75 SOUTH ASIA 75 Recent developments Regional GDP growth is estimated to have picked up modestly in 2013 but was weak compared with past performance. South Asia’s GDP growth rose to an estimated 4.6 percent in 2013 in calendar year-market price terms from 4.2 percent growth recorded in 2012. Growth was, how- ever, well below its pre-crisis pace. In India, the largest regional economy, GDP growth measured on a factor cost basis is estimated to have moderated to 4.8 per- cent in the 2013–14 fiscal year (from the 5 percent rate in the previous fiscal year)—remaining well below the nearly 8 percent average growth achieved during the past decade. GDP growth in Pakistan, South Asia’s sec- ond largest economy, has also been relatively weak in recent years, averaging 3.5 percent in factor cost terms since 2010, below the nearly 5 percent average growth during the previous decade. The relatively weak growth rates in these two countries, which together account for close to 90 percent of regional GDP, reflect a combi - nation of domestic imbalances (including large fiscal deficits and high inflation), weakening investment rates, and a challenging external environment. 1 Among other countries, Bangladesh’s growth slowed to 6.0 percent in FY2012–13 from 6.2 percent in FY2011–12, while South Asia’s GDP growth rose to an estimated 4.6 percent in 2013 from 4.2 percent in 2012, but was well below its average in the past decade, reflecting both rising domestic imbalances and a challenging external environment. Regional GDP growth is projected to improve to 5.7 percent in 2014 and then to rise to 6.3 percent in 2015 and 6.7 percent in 2016. The projected pickup will depend critically on ensuring macroeconomic stability, sustaining reforms, and reducing supply-side constraints. January 2014 GLOBAL ECONOMIC PROSPECTS Chapter 2 growth in Afghanistan weakened sharply to an esti- mated 3.1 percent in 2013 from an exceptionally high 14.4 percent in 2012. By contrast, growth in Sri Lanka picked up to an estimated 7.0 percent in 2013 from 6.4 percent in 2012, with stronger manufacturing and ser- vices activity and a rebound in agriculture in the third quarter. A cyclical improvement in activity in the second half of 2013 was led by a rapid expansion of exports. Activity in South Asia reg- istered a cyclical recovery during the second half of 2013, following a mid-year slump. Regional export volumes expanded by a robust annualized 40.8 percent in the three months to October (3m/3m saar), reflecting a gradual recovery in global demand and currency depreciation in India (see figures 2.19 and 2.22). Export volumes in South Asia excluding India also rose robustly in the third quarter. Despite the strong momentum in recent quarters, regional export growth is estimated to have slowed in 2013. Nev- ertheless, the regional current account deficit fell by an estimated 1.1 percent of GDP—mainly owing to weaker import growth resulting from weak domestic demand and policy measures to reduce import of gold in India, and stable crude oil prices relative to 2012. Even with a 1. See Rajan (2013a and 2013b) for a discussion on India.

Welcome message from author
This document is posted to help you gain knowledge. Please leave a comment to let me know what you think about it! Share it to your friends and learn new things together.
Transcript
75
SOUTH ASIA
75
Recent developments
Regional GDP growth is estimated to have picked up modestly in 2013 but was weak compared with past performance. South Asia’s GDP growth rose to an estimated 4.6 percent in 2013 in calendar year-market price terms from 4.2 percent growth recorded in 2012. Growth was, how-ever, well below its pre-crisis pace. In India, the largest regional economy, GDP growth measured on a factor cost basis is estimated to have moderated to 4.8 per-cent in the 2013–14 fiscal year (from the 5 percent rate in the previous fiscal year)—remaining well below the nearly 8 percent average growth achieved during the past decade. GDP growth in Pakistan, South Asia’s sec-ond largest economy, has also been relatively weak in recent years, averaging 3.5 percent in factor cost terms since 2010, below the nearly 5 percent average growth during the previous decade. The relatively weak growth rates in these two countries, which together account for close to 90 percent of regional GDP, reflect a combi-nation of domestic imbalances (including large fiscal deficits and high inflation), weakening investment rates, and a challenging external environment.1 Among other countries, Bangladesh’s growth slowed to 6.0 percent in FY2012–13 from 6.2 percent in FY2011–12, while
South Asia’s GDP growth rose to an estimated 4.6 percent in 2013 from 4.2 percent in 2012, but was well below its average in the past decade, reflecting both rising domestic imbalances and a challenging external environment. Regional GDP growth is projected to improve to 5.7 percent in 2014 and then to rise to 6.3 percent in 2015 and 6.7 percent in 2016. The projected pickup will depend critically on ensuring macroeconomic stability, sustaining reforms, and reducing supply-side constraints.
January2014
GLOBAL ECONOMIC PROSPECTS
Chapter 2
growth in Afghanistan weakened sharply to an esti-mated 3.1 percent in 2013 from an exceptionally high 14.4 percent in 2012. By contrast, growth in Sri Lanka picked up to an estimated 7.0 percent in 2013 from 6.4 percent in 2012, with stronger manufacturing and ser-vices activity and a rebound in agriculture in the third quarter.
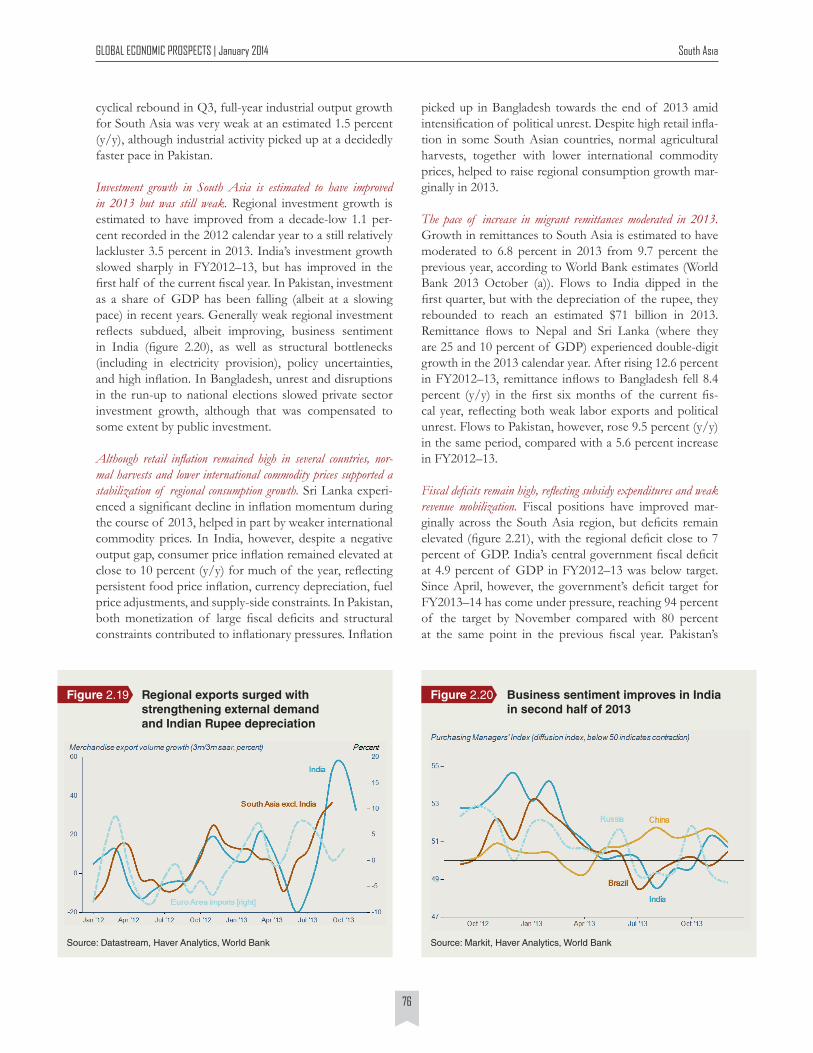
A cyclical improvement in activity in the second half of 2013 was led by a rapid expansion of exports. Activity in South Asia reg-istered a cyclical recovery during the second half of 2013, following a mid-year slump. Regional export volumes expanded by a robust annualized 40.8 percent in the three months to October (3m/3m saar), reflecting a gradual recovery in global demand and currency depreciation in India (see figures 2.19 and 2.22). Export volumes in South Asia excluding India also rose robustly in the third quarter. Despite the strong momentum in recent quarters, regional export growth is estimated to have slowed in 2013. Nev-ertheless, the regional current account deficit fell by an estimated 1.1 percent of GDP—mainly owing to weaker import growth resulting from weak domestic demand and policy measures to reduce import of gold in India, and stable crude oil prices relative to 2012. Even with a
1. See Rajan (2013a and 2013b) for a discussion on India.
GLOBAL ECONOMIC PROSPECTS | January 2014 South Asia
76
cyclical rebound in Q3, full-year industrial output growth for South Asia was very weak at an estimated 1.5 percent (y/y), although industrial activity picked up at a decidedly faster pace in Pakistan.
Investment growth in South Asia is estimated to have improved in 2013 but was still weak. Regional investment growth is estimated to have improved from a decade-low 1.1 per-cent recorded in the 2012 calendar year to a still relatively lackluster 3.5 percent in 2013. India’s investment growth slowed sharply in FY2012–13, but has improved in the first half of the current fiscal year. In Pakistan, investment as a share of GDP has been falling (albeit at a slowing pace) in recent years. Generally weak regional investment reflects subdued, albeit improving, business sentiment in India (figure 2.20), as well as structural bottlenecks (including in electricity provision), policy uncertainties, and high inflation. In Bangladesh, unrest and disruptions in the run-up to national elections slowed private sector investment growth, although that was compensated to some extent by public investment.
Although retail inflation remained high in several countries, nor-mal harvests and lower international commodity prices supported a stabilization of regional consumption growth. Sri Lanka experi-enced a significant decline in inflation momentum during the course of 2013, helped in part by weaker international commodity prices. In India, however, despite a negative output gap, consumer price inflation remained elevated at close to 10 percent (y/y) for much of the year, reflecting persistent food price inflation, currency depreciation, fuel price adjustments, and supply-side constraints. In Pakistan, both monetization of large fiscal deficits and structural constraints contributed to inflationary pressures. Inflation
picked up in Bangladesh towards the end of 2013 amid intensification of political unrest. Despite high retail infla-tion in some South Asian countries, normal agricultural harvests, together with lower international commodity prices, helped to raise regional consumption growth mar-ginally in 2013.
The pace of increase in migrant remittances moderated in 2013. Growth in remittances to South Asia is estimated to have moderated to 6.8 percent in 2013 from 9.7 percent the previous year, according to World Bank estimates (World Bank 2013 October (a)). Flows to India dipped in the first quarter, but with the depreciation of the rupee, they rebounded to reach an estimated $71 billion in 2013. Remittance flows to Nepal and Sri Lanka (where they are 25 and 10 percent of GDP) experienced double-digit growth in the 2013 calendar year. After rising 12.6 percent in FY2012–13, remittance inflows to Bangladesh fell 8.4 percent (y/y) in the first six months of the current fis-cal year, reflecting both weak labor exports and political unrest. Flows to Pakistan, however, rose 9.5 percent (y/y) in the same period, compared with a 5.6 percent increase in FY2012–13.
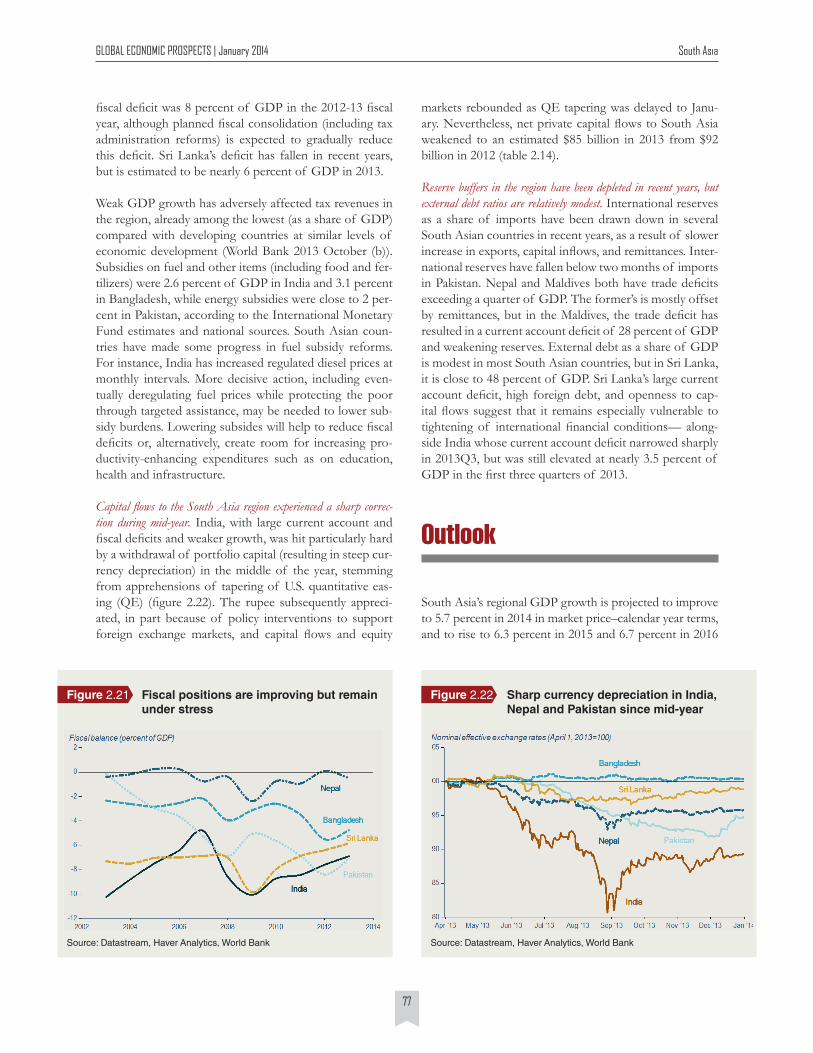
Fiscal deficits remain high, reflecting subsidy expenditures and weak revenue mobilization. Fiscal positions have improved mar-ginally across the South Asia region, but deficits remain elevated (figure 2.21), with the regional deficit close to 7 percent of GDP. India’s central government fiscal deficit at 4.9 percent of GDP in FY2012–13 was below target. Since April, however, the government’s deficit target for FY2013–14 has come under pressure, reaching 94 percent of the target by November compared with 80 percent at the same point in the previous fiscal year. Pakistan’s
Source: Datastream, Haver Analytics, World Bank
Regional exports surged with strengthening external demand and Indian Rupee depreciation
Figure 2.19
Source: Markit, Haver Analytics, World Bank
Business sentiment improves in India in second half of 2013
Figure 2.20
GLOBAL ECONOMIC PROSPECTS | January 2014 South Asia
77
fiscal deficit was 8 percent of GDP in the 2012-13 fiscal year, although planned fiscal consolidation (including tax administration reforms) is expected to gradually reduce this deficit. Sri Lanka’s deficit has fallen in recent years, but is estimated to be nearly 6 percent of GDP in 2013.
Weak GDP growth has adversely affected tax revenues in the region, already among the lowest (as a share of GDP) compared with developing countries at similar levels of economic development (World Bank 2013 October (b)). Subsidies on fuel and other items (including food and fer-tilizers) were 2.6 percent of GDP in India and 3.1 percent in Bangladesh, while energy subsidies were close to 2 per-cent in Pakistan, according to the International Monetary Fund estimates and national sources. South Asian coun-tries have made some progress in fuel subsidy reforms. For instance, India has increased regulated diesel prices at monthly intervals. More decisive action, including even-tually deregulating fuel prices while protecting the poor through targeted assistance, may be needed to lower sub-sidy burdens. Lowering subsides will help to reduce fiscal deficits or, alternatively, create room for increasing pro-ductivity-enhancing expenditures such as on education, health and infrastructure.
Capital flows to the South Asia region experienced a sharp correc-tion during mid-year. India, with large current account and fiscal deficits and weaker growth, was hit particularly hard by a withdrawal of portfolio capital (resulting in steep cur-rency depreciation) in the middle of the year, stemming from apprehensions of tapering of U.S. quantitative eas-ing (QE) (figure 2.22). The rupee subsequently appreci-ated, in part because of policy interventions to support foreign exchange markets, and capital flows and equity
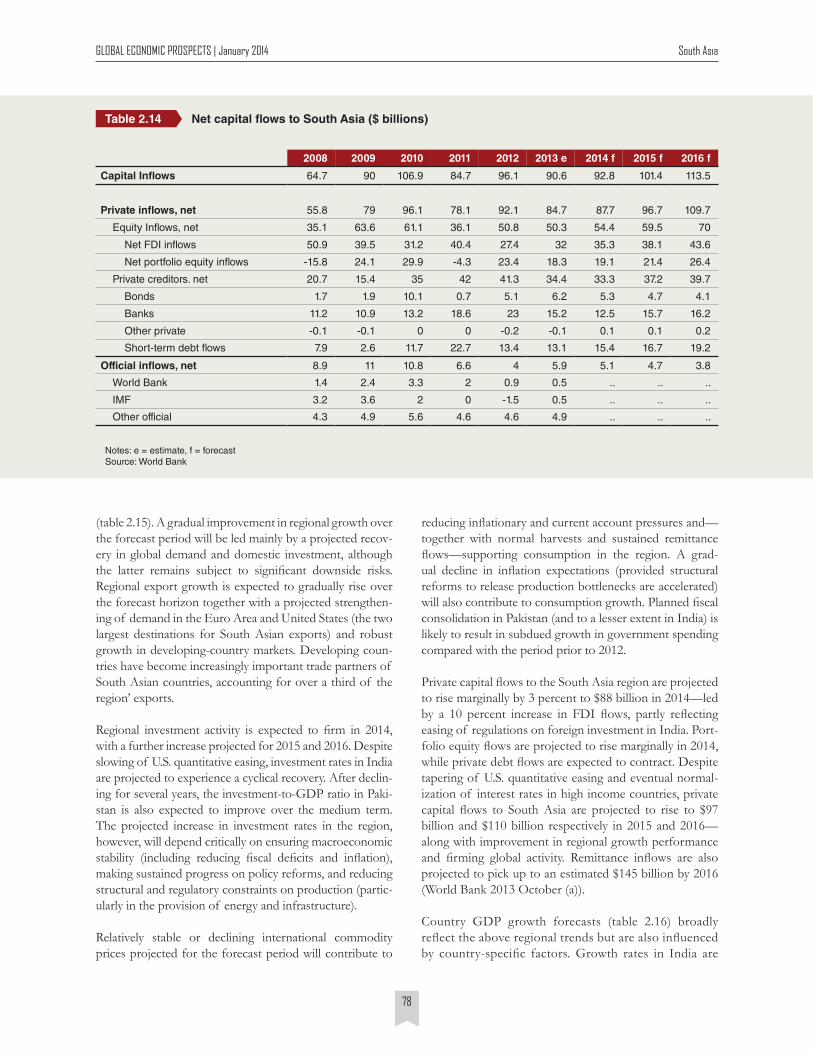
markets rebounded as QE tapering was delayed to Janu-ary. Nevertheless, net private capital flows to South Asia weakened to an estimated $85 billion in 2013 from $92 billion in 2012 (table 2.14).
Reserve buffers in the region have been depleted in recent years, but external debt ratios are relatively modest. International reserves as a share of imports have been drawn down in several South Asian countries in recent years, as a result of slower increase in exports, capital inflows, and remittances. Inter-national reserves have fallen below two months of imports in Pakistan. Nepal and Maldives both have trade deficits exceeding a quarter of GDP. The former’s is mostly offset by remittances, but in the Maldives, the trade deficit has resulted in a current account deficit of 28 percent of GDP and weakening reserves. External debt as a share of GDP is modest in most South Asian countries, but in Sri Lanka, it is close to 48 percent of GDP. Sri Lanka’s large current account deficit, high foreign debt, and openness to cap-ital flows suggest that it remains especially vulnerable to tightening of international financial conditions— along-side India whose current account deficit narrowed sharply in 2013Q3, but was still elevated at nearly 3.5 percent of GDP in the first three quarters of 2013.
Outlook
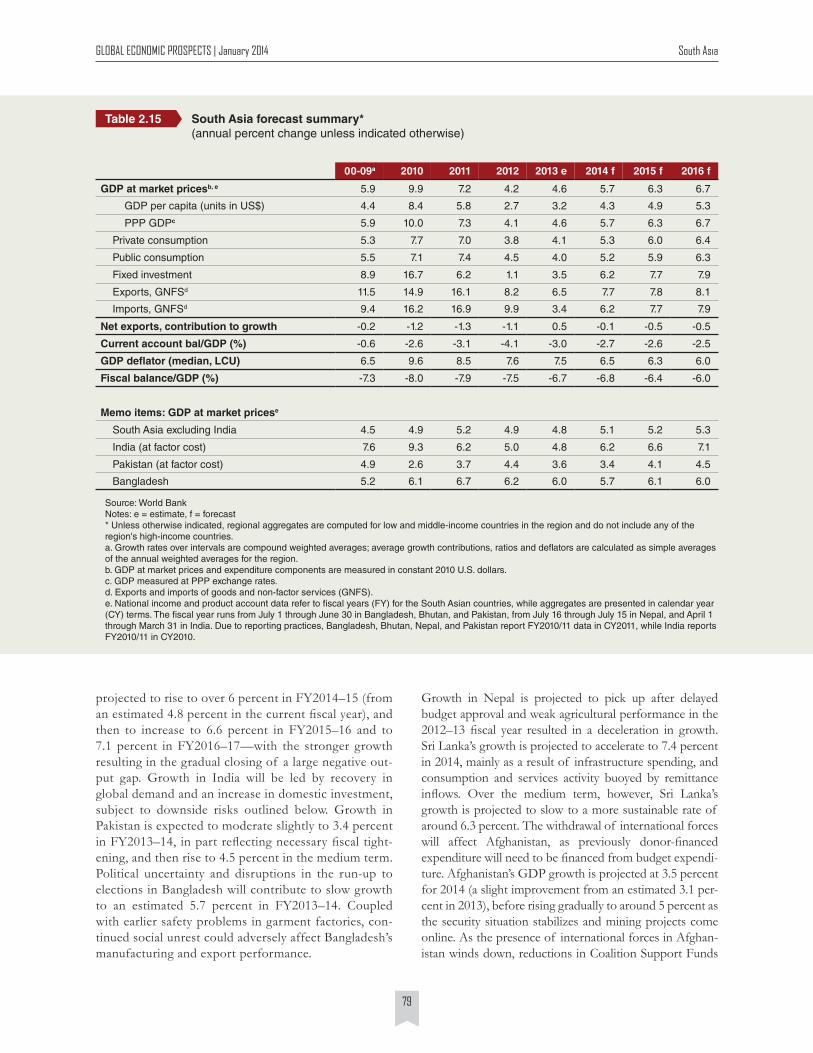
South Asia’s regional GDP growth is projected to improve to 5.7 percent in 2014 in market price–calendar year terms, and to rise to 6.3 percent in 2015 and 6.7 percent in 2016
Source: Datastream, Haver Analytics, World Bank
Fiscal positions are improving but remain under stress
Figure 2.21
Source: Datastream, Haver Analytics, World Bank
Sharp currency depreciation in India, Nepal and Pakistan since mid-year
Figure 2.22
GLOBAL ECONOMIC PROSPECTS | January 2014 South Asia
78
(table 2.15). A gradual improvement in regional growth over the forecast period will be led mainly by a projected recov-ery in global demand and domestic investment, although the latter remains subject to significant downside risks. Regional export growth is expected to gradually rise over the forecast horizon together with a projected strengthen-ing of demand in the Euro Area and United States (the two largest destinations for South Asian exports) and robust growth in developing-country markets. Developing coun-tries have become increasingly important trade partners of South Asian countries, accounting for over a third of the region’ exports.
Regional investment activity is expected to firm in 2014, with a further increase projected for 2015 and 2016. Despite slowing of U.S. quantitative easing, investment rates in India are projected to experience a cyclical recovery. After declin-ing for several years, the investment-to-GDP ratio in Paki-stan is also expected to improve over the medium term. The projected increase in investment rates in the region, however, will depend critically on ensuring macroeconomic stability (including reducing fiscal deficits and inflation), making sustained progress on policy reforms, and reducing structural and regulatory constraints on production (partic-ularly in the provision of energy and infrastructure).
Relatively stable or declining international commodity prices projected for the forecast period will contribute to
Net capital flows to South Asia ($ billions)Table 2.14
Notes: e = estimate, f = forecastSource: World Bank
2008 2009 2010 2011 2012 2013 e 2014 f 2015 f 2016 f
Capital Inflows 64.7 90 106.9 84.7 96.1 90.6 92.8 101.4 113.5
Private inflows, net 55.8 79 96.1 78.1 92.1 84.7 87.7 96.7 109.7
Equity Inflows, net 35.1 63.6 61.1 36.1 50.8 50.3 54.4 59.5 70
Net FDI inflows 50.9 39.5 31.2 40.4 27.4 32 35.3 38.1 43.6
Net portfolio equity inflows -15.8 24.1 29.9 -4.3 23.4 18.3 19.1 21.4 26.4
Private creditors. net 20.7 15.4 35 42 41.3 34.4 33.3 37.2 39.7
Bonds 1.7 1.9 10.1 0.7 5.1 6.2 5.3 4.7 4.1
Banks 11.2 10.9 13.2 18.6 23 15.2 12.5 15.7 16.2
Other private -0.1 -0.1 0 0 -0.2 -0.1 0.1 0.1 0.2
Short-term debt flows 7.9 2.6 11.7 22.7 13.4 13.1 15.4 16.7 19.2
Official inflows, net 8.9 11 10.8 6.6 4 5.9 5.1 4.7 3.8
World Bank 1.4 2.4 3.3 2 0.9 0.5 .. .. ..
IMF 3.2 3.6 2 0 -1.5 0.5 .. .. ..
Other official 4.3 4.9 5.6 4.6 4.6 4.9 .. .. ..
reducing inflationary and current account pressures and—together with normal harvests and sustained remittance flows—supporting consumption in the region. A grad-ual decline in inflation expectations (provided structural reforms to release production bottlenecks are accelerated) will also contribute to consumption growth. Planned fiscal consolidation in Pakistan (and to a lesser extent in India) is likely to result in subdued growth in government spending compared with the period prior to 2012.
Private capital flows to the South Asia region are projected to rise marginally by 3 percent to $88 billion in 2014—led by a 10 percent increase in FDI flows, partly reflecting easing of regulations on foreign investment in India. Port-folio equity flows are projected to rise marginally in 2014, while private debt flows are expected to contract. Despite tapering of U.S. quantitative easing and eventual normal-ization of interest rates in high income countries, private capital flows to South Asia are projected to rise to $97 billion and $110 billion respectively in 2015 and 2016—along with improvement in regional growth performance and firming global activity. Remittance inflows are also projected to pick up to an estimated $145 billion by 2016 (World Bank 2013 October (a)).
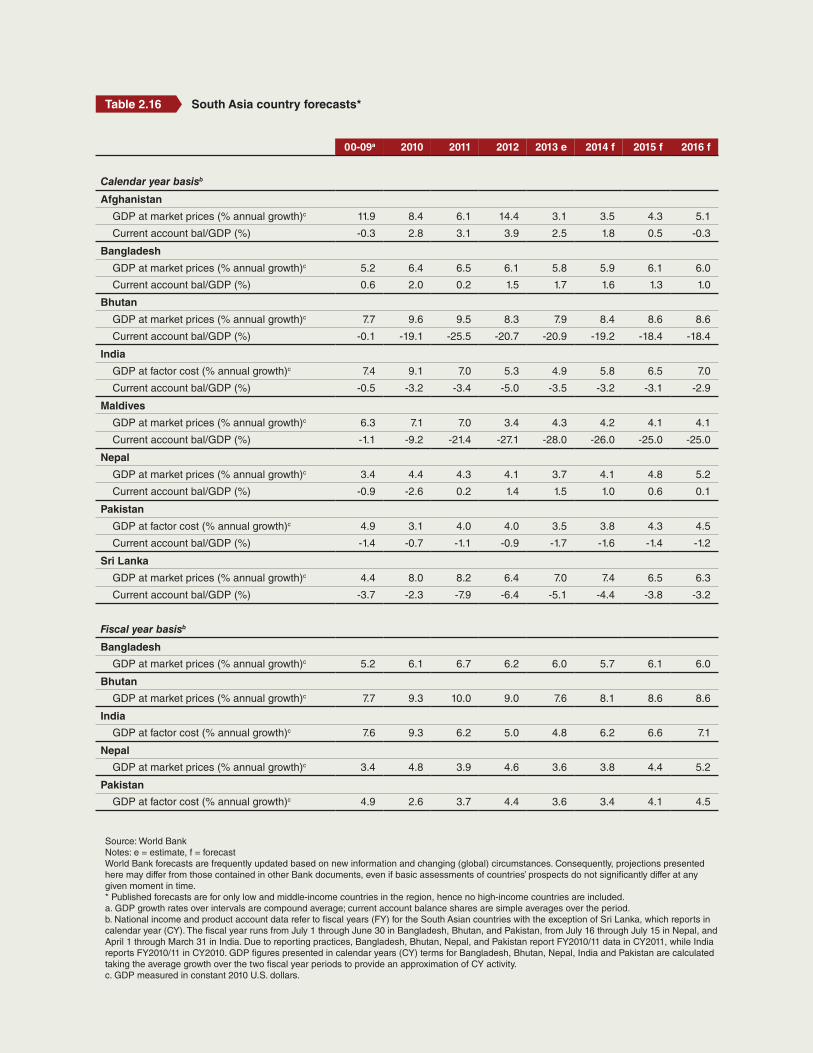
Country GDP growth forecasts (table 2.16) broadly reflect the above regional trends but are also influenced by country-specific factors. Growth rates in India are
GLOBAL ECONOMIC PROSPECTS | January 2014 South Asia
79
projected to rise to over 6 percent in FY2014–15 (from an estimated 4.8 percent in the current fiscal year), and then to increase to 6.6 percent in FY2015–16 and to 7.1 percent in FY2016–17—with the stronger growth resulting in the gradual closing of a large negative out-put gap. Growth in India will be led by recovery in global demand and an increase in domestic investment, subject to downside risks outlined below. Growth in Pakistan is expected to moderate slightly to 3.4 percent in FY2013–14, in part reflecting necessary fiscal tight-ening, and then rise to 4.5 percent in the medium term. Political uncertainty and disruptions in the run-up to elections in Bangladesh will contribute to slow growth to an estimated 5.7 percent in FY2013–14. Coupled with earlier safety problems in garment factories, con-tinued social unrest could adversely affect Bangladesh’s manufacturing and export performance.
Growth in Nepal is projected to pick up after delayed budget approval and weak agricultural performance in the 2012–13 fiscal year resulted in a deceleration in growth. Sri Lanka’s growth is projected to accelerate to 7.4 percent in 2014, mainly as a result of infrastructure spending, and consumption and services activity buoyed by remittance inflows. Over the medium term, however, Sri Lanka’s growth is projected to slow to a more sustainable rate of around 6.3 percent. The withdrawal of international forces will affect Afghanistan, as previously donor-financed expenditure will need to be financed from budget expendi-ture. Afghanistan’s GDP growth is projected at 3.5 percent for 2014 (a slight improvement from an estimated 3.1 per-cent in 2013), before rising gradually to around 5 percent as the security situation stabilizes and mining projects come online. As the presence of international forces in Afghan-istan winds down, reductions in Coalition Support Funds
South Asia forecast summary* (annual percent change unless indicated otherwise)
Table 2.15
00-09a 2010 2011 2012 2013 e 2014 f 2015 f 2016 f
GDP at market pricesb, e 5.9 9.9 7.2 4.2 4.6 5.7 6.3 6.7
GDP per capita (units in US$) 4.4 8.4 5.8 2.7 3.2 4.3 4.9 5.3
PPP GDPc 5.9 10.0 7.3 4.1 4.6 5.7 6.3 6.7
Private consumption 5.3 7.7 7.0 3.8 4.1 5.3 6.0 6.4
Public consumption 5.5 7.1 7.4 4.5 4.0 5.2 5.9 6.3
Fixed investment 8.9 16.7 6.2 1.1 3.5 6.2 7.7 7.9
Exports, GNFSd 11.5 14.9 16.1 8.2 6.5 7.7 7.8 8.1
Imports, GNFSd 9.4 16.2 16.9 9.9 3.4 6.2 7.7 7.9
Net exports, contribution to growth -0.2 -1.2 -1.3 -1.1 0.5 -0.1 -0.5 -0.5
Current account bal/GDP (%) -0.6 -2.6 -3.1 -4.1 -3.0 -2.7 -2.6 -2.5
GDP deflator (median, LCU) 6.5 9.6 8.5 7.6 7.5 6.5 6.3 6.0
Fiscal balance/GDP (%) -7.3 -8.0 -7.9 -7.5 -6.7 -6.8 -6.4 -6.0
Memo items: GDP at market pricese
South Asia excluding India 4.5 4.9 5.2 4.9 4.8 5.1 5.2 5.3
India (at factor cost) 7.6 9.3 6.2 5.0 4.8 6.2 6.6 7.1
Pakistan (at factor cost) 4.9 2.6 3.7 4.4 3.6 3.4 4.1 4.5
Bangladesh 5.2 6.1 6.7 6.2 6.0 5.7 6.1 6.0
Source: World Bank Notes: e = estimate, f = forecast* Unless otherwise indicated, regional aggregates are computed for low and middle-income countries in the region and do not include any of the region's high-income countries.a. Growth rates over intervals are compound weighted averages; average growth contributions, ratios and deflators are calculated as simple averages of the annual weighted averages for the region.b. GDP at market prices and expenditure components are measured in constant 2010 U.S. dollars. c. GDP measured at PPP exchange rates.d. Exports and imports of goods and non-factor services (GNFS).e. National income and product account data refer to fiscal years (FY) for the South Asian countries, while aggregates are presented in calendar year (CY) terms. The fiscal year runs from July 1 through June 30 in Bangladesh, Bhutan, and Pakistan, from July 16 through July 15 in Nepal, and April 1 through March 31 in India. Due to reporting practices, Bangladesh, Bhutan, Nepal, and Pakistan report FY2010/11 data in CY2011, while India reports FY2010/11 in CY2010.
GLOBAL ECONOMIC PROSPECTS | January 2014 South Asia
80
for Pakistan are likely to be offset by continued disburse-ments under the IMF’s extended fund facility and robust inflows of remittances.
Risks
Risks to the outlook for the South Asia region are tilted to the downside, on balance. Some potential upside risks include better-than-anticipated global growth, and lower crude oil prices than projected. Domestic downside risks are particularly relevant for a sustained revival of invest-ment and for medium-term growth prospects.
Domestic risks. The main domestic risks concern the abil-ity of South Asian countries to keep current and planned reforms from going off-track and to maintain fiscal dis-cipline. A stalling or reversal of policy reforms could see significantly lower investment and growth than that pro-jected in the baseline. Limited fiscal space in South Asian countries compared with the immediate pre-2008 crisis period has already made it difficult to respond forcefully to intensification of crises. An inability to maintain fiscal discipline and to reduce subsidies could adversely affect sovereign creditworthiness. Political uncertainties related to national elections in Bangladesh in early 2014 and in India in mid-2014 could hamper a sustained revival of business confidence and investment. In Afghanistan, the combination of political transition and withdrawal of international forces in 2014 could pose risks to the country’s fiscal sustainability and growth. Entrenchment of inflation expectations in India (RBI 2013a) could reduce space for monetary easing and adversely affect investment. Lack of progress in reducing supply-side constraints (particularly in electricity, infrastructure and agricultural sectors) could also pose significant downside risk to the outlook.
Disorderly adjustment of capital flows. The tapering of U.S quantitative easing is expected to proceed gradually, but abrupt changes in expectations could cause a disorderly adjustment of capital flows and currency depreciation pressures. Weak GDP growth has already taken a toll on corporate and bank balance sheets in India, as gross non--performing and restructured loans rose to 10.2 percent of loans in September 2013, with India’s central bank warning of stress on asset quality in the iron and steel, and infrastructure sectors (RBI 2013b). Further strains from a sharp withdrawal of foreign capital could increase risk of corporate debt distress, while one-off costs of bank recapitalization can put pressure on fiscal positions.
Fragile global growth. Prolonged weakness in the Euro Area, U.S. fiscal policy brinkmanship, and geopolitical risks in the Middle East are additional sources of external risk. A relatively subdued recovery in the Euro Area, reflecting unresolved financial fragilities and structural problems, would act as a drag on global trade and affect South Asian exports. Risks from brinkmanship on U.S fiscal policy have diminished, but a recurrence could affect global activity through negative confidence effects. Tensions in the Mid-dle-East have subsided somewhat, but a resurgence and associated supply shocks could result in a spike in inter-national crude oil prices, and threaten the gains made in stabilizing current account positions in South Asia.
South Asian policy makers must continue the urgent task of rebuilding domestic and external policy buffers and reducing imbalances to deal with potential intensification of external pressures, as well as accelerate productivity-en-hancing reforms and improve their business environment to raise growth rates on a sustained basis. Given already large fiscal and current account deficits, high inflation, and weak reserve positions (or a combination of these) in some South Asian countries, policymakers need to main-tain an appropriately tight macroeconomic stance to avoid exacerbating external vulnerabilities and domestic infla-tionary pressures.
South Asia country forecasts*Table 2.16
00-09a 2010 2011 2012 2013 e 2014 f 2015 f 2016 f
Calendar year basisb
Afghanistan
GDP at market prices (% annual growth)c 11.9 8.4 6.1 14.4 3.1 3.5 4.3 5.1
Current account bal/GDP (%) -0.3 2.8 3.1 3.9 2.5 1.8 0.5 -0.3
Bangladesh
GDP at market prices (% annual growth)c 5.2 6.4 6.5 6.1 5.8 5.9 6.1 6.0
Current account bal/GDP (%) 0.6 2.0 0.2 1.5 1.7 1.6 1.3 1.0
Bhutan
GDP at market prices (% annual growth)c 7.7 9.6 9.5 8.3 7.9 8.4 8.6 8.6
Current account bal/GDP (%) -0.1 -19.1 -25.5 -20.7 -20.9 -19.2 -18.4 -18.4
India
GDP at factor cost (% annual growth)c 7.4 9.1 7.0 5.3 4.9 5.8 6.5 7.0
Current account bal/GDP (%) -0.5 -3.2 -3.4 -5.0 -3.5 -3.2 -3.1 -2.9
Maldives
GDP at market prices (% annual growth)c 6.3 7.1 7.0 3.4 4.3 4.2 4.1 4.1
Current account bal/GDP (%) -1.1 -9.2 -21.4 -27.1 -28.0 -26.0 -25.0 -25.0
Nepal
GDP at market prices (% annual growth)c 3.4 4.4 4.3 4.1 3.7 4.1 4.8 5.2
Current account bal/GDP (%) -0.9 -2.6 0.2 1.4 1.5 1.0 0.6 0.1
Pakistan
GDP at factor cost (% annual growth)c 4.9 3.1 4.0 4.0 3.5 3.8 4.3 4.5
Current account bal/GDP (%) -1.4 -0.7 -1.1 -0.9 -1.7 -1.6 -1.4 -1.2
Sri Lanka
GDP at market prices (% annual growth)c 4.4 8.0 8.2 6.4 7.0 7.4 6.5 6.3
Current account bal/GDP (%) -3.7 -2.3 -7.9 -6.4 -5.1 -4.4 -3.8 -3.2
Fiscal year basisb
Bangladesh
GDP at market prices (% annual growth)c 5.2 6.1 6.7 6.2 6.0 5.7 6.1 6.0
Bhutan
GDP at market prices (% annual growth)c 7.7 9.3 10.0 9.0 7.6 8.1 8.6 8.6
India
GDP at factor cost (% annual growth)c 7.6 9.3 6.2 5.0 4.8 6.2 6.6 7.1
Nepal
GDP at market prices (% annual growth)c 3.4 4.8 3.9 4.6 3.6 3.8 4.4 5.2
Pakistan
GDP at factor cost (% annual growth)c 4.9 2.6 3.7 4.4 3.6 3.4 4.1 4.5
Source: World BankNotes: e = estimate, f = forecastWorld Bank forecasts are frequently updated based on new information and changing (global) circumstances. Consequently, projections presented here may differ from those contained in other Bank documents, even if basic assessments of countries’ prospects do not significantly differ at any given moment in time.* Published forecasts are for only low and middle-income countries in the region, hence no high-income countries are included.a. GDP growth rates over intervals are compound average; current account balance shares are simple averages over the period.b. National income and product account data refer to fiscal years (FY) for the South Asian countries with the exception of Sri Lanka, which reports in calendar year (CY). The fiscal year runs from July 1 through June 30 in Bangladesh, Bhutan, and Pakistan, from July 16 through July 15 in Nepal, and April 1 through March 31 in India. Due to reporting practices, Bangladesh, Bhutan, Nepal, and Pakistan report FY2010/11 data in CY2011, while India reports FY2010/11 in CY2010. GDP figures presented in calendar years (CY) terms for Bangladesh, Bhutan, Nepal, India and Pakistan are calculated taking the average growth over the two fiscal year periods to provide an approximation of CY activity.c. GDP measured in constant 2010 U.S. dollars.
Related Documents