South Africa's Water Research, Development, and Innovation (RDI) Roadmap: 2015-2025 Water Research Commission Department of Science and Technology Department of Water and Sanitation WRC Report No. 2305/1/15 ISBN 978-1-4312-0683-4 July 2015

Welcome message from author
This document is posted to help you gain knowledge. Please leave a comment to let me know what you think about it! Share it to your friends and learn new things together.
Transcript
South Africa's Water Research, Development, and Innovation (RDI) Roadmap: 2015-2025
Water Research Commission
Department of Science and Technology
Department of Water and Sanitation
WRC Report No. 2305/1/15
ISBN 978-1-4312-0683-4
July 2015

Obtainable from
Water Research Commission Private Bag X03 GEZINA, 0031
[email protected] or download from www.wrc.org.za
DISCLAIMER
This report has been reviewed by the Water Research Commission (WRC), Department of Science and Technology (DST), and Department of Water and Sanitation (DWS) and approved for publication. Approval does not signify that the contents necessarily reflect the views and policies of the WRC, DST, or DWS, nor does mention of trade names or commercial products constitute endorsement or recommendation for use.
© Water Research Commission
Water Research, Development, and Innovation Roadmap
i
EXECUTIVE SUMMARY The National Water Research, Development, and Innovation (RDI) Roadmap provides a structured framework to focus the contribution of RDI activity to the implementation of national policy, strategy and planning in water resources management in South Africa. The vision of the roadmap is that South Africa is a leader among middle income countries in the development and deployment of water management practices and technologies. It competes with leading countries in providing sustainable solutions.
This has been achieved by means of a National Water Research, Development, and Deployment1 (RDD) Programme focused on: delivery of at least one breakthrough technology every five years; increasing the number of small and medium sized enterprises operating in the water sector; increasing access to water for rural communities, including provision of sanitation for all in a sustainable manner. Together, this creates significant economic, health, social and environmental benefit.
The contribution of RDD to achieving the vision results from a focus on four key objectives: Increase the availability of water; improve the governance, planning and management of supply and delivery; enable water and sanitation services to operate as a sustainable “business” and increase the efficiency and productivity of water use.
The roadmap was developed through an exhaustive, structured process of eliciting staged responses from the professional community, reviewing the inputs, and assessing their implications.
The roadmapping process included participation, input, review, and revision from key stakeholders in industry, government and organisations within the National System of Innovation. The roadmap provides strategic direction, a set of action plans and an implementation framework to guide, plan, coordinate and manage South Africa’s portfolio investment for the next ten years in seven identified clusters of RDD activity. The investment aspiration and potential return on investment is also mapped out.
The result of this process is a set of seven plans which over the period 2015-2025 develop out pathways to progress from the 2015 situation to a much improved future state, by implementing interventions in research, development, testing, demonstration, and deployment of new technologies and know-how, and demonstration and deployment of emerging technologies.
The seven plans provide itemised, actionable tasks under the following headings:
1. Water supply
1.1. Increase ability to make use of more sources of water, including alternatives
1.2. Improve governance, planning and management of supply and delivery
1.3. Improve adequacy and performance of supply infrastructure
1.4. Run water as a financially sustainable “business” by improving operational performance
2. Water demand
2.1. Improve governance, planning, and management of demand and use
2.2. Reduce losses and increase efficiency of productive use
2.3. Improve performance of pricing, monitoring, billing, metering and collection
Developing, strengthening and embedding South Africa’s water RDD capability and capacity within and between research institutions, academic institutions, industry and government, will enable faster and more effective deployment of context-appropriate technologies and create opportunities for the export of know-how and technology into the African continent and beyond.
This Water RDI Roadmap thus provides a set of Research, Development, and Deployment clusters (focal areas) and associated high level action plans to guide investments over a ten year period, and it also lays out an investment ambition to achieve these plans. This Roadmap is a high level planning tool that facilitates and guides refocusing of research, reprioritization of funds, synergising of existing initiatives and ring-fencing of new resources in order to facilitate a more optimal water innovation system.
1 i.e. Deployment of innovative technologies and new know-how.
Water Research, Development, and Innovation Roadmap
ii
ACKNOWLEDGEMENTS The project team wishes to thank the following individuals for their contributions to the project.
Reference Group
Ms R Mühlbauer Anglo American Coal Ms S Clark BHP Billiton Energy Coal South Africa Ltd (BECSA) Mr J Beukes Coaltech Dr L Godfrey Council for Scientific and Industrial Research (CSIR) Mr I Patel Department of Science and Technology (DST) Ms B Ting Department of Science and Technology Mr I Maredi Department of Science and Technology Mr R Sekwele Department of Water and Sanitation (DWS) Mr M Bannister Department of Water and Sanitation Mr G Gericke Eskom Mr S Moodliar eThekwini Metropolitan Municipality Mr M Padayachee Rand Water Prof J Maree Tshwane University of Technology Dr C Sheridan University of the Witwatersrand Mrs N Seetal WADER Dr S Mpandeli Water Research Commission (WRC) Mr B Madikizela WRC Mr C Moseki WRC / DWS
Other work session / workshop participants, without whom this roadmap would never have existed:
Agri SA Agricultural Research Council (ARC) Amatola Water Anglo American Coal ARC-Institute for Soil, Climate and Water BHP Billiton Energy Coal South Africa Ltd Biomimicry SA Chamber of Mines City of Cape Town City of Johannesburg City of Tshwane Coaltech Coca Cola South Africa Council for Scientific and Industrial Research Department of Agriculture, Forestry and Fisheries Department of Environmental Affairs Department of Science and Technology Department of Water and Sanitation East Rand Water Care Company EON Consulting Eskom-Mining Eskom-Research & Development Eskom-Technology, Strategy, and Research
Management Eskom-Water Resources eThekwini Municipality Exxaro Federation for a Sustainable Environment Golder Associates (Pty) Ltd Grain SA Johannesburg Water Land Rehabilitation Society of South Africa
Limpopo Department of Agriculture Midvaal Water Company Mintails Ltd National Business Initiative National Planning Commission Nelson Mandela Metropolitan Municipality NEPAD Business Foundation Nestlé Rand Water SA Association for Water User Associations SA Irrigation Institute SAB Miller Sappi Sasol South African Local Government Association South African National Biodiversity Institute South African Weather Services (SAWS) Stellenbosch University Strategic Water Partners Network (SWPN) Trans Caledon Tunnel Authority (TCTA) Tshwane University of Technology Umgeni Water Umhlaba Consulting Group University of Pretoria University of the Witwatersrand Water Technologies Demonstration Programme
(WADER) Water Institute of Southern Africa (WISA) Water Research Commission (WRC) Western Cape Department of Agriculture Wildlife and Environment Society of South Africa Worldwide Fund for Nature SA
Water Research, Development, and Innovation Roadmap
iii
CONTENTS EXECUTIVE SUMMARY ..................................................................................................................................... i
ACKNOWLEDGEMENTS ................................................................................................................................... ii
CONTENTS ....................................................................................................................................................... iii
LIST OF FIGURES ............................................................................................................................................ vi
LIST OF TABLES ............................................................................................................................................ viii
ACRONYMS & ABBREVIATIONS .................................................................................................................... ix
GLOSSARY ........................................................................................................................................................ x
REPORT ARCHITECTURE ............................................................................................................................. xii
CHAPTER 1: CONTEXT .................................................................................................................................... 1
CHAPTER 2: SOUTH AFRICA'S WATER RDI ROADMAP: 2015-2025 .......................................................... 5
2.1 STRUCTURE OF THE ROADMAP ........................................................................................................ 5 2.2 INCREASE ABILITY TO MAKE USE OF MORE SOURCES OF WATER, INCLUDING
ALTERNATIVES .................................................................................................................................... 6 2.2.1 Cluster definition, scope, and research initiatives ..................................................................... 6
2.2.1.1 Sector Objective ...................................................................................................... 6 2.2.1.2 Target RDD Outcome for 2025................................................................................ 6 2.2.1.3 Research Initiatives ................................................................................................. 6
2.2.2 RDD Response: Sources .......................................................................................................... 7 2.2.3 RDD Impact: Sources ............................................................................................................... 8 2.2.4 Strategic RDD Programme: Sources ........................................................................................ 9 2.2.5 HCD Outline Plans per research initiative (Cluster: Sources) ................................................ 10
2.2.5.1 Needs .................................................................................................................... 10 2.2.5.2 Potential ................................................................................................................. 12 2.2.5.3 Enablers ................................................................................................................. 14
2.3 IMPROVE GOVERNANCE, PLANNING AND MANAGEMENT OF SUPPLY AND DELIVERY .......... 16 2.3.1 Cluster definition, scope, and research initiatives ................................................................... 16
2.3.1.1 Sector Objective .................................................................................................... 16 2.3.1.2 Target RDD Outcome for 2025.............................................................................. 16 2.3.1.3 Research Initiatives ............................................................................................... 16
2.3.2 RDD Response: Governance, planning and management of supply ..................................... 17 2.3.3 RDD Impact: Governance, planning and management of supply .......................................... 18 2.3.4 Strategic RDD Programme: Governance, planning and management of supply ................... 19 2.3.5 HCD Outline Plans: Governance, planning and management of supply ................................ 20
2.3.5.1 Required research capacity: Governance, planning and management of supply . 20 2.3.5.2 Current research capacity per research initiative within Cluster: Governance, planning and management of supply ..................................................................................... 21
2.4 IMPROVE ADEQUACY AND PERFORMANCE OF SUPPLY INFRASTRUCTURE ........................... 23 2.4.1 Cluster definition, scope, and research initiatives ................................................................... 23
2.4.1.1 Sector Objective .................................................................................................... 23 2.4.1.2 Target RDD Outcome for 2025.............................................................................. 23 2.4.1.3 Research Initiatives ............................................................................................... 23
2.4.2 RDD Response: Infrastructure ................................................................................................ 24 2.4.3 RDD Impact: Infrastructure ..................................................................................................... 25 2.4.4 Strategic RDD Programme: Infrastructure .............................................................................. 26 2.4.5 HCD Outline Plans per research initiative: Infrastructure ....................................................... 27
2.4.5.1 Ecological Infrastructure (Infrastructure) ............................................................... 27 2.4.5.2 Built Infrastructure (Infrastructure) ......................................................................... 29
2.5 RUN WATER AS A FINANCIALLY SUSTAINABLE “BUSINESS” BY IMPROVING OPERATIONAL PERFORMANCE ................................................................................................................................. 31
2.5.1 Cluster definition, scope, and research initiatives ................................................................... 31 2.5.1.1 Sector Objective .................................................................................................... 31
Water Research, Development, and Innovation Roadmap
iv
2.5.1.2 Target RDD Outcome for 2025.............................................................................. 31 2.5.1.3 Research Initiatives ............................................................................................... 31
2.5.2 RDD Response: Operational performance ............................................................................. 32 2.5.3 RDD Impact: Operational performance .................................................................................. 33 2.5.4 Strategic RDD Programme: Operational performance ........................................................... 34 2.5.5 HCD Outline Plans: Operational performance ........................................................................ 35
2.6 IMPROVE GOVERNANCE, PLANNING, AND MANAGEMENT OF DEMAND AND USE .................. 36 2.6.1 Cluster definition, scope, and research initiatives ................................................................... 36
2.6.1.1 Sector Objective .................................................................................................... 36 2.6.1.2 Target RDD Outcome for 2025.............................................................................. 36 2.6.1.3 Research Initiatives ............................................................................................... 36
2.6.2 RDD Response: Governance, Planning, and Management of Demand ................................ 37 2.6.3 RDD Impact: Governance, Planning, and Management of Demand ...................................... 38 2.6.4 Strategic RDD Programme: Governance, Planning, and Management of Demand .............. 39 2.6.5 HCD Outline Plans per research initiative: Governance, Planning, and Management of
Demand ................................................................................................................................... 40 2.6.5.1 Governance (Demand) .......................................................................................... 40 2.6.5.2 Planning and Management (Demand) .................................................................. 41
2.7 REDUCE LOSSES AND INCREASE EFFICIENCY OF PRODUCTIVE USE ..................................... 43 2.7.1 Cluster definition, scope, and research initiatives ................................................................... 43
2.7.1.1 Sector Objective .................................................................................................... 43 2.7.1.2 Target RDD Outcome for 2025.............................................................................. 43 2.7.1.3 Research Initiatives ............................................................................................... 43
2.7.2 RDD Response: Productive use ............................................................................................. 44 2.7.3 RDD Impact: Productive use ................................................................................................... 45 2.7.4 Strategic RDD Programme: Productive use ........................................................................... 46 2.7.5 HCD Outline Plans per research initiative: Productive use .................................................... 47
2.7.5.1 Technical Loss ....................................................................................................... 47 2.7.5.2 Deliberate Demand ................................................................................................ 49
2.8 IMPROVE PERFORMANCE OF PRICING, MONITORING, BILLING, METERING AND COLLECTION ...................................................................................................................................... 51
2.8.1 Cluster definition, scope, and research initiatives ................................................................... 51 2.8.1.1 Sector Objective .................................................................................................... 51 2.8.1.2 Target RDD Outcome for 2025.............................................................................. 51 2.8.1.3 Research Initiatives ............................................................................................... 51
2.8.2 RDD Response: Pricing, Monitoring, Billing ........................................................................... 52 2.8.3 RDD Impact: Pricing, Monitoring, Billing ................................................................................. 53 2.8.4 Strategic RDD Programme: Pricing, Monitoring, Billing ......................................................... 54 2.8.5 HCD Outline Plans per research initiative: Pricing, Monitoring, Billing ................................... 55
2.8.5.1 Cost ....................................................................................................................... 55 2.8.5.2 Volume ................................................................................................................... 56
CHAPTER 3: RETURNS AND INVESTMENTS .............................................................................................. 57
3.1 ANTICIPATED RETURNS ON INVESTMENT ..................................................................................... 57 3.2 INVESTMENT REQUIREMENTS ......................................................................................................... 61 CHAPTER 4: APPROACH AND PARTICIPATION ........................................................................................ 64
4.1 WHAT DO CUSTOMERS WANT? ....................................................................................................... 64 4.1.1 Identify customer needs .......................................................................................................... 64 4.1.2 Review needs, and articulate interventions ............................................................................ 64 4.1.3 Confirm clusters of needs and interventions ........................................................................... 66 4.1.4 Define Sector Performance Measures .................................................................................... 71
4.2 SOUTH AFRICA’S RDD RESPONSE .................................................................................................. 73 4.2.1 Articulate and assess RDD Potential ...................................................................................... 73 4.2.2 Research capability mapping .................................................................................................. 77 4.2.3 Articulate strategic intent ......................................................................................................... 81 4.2.4 Define RDD Programmes ....................................................................................................... 82 4.2.5 Anticipate Programme Impact ................................................................................................. 82
4.3 SETTING UP TO DELIVER SUCCESS ............................................................................................... 83

Water Research, Development, and Innovation Roadmap
v
4.3.1 Quantify impact and investment.............................................................................................. 84 4.3.2 Design implementation framework.......................................................................................... 84
APPENDIX A: WORK SESSION DATA .......................................................................................................... 86
APPENDIX B: ATTRACTIVENESS OF RDD OPPORTUNITIES ACCORDING TO EACH SECTOR, PER CLUSTER. ......................................................................................................................................... 97
APPENDIX C: RESEARCH FOCUS AREAS AND THEIR UNDERLYING DISCIPLINES, MAPPED TO THE SEVEN CLUSTERS OF NEEDS AND INTERVENTIONS ............................................................. 104
APPENDIX D: DEGREE OF DIFFUSION IN RESEARCH FOCUS AREAS, CATEGORISED BY CLUSTER AND SECTOR ................................................................................................................................. 114
APPENDIX E: LEVEL OF RESEARCH STRENGTH OF INSTITUTES, CATEGORISED BY CLUSTER AND SECTOR ......................................................................................................................................... 116
APPENDIX F: IMPACT ANTICIPATED, BASED ON FIVE IMPACT AREAS – SUMMARY ......................... 118
APPENDIX G: NATIONAL RESEARCH FOUNDATION VALUES FOR RESEARCH HUMAN CAPACITY . 121

Water Research, Development, and Innovation Roadmap
vi
LIST OF FIGURES Figure 1: Organogram of this report ................................................................................................................. xii
Figure 2: Structure and overview of the response for each Cluster ................................................................... 5
Figure 3: Research Capacity required each year to carry out RDD Programme, for the Research Initiative “Needs” within the Sources Cluster ................................................................................................... 10
Figure 4: Research Capacity required each year to carry out RDD Programme, for the Research Initiative “Potential” within the Sources Cluster ............................................................................................... 12
Figure 5: Research Capacity required each year to carry out RDD Programme, for the Research Initiative “Enablers” within the Sources Cluster ............................................................................................... 14
Figure 6: Research Capacity required each year to carry out RDD Programme, for the two Research Initiatives “Governance” and “Planning and Management” within the Governance, Planning and Management of Supply Cluster ......................................................................................................... 20
Figure 7: Research Capacity required each year to carry out RDD Programme, for the Research Initiative “Ecological Infrastructure”within the Infrastructure Cluster ............................................................... 27
Figure 8: Research Capacity required each year to carry out RDD Programme, for the Research Initiative “Built Infrastructure” and “Planning and Management” within the Infrastructure Cluster .................. 29
Figure 9: Research Capacity required each year to carry out RDD Programme, for the Operational Performance Cluster ......................................................................................................................... 35
Figure 10: Research Capacity required each year to carry out RDD Programme, for “Governance” in the Cluster, Governance, Planning, and Management of Demand ........................................................ 40
Figure 11: Research Capacity required each year to carry out RDD Programme, for “Planning and Management” in the Cluster, Governance, Planning, and Management of Demand ....................... 41
Figure 12: Research Capacity required each year to carry out RDD Programme, for “Technical Loss” in the Cluster, Productive Use .................................................................................................................... 47
Figure 13: Research Capacity required each year to carry out RDD Programme, for “Technical Loss” in the Cluster, Productive Use .................................................................................................................... 49
Figure 14: Research Capacity required each year to carry out RDD Programme, for “Cost” in the Cluster, Price, Monitor, Bill ............................................................................................................................. 55
Figure 15: Research Capacity required each year to carry out RDD Programme, for “Volume” in the Cluster, Price, Monitor, Bill ............................................................................................................................. 56
Figure 16: Overview of the investment focus and returns ................................................................................ 57
Figure 17: Number of additional people entering water-related SET research via the ten year RDI programme, categorised by research seniority ................................................................................. 59
Figure 18: Investment requirement per year, by cluster, in ZARm ................................................................... 61
Figure 19: Total investment requirement, proportion of investment per Cluster .............................................. 61
Figure 20: Investment requirement per year, by investment instrument, in ZARm .......................................... 62
Figure 21: Total investment requirement, proportion of investment per instrument ......................................... 62
Figure 22: Funding by source as % of investment requirement, by year ......................................................... 63
Figure 23: Funding by source in total, over ten years in R million (left) and as proportion of total investment requirement (right) ............................................................................................................................. 63
Figure 24: Flow chart of the approach and methodology of the road mapping process .................................. 65
Figure 26: Evaluation Framework for RDD Potential ....................................................................................... 74
Figure 25: RDD Potential by Nature and Stage in the innovation chain, expressed in % of needs per cluster, all sectors .......................................................................................................................................... 75
Figure 27: Mapping of capacity in underlying science (RFA) required to conduct research for the Cluster: Operational Performance. An RFA in red indicates no capacity identified at academic units or in research institutions. ......................................................................................................................... 80
Figure 28: Readiness to do ResearchTM framework ......................................................................................... 80
Figure B1: Increase ability to make use of more sources of water, including alternatives ............................... 97
Water Research, Development, and Innovation Roadmap
vii
Figure B2: Improve governance, planning and management of supply and delivery ...................................... 98
Figure B3: Improve adequacy and performance of supply infrastructure ........................................................ 99
Figure B4: Run water as a financially sustainable “business” by improving operational performance .......... 100
Figure B5: Improve governance, planning, and management of demand and use ....................................... 101
Figure B6: Reduce losses and increase efficiency of productive use ............................................................ 102
Figure B7: Improve performance of pricing, monitoring, billing, metering and collection ............................... 103
Figure D1: Degree of diffusion in water supply Clusters ................................................................................ 114
Figure D2: Degree of diffusion in water demand Clusters .............................................................................. 115
Figure E1: Level of strength in water supply Clusters .................................................................................... 116
Figure E2: Level of strength in water demand Clusters ................................................................................. 117
Water Research, Development, and Innovation Roadmap
viii
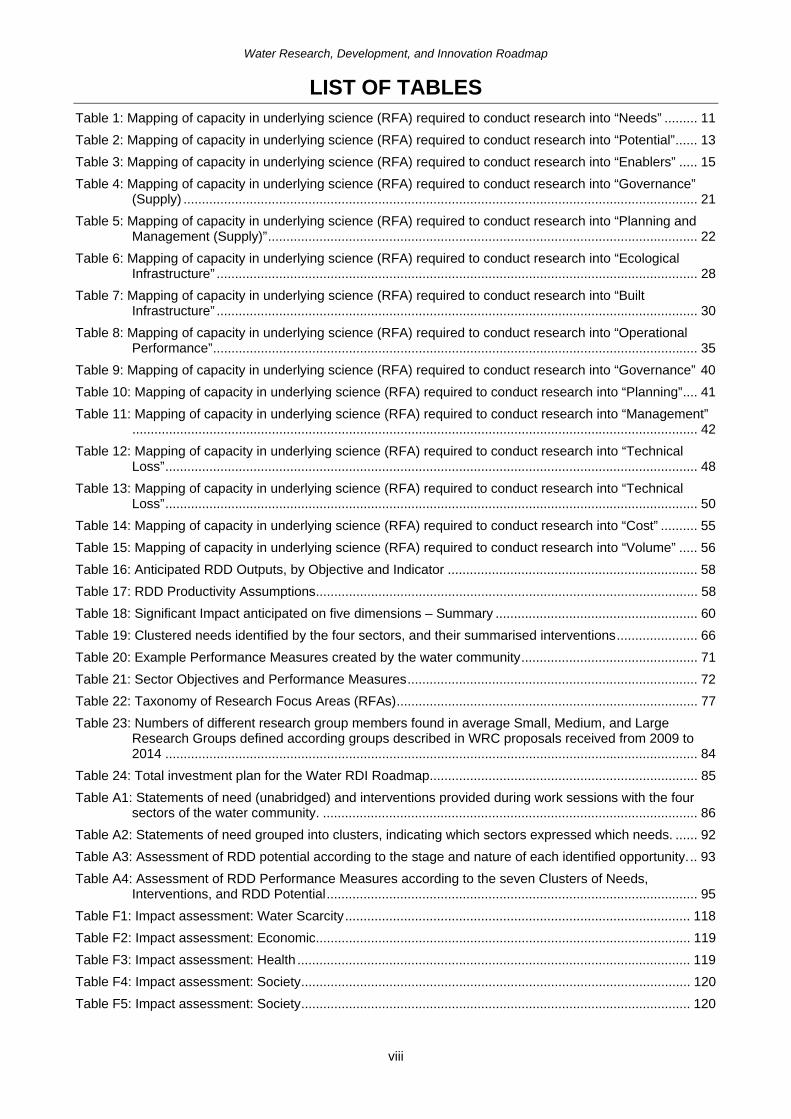
LIST OF TABLES Table 1: Mapping of capacity in underlying science (RFA) required to conduct research into “Needs” ......... 11 Table 2: Mapping of capacity in underlying science (RFA) required to conduct research into “Potential” ...... 13 Table 3: Mapping of capacity in underlying science (RFA) required to conduct research into “Enablers” ..... 15 Table 4: Mapping of capacity in underlying science (RFA) required to conduct research into “Governance”
(Supply) ............................................................................................................................................ 21 Table 5: Mapping of capacity in underlying science (RFA) required to conduct research into “Planning and
Management (Supply)” ..................................................................................................................... 22 Table 6: Mapping of capacity in underlying science (RFA) required to conduct research into “Ecological
Infrastructure” ................................................................................................................................... 28 Table 7: Mapping of capacity in underlying science (RFA) required to conduct research into “Built
Infrastructure” ................................................................................................................................... 30 Table 8: Mapping of capacity in underlying science (RFA) required to conduct research into “Operational
Performance” .................................................................................................................................... 35 Table 9: Mapping of capacity in underlying science (RFA) required to conduct research into “Governance” 40 Table 10: Mapping of capacity in underlying science (RFA) required to conduct research into “Planning” .... 41 Table 11: Mapping of capacity in underlying science (RFA) required to conduct research into “Management”
.......................................................................................................................................................... 42 Table 12: Mapping of capacity in underlying science (RFA) required to conduct research into “Technical
Loss” ................................................................................................................................................. 48 Table 13: Mapping of capacity in underlying science (RFA) required to conduct research into “Technical
Loss” ................................................................................................................................................. 50 Table 14: Mapping of capacity in underlying science (RFA) required to conduct research into “Cost” .......... 55 Table 15: Mapping of capacity in underlying science (RFA) required to conduct research into “Volume” ..... 56 Table 16: Anticipated RDD Outputs, by Objective and Indicator .................................................................... 58 Table 17: RDD Productivity Assumptions ........................................................................................................ 58 Table 18: Significant Impact anticipated on five dimensions – Summary ....................................................... 60 Table 19: Clustered needs identified by the four sectors, and their summarised interventions ...................... 66 Table 20: Example Performance Measures created by the water community ................................................ 71 Table 21: Sector Objectives and Performance Measures ............................................................................... 72 Table 22: Taxonomy of Research Focus Areas (RFAs) .................................................................................. 77 Table 23: Numbers of different research group members found in average Small, Medium, and Large
Research Groups defined according groups described in WRC proposals received from 2009 to 2014 ................................................................................................................................................. 84
Table 24: Total investment plan for the Water RDI Roadmap ......................................................................... 85 Table A1: Statements of need (unabridged) and interventions provided during work sessions with the four
sectors of the water community. ...................................................................................................... 86 Table A2: Statements of need grouped into clusters, indicating which sectors expressed which needs. ...... 92 Table A3: Assessment of RDD potential according to the stage and nature of each identified opportunity. .. 93 Table A4: Assessment of RDD Performance Measures according to the seven Clusters of Needs,
Interventions, and RDD Potential ..................................................................................................... 95 Table F1: Impact assessment: Water Scarcity .............................................................................................. 118 Table F2: Impact assessment: Economic ...................................................................................................... 119 Table F3: Impact assessment: Health ........................................................................................................... 119 Table F4: Impact assessment: Society .......................................................................................................... 120 Table F5: Impact assessment: Society .......................................................................................................... 120

Water Research, Development, and Innovation Roadmap
ix
ACRONYMS & ABBREVIATIONS
ARC Agricultural Research Council
ASSAf Academy of Science of South Africa
CoC Centre of Competence
CoE Centre of Excellence
CSIR Council for Scientific and Industrial Research
DAFF Department of Agriculture, Forestry and Fisheries
DHS Department of Human Settlements
DoH Department of Health
DST Department of Science and Technology
DWS Department of Water and Sanitation
HCD Human Capacity Development, or Human Capital Development
HEI Higher Education Institute
KG Knowledge generation
M&E Monitoring and evaluation
NBI National Business Initiative
NEPAD The New Partnership for Africa's Development
NGO Non-government organisation
NIPMO National Intellectual Property Management Office
NPC National Planning Commission
NRF National Research Foundation
NSI National System of Innovation
NWRS2 National Water Resources Strategy 2
PSP Professional service centre
R&D Research and development
RDD Research, development, and deployment
RDI Research, development, and innovation
RFA Research focus area
RP Research programme
SALGA South African Local Government Association
SANBI South African National Biodiversity Institute
SAWS South African Weather Services
SET Science, engineering, and technology
SOE State-owned enterprise
SWPN Strategic Water Partners Network
TAC Technical assistance centre
TCTA Trans Caledon Tunnel Authority
TIA Technology Innovation Agency
TRP Targeted research programme
WADER Water Technologies Demonstration Programme
WCDM Water conservation and demand management
WDCS Waste discharge charge system
WESSA Wildlife and Environment Society of South Africa
WHO World Health Organization
WRC Water Research Commission
WUA Water Users’ Association
WUE Water use efficiency
WWF-SA Worldwide Fund for Nature South Africa

Water Research, Development, and Innovation Roadmap
x
GLOSSARY
Centre of Competence
Pre-commercialisation instrument positioned downstream in the NSI of a CoE, and immediately before commercialisation.
Centre of Excellence
CoEs are physical or virtual centres of research that concentrate existing research excellence and capacity and resources to enable researchers to collaborate across disciplines and institutions on long-term projects that are locally relevant and internationally competitive in order to enhance the pursuit of research excellence and capacity development.
Cluster definition A definition of the Cluster with its constituent Research Initiatives, together with the associated water sector objective and RDD Outcome for 2025, in support of the Cluster objective.
Customer and Partner Relationship Management
Recognises that the need to engage with customers, partner and investors – to engage, understand needs, secure buy-in, participation and commitment to collaborate, invest or commercialise requires explicit resource that is other, or incremental to those that are principally involved in conducting research itself. This may require a dedicated function, such as a desk
Customer needs Statements of need expressed by ‘Customers’, who in this context were members of the water community of professionals, which were divided into four sectors: Agriculture, Industry, The public sector, and Environmental protection.
HCD Outline Plan A summary of the research capacity required for each Cluster – at the level of Research Initiative – as well as the current level of competence in the associated Research Focus Areas (RFAs). This indicates the potential for realisation of the intended RDD Programme. It also provides a basis for more detailed investigation of requirements for HCD interventions.
Human Capacity Development, or Human Capital Development (HCD)
Honours and graduate students (not Masters or PhDs) supported as part of building a pipeline of RDI Capacity. In the investment model, masters and doctoral studies are catered for under Research Capacity because these students contribute to research activity as part of Research Groups. Investment is also required in the Bachelors and Honours part of the pipeline. This is provided for in the HCD component of the Investment Model.
Impact Assessment Framework
The Impact Assessment Framework used required assessment of anticipated impacts in a set of nine sub-areas in five broad areas: Water Scarcity, Economic, Health, Society, and Environment.
Interventions Actions required or corrective measures that can be taken to satisfy a need, without prescribing a solution in terms of how, or when, such action could be taken.
Knowledge Diffusion
The extent to which knowledge about a specified topic has diffused from research into practice. The degree of KD is estimated on a scale of 0 (initial research, no implementation), through field testing and pockets of implementation, to 5 (research translated into full adoption).
Professional Service Centre (PSC)
A PSC is a market-facing unit that delivers services or technical offerings to a defined set of customers, on a commercial basis (though not necessarily as a for-profit enterprise).
RDD Impact A high level summary of the potential impact anticipated, based on successful performance of the RDD Programme, in relation to five areas defined in the Impact Assessment Framework.
RDD Opportunity An identified set of actions which would allow RDD activity to provide for interventions to satisfy needs.

Water Research, Development, and Innovation Roadmap
xi
RDD Outcome Describes our ambition, i.e. what – ideally – will have been achieved at the successful conclusion of the Programme.
RDD Potential The potential that resides in South Africa to undertake RDI and RDD activity, as a product of current research capability and strength, and existence of opportunities.
RDD Programme Defined in immediate, short-, medium-, and long-term timeframes. The immediate phase is typically time-limited to one year in which to explore and further clarify the RDD Opportunity and plan an appropriate research response.
RDD Response A high level summary of the planned RDD Programme planned for each Cluster based on identified Customer Needs and the opportunity to develop and deploy solutions in satisfaction of such needs through R&D.
RDI / RDD Objective
RDD Objectives distil and summarise the Needs and Interventions documented. Sets out at a high level the ambition and focus of the RDI Programmes that underpin the contribution of RDI to achievement of the vision.
RDI Infrastructure Facilities and equipment required to perform RDI activity
RDI Success Factor Success Factors are things that are required to enable achievement of the RDD Objectives.
Research Capacity Research Groups, whether at a particular location or in the form of a distributed network, including masters and doctoral students that are associated with, and supervised by this Research Capacity. Capacity Outline Plan: forward needs summarised.
Research Chair Research Chairs may be publicly or privately funded. They are held by a university in partnership with a private partner or a public research institution. The main goal of Research Chairs is to strengthen and improve research and innovation capacity of public universities for producing high quality postgraduate students and research and innovation outputs. The South African Research Chairs Initiative (SARChI) is designed to attract and retain excellence in research and innovation at South African public universities through the establishment of Research Chairs at public universities in South Africa with a long-term investment trajectory of up to fifteen years.
Research Focus Area
Areas of research expertise were defined both by the underlying academic discipline (e.g. microbiology) and the research focus area (RFA), or area of interest (e.g. potable water quality). The full list of RFAs is shown in Appendix C.
Research Strength The number of people active in an RFA, with recognition of their length experience and depth and breadth of their capabilities. Research Strength is gauged on a scale of 1 to 8. The ideal situation is one in which 20% of research groups in a certain focus area are below level, 50% at levels 5-6, and 30% at level 7 or 8.
Sector Objective The Target Objective for a sector.
Seeding Covers investments made at the Exploratory Phase, as well as investment to enable a change in state in the course of the overall timeframe
Target Objective The Target Objective sets out an intended end-state, in terms of a capabilities, products, and state of commercialisation for these key areas or contribution.
Targeted Research Programme (TRP)
A Research Programme (RP) designed specifically to satisfy a particular Need or Cluster of Needs.
Technology Development
Human resource investments associated with the development of technology (and service) components, platforms, systems, process improvements
Water Research, Development, and Innovation Roadmap
xii
REPORT ARCHITECTURE
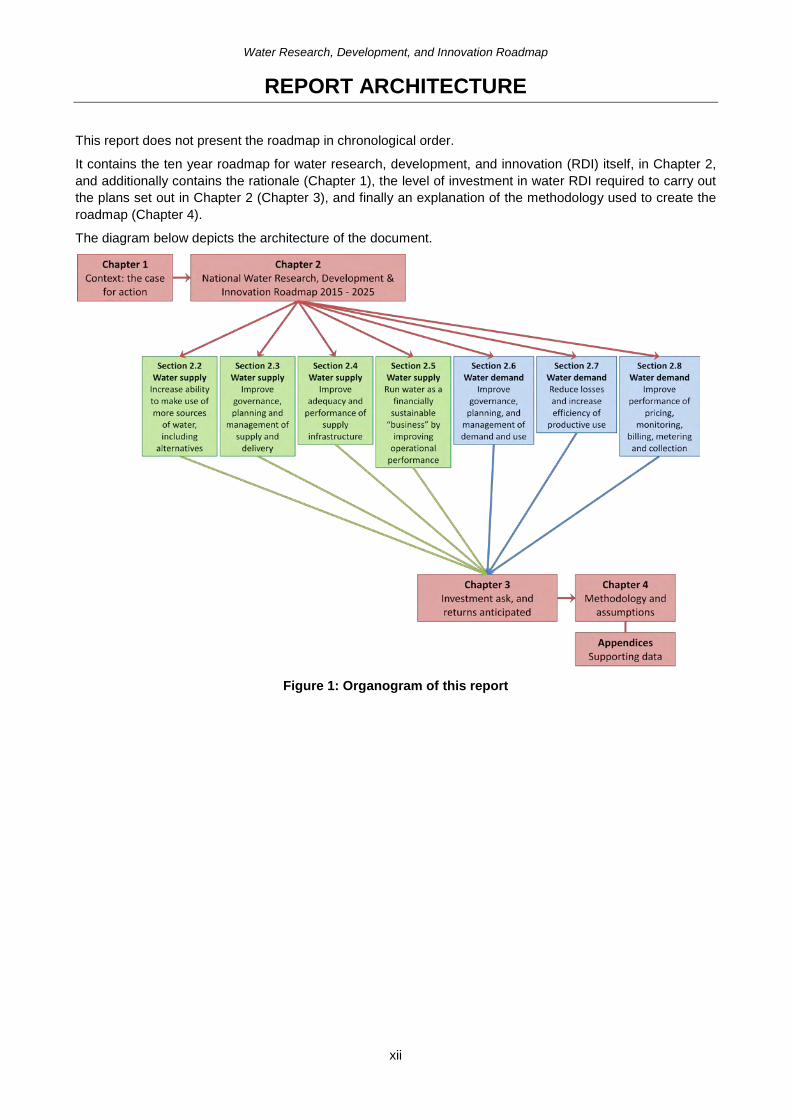
This report does not present the roadmap in chronological order.
It contains the ten year roadmap for water research, development, and innovation (RDI) itself, in Chapter 2, and additionally contains the rationale (Chapter 1), the level of investment in water RDI required to carry out the plans set out in Chapter 2 (Chapter 3), and finally an explanation of the methodology used to create the roadmap (Chapter 4).
The diagram below depicts the architecture of the document.
Figure 1: Organogram of this report
South Africa’s Research, Development, and Innovation Roadmap
1
CHAPTER 1: CONTEXT
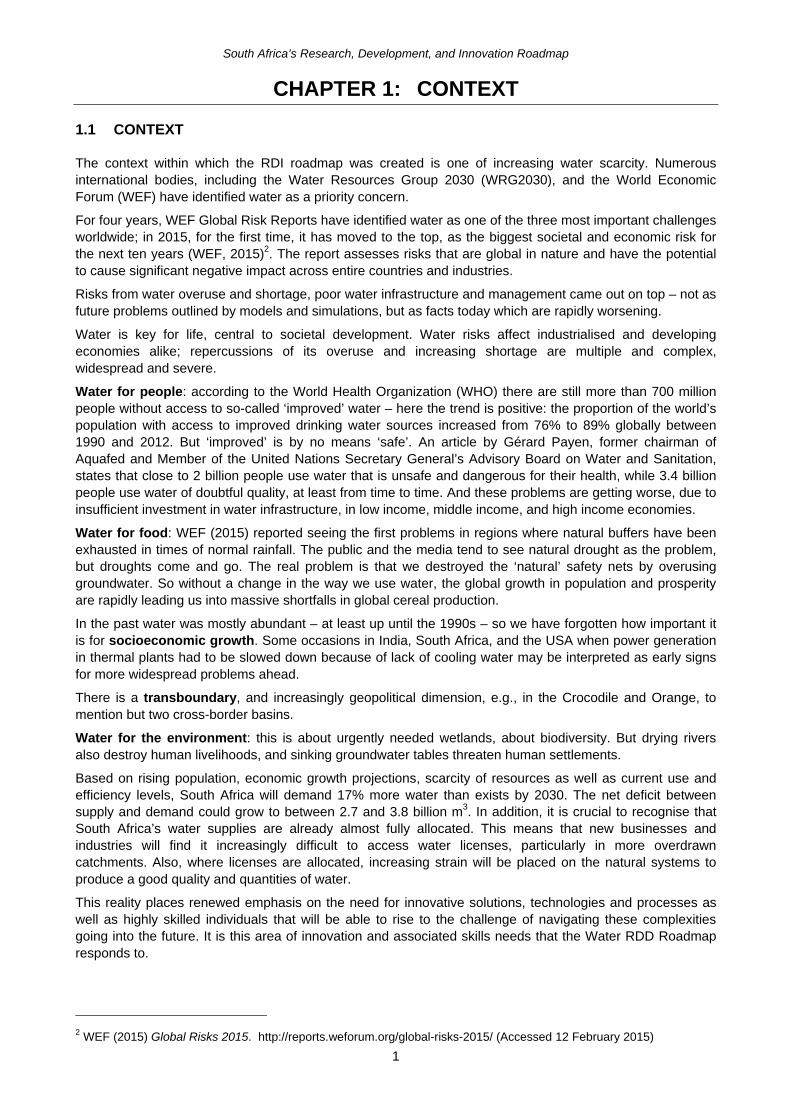
1.1 CONTEXT
The context within which the RDI roadmap was created is one of increasing water scarcity. Numerous international bodies, including the Water Resources Group 2030 (WRG2030), and the World Economic Forum (WEF) have identified water as a priority concern.
For four years, WEF Global Risk Reports have identified water as one of the three most important challenges worldwide; in 2015, for the first time, it has moved to the top, as the biggest societal and economic risk for the next ten years (WEF, 2015)2. The report assesses risks that are global in nature and have the potential to cause significant negative impact across entire countries and industries.
Risks from water overuse and shortage, poor water infrastructure and management came out on top – not as future problems outlined by models and simulations, but as facts today which are rapidly worsening.
Water is key for life, central to societal development. Water risks affect industrialised and developing economies alike; repercussions of its overuse and increasing shortage are multiple and complex, widespread and severe.
Water for people: according to the World Health Organization (WHO) there are still more than 700 million people without access to so-called ‘improved’ water – here the trend is positive: the proportion of the world’s population with access to improved drinking water sources increased from 76% to 89% globally between 1990 and 2012. But ‘improved’ is by no means ‘safe’. An article by Gérard Payen, former chairman of Aquafed and Member of the United Nations Secretary General’s Advisory Board on Water and Sanitation, states that close to 2 billion people use water that is unsafe and dangerous for their health, while 3.4 billion people use water of doubtful quality, at least from time to time. And these problems are getting worse, due to insufficient investment in water infrastructure, in low income, middle income, and high income economies.
Water for food: WEF (2015) reported seeing the first problems in regions where natural buffers have been exhausted in times of normal rainfall. The public and the media tend to see natural drought as the problem, but droughts come and go. The real problem is that we destroyed the ‘natural’ safety nets by overusing groundwater. So without a change in the way we use water, the global growth in population and prosperity are rapidly leading us into massive shortfalls in global cereal production.
In the past water was mostly abundant – at least up until the 1990s – so we have forgotten how important it is for socioeconomic growth. Some occasions in India, South Africa, and the USA when power generation in thermal plants had to be slowed down because of lack of cooling water may be interpreted as early signs for more widespread problems ahead.
There is a transboundary, and increasingly geopolitical dimension, e.g., in the Crocodile and Orange, to mention but two cross-border basins.
Water for the environment: this is about urgently needed wetlands, about biodiversity. But drying rivers also destroy human livelihoods, and sinking groundwater tables threaten human settlements.
Based on rising population, economic growth projections, scarcity of resources as well as current use and efficiency levels, South Africa will demand 17% more water than exists by 2030. The net deficit between supply and demand could grow to between 2.7 and 3.8 billion m3. In addition, it is crucial to recognise that South Africa’s water supplies are already almost fully allocated. This means that new businesses and industries will find it increasingly difficult to access water licenses, particularly in more overdrawn catchments. Also, where licenses are allocated, increasing strain will be placed on the natural systems to produce a good quality and quantities of water.
This reality places renewed emphasis on the need for innovative solutions, technologies and processes as well as highly skilled individuals that will be able to rise to the challenge of navigating these complexities going into the future. It is this area of innovation and associated skills needs that the Water RDD Roadmap responds to.
2 WEF (2015) Global Risks 2015. http://reports.weforum.org/global-risks-2015/ (Accessed 12 February 2015)
South Africa’s Research, Development, and Innovation Roadmap
2
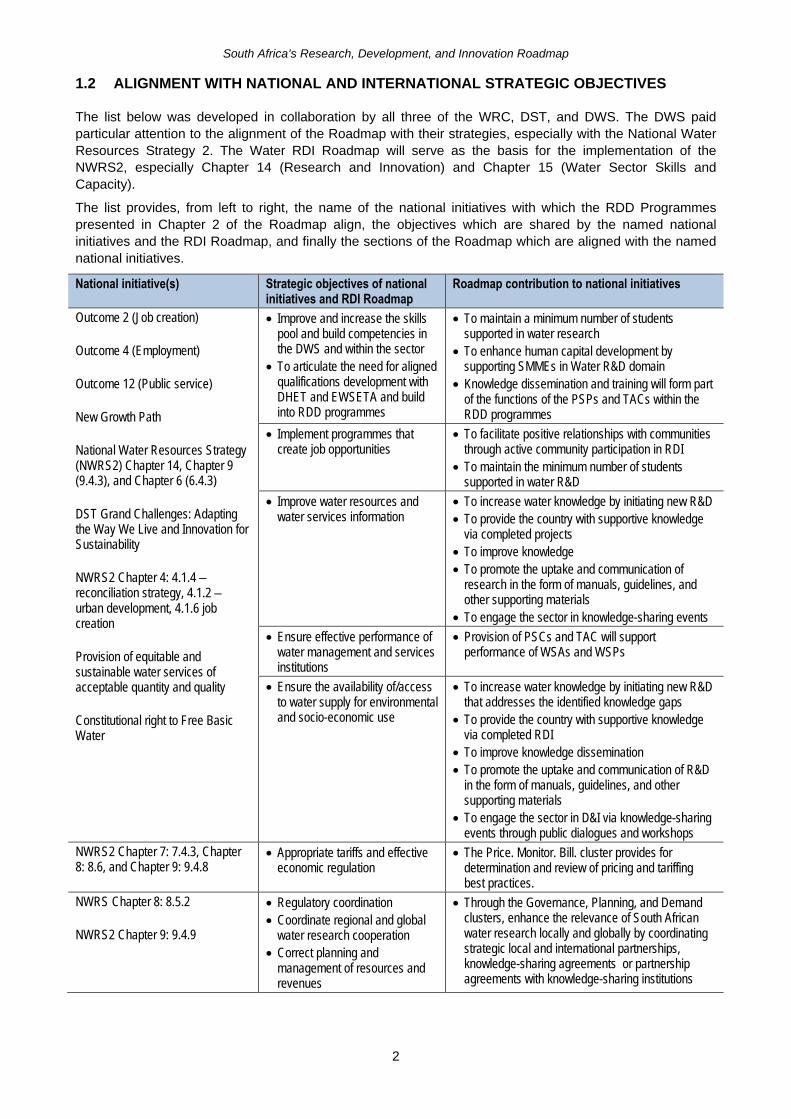
1.2 ALIGNMENT WITH NATIONAL AND INTERNATIONAL STRATEGIC OBJECTIVES
The list below was developed in collaboration by all three of the WRC, DST, and DWS. The DWS paid particular attention to the alignment of the Roadmap with their strategies, especially with the National Water Resources Strategy 2. The Water RDI Roadmap will serve as the basis for the implementation of the NWRS2, especially Chapter 14 (Research and Innovation) and Chapter 15 (Water Sector Skills and Capacity).
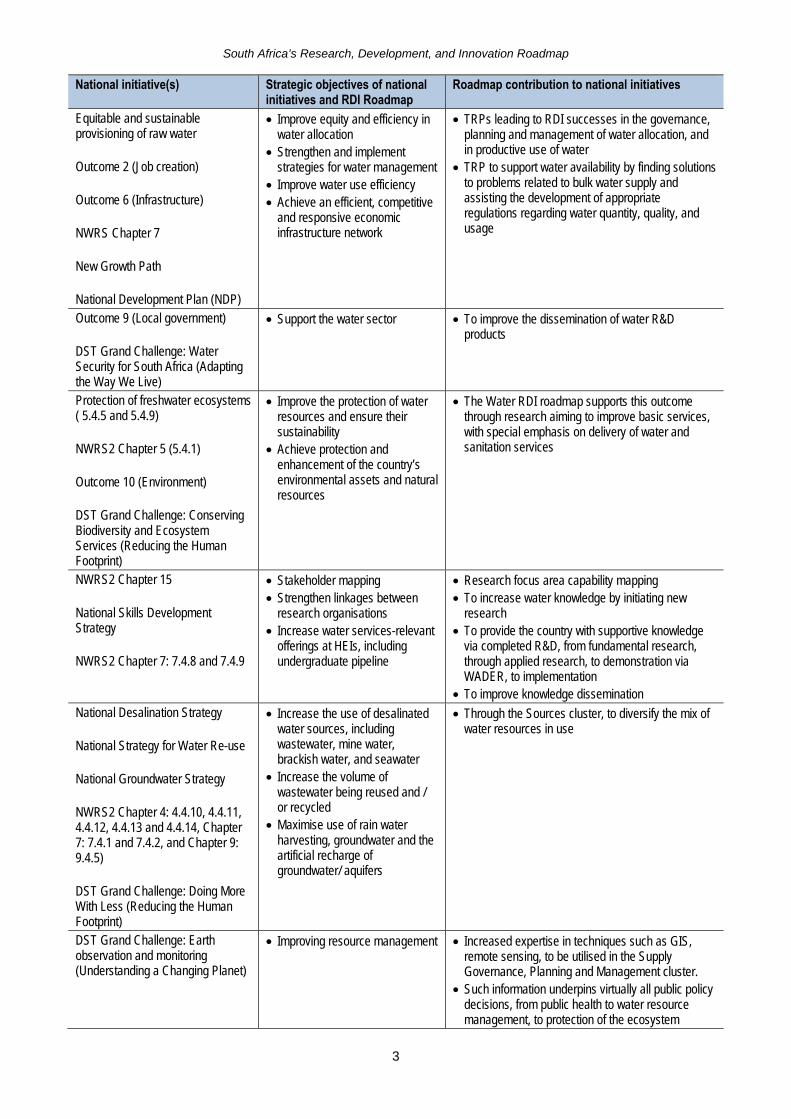
The list provides, from left to right, the name of the national initiatives with which the RDD Programmes presented in Chapter 2 of the Roadmap align, the objectives which are shared by the named national initiatives and the RDI Roadmap, and finally the sections of the Roadmap which are aligned with the named national initiatives.
National initiative(s) Strategic objectives of national initiatives and RDI Roadmap
Roadmap contribution to national initiatives
Outcome 2 (Job creation) Outcome 4 (Employment) Outcome 12 (Public service) New Growth Path National Water Resources Strategy (NWRS2) Chapter 14, Chapter 9 (9.4.3), and Chapter 6 (6.4.3) DST Grand Challenges: Adapting the Way We Live and Innovation for Sustainability NWRS2 Chapter 4: 4.1.4 – reconciliation strategy, 4.1.2 – urban development, 4.1.6 job creation Provision of equitable and sustainable water services of acceptable quantity and quality Constitutional right to Free Basic Water
• Improve and increase the skills pool and build competencies in the DWS and within the sector
• To articulate the need for aligned qualifications development with DHET and EWSETA and build into RDD programmes
• To maintain a minimum number of students supported in water research
• To enhance human capital development by supporting SMMEs in Water R&D domain
• Knowledge dissemination and training will form part of the functions of the PSPs and TACs within the RDD programmes
• Implement programmes that create job opportunities
• To facilitate positive relationships with communities through active community participation in RDI
• To maintain the minimum number of students supported in water R&D
• Improve water resources and water services information
• To increase water knowledge by initiating new R&D • To provide the country with supportive knowledge
via completed projects • To improve knowledge • To promote the uptake and communication of
research in the form of manuals, guidelines, and other supporting materials
• To engage the sector in knowledge-sharing events
• Ensure effective performance of water management and services institutions
• Provision of PSCs and TAC will support performance of WSAs and WSPs
• Ensure the availability of/access to water supply for environmental and socio-economic use
• To increase water knowledge by initiating new R&D that addresses the identified knowledge gaps
• To provide the country with supportive knowledge via completed RDI
• To improve knowledge dissemination • To promote the uptake and communication of R&D
in the form of manuals, guidelines, and other supporting materials
• To engage the sector in D&I via knowledge-sharing events through public dialogues and workshops
NWRS2 Chapter 7: 7.4.3, Chapter 8: 8.6, and Chapter 9: 9.4.8
• Appropriate tariffs and effective economic regulation
• The Price. Monitor. Bill. cluster provides for determination and review of pricing and tariffing best practices.
NWRS Chapter 8: 8.5.2 NWRS2 Chapter 9: 9.4.9
• Regulatory coordination • Coordinate regional and global
water research cooperation • Correct planning and
management of resources and revenues
• Through the Governance, Planning, and Demand clusters, enhance the relevance of South African water research locally and globally by coordinating strategic local and international partnerships, knowledge-sharing agreements or partnership agreements with knowledge-sharing institutions
South Africa’s Research, Development, and Innovation Roadmap
3
National initiative(s) Strategic objectives of national initiatives and RDI Roadmap
Roadmap contribution to national initiatives
Equitable and sustainable provisioning of raw water Outcome 2 (Job creation) Outcome 6 (Infrastructure) NWRS Chapter 7 New Growth Path National Development Plan (NDP)
• Improve equity and efficiency in water allocation
• Strengthen and implement strategies for water management
• Improve water use efficiency • Achieve an efficient, competitive
and responsive economic infrastructure network
• TRPs leading to RDI successes in the governance, planning and management of water allocation, and in productive use of water
• TRP to support water availability by finding solutions to problems related to bulk water supply and assisting the development of appropriate regulations regarding water quantity, quality, and usage
Outcome 9 (Local government) DST Grand Challenge: Water Security for South Africa (Adapting the Way We Live)
• Support the water sector • To improve the dissemination of water R&D products
Protection of freshwater ecosystems ( 5.4.5 and 5.4.9) NWRS2 Chapter 5 (5.4.1) Outcome 10 (Environment) DST Grand Challenge: Conserving Biodiversity and Ecosystem Services (Reducing the Human Footprint)
• Improve the protection of water resources and ensure their sustainability
• Achieve protection and enhancement of the country’s environmental assets and natural resources
• The Water RDI roadmap supports this outcome through research aiming to improve basic services, with special emphasis on delivery of water and sanitation services
NWRS2 Chapter 15 National Skills Development Strategy NWRS2 Chapter 7: 7.4.8 and 7.4.9
• Stakeholder mapping • Strengthen linkages between
research organisations • Increase water services-relevant
offerings at HEIs, including undergraduate pipeline
• Research focus area capability mapping • To increase water knowledge by initiating new
research • To provide the country with supportive knowledge
via completed R&D, from fundamental research, through applied research, to demonstration via WADER, to implementation
• To improve knowledge dissemination National Desalination Strategy National Strategy for Water Re-use National Groundwater Strategy NWRS2 Chapter 4: 4.4.10, 4.4.11, 4.4.12, 4.4.13 and 4.4.14, Chapter 7: 7.4.1 and 7.4.2, and Chapter 9: 9.4.5) DST Grand Challenge: Doing More With Less (Reducing the Human Footprint)
• Increase the use of desalinated water sources, including wastewater, mine water, brackish water, and seawater
• Increase the volume of wastewater being reused and / or recycled
• Maximise use of rain water harvesting, groundwater and the artificial recharge of groundwater/ aquifers
• Through the Sources cluster, to diversify the mix of water resources in use
DST Grand Challenge: Earth observation and monitoring (Understanding a Changing Planet)
• Improving resource management • Increased expertise in techniques such as GIS, remote sensing, to be utilised in the Supply Governance, Planning and Management cluster.
• Such information underpins virtually all public policy decisions, from public health to water resource management, to protection of the ecosystem
South Africa’s Research, Development, and Innovation Roadmap
4
National initiative(s) Strategic objectives of national initiatives and RDI Roadmap
Roadmap contribution to national initiatives
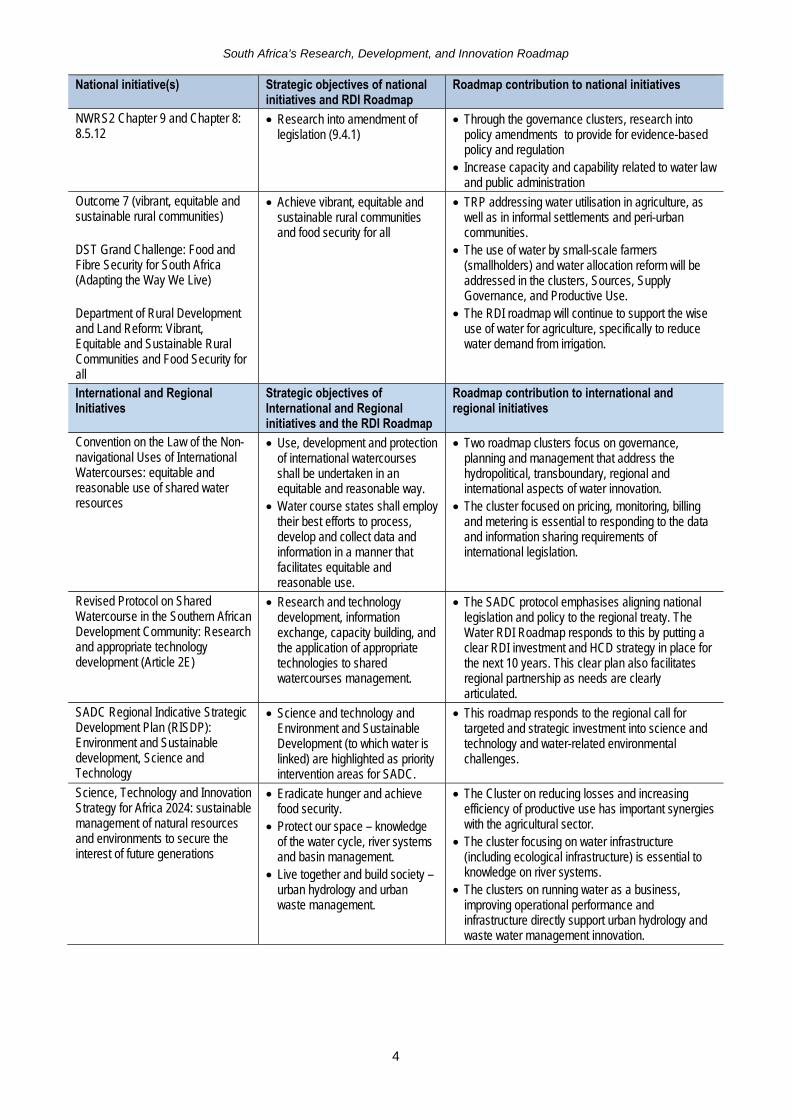
NWRS2 Chapter 9 and Chapter 8: 8.5.12
• Research into amendment of legislation (9.4.1)
• Through the governance clusters, research into policy amendments to provide for evidence-based policy and regulation
• Increase capacity and capability related to water law and public administration
Outcome 7 (vibrant, equitable and sustainable rural communities) DST Grand Challenge: Food and Fibre Security for South Africa (Adapting the Way We Live) Department of Rural Development and Land Reform: Vibrant, Equitable and Sustainable Rural Communities and Food Security for all
• Achieve vibrant, equitable and sustainable rural communities and food security for all
• TRP addressing water utilisation in agriculture, as well as in informal settlements and peri-urban communities.
• The use of water by small-scale farmers (smallholders) and water allocation reform will be addressed in the clusters, Sources, Supply Governance, and Productive Use.
• The RDI roadmap will continue to support the wise use of water for agriculture, specifically to reduce water demand from irrigation.
International and Regional Initiatives
Strategic objectives of International and Regional initiatives and the RDI Roadmap
Roadmap contribution to international and regional initiatives
Convention on the Law of the Non-navigational Uses of International Watercourses: equitable and reasonable use of shared water resources
• Use, development and protection of international watercourses shall be undertaken in an equitable and reasonable way.
• Water course states shall employ their best efforts to process, develop and collect data and information in a manner that facilitates equitable and reasonable use.
• Two roadmap clusters focus on governance, planning and management that address the hydropolitical, transboundary, regional and international aspects of water innovation.
• The cluster focused on pricing, monitoring, billing and metering is essential to responding to the data and information sharing requirements of international legislation.
Revised Protocol on Shared Watercourse in the Southern African Development Community: Research and appropriate technology development (Article 2E)
• Research and technology development, information exchange, capacity building, and the application of appropriate technologies to shared watercourses management.
• The SADC protocol emphasises aligning national legislation and policy to the regional treaty. The Water RDI Roadmap responds to this by putting a clear RDI investment and HCD strategy in place for the next 10 years. This clear plan also facilitates regional partnership as needs are clearly articulated.
SADC Regional Indicative Strategic Development Plan (RISDP): Environment and Sustainable development, Science and Technology
• Science and technology and Environment and Sustainable Development (to which water is linked) are highlighted as priority intervention areas for SADC.
• This roadmap responds to the regional call for targeted and strategic investment into science and technology and water-related environmental challenges.
Science, Technology and Innovation Strategy for Africa 2024: sustainable management of natural resources and environments to secure the interest of future generations
• Eradicate hunger and achieve food security.
• Protect our space – knowledge of the water cycle, river systems and basin management.
• Live together and build society – urban hydrology and urban waste management.
• The Cluster on reducing losses and increasing efficiency of productive use has important synergies with the agricultural sector.
• The cluster focusing on water infrastructure (including ecological infrastructure) is essential to knowledge on river systems.
• The clusters on running water as a business, improving operational performance and infrastructure directly support urban hydrology and waste water management innovation.

South Africa’s Research, Development, and Innovation Roadmap
5
CHAPTER 2: SOUTH AFRICA'S WATER RDI ROADMAP: 2015-2025
2.1 STRUCTURE OF THE ROADMAP
This chapter presents the end results of the roadmapping process – i.e. the roadmap itself. Explanations of how the information in this chapter was derived are provided in Chapter 4. Definitions of the specialised terms used may be found in the glossary and list of abbreviations on pages vi-vii.
The reader should be aware that in order to fully understand the methodology and assumptions that underpin the conclusions of the roadmapping process presented in Chapter 2, s/he will need to read, or at least refer to, Chapter 4.
In brief, a comprehensive workshopping and reiterative review and rebuild process was adopted to create a list of the needs of the water community. The water community as a whole was divided into four sectors: Agriculture, Industry, Public Sector, and Environmental Protection.
Each sector then identified Interventions in order to provide lists of recommended actions that would satisfy each need. The needs and interventions could be categorised into seven Clusters, around each of which a ten year programme of action and investment was created. The process is described in full in sections 4.1 to 4.3.
The seven Clusters are divided into supply and demand side needs and interventions, as follows:
Water supply 1. Increase ability to make use of more sources of water, including alternatives 2. Improve governance, planning and management of supply and delivery 3. Improve adequacy and performance of supply infrastructure 4. Run water as a financially sustainable “business” by improving operational performance
Water demand 5. Improve governance, planning, and management of demand and use 6. Reduce losses and increase efficiency of productive use 7. Improve performance of pricing, monitoring, billing, metering and collection
Sections 2.2 to 2.8 present the programmes of RDD Responses designed for each Cluster. Figure 2 illustrates the way in which sections 2.2 to 2.8 have been structured.
Figure 2: Structure and overview of the response for each Cluster

South Africa’s Research, Development, and Innovation Roadmap
6
Each section begins by defining the Cluster, then provides the RDD Response, the anticipated impact of responding, an RDD programme which sets out actions over a ten year period, and finally an HCD plan for each research initiative within the RDD Programme.
The RDD Response plans each provide identification of national and international partners to be engaged, for each Cluster (for example, the Sources Cluster RDD Response is shown on page 7). This is important, as it informs decisions around co-funding, such as which donors may have overlapping priorities, and around internationalisation of the research outputs. Water is a major research and innovation theme that is central to Africa’s development, and an area in which international co-operation is essential.
The impacts that would be made by implementing each ten year plan were assessed using the methodology set out in section 4.2.4. The appropriate instruments to implement each ten year plan were identified, and the costs estimated, based on sets of assumptions which are explained in detail in sections 4.2 and 4.3.
2.2 SUPPLY CLUSTER 1: INCREASE ABILITY TO MAKE USE OF MORE SOURCES OF WATER, INCLUDING ALTERNATIVES
2.2.1 Cluster definition, scope, and research initiatives
2.2.1.1 Sector Objective
Increase ability to make use of more sources of water, including alternatives.
2.2.1.2 Target RDD Outcome for 2025
Technology development for utilisation of diverse water sources at catchment level, with source localisation and exploitation driven by fitness for use is a key point of excellence in South African practices.
Focus on local resources and appropriate technologies, with strategic consideration of leverage potential and location opportunity from the adaption of inbound technology; explicit emphasis on deployment and uptake.
2.2.1.3 Research Initiatives
The Sources Cluster contains three research initiatives, which are:

Sou
th A
fric
a’s
Res
ear
ch, D
evel
op
men
t, an
d In
nova
tion
Roa
dmap
7
2.2.
2 R
DD
Res
po
nse
: S
ou
rces
RDD
Activ
ity
RDD
Focu
s and
Pr
ogre
ssio
n
Iden
tific
atio
n of
opp
ortu
nitie
s to
impr
ove
mix
of w
ater
sour
ces i
n us
e. D
evel
opm
ent o
f tec
hnol
ogie
s, c
apac
ity, i
nfor
mat
ion
and
man
agem
ent
met
hods
to
incr
ease
the
use
of tr
eate
d ef
fluen
t, de
crea
se le
vels
of sa
linity
thro
ugh
desa
linat
ion,
incr
ease
rain
wat
er h
arve
stin
g an
d th
e us
e of
gro
undw
ater
. Ex
plor
e th
e co
untr
y’s p
oten
tial t
o in
crea
se fl
oodw
ater
and
stor
mw
ater
har
vest
ing
and
man
agem
ent.
U
nder
lyin
g Sc
ienc
e
Mul
tiple
disc
iplin
es w
ithin
nat
ural
scie
nces
, eng
inee
ring,
hum
aniti
es, a
nd la
w
Know
-How
In
telle
ctua
l Pro
pert
y Po
tent
ial f
or p
aten
tabl
e tr
eatm
ent t
echn
olog
ies f
or d
irect
and
indi
rect
wat
er re
use
and
recy
clin
g
Know
ledg
e Di
ffusio
n
Agric
ultu
re: n
ot m
any
prod
ucts
mak
ing
the
mar
ket t
o ad
dres
s nee
ds. P
ublic
sect
or, I
ndus
try,
and
Env
ironm
ent:
inve
st in
com
mer
cial
isatio
n ve
hicl
es,
prod
uct d
evel
opm
ent c
entr
es, t
echn
olog
y de
velo
pmen
t, se
ed fu
ndin
g, e
tc. t
o sh
ift b
alan
ce m
ore
tow
ards
rese
arch
bei
ng tr
ansla
ted
into
full
adop
tion.
Re
adin
ess t
o do
Res
earc
hTM
Capa
city
Th
e re
sear
ch g
roup
s are
dist
ribut
ed b
etw
een
seve
ral u
nive
rsiti
es, s
cien
ce c
ounc
ils, a
nd p
rivat
e or
gani
satio
ns. M
ost g
roup
s are
em
ergi
ng o
r bui
ldin
g.
Inve
stm
ent f
ocus
shou
ld b
e on
stre
ngth
enin
g th
e ex
istin
g re
sear
ch g
roup
s.
Stre
ngth
1 To
o m
any
at m
id-le
vel (
4-6)
. Fun
ding
may
be
insu
ffici
ent t
o gr
ow th
e st
reng
th o
f ins
titut
ions
. Alig
nmen
t and
refo
cus o
f res
earc
h m
ay b
e re
quire
d to
in
crea
se st
reng
th a
nd b
ring
reso
urce
s tog
ethe
r. TR
P ne
eded
, lea
ding
to C
oE.
RDI I
nfra
stru
ctur
e
Inst
all,
Mai
ntai
n
Map
ping
and
mod
ellin
g in
fras
truc
ture
, lab
orat
ory
abili
ty to
do
LCA
anal
yses
, com
putin
g, w
ater
qua
lity
test
ing,
mat
eria
ls te
stin
g. P
ilot /
dem
onst
ratio
n pl
ant f
acili
ties.
Cu
stom
ers a
nd P
artn
ers
Gove
rnm
ent a
nd
Stak
ehol
ders
DW
S, N
PC, D
ST, D
oH, D
AFF,
DHS
, SAL
GA, W
ater
Boa
rds,
Wat
er S
ervi
ces A
utho
ritie
s, W
ater
Ser
vice
s Pro
vide
rs
Priv
ate
Sect
or
Priv
ate
sect
or e
ngin
eerin
g co
mpa
nies
Re
sear
ch
Agen
cies
N
RF, W
RC, T
IA –
age
ncie
s are
larg
ely
resp
onsib
le fo
r ena
blem
ent,
such
as f
undi
ng, p
rovi
ding
par
tner
ship
s, o
r oth
er su
ppor
t mec
hani
sms
Scie
nce
Coun
cils
and
Uni
vers
ities
Broa
d ra
nge
of p
artn
ersh
ips a
t HEI
s, AR
C, M
inte
k, C
SIR,
CGS
, with
spec
ific
part
ners
dep
endi
ng o
n RF
A, d
iscip
line,
and
scal
e of
tech
nolo
gy. T
hese
or
gani
satio
ns h
ave
role
s and
man
date
s rel
atin
g to
fund
amen
tal r
esea
rch,
app
lied
rese
arch
, ind
ustr
ial d
evel
opm
ent,
and
scal
e-up
of i
nnov
ativ
e pr
oduc
ts
and
proc
esse
s.
Oth
er P
artn
ersh
ips
SWPN
, NBI
, NEP
AD. T
hese
‘oth
er’ p
artn
ers w
ill b
e in
volv
ed in
div
erse
act
iviti
es, f
or e
xam
ple,
diss
emin
atio
n of
new
kno
wle
dge,
ass
istan
ce w
ith fi
ndin
g an
d se
curin
g sit
es a
nd/o
r par
tner
s for
pilo
ting
/ dem
onst
ratio
n, c
o-fu
ndin
g, p
rom
otio
n of
the
RDI O
utpu
ts to
thei
r net
wor
ks.
1 R
esea
rch
Str
engt
h is
ga
uged
on
a sc
ale
of 1
to 8
. The
idea
l situ
atio
n is
on
e in
wh
ich
•
20%
of r
ese
arch
gro
ups
in a
cer
tain
focu
s ar
ea a
re b
elo
w le
vel 4
– th
is s
how
s th
at th
ere
is g
row
th, m
ean
ing
new
inst
itutio
ns s
tart
ing
to w
ork
in th
e fo
cus
area
. •
50%
in le
vels
5-6
, mea
ning
that
the
maj
ority
of i
nstit
utio
ns a
re a
t a b
uild
ing
leve
l •
30%
at l
evel
7 o
r 8,
sho
win
g th
at th
ere
is e
nou
gh
rese
arch
at a
mat
ure
enou
gh
leve
l to
add
ress
mar
ket n
eeds
.
Sou
th A
fric
a’s
Res
ear
ch, D
evel
op
men
t, an
d In
nova
tion
Roa
dmap
8
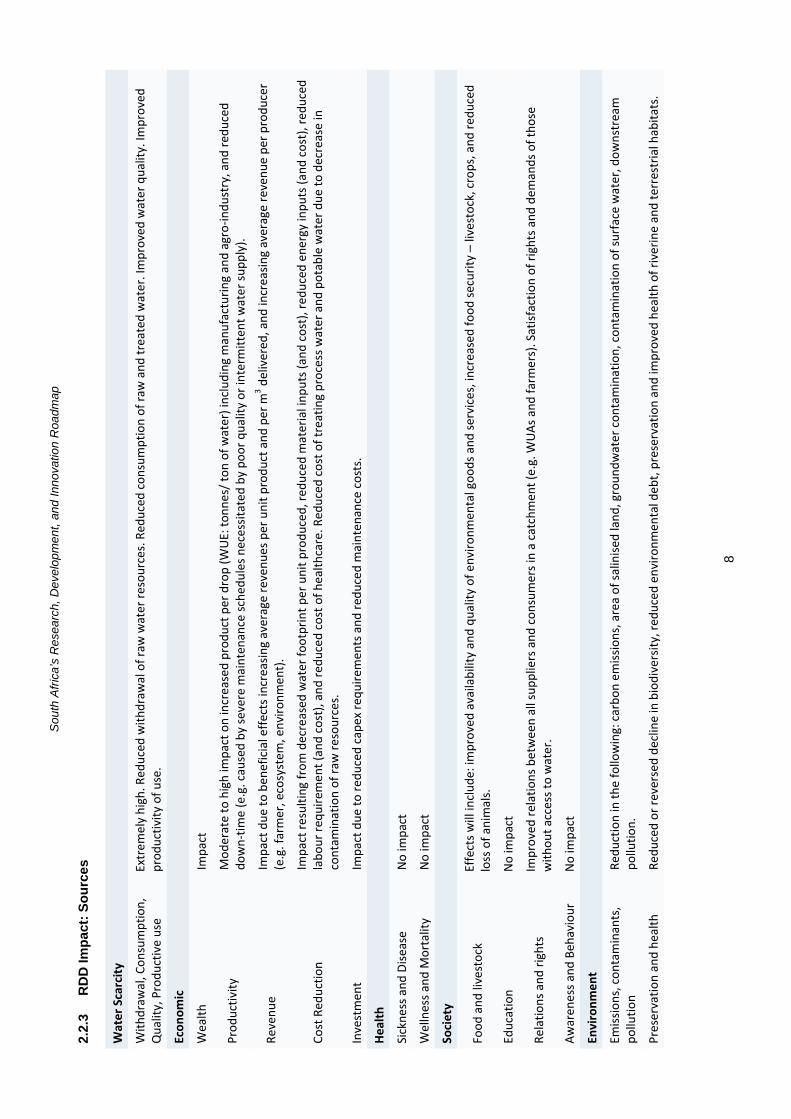
2.2.
3 R
DD
Imp
act:
So
urc
es
Wat
er S
carc
ity
With
draw
al, C
onsu
mpt
ion,
Q
ualit
y, P
rodu
ctiv
e us
e
Extr
emel
y hi
gh. R
educ
ed w
ithdr
awal
of r
aw w
ater
reso
urce
s. R
educ
ed c
onsu
mpt
ion
of ra
w a
nd tr
eate
d w
ater
. Im
prov
ed w
ater
qua
lity.
Impr
oved
pr
oduc
tivity
of u
se.
Econ
omic
Wea
lth
Impa
ct
Prod
uctiv
ity
Mod
erat
e to
hig
h im
pact
on
incr
ease
d pr
oduc
t per
dro
p (W
UE:
tonn
es/ t
on o
f wat
er) i
nclu
ding
man
ufac
turin
g an
d ag
ro-in
dust
ry, a
nd re
duce
d do
wn-
time
(e.g
. cau
sed
by se
vere
mai
nten
ance
sche
dule
s nec
essit
ated
by
poor
qua
lity
or in
term
itten
t wat
er su
pply
).
Reve
nue
Im
pact
due
to b
enef
icia
l effe
cts i
ncre
asin
g av
erag
e re
venu
es p
er u
nit p
rodu
ct a
nd p
er m
3 del
iver
ed, a
nd in
crea
sing
aver
age
reve
nue
per p
rodu
cer
(e.g
. far
mer
, eco
syst
em, e
nviro
nmen
t).
Cost
Red
uctio
n
Impa
ct re
sulti
ng fr
om d
ecre
ased
wat
er fo
otpr
int p
er u
nit p
rodu
ced,
redu
ced
mat
eria
l inp
uts (
and
cost
), re
duce
d en
ergy
inpu
ts (a
nd c
ost),
redu
ced
labo
ur re
quire
men
t (an
d co
st),
and
redu
ced
cost
of h
ealth
care
. Red
uced
cos
t of t
reat
ing
proc
ess w
ater
and
pot
able
wat
er d
ue to
dec
reas
e in
co
ntam
inat
ion
of ra
w re
sour
ces.
Inve
stm
ent
Impa
ct d
ue to
redu
ced
cape
x re
quire
men
ts a
nd re
duce
d m
aint
enan
ce c
osts
.
Heal
th
Sick
ness
and
Dise
ase
N
o im
pact
Wel
lnes
s and
Mor
talit
y
No
impa
ct
Soci
ety
Food
and
live
stoc
k
Effe
cts w
ill in
clud
e: im
prov
ed a
vaila
bilit
y an
d qu
ality
of e
nviro
nmen
tal g
oods
and
serv
ices
, inc
reas
ed fo
od se
curit
y –
lives
tock
, cro
ps, a
nd re
duce
d lo
ss o
f ani
mal
s.
Educ
atio
n
No
impa
ct
Rela
tions
and
righ
ts
Impr
oved
rela
tions
bet
wee
n al
l sup
plie
rs a
nd c
onsu
mer
s in
a ca
tchm
ent (
e.g.
WUA
s and
farm
ers)
. Sat
isfac
tion
of ri
ghts
and
dem
ands
of t
hose
w
ithou
t acc
ess t
o w
ater
.
Awar
enes
s and
Beh
avio
ur
No
impa
ct
Envi
ronm
ent
Emiss
ions
, con
tam
inan
ts,
pollu
tion
Re
duct
ion
in th
e fo
llow
ing:
car
bon
emiss
ions
, are
a of
salin
ised
land
, gro
undw
ater
con
tam
inat
ion,
con
tam
inat
ion
of su
rfac
e w
ater
, dow
nstr
eam
po
llutio
n.
Pres
erva
tion
and
heal
th
Redu
ced
or re
vers
ed d
eclin
e in
bio
dive
rsity
, red
uced
env
ironm
enta
l deb
t, pr
eser
vatio
n an
d im
prov
ed h
ealth
of r
iver
ine
and
terr
estr
ial h
abita
ts.
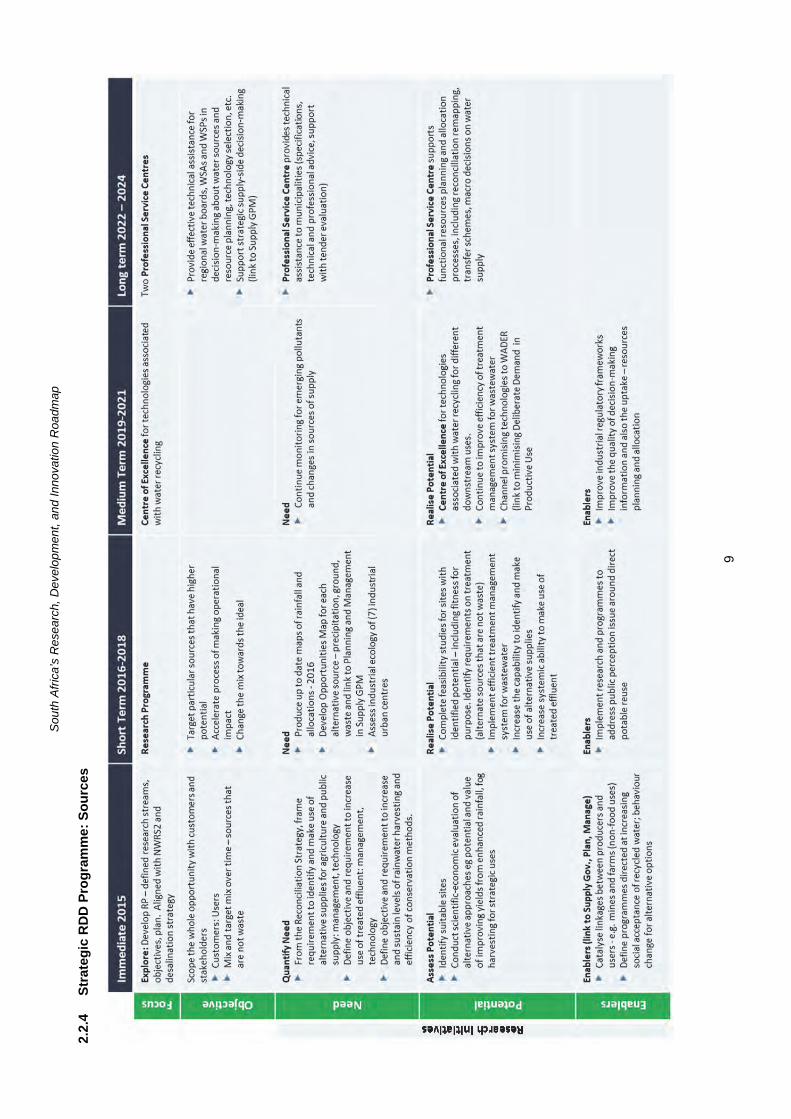
Sou
th A
fric
a’s
Res
ear
ch,
Dev
elo
pm
ent,
an
d In
nova
tion
Roa
dmap
9
2.2.
4 S
trat
egic
RD
D P
rog
ram
me:
So
urc
es

South Africa’s Research, Development, and Innovation Roadmap
10
2.2.5 HCD Outline Plans per research initiative (Cluster: Sources)
The Research Capacity required to carry out RDD Programme, per year (i.e. number of people in each year, not a cumulative number) is presented graphically for each of the research initiatives.
The RDD Capacity by Research Initiative is also presented as a table indicating which research focus areas (RFAs) are relevant to the Research Initiative, and mapping the existing capacity in each RFA required to conduct research within the RDD programme set out in the preceding section.
Capacity has been identified at four levels using a scoring system for each research group (Emerging 0, Building 4, Established 7, Mature 10 ) based on composite score on a scale of 0-10 based on number and seniority of people, budget, publications and products, and technical services.
2.2.5.1 Needs Research Initiative (Sources)
Year 1 2 3 4 5 6 7 8 9 10 Research Chairs 0 0 0 0 0 0 0 0 0 0 Project leaders 0 3 3 3 3 3 3 3 3 3 Principal researchers 0 3 3 3 3 3 3 3 3 3 Senior researchers 0 6 6 6 6 6 6 6 6 6 Researchers 0 15 15 15 15 15 15 15 15 15 Doctoral students 0 17 17 17 17 17 17 17 17 17 Masters students 0 26 26 26 26 26 26 26 26 26
Figure 3: Research Capacity required each year to carry out RDD Programme, for the Research Initiative “Needs” within the Sources Cluster
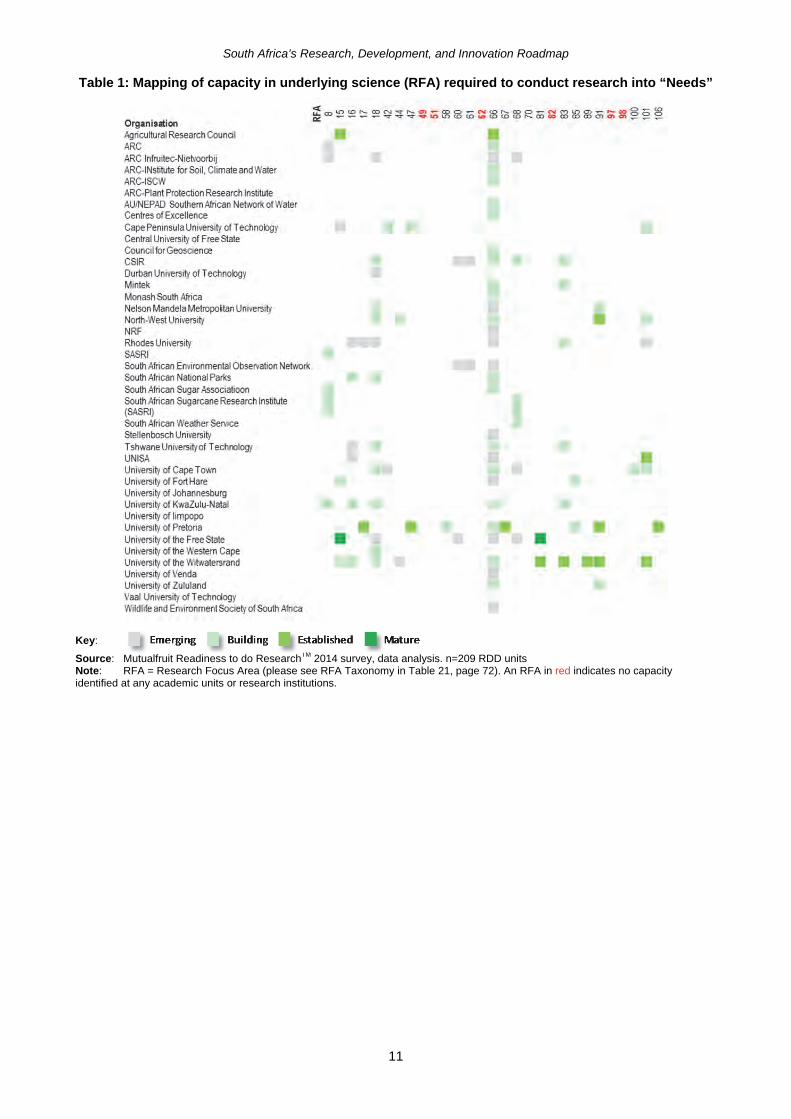
South Africa’s Research, Development, and Innovation Roadmap
11
Table 1: Mapping of capacity in underlying science (RFA) required to conduct research into “Needs”
Key:
Source: Mutualfruit Readiness to do ResearchTM 2014 survey, data analysis. n=209 RDD units Note: RFA = Research Focus Area (please see RFA Taxonomy in Table 21, page 72). An RFA in red indicates no capacity identified at any academic units or research institutions.
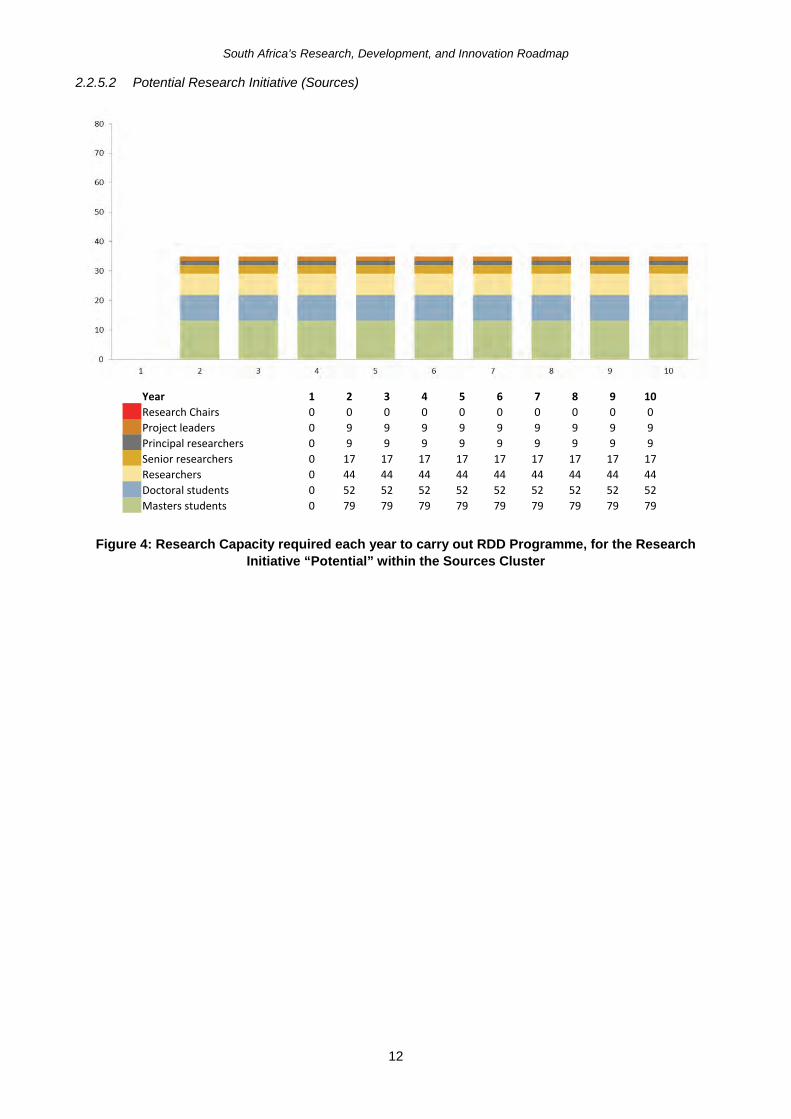
South Africa’s Research, Development, and Innovation Roadmap
12
2.2.5.2 Potential Research Initiative (Sources)
Year 1 2 3 4 5 6 7 8 9 10 Research Chairs 0 0 0 0 0 0 0 0 0 0 Project leaders 0 9 9 9 9 9 9 9 9 9 Principal researchers 0 9 9 9 9 9 9 9 9 9 Senior researchers 0 17 17 17 17 17 17 17 17 17 Researchers 0 44 44 44 44 44 44 44 44 44 Doctoral students 0 52 52 52 52 52 52 52 52 52 Masters students 0 79 79 79 79 79 79 79 79 79
Figure 4: Research Capacity required each year to carry out RDD Programme, for the Research Initiative “Potential” within the Sources Cluster
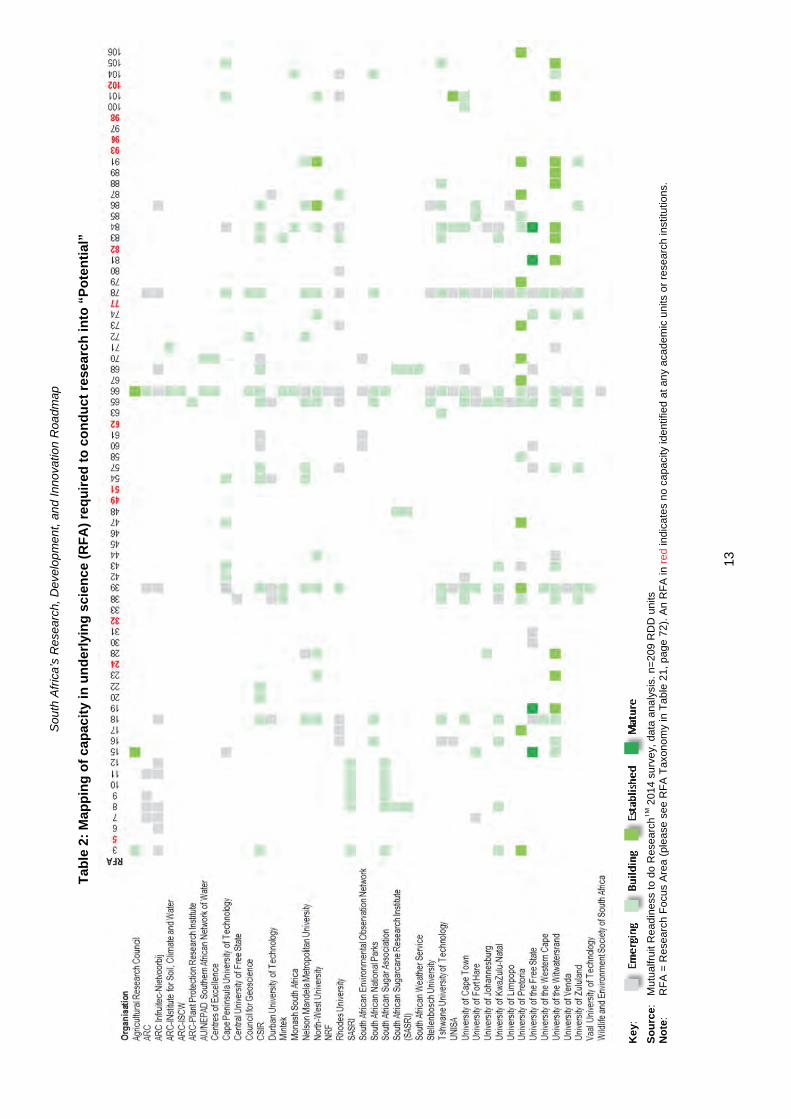
Sou
th A
fric
a’s
Res
ear
ch,
Dev
elo
pm
ent,
an
d In
nova
tion
Roa
dmap
13
Tab
le 2
: M
app
ing
of
cap
acit
y in
un
der
lyin
g s
cien
ce (
RF
A)
req
uir
ed t
o c
on
du
ct r
esea
rch
into
“P
ote
nti
al”
Ke
y:
So
urc
e:
Mut
ualfr
uit R
eadi
ness
to d
o R
ese
arch
TM 2
014
surv
ey,
dat
a an
alys
is. n
=20
9 R
DD
uni
ts
No
te:
R
FA
= R
esea
rch
Foc
us A
rea
(ple
ase
see
RF
A T
axo
nom
y in
Tab
le 2
1, p
age
72).
An
RF
A in
red
indi
cate
s no
cap
acity
iden
tifie
d at
an
y a
cade
mic
uni
ts o
r re
sear
ch in
stitu
tions
.

South Africa’s Research, Development, and Innovation Roadmap
14
2.2.5.3 Enablers Research Initiative (Sources)
Year 1 2 3 4 5 6 7 8 9 10 Research Chairs 0 0 0 0 0 0 0 0 0 0 Project leaders 0 1 1 1 1 1 1 1 1 1 Principal researchers 0 1 1 1 1 1 1 1 1 1 Senior researchers 0 3 3 3 3 3 3 3 3 3 Researchers 0 7 7 7 7 7 7 7 7 7 Doctoral students 0 9 9 9 9 9 9 9 9 9 Masters students 0 13 13 13 13 13 13 13 13 13
Figure 5: Research Capacity required each year to carry out RDD Programme, for the Research Initiative “Enablers” within the Sources Cluster
0
10
20
30
40
50
60
70
80
1 2 3 4 5 6 7 8 9 10
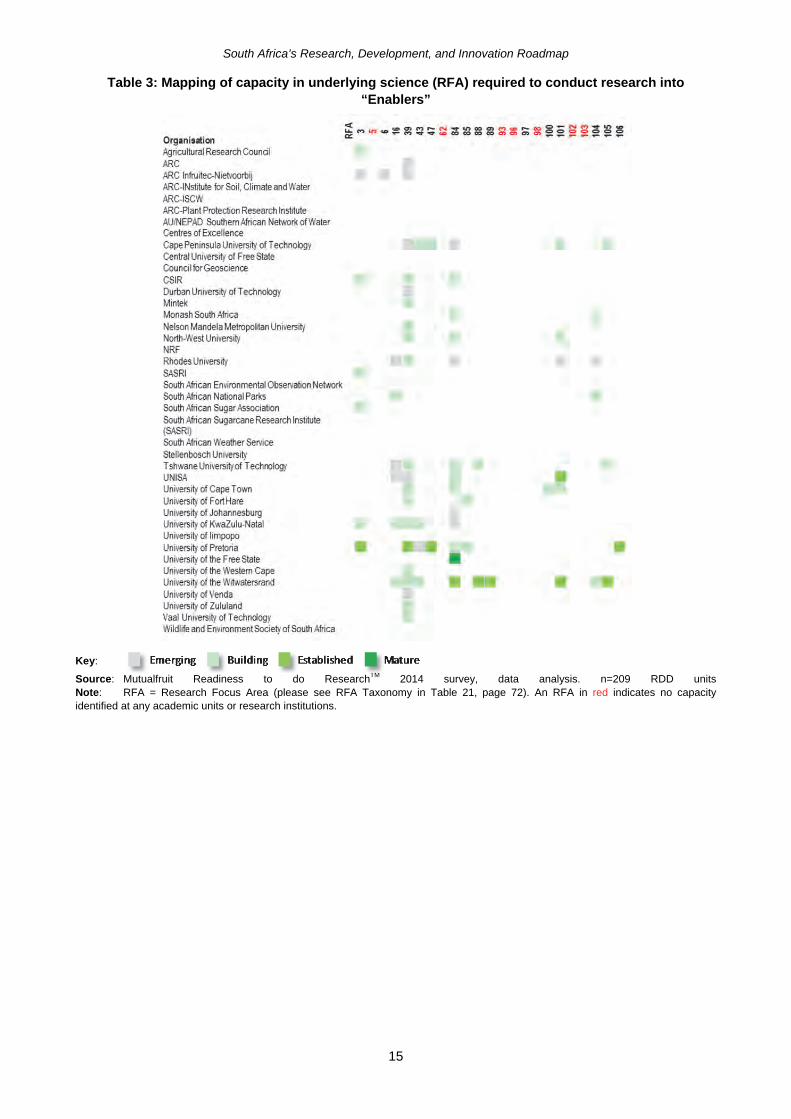
South Africa’s Research, Development, and Innovation Roadmap
15
Table 3: Mapping of capacity in underlying science (RFA) required to conduct research into “Enablers”
Key:
Source: Mutualfruit Readiness to do ResearchTM 2014 survey, data analysis. n=209 RDD units Note: RFA = Research Focus Area (please see RFA Taxonomy in Table 21, page 72). An RFA in red indicates no capacity identified at any academic units or research institutions.
South Africa’s Research, Development, and Innovation Roadmap
16
2.3 SUPPLY CLUSTER 2: IMPROVE GOVERNANCE, PLANNING AND MANAGEMENT OF SUPPLY AND DELIVERY
2.3.1 Cluster definition, scope, and research initiatives
2.3.1.1 Sector Objective
Improve governance, planning and management of supply and delivery.
2.3.1.2 Target RDD Outcome for 2025
The new DWS water allocations map (2016) is implemented by nine functional Catchment Management Agencies. The map includes groundwater, seawater, and wastewater.
This enables optimised reallocation and distribution of supplies and an improved ability to manage water flows. Focus on improved quality and resilience of planning for the future – ability to respond to changes, including climate change.
2.3.1.3 Research Initiatives
This cluster contains two research initiatives, which are Governance, and Planning and Management:
Governance Design, implement, drive uptake and support in an integrated manner:
effective governance models and mechanisms
context-specific and transparent planning processes
more efficient management of allocation and distribution
all as the means to enable effective functioning of Catchment Management Agencies
Planning and management
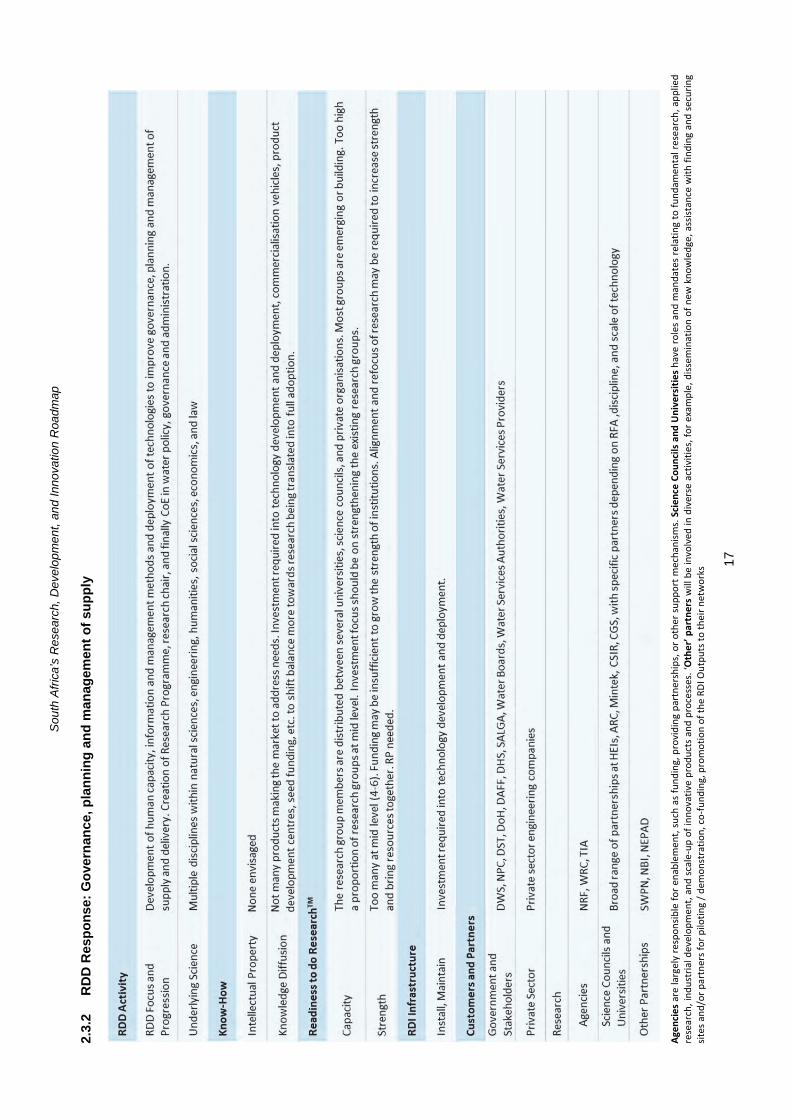
Sou
th A
fric
a’s
Res
ear
ch,
Dev
elo
pm
ent,
an
d In
nova
tion
Roa
dmap
17
2.3.
2 R
DD
Res
po
nse
: G
ove
rnan
ce, p
lan
nin
g a
nd
man
agem
ent
of
sup
ply
Ag
enci
es a
re la
rgel
y re
spon
sible
for e
nabl
emen
t, su
ch a
s fu
ndin
g, p
rovi
ding
par
tner
ship
s, o
r oth
er s
uppo
rt m
echa
nism
s. S
cien
ce C
ounc
ils a
nd U
nive
rsiti
es h
ave
role
s an
d m
anda
tes
rela
ting
to fu
ndam
enta
l res
earc
h, a
pplie
d re
sear
ch, i
ndus
tria
l dev
elop
men
t, an
d sc
ale-
up o
f inn
ovat
ive
prod
ucts
and
pro
cess
es. ‘
Oth
er’ p
artn
ers
will
be
invo
lved
in d
iver
se a
ctiv
ities
, for
exa
mpl
e, d
issem
inat
ion
of n
ew k
now
ledg
e, a
ssist
ance
with
find
ing
and
secu
ring
sites
and
/or p
artn
ers f
or p
ilotin
g / d
emon
stra
tion,
co-
fund
ing,
pro
mot
ion
of th
e RD
I Out
puts
to th
eir n
etw
orks
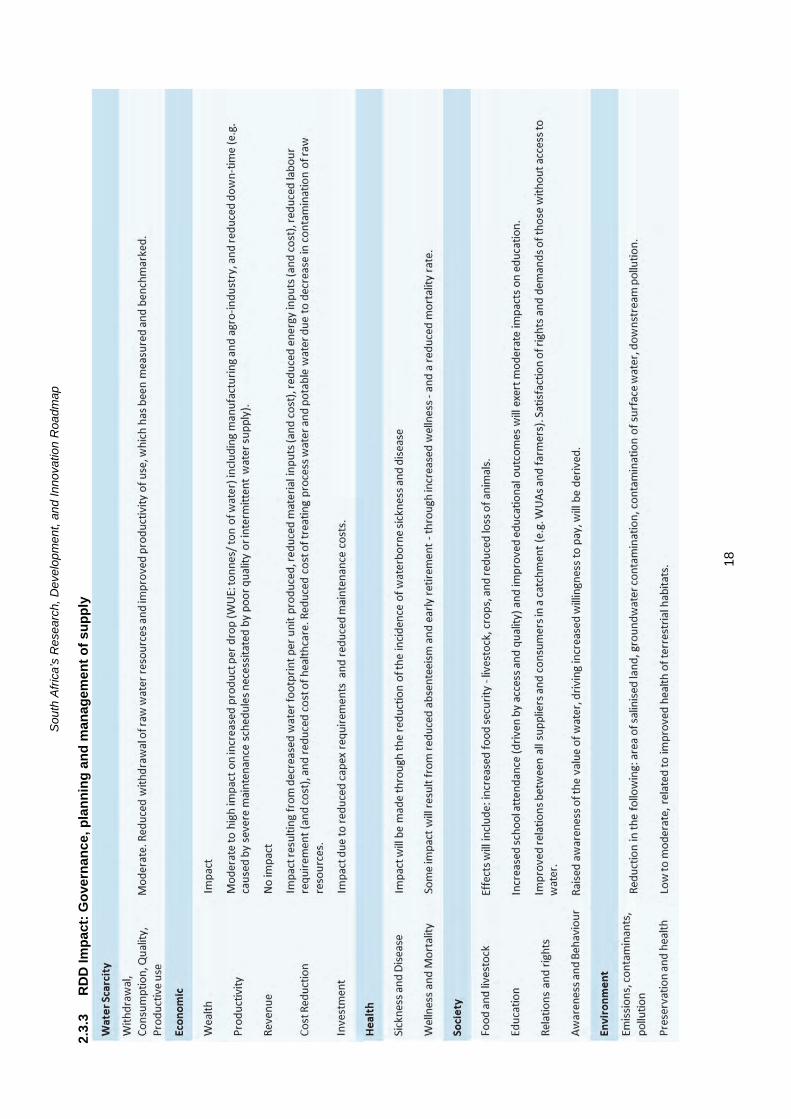
Sou
th A
fric
a’s
Res
ear
ch,
Dev
elo
pm
ent,
an
d In
nova
tion
Roa
dmap
18
2.3.
3 R
DD
Imp
act:
Go
vern
ance
, pla
nn
ing
an
d m
anag
emen
t o
f su
pp
ly

Sou
th A
fric
a’s
Res
ear
ch,
Dev
elo
pm
ent,
an
d In
nova
tion
Roa
dmap
19
2.3.
4 S
trat
egic
RD
D P
rog
ram
me:
Go
vern
ance
, pla
nn
ing
an
d m
anag
emen
t o
f su
pp
ly

South Africa’s Research, Development, and Innovation Roadmap
20
2.3.5 HCD Outline Plans: Governance, planning and management of supply
2.3.5.1 Required research capacity: Governance, planning and management of supply
Year 1 2 3 4 5 6 7 8 9 10 Research Chairs 0 0 2 2 2 2 2 0 0 0 Project leaders 0 2 2 2 2 2 2 2 2 0 Principal researchers 0 2 2 2 2 2 2 2 2 0 Senior researchers 0 4 4 4 4 4 4 4 4 0 Researchers 0 10 10 10 10 10 10 10 10 0 Doctoral students 0 12 12 12 12 12 12 12 12 0 Masters students 0 17 17 17 17 17 17 17 17 0
Figure 6: Research Capacity required each year to carry out RDD Programme, for the two Research Initiatives “Governance” and “Planning and Management” within the Governance, Planning and
Management of Supply Cluster
0
10
20
30
40
50
60
70
80
1 2 3 4 5 6 7 8 9 10
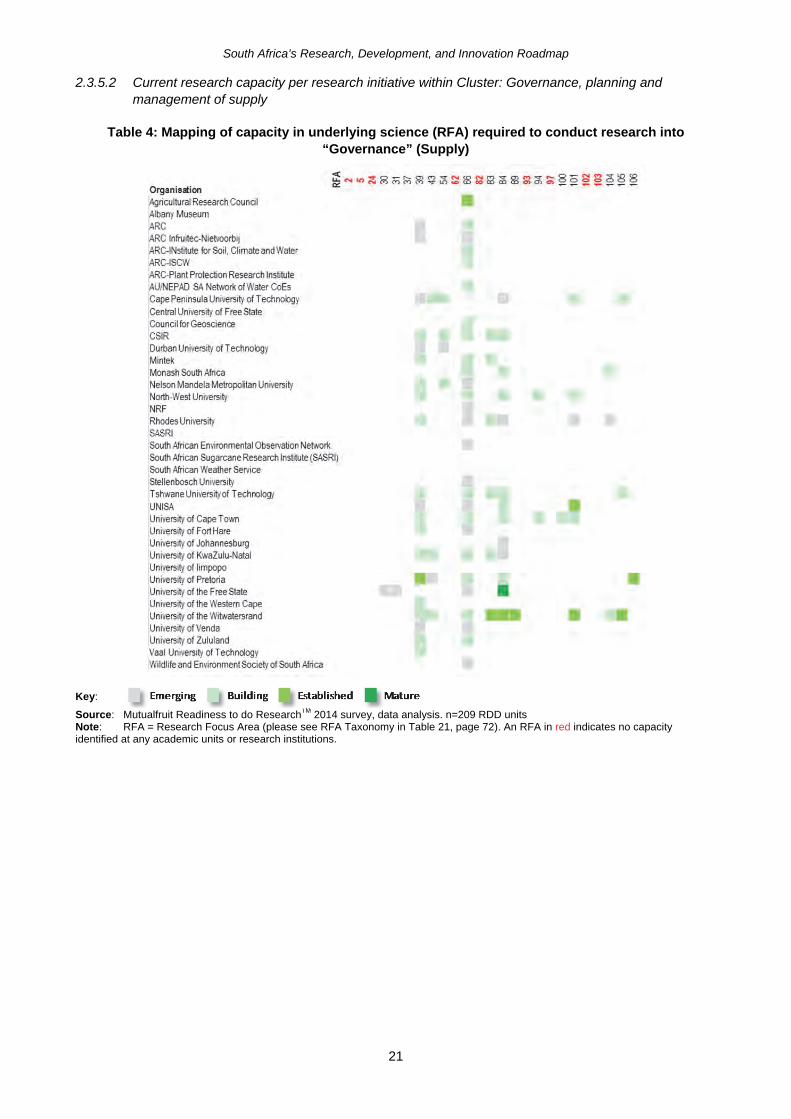
South Africa’s Research, Development, and Innovation Roadmap
21
2.3.5.2 Current research capacity per research initiative within Cluster: Governance, planning and management of supply
Table 4: Mapping of capacity in underlying science (RFA) required to conduct research into “Governance” (Supply)
Key:
Source: Mutualfruit Readiness to do ResearchTM 2014 survey, data analysis. n=209 RDD units Note: RFA = Research Focus Area (please see RFA Taxonomy in Table 21, page 72). An RFA in red indicates no capacity identified at any academic units or research institutions.
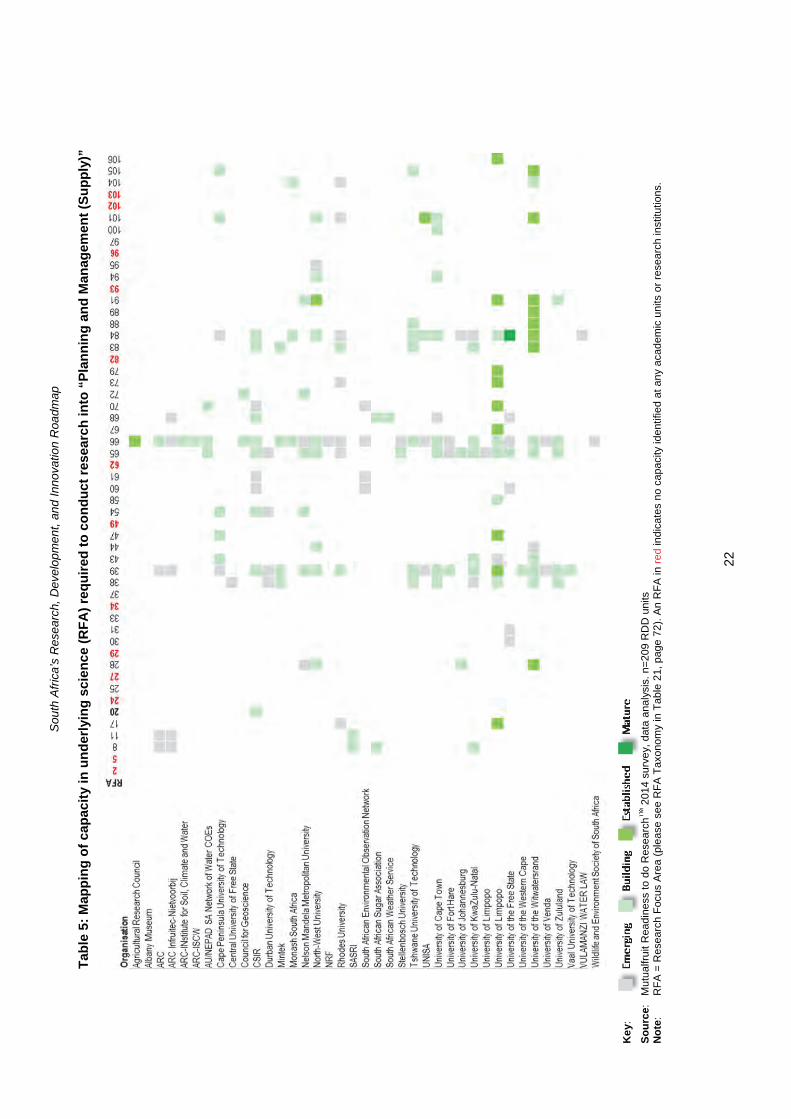
Sou
th A
fric
a’s
Res
ear
ch,
Dev
elo
pm
ent,
an
d In
nova
tion
Roa
dmap
22
Tab
le 5
: M
app
ing
of
cap
acit
y in
un
der
lyin
g s
cien
ce (
RF
A)
req
uir
ed t
o c
on
du
ct r
esea
rch
into
“P
lan
nin
g a
nd
Man
agem
ent
(Su
pp
ly)”
Ke
y:
So
urc
e:
Mut
ualfr
uit R
eadi
ness
to d
o R
ese
arch
TM 2
014
surv
ey,
dat
a an
alys
is. n
=20
9 R
DD
uni
ts
No
te:
R
FA
= R
esea
rch
Foc
us A
rea
(ple
ase
see
RF
A T
axo
nom
y in
Tab
le 2
1, p
age
72).
An
RF
A in
red
indi
cate
s no
cap
acity
iden
tifie
d at
an
y a
cade
mic
uni
ts o
r re
sear
ch in
stitu
tions
.

South Africa’s Research, Development, and Innovation Roadmap
23
2.4 SUPPLY CLUSTER 3: IMPROVE ADEQUACY AND PERFORMANCE OF SUPPLY INFRASTRUCTURE
2.4.1 Cluster definition, scope, and research initiatives
2.4.1.1 Sector Objective
Improve adequacy and performance of supply infrastructure.
2.4.1.2 Target RDD Outcome for 2025
Increased volume and adaptability of storage capacity for raw water and treated effluent is available.
This has increased the levels of protection and reliability of ecological infrastructure, and the ecological reserve is sufficient.
2.4.1.3 Research Initiatives
This cluster contains two research initiatives, which are:

Sou
th A
fric
a’s
Res
ear
ch,
Dev
elo
pm
ent,
an
d In
nova
tion
Roa
dmap
24
2.4.
2 R
DD
Res
po
nse
: In
fras
tru
ctu
re
Ag
enci
es a
re la
rgel
y re
spon
sible
for e
nabl
emen
t, su
ch a
s fu
ndin
g, p
rovi
ding
par
tner
ship
s, o
r oth
er s
uppo
rt m
echa
nism
s. S
cien
ce C
ounc
ils a
nd U
nive
rsiti
es h
ave
role
s an
d m
anda
tes
rela
ting
to fu
ndam
enta
l res
earc
h, a
pplie
d re
sear
ch, i
ndus
tria
l dev
elop
men
t, an
d sc
ale-
up o
f inn
ovat
ive
prod
ucts
and
pro
cess
es. ‘
Oth
er’ p
artn
ers
will
be
invo
lved
in d
iver
se a
ctiv
ities
, for
exa
mpl
e, d
issem
inat
ion
of n
ew k
now
ledg
e, a
ssist
ance
with
find
ing
and
secu
ring
sites
and
/or p
artn
ers f
or p
ilotin
g / d
emon
stra
tion,
co-
fund
ing,
pro
mot
ion
of th
e RD
I Out
puts
to th
eir n
etw
orks

Sou
th A
fric
a’s
Res
ear
ch,
Dev
elo
pm
ent,
an
d In
nova
tion
Roa
dmap
25
2.4.
3 R
DD
Imp
act:
Infr
astr
uct
ure

Sou
th A
fric
a’s
Res
ear
ch,
Dev
elo
pm
ent,
an
d In
nova
tion
Roa
dmap
26
2.4.
4 S
trat
egic
RD
D P
rog
ram
me:
Infr
astr
uct
ure

South Africa’s Research, Development, and Innovation Roadmap
27
2.4.5 HCD Outline Plans per research initiative: Infrastructure
2.4.5.1 Ecological Infrastructure (Infrastructure)
Year 1 2 3 4 5 6 7 8 9 10 Research Chairs 0 1 1 1 1 1 0 0 0 0 Project leaders 0 1 1 1 1 1 1 1 1 0 Principal researchers 0 1 1 1 1 1 1 1 1 0 Senior researchers 0 2 2 2 2 2 2 2 2 0 Researchers 0 5 5 5 5 5 5 5 5 0 Doctoral students 0 7 7 6 6 6 6 6 6 0 Masters students 0 10 10 9 9 9 9 9 9 0
Figure 7: Research Capacity required each year to carry out RDD Programme, for the Research Initiative “Ecological Infrastructure” within the Infrastructure Cluster

South Africa’s Research, Development, and Innovation Roadmap
28
Table 6: Mapping of capacity in underlying science (RFA) required to conduct research into “Ecological Infrastructure”
Key:
Source: Mutualfruit Readiness to do ResearchTM 2014 survey, data analysis. n=209 RDD units Note: RFA = Research Focus Area (please see RFA Taxonomy in Table 21, page 72). An RFA in red indicates no capacity identified at any academic units or research institutions.
SAEON

South Africa’s Research, Development, and Innovation Roadmap
29
2.4.5.2 Built Infrastructure (Infrastructure)
Year 1 2 3 4 5 6 7 8 9 10 Research Chairs 0 1 1 1 1 1 0 0 0 0 Project leaders 0 1 1 1 1 1 1 1 1 0 Principal researchers 0 1 1 1 1 1 1 1 1 0 Senior researchers 0 3 3 2 2 2 2 2 2 0 Researchers 0 7 7 5 5 5 5 5 5 0 Doctoral students 0 9 9 6 6 6 6 6 6 0 Masters students 0 13 13 9 9 9 9 9 9 0
Figure 8: Research Capacity required each year to carry out RDD Programme, for the Research Initiative “Built Infrastructure” and “Planning and Management” within the Infrastructure Cluster
0
10
20
30
40
50
60
70
80
1 2 3 4 5 6 7 8 9 10
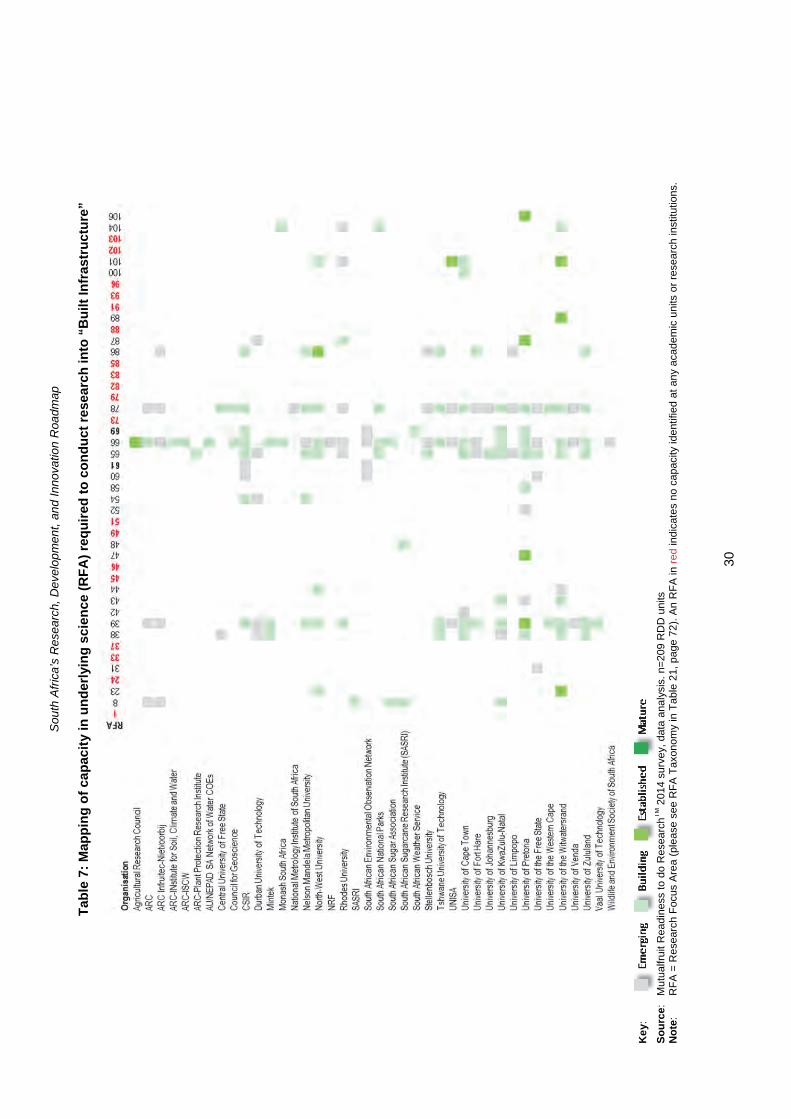
Sou
th A
fric
a’s
Res
ear
ch,
Dev
elo
pm
ent,
an
d In
nova
tion
Roa
dmap
30
Tab
le 7
: M
app
ing
of
cap
acit
y in
un
der
lyin
g s
cien
ce (
RF
A)
req
uir
ed t
o c
on
du
ct r
esea
rch
into
“B
uilt
Infr
astr
uct
ure
”
Ke
y:
So
urc
e:
Mut
ualfr
uit R
eadi
ness
to d
o R
ese
arch
TM 2
014
surv
ey,
dat
a an
alys
is. n
=20
9 R
DD
uni
ts
No
te:
R
FA
= R
esea
rch
Foc
us A
rea
(ple
ase
see
RF
A T
axo
nom
y in
Tab
le 2
1, p
age
72).
An
RF
A in
red
indi
cate
s no
cap
acity
iden
tifie
d at
an
y a
cade
mic
uni
ts o
r re
sear
ch in
stitu
tions
.
South Africa’s Research, Development, and Innovation Roadmap
31
2.5 SUPPLY CLUSTER 4: RUN WATER AS A FINANCIALLY SUSTAINABLE “BUSINESS” BY IMPROVING OPERATIONAL PERFORMANCE
2.5.1 Cluster definition, scope, and research initiatives
2.5.1.1 Sector Objective
Improve operational performance and run Water as a sustainable “business”,
2.5.1.2 Target RDD Outcome for 2025
The financial sustainability of the water services system is secured.
Pricing is equitable and the attribution of water use is accurate. Non-revenue water is below 15% and revenues are collected punctually. Operational efficiency has been gained and >90% of water and wastewater treatment works have Blue Drop / Green Drop status.
2.5.1.3 Research Initiatives
This cluster contains three research initiatives combined into one:
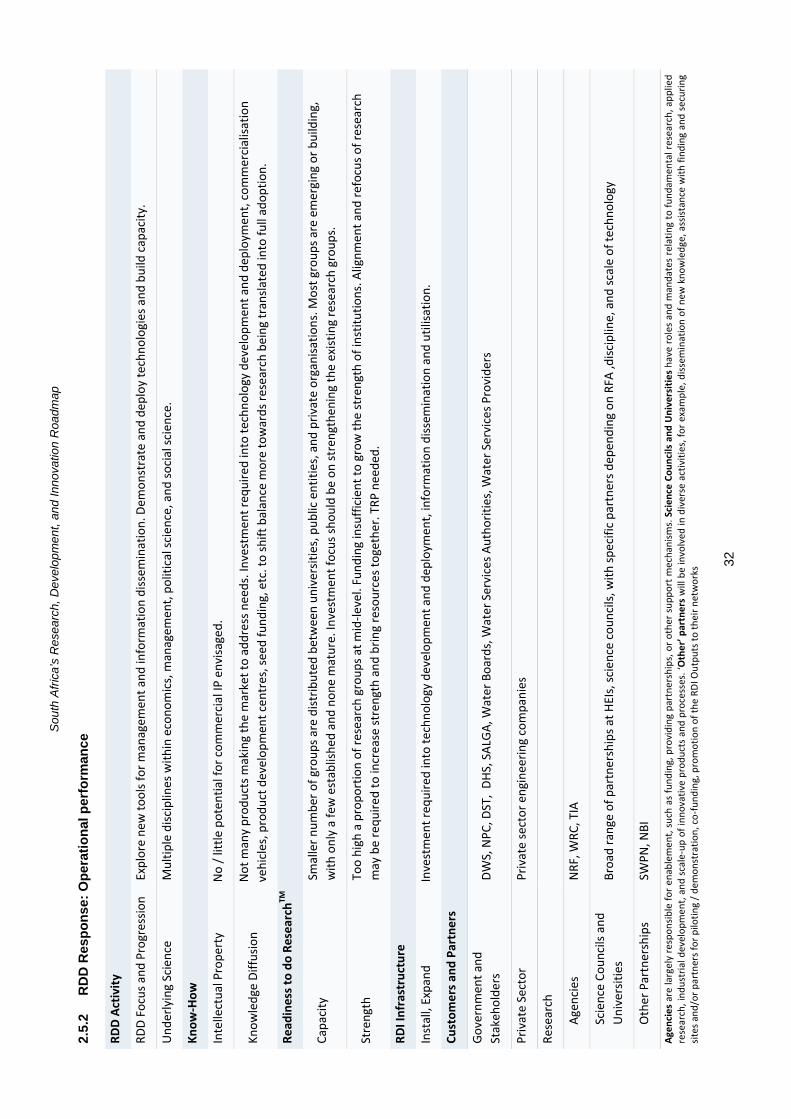
Sou
th A
fric
a’s
Res
ear
ch, D
evel
op
men
t, an
d In
nova
tion
Roa
dmap
32
2.5.
2 R
DD
Res
po
nse
: O
per
atio
nal
per
form
ance
RDD
Activ
ity
RDD
Focu
s and
Pro
gres
sion
Expl
ore
new
tool
s for
man
agem
ent a
nd in
form
atio
n di
ssem
inat
ion.
Dem
onst
rate
and
dep
loy
tech
nolo
gies
and
bui
ld c
apac
ity.
Und
erly
ing
Scie
nce
M
ultip
le d
iscip
lines
with
in e
cono
mic
s, m
anag
emen
t, po
litic
al sc
ienc
e, a
nd so
cial
scie
nce.
Know
-How
Inte
llect
ual P
rope
rty
No
/ litt
le p
oten
tial f
or c
omm
erci
al IP
env
isage
d.
Know
ledg
e Di
ffusio
n
Not
man
y pr
oduc
ts m
akin
g th
e m
arke
t to
addr
ess n
eeds
. Inv
estm
ent r
equi
red
into
tech
nolo
gy d
evel
opm
ent a
nd d
eplo
ymen
t, co
mm
erci
alisa
tion
vehi
cles
, pro
duct
dev
elop
men
t cen
tres
, see
d fu
ndin
g, e
tc. t
o sh
ift b
alan
ce m
ore
tow
ards
rese
arch
bei
ng tr
ansla
ted
into
full
adop
tion.
Read
ines
s to
do R
esea
rchTM
Capa
city
Sm
alle
r num
ber o
f gro
ups a
re d
istrib
uted
bet
wee
n un
iver
sitie
s, p
ublic
ent
ities
, and
priv
ate
orga
nisa
tions
. Mos
t gro
ups a
re e
mer
ging
or b
uild
ing,
w
ith o
nly
a fe
w e
stab
lishe
d an
d no
ne m
atur
e. In
vest
men
t foc
us sh
ould
be
on st
reng
then
ing
the
exist
ing
rese
arch
gro
ups.
Stre
ngth
To
o hi
gh a
pro
port
ion
of re
sear
ch g
roup
s at m
id-le
vel.
Fund
ing
insu
ffici
ent t
o gr
ow th
e st
reng
th o
f ins
titut
ions
. Alig
nmen
t and
refo
cus o
f res
earc
h m
ay b
e re
quire
d to
incr
ease
stre
ngth
and
brin
g re
sour
ces t
oget
her.
TRP
need
ed.
RDI I
nfra
stru
ctur
e
Inst
all,
Expa
nd
Inve
stm
ent r
equi
red
into
tech
nolo
gy d
evel
opm
ent a
nd d
eplo
ymen
t, in
form
atio
n di
ssem
inat
ion
and
utili
satio
n.
Cust
omer
s and
Par
tner
s
Gove
rnm
ent a
nd
Stak
ehol
ders
DW
S, N
PC, D
ST,
DHS,
SAL
GA, W
ater
Boa
rds,
Wat
er S
ervi
ces A
utho
ritie
s, W
ater
Ser
vice
s Pro
vide
rs
Priv
ate
Sect
or
Priv
ate
sect
or e
ngin
eerin
g co
mpa
nies
Rese
arch
Agen
cies
N
RF, W
RC, T
IA
Scie
nce
Coun
cils
and
Uni
vers
ities
Br
oad
rang
e of
par
tner
ship
s at H
EIs,
scie
nce
coun
cils,
with
spec
ific
part
ners
dep
endi
ng o
n RF
A ,d
iscip
line,
and
scal
e of
tech
nolo
gy
Oth
er P
artn
ersh
ips
SWPN
, NBI
Agen
cies
are
larg
ely
resp
onsib
le fo
r ena
blem
ent,
such
as
fund
ing,
pro
vidi
ng p
artn
ersh
ips,
or o
ther
sup
port
mec
hani
sms.
Sci
ence
Cou
ncils
and
Uni
vers
ities
have
role
s an
d m
anda
tes
rela
ting
to fu
ndam
enta
l res
earc
h, a
pplie
d re
sear
ch, i
ndus
tria
l dev
elop
men
t, an
d sc
ale-
up o
f inn
ovat
ive
prod
ucts
and
pro
cess
es. ‘
Oth
er’ p
artn
ers
will
be
invo
lved
in d
iver
se a
ctiv
ities
, for
exa
mpl
e, d
issem
inat
ion
of n
ew k
now
ledg
e, a
ssist
ance
with
find
ing
and
secu
ring
sites
and
/or p
artn
ers f
or p
ilotin
g / d
emon
stra
tion,
co-
fund
ing,
pro
mot
ion
of th
e RD
I Out
puts
to th
eir n
etw
orks
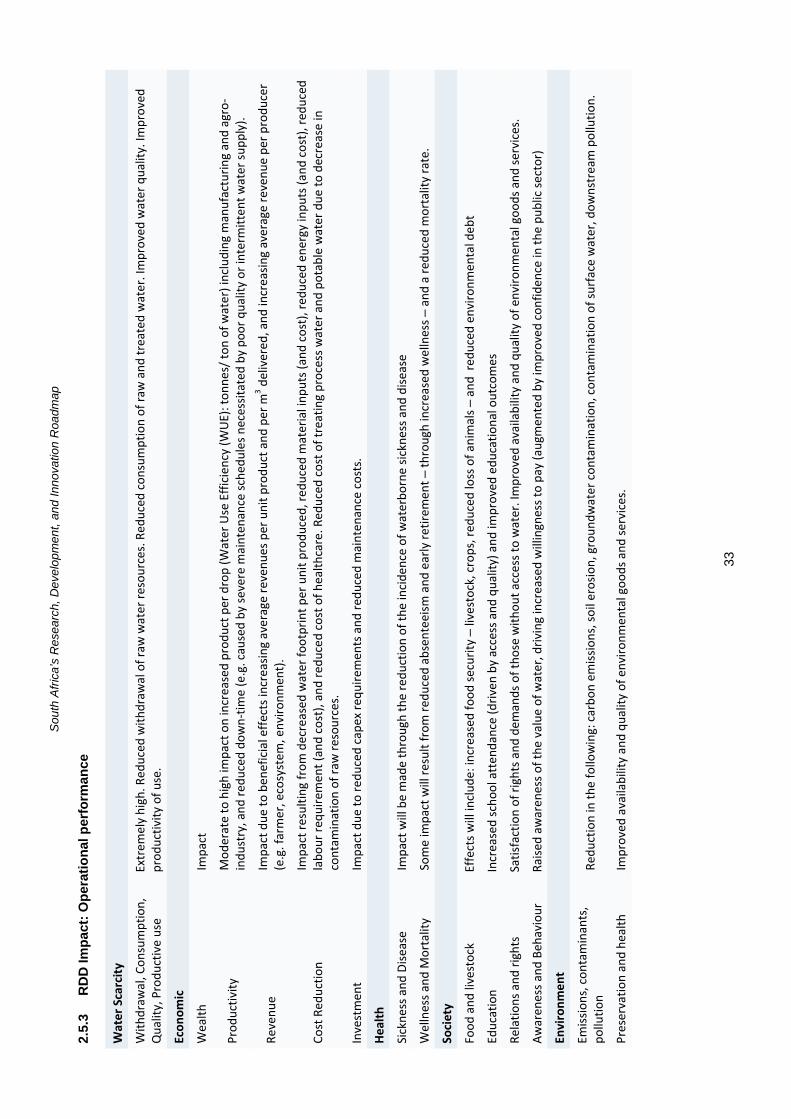
Sou
th A
fric
a’s
Res
ear
ch, D
evel
op
men
t, an
d In
nova
tion
Roa
dmap
33
2.5.
3 R
DD
Imp
act:
Op
erat
ion
al p
erfo
rman
ce
Wat
er S
carc
ity
With
draw
al, C
onsu
mpt
ion,
Q
ualit
y, P
rodu
ctiv
e us
e
Extr
emel
y hi
gh. R
educ
ed w
ithdr
awal
of r
aw w
ater
reso
urce
s. R
educ
ed c
onsu
mpt
ion
of ra
w a
nd tr
eate
d w
ater
. Im
prov
ed w
ater
qua
lity.
Impr
oved
pr
oduc
tivity
of u
se.
Econ
omic
Wea
lth
Impa
ct
Prod
uctiv
ity
Mod
erat
e to
hig
h im
pact
on
incr
ease
d pr
oduc
t per
dro
p (W
ater
Use
Effi
cien
cy (W
UE)
: ton
nes/
ton
of w
ater
) inc
ludi
ng m
anuf
actu
ring
and
agro
-in
dust
ry, a
nd re
duce
d do
wn-
time
(e.g
. cau
sed
by se
vere
mai
nten
ance
sche
dule
s nec
essit
ated
by
poor
qua
lity
or in
term
itten
t wat
er su
pply
).
Reve
nue
Im
pact
due
to b
enef
icia
l effe
cts i
ncre
asin
g av
erag
e re
venu
es p
er u
nit p
rodu
ct a
nd p
er m
3 del
iver
ed, a
nd in
crea
sing
aver
age
reve
nue
per p
rodu
cer
(e.g
. far
mer
, eco
syst
em, e
nviro
nmen
t).
Cost
Red
uctio
n
Impa
ct re
sulti
ng fr
om d
ecre
ased
wat
er fo
otpr
int p
er u
nit p
rodu
ced,
redu
ced
mat
eria
l inp
uts (
and
cost
), re
duce
d en
ergy
inpu
ts (a
nd c
ost),
redu
ced
labo
ur re
quire
men
t (an
d co
st),
and
redu
ced
cost
of h
ealth
care
. Red
uced
cos
t of t
reat
ing
proc
ess w
ater
and
pot
able
wat
er d
ue to
dec
reas
e in
co
ntam
inat
ion
of ra
w re
sour
ces.
Inve
stm
ent
Impa
ct d
ue to
redu
ced
cape
x re
quire
men
ts a
nd re
duce
d m
aint
enan
ce c
osts
.
Heal
th
Sick
ness
and
Dise
ase
Im
pact
will
be
mad
e th
roug
h th
e re
duct
ion
of th
e in
cide
nce
of w
ater
born
e sic
knes
s and
dise
ase
Wel
lnes
s and
Mor
talit
y
Som
e im
pact
will
resu
lt fr
om re
duce
d ab
sent
eeism
and
ear
ly re
tirem
ent –
thro
ugh
incr
ease
d w
elln
ess –
and
a re
duce
d m
orta
lity
rate
.
Soci
ety
Food
and
live
stoc
k
Effe
cts w
ill in
clud
e: in
crea
sed
food
secu
rity
– liv
esto
ck, c
rops
, red
uced
loss
of a
nim
als –
and
red
uced
env
ironm
enta
l deb
t
Educ
atio
n
Incr
ease
d sc
hool
att
enda
nce
(driv
en b
y ac
cess
and
qua
lity)
and
impr
oved
edu
catio
nal o
utco
mes
Rela
tions
and
righ
ts
Satis
fact
ion
of ri
ghts
and
dem
ands
of t
hose
with
out a
cces
s to
wat
er. I
mpr
oved
ava
ilabi
lity
and
qual
ity o
f env
ironm
enta
l goo
ds a
nd se
rvic
es.
Awar
enes
s and
Beh
avio
ur
Raise
d aw
aren
ess o
f the
val
ue o
f wat
er, d
rivin
g in
crea
sed
will
ingn
ess t
o pa
y (a
ugm
ente
d by
impr
oved
con
fiden
ce in
the
publ
ic se
ctor
)
Envi
ronm
ent
Emiss
ions
, con
tam
inan
ts,
pollu
tion
Re
duct
ion
in th
e fo
llow
ing:
car
bon
emiss
ions
, soi
l ero
sion,
gro
undw
ater
con
tam
inat
ion,
con
tam
inat
ion
of su
rfac
e w
ater
, dow
nstr
eam
pol
lutio
n.
Pres
erva
tion
and
heal
th
Impr
oved
ava
ilabi
lity
and
qual
ity o
f env
ironm
enta
l goo
ds a
nd se
rvic
es.
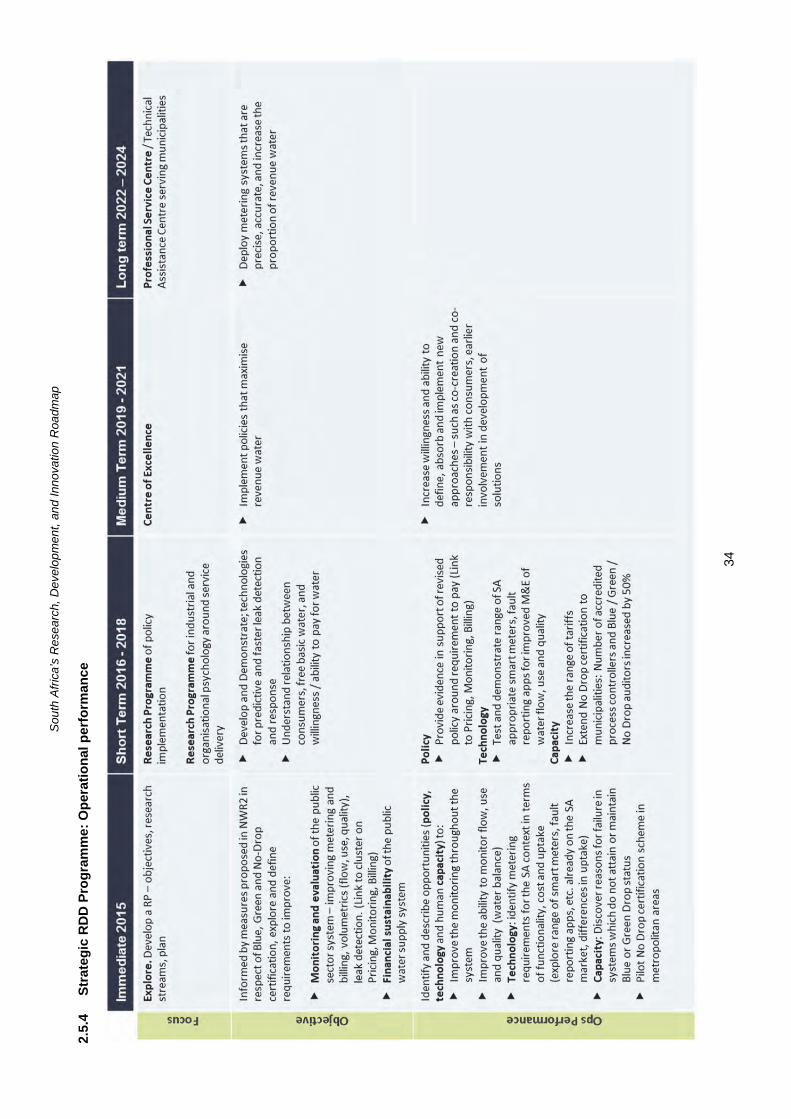
Sou
th A
fric
a’s
Res
ear
ch,
Dev
elo
pm
ent,
an
d In
nova
tion
Roa
dmap
34
2.5.
4 S
trat
egic
RD
D P
rog
ram
me:
Op
erat
ion
al p
erfo
rman
ce

South Africa’s Research, Development, and Innovation Roadmap
35
2.5.5 HCD Outline Plans: Operational performance
Year 1 2 3 4 5 6 7 8 9 10 Research Chairs 0 0 0 0 0 0 0 0 0 0 Project leaders 0 3 3 3 3 3 3 3 3 3 Principal researchers 0 3 3 3 3 3 3 3 3 3 Senior researchers 0 6 6 6 6 6 6 6 6 6 Researchers 0 15 15 15 15 15 15 15 15 15 Doctoral students 0 17 17 17 17 17 17 17 17 17 Masters students 0 26 26 26 26 26 26 26 26 26
Figure 9: Research Capacity required each year to carry out RDD Programme, for the Operational Performance Cluster
Table 8: Mapping of capacity in underlying science (RFA) required to conduct research into “Operational Performance”
Key:
Source: Mutualfruit Readiness to do ResearchTM 2014 survey, data analysis. n=209 RDD units Note: RFA = Research Focus Area (please see RFA Taxonomy in Table 21, page 72). An RFA in red indicates no capacity identified at any academic units or research institutions.
0
10
20
30
40
50
60
70
80
1 2 3 4 5 6 7 8 9 10
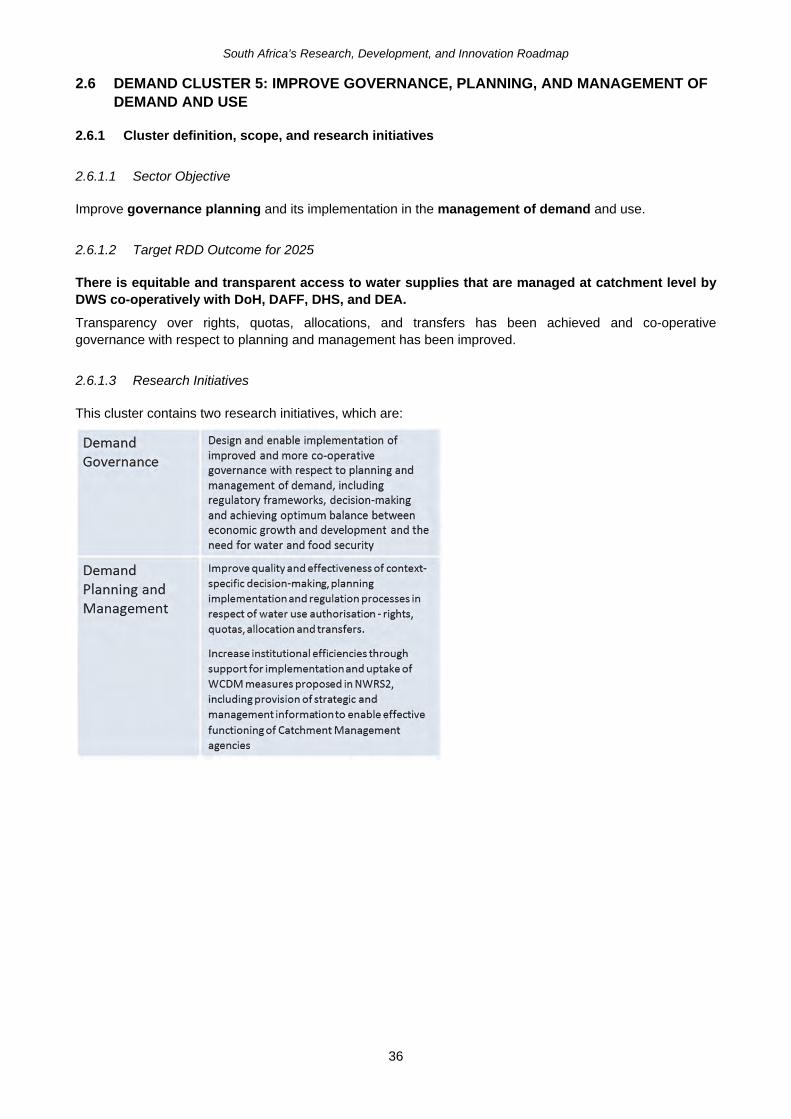
South Africa’s Research, Development, and Innovation Roadmap
36
2.6 DEMAND CLUSTER 5: IMPROVE GOVERNANCE, PLANNING, AND MANAGEMENT OF DEMAND AND USE
2.6.1 Cluster definition, scope, and research initiatives
2.6.1.1 Sector Objective
Improve governance planning and its implementation in the management of demand and use.
2.6.1.2 Target RDD Outcome for 2025
There is equitable and transparent access to water supplies that are managed at catchment level by DWS co-operatively with DoH, DAFF, DHS, and DEA.
Transparency over rights, quotas, allocations, and transfers has been achieved and co-operative governance with respect to planning and management has been improved.
2.6.1.3 Research Initiatives
This cluster contains two research initiatives, which are:
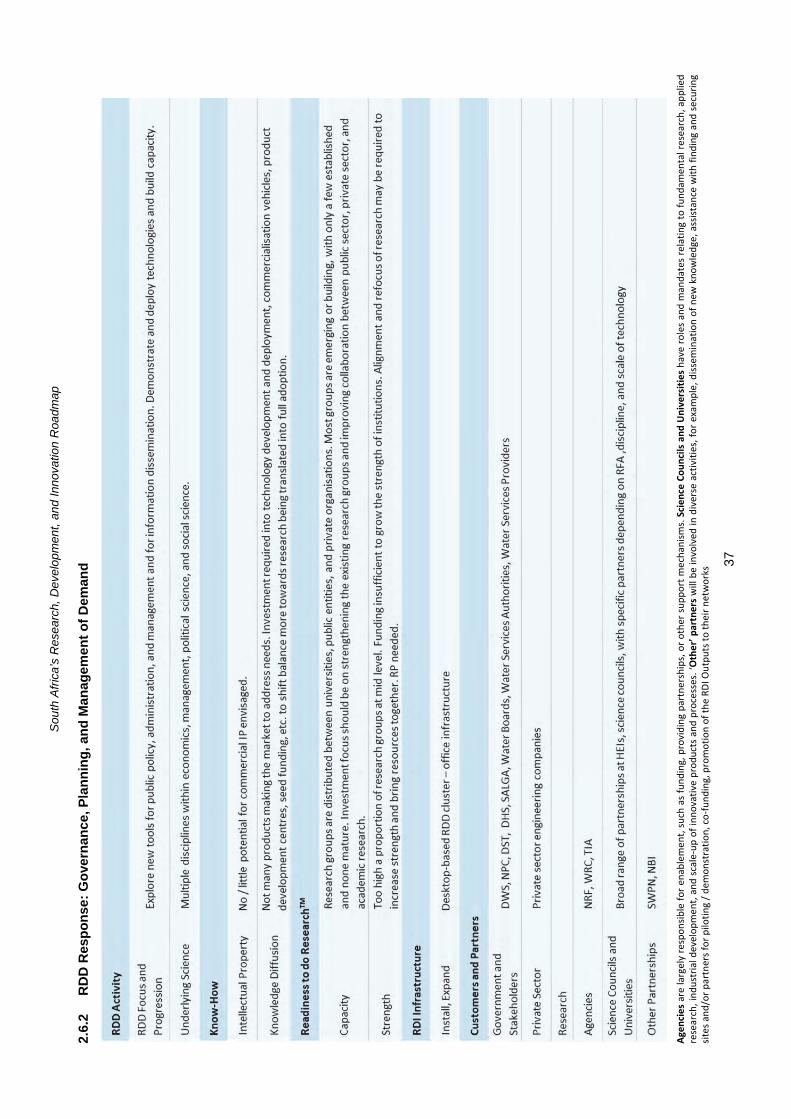
Sou
th A
fric
a’s
Res
ear
ch,
Dev
elo
pm
ent,
an
d In
nova
tion
Roa
dmap
37
2.6.
2 R
DD
Res
po
nse
: G
ove
rnan
ce, P
lan
nin
g, a
nd
Man
agem
ent
of
Dem
and
Ag
enci
es a
re la
rgel
y re
spon
sible
for e
nabl
emen
t, su
ch a
s fu
ndin
g, p
rovi
ding
par
tner
ship
s, o
r oth
er s
uppo
rt m
echa
nism
s. S
cien
ce C
ounc
ils a
nd U
nive
rsiti
es h
ave
role
s an
d m
anda
tes
rela
ting
to fu
ndam
enta
l res
earc
h, a
pplie
d re
sear
ch, i
ndus
tria
l dev
elop
men
t, an
d sc
ale-
up o
f inn
ovat
ive
prod
ucts
and
pro
cess
es. ‘
Oth
er’ p
artn
ers
will
be
invo
lved
in d
iver
se a
ctiv
ities
, for
exa
mpl
e, d
issem
inat
ion
of n
ew k
now
ledg
e, a
ssist
ance
with
find
ing
and
secu
ring
sites
and
/or p
artn
ers f
or p
ilotin
g / d
emon
stra
tion,
co-
fund
ing,
pro
mot
ion
of th
e RD
I Out
puts
to th
eir n
etw
orks
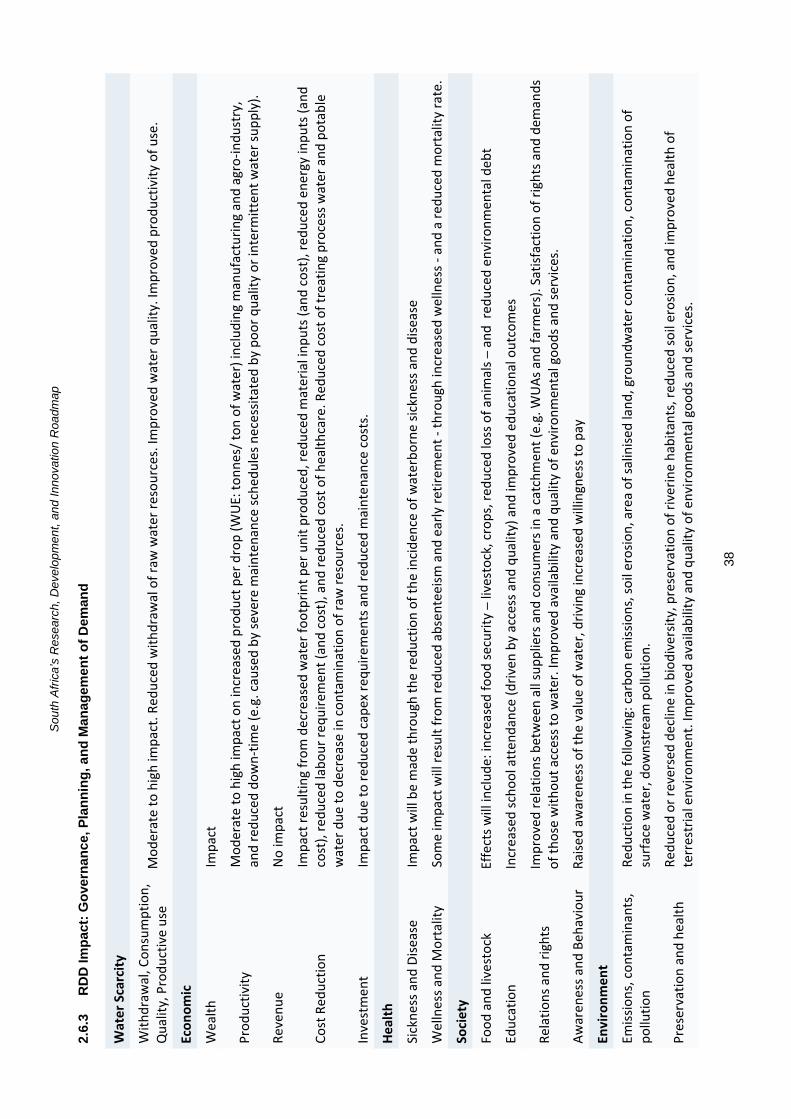
Sou
th A
fric
a’s
Res
ear
ch, D
evel
op
men
t, an
d In
nova
tion
Roa
dmap
38
2.6.
3 R
DD
Imp
act:
Go
vern
ance
, Pla
nn
ing
, an
d M
anag
emen
t o
f D
eman
d
Wat
er S
carc
ity
With
draw
al, C
onsu
mpt
ion,
Q
ualit
y, P
rodu
ctiv
e us
e
Mod
erat
e to
hig
h im
pact
. Red
uced
with
draw
al o
f raw
wat
er re
sour
ces.
Impr
oved
wat
er q
ualit
y. Im
prov
ed p
rodu
ctiv
ity o
f use
.
Econ
omic
Wea
lth
Impa
ct
Prod
uctiv
ity
Mod
erat
e to
hig
h im
pact
on
incr
ease
d pr
oduc
t per
dro
p (W
UE:
tonn
es/ t
on o
f wat
er) i
nclu
ding
man
ufac
turin
g an
d ag
ro-in
dust
ry,
and
redu
ced
dow
n-tim
e (e
.g. c
ause
d by
seve
re m
aint
enan
ce sc
hedu
les n
eces
sitat
ed b
y po
or q
ualit
y or
inte
rmitt
ent w
ater
supp
ly).
Reve
nue
N
o im
pact
Cost
Red
uctio
n
Impa
ct re
sulti
ng fr
om d
ecre
ased
wat
er fo
otpr
int p
er u
nit p
rodu
ced,
redu
ced
mat
eria
l inp
uts (
and
cost
), re
duce
d en
ergy
inpu
ts (a
nd
cost
), re
duce
d la
bour
requ
irem
ent (
and
cost
), an
d re
duce
d co
st o
f hea
lthca
re. R
educ
ed c
ost o
f tre
atin
g pr
oces
s wat
er a
nd p
otab
le
wat
er d
ue to
dec
reas
e in
con
tam
inat
ion
of ra
w re
sour
ces.
Inve
stm
ent
Impa
ct d
ue to
redu
ced
cape
x re
quire
men
ts a
nd re
duce
d m
aint
enan
ce c
osts
.
Heal
th
Sick
ness
and
Dise
ase
Im
pact
will
be
mad
e th
roug
h th
e re
duct
ion
of th
e in
cide
nce
of w
ater
born
e sic
knes
s and
dise
ase
Wel
lnes
s and
Mor
talit
y
Som
e im
pact
will
resu
lt fr
om re
duce
d ab
sent
eeism
and
ear
ly re
tirem
ent -
thro
ugh
incr
ease
d w
elln
ess -
and
a re
duce
d m
orta
lity
rate
.
Soci
ety
Food
and
live
stoc
k
Effe
cts w
ill in
clud
e: in
crea
sed
food
secu
rity
– liv
esto
ck, c
rops
, red
uced
loss
of a
nim
als –
and
red
uced
env
ironm
enta
l deb
t
Educ
atio
n
Incr
ease
d sc
hool
att
enda
nce
(driv
en b
y ac
cess
and
qua
lity)
and
impr
oved
edu
catio
nal o
utco
mes
Rela
tions
and
righ
ts
Impr
oved
rela
tions
bet
wee
n al
l sup
plie
rs a
nd c
onsu
mer
s in
a ca
tchm
ent (
e.g.
WU
As a
nd fa
rmer
s). S
atisf
actio
n of
righ
ts a
nd d
eman
ds
of th
ose
with
out a
cces
s to
wat
er. I
mpr
oved
ava
ilabi
lity
and
qual
ity o
f env
ironm
enta
l goo
ds a
nd se
rvic
es.
Awar
enes
s and
Beh
avio
ur
Raise
d aw
aren
ess o
f the
val
ue o
f wat
er, d
rivin
g in
crea
sed
will
ingn
ess t
o pa
y
Envi
ronm
ent
Emiss
ions
, con
tam
inan
ts,
pollu
tion
Re
duct
ion
in th
e fo
llow
ing:
car
bon
emiss
ions
, soi
l ero
sion,
are
a of
salin
ised
land
, gro
undw
ater
con
tam
inat
ion,
con
tam
inat
ion
of
surf
ace
wat
er, d
owns
trea
m p
ollu
tion.
Pres
erva
tion
and
heal
th
Redu
ced
or re
vers
ed d
eclin
e in
bio
dive
rsity
, pre
serv
atio
n of
rive
rine
habi
tant
s, re
duce
d so
il er
osio
n, a
nd im
prov
ed h
ealth
of
terr
estr
ial e
nviro
nmen
t. Im
prov
ed a
vaila
bilit
y an
d qu
ality
of e
nviro
nmen
tal g
oods
and
serv
ices
.

Sou
th A
fric
a’s
Res
ear
ch,
Dev
elo
pm
ent,
an
d In
nova
tion
Roa
dmap
39
2.6.
4 S
trat
egic
RD
D P
rog
ram
me:
Go
vern
ance
, Pla
nn
ing
, an
d M
anag
emen
t o
f D
eman
d
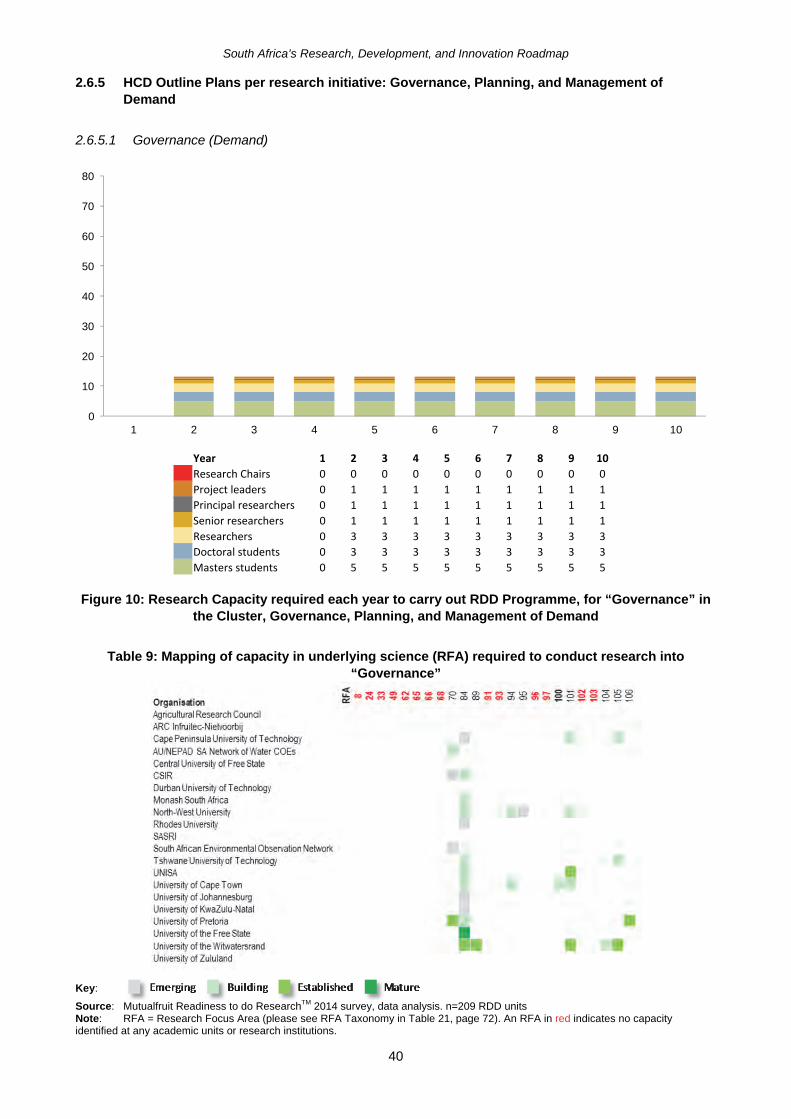
South Africa’s Research, Development, and Innovation Roadmap
40
2.6.5 HCD Outline Plans per research initiative: Governance, Planning, and Management of Demand
2.6.5.1 Governance (Demand)
Year 1 2 3 4 5 6 7 8 9 10 Research Chairs 0 0 0 0 0 0 0 0 0 0 Project leaders 0 1 1 1 1 1 1 1 1 1 Principal researchers 0 1 1 1 1 1 1 1 1 1 Senior researchers 0 1 1 1 1 1 1 1 1 1 Researchers 0 3 3 3 3 3 3 3 3 3 Doctoral students 0 3 3 3 3 3 3 3 3 3 Masters students 0 5 5 5 5 5 5 5 5 5
Figure 10: Research Capacity required each year to carry out RDD Programme, for “Governance” in
the Cluster, Governance, Planning, and Management of Demand
Table 9: Mapping of capacity in underlying science (RFA) required to conduct research into “Governance”
Key:
Source: Mutualfruit Readiness to do ResearchTM 2014 survey, data analysis. n=209 RDD units Note: RFA = Research Focus Area (please see RFA Taxonomy in Table 21, page 72). An RFA in red indicates no capacity identified at any academic units or research institutions.
0
10
20
30
40
50
60
70
80
1 2 3 4 5 6 7 8 9 10

South Africa’s Research, Development, and Innovation Roadmap
41
2.6.5.2 Planning and Management (Demand)
Year 1 2 3 4 5 6 7 8 9 10 Research Chairs 0 0 0 0 0 0 0 0 0 0 Project leaders 0 1 1 1 1 1 1 1 1 1 Principal researchers 0 1 1 1 1 1 1 1 1 1 Senior researchers 0 2 2 2 3 3 3 3 3 3 Researchers 0 5 5 5 7 7 7 7 7 7 Doctoral students 0 6 6 6 9 9 9 9 9 9 Masters students 0 9 9 9 13 13 13 13 13 13
Figure 11: Research Capacity required each year to carry out RDD Programme, for “Planning and
Management” in the Cluster, Governance, Planning, and Management of Demand
Table 10: Mapping of capacity in underlying science (RFA) required to conduct research into “Planning”
Key:
Source: Mutualfruit Readiness to do ResearchTM 2014 survey, data analysis. n=209 RDD units Note: RFA = Research Focus Area (please see RFA Taxonomy in Table 21, page 72). An RFA in red indicates no capacity identified at any academic units or research institutions.

South Africa’s Research, Development, and Innovation Roadmap
42
Table 11: Mapping of capacity in underlying science (RFA) required to conduct research into “Management”
Key:
Source: Mutualfruit Readiness to do ResearchTM 2014 survey, data analysis. n=209 RDD units Note: RFA = Research Focus Area (please see RFA Taxonomy in Table 21, page 72). An RFA in red indicates no capacity identified at any academic units or research institutions.
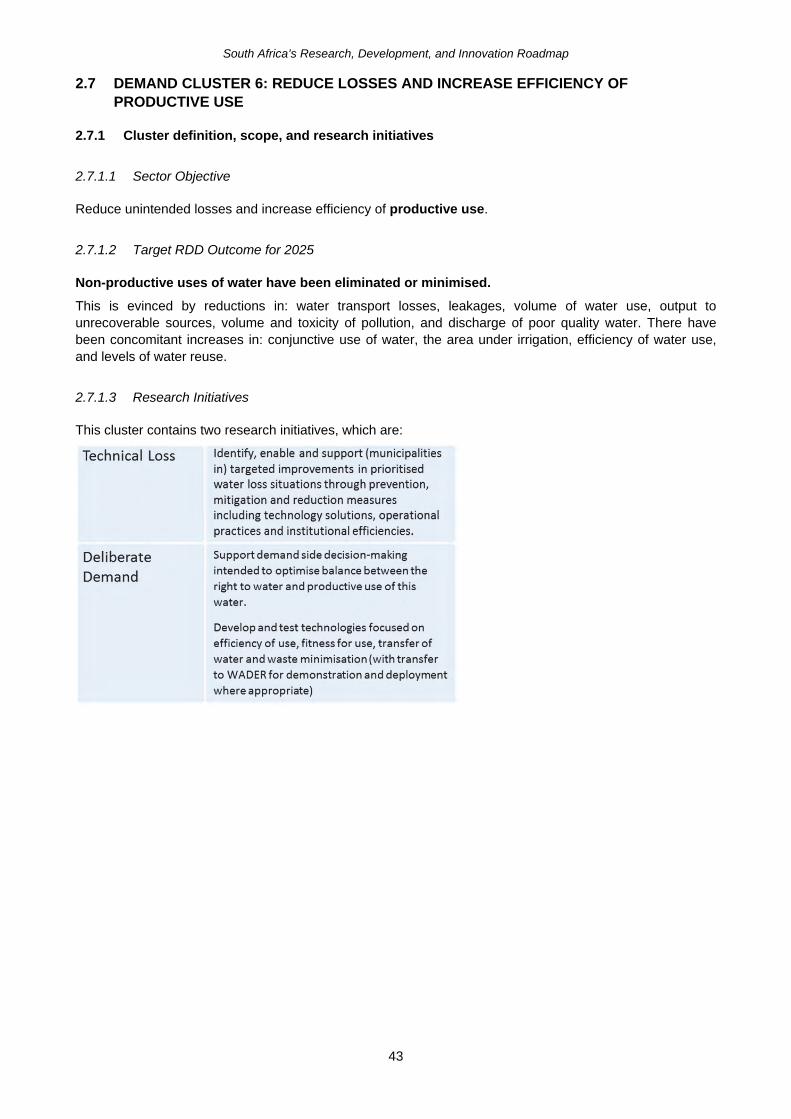
South Africa’s Research, Development, and Innovation Roadmap
43
2.7 DEMAND CLUSTER 6: REDUCE LOSSES AND INCREASE EFFICIENCY OF PRODUCTIVE USE
2.7.1 Cluster definition, scope, and research initiatives
2.7.1.1 Sector Objective
Reduce unintended losses and increase efficiency of productive use.
2.7.1.2 Target RDD Outcome for 2025
Non-productive uses of water have been eliminated or minimised.
This is evinced by reductions in: water transport losses, leakages, volume of water use, output to unrecoverable sources, volume and toxicity of pollution, and discharge of poor quality water. There have been concomitant increases in: conjunctive use of water, the area under irrigation, efficiency of water use, and levels of water reuse.
2.7.1.3 Research Initiatives
This cluster contains two research initiatives, which are:

Sou
th A
fric
a’s
Res
ear
ch,
Dev
elo
pm
ent,
an
d In
nova
tion
Roa
dmap
44
2.7.
2 R
DD
Res
po
nse
: P
rod
uct
ive
use
Ag
enci
es a
re la
rgel
y re
spon
sible
for e
nabl
emen
t, su
ch a
s fu
ndin
g, p
rovi
ding
par
tner
ship
s, o
r oth
er s
uppo
rt m
echa
nism
s. S
cien
ce C
ounc
ils a
nd U
nive
rsiti
es h
ave
role
s an
d m
anda
tes
rela
ting
to fu
ndam
enta
l res
earc
h, a
pplie
d re
sear
ch, i
ndus
tria
l dev
elop
men
t, an
d sc
ale-
up o
f inn
ovat
ive
prod
ucts
and
pro
cess
es. ‘
Oth
er’ p
artn
ers
will
be
invo
lved
in d
iver
se a
ctiv
ities
, for
exa
mpl
e, d
issem
inat
ion
of n
ew k
now
ledg
e, a
ssist
ance
with
find
ing
and
secu
ring
sites
and
/or p
artn
ers f
or p
ilotin
g / d
emon
stra
tion,
co-
fund
ing,
pro
mot
ion
of th
e RD
I Out
puts
to th
eir n
etw
orks
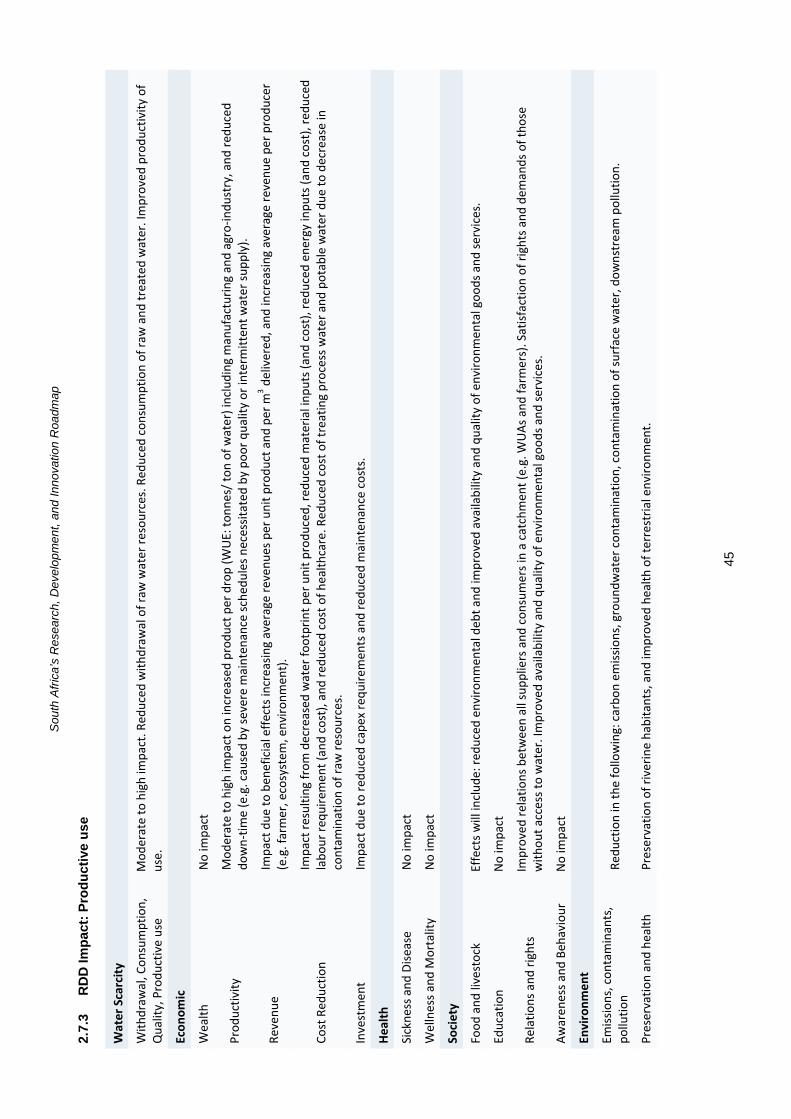
Sou
th A
fric
a’s
Res
ear
ch, D
evel
op
men
t, an
d In
nova
tion
Roa
dmap
45
2.7.
3 R
DD
Imp
act:
Pro
du
ctiv
e u
se
Wat
er S
carc
ity
With
draw
al, C
onsu
mpt
ion,
Q
ualit
y, P
rodu
ctiv
e us
e
Mod
erat
e to
hig
h im
pact
. Red
uced
with
draw
al o
f raw
wat
er re
sour
ces.
Red
uced
con
sum
ptio
n of
raw
and
trea
ted
wat
er. I
mpr
oved
pro
duct
ivity
of
use.
Econ
omic
Wea
lth
No
impa
ct
Prod
uctiv
ity
Mod
erat
e to
hig
h im
pact
on
incr
ease
d pr
oduc
t per
dro
p (W
UE:
tonn
es/ t
on o
f wat
er) i
nclu
ding
man
ufac
turin
g an
d ag
ro-in
dust
ry, a
nd re
duce
d do
wn-
time
(e.g
. cau
sed
by se
vere
mai
nten
ance
sche
dule
s nec
essit
ated
by
poor
qua
lity
or in
term
itten
t wat
er su
pply
).
Reve
nue
Im
pact
due
to b
enef
icia
l effe
cts i
ncre
asin
g av
erag
e re
venu
es p
er u
nit p
rodu
ct a
nd p
er m
3 del
iver
ed, a
nd in
crea
sing
aver
age
reve
nue
per p
rodu
cer
(e.g
. far
mer
, eco
syst
em, e
nviro
nmen
t).
Cost
Red
uctio
n
Impa
ct re
sulti
ng fr
om d
ecre
ased
wat
er fo
otpr
int p
er u
nit p
rodu
ced,
redu
ced
mat
eria
l inp
uts (
and
cost
), re
duce
d en
ergy
inpu
ts (a
nd c
ost),
redu
ced
labo
ur re
quire
men
t (an
d co
st),
and
redu
ced
cost
of h
ealth
care
. Red
uced
cos
t of t
reat
ing
proc
ess w
ater
and
pot
able
wat
er d
ue to
dec
reas
e in
co
ntam
inat
ion
of ra
w re
sour
ces.
Inve
stm
ent
Impa
ct d
ue to
redu
ced
cape
x re
quire
men
ts a
nd re
duce
d m
aint
enan
ce c
osts
.
Heal
th
Sick
ness
and
Dise
ase
N
o im
pact
Wel
lnes
s and
Mor
talit
y
No
impa
ct
Soci
ety
Food
and
live
stoc
k
Effe
cts w
ill in
clud
e: re
duce
d en
viro
nmen
tal d
ebt a
nd im
prov
ed a
vaila
bilit
y an
d qu
ality
of e
nviro
nmen
tal g
oods
and
serv
ices
.
Educ
atio
n
No
impa
ct
Rela
tions
and
righ
ts
Impr
oved
rela
tions
bet
wee
n al
l sup
plie
rs a
nd c
onsu
mer
s in
a ca
tchm
ent (
e.g.
WUA
s and
farm
ers)
. Sat
isfac
tion
of ri
ghts
and
dem
ands
of t
hose
w
ithou
t acc
ess t
o w
ater
. Im
prov
ed a
vaila
bilit
y an
d qu
ality
of e
nviro
nmen
tal g
oods
and
serv
ices
.
Awar
enes
s and
Beh
avio
ur
No
impa
ct
Envi
ronm
ent
Emiss
ions
, con
tam
inan
ts,
pollu
tion
Re
duct
ion
in th
e fo
llow
ing:
car
bon
emiss
ions
, gro
undw
ater
con
tam
inat
ion,
con
tam
inat
ion
of su
rfac
e w
ater
, dow
nstr
eam
pol
lutio
n.
Pres
erva
tion
and
heal
th
Pres
erva
tion
of ri
verin
e ha
bita
nts,
and
impr
oved
hea
lth o
f ter
rest
rial e
nviro
nmen
t.

Sou
th A
fric
a’s
Res
ear
ch,
Dev
elo
pm
ent,
an
d In
nova
tion
Roa
dmap
46
2.7.
4 S
trat
egic
RD
D P
rog
ram
me:
Pro
du
ctiv
e u
se
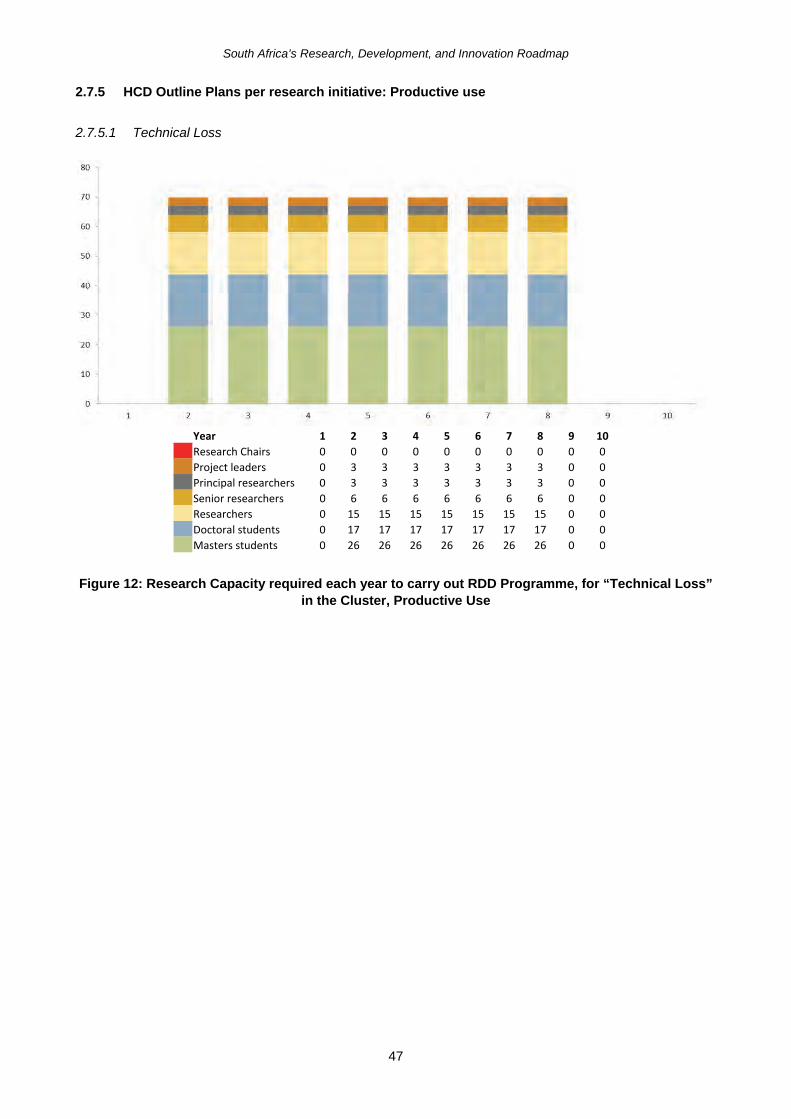
South Africa’s Research, Development, and Innovation Roadmap
47
2.7.5 HCD Outline Plans per research initiative: Productive use
2.7.5.1 Technical Loss
Year 1 2 3 4 5 6 7 8 9 10 Research Chairs 0 0 0 0 0 0 0 0 0 0 Project leaders 0 3 3 3 3 3 3 3 0 0 Principal researchers 0 3 3 3 3 3 3 3 0 0 Senior researchers 0 6 6 6 6 6 6 6 0 0 Researchers 0 15 15 15 15 15 15 15 0 0 Doctoral students 0 17 17 17 17 17 17 17 0 0 Masters students 0 26 26 26 26 26 26 26 0 0
Figure 12: Research Capacity required each year to carry out RDD Programme, for “Technical Loss” in the Cluster, Productive Use
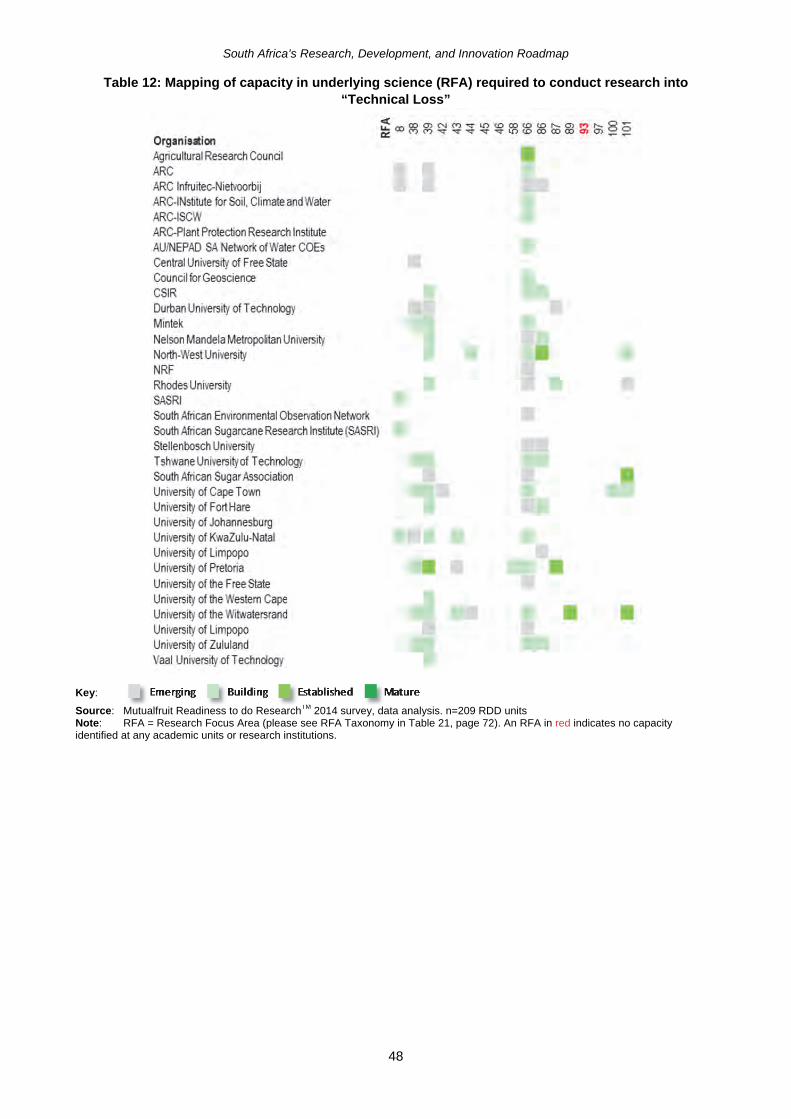
South Africa’s Research, Development, and Innovation Roadmap
48
Table 12: Mapping of capacity in underlying science (RFA) required to conduct research into “Technical Loss”
Key:
Source: Mutualfruit Readiness to do ResearchTM 2014 survey, data analysis. n=209 RDD units Note: RFA = Research Focus Area (please see RFA Taxonomy in Table 21, page 72). An RFA in red indicates no capacity identified at any academic units or research institutions.
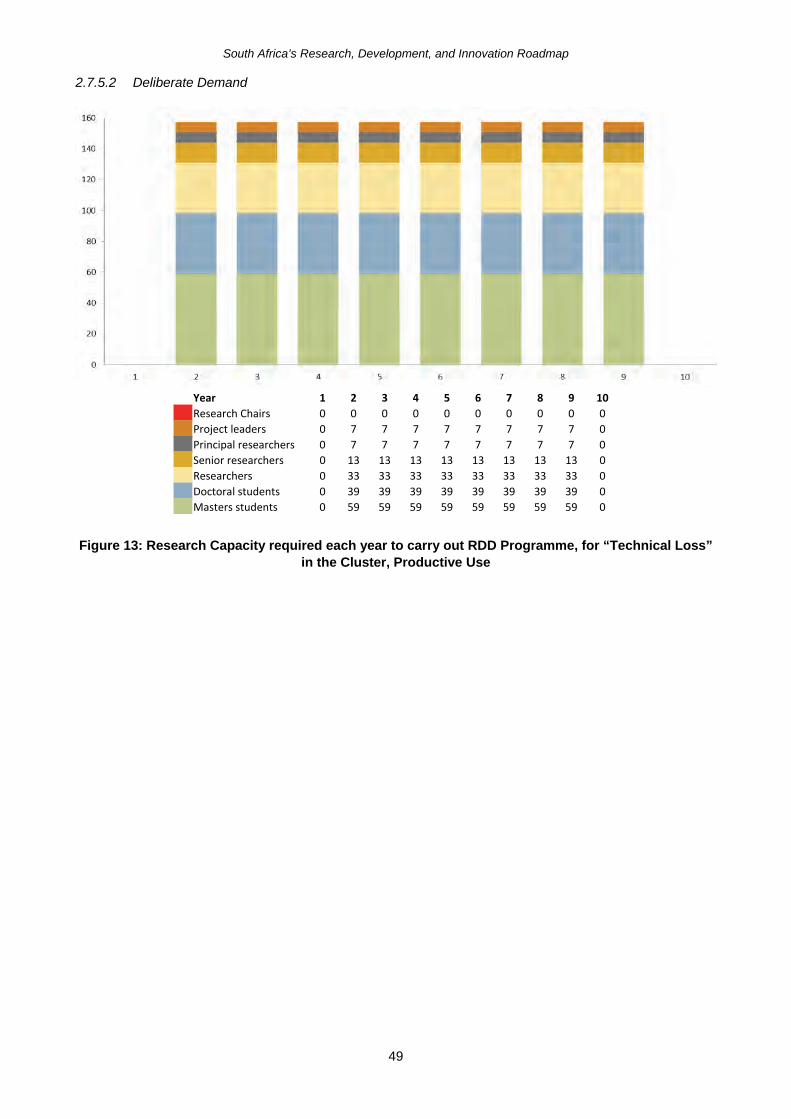
South Africa’s Research, Development, and Innovation Roadmap
49
2.7.5.2 Deliberate Demand
Year 1 2 3 4 5 6 7 8 9 10 Research Chairs 0 0 0 0 0 0 0 0 0 0 Project leaders 0 7 7 7 7 7 7 7 7 0 Principal researchers 0 7 7 7 7 7 7 7 7 0 Senior researchers 0 13 13 13 13 13 13 13 13 0 Researchers 0 33 33 33 33 33 33 33 33 0 Doctoral students 0 39 39 39 39 39 39 39 39 0 Masters students 0 59 59 59 59 59 59 59 59 0
Figure 13: Research Capacity required each year to carry out RDD Programme, for “Technical Loss” in the Cluster, Productive Use

Sou
th A
fric
a’s
Res
ear
ch,
Dev
elo
pm
ent,
an
d In
nova
tion
Roa
dmap
50
Tab
le 1
3: M
app
ing
of
cap
acit
y in
un
der
lyin
g s
cien
ce (
RF
A)
req
uir
ed t
o c
on
du
ct r
esea
rch
into
“T
ech
nic
al L
oss
”
Ke
y:
So
urc
e:
Mut
ualfr
uit R
eadi
ness
to d
o R
ese
arch
TM 2
014
surv
ey,
dat
a an
alys
is. n
=20
9 R
DD
uni
ts
No
te:
R
FA
= R
esea
rch
Foc
us A
rea
(ple
ase
see
RF
A T
axo
nom
y in
Tab
le 2
1, p
age
72).
An
RF
A in
red
indi
cate
s no
cap
acity
iden
tifie
d at
an
y a
cade
mic
uni
ts o
r re
sear
ch in
stitu
tions
.
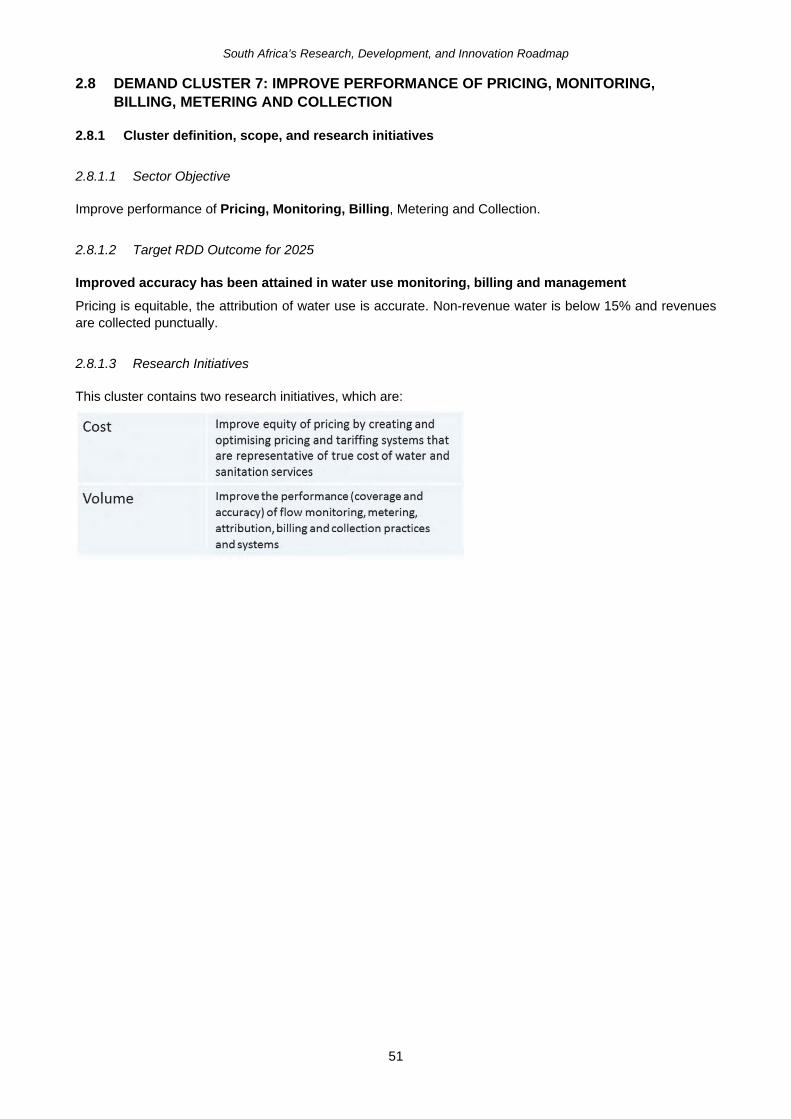
South Africa’s Research, Development, and Innovation Roadmap
51
2.8 DEMAND CLUSTER 7: IMPROVE PERFORMANCE OF PRICING, MONITORING, BILLING, METERING AND COLLECTION
2.8.1 Cluster definition, scope, and research initiatives
2.8.1.1 Sector Objective
Improve performance of Pricing, Monitoring, Billing, Metering and Collection.
2.8.1.2 Target RDD Outcome for 2025
Improved accuracy has been attained in water use monitoring, billing and management
Pricing is equitable, the attribution of water use is accurate. Non-revenue water is below 15% and revenues are collected punctually.
2.8.1.3 Research Initiatives
This cluster contains two research initiatives, which are:

Sou
th A
fric
a’s
Res
ear
ch, D
evel
op
men
t, an
d In
nova
tion
Roa
dmap
52
2.8.
2 R
DD
Res
po
nse
: P
rici
ng
, Mo
nit
ori
ng
, Bill
ing
RDD
Activ
ity
RDD
Focu
s and
Pro
gres
sion
Expl
ore
new
tool
s for
man
agem
ent a
nd m
eter
ing.
Tes
t, de
mon
stra
te a
nd d
eplo
y te
chno
logi
es a
nd b
uild
hum
an c
apac
ity.
Und
erly
ing
Scie
nce
M
ultip
le d
iscip
lines
with
in W
CDM
, los
s min
imisa
tion,
M&
E an
d au
tom
atio
n / c
ontr
ol.
Know
-How
Inte
llect
ual P
rope
rty
No
/ litt
le p
oten
tial f
or c
omm
erci
al IP
env
isage
d
Know
ledg
e Di
ffusio
n
Extr
emel
y sm
all p
ool o
f exp
ertis
e. T
oo m
any
grou
ps a
t lev
els 0
to 3
, thu
s inv
estm
ent i
nto
tech
nolo
gy im
port
and
dep
loym
ent i
s nee
ded.
Read
ines
s to
do R
esea
rchTM
Capa
city
Sm
all n
umbe
r of r
esea
rch
grou
ps th
at a
re d
istrib
uted
bet
wee
n un
iver
sitie
s, a
nd a
mix
ture
of p
ublic
and
priv
ate
orga
nisa
tions
.Mos
t gro
ups a
re
emer
ging
or b
uild
ing.
Onl
y six
RFA
s rep
rese
nted
.
Stre
ngth
In
vest
men
t nee
ded
into
kno
wle
dge
gene
ratio
n, a
nd H
CD. R
esea
rch
grou
ps re
quire
stre
ngth
enin
g an
d m
ultip
lyin
g. T
RP n
eede
d to
focu
s fun
ding
.
RDI I
nfra
stru
ctur
e
Inst
all,
Expa
nd
Inve
stm
ent r
equi
red
into
cap
acity
bui
ldin
g, te
chno
logy
dem
onst
ratio
n an
d de
ploy
men
t, an
d m
eter
ing
met
hods
.
Cust
omer
s and
Par
tner
s
Gove
rnm
ent a
nd S
take
hold
ers
DWS,
SAL
GA, W
ater
Boa
rds,
Wat
er S
ervi
ces A
utho
ritie
s, W
ater
Ser
vice
s Pro
vide
rs
Priv
ate
Sect
or
Priv
ate
sect
or e
ngin
eerin
g co
mpa
nies
.
Rese
arch
Agen
cies
W
RC, p
ossib
ly T
IA
Scie
nce
Coun
cils
and
Uni
vers
ities
Pa
rtne
rshi
ps a
t HEI
s, pr
ivat
e an
d pu
blic
com
pani
es, a
nd sc
ienc
e co
unci
ls, w
ith sp
ecifi
c pa
rtne
rs d
epen
ding
on
RFA,
disc
iplin
e, a
nd sc
ale
of
tech
nolo
gy
Oth
er P
artn
ersh
ips
Ofw
at
Agen
cies
are
larg
ely
resp
onsib
le fo
r ena
blem
ent,
such
as
fund
ing,
pro
vidi
ng p
artn
ersh
ips,
or o
ther
sup
port
mec
hani
sms.
Sci
ence
Cou
ncils
and
Uni
vers
ities
hav
e ro
les
and
man
date
s re
latin
g to
fund
amen
tal r
esea
rch,
app
lied
rese
arch
, ind
ustr
ial d
evel
opm
ent,
and
scal
e-up
of i
nnov
ativ
e pr
oduc
ts a
nd p
roce
sses
. ‘O
ther
’ par
tner
s w
ill b
e in
volv
ed in
div
erse
act
iviti
es, f
or e
xam
ple,
diss
emin
atio
n of
new
kno
wle
dge,
ass
istan
ce w
ith fi
ndin
g an
d se
curin
g sit
es a
nd/o
r par
tner
s for
pilo
ting
/ dem
onst
ratio
n, c
o-fu
ndin
g, p
rom
otio
n of
the
RDI O
utpu
ts to
thei
r net
wor
ks

Sou
th A
fric
a’s
Res
ear
ch, D
evel
op
men
t, an
d In
nova
tion
Roa
dmap
53
2.8.
3 R
DD
Imp
act:
Pri
cin
g, M
on
ito
rin
g, B
illin
g
Wat
er S
carc
ity
With
draw
al, C
onsu
mpt
ion,
Q
ualit
y, P
rodu
ctiv
e us
e
Mod
erat
e to
hig
h im
pact
. Red
uced
with
draw
al o
f raw
wat
er re
sour
ces.
Red
uced
con
sum
ptio
n of
raw
and
trea
ted
wat
er. I
mpr
oved
pro
duct
ivity
of
use.
Econ
omic
Wea
lth
Impa
ct
Prod
uctiv
ity
Mod
erat
e to
hig
h im
pact
on
incr
ease
d pr
oduc
t per
dro
p (W
UE:
tonn
es/ t
on o
f wat
er) i
nclu
ding
man
ufac
turin
g an
d ag
roin
dust
ry, a
nd re
duce
d do
wn-
time
(e.g
. cau
sed
by se
vere
mai
nten
ance
sche
dule
s nec
essit
ated
by
poor
qua
lity
or in
term
itten
t wat
er su
pply
).
Reve
nue
Im
pact
due
to b
enef
icia
l effe
cts i
ncre
asin
g av
erag
e re
venu
es p
er u
nit p
rodu
ct a
nd p
er m
3 del
iver
ed, a
nd in
crea
sing
aver
age
reve
nue
per p
rodu
cer
(e.g
. far
mer
, eco
syst
em, e
nviro
nmen
t).
Cost
Red
uctio
n
Impa
ct re
sulti
ng fr
om d
ecre
ased
wat
er fo
otpr
int p
er u
nit p
rodu
ced,
redu
ced
mat
eria
l inp
uts (
and
cost
), re
duce
d en
ergy
inpu
ts (a
nd c
ost),
redu
ced
labo
ur re
quire
men
t (an
d co
st),
and
redu
ced
cost
of h
ealth
care
. Red
uced
cos
t of t
reat
ing
proc
ess w
ater
and
pot
able
wat
er d
ue to
dec
reas
e in
co
ntam
inat
ion
of ra
w re
sour
ces.
Inve
stm
ent
Impa
ct d
ue to
redu
ced
cape
x re
quire
men
ts a
nd re
duce
d m
aint
enan
ce c
osts
.
Heal
th
Sick
ness
and
Dise
ase
N
o im
pact
Wel
lnes
s and
Mor
talit
y
No
impa
ct
Soci
ety
Food
and
live
stoc
k
Effe
cts w
ill in
clud
e: re
duce
d en
viro
nmen
tal d
ebt a
nd im
prov
ed a
vaila
bilit
y an
d qu
ality
of e
nviro
nmen
tal g
oods
and
serv
ices
.
Educ
atio
n
No
impa
ct
Rela
tions
and
righ
ts
Impr
oved
rela
tions
bet
wee
n al
l sup
plie
rs a
nd c
onsu
mer
s in
a ca
tchm
ent (
e.g.
WUA
s and
farm
ers)
. Sat
isfac
tion
of ri
ghts
and
dem
ands
of t
hose
w
ithou
t acc
ess t
o w
ater
.
Awar
enes
s and
Beh
avio
ur
Raise
d aw
aren
ess o
f the
val
ue o
f wat
er, d
rivin
g in
crea
sed
will
ingn
ess t
o pa
y.
Envi
ronm
ent
Emiss
ions
, con
tam
inan
ts,
pollu
tion
Re
duct
ion
in th
e fo
llow
ing:
car
bon
emiss
ions
, con
tam
inat
ion
of su
rfac
e w
ater
, dow
nstr
eam
pol
lutio
n.
Pres
erva
tion
and
heal
th
No
impa
ct

Sou
th A
fric
a’s
Res
ear
ch,
Dev
elo
pm
ent,
an
d In
nova
tion
Roa
dmap
54
2.8.
4 S
trat
egic
RD
D P
rog
ram
me:
Pri
cin
g, M
on
ito
rin
g, B
illin
g
* T
ime
fram
es o
verla
p, d
ue to
diff
eren
ce in
dur
atio
n of
RP
s fo
r C
ost a
nd V
olum
e.
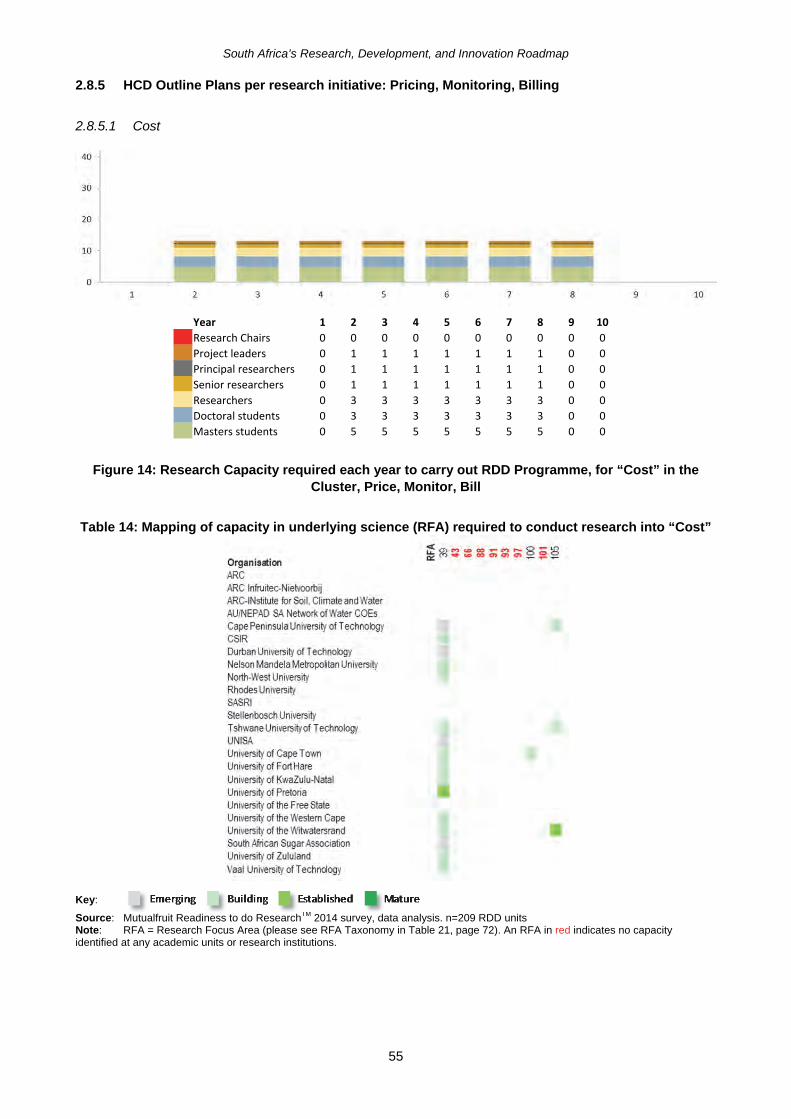
South Africa’s Research, Development, and Innovation Roadmap
55
2.8.5 HCD Outline Plans per research initiative: Pricing, Monitoring, Billing
2.8.5.1 Cost
Year 1 2 3 4 5 6 7 8 9 10 Research Chairs 0 0 0 0 0 0 0 0 0 0 Project leaders 0 1 1 1 1 1 1 1 0 0 Principal researchers 0 1 1 1 1 1 1 1 0 0 Senior researchers 0 1 1 1 1 1 1 1 0 0 Researchers 0 3 3 3 3 3 3 3 0 0 Doctoral students 0 3 3 3 3 3 3 3 0 0 Masters students 0 5 5 5 5 5 5 5 0 0
Figure 14: Research Capacity required each year to carry out RDD Programme, for “Cost” in the Cluster, Price, Monitor, Bill
Table 14: Mapping of capacity in underlying science (RFA) required to conduct research into “Cost”
Key:
Source: Mutualfruit Readiness to do ResearchTM 2014 survey, data analysis. n=209 RDD units Note: RFA = Research Focus Area (please see RFA Taxonomy in Table 21, page 72). An RFA in red indicates no capacity identified at any academic units or research institutions.

South Africa’s Research, Development, and Innovation Roadmap
56
2.8.5.2 Volume
Year 1 2 3 4 5 6 7 8 9 10 Research Chairs 0 1 1 1 1 1 0 0 0 0 Project leaders 0 2 2 2 2 2 2 2 2 0 Principal researchers 0 2 2 2 2 2 2 2 2 0 Senior researchers 0 4 4 4 4 4 4 4 4 0 Researchers 0 10 10 10 10 10 10 10 10 0 Doctoral students 0 12 12 12 12 12 12 12 12 0 Masters students 0 17 17 17 17 17 17 17 17 0
Figure 15: Research Capacity required each year to carry out RDD Programme, for “Volume” in the Cluster, Price, Monitor, Bill
Table 15: Mapping of capacity in underlying science (RFA) required to conduct research into “Volume”
Key:
Source: Mutualfruit Readiness to do ResearchTM 2014 survey, data analysis. n=209 RDD units Note: RFA = Research Focus Area (please see RFA Taxonomy in Table 21, page 72). An RFA in red indicates no capacity identified at any academic units or research institutions.
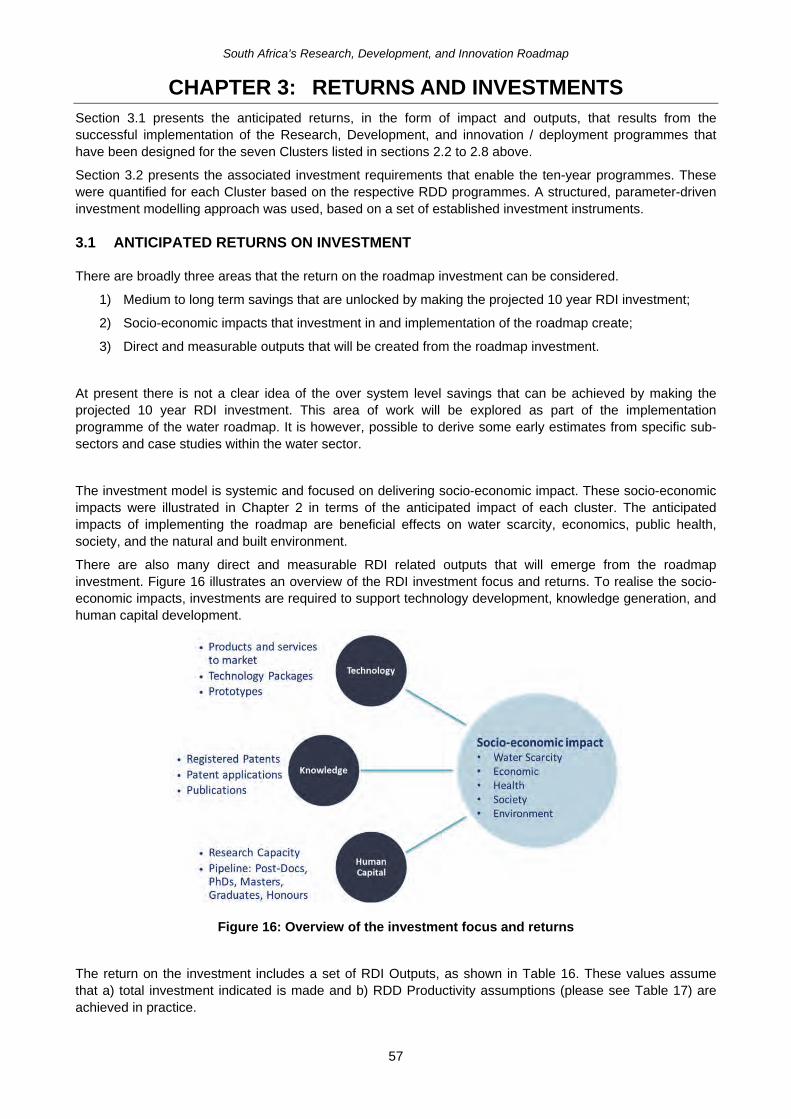
South Africa’s Research, Development, and Innovation Roadmap
57
CHAPTER 3: RETURNS AND INVESTMENTS Section 3.1 presents the anticipated returns, in the form of impact and outputs, that results from the successful implementation of the Research, Development, and innovation / deployment programmes that have been designed for the seven Clusters listed in sections 2.2 to 2.8 above.
Section 3.2 presents the associated investment requirements that enable the ten-year programmes. These were quantified for each Cluster based on the respective RDD programmes. A structured, parameter-driven investment modelling approach was used, based on a set of established investment instruments.
3.1 ANTICIPATED RETURNS ON INVESTMENT
There are broadly three areas that the return on the roadmap investment can be considered.
1) Medium to long term savings that are unlocked by making the projected 10 year RDI investment;
2) Socio-economic impacts that investment in and implementation of the roadmap create;
3) Direct and measurable outputs that will be created from the roadmap investment.
At present there is not a clear idea of the over system level savings that can be achieved by making the projected 10 year RDI investment. This area of work will be explored as part of the implementation programme of the water roadmap. It is however, possible to derive some early estimates from specific sub-sectors and case studies within the water sector.
The investment model is systemic and focused on delivering socio-economic impact. These socio-economic impacts were illustrated in Chapter 2 in terms of the anticipated impact of each cluster. The anticipated impacts of implementing the roadmap are beneficial effects on water scarcity, economics, public health, society, and the natural and built environment.
There are also many direct and measurable RDI related outputs that will emerge from the roadmap investment. Figure 16 illustrates an overview of the RDI investment focus and returns. To realise the socio-economic impacts, investments are required to support technology development, knowledge generation, and human capital development.
Figure 16: Overview of the investment focus and returns
The return on the investment includes a set of RDI Outputs, as shown in Table 16. These values assume that a) total investment indicated is made and b) RDD Productivity assumptions (please see Table 17) are achieved in practice.
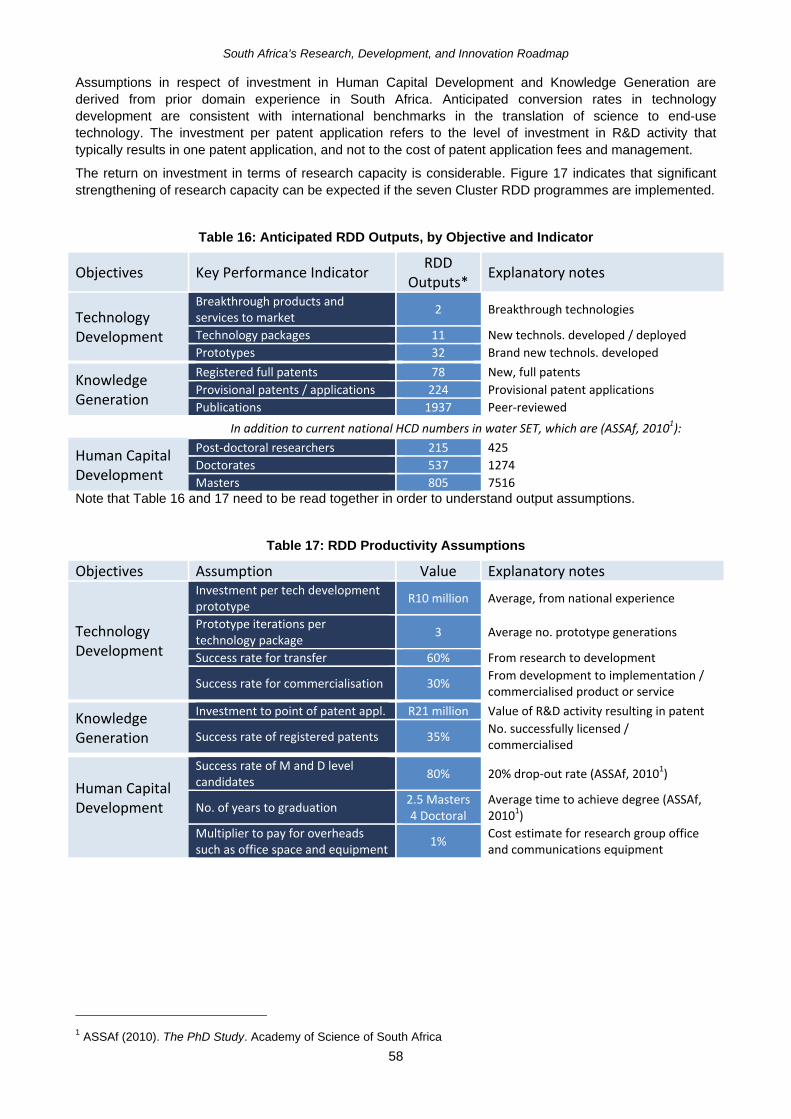
South Africa’s Research, Development, and Innovation Roadmap
58
Assumptions in respect of investment in Human Capital Development and Knowledge Generation are derived from prior domain experience in South Africa. Anticipated conversion rates in technology development are consistent with international benchmarks in the translation of science to end-use technology. The investment per patent application refers to the level of investment in R&D activity that typically results in one patent application, and not to the cost of patent application fees and management.
The return on investment in terms of research capacity is considerable. Figure 17 indicates that significant strengthening of research capacity can be expected if the seven Cluster RDD programmes are implemented.
Table 16: Anticipated RDD Outputs, by Objective and Indicator
Objectives Key Performance Indicator RDD Outputs* Explanatory notes
Technology Development
Breakthrough products and services to market 2 Breakthrough technologies
Technology packages 11 New technols. developed / deployedPrototypes 32 Brand new technols. developed
Knowledge Generation
Registered full patents 78 New, full patents Provisional patents / applications 224 Provisional patent applicationsPublications 1937 Peer-reviewed
In addition to current national HCD numbers in water SET, which are (ASSAf, 20101):
Human Capital Development
Post-doctoral researchers 215 425Doctorates 537 1274Masters 805 7516
Note that Table 16 and 17 need to be read together in order to understand output assumptions.
Table 17: RDD Productivity Assumptions
Objectives Assumption Value Explanatory notes
Technology Development
Investment per tech developmentprototype R10 million Average, from national experience
Prototype iterations per technology package 3 Average no. prototype generations
Success rate for transfer 60% From research to development
Success rate for commercialisation 30% From development to implementation / commercialised product or service
Knowledge Generation
Investment to point of patent appl. R21 million Value of R&D activity resulting in patent
Success rate of registered patents 35% No. successfully licensed / commercialised
Human Capital Development
Success rate of M and D level candidates 80% 20% drop-out rate (ASSAf, 20101)
No. of years to graduation 2.5 Masters4 Doctoral
Average time to achieve degree (ASSAf, 20101)
Multiplier to pay for overheads such as office space and equipment 1% Cost estimate for research group office
and communications equipment
1 ASSAf (2010). The PhD Study. Academy of Science of South Africa

South Africa’s Research, Development, and Innovation Roadmap
59
Figure 17: Number of additional people entering water-related SET research via the ten year RDI programme, categorised by research seniority
The root contribution of the Roadmap to sector success comes through allowing better coordination, improved decision-making, and greater enablement, principally through the systematic translation of research into operational practice
Products and services delivered to market is but the end point of a total pipeline of technology development that includes attempts and failures. This is expressed by the conversion ratios in Table 17.
The principal purpose of technology in the water RDI Roadmap is deployment to solve national needs. The return on the total investment over 10 years is expressed clearly on page 11 (South Africa’s water and wastewater industry outperforms) – i.e. if we are successful in the execution of our RDD Objectives (listed in full on page 77), we will have enabled the water sector to have achieved its objectives (right-most column)
If the purpose of investment in technology were for the purpose of export, this would have driven a different strategy. Our target market would have been different and our approach to developing a market strategy would have assessed needs and South Africa’s ability to satisfy them better, faster (and possibly cheaper) than the competition.
We assessed the Impact and summarised this in Table 18. However, due to the lack of underlying data and associated models – as identified in discussions with a leading resource economist – this project could not provide a more specific and quantified estimation of the overall value, as was the case for the ICT and Waste Roadmaps.
However, it should be noted that some of the impacts may be semi-quantifiable. For example, “the country loses R7 billion a year to water losses1”. One of the performance measures of the RDI Roadmap is the reduction of water losses from a national average of approx. 35% to 15%; this would indirectly create a saving of approx. R3.5 billion per annum to the nation. Quantifying the benefits of the Water RDI Roadmap is an ongoing initiative.
1 President Zuma, State of the Nation Address 2015
0
100
200
300
400
500
600
700
800
900
Year 1 Year 2 Year 3 Year 4 Year 5 Year 6 Year 7 Year 8 Year 9 Year 10
Research Chairs
Project leaders
Principal researchers
Senior researchers
Researchers
Doctoral students
Masters students
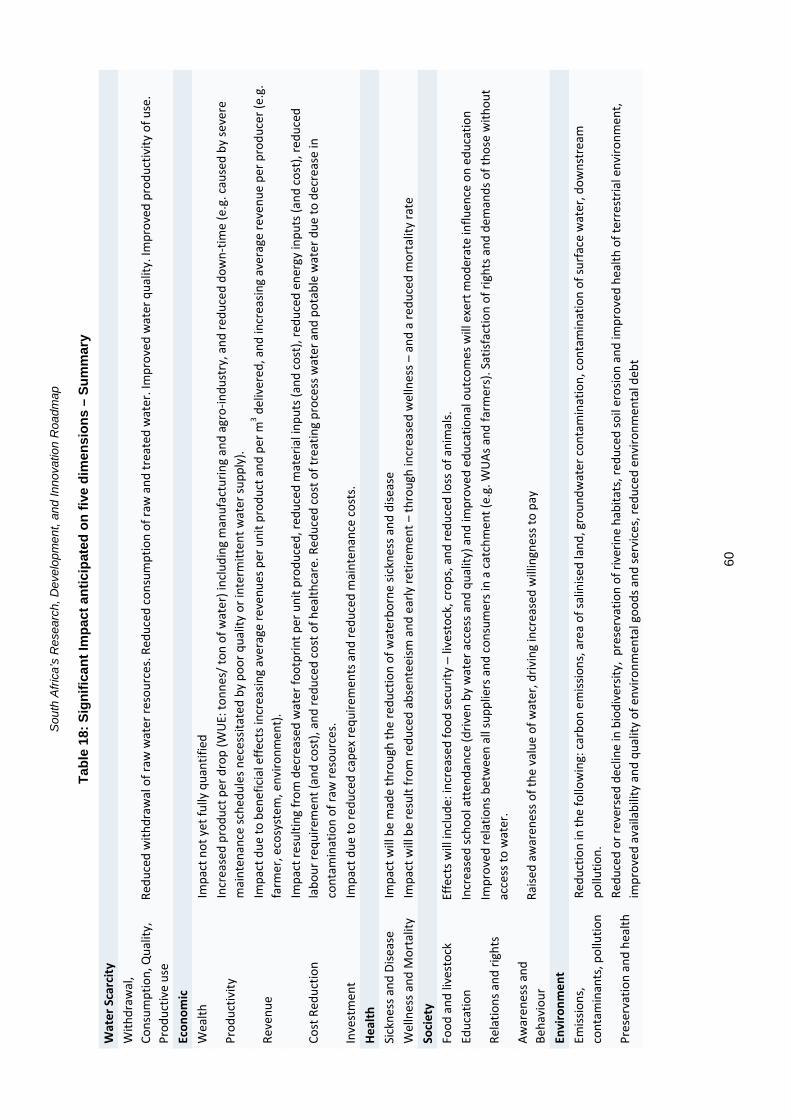
Sou
th A
fric
a’s
Res
ear
ch, D
evel
op
men
t, an
d In
nova
tion
Roa
dmap
60
Tab
le 1
8: S
ign
ific
ant
Imp
act
anti
cip
ated
on
fiv
e d
imen
sio
ns
– S
um
mar
y
Wat
er S
carc
ity
With
draw
al,
Cons
umpt
ion,
Qua
lity,
Pr
oduc
tive
use
Re
duce
d w
ithdr
awal
of r
aw w
ater
reso
urce
s. R
educ
ed c
onsu
mpt
ion
of ra
w a
nd tr
eate
d w
ater
. Im
prov
ed w
ater
qua
lity.
Impr
oved
pro
duct
ivity
of u
se.
Econ
omic
W
ealth
Im
pact
not
yet
fully
qua
ntifi
ed
Prod
uctiv
ity
Incr
ease
d pr
oduc
t per
dro
p (W
UE:
tonn
es/ t
on o
f wat
er) i
nclu
ding
man
ufac
turin
g an
d ag
ro-in
dust
ry, a
nd re
duce
d do
wn-
time
(e.g
. cau
sed
by se
vere
m
aint
enan
ce sc
hedu
les n
eces
sitat
ed b
y po
or q
ualit
y or
inte
rmitt
ent w
ater
supp
ly).
Reve
nue
Im
pact
due
to b
enef
icia
l effe
cts i
ncre
asin
g av
erag
e re
venu
es p
er u
nit p
rodu
ct a
nd p
er m
3de
liver
ed, a
nd in
crea
sing
aver
age
reve
nue
per p
rodu
cer (
e.g.
fa
rmer
, eco
syst
em, e
nviro
nmen
t).
Cost
Red
uctio
n
Impa
ct re
sulti
ng fr
om d
ecre
ased
wat
er fo
otpr
int p
er u
nit p
rodu
ced,
redu
ced
mat
eria
l inp
uts (
and
cost
), re
duce
d en
ergy
inpu
ts (a
nd c
ost),
redu
ced
labo
ur re
quire
men
t (an
d co
st),
and
redu
ced
cost
of h
ealth
care
. Red
uced
cos
t of t
reat
ing
proc
ess w
ater
and
pot
able
wat
er d
ue to
dec
reas
e in
co
ntam
inat
ion
of ra
w re
sour
ces.
In
vest
men
t Im
pact
due
to re
duce
d ca
pex
requ
irem
ents
and
redu
ced
mai
nten
ance
cos
ts.
Heal
th
Sick
ness
and
Dise
ase
Impa
ct w
ill b
e m
ade
thro
ugh
the
redu
ctio
n of
wat
erbo
rne
sickn
ess a
nd d
iseas
e
Wel
lnes
s and
Mor
talit
y Im
pact
will
be
resu
lt fr
om re
duce
d ab
sent
eeism
and
ear
ly re
tirem
ent –
thro
ugh
incr
ease
d w
elln
ess –
and
a re
duce
d m
orta
lity
rate
Soci
ety
Fo
od a
nd li
vest
ock
Effe
cts w
ill in
clud
e: in
crea
sed
food
secu
rity
–liv
esto
ck, c
rops
, and
redu
ced
loss
of a
nim
als.
Educ
atio
n
Incr
ease
d sc
hool
att
enda
nce
(driv
enby
wat
er a
cces
s and
qua
lity)
and
impr
oved
edu
catio
nal o
utco
mes
will
exe
rt m
oder
ate
influ
ence
on
educ
atio
n
Rela
tions
and
righ
ts
Impr
oved
rela
tions
bet
wee
n al
l sup
plie
rs a
nd c
onsu
mer
s in
a ca
tchm
ent (
e.g.
WUA
s and
farm
ers)
. Sat
isfac
tion
of ri
ghts
and
dem
ands
of t
hose
with
out
acce
ss to
wat
er.
Awar
enes
s and
Be
havi
our
Raise
d aw
aren
ess o
f the
val
ue o
f wat
er, d
rivin
g in
crea
sed
will
ingn
ess t
o pa
y
Envi
ronm
ent
Emiss
ions
, co
ntam
inan
ts, p
ollu
tion
Redu
ctio
n in
the
follo
win
g: c
arbo
n em
issio
ns, a
rea
of sa
linise
d la
nd, g
roun
dwat
er c
onta
min
atio
n, c
onta
min
atio
n of
surf
ace
wat
er, d
owns
trea
m
pollu
tion.
Pres
erva
tion
and
heal
th
Redu
ced
or re
vers
ed d
eclin
e in
bio
dive
rsity
, pr
eser
vatio
n of
rive
rine
habi
tats
, red
uced
soil
eros
ion
and
impr
oved
hea
lth o
f ter
rest
rial e
nviro
nmen
t, im
prov
ed a
vaila
bilit
y an
d qu
ality
of e
nviro
nmen
tal g
oods
and
serv
ices
, red
uced
env
ironm
enta
l deb
t
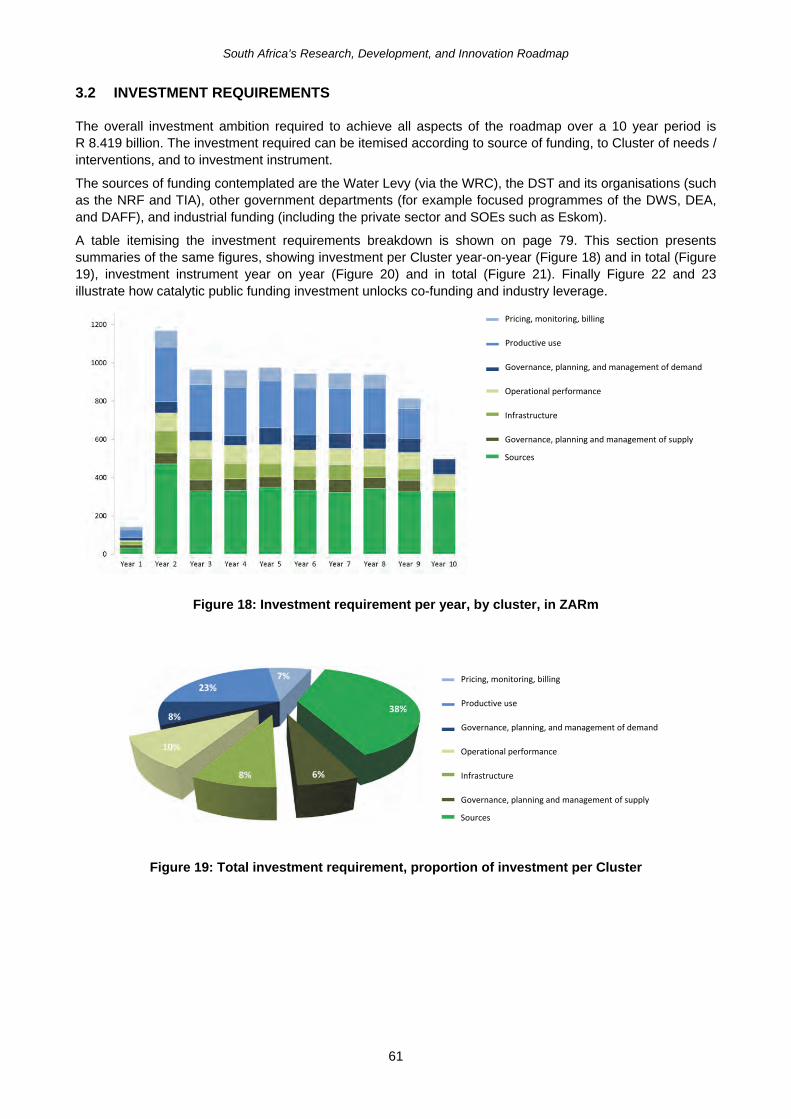
South Africa’s Research, Development, and Innovation Roadmap
61
3.2 INVESTMENT REQUIREMENTS
The overall investment ambition required to achieve all aspects of the roadmap over a 10 year period is R 8.419 billion. The investment required can be itemised according to source of funding, to Cluster of needs / interventions, and to investment instrument.
The sources of funding contemplated are the Water Levy (via the WRC), the DST and its organisations (such as the NRF and TIA), other government departments (for example focused programmes of the DWS, DEA, and DAFF), and industrial funding (including the private sector and SOEs such as Eskom).
A table itemising the investment requirements breakdown is shown on page 79. This section presents summaries of the same figures, showing investment per Cluster year-on-year (Figure 18) and in total (Figure 19), investment instrument year on year (Figure 20) and in total (Figure 21). Finally Figure 22 and 23 illustrate how catalytic public funding investment unlocks co-funding and industry leverage.
Pricing, monitoring, billing
Productive use
Governance, planning, and management of demand
Operational performance
Infrastructure
Governance, planning and management of supply Sources
Figure 18: Investment requirement per year, by cluster, in ZARm
Pricing, monitoring, billing
Productive use
Governance, planning, and management of demand
Operational performance
Infrastructure
Governance, planning and management of supply Sources
Figure 19: Total investment requirement, proportion of investment per Cluster

South Africa’s Research, Development, and Innovation Roadmap
62
Figure 20: Investment requirement per year, by investment instrument, in ZARm
Figure 21: Total investment requirement, proportion of investment per instrument
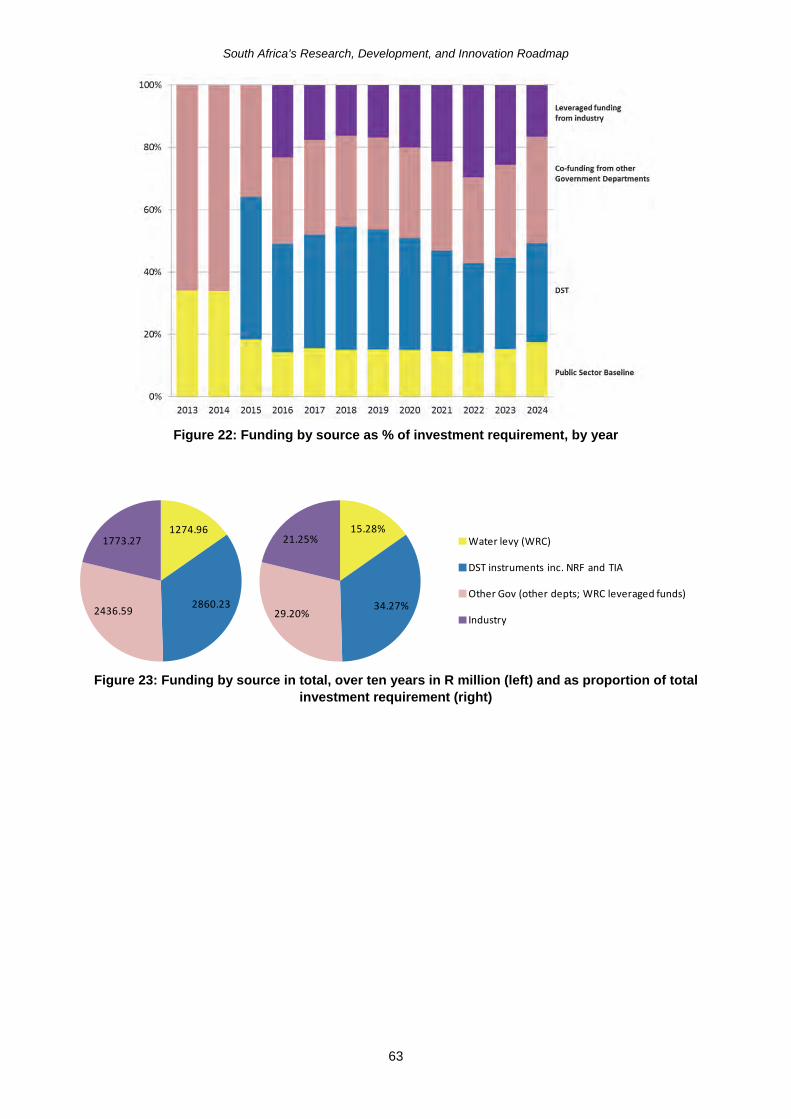
South Africa’s Research, Development, and Innovation Roadmap
63
Figure 22: Funding by source as % of investment requirement, by year
Figure 23: Funding by source in total, over ten years in R million (left) and as proportion of total investment requirement (right)
1274.96
2860.232436.59
1773.2715.28%
34.27%29.20%
21.25% Water levy (WRC)
DST instruments inc. NRF and TIA
Other Gov (other depts; WRC leveraged funds)
Industry
South Africa’s Research, Development, and Innovation Roadmap
64
CHAPTER 4: APPROACH AND PARTICIPATION Having provided the context and case for action in Chapter 1, and the roadmap itself in Chapter 2, and investments with returns on investments in Chapter 3, this chapter presents the two-stage, customer-driven approach to development of the Roadmap (Figure 24).
Step 1 was an exploration of what customers want provided the basis for a focused approach to developing South Africa’s Research, Development, and Deployment (RDD) Response. Step 2 was framing the RDD response, and developing out the roadmap itself. The two steps were broken down into eleven phases of work, which are summarised in chronological order in Figure 24 and will be described in the following sections.
4.1 WHAT DO CUSTOMERS WANT?
4.1.1 Identify customer needs
The ‘customers’ in this context were members of the water community of professionals, which were divided into four sectors:
• Agriculture • Industry • The public sector • Environmental protection
A comprehensive series of 32 work sessions and workshops took place between June 2013 and January 2015.
To identify customers’ needs, the four sectors were initially engaged separately. The premise of the roadmap was explained in summary, and then they were given a blank slate upon which to write simple statements of needs specific to their sector. The four sectors’ lists of needs were captured into a first long list of 154 statements (Table A1, Appendix A). The statements of each sector were not shared with the other three sectors until the second round of work sessions, as each sector was required to provide their own, sector-specific list of needs rather than to choose needs from a menu of previous inputs.
4.1.2 Review needs, and articulate interventions
The second series of sector work sessions used the list of 154 needs as a departure point. The participants were provided with the list, and asked to review it for clarity and mutual understanding. They were then asked to describe what interventions they deemed would enable each need to be met.
The participants were asked to provide the nature of the intervention required to satisfy the need, without prescribing a solution. The interventions were drawn up by breakaway groups within each sector work session, and then exchanged in plenary. A satisfying level of convergence emerged during these sessions. The interventions are listed in full in Table A1 (Appendix A).

Sou
th A
frica
’s R
esea
rch,
Dev
elop
men
t, an
d In
nova
tion
Roa
dmap
65
Fi
gure
24:
Flo
w c
hart
of t
he a
ppro
ach
and
met
hodo
logy
of t
he ro
ad m
appi
ng p
roce
ss
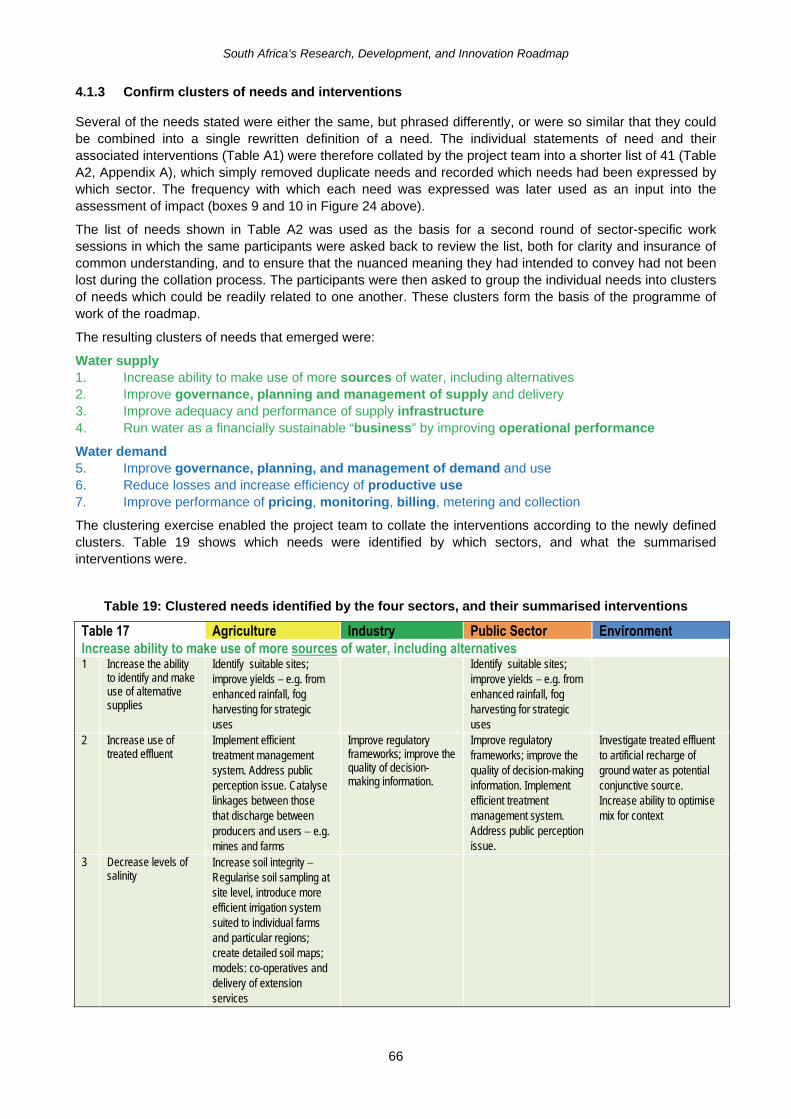
South Africa’s Research, Development, and Innovation Roadmap
66
4.1.3 Confirm clusters of needs and interventions
Several of the needs stated were either the same, but phrased differently, or were so similar that they could be combined into a single rewritten definition of a need. The individual statements of need and their associated interventions (Table A1) were therefore collated by the project team into a shorter list of 41 (Table A2, Appendix A), which simply removed duplicate needs and recorded which needs had been expressed by which sector. The frequency with which each need was expressed was later used as an input into the assessment of impact (boxes 9 and 10 in Figure 24 above).
The list of needs shown in Table A2 was used as the basis for a second round of sector-specific work sessions in which the same participants were asked back to review the list, both for clarity and insurance of common understanding, and to ensure that the nuanced meaning they had intended to convey had not been lost during the collation process. The participants were then asked to group the individual needs into clusters of needs which could be readily related to one another. These clusters form the basis of the programme of work of the roadmap.
The resulting clusters of needs that emerged were:
Water supply 1. Increase ability to make use of more sources of water, including alternatives 2. Improve governance, planning and management of supply and delivery 3. Improve adequacy and performance of supply infrastructure 4. Run water as a financially sustainable “business” by improving operational performance
Water demand 5. Improve governance, planning, and management of demand and use 6. Reduce losses and increase efficiency of productive use 7. Improve performance of pricing, monitoring, billing, metering and collection
The clustering exercise enabled the project team to collate the interventions according to the newly defined clusters. Table 19 shows which needs were identified by which sectors, and what the summarised interventions were.
Table 19: Clustered needs identified by the four sectors, and their summarised interventions
Table 17 Agriculture Industry Public Sector Environment Increase ability to make use of more sources of water, including alternatives 1 Increase the ability
to identify and make use of alternative supplies
Identify suitable sites; improve yields – e.g. from enhanced rainfall, fog harvesting for strategic uses
Identify suitable sites; improve yields – e.g. from enhanced rainfall, fog harvesting for strategic uses
2 Increase use of treated effluent
Implement efficient treatment management system. Address public perception issue. Catalyse linkages between those that discharge between producers and users – e.g. mines and farms
Improve regulatory frameworks; improve the quality of decision-making information.
Improve regulatory frameworks; improve the quality of decision-making information. Implement efficient treatment management system. Address public perception issue.
Investigate treated effluent to artificial recharge of ground water as potential conjunctive source. Increase ability to optimise mix for context
3 Decrease levels of salinity
Increase soil integrity – Regularise soil sampling at site level, introduce more efficient irrigation system suited to individual farms and particular regions; create detailed soil maps; models: co-operatives and delivery of extension services
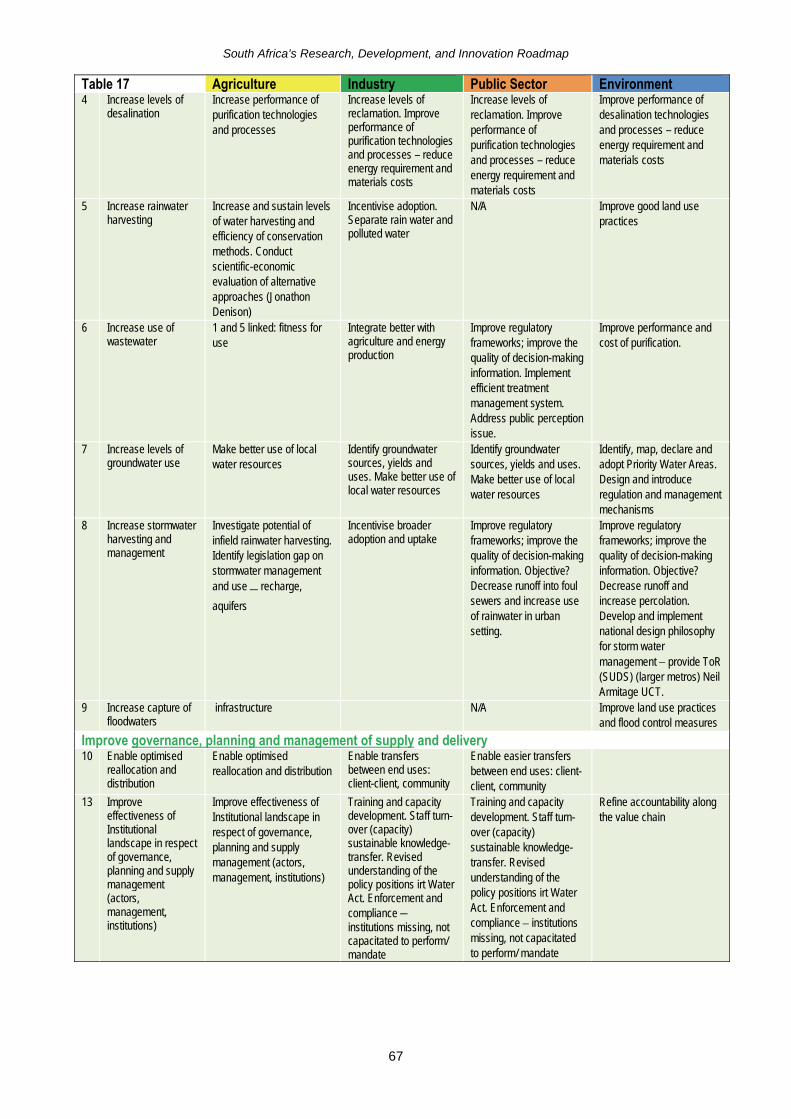
South Africa’s Research, Development, and Innovation Roadmap
67
Table 17 Agriculture Industry Public Sector Environment 4 Increase levels of
desalination Increase performance of purification technologies and processes
Increase levels of reclamation. Improve performance of purification technologies and processes – reduce energy requirement and materials costs
Increase levels of reclamation. Improve performance of purification technologies and processes – reduce energy requirement and materials costs
Improve performance of desalination technologies and processes – reduce energy requirement and materials costs
5 Increase rainwater harvesting
Increase and sustain levels of water harvesting and efficiency of conservation methods. Conduct scientific-economic evaluation of alternative approaches (Jonathon Denison)
Incentivise adoption. Separate rain water and polluted water
N/A Improve good land use practices
6 Increase use of wastewater
1 and 5 linked: fitness for use
Integrate better with agriculture and energy production
Improve regulatory frameworks; improve the quality of decision-making information. Implement efficient treatment management system. Address public perception issue.
Improve performance and cost of purification.
7 Increase levels of groundwater use
Make better use of local water resources
Identify groundwater sources, yields and uses. Make better use of local water resources
Identify groundwater sources, yields and uses. Make better use of local water resources
Identify, map, declare and adopt Priority Water Areas. Design and introduce regulation and management mechanisms
8 Increase stormwater harvesting and management
Investigate potential of infield rainwater harvesting. Identify legislation gap on stormwater management and use – recharge,
aquifers
Incentivise broader adoption and uptake
Improve regulatory frameworks; improve the quality of decision-making information. Objective? Decrease runoff into foul sewers and increase use of rainwater in urban setting.
Improve regulatory frameworks; improve the quality of decision-making information. Objective? Decrease runoff and increase percolation. Develop and implement national design philosophy for storm water management – provide ToR (SUDS) (larger metros) Neil Armitage UCT.
9 Increase capture of floodwaters
infrastructure N/A Improve land use practices and flood control measures
Improve governance, planning and management of supply and delivery 10 Enable optimised
reallocation and distribution
Enable optimised reallocation and distribution
Enable transfers between end uses: client-client, community
Enable easier transfers between end uses: client-client, community
13 Improve effectiveness of Institutional landscape in respect of governance, planning and supply management (actors, management, institutions)
Improve effectiveness of Institutional landscape in respect of governance, planning and supply management (actors, management, institutions)
Training and capacity development. Staff turn-over (capacity) sustainable knowledge-transfer. Revised understanding of the policy positions irt Water Act. Enforcement and compliance – institutions missing, not capacitated to perform/ mandate
Training and capacity development. Staff turn-over (capacity) sustainable knowledge-transfer. Revised understanding of the policy positions irt Water Act. Enforcement and compliance – institutions missing, not capacitated to perform/ mandate
Refine accountability along the value chain
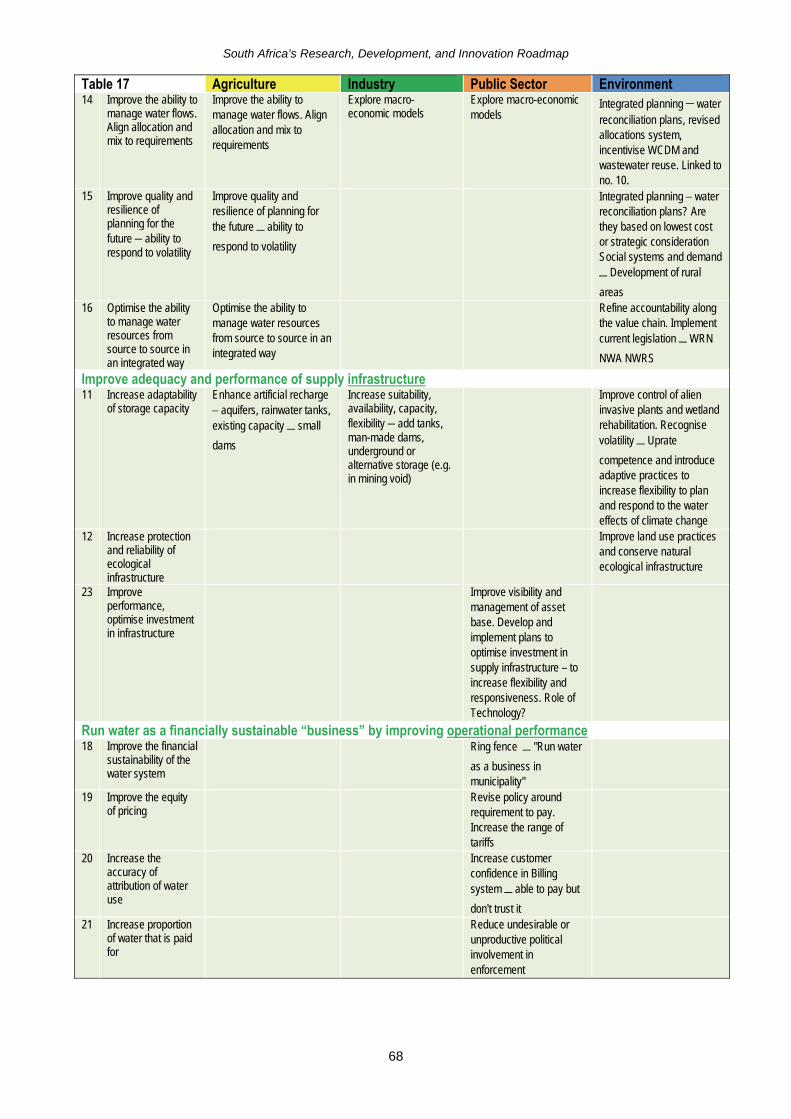
South Africa’s Research, Development, and Innovation Roadmap
68
Table 17 Agriculture Industry Public Sector Environment 14 Improve the ability to
manage water flows. Align allocation and mix to requirements
Improve the ability to manage water flows. Align allocation and mix to requirements
Explore macro-economic models
Explore macro-economic models
Integrated planning – water reconciliation plans, revised allocations system, incentivise WCDM and wastewater reuse. Linked to no. 10.
15 Improve quality and resilience of planning for the future – ability to respond to volatility
Improve quality and resilience of planning for the future – ability to
respond to volatility
Integrated planning – water reconciliation plans? Are they based on lowest cost or strategic consideration Social systems and demand
– Development of rural
areas 16 Optimise the ability
to manage water resources from source to source in an integrated way
Optimise the ability to manage water resources from source to source in an integrated way
Refine accountability along the value chain. Implement current legislation – WRN
NWA NWRS
Improve adequacy and performance of supply infrastructure 11 Increase adaptability
of storage capacity Enhance artificial recharge – aquifers, rainwater tanks, existing capacity – small
dams
Increase suitability, availability, capacity, flexibility – add tanks, man-made dams, underground or alternative storage (e.g. in mining void)
Improve control of alien invasive plants and wetland rehabilitation. Recognise volatility – Uprate
competence and introduce adaptive practices to increase flexibility to plan and respond to the water effects of climate change
12 Increase protection and reliability of ecological infrastructure
Improve land use practices and conserve natural ecological infrastructure
23 Improve performance, optimise investment in infrastructure
Improve visibility and management of asset base. Develop and implement plans to optimise investment in supply infrastructure – to increase flexibility and responsiveness. Role of Technology?
Run water as a financially sustainable “business” by improving operational performance 18 Improve the financial
sustainability of the water system
Ring fence – "Run water
as a business in municipality"
19 Improve the equity of pricing
Revise policy around requirement to pay. Increase the range of tariffs
20 Increase the accuracy of attribution of water use
Increase customer confidence in Billing system – able to pay but
don't trust it
21 Increase proportion of water that is paid for
Reduce undesirable or unproductive political involvement in enforcement
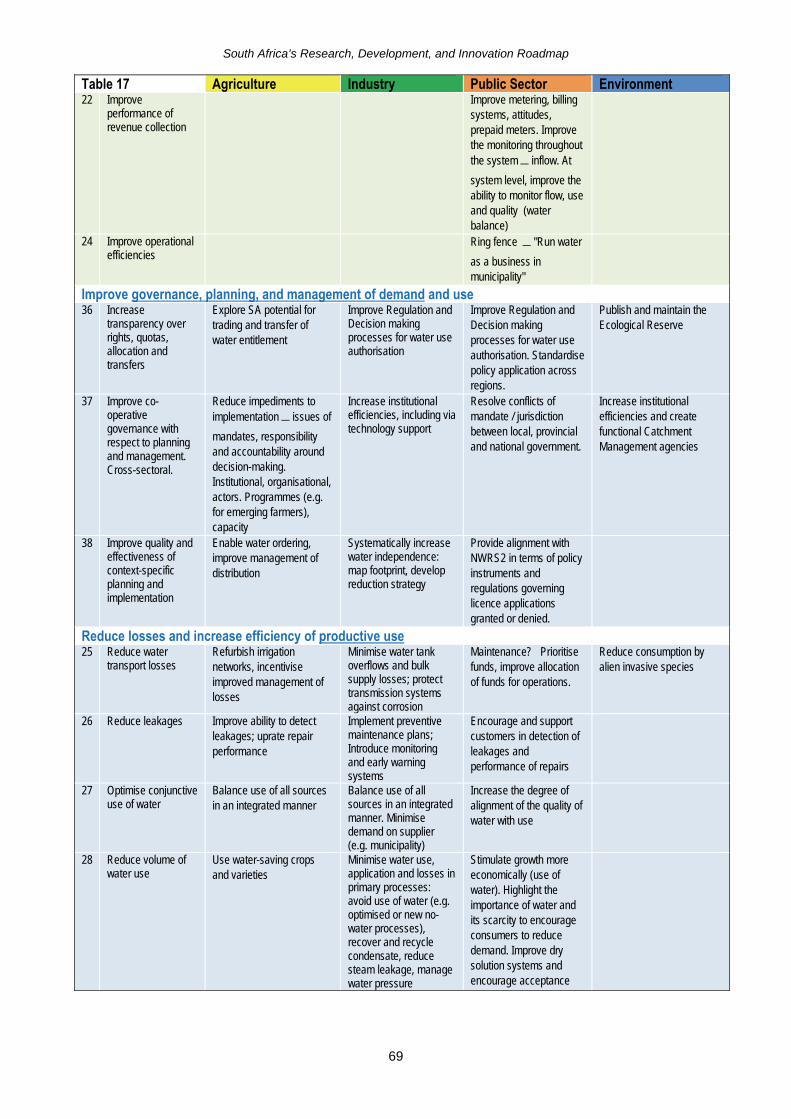
South Africa’s Research, Development, and Innovation Roadmap
69
Table 17 Agriculture Industry Public Sector Environment 22 Improve
performance of revenue collection
Improve metering, billing systems, attitudes, prepaid meters. Improve the monitoring throughout the system – inflow. At
system level, improve the ability to monitor flow, use and quality (water balance)
24 Improve operational efficiencies
Ring fence – "Run water
as a business in municipality"
Improve governance, planning, and management of demand and use 36 Increase
transparency over rights, quotas, allocation and transfers
Explore SA potential for trading and transfer of water entitlement
Improve Regulation and Decision making processes for water use authorisation
Improve Regulation and Decision making processes for water use authorisation. Standardise policy application across regions.
Publish and maintain the Ecological Reserve
37 Improve co-operative governance with respect to planning and management. Cross-sectoral.
Reduce impediments to implementation – issues of
mandates, responsibility and accountability around decision-making. Institutional, organisational, actors. Programmes (e.g. for emerging farmers), capacity
Increase institutional efficiencies, including via technology support
Resolve conflicts of mandate / jurisdiction between local, provincial and national government.
Increase institutional efficiencies and create functional Catchment Management agencies
38 Improve quality and effectiveness of context-specific planning and implementation
Enable water ordering, improve management of distribution
Systematically increase water independence: map footprint, develop reduction strategy
Provide alignment with NWRS2 in terms of policy instruments and regulations governing licence applications granted or denied.
Reduce losses and increase efficiency of productive use 25 Reduce water
transport losses Refurbish irrigation networks, incentivise improved management of losses
Minimise water tank overflows and bulk supply losses; protect transmission systems against corrosion
Maintenance? Prioritise funds, improve allocation of funds for operations.
Reduce consumption by alien invasive species
26 Reduce leakages Improve ability to detect leakages; uprate repair performance
Implement preventive maintenance plans; Introduce monitoring and early warning systems
Encourage and support customers in detection of leakages and performance of repairs
27 Optimise conjunctive use of water
Balance use of all sources in an integrated manner
Balance use of all sources in an integrated manner. Minimise demand on supplier (e.g. municipality)
Increase the degree of alignment of the quality of water with use
28 Reduce volume of water use
Use water-saving crops and varieties
Minimise water use, application and losses in primary processes: avoid use of water (e.g. optimised or new no-water processes), recover and recycle condensate, reduce steam leakage, manage water pressure
Stimulate growth more economically (use of water). Highlight the importance of water and its scarcity to encourage consumers to reduce demand. Improve dry solution systems and encourage acceptance

South Africa’s Research, Development, and Innovation Roadmap
70
Table 17 Agriculture Industry Public Sector Environment 29 Increase the area
under irrigation Use savings in current water use. Change NDP word "irrigation" to "agricultural water use" (in line with the rest of the world)
30 Improve efficiency of water use
Encourage uptake of land and water use practices Introduce irrigation systems and improve performance: Optimise irrigation: Plan, meter, schedule; Monitor soil moisture; Reduce evapo-transpiration; Optimise fertiliser use. Increase effectiveness of knowledge transfer. Increase levels of rehabilitation
Reduce water in ancillary processes, reduce demand for domestic water
31 Increase levels of water reuse
Reduce volume of wastewater, recover and recycle
Reduce volume of wastewater, increase levels of recovery and recycling;
32 Minimise output to unrecoverable sources
Reduce wastewater released to sewers
Reduce volume of wastewater released to sewers. Recycle water streams for water and wastewater treatment
33 Minimise volume and toxicity of pollution
Reduce rainwater runoff Minimise production of waste (e.g. cleaner production methods)
Increase number of WWTW with Green Drop certification to >95%. Link to no. 35
Maximise natural water resource function (aquatic response)
34 Optimise balance between the right to water and productive use of this water
Reduce downstream pollution (point-sources and diffuse sources)
Investigate and develop economic modelling on the use and value of environmental goods and services. Inform greater clarity at a macro level in order to inform decision-making and policy evidencing
35 Minimise discharge of poor quality water
Minimise production of effluent (e.g. cleaner production methods)
Increase number of WWTW with Green Drop certification to >95%
Improve performance of pricing, monitoring, billing, metering, and collection 39 Improve equity of
pricing, encourage desirable practice
Introduce tariffs and incentives ("real cost" of water); enforce quotas
Introduce tariffs and incentives ("real cost" of water). Increase cost of discharge to sewer
Improve pricing structures based on full cost pricing to reflect the "real cost“ of water, including equitable charging.
40 Improve accuracy: use monitoring, billing and management
Increase coverage, accuracy of flow monitoring, attribution; introduce management systems
Increase coverage and accuracy of monitoring, metering, attribution and billing. Target reductions
Improve coverage and accuracy and hence
confidence in metering – similar to electricity metering
Increase coverage and accuracy of monitoring
41 Reduce levels of unmetered use
Detect and remove unmetered supplies; ensure meters are operating
Detect and remove unmetered supplies; ensure meters are operating; improve management of collection
Define, implement and support policy on billing control

South Africa’s Research, Development, and Innovation Roadmap
71
4.1.4 Define Sector Performance Measures
The satisfaction of the customers’ needs has value, which can be expressed in relation to measures of performance (speed, reliance, cost). In order to be motivated to adopt a new or improved solution in the pursuit of the satisfaction of their needs, customers have an expectation (a minimum requirement for an improvement in performance) that a solution must deliver. These expectations should be specifically quantifiable in terms of a target (e.g. cost less than R100 per m3), a percentage (e.g. faster by 20%). These expectations were elicited from the sectors through a series of sessions in which the expectations were sought and then reviewed. An example is shown in Table 18, and the full list of performance measures is shown in Table A4, Appendix A.
To the extent that RDD can make a contribution to developing and delivering a solution a) these expectations were used to later set the objectives for the RDD activity, and the value that the customer attached to adopting the solution underpins the case for investing in RDD.
A joint scoring workshop was held to assess the attractiveness of the seven agreed clusters of RDD opportunities which had been listed as responses to the needs and their interventions. The participants, from all four sectors of the water community, evaluated the opportunities and interventions in a structured and consistent manner using the dimensions of Customer Need, Market Opportunity, and the potential Value and Impact that attaches to successful realisation. Four follow-up sessions were held to cross-check the validity and level of ambition of the performance measures on which the sectors settled.
Table 20: Example Performance Measures created by the water community
Need Performance Measures Minimum change required 10 Enable optimised reallocation and
distribution DWA water allocations remapped A new map completed by 2016
36 Increase transparency over rights, quotas, allocation and transfers
Consumers within catchments know everyone's water allocation
Nine functional Catchment Management Agencies
The Sector Objectives and Performance Measures (determined as described in Section 4.1.3 and 4.1.4) can be summarised as (Table 21):
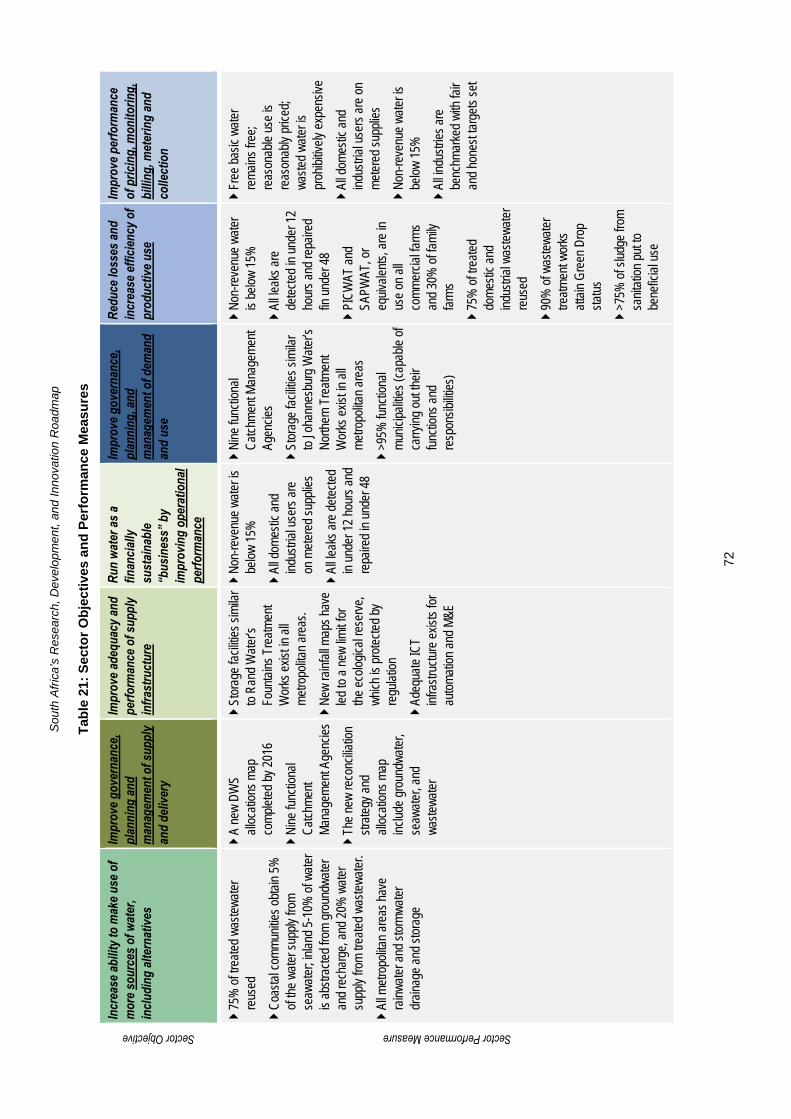
Sou
th A
fric
a’s
Res
ear
ch, D
evel
op
men
t, an
d In
nova
tion
Roa
dmap
72
Tab
le 2
1: S
ecto
r O
bje
ctiv
es a
nd
Per
form
ance
Mea
sure
s Sector Objective
Incr
ease
abilit
y to
mak
e use
of
mor
e sou
rces
of w
ater
, in
cludi
ng al
tern
ative
s
Impr
ove g
over
nanc
e, pl
anni
ng an
d m
anag
emen
t of s
uppl
y an
d de
liver
y
Impr
ove a
dequ
acy a
nd
perfo
rman
ce o
f sup
ply
infra
stru
ctur
e
Run
wate
r as a
fin
ancia
lly
sust
ainab
le “b
usin
ess”
by
impr
ovin
g op
erat
iona
l pe
rform
ance
Impr
ove g
over
nanc
e, pl
anni
ng, a
nd
man
agem
ent o
f dem
and
and
use
Redu
ce lo
sses
and
incr
ease
effic
iency
of
prod
uctiv
e use
Impr
ove p
erfo
rman
ce
of p
ricin
g, m
onito
ring,
bi
lling,
met
erin
g an
d co
llect
ion
Sector Performance Measure
75
% o
f tre
ated
was
tew
ater
re
used
C
oast
al c
omm
uniti
es o
btai
n 5%
of
the
wat
er s
uppl
y fro
m
seaw
ater
; inl
and
5-10
% o
f wat
er
is a
bstra
cted
from
gro
undw
ater
an
d re
char
ge, a
nd 2
0% w
ater
su
pply
from
trea
ted
was
tew
ater
.
Al
l met
ropo
litan
are
as h
ave
rain
wat
er a
nd s
torm
wat
er
drai
nage
and
sto
rage
A
new
DW
S al
loca
tions
map
co
mpl
eted
by
2016
N
ine
func
tiona
l C
atch
men
t M
anag
emen
t Age
ncie
s
Th
e ne
w re
conc
iliatio
n st
rate
gy a
nd
allo
catio
ns m
ap
incl
ude
grou
ndw
ater
, se
awat
er, a
nd
was
tew
ater
St
orag
e fa
cilit
ies
sim
ilar
to R
and
Wat
er’s
Fo
unta
ins
Trea
tmen
t W
orks
exi
st in
all
met
ropo
litan
are
as.
N
ew ra
infa
ll m
aps
have
le
d to
a n
ew li
mit
for
the
ecol
ogic
al re
serv
e,
whi
ch is
pro
tect
ed b
y re
gula
tion
Ad
equa
te IC
T in
frast
ruct
ure
exis
ts fo
r au
tom
atio
n an
d M
&E
N
on-re
venu
e w
ater
is
belo
w 1
5%
Al
l dom
estic
and
in
dust
rial u
sers
are
on
met
ered
sup
plie
s
Al
l lea
ks a
re d
etec
ted
in u
nder
12
hour
s an
d re
paire
d in
und
er 4
8
N
ine
func
tiona
l C
atch
men
t Man
agem
ent
Agen
cies
St
orag
e fa
cilit
ies
sim
ilar
to J
ohan
nesb
urg
Wat
er’s
N
orth
ern
Trea
tmen
t W
orks
exi
st in
all
met
ropo
litan
are
as
>9
5% fu
nctio
nal
mun
icip
aliti
es (c
apab
le o
f ca
rryin
g ou
t the
ir fu
nctio
ns a
nd
resp
onsi
bilit
ies)
N
on-re
venu
e w
ater
is
bel
ow 1
5%
Al
l lea
ks a
re
dete
cted
in u
nder
12
hour
s an
d re
paire
d fin
und
er 4
8
PI
CW
AT a
nd
SAPW
AT, o
r eq
uiva
lent
s, a
re in
us
e on
all
com
mer
cial
farm
s an
d 30
% o
f fam
ily
farm
s
75
% o
f tre
ated
do
mes
tic a
nd
indu
stria
l was
tew
ater
re
used
90
% o
f was
tew
ater
tre
atm
ent w
orks
at
tain
Gre
en D
rop
stat
us
>7
5% o
f slu
dge
from
sa
nita
tion
put t
o be
nefic
ial u
se
Fr
ee b
asic
wat
er
rem
ains
free
; re
ason
able
use
is
reas
onab
ly p
riced
; w
aste
d w
ater
is
proh
ibiti
vely
exp
ensi
ve
Al
l dom
estic
and
in
dust
rial u
sers
are
on
met
ered
sup
plie
s
N
on-re
venu
e w
ater
is
belo
w 1
5%
Al
l ind
ustri
es a
re
benc
hmar
ked
with
fair
and
hone
st ta
rget
s se
t
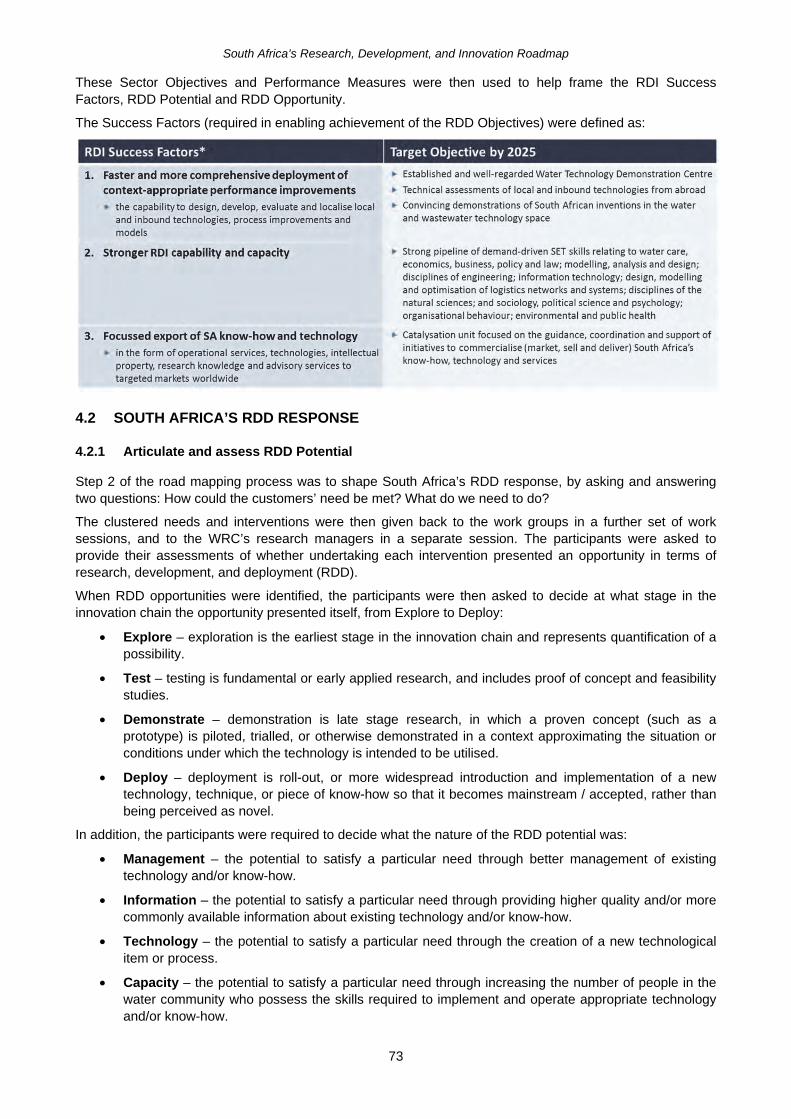
South Africa’s Research, Development, and Innovation Roadmap
73
These Sector Objectives and Performance Measures were then used to help frame the RDI Success Factors, RDD Potential and RDD Opportunity.
The Success Factors (required in enabling achievement of the RDD Objectives) were defined as:
4.2 SOUTH AFRICA’S RDD RESPONSE
4.2.1 Articulate and assess RDD Potential
Step 2 of the road mapping process was to shape South Africa’s RDD response, by asking and answering two questions: How could the customers’ need be met? What do we need to do?
The clustered needs and interventions were then given back to the work groups in a further set of work sessions, and to the WRC’s research managers in a separate session. The participants were asked to provide their assessments of whether undertaking each intervention presented an opportunity in terms of research, development, and deployment (RDD).
When RDD opportunities were identified, the participants were then asked to decide at what stage in the innovation chain the opportunity presented itself, from Explore to Deploy:
• Explore – exploration is the earliest stage in the innovation chain and represents quantification of a possibility.
• Test – testing is fundamental or early applied research, and includes proof of concept and feasibility studies.
• Demonstrate – demonstration is late stage research, in which a proven concept (such as a prototype) is piloted, trialled, or otherwise demonstrated in a context approximating the situation or conditions under which the technology is intended to be utilised.
• Deploy – deployment is roll-out, or more widespread introduction and implementation of a new technology, technique, or piece of know-how so that it becomes mainstream / accepted, rather than being perceived as novel.
In addition, the participants were required to decide what the nature of the RDD potential was:
• Management – the potential to satisfy a particular need through better management of existing technology and/or know-how.
• Information – the potential to satisfy a particular need through providing higher quality and/or more commonly available information about existing technology and/or know-how.
• Technology – the potential to satisfy a particular need through the creation of a new technological item or process.
• Capacity – the potential to satisfy a particular need through increasing the number of people in the water community who possess the skills required to implement and operate appropriate technology and/or know-how.
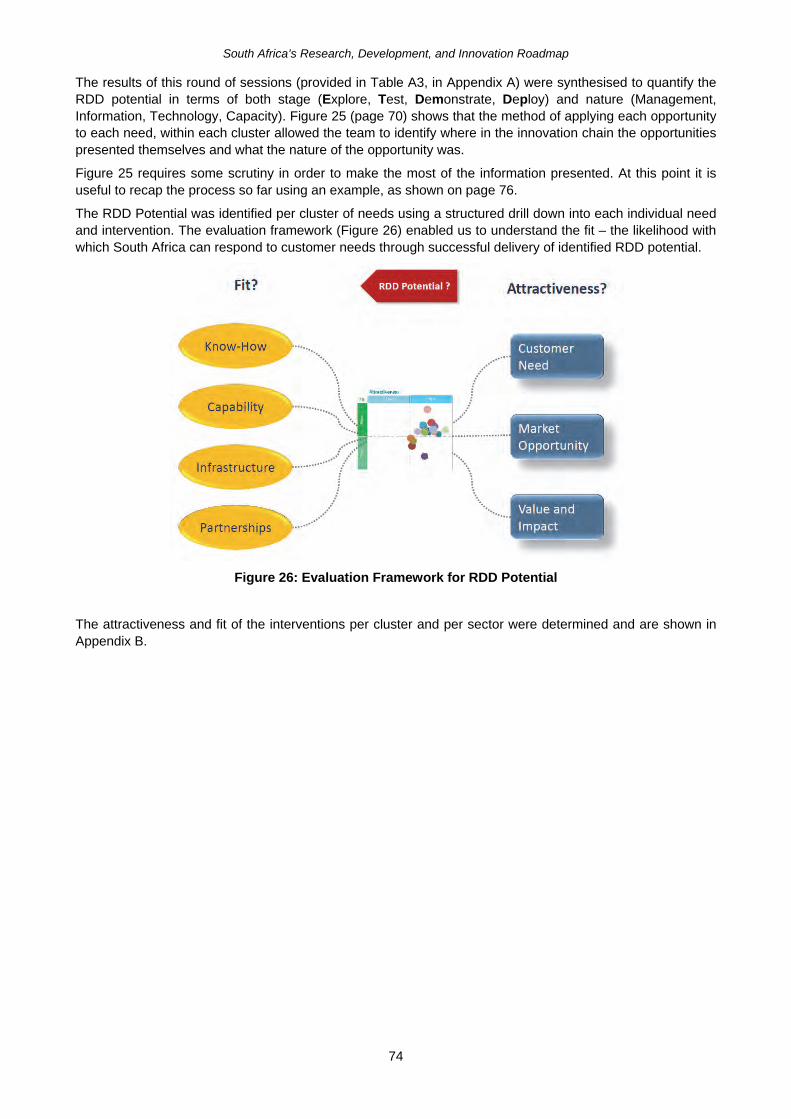
South Africa’s Research, Development, and Innovation Roadmap
74
The results of this round of sessions (provided in Table A3, in Appendix A) were synthesised to quantify the RDD potential in terms of both stage (Explore, Test, Demonstrate, Deploy) and nature (Management, Information, Technology, Capacity). Figure 25 (page 70) shows that the method of applying each opportunity to each need, within each cluster allowed the team to identify where in the innovation chain the opportunities presented themselves and what the nature of the opportunity was.
Figure 25 requires some scrutiny in order to make the most of the information presented. At this point it is useful to recap the process so far using an example, as shown on page 76.
The RDD Potential was identified per cluster of needs using a structured drill down into each individual need and intervention. The evaluation framework (Figure 26) enabled us to understand the fit – the likelihood with which South Africa can respond to customer needs through successful delivery of identified RDD potential.
Figure 26: Evaluation Framework for RDD Potential
The attractiveness and fit of the interventions per cluster and per sector were determined and are shown in Appendix B.
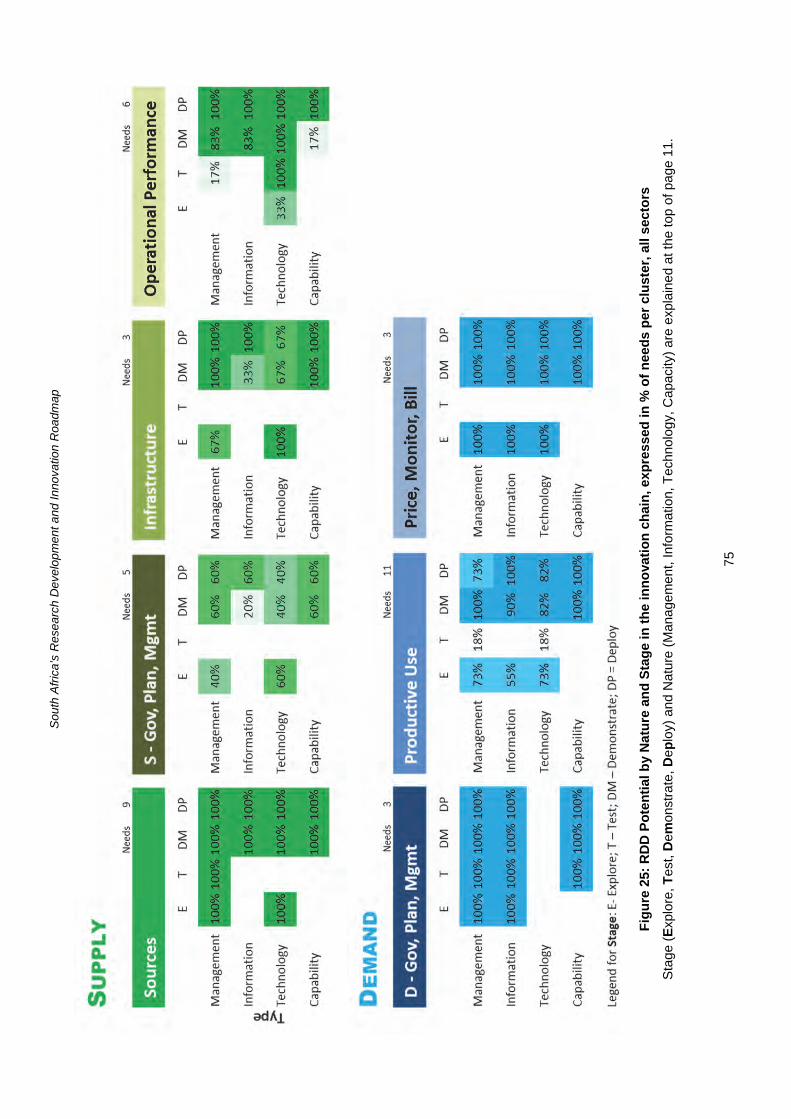
Sou
th A
fric
a’s
Res
ear
ch D
evel
op
men
t a
nd I
nnov
atio
n R
oadm
ap
75
Fig
ure
25:
RD
D P
ote
nti
al b
y N
atu
re a
nd
Sta
ge
in t
he
inn
ova
tio
n c
hai
n, e
xpre
ssed
in %
of
nee
ds
per
clu
ster
, all
sect
ors
Sta
ge (
Exp
lore
, Tes
t, D
emon
stra
te, D
eplo
y) a
nd N
atur
e (M
anag
emen
t, In
form
atio
n, T
echn
olog
y, C
apac
ity)
are
expl
aine
d at
the
top
of p
age
11.
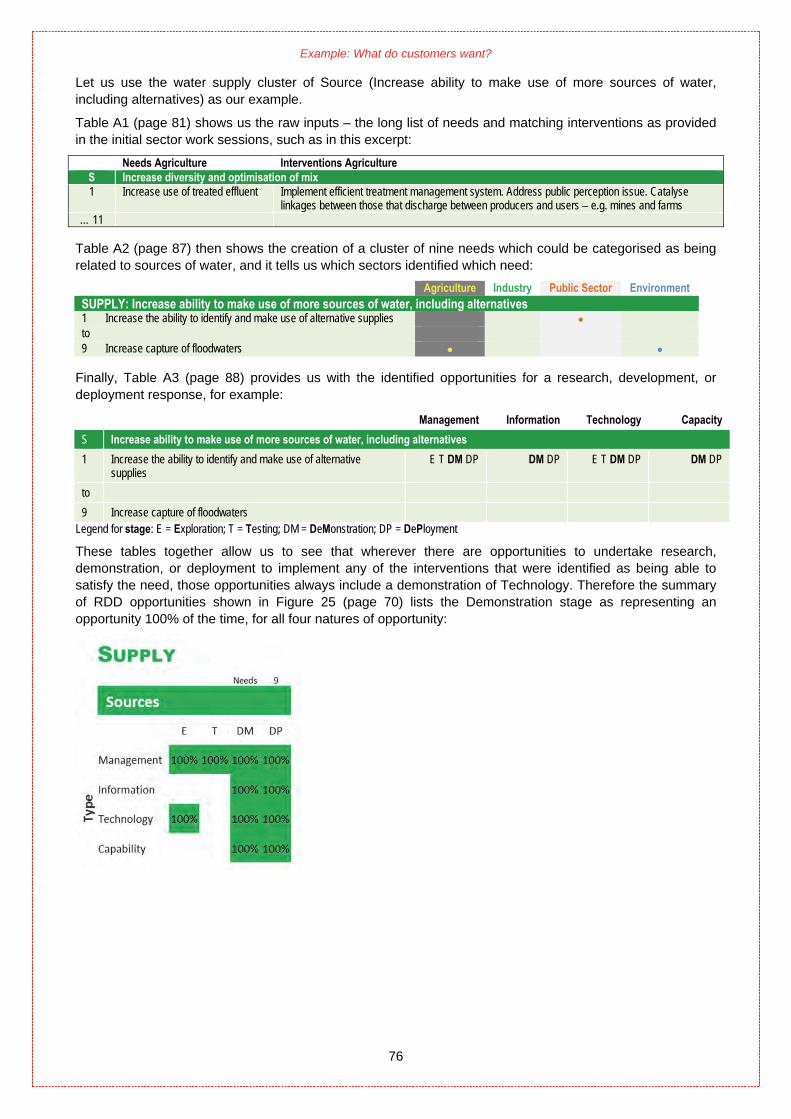
Example: What do customers want?
76
Let us use the water supply cluster of Source (Increase ability to make use of more sources of water, including alternatives) as our example.
Table A1 (page 81) shows us the raw inputs – the long list of needs and matching interventions as provided in the initial sector work sessions, such as in this excerpt:
Needs Agriculture Interventions AgricultureS Increase diversity and optimisation of mix 1 Increase use of treated effluent Implement efficient treatment management system. Address public perception issue. Catalyse
linkages between those that discharge between producers and users – e.g. mines and farms … 11
Table A2 (page 87) then shows the creation of a cluster of nine needs which could be categorised as being related to sources of water, and it tells us which sectors identified which need:
Agriculture Industry Public Sector EnvironmentSUPPLY: Increase ability to make use of more sources of water, including alternatives 1 Increase the ability to identify and make use of alternative supplies • to 9 Increase capture of floodwaters • •
Finally, Table A3 (page 88) provides us with the identified opportunities for a research, development, or deployment response, for example:
Management Information Technology Capacity
S Increase ability to make use of more sources of water, including alternatives
1 Increase the ability to identify and make use of alternative supplies
E T DM DP DM DP E T DM DP DM DP
to
9 Increase capture of floodwaters Legend for stage: E = Exploration; T = Testing; DM = DeMonstration; DP = DePloyment
These tables together allow us to see that wherever there are opportunities to undertake research, demonstration, or deployment to implement any of the interventions that were identified as being able to satisfy the need, those opportunities always include a demonstration of Technology. Therefore the summary of RDD opportunities shown in Figure 25 (page 70) lists the Demonstration stage as representing an opportunity 100% of the time, for all four natures of opportunity:

South Africa’s Research Development and Innovation Roadmap
77
4.2.2 Research capability mapping
Concurrently, the project team ran two questionnaires in order to map the existing capacity and capability of South African researchers. Individual and institutional questionnaires were designed and respondents asked to identify their relevant areas of expertise. The areas of expertise were defined both by the underlying academic discipline (e.g. microbiology) and the research focus area (RFA), or area of interest (e.g. potable water quality). The full list of RFAs is shown in Appendix C. The 106 unique RFAs (Table 22) were mapped onto the clusters by the WRC research managers (Appendix C). Questionnaire respondents who felt that their particular discipline or RFA was not already represented were able to select ‘Other’ and add their self-defined discipline or RFA.
Table 22: Taxonomy of Research Focus Areas (RFAs)
RFA no. RFA name 1 Agroforestry 2 Business efficiency 3 Crop production Genetics and Plant Breeding 4 Efficient agriculture 5 Food security and business efficiency 6 Horticulture 7 Improved food production 8 Irrigation and Drainage 9 Soil chemistry 10 Soil fertility 11 Soil management 12 Soil microbiology and biochemistry 13 Soil morphology and genesis 14 Soil physics 15 Animal, human, public, and environmental health Endocrinology 16 Ecosystem functioning 17 Wastewater treatment Microbiology and Chemistry 18 Animal, human, public, and environmental health Fate and behaviour of pollutants 19 Human health 20 Process automation and control – potable and waste water treatment 21 Wastewater treatment Bioinformatics 22 Environmental water quality 23 Environmental health and ecosystem functioning Remote sensing 24 Food security and business efficiency 25 Econometrics 26 Macroeconomics 27 Microeconomics 28 Applied economics 29 Computational economics 30 Economic modelling 31 Decision sciences 32 Entrepreneurship and Management 33 Technoeconomics 34 Insurance Mathematics and Economics 35 Forecasting and Game Theory 36 Behavioural finance 37 Business and Economic Statistics 38 Civil engineering aspects of water cycle 39 Wastewater and Potable water treatment Domestic 40 Treatment and distribution 41 Stormwater management 42 Water /wastewater and industrial Process optimisation 43 Wastewater and potable treatment Industrial 44 Mine water desalination
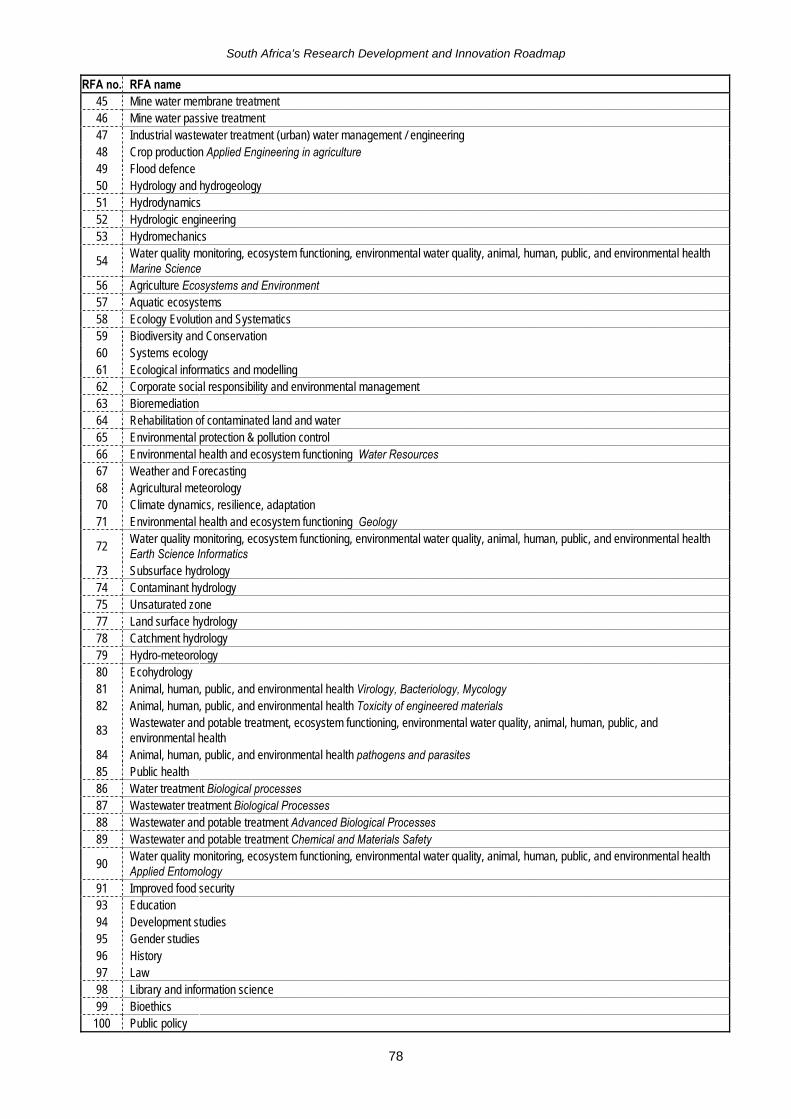
South Africa’s Research Development and Innovation Roadmap
78
RFA no. RFA name 45 Mine water membrane treatment 46 Mine water passive treatment 47 Industrial wastewater treatment (urban) water management / engineering 48 Crop production Applied Engineering in agriculture 49 Flood defence 50 Hydrology and hydrogeology 51 Hydrodynamics 52 Hydrologic engineering 53 Hydromechanics
54 Water quality monitoring, ecosystem functioning, environmental water quality, animal, human, public, and environmental health Marine Science
56 Agriculture Ecosystems and Environment 57 Aquatic ecosystems 58 Ecology Evolution and Systematics 59 Biodiversity and Conservation 60 Systems ecology 61 Ecological informatics and modelling 62 Corporate social responsibility and environmental management 63 Bioremediation 64 Rehabilitation of contaminated land and water 65 Environmental protection & pollution control 66 Environmental health and ecosystem functioning Water Resources 67 Weather and Forecasting 68 Agricultural meteorology 70 Climate dynamics, resilience, adaptation 71 Environmental health and ecosystem functioning Geology
72 Water quality monitoring, ecosystem functioning, environmental water quality, animal, human, public, and environmental health Earth Science Informatics
73 Subsurface hydrology 74 Contaminant hydrology 75 Unsaturated zone 77 Land surface hydrology 78 Catchment hydrology 79 Hydro-meteorology 80 Ecohydrology 81 Animal, human, public, and environmental health Virology, Bacteriology, Mycology 82 Animal, human, public, and environmental health Toxicity of engineered materials
83 Wastewater and potable treatment, ecosystem functioning, environmental water quality, animal, human, public, and environmental health
84 Animal, human, public, and environmental health pathogens and parasites 85 Public health 86 Water treatment Biological processes 87 Wastewater treatment Biological Processes 88 Wastewater and potable treatment Advanced Biological Processes 89 Wastewater and potable treatment Chemical and Materials Safety
90 Water quality monitoring, ecosystem functioning, environmental water quality, animal, human, public, and environmental health Applied Entomology
91 Improved food security 93 Education 94 Development studies 95 Gender studies 96 History 97 Law 98 Library and information science 99 Bioethics
100 Public policy
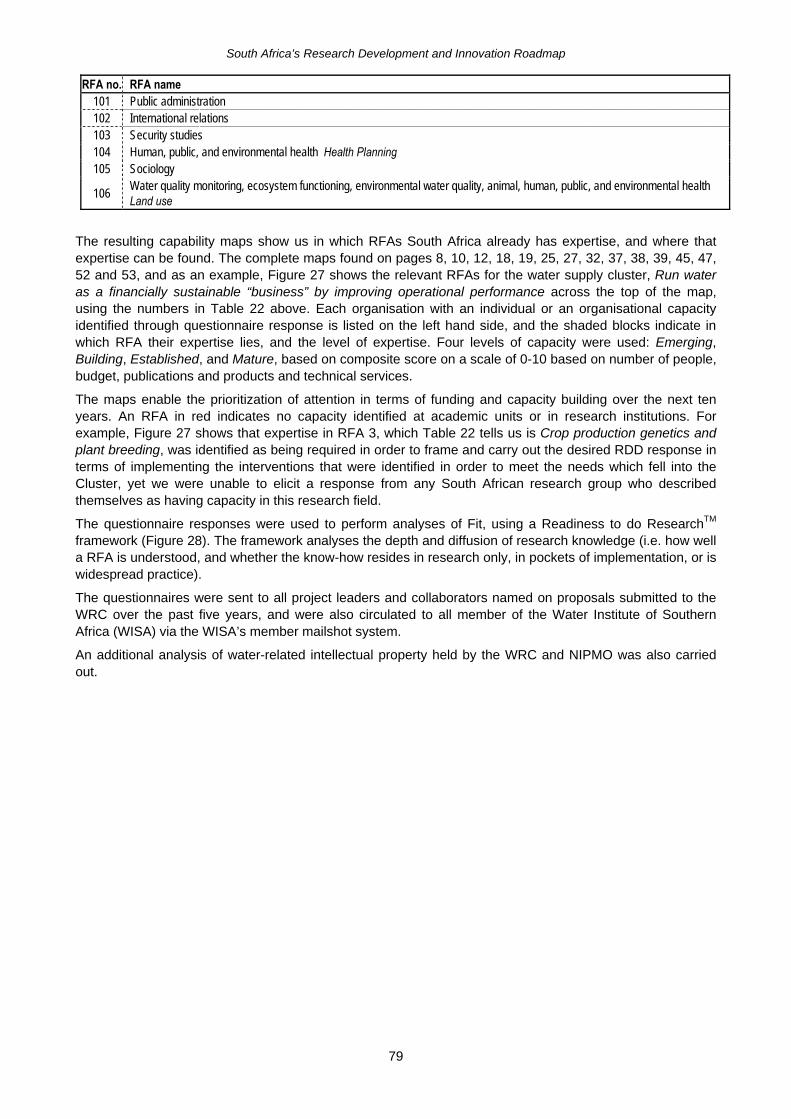
South Africa’s Research Development and Innovation Roadmap
79
RFA no. RFA name 101 Public administration 102 International relations 103 Security studies 104 Human, public, and environmental health Health Planning 105 Sociology
106 Water quality monitoring, ecosystem functioning, environmental water quality, animal, human, public, and environmental health Land use
The resulting capability maps show us in which RFAs South Africa already has expertise, and where that expertise can be found. The complete maps found on pages 8, 10, 12, 18, 19, 25, 27, 32, 37, 38, 39, 45, 47, 52 and 53, and as an example, Figure 27 shows the relevant RFAs for the water supply cluster, Run water as a financially sustainable “business” by improving operational performance across the top of the map, using the numbers in Table 22 above. Each organisation with an individual or an organisational capacity identified through questionnaire response is listed on the left hand side, and the shaded blocks indicate in which RFA their expertise lies, and the level of expertise. Four levels of capacity were used: Emerging, Building, Established, and Mature, based on composite score on a scale of 0-10 based on number of people, budget, publications and products and technical services.
The maps enable the prioritization of attention in terms of funding and capacity building over the next ten years. An RFA in red indicates no capacity identified at academic units or in research institutions. For example, Figure 27 shows that expertise in RFA 3, which Table 22 tells us is Crop production genetics and plant breeding, was identified as being required in order to frame and carry out the desired RDD response in terms of implementing the interventions that were identified in order to meet the needs which fell into the Cluster, yet we were unable to elicit a response from any South African research group who described themselves as having capacity in this research field.
The questionnaire responses were used to perform analyses of Fit, using a Readiness to do ResearchTM framework (Figure 28). The framework analyses the depth and diffusion of research knowledge (i.e. how well a RFA is understood, and whether the know-how resides in research only, in pockets of implementation, or is widespread practice).
The questionnaires were sent to all project leaders and collaborators named on proposals submitted to the WRC over the past five years, and were also circulated to all member of the Water Institute of Southern Africa (WISA) via the WISA’s member mailshot system.
An additional analysis of water-related intellectual property held by the WRC and NIPMO was also carried out.
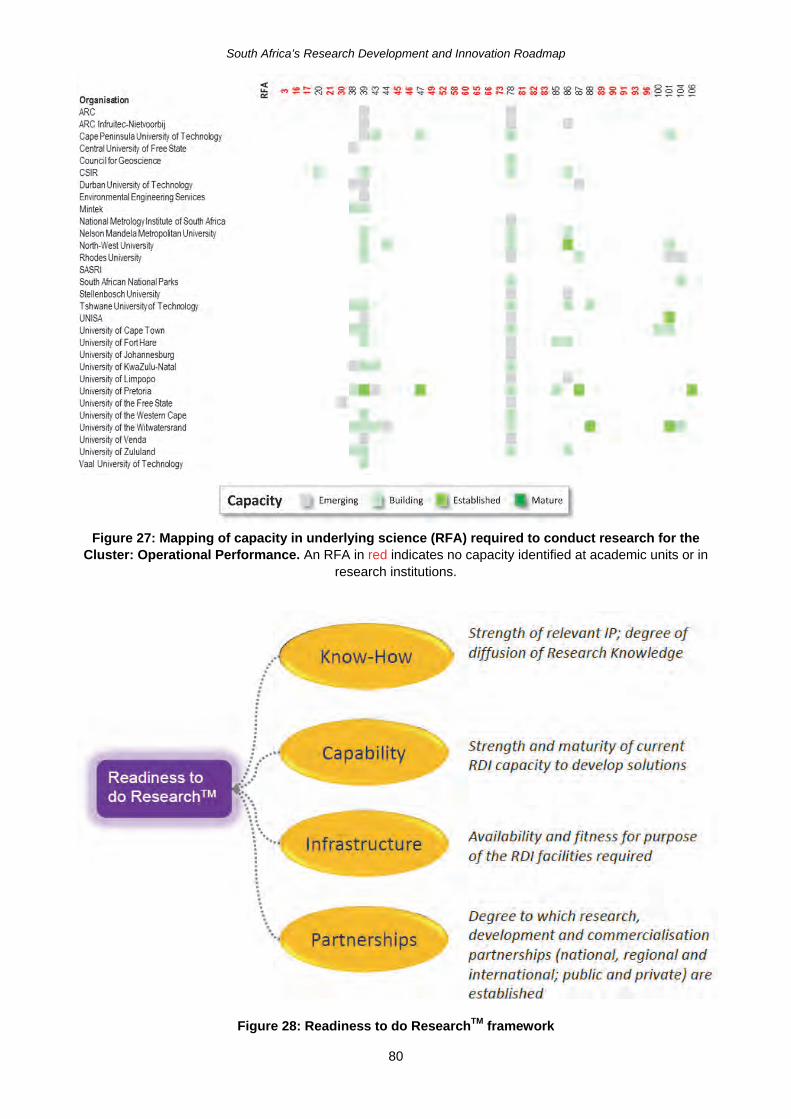
South Africa’s Research Development and Innovation Roadmap
80
Figure 27: Mapping of capacity in underlying science (RFA) required to conduct research for the Cluster: Operational Performance. An RFA in red indicates no capacity identified at academic units or in
research institutions.
Figure 28: Readiness to do ResearchTM framework
South Africa’s Research Development and Innovation Roadmap
81
The resulting data were summarised to indicate two sets of information, the extent of research knowledge diffusion into practice (Appendix D), and the country’s RDI capability (Appendix E). These were later used as the basis on which in identify real RDD opportunities that could be taken up, and the additional research capability required to be built in order to take up those opportunities.
4.2.3 Articulate strategic intent
The participants of the previous work sessions of the four sectors, along with stakeholders who had engaged with the WRC in workshops that preceding the RDI road map project, were invited to review the progress of the road map, and to help define its vision (i.e. ideal future state of affairs), mission (i.e. how the ideal state of affairs has come to pass), and the means by which the vision and mission could be accomplished.
The resulting consensus was:
Vision
South Africa leads the developing world in the development and deployment of water management practices and technologies. It competes with leading countries in providing sustainable solutions.
Mission
This has been achieved by means of a National Water RDD Programme focused on: delivery of at least one breakthrough technology every five years; increasing the number of small and medium sized enterprises (SMMEs) operating in the water sector; increasing access to water for rural communities, including provision of sanitation for all in a sustainable manner. Together, this creates significant economic, health, social and environmental benefit
Means
RDD contributes to achieving this Vision, via a focus on four key Objectives: 1. Increase the availability of water 2. Improve the governance, planning and management of supply and delivery 3. Operate water and sanitation services as a sustainable “business” 4. Increase the efficiency and productivity of water use
Three key RDD success factors are: 1. Faster, more comprehensive deployment of context-appropriate performance improvements 2. Stronger RDI capability and capacity 3. Focused export of SA know-how and technology
The four RDD Objectives distil and summarise the Needs and Interventions documented in Sections 4.1.2, and 4.1.3, and in Appendix A, and were further defined as:
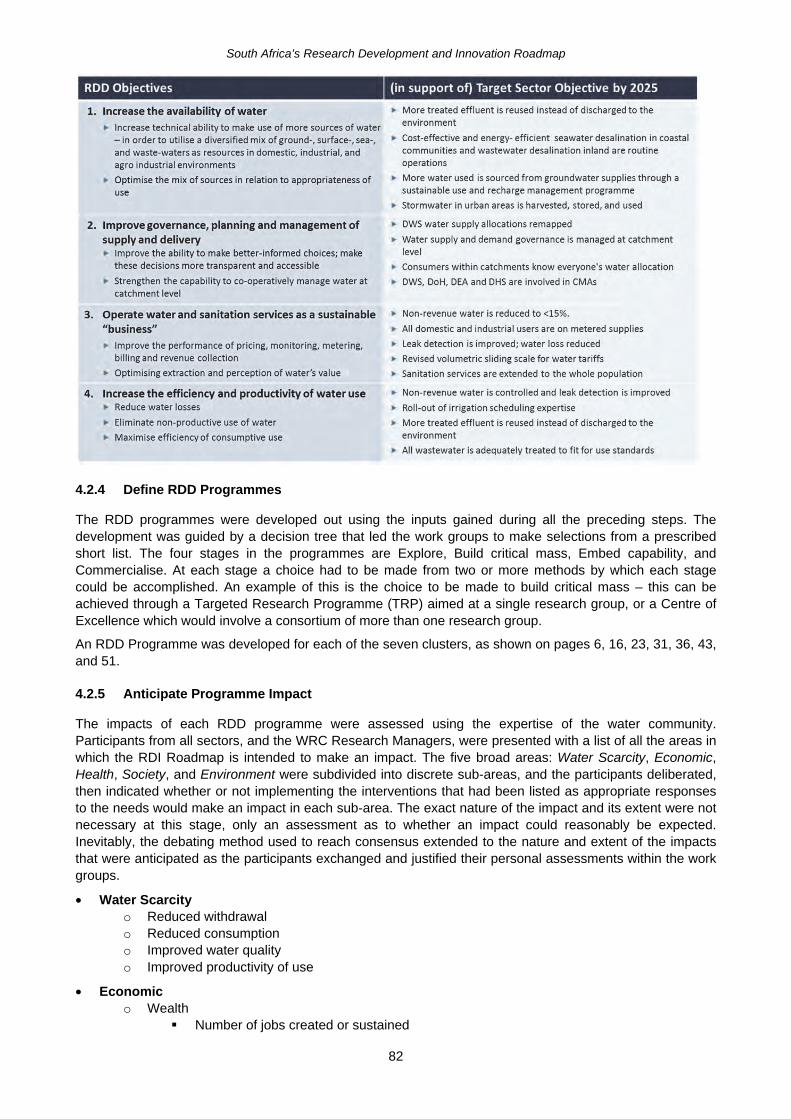
South Africa’s Research Development and Innovation Roadmap
82
4.2.4 Define RDD Programmes
The RDD programmes were developed out using the inputs gained during all the preceding steps. The development was guided by a decision tree that led the work groups to make selections from a prescribed short list. The four stages in the programmes are Explore, Build critical mass, Embed capability, and Commercialise. At each stage a choice had to be made from two or more methods by which each stage could be accomplished. An example of this is the choice to be made to build critical mass – this can be achieved through a Targeted Research Programme (TRP) aimed at a single research group, or a Centre of Excellence which would involve a consortium of more than one research group.
An RDD Programme was developed for each of the seven clusters, as shown on pages 6, 16, 23, 31, 36, 43, and 51.
4.2.5 Anticipate Programme Impact
The impacts of each RDD programme were assessed using the expertise of the water community. Participants from all sectors, and the WRC Research Managers, were presented with a list of all the areas in which the RDI Roadmap is intended to make an impact. The five broad areas: Water Scarcity, Economic, Health, Society, and Environment were subdivided into discrete sub-areas, and the participants deliberated, then indicated whether or not implementing the interventions that had been listed as appropriate responses to the needs would make an impact in each sub-area. The exact nature of the impact and its extent were not necessary at this stage, only an assessment as to whether an impact could reasonably be expected. Inevitably, the debating method used to reach consensus extended to the nature and extent of the impacts that were anticipated as the participants exchanged and justified their personal assessments within the work groups.
• Water Scarcity o Reduced withdrawal o Reduced consumption o Improved water quality o Improved productivity of use
• Economic o Wealth
Number of jobs created or sustained
South Africa’s Research Development and Innovation Roadmap
83
Number of new businesses created or sustained
o Productivity Increased product per drop (water use efficiency (WUE), tonnes/ ton of water) Increased crop yield per drop Reduce down-time (e.g. caused by maintenance)
o Revenue Increased average revenues per unit product and per m3 delivered Increased average revenue per producer (e.g. farmer, ecosystem, environment)
o Cost reduction Decreased water footprint per unit produced Reduced material inputs (and cost) Reduced energy inputs (and cost) Reduced labour requirement (and cost) Reduced cost of healthcare
o Investment Reduced capex requirements Reduced maintenance costs
• Health o Reduced incidence of water-borne sickness and disease o Reduced incidence of sickness and disease from air pollution o Reduced incidence of sickness and disease from chemical contaminants o Reduced absenteeism and early retirement – through increased wellness o Reduced mortality rate
• Society o Improved availability and quality of environmental goods and services o Increased food security – livestock, crops o Reduced loss of animals o Increased school attendance (driven by access and quality) and improved educational outcomes o Improved relations between all suppliers and consumers in a catchment (e.g. WUAs and
farmers) o Satisfaction of rights and demands of those without access to water o Reduced environmental debt o Raised awareness of the value of water, driving increased willingness to pay
• Environment o Reduction in carbon emissions o Reduction in area of salinised land o Reduced levels of groundwater contamination o Reduced cost of treating process water and potable water o Reduced contamination of surface water o Reduced downstream pollution o Reduced levels of soil erosion o Reduced or reversed decline in biodiversity o Preservation of riverine habitants o Improved health of terrestrial environment
The results of the impact assessment are shown in Appendix F, and they have been summarised per cluster on pages 5, 15, 22, 30, 35, 42, and 50..
4.3 SETTING UP TO DELIVER SUCCESS
This last stage of the roadmapping process was the stage in which all of the diverse and numerous data gathered during the steps 2 to 9 in Figure 24 (p. 60) were collated and related to one another. The results have already been presented in sections 2.2 to 2.8, so the following sections merely serve to explain the methodology, and not to present the results.
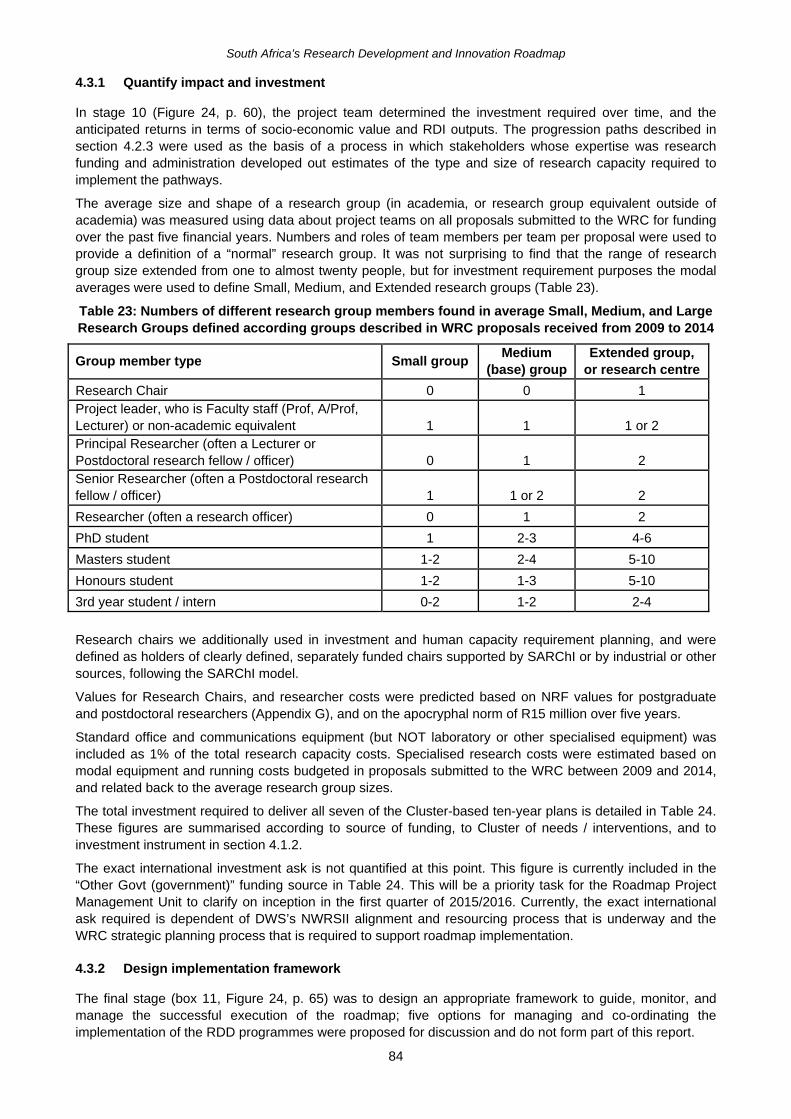
South Africa’s Research Development and Innovation Roadmap
84
4.3.1 Quantify impact and investment
In stage 10 (Figure 24, p. 60), the project team determined the investment required over time, and the anticipated returns in terms of socio-economic value and RDI outputs. The progression paths described in section 4.2.3 were used as the basis of a process in which stakeholders whose expertise was research funding and administration developed out estimates of the type and size of research capacity required to implement the pathways.
The average size and shape of a research group (in academia, or research group equivalent outside of academia) was measured using data about project teams on all proposals submitted to the WRC for funding over the past five financial years. Numbers and roles of team members per team per proposal were used to provide a definition of a “normal” research group. It was not surprising to find that the range of research group size extended from one to almost twenty people, but for investment requirement purposes the modal averages were used to define Small, Medium, and Extended research groups (Table 23).
Table 23: Numbers of different research group members found in average Small, Medium, and Large Research Groups defined according groups described in WRC proposals received from 2009 to 2014
Group member type Small group Medium
(base) group Extended group,
or research centre
Research Chair 0 0 1 Project leader, who is Faculty staff (Prof, A/Prof, Lecturer) or non-academic equivalent 1 1 1 or 2 Principal Researcher (often a Lecturer or Postdoctoral research fellow / officer) 0 1 2 Senior Researcher (often a Postdoctoral research fellow / officer) 1 1 or 2 2
Researcher (often a research officer) 0 1 2
PhD student 1 2-3 4-6
Masters student 1-2 2-4 5-10
Honours student 1-2 1-3 5-10
3rd year student / intern 0-2 1-2 2-4
Research chairs we additionally used in investment and human capacity requirement planning, and were defined as holders of clearly defined, separately funded chairs supported by SARChI or by industrial or other sources, following the SARChI model.
Values for Research Chairs, and researcher costs were predicted based on NRF values for postgraduate and postdoctoral researchers (Appendix G), and on the apocryphal norm of R15 million over five years.
Standard office and communications equipment (but NOT laboratory or other specialised equipment) was included as 1% of the total research capacity costs. Specialised research costs were estimated based on modal equipment and running costs budgeted in proposals submitted to the WRC between 2009 and 2014, and related back to the average research group sizes.
The total investment required to deliver all seven of the Cluster-based ten-year plans is detailed in Table 24. These figures are summarised according to source of funding, to Cluster of needs / interventions, and to investment instrument in section 4.1.2.
The exact international investment ask is not quantified at this point. This figure is currently included in the “Other Govt (government)” funding source in Table 24. This will be a priority task for the Roadmap Project Management Unit to clarify on inception in the first quarter of 2015/2016. Currently, the exact international ask required is dependent of DWS’s NWRSII alignment and resourcing process that is underway and the WRC strategic planning process that is required to support roadmap implementation.
4.3.2 Design implementation framework
The final stage (box 11, Figure 24, p. 65) was to design an appropriate framework to guide, monitor, and manage the successful execution of the roadmap; five options for managing and co-ordinating the implementation of the RDD programmes were proposed for discussion and do not form part of this report.
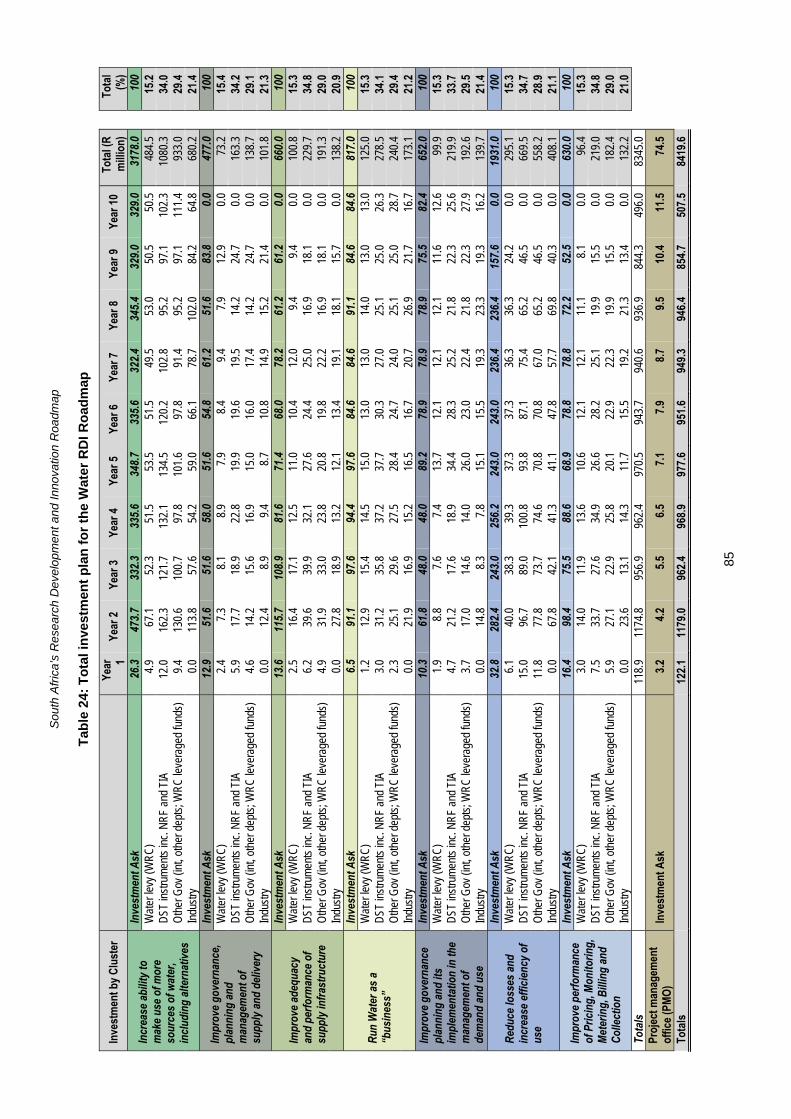
Sou
th A
fric
a’s
Res
ear
ch D
evel
op
men
t and
Inno
vatio
n R
oadm
ap
85
Tab
le 2
4: T
ota
l in
vest
men
t p
lan
fo
r th
e W
ater
RD
I Ro
adm
ap
Inve
stm
ent b
y C
lust
er
Ye
ar 1
Year
2
Year
3
Year
4
Year
5
Year
6
Year
7
Year
8
Year
9
Year
10
Tota
l (R
m
illio
n)
To
tal
(%)
Incr
ease
abilit
y to
mak
e use
of m
ore
sour
ces o
f wat
er,
inclu
ding
alte
rnat
ives
Inve
stm
ent A
sk
26.3
473.7
332.3
335.6
34
8.733
5.632
2.434
5.432
9.032
9.031
78.0
100
Wat
er le
vy (W
RC
) 4.
967
.152
.351
.5
53.5
51.5
49.5
53.0
50.5
50.5
484.
5 15
.2
DST
inst
rum
ents
inc.
NR
F an
d TI
A12
.016
2.3
121.
713
2.1
134.
512
0.2
102.
895
.297
.110
2.3
1080
.3
34.0
O
ther
Gov
(int
, oth
er d
epts
; WR
C le
vera
ged
fund
s)9.
413
0.6
100.
797
.8
101.
697
.891
.495
.297
.111
1.4
933.
0 29
.4
Indu
stry
0.0
113.
857
.654
.2
59.0
66.1
78.7
102.
084
.264
.868
0.2
21.4
Impr
ove g
over
nanc
e, pl
anni
ng an
d m
anag
emen
t of
supp
ly an
d de
liver
y
Inve
stm
ent A
sk
12.9
51.6
51.6
58.0
51.6
54.8
61.2
51.6
83.8
0.047
7.0
100
Wat
er le
vy (W
RC
) 2.
47.
38.
18.
9 7.
98.
49.
47.
912
.90.
073
.2
15.4
D
ST in
stru
men
ts in
c. N
RF
and
TIA
5.9
17.7
18.9
22.8
19
.919
.619
.514
.224
.70.
016
3.3
34.2
O
ther
Gov
(int
, oth
er d
epts
; WR
C le
vera
ged
fund
s)4.
614
.215
.616
.9
15.0
16.0
17.4
14.2
24.7
0.0
138.
7 29
.1
Indu
stry
0.0
12.4
8.9
9.4
8.7
10.8
14.9
15.2
21.4
0.0
101.
8 21
.3
Impr
ove a
dequ
acy
and
perfo
rman
ce o
f su
pply
infra
stru
ctur
e
Inve
stm
ent A
sk
13.6
115.7
108.9
81.6
71.4
68.0
78.2
61.2
61.2
0.066
0.0
100
Wat
er le
vy (W
RC
) 2.
516
.417
.112
.5
11.0
10.4
12.0
9.4
9.4
0.0
100.
8 15
.3
DST
inst
rum
ents
inc.
NR
F an
d TI
A6.
239
.639
.932
.1
27.6
24.4
25.0
16.9
18.1
0.0
229.
7 34
.8
Oth
er G
ov (i
nt, o
ther
dep
ts; W
RC
leve
rage
d fu
nds)
4.9
31.9
33.0
23.8
20
.819
.822
.216
.918
.10.
019
1.3
29.0
In
dust
ry0.
027
.818
.913
.2
12.1
13.4
19.1
18.1
15.7
0.0
138.
2 20
.9
Run
Wat
er as
a “b
usin
ess”
Inve
stm
ent A
sk
6.591
.197
.694
.4 97
.684
.684
.691
.184
.684
.681
7.0
100
Wat
er le
vy (W
RC
) 1.
212
.915
.414
.5
15.0
13.0
13.0
14.0
13.0
13.0
125.
0 15
.3
DST
inst
rum
ents
inc.
NR
F an
d TI
A3.
031
.235
.837
.2
37.7
30.3
27.0
25.1
25.0
26.3
278.
5 34
.1
Oth
er G
ov (i
nt, o
ther
dep
ts; W
RC
leve
rage
d fu
nds)
2.3
25.1
29.6
27.5
28
.424
.724
.025
.125
.028
.724
0.4
29.4
In
dust
ry0.
021
.916
.915
.2
16.5
16.7
20.7
26.9
21.7
16.7
173.
1 21
.2
Impr
ove g
over
nanc
e pl
anni
ng an
d its
im
plem
enta
tion
in th
e m
anag
emen
t of
dem
and
and
use
Inve
stm
ent A
sk
10.3
61.8
48.0
48.0
89.2
78.9
78.9
78.9
75.5
82.4
652.0
10
0 W
ater
levy
(WR
C)
1.9
8.8
7.6
7.4
13.7
12.1
12.1
12.1
11.6
12.6
99.9
15
.3
DST
inst
rum
ents
inc.
NR
F an
d TI
A4.
721
.217
.618
.9
34.4
28.3
25.2
21.8
22.3
25.6
219.
9 33
.7
Oth
er G
ov (i
nt, o
ther
dep
ts; W
RC
leve
rage
d fu
nds)
3.7
17.0
14.6
14.0
26
.023
.022
.421
.822
.327
.919
2.6
29.5
In
dust
ry0.
014
.88.
37.
8 15
.115
.519
.323
.319
.316
.213
9.7
21.4
Redu
ce lo
sses
and
incr
ease
effic
iency
of
use
Inve
stm
ent A
sk
32.8
282.4
243.0
256.2
24
3.024
3.023
6.423
6.415
7.60.0
1931
.0 10
0 W
ater
levy
(WR
C)
6.1
40.0
38.3
39.3
37
.337
.336
.336
.324
.20.
029
5.1
15.3
D
ST in
stru
men
ts in
c. N
RF
and
TIA
15.0
96.7
89.0
100.
8 93
.887
.175
.465
.246
.50.
066
9.5
34.7
O
ther
Gov
(int
, oth
er d
epts
; WR
C le
vera
ged
fund
s)11
.877
.873
.774
.6
70.8
70.8
67.0
65.2
46.5
0.0
558.
2 28
.9
Indu
stry
0.0
67.8
42.1
41.3
41
.147
.857
.769
.840
.30.
040
8.1
21.1
Impr
ove p
erfo
rman
ce
of P
ricin
g, M
onito
ring,
Me
terin
g, B
illing
and
Colle
ctio
n
Inve
stm
ent A
sk
16.4
98.4
75.5
88.6
68.9
78.8
78.8
72.2
52.5
0.063
0.0
100
Wat
er le
vy (W
RC
) 3.
014
.011
.913
.6
10.6
12.1
12.1
11.1
8.1
0.0
96.4
15
.3
DST
inst
rum
ents
inc.
NR
F an
d TI
A7.
533
.727
.634
.9
26.6
28.2
25.1
19.9
15.5
0.0
219.
0 34
.8
Oth
er G
ov (i
nt, o
ther
dep
ts; W
RC
leve
rage
d fu
nds)
5.9
27.1
22.9
25.8
20
.122
.922
.319
.915
.50.
018
2.4
29.0
In
dust
ry0.
023
.613
.114
.3
11.7
15.5
19.2
21.3
13.4
0.0
132.
2 21
.0
Tota
ls 11
8.9
1174
.895
6.9
962.
4 97
0.5
943.
794
0.6
936.
984
4.3
496.
083
45.0
Proj
ect m
anag
emen
t of
fice
(PM
O)
Inve
stm
ent A
sk
3.2
4.2
5.5
6.5
7.1
7.9
8.7
9.5
10.4
11
.5
74.5
Tota
ls
122.
111
79.0
962.
496
8.9
977.
695
1.6
949.
394
6.4
854.
750
7.5
8419
.6
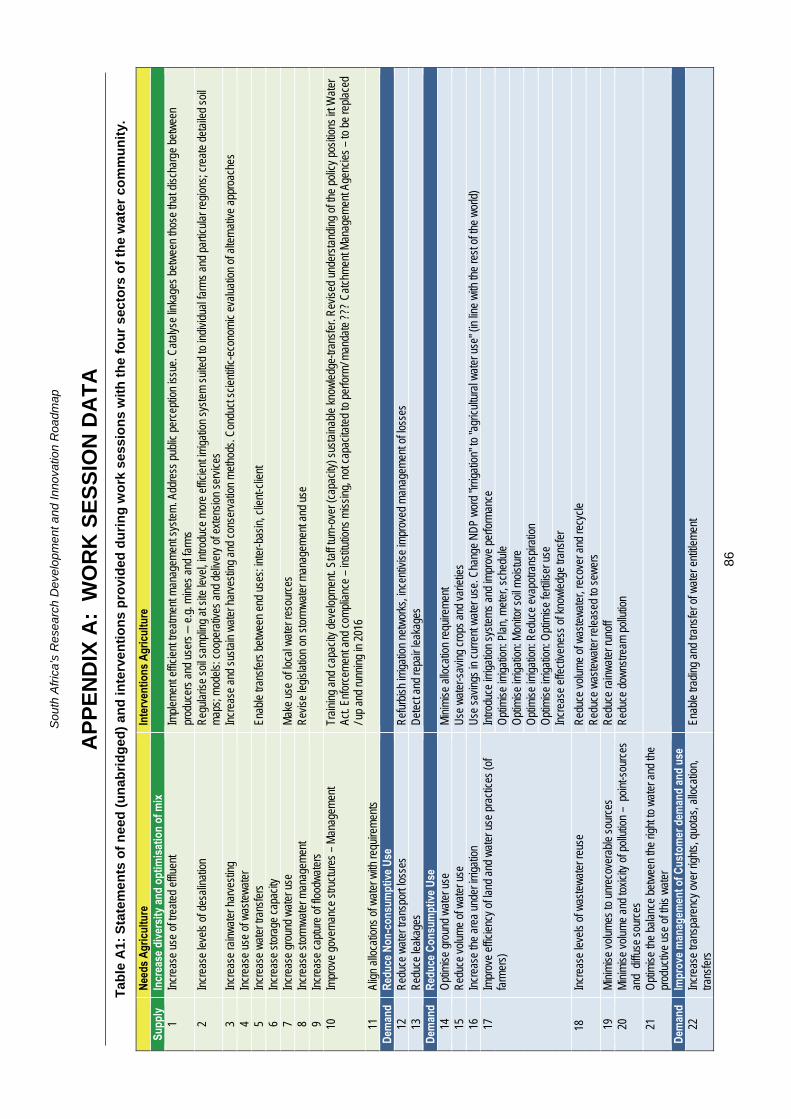
Sou
th A
fric
a’s
Res
ear
ch D
evel
op
men
t and
Inno
vatio
n R
oadm
ap
86
AP
PE
ND
IX A
: W
OR
K S
ES
SIO
N D
AT
A
Tab
le A
1: S
tate
men
ts o
f n
eed
(u
nab
rid
ged
) an
d in
terv
enti
on
s p
rovi
ded
du
rin
g w
ork
ses
sio
ns
wit
h t
he
fou
r se
cto
rs o
f th
e w
ater
co
mm
un
ity.
N
eeds
Agr
icul
ture
Inte
rven
tions
Agr
icul
ture
Supp
ly
Incr
ease
div
ersi
ty a
nd o
ptim
isat
ion
of m
ix
1 In
crea
se u
se o
f tre
ated
effl
uent
Im
plem
ent e
ffici
ent t
reat
men
t man
agem
ent s
yste
m. A
ddre
ss p
ublic
per
cept
ion
issu
e. C
atal
yse
linka
ges
betw
een
thos
e th
at d
isch
arge
bet
wee
n pr
oduc
ers
and
user
s –
e.g.
min
es a
nd fa
rms
2 In
crea
se le
vels
of d
esal
inat
ion
Reg
ular
ise
soil
sam
plin
g at
site
leve
l, in
trodu
ce m
ore
effic
ient
irrig
atio
n sy
stem
sui
ted
to in
divi
dual
farm
s an
d pa
rticu
lar r
egio
ns; c
reat
e de
taile
d so
il m
aps;
mod
els:
coo
pera
tives
and
del
iver
y of
ext
ensi
on s
ervi
ces
3
Incr
ease
rain
wat
er h
arve
stin
g
Incr
ease
and
sus
tain
wat
er h
arve
stin
g an
d co
nser
vatio
n m
etho
ds. C
ondu
ct s
cien
tific
-eco
nom
ic e
valu
atio
n of
alte
rnat
ive
appr
oach
es
4 In
crea
se u
se o
f was
tew
ater
5
Incr
ease
wat
er tr
ansf
ers
En
able
tran
sfer
s be
twee
n en
d us
es: i
nter
-bas
in, c
lient
-clie
nt
6 In
crea
se s
tora
ge c
apac
ity
7 In
crea
se g
roun
d w
ater
use
M
ake
use
of lo
cal w
ater
reso
urce
s8
Incr
ease
sto
rmw
ater
man
agem
ent
Rev
ise
legi
slat
ion
on s
torm
wat
er m
anag
emen
t and
use
9
Incr
ease
cap
ture
of f
lood
wat
ers
10
Impr
ove
gove
rnan
ce s
truct
ures
– M
anag
emen
tTr
aini
ng a
nd c
apac
ity d
evel
opm
ent.
Staf
f tur
n-ov
er (c
apac
ity) s
usta
inab
le k
now
ledg
e-tra
nsfe
r. R
evis
ed u
nder
stan
ding
of th
e po
licy
posi
tions
irt W
ater
Ac
t. En
forc
emen
t and
com
plia
nce
– in
stitu
tions
mis
sing
, not
cap
acita
ted
to p
erfo
rm/ m
anda
te ?
?? C
atch
men
t Man
agem
ent A
genc
ies
– to
be
repl
aced
/ u
p an
d ru
nnin
g in
201
6 11
Al
ign
allo
catio
ns o
f wat
er w
ith re
quire
men
ts
Dem
and
Red
uce
Non
-con
sum
ptiv
e U
se
12
Red
uce
wat
er tr
ansp
ort l
osse
s R
efur
bish
irrig
atio
n ne
twor
ks, i
ncen
tivis
e im
prov
ed m
anag
emen
t of l
osse
s13
R
educ
e le
akag
esD
etec
t and
repa
ir le
akag
esD
eman
d R
educ
e C
onsu
mpt
ive
Use
14
O
ptim
ise
grou
nd w
ater
use
M
inim
ise
allo
catio
n re
quire
men
t15
R
educ
e vo
lum
e of
wat
er u
se
Use
wat
er-s
avin
g cr
ops
and
varie
ties
16
Incr
ease
the
area
und
er ir
rigat
ion
U
se s
avin
gs in
cur
rent
wat
er u
se. C
hang
e N
DP
wor
d "ir
rigat
ion"
to "a
gric
ultu
ral w
ater
use
" (in
line
with
the
rest
oft
he w
orld
)17
Impr
ove
effic
ienc
y of
land
and
wat
er u
se p
ract
ices
(of
farm
ers)
In
trodu
ce ir
rigat
ion
syst
ems
and
impr
ove
perfo
rman
ce
Opt
imis
e irr
igat
ion:
Pla
n, m
eter
, sch
edul
eO
ptim
ise
irrig
atio
n: M
onito
r soi
l moi
stur
eO
ptim
ise
irrig
atio
n: R
educ
e ev
apot
rans
pira
tion
Opt
imis
e irr
igat
ion:
Opt
imis
e fe
rtilis
er u
seIn
crea
se e
ffect
iven
ess
of k
now
ledg
e tra
nsfe
r
18
Incr
ease
leve
ls o
f was
tew
ater
reus
e
Red
uce
volu
me
of w
aste
wat
er, r
ecov
er a
nd re
cycl
e R
educ
e w
aste
wat
er re
leas
edto
sew
ers
19
Min
imis
e vo
lum
es to
unr
ecov
erab
le s
ourc
es
Red
uce
rain
wat
er ru
noff
20
Min
imis
e vo
lum
e an
d to
xici
ty o
f pol
lutio
n –
poi
nt-s
ourc
es
and
diff
use
sour
ces
Red
uce
dow
nstre
am p
ollu
tion
21
Opt
imis
e th
e ba
lanc
e be
twee
n th
e rig
ht to
wat
er a
nd th
e pr
oduc
tive
use
of th
is w
ater
D
eman
d Im
prov
e m
anag
emen
t of C
usto
mer
dem
and
and
use
22
Incr
ease
tran
spar
ency
ove
r rig
hts,
quo
tas,
allo
catio
n,
trans
fers
En
able
trad
ing
and
trans
fer o
f wat
er e
ntitl
emen
t

Sou
th A
fric
a’s
Res
ear
ch D
evel
op
men
t and
Inno
vatio
n R
oadm
ap
87
N
eeds
Agr
icul
ture
Inte
rven
tions
Agr
icul
ture
23
Impr
ove
qual
ity a
nd e
ffect
iven
ess
of c
onte
xt o
f pla
nnin
g an
d im
plem
enta
tion
En
able
wat
er o
rder
ing,
impr
ove
man
agem
ent o
f dis
tribu
tion
24
Impr
ove
equi
ty o
f pric
ing,
enc
oura
ge d
esira
ble
prac
tice
Intro
duce
tarif
fs a
nd in
cent
ives
("re
al c
ost"
of w
ater
); en
forc
e qu
otas
25
Impr
ove
accu
racy
: use
mon
itorin
g, b
illing
and
m
anag
emen
t In
crea
se c
over
age,
acc
urac
y of
flow
mon
itorin
g, a
ttrib
utio
n; in
trodu
ce m
anag
emen
t sys
tem
s
26
Red
uce
leve
ls o
f unm
eter
ed w
ater
use
D
etec
t and
rem
ove
unm
eter
ed s
uppl
ies;
ens
ure
met
ers
are
oper
atin
g27
In
crea
se e
ffect
iven
ess
of c
ross
-sec
tora
l pla
nnin
g an
d im
plem
enta
tion
(e.g
. wat
ersh
ed)
28
Red
uce
impe
dim
ents
to im
plem
enta
tion
N
eeds
Indu
stry
Inte
rven
tions
Indu
stry
Supp
ly
Incr
ease
div
ersi
ty a
nd o
ptim
isat
ion
of m
ix
1 In
crea
se u
se o
f tre
ated
effl
uent
R
educ
e co
st o
f effl
uent
trea
tmen
t2
Incr
ease
leve
ls o
f des
alin
atio
n
R
educ
e en
ergy
requ
irem
ent a
nd m
ater
ial c
osts
. Inc
reas
e re
clam
atio
n.3
Incr
ease
rain
wat
er h
arve
stin
g
Ince
ntiv
ise
adop
tion.
Use
all
hard
sur
face
s; s
epar
ate
rain
wat
er a
nd p
ollu
ted
wat
er4
Incr
ease
use
of w
aste
wat
er
Inte
grat
e ag
ricul
ture
and
ene
rgy
prod
uctio
n5
Incr
ease
wat
er tr
ansf
ers
Enab
le e
asie
r tra
nsfe
r bet
wee
n us
es a
nd u
sers
. Ena
ble
trans
fers
bet
wee
n en
d us
es: i
nter
-bas
in, c
lient
-clie
nt6
Incr
ease
ada
ptab
ility
of s
tora
ge c
apac
ity
Suita
bilit
y, a
vaila
bilit
y, c
apac
ity, f
lexi
bilit
y. A
dd ta
nks,
man
-mad
e da
ms,
und
ergr
ound
or a
ltern
ativ
e st
orag
e (e
.g.i
n m
inin
g vo
id)
7 In
crea
se g
roun
d w
ater
use
Id
entif
y gr
ound
wat
er s
ourc
es, y
ield
s an
d us
es8
Incr
ease
sto
rmw
ater
har
vest
ing
and
man
agem
ent
Ince
ntiv
ise
broa
der a
dopt
ion
and
upta
ke; S
epar
ate
clea
n an
d di
rty (C
SO)
9 In
crea
se c
aptu
re o
f flo
odw
ater
s
10
In
crea
se p
rote
ctio
n of
exi
stin
g ec
olog
ical
infra
stru
ctur
eR
ehab
ilitat
ion
and
prot
ectio
n. In
crea
se a
war
enes
s; i
mpr
ove
mon
itorin
g an
d ev
alua
tion
11
Incr
ease
the
relia
bilit
y of
the
infra
stru
ctur
e Im
prov
e pe
rform
ance
of p
lann
ing
desi
gn, o
pera
tions
and
mai
nten
ance
12
Incr
ease
eco
logi
cal t
reat
men
t Im
prov
e pe
rform
ance
of a
ltern
ativ
es,r
elat
ive
to c
urre
nt s
olut
ions
(and
per
cept
ion)
13
Impr
ove
the
relia
bilit
yof
bul
k su
pply
En
able
coo
pera
tive
solu
tion
deve
lopm
ent a
nd im
plem
enta
tion
14
Incr
ease
wat
er q
ualit
y be
twee
n us
es
Enab
le m
ore
effe
ctiv
e an
d in
tegr
ated
pro
cess
es–
incr
ease
com
pete
nce
and
capa
city
15
Incr
ease
tran
spar
ency
ove
r rig
hts,
quo
tas,
allo
catio
n,
trans
fers
(at a
sys
tem
leve
l) D
eman
d R
educ
e N
on-c
onsu
mpt
ive
Use
16
R
educ
e w
ater
tran
spor
t los
ses
Min
imis
e w
ater
tank
ove
rflow
s an
d bu
lk s
uppl
y lo
sses
; pro
tect
tran
smis
sion
aga
inst
cor
rosi
on17
R
educ
e le
akag
es a
nd e
vapo
rativ
e lo
sses
Im
plem
ent p
reve
ntiv
e m
aint
enan
ce p
lans
; Int
rodu
ce m
onito
ring
and
early
war
ning
sys
tem
sD
eman
d R
educ
e C
onsu
mpt
ive
Use
18
M
inim
ise
grou
nd w
ater
abs
tract
ion
(ulti
mat
ely
to z
ero)
Min
imis
e de
man
d on
sup
plie
r (e.
g. m
unic
ipal
ity).
Red
uce
rain
wat
er ru
noff,
enf
orce
use
of g
roun
dwat
er re
sour
ces
Min
imis
e gr
ound
wat
er a
bstra
ctio
n (u
ltim
atel
y to
zer
o)
19
Red
uce
volu
me
of w
ater
use
, av
oid
the
need
for w
ater
Min
imis
e w
ater
use
, app
licat
ion
and
loss
es in
prim
ary
proc
esse
sPr
imar
y: A
void
use
of w
ater
(e.g
. opt
imis
ed o
r new
no-
wat
er p
roce
sses
)An
cilla
ry: R
ecov
er c
onde
nsat
e. R
educ
e st
eam
leak
age.
D
omes
tic: M
anag
e w
ater
pre
ssur
ePr
oduc
t wat
er20
Im
prov
e ef
ficie
ncy
of w
ater
use
R
educ
e w
ater
use
in a
ncilla
ry p
roce
sses
Red
uce
dem
and
for d
omes
tic w
ater
21
Incr
ease
leve
ls o
f was
tew
ater
reus
e In
crea
se k
now
ledg
e an
d sh
arin
g of
bes
t pra
ctic
esR
ecov
er a
nd re
cycl
e–
at a
ccep
tabl
e co
stR
ecov
er a
nd re
cycl
e pr
oces
s, d
omes
tic a
nd w
aste
wat
er
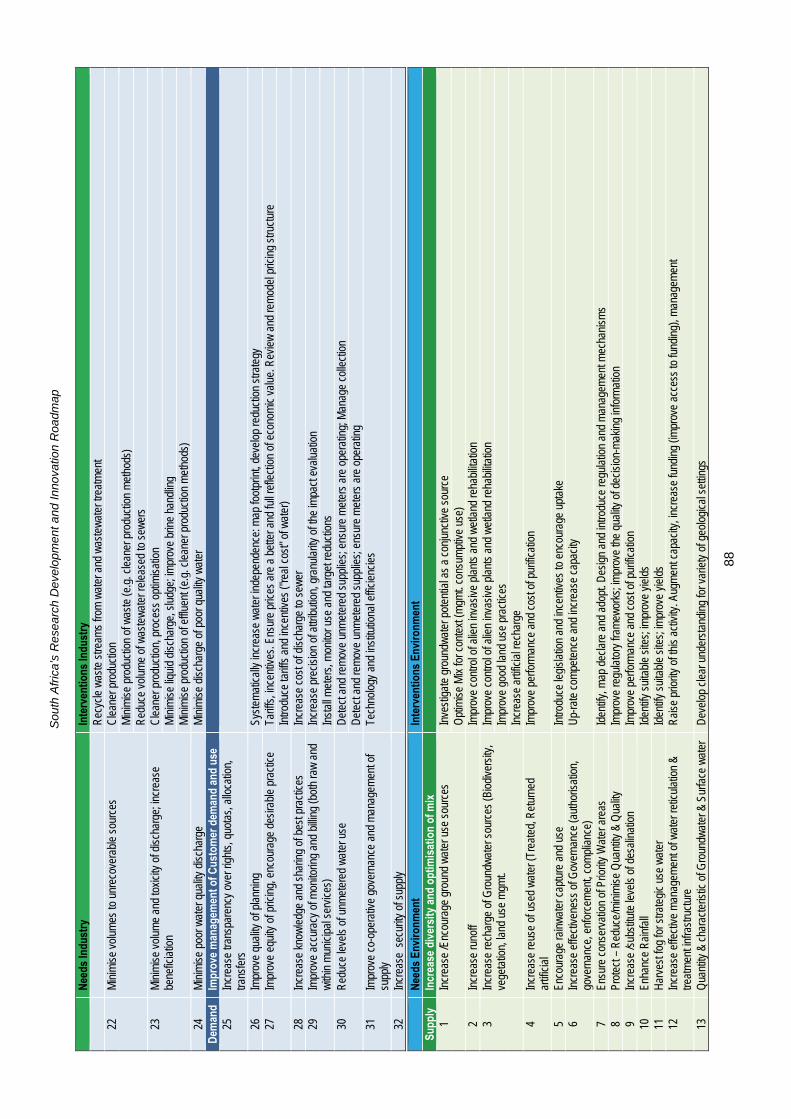
Sou
th A
fric
a’s
Res
ear
ch D
evel
op
men
t and
Inno
vatio
n R
oadm
ap
88
N
eeds
Indu
stry
Inte
rven
tions
Indu
stry
Rec
ycle
was
te s
tream
s fro
m w
ater
and
was
tew
ater
trea
tmen
t22
M
inim
ise
volu
mes
to u
nrec
over
able
sou
rces
C
lean
er p
rodu
ctio
nM
inim
ise
prod
uctio
n of
was
te (e
.g.c
lean
er p
rodu
ctio
n m
etho
ds)
Red
uce
volu
me
of w
aste
wat
er re
leas
ed to
sew
ers
23
Min
imis
e vo
lum
e an
d to
xici
ty o
f dis
char
ge; i
ncre
ase
bene
ficia
tion
Cle
aner
pro
duct
ion,
pro
cess
opt
imis
atio
nM
inim
ise
liqui
d di
scha
rge,
slu
dge;
impr
ove
brin
e ha
ndlin
g M
inim
ise
prod
uctio
n of
effl
uent
(e.g
. cle
aner
pro
duct
ion
met
hods
)24
M
inim
ise
poor
wat
er q
ualit
y di
scha
rge
M
inim
ise
disc
harg
e of
poo
r qua
lity
wat
erD
eman
d Im
prov
e m
anag
emen
t of C
usto
mer
dem
and
and
use
25
Incr
ease
tran
spar
ency
ove
r rig
hts,
quo
tas,
allo
catio
n,
trans
fers
26
Im
prov
e qu
ality
of p
lann
ing
Sy
stem
atic
ally
incr
ease
wat
er in
depe
nden
ce: m
ap fo
otpr
int,
deve
lop
redu
ctio
n st
rate
gy27
Im
prov
e eq
uity
of p
ricin
g, e
ncou
rage
des
irabl
e pr
actic
eTa
riffs
, inc
entiv
es. E
nsur
e pr
ices
are
a b
ette
r and
full
refle
ctio
n of
eco
nom
ic v
alue
. Rev
iew
and
rem
odel
pric
ing
stru
ctur
eIn
trodu
ce ta
riffs
and
ince
ntiv
es ("
real
cos
t" of
wat
er)
28
Incr
ease
kno
wle
dge
and
shar
ing
of b
est p
ract
ices
Incr
ease
cos
t of d
isch
arge
to s
ewer
29
Impr
ove
accu
racy
of m
onito
ring
and
billin
g (b
oth
raw
and
w
ithin
mun
icip
al s
ervi
ces)
In
crea
se p
reci
sion
of a
ttrib
utio
n, g
ranu
larit
y of
the
impa
ct e
valu
atio
nIn
stal
l met
ers,
mon
itor u
se a
nd ta
rget
redu
ctio
ns30
R
educ
e le
vels
of u
nmet
ered
wat
er u
se
Det
ect a
nd re
mov
e un
met
ered
sup
plie
s; e
nsur
e m
eter
s ar
e op
erat
ing;
Man
age
colle
ctio
nD
etec
t and
rem
ove
unm
eter
ed s
uppl
ies;
ens
ure
met
ers
are
oper
atin
g31
Im
prov
e co
-ope
rativ
e go
vern
ance
and
man
agem
ent o
f su
pply
Te
chno
logy
and
inst
itutio
nal e
ffici
enci
es
32
Incr
ease
sec
urity
of s
uppl
y
N
eeds
Env
ironm
ent
Inte
rven
tions
Env
ironm
ent
Supp
ly
Incr
ease
div
ersi
ty a
nd o
ptim
isat
ion
of m
ix
1 In
crea
se /E
ncou
rage
gro
und
wat
er u
se s
ourc
es
Inve
stig
ate
grou
ndw
ater
pot
entia
l as
a co
njun
ctiv
e so
urce
O
ptim
ise
Mix
for c
onte
xt (m
gmt.
cons
umpt
ive
use)
2 In
crea
se ru
noff
Impr
ove
cont
rol o
f alie
n in
vasi
ve p
lant
s an
d w
etla
nd re
habi
litat
ion
3 In
crea
se re
char
ge o
f Gro
undw
ater
sou
rces
(Bio
dive
rsity
, ve
geta
tion,
land
use
mgm
t. Im
prov
e co
ntro
l of a
lien
inva
sive
pla
nts
and
wet
land
reha
bilit
atio
nIm
prov
e go
od la
nd u
se p
ract
ices
Incr
ease
arti
ficia
l rec
harg
e4
Incr
ease
reus
e of
use
d w
ater
(Tre
ated
, Ret
urne
d
artif
icia
l Im
prov
e pe
rform
ance
and
cos
t of p
urifi
catio
n
5 En
cour
age
rain
wat
er c
aptu
re a
nd u
se
Intro
duce
legi
slat
ion
and
ince
ntiv
es to
enc
oura
ge u
ptak
e 6
Incr
ease
effe
ctiv
enes
s of
Gov
erna
nce
(aut
horis
atio
n,go
vern
ance
, enf
orce
men
t, co
mpl
ianc
e)
Up-
rate
com
pete
nce
and
incr
ease
cap
acity
7 En
sure
con
serv
atio
n of
Prio
rity
Wat
er a
reas
Id
entif
y, m
ap d
ecla
re a
nd a
dopt
. Des
ign
and
intro
duce
regu
latio
n an
d m
anag
emen
t mec
hani
sms
8 Pr
otec
t –R
educ
e/m
inim
ise
Qua
ntity
& Q
ualit
yIm
prov
e re
gula
tory
fram
ewor
ks; i
mpr
ove
the
qual
ity o
f dec
isio
n-m
akin
g in
form
atio
n9
Incr
ease
/sub
stitu
te le
vels
of d
esal
inat
ion
Impr
ove
perfo
rman
ce a
nd c
ost o
f pur
ifica
tion
10
Enha
nce
Rai
nfal
lId
entif
y su
itabl
e si
tes;
impr
ove
yiel
ds11
H
arve
st fo
g fo
r stra
tegi
c us
e w
ater
Id
entif
y su
itabl
e si
tes;
impr
ove
yiel
ds12
In
crea
se e
ffect
ive
man
agem
ent o
f wat
er re
ticul
atio
n &
treat
men
t inf
rast
ruct
ure
Rai
se p
riorit
y of
this
act
ivity
. Aug
men
t cap
acity
, inc
reas
e fu
ndin
g (im
prov
e ac
cess
to fu
ndin
g),m
anag
emen
t
13
Qua
ntity
& c
hara
cter
istic
of G
roun
dwat
er &
Sur
face
wat
er
Dev
elop
cle
ar u
nder
stan
ding
for v
arie
ty o
f geo
logi
cal s
ettin
gs
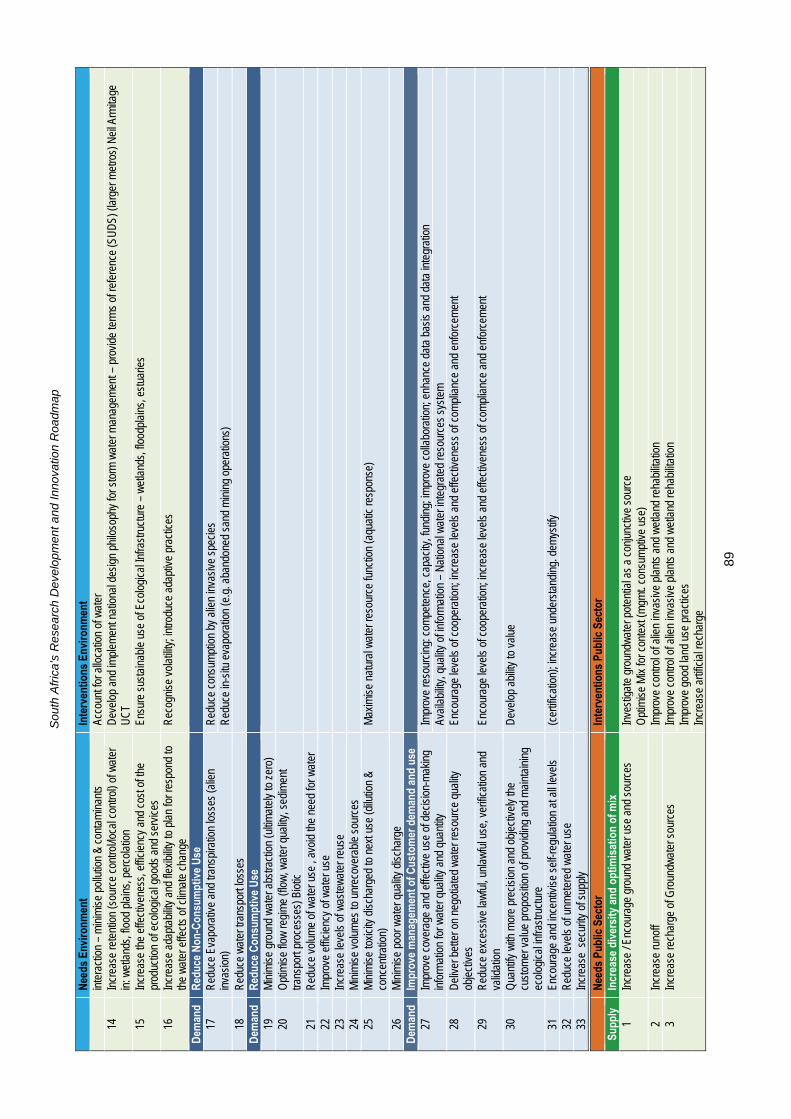
Sou
th A
fric
a’s
Res
ear
ch D
evel
op
men
t and
Inno
vatio
n R
oadm
ap
89
N
eeds
Env
ironm
ent
Inte
rven
tions
Env
ironm
ent
inte
ract
ion
–m
inim
ise
pollu
tion
& co
ntam
inan
tsAc
coun
t for
allo
catio
n of
wat
er14
In
crea
se re
tent
ion
(sou
rce
cont
rol/l
ocal
con
trol)
of w
ater
in
: wet
land
s, fl
ood
plai
ns, p
erco
latio
n D
evel
op a
nd im
plem
ent n
atio
nal d
esig
n ph
iloso
phy
for s
torm
wat
er m
anag
emen
t–pr
ovid
e te
rms
of re
fere
nce
(SU
DS)
(lar
ger m
etro
s) N
eil A
rmita
ge
UC
T 15
In
crea
se th
e ef
fect
iven
ess,
effi
cien
cy a
nd c
ost o
f the
pr
oduc
tion
of e
colo
gica
l goo
ds a
nd s
ervi
ces
Ensu
re s
usta
inab
le u
se o
f Eco
logi
cal I
nfra
stru
ctur
e –
wet
land
s, fl
oodp
lain
s, e
stua
ries
16
Incr
ease
ada
ptab
ility
and
flexi
bilit
y to
pla
n fo
r res
pond
to
the
wat
er e
ffect
s of
clim
ate
chan
ge
Rec
ogni
se v
olat
ility;
intro
duce
ada
ptiv
e pr
actic
es
Dem
and
Red
uce
Non
-Con
sum
ptiv
e U
se
17
Red
uce
Evap
orat
ive
and
trans
pira
tion
loss
es (a
lien
inva
sion
) R
educ
e co
nsum
ptio
n by
alie
n in
vasi
ve s
peci
esR
educ
e in
-situ
eva
pora
tion
(e.g
. aba
ndon
ed s
and
min
ing
oper
atio
ns)
18
Red
uce
wat
er tr
ansp
ort l
osse
s D
eman
d R
educ
e C
onsu
mpt
ive
Use
19
M
inim
ise
grou
nd w
ater
abs
tract
ion
(ulti
mat
ely
to z
ero)
20
Opt
imis
e flo
w re
gim
e (fl
ow, w
ater
qua
lity,
sed
imen
t tra
nspo
rt pr
oces
ses)
Bio
tic
21
R
educ
e vo
lum
e of
wat
er u
se ,
avoi
d th
e ne
ed fo
r wat
er22
Im
prov
e ef
ficie
ncy
of w
ater
use
23
In
crea
se le
vels
of w
aste
wat
er re
use
24
Min
imis
e vo
lum
es to
unr
ecov
erab
le s
ourc
es
25
Min
imis
e to
xici
ty d
isch
arge
d to
nex
t use
(dilu
tion
& co
ncen
tratio
n)
Max
imis
e na
tura
l wat
er re
sour
ce fu
nctio
n (a
quat
ic re
spon
se)
26
Min
imis
e po
or w
ater
qua
lity
disc
harg
e
Dem
and
Impr
ove
man
agem
ent o
f Cus
tom
er d
eman
d an
d us
e27
Im
prov
e co
vera
ge a
nd e
ffect
ive
use
of d
ecis
ion-
mak
ing
info
rmat
ion
for w
ater
qua
lity
and
quan
tity
Impr
ove
reso
urci
ng: c
ompe
tenc
e, c
apac
ity, f
undi
ng; i
mpr
ove
colla
bora
tion;
enh
ance
dat
a ba
sis
and
data
inte
grat
ion
Avai
labi
lity,
qua
lity
of in
form
atio
n–
Nat
iona
l wat
er in
tegr
ated
reso
urce
s sy
stem
28
Del
iver
bet
ter o
n ne
gotia
ted
wat
er re
sour
ce q
ualit
y ob
ject
ives
En
cour
age
leve
ls o
f coo
pera
tion;
incr
ease
leve
ls a
nd e
ffect
iven
ess
of c
ompl
ianc
e an
d en
forc
emen
t
29
Red
uce
exce
ssiv
e la
wfu
l, un
law
ful u
se, v
erifi
catio
n an
d
valid
atio
n En
cour
age
leve
ls o
f coo
pera
tion;
incr
ease
leve
ls a
nd e
ffect
iven
ess
of c
ompl
ianc
e an
d en
forc
emen
t
30
Qua
ntify
with
mor
e pr
ecis
ion
and
obje
ctiv
ely
the
cust
omer
val
ue p
ropo
sitio
n of
pro
vidi
ng a
nd m
aint
aini
ng
ecol
ogic
al in
frast
ruct
ure
Dev
elop
abi
lity
to v
alue
31
Enco
urag
e an
d in
cent
ivis
e se
lf-re
gula
tion
at a
ll le
vels
(cer
tific
atio
n); i
ncre
ase
unde
rsta
ndin
g. d
emys
tify
32
Red
uce
leve
ls o
f unm
eter
ed w
ater
use
33
In
crea
se s
ecur
ity o
f sup
ply
N
eeds
Pub
lic S
ecto
rIn
terv
entio
ns P
ublic
Sec
tor
Supp
ly
Incr
ease
div
ersi
ty a
nd o
ptim
isat
ion
of m
ix
1 In
crea
se /
Enco
urag
e gr
ound
wat
er u
se a
nd s
ourc
es
Inve
stig
ate
grou
ndw
ater
pot
entia
l as
a co
njun
ctiv
e so
urce
O
ptim
ise
Mix
for c
onte
xt (m
gmt.
cons
umpt
ive
use)
2 In
crea
se ru
noff
Impr
ove
cont
rol o
f alie
n in
vasi
ve p
lant
s an
d w
etla
nd re
habi
litat
ion
3 In
crea
se re
char
ge o
f Gro
undw
ater
sou
rces
Im
prov
e co
ntro
l of a
lien
inva
sive
pla
nts
and
wet
land
reha
bilit
atio
nIm
prov
e go
od la
nd u
se p
ract
ices
Incr
ease
arti
ficia
l rec
harg
e

Sou
th A
fric
a’s
Res
ear
ch D
evel
op
men
t and
Inno
vatio
n R
oadm
ap
90
N
eeds
Pub
lic S
ecto
rIn
terv
entio
ns P
ublic
Sec
tor
4 In
crea
se re
use
of u
sed
wat
er (T
reat
ed, R
etur
ned,
ar
tific
ial –
from
indu
stry
and
min
ing)
Im
prov
e pe
rform
ance
and
cos
t of p
urifi
catio
n
5 En
cour
age
rain
wat
er c
aptu
re a
nd u
se
Incr
ease
pro
porti
on c
aptu
red;
ince
ntiv
ise
upta
ke6
Incr
ease
effe
ctiv
enes
s of
Gov
erna
nce
(aut
horis
atio
n,
gove
rnan
ce, e
nfor
cem
ent,
com
plia
nce)
U
p-ra
te c
ompe
tenc
e an
d in
crea
se c
apac
ity
7 En
sure
con
serv
atio
n of
Prio
rity
Wat
er a
reas
Id
entif
y, m
ap d
ecla
re a
nd a
dopt
. Des
ign
and
intro
duce
regu
latio
n an
d m
anag
emen
t mec
hani
sms
8 Pr
otec
t –R
educ
e/m
inim
ise
Qua
ntity
& Q
ualit
yIm
prov
e re
gula
tory
fram
ewor
ks; i
mpr
ove
the
qual
ity o
f dec
isio
n-m
akin
g in
form
atio
n9
Incr
ease
/sub
stitu
te le
vels
of d
esal
inat
ion
Incr
ease
reco
very
from
sou
rces
(was
tew
ater
, sea
wat
er, p
roce
ss a
nd b
rack
ish)
Impr
ove
perfo
rman
ce a
nd c
ost o
f pur
ifica
tion
10
Incr
ease
sto
rmw
ater
har
vest
ing
and
man
agem
ent
Ince
ntiv
ise
broa
der a
dopt
ion
and
upta
ke; S
epar
ate
clea
n an
d di
rty (C
SO)
11
Incr
ease
effe
ctiv
e m
anag
emen
t of w
ater
retic
ulat
ion
& tre
atm
ent i
nfra
stru
ctur
e R
aise
prio
rity
of th
is a
ctiv
ity. A
ugm
ent c
apac
ity, i
ncre
ase
fund
ing
(impr
ove
acce
ss to
fund
ing)
, man
agem
ent
12
Qua
ntity
& c
hara
cter
istic
of G
roun
dwat
er &
Sur
face
wat
er
inte
ract
ion
– m
inim
ise
pollu
tion
& co
ntam
inan
ts
Dev
elop
cle
ar u
nder
stan
ding
for v
arie
ty o
f geo
logi
cal s
ettin
gs
13
Incr
ease
wat
er tr
ansf
ers
Enab
le, s
treng
then
inte
rbas
in tr
ansf
ers
14
Incr
ease
rete
ntio
n (s
ourc
e co
ntro
l/loc
al c
ontro
l) of
wat
er
in: w
etla
nds,
floo
d pl
ains
, per
cola
tion
Dev
elop
and
impl
emen
t nat
iona
l des
ign
philo
soph
y fo
r sto
rm w
ater
man
agem
ent–
prov
ide
term
s of
refe
renc
e (S
UD
S) (l
arge
r met
ros)
Nei
l Arm
itage
U
CT
15
Wat
er lo
ss -r
educ
e w
ater
loss
in th
e di
strib
utio
n sy
stem
-ab
stra
ctio
n, d
istri
butio
n, re
ticul
atio
n
Mai
nten
ance
?
Prio
ritis
e th
e fu
nds,
impr
ove
allo
catio
n of
fund
s fo
r ope
ratio
ns. R
ing
fenc
e –
"Run
wat
er a
s a
busi
ness
in m
unic
ipal
ity"
16
Impr
ove
visi
bilit
y a
nd m
anag
emen
t of a
sset
bas
eD
evel
op a
pla
n to
opt
imis
e th
e in
vest
men
t in
Infra
stru
ctur
e –
plan
and
dev
elop
(fle
xibl
e an
d re
spon
sive
) 17
Im
prov
e th
e fin
anci
al s
usta
inab
ility
of th
e w
ater
sys
tem
18
Incr
ease
pro
porti
on o
f wat
er th
at is
pai
d fo
r R
emov
e po
litic
al in
terfe
renc
e in
enf
orce
men
t, re
duce
und
esira
ble
or u
npro
duct
ive
polit
ical
invo
lvem
ent
19
Incr
ease
the
accu
racy
of a
ttrib
utio
n of
wat
er u
seN
o co
nfid
ence
in B
illing
sys
tem
–ab
le to
pay
but
don
't tru
st it
20
Im
prov
e re
venu
e co
llect
ion
perfo
rman
ce
Impr
ove
met
erin
g, b
illing
sys
tem
s, a
ttitu
des,
pre
paid
met
ers.
Impr
ove
the
mon
itorin
g th
roug
hout
the
syst
em–
inflo
w. A
t sys
tem
leve
l im
prov
e th
e ab
ility
to m
onito
r the
flo
w u
se a
nd q
ualit
y (w
ater
bal
ance
) 21
Im
prov
e th
e eq
uity
of p
ricin
g R
evis
e po
licy
arou
nd re
quire
men
t to
pay?
Incr
ease
the
rang
e of
tarif
fs22
In
stitu
tiona
l lan
dsca
pe in
the
coun
try?
Gov
erna
nce,
m
anag
emen
t,
Ref
ine
acco
unta
bilit
y al
ong
the
valu
e ch
ain
23
Opt
imis
e th
e ab
ility
to m
anag
e fro
m s
ourc
e to
sou
rce
in
an in
tegr
ated
way
R
efin
e ac
coun
tabi
lity
alon
g th
e va
lue
chai
n
24
Impr
ove
wat
er re
sour
ce m
anag
emen
t -
impl
emen
ting
curre
nt le
gisl
atio
n–
WR
N N
WA
NW
RS
25
Impr
ove
the
reso
urce
mix
– g
roun
dwat
er e
fflue
nt re
use,
de
salin
atio
n 26
Im
prov
e Pl
anni
ng f
or th
e fu
ture
– a
bilit
y to
resp
ond
to
vola
tility
In
tegr
ated
pla
nnin
g –
wat
er re
conc
iliatio
n pl
ans?
Are
they
bas
ed o
n lo
wes
t cos
t or s
trate
gic
cons
ider
atio
n S
ocia
l sys
tem
s an
d de
man
d –
D
evel
opm
ent o
f rur
al a
reas
27
Im
prov
e pe
rform
ance
and
opt
imis
e in
vest
men
t in
Infra
stru
ctur
e R
oll o
f Tec
hnol
ogy?
28
Incr
ease
the
abilit
y in
iden
tifyi
ng a
ltern
ativ
e su
pplie
s29
In
crea
se n
on p
otab
le w
ater
30
Im
prov
e th
e ab
ility
to m
anag
e w
ater
flow
s Im
prov
e In
cent
ives
for g
ood
oper
atio
nal p
ract
ices
Dem
and
Red
uce
Non
-con
sum
ptiv
e U
se
31
Red
uce
wat
er tr
ansp
ort l
osse
s
Ref
urbi
sh a
nd m
aint
ain
dist
ribut
ion
infra
stru
ctur
e32
R
educ
e w
ater
leak
ages
and
eva
pora
tive
loss
esIn
crea
se d
etec
tion
and
repa
ir pe
rform
ance
; im
prov
e m
anag
emen
t of p
ress
ure;
mai
ntai
n ap
plia
nces
Dem
and
Red
uce
Con
sum
ptiv
e U
se
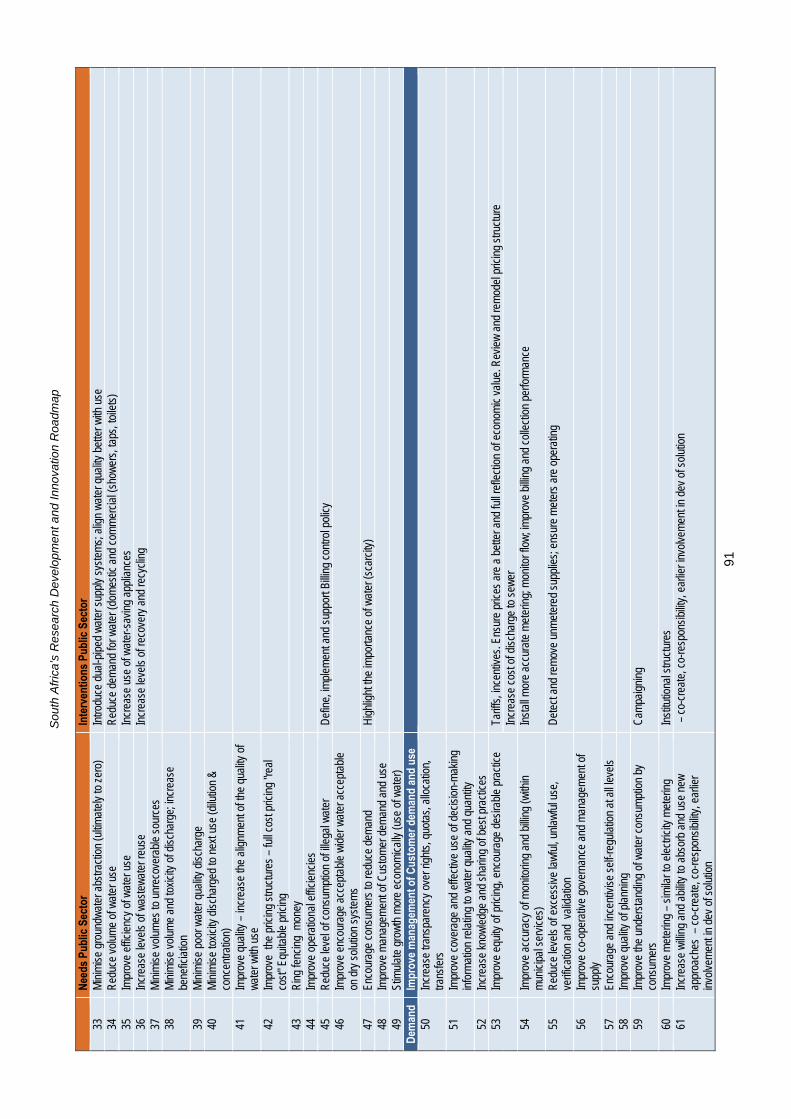
Sou
th A
fric
a’s
Res
ear
ch D
evel
op
men
t and
Inno
vatio
n R
oadm
ap
91
N
eeds
Pub
lic S
ecto
rIn
terv
entio
ns P
ublic
Sec
tor
33
Min
imis
e gr
ound
wat
er a
bstra
ctio
n (u
ltim
atel
y to
zer
o)In
trodu
ce d
ual-p
iped
wat
er s
uppl
y sy
stem
s; a
lign
wat
er q
ualit
y be
tter w
ith u
se34
R
educ
e vo
lum
e of
wat
er u
se
Red
uce
dem
and
for w
ater
(dom
estic
and
com
mer
cial
(sho
wer
s, ta
ps, t
oile
ts)
35
Impr
ove
effic
ienc
y of
wat
er u
se
Incr
ease
use
of w
ater
-sav
ing
appl
ianc
es36
In
crea
se le
vels
of w
aste
wat
er re
use
Incr
ease
leve
ls o
f rec
over
y an
d re
cycl
ing
37
Min
imis
e vo
lum
es to
unr
ecov
erab
le s
ourc
es
38
Min
imis
e vo
lum
e an
d to
xici
ty o
f dis
char
ge; i
ncre
ase
bene
ficia
tion
39
Min
imis
e po
or w
ater
qua
lity
disc
harg
e
40
Min
imis
e to
xici
ty d
isch
arge
d to
nex
t use
(dilu
tion
& co
ncen
tratio
n)
41
Impr
ove
qual
ity–
incr
ease
the
alig
nmen
t of t
he q
ualit
y of
w
ater
with
use
42
Im
prov
e th
e pr
icin
g st
ruct
ures
– fu
ll co
st p
ricin
g "re
al
cost
" Equ
itabl
e pr
icin
g 43
R
ing
fenc
ing
mon
ey44
Im
prov
e op
erat
iona
l effi
cien
cies
45
R
educ
e le
vel o
f con
sum
ptio
n of
ille
gal w
ater
D
efin
e, im
plem
ent a
nd s
uppo
rt Bi
lling
cont
rol p
olic
y
46
Impr
ove
enco
urag
e ac
cept
able
wid
er w
ater
acc
epta
ble
on d
ry s
olut
ion
syst
ems
47
En
cour
age
cons
umer
s to
redu
ce d
eman
d
Hig
hlig
ht th
e im
porta
nce
of w
ater
(sca
rcity
)48
Im
prov
e m
anag
emen
t of C
usto
mer
dem
and
and
use
49
Stim
ulat
e gr
owth
mor
e ec
onom
ical
ly (u
se o
f wat
er)
Dem
and
Impr
ove
man
agem
ent o
f Cus
tom
er d
eman
d an
d us
e50
In
crea
se tr
ansp
aren
cy o
ver r
ight
s, q
uota
s, a
lloca
tion,
tra
nsfe
rs
51
Impr
ove
cove
rage
and
effe
ctiv
e us
e of
dec
isio
n-m
akin
g in
form
atio
n re
latin
g to
wat
er q
ualit
y an
d qu
antit
y 52
In
crea
se k
now
ledg
e an
d sh
arin
g of
bes
t pra
ctic
es53
Im
prov
e eq
uity
of p
ricin
g, e
ncou
rage
des
irabl
e pr
actic
eTa
riffs
, inc
entiv
es. E
nsur
e pr
ices
are
a b
ette
r and
full
refle
ctio
n of
eco
nom
ic v
alue
. Rev
iew
and
rem
odel
pric
ing
stru
ctur
eIn
crea
se c
ost o
f dis
char
ge to
sew
er54
Im
prov
e ac
cura
cy o
f mon
itorin
g an
d bi
lling
(with
in
mun
icip
al s
ervi
ces)
In
stal
l mor
e ac
cura
te m
eter
ing;
mon
itor f
low
; im
prov
e bi
lling
and
colle
ctio
n pe
rform
ance
55
Red
uce
leve
ls o
f exc
essi
ve la
wfu
l, un
law
ful u
se,
verif
icat
ion
and
val
idat
ion
Det
ect a
nd re
mov
e un
met
ered
sup
plie
s; e
nsur
e m
eter
s ar
e op
erat
ing
56
Impr
ove
co-o
pera
tive
gove
rnan
ce a
nd m
anag
emen
t of
supp
ly
57
Enco
urag
e an
d in
cent
ivis
e se
lf-re
gula
tion
at a
ll le
vels
58
Impr
ove
qual
ity o
f pla
nnin
g 59
Im
prov
e th
e un
ders
tand
ing
of w
ater
con
sum
ptio
n by
co
nsum
ers
C
ampa
igni
ng
60
Impr
ove
met
erin
g–
sim
ilar t
o el
ectri
city
met
erin
gIn
stitu
tiona
l stru
ctur
es61
In
crea
se w
illing
and
abi
lity
to a
bsor
b an
d us
e ne
w
appr
oach
es –
co-
crea
te, c
o-re
spon
sibi
lity,
ear
lier
invo
lvem
ent i
n de
v of
sol
utio
n
–co
-cre
ate,
co-
resp
onsi
bilit
y, e
arlie
r inv
olve
men
t in
dev
of s
olut
ion
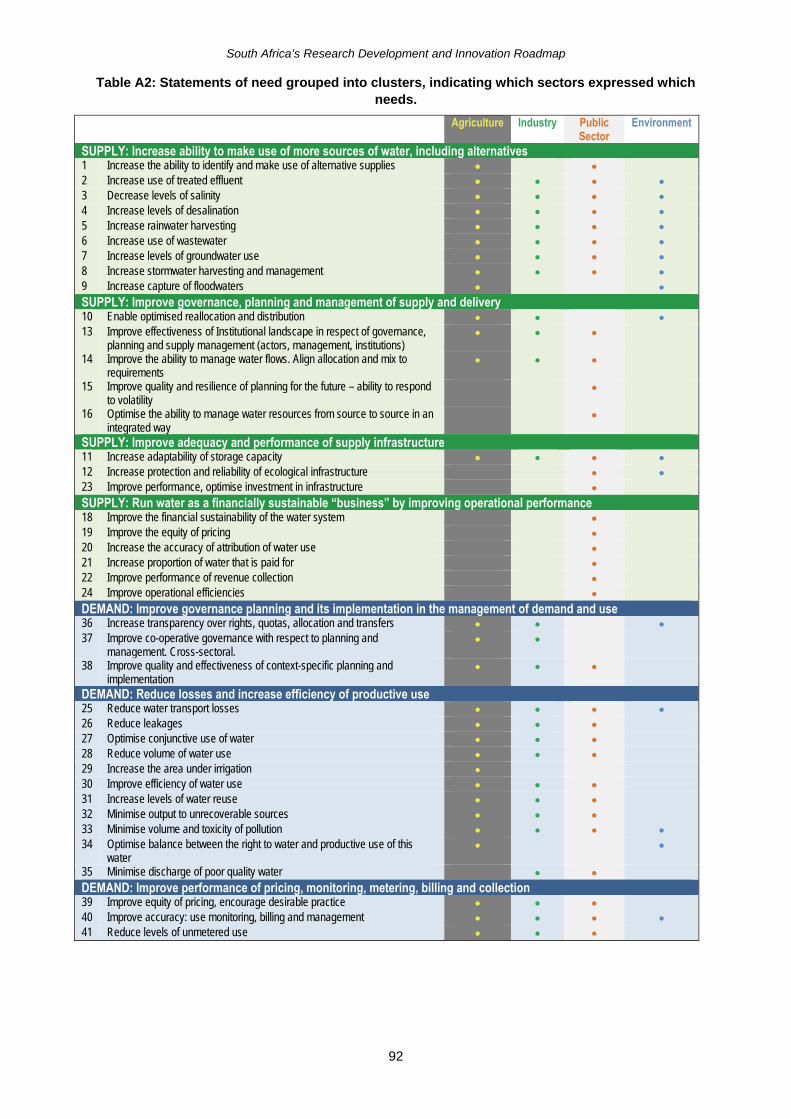
South Africa’s Research Development and Innovation Roadmap
92
Table A2: Statements of need grouped into clusters, indicating which sectors expressed which needs.
Agriculture Industry Public Sector
Environment
SUPPLY: Increase ability to make use of more sources of water, including alternatives 1 Increase the ability to identify and make use of alternative supplies • • 2 Increase use of treated effluent • • • • 3 Decrease levels of salinity • • • • 4 Increase levels of desalination • • • • 5 Increase rainwater harvesting • • • • 6 Increase use of wastewater • • • • 7 Increase levels of groundwater use • • • • 8 Increase stormwater harvesting and management • • • • 9 Increase capture of floodwaters • • SUPPLY: Improve governance, planning and management of supply and delivery 10 Enable optimised reallocation and distribution • • • 13 Improve effectiveness of Institutional landscape in respect of governance,
planning and supply management (actors, management, institutions) • • •
14 Improve the ability to manage water flows. Align allocation and mix to requirements
• • •
15 Improve quality and resilience of planning for the future – ability to respond to volatility
•
16 Optimise the ability to manage water resources from source to source in an integrated way
•
SUPPLY: Improve adequacy and performance of supply infrastructure 11 Increase adaptability of storage capacity • • • • 12 Increase protection and reliability of ecological infrastructure • • 23 Improve performance, optimise investment in infrastructure • SUPPLY: Run water as a financially sustainable “business” by improving operational performance 18 Improve the financial sustainability of the water system • 19 Improve the equity of pricing • 20 Increase the accuracy of attribution of water use • 21 Increase proportion of water that is paid for • 22 Improve performance of revenue collection • 24 Improve operational efficiencies • DEMAND: Improve governance planning and its implementation in the management of demand and use 36 Increase transparency over rights, quotas, allocation and transfers • • • 37 Improve co-operative governance with respect to planning and
management. Cross-sectoral. • •
38 Improve quality and effectiveness of context-specific planning and implementation
• • •
DEMAND: Reduce losses and increase efficiency of productive use 25 Reduce water transport losses • • • • 26 Reduce leakages • • • 27 Optimise conjunctive use of water • • • 28 Reduce volume of water use • • • 29 Increase the area under irrigation • 30 Improve efficiency of water use • • • 31 Increase levels of water reuse • • • 32 Minimise output to unrecoverable sources • • • 33 Minimise volume and toxicity of pollution • • • • 34 Optimise balance between the right to water and productive use of this
water • •
35 Minimise discharge of poor quality water • • DEMAND: Improve performance of pricing, monitoring, metering, billing and collection 39 Improve equity of pricing, encourage desirable practice • • • 40 Improve accuracy: use monitoring, billing and management • • • • 41 Reduce levels of unmetered use • • •
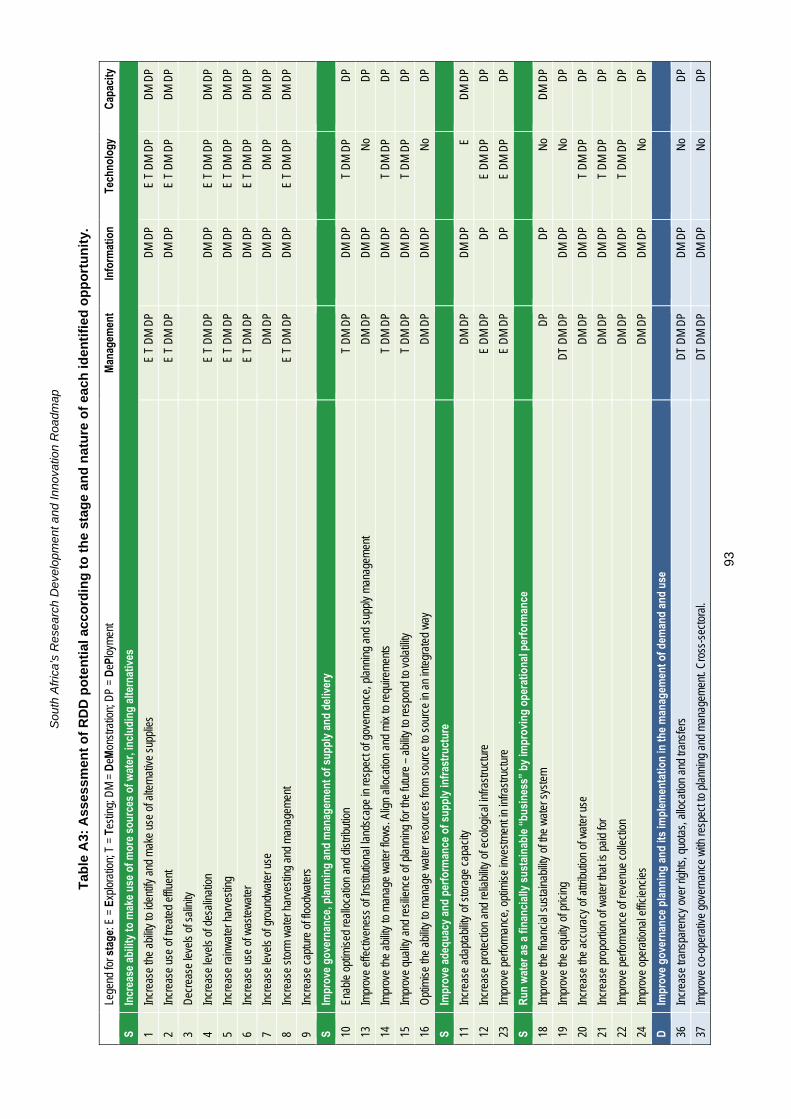
Sou
th A
fric
a’s
Res
ear
ch D
evel
op
men
t and
Inno
vatio
n R
oadm
ap
93
Tab
le A
3: A
sses
smen
t o
f R
DD
po
ten
tial
acc
ord
ing
to
th
e st
age
and
nat
ure
of
each
iden
tifi
ed o
pp
ort
un
ity.
Le
gend
for s
tage
: E =
Exp
lora
tion;
T =
Tes
ting;
DM
= D
eMon
stra
tion;
DP
= D
ePlo
ymen
t M
anag
emen
t In
form
atio
n Te
chno
logy
C
apac
ity
S In
crea
se a
bilit
y to
mak
e us
e of
mor
e so
urce
s of
wat
er, i
nclu
ding
alte
rnat
ives
1 In
crea
se th
e ab
ility
to id
entif
y an
d m
ake
use
of a
ltern
ativ
e su
pplie
s E
T D
M D
P D
M D
P E
T D
M D
P D
M D
P
2 In
crea
se u
se o
f tre
ated
effl
uent
E
T D
M D
P D
M D
P E
T D
M D
P D
M D
P
3 D
ecre
ase
leve
ls o
f sal
inity
4 In
crea
se le
vels
of d
esal
inat
ion
E
T D
M D
P D
M D
P E
T D
M D
P D
M D
P
5 In
crea
se ra
inw
ater
har
vest
ing
E T
DM
DP
DM
DP
E T
DM
DP
DM
DP
6 In
crea
se u
se o
f was
tew
ater
E
T D
M D
P D
M D
P E
T D
M D
P D
M D
P
7 In
crea
se le
vels
of g
roun
dwat
er u
se
DM
DP
DM
DP
DM
DP
DM
DP
8 In
crea
se s
torm
wat
er h
arve
stin
g an
d m
anag
emen
t E
T D
M D
P D
M D
P E
T D
M D
P D
M D
P
9 In
crea
se c
aptu
re o
f flo
odw
ater
s
S Im
prov
e go
vern
ance
, pla
nnin
g an
d m
anag
emen
t of s
uppl
y an
d de
liver
y
10
Enab
le o
ptim
ised
real
loca
tion
and
dist
ribut
ion
T D
M D
P D
M D
P T
DM
DP
DP
13
Impr
ove
effe
ctiv
enes
s of
Inst
itutio
nal l
ands
cape
in re
spec
t of g
over
nanc
e, p
lann
ing
and
supp
ly m
anag
emen
t D
M D
P D
M D
P N
o D
P
14
Impr
ove
the
abilit
y to
man
age
wat
er fl
ows.
Alig
n al
loca
tion
and
mix
to re
quire
men
ts
T D
M D
P D
M D
P T
DM
DP
DP
15
Impr
ove
qual
ity a
nd re
silie
nce
of p
lann
ing
for t
he fu
ture
– a
bilit
y to
resp
ond
to v
olat
ility
T
DM
DP
DM
DP
T D
M D
P D
P
16
Opt
imis
e th
e ab
ility
to m
anag
e w
ater
reso
urce
s fro
m s
ourc
e to
sou
rce
in a
n in
tegr
ated
way
D
M D
P D
M D
P N
o D
P
S Im
prov
e ad
equa
cy a
nd p
erfo
rman
ce o
f sup
ply
infr
astr
uctu
re
11
Incr
ease
ada
ptab
ility
of s
tora
ge c
apac
ity
DM
DP
DM
DP
E D
M D
P
12
Incr
ease
pro
tect
ion
and
relia
bilit
y of
eco
logi
cal i
nfra
stru
ctur
e E
DM
DP
DP
E D
M D
P D
P
23
Impr
ove
perfo
rman
ce, o
ptim
ise
inve
stm
ent i
n in
frast
ruct
ure
E D
M D
P D
P E
DM
DP
DP
S R
un w
ater
as
a fin
anci
ally
sus
tain
able
“bu
sine
ss”
by im
prov
ing
oper
atio
nal p
erfo
rman
ce
18
Impr
ove
the
finan
cial
sus
tain
abilit
y of
the
wat
er s
yste
m
DP
DP
No
DM
DP
19
Impr
ove
the
equi
ty o
f pric
ing
DT
DM
DP
DM
DP
No
DP
20
Incr
ease
the
accu
racy
of a
ttrib
utio
n of
wat
er u
se
DM
DP
DM
DP
T D
M D
P D
P
21
Incr
ease
pro
porti
on o
f wat
er th
at is
pai
d fo
r D
M D
P D
M D
P T
DM
DP
DP
22
Impr
ove
perfo
rman
ce o
f rev
enue
col
lect
ion
D
M D
P D
M D
P T
DM
DP
DP
24
Impr
ove
oper
atio
nal e
ffici
enci
es
DM
DP
DM
DP
No
DP
D
Impr
ove
gove
rnan
ce p
lann
ing
and
its im
plem
enta
tion
in th
e m
anag
emen
t of d
eman
d an
d us
e
36
Incr
ease
tran
spar
ency
ove
r rig
hts,
quo
tas,
allo
catio
n an
d tra
nsfe
rs
DT
DM
DP
DM
DP
No
DP
37
Impr
ove
co-o
pera
tive
gove
rnan
ce w
ith re
spec
t to
plan
ning
and
man
agem
ent.
Cro
ss-s
ecto
ral.
DT
DM
DP
DM
DP
No
DP
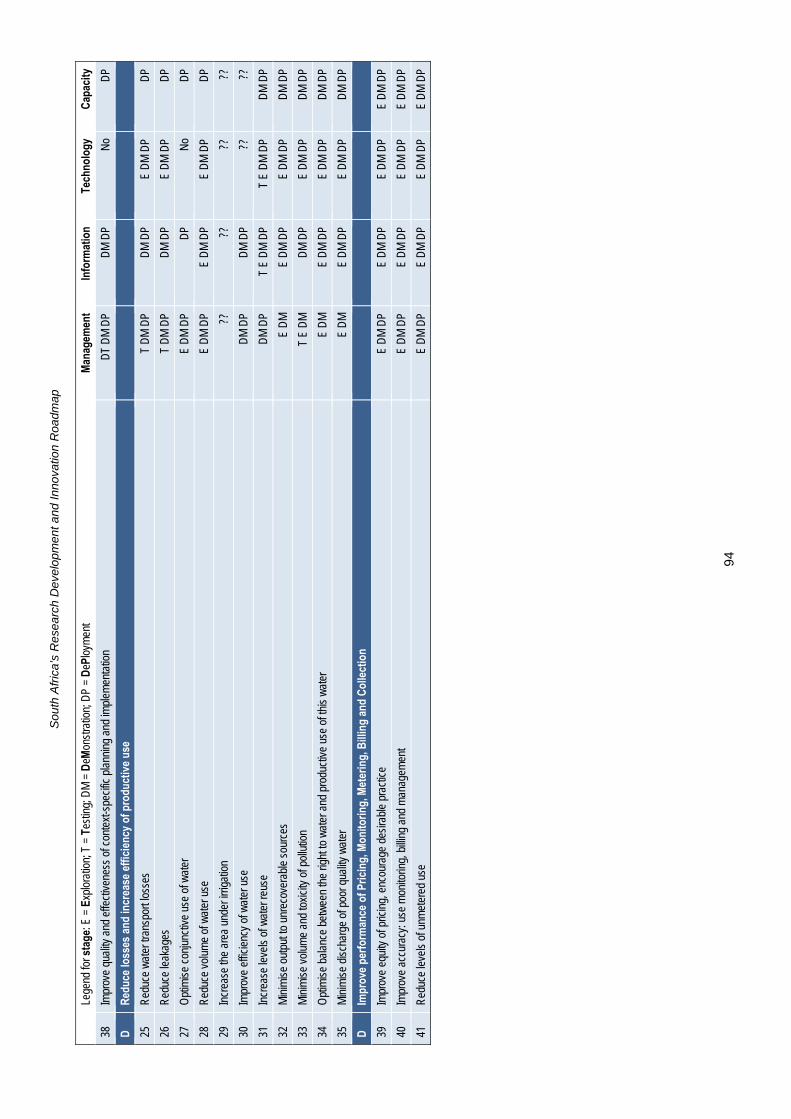
Sou
th A
fric
a’s
Res
ear
ch D
evel
op
men
t and
Inno
vatio
n R
oadm
ap
94
Le
gend
for s
tage
: E =
Exp
lora
tion;
T =
Tes
ting;
DM
= D
eMon
stra
tion;
DP
= D
ePlo
ymen
t M
anag
emen
t In
form
atio
n Te
chno
logy
C
apac
ity
38
Impr
ove
qual
ity a
nd e
ffect
iven
ess
of c
onte
xt-s
peci
fic p
lann
ing
and
impl
emen
tatio
n D
T D
M D
P D
M D
P N
o D
P
D
Red
uce
loss
es a
nd in
crea
se e
ffici
ency
of p
rodu
ctiv
e us
e
25
Red
uce
wat
er tr
ansp
ort l
osse
s T
DM
DP
DM
DP
E D
M D
P D
P
26
Red
uce
leak
ages
T
DM
DP
DM
DP
E D
M D
P D
P
27
Opt
imis
e co
njun
ctiv
e us
e of
wat
er
E D
M D
P D
P N
o D
P
28
Red
uce
volu
me
of w
ater
use
E
DM
DP
E D
M D
P E
DM
DP
DP
29
Incr
ease
the
area
und
er ir
rigat
ion
??
??
??
??
30
Impr
ove
effic
ienc
y of
wat
er u
se
DM
DP
DM
DP
??
??
31
Incr
ease
leve
ls o
f wat
er re
use
D
M D
P T
E D
M D
P T
E D
M D
P D
M D
P
32
Min
imis
e ou
tput
to u
nrec
over
able
sou
rces
E
DM
E
DM
DP
E D
M D
P D
M D
P
33
Min
imis
e vo
lum
e an
d to
xici
ty o
f pol
lutio
n T
E D
M
DM
DP
E D
M D
P D
M D
P
34
Opt
imis
e ba
lanc
e be
twee
n th
e rig
ht to
wat
er a
nd p
rodu
ctiv
e us
e of
this
wat
er
E D
M
E D
M D
P E
DM
DP
DM
DP
35
Min
imis
e di
scha
rge
of p
oor q
ualit
y w
ater
E
DM
E
DM
DP
E D
M D
P D
M D
P
D
Impr
ove
perf
orm
ance
of P
ricin
g, M
onito
ring,
Met
erin
g, B
illin
g an
d C
olle
ctio
n
39
Impr
ove
equi
ty o
f pric
ing,
enc
oura
ge d
esira
ble
prac
tice
E D
M D
P E
DM
DP
E D
M D
P E
DM
DP
40
Impr
ove
accu
racy
: use
mon
itorin
g, b
illing
and
man
agem
ent
E D
M D
P E
DM
DP
E D
M D
P E
DM
DP
41
Red
uce
leve
ls o
f unm
eter
ed u
se
E D
M D
P E
DM
DP
E D
M D
P E
DM
DP
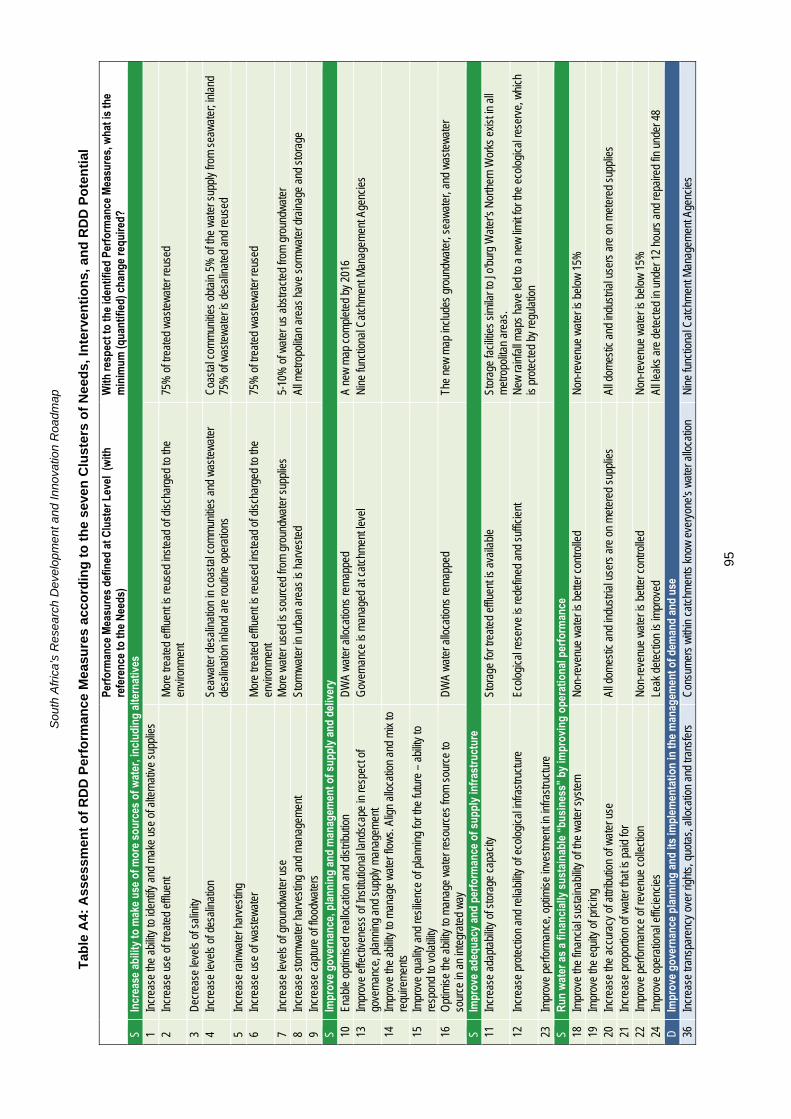
Sou
th A
fric
a’s
Res
ear
ch D
evel
op
men
t and
Inno
vatio
n R
oadm
ap
95
Tab
le A
4: A
sses
smen
t o
f R
DD
Per
form
ance
Mea
sure
s ac
cord
ing
to
th
e se
ven
Clu
ster
s o
f N
eed
s, In
terv
enti
on
s, a
nd
RD
D P
ote
nti
al
Perf
orm
ance
Mea
sure
s de
fined
at C
lust
er L
evel
(w
ith
refe
renc
e to
the
Nee
ds)
With
resp
ect t
o th
e id
entif
ied
Perf
orm
ance
Mea
sure
s, w
hat i
s th
e m
inim
um (q
uant
ified
) cha
nge
requ
ired?
S
Incr
ease
abi
lity
to m
ake
use
of m
ore
sour
ces
of w
ater
, inc
ludi
ng a
ltern
ativ
es1
Incr
ease
the
abilit
y to
iden
tify
and
mak
e us
e of
alte
rnat
ive
supp
lies
2 In
crea
se u
se o
f tre
ated
effl
uent
M
ore
treat
ed e
fflue
nt is
reus
ed in
stea
d of
dis
char
ged
to th
e en
viro
nmen
t 75
% o
f tre
ated
was
tew
ater
reus
ed
3 D
ecre
ase
leve
ls o
f sal
inity
4 In
crea
se le
vels
of d
esal
inat
ion
Se
awat
erde
salin
atio
n in
coa
stal
com
mun
ities
and
was
tew
ater
de
salin
atio
n in
land
are
rout
ine
oper
atio
ns
Coa
stal
com
mun
ities
obt
ain
5% o
f the
wat
er s
uppl
y fro
m s
eaw
ater
; inl
and
75%
of w
aste
wat
er is
des
alin
ated
and
reus
ed
5 In
crea
se ra
inw
ater
har
vest
ing
6 In
crea
se u
se o
f was
tew
ater
Mor
e tre
ated
effl
uent
is re
used
inst
ead
of d
isch
arge
d to
the
envi
ronm
ent
75%
of t
reat
ed w
aste
wat
er re
used
7 In
crea
se le
vels
of g
roun
dwat
er u
se
Mor
e w
ater
use
d is
sou
rced
from
gro
undw
ater
sup
plie
s5-
10%
of w
ater
us
abst
ract
ed fr
om g
roun
dwat
er8
Incr
ease
sto
rmw
ater
har
vest
ing
and
man
agem
ent
Stor
mw
ater
in u
rban
are
as is
har
vest
edAl
l met
ropo
litan
are
as h
ave
sorm
wat
er d
rain
age
and
stor
age
9 In
crea
se c
aptu
re o
f flo
odw
ater
s S
Impr
ove
gove
rnan
ce, p
lann
ing
and
man
agem
ent o
f sup
ply
and
deliv
ery
10
Enab
le o
ptim
ised
real
loca
tion
and
dist
ribut
ion
DW
A w
ater
allo
catio
ns re
map
ped
A ne
w m
ap c
ompl
eted
by
2016
13
Impr
ove
effe
ctiv
enes
s of
Inst
itutio
nal l
ands
cape
in re
spec
t of
gove
rnan
ce, p
lann
ing
and
supp
ly m
anag
emen
t G
over
nanc
e is
man
aged
at c
atch
men
t lev
elN
ine
func
tiona
l Cat
chm
ent M
anag
emen
t Age
ncie
s
14
Impr
ove
the
abilit
y to
man
age
wat
er fl
ows.
Alig
n al
loca
tion
and
mix
to
requ
irem
ents
15
Im
prov
e qu
ality
and
resi
lienc
e of
pla
nnin
g fo
r the
futu
re–
abilit
y to
re
spon
d to
vol
atilit
y
16
Opt
imis
e th
e ab
ility
to m
anag
e w
ater
reso
urce
s fro
m s
ourc
e to
so
urce
in a
n in
tegr
ated
way
D
WA
wat
er a
lloca
tions
rem
appe
dTh
e ne
w m
ap in
clud
es g
roun
dwat
er, s
eaw
ater
, and
was
tew
ater
S Im
prov
e ad
equa
cy a
nd p
erfo
rman
ce o
f sup
ply
infr
astr
uctu
re11
In
crea
se a
dapt
abilit
y of
sto
rage
cap
acity
St
orag
e fo
r tre
ated
effl
uent
is a
vaila
ble
Stor
age
faci
litie
s si
mila
r to
Jo'b
urg
Wat
er's
Nor
ther
n W
orks
exi
st in
all
met
ropo
litan
are
as.
12
Incr
ease
pro
tect
ion
and
relia
bilit
y of
eco
logi
cal i
nfra
stru
ctur
eEc
olog
ical
rese
rve
is re
defin
ed a
nd s
uffic
ient
N
ew ra
infa
ll m
aps
have
led
to a
new
lim
it fo
r the
eco
logi
cal r
eser
ve, w
hich
is
pro
tect
ed b
y re
gula
tion
23
Impr
ove
perfo
rman
ce, o
ptim
ise
inve
stm
ent i
n in
frast
ruct
ure
S R
un w
ater
as
a fin
anci
ally
sus
tain
able
“bu
sine
ss”
by im
prov
ing
oper
atio
nal p
erfo
rman
ce18
Im
prov
e th
e fin
anci
al s
usta
inab
ility
of th
e w
ater
sys
tem
Non
-reve
nue
wat
er is
bet
ter c
ontro
lled
Non
-reve
nue
wat
er is
bel
ow 1
5%19
Im
prov
e th
e eq
uity
of p
ricin
g20
In
crea
se th
e ac
cura
cy o
f attr
ibut
ion
of w
ater
use
Al
l dom
estic
and
indu
stria
l use
rs a
re o
n m
eter
ed s
uppl
ies
All d
omes
tic a
nd in
dust
rialu
sers
are
on
met
ered
sup
plie
s21
In
crea
se p
ropo
rtion
of w
ater
that
is p
aid
for
22
Impr
ove
perfo
rman
ce o
f rev
enue
col
lect
ion
N
on-re
venu
e w
ater
is b
ette
r con
trolle
dN
on-re
venu
e w
ater
is b
elow
15%
24
Impr
ove
oper
atio
nal e
ffici
enci
es
Leak
det
ectio
n is
impr
oved
All l
eaks
are
det
ecte
d in
und
er 1
2 ho
urs
and
repa
ired
fin u
nder
48
D
Impr
ove
gove
rnan
ce p
lann
ing
and
its im
plem
enta
tion
in th
e m
anag
emen
t of d
eman
d an
d us
e36
In
crea
se tr
ansp
aren
cy o
ver r
ight
s, q
uota
s, a
lloca
tion
and
trans
fers
Con
sum
ers
with
in c
atch
men
ts k
now
eve
ryon
e's
wat
er a
lloca
tion
Nin
e fu
nctio
nal C
atch
men
t Man
agem
ent A
genc
ies
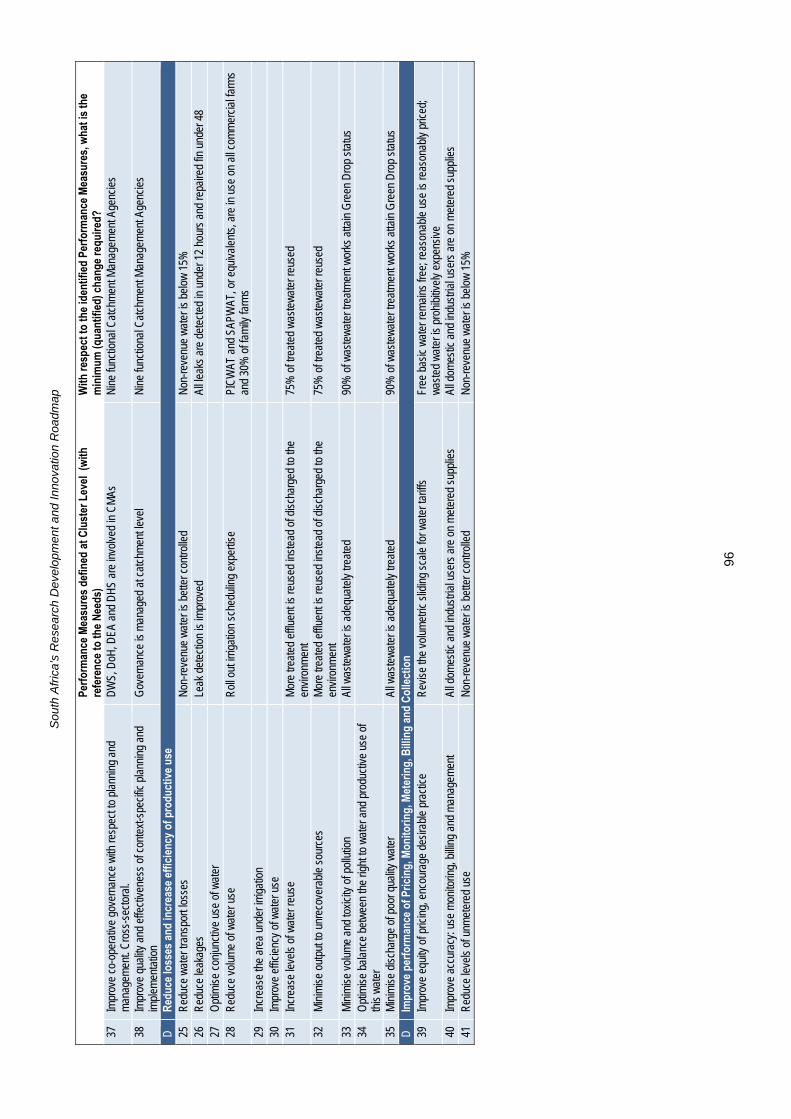
Sou
th A
fric
a’s
Res
ear
ch D
evel
op
men
t and
Inno
vatio
n R
oadm
ap
96
Perf
orm
ance
Mea
sure
s de
fined
at C
lust
er L
evel
(w
ith
refe
renc
e to
the
Nee
ds)
With
resp
ect t
o th
e id
entif
ied
Perf
orm
ance
Mea
sure
s, w
hat i
s th
e m
inim
um (q
uant
ified
) cha
nge
requ
ired?
37
Im
prov
e co
-ope
rativ
e go
vern
ance
with
resp
ect t
o pl
anni
ng a
nd
man
agem
ent.
Cro
ss-s
ecto
ral.
DW
S, D
oH, D
EA a
nd D
HS
are
invo
lved
in C
MAs
N
ine
func
tiona
l Cat
chm
ent M
anag
emen
t Age
ncie
s
38
Impr
ove
qual
ity a
nd e
ffect
iven
ess
of c
onte
xt-s
peci
fic p
lann
ing
and
impl
emen
tatio
n G
over
nanc
e is
man
aged
at c
atch
men
t lev
elN
ine
func
tiona
l Cat
chm
ent M
anag
emen
t Age
ncie
s
D
Red
uce
loss
esan
d in
crea
se e
ffici
ency
of p
rodu
ctiv
e us
e25
R
educ
e w
ater
tran
spor
t los
ses
Non
-reve
nue
wat
er is
bet
ter c
ontro
lled
Non
-reve
nue
wat
er is
bel
ow 1
5%26
R
educ
e le
akag
esLe
ak d
etec
tion
is im
prov
edAl
l lea
ks a
re d
etec
ted
in u
nder
12
hour
s an
d re
paire
d fin
und
er 4
8 27
O
ptim
ise
conj
unct
ive
use
of w
ater
28
R
educ
e vo
lum
e of
wat
er u
seR
oll o
ut ir
rigat
ion
sche
dulin
g ex
perti
sePI
CW
AT a
nd S
APW
AT, o
r equ
ival
ents
, are
in u
se o
n al
l com
mer
cial
farm
s an
d 30
% o
f fam
ily fa
rms
29
Incr
ease
the
area
und
er ir
rigat
ion
30
Im
prov
e ef
ficie
ncy
of w
ater
use
31
In
crea
se le
vels
of w
ater
reus
e
Mor
e tre
ated
effl
uent
is re
used
inst
ead
of d
isch
arge
d to
the
envi
ronm
ent
75%
of t
reat
ed w
aste
wat
er re
used
32
Min
imis
e ou
tput
to u
nrec
over
able
sou
rces
M
ore
treat
ed e
fflue
nt is
reus
ed in
stea
d of
dis
char
ged
to th
e en
viro
nmen
t 75
% o
f tre
ated
was
tew
ater
reus
ed
33
Min
imis
e vo
lum
e an
d to
xici
ty o
f pol
lutio
n Al
l was
tew
ater
is a
dequ
atel
y tre
ated
90%
of w
aste
wat
er tr
eatm
ent w
orks
atta
in G
reen
Dro
p st
atus
34
O
ptim
ise
bala
nce
betw
een
the
right
to w
ater
and
pro
duct
ive
use
of
this
wat
er
35
Min
imis
e di
scha
rge
of p
oor q
ualit
y w
ater
Al
l was
tew
ater
is a
dequ
atel
y tre
ated
90%
of w
aste
wat
er tr
eatm
ent w
orks
atta
in G
reen
Dro
p st
atus
D
Im
prov
e pe
rfor
man
ce o
f Pric
ing,
Mon
itorin
g, M
eter
ing,
Bill
ing
and
Col
lect
ion
39
Impr
ove
equi
ty o
f pric
ing,
enc
oura
ge d
esira
ble
prac
tice
Rev
ise
the
volu
met
ric s
lidin
g sc
ale
for w
ater
tarif
fs
Free
bas
ic w
ater
rem
ains
free
; rea
sona
ble
use
is re
ason
ably
pric
ed;
was
ted
wat
er is
pro
hibi
tivel
y ex
pens
ive
40
Impr
ove
accu
racy
: use
mon
itorin
g, b
illing
and
man
agem
ent
All d
omes
tic a
nd in
dust
rial u
sers
are
on
met
ered
sup
plie
sAl
l dom
estic
and
indu
stria
luse
rs a
re o
n m
eter
ed s
uppl
ies
41
Red
uce
leve
ls o
f unm
eter
ed u
se
Non
-reve
nue
wat
er is
bet
ter c
ontro
lled
Non
-reve
nue
wat
eris
bel
ow 1
5%

South Africa’s Research Development and Innovation Roadmap
97
APPENDIX B: ATTRACTIVENESS OF RDD OPPORTUNITIES ACCORDING TO EACH SECTOR, PER CLUSTER.
Figure B1: Increase ability to make use of more sources of water, including alternatives

South Africa’s Research Development and Innovation Roadmap
98
Figure B2: Improve governance, planning and management of supply and delivery
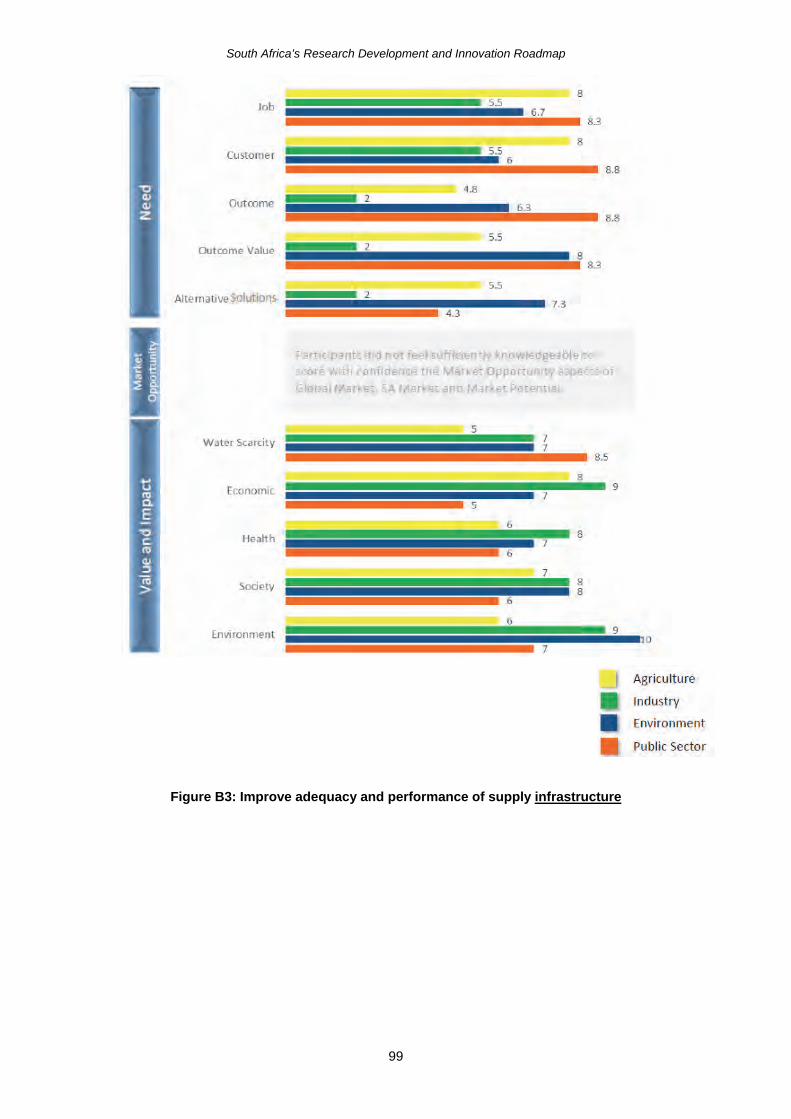
South Africa’s Research Development and Innovation Roadmap
99
Figure B3: Improve adequacy and performance of supply infrastructure
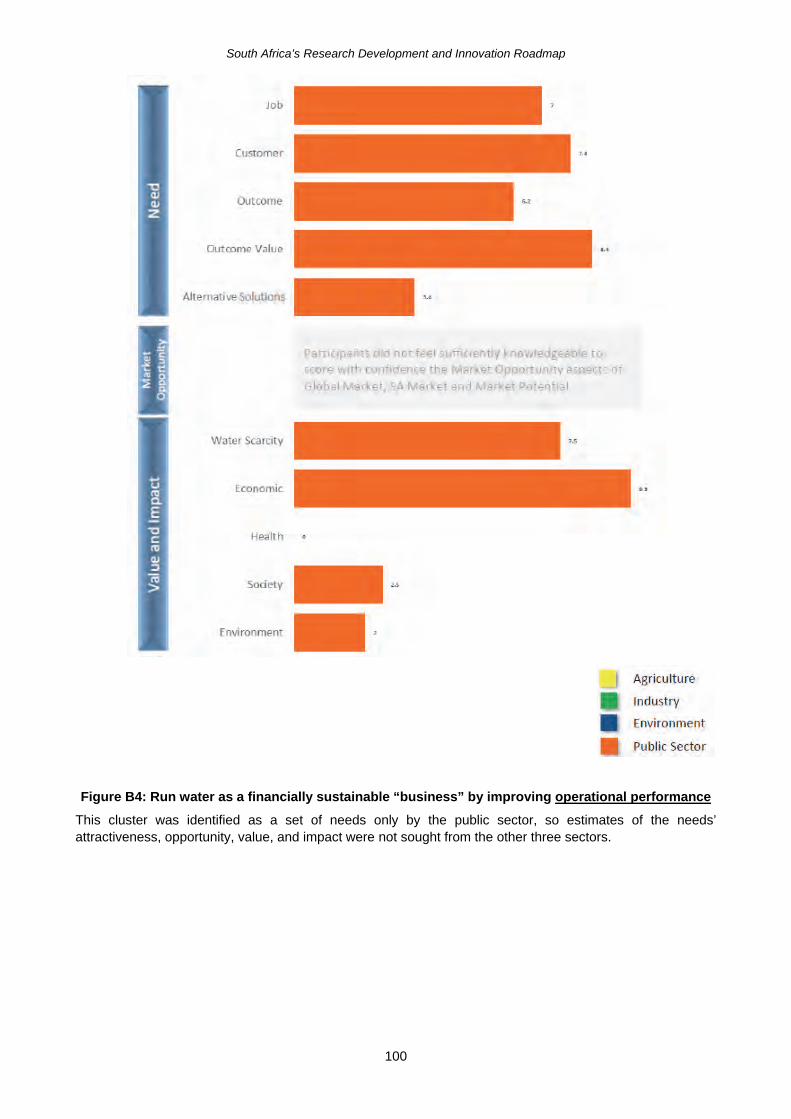
South Africa’s Research Development and Innovation Roadmap
100
Figure B4: Run water as a financially sustainable “business” by improving operational performance
This cluster was identified as a set of needs only by the public sector, so estimates of the needs’ attractiveness, opportunity, value, and impact were not sought from the other three sectors.
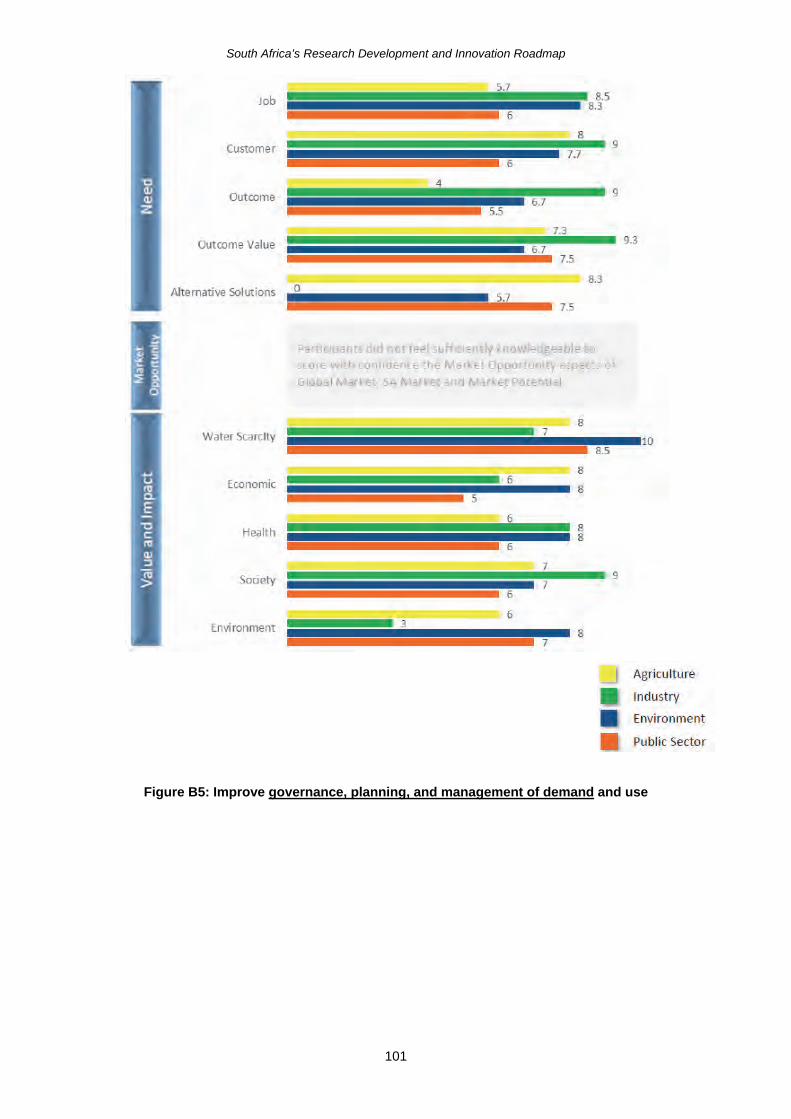
South Africa’s Research Development and Innovation Roadmap
101
Figure B5: Improve governance, planning, and management of demand and use
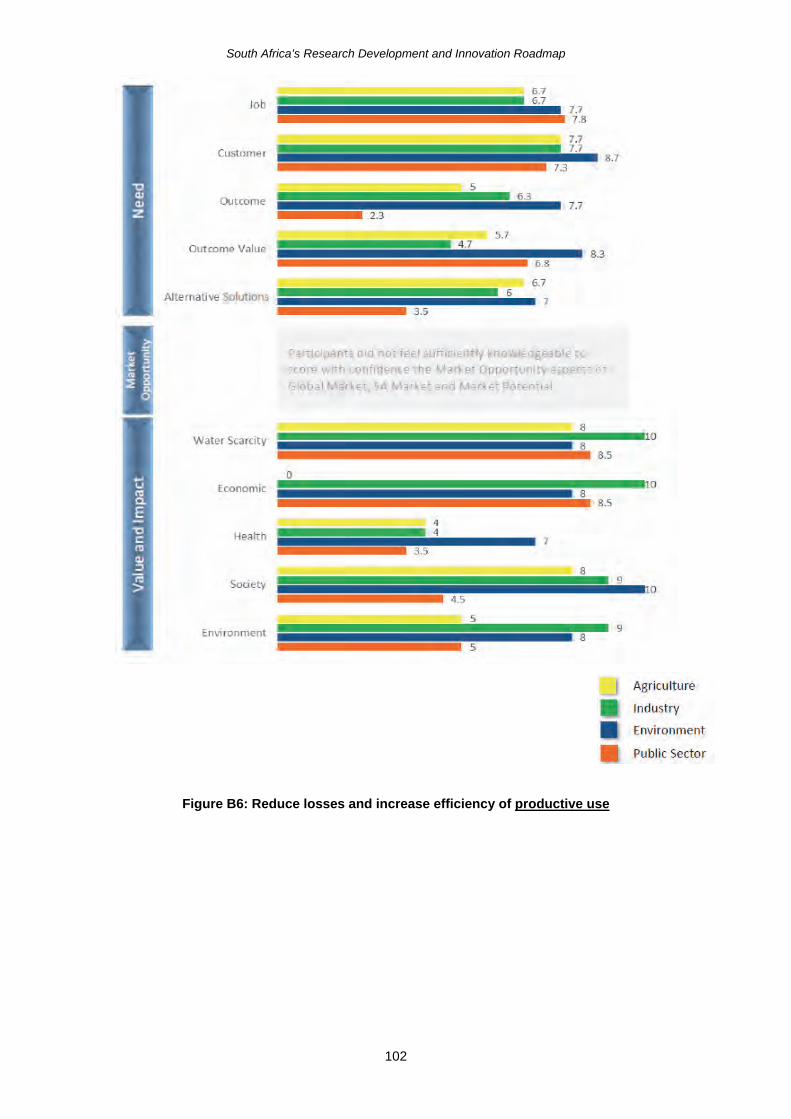
South Africa’s Research Development and Innovation Roadmap
102
Figure B6: Reduce losses and increase efficiency of productive use
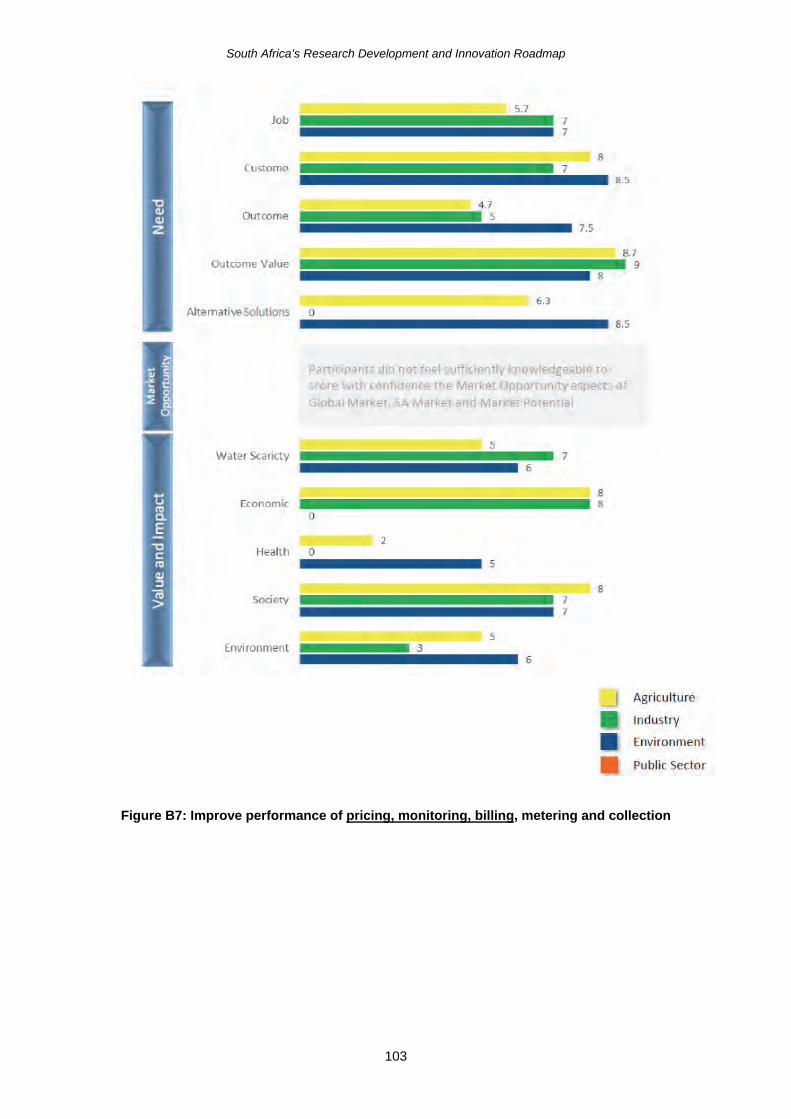
South Africa’s Research Development and Innovation Roadmap
103
Figure B7: Improve performance of pricing, monitoring, billing, metering and collection

Sou
th A
fric
a’s
Res
ear
ch D
evel
op
men
t and
Inno
vatio
n R
oadm
ap
104
AP
PE
ND
IX C
: R
ES
EA
RC
H F
OC
US
AR
EA
S A
ND
TH
EIR
UN
DE
RL
YIN
G D
ISC
IPL
INE
S, M
AP
PE
D
TO
TH
E S
EV
EN
CL
US
TE
RS
OF
NE
ED
S A
ND
INT
ER
VE
NT
ION
S
Dis
cipl
ine
leve
l 1
Dis
cipl
ine
leve
l 2
Dis
cipl
ine
leve
l 3
Res
earc
h fo
cus
area
/ fie
ld o
f re
sear
ch
Sour
ces
Gov
erna
nce,
Pl
anni
ng &
M
anag
emen
t –
Supp
ly
Infr
astr
uctu
re
Op
perf
orm
ance
Gov
erna
nce,
Pl
anni
ng &
M
anag
emen
t –
Dem
and
Prod
uctiv
e us
e
Pric
ing,
m
onito
ring,
bi
lling
Agric
ultu
ral
scie
nces
Ag
ribus
ines
s Ag
riche
mic
als
Impr
oved
food
pro
duct
ion
x Ag
ricul
tura
l sc
ienc
es
Agrib
usin
ess
Cro
p pr
oduc
tion
Impr
oved
food
pro
duct
ion
x x
x x
Agric
ultu
ral
scie
nces
Ag
ribus
ines
s D
istri
butio
n Fo
od s
ecur
ity a
nd b
usin
ess
effic
ienc
y x
x x
x Ag
ricul
tura
l sc
ienc
es
Agrib
usin
ess
Mac
hine
ry
Effic
ient
agr
icul
ture
x
Agric
ultu
ral
scie
nces
Ag
ribus
ines
s M
arke
ting
Busi
ness
effi
cien
cy
x x
x Ag
ricul
tura
l sc
ienc
es
Agrib
usin
ess
Proc
essi
ng
Effic
ient
agr
icul
ture
x
Agric
ultu
ral
scie
nces
Ag
ribus
ines
s Sa
les
Busi
ness
effi
cien
cy
x x
Agric
ultu
ral
scie
nces
Ag
ribus
ines
s Se
ed s
uppl
y C
rop
prod
uctio
n
Agric
ultu
ral
scie
nces
Ag
rofo
rest
ry
Agro
fore
stry
Ag
rofo
rest
ry
x Ag
ricul
tura
l sc
ienc
es
Agro
nom
y H
ortic
ultu
re
Hor
ticul
ture
x
x Ag
ricul
tura
l sc
ienc
es
Agro
nom
y Pr
ecis
ion
agric
ultu
re
Impr
oved
food
pro
duct
ion
x Ag
ricul
tura
l sc
ienc
es
Cro
p sc
ienc
e C
rop
prod
uctio
n an
d ph
ysio
logy
C
rop
prod
uctio
n x
x Ag
ricul
tura
l sc
ienc
es
Cro
p sc
ienc
e G
enet
ics
and
plan
t br
eedi
ng
Cro
p pr
oduc
tion
x Ag
ricul
tura
l sc
ienc
es
Irrig
atio
n an
d dr
aina
ge
scie
nce
engi
neer
ing
Irrig
atio
n an
d dr
aina
ge
scie
nce
engi
neer
ing
Irrig
atio
n an
d dr
aina
ge
x x
x x
x x
Agric
ultu
ral
scie
nces
So
il sc
ienc
e So
il ch
emis
try
Soil
chem
istry
x
x Ag
ricul
tura
l sc
ienc
es
Soil
scie
nce
Soil
ferti
lity
Soil
ferti
lity
x x
Agric
ultu
ral
scie
nces
So
il sc
ienc
e So
il m
anag
emen
t So
il m
anag
emen
t x
x x
x Ag
ricul
tura
l sc
ienc
es
Soil
scie
nce
Soil
mic
robi
olog
y an
d bi
oche
mis
try
Soil
mic
robi
olog
y an
d bi
oche
mis
try
x x
Agric
ultu
ral
scie
nces
So
il sc
ienc
e So
il m
orph
olog
y an
d ge
nesi
s So
il m
orph
olog
y an
d ge
nesi
s x
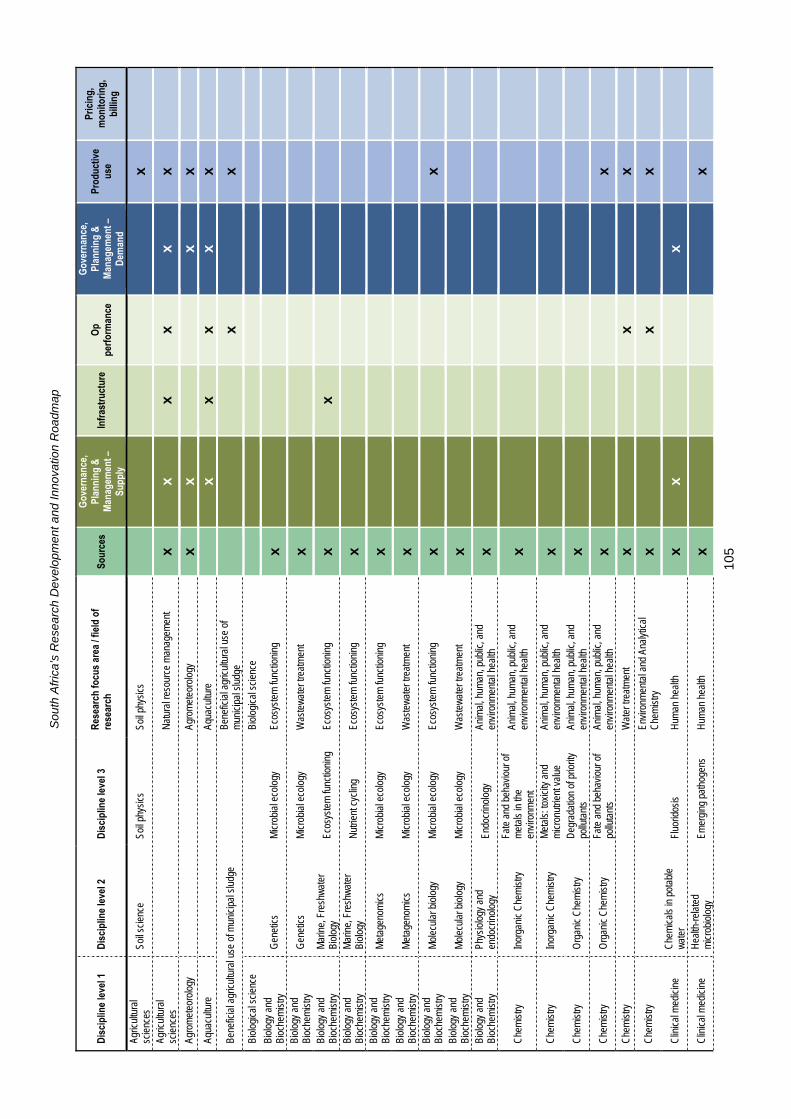
Sou
th A
fric
a’s
Res
ear
ch D
evel
op
men
t and
Inno
vatio
n R
oadm
ap
105
Dis
cipl
ine
leve
l 1
Dis
cipl
ine
leve
l 2
Dis
cipl
ine
leve
l 3
Res
earc
h fo
cus
area
/ fie
ld o
f re
sear
ch
Sour
ces
Gov
erna
nce,
Pl
anni
ng &
M
anag
emen
t –
Supp
ly
Infr
astr
uctu
re
Op
perf
orm
ance
Gov
erna
nce,
Pl
anni
ng &
M
anag
emen
t –
Dem
and
Prod
uctiv
e us
e
Pric
ing,
m
onito
ring,
bi
lling
Agric
ultu
ral
scie
nces
So
il sc
ienc
e So
il ph
ysic
s So
il ph
ysic
s x
Agric
ultu
ral
scie
nces
N
atur
al re
sour
ce m
anag
emen
t x
x x
x x
x
Agro
met
eoro
logy
Ag
rom
eteo
rolo
gy
x x
x x
Aqua
cultu
re
Aqua
cultu
re
x x
x x
x
Bene
ficia
l agr
icul
tura
l use
of m
unic
ipal
slu
dge
Be
nefic
ial a
gric
ultu
ral u
se o
f m
unic
ipal
slu
dge
x x
Biol
ogic
al s
cien
ce
Biol
ogic
al s
cien
ce
Biol
ogy
and
Bioc
hem
istry
G
enet
ics
Mic
robi
al e
colo
gy
Ecos
yste
m fu
nctio
ning
x
Biol
ogy
and
Bioc
hem
istry
G
enet
ics
Mic
robi
al e
colo
gy
Was
tew
ater
trea
tmen
t x
Biol
ogy
and
Bioc
hem
istry
M
arin
e, F
resh
wat
er
Biol
ogy
Ecos
yste
m fu
nctio
ning
Ec
osys
tem
func
tioni
ng
x x
Biol
ogy
and
Bioc
hem
istry
M
arin
e, F
resh
wat
er
Biol
ogy
Nut
rient
cyc
ling
Ecos
yste
m fu
nctio
ning
x
Biol
ogy
and
Bioc
hem
istry
M
etag
enom
ics
Mic
robi
al e
colo
gy
Ecos
yste
m fu
nctio
ning
x
Biol
ogy
and
Bioc
hem
istry
M
etag
enom
ics
Mic
robi
al e
colo
gy
Was
tew
ater
trea
tmen
t x
Biol
ogy
and
Bioc
hem
istry
M
olec
ular
bio
logy
M
icro
bial
eco
logy
Ec
osys
tem
func
tioni
ng
x x
Biol
ogy
and
Bioc
hem
istry
M
olec
ular
bio
logy
M
icro
bial
eco
logy
W
aste
wat
er tr
eatm
ent
x Bi
olog
y an
d Bi
oche
mis
try
Phys
iolo
gy a
nd
endo
crin
olog
y En
docr
inol
ogy
Anim
al, h
uman
, pub
lic, a
nd
envi
ronm
enta
l hea
lth
x
Che
mis
try
Inor
gani
c C
hem
istry
Fa
te a
nd b
ehav
iour
of
met
als
in th
e en
viro
nmen
t
Anim
al, h
uman
, pub
lic, a
nd
envi
ronm
enta
l hea
lth
x
Che
mis
try
Inor
gani
c C
hem
istry
M
etal
s: to
xici
ty a
nd
mic
ronu
trien
t val
ue
Anim
al, h
uman
, pub
lic, a
nd
envi
ronm
enta
l hea
lth
x
Che
mis
try
Org
anic
Che
mis
try
Deg
rada
tion
of p
riorit
y po
lluta
nts
Anim
al, h
uman
, pub
lic, a
nd
envi
ronm
enta
l hea
lth
x
Che
mis
try
Org
anic
Che
mis
try
Fate
and
beh
avio
ur o
f po
lluta
nts
Anim
al, h
uman
, pub
lic, a
nd
envi
ronm
enta
l hea
lth
x x
Che
mis
try
Wat
er tr
eatm
ent
x x
x
Che
mis
try
Envi
ronm
enta
l and
Ana
lytic
al
Che
mis
try
x x
x
Clin
ical
med
icin
e C
hem
ical
s in
pot
able
w
ater
Fl
uorid
osis
H
uman
hea
lth
x x
x
Clin
ical
med
icin
e H
ealth
-rela
ted
mic
robi
olog
y Em
ergi
ng p
atho
gens
H
uman
hea
lth
x x
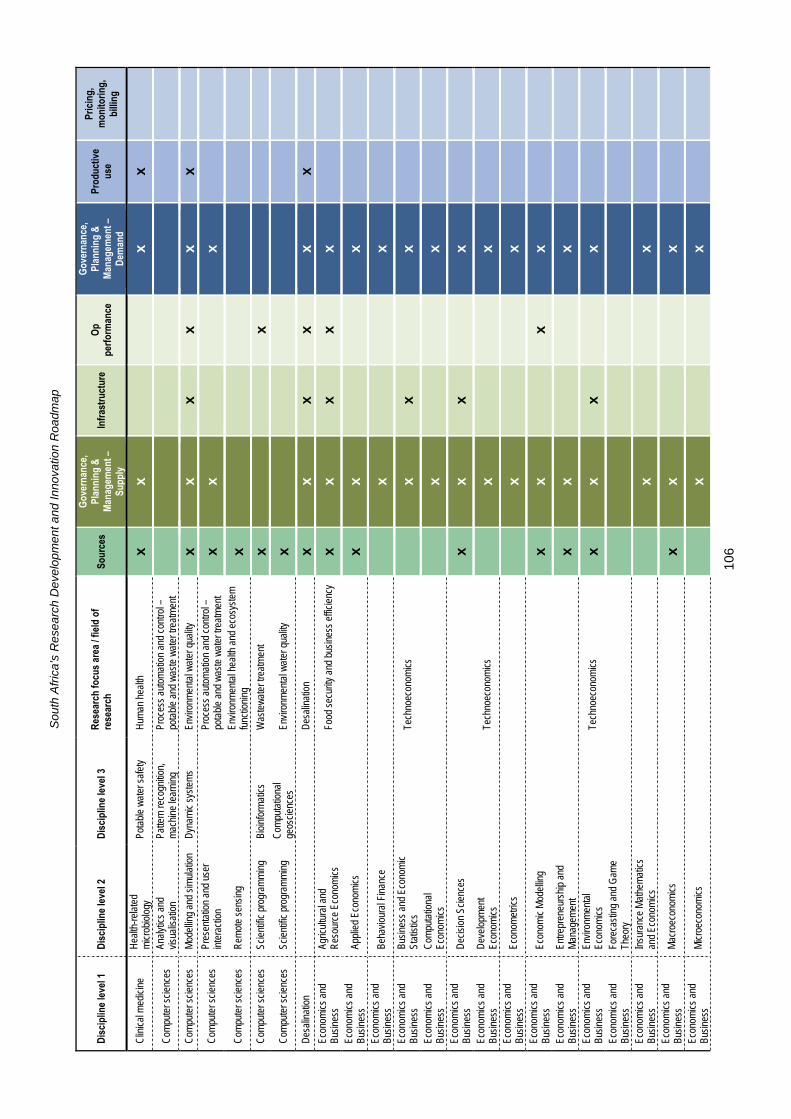
Sou
th A
fric
a’s
Res
ear
ch D
evel
op
men
t and
Inno
vatio
n R
oadm
ap
106
Dis
cipl
ine
leve
l 1
Dis
cipl
ine
leve
l 2
Dis
cipl
ine
leve
l 3
Res
earc
h fo
cus
area
/ fie
ld o
f re
sear
ch
Sour
ces
Gov
erna
nce,
Pl
anni
ng &
M
anag
emen
t –
Supp
ly
Infr
astr
uctu
re
Op
perf
orm
ance
Gov
erna
nce,
Pl
anni
ng &
M
anag
emen
t –
Dem
and
Prod
uctiv
e us
e
Pric
ing,
m
onito
ring,
bi
lling
Clin
ical
med
icin
e H
ealth
-rela
ted
mic
robi
olog
y Po
tabl
e w
ater
saf
ety
Hum
an h
ealth
x
x x
x
Com
pute
r sci
ence
s An
alyt
ics
and
visu
alis
atio
n Pa
ttern
reco
gniti
on,
mac
hine
lear
ning
Pr
oces
s au
tom
atio
n an
d co
ntro
l –po
tabl
e an
d w
aste
wat
er tr
eatm
ent
Com
pute
r sci
ence
s M
odel
ling
and
sim
ulat
ion
Dyn
amic
sys
tem
s En
viro
nmen
tal w
ater
qua
lity
x x
x x
x x
Com
pute
r sci
ence
s Pr
esen
tatio
n an
d us
er
inte
ract
ion
Pr
oces
s au
tom
atio
n an
d co
ntro
l–po
tabl
e an
d w
aste
wat
er tr
eatm
ent
x x
x
Com
pute
r sci
ence
s R
emot
e se
nsin
g
Envi
ronm
enta
l hea
lth a
nd e
cosy
stem
func
tioni
ng
x
Com
pute
r sci
ence
s Sc
ient
ific
prog
ram
min
g Bi
oinf
orm
atic
s W
aste
wat
er tr
eatm
ent
x x
Com
pute
r sci
ence
s Sc
ient
ific
prog
ram
min
g C
ompu
tatio
nal
geos
cien
ces
Envi
ronm
enta
l wat
er q
ualit
y x
Des
alin
atio
n
D
esal
inat
ion
x x
x x
x x
Econ
omic
s an
d Bu
sine
ss
Agric
ultu
ral a
ndR
esou
rce
Econ
omic
s
Food
sec
urity
and
bus
ines
s ef
ficie
ncy
x x
x x
x Ec
onom
ics
and
Busi
ness
Ap
plie
d Ec
onom
ics
x x
x Ec
onom
ics
and
Busi
ness
Be
havi
oura
l Fin
ance
x
x Ec
onom
ics
and
Busi
ness
Bu
sine
ss a
nd E
cono
mic
St
atis
tics
Te
chno
econ
omic
s x
x x
Econ
omic
s an
d Bu
sine
ss
Com
puta
tiona
l Ec
onom
ics
x x
Econ
omic
s an
d Bu
sine
ss
Dec
isio
n Sc
ienc
es
x x
x x
Econ
omic
s an
d Bu
sine
ss
Dev
elop
men
t Ec
onom
ics
Te
chno
econ
omic
s x
x Ec
onom
ics
and
Busi
ness
Ec
onom
etric
s
x
x Ec
onom
ics
and
Busi
ness
Ec
onom
ic M
odel
ling
x x
x x
Econ
omic
s an
d Bu
sine
ss
Entre
pren
eurs
hip
and
Man
agem
ent
x x
x Ec
onom
ics
and
Busi
ness
En
viro
nmen
tal
Econ
omic
s
Tech
noec
onom
ics
x x
x x
Econ
omic
s an
d Bu
sine
ss
Fore
cast
ing
and
Gam
e Th
eory
Ec
onom
ics
and
Busi
ness
In
sura
nce
Mat
hem
atic
s an
d Ec
onom
ics
x x
Econ
omic
s an
d Bu
sine
ss
Mac
roec
onom
ics
x x
x Ec
onom
ics
and
Busi
ness
M
icro
econ
omic
s
x
x
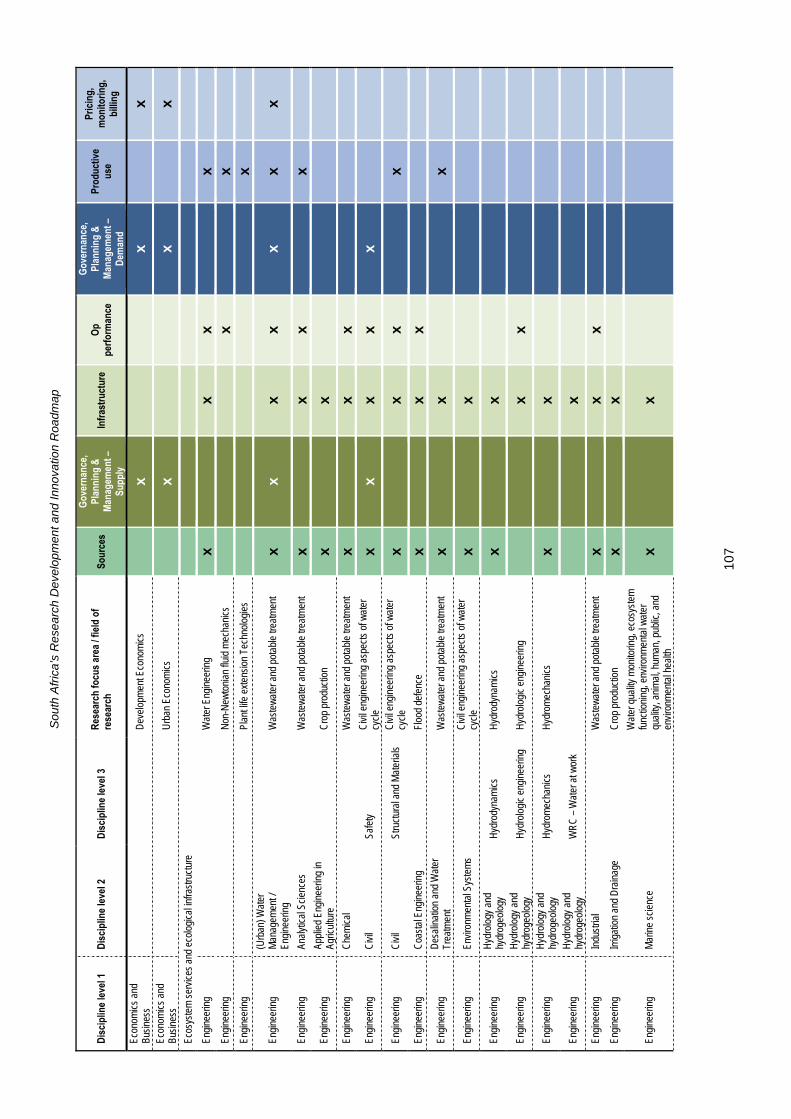
Sou
th A
fric
a’s
Res
ear
ch D
evel
op
men
t and
Inno
vatio
n R
oadm
ap
107
Dis
cipl
ine
leve
l 1
Dis
cipl
ine
leve
l 2
Dis
cipl
ine
leve
l 3
Res
earc
h fo
cus
area
/ fie
ld o
f re
sear
ch
Sour
ces
Gov
erna
nce,
Pl
anni
ng &
M
anag
emen
t –
Supp
ly
Infr
astr
uctu
re
Op
perf
orm
ance
Gov
erna
nce,
Pl
anni
ng &
M
anag
emen
t –
Dem
and
Prod
uctiv
e us
e
Pric
ing,
m
onito
ring,
bi
lling
Econ
omic
s an
d Bu
sine
ss
Dev
elop
men
t Eco
nom
ics
x x
x Ec
onom
ics
and
Busi
ness
U
rban
Eco
nom
ics
x x
x Ec
osys
tem
ser
vice
s an
d ec
olog
ical
infra
stru
ctur
e
En
gine
erin
g
W
ater
Eng
inee
ring
x x
x x
Engi
neer
ing
Non
-New
toni
an fl
uid
mec
hani
cs
x x
Engi
neer
ing
Plan
t life
ext
ensi
on T
echn
olog
ies
x
Engi
neer
ing
(U
rban
) Wat
er
Man
agem
ent /
En
gine
erin
g
Was
tew
ater
and
pot
able
trea
tmen
t x
x x
x x
x x
Engi
neer
ing
An
alyt
ical
Sci
ence
s
Was
tew
ater
and
pot
able
trea
tmen
t x
x x
x
Engi
neer
ing
Ap
plie
d En
gine
erin
g in
Ag
ricul
ture
Cro
p pr
oduc
tion
x x
Engi
neer
ing
C
hem
ical
Was
tew
ater
and
pot
able
trea
tmen
t x
x x
Engi
neer
ing
C
ivil
Safe
ty
Civ
il en
gine
erin
g as
pect
s of
wat
er
cycl
e x
x x
x x
Engi
neer
ing
C
ivil
Stru
ctur
al a
nd M
ater
ials
C
ivil
engi
neer
ing
aspe
cts
of w
ater
cy
cle
x x
x x
Engi
neer
ing
C
oast
al E
ngin
eerin
g
Floo
d de
fenc
e x
x x
Engi
neer
ing
D
esal
inat
ion
and
Wat
er
Trea
tmen
t
Was
tew
ater
and
pot
able
trea
tmen
t x
x x
Engi
neer
ing
En
viro
nmen
tal S
yste
ms
C
ivil
engi
neer
ing
aspe
cts
of w
ater
cy
cle
x x
Engi
neer
ing
H
ydro
logy
and
hy
drog
eolo
gy
Hyd
rody
nam
ics
Hyd
rody
nam
ics
x x
Engi
neer
ing
H
ydro
logy
and
hy
drog
eolo
gy
Hyd
rolo
gic
engi
neer
ing
Hyd
rolo
gic
engi
neer
ing
x x
Engi
neer
ing
H
ydro
logy
and
hy
drog
eolo
gy
Hyd
rom
echa
nics
H
ydro
mec
hani
cs
x x
Engi
neer
ing
H
ydro
logy
and
hy
drog
eolo
gy
WR
C –
Wat
er a
t wor
k
x
Engi
neer
ing
In
dust
rial
W
aste
wat
er a
nd p
otab
le tr
eatm
ent
x x
x En
gine
erin
g
Irrig
atio
n an
d D
rain
age
C
rop
prod
uctio
n x
x
Engi
neer
ing
M
arin
e sc
ienc
e
Wat
er q
ualit
y m
onito
ring,
eco
syst
em
func
tioni
ng, e
nviro
nmen
tal w
ater
qu
ality
, ani
mal
, hum
an, p
ublic
, and
en
viro
nmen
tal h
ealth
x
x
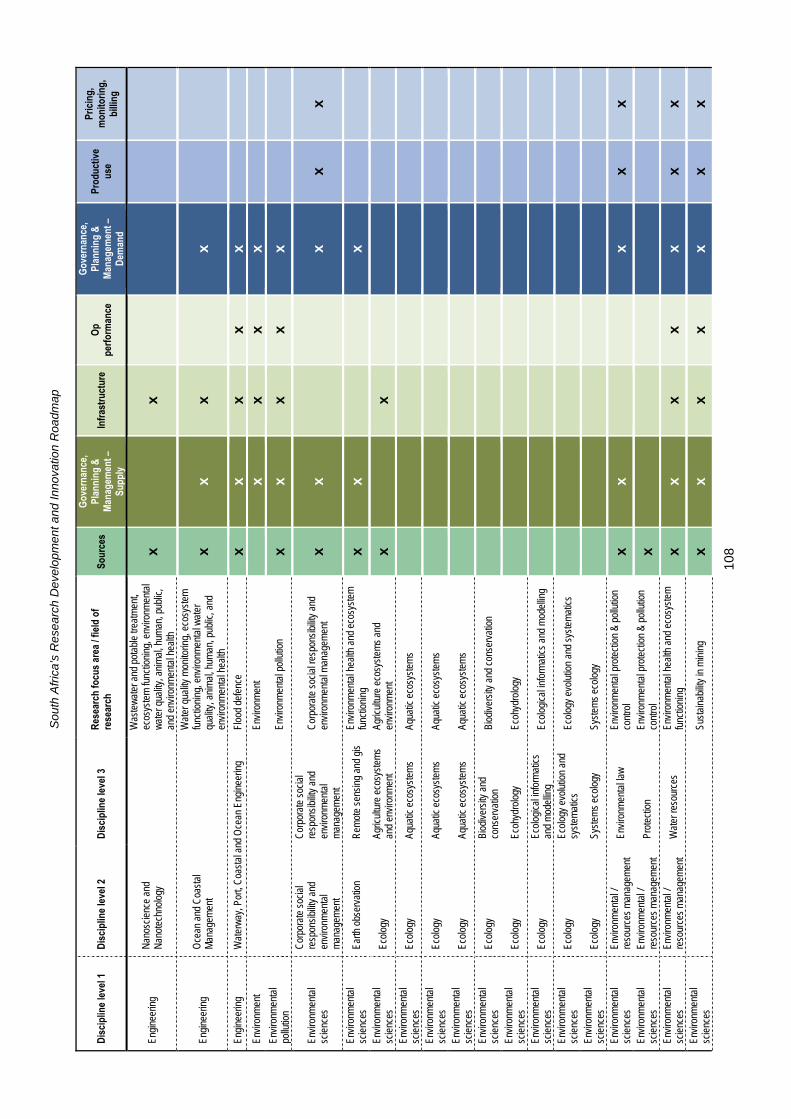
Sou
th A
fric
a’s
Res
ear
ch D
evel
op
men
t and
Inno
vatio
n R
oadm
ap
108
Dis
cipl
ine
leve
l 1
Dis
cipl
ine
leve
l 2
Dis
cipl
ine
leve
l 3
Res
earc
h fo
cus
area
/ fie
ld o
f re
sear
ch
Sour
ces
Gov
erna
nce,
Pl
anni
ng &
M
anag
emen
t –
Supp
ly
Infr
astr
uctu
re
Op
perf
orm
ance
Gov
erna
nce,
Pl
anni
ng &
M
anag
emen
t –
Dem
and
Prod
uctiv
e us
e
Pric
ing,
m
onito
ring,
bi
lling
Engi
neer
ing
N
anos
cien
ce a
nd
Nan
otec
hnol
ogy
W
aste
wat
er a
nd p
otab
le tr
eatm
ent,
ecos
yste
m fu
nctio
ning
, env
ironm
enta
l w
ater
qua
lity,
ani
mal
, hum
an, p
ublic
, an
d en
viro
nmen
tal h
ealth
x
x
Engi
neer
ing
O
cean
and
Coa
stal
M
anag
emen
t
Wat
er q
ualit
y m
onito
ring,
eco
syst
em
func
tioni
ng, e
nviro
nmen
tal w
ater
qu
ality
, ani
mal
, hum
an, p
ublic
, and
en
viro
nmen
tal h
ealth
x x
x
x
Engi
neer
ing
W
ater
way
, Por
t, C
oast
al a
nd O
cean
Eng
inee
ring
Floo
d de
fenc
e x
x x
x x
Envi
ronm
ent
Envi
ronm
ent
x x
x x
Envi
ronm
enta
l po
llutio
n
En
viro
nmen
tal p
ollu
tion
x x
x x
x
Envi
ronm
enta
l sc
ienc
es
Cor
pora
te s
ocia
l re
spon
sibi
lity
and
envi
ronm
enta
l m
anag
emen
t
Cor
pora
te s
ocia
l re
spon
sibi
lity
and
envi
ronm
enta
l m
anag
emen
t
Cor
pora
te s
ocia
l res
pons
ibilit
y an
d en
viro
nmen
tal m
anag
emen
t x
x
x
x x
Envi
ronm
enta
l sc
ienc
es
Earth
obs
erva
tion
Rem
ote
sens
ing
and
gis
Envi
ronm
enta
lhea
lth a
nd e
cosy
stem
fu
nctio
ning
x
x x
Envi
ronm
enta
l sc
ienc
es
Ecol
ogy
Agric
ultu
re e
cosy
stem
s an
d en
viro
nmen
t Ag
ricul
ture
eco
syst
ems
and
envi
ronm
ent
x x
Envi
ronm
enta
l sc
ienc
es
Ecol
ogy
Aqua
tic e
cosy
stem
s Aq
uatic
eco
syst
ems
Envi
ronm
enta
l sc
ienc
es
Ecol
ogy
Aqua
tic e
cosy
stem
s Aq
uatic
eco
syst
ems
Envi
ronm
enta
l sc
ienc
es
Ecol
ogy
Aqua
tic e
cosy
stem
s Aq
uatic
eco
syst
ems
Envi
ronm
enta
l sc
ienc
es
Ecol
ogy
Biod
iver
sity
and
co
nser
vatio
n Bi
odiv
ersi
ty a
nd c
onse
rvat
ion
Envi
ronm
enta
l sc
ienc
es
Ecol
ogy
Ecoh
ydro
logy
Ec
ohyd
rolo
gy
Envi
ronm
enta
l sc
ienc
es
Ecol
ogy
Ecol
ogic
al in
form
atic
s an
d m
odel
ling
Ecol
ogic
al in
form
atic
s an
d m
odel
ling
Envi
ronm
enta
l sc
ienc
es
Ecol
ogy
Ecol
ogy
evol
utio
n an
d sy
stem
atic
s Ec
olog
y ev
olut
ion
and
syst
emat
ics
Envi
ronm
enta
l sc
ienc
es
Ecol
ogy
Syst
ems
ecol
ogy
Syst
ems
ecol
ogy
Envi
ronm
enta
l sc
ienc
es
Envi
ronm
enta
l /
reso
urce
s m
anag
emen
t En
viro
nmen
tal l
aw
Envi
ronm
enta
l pro
tect
ion
& po
llutio
n co
ntro
l x
x x
x x
Envi
ronm
enta
l sc
ienc
es
Envi
ronm
enta
l /
reso
urce
s m
anag
emen
t Pr
otec
tion
Envi
ronm
enta
l pro
tect
ion
& po
llutio
n co
ntro
l x
Envi
ronm
enta
l sc
ienc
es
Envi
ronm
enta
l /
reso
urce
s m
anag
emen
t W
ater
reso
urce
s En
viro
nmen
tal h
ealth
and
eco
syst
em
func
tioni
ng
x x
x x
x x
x En
viro
nmen
tal
scie
nces
Su
stai
nabi
lity
in m
inin
g x
x x
x x
x x

Sou
th A
fric
a’s
Res
ear
ch D
evel
op
men
t and
Inno
vatio
n R
oadm
ap
109
Dis
cipl
ine
leve
l 1
Dis
cipl
ine
leve
l 2
Dis
cipl
ine
leve
l 3
Res
earc
h fo
cus
area
/ fie
ld o
f re
sear
ch
Sour
ces
Gov
erna
nce,
Pl
anni
ng &
M
anag
emen
t –
Supp
ly
Infr
astr
uctu
re
Op
perf
orm
ance
Gov
erna
nce,
Pl
anni
ng &
M
anag
emen
t –
Dem
and
Prod
uctiv
e us
e
Pric
ing,
m
onito
ring,
bi
lling
Envi
ronm
enta
l sc
ienc
es
Clim
atol
ogy
x x
x x
x En
viro
nmen
tal
scie
nces
Ec
osys
tem
ser
vice
s an
d ec
olog
ical
in
frast
ruct
ure
x x
x x
Envi
ronm
enta
l sc
ienc
es
Wat
er s
cien
ce
x x
x En
viro
nmen
tal
scie
nces
W
ater
reso
urce
gov
erna
nce
and
man
agem
ent
x x
x x
x G
eom
embr
ane
linin
gs a
nd c
over
s fo
r pot
able
w
ater
sto
rage
Geo
mem
bran
e lin
ings
and
cov
ers
for
pota
ble
wat
er s
tora
ge
x x
x x
x
Geo
scie
nces
At
mos
pher
ic S
cien
ces
Clim
atol
ogy
Clim
ate
dyna
mic
s, re
silie
nce,
ad
apta
tion
x x
x x
Geo
scie
nces
At
mos
pher
ic S
cien
ces
Met
eoro
logy
W
eath
er a
nd F
orec
astin
g x
x x
x G
eosc
ienc
es
Atm
osph
eric
Sci
ence
s M
eteo
rolo
gy
Agric
ultu
ral M
eteo
rolo
gy
x G
eosc
ienc
es
Atm
osph
eric
Sci
ence
s M
eteo
rolo
gyH
ydro
met
eoro
logy
Geo
scie
nces
Ea
rth S
cien
ces
Earth
Sci
ence
In
form
atic
s
Wat
er q
ualit
y m
onito
ring,
eco
syst
em
func
tioni
ng, e
nviro
nmen
tal w
ater
qu
ality
, ani
mal
, hum
an, p
ublic
, and
en
viro
nmen
tal h
ealth
x x
x
Geo
scie
nces
Ea
rth S
cien
ces
Geo
logy
En
viro
nmen
tal h
ealth
and
eco
syst
em
func
tioni
ng
x
Geo
scie
nces
Ea
rth S
cien
ces
Geo
mor
phol
ogy
Envi
ronm
enta
l hea
lth a
nd e
cosy
stem
fu
nctio
ning
Geo
scie
nces
Ea
rth S
cien
ces
Icht
hyol
ogy
Wat
er q
ualit
y m
onito
ring,
eco
syst
em
func
tioni
ng, e
nviro
nmen
tal w
ater
qu
ality
, ani
mal
hea
lth
Geo
scie
nces
Ea
rth S
cien
ces
Min
eral
ogy
Envi
ronm
enta
l hea
lth a
nd e
cosy
stem
fu
nctio
ning
Geo
scie
nces
G
eogr
aphy
Wat
er q
ualit
y m
onito
ring,
eco
syst
em
func
tioni
ng, e
nviro
nmen
tal w
ater
qu
ality
, ani
mal
, hum
an, p
ublic
, and
en
viro
nmen
tal h
ealth
Geo
scie
nces
H
ydro
logy
Ec
ohyd
rolo
gy
Ecoh
ydro
logy
x
Geo
scie
nces
H
ydro
logy
Su
bsur
face
hyd
rolo
gy
Subs
urfa
ce h
ydro
logy
x
x x
Geo
scie
nces
H
ydro
logy
Su
bsur
face
hyd
rolo
gy
Hyd
rolo
gy
x x
x x
Geo
scie
nces
H
ydro
logy
Su
bsur
face
hyd
rolo
gy
Con
tam
inan
t hyd
rolo
gy
x G
eosc
ienc
es
Hyd
rolo
gySu
bsur
face
hyd
rolo
gyU
nsat
urat
ed z
one
Geo
scie
nces
H
ydro
logy
Su
rface
hyd
rolo
gy
Cat
chm
ent h
ydro
logy
x
x x
x G
eosc
ienc
es
Hyd
rolo
gy
Surfa
ce h
ydro
logy
La
nd s
urfa
ce h
ydro
logy
x
x G
eosc
ienc
es
Hyd
rolo
gy
Surfa
ce h
ydro
logy
H
ydro
met
eoro
logy
x
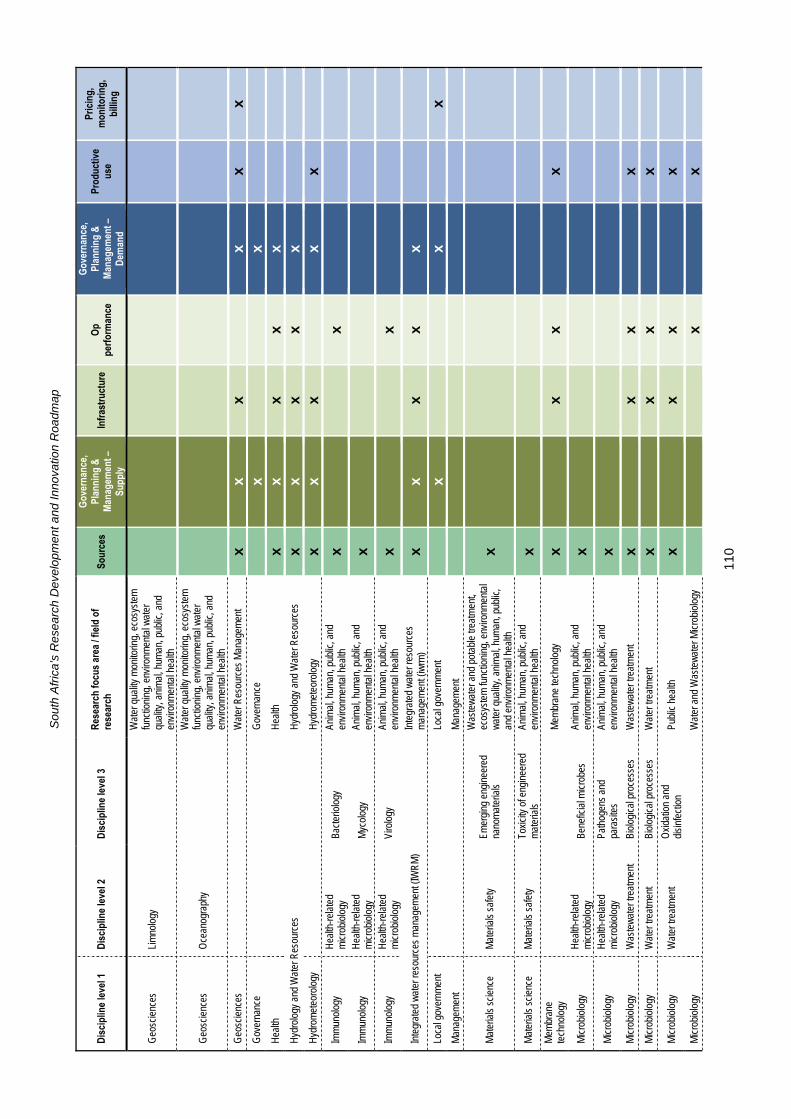
Sou
th A
fric
a’s
Res
ear
ch D
evel
op
men
t and
Inno
vatio
n R
oadm
ap
110
Dis
cipl
ine
leve
l 1
Dis
cipl
ine
leve
l 2
Dis
cipl
ine
leve
l 3
Res
earc
h fo
cus
area
/ fie
ld o
f re
sear
ch
Sour
ces
Gov
erna
nce,
Pl
anni
ng &
M
anag
emen
t –
Supp
ly
Infr
astr
uctu
re
Op
perf
orm
ance
Gov
erna
nce,
Pl
anni
ng &
M
anag
emen
t –
Dem
and
Prod
uctiv
e us
e
Pric
ing,
m
onito
ring,
bi
lling
Geo
scie
nces
Li
mno
logy
Wat
er q
ualit
y m
onito
ring,
eco
syst
em
func
tioni
ng, e
nviro
nmen
tal w
ater
qu
ality
, ani
mal
, hum
an, p
ublic
, and
en
viro
nmen
tal h
ealth
Geo
scie
nces
O
cean
ogra
phy
W
ater
qua
lity
mon
itorin
g, e
cosy
stem
fu
nctio
ning
, env
ironm
enta
l wat
er
qual
ity, a
nim
al, h
uman
, pub
lic, a
nd
envi
ronm
enta
l hea
lth
Geo
scie
nces
W
ater
Res
ourc
es M
anag
emen
t x
x x
x x
x G
over
nanc
e
G
over
nanc
e x
x H
ealth
H
ealth
x
x x
x x
Hyd
rolo
gy a
nd W
ater
Res
ourc
es
H
ydro
logy
and
Wat
er R
esou
rces
x
x x
x x
Hyd
rom
eteo
rolo
gy
Hyd
rom
eteo
rolo
gy
x x
x x
x
Imm
unol
ogy
Hea
lth-re
late
d m
icro
biol
ogy
Bact
erio
logy
An
imal
, hum
an, p
ublic
, and
en
viro
nmen
tal h
ealth
x
x
Imm
unol
ogy
Hea
lth-re
late
d m
icro
biol
ogy
Myc
olog
y An
imal
, hum
an, p
ublic
, and
en
viro
nmen
tal h
ealth
x
Imm
unol
ogy
Hea
lth-re
late
d m
icro
biol
ogy
Viro
logy
An
imal
, hum
an, p
ublic
, and
en
viro
nmen
tal h
ealth
x
x
Inte
grat
ed w
ater
reso
urce
s m
anag
emen
t (IW
RM
)
Inte
grat
ed w
ater
reso
urce
s m
anag
emen
t (iw
rm)
x x
x x
x
Loca
l gov
ernm
ent
Loca
l gov
ernm
ent
x x
x M
anag
emen
t
M
anag
emen
t
Mat
eria
ls s
cien
ce
Mat
eria
ls s
afet
y Em
ergi
ng e
ngin
eere
d na
nom
ater
ials
Was
tew
ater
and
pot
able
trea
tmen
t, ec
osys
tem
func
tioni
ng, e
nviro
nmen
tal
wat
er q
ualit
y, a
nim
al, h
uman
, pub
lic,
and
envi
ronm
enta
l hea
lth
x
Mat
eria
ls s
cien
ce
Mat
eria
ls s
afet
y To
xici
ty o
f eng
inee
red
mat
eria
ls
Anim
al, h
uman
, pub
lic, a
nd
envi
ronm
enta
l hea
lth
x M
embr
ane
tech
nolo
gy
Mem
bran
e te
chno
logy
x
x x
x
Mic
robi
olog
y H
ealth
-rela
ted
mic
robi
olog
y Be
nefic
ial m
icro
bes
Anim
al, h
uman
, pub
lic, a
nd
envi
ronm
enta
l hea
lth
x
Mic
robi
olog
y H
ealth
-rela
ted
mic
robi
olog
y Pa
thog
ens
and
para
site
s An
imal
, hum
an, p
ublic
, and
en
viro
nmen
tal h
ealth
x
Mic
robi
olog
y W
aste
wat
er tr
eatm
ent
Biol
ogic
al p
roce
sses
W
aste
wat
er tr
eatm
ent
x x
x x
Mic
robi
olog
y W
ater
trea
tmen
t Bi
olog
ical
pro
cess
es
Wat
er tr
eatm
ent
x x
x x
Mic
robi
olog
y W
ater
trea
tmen
t O
xida
tion
and
disi
nfec
tion
Publ
ic h
ealth
x
x x
x
Mic
robi
olog
y
W
ater
and
Was
tew
ater
Mic
robi
olog
y x
x
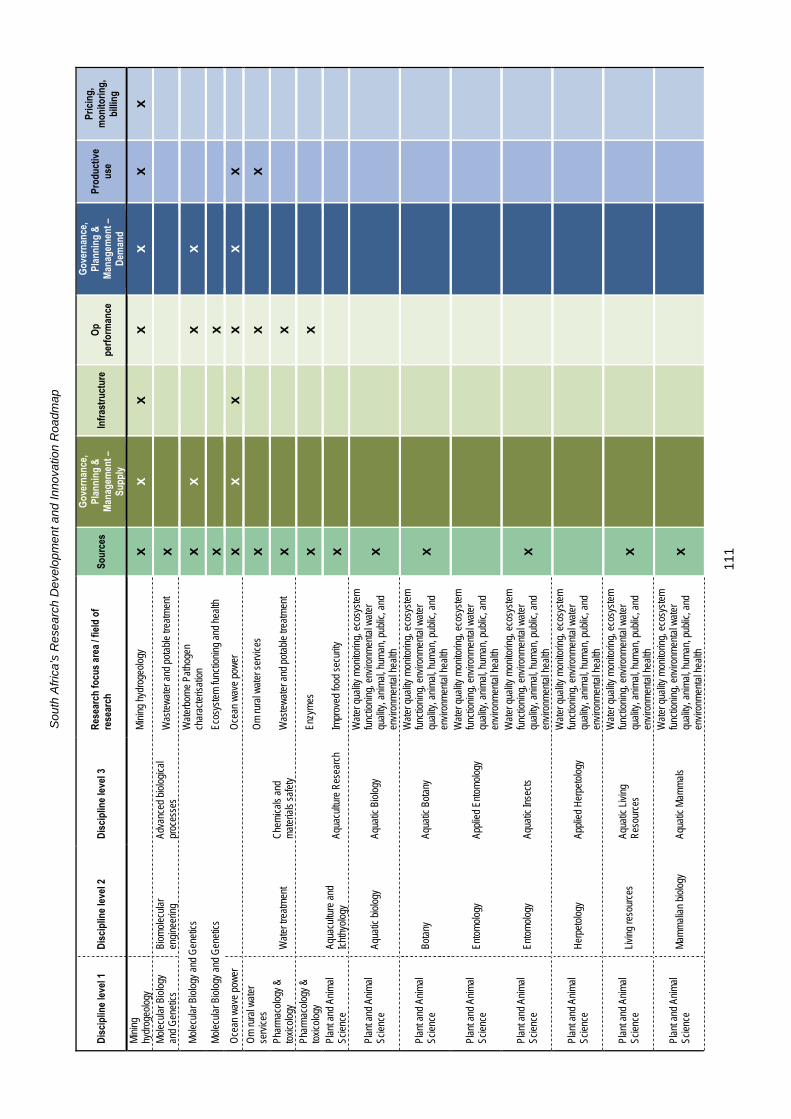
Sou
th A
fric
a’s
Res
ear
ch D
evel
op
men
t and
Inno
vatio
n R
oadm
ap
111
Dis
cipl
ine
leve
l 1
Dis
cipl
ine
leve
l 2
Dis
cipl
ine
leve
l 3
Res
earc
h fo
cus
area
/ fie
ld o
f re
sear
ch
Sour
ces
Gov
erna
nce,
Pl
anni
ng &
M
anag
emen
t –
Supp
ly
Infr
astr
uctu
re
Op
perf
orm
ance
Gov
erna
nce,
Pl
anni
ng &
M
anag
emen
t –
Dem
and
Prod
uctiv
e us
e
Pric
ing,
m
onito
ring,
bi
lling
Min
ing
hydr
ogeo
logy
M
inin
g hy
drog
eolo
gy
x x
x x
x x
x M
olec
ular
Bio
logy
an
d G
enet
ics
Biom
olec
ular
engi
neer
ing
Adva
nced
bio
logi
cal
proc
esse
s W
aste
wat
er a
nd p
otab
le tr
eatm
ent
x
Mol
ecul
ar B
iolo
gy a
nd G
enet
ics
W
ater
born
e Pa
thog
en
char
acte
risat
ion
x x
x x
Mol
ecul
ar B
iolo
gy a
nd G
enet
ics
Ec
osys
tem
func
tioni
ng a
nd h
ealth
x
x O
cean
wav
e po
wer
O
cean
wav
e po
wer
x
x x
x x
x O
m ru
ral w
ater
se
rvic
es
Om
rura
l wat
er s
ervi
ces
x x
x Ph
arm
acol
ogy
& to
xico
logy
W
ater
trea
tmen
t C
hem
ical
s an
d m
ater
ials
saf
ety
Was
tew
ater
and
pot
able
trea
tmen
t x
x Ph
arm
acol
ogy
& to
xico
logy
En
zym
es
x x
Plan
t and
Ani
mal
Sc
ienc
e Aq
uacu
lture
and
Ic
hthy
olog
y Aq
uacu
lture
Res
earc
h Im
prov
ed fo
od s
ecur
ity
x
Plan
t and
Ani
mal
Sc
ienc
e Aq
uatic
bio
logy
Aq
uatic
Bio
logy
Wat
er q
ualit
y m
onito
ring,
eco
syst
em
func
tioni
ng, e
nviro
nmen
tal w
ater
qu
ality
, ani
mal
, hum
an, p
ublic
, and
en
viro
nmen
tal h
ealth
x
Plan
t and
Ani
mal
Sc
ienc
e Bo
tany
Aq
uatic
Bot
any
Wat
er q
ualit
y m
onito
ring,
eco
syst
em
func
tioni
ng, e
nviro
nmen
tal w
ater
qu
ality
, ani
mal
, hum
an, p
ublic
, and
en
viro
nmen
tal h
ealth
x
Plan
t and
Ani
mal
Sc
ienc
e En
tom
olog
y Ap
plie
d En
tom
olog
y
Wat
er q
ualit
y m
onito
ring,
eco
syst
em
func
tioni
ng, e
nviro
nmen
tal w
ater
qu
ality
, ani
mal
, hum
an, p
ublic
, and
en
viro
nmen
tal h
ealth
Plan
t and
Ani
mal
Sc
ienc
e En
tom
olog
y Aq
uatic
Inse
cts
Wat
er q
ualit
y m
onito
ring,
eco
syst
em
func
tioni
ng, e
nviro
nmen
tal w
ater
qu
ality
, ani
mal
, hum
an, p
ublic
, and
en
viro
nmen
tal h
ealth
x
Plan
t and
Ani
mal
Sc
ienc
e H
erpe
tolo
gy
Appl
ied
Her
peto
logy
Wat
er q
ualit
y m
onito
ring,
eco
syst
em
func
tioni
ng, e
nviro
nmen
tal w
ater
qu
ality
, ani
mal
, hum
an, p
ublic
, and
en
viro
nmen
tal h
ealth
Plan
t and
Ani
mal
Sc
ienc
e Li
ving
reso
urce
s Aq
uatic
Liv
ing
Res
ourc
es
Wat
er q
ualit
y m
onito
ring,
eco
syst
em
func
tioni
ng, e
nviro
nmen
tal w
ater
qu
ality
, ani
mal
, hum
an, p
ublic
, and
en
viro
nmen
tal h
ealth
x
Plan
t and
Ani
mal
Sc
ienc
e M
amm
alia
n bi
olog
y Aq
uatic
Mam
mal
s
Wat
er q
ualit
y m
onito
ring,
eco
syst
em
func
tioni
ng, e
nviro
nmen
tal w
ater
qu
ality
, ani
mal
, hum
an, p
ublic
, and
en
viro
nmen
tal h
ealth
x

Sou
th A
fric
a’s
Res
ear
ch D
evel
op
men
t and
Inno
vatio
n R
oadm
ap
112
Dis
cipl
ine
leve
l 1
Dis
cipl
ine
leve
l 2
Dis
cipl
ine
leve
l 3
Res
earc
h fo
cus
area
/ fie
ld o
f re
sear
ch
Sour
ces
Gov
erna
nce,
Pl
anni
ng &
M
anag
emen
t –
Supp
ly
Infr
astr
uctu
re
Op
perf
orm
ance
Gov
erna
nce,
Pl
anni
ng &
M
anag
emen
t –
Dem
and
Prod
uctiv
e us
e
Pric
ing,
m
onito
ring,
bi
lling
Plan
t and
Ani
mal
Sc
ienc
e M
icro
bial
eco
logy
Aq
uatic
Mic
robi
al
Ecol
ogy
Wat
er q
ualit
y m
onito
ring,
eco
syst
em
func
tioni
ng, e
nviro
nmen
tal w
ater
qu
ality
, ani
mal
, hum
an, p
ublic
, and
en
viro
nmen
tal h
ealth
x
Plan
t and
Ani
mal
Sc
ienc
e To
xico
logy
Aq
uatic
Tox
icol
ogy
Wat
er q
ualit
y m
onito
ring,
eco
syst
em
func
tioni
ng, e
nviro
nmen
tal w
ater
qu
ality
, ani
mal
, hum
an, p
ublic
, and
en
viro
nmen
tal h
ealth
x
Publ
ic p
artic
ipat
ion
Publ
ic p
artic
ipat
ion
x x
Riv
er B
asin
m
anag
emen
t
R
iver
Bas
in m
anag
emen
t x
x x
x x
Sani
tatio
n
Sa
nita
tion
x x
x x
x So
cial
Sci
ence
and
H
uman
ities
An
thro
polo
gy
H
uman
, pub
lic, a
nd e
nviro
nmen
tal
heal
th
x x
x x
Soci
al S
cien
ce a
nd
Hum
aniti
es
Com
mun
icat
ions
Sc
ienc
e C
omm
unic
atio
n Ed
ucat
ion
x x
x x
x x
x So
cial
Sci
ence
and
H
uman
ities
D
evel
opm
ent S
tudi
es
x x
Soci
al S
cien
ce a
nd
Hum
aniti
es
Educ
atio
n Ag
ricul
ture
Ed
ucat
ion
x x
Soci
al S
cien
ce a
nd
Hum
aniti
es
Educ
atio
n Sc
ienc
e Ed
ucat
ion
Educ
atio
n x
x x
x So
cial
Sci
ence
and
H
uman
ities
G
ende
r Stu
dies
x
x So
cial
Sci
ence
and
H
uman
ities
H
isto
ry
x x
Soci
al S
cien
ce a
nd
Hum
aniti
es
Law
x
x x
x x
Soci
al S
cien
ce a
nd
Hum
aniti
es
Libr
ary
and
info
rmat
ion
scie
nce
Dig
ital r
ecor
ds
man
agem
ent a
nd
arch
ival
stu
dies
x
Soci
al S
cien
ce a
nd
Hum
aniti
es
Philo
soph
y
Bioe
thic
s x
Soci
al S
cien
ce a
nd
Hum
aniti
es
Polit
ical
Sci
ence
In
tern
atio
nal R
elat
ions
x x
x x
Soci
al S
cien
ce a
nd
Hum
aniti
es
Polit
ical
Sci
ence
Pu
blic
Adm
inis
tratio
n
x x
x x
x x
x So
cial
Sci
ence
and
H
uman
ities
Po
litic
al S
cien
ce
Publ
ic P
olic
y
x x
x x
x x
Soci
al S
cien
ce a
nd
Hum
aniti
es
Polit
ical
Sci
ence
Se
curit
y St
udie
s
x x
x x
Soci
al S
cien
ce a
nd
Hum
aniti
es
Publ
ic H
ealth
H
ealth
Pla
nnin
g H
uman
, pub
lic, a
nd e
nviro
nmen
tal
heal
th
x x
x x
x
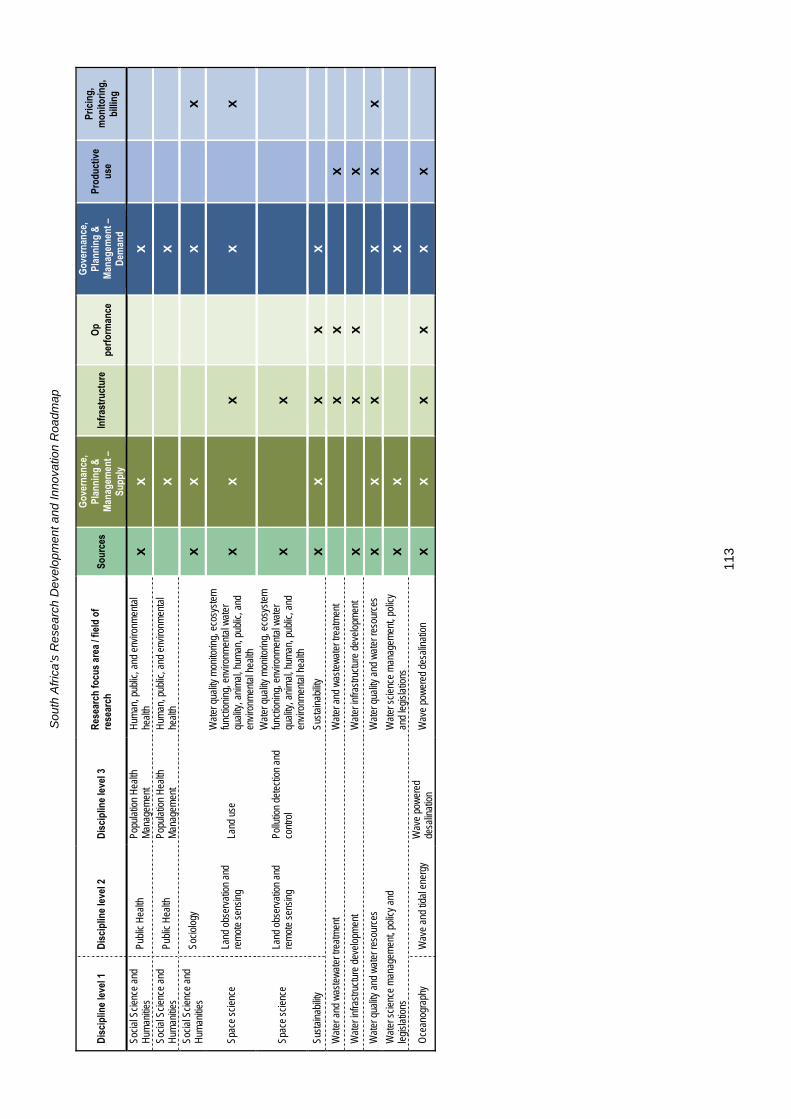
Sou
th A
fric
a’s
Res
ear
ch D
evel
op
men
t and
Inno
vatio
n R
oadm
ap
113
Dis
cipl
ine
leve
l 1
Dis
cipl
ine
leve
l 2
Dis
cipl
ine
leve
l 3
Res
earc
h fo
cus
area
/ fie
ld o
f re
sear
ch
Sour
ces
Gov
erna
nce,
Pl
anni
ng &
M
anag
emen
t –
Supp
ly
Infr
astr
uctu
re
Op
perf
orm
ance
Gov
erna
nce,
Pl
anni
ng &
M
anag
emen
t –
Dem
and
Prod
uctiv
e us
e
Pric
ing,
m
onito
ring,
bi
lling
Soci
al S
cien
ce a
nd
Hum
aniti
es
Publ
ic H
ealth
Po
pula
tion
Hea
lth
Man
agem
ent
Hum
an, p
ublic
, and
env
ironm
enta
l he
alth
x
x x
Soci
al S
cien
ce a
nd
Hum
aniti
es
Publ
ic H
ealth
Po
pula
tion
Hea
lth
Man
agem
ent
Hum
an, p
ublic
, and
env
ironm
enta
l he
alth
x
x So
cial
Sci
ence
and
H
uman
ities
So
ciol
ogy
x x
x x
Spac
e sc
ienc
e La
nd o
bser
vatio
n an
d re
mot
e se
nsin
g La
nd u
se
Wat
er q
ualit
y m
onito
ring,
eco
syst
em
func
tioni
ng, e
nviro
nmen
tal w
ater
qu
ality
, ani
mal
, hum
an, p
ublic
, and
en
viro
nmen
tal h
ealth
x x
x
x
x
Spac
e sc
ienc
e La
nd o
bser
vatio
n an
d re
mot
e se
nsin
g Po
llutio
n de
tect
ion
and
cont
rol
Wat
er q
ualit
y m
onito
ring,
eco
syst
em
func
tioni
ng, e
nviro
nmen
tal w
ater
qu
ality
, ani
mal
, hum
an, p
ublic
, and
en
viro
nmen
tal h
ealth
x
x
Sust
aina
bilit
y
Su
stai
nabi
lity
x x
x x
x W
ater
and
was
tew
ater
trea
tmen
t
Wat
er a
nd w
aste
wat
er tr
eatm
ent
x x
x W
ater
infra
stru
ctur
e de
velo
pmen
t
Wat
er in
frast
ruct
ure
deve
lopm
ent
x x
x x
Wat
er q
ualit
y an
d w
ater
reso
urce
s
Wat
er q
ualit
y an
d w
ater
reso
urce
s x
x x
x x
x W
ater
sci
ence
man
agem
ent,
polic
y an
d le
gisl
atio
ns
W
ater
sci
ence
man
agem
ent,
polic
y an
d le
gisl
atio
ns
x x
x
Oce
anog
raph
y W
ave
and
tidal
ene
rgy
Wav
e po
wer
ed
desa
linat
ion
Wav
e po
wer
ed d
esal
inat
ion
x x
x x
x x
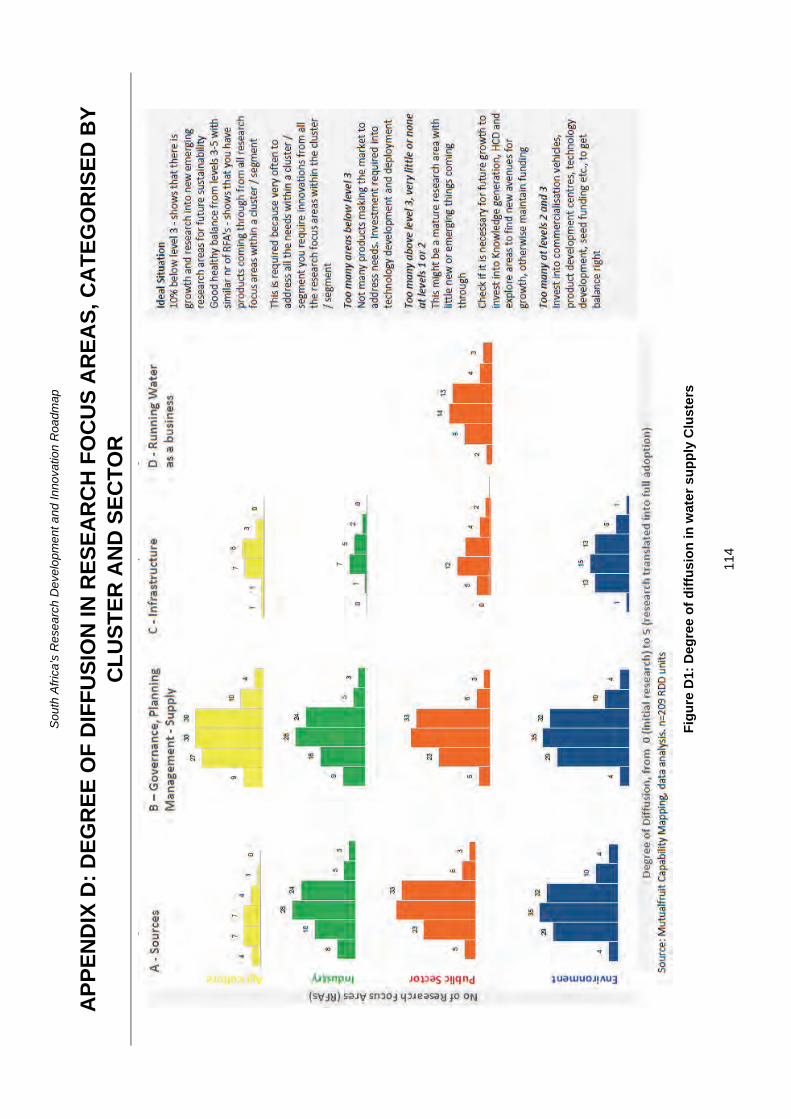
Sou
th A
fric
a’s
Res
ear
ch D
evel
op
men
t and
Inno
vatio
n R
oadm
ap
114
AP
PE
ND
IX D
: D
EG
RE
E O
F D
IFF
US
ION
IN R
ES
EA
RC
H F
OC
US
AR
EA
S, C
AT
EG
OR
ISE
D B
Y
CL
US
TE
R A
ND
SE
CT
OR
Fig
ure
D1:
Deg
ree
of
dif
fusi
on
in w
ater
su
pp
ly C
lust
ers
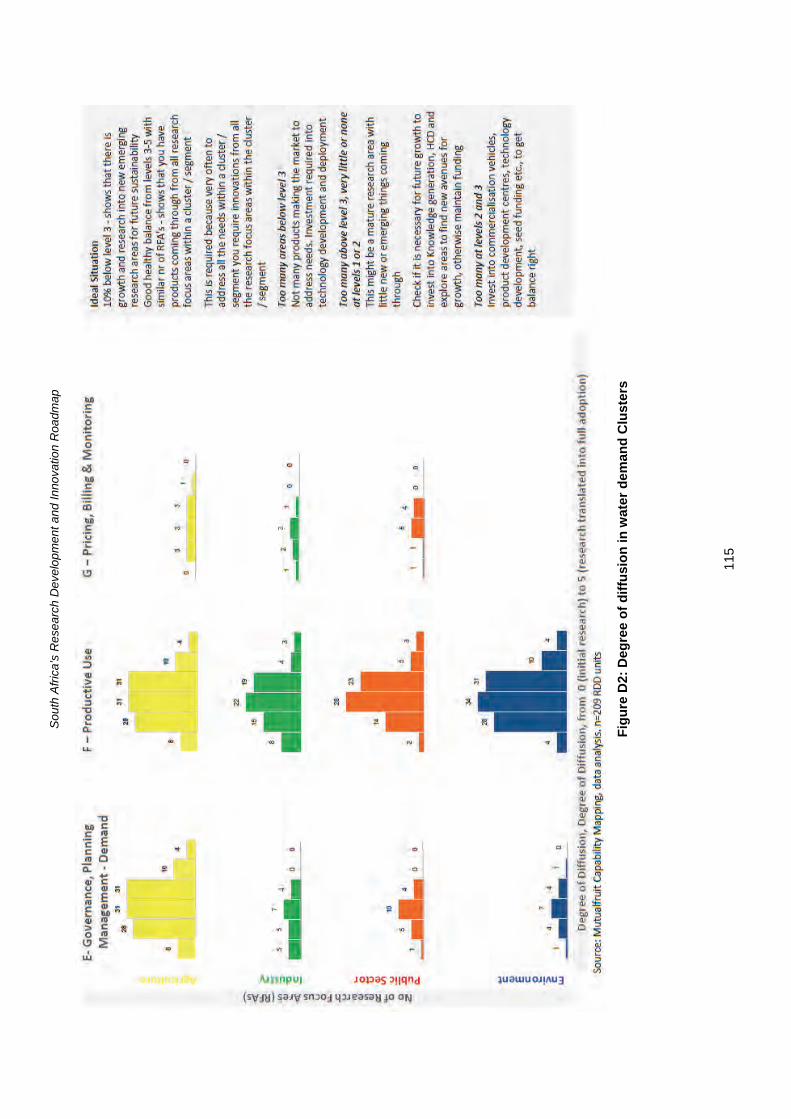
Sou
th A
fric
a’s
Res
ear
ch D
evel
op
men
t and
Inno
vatio
n R
oadm
ap
115
Fig
ure
D2:
Deg
ree
of
dif
fusi
on
in w
ater
dem
and
Clu
ster
s

Sou
th A
fric
a’s
Res
ear
ch D
evel
op
men
t and
Inno
vatio
n R
oadm
ap
116
AP
PE
ND
IX E
: L
EV
EL
OF
RE
SE
AR
CH
ST
RE
NG
TH
OF
INS
TIT
UT
ES
, CA
TE
GO
RIS
ED
BY
C
LU
ST
ER
AN
D S
EC
TO
R
Fig
ure
E1:
Lev
el o
f st
ren
gth
in w
ater
su
pp
ly C
lust
ers
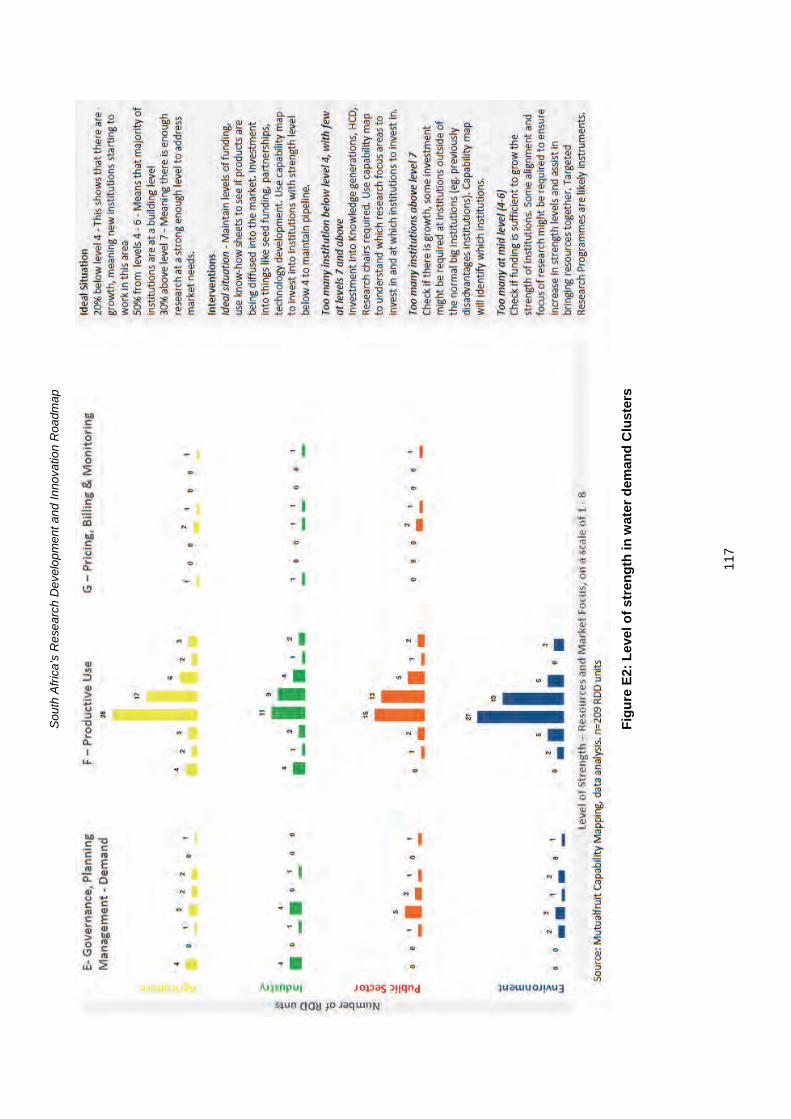
Sou
th A
fric
a’s
Res
ear
ch D
evel
op
men
t and
Inno
vatio
n R
oadm
ap
117
Fig
ure
E2:
Lev
el o
f st
ren
gth
in w
ater
dem
and
Clu
ster
s
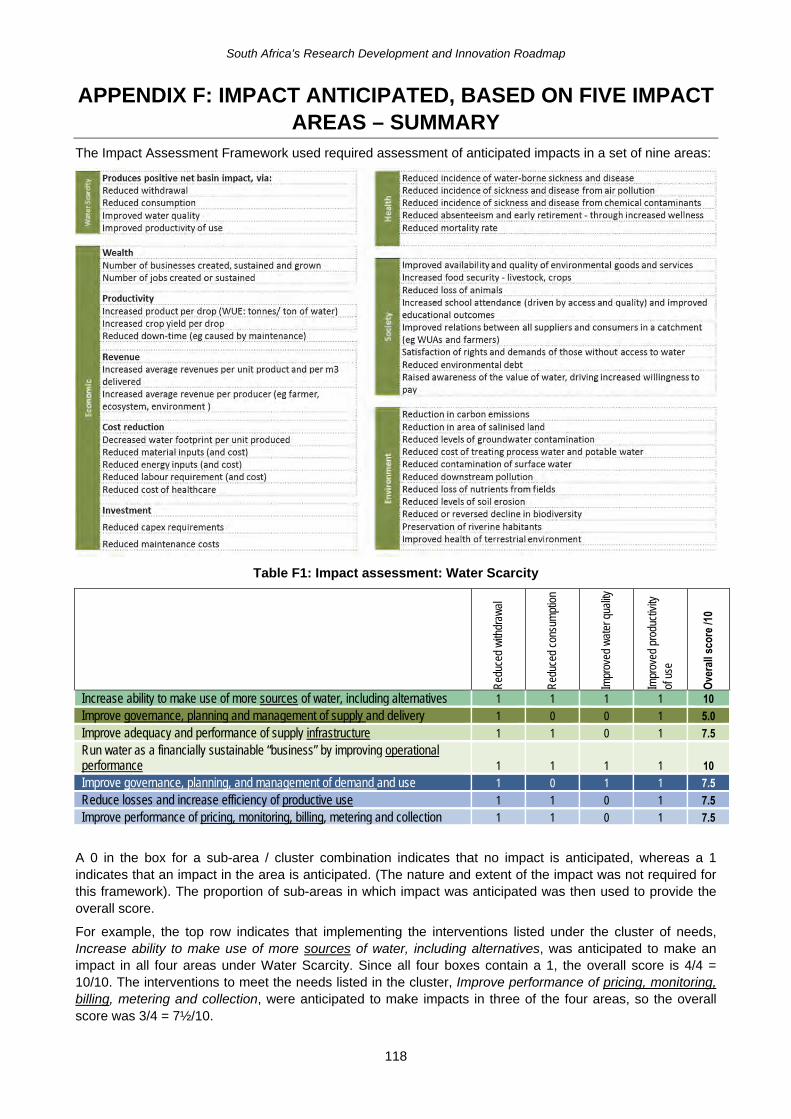
South Africa’s Research Development and Innovation Roadmap
118
APPENDIX F: IMPACT ANTICIPATED, BASED ON FIVE IMPACT AREAS – SUMMARY
The Impact Assessment Framework used required assessment of anticipated impacts in a set of nine areas:
Table F1: Impact assessment: Water Scarcity
Red
uced
with
draw
al
Red
uced
con
sum
ptio
n
Impr
oved
wat
er q
ualit
y
Impr
oved
pro
duct
ivity
of
use
Ove
rall
scor
e /1
0 Increase ability to make use of more sources of water, including alternatives 1 1 1 1 10
Improve governance, planning and management of supply and delivery 1 0 0 1 5.0
Improve adequacy and performance of supply infrastructure 1 1 0 1 7.5
Run water as a financially sustainable “business” by improving operational performance 1 1 1 1 10
Improve governance, planning, and management of demand and use 1 0 1 1 7.5
Reduce losses and increase efficiency of productive use 1 1 0 1 7.5
Improve performance of pricing, monitoring, billing, metering and collection 1 1 0 1 7.5
A 0 in the box for a sub-area / cluster combination indicates that no impact is anticipated, whereas a 1 indicates that an impact in the area is anticipated. (The nature and extent of the impact was not required for this framework). The proportion of sub-areas in which impact was anticipated was then used to provide the overall score.
For example, the top row indicates that implementing the interventions listed under the cluster of needs, Increase ability to make use of more sources of water, including alternatives, was anticipated to make an impact in all four areas under Water Scarcity. Since all four boxes contain a 1, the overall score is 4/4 = 10/10. The interventions to meet the needs listed in the cluster, Improve performance of pricing, monitoring, billing, metering and collection, were anticipated to make impacts in three of the four areas, so the overall score was 3/4 = 7½/10.
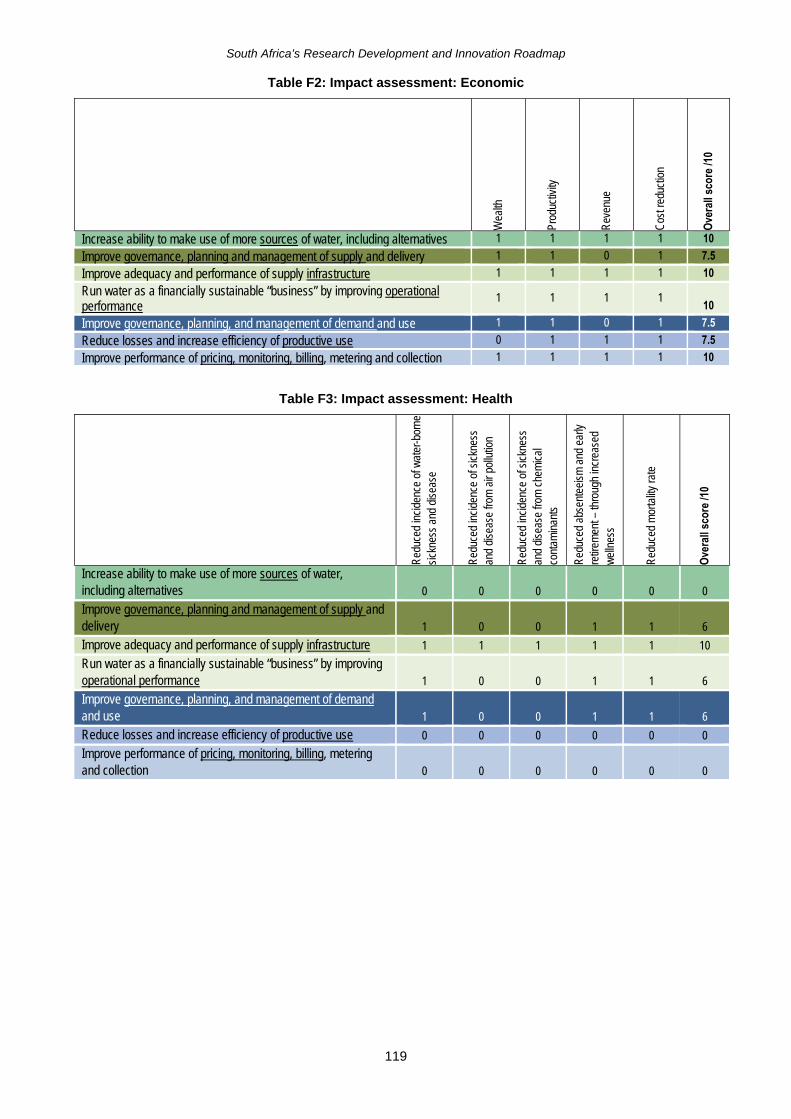
South Africa’s Research Development and Innovation Roadmap
119
Table F2: Impact assessment: Economic
Wea
lth
Prod
uctiv
ity
Rev
enue
Cos
t red
uctio
n
Ove
rall
scor
e /1
0
Increase ability to make use of more sources of water, including alternatives 1 1 1 1 10
Improve governance, planning and management of supply and delivery 1 1 0 1 7.5
Improve adequacy and performance of supply infrastructure 1 1 1 1 10
Run water as a financially sustainable “business” by improving operational performance
1 1 1 1 10
Improve governance, planning, and management of demand and use 1 1 0 1 7.5
Reduce losses and increase efficiency of productive use 0 1 1 1 7.5
Improve performance of pricing, monitoring, billing, metering and collection 1 1 1 1 10
Table F3: Impact assessment: Health
R
educ
ed in
cide
nce
of w
ater
-bor
ne
sick
ness
and
dis
ease
Red
uced
inci
denc
e of
sic
knes
s an
d di
seas
e fro
m a
ir po
llutio
n
Red
uced
inci
denc
e of
sic
knes
s an
d di
seas
e fro
m c
hem
ical
co
ntam
inan
ts
Red
uced
abs
ente
eism
and
ear
ly
retir
emen
t – th
roug
h in
crea
sed
wel
lnes
s
Red
uced
mor
talit
y ra
te
Ove
rall
scor
e /1
0
Increase ability to make use of more sources of water, including alternatives 0 0 0 0 0 0
Improve governance, planning and management of supply and delivery 1 0 0 1 1 6
Improve adequacy and performance of supply infrastructure 1 1 1 1 1 10
Run water as a financially sustainable “business” by improving operational performance 1 0 0 1 1 6
Improve governance, planning, and management of demand and use 1 0 0 1 1 6
Reduce losses and increase efficiency of productive use 0 0 0 0 0 0
Improve performance of pricing, monitoring, billing, metering and collection 0 0 0 0 0 0
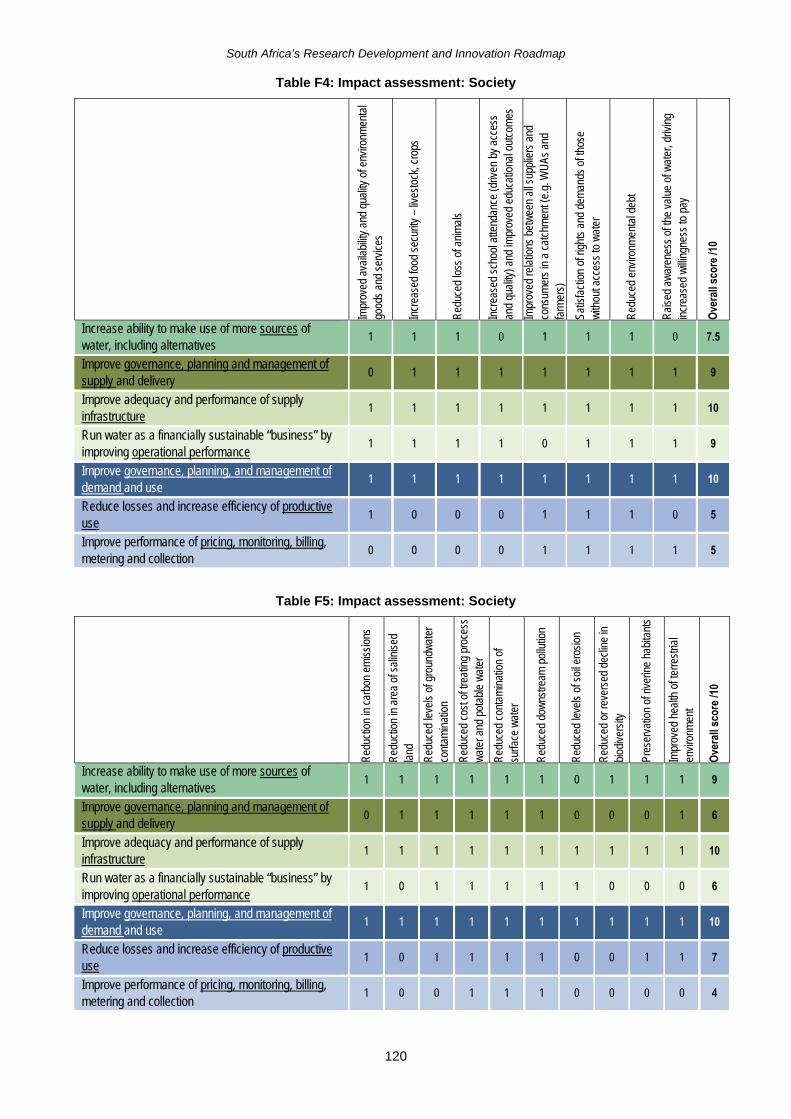
South Africa’s Research Development and Innovation Roadmap
120
Table F4: Impact assessment: Society
Impr
oved
ava
ilabi
lity
and
qual
ity o
f env
ironm
enta
l go
ods
and
serv
ices
Incr
ease
d fo
od s
ecur
ity –
live
stoc
k, c
rops
Red
uced
loss
of a
nim
als
Incr
ease
d sc
hool
atte
ndan
ce (d
riven
by
acce
ss
and
qual
ity) a
nd im
prov
ed e
duca
tiona
l out
com
es
Impr
oved
rela
tions
bet
wee
n al
l sup
plie
rs a
nd
cons
umer
s in
a c
atch
men
t (e.
g. W
UAs
and
fa
rmer
s )
Satis
fact
ion
of ri
ghts
and
dem
ands
of t
hose
w
ithou
t acc
ess
to w
ater
Red
uced
env
ironm
enta
l deb
t
Rai
sed
awar
enes
s of
the
valu
e of
wat
er, d
rivin
g in
crea
sed
willi
ngne
ss to
pay
Ove
rall
scor
e /1
0
Increase ability to make use of more sources of water, including alternatives
1 1 1 0 1 1 1 0 7.5
Improve governance, planning and management of supply and delivery
0 1 1 1 1 1 1 1 9
Improve adequacy and performance of supply infrastructure
1 1 1 1 1 1 1 1 10
Run water as a financially sustainable “business” by improving operational performance
1 1 1 1 0 1 1 1 9
Improve governance, planning, and management of demand and use
1 1 1 1 1 1 1 1 10
Reduce losses and increase efficiency of productive use
1 0 0 0 1 1 1 0 5
Improve performance of pricing, monitoring, billing, metering and collection
0 0 0 0 1 1 1 1 5
Table F5: Impact assessment: Society
Red
uctio
n in
car
bon
emis
sion
s
Red
uctio
n in
are
a of
sal
inis
ed
land
Red
uced
leve
ls o
f gro
undw
ater
co
ntam
inat
ion
Red
uced
cos
t of t
reat
ing
proc
ess
wat
er a
nd p
otab
le w
ater
Red
uced
con
tam
inat
ion
of
surfa
ce w
ater
Red
uced
dow
nstre
am p
ollu
tion
Red
uced
leve
ls o
f soi
l ero
sion
Red
uced
or r
ever
sed
decl
ine
in
biod
iver
sity
Pres
erva
tion
of ri
verin
e ha
bita
nts
Impr
oved
hea
lth o
f ter
rest
rial
envi
ronm
ent
Ove
rall
scor
e /1
0
Increase ability to make use of more sources of water, including alternatives
1 1 1 1 1 1 0 1 1 1 9
Improve governance, planning and management of supply and delivery
0 1 1 1 1 1 0 0 0 1 6
Improve adequacy and performance of supply infrastructure
1 1 1 1 1 1 1 1 1 1 10
Run water as a financially sustainable “business” by improving operational performance
1 0 1 1 1 1 1 0 0 0 6
Improve governance, planning, and management of demand and use
1 1 1 1 1 1 1 1 1 1 10
Reduce losses and increase efficiency of productive use
1 0 1 1 1 1 0 0 1 1 7
Improve performance of pricing, monitoring, billing, metering and collection
1 0 0 1 1 1 0 0 0 0 4

South Africa’s Research Development and Innovation Roadmap
121
APPENDIX G: NATIONAL RESEARCH FOUNDATION VALUES FOR RESEARCH HUMAN CAPACITY
G.1 EXCERPTS FROM “FUNDING YOUR RESEARCH FUTURE”
(NRF, 2014. Available at http://www.nrf.ac.za/sites/default/files/documents/Funding%20your%20Research%20Future%20NRF%20Bursary%2C%20Scholarships%20Value%20Rules%20and%20G....pdf (Accessed 11 November 2014).

South Africa’s Research Development and Innovation Roadmap
122
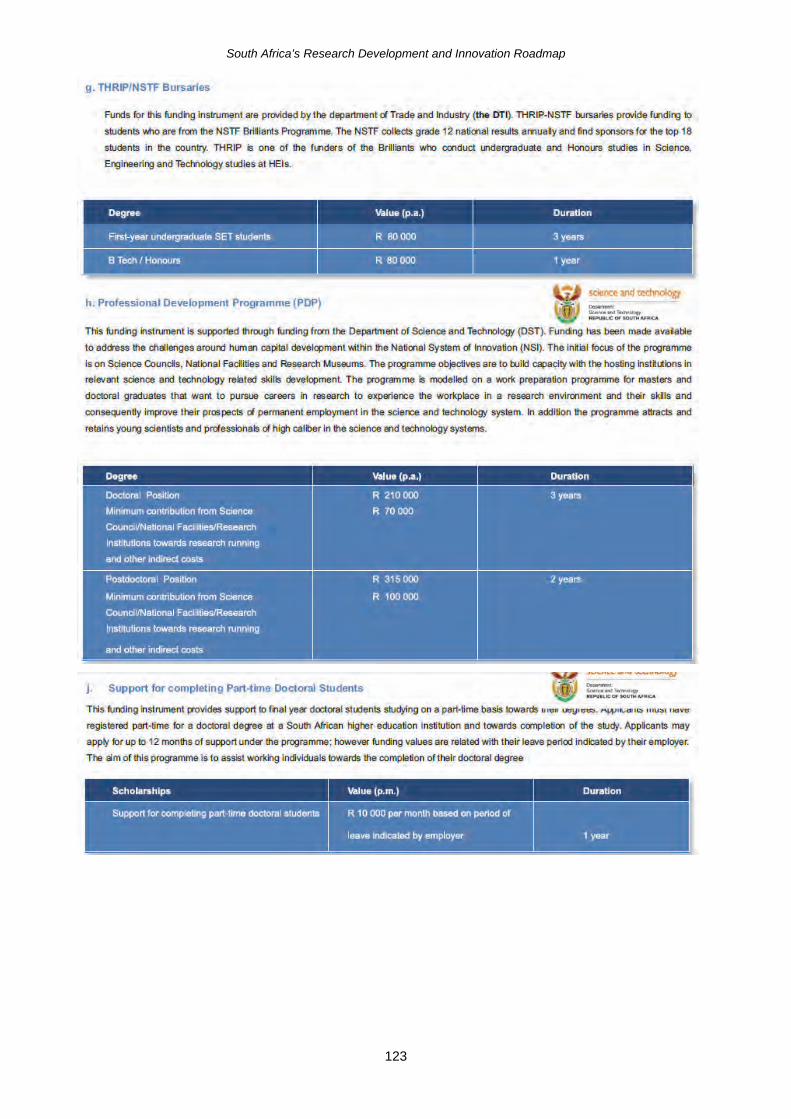
South Africa’s Research Development and Innovation Roadmap
123
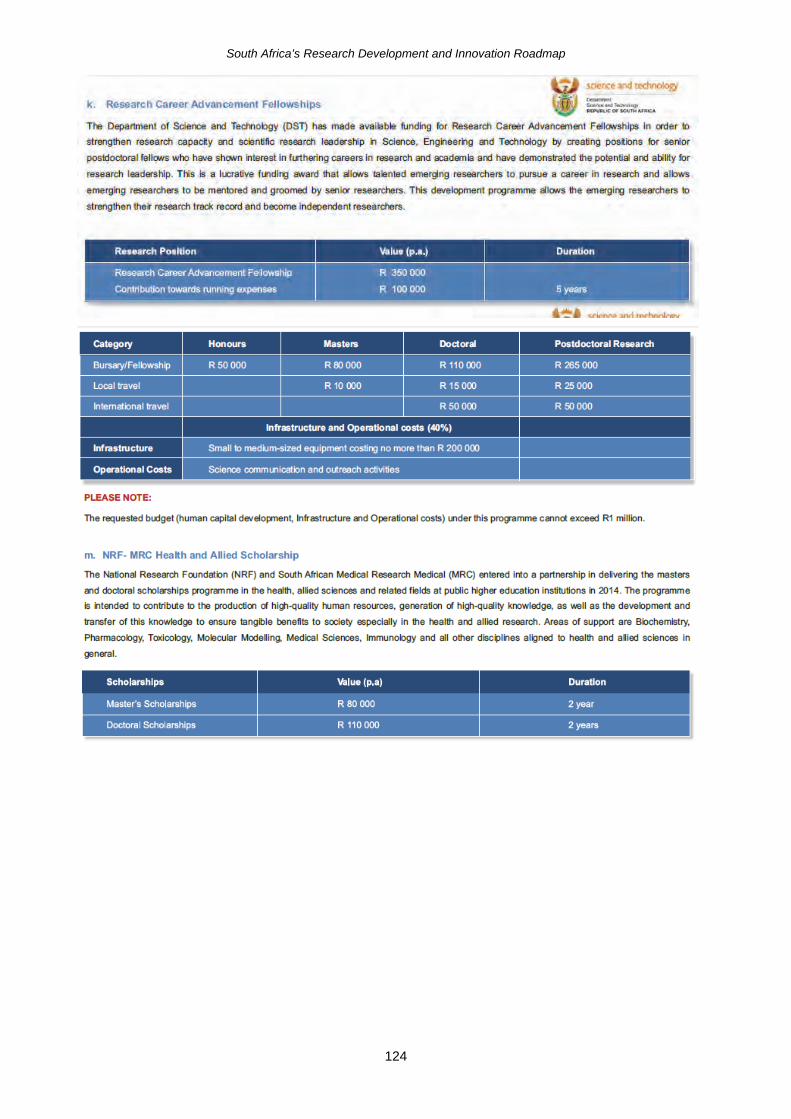
South Africa’s Research Development and Innovation Roadmap
124

South Africa’s Research Development and Innovation Roadmap
125
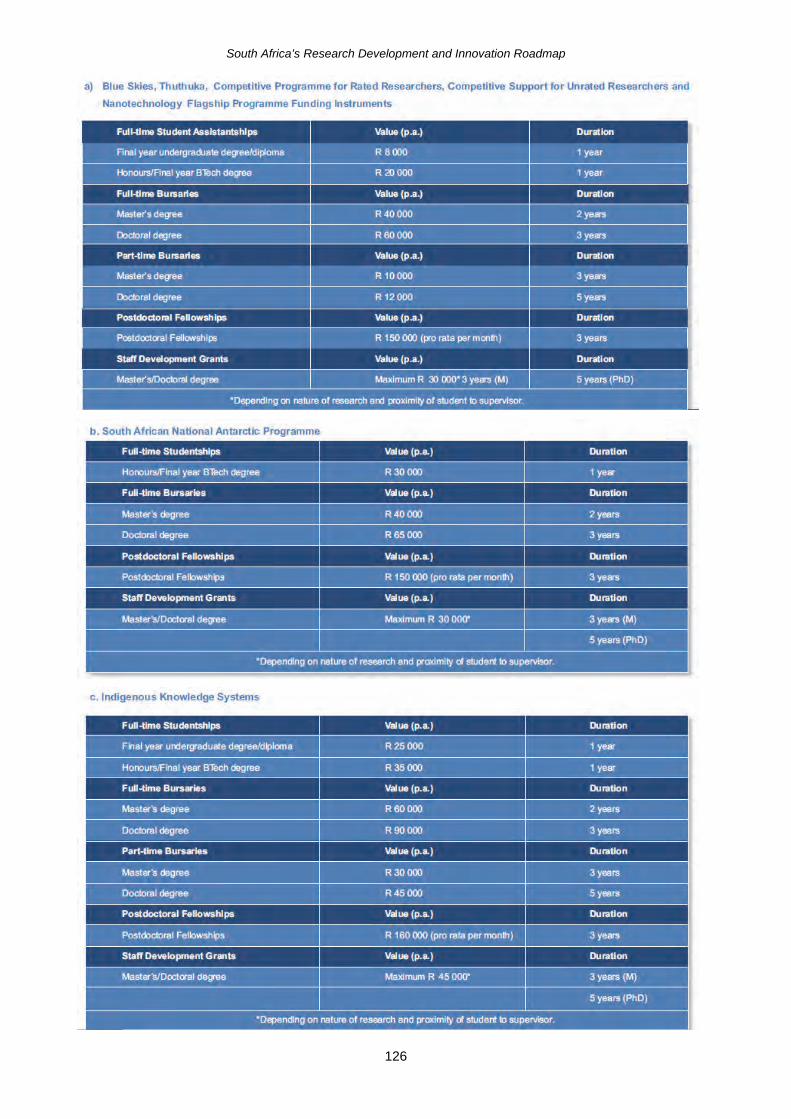
South Africa’s Research Development and Innovation Roadmap
126

South Africa’s Research Development and Innovation Roadmap
127
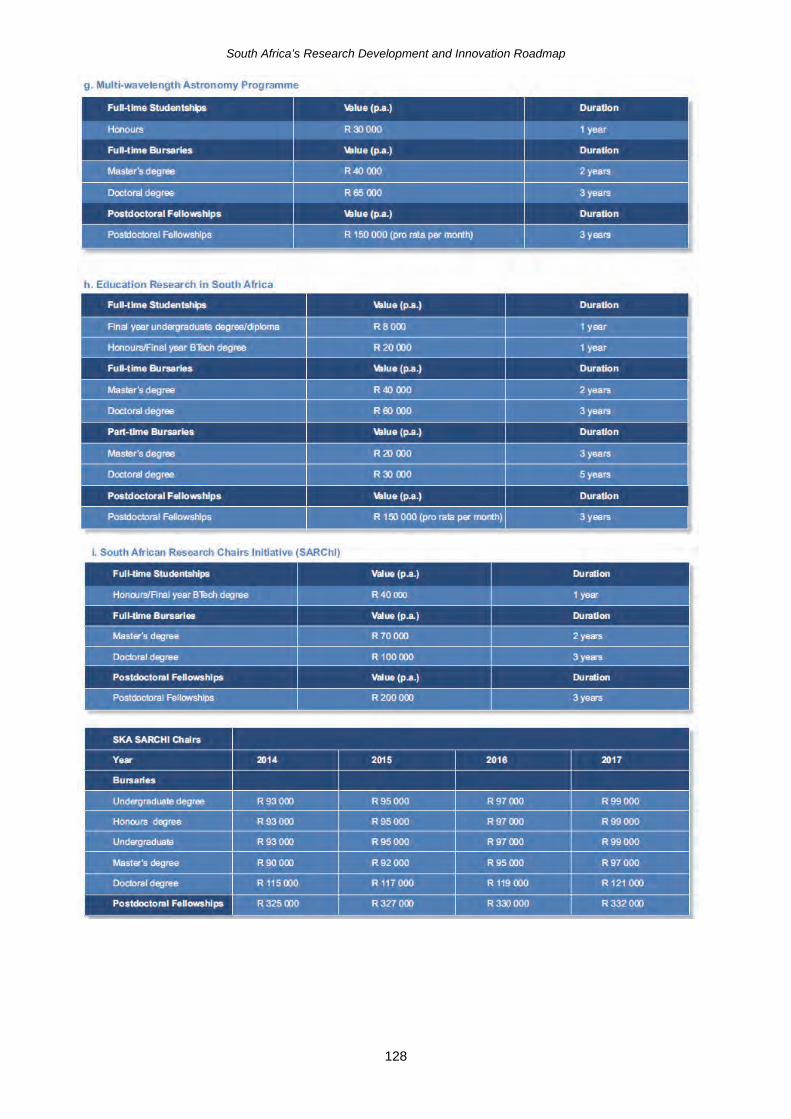
South Africa’s Research Development and Innovation Roadmap
128

South Africa’s Research Development and Innovation Roadmap
129
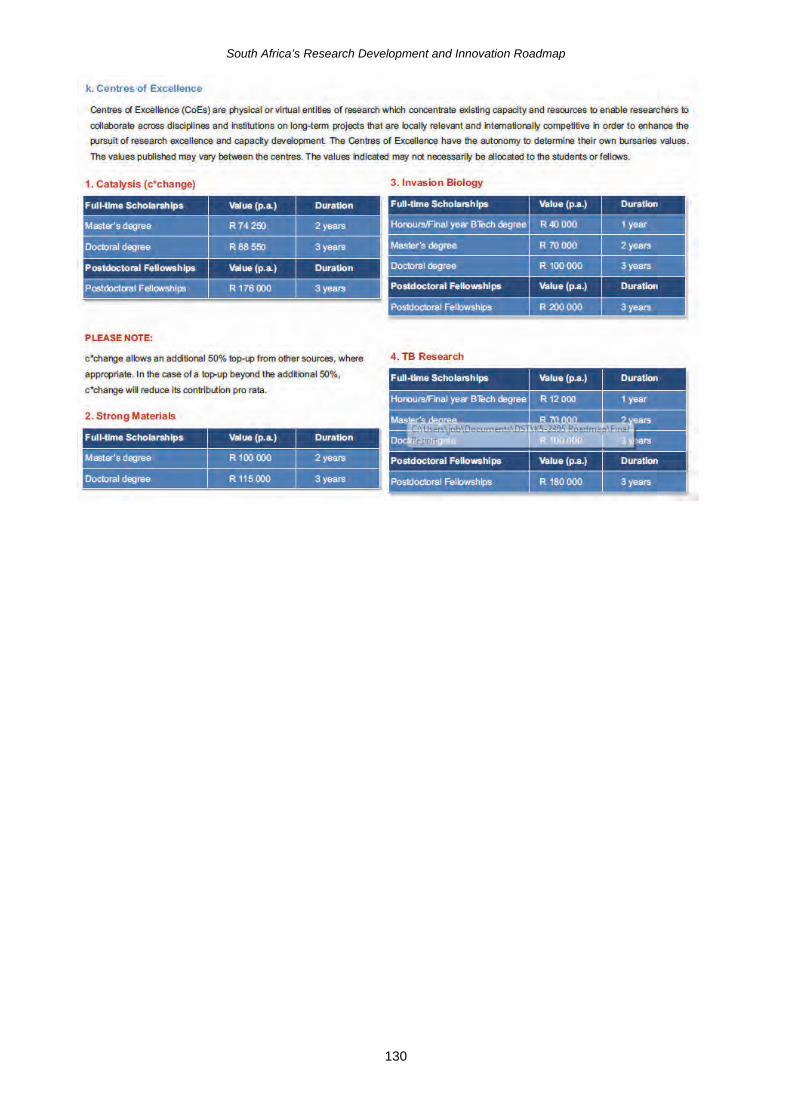
South Africa’s Research Development and Innovation Roadmap
130

South Africa’s Research Development and Innovation Roadmap
131
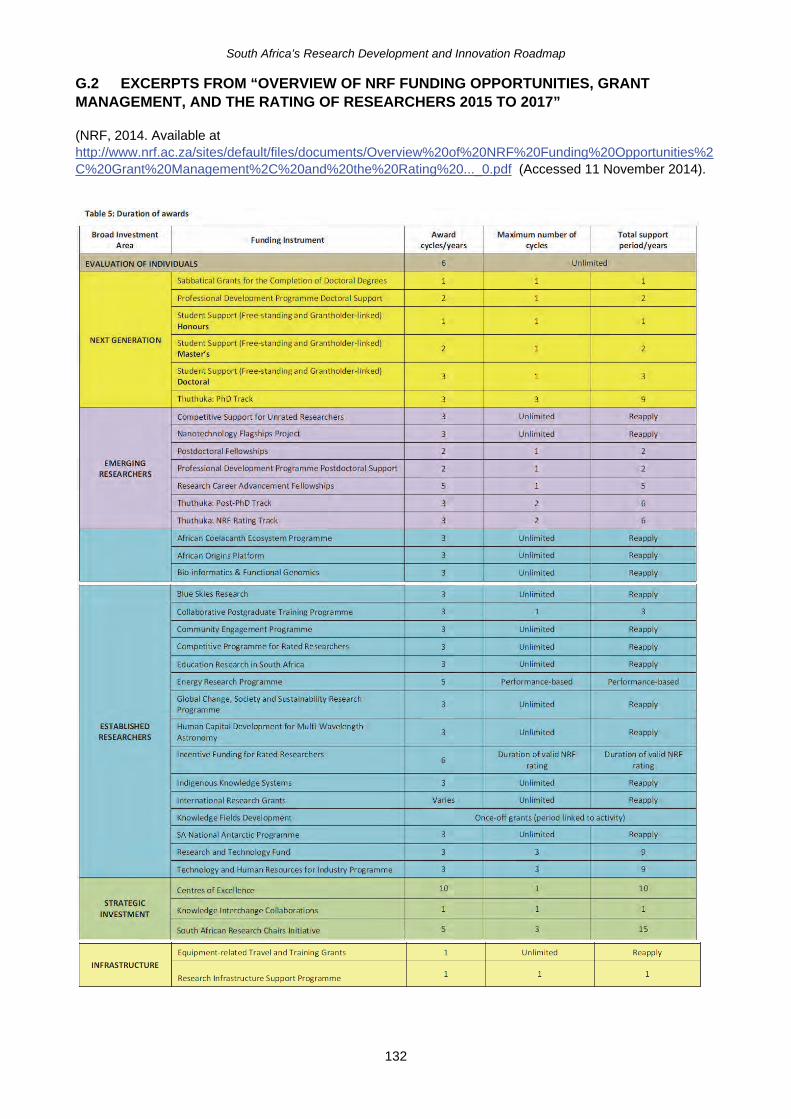
South Africa’s Research Development and Innovation Roadmap
132
G.2 EXCERPTS FROM “OVERVIEW OF NRF FUNDING OPPORTUNITIES, GRANT MANAGEMENT, AND THE RATING OF RESEARCHERS 2015 TO 2017”
(NRF, 2014. Available at http://www.nrf.ac.za/sites/default/files/documents/Overview%20of%20NRF%20Funding%20Opportunities%2C%20Grant%20Management%2C%20and%20the%20Rating%20..._0.pdf (Accessed 11 November 2014).
Related Documents