SOUTH AFRICA WORKS BECAUSE OF PUBLIC WORKS

Welcome message from author
This document is posted to help you gain knowledge. Please leave a comment to let me know what you think about it! Share it to your friends and learn new things together.
Transcript

South AfricA workS becAuSe of Public workS

Department of Public Works | Annual Report 2012/13 1
ANNUAL REPORT
2012/2013
Mr TW Nxesi
Public Works Minister
I have the honour of submitting the Annual Report of the Department of Public Works
for the period 1 April 2012 to 31 March 2013
Mr M Dlabantu
Director-General
30 September 2013

2 Department of Public Works | Annual Report 2012/13
Table of ContentsChapter 1 ........................................................................................................................................................ 9General Information .................................................................................................................................................. 10
1.1 Strategic Overview .................................................................................................................................................................10
• Vision ............................................................................................................................................................................................................. 10
• Mission ......................................................................................................................................................................................................... 10
• Values ............................................................................................................................................................................................................ 10
• Urgency ........................................................................................................................................................................................................ 10
• Integrity ........................................................................................................................................................................................................ 10
• Client Focus ................................................................................................................................................................................................ 10
• Team Work ................................................................................................................................................................................................... 10
1.2 Legislative And Other Mandates ..........................................................................................................................................12
1.3 Organisational Structure .......................................................................................................................................................12
1.4 Entities Reporting To The Minister .......................................................................................................................................13
1.5 Foreword By Minister .............................................................................................................................................................16
1.6 Overview By The Accounting Officer ...................................................................................................................................18
Chapter 2 .......................................................................................................................................................25Performance Information ......................................................................................................................................... 25
2.1 Accounting Officer’s Statement Of Responsibility For Performance Information......................................................26
2.3 Overview Of Departmental Performance ..........................................................................................................................27
• Service delivery environment .............................................................................................................................................................. 27
• Expanded Public Works Programme (EPWP).................................................................................................................................. 28
• Projects ......................................................................................................................................................................................................... 28
• Strategic Asset Investment Analysis .................................................................................................................................................. 28
• Inner City regeneration .......................................................................................................................................................................... 29
• Service Delivery Improvement Plan .................................................................................................................................................. 29
• Organisational environment ................................................................................................................................................................ 29
• Key policy developments And legislative changes ...................................................................................................................... 29
2.4 Strategic Outcome Oriented Goals ......................................................................................................................................30
2.5 Performance information By Programme ..........................................................................................................................32
• Programme 1: Administration .............................................................................................................................................................. 32
• Programme 2: Immovable Asset Management ............................................................................................................................. 32
• Programme 3: Expanded Public Works Programme .................................................................................................................... 33
• Programme 4: Property And Construction Industry Policy Regulation ................................................................................ 33
• Programme 5: Auxiliary And Associated Services......................................................................................................................... 33
• Performance Indicators .......................................................................................................................................................................... 34
• Programme 1: Administration .............................................................................................................................................................. 34
• Programme 2: Immovable Asset Investment Management ..................................................................................................... 50
• Programme 3: Expanded Public Works Programme .................................................................................................................... 70

Department of Public Works | Annual Report 2012/13 3
Table of Contents
• Programme 4: Construction and Property Policy Regulation .................................................................................................. 72
• Strategy to overcome areas of under performance ..................................................................................................................... 76
• Linking Performance with Budgets ................................................................................................................................................... 80
2.6 Summary of Financial Information ......................................................................................................................................80
• Departmental Receipts ........................................................................................................................................................................... 80
• Programme Expenditure ........................................................................................................................................................................ 80
• Spending per Economic Classification ............................................................................................................................................. 81
• Current Payments: Compensation of employee ........................................................................................................................... 82
• Current payments: Goods and Services ........................................................................................................................................... 82
• Transfers and Subsidies .......................................................................................................................................................................... 82
• Payments for Capital Asset: Infrastructure ...................................................................................................................................... 82
• Payments for Capital Assets: Machinery and Equipment .......................................................................................................... 82
• Payment for Capital Assets: Software and Intangible ................................................................................................................. 82
• Transfer Payments (excluding public entities) ............................................................................................................................... 83
• Public Entities ............................................................................................................................................................................................. 90
• Conditional Grants and Earmarked Funds Paid ............................................................................................................................. 90
• Conditional Grants and Earmarked Funds Received ................................................................................................................... 90
• Donor Funds ............................................................................................................................................................................................... 90
• Capital Investment, Maintenance and Asset Management Plan ............................................................................................ 91
CHAPTER 3 ................................................................................................................................................. 133Governance ................................................................................................................................................................ 93
3.1 Introduction .............................................................................................................................................................................94
3.1.1 Risk Management ................................................................................................................................................................94
3.1.2 Fraud and Corruption .........................................................................................................................................................94
3.1.3 Minimising Conflict of Interest ..........................................................................................................................................95
3.1.4 Code of Conduct ..................................................................................................................................................................96
3.1.5 Health, Safety and Environmental Issues ........................................................................................................................96
3.1.6 Audit Committee Report ....................................................................................................................................................97
CHAPTER 4 ................................................................................................................................................. 101Human Resource Management ............................................................................................................................. 101
4.1 Personnel Related Expenditure ......................................................................................................................................... 102
4.2. Employment and Vacancies .............................................................................................................................................. 104
4.3 Job Evaluation ...................................................................................................................................................................... 106
4.4. Employment Changes ........................................................................................................................................................ 108
3.5. Employment Equity ............................................................................................................................................................ 110
CHAPTER 5 ................................................................................................................................................. 131Financial Information ............................................................................................................................................. 131

4 Department of Public Works | Annual Report 2012/13
Contact Information
Department of Public Works
CGO Building
264 Madiba Street (cnr Bosman and Madiba Streets)
Tshwane Central
0001
Communications Unit: 012 406 1830/1
Switchboard: 012 406 2000/3000
Fax: 086 276 8958
Website: www.publicworks.gov.za
Department of Public Works - CGO building

Department of Public Works | Annual Report 2012/13 5
List of Abbreviations/Acronyms
FULL DESCRIPTION ACRONYM
Adult Basic Education and Training ABET
Annual Financial Statement AFS
Agrément South Africa ASA
Annual Performance Plan APP
Business Intelligence BI
Built Environment Professionals BEP
Asset Register Management ARM
Basic Accounting System BAS
Black Economic Empowerment BEE
Broad-Based Black Economic Empowerment BBBEE
Business Continuity Plan BCP
Client Relationship Management CRM
Community Based Organisations CBOs
Construction Contact Centres CCC’s
Community Works Programme CWP
Construction Industry Development Board cidb
Continued Professional Development CPD
Contractor Incubator Programme CIP
Council for Built Environment CBE
Custodian Asset Management Plan CAMP
Department of Cooperative Governance and Traditional Affairs COGTA
Capital Works Implementation Programme CWIP
Department of Enviromental Affairs DEA
Department of International Relations and Cooperation DIRCO
Department of Public Works DPW
Department of Water Affairs DWA
Department of Public Works National Intergovernmental Forum DPWNIF
Department of Rural Development and Land Reform DRDLP
Division of Revenue Act DORA
Document Management System DMS
Engineering Council of South Africa ECSA
Early Childhood Development ECD
Economic and Employment Cluster EEC
Employee Development and Management System EDMS
Estimates of National Expenditure ENE
Employment Skills Development Agency ESDA
Expanded Public Works Programme EPWP

6 Department of Public Works | Annual Report 2012/13
List of Abbreviations/Acronyms (continued)
FULL DESCRIPTION ACRONYM
Executive Management Committee EXCO
Full Time Equivalent FTE
Facilities Management FM
Financial Year FY
Generally Accepted Accounting Principles GAAP
Generally Recognised Accounting Practice GRAP
Geographical Information System GIS
Government Immovable Asset Management Act GIAMA
Head of Department HOD
Home Community Based Care HCBC
Human Resource Development HRD
Immovable Asset Register IAR
Independent Development Trust IDT
Integrated Risk Management Framework IRMF
Industrial Policy Action Plan IPAP
Information Communication and Technology ICT
Integrated Financial Management System IFMS
Information Technology IT
Infrastructure Delivery Improvement Programme IDIP
Information Technology Acquisition ITAC
Information Technology Procurement ITP
Institute of Internal Auditors IIA
Integrated Growth Plan IGP
International Union of Architects IUA
Key Account Management KAM
Land Redistribution Agricultural Development LRAD
Logistical Information System LOGIS
Memorandum of Understanding MOU
Medium Term Budget Policy Statement MTBPS
Medium Term Expenditure Framework MTEF
Medium Term Strategic Framework MTSF
Middle Management Services MMS
Millennium Development Goals MDGs
Municipal Infrastructure Grant MIG
Management Information System MIS
Non-Governmental Organisations NGOs
Non-Profit Organizations NPOs
National Contractor Development Programme NCDP
National Economic Development and Labour Council NEDLAC

Department of Public Works | Annual Report 2012/13 7
List of Abbreviations/Acronyms (continued)
FULL DESCRIPTION ACRONYM
National Infrastructure Maintenance Strategy NIMS
National Youth Service NYS
Occupational Specific Dispensation OSD
Occupational Health and Safety Act OHSA
Pan African Parliament PAP
Performance Based Building PBB
Performance Management and Development System PMDS
Planned Maintenance Implementation Programme PMIP
Portfolio Performance and Monitoring PPM
Property Sector Charter Council PSCC
Property Incubator Programme PIP
Property Management Information System PMIS
Property Management Trading Entity PMTE
Property Performance Standards PPS
Public Finance Management Act PFMA
Parliamentary Villages PV
Regulatory Impact Assessment RIA
Recognition of Prior Learning RPL
South African Local Government Association SALGA
Supply Chain Management SCM
Implement Service Delivery Improvement Programme SDIP
Senior Management Services SMS
Service Delivery Standards SDS
Service Level Agreement SLA
Software Asset Management SAM
Strategic Performance Management SPM
Strategic Plan SP
Spatial Development Framework SDF
State-owned Entities SOEs
Union Building UB
User Asset Management Plan UAMP
User Requirement Specification URS
Virtual Private Network VPN
Web Based Reporting Systems WBS
Works Control System WCS
Workplace Skills Plan WSP

Chapter 1:General Information

10 Department of Public Works | Annual Report 2012/13
1.1 Strategic Overview
Vision
To be a world-class Public Works Department.
Mission
The Department of Public Works (DPW) aims to promote the government’s objectives of economic development, good governance and raising living standards and prosperity by providing and managing accommodation, housing, land and infrastructure needs for national departments, promoting the Expanded Public Works Programme (EPWP) and encouraging the transformation of the construction and property industries. In pursuit of these objectives, the Department seeks to:
• Manage efficiently the lifecycle of immovable assets under its custodianship.
• Provide expert advice to all three spheres of government and State-owned entities on immovable assets.
• Contribute to the national goals of job creation and poverty alleviation through programme management and directing of public works programmes across all spheres of government, of which the EPWP forms an integral part.
• Provide strategic leadership to the construction and property industries.
Values
Governed by our mission, the values outlined below serve as guiding principles in the Department’s continuous effort toward service delivery improvement:-
• Urgency
All tasks are attended to timeously and diligently.
• Integrity
The Department rejects any form of corruption and/or maladministration, and all employees vow to expose any actions undermining principles of good corporate governance.
• Client Focus
All aspects of our work are guided by the need to improve service delivery to both internal and external clients.
• Team Work
Every employee has a specific task/role to perform and the sum of all our actions defines our destiny (success or failure).
Nelson Mandela Museum

Department of Public Works | Annual Report 2012/13 11
Strategic Overview (continued)
Strategic outcomes oriented goals
Strategic Outcome Oriented Goal (Outcome 4):
Decent employment through inclusive economic growth.
Goal Statement To improve employment conditions for beneficiaries of EPWP.
To increase full-time equivalent jobs within EPWP through the implementation of fiscal incentives.
To implement proposed programmes to increase work opportunities in the Social, Infrastructure, Non State and Environmental & Cultural sectors.
Strategic Outcome Oriented Goal (Outcome 12):
Service delivery quality and access to government services.
Goal Statement To ensure that user departments occupy accommodation that meet their financial, technical and social requirements, to enable them to effectively deliver services to all citizens.
DPW as a major custodian of State Immovable Assets, ensures that Immovable Assets owned and/or utilised for delivering various government services yields functional, economic and social benefits to the state for improved service delivery
Strategic Outcome Oriented Goal (Outcome 8):
Efficient utilisation of land for human settlement.
Mobilisation of well-located public land for low income earners and affordable income housing with increased densities on this land in general.
Goal Statement To release land and buildings vested nationally and provincially for human settlements development.
Strategic Outcome Oriented Goal (Outcome 5)
Investment in core skills development both within DPW and externally.
Goal Statement To revive workshops that facilitate the absorbtion of artisans.
To increase intake of internships, learnerships and young professionals.
To increase participation of emerging contractors in the NCDP.
To provide training to DPW engineers on labour intensive technology.
Strategic Outcome Oriented Goal (Outcome 6)
Improve the condition of the state’s immovable assets to ensure operational efficiency.
Goal Statement To reduce the maintenance backlog.
To reduce the leased portfolio of the state.
To accelerate the implementation of the rehabilitation programme.

12 Department of Public Works | Annual Report 2012/13
Strategic outcome oriented goals
1.2 Legislative and Other MandatesIn terms of the Constitution of the Republic of South Africa of 1996, the powers and functions relating to the Department of Public Works (DPW) at a National level are granted by the President to the Minister of Public Works. Public Works is a concurrent function exercised by both the national and provincial spheres in terms of Schedule 4 of the Constitution. This legislation, therefore, mandates the custodianship and management of a significant portfolio of the national government’s immovable assets to the DPW. These include the provision of accommodation, rendering of expert built environment services to the user departments at national government level and the planning, acquisition, management and disposal of immovable assets under the custodianship of the DPW. In addition, the Department is mandated to coordinate and provide strategic leadership in job creation through the implementation of the EPWP.
The Department’s operations, inter alia, are regulated by the Government Immovable Asset Management Act, 2007 (GIAMA). The Act aims to ensure efficient and effective management of immovable assets throughout national and provincial government to improve service delivery. Furthermore, through the Construction Industry Development Board Act, 2000 (cidb), the Council for the Built Environment Act, 2000 (CBE) and the six Professional Councils Acts that regulate the six built environment professions, the DPW regulates the construction industry and the built environment. (Appendix A provides a list of the various Acts that outline key responsibilities placed on DPW).
1.3 Organisational Structure (Management)
Minister Mr TW Nxesi
Director - General
Mr M Dlabantu
Business Improvement Unit
Mr M Govender
Deputy Minister
Mr J Cronin
DDG: Regional -
CordinationMr B Matutle
DDG: Key Accounts ManagementMr MP Mabuza
DDG: Construction
& Property Policy
RegulationMs L Bici
DDG: Inner-City
Regeneration ProgrammeMs S Subban
DDG: Projects &
Professional Services
Mr M Gwazube
DDG: Expanded
Public Works Programme
Mr S Henderson
DDG: Asset
Investment Management Mr P Chiapasco
(Acting)
DDG: Corporate
ServicesMr K Govender
(Acting)
Chief Financial
OfficerMr C Mokgoro

Department of Public Works | Annual Report 2012/13 13
Strategic outcome oriented goals (continued)
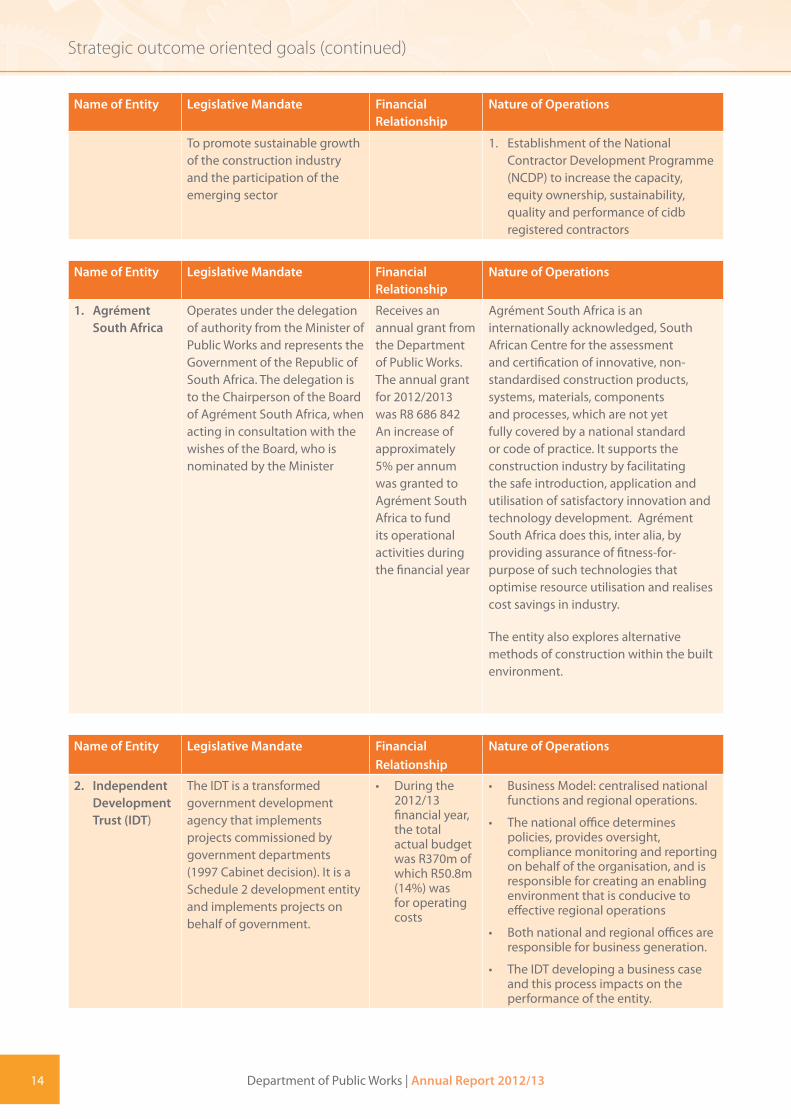
1.4 Entities Reporting to the MinisterThese entities assist the Department to deliver on its objectives and achieve the broader governmental goals, focusing on the construction and property industries. Key to attaining these objectives, is a long term drive towards transformation.
Name of Entity Legislative Mandate Financial Relationship
Nature of Operations
1. Construction Industry Development Board (cidb)
To provide strategic leadership to the construction industry stakeholders to stimulate sustainable growth, reform, transformation and improvement of the construction sector in order to meet the social and economic development objectives
Transfer payment 1. Categorising and grading of contractors on a National Register of Contractors which reflects the nature, size and geographic distribution of andcontractors and further reflects the country’s capacity to meet the construction demand.
2. Establishment of the iTender system and the National Register of Projects. The Register of Projects reflects the nature, size and geographic distribution of the projects.
3. Establishment of the Best Practice Contractor Recognition System which enables organs of state to manage risk on complex contracting strategies; and promotes contractor development in relation to best practice standards and guidelines, developed by the Board in terms of the section.
4. Establishment of the Best Practice Project Assessment Scheme, based on best practices identified by the Board.
To promote uniform application of policy in the construction industry throughout all spheres of Government
1. Development and implementation of the Standard for Uniformity in Construction Procurement which is aimed at bringing about standardisation and uniformity in the construction procurement documentation, practices and procedures.
2. The establishment of the Code of Conduct for all parties engaged in Construction Procurement to guide and regulate the behaviour of parties engaged in construction-related procurement.
14 Department of Public Works | Annual Report 2012/13
Name of Entity Legislative Mandate Financial Relationship
Nature of Operations
To promote sustainable growth of the construction industry and the participation of the emerging sector
1. Establishment of the National Contractor Development Programme (NCDP) to increase the capacity, equity ownership, sustainability, quality and performance of cidb registered contractors
Name of Entity Legislative Mandate Financial Relationship
Nature of Operations
1. Agrément South Africa
Operates under the delegation of authority from the Minister of Public Works and represents the Government of the Republic of South Africa. The delegation is to the Chairperson of the Board of Agrément South Africa, when acting in consultation with the wishes of the Board, who is nominated by the Minister
Receives an annual grant from the Department of Public Works. The annual grant for 2012/2013 was R8 686 842 An increase of approximately 5% per annum was granted to Agrément South Africa to fund its operational activities during the financial year
Agrément South Africa is an internationally acknowledged, South African Centre for the assessment and certification of innovative, non-standardised construction products, systems, materials, components and processes, which are not yet fully covered by a national standard or code of practice. It supports the construction industry by facilitating the safe introduction, application and utilisation of satisfactory innovation and technology development. Agrément South Africa does this, inter alia, by providing assurance of fitness-for-purpose of such technologies that optimise resource utilisation and realises cost savings in industry.
The entity also explores alternative methods of construction within the built environment.
Name of Entity Legislative Mandate Financial Relationship
Nature of Operations
2. Independent Development Trust (IDT)
The IDT is a transformed government development agency that implements projects commissioned by government departments (1997 Cabinet decision). It is a Schedule 2 development entity and implements projects on behalf of government.
• During the 2012/13 financial year, the total actual budget was R370m of which R50.8m (14%) was for operating costs
• Business Model: centralised national functions and regional operations.
• The national office determines policies, provides oversight, compliance monitoring and reporting on behalf of the organisation, and is responsible for creating an enabling environment that is conducive to effective regional operations
• Both national and regional offices are responsible for business generation.
• The IDT developing a business case and this process impacts on the performance of the entity.
Strategic outcome oriented goals (continued)

Department of Public Works | Annual Report 2012/13 15
Name of Entity Legislative Mandate Financial Relationship
Nature of Operations
3. Council for the Built Environment
To facilitate transformation of the built environment profession and protect members of the public within South Africa from unsafe practices by built environment professionals.
To provide advice and body of knowledge on built environment issues.
To ensure good governance in the provisioning of built environment professional services in both the public and private sectors.
By Parliament through the Department
Drives and facilitates skills development within the built environment
Provides research and a platform for discussions on built environment issues.
Strengthens and implements a public protection regime.
1.5 Foreword by the Minister
Strategic outcome oriented goals (continued)
Public Works Minister, Thulas Nxesi and the Deputy Minister , Jeremy Cronin
Tweefontein Police Station

16 Department of Public Works | Annual Report 2012/13
“Despite many challenges faced by the DPW, major sections of the
Department, remained productive due to the commitment and hard work of officials and a number of
successes have been recorded”
Minister : Mr TW Nxesi
The mandate of the Department as the major custodian of the State’s immoveable assets, is to manage its assets optimally in order to provide accommodation to government departments to effect service delivery effectively and efficiently. In addition, the Department regulates the property and construction sectors and provides policy advice to the government in this regard. The Department also strives to create jobs and develop skills, particularly in relation to the built environment.
Despite many challenges faced by the Department, major sections remained productive due to the commitment and hard work of officials and a number of successes have been recorded.
In relation to the Expanded Public Works Programme, the Department is on course to reach the initial target of 4,500,000 job opportunities for the period 2009/2010 - 2013/2014.
The issue of under-spending of R358 million in 2011/2012 on the EPWP incentive grant was eliminated in the 2012/2013 financial year. This success is due to the active partnership, coordination and participation of provinces, municipalities and Non-profit Government, Community Based and Faith Based Organisations.
During the 2012/2013 financial year, 214 projects were completed in relation to Capital Projects, creating 18 815 jobs.
In relation to Asset Investment Management, 6 buildings were rehabilitated in the year under review and 11 buildings were made accessible for people with disabilities. Two properties measuring 4 33.026 hectares, earmarked for sustainable human settlements were approved for release.
In relation to policy regarding the transformation of the built environment, the Construction Sector Charter Council was registered as a section 21 Company and the National Contractor Development Programme (NCDP) – driven by the Construction Industry Development Board (cidb) – was launched in December 2012.
Despite the great progress, the Department remains confronted by challenges. There are still many challenges faced by the Department such as fraud and corruption on the part of a few officials. This remains a concern due to a legacy of weak systems, poor management and a lack of accountability resulting in a disclaimer and a poor audit outcome for the year 2011/2012.
The priority for the previous year was to develop and implement a robust and credible turnaround strategy to ‘Rebuild the Department of Public Works’. The building blocks are in place. The National Treasury has provided a budget; a Turnaround Team, known as the Business Improvement Unit – was established in the office of the Director-General; and leadership has been stabilised with the appointment of a new Director-General and Chief Financial Officer.

Department of Public Works | Annual Report 2012/13 17
Our strategic focus has been on taking control of five key areas:
Combatting fraud and corruption - We have worked closely with the Special Investigations Unit (SIU) to investigate a total of 40 irregular leases and projects of which 23 were completed. This resulted in successful disciplinary actions being implemented, for example, the suspension of six officials and the dismissal of three others, including one Deputy Director-General (DDG). Court actions were instituted to recover monies wrongly paid by the Department. We are currently awaiting reports from disciplinary hearings involving another DDG and Chief Director. The SIU completed investigations into Prestige within the Pretoria regional office relating to the inflated cost of renovations of ministerial houses. It was recommended that all officials involved in irregular behaviour be disciplined. This process is currently underway. In addition, all Prestige projects are under investigation. The process was completed in Pretoria and has been extended to Cape Town where R100 million was spent on renovating 11 ministerial houses. The SIU investigations, together with recent findings of the Competition Commission, confirm that there was over-pricing and collusion among some officials and sections of the construction industry. They further concluded that corruption and greed in the private and public sectors were mutually reinforcing unethical practices.
The Immovable Asset Register - The state land reconciliation with the Deeds Office records was completed by the end of the financial year. Provinces, the Departments of Rural Development and Land Reform and Human Settlements made inputs and cooperated with the process of creating an Asset Register that will accurately reflect the state’s assets. This will give us the tools to leverage this massive property portfolio for future economic development.
Audit of Leases – All of the Department’s 2 778 leases were reviewed during the past year. Of these, 1 316 required attention in terms of either revision/cancellation or renewal. Presently, all new leases are being correctly processed.
Improving audit outcomes - The Clean Audit project was initiated in December 2012 and rolled out in February 2013 to address the negative audit outcomes. This intervention resulted in the deployment of well in excess of 100 experts within the finance and SCM profession. Also included was the deployment of additional 64 unemployed graduates for skills and development within finance and SCM. The strong element of this intervention was to transfer skills with the intention to absorb these graduates into the Department.
Operationalising the Property Management Trading Entity–(PMTE)
The establishment of the PMTE was formalised. A detailed business plan will be submitted to Cabinet for approval in the financial year 2013/14. Failure in finalising these processes previously approved in 2006, contributed significantly to both the DPW and PMTE receiving negative audit outcast in the past.
I thank the Auditor-General, the Public Protector, the SIU and members of the Parliamentary Committees for their constructive criticism and support; National Treasury and the DPSA for the assistance in developing and implementing a turnaround strategy; the MECs and the HoDs whose participation has reinvigorated MINMEC; the Director- General and senior management of the Department who have kept the ship afloat. A special word of thanks to those officials of the Department who actively assisted in the process of rebuilding the Department. Working together we have stabilised the Department, put in place the building blocks and developed a plan of action to rebuild Public Works and deliver on its mandate.
Mr. TW Nxesi Mr. J Cronin
Minister Deputy Minister
Foreword by the Minister (continued)

18 Department of Public Works | Annual Report 2012/13
1.6 Overview by the Accounting Officer
“While the Department remains committed to the National Development Agenda through its strategic objectives that meet specific strategic outcomes,
the rationale for change, resulted in the Department focusing on re-building
Public Works and reclaiming its mandate. The approach by the Department is
aligned with the MTEF allocations by National Treasury.”
Accounting Officer: Mr. M Dlabantu
The financial year 2012/13 was challenging and exciting. It year was marred by a significant degree of negativity especially around certain core business areas of the Department, much of which emanate from the operational complexities of the Department. These complexities also arose from the ever changing infrastructure and property environment, internal business improvement initiatives and broader policy changes affecting the Department. All these necessitated a change in operations and some projects were initiated to address these challenges and stabilise the Department. The exciting part of the year was as a result of the Department making considerable strides with the asset register, although not to the levels initially envisaged, but to a point that some degree of reliability and certainty could be attached to it. In addition, the positions of the Director-General and the Chief Financial Officer were filled, addressing the top management instability that had existed for some time. Apart from all the challenges, the Department continued to realise its mandate and the various turnaround projects have started yielding some positive results.
Top management perspective of the Department
The Department plays a crucial role in government in line with its mandate to provide and manage accommodation, housing, land and infrastructure needs for national Departments, promote the Expanded Public Works Programme (EPWP) and encourage the transformation of the construction and property industries. The Department was guided by the Strategic Plan and Annual Performance Plan that were successfully tabled to the Parliament of South Africa. The Department further took risk elements into consideration and implemented the audit action plans that sought to address the various challenges facing the Department. Many of those challenges received the appropriate attention with the assistance of the Business Improvement Unit that instituted a Turnaround Strategy. The Turnaround Strategy projected a number of initiatives with emphasis on stabilisation, business efficiency and transforming the Department over a period of time. Some of these initiatives are starting to bear fruit. Dictated by the mandate and the performance agreement of the Executive Authority that is central to the planning in the Department, attention was paid to three sector outcomes: decent employment through inclusive economic growth (Outcome 4); sustainable human settlements and an improved quality of household life (Outcome 8) and an efficient, effective and development oriented public service and an empowered, fair and inclusive citizenry (Outcome 12). The Department also provided full support to the realisation of a skilled and capable workforce (Outcome 5) and the creation of an efficient, competitive and responsive economic infrastructure network (Outcome 6).
Despite yet another challenging year, the Department has made satisfactory progress in various areas. During the year under review, the Department embarked on a clean audit project to drive the Department to financial health, accountability, transparency, credibility and compliance.
The clean audit project is a culmination of various key projects, namely Supply Chain Management, Property Management Trading Entity, Immovable Asset Register and Lease Review.

Department of Public Works | Annual Report 2012/13 19
Supply Chain Management (SCM)
Supply Chain Management within the Department was identified as a major risk area by the Auditor-General and is a key project within the Turnaround Strategy. As part of the Organisational Functional Assessment, the Department intends establishing a separate Supply Chain Management Branch with oversight and management at senior level.
A large percentage of the Department’s work is undertaken through the supply chain processes and as such this is critical to the business of the Department. In the financial year under review, the SCM processes were critically reviewed to combat waste and corruption as well as to improve efficiencies. The supplier register’s objective is to have an effective and efficient database of suppliers and service providers to support the quotation and tendering environment for general goods and services. The Department drafted a revised Supplier Register Directive and developed an SCM Policy that incorporated all applicable circulars and practice notes issued by the National Treasury and the cidb.
Property Management Trading Entity (PMTE)
During the reporting period, the Department decided to adopt interim structural measures by establishing a clear separation between the PMTE and the Department’s main account. The implementation of PMTE is in line with the original approval by National Treasury. An interim solution was conceptualised in terms of structure, systems and human resource requirements and is envisaged to be implemented in the next financial year. In addition, much focus was on the accounting and reporting requirements for this entity. Trading entities are required to adopt the GRAP principles of accounting in the next financial year and the Department decided to accommodate an early adoption of GRAP as from 1 April 2012 and align all accounting and reporting templates and processes accordingly.
The intention of establishing the trading entity within the Department was to facilitate better delivery on its mandate in providing fit-for-purpose accommodation to clients at appropriate prices and to enable PMTE to obtain and retain funds for future immovable property development. The achievements to date are encouraging and it is expected that the eventual outcome of the project will support the creation of financial centres of excellence for the Department’s main account as well as the PMTE. The policy enhancements, controls and systems improvements have already been implemented, and this bodes well for the coming years.
Asset Investment Management
The Asset Life Cycle of the immovable asset is obtained at an initial acquisition cost (that could be through construction, purchase, lease, acceptance as a gift, exchange or transfer of custodianship between custodians). Ordinary use of the asset leads to wear and tear, thus requiring preventative maintenance to ensure that deterioration remains within the parameters of the assets required for performance.
After an initial phase (7-10 years for buildings) the asset requires renovation to reinstate it to its original state, followed by the next phase of preventative maintenance. During a lifecycle, the asset may also be upgraded or extended that would increase the value of the asset. The asset could be renovated for a second or a third time.
The useful life of the immovable asset typically extends beyond this point and after refurbishment, a new economic lifecycle will commence. Some well-known immovable assets, such as the Union Buildings, are already in their fifth financial lifecycle.
Once the value of the asset has deteriorated below the salvage value, the cost to refurbish or repair the asset is generally more than the cost to construct a new asset.
Inherent in the Immovable Asset Management function is the Immovable Asset Register, Portfolio Analysis and Valuations components which are central in the management of State immovable assets.
Immovable Asset Register
The Department embarked on a process to update the Immovable Asset Register. The Department in consultation with the Office of the Chief Surveyor General received the extensive reconciliation of National and Provincial current IARs that were completed against the Deeds Registry. The State land reconciliation with the Deeds Office records was
Overview by the Accounting Officer (continued)

20 Department of Public Works | Annual Report 2012/13
completed by 31 March 2013. Together with the input from the Provinces and the co-operation from the Departments of Rural Development and Land Reform and Human Settlements, this is a huge milestone to create an IAR that will – for the first time in years - accurately reflect the state’s immovable assets. A process is underway to link structures to land parcels and sourcing other information sources, for example, UAMPs, and external databases. The Department has created a repository in iEWorks for cleansed IAR data to be placed and also procured a tool for the physical inventory. The immediate plans for the IAR include formulating a custodian framework, a capitalisation policy, an operating model and a Fair Value model. Looking ahead, this will give the Department the tools to leverage its massive property portfolio for greater economic development.
Portfolio Analysis
Portfolio Analysis is central in determining of all property investment solutions. The built environment professionals enhance service delivery through the compilation of technical reports on option analysis, valuation reports and lease reviews. Such information provides recommendations on detailed solutions for specific projects inter alia, the options to buy, sell, maintain or construct new property.
Valuations and the Land Affairs Board (LAB)
The Department is responsible for the provision of a competent, comprehensive and cost effective valuation service. The Valuation Services function is tasked with the valuation of all acquisitions, disposals and rentals that involve transactions between the Department and various parties, mainly private sector property entities. The other key activity within Valuation Services has been the review of municipal valuations on State-owned properties to enable savings on municipal rates levied, through lodging of objections on over/under valued State properties.
The Department is in the process of developing a fair value model to undertake property valuations that comply with accounting standards, in particular GRAP. In conducting valuations, internationally recognised valuation methods are applied as stipulated in the International Valuation Standards (IVS), these methods include among others the Sales Comparison, Income Capitalisation and Depreciated Replacement methods.
During 2012/2013 the following was achieved in terms of valuations:
• 355 Market Valuations completed.
• 2 633 Municipal Valuations appraised. The Land Affairs Board (LAB) members are appointed on an annual basis by the Minister of Public Works in terms of Section 3 of the Land Affairs Act, 101 of 1987. The functions of the LAB in terms of the Land Affairs Act 101 of 1987, Section 6(1) and (2) are subject to the directions of the Minister. The Board shall determine the amount of compensation, purchase prices or rentals payable in respect of immovable property which is expropriated, purchased or leased by the Department for public purposes, out of funds appropriated by Parliament for that purpose.
In the financial year 2012/2013, the LAB assessed 230 valuation reports for purposes of acquisitions, disposals, rentals, donations and exchange.
Property Management
Property Management is one of the streams of the core business of the Department. In the 2012/13 Annual Performance Plan, the Department announced that as part of enhancing the Property Management function to reflect properly its centrality, it will embark on a lease audit review, with the assistance of the National Treasury.
Prior to the lease review with the National Treasury, the Department initiated a process with the Auditor General to conduct an audit on all the Departmental leases which would form the basis of the specific terms of reference for the lease review project. The purpose of the lease review exercise was to address the irregularities in the lease environment by conducting a forensic lease audit, dealing with the backlog of leases, dealing with leases that are due to expire and managing the accommodation needs of the State.
To date, all of the 2 778 leases have been reviewed. Of the 2 778, a total of 1 316 were leases that required completion, revision or renewal. These were regarded as backlog leases. Of the backlog leases, recommendations have already been
Overview by the Accounting Officer (continued)
Department of Public Works | Annual Report 2012/13 21
made in respect of 365 leases. Recommendations for the remaining 951 leases were made and should be in place in the next financial year.
In enhancing the Property Management function, through the Organisational Functional Assessment project in consultation with DPSA, the Department intends to elevate the property management function to a branch level.
Devolution of budgets and accommodation charges
During 2006 the Department devolved its maintenance budget to the users in favour of an accommodation charge. The purpose of the accommodation charge is to reflect the full cost of accommodation on the budget of the user and to establish a landlord – tenant relationship between the Department as custodian and the user as its clients.
In terms of the “Framework for the Devolution of Budget and the Introduction of Accommodation Charges Version 17, 18 December 2005” a rental per square meter was determined for each accommodation type, based on the then maintenance budget of the Department.
However the current budget levels, given the condition of the Departments assets, are still not sufficient to ensure that the full maintenance, renovation and refurbishment requirements are met. The National Treasury has also committed to fund the full accommodation charges (full cost of accommodation) on all assets that are fully refurbished by the Department. Currently the National Treasury has made capital available for the funding of various refurbishment activities. These include the Inner City Regeneration, upgrading of land ports of entry through the Border Control Operational Coordinating Committee (BCOCC) and capital on the budget of the user Departments.
As the accommodation charges model only provides for ongoing maintenance requirements, it does not take into account the inherited backlogs in maintenance and associated rehabilitation requirements, nor does it take into account the possible savings from more efficient use of available accommodation space. The Department agreed that the budget will include a capital amount to contribute to the rehabilitation and investment in new or replacement accommodation.
Construction management
The Department has access to three key infrastructure budget streams, namely the Department of Public Works capital and the user Departments’ capital and maintenance. At national government level, the Department provides accommodation to 52 user Departments including entities. The implementation of projects on the building programme funded by the Department and the user Departments, at Head Office level and throughout the 11 Regional Offices is significant for job creation.
The infrastructure budget of the Department for 2012/13 was spent on the following programmes:
• Accessibility of state-owned buildings by people with disabilities.
• Dolomite Risk Management.
• Land Ports Of Entry.
• Inner-City Regeneration.
• Special and Major Projects.
• The Departments’ own office accommodation.
Approximately 214 projects were completed, including high-profile projects for the Department of Justice, Correctional Services, SAPS, and the SANDF. These included the upgrading of the Boston Base Air Force Base and the Phase 2 runway upgrade at the Waterkloof Air Force Base for the Department of Defence, the new magistrates court buildings in Katlehong, renovations to Bloemfontein Magistrates Court, refurbishment of Gelvandale Magistrates Court (Port Elizabeth) for the Department of Justice and Constitutional Development, maintenance at Glencoe and Kroonstad prisons, upgrading of the power supply at Goedemoeg Prison, repairs at Tulbagh Prison for the Department of Correctional Service and for the South African Police Services the renovation of buildings at Port St Johns and the upgrade and new accommodation for the Clocolan Police Station was completed. Capital projects created about 18 815 jobs during the financial period. The target for the new financial year is approximately 40 000 jobs – based on the current and planned projects. Currently 518 projects are in the construction phase, with 300 expected to be completed by the end of March 2014.
Overview by the Accounting Officer (continued)
22 Department of Public Works | Annual Report 2012/13
Strategic projects to be completed this year include 7 military projects, the Tzaneen prison, the Matola Raid Monument in Mozambique, the Skilpadhek Port of Entry; upgrading of 38 Church Street (National Treasury); and the Golela Port of Entry Residential Complex.
Border Control Operating Co-coordinating Committee (BCOCC)
The BCOCC is a National body “responsible for the strategic management of the South African border environment in a coordinated manner.” This includes the key components of improved and coordinated security, trade and tourism. The control of the border environment is inherently a multi-Departmental responsibility, requiring extensive communication and coordination across Departments, agencies and provinces. The BCOCC comprises numerous stakeholders in the border environment, of whom, six Departments are actively operational at the Land Ports of Entry.
The Department, as custodian to state-owned immovable assets at land ports of entry has progressively improved over the years to support the BCOCC Departments by providing operational accommodation and related physical infrastructure services. The Department executes its custodian functions in the form of comprehensive upgrade, repair, renovation and facilities management contracts at all land ports of entry. In most cases the border posts are situated in remote parts of the country where accessibility to services remains a challenge. Where required, auxiliary services are provided on site and managed with daily operators to ensure compliance to Occupational Health and Safety requirements.
As the largest infrastructure programme under the Department Capital Budget, R233 891 508 (84% of the allocation is for land ports of entry) was spent for the period under review, on the construction of new accommodation, refurbishment of existing accommodation and repairs and maintenance of accommodation at the land ports of entry.
An Inter-Agency Clearing Forum (IACF) steering committee was formed to spearhead the work aimed at developing an enhanced movement control system at identified ports of entry. The committee ensured development and the smooth and timely roll-out of the Department of Home Affairs (DHA) system to 34 sites including airports and land ports of entry.
The successful roll-out of the project provided affirmation that with cooperation and collaboration among and between Departments, a lot can be achieved. The steering committee has evolved into a bigger forum and has been extended to include the additional Departments. The IACF manages the problems associated with operations at ports of entry, with the aim of finding collective resolutions to these problems.
Service Delivery Improvement Programme (SDIP)
The development of the SDIP is based on the premise, as per Section 195(5) of the South African Constitution (1996), that states that “the public administration must be governed by the democratic values and principles”. The intention of the SDIP is for the Department to strive for excellence in service delivery and commit to continuous service delivery improvement. It seeks to improve the nature or quality of the actual service being provided and the manner in which the service is delivered focusing on whether the Department utilises its resources efficiently to produce outputs that are consistent with its mandate and have objectives that are relevant for its users which are key to achieving service delivery excellence.
Between 2005 and 2007, the Department developed a Service Delivery Improvement Programme called Zimisele. Building on the work completed through Zimisele, the Department is improving the SDIP in collaboration with DPSA. In line with the methodology used, the following areas were identified as needing improvement during the 2013/14 financial year:
• Acquisition of functional, office and residential accommodation through construction.
• Provision of leased accommodation.
• Provision of day-to-day maintenance services.
Professional Legal and Variations Order (VO) Committees
On the 4 April 2012, the Department signed back into operation the Professional Legal Committee, comprising members from the Professional and Legal Services’ Units. The objectives of the Committee are to advise on matters related to construction contracts, Professional Acts and Regulations and published professional fee scales, including the drafting
Overview by the Accounting Officer (continued)

Department of Public Works | Annual Report 2012/13 23
of generic and specific documentation related to the aforementioned; advising Project Managers on cases involving repudiation, default, cancellation of contracts and liquidations and whether to defend or settle matters of dispute; to co-ordinate legal matters and be a central body of progress verification of litigation events of a construction industry nature for or against the Department; to assist Project Managers in litigation matters which could, inter alia, include instruction to Legal Counsel, assistance in drawing up legal documentation and pleadings, consultation with legal Counsel, guide settlement negotiations; and to issue professional/legal directives aimed at assisting and capacitating Project Managers.
The work of the VO Committee commenced on the 15th May 2012 and the basis for its existence emanates from the decision to withdraw the Variation Orders Delegations. The VO Committee reports to the Director-General on a quarterly basis and its role is to assess the applications of variation orders on capital projects and advise the Director-General on the suitable actions to take.
Expanded Public Works Programme (EPWP)
The Expanded Public Works Programme (EPWP) is a National programme co-ordinated by the Department. The goal of EPWP is to create 4.5 million work opportunities (equivalent to 2 million full time equivalents) for the poor and unemployed people of South Africa, so as to contribute to halving unemployment by 2014, through the delivery of public and community services. EPWP supports public bodies from all spheres of government (in terms of their normal mandates and budgets) and the Non-State sector through Government incentives to deliberately optimise the creation of work opportunities for unemployed and poor people in South Africa through the delivery of public and community services.
Overall, the EPWP has created 3 054 027 work opportunities in Phase 2 thus far (April 2009 - 31 March 2013). This is 68% of the five year target of 4 500 000 work opportunities. The four year commulative performance of 3 054 027 constitutes 93.4% of the cumulative target of 3 270 000 for the period April 2009 to 31 March 2013. For the financial year 2012/13, the programme has created 941 593 work opportunities during the period 01 April 2012 to 31 March 2013. This constitutes 78% of the target of 1 210 000 work opportunities.
Three provinces over-performed against their 2012/13 work opportunity targets, namely, Eastern Cape, Mpumalanga and Western Cape. The Northern Cape achieved 99% of its target. Three provinces achieved more than 70% of their 2012/13 target, namely Limpopo, Gauteng and KwaZulu-Natal.
For the 2012/13 financial year, the Department disbursed 100% of the Social Sector EPWP Incentive Grant allocated to DoRA compliant provincial sector public bodies via the Provincial Treasuries. Provincial departments in total spent 91% of the Grant in 2012/13. Seven provinces (GP, LP, MP, NC, EC, NW and WC) had spent more than 95% of their allocation except whereas KZN and FS at 47% and 77% respectively. A total of 520 839 households were serviced, 2 890 NPOs supported, and Stipends paid to 11 902 beneficiaries.
In terms of the EPWP Integrated Grant to Provinces, 100% of the grant has been disbursed by the National Department of Public Works. In terms of expenditure, 90% of the grant has been spent by the eligible Provincial Departments as at the end of March 2013. Full expenditure of the grant was not achieved in the Free State, Gauteng, Northern Cape, North West and Western Cape provinces. Full expenditure has not been recieved by the public bodies because of delays in the implementation of projects.
The measures put in place to improve expenditure on the Integrated Grant include providing technical support to help in the implementation of projects, in terms of design and relevant contract documentation; re-orientation workshops on labour-intensive methods are being held with officials in the different public bodies to empower them on EPWP principles to assist with implementation; and site verification visits have been made to different public bodies to monitor implementation of projects. In addition, follow-up is being made with Accounting Officers and Financial Officers in the different public bodies to provide regular reports.
Overview by the Accounting Officer (continued)

24 Department of Public Works | Annual Report 2012/13
Limpopo Department of Public Works (LDPW)
Cabinet decided on the 5 December 2011 to invoke s100 (1) (b) of the Constitution of the Republic of South Africa in the Limpopo Department of Public Works. The intervention identified five areas of intervention that was informed by a diagnostic report. The vision of the intervention team is to position the Limpopo Department of Public Works (LDPW) as an infrastructure Department that is able to deliver on its mandate as required by a proclamation of the Premier of Limpopo in terms of Section 3.3 of the GIAMA. The key areas of intervention included, inter alia, the compilation of a GIAMA asset register; review of the current lease portfolio of the LDPW, building the professional capacity of the LDPW to deliver on its mandate and building the capacity of the CFO’s office to manage procurement and finances. To date, in terms of progress, the intervention consolidated six immovable asset registers into one Master Register. In addition, appropriate title deed numbers to registered properties as indicated on the deeds register were assigned. One of the challenges facing the LDPW was around its management of its finances. Through the intervention, the R2billion that contributed to the disclaimer in the previous year was reconciled. Importantly, the intervention established a vesting factory to speed up the process of vesting properties by 31 March 2014 in line with the National targets.
The Department has improved the pace of its institutional support to the Provinces through its coordinating engine – the Intergovernmental Unit – where meetings between the Accounting Officer and the provincial Heads of Departments are held and technical areas affecting the spheres are discussed. These discussions also form the basis for engagement at Minmec with the aim of implementing the decisions taken.
Mr Mziwonke Dlabantu
Accounting Officer
Golela border Post
Overview by the Accounting Officer (continued)

Department of Public Works | Annual Report 2012/13 25
CHAPTER 2Performance Information
South African Embassy in Abuja Nigeria

26 Department of Public Works | Annual Report 2012/13
2.1 Accounting Officer’s Statement of Responsibility for Performance Information
Statement of Responsibility for Performance Information
The Accounting Officer is responsible for the preparation of the Department’s performance information and judgements’ made in this information.
The Accounting Officer is also responsible for establishing and implementing a system of internal control designed to provide reasonable assurance to the integrity and reliability of performance information.
In my opinion, the performance information fairly reflects the performance information of the Department for the financial year ended 31 March 2013.
Mr Mziwonke Dlabantu
Accounting Officer
31 May 2013

Department of Public Works | Annual Report 2012/13 27
2.2 Overview of Departmental PerformanceService delivery environment
As the key provider of government building infrastructure in South Africa, the Department plays a critical role in providing an enabling environment for the effective implementation of social and economic development. Its mandate is governed largely by the Government Immovable Asset Management Act of 2007 (GIAMA). This is a continuation of its pre-1994 role, that was to provide government building infrastructure delivered through the vehicle of National Public Works Programmes and accompanied by job-creation mechanisms. The existing public works programmes were replaced by the Expanded Public Works Programme in 2004. While the period since 1994 was marked by several programmatic shifts in focus, the underlying mandate of the Department remained constant. The White Paper on Public Works, gazetted in 1997, reinforced the role of the Department of Public Works as an enabler of sustainable economic growth through infrastructural development, a leader in transforming the construction and property sectors and the lead coordinator in optimising state funding for job creation through public works programmes.
Following a diagnostics undertaken as part of the turnaround process, it was revealed that there are major capacity deficiencies within the professional services of the Department which, if not corrected, impact negatively on the Department’s ability to deliver on the its mandate, also resulting in under-spending on capital projects.
As a major custodian of state immovable assets, the Department is responsible for the planning, acquisition, management and disposal of State immovable properties vested in the national government, hence, the Immovable Asset Register is key to the custodial role which the Department plays, in relation to the planning and management of state immovable assets. As reflected historically in reports from the Auditor General, the inadequacy of a compliant Immovable Asset Register has significantly contributed to the Department’s successive negative audit opinions. As a key priority towards the cleaning up of all negative audit findings, the compilation of a comprehensive compliant baseline Immovable Asset Register is paramount.
The Department remains responsible for the regulation and transformation of the construction and property sectors. Skewed property ownership patterns should be addressed, and the construction industry has to create an environment where emerging contractors graduate into sustainable businesses. The key programmes in this regard are: Implementation of the Construction Sector Charter Codes; the National Contractor Development Programme (NCDP), driven by the Construction Industry Development Board (cidb); the Contractor Incubator Programme (CIP) contributing to the development of emerging contractors between grades three and seven; the Property Incubator Programme (PIP); active participation in the Construction and Property Sector Charter Councils; and new legislation to facilitate change in these sectors.
The Department’s entities reporting to the Minster, namely the Agrément South Africa (ASA), Council for the Built Environment (CBE), Construction Independent Development Board (cidb) and Independent Development Trust (IDT),
Saldanha Bay: Sea Border Aerial View

28 Department of Public Works | Annual Report 2012/13
Overview of Departmental Performance (continues)
play a vital role in the area of construction, property, provision of expert advice and delivery of infrastructure such as schools.
Property Management Trading Entity (PMTE)
In 2006, the Department developed a draft business case for the establishment of the PMTE due to the devolution of budgets and the introduction of accommodation charges. However, the concept of a fully-fledged PMTE was not finalised. Furthermore, the Department failed to segregate properly the functions of its “main account” from those of the PMTE. This contributed significantly to both the Department and the PMTE receiving disclaimed audit opinions over the past years. The intervention to establish the PMTE to achieve greater transparency and cost-saving for the Department, created an adverse impact on the credibility of the Department. The Department has mapped out a plan that details the interim, medium to long term measure to organise the PMTE.
In relation to systems, the PMTE is still operating without the relevant financial systems that are critical for enabling compliance with GRAP. The business requirements in terms of Generally Recognised Accounting Practices (GRAP) requirements as well as the technical requirements were developed and documented. The procurement of the new financial system will be put to the open market during the 2013/14 financial year. In the meantime, the PMTE continues to use the Basic Accounting System (BAS), that is a “cash based” system. All balances have to be converted to accrual figures at year-end. All reports are based on manual processes that have to be updated on a monthly basis and all accounting treatments (e.g. impairments and discounting) are also performed manually on these balances. To ensure accuracy, reconciliations are done on a monthly basis on all accounts and between operational systems to ensure that any discrepancies are identified and dealt with expeditiously. Significant progress has been made in terms of completeness and accuracy of figures, especially those relating to previous year’s balances.
Expanded Public Works Programme (EPWP)
Through the Expanded Public Works Programme (EPWP), many work opportunities were created through various projects during the financial year under review. Although some targets may have not been fully achieved due to implementation challenges, inter alia, it is evident that the programme’s achievements impacted on creating work opportunities for the unskilled and reducing poverty amongst the poor in the country. In addition, the benefits of the EPWP on beneficiaries, especially with regard to addressing household food security are visible.
Projects
In terms of projects done by the Department, for the year under review, 214 projects were completed achieving status 6A stage (construction is completed in terms of all tender conditions and specifications). Under the Department’s Capital, a total of 264 projects were at the commitment stages of construction, while 348 projects and 68 projects (varying in status) were on construction stages. These projects will continue into the next financial year. The projects were achieved despite some challenges such as late awarding of projects, especially those above R20 million in tender value as well as capacity constraints with regard to project leaders. In addressing the capacity challenges, the Department established a joint professional team consisting of Architects, Engineers, and Quantity Surveyors in these regions to provide professional and technical support to project managers starting in the financial year 2013/14.
Strategic Asset Investment Analysis
Extensive work took place during the period under review to ensure that the information required for the Immovable Asset Register (IAR) meets the completeness assertion. The programme focused on confirmation of registered properties and verification of discrepancies identified, during the desktop deeds reconciliation process for state land custodians as at 31 March 2013. This verification and confirmation process resulted in adjustments to the National Department of Public Works and relevant custodians’ asset registers, to ensure that the correct properties were recorded and accounted for by relevant custodians. Outstanding issues pertaining to the status of IARs are addressed through various forums between National Treasury and custodians in the national and the provincial spheres of government. Furthermore, and in order to address accuracy and existence requirements, the Department appointed service providers to conduct physical verification of all immovable assets under its custodianship, which will take place in the 2013/14 financial year. In addition, the Department continues to engage with all relevant national and provincial stakeholders to support

Department of Public Works | Annual Report 2012/13 29
Overview of Departmental Performance (continues)
the national programme on immovable asset register. This will ensure that all management assertions (completeness, accuracy, existence, rights and obligations, valuations, and presentation and disclosure) for IARs are addressed.
In an effort to ensure that User Departments are accommodated in functional buildings, the Department embarked on enhancing the condition and increasing the value of State’s immovable assets through the Rehabilitation Programme. In the year under review, 6 State-owned buildings were rehabilitated to accommodate various User Departments.
Further, in ensuring that Government services are accessible to people with disabilities, the Department through its Accessibility Programme made 11 State-owned buildings accessible.
In addressing Outcome 8 which relates to provision of decent human settlements, the Department approved the release of 433.0026 hectares for human settlements to Housing Development Agency and municipalities.
Inner City regeneration
An Inner City Master Plan was completed in the financial under review for Tshwane. The Master Plan encapsulates a vision for the City as an African Capital City and demonstrates how Government’s presence in the Inner City creates a catalyst for Inner City regeneration and development. Precinct Plans were completed for Salvokop, Paul Kruger and Marabastad zones. Through concerted and multiple actions by all levels of government, these plans will deliver a combination of safety, cleanliness, efficiency, and urban management to drive the alignment of public service improved infrastructure, including planning for funding and appropriate delivery models.
Towards the creation of a government estate in Salvakop, the Department of Statistics South Africa was provided with site development guidelines that enabled them to finalise their Public Private Partnership tender for a new head office at Salvokop. Engagement with other prioritised departments were initiated for their optimal placement within the Salvakop Precinct.
Service Delivery Improvement Plan (SDIP)
The Department conducted a situational analysis and identified projects for improvement over the three-year cycle. The following projects were identified as high impact service delivery areas: Acquisition of accommodation through construction, leasing of accommodation and provision of day-to-day maintenance services. Governance structures to give effect to SDIP were approved.
Organisational Environment
In the past, the Department was fraught by a number of changes at management level and the financial year under review was not immune to the challenge. Some of the challenges, because of their nature, could not be resolved immediately, resulting in structural fissures. In an effort to address some of the structural challenges and management stability, the Department appointed a permanent Director-General and Chief Financial Officer to help steer the Department in the right direction. This meant that plans had to be revised with the intention to improve business efficiency and deliverables that meet the broader government objectives.
Key policy developments and legislative changes
The Department as a major shareholder of the sector entities, has during the period under review, developed business cases for the Independent Development Trust (IDT) and Agrément South Africa (ASA). The former seeks to IDT’s mandate and address the future sustainability of the entity while the latter is intended to establish the entity as a juristic person. Furthermore, the Construction Industry Development (cidb) Amendment Regulations, 2013 was published for public comment on 5 October 2012. The public comment phase closed on 5 December 2012. The requirements for registration were improved. Contractors will be better able to maintain their grades with the cidb and to upgrade. The final Regulations are being reviewed by the Department. The draft Built Environment Professions (BEP) Policy was developed to address challenges and shortcomings in the functioning and regulation of the built environment professions.
The Department continued the development of the draft Expropriation Bill to ensure consistency with the Constitution and uniformity in the expropriation of property by all organs of state.

30 Department of Public Works | Annual Report 2012/13
Overview of Departmental Performance (continues)
2.3 Strategic outcome oriented goalsDirected by the mandate and the performance agreement of the Executive Authority that is central to the planning of the Department. Further attention is paid to three sector outcomes: decent employment through inclusive economic growth (Outcome 4); sustainable human settlements and an improved quality of household life (Outcome 8) and an efficient, effective and development oriented public service and an empowered, fair and inclusive citizenry (Outcome 12). The Department also provides full support to the realisation of a skilled and capable workforce (Outcome 5) and the creation of an efficient, competitive and responsive economic infrastructure network (Outcome 6).
Progress on DPW’s contribution to the National Outcomes
• Outcome 4
The Department of Public Works is responsible for leading and co-coordinating the Expanded Public Works Programme (EPWP). The second phase of the EPWP covers the period from 2009/10 to 2014/15 and it aims to create 4.5 million work opportunities over a 5-year period. During the 2012/13 financial year year, 941 593 work opportunities were created under EPWP.
• Outcome 8
Departments from all spheres of government are required to release land for human settlements development purposes. As indicated above, the Department of Public Works, in consultation with the Department of Human Settlements contributes to the mobilisation of well-located public land for low income and affordable housing. In this regard, the Department of Public Works released 433.0026 hectares of land for human settlement purposes during the period under review.
• Outcome 12
The Department of Public Works will contribute to the access of government services through the provision of office accommodation. During the period under review, the Department of Public Works constructed 214 building projects, of which 11 buildings were made accessible to people with disabilities and 6 properties were rehabilitated in an effort to improve the physical environment where government services are rendered.
Progress on National Development Plan
The National Development Plan contains proposals for addressing the problems of poverty, inequality and unemployment in the country. It is a roadmap to a South Africa, where all South Africans will have water, electricity, sanitation, jobs, housing, public transport, adequate nutrition, education, social protection, quality healthcare, recreation and a clean environment. The Department will contribute to the priorities in the National Development Plan through the implementation of a number of initiatives.
Lamberts Bay police station

Department of Public Works | Annual Report 2012/13 31
Overview of Departmental Performance (continues)
Environmental Sustainability and Resilience
In operationalising the Long Term Mitigation Strategy (LTMS) of government within the built environment, the DPW (through its entities such as CBE and cidb) engaged International organisations and programmes such as the United Nations Environment Programme- Sustainable Building Climate Initiative (UNEP-SBCI) and the United Nations Framework Convention on Climate Change which located the built environment as one of the foremost contributors to Greenhouse gas emission, with a footprint of 40 percent of total emissions and a high potential for mitigation measures.
As a lead Department in the built environment sector, the Department of Public Works is in a process of establishing a Project Management Office for its Built Environment Green Economy Programme (BEGEP) that is aimed at bringing effect to the Department’s Green Building Framework, supporting South Africa’s commitments to the Kyoto Protocol, and contributing towards the implementation of the National Climate Change Response White Paper.
BEGEP will encompass energy efficiency, water efficiency, sustainable waste management, building retrofitting, eco-labelling of building materials and processes, and Green Building rating metrics aligned to international best-practice, socio-economic development trajectory, social-cohesion, and promote African epistemologies on sustainable building. The programme will coordinate the work and prescripts of DPW and its entities, i.e. CBE, cidb, ASA, and IDT.
Performance information on concurrent mandate
The National Department of Public Works assisted the Provincial Department of Public Works to developed a revised set of performance indicators for Programme two (2) –Immovable Asset Management and three (3) – Expanded Public Works Programme for the financial year 2013/14. This is an institutional support role played by the National Department as required by the Framework for Managing Performance Information (FMPPI).
Tweefontein police station in KwaMhlanga
The newly built Myra Primary School

32 Department of Public Works | Annual Report 2012/13
Overview of Departmental Performance (continues)
2.4 Performance Information by Programme The Department has five programmes and below is a brief description of each.
Programme 1: Administration
Purpose: To provide strategic leadership and support services, including the accommodation needs and overall management of the Department.
Sub-Programmes:
• Ministry
• Management
• Corporate Services
• Office Accommodation
Programme 2: Immovable Asset Management
Purpose: To provide and manage the Government’s immovable property portfolio in support of Government’s social, economic, functional and political objectives.
Sub-Programmes:
• Infrastructure (Public Works)
• Strategic Asset Investment Analysis
• Special Projects
• Operations Management
• Prestige Management
• Property Management
• Augmentation of the PMTE
• Construction Industry Development Board
• Council for the Built Environment
• Parliamentary Village Management Board
• Independent Development Trust

Department of Public Works | Annual Report 2012/13 33
Overview of Departmental Performance (continues)
Programme 3: Expanded Public Works Programme
Purpose: To create work opportunities and provide training (in targeted sub-programmes) for unskilled, marginalised and unemployed people of South Africa by coordinating the implementation of the Expanded Public Works Programme.
Sub-Programmes:
• Expanded Public Works Programme
• Performance-based Incentive Allocations
Programme 4: Property and Construction Industry Policy Regulation
Purpose: To regulate and promote the growth and transformation in the construction and property industries and to promote uniformity and best practices in construction and immovable asset management in the public sector.
Sub-Programmes:
• Construction Industry Development Programme
• Property Industry Development Programme
Programme 5: Auxiliary and Associated Services
Purpose: To provide for various services, including compensation for losses on the Government-assisted housing scheme and assistance to organisations for the preservation of national memorials and to meet the protocol responsibilities for state functions.
Sub-Programmes:
• Compensation for Losses
• Distress Relief
• Loskop Settlement
• Assistance to Organisations for the Preservation of National Memories
• State Functions
• Sector Education and Training Authority
Lamberts Bay police station

34 Department of Public Works | Annual Report 2012/13
Prog
ram
me
1: A
dmin
istr
atio
n
Purp
ose
of th
e pr
ogra
mm
e: P
rovi
de s
trat
egic
lead
ersh
ip a
nd s
uppo
rt s
ervi
ces,
incl
udin
g th
e ac
com
mod
atio
n an
d ov
eral
l man
agem
ent o
f the
Dep
artm
ent.
STRA
TEG
IC M
AN
AG
EMEN
T
Sub-
Prog
ram
me
Stra
tegi
c M
anag
emen
t
Stra
tegi
c O
bjec
tive
To e
nsur
e eff
ectiv
e co
rpor
ate
gove
rnan
ce a
nd s
ound
reso
urce
man
agem
ent
Perf
orm
ance
In
dica
tor
Act
ual A
chie
vem
ent
2011
/12
Plan
ned
Targ
et
2012
/201
3A
ctua
l Ach
ieve
men
t 20
12/2
013
Dev
iatio
n fr
om
Plan
ned
Targ
et to
A
ctua
l Ach
ieve
men
t for
20
12/2
013
Com
men
ts o
n D
evia
tions
Subm
issi
on a
nd
tabl
ing
of th
e St
rate
gic
Plan
and
Ann
ual
Perf
orm
ance
Pla
n to
Pa
rliam
ent a
ligne
d to
al
l rel
evan
t pre
scrip
ts.
Stra
tegi
c Pl
an a
nd A
nnua
l Pe
rfor
man
ce P
lan
(APP
) w
ere
tabl
ed in
Par
liam
ent
on 7
Mar
ch 2
012
to th
e Po
rtfo
lio C
omm
ittee
.
1 St
rate
gic
Plan
and
A
nnua
l Per
form
ance
Pla
n co
mpl
iant
with
Tre
asur
y Re
gula
tions
and
oth
er
rele
vant
pre
scrip
ts
The
final
201
3/14
Ann
ual
Perf
orm
ance
Pla
n w
as ta
bled
in
Par
liam
ent o
n 12
Mar
ch
2013
. The
str
ateg
ic P
lan
was
no
t rev
ised
and
re-t
able
d as
ap
prov
ed b
y th
e M
inis
ter f
or
the
5-ye
ar p
erio
d
Targ
et A
chie
ved
Non
e
Upd
ated
risk
regi
ster
sRe
view
ed th
e ap
prov
ed
inte
grat
ed ri
sk m
anag
emen
t st
rate
gy/p
olic
y
Risk
man
agem
ent r
epor
ts
subm
itted
to A
udit
and
Risk
M
anag
emen
t Com
mitt
ee
(ARM
C).
Risk
Reg
iste
rs c
ompl
eted
for
all u
nits
for 2
011/
12.
Risk
mon
itorin
g re
port
s si
gned
off
for 2
011/
12
(100
% c
ompl
eted
)
80%
of D
epar
tmen
tal R
isk
regi
ster
s up
date
dA
nnua
l ris
k as
sess
men
t rev
iew
s fo
r 201
2/13
was
con
duct
ed fo
r al
l bra
nche
s in
hea
d offi
ce a
nd
11 re
gion
al o
ffice
s.
2012
/13
risk
regi
ster
s ar
e in
pla
ce fo
r hea
d offi
ce a
nd
regi
ons
Targ
et A
chie
ved
Non
e

Department of Public Works | Annual Report 2012/13 35
Performance Indicators
Sub-
Prog
ram
me
Stra
tegi
c M
anag
emen
t
Stra
tegi
c O
bjec
tive
To e
nsur
e eff
ectiv
e co
rpor
ate
gove
rnan
ce a
nd s
ound
reso
urce
man
agem
ent
Perf
orm
ance
In
dica
tor
Act
ual A
chie
vem
ent
2011
/12
Plan
ned
Targ
et
2012
/201
3A
ctua
l Ach
ieve
men
t 20
12/2
013
Dev
iatio
n fr
om
Plan
ned
Targ
et to
A
ctua
l Ach
ieve
men
t for
20
12/2
013
Com
men
ts o
n D
evia
tions
Upd
ated
bus
ines
s pr
oces
ses
-Re
view
bus
ines
s pr
oces
s A
sset
Inve
stm
ent
Man
agem
ent
Targ
et N
ot A
chie
ved
The
crea
tion
of th
e D
irect
orat
e fo
r Bus
ines
s Pr
oces
ses
did
not
mat
eria
lise,
hen
ce th
ere
was
no
capa
city
to
deliv
er th
e ta
rget
.
Upd
atin
g of
Bus
ines
s Pr
oces
ses
will
be
defe
rred
unt
il th
e re
quire
d ca
paci
ty
beco
mes
ava
ilabl
e.
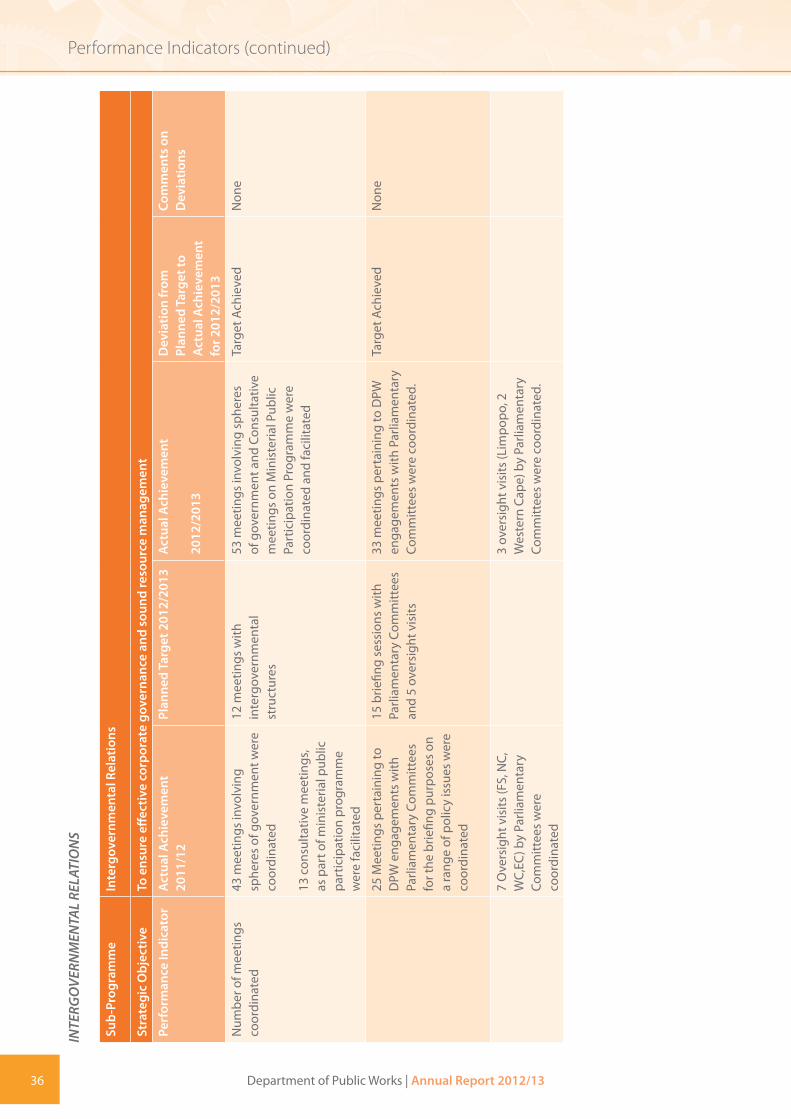
36 Department of Public Works | Annual Report 2012/13
Performance Indicators (continued)IN
TERG
OV
ERN
MEN
TAL
RELA
TIO
NS
Sub-
Prog
ram
me
Inte
rgov
ernm
enta
l Rel
atio
ns
Stra
tegi
c O
bjec
tive
To e
nsur
e eff
ectiv
e co
rpor
ate
gove
rnan
ce a
nd s
ound
reso
urce
man
agem
ent
Perf
orm
ance
Indi
cato
rA
ctua
l Ach
ieve
men
t 20
11/1
2Pl
anne
d Ta
rget
201
2/20
13A
ctua
l Ach
ieve
men
t
2012
/201
3
Dev
iatio
n fr
om
Plan
ned
Targ
et to
A
ctua
l Ach
ieve
men
t fo
r 201
2/20
13
Com
men
ts o
n D
evia
tions
Num
ber o
f mee
tings
co
ordi
nate
d43
mee
tings
invo
lvin
g sp
here
s of
gov
ernm
ent w
ere
coor
dina
ted
13 c
onsu
ltativ
e m
eetin
gs,
as p
art o
f min
iste
rial p
ublic
pa
rtic
ipat
ion
prog
ram
me
wer
e fa
cilit
ated
12 m
eetin
gs w
ith
inte
rgov
ernm
enta
l st
ruct
ures
53 m
eetin
gs in
volv
ing
sphe
res
of g
over
nmen
t and
Con
sulta
tive
mee
tings
on
Min
iste
rial P
ublic
Pa
rtic
ipat
ion
Prog
ram
me
wer
e co
ordi
nate
d an
d fa
cilit
ated
Targ
et A
chie
ved
Non
e
25 M
eetin
gs p
erta
inin
g to
D
PW e
ngag
emen
ts w
ith
Parli
amen
tary
Com
mitt
ees
for t
he b
riefin
g pu
rpos
es o
n a
rang
e of
pol
icy
issu
es w
ere
coor
dina
ted
15 b
riefin
g se
ssio
ns w
ith
Parli
amen
tary
Com
mitt
ees
and
5 ov
ersi
ght v
isits
33 m
eetin
gs p
erta
inin
g to
DPW
en
gage
men
ts w
ith P
arlia
men
tary
Co
mm
ittee
s w
ere
coor
dina
ted.
Targ
et A
chie
ved
Non
e
7 O
vers
ight
vis
its (F
S, N
C,
WC,
EC) b
y Pa
rliam
enta
ry
Com
mitt
ees
wer
e co
ordi
nate
d
3 ov
ersi
ght v
isits
(Lim
popo
, 2
Wes
tern
Cap
e) b
y Pa
rliam
enta
ry
Com
mitt
ees
wer
e co
ordi
nate
d.

Department of Public Works | Annual Report 2012/13 37
Performance Indicators (continued)
Sub-
Prog
ram
me
Inte
rgov
ernm
enta
l Rel
atio
ns
Stra
tegi
c O
bjec
tive
To e
nsur
e eff
ectiv
e co
rpor
ate
gove
rnan
ce a
nd s
ound
reso
urce
man
agem
ent
Perf
orm
ance
Indi
cato
rA
ctua
l Ach
ieve
men
t 20
11/1
2Pl
anne
d Ta
rget
201
2/20
13A
ctua
l Ach
ieve
men
t
2012
/201
3
Dev
iatio
n fr
om
Plan
ned
Targ
et to
A
ctua
l Ach
ieve
men
t fo
r 201
2/20
13
Com
men
ts o
n D
evia
tions
16 q
uart
erly
per
form
ance
re
port
s w
ere
coor
dina
ted
from
4 D
PW E
ntiti
es a
nd
pres
ente
d to
the
EA fo
r pe
rfor
man
ce m
onito
ring
A s
peci
al m
eetin
g be
twee
n th
e M
inis
ter a
nd
4 D
PW E
ntiti
es a
nd 6
Bui
lt En
viro
nmen
t Pro
fess
iona
l Co
unci
ls re
gard
ing
the
stra
tegi
c vi
sion
of D
PW w
as
coor
dina
ted
4 qu
arte
rly p
erfo
rman
ce
revi
ew m
eetin
gs fo
r 4
entit
ies
coor
dina
ted
All
four
201
2/13
Qua
rter
ly
Perf
orm
ance
Rev
iew
mee
tings
be
twee
n th
e M
inis
ter a
nd 4
DPW
pu
blic
ent
ities
wer
e he
ld.
Targ
et A
chie
ved
Non
e
Gov
erna
nce
stru
ctur
es
mee
tings
wer
e co
ordi
nate
d as
follo
ws:
4 M
INM
EC
28 E
XCO
and
8 Sp
ecia
l EXC
Os
5 H
eads
of D
epar
tmen
ts
Foru
m
11 M
into
p
3 TM
Cs
1 M
AN
CO
1 D
PW L
ekgo
tla p
er a
nnum
30 in
tern
al to
p go
vern
ance
st
ruct
ure
mee
tings
co
ordi
nate
d
37 G
over
nanc
e St
ruct
ures
M
eetin
gs w
ere
coor
dina
ted
as
follo
ws:
12 E
XCO
s an
d 7
Spec
ial E
XCO
s
9 M
INTO
P
4 H
OD
’s Fo
rum
5 M
INM
EC
Targ
et A
chie
ved
Non
e

38 Department of Public Works | Annual Report 2012/13
Performance Indicators (continued)
Sub-
Prog
ram
me
Inte
rgov
ernm
enta
l Rel
atio
ns
Stra
tegi
c O
bjec
tive
To e
nsur
e eff
ectiv
e co
rpor
ate
gove
rnan
ce a
nd s
ound
reso
urce
man
agem
ent
Perf
orm
ance
Indi
cato
rA
ctua
l Ach
ieve
men
t 20
11/1
2Pl
anne
d Ta
rget
201
2/20
13A
ctua
l Ach
ieve
men
t
2012
/201
3
Dev
iatio
n fr
om
Plan
ned
Targ
et to
A
ctua
l Ach
ieve
men
t fo
r 201
2/20
13
Com
men
ts o
n D
evia
tions
Parli
amen
tary
do
cum
ents
per
tain
ing
to th
e D
epar
tmen
t and
en
titie
s ta
bled
as
per
PFM
A re
quire
men
ts
(str
ateg
ic p
lans
, Bi
lls, A
nnua
l rep
orts
an
d Pa
rliam
enta
ry
ques
tions
)
Five
Str
ateg
ic P
lan
and
APP
’s (D
PW a
nd E
ntiti
es) w
ere
tabl
ed o
n 30
Sep
tem
ber
2011
120
Parli
amen
tary
que
stio
ns
wer
e re
ceiv
ed a
nd p
roce
ssed
50 P
arlia
men
tary
do
cum
ents
tabl
edA
ll St
rate
gic
Plan
s an
d A
nnua
l Pe
rfor
man
ce P
lans
for 4
DPW
& 4
en
titie
s w
ere
tabl
ed.
2012
/13
Ann
ual R
epor
ts fo
r 4
DPW
ent
ities
and
6 P
rofe
ssio
nal
Coun
cils
wer
e ta
bled
.
143
Parli
amen
tary
que
stio
ns
wer
e re
ceiv
ed a
nd p
roce
ssed
.
Targ
et A
chie
ved
Non
e
Effec
tive
gove
rnan
ce o
f se
ctor
ent
ities
80 0
00 E
uros
pai
d to
UIA
as
gua
rant
ee fo
r the
righ
ts
to h
ost t
he 2
014
UA
I Wor
ld
Cong
ress
in D
urba
n
Faci
litat
ed th
e pa
ymen
t of 8
0 00
0 Eu
ros
to U
IA a
s gu
aran
tee
for t
he
right
s to
hos
t the
201
4 U
AI W
orld
Co
ngre
ss in
Dur
ban
Targ
et A
chie
ved

Department of Public Works | Annual Report 2012/13 39
Performance Indicators (continued)M
ON
ITO
RIN
G A
ND
EVA
LUAT
ION
Sub-
Prog
ram
me
Mon
itori
ng a
nd E
valu
atio
n
Stra
tegi
c O
bjec
tive
To e
nsur
e eff
ectiv
e co
rpor
ate
gove
rnan
ce a
nd s
ound
reso
urce
man
agem
ent
Perf
orm
ance
Indi
cato
rA
ctua
l Ach
ieve
men
t 20
11/1
2Pl
anne
d Ta
rget
20
12/2
013
Act
ual A
chie
vem
ent
2012
/201
3D
evia
tion
from
Pl
anne
d Ta
rget
to
Act
ual A
chie
vem
ent
for 2
012/
2013
Com
men
ts o
n D
evia
tions
App
rove
d po
licy
guid
elin
esIn
stitu
tiona
lisat
ion
of
M&
E –
inte
ract
ion
with
all
bran
ches
and
bus
ines
s un
its
on re
port
ing
requ
irem
ents
(5
0%)
Inst
itutio
nalis
e an
d im
plem
ent r
evie
wed
pol
icy
Polic
y re
view
ed a
nd g
uide
lines
co
mpl
eted
and
read
y fo
r ap
prov
al
Targ
et N
ot A
chie
ved
Dat
e se
t for
app
rova
l sc
hedu
led
for M
ay 2
013
(out
side
the
repo
rtin
g ye
ar)
Impr
oved
Cor
pora
te
Gov
erna
nce
One
-on-
one
enga
gem
ent
with
bra
nche
s on
qua
rter
ly
repo
rtin
g fr
amew
ork.
60%
com
plia
nce
by
busi
ness
uni
ts.
Coor
dina
ted
and
cons
olid
ated
man
agem
ent
perf
orm
ance
ass
essm
ent
tool
(MPA
T) in
puts
fo
r sub
mis
sion
to th
e Pr
esid
ency
.
Perf
orm
ance
repo
rts
wer
e co
llate
d fr
om a
ll Bu
sine
ss
units
aga
inst
the
stra
tegi
c an
d bu
sine
ss p
lans
(100
%).
Impa
ct A
naly
sis
Repo
rtIm
pact
Ana
lysi
s Re
port
not
yet
do
neTa
rget
Not
Ach
ieve
d
Impa
ct a
sses
smen
t is
oft
en d
one
afte
r th
e fin
anci
al y
ear e
nd
(Jun
e-Ju
ly)
Targ
et h
as
been
revi
sed
appr
opria
tely
for t
he
next
fina
ncia
l yea
r
Verifi
catio
n &
Val
idat
ion
of P
rogr
amm
e Pe
rfor
man
ce
-Ve
rifica
tion
30 s
tate
-ow
ned
build
ings
Verifi
catio
n 30
sta
te-o
wne
d bu
ildin
gs n
ot d
one
Targ
et N
ot A
chie
ved
Capa
city
con
stra
ints
Targ
et w
as re
vise
d to
co
nsid
er re
sour
ces
requ
ired
to c
ondu
ct
such
an
exer
cise

40 Department of Public Works | Annual Report 2012/13
Performance Indicators (continued)IN
TERN
AL
AUD
IT A
ND
INV
ESTI
GAT
ION
SER
VIC
ES
Sub
- Pro
gram
me
Inte
rnal
Aud
it an
d In
vest
igat
ions
Ser
vice
s
Stra
tegi
c O
bjec
tive
To e
nsur
e eff
ectiv
e co
rpor
ate
gove
rnan
ce a
nd s
ound
reso
urce
man
agem
ent
Perf
orm
ance
Indi
cato
rA
ctua
l Ach
ieve
men
t 20
11/2
012
Plan
ned
Targ
et 2
012/
2013
Act
ual A
chie
vem
ent
2012
/201
3
Dev
iatio
n fr
om
plan
ned
targ
ets
to
actu
al a
chie
vem
ent f
or
2012
/201
3
Com
men
ts o
n D
evia
tions
Inte
rnal
Aud
it pl
an
deve
lope
d an
d ap
prov
ed a
nnua
lly b
y M
ay
Inte
rnal
Aud
it Pl
an
appr
oved
on
27 M
ay
2011
by
Audi
t and
Ris
k M
anag
emen
t Com
mitt
ee.
1 In
tern
al A
udit
plan
ap
prov
ed b
y M
ay
2012
by
Audi
t and
Ris
k M
anag
emen
t Com
mitt
ee.
Inte
rnal
Aud
it Pl
an (A
nnua
l Pl
an) a
ppro
ved
by A
RMC
on
29 M
ay 2
012.
Targ
et A
chie
ved
Non
e
Inte
rnal
Aud
it pl
an
impl
emen
ted
ad
Audi
t rep
orts
issu
ed
to E
XCO
and
Aud
it an
d Ri
sk M
anag
emen
t Co
mm
ittee
•75
.5 %
com
plet
ion
of
appr
oved
pla
nned
aud
it
•7
repo
rts
issu
ed to
Aud
it an
d Ri
sk M
anag
emen
t Co
mm
ittee
9 In
tern
al A
udit
repo
rts
issu
ed to
EXC
O a
nd A
udit
and
Risk
Man
agem
ent
Com
mitt
ee
2 In
tern
al A
udit
repo
rts
issu
ed to
EXC
O a
nd A
udit
and
Risk
Man
agem
ent
Com
mitt
ee
Cum
ulat
ive
perf
orm
ance
is
at 6
5% a
nd
Actu
al p
erfo
rman
ce is
19
.5%
•H
R D
ata
Ana
lysi
s/St
aff
Com
plem
ent (
IT) A
udit
•Tr
ansf
er P
aym
ents
-En
titie
s
Targ
et N
ot A
chie
ved
7 au
dits
wer
e ov
erla
ps
from
201
1/20
12:
•PM
TE
•SA
S –
App
licat
ion
Cont
rols
Rev
iew
•D
ivis
ion
of R
even
ue
(DO
RA)-
Tran
sfer
s
•IT
Gen
eral
Con
trol
s Re
view
(GCR
) - A
D H
OC
•Fo
llow
Up
on p
revi
ous
audi
ts: I
nter
nal A
udit
&
AG F
indi
ngs
•Au
dit o
f Per
form
ance
In
form
atio
n
•EP
WP
(Com
plia
nce)
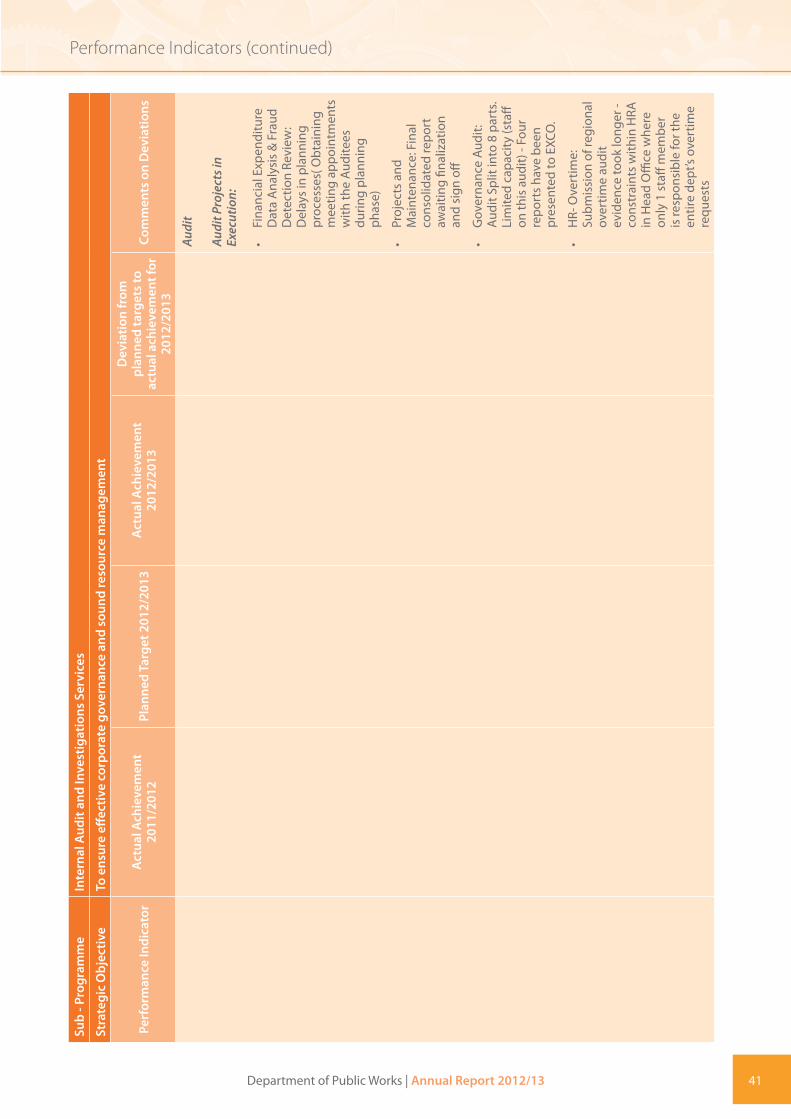
Department of Public Works | Annual Report 2012/13 41
Performance Indicators (continued)
Sub
- Pro
gram
me
Inte
rnal
Aud
it an
d In
vest
igat
ions
Ser
vice
s
Stra
tegi
c O
bjec
tive
To e
nsur
e eff
ectiv
e co
rpor
ate
gove
rnan
ce a
nd s
ound
reso
urce
man
agem
ent
Perf
orm
ance
Indi
cato
rA
ctua
l Ach
ieve
men
t 20
11/2
012
Plan
ned
Targ
et 2
012/
2013
Act
ual A
chie
vem
ent
2012
/201
3
Dev
iatio
n fr
om
plan
ned
targ
ets
to
actu
al a
chie
vem
ent f
or
2012
/201
3
Com
men
ts o
n D
evia
tions
Aud
it
Aud
it P
roje
cts
in
Exec
utio
n:
•Fi
nanc
ial E
xpen
ditu
re
Dat
a A
naly
sis
& F
raud
D
etec
tion
Revi
ew:
Del
ays
in p
lann
ing
proc
esse
s( O
btai
ning
m
eetin
g ap
poin
tmen
ts
with
the
Audi
tees
du
ring
plan
ning
ph
ase)
•Pr
ojec
ts a
nd
Mai
nten
ance
: Fin
al
cons
olid
ated
repo
rt
awai
ting
final
izat
ion
and
sign
off
•G
over
nanc
e Au
dit:
Audi
t Spl
it in
to 8
par
ts.
Lim
ited
capa
city
(sta
ff on
this
aud
it) -
Four
re
port
s ha
ve b
een
pres
ente
d to
EXC
O.
•H
R- O
vert
ime:
Su
bmis
sion
of r
egio
nal
over
time
audi
t ev
iden
ce to
ok lo
nger
- co
nstr
aint
s w
ithin
HRA
in
Hea
d O
ffice
whe
re
only
1 s
taff
mem
ber
is re
spon
sibl
e fo
r the
en
tire
dept
’s ov
ertim
e re
ques
ts

42 Department of Public Works | Annual Report 2012/13
Performance Indicators (continued)
Sub
- Pro
gram
me
Inte
rnal
Aud
it an
d In
vest
igat
ions
Ser
vice
s
Stra
tegi
c O
bjec
tive
To e
nsur
e eff
ectiv
e co
rpor
ate
gove
rnan
ce a
nd s
ound
reso
urce
man
agem
ent
Perf
orm
ance
Indi
cato
rA
ctua
l Ach
ieve
men
t 20
11/2
012
Plan
ned
Targ
et 2
012/
2013
Act
ual A
chie
vem
ent
2012
/201
3
Dev
iatio
n fr
om
plan
ned
targ
ets
to
actu
al a
chie
vem
ent f
or
2012
/201
3
Com
men
ts o
n D
evia
tions
•Irr
egul
ar E
xpen
ditu
re-
Follo
w U
p:
Confi
rmat
ion
of
proc
esse
s in
pla
ce fo
r th
e ne
wly
est
ablis
hed
Com
plia
nce
Uni
t in
regi
ons
Aud
it P
roje
cts
not y
et
star
ted:
•Fo
llow
Up
Man
agem
ent A
ctio
n Pl
an to
AG
SA R
epor
t 20
11/1
2: P
ostp
oned
to
2013
/14
Audi
t Pla
n
• IE
Wor
ks A
CR/ D
ata
Mig
ratio
n: C
ance
lled
•IT
Aud
it Fo
llow
Ups
(S
AS,
GCR
etc
.): A
udit
po
stpo
ned
to 2
013/
14
•IT
Sec
urity
Rev
iew
: Po
stpo
ned
to 2
013/
14
Audi
t Pla
n; A
wai
ting
Secu
rity
clea
ranc
e fo
r ser
vice
pro
vide
r an
d fin
aliz
atio
n of
pr
ocur
emen
t pro
cess
es
by S
CM.

Department of Public Works | Annual Report 2012/13 43
Performance Indicators (continued)
Sub
- Pro
gram
me
Inte
rnal
Aud
it an
d In
vest
igat
ions
Ser
vice
s
Stra
tegi
c O
bjec
tive
To e
nsur
e eff
ectiv
e co
rpor
ate
gove
rnan
ce a
nd s
ound
reso
urce
man
agem
ent
Perf
orm
ance
Indi
cato
rA
ctua
l Ach
ieve
men
t 20
11/2
012
Plan
ned
Targ
et 2
012/
2013
Act
ual A
chie
vem
ent
2012
/201
3
Dev
iatio
n fr
om
plan
ned
targ
ets
to
actu
al a
chie
vem
ent f
or
2012
/201
3
Com
men
ts o
n D
evia
tions
4 Au
dit a
nd R
isk
Man
agem
ent
Com
mitt
ee m
eetin
gs
held
Five
ARM
C m
eetin
gs w
ere
held
as
follo
ws
and
repo
rts
pres
ente
d:
•27
May
201
1
•31
Aug
ust 2
011
•28
Oct
ober
201
1
•27
Janu
ary
2012
•30
Mar
ch 2
012
4 m
eetin
gs fa
cilit
ated
qu
arte
rly.
2 Au
dit C
omm
ittee
m
eetin
gs h
eld
on 0
5 Fe
brua
ry a
nd 2
7 M
arch
2013
Targ
et N
ot A
chie
ved
Revi
ewed
and
Upd
ated
Fr
aud
Prev
entio
n St
rate
gy
Not
Ach
ieve
d, R
evie
w
Proc
ess
unde
rway
Revi
ewed
1 F
raud
Pr
even
tion
Stra
tegy
Revi
ew P
roce
ss u
nder
way
Targ
et N
ot A
chie
ved
The
revi
ew p
roce
ss o
f the
co
nten
t fina
lised
,
The
frau
d ris
ks s
till t
o be
re
vise
d.
Uni
t exp
erie
nce
serio
us
capa
city
con
stra
ints
,inve
s-tig
atio
ns w
ere
ther
efor
e pr
iorit
ised
20 A
war
enes
s Wor
ksho
ps
cond
ucte
d in
the
regi
onal
offi
ces
12 A
war
enes
s Wor
ksho
ps
rolle
d ac
ross
the
Dep
artm
ent
5 Aw
aren
ess
Pres
enta
tion
cond
ucte
d at
Hea
d O
ffice
an
d W
orks
hops
Targ
et N
ot A
chie
ved
5 Aw
aren
ess
Pres
enta
tion
cond
ucte
d at
Hea
d O
ffice
an
d W
orks
hops
Achi
eved
– 1
Art
icle
pu
blis
hed
in W
orx-
New
s4
Art
icle
s in
Wor
x-N
ews
1 A
rtic
le p
ublis
hed
in W
orx-
New
sTa
rget
Not
Ach
ieve
dN
o W
orx-
New
s pu
blis
hed
for t
he p
erio
d.
4 pr
ogre
ss re
port
s on
in
vest
igat
ions
issu
ed
quar
terly
to E
XCO
and
Aud
it an
d Ri
sk M
anag
emen
t Co
mm
ittee
4 pr
ogre
ss re
port
s on
in
vest
igat
ions
sub
mitt
ed
to M
anag
emen
t and
Aud
it an
d Ri
sk M
anag
emen
t Co
mm
ittee
Prog
ress
Rep
ort
pres
ente
d to
ARM
C on
05
Feb
ruar
y 20
13 –
. Th
ree
(3) i
nves
tigat
ions
co
mpl
eted
; Thi
rty-
two
(32)
in
vest
igat
ions
at R
epor
ting
stag
e; th
irty-
five
(35)
in
vest
igat
ions
at e
xecu
tion
stag
e
Targ
et N
ot A
chie
ved
One
(1) I
nves
tigat
ion
Prog
ress
Rep
ort p
rese
nted
to
ARM
C on
05
Febr
uary
20
13

44 Department of Public Works | Annual Report 2012/13
Performance Indicators (continued)FI
NA
NC
E A
ND
SU
PPLY
CH
AIN
MA
NA
GEM
ENT
Sub
- Pro
gram
me
Fina
nce
and
Supp
ly C
hain
Man
agem
ent
Stra
tegi
c O
bjec
tive
To e
nsur
e eff
ectiv
e co
rpor
ate
gove
rnan
ce a
nd s
ound
reso
urce
man
agem
ent
Perf
orm
ance
Indi
cato
rA
ctua
l Ach
ieve
men
t 20
11/1
2Pl
anne
d Ta
rget
20
12/2
013
Act
ual A
chie
vem
ent
2012
/201
3D
evia
tion
from
Pla
nned
Tar
get
to A
ctua
l Ach
ieve
men
t for
20
12/2
013
Com
men
ts o
n D
evia
tions
PMTE
deb
tors
’ age
an
alys
isD
ebto
r boo
k in
crea
sed
Redu
ce d
ebto
rs a
ge
anal
ysis
to 1
yea
r56
.44%
of t
arge
t ach
ieve
d.
This
tran
slat
es to
R1
060
Billi
on c
olle
cted
from
thes
e de
btor
s
Targ
et N
ot A
chie
ved
The
plan
ned
targ
et o
f 100
% c
ould
no
t be
obta
ined
due
to c
apac
ity
cons
trai
nts.
The
devi
atio
n fr
om th
e pl
anne
d ta
rget
is th
eref
ore
43.5
6%.
The
Fina
ncia
l Se
rvic
e Pr
ovid
er
(FSP
) ass
umed
dut
y on
9 Ja
nuar
y 20
13.
Reco
ncili
atio
n of
de
btor
s is
a k
ey
focu
s ar
ea o
f the
ir de
liver
able
s. It
is
expe
cted
that
this
ta
rget
will
impr
ove
sign
ifica
ntly
in th
e ne
xt fi
nanc
ial y
ear.
Audi
t Rep
ort (
i.e. t
o SA
, G
AA
P co
mpl
ianc
e)-
Posi
tive
exte
rnal
aud
it ou
tcom
e A
ll co
mpl
ianc
e co
ntro
ls
(rela
ted
to th
e pr
evio
us
year
dis
clai
mer
) was
in
stitu
ted.
How
ever
, the
se
appe
ar to
be
insu
ffici
ent t
o qu
alify
for a
pos
itive
aud
it ou
tcom
e.
Targ
et N
ot A
chie
ved
No
com
men
t unt
il au
dit o
utco
me
is
publ
ishe
d.
Audi
t Rep
ort (
DPW
co
mpl
ianc
e w
ith th
e A
FS p
resc
ripts
)
-Po
sitiv
e ex
tern
al a
udit
outc
ome
All
disc
laim
er it
ems
wer
e re
solv
ed.
Targ
et A
chie
ved
Effec
tive
Dem
and
Man
agem
ent
Impl
emen
ted
-Ex
iste
nce
and
Com
plet
enes
s of
a
Cons
olid
ated
Pr
ocur
emen
t Pla
n
95%
com
plia
nce
to C
PP
Cons
olid
ated
Pro
cure
men
t Pl
an w
as s
ubm
itted
to
Nat
iona
l Tre
asur
y
Targ
et A
chie
ved
Non
e

Department of Public Works | Annual Report 2012/13 45
Performance Indicators (continued)
Sub
- Pro
gram
me
Fina
nce
and
Supp
ly C
hain
Man
agem
ent
Stra
tegi
c O
bjec
tive
To e
nsur
e eff
ectiv
e co
rpor
ate
gove
rnan
ce a
nd s
ound
reso
urce
man
agem
ent
Perf
orm
ance
Indi
cato
rA
ctua
l Ach
ieve
men
t 20
11/1
2Pl
anne
d Ta
rget
20
12/2
013
Act
ual A
chie
vem
ent
2012
/201
3D
evia
tion
from
Pla
nned
Tar
get
to A
ctua
l Ach
ieve
men
t for
20
12/2
013
Com
men
ts o
n D
evia
tions
Mov
able
Ass
et
Man
agem
ent
-Po
sitiv
e ex
tern
al a
udit
outc
ome
The
targ
et o
f 85%
of
phys
ical
ver
ifica
tion
of
asse
ts w
as a
chie
ved.
Targ
et N
ot A
chie
ved
The
devi
atio
n of
15%
was
due
to
cha
lleng
es e
xper
ienc
ed in
ac
cess
ing
site
s fo
r the
phy
sica
l ve
rifica
tion
proc
ess.
Targ
et p
artia
lly
achi
eved
. Acc
ess
to
pres
tige
site
s an
d se
curit
y ch
alle
nges
ha
mpe
red
the
reco
ncili
atio
n of
m
ovab
le a
sset
s
Paym
ents
Reg
iste
rs
(Pay
men
t tur
naro
und
time)
30 d
ays o
n go
ods,
serv
ices
an
d w
orks
85%
of s
ervi
ce p
rovi
ders
to
be
paid
with
in 2
1 da
ysTh
e bu
sine
ss p
roce
ss fo
r pa
ymen
t with
in 2
1 da
ys
was
not
real
istic
. The
targ
et
of p
aym
ent w
ithin
30
days
w
as m
ore
feas
ible
.
Targ
et N
ot A
chie
ved
The
devi
atio
n is
sum
mar
ised
as
follo
ws:
•0%
with
in 2
1 da
ys
•88
% w
ithin
30
days
•5%
ove
r 30
days
•7%
reje
cted
Impr
oved
bus
ines
s pr
oces
ses
for
paym
ent w
ithin
30
day
s ha
ve b
een
inst
itute
d fo
r the
ne
xt fi
nanc
ial y
ear

46 Department of Public Works | Annual Report 2012/13
Performance Indicators (continued)CO
RPO
RATE
SER
VIC
ES
Sub-
Prog
ram
me
Corp
orat
e Se
rvic
es
Stra
tegi
c O
bjec
tive
To e
nsur
e eff
ectiv
e co
rpor
ate
gove
rnan
ce a
nd s
ound
reso
urce
man
agem
ent
Perf
orm
ance
Indi
cato
rA
ctua
l Ach
ieve
men
t 20
11/1
2Pl
anne
d Ta
rget
20
12/2
013
Act
ual A
chie
vem
ent
2012
/201
3D
evia
tion
from
pl
anne
d ta
rget
to
Act
ual A
chie
vem
ent
for 2
012/
2013
Com
men
ts o
n D
evia
tions
Redu
ced
Vaca
ncy
Rate
1286
of 1
375
posi
tions
fil
led
(con
stitu
ting
93. 5
2% -
targ
et e
xcee
ded)
.
Vaca
ncy
rate
redu
ced
by
14.2
% (6
818
with
in D
PW
and
5849
fille
d po
sitio
ns).
A d
raft
Hum
an R
esou
rces
(H
R) P
lan
revi
ewed
.
Vaca
ncy
rate
is re
duce
d to
15
%Va
canc
y ra
te c
urre
ntly
18.
1%
(1 2
11 p
ositi
ons)
by
31 M
arch
20
13
Staff
com
plim
ent a
s at
31
Mar
ch
2013
is 5
494
.
164
posi
tions
adv
ertis
ed,
incl
udin
g pr
ofes
sion
al a
nd
tech
nica
l pos
ition
s
Targ
et N
ot A
chie
ved
The
vaca
ncy
rate
is
hig
h be
caus
e of
the
non-
fillin
g of
pos
ition
s an
d no
n-re
new
al o
f co
ntra
cts
due
to th
e ov
er-e
xpen
ditu
re
on c
ompe
nsat
ion
of
empl
oyee
s.
Func
tiona
l ski
lls
gene
ratio
n in
itiat
ives
2121
( (3
2.8%
) em
ploy
ees
(nat
iona
lly) w
ere
trai
ned.
The
follo
win
g tr
aine
es
wer
e ap
poin
ted
in s
kills
im
prov
emen
t pro
gram
mes
:
31 a
rtis
ans
(24
still
in th
e pr
ogra
mm
e)
200
lean
ers
363
inte
rns
(222
stil
l in
the
prog
ram
me)
64 y
oung
pro
fess
iona
ls (6
3 st
ill in
the
prog
ram
me)
29 m
anag
emen
t tra
inee
s.
1% o
f per
sonn
el b
udge
t sp
ent o
n tr
aini
ng.
Min
imum
5%
of s
taff
esta
blis
hmen
t (30
0 tr
aine
es)
2 30
1 em
ploy
ees
trai
ned
natio
nally
(158
%)
Num
ber o
f Tra
inee
s on
the
prog
ram
me
Youn
g Pr
ofes
sion
als:
74 M
anag
emen
t Tra
inee
s: 5
4
Inte
rns
= 77
Art
isan
s =
27
Lear
ners
= 4
6
TOTA
L: 4
04
13 y
oung
Pro
fess
iona
ls o
btai
ned
prof
essi
onal
regi
stra
tion.
Mon
itorin
g w
as c
ondu
cted
in
all r
egio
ns a
nd u
nits
hos
ting
trai
nees
:

Department of Public Works | Annual Report 2012/13 47
Performance Indicators (continued)
Sub-
Prog
ram
me
Corp
orat
e Se
rvic
es
Stra
tegi
c O
bjec
tive
To e
nsur
e eff
ectiv
e co
rpor
ate
gove
rnan
ce a
nd s
ound
reso
urce
man
agem
ent
Perf
orm
ance
Indi
cato
rA
ctua
l Ach
ieve
men
t 20
11/1
2Pl
anne
d Ta
rget
20
12/2
013
Act
ual A
chie
vem
ent
2012
/201
3D
evia
tion
from
pl
anne
d ta
rget
to
Act
ual A
chie
vem
ent
for 2
012/
2013
Com
men
ts o
n D
evia
tions
100%
Inte
grat
ed F
ixed
A
sset
Man
agem
ent
syst
em a
nd b
usin
ess
syst
ems.
60%
BA
S an
d EP
WP
war
ehou
sed,
str
ateg
ic
perf
orm
ance
man
agem
ent
scor
ecar
ds d
efine
d an
d de
velo
ped
, Per
sal m
appi
ng
com
plet
ed.
100%
test
ed, a
udite
d an
d tr
aini
ng o
f the
wor
ks c
ontr
ol,
billi
ng a
nd a
ccou
ntin
g sy
stem
.
100%
oth
er iE
-Wor
ks m
odul
es.
Targ
et A
chie
ved
Non
e
Busi
ness
cas
e an
d U
RS
docu
men
t for
Fac
ility
an
d Co
nstr
uctio
n Pr
ojec
t M
anag
emen
t Sys
tem
.
40%
of W
CS u
ser r
equi
rem
ents
an
d de
velo
pmen
t.Ta
rget
Not
Ach
ieve
d
10%
due
to In
com
plet
e an
d ve
rified
bus
ines
s pr
oces
ses.
100%
ent
erpr
ise
data
vi
sibi
lity
and
inte
grat
ed
secu
red
perf
orm
ance
in
form
atio
n
60%
BA
S an
d EP
WP
war
ehou
sed,
str
ateg
ic
perf
orm
ance
man
agem
ent
scor
ecar
ds d
efine
d an
d de
velo
pmen
t, Pe
rsal
m
appi
ng c
ompl
eted
.
100%
impl
emen
tatio
n of
IT
risk
man
agem
ent
90%
Com
plet
ed
Targ
et N
ot A
chie
ved
Dep
loy
hard
war
e th
at m
eets
cor
rect
sp
ecifi
catio
ns
100%
impl
emen
tatio
n of
des
ktop
bac
kup,
dat
a cl
assi
ficat
ion
and
leak
age
syst
em.
10%
impl
emen
tatio
n of
des
ktop
ba
ckup
, dat
a cl
assi
ficat
ion
and
leak
age
syst
em.
Targ
et N
ot A
chie
ved
Insu
ffici
ent f
unds
to
acqu
ire h
ardw
are,
tr
aini
ng, t
estin
g an
d en
hanc
emen
ts.
CORP
ORA
TE S
ERV
ICES
Sub-
Prog
ram
me
Corp
orat
e Se
rvic
es
Stra
tegi
c O
bjec
tive
To e
nsur
e eff
ectiv
e co
rpor
ate
gove
rnan
ce a
nd s
ound
reso
urce
man
agem
ent
Perf
orm
ance
Indi
cato
rA
ctua
l Ach
ieve
men
t 20
11/1
2Pl
anne
d Ta
rget
20
12/2
013
Act
ual A
chie
vem
ent
2012
/201
3D
evia
tion
from
pl
anne
d ta
rget
to
Act
ual A
chie
vem
ent
for 2
012/
2013
Com
men
ts o
n D
evia
tions
Redu
ced
Vaca
ncy
Rate
1286
of 1
375
posi
tions
fil
led
(con
stitu
ting
93. 5
2% -
targ
et e
xcee
ded)
.
Vaca
ncy
rate
redu
ced
by
14.2
% (6
818
with
in D
PW
and
5849
fille
d po
sitio
ns).
A d
raft
Hum
an R
esou
rces
(H
R) P
lan
revi
ewed
.
Vaca
ncy
rate
is re
duce
d to
15
%Va
canc
y ra
te c
urre
ntly
18.
1%
(1 2
11 p
ositi
ons)
by
31 M
arch
20
13
Staff
com
plim
ent a
s at
31
Mar
ch
2013
is 5
494
.
164
posi
tions
adv
ertis
ed,
incl
udin
g pr
ofes
sion
al a
nd
tech
nica
l pos
ition
s
Targ
et N
ot A
chie
ved
The
vaca
ncy
rate
is
hig
h be
caus
e of
the
non-
fillin
g of
pos
ition
s an
d no
n-re
new
al o
f co
ntra
cts
due
to th
e ov
er-e
xpen
ditu
re
on c
ompe
nsat
ion
of
empl
oyee
s.
Func
tiona
l ski
lls
gene
ratio
n in
itiat
ives
2121
( (3
2.8%
) em
ploy
ees
(nat
iona
lly) w
ere
trai
ned.
The
follo
win
g tr
aine
es
wer
e ap
poin
ted
in s
kills
im
prov
emen
t pro
gram
mes
:
31 a
rtis
ans
(24
still
in th
e pr
ogra
mm
e)
200
lean
ers
363
inte
rns
(222
stil
l in
the
prog
ram
me)
64 y
oung
pro
fess
iona
ls (6
3 st
ill in
the
prog
ram
me)
29 m
anag
emen
t tra
inee
s.
1% o
f per
sonn
el b
udge
t sp
ent o
n tr
aini
ng.
Min
imum
5%
of s
taff
esta
blis
hmen
t (30
0 tr
aine
es)
2 30
1 em
ploy
ees
trai
ned
natio
nally
(158
%)
Num
ber o
f Tra
inee
s on
the
prog
ram
me
Youn
g Pr
ofes
sion
als:
74 M
anag
emen
t Tra
inee
s: 5
4
Inte
rns
= 77
Art
isan
s =
27
Lear
ners
= 4
6
TOTA
L: 4
04
13 y
oung
Pro
fess
iona
ls o
btai
ned
prof
essi
onal
regi
stra
tion.
Mon
itorin
g w
as c
ondu
cted
in
all r
egio
ns a
nd u
nits
hos
ting
trai
nees
:

48 Department of Public Works | Annual Report 2012/13
Performance Indicators (continued)
Sub-
Prog
ram
me
Corp
orat
e Se
rvic
es
Stra
tegi
c O
bjec
tive
To e
nsur
e eff
ectiv
e co
rpor
ate
gove
rnan
ce a
nd s
ound
reso
urce
man
agem
ent
Perf
orm
ance
Indi
cato
rA
ctua
l Ach
ieve
men
t 20
11/1
2Pl
anne
d Ta
rget
20
12/2
013
Act
ual A
chie
vem
ent
2012
/201
3D
evia
tion
from
pl
anne
d ta
rget
to
Act
ual A
chie
vem
ent
for 2
012/
2013
Com
men
ts o
n D
evia
tions
Sign
ed a
nd
impl
emen
ted
MO
U’s
with
iden
tified
co
untr
ies.
-Fa
cilit
ate
the
sign
ing
of 2
M
oU’s.
•1
MoU
sig
ned
with
Nam
ibia
.Ta
rget
Not
Ach
ieve
dZa
mbi
a (In
pro
gres
s)
The
MoU
has
bee
n fo
rwar
ded
to
Zam
bia
thro
ugh
Dip
lom
atic
Ch
anne
ls. A
fina
l cl
eara
nce
is a
wai
ted
from
the
Att
orne
y G
ener
al o
f Zam
bia.
100%
impl
emen
tatio
n of
dev
elop
men
t co
mm
unic
atio
ns
stra
tegy
90%
impl
emen
tatio
n of
co
mm
unic
atio
n pl
ans
and
prog
ram
mes
.
Plan
and
org
anis
e 10
Min
iste
rial P
ublic
Pa
rtic
ipat
ion.
13 M
inis
teria
l Roa
dsho
ws
to
Regi
onal
offi
ces
coor
dina
ted.
Targ
et A
chie
ved
Non
e
Lega
l opi
nion
s pr
ovid
edIn
dica
tor n
ot in
clud
ed 1
Lega
l opi
nion
or i
nter
im
repo
rt p
rovi
ded
with
in 1
4 w
orki
ng d
ays
Opi
nion
s –
517
Ora
l – 2
98
Writ
ten
– 21
9
Targ
et A
chie
ved
Lega
lly b
indi
ng
cont
ract
sA
ll co
ntra
cts
verifi
ed a
gain
st
bid
appr
oval
sCo
ntra
cts:
Sign
ed
663
Dra
fted
41
Am
ende
d 5
Com
men
ted
1
Gua
rant
ees:
Rece
ived
28
Rele
ased
33
Calle
d up
1
Canc
elle
d 1
Targ
et A
chie
ved
1 Ac
hiev
emen
ts fo
r 201
1/12
Leg
al o
pini
ons
– 51
4, O
ral –
297
, Writ
ten
– 21
7 an
d le
gally
bin
ding
con
trac
ts s
igne
d –
693,
Dra
fted
– 1
61, A
men
ded
– 10
, Com
men
ted
– 32
, and
Gua
rant
ees
rece
ived
– 4
5, re
leas
ed –
19,
cal
led
up –
1.

Department of Public Works | Annual Report 2012/13 49
Performance Indicators (continued)
Sub-
Prog
ram
me
Corp
orat
e Se
rvic
es
Stra
tegi
c O
bjec
tive
To e
nsur
e eff
ectiv
e co
rpor
ate
gove
rnan
ce a
nd s
ound
reso
urce
man
agem
ent
Perf
orm
ance
Indi
cato
rA
ctua
l Ach
ieve
men
t 20
11/1
2Pl
anne
d Ta
rget
20
12/2
013
Act
ual A
chie
vem
ent
2012
/201
3D
evia
tion
from
pl
anne
d ta
rget
to
Act
ual A
chie
vem
ent
for 2
012/
2013
Com
men
ts o
n D
evia
tions
Secu
rity
clea
ranc
e of
pr
iorit
ised
per
sonn
el.
286
vett
ing
files
for
prio
ritis
ed o
ffici
als
wer
e co
mpl
eted
.
80 p
riorit
ized
per
sonn
el to
be
vet
ted.
99 V
ettin
g fil
es w
ere
com
plet
ed
and
sent
to th
e SS
A fo
r fur
ther
ha
ndlin
g an
d 32
sec
urity
cl
eara
nces
wer
e re
ceiv
ed.
Targ
et A
chie
ved
Non
e
Resu
lts o
f scr
eene
d co
mpa
nies
.73
3 co
mpa
nies
wer
e ve
tted
.20
0 co
mpa
nies
to b
e sc
reen
ed.
246
of th
e 24
6 co
mpa
ny
scre
enin
g re
ques
ts w
ere
rece
ived
an
d pr
oces
sed.
Targ
et A
chie
ved
Non
e
Incr
ease
d pa
rtic
ipat
ion
of w
omen
, peo
ple
with
di
sabi
litie
s, an
d yo
uth
in D
PW b
usin
ess.
-5%
incr
ease
from
201
1/12
on
the
part
icip
atio
n of
wom
en
and
peop
le w
ith d
isab
ilitie
s in
DPW
pro
gram
mes
.
Yout
h
250
girls
par
ticip
ated
in th
e ta
king
a g
irl c
hild
to w
ork.
120
boys
par
ticip
ated
in th
e “M
en
in th
e M
akin
g Ca
mpa
ign”
.
Wom
en
87 p
artic
ipat
ed in
the
Capa
city
D
evel
opm
ent P
rogr
amm
e.
400
part
icip
ated
in th
e Ad
voca
cy
Prog
ram
me/
Awar
enes
s.
30 w
omen
in S
MS
part
icip
ated
in
the
SMS
Wom
en F
orum
Dis
abili
ties
32 p
eopl
e w
ith d
isab
ilitie
s pa
rtic
ipat
ed in
the
Capa
city
D
evel
opm
ent P
rogr
amm
e
Targ
et N
ot A
chie
ved
Subm
issi
on fo
r ap
prov
al d
elay
ed.

50 Department of Public Works | Annual Report 2012/13
Performance Indicators (continued)Pr
ogra
mm
e 2:
Imm
ovab
le A
sset
Inve
stm
ent M
anag
emen
t
Purp
ose
of t
he p
rogr
amm
e: P
rovi
de a
nd m
anag
e G
over
nmen
t’s i
mm
ovab
le p
rope
rty
port
folio
in
supp
ort
of G
over
nmen
t’s s
ocia
l, ec
onom
ic, f
unct
iona
l an
d po
litic
al
obje
ctiv
es.
Sub-
Prog
ram
me
Stra
tegi
c A
sset
Inve
stm
ent A
naly
sis
(A
sset
Reg
iste
r Man
agem
ent,
Port
folio
Per
form
ance
& M
onito
ring
, Po
rtfo
lio A
naly
sis)
Stra
tegi
c O
bjec
tive
To p
rovi
de s
trat
egic
lead
ersh
ip in
effe
ctiv
e an
d effi
cien
t im
mov
able
ass
et m
anag
emen
t and
the
deliv
ery
of in
fras
truc
ture
pro
gram
mes
Perf
orm
ance
Indi
cato
rA
ctua
l Ach
ieve
men
t 20
11/1
2Pl
anne
d Ta
rget
20
12/2
013
Act
ual A
chie
vem
ent
2012
/201
3D
evia
tion
from
Pl
anne
d Ta
rget
to
Act
ual A
chie
vem
ent f
or
2012
/201
3
Com
men
ts o
n D
evia
tions
Num
ber o
f pro
pert
ies
popu
late
d w
ith
esse
ntia
l inf
orm
atio
n in
acc
orda
nce
with
N
atio
nal T
reas
ury’
s on
DPW
’s Im
mov
able
A
sset
Reg
iste
r
86%
(93
692
out o
f 108
562
pr
oper
ties
Popu
late
54
376
prop
ertie
s on
DPW
’s Im
mov
able
Ass
et
Regi
ster
in a
ccor
danc
e w
ith N
atio
nal T
reas
ury’
s m
inim
um re
quire
men
ts b
y 31
Mar
ch 2
013
70 9
98 p
rope
rtie
s po
pula
ted
with
des
ktop
info
rmat
ion
(e.g
. SG
Dia
gram
num
bers
, Ext
ent
etc.
)
Targ
et A
chie
ved
The
Stra
tegy
to
enha
nce
IAR
was
ch
ange
d to
add
ress
all
Man
agem
ent A
sser
tions
(C
ompl
eten
ess,
Accu
racy
, Ex
iste
nce,
Ow
ners
hip,
Va
luat
ions
, Dis
clos
ure
and
Pres
enta
tion)
.
Des
ktop
info
rmat
ion
does
not
incl
ude
all
esse
ntia
l inf
orm
atio
n
Impr
oved
info
rmat
ion
to b
e up
date
d on
the
syst
em.
Prov
ide
enha
nced
us
er re
quire
men
ts
for t
he fi
nalis
atio
n/de
velo
pmen
t of t
he
syst
em
Phys
ical
ver
ifica
tion
to in
clud
e al
l oth
er
esse
ntia
l inf
orm
atio
n an
d as
sert
ions
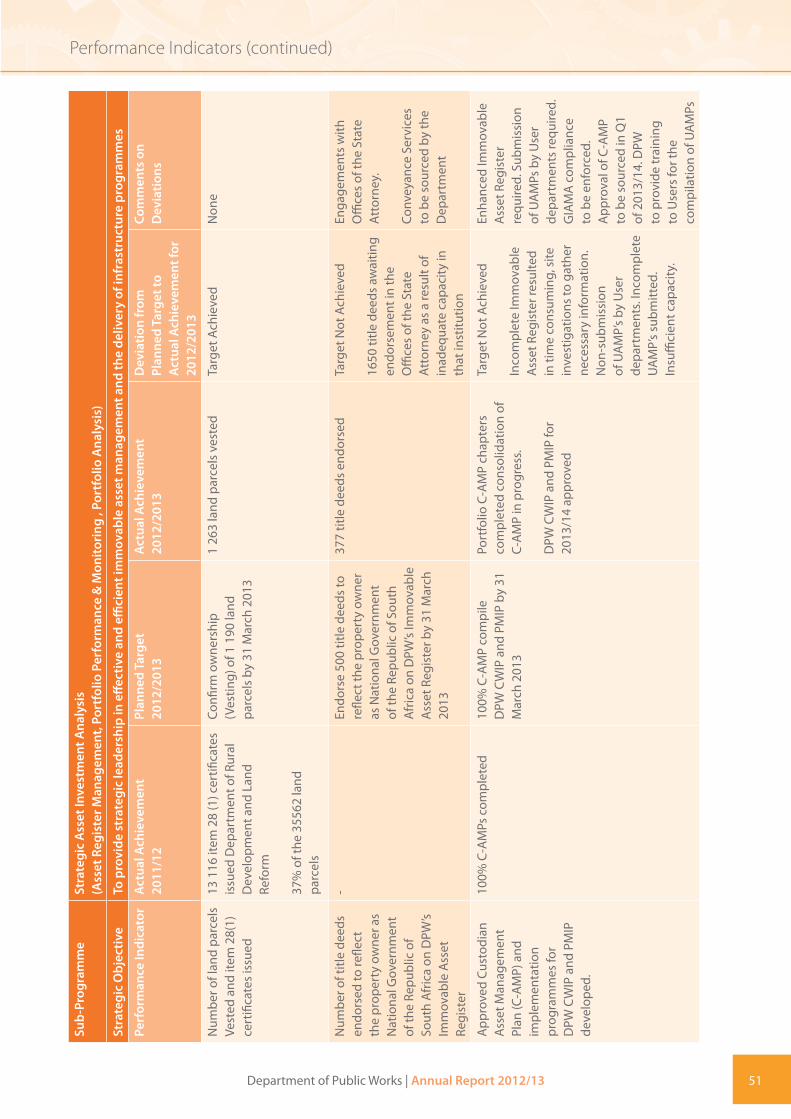
Department of Public Works | Annual Report 2012/13 51
Performance Indicators (continued)
Sub-
Prog
ram
me
Stra
tegi
c A
sset
Inve
stm
ent A
naly
sis
(A
sset
Reg
iste
r Man
agem
ent,
Port
folio
Per
form
ance
& M
onito
ring
, Po
rtfo
lio A
naly
sis)
Stra
tegi
c O
bjec
tive
To p
rovi
de s
trat
egic
lead
ersh
ip in
effe
ctiv
e an
d effi
cien
t im
mov
able
ass
et m
anag
emen
t and
the
deliv
ery
of in
fras
truc
ture
pro
gram
mes
Perf
orm
ance
Indi
cato
rA
ctua
l Ach
ieve
men
t 20
11/1
2Pl
anne
d Ta
rget
20
12/2
013
Act
ual A
chie
vem
ent
2012
/201
3D
evia
tion
from
Pl
anne
d Ta
rget
to
Act
ual A
chie
vem
ent f
or
2012
/201
3
Com
men
ts o
n D
evia
tions
Num
ber o
f lan
d pa
rcel
s Ve
sted
and
item
28(
1)
cert
ifica
tes
issu
ed
13 1
16 it
em 2
8 (1
) cer
tifica
tes
issu
ed D
epar
tmen
t of R
ural
D
evel
opm
ent a
nd L
and
Refo
rm
37%
of t
he 3
5562
land
pa
rcel
s
Confi
rm o
wne
rshi
p (V
estin
g) o
f 1 1
90 la
nd
parc
els
by 3
1 M
arch
201
3
1 26
3 la
nd p
arce
ls v
este
dTa
rget
Ach
ieve
dN
one
Num
ber o
f titl
e de
eds
endo
rsed
to re
flect
th
e pr
oper
ty o
wne
r as
Nat
iona
l Gov
ernm
ent
of th
e Re
publ
ic o
f So
uth
Afr
ica
on D
PW’s
Imm
ovab
le A
sset
Re
gist
er
-En
dors
e 50
0 tit
le d
eeds
to
refle
ct th
e pr
oper
ty o
wne
r as
Nat
iona
l Gov
ernm
ent
of th
e Re
publ
ic o
f Sou
th
Afr
ica
on D
PW’s
Imm
ovab
le
Ass
et R
egis
ter b
y 31
Mar
ch
2013
377
title
dee
ds e
ndor
sed
Targ
et N
ot A
chie
ved
1650
title
dee
ds a
wai
ting
endo
rsem
ent i
n th
e O
ffice
s of
the
Stat
e A
ttor
ney
as a
resu
lt of
in
adeq
uate
cap
acity
in
that
inst
itutio
n
Enga
gem
ents
with
O
ffice
s of
the
Stat
e A
ttor
ney.
Conv
eyan
ce S
ervi
ces
to b
e so
urce
d by
the
Dep
artm
ent
App
rove
d Cu
stod
ian
Ass
et M
anag
emen
t Pl
an (C
-AM
P) a
nd
impl
emen
tatio
n pr
ogra
mm
es fo
r D
PW C
WIP
and
PM
IP
deve
lope
d.
100%
C-A
MPs
com
plet
ed10
0% C
-AM
P co
mpi
le
DPW
CW
IP a
nd P
MIP
by
31
Mar
ch 2
013
Port
folio
C-A
MP
chap
ters
co
mpl
eted
con
solid
atio
n of
C-
AM
P in
pro
gres
s.
DPW
CW
IP a
nd P
MIP
for
2013
/14
appr
oved
Targ
et N
ot A
chie
ved
Inco
mpl
ete
Imm
ovab
le
Ass
et R
egis
ter r
esul
ted
in ti
me
cons
umin
g, s
ite
inve
stig
atio
ns to
gat
her
nece
ssar
y in
form
atio
n.
Non
-sub
mis
sion
of
UA
MP’
s by
Use
r de
part
men
ts. I
ncom
plet
e U
AM
P’s
subm
itted
. In
suffi
cien
t cap
acity
.
Enha
nced
Imm
ovab
le
Ass
et R
egis
ter
requ
ired.
Sub
mis
sion
of
UA
MPs
by
Use
r de
part
men
ts re
quire
d.
GIA
MA
com
plia
nce
to b
e en
forc
ed.
App
rova
l of C
-AM
P to
be
sour
ced
in Q
1 of
201
3/14
. DPW
to
pro
vide
trai
ning
to
Use
rs fo
r the
co
mpi
latio
n of
UA
MPs

52 Department of Public Works | Annual Report 2012/13
Performance Indicators (continued)
Sub-
Prog
ram
me
Stra
tegi
c A
sset
Inve
stm
ent A
naly
sis
(A
sset
Reg
iste
r Man
agem
ent,
Port
folio
Per
form
ance
& M
onito
ring
, Po
rtfo
lio A
naly
sis)
Stra
tegi
c O
bjec
tive
To p
rovi
de s
trat
egic
lead
ersh
ip in
effe
ctiv
e an
d effi
cien
t im
mov
able
ass
et m
anag
emen
t and
the
deliv
ery
of in
fras
truc
ture
pro
gram
mes
Perf
orm
ance
Indi
cato
rA
ctua
l Ach
ieve
men
t 20
11/1
2Pl
anne
d Ta
rget
20
12/2
013
Act
ual A
chie
vem
ent
2012
/201
3D
evia
tion
from
Pl
anne
d Ta
rget
to
Act
ual A
chie
vem
ent f
or
2012
/201
3
Com
men
ts o
n D
evia
tions
Incr
ease
d re
venu
e ge
nera
tion
thro
ugh
new
initi
ativ
es u
sing
D
PW’s
imm
ovab
le
asse
ts
10,9
% in
reve
nue
incr
ease
Incr
ease
d re
venu
e by
R1
643
372
gene
rate
d th
roug
h ne
w in
itiat
ives
usi
ng D
PW’s
imm
ovab
le a
sset
s by
31
Mar
ch 2
013
R177
531
incr
ease
in re
venu
e th
roug
h ta
rget
ed in
itiat
ives
(o
utdo
or a
dver
tisin
g, c
ell
mas
t ren
tals
, lea
se o
ut a
irfiel
d fo
r air
show
)
Targ
et N
ot A
chie
ved
Incr
ease
reve
nue
coul
d no
t be
achi
eved
due
to
leas
e ag
reem
ents
not
be
ing
conc
lude
d as
a
resu
lt of
the
revi
ewin
g of
the
Supp
ly C
hain
M
anag
emen
t
App
ropr
iate
Sup
ply
Chai
n Pr
oces
ses
requ
ired
for l
ettin
g of
Sta
te-o
wne
d pr
oper
ties
Uni
t and
cos
t red
uctio
n in
ele
ctric
ity a
nd w
ater
co
nsum
ptio
n (s
hare
d en
ergy
mod
el a
nd
retr
ofitt
ing)
Ove
r 100
% (8
025
752
KW/H
) en
ergy
sav
ing
was
ach
ieve
d in
bui
ldin
gs re
trofi
tted
by
IDT
for 2
011/
12
Redu
ctio
n of
942
857
kw/h
an
d 80
2 50
0kl b
y 31
Mar
ch
2013
EE S
avin
gs
Achi
eved
: 28
635
782
kW
/h
Targ
et N
ot A
chie
ved
The
shar
ed e
nerg
y co
ntra
cts
wer
e im
plem
ente
d in
Cap
e To
wn
and
Dur
ban
prop
ertie
s
The
targ
et w
ill b
e ba
sed
on th
e nu
mbe
r of
bui
ldin
gs p
riorit
ised
fo
r the
pro
gram
me
22%
redu
ctio
n on
ki
lolit
res
was
ach
ieve
d in
Blo
emfo
ntei
n an
d Jo
hann
esbu
rg
No
wat
er c
onsu
mpt
ion
redu
ctio
n re
cord
edTa
rget
Not
Ach
ieve
d
Chan
ge in
str
ateg
y to
co
nduc
t an
audi
t of
prev
ious
wat
er e
ffici
ency
in
itiat
ives
. No
serv
ice
prov
ider
app
oint
ed
owin
g to
cha
lleng
es
in S
uppl
y Ch
ain
Man
agem
ent p
roce
sses
Fast
-tra
ck
proc
urem
ent
proc
esse
s to
app
oint
a
serv
ice
prov
ider
to
con
duct
aud
it of
pr
evio
us w
ork.
Serv
ice
prov
ider
to
reco
mm
end
on a
ppro
pria
te
wat
er e
ffici
ency
im
plem
enta
tion
mod
els

Department of Public Works | Annual Report 2012/13 53
Performance Indicators (continued)
Sub-
Prog
ram
me
Stra
tegi
c A
sset
Inve
stm
ent A
naly
sis
(A
sset
Reg
iste
r Man
agem
ent,
Port
folio
Per
form
ance
& M
onito
ring
, Po
rtfo
lio A
naly
sis)
Stra
tegi
c O
bjec
tive
To p
rovi
de s
trat
egic
lead
ersh
ip in
effe
ctiv
e an
d effi
cien
t im
mov
able
ass
et m
anag
emen
t and
the
deliv
ery
of in
fras
truc
ture
pro
gram
mes
Perf
orm
ance
Indi
cato
rA
ctua
l Ach
ieve
men
t 20
11/1
2Pl
anne
d Ta
rget
20
12/2
013
Act
ual A
chie
vem
ent
2012
/201
3D
evia
tion
from
Pl
anne
d Ta
rget
to
Act
ual A
chie
vem
ent f
or
2012
/201
3
Com
men
ts o
n D
evia
tions
Num
ber o
f St
ate-
owne
d pr
oper
ties
reha
bilit
ated
nat
iona
lly
as p
er P
IMP
for 2
012/
13
11 p
roje
cts
com
plet
ed in
the
first
yea
r of t
he M
TEF
Reha
bilit
ate
10 p
rope
rtie
s by
31
Mar
ch 2
013
Reha
bilit
ated
6 p
rope
rtie
sTa
rget
Not
Ach
ieve
d
Four
pro
ject
s w
ere
canc
elle
d
Canc
elle
d pr
ojec
ts
will
be
re-a
ctiv
ated
in
2013
/14
finan
cial
yea
r
Num
ber o
f St
ate-
owne
d bu
ildin
gs m
ade
acce
ssib
le n
atio
nally
as
per C
WIP
for 2
012/
13
51 b
uild
ings
com
plet
ed10
0 bu
ildin
gs a
cces
sibl
e by
31
Mar
ch 2
013
11 b
uild
ings
wer
e m
ade
acce
ssib
leTa
rget
Not
Ach
ieve
d
Maj
ority
of t
he p
roje
cts
are
still
in th
e pl
anni
ng
and
cons
truc
tion
phas
e
Maj
ority
of t
he p
roje
cts
are
still
in th
e pl
anni
ng
proc
ess
owin
g to
del
ay
in th
e ap
poin
tmen
t of
cons
ulta
nts
Expe
dite
com
plet
ion
of th
e pr
ojec
ts th
at a
re
still
in th
e pl
anni
ng
and
cons
truc
tion
phas
e
Exte
nt o
f lan
d re
leas
ed
for h
uman
set
tlem
ent
purp
oses
1.7
hect
ares
rele
ased
7 pr
oper
ties
mea
surin
g 92
6 he
ctar
es fo
r hum
an
sett
lem
ent i
n th
e pr
oces
s of
be
ing
final
ised
Rele
ase
200
ha la
nd (i
n th
e fo
rm o
f 7 p
rope
rtie
s) fo
r hu
man
set
tlem
ent b
y 31
M
arch
201
3 in
:
Cape
Tow
n –
4 Po
rt E
lizab
eth
– 2
Pret
oria
– 1
433
.002
6 he
ctar
es w
ere
appr
oved
for r
elea
se in
line
w
ith 2
hum
an s
ettle
men
t de
velo
pmen
t pro
posa
ls
Targ
et A
chie
ved
The
exte
nt o
f lan
d ac
tual
ly id
entifi
ed fo
r the
tw
o hu
man
set
tlem
ent
deve
lopm
ent e
xcee
ded
the
initi
al e
stim
ates
in
mee
ting
the
requ
irem
ent
The
targ
et w
ill b
e ba
sed
on a
ctua
l ext
ent
requ
este
d
Num
ber o
f pro
pert
ies
rele
ased
for l
and
refo
rm p
urpo
ses.
-Re
leas
e 20
pro
pert
ies
for
land
refo
rm p
urpo
ses
by 3
1 M
arch
201
3
Dur
ban-
20
No
prop
ertie
s ap
prov
ed fo
r La
nd R
efor
m p
urpo
ses.
Targ
et N
ot A
chie
ved
35 p
rope
rtie
s in
the
proc
ess
of a
ppro
val
Inte
rven
tion
to fa
st
trac
k ap
prov
al o
f su
bmis
sion
s

54 Department of Public Works | Annual Report 2012/13
Performance Indicators (continued)
Sub-
Prog
ram
me
Stra
tegi
c A
sset
Inve
stm
ent A
naly
sis
(A
sset
Reg
iste
r Man
agem
ent,
Port
folio
Per
form
ance
& M
onito
ring
, Po
rtfo
lio A
naly
sis)
Stra
tegi
c O
bjec
tive
To p
rovi
de s
trat
egic
lead
ersh
ip in
effe
ctiv
e an
d effi
cien
t im
mov
able
ass
et m
anag
emen
t and
the
deliv
ery
of in
fras
truc
ture
pro
gram
mes
Perf
orm
ance
Indi
cato
rA
ctua
l Ach
ieve
men
t 20
11/1
2Pl
anne
d Ta
rget
20
12/2
013
Act
ual A
chie
vem
ent
2012
/201
3D
evia
tion
from
Pl
anne
d Ta
rget
to
Act
ual A
chie
vem
ent f
or
2012
/201
3
Com
men
ts o
n D
evia
tions
Num
ber o
f fea
sibi
lity
asse
ssm
ents
co
mpl
eted
113%
requ
ests
for f
easi
bilit
y st
udie
s co
mpl
eted
(49)
Cond
uct 1
00 fe
asib
ility
as
sess
men
t in
acco
rdan
ce
with
the
2013
/14
CAM
P by
31
Mar
ch 2
013
100
feas
ibili
ty a
sses
smen
ts
com
plet
ed a
nd a
ppro
ved
Targ
et A
chie
ved
Non
e
Num
ber o
f mar
ket
valu
atio
ns a
ppro
ved
97%
com
plet
ed m
arke
t va
luat
ions
(139
)Co
nduc
t 200
mar
ket
valu
atio
ns in
acc
orda
nce
with
the
2013
/14
CAM
P by
31
Mar
ch 2
013
355
Mar
ket v
alua
tions
co
mpl
eted
and
ass
esse
dTa
rget
Ach
ieve
d
Due
to in
crea
sed
capa
city
of a
dditi
onal
In
tern
s an
d Yo
ung
Prof
essi
onal
s
Targ
et to
be
revi
ewed
in
futu
re a
s a
resu
lt of
impr
oved
pe
rfor
man
ce
Num
ber o
f mun
icip
al
valu
atio
ns a
ppra
ised
in
the
new
mun
icip
al
valu
atio
n ro
ll
100%
mun
icip
al v
alua
tions
(4
81)
1000
rate
d pr
oper
ties
appr
aise
d in
the
new
m
unic
ipal
val
uatio
n ro
lls
from
DPW
’s Im
mov
able
A
sset
Reg
iste
r by
31 M
arch
20
13
2633
Mun
icip
al v
alua
tion
appr
aise
dTa
rget
Ach
ieve
d
Incr
ease
in m
unic
ipal
va
luat
ion
rolls
rece
ived
to
be
appr
aise
d
Targ
et to
be
revi
ewed
in
futu
re a
s a
resu
lt of
impr
oved
pe
rfor
man
ce
Num
ber o
f lea
ses
asse
ssed
for l
ettin
g an
d le
asin
g ra
tes
in th
ree
regi
on (
Dur
ban,
Por
t El
izab
eth
and
Cape
To
wn)
-10
0% o
f all
leas
es p
rofil
es
asse
ssed
in:
Dur
ban
- 476
Po
rt E
lizab
eth
- 239
Ca
pe T
own
– 36
0
by 3
1 M
arch
201
3
100%
of a
ll le
ases
ass
esse
d in
id
entifi
ed re
gion
sTa
rget
Ach
ieve
dN
one

Department of Public Works | Annual Report 2012/13 55
Performance Indicators (continued)PR
OJE
CTS
AN
D P
ROFE
SSIO
NA
L SE
RVIC
ES
Sub-
Prog
ram
me
Proj
ects
and
Pro
fess
iona
l Ser
vice
s
Stra
tegi
c O
bjec
tive
To p
rovi
de s
trat
egic
lead
ersh
ip in
effe
ctiv
e an
d effi
cien
t im
mov
able
ass
et m
anag
emen
t and
the
deliv
ery
of in
fras
truc
ture
pro
gram
mes
To p
rom
ote
an e
nabl
ing
envi
ronm
ent f
or th
e cr
eatio
n of
bot
h sh
ort a
nd s
usta
inab
le w
ork
oppo
rtun
ities
, so
as to
con
trib
ute
to th
e na
tiona
l go
al o
f job
cre
atio
n an
d po
vert
y al
levi
atio
n
Perf
orm
ance
Indi
cato
rA
ctua
l Ach
ieve
men
t 20
11/1
2Pl
anne
d Ta
rget
20
12/2
013
Act
ual A
chie
vem
ent
2012
/201
3D
evia
tion
from
Pl
anne
d Ta
rget
to
Act
ual A
chie
vem
ent
for 2
012/
2013
Com
men
ts o
n D
evia
tions
Num
ber o
f pro
ject
s to
be
com
plet
ed (s
tatu
s 6A
) with
in H
ead
Offi
ce
and
11 R
egio
nal
Offi
ces
as p
er th
e CW
IPs
and
PIM
P
237
proj
ects
con
stru
cted
200
proj
ects
to b
e co
mpl
eted
(sta
tus
6a) a
s pe
r the
CW
IPs
and
PIM
P by
31
Mar
ch 2
013
Bloe
mfo
ntei
n - 2
7 Ca
pe To
wn
– 26
D
urba
n- 2
7 Jo
hann
esbu
rg –
22
Hea
d O
ffice
- 2
Kim
berle
y - 1
9 M
mab
atho
– 1
4 N
elsp
ruit
– 12
Po
lokw
ane
– 14
Po
rt E
lizab
eth
– 20
Pr
etor
ia –
10
Um
tata
-7
214
Proj
ects
com
plet
ed a
nd
upda
ted
on W
CSTa
rget
Ach
ieve
d
Addi
tiona
l 14
proj
ects
co
mpl
eted
/ 107
%

56 Department of Public Works | Annual Report 2012/13
Performance Indicators (continued)
Sub-
Prog
ram
me
Proj
ects
and
Pro
fess
iona
l Ser
vice
s
Stra
tegi
c O
bjec
tive
To p
rovi
de s
trat
egic
lead
ersh
ip in
effe
ctiv
e an
d effi
cien
t im
mov
able
ass
et m
anag
emen
t and
the
deliv
ery
of in
fras
truc
ture
pro
gram
mes
To p
rom
ote
an e
nabl
ing
envi
ronm
ent f
or th
e cr
eatio
n of
bot
h sh
ort a
nd s
usta
inab
le w
ork
oppo
rtun
ities
, so
as to
con
trib
ute
to th
e na
tiona
l go
al o
f job
cre
atio
n an
d po
vert
y al
levi
atio
n
Perf
orm
ance
Indi
cato
rA
ctua
l Ach
ieve
men
t 20
11/1
2Pl
anne
d Ta
rget
20
12/2
013
Act
ual A
chie
vem
ent
2012
/201
3D
evia
tion
from
Pl
anne
d Ta
rget
to
Act
ual A
chie
vem
ent
for 2
012/
2013
Com
men
ts o
n D
evia
tions
Num
ber o
f the
jobs
cr
eate
d na
tiona
lly
thro
ugh
the
build
ing
prog
ram
me
(DPW
and
us
er d
epar
tmen
ts)
-40
000
jobs
to b
e cr
eate
d by
31
Mar
ch 2
013
in:
Bloe
mfo
ntei
n - 3
560
Cape
Tow
n –
5300
D
urba
n- 5
200
Joha
nnes
burg
– 4
400
Hea
d O
ffice
- 41
00
Kim
berle
y– 2
600
Mm
abat
ho- 2
240
Nel
spru
it –
1300
Po
lokw
ane
–260
0 Po
rt E
lizab
eth
– 32
00
Pret
oria
– 4
100
Um
tata
-140
0
18 8
15 w
ork
oppo
rtun
ities
re
cord
edTa
rget
Not
Ach
ieve
d
47%
ach
ieve
d
Dat
a no
t co
llect
ed fr
om a
ll co
nstr
uctio
n si
tes

Department of Public Works | Annual Report 2012/13 57
Performance Indicators (continued)
Sub-
Prog
ram
me
Proj
ects
and
Pro
fess
iona
l Ser
vice
s
Stra
tegi
c O
bjec
tive
To p
rovi
de s
trat
egic
lead
ersh
ip in
effe
ctiv
e an
d effi
cien
t im
mov
able
ass
et m
anag
emen
t and
the
deliv
ery
of in
fras
truc
ture
pro
gram
mes
To p
rom
ote
an e
nabl
ing
envi
ronm
ent f
or th
e cr
eatio
n of
bot
h sh
ort a
nd s
usta
inab
le w
ork
oppo
rtun
ities
, so
as to
con
trib
ute
to th
e na
tiona
l go
al o
f job
cre
atio
n an
d po
vert
y al
levi
atio
n
Perf
orm
ance
Indi
cato
rA
ctua
l Ach
ieve
men
t 20
11/1
2Pl
anne
d Ta
rget
20
12/2
013
Act
ual A
chie
vem
ent
2012
/201
3D
evia
tion
from
Pl
anne
d Ta
rget
to
Act
ual A
chie
vem
ent
for 2
012/
2013
Com
men
ts o
n D
evia
tions
Num
ber o
f lea
rnin
g an
d tr
aini
ng
oppo
rtun
ities
cre
ated
fo
r gra
duat
es o
f bui
lt en
viro
nmen
t car
eers
-10
0 tr
aini
ng o
ppor
tuni
ties
to b
e cr
eate
d by
31
Mar
ch
2013
Bloe
mfo
ntei
n - 5
Ca
pe To
wn
– 5
Dur
ban-
40
Joha
nnes
burg
– 6
H
ead
Offi
ce -
8 Ki
mbe
rley–
5
Mm
abat
ho- 5
N
elsp
ruit
– 5
Polo
kwan
e - 5
Po
rt E
lizab
eth
– 5
Pret
oria
– 7
U
mta
ta -
4
74 y
oung
pro
fess
iona
lsTa
rget
Not
Ach
ieve
d
Targ
et fe
ll sh
ort o
f 26
youn
g pr
ofes
sion
als
(74%
ach
ieve
men
t) d
ue
to fi
nanc
ial c
onst
rain
ts
Fina
ncia
l con
stra
ints
Perc
enta
ge o
f an
nual
con
stru
ctio
n bu
dget
exp
endi
ture
ac
crue
d to
Em
ergi
ng
Cont
ract
ors,
Wom
en
Ow
ned
Ente
rpris
e,
Dis
able
d, a
nd Y
outh
in
term
s of
BBB
EE s
core
ca
rd
-35
% in
fras
truc
ture
bu
dget
exp
endi
ture
fo
r dev
elop
men
t of
Emer
ging
Con
trac
tors
, W
omen
Ow
ned
Ente
rpris
e,
Dis
able
d, a
nd Y
outh
in
term
s of
BBB
EE s
core
car
d in
Hea
d O
ffice
s by
31
Mar
ch 2
013
No
proj
ect a
war
ded
with
Co
ntra
ct P
artic
ipat
ion
Goa
lTa
rget
Not
Ach
ieve
dN
o pr
ojec
t aw
arde
d du
e to
fina
ncia
l co
nstr
aint
s
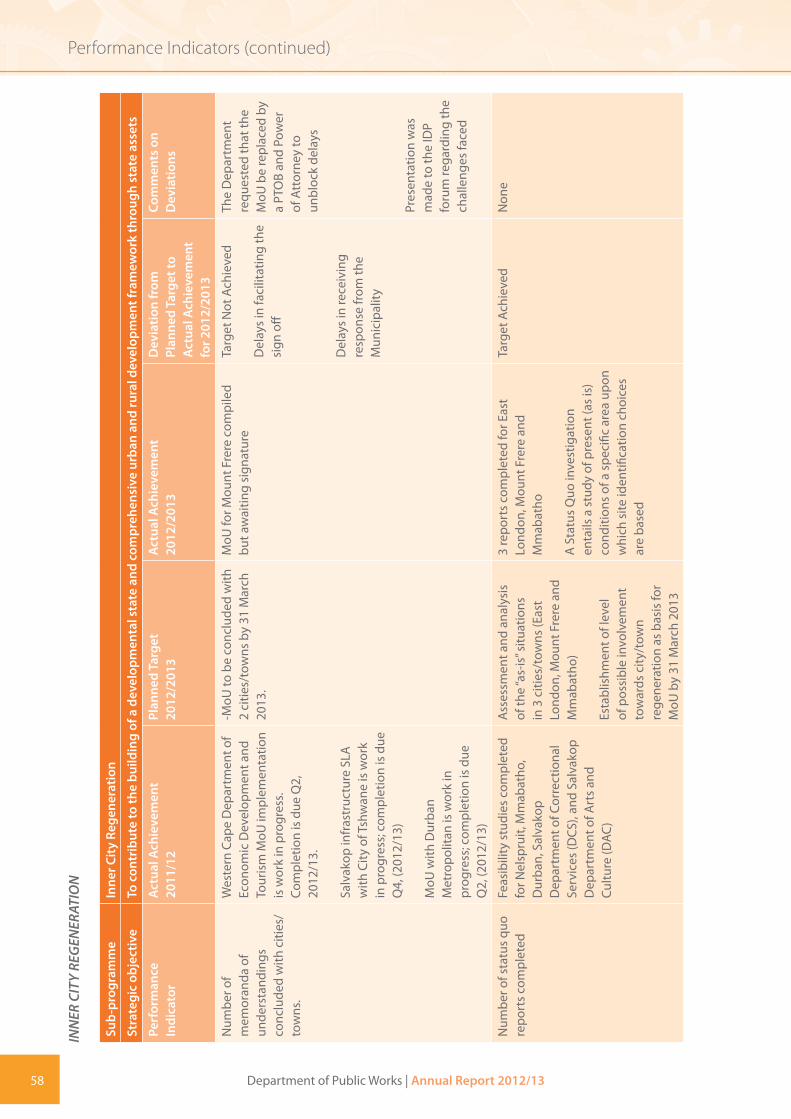
58 Department of Public Works | Annual Report 2012/13
Performance Indicators (continued)IN
NER
CIT
Y RE
GEN
ERAT
ION
Sub-
prog
ram
me
Inne
r Cit
y Re
gene
ratio
n
Stra
tegi
c ob
ject
ive
To c
ontr
ibut
e to
the
build
ing
of a
dev
elop
men
tal s
tate
and
com
preh
ensi
ve u
rban
and
rura
l dev
elop
men
t fra
mew
ork
thro
ugh
stat
e as
sets
Perf
orm
ance
In
dica
tor
Act
ual A
chie
vem
ent
2011
/12
Plan
ned
Targ
et
2012
/201
3A
ctua
l Ach
ieve
men
t 20
12/2
013
Dev
iatio
n fr
om
Plan
ned
Targ
et to
A
ctua
l Ach
ieve
men
t fo
r 201
2/20
13
Com
men
ts o
n D
evia
tions
Num
ber o
f m
emor
anda
of
unde
rsta
ndin
gs
conc
lude
d w
ith c
ities
/to
wns
.
Wes
tern
Cap
e D
epar
tmen
t of
Econ
omic
Dev
elop
men
t and
To
uris
m M
oU im
plem
enta
tion
is w
ork
in p
rogr
ess.
Com
plet
ion
is d
ue Q
2,
2012
/13.
Salv
akop
infr
astr
uctu
re S
LA
with
City
of T
shw
ane
is w
ork
in p
rogr
ess;
com
plet
ion
is d
ue
Q4,
(201
2/13
)
MoU
with
Dur
ban
Met
ropo
litan
is w
ork
in
prog
ress
; com
plet
ion
is d
ue
Q2,
(201
2/13
)
-MoU
to b
e co
nclu
ded
with
2
citie
s/to
wns
by
31 M
arch
20
13.
MoU
for M
ount
Fre
re c
ompi
led
but a
wai
ting
sign
atur
eTa
rget
Not
Ach
ieve
d
Del
ays
in fa
cilit
atin
g th
e si
gn o
ff
Del
ays
in re
ceiv
ing
resp
onse
from
the
Mun
icip
ality
The
Dep
artm
ent
requ
este
d th
at th
e M
oU b
e re
plac
ed b
y a
PTO
B an
d Po
wer
of
Att
orne
y to
un
bloc
k de
lays
Pres
enta
tion
was
m
ade
to th
e ID
P fo
rum
rega
rdin
g th
e ch
alle
nges
face
d
Num
ber o
f sta
tus
quo
repo
rts
com
plet
edFe
asib
ility
stu
dies
com
plet
ed
for N
elsp
ruit,
Mm
abat
ho,
Dur
ban,
Sal
vako
p D
epar
tmen
t of C
orre
ctio
nal
Serv
ices
(DCS
), an
d Sa
lvak
op
Dep
artm
ent o
f Art
s an
d Cu
lture
(DAC
)
Ass
essm
ent a
nd a
naly
sis
of th
e “a
s-is
” situ
atio
ns
in 3
citi
es/t
owns
(Eas
t Lo
ndon
, Mou
nt F
rere
and
M
mab
atho
)
Esta
blis
hmen
t of l
evel
of
pos
sibl
e in
volv
emen
t to
war
ds c
ity/t
own
rege
nera
tion
as b
asis
for
MoU
by
31 M
arch
201
3
3 re
port
s co
mpl
eted
for E
ast
Lond
on, M
ount
Fre
re a
nd
Mm
abat
ho
A S
tatu
s Q
uo in
vest
igat
ion
enta
ils a
stu
dy o
f pre
sent
(as
is)
cond
ition
s of
a s
peci
fic a
rea
upon
w
hich
site
iden
tifica
tion
choi
ces
are
base
d
Targ
et A
chie
ved
Non
e

Department of Public Works | Annual Report 2012/13 59
Performance Indicators (continued)
Sub-
prog
ram
me
Inne
r Cit
y Re
gene
ratio
n
Stra
tegi
c ob
ject
ive
To c
ontr
ibut
e to
the
build
ing
of a
dev
elop
men
tal s
tate
and
com
preh
ensi
ve u
rban
and
rura
l dev
elop
men
t fra
mew
ork
thro
ugh
stat
e as
sets
Perf
orm
ance
In
dica
tor
Act
ual A
chie
vem
ent
2011
/12
Plan
ned
Targ
et
2012
/201
3A
ctua
l Ach
ieve
men
t 20
12/2
013
Dev
iatio
n fr
om
Plan
ned
Targ
et to
A
ctua
l Ach
ieve
men
t fo
r 201
2/20
13
Com
men
ts o
n D
evia
tions
Num
ber o
f SD
Fs/
IDPs
for s
ubje
ct
tow
ns/u
rban
cen
tres
co
mpl
eted
.
100%
site
s id
entifi
ed
Inve
stig
atio
ns c
ompl
eted
for
Dur
ban,
Mth
atha
, Mm
abat
ho,
Nel
spru
it, P
olok
wan
e,
Joha
nnes
burg
, Kim
berle
y,
Bloe
mfo
ntei
n an
d M
ount
Fr
ere
SDF/
IDP
for 2
tow
ns (E
ast
Lond
on a
nd M
ount
Fre
re)
by 3
1 M
arch
201
3
2 SD
F/ID
P co
mpl
eted
for E
ast
Lond
on a
nd M
ount
Fre
reTa
rget
Ach
ieve
dN
one

60 Department of Public Works | Annual Report 2012/13
Performance Indicators (continued)
Sub-
prog
ram
me
Inne
r Cit
y Re
gene
ratio
n
Stra
tegi
c ob
ject
ive
To c
ontr
ibut
e to
the
build
ing
of a
dev
elop
men
tal s
tate
and
com
preh
ensi
ve u
rban
and
rura
l dev
elop
men
t fra
mew
ork
thro
ugh
stat
e as
sets
Perf
orm
ance
In
dica
tor
Act
ual A
chie
vem
ent
2011
/12
Plan
ned
Targ
et
2012
/201
3A
ctua
l Ach
ieve
men
t 20
12/2
013
Dev
iatio
n fr
om
Plan
ned
Targ
et to
A
ctua
l Ach
ieve
men
t fo
r 201
2/20
13
Com
men
ts o
n D
evia
tions
Num
ber o
f pre
cinc
t de
velo
pmen
t pla
ns
com
plet
ed
Tshw
ane
Prec
inct
Mas
ter
Plan
ning
has
com
men
ced.
Co
mpl
etio
n is
due
in th
e th
ird
quar
ter o
f 201
2/13
Proj
ect i
ncep
tion
repo
rt
com
plet
ed
Inne
r city
sta
tus
quo
repo
rt
com
plet
ed
Dra
ft s
ched
ule
for p
roje
ct
com
plet
ed
Salv
okop
inte
rim
deve
lopm
ent g
uide
lines
pr
oduc
ed
Salv
akop
site
loca
tion
prod
uced
and
pre
sent
ed to
D
CS
Loca
tion
repo
rt fo
r STA
TSSA
pr
oduc
ed a
nd im
plem
ente
d
Salv
okop
pre
cinc
t pla
n co
mm
ence
d an
d co
mpl
etio
n is
sch
edul
ed fo
r thi
rd q
uart
er
of 2
012/
13
Tshw
ane
Mas
ter p
lan
and2
pre
cinc
t pla
ns fo
r Pa
ul K
ruge
r and
Sal
voko
p co
mpl
eted
Tshw
ane
Mas
ter p
lan
and
2 pr
ecin
ct p
lans
for P
aul K
ruge
r an
d Sa
lvok
op c
ompl
eted
Targ
et A
chie
ved
Non
e
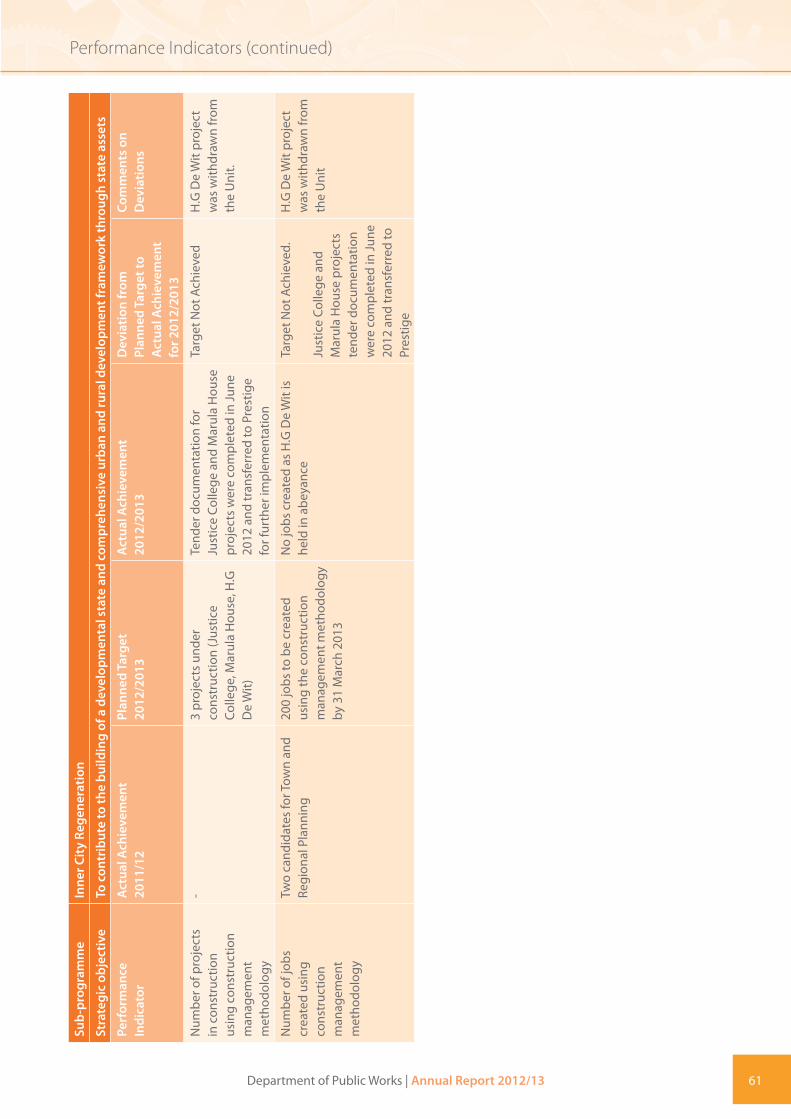
Department of Public Works | Annual Report 2012/13 61
Performance Indicators (continued)
Sub-
prog
ram
me
Inne
r Cit
y Re
gene
ratio
n
Stra
tegi
c ob
ject
ive
To c
ontr
ibut
e to
the
build
ing
of a
dev
elop
men
tal s
tate
and
com
preh
ensi
ve u
rban
and
rura
l dev
elop
men
t fra
mew
ork
thro
ugh
stat
e as
sets
Perf
orm
ance
In
dica
tor
Act
ual A
chie
vem
ent
2011
/12
Plan
ned
Targ
et
2012
/201
3A
ctua
l Ach
ieve
men
t 20
12/2
013
Dev
iatio
n fr
om
Plan
ned
Targ
et to
A
ctua
l Ach
ieve
men
t fo
r 201
2/20
13
Com
men
ts o
n D
evia
tions
Num
ber o
f pro
ject
s in
con
stru
ctio
n us
ing
cons
truc
tion
man
agem
ent
met
hodo
logy
-3
proj
ects
und
er
cons
truc
tion
(Jus
tice
Colle
ge, M
arul
a H
ouse
, H.G
D
e W
it)
Tend
er d
ocum
enta
tion
for
Just
ice
Colle
ge a
nd M
arul
a H
ouse
pr
ojec
ts w
ere
com
plet
ed in
June
20
12 a
nd tr
ansf
erre
d to
Pre
stig
e fo
r fur
ther
impl
emen
tatio
n
Targ
et N
ot A
chie
ved
H.G
De
Wit
proj
ect
was
with
draw
n fr
om
the
Uni
t.
Num
ber o
f job
s cr
eate
d us
ing
cons
truc
tion
man
agem
ent
met
hodo
logy
Two
cand
idat
es fo
r Tow
n an
d Re
gion
al P
lann
ing
200
jobs
to b
e cr
eate
d us
ing
the
cons
truc
tion
man
agem
ent m
etho
dolo
gy
by 3
1 M
arch
201
3
No
jobs
cre
ated
as
H.G
De
Wit
is
held
in a
beya
nce
Targ
et N
ot A
chie
ved.
Just
ice
Colle
ge a
nd
Mar
ula
Hou
se p
roje
cts
tend
er d
ocum
enta
tion
wer
e co
mpl
eted
in Ju
ne
2012
and
tran
sfer
red
to
Pres
tige
H.G
De
Wit
proj
ect
was
with
draw
n fr
om
the
Uni
t

62 Department of Public Works | Annual Report 2012/13
Performance Indicators (continued)RE
GIO
NA
L CO
ORD
INAT
ION
Sub-
Prog
ram
me
Regi
onal
Coo
rdin
atio
n
Stra
tegi
c O
bjec
tive
To e
nsur
e im
prov
ed s
ervi
ce d
eliv
ery
in a
ll de
part
men
tal p
rogr
ams
to m
eet c
lient
’s ex
pect
atio
ns a
nd le
vera
ge s
take
hold
er re
latio
ns
Perf
orm
ance
In
dica
tor
Act
ual A
chie
vem
ent
2011
/12
Plan
ned
Targ
et
2012
/201
3A
ctua
l Ach
ieve
men
t 20
12/2
013
Dev
iatio
n fr
om
Plan
ned
Targ
et to
A
ctua
l Ach
ieve
men
t fo
r 201
2/20
13
Com
men
ts o
n D
evia
tions
Num
ber o
f DPW
leas
e ag
reem
ents
man
aged
in
term
s of
sig
ned
cont
ract
s an
d re
leva
nt
legi
slat
ion/
polic
ies/
regu
latio
ns
2263
leas
es m
anag
ed
Budg
et a
lloca
ted:
R2
.932
bill
ion
Expe
nditu
re:
R2.9
11 b
illio
n
(99%
)
Man
agem
ent o
f 285
0 le
ase
agre
emen
ts a
t the
Reg
iona
l O
ffice
s in
term
s of
sig
ned
cont
ract
ors,
rele
vant
le
gisl
atio
n /p
olic
ies/
pr
oced
ures
in
Bloe
mfo
ntei
n - 1
99
Dur
ban-
486
Jo
hann
esbu
rg –
222
Ca
pe T
own
- 358
Ki
mbe
rley–
212
Po
rt E
lizab
eth-
354
Pr
etor
ia–
235
Mm
abat
ho –
164
Nel
spru
it –
220
Polo
kwan
e –
206
Um
tata
-194
Initi
al p
ortf
olio
was
285
0 an
d 25
29 le
ases
wer
e m
anag
ed fo
r 20
12/1
3 fin
anci
al y
ear
Budg
et a
lloca
ted:
R3
224
667
138
bill
ion
Expe
nditu
re:
R3 1
45 5
57 0
57.7
0 bi
llion
Targ
et A
chie
ved
321
leas
es w
ere
term
inat
ed
321
leas
es w
ere
term
inat
ed

Department of Public Works | Annual Report 2012/13 63
Performance Indicators (continued)
Sub-
Prog
ram
me
Regi
onal
Coo
rdin
atio
n
Stra
tegi
c O
bjec
tive
To e
nsur
e im
prov
ed s
ervi
ce d
eliv
ery
in a
ll de
part
men
tal p
rogr
ams
to m
eet c
lient
’s ex
pect
atio
ns a
nd le
vera
ge s
take
hold
er re
latio
ns
Perf
orm
ance
In
dica
tor
Act
ual A
chie
vem
ent
2011
/12
Plan
ned
Targ
et
2012
/201
3A
ctua
l Ach
ieve
men
t 20
12/2
013
Dev
iatio
n fr
om
Plan
ned
Targ
et to
A
ctua
l Ach
ieve
men
t fo
r 201
2/20
13
Com
men
ts o
n D
evia
tions
Num
ber o
f St
ate-
owne
d an
d le
ased
pr
oper
ties
verifi
ed fo
r pa
ymen
ts o
f Mun
icip
al
serv
ices
, rat
es a
nd
taxe
s
Mun
icip
al S
ervi
ces
115%
Num
ber o
f pay
men
ts:
91 4
57
Expe
nditu
re:
R 2.
618
billi
on.
100%
Verifi
catio
n of
200
90
prop
ertie
s fo
r pay
men
t of
cert
ified
invo
ices
with
in 3
0 da
ys
Bloe
mfo
ntei
n - 2
198
Dur
ban-
229
7 Jo
hann
esbu
rg –
208
1 Ca
pe To
wn
- 453
5 Ki
mbe
rley–
190
0 Po
rt E
lizab
eth-
169
0 Pr
etor
ia–
749
Mm
abat
ho –
1084
N
elsp
ruit
– 15
03
Polo
kwan
e –
1419
U
mta
ta -6
34
233
466
cert
ified
invo
ices
re
ceiv
ed w
ere
paid
Budg
et a
lloca
ted:
R0
(Rec
over
able
).
Expe
nditu
re:
R2 9
36 8
18 6
30.8
5 bi
llion
Targ
et A
chie
ved
Tim
eous
sub
mis
sion
of
invo
ices
by
Mun
icip
aliti
es
Tim
eous
sub
mis
sion
of
invo
ices
by
Mun
icip
aliti
es
Rate
s an
d Ta
xes
87%
Num
ber o
f pay
men
ts: 8
834
Expe
nditu
re: R
514
mill
ion
79%
4 86
0 ce
rtifi
ed in
voic
es re
ceiv
ed
wer
e pa
id.
Budg
et a
lloca
ted:
R7
16 8
76 0
00
Expe
nditu
re:
R786
869
420
.62
Tim
eous
sub
mis
sion
of
invo
ices
by
Mun
icip
aliti
es

64 Department of Public Works | Annual Report 2012/13
Performance Indicators (continued)
Sub-
Prog
ram
me
Regi
onal
Coo
rdin
atio
n
Stra
tegi
c O
bjec
tive
To e
nsur
e im
prov
ed s
ervi
ce d
eliv
ery
in a
ll de
part
men
tal p
rogr
ams
to m
eet c
lient
’s ex
pect
atio
ns a
nd le
vera
ge s
take
hold
er re
latio
ns
Perf
orm
ance
In
dica
tor
Act
ual A
chie
vem
ent
2011
/12
Plan
ned
Targ
et
2012
/201
3A
ctua
l Ach
ieve
men
t 20
12/2
013
Dev
iatio
n fr
om
Plan
ned
Targ
et to
A
ctua
l Ach
ieve
men
t fo
r 201
2/20
13
Com
men
ts o
n D
evia
tions
Num
ber o
f sta
te
and
leas
ed a
sset
s in
spec
ted
to e
nsur
e co
mpl
ianc
e w
ith
the
OH
S Ac
t and
re
gula
tions
Num
ber o
f bui
ldin
gs
insp
ecte
d:
Sta
te-o
wne
d:79
5
Leas
ed: 8
99
Tota
l: 16
94
4752
con
solid
ated
bui
ldin
g in
spec
tion
repo
rts
for
stat
e an
d le
ased
faci
litie
s an
d ve
rifica
tion
of o
ptim
al
utili
satio
n by
31
Mar
ch
2013
(Eac
h Re
gion
al
Offi
ce w
ill c
ondu
ct 4
32
insp
ectio
ns)
2 69
2 bu
ildin
gs in
spec
ted
Targ
et N
ot A
chie
ved
2 05
5 In
spec
tions
not
do
ne d
ue to
lack
of
capa
city
Revi
se A
nnua
l Ta
rget
for 2
013/
14
finan
cial
yea
r
Num
ber o
f on-
goin
g pr
ojec
ts
insp
ecte
d: 5
87In
spec
tion
of 5
89
cons
truc
tion
site
s by
31
Mar
ch 2
013
in:
Bloe
mfo
ntei
n - 3
9 D
urba
n- 8
3 Jo
hann
esbu
rg –
51
Cape
Tow
n - 1
01
Kim
berle
y– 2
4 Po
rt E
lizab
eth-
42
Pret
oria
– 48
M
mab
atho
–53
N
elsp
ruit
– 25
Po
lokw
ane
– 51
U
mta
ta -6
3 H
ead
Offi
ce -9
Insp
ectio
n of
973
con
stru
ctio
n pr
ojec
tsTa
rget
Ach
ieve
d
The
over
ach
ieve
men
t is
as a
resu
lts o
f unl
imite
d fo
llow
up
insp
ectio
ns
from
the
mai
n in
spec
tion
The
follo
w u
p in
spec
tion
are
cond
ucte
d ba
sed
on th
e on
the
risks
id
entifi
ed o
n th
e pr
ojec
t
Num
ber o
f BBB
EE
App
rove
d St
anda
rd
Faci
litie
s M
anag
emen
t Co
ntra
cts
ente
red
into
-30
% F
acili
ties
Man
agem
ent
cont
ract
s w
ith B
BBEE
sta
tus
by 3
1 M
arch
201
3
FM P
resc
ripts
(FM
Str
ateg
y,
FM P
olic
y, a
nd F
M C
ontr
acts
Sp
ecifi
catio
ns/g
uide
lines
) pr
ovid
ing
for t
he m
anag
emen
t of
FM
func
tion
and
BBBE
E w
as
deve
lope
d an
d fin
alis
ed b
ut
awai
ting
appr
oval
Targ
et N
ot A
chie
ved
Del
ays
in fa
cilit
atin
g si
gn o
ff / a
ppro
val o
f Pr
escr
ipts

Department of Public Works | Annual Report 2012/13 65
Performance Indicators (continued)KE
Y A
CCO
UN
TS M
AN
AG
EMEN
T
Sub-
Prog
ram
me
Key
Acc
ount
s M
anag
emen
t
Stra
tegi
c O
bjec
tive
To e
nsur
e im
prov
ed s
ervi
ce d
eliv
ery
in a
ll D
epar
tmen
tal p
rogr
ams
to m
eet c
lient
s’ ex
pect
atio
ns a
nd le
vera
ge s
take
hold
er re
latio
ns
Perf
orm
ance
In
dica
tor
Act
ual A
chie
vem
ent
2011
/12
Plan
ned
Targ
et
2012
/201
3A
ctua
l Ach
ieve
men
t 20
12/2
013
Dev
iatio
n fr
om P
lann
ed
Targ
et to
Act
ual
Ach
ieve
men
t for
201
2/20
13
Com
men
ts o
n D
evia
tions
Num
ber o
f sig
ned
Serv
ice
Leve
l Ag
reem
ents
for u
ser
depa
rtm
ents
53%
(22)
use
r dep
artm
ents
si
gned
the
SLA
doc
umen
tSL
As
sign
ed w
ith 2
5 us
er
depa
rtm
ents
SLA
sig
ned
with
5 u
ser
depa
rtm
ents
D
elay
s in
revi
ewin
g th
e co
nten
ts o
f SLA
sEx
pedi
te re
view
and
si
gnin
g of
SLA
s in
20
13/1
4
Palm
Rid
ge M
agis
trat
e’s
Cour
t

66 Department of Public Works | Annual Report 2012/13
Performance Indicators (continued)
Sub-
Prog
ram
me
Key
Acc
ount
s M
anag
emen
t
Stra
tegi
c O
bjec
tive
To e
nsur
e im
prov
ed s
ervi
ce d
eliv
ery
in a
ll D
epar
tmen
tal p
rogr
ams
to m
eet c
lient
s’ ex
pect
atio
ns a
nd le
vera
ge s
take
hold
er re
latio
ns
Perf
orm
ance
In
dica
tor
Act
ual A
chie
vem
ent
2011
/12
Plan
ned
Targ
et
2012
/201
3A
ctua
l Ach
ieve
men
t 20
12/2
013
Dev
iatio
n fr
om P
lann
ed
Targ
et to
Act
ual
Ach
ieve
men
t for
201
2/20
13
Com
men
ts o
n D
evia
tions
Num
ber o
f use
r de
part
men
t UA
MP
tem
plat
e co
mpl
eted
75.7
% U
AM
P te
mpl
ates
wer
e co
mpl
eted
for 2
5 N
atio
nal
Dep
artm
ents
and
Pub
lic
Entit
ies
50 u
ser d
epar
tmen
t UA
MP
tem
plat
es to
be
com
plet
ed
by 3
1 M
arch
201
3
UA
MP
tem
plat
es s
ubm
itted
to
38
user
dep
artm
ents
Th
e fo
llow
ing
reas
ons
wer
e in
dica
ted:
- Som
e cl
ient
s ar
e ex
empt
ed
as p
er th
eir r
eque
st
-Bas
ic E
duca
tion
and
DIR
CO a
re u
sing
PPP
mod
el
acco
mm
odat
ion
-No
resp
onse
from
clie
nt
(DPW
, Tou
rism
)
-Del
ayed
sub
mis
sion
for
Agric
ultu
re, E
nviro
nmen
tal
Affa
irs
-Som
e cl
ient
s re
ques
ted
exte
nsio
ns re
gard
ing
subm
issi
on o
f inp
uts
and
-Oth
ers
clie
nts
(SA
PS)
appo
inte
d th
eir o
wn
serv
ice
prov
ider
and
requ
este
d to
su
bmit
copy
of c
ompl
eted
-Tra
ditio
nal A
ffairs
is
inco
rpor
ated
in C
orpo
rate
G
over
nanc
e an
d IC
ASA
has
no
acc
omm
odat
ion
UA
MP
Inte
nsify
trai
ning
w
ith u
ser
depa
rtm
ents

Department of Public Works | Annual Report 2012/13 67
Performance Indicators (continued)
Sub-
Prog
ram
me
Key
Acc
ount
s M
anag
emen
t
Stra
tegi
c O
bjec
tive
To e
nsur
e im
prov
ed s
ervi
ce d
eliv
ery
in a
ll D
epar
tmen
tal p
rogr
ams
to m
eet c
lient
s’ ex
pect
atio
ns a
nd le
vera
ge s
take
hold
er re
latio
ns
Perf
orm
ance
In
dica
tor
Act
ual A
chie
vem
ent
2011
/12
Plan
ned
Targ
et
2012
/201
3A
ctua
l Ach
ieve
men
t 20
12/2
013
Dev
iatio
n fr
om P
lann
ed
Targ
et to
Act
ual
Ach
ieve
men
t for
201
2/20
13
Com
men
ts o
n D
evia
tions
Num
ber o
f sig
ned
Capi
tal W
orks
im
plem
enta
tion
prog
ram
mes
(CW
IP)
for u
ser d
epar
tmen
ts
100%
- A
ll 9
affec
ted
natio
nal d
epar
tmen
ts
sign
ed o
ff th
e Ca
pita
l Wor
ks
Impl
emen
tatio
n Pr
ogra
mm
e (C
WIP
) for
201
1/12
CWIP
sig
ned
for 1
0 us
er
depa
rtm
ents
(i.e
. DA
FF,
DAC
,SA
PS, D
oJ &
CD
, DH
A,
DoL
, DRD
LR &
DPW
) by
31
Mar
ch 2
013
7 us
er d
epar
tmen
ts s
igne
d CW
IP fo
r 201
3/14
Art
s an
d Cu
lture
and
Lab
our
CWIP
wer
e no
t sig
ned
due
to d
elay
s w
ith th
e cl
ient
ap
prov
al.
Trea
sury
requ
este
d D
PW to
re
duce
the
budg
et
DPW
to e
xecu
te th
e co
mm
itted
pro
ject
s
Num
ber o
f rep
orts
su
bmitt
ed to
eac
h us
er
depa
rtm
ent
11 re
port
s su
bmitt
ed
annu
ally
to 5
0 us
er
depa
rtm
ents
by
31 M
arch
20
13
Mon
thly
repo
rts
subm
itted
to
44
user
dep
artm
ent f
or a
pe
riod
of 1
0 m
onth
s
Repo
rts
not c
ompi
led
for
Dec
embe
r 201
2 du
e to
bu
ilder
s’ ho
liday
and
for
Mar
ch 2
013
as it
is d
ue in
A
pril
2013
Repo
rts
not
com
pile
d fo
r D
ecem
ber 2
012
due
to b
uild
ers’
holid
ay
and
for M
arch
201
3 as
it is
due
in A
pril
2013

68 Department of Public Works | Annual Report 2012/13
Performance Indicators (continued)PR
ESTI
GE
MA
NA
GEM
ENT
Sub
- Pro
gram
me
Pres
tige
Man
agem
ent
Stra
tegi
c O
bjec
tive
To e
nsur
e im
prov
ed s
ervi
ce d
eliv
ery
in a
ll D
epar
tmen
tal p
rogr
ams
to m
eet c
lient
s’ ex
pect
atio
ns a
nd le
vera
ge s
take
hold
er re
latio
ns
Perf
orm
ance
Indi
cato
rA
ctua
l Ach
ieve
men
t 20
11/1
2Pl
anne
d Ta
rget
20
12/2
013
Act
ual A
chie
vem
ent
2012
/201
3D
evia
tion
from
pl
anne
d ta
rget
to
Act
ual A
chie
vem
ent f
or
2012
/201
3
Com
men
ts o
n D
evia
tions
Num
ber o
f sig
ned
SLA
s w
ith P
rest
ige
clie
nts
-SL
As
sign
ed w
ith
Parli
amen
t and
the
Pres
iden
cy b
y 31
Mar
ch
2013
SLA
s no
t yet
con
clud
edTa
rget
Not
Ach
ieve
d
Com
plet
ing
offici
al
enga
gem
ents
Enga
ge c
lient
s w
ith th
e in
tent
ion
to c
oncl
ude
the
SLA
s du
ring
Q1
of
2013
/14
UA
MP
tem
plat
es
for a
ccom
mod
atio
n su
bmitt
ed to
Nat
iona
l Tr
easu
ry a
s pa
rt o
f the
D
PW U
AM
P
-Pr
estig
e U
AM
P su
bmitt
ed
to N
atio
nal T
reas
ury
as p
art
of th
e D
PW U
AM
P by
31
Mar
ch 2
013
Popu
latio
n of
UA
MP
tem
plat
es fo
r 201
4/15
co
mpl
eted
. Not
yet
su
bmitt
ed to
Nat
iona
l Tr
easu
ry
Targ
et N
ot A
chie
ved
DPW
UA
MP
not y
et
com
plet
ed
Subm
issi
on d
urin
g Q
1 of
201
3/14
Num
ber o
f sig
ned
Capi
tal W
orks
im
plem
enta
tion
prog
ram
mes
(CW
IP) f
or
Pres
tige
clie
nts
-1
CWIP
and
1 P
MIP
si
gned
for P
rest
ige
clie
nt
acco
mm
odat
ion
proj
ects
by
31
Mar
ch 2
013
1 CW
IP a
nd 1
PM
IP
sign
ed fo
r Pre
stig
e cl
ient
ac
com
mod
atio
n pr
ojec
ts b
y 31
Mar
ch 2
013
Targ
et A
chie
ved
Non
e
Sign
ed (i
nter
ior d
esig
n an
d de
cora
tion)
im
plem
enta
tion
prog
ram
me
for P
rest
ige
clie
nts
Sign
ed (i
nter
ior d
esig
n an
d de
cora
tion)
im
plem
enta
tion
Ann
ual i
nter
ior d
esig
n an
d de
cora
tion
prog
ram
me
for
2012
/13
sign
ed fo
r pre
stig
e ac
com
mod
atio
n by
31
Mar
ch 2
013
Targ
et A
chie
ved
The
mai
n ad
min
istr
ativ
e ob
stac
le in
pro
cess
ing
furn
iture
item
s pr
ocur
emen
t w
as th
e in
terp
reta
tion
of
Circ
ular
33
of N
ovem
ber
2011
whi
ch c
ause
d a
back
log
in s
ecur
ing
the
acco
untin
g O
ffice
r’s
appr
oval
and
the
subs
eque
nt im
plem
enta
tion
by th
e re
spec
tive
regi
onal
offi
ces
Targ
et A
chie
ved
Non
e

Department of Public Works | Annual Report 2012/13 69
Performance Indicators (continued)
Sub
- Pro
gram
me
Pres
tige
Man
agem
ent
Stra
tegi
c O
bjec
tive
To e
nsur
e im
prov
ed s
ervi
ce d
eliv
ery
in a
ll D
epar
tmen
tal p
rogr
ams
to m
eet c
lient
s’ ex
pect
atio
ns a
nd le
vera
ge s
take
hold
er re
latio
ns
Perf
orm
ance
Indi
cato
rA
ctua
l Ach
ieve
men
t 20
11/1
2Pl
anne
d Ta
rget
20
12/2
013
Act
ual A
chie
vem
ent
2012
/201
3D
evia
tion
from
pl
anne
d ta
rget
to
Act
ual A
chie
vem
ent f
or
2012
/201
3
Com
men
ts o
n D
evia
tions
Num
ber o
f pro
gres
s re
port
s su
bmitt
ed
annu
ally
to p
rest
ige
clie
nts
-11
repo
rts
subm
itted
an
nual
ly to
Par
liam
ent
and
The
Pres
iden
cy b
y 31
M
arch
201
3
Repo
rts
not s
ubm
itted
Targ
et N
ot A
chie
ved
Repo
rtin
g fr
amew
ork
not a
gree
d up
on b
y cl
ient
s
Num
ber o
f sch
edul
ed
Pres
tige
even
ts s
uppo
rt
with
the
prov
isio
n of
in
fras
truc
ture
-A
ppro
val o
f cal
enda
r for
20
12/1
3 an
d pr
ovis
ion
of
infr
astr
uctu
re s
uppo
rt fo
r 10
sch
edul
ed e
vent
s by
31
Mar
ch 2
013
App
rova
l of c
alen
dar f
or
2012
/13
and
prov
isio
n of
in
fras
truc
ture
sup
port
for
10 s
ched
uled
eve
nts
by 3
1 M
arch
201
3
Targ
et A
chie
ved
Non
e

70 Department of Public Works | Annual Report 2012/13
Performance Indicators (continued)PR
OG
RAM
ME
3: E
XPA
ND
ED P
UBL
IC W
ORK
S PR
OG
RAM
ME
Purp
ose
of t
he p
rogr
amm
e: E
nsur
e th
e cr
eatio
n of
wor
k op
port
uniti
es a
nd p
rovi
sion
of t
rain
ing
for
unsk
illed
, mar
gina
lised
and
une
mpl
oyed
peo
ple
in S
outh
Afr
ica
by
coor
dina
ting
the
impl
emen
tatio
n of
the
Expa
nded
Pub
lic W
orks
Pro
gram
me.
Prog
ram
me
3:
Expa
nded
Pub
lic W
orks
Pro
gram
me
Stra
tegi
c O
bjec
tive
To p
rom
ote
an e
nabl
ing
envi
ronm
ent f
or th
e cr
eatio
n of
bot
h sh
ort a
nd s
usta
inab
le w
ork
oppo
rtun
ities
, so
as to
con
trib
ute
to th
e na
tiona
l goa
l of j
ob c
reat
ion
and
pove
rty
alle
viat
ion
Perf
orm
ance
Indi
cato
rA
ctua
l Ach
ieve
men
t 20
11/1
2Pl
anne
d Ta
rget
20
12/2
013
Act
ual A
chie
vem
ent
2012
/201
3D
evia
tion
from
Pla
nned
Ta
rget
to A
ctua
l A
chie
vem
ent f
or 2
012/
2013
Com
men
ts o
n D
evia
tions
Num
ber o
f you
th
part
icip
atin
g in
the
NYS
pro
gram
me
-3
500
yout
h to
par
ticip
ate
on E
PWP
NYS
by
31 M
arch
20
13
1 52
6 le
arne
rs p
artic
ipat
ing
in N
YSTa
rget
Not
Ach
ieve
dPr
ojec
ts w
ill b
e fa
st
trac
ked
with
in th
e D
epar
tmen
t
Del
ays
in
impl
emen
tatio
n of
pr
ojec
ts
Num
ber o
f mun
icip
aliti
es
repo
rtin
g on
EPW
P ta
rget
s-
260
mun
icip
aliti
es to
repo
rt
on E
PWP
targ
ets
by 3
1 M
arch
201
3
247
mun
icip
aliti
es to
repo
rt
on E
PWP
targ
ets
Targ
et N
ot A
chie
ved
Tech
nica
l sup
port
ha
s be
en d
eplo
yed
to m
unic
ipal
ities
to
assi
st in
max
imis
ing
EPW
P jo
b cr
eatio
n
Inab
ility
to p
lan
and
impl
emen
t EP
WP
proj
ects
by
mun
icip
aliti
es

Department of Public Works | Annual Report 2012/13 71
Performance Indicators (continued)
Prog
ram
me
3:
Expa
nded
Pub
lic W
orks
Pro
gram
me
Stra
tegi
c O
bjec
tive
To p
rom
ote
an e
nabl
ing
envi
ronm
ent f
or th
e cr
eatio
n of
bot
h sh
ort a
nd s
usta
inab
le w
ork
oppo
rtun
ities
, so
as to
con
trib
ute
to th
e na
tiona
l goa
l of j
ob c
reat
ion
and
pove
rty
alle
viat
ion
Perf
orm
ance
Indi
cato
rA
ctua
l Ach
ieve
men
t 20
11/1
2Pl
anne
d Ta
rget
20
12/2
013
Act
ual A
chie
vem
ent
2012
/201
3D
evia
tion
from
Pla
nned
Ta
rget
to A
ctua
l A
chie
vem
ent f
or 2
012/
2013
Com
men
ts o
n D
evia
tions
Num
ber o
f wor
k op
port
uniti
es c
reat
ed
thro
ugh
EPW
P by
pa
rtic
ipat
ing
publ
ic b
odie
s al
igne
d to
the
appr
oved
EP
WP
Busi
ness
Pla
n
8434
59 w
ork
oppo
rtun
ities
Cr
eate
1 2
10 0
00 w
ork
oppo
rtun
ities
by
31 M
arch
20
13
941
593
wor
k op
port
uniti
es
crea
ted
Targ
et N
ot A
chie
ved
Tech
nica
l sup
port
ha
s be
en d
eplo
yed
to a
ll sp
here
s to
as
sist
in m
axim
isin
g EP
WP
job
crea
tion
and
repo
rtin
g.
Und
er a
nd p
oor
repo
rtin
g by
pub
lic
bodi
es
Lack
of t
echn
ical
ca
paci
ty to
im
plem
ent p
roje
cts
Num
ber o
f EPW
P w
ork
oppo
rtun
ities
cre
ated
on
prov
inci
al a
cces
s ro
ads
-Cr
eate
130
000
wor
k op
port
uniti
es o
n pr
ovin
cial
ac
cess
road
s by
31
Mar
ch
2013
121
028
wor
k op
port
uniti
es
crea
ted
Targ
et N
ot A
chie
ved
Enga
gem
ent w
ith
Prov
inci
al R
oads
de
part
men
ts to
en
sure
that
they
im
plem
ent p
roje
cts
as p
er a
ppro
ved
busi
ness
pla
ns
Pro
vinc
es d
id n
ot
impl
emen
t pro
ject
s as
per
app
rove
d bu
sine
ss p
lans
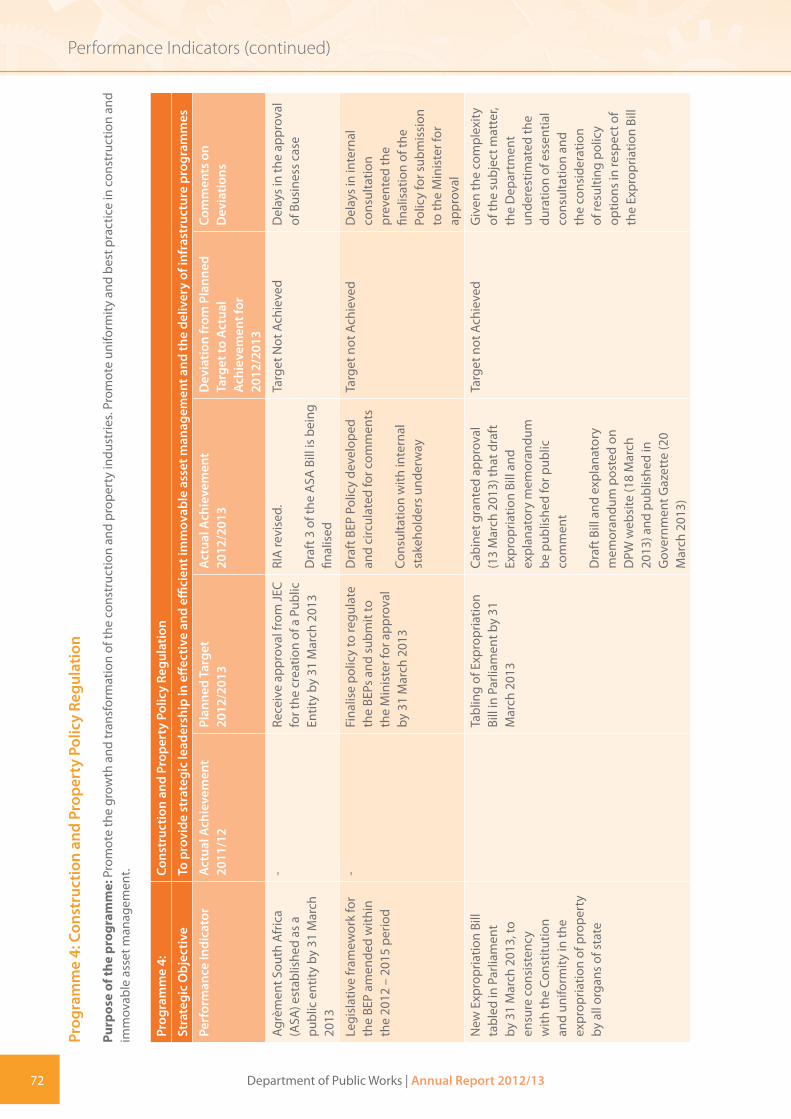
72 Department of Public Works | Annual Report 2012/13
Performance Indicators (continued)Pr
ogra
mm
e 4:
Con
stru
ctio
n an
d Pr
oper
ty P
olic
y Re
gula
tion
Purp
ose
of th
e pr
ogra
mm
e: P
rom
ote
the
grow
th a
nd tr
ansf
orm
atio
n of
the
cons
truc
tion
and
prop
erty
indu
strie
s. Pr
omot
e un
iform
ity a
nd b
est p
ract
ice
in c
onst
ruct
ion
and
imm
ovab
le a
sset
man
agem
ent.
Prog
ram
me
4:
Cons
truc
tion
and
Prop
erty
Pol
icy
Regu
latio
n
Stra
tegi
c O
bjec
tive
To p
rovi
de s
trat
egic
lead
ersh
ip in
effe
ctiv
e an
d effi
cien
t im
mov
able
ass
et m
anag
emen
t and
the
deliv
ery
of in
fras
truc
ture
pro
gram
mes
Perf
orm
ance
Indi
cato
rA
ctua
l Ach
ieve
men
t 20
11/1
2Pl
anne
d Ta
rget
20
12/2
013
Act
ual A
chie
vem
ent
2012
/201
3D
evia
tion
from
Pla
nned
Ta
rget
to A
ctua
l A
chie
vem
ent f
or
2012
/201
3
Com
men
ts o
n D
evia
tions
Agrè
men
t Sou
th A
fric
a (A
SA) e
stab
lishe
d as
a
publ
ic e
ntity
by
31 M
arch
20
13
-Re
ceiv
e ap
prov
al fr
om JE
C fo
r the
cre
atio
n of
a P
ublic
En
tity
by 3
1 M
arch
201
3
RIA
revi
sed.
Dra
ft 3
of t
he A
SA B
ill is
bei
ng
final
ised
Targ
et N
ot A
chie
ved
Del
ays
in th
e ap
prov
al
of B
usin
ess
case
Legi
slat
ive
fram
ewor
k fo
r th
e BE
P am
ende
d w
ithin
th
e 20
12 –
201
5 pe
riod
-Fi
nalis
e po
licy
to re
gula
te
the
BEPs
and
sub
mit
to
the
Min
iste
r for
app
rova
l by
31
Mar
ch 2
013
Dra
ft B
EP P
olic
y de
velo
ped
and
circ
ulat
ed fo
r com
men
ts
Cons
ulta
tion
with
inte
rnal
st
akeh
olde
rs u
nder
way
Targ
et n
ot A
chie
ved
Del
ays
in in
tern
al
cons
ulta
tion
prev
ente
d th
e fin
alis
atio
n of
the
Polic
y fo
r sub
mis
sion
to
the
Min
iste
r for
ap
prov
al
New
Exp
ropr
iatio
n Bi
ll ta
bled
in P
arlia
men
t by
31
Mar
ch 2
013,
to
ensu
re c
onsi
sten
cy
with
the
Cons
titut
ion
and
unifo
rmity
in th
e ex
prop
riatio
n of
pro
pert
y by
all
orga
ns o
f sta
te
Tabl
ing
of E
xpro
pria
tion
Bill
in P
arlia
men
t by
31
Mar
ch 2
013
Cabi
net g
rant
ed a
ppro
val
(13
Mar
ch 2
013)
that
dra
ft
Expr
opria
tion
Bill
and
expl
anat
ory
mem
oran
dum
be
pub
lishe
d fo
r pub
lic
com
men
t
Dra
ft B
ill a
nd e
xpla
nato
ry
mem
oran
dum
pos
ted
on
DPW
web
site
(18
Mar
ch
2013
) and
pub
lishe
d in
G
over
nmen
t Gaz
ette
(20
Mar
ch 2
013)
Targ
et n
ot A
chie
ved
Giv
en th
e co
mpl
exity
of
the
subj
ect m
atte
r, th
e D
epar
tmen
t un
dere
stim
ated
the
dura
tion
of e
ssen
tial
cons
ulta
tion
and
the
cons
ider
atio
n of
resu
lting
pol
icy
optio
ns in
resp
ect o
f th
e Ex
prop
riatio
n Bi
ll

Department of Public Works | Annual Report 2012/13 73
Performance Indicators (continued)
Prog
ram
me
4:
Cons
truc
tion
and
Prop
erty
Pol
icy
Regu
latio
n
Stra
tegi
c O
bjec
tive
To p
rovi
de s
trat
egic
lead
ersh
ip in
effe
ctiv
e an
d effi
cien
t im
mov
able
ass
et m
anag
emen
t and
the
deliv
ery
of in
fras
truc
ture
pro
gram
mes
Perf
orm
ance
Indi
cato
rA
ctua
l Ach
ieve
men
t 20
11/1
2Pl
anne
d Ta
rget
20
12/2
013
Act
ual A
chie
vem
ent
2012
/201
3D
evia
tion
from
Pla
nned
Ta
rget
to A
ctua
l A
chie
vem
ent f
or
2012
/201
3
Com
men
ts o
n D
evia
tions
Bi-a
nnua
l rep
orts
co
mpl
eted
on
the
impl
emen
tatio
n fo
r the
20
12-2
015
perio
d fo
r:
(a) N
atio
nal C
ontr
acto
r D
evel
opm
ent P
rogr
amm
e (N
CDP)
.
Expa
nd, m
onito
r and
re
port
bi-a
nnua
lly o
n th
e N
CDP
thro
ugh
NCD
P St
eerin
g Co
mm
ittee
Repo
rts
on th
e ex
pans
ion
and
mon
itorin
g of
NCD
P at
a p
rovi
ncia
l lev
el w
ere
subm
itted
to th
e N
CDP
Stee
ring
Com
mitt
ee in
Ju
ne 2
012
and
Mar
ch 2
013
resp
ectiv
ely
NCD
P w
as fu
rthe
r exp
ande
d th
roug
h th
e es
tabl
ishm
ent
of a
Nat
iona
l NCD
P Fo
rum
in
Nov
embe
r 201
2
Targ
et A
chie
ved
Non
e
(b)P
rope
rty
Man
agem
ent
BEE
Stra
tegy
Revi
ew th
e Pr
oper
ty
Man
agem
ent t
o al
ign
with
BB
BEE
code
s by
31
Mar
ch
2013
Proj
ect p
ut o
n ho
ld in
Pol
icy
Bran
chTa
rget
Not
Ach
ieve
dA
ser
vice
pro
vide
r w
as a
ppoi
nted
by
Prop
erty
and
Fac
ilitie
s M
anag
emen
t Chi
ef
Dire
ctor
ate
for t
he
revi
ew o
f lea
ses
as
wel
l as
the
Prop
erty
M
anag
emen
t BEE
St
rate
gy

74 Department of Public Works | Annual Report 2012/13
Performance Indicators (continued)
Prog
ram
me
4:
Cons
truc
tion
and
Prop
erty
Pol
icy
Regu
latio
n
Stra
tegi
c O
bjec
tive
To p
rovi
de s
trat
egic
lead
ersh
ip in
effe
ctiv
e an
d effi
cien
t im
mov
able
ass
et m
anag
emen
t and
the
deliv
ery
of in
fras
truc
ture
pro
gram
mes
Perf
orm
ance
Indi
cato
rA
ctua
l Ach
ieve
men
t 20
11/1
2Pl
anne
d Ta
rget
20
12/2
013
Act
ual A
chie
vem
ent
2012
/201
3D
evia
tion
from
Pla
nned
Ta
rget
to A
ctua
l A
chie
vem
ent f
or
2012
/201
3
Com
men
ts o
n D
evia
tions
Gre
en b
uild
ing
fram
ewor
k an
d re
late
d gu
idel
ines
im
plem
ente
d w
ithin
th
e201
2-20
15 p
erio
d to
en
sure
env
ironm
enta
l su
stai
nabi
lity
in th
e co
nstr
uctio
n an
d pr
oper
ty
sect
ors
Gre
en b
uild
ing
fram
ewor
k ap
prov
ed in
O
ctob
er 2
011.
Dev
elop
men
t of a
Gre
en
build
ing
prog
ram
me
for
gove
rnm
ent t
owar
ds
gree
n jo
b cr
eatio
n an
d ec
onom
ic g
row
th b
y 31
M
arch
201
3
Dev
elop
men
t of e
co-
labe
lling
crit
eria
for
sele
cted
con
stru
ctio
n m
ater
ials
as
iden
tified
in
2012
/13
Prog
ram
me
was
co
ncep
tual
ised
and
rele
vant
ex
pert
s id
entifi
ed to
ass
ist i
n th
is d
evel
opm
ent
Seve
n (7
) con
stru
ctio
n m
ater
ials
iden
tified
for e
co
labe
lling
in O
ctob
er 2
012.
Dep
artm
ent o
f En
viro
nmen
tal A
ffairs
(DEA
) co
nsid
ered
dra
ft M
oU to
de
velo
p ec
o-la
belli
ng c
riter
ia
on s
elec
ted
mat
eria
ls w
ith
DPW
Targ
et N
ot A
chie
ved
Gre
en B
uild
ing
Prog
ram
me
hand
ed
over
to P
rope
rty
and
Faci
litie
s M
anag
emen
t Ch
ief D
irect
orat
e in
Q
uart
er 4
of 2
012/
13
(in te
rms
of D
PW’S
Ci
rcul
ar 9
of 2
013)

Department of Public Works | Annual Report 2012/13 75
Performance Indicators (continued)
Prog
ram
me
4:
Cons
truc
tion
and
Prop
erty
Pol
icy
Regu
latio
n
Stra
tegi
c O
bjec
tive
To p
rovi
de s
trat
egic
lead
ersh
ip in
effe
ctiv
e an
d effi
cien
t im
mov
able
ass
et m
anag
emen
t and
the
deliv
ery
of in
fras
truc
ture
pro
gram
mes
Perf
orm
ance
Indi
cato
rA
ctua
l Ach
ieve
men
t 20
11/1
2Pl
anne
d Ta
rget
20
12/2
013
Act
ual A
chie
vem
ent
2012
/201
3D
evia
tion
from
Pla
nned
Ta
rget
to A
ctua
l A
chie
vem
ent f
or
2012
/201
3
Com
men
ts o
n D
evia
tions
Num
ber o
f bes
t pra
ctic
e gu
idel
ines
for t
he
man
agem
ent o
f sta
te
Imm
ovab
le A
sset
s in
the
Nat
iona
l and
Pro
vinc
ial
sphe
res
of g
over
nmen
t de
velo
ped
with
in th
e 20
12
-201
5 pe
riod
Dra
ft Im
mov
able
Ass
et
lifec
ycle
man
agem
ent
guid
elin
es d
evel
oped
Pres
ent I
mm
ovab
le A
sset
lif
ecyc
le m
anag
emen
t gu
idel
ines
to N
atio
nal a
nd
Prov
inci
al c
usto
dian
s an
d pr
ovid
e gu
idan
ce re
quire
d by
31
Mar
ch 2
013
Dra
ft im
mov
able
Ass
et
lifec
ycle
man
agem
ent
guid
elin
es d
evel
oped
. In
tern
al c
onsu
ltatio
n un
derw
ay w
ith re
leva
nt
bran
ches
in th
e D
epar
tmen
t to
war
ds p
rese
ntat
ion
to
EXCO
for a
ppro
val
Targ
et N
ot A
chie
ved
Del
ays
in in
tern
al
cons
ulta
tion
prev
ente
d th
e fin
alis
atio
n of
the
Gui
delin
e
1st d
raft
Imm
ovab
le A
sset
co
nditi
ons
asse
ssm
ent
guid
elin
e: G
ener
al
build
ings
dev
elop
ed
Fina
l dra
ft G
uide
line
deve
lope
d. C
onsu
ltatio
n m
eetin
g be
ing
conv
ened
for
final
com
men
t by
rele
vant
br
anch
es in
the
Dep
artm
ent
befo
re p
rese
ntat
ion
to E
XCO
Targ
et N
ot A
chie
ved
Del
ays
in in
tern
al
cons
ulta
tion
prev
ente
d th
e fin
alis
atio
n of
the
Gui
delin
e

76 Department of Public Works | Annual Report 2012/13
Performance Indicators (continued)
Strategy to overcome areas of under performance
The Department is experiencing many complex challenges. These challenges are both internal (structures, processes, systems, capacity and capability and performance) and external (stakeholder relations and impaired public perceptions). Most of them predate the existing leadership of the Department and have not been adequately addressed over the past several years.
The Report of the Auditor-General highlighted the need for a serious review of the management systems of the Department. The Special Investigation Unit also conducted investigations regarding alleged irregularities. The Department is committed to improve the management systems and actively addressing issues of fraud and corruption.
In response to this situation, the Department initiated the development of a turnaround strategy in January 2012. This strategy and its associated high-level project plan, defines the process of organisational review and renewal that will ensure compliance with the mandate and satisfactory audits.
Short-term stabilisation interventions were defined and others may be added. Stabilised areas will create the potential for more fundamental change that can bring large efficiency gains, through better practice and improved policy options. The stabilisation of management is critical.
Key areas of attention in the turnaround strategy include Supply Chain Management, Lease Management, the Property Management Trading Entity (PMTE), the Immovable Asset Register (IAR) and a lack of professional and technical skills in the built-industry environment. These are addressed below:
Lack of controls in Supply Chain Management
A core driver to the transformation of operations of the Department is the efficiency enhancement of the Finance and Supply Chain Management (SCM) operations. In this regard, a service provider was appointed towards the end of the reporting period to assist with a fundamental review of these functions and the capacitation of the affected units. This intervention will operate until July 2014. Post this intervention, the Department will have all the necessary controls, systems and processes in place for the Department to take full responsibility of these important functions.
The project consists of three core focus areas of operations:
The Departmental (DPW) main Account.
• The Property Management Trading Entity (PMTE) Account,
• Supply Chain Management across all regions and head office.
The Department’s capacity to process tenders, perform Supply Chain Management and project manage construction, maintenance and lease contracts, has been severely eroded. The resultant lack of financial controls and mismanagement provided fertile ground for fraud and corruption. The scale of mismanagement and corruption is only now coming to light owing largely to the detailed forensic work of the Special Investigating Unit. Consequently, the Supply Chain Management processes are being critically reviewed both to combat waste and corruption as well as expedite delivery and supplier payments.
These concerns are being addressed across several dimensions:
• Four discrete supply chain streams are being designed to address the differing needs of clients and projects;
- Prestige
- Infrastructure projects
- Acquisition of poperty for leasing
- Goods and services

Department of Public Works | Annual Report 2012/13 77
Performance Indicators (continued)
• Supply chain controls are being improved through process redesign. Gaps are being identified with SCM processes and plugged. In addition suspect contracts are being investigated extensively. This will take between 12-18 month to conduct.
• Supplier payment lead times are being progressively reduced to the targeted 30 days. While there is a backlog, this process should be up-to-date by end of third quarter of 2013/2014 financial year. All new supplier invoices are already being settled within 30 days.
• The supplier database is being overhauled for relevance.
• Supply Chain experts and a service provider were appointed to run the intervention in the absence of adequate organisational skills and capability.
• Revised Policy on SCM.
Poor lease management
Building on earlier work by the Auditor-General and the Special Investigations Unit, and with the assistance of National Treasury, the Department embarked on a review of all lease agreements, including leases of government-owned properties. The irregularities in the leasing environment created unmanageable legal and reputational risks, lack of value for money and directly affected service delivery. The purpose of this exercise is to resolve the backlog of leases: deal with the leases that are due to expire: conduct a forensic audit to establish lease irregularities; conduct a physical verification of the condition, extent, occupation and use of leased properties; recover monies owed to the Department; review and strengthen the business processes, policies, strategy and systems of the Department relating to lease management: and to train and capacitate staff accordingly.
A joint Departmental and service provider team is in place. Challenges were experienced in sourcing information and documentation for the Lease Review. These impacted on the Department’s ability to conduct a physical verification of leased accommodation. At this stage, only 42 percent of floor plans and contact details are in place. As a result, the project is approximately one month behind schedule.
The lease backlog is being progressively addressed by a newly-established Bid Adjudication Committee for Leases.
To date, 100 percent the 2 778 leases were reviewed. Of the 2 778, 1 316 were leases that required attention, revision or renewal. These were regarded as backlog leases. Of the backlog leases, recommendations were made in respect of 365 leases. These included leases for Pretoria, Nelspruit and Polokwane. Recommendations for the remaining 951 leases will made in the financial year 2013/14.
Lack of an appropriate accounting platform for the PMTE
The creation of the PMTE was approved by National Treasury in 2006. It has only recently been formalised. This was long overdue and a source of embarrassment to the Department. It was also the source of many of the issues identified by the Auditor-General.
An interim operating model was developed and implemented and, with effect from the 1st April 2013, PMTE and DPW main account activities will be separate. The PMTE has, ahead of schedule, adopted GRAP as its accounting system and the first formal training interventions were completed.
A detailed business case is under development and will be submitted to Cabinet for approval in 2013/14. This relates to the final structure of the PMTE.
The new entity requires a different accounting platform to that used by the DPW. The move from a modified cash basis to GRAP has far-reaching impacts. A business needs assessment was completed on the billing and accounting system requirements.
There are several options that are being explored in terms of systems selection. These will be finalised by September 2013.

78 Department of Public Works | Annual Report 2012/13
Performance Indicators (continued)
Inadequate Immovable Asset Register
The Department is in the process of rebuilding its immovable asset register. As part of this process, it is reviewing the current structure and operating model to maintain this database of state property in conjunction with the provinces and other key custodians. The rebuilt and revised operating model will not only provide the right data and tools to ensure compliance but will also provide the type of data base required to support DPW’s core business, enable the right level of integration with its clients’ needs and support specific asset and portfolio management principles. The asset register will be integrated with the required billing, asset management (UAMPs and CAMPs), budgeting, accounting and reporting systems.
As the major custodian of State immovable assets, the DPW is responsible for the planning, acquisition, management and disposal of State immovable properties vested in the national government, hence the Immovable Asset Register is key to the custodial role which the Department plays, in relation to the planning and management of state immovable assets.
As reflected historically in reports from the Auditor General, the absence of a compliant Immovable Asset Register has significantly contributed of the Department’s successive negative audit opinions.
The compilation of a comprehensive and compliant Immovable Asset Register is paramount. This exercise involves a joint-DPW and service provider team. A significant amount of work is required to resolve a multitude of unresolved legacy issues which requires extensive interaction with the Department of Rural Development and Land Reform, Provinces, National Treasury and other stakeholders. We are developing a fair value model to value the Immovable Assets and a compliant capitalisation policy to ensure that it remains properly valued, going forward.
The state land reconciliation has been substantially completed and the asset register updated. The results currently reflect the following:
Custodian Number of land parcels
National DPW 28 841
DRDLR 25 435
9 Provincial Departments of Public Works 50 606
9 Provincial Departments of Human Settlements 70 176
Work in progress, still to be allocated 1 174
Other custodians being confirmed 3 341
Total according to original Deeds downloaded 179 573
These figures will form the basis of a physical verification process due to commence in 2013/14.
The Department commenced work in conjunction with the Chief Surveyor-General in addressing the completeness and accuracy of surveyed land not registered and other unregistered state land.
The Department established a process of engagement with the identified state land custodians on an ongoing basis, to update registers and keep track of the balance of registered land parcels. This has never been attempted before and is proving to be more time-consuming than expected.
Further, the Department has targeted the completion of the Immovable Asset Register in line with the revised requirements of the PMTE established with effect from 1 April 2013. This requires us to substantially complete the IAR by 31 March 2015 with the final adjustments effected by 31 March 2016.
A total of about 24 000 land parcels lying in the regions still need to be vested. These are planned for completion by March 2016.

Department of Public Works | Annual Report 2012/13 79
Performance Indicators (continued)
Road construction under EPWP
Lack of built environment and property management skills across the value chain
Several years ago, the state, including the Department, employed artisans and professionals, including engineers, architects, and quantity surveyors etc. to construct and maintain buildings. Despite the existence of pockets of skills within the Department, there is a significant lack of technical capacity to undertake direct construction and maintenance functions – as well as to effectively manage relations with contractors and service providers.
The Department recently started reversing this trend through the resuscitation of regional workshop facilities, prioritising Pretoria and Cape Town, and employing trainee artisans. We have secured cooperation from the Department of Public Service and Administration and the Department of Higher Education and Training to assist in the training of artisans and technicians.
The Department has initiated a Professionals Insourcing Strategy to build-in capacity of built environment professionals who will continue to assist the Department for the three to five year duration.
The task of capacitating the Department is a significant one as the built environment and property management industry is suffering from a general shortage of skills, making attraction and retention of appropriate resources a challenging task.
Expanded Public Works Programme
The Expanded Public Works Programme is one of the Government arrays of programmes, aimed at providing poverty and income relief through temporary work for the unemployed to carry out socially useful activities. This programme cuts across all spheres of government. One of the challenges facing the Department regarding EPWP projects at local government level, has been the ability to implement projects with ease. Therefore, the Department has deployed technical support to municipalities to assist in maximising EPWP job creation in all municipalities. The Department will fast track all projects that are implemented to ensure that the National Youth Services (NYS) programme achieves its targets.

80 Department of Public Works | Annual Report 2012/13
Linking performance with budgets
2.5 Summary of financial informationDepartmental Receipts
The Department collected 53 795 million more than the target of R36 445 million as depicted in the table for departmental revenue below, which represent an overall increase of 33 percent of revenue collected for the financial year ended 31 March 2013. Sale of goods and services other than capital assets, the revenue collected increased by 10% as a result of slight improvement on collection of debtors. There was no collection from sales of scrap, waste, arms and other used current goods. Fines, penalties and forfeits, the revenue collected decreased by 467 percent because fewer incidents of fines and penalties occurred during the year. There was no sale of capital assets during the financial year. Financial transactions were more by 82% as a result of old payables that was allocated to revenue.
Departmental revenue
2011/12 2012/13 2012/13 2013/14 % Deviation
from TargetActual Actual Target Target
R`000 R`000 R’000 R`000
Sale of goods and services other than capital assets 36 388 32 017 31 445 32 772 10%
Sales of scrap, waste, arms and other used current goods 35 467
Fines, penalties and forfeits 12 3 17 -467%
Interest, dividends and rent on land 103 7 835 546 89%
Sales of capital assets 3 154 - 1 454 1 527
Buildings and other fixed structures 3 154 - - -
Land and subsoil assets 1 527
Financial transactions (recovery of loans and advances) 35 538 13 940 2 516 2 642 82%
TOTAL DEPARTMENTAL RECEIPTS 75 195 53 795 36 445 36 941 33%
Programme Expenditure
Details 2012/13 2011/12
R`000 R`000
Budget Allocation 7 891 248 7 829 744
Actual expenditure 7 203 925 7 061 437
Spending as a percentage 91% 90%
Unspent funds 687 323 768 307
Unspent funds as a percentage 9% 10%
Mitchelle’s Plain police station

Department of Public Works | Annual Report 2012/13 81
Linking performance with budgets (continues)
Spending per Economic Classification
2012/13 2011/12
Final Appropria-
tion
Actual Expendi-
ture Variance Exp as %
Final Appropria-
tion
Actual Expendi-
ture Exp as %
R’000 R’000 R’000 % R’000 R’000 %
Current payments Compensation of employees 1 381 450 1 374 552 6 898 100% 1 252 469 1 269 579 101%
Goods and services 1 203 845 977 014 226 831 81% 1 034 900 1 032 905 100%
Interest and rent on land 9 774 21 9 753 0.2% 1 586 1 567 99%
Transfers & subsidies
Provinces & municipalities 3 090 982 2 969 955 121 027 96% 2 950 451 2 592 965 88%
Departmental agencies & accounts
752 986 751 640 1 346 100% 734 690 732 486 100%
Foreign governments & international organisations
18 941 15 436 3 505 82% 16 915 12 956 77%
Public corporations & private enterprises
50 800 50 800 - 100% 150 000 150 000 100%
Non-profit institutions 282 724 292 627 (9 903) 104% 154 370 163 801 106%
Households 11 876 11 875 1 100% 3 968 4 012 101%
Gift & donation 3 20 (17) 668% 2 2 100%
Payment for capital assets
Buildings & other fixed structures 999 254 713 003 286 251 71% 1 436 745 1 011 408 70%
Machinery & equipment 59 558 43 283 16 275 73% 84 984 81 162 96%
Software & other intangible assets
25 857 501 25 356 2% 6 639 6 569 99%
Payment for financial assets 3 198 3 198 - 100% 2 025 2 025 100%
Total 7 891 248 7 203 925 687 323 91% 7 829 744 7 061 437 90%

82 Department of Public Works | Annual Report 2012/13
Linking performance with budgets (continues)
Notes to expenditure
Current Payments: Compensation of employees
Expenditure for the compensation of employees is R1.375 billion and is equivalent to 100 percent of the allocation. Adjustment of R52 million from goods and services was approved by National Treasury to offset the projected over-spending on compensation of employees.
Current Payments: Goods and services
Expenditure for the goods and services is R983 million and is equivalent to 82 percent of the allocation. Under-spending on goods and services relates to funds allocated for the Turnaround programme and office accommodation. Turnaround programme funds were allocated during the adjustment estimates and the delay in the appointment of the services provider resulted in funds being underspend. Under-spending in Office Accommodation is due to reconciliation of the leases between the Department and PMTE. Roll over was requested for the funds not spent during 2012/13 under Office Accommodation.
Transfers and Subsidies
Expenditure for the transfers and subsidies is R4.092 billion and is equivalent to 97 percent of the allocation. Under-spending in transfers and subsidies relate to funds declared as saving by Kwazulu-Natal Provincial Department of Public Works for funds related to Devolution of Property Rates Fund Grant to Provinces.
Payments for Capital Asset: Infrastructure
Expenditure for infrastructure is R713 million and is equivalent to 71 percent of the allocation. Under-spending in infrastructure is due to non-performance of the contractors, termination and technical problems on the project side, including vacant project managers’ posts in some regional offices.
Payments for Capital Assets: Machinery and Equipment
Expenditure for machinery and equipment is R43 million and expenditure is equivalent to 71 percent of the allocation. Under-spending in machinery and equipment is due to invoices received but could not be paid before the end of the financial year.
Payment for Capital Assets: Software and Intangible
Expenditure for software and intangible assets is R584 000 and is equivalent to 2 percent of the allocation. Under-spending in software and intangible assets relate to funds received during the adjustment estimates for accounting system for the PMTE.
Palmridge Magistrates court
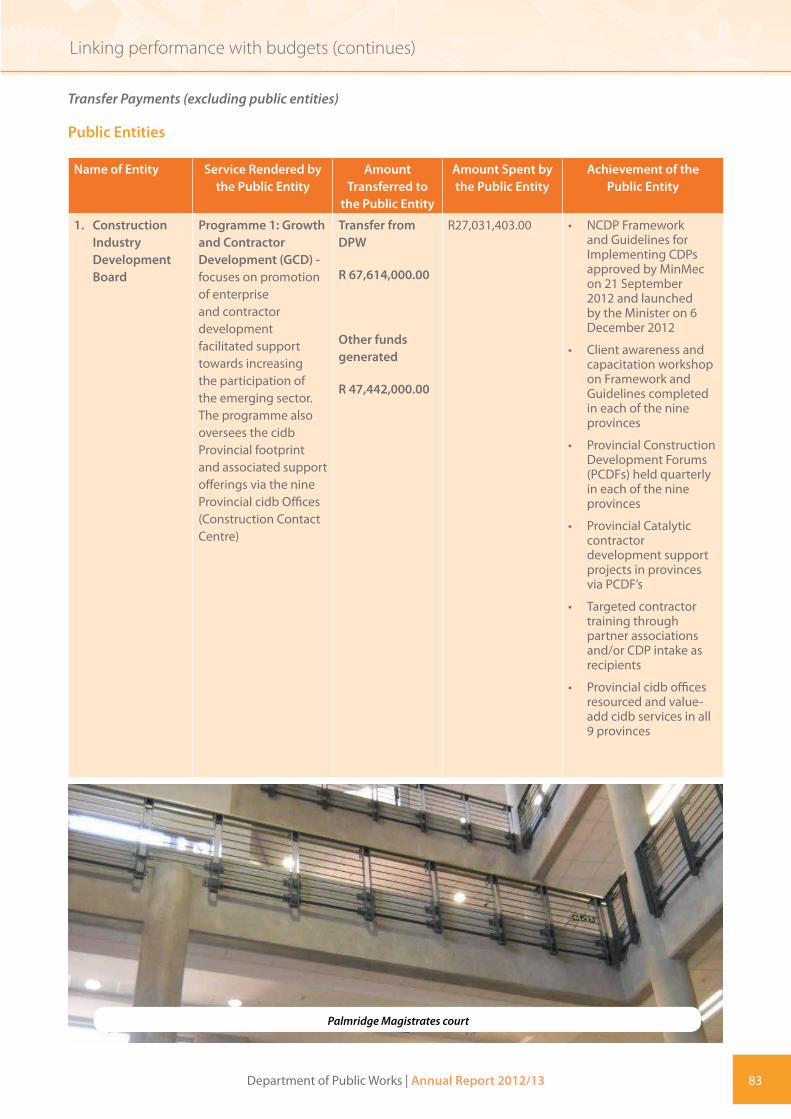
Department of Public Works | Annual Report 2012/13 83
Linking performance with budgets (continues)
Transfer Payments (excluding public entities)
Public Entities
Name of Entity Service Rendered by the Public Entity
Amount Transferred to
the Public Entity
Amount Spent by the Public Entity
Achievement of the Public Entity
1. Construction Industry Development Board
Programme 1: Growth and Contractor Development (GCD) - focuses on promotion of enterprise and contractor development facilitated support towards increasing the participation of the emerging sector. The programme also oversees the cidb Provincial footprint and associated support offerings via the nine Provincial cidb Offices (Construction Contact Centre)
Transfer from DPW
R 67,614,000.00
Other funds generated
R 47,442,000.00
R27,031,403.00 • NCDP Framework and Guidelines for Implementing CDPs approved by MinMec on 21 September 2012 and launched by the Minister on 6 December 2012
• Client awareness and capacitation workshop on Framework and Guidelines completed in each of the nine provinces
• Provincial Construction Development Forums (PCDFs) held quarterly in each of the nine provinces
• Provincial Catalytic contractor development support projects in provinces via PCDF’s
• Targeted contractor training through partner associations and/or CDP intake as recipients
• Provincial cidb offices resourced and value-add cidb services in all 9 provinces
Palmridge Magistrates court

84 Department of Public Works | Annual Report 2012/13
Linking performance with budgets (continues)
Name of Entity Service Rendered by the Public Entity
Amount Transferred to
the Public Entity
Amount Spent by the Public Entity
Achievement of the Public Entity
Programme 2: Construction Industry Performance - focuses on improved performance and best practice for an industry that delivers reliable value to clients, investors and end-users, information on construction industry indicators to inform cidb strategy, policy makers and stakeholders.
R 8,719,249.00 • Standard for Indirect Targeting for Enterprise Development published in the Gazette on 25 February 2013, which establishes an enterprise development contract participation goal (CPG).
• Standard for Contractor Performance Reports for Grades 2 to 9 gazetted for public comment on 25 February 2013, which provides for a uniform and consistent method of assessment of performance of contractor with respect to time, cost, quality, health and safety safety, site conditions and and management of subcontractors.
• Report on the State of Sub-Contracting published in March 2013 with the the primary objective to better understand skills development within the subcontracting sector – and to identify opportunities for improving skills development within this sector.
• Construction Industry Indicators (CIIs) published, monitoring perceptions of clients, professionals and contractors on procurement and construction factors, including construction quality, defects, delayed payments, etc.
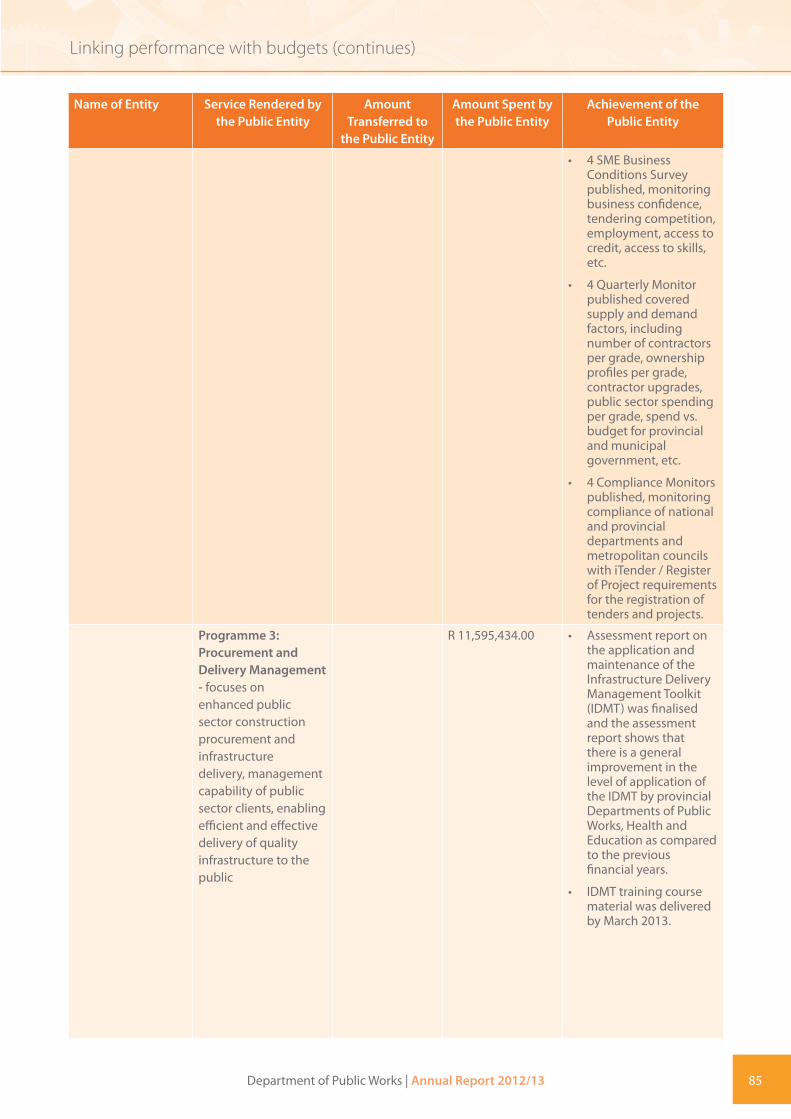
Department of Public Works | Annual Report 2012/13 85
Linking performance with budgets (continues)
Name of Entity Service Rendered by the Public Entity
Amount Transferred to
the Public Entity
Amount Spent by the Public Entity
Achievement of the Public Entity
• 4 SME Business Conditions Survey published, monitoring business confidence, tendering competition, employment, access to credit, access to skills, etc.
• 4 Quarterly Monitor published covered supply and demand factors, including number of contractors per grade, ownership profiles per grade, contractor upgrades, public sector spending per grade, spend vs. budget for provincial and municipal government, etc.
• 4 Compliance Monitors published, monitoring compliance of national and provincial departments and metropolitan councils with iTender / Register of Project requirements for the registration of tenders and projects.
Programme 3: Procurement and Delivery Management - focuses on enhanced public sector construction procurement and infrastructure delivery, management capability of public sector clients, enabling efficient and effective delivery of quality infrastructure to the public
R 11,595,434.00 • Assessment report on the application and maintenance of the Infrastructure Delivery Management Toolkit (IDMT) was finalised and the assessment report shows that there is a general improvement in the level of application of the IDMT by provincial Departments of Public Works, Health and Education as compared to the previous financial years.
• IDMT training course material was delivered by March 2013.

86 Department of Public Works | Annual Report 2012/13
Linking performance with budgets (continues)
Name of Entity Service Rendered by the Public Entity
Amount Transferred to
the Public Entity
Amount Spent by the Public Entity
Achievement of the Public Entity
Programme 4: Construction Registers Service focuses on:
Registration of Contractors (ROC) for application in public sector construction work projects, and ROP which provides information on the nature, value and distribution of construction projects nationally
Implementation of regulations to align the Construction Registers Service with developments in the construction industry, ensuring that the Register is maintained as a macro risk management tool for the public sector, while taking into account the state of development of the emerging sector.
R 21,340.206 • New Customer Relationship Management (CRM) System was implemented in August 2012 in order to provide an improved service to stakeholders. The system was stabilised in February 2013 and provides for improved registration services provincially.
• Regulation amendments designed to improve the requirements for registration was published for public comment in October 2012
Minister Thulas Nxesi opens Setumo Secondary School in Stella North West province
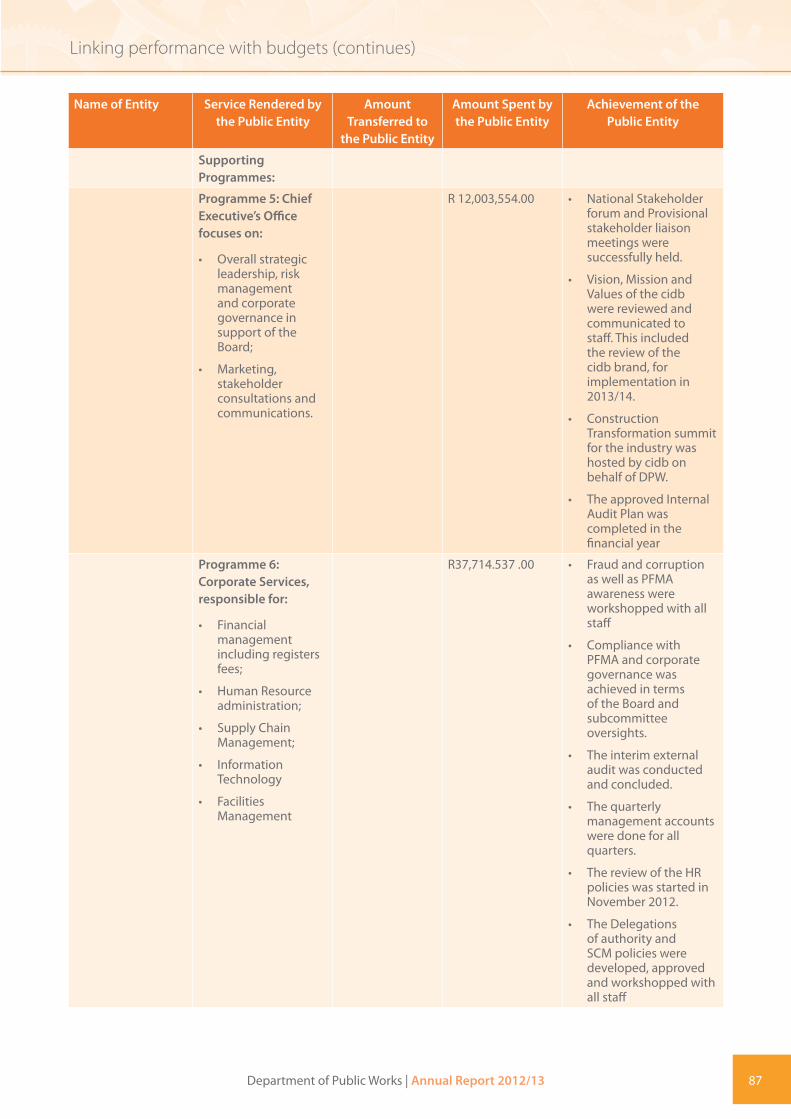
Department of Public Works | Annual Report 2012/13 87
Linking performance with budgets (continues)
Name of Entity Service Rendered by the Public Entity
Amount Transferred to
the Public Entity
Amount Spent by the Public Entity
Achievement of the Public Entity
Supporting Programmes:
Programme 5: Chief Executive’s Office focuses on:
• Overall strategic leadership, risk management and corporate governance in support of the Board;
• Marketing, stakeholder consultations and communications.
R 12,003,554.00 • National Stakeholder forum and Provisional stakeholder liaison meetings were successfully held.
• Vision, Mission and Values of the cidb were reviewed and communicated to staff. This included the review of the cidb brand, for implementation in 2013/14.
• Construction Transformation summit for the industry was hosted by cidb on behalf of DPW.
• The approved Internal Audit Plan was completed in the financial year
Programme 6: Corporate Services, responsible for:
• Financial management including registers fees;
• Human Resource administration;
• Supply Chain Management;
• Information Technology
• Facilities Management
R37,714.537 .00 • Fraud and corruption as well as PFMA awareness were workshopped with all staff
• Compliance with PFMA and corporate governance was achieved in terms of the Board and subcommittee oversights.
• The interim external audit was conducted and concluded.
• The quarterly management accounts were done for all quarters.
• The review of the HR policies was started in November 2012.
• The Delegations of authority and SCM policies were developed, approved and workshopped with all staff

88 Department of Public Works | Annual Report 2012/13
Linking performance with budgets (continues)
Name of Entity Service Rendered by the Public Entity
Amount Transferred to
the Public Entity
Amount Spent by the Public Entity
Achievement of the Public Entity
• The vacant positions of key personnel within Corporate Services were filled: viz. CFO, HR Manager and SCM Manager.
• The servers for IT were upgraded nationally.
• The IT equipment was upgraded.
• A division for Facilities Management was established.
• The tender to upgrade the network infrastructure nationally, was finalised.
• The tender to review, upgrade and centralise the management of automation facilities: printing, faxes etc. was finalised.
Name of Public Entity
Services rendered by the public entity
Amount transferred to the public entity
Amount spent by the public entity
Achievements of the public entity
Agrément South Africa
Undertaking technical assessments of innovative construction technologies
The amount for the annual grant was R8 686 842 for the 2012/2013 financial year.
The total annual expenditure from the annual grant was R8 686 842 for the 2012/2013 financial year.
Agrément South Africa received a total of 33 applications for technical assessments in accordance with Agrément South Africa assessment criteria. Of these, a total of 30 contract offers for assessment for fitness for purpose were submitted to the applicants.
During the year under review a record number of 31 product assessments were finalised and successfully awarded Agrément certificates of fitness for purpose by the Board of Agrément South Africa.
An Agrément certificate has a deemed to satisfy status in the national building regulations and can be used to show compliance therewith, thus allowing the benefits of innovation to be used in the construction industry.
The technical assessments provide a technical conduit for the safe introduction of new and improved standardised building materials which leads to improvements in performance of the construction industry.

Department of Public Works | Annual Report 2012/13 89
Linking performance with budgets (continues)
Name of Public Entity
Services Rendered by Public Entity
Amount Transferred to Entity
Amount Spent by Public Entity
Achievements of the Public Entity
Independent Development Trust
Programme Management on behalf of national and provincial government departments
R50.8 million R50.8 million The IDT was not given a 2012/13 baseline allocation, the R50.8m allocation was used to fund operational costs to deliver programmes to the value of R5.6 billion
R 190.5 m (51%) of the IDT’s budget was expended on Strategic Objective 1.2 focusing on Integrated Social Infrastructure Delivery. The R50.8m allocation constitutes 26.7% of these operational costs.
Key development performance indicators arising from this R5.6 billion programme spend include:
• 34 354: No. of Jobs created
• 95% of the programme spend was directed at the delivery of social infrastructure
• 259 social infrastructure facilities completed and handed over. Facilities included schools, clinics and multi-purpose centres.
65% (R3.696bn): Programme spend was delivered by BBBEE contractors,
31% (R1. 737m): Approximate value of contracts awarded to women-owned contractors
11.8% (R 667.57m): Approximate value of Youth spend
104: No. of Contractor Development Programme participants of which xx are women

90 Department of Public Works | Annual Report 2012/13
Linking performance with budgets (continues)
Name of Public Entity
Services rendered by public entity
Amount transferred to entity
Amount spent by public entity
Achievements of the public entity
Council for Built Environment
• Skills Development
• Research
• Public protection
R 28 146 000 R 28 146 000 Entity budget is augmented through other income such as levies from the professional council as well as interest on investment made.
33 students from previously disadvantaged backgrounds received CBE financial assistance through the bursary scheme
Framework developed on Structured Candidacy Programme
Research report on the state of the built environment professions completed.
Technical built environment skills capacity conducted in the following municipalities:
Tshwane, Johannesburg, Bojanala (Rustenburg), Mudiri (Mafikeng), Capricorn (Limpopo), Thabo Mafutsanyana (Free State), City of Cape Town and Winelands, King Dalintjebo (Eastern Cape), Ethekwini (Durban), Zululand (Ulundi), Francis Baard (Northern Cape), Pixley Kaseme (De Aar)
Built Environment Indaba hosted in March 2013
Completed 8 of 9 Engineering scopes of Identification of Work (IDoW) – which ring fences work that can only be undertaken by registered persons
Conditional Grants and earmarked funds paid
Conditional Grants and earmarked funds received
There were no conditional grants or earmarked funds received
Donor Funds
There were no donor fund received by the Department

Department of Public Works | Annual Report 2012/13 91
Linking performance with budgets (continues)
Capital investment, maintenance and asset management plan
(a) The current state of the Department’s capital stock, for example what percentage is in good, fair or bad condition
Department
Condition of State-owned Buildings
Total(Number and Percentage)
Very Good Good Fair Poor Very Poor
C5 C4 C3 C2 C1
Defence 1 0% 126 4% 2332 83% 335 12% 28 1% 2822 100%
Correctional Services
1 1% 11 6% 153 81% 20 11% 5 3% 190100%
Justice 3 0% 103 14% 580 79% 35 5% 9 1% 730 100%
Other Clients Combined
34 4% 116 14% 631 73% 70 8% 8 1% 859100%
SAPS 43 3% 145 10% 1014 70% 232 16% 14 1% 1448 100%
Unutilised 0 0% 0 0% 0 0% 0 0% 133 100% 133 100%
TOTALS 82 1% 501 8% 4710 76% 692 11% 197 3% 6182 100%
• The table above represents the number of buildings in the DPW portfolio for which high-level condition assessments were concluded in the year under review.
• Justice portfolio excludes condition ratings for all residential accommodation as the audit is on-going.
• SAPS portfolio includes condition ratings for devolved police stations.
• The number of properties under Defence is derived from the User Asset Management Plan (UAMP) 2012-2015 and it includes residential units within complexes.
• Unutilised buildings comprise of offices only and reported at complex level.
• DCS portfolio excludes condition rating for residential units both within and outside complexes.
Saldana Bay

CHAPTER 3Governance

94 Department of Public Works | Annual Report 2012/13
Governance
3.1 Introduction Good governance is essential for growth and development. When the principles of good governance are applied, it makes it possible for Departments to grow, improve their human capital, welfare, business efficiency, and ensure political stability, capacity and responsibility towards achieving the developmental goals and broader government priorities over a period of time. The Department commits to maintain the highest standards of governance.
3.1.1 Risk Management
Nature of risk management
The risk management process of the Department is structured and guided by an approved Risk Management Policy that is supported by a Risk Management Strategy. The Department established a Risk Management Committee (RMC) that convenes quarterly to look at the Department’s critical risks, emerging risks and advises the Accounting Officer. In the financial year ending 31st March 2013, the RMC met six times.
Risk management strategies to identify and manage the risks
During the fiscal year under review, the Department developed high level risks and separate risk registers for Head office and 11 regional offices with action plans. The Office of the Auditor General, Internal Audit and Investigations played a key role in risk management. Risks were monitored by requesting quarterly reports from the action owners and workshops/ meetings were held with regional offices to evaluate the implementation of the plans.
Progress in addressing risks identified
Whilst the Department managed to monitor the implementation of action plans, the following challenges still have to be addressed to ensure that risks identified are managed and mitigated to be within an acceptable level:
• No link between key strategic projects and the risks facing the Department
• Setting risk appetite and tolerance levels to guide the prioritisation of risks
• Review of key risks during the strategic planning sessions and incorporating risk management activities (including management actions) into the business plans
• Inclusion of risk management into the performance agreements of the heads of units and other personnel within the Department
• Costing of risk management controls and action plans for key strategic risks to guide the prioritisation of the management of key risks facing the Department
• Adequacy of risk management structure/capacity to optimally service the Department
3.1.2 Fraud and Corruption
The Department’s Fraud Prevention Plan and its implementation
The Department developed a Fraud Prevention Plan (FPP) as required by the PFMA to ensure that it is able to respond to issues related to fraud and corruption. The Strategy recognises basic fraud and corruption prevention measures, that are already in place within DPW. Furthermore, it identifies fraud and corruption risks that must be addressed and which could jeopardise the successful implementation of the Fraud Prevention Strategy, and the achievement of the DPW goals.
Fraud Awareness Campaigns
The Department conducts on-going training with the officials and induction programmes are held for the new appointees to familarise themselves with the elements of fraud and corruption within their area of responsibility and for detection and prevention purposes.

Department of Public Works | Annual Report 2012/13 95
Governance (continued)
Investigations
The Directorate Fraud Awareness and Investigation conducts investigations on reported cases of fraud and corruption. Capacity is enhanced through the appointment of three services providers. The Unit is in the process of appointing a panel of service providers for a period of 24 months to capacitate the Unit by assisting in conducting investigations as and when cases are reported.
Mechanisms todisclose confidentially and report fraud and corruption
The Department promotes the utilisation of the National Anti-Corruption Hotline to stakeholders to report allegations of fraud and corruption anonymously. The DPW web portal also makes provision for reporting to the Minister, Deputy Minister and Director General through the “Talk to Minister“, “Talk to Deputy Minister” and “Talk to DG”. Furthermore, all stakeholders are also encouraged to report fraudulent activities to either the Chief Audit Executive (CAE) or Director of Fraud Awareness and Investigations.
Reporting fraud and taking action
All reported allegations of fraud and corruption are recorded on the allegations register maintained within Internal Audit and Investigations Unit and allocated a reference number for tracking purposes. This register is updated on a regular basis to track progress with regard to the status of the reported allegations.
Upon completion of an investigation, the Unit provides an investigation report to the Accounting Officer and relevant Senior Management to consider and implement corrective actions i.e. criminal, civil and/or disciplinary action against identified transgressors.
3.1.3 Minimising Conflict of Interest
Conflict of Interest
A conflict of interest is considered if a SCM practitioner or other role player, or any close family member, partner or associate of such official or other role player;
• Has any private or business interest in any contract that is to be awarded
• Conducts activities that could reflect negatively on the reputation of the DPW and its personnel
• Participates in any activity that might lead to the disclosure of DPW proprietary information
• Conducts outside work for suppliers
The affected official or role player must:
• Disclose the interest to the Head of the unit
• Withdraw completely from participating in the process relating to the contract or bid
Breaches
Employees and agents of DPW shall report to the Accounting Officer any alleged irregular conduct that they may become aware of, including any alleged fraud or corruption.

96 Department of Public Works | Annual Report 2012/13
Governance (continued)
3.1.4 Code of Conduct
All officials and other role players involved in the SCM processes, must adhere to the National Treasury’s Code of Conduct for Supply Chain Management Practitioners and the Policy Strategy to guide uniformity in Procurement reform processes in Government, as well as directives regarding the code of conduct for SCM Practitioners. In addition, the cidb Code of Conduct for the parties engaged in Construction Procurement requires that the parties in any public or private construction-related procurement, in their dealings with each other:
• Behave equitably, honestly and transparently.
• Discharge duties and obligations timeously and with integrity.
• Comply with all applicable legislation and associated regulations.
• Satisfy all relevant requirements established in the procurement documents.
• Avoid conflicts of interest.
• Not maliciously or recklessly injure or attempt to injure the reputation of another party.
Reports on any perceived breaches or transgressions to the applicable code of conduct will be reported by the Accounting Officer to the applicable authority. These aspects of the code of conduct must be adhered to by all stakeholders within the SCM processes.
3.1.5 Health Safety and Environmental Issues
Section 8 of the Occupational Health and Safety Act 85 of 1993 (OHSA) requires that every employer “shall provide and maintain, as far as is reasonably practicable, a working environment that is safe and without risk to the health of his employees.” This refers in particular to:
• Taking such steps to eliminate or mitigate any potential hazard.
• Ensuring adherence to the requirements of the OHSA.
• Taking all necessary measures in the interest of health and safety.
The Department conducted inspections in various workplaces, including projects that were under construction to ensure compliance of OHSA. Regular Training was provided to departmental officials alerting them to the hazards that existed in the workplace.

Department of Public Works | Annual Report 2012/13 97
Audit Committee Report
1. Report of the audit and risk management committee for the year ended 31 March 2013
We are pleased to present our report for the financial year ended 31 March 2013.
2. Audit and Risk Management Committee Members and Attendance
In the course of the year under review, the term of the preceding Audit and Risk Management Committee (the Audit Committee or the Committee) expired and accordingly, the Department duly appointed a new Audit Committee. Our reporting under this sub-section therefore, reflects this transition.
The Audit Committee’s terms of reference (the audit charter) provide for the Committee to meet at least four times in a financial year. During the year under review, meetings were held as follows:
2.1 The Outgoing Audit Committee:
The Outgoing Audit Committee covering the period 01 April 2012 to 30 September 2012 held three meetings. Attendance at these meetings was as follows:
No of members Name of member Number of meetings attended
1. Ms V. Zitumane - Chairperson 3
2. Ms V.F. Memani-Sedile 0
3. Advocate O.C. Mabaso 1
4. Commissioner B. Seruwe 1
5. Ms N. Noxaka 3
2.2 The Incoming Audit Committee:
The Incoming Audit Committee covering the period 01 October 2012 – 31 March 2013 held two meetings during the year. Attendance at these meetings was as follows:
No of members Name of member Number of meetings attended
1. Z Luswazi - Chairperson 2
2. Ms N Singh 2
3. C Bunting 2
4. M Ramurunzi 2
3. Audit Committee ResponsibilityThe Audit Committee has complied with Section 38(1) (a) of the Public Finance Management Act, Act 1 of 1999 (the PFMA) and Treasury Regulation 3.1 in that the Department has and maintains a system of Internal Audit under the control and direction of the Audit Committee complying with and operating in accordance with regulations and instructions prescribed by the PFMA.
The Audit Committee has formally adopted an audit charter, reflective of the terms of reference under which the Committee operates.
The Audit Committee further reports that it has complied with the spirit and the letter of the said audit charter.

98 Department of Public Works | Annual Report 2012/13
Audit Committee Report (continued)
4. Effectiveness of Internal Control4.1 Efficiency and effectiveness of the system of internal control
The system of internal control at the Department and at the Property Management Trading Entity (the PMTE) is not considered to be efficient nor effective. The Auditor General has raised a number of issues with respect to the system of internal control. Similarly during the year under review, the Internal Audit Unit presented reports articulating similar governance concerns. As a result, the Department’s audit report was qualified due to the state of its Supply Chain Management Function. The Auditor General’s audit report further highlighted internal control concerns on the system responsible for the safeguarding and maintenance of assets.
At the PMTE, the Auditor General raised similar Supply Chain Management issues that directly affected Irregular Expenditure and Fruitless and Wasteful Expenditure. Revenue completeness controls affecting both revenue and trade debtors; accounting and internal control systems affecting operating leases and associated liabilities were also reported as pervasive issues. The same applied to retention liabilities. All the foregoing PMTE issues led to the disclaimer of audit opinion in the year under review. The foregoing clearly indicates that in the 2013/14 financial year these areas have to be prioritised, this to ensure a visibly improved internal control environment.
4.2 Risk Management its effectiveness, efficiency and transparency
The Risk Management function at the Department and at the PMTE (collectively referred to as the institution) remains an area of concern. While there is an active Risk Management Function at the institution, significant work remains to be done in terms of crystallizing the Risk Management Function to exist at operational level impacting the day-to-day operational and management activities of both the Department and the PMTE. Equally, the quality of Risk Assessment as a technical discipline (in terms of identifying all the core risk areas) needs equally significant improvement.
4.3 Annual Financial Statements
The Department and the PMTE made significant improvements in enhancing the quality of the financial statements in relation to prior years. The qualified report versus the historical disclaimers for the Department reflects this. Notwithstanding the disclaimer of opinion on the PMTE financial statements, Management embarked on an ambitious plan to implement GRAP on the PMTE financial statements for the first time. The Audit Committee is of the view that a foundation has been laid in respect of both the Department and the Entity whereby the quality and the content of future financial statements will be improved as a result of the foundational work done in the current reporting period.
4.4 Management report of the Auditor General
There has been robust interaction between the Auditor General and Management. The Management Report and equally the Audit Report are reflective of factual findings that Management supports. Currently underway right through to the compilation and submission of the 2013/14 annual financial statements is a comprehensive Audit Action Plan to address issues raised by the Auditor General.
4.5 Quality of in year management and monthly / quarterly reports submitted in terms of the PFMA and the Division of Revenue Act
In the year under review, there was no compliance in the sense of compiling qualitative, accurate and informative management accounts. Under item 5 below, we revisit this aspect. Going forward, the Audit Committee has recommended compilation of quarterly financial statements (to comply with the annual reporting standard i.e. Modified Cash Basis and GRAP applicable to the Department and the PMTE respectively) to be presented at future Audit Committee meetings. Management has agreed to this recommendation and the implementation is underway.
5. Evaluation of financial statementsAs mentioned in item 4 above, significant progress was made in the current year to compile credible financial statements. Comparatively speaking, the disclaimer of opinion on the PMTE financial statements is on a significantly less number of
Department of Public Works | Annual Report 2012/13 99
Audit Committee Report (continued)
issues than was the case in the 2011/12 audit. The Audit Committee’s evaluation of the financial statements therefore is that they are reflective of a reliable base upon which both the Department and the PMTE can build on for the 2013/14 financial year and beyond.
The Committee agrees with the Auditor General’s findings and the resultant audit opinions in respect of both sets of financial statements. As mentioned already, these findings are reflective of established facts that Management objectively supports.
The PMTE changed its accounting policies by implementing GRAP changing from SA GAAP. This resulted in a number of prior period adjustments as well as reclassification of comparative figures.
There are a number of areas and instances where the Department and the PMTE did not comply with specific provisions of the PFMA and Treasury Regulations. Both audit reports have articulated these non-compliances.
The quality of Performance Information reported during the year was unsatisfactory and noted as an area of improvement. The Audit Committee has been making continuous recommendations in this regard for the improvement of Performance Information, starting with how the performance targets are set and documented, to how performance against these targets is measured, monitored and reported upon. .
There were significant adjustments on the financial statements of both the Department and the PMTE. These major audit adjustments were audited and approved by the Auditor General; presented to the Audit Committee and duly approved.
6. Internal AuditIn the year under review, the Internal Audit Unit has not been as effective as it should have been. This is primarily due to three factors. Firstly, that the Unit has been and continues to be short-staffed for quite a lengthy period extending to preceding financial years. Secondly, that notwithstanding being ordinarily short-staffed, the Unit has had to provide a Secretariat Support Responsibility to the Audit Committee thereby further depleting the already depleted resources. Thirdly that the Unit needs to overhaul its own internal processes that unnecessarily lead to bottlenecks, inefficiencies and a general compromise of the quality of output from the Unit.
Management will support speedy recruitment of human resources. It will also effect the necessary budgetary adjustments to avoid unauthorised expenditure. The Audit Committee will continuously provide an effective quality assurance and continuous improvement role on the work of Internal Audit. Furthermore, a five year review of the Internal Audit is imminent and that this imminent review follows a similar review by National Treasury, in terms of which the Unit is currently implementing the latter’s (National Treasury’s) recommendations.
7. Auditor General South AfricaNo unresolved issues with respect to the audit have been brought to the attention of the Audit Committee; accordingly the Committee is not aware of any unresolved audit issues in respect of the year under review.
8. Turnaround Strategy to Clean AuditSubsequent to the financial year end, the Audit Committee spent time reviewing progress on the turnaround strategy for clean audit. The Committee remains concerned with the pace, overall project management, expected deliverables and the cost of the project. The Committee received assurance from the Accounting Officer of closer monitoring of the project management aspects of the project.
9. Overall observation Amongst the biggest challenges facing the Department and the PMTE is a lack of capacity in terms of the requisite number of personnel firstly within the Finance Department and secondly, generally within the rest of the Department and the PMTE Management structures. The second aspect of inadequate capacity relates to the desperate shortage of

100 Department of Public Works | Annual Report 2012/13
Audit Committee Report (continued)
the required accounting and financial management skills on the existing personnel. This is the core reason behind the engagement of the Turnaround Team (Operation Clean Audit) as the Department and the PMTE do not have adequate capacity or skill to achieve the turnaround. On the positive side however, we report that towards the end of the financial year, senior permanent leadership such as a permanent Director General and a Chief Financial Officer have been engaged. This is bringing about stability in the Department and the PMTE and creates a realistic environment for a sustainable turnaround.
The second core challenge ahead of the Department and the PMTE (collectively referred to as the institution) is that the institution as a whole is not properly structured to enable it to successfully fulfil or execute its core business and mandate. In simple terms, the institution’s core business is property management with a hardcore engineering base. The challenge therefore is to restructure the institution and do this at pace.
Thirdly and lastly, the process of engaging new personnel at the institution is prohibitively long and immeasurably costly when measured (the cost that is) in terms of the impact that the absence of the required skills has on the business of the institution. This area requires its own turnaround intervention.
The Operation Clean Audit has made a positive impact on the current year audit results of the institution, the challenge now is to sustain the work done while improving on the institution’s audit opinion in the 2013/14 financial year.
Finally, effective management of various teams of consultants assisting with the turnaround initiative is of critical essence to ensure delivery on the mandate and value for money for the institution.
The Audit Committee’s overall assessment is that progress is being made, however the issues articulated in this report require attention to ensure a sustainable turnaround of the institiution.
Z Luswazi CA(SA)
Chairperson
Audit and Risk Management Committee
31 March 2013

CHAPTER 4Human Resource Management

102 Department of Public Works | Annual Report 2012/13
4.1 Personnel Related Expenditure The following tables summarise the final audited personnel related expenditure by programme and by salary bands. In particular, they indicate the following:
• Amount spent on personnel
• Amount spent on salaries, overtime, homeowner’s allowances and medical aid.
Table 4.1.1 Personnel expenditure by programme
Programme Total Voted Expenditure (R’000)
Compensation of Employees Expenditure (R’000)
Training Expenditure (R’000)
Compensation of Employees as % of Total Expenditure
Average Compensation of Cost per Employee (R’000)
Administration 862 492 218 979 3 727 25.39 371
Immovable Asset Management 4 683 990 1 046 755 3 142 22.35 226
Expanded Public Works Programme
1 708 612 100 901 2 779 5.91 410
Property and Construction Industry Policy
26 858 7 916 4 29.47 466
Auxiliary and Associates Services 53 330 0 0 0.00 0.00
Total 7 335 282 1 374 551 9652 18.74 1472
Table 4.1.2 Personnel costs by salary band
Salary Bands Compensation of Employees Cost (R’000)
Percentage of Total Personnel Cost for Department
Average Compensation Cost per Employee (R’000)
Number of Employees
Lower skilled (Levels 1-2) 125 265 9.11 111 1 125
Skilled (Levels 3-5) 177 571 12.92 135 1 313
Highly skilled production (Levels 6-8) 326 363 23.74 248 1 317
Highly skilled supervision (Levels 9-12) 507 061 36.89 480 1 057
Senior management (Levels 13-16) 123 213 8.96 811 152
Contract (Levels 1-2) 22 724 1.65 85 266
Contract (Levels 3-5) 8 830 0.64 210 42
Contract (Levels 6-8) 33 957 2.47 233 146
Contract (Levels 9-12) 29 025 2.11 492 59
Contract (Levels 13-16) 12 208 0.89 718 17
Periodical Remuneration 6 720 0.49 3 2 212
Abnormal Appointment 1 614 0.12 16 104
TOTAL 1 374 551 100 176 7810

Department of Public Works | Annual Report 2012/13 103
Personnel Related Expenditure (continued)Ta
ble
4.1.
3 Sa
lari
es, O
vert
ime,
Hom
e O
wne
rs A
llow
ance
and
Med
ical
Aid
by
prog
ram
me
Prog
ram
me
Sala
ries
(R
’000
)Sa
lari
es
as %
of
Pers
onne
l Co
st
Ove
rtim
e (R
’000
)O
vert
ime
as %
of
Pers
onne
l Co
st
HO
A
(R’0
00)
HO
A
as %
of
Pers
onne
l Co
st
Med
ical
A
ss. (
R’00
0)M
edic
al
Ass
. as
% o
f Pe
rson
nel
Cost
Tota
l Pe
rson
nel
Cost
per
Pr
ogra
mm
e (R
’000
)
Prog
ram
me
1: A
dmin
istr
atio
n 16
7 53
976
.51
915
0.9
8 25
63.
87
750
3.5
218
979
Prog
ram
me
2: Im
mov
able
Ass
et
Man
agem
ent
790
191
75.5
7 96
30.
847
035
4.5
58 6
415.
61
046
755
Prog
ram
me
3: E
xpan
ded
Publ
ic W
orks
Pr
ogra
mm
e 76
415
75.7
50
3 22
13.
23
013
310
0 90
1
Prog
ram
me
4: P
rope
rty
&
Cons
truc
tion
Indu
stry
Pol
icy
6 18
578
.10
015
41.
919
72.
57
916
TOTA
L1
040
330
75.7
9 88
30.
758
666
4.3
69 6
015.
11
374
551
Tabl
e 4.
1.4
Sala
ries
, Ove
rtim
e, H
ome
Ow
ners
Allo
wan
ce a
nd M
edic
al A
id b
y sa
lary
ban
d
Sala
ry b
ands
Sala
ries
(R
’000
)Sa
lari
es
as %
of
Pers
onne
l Co
st
Ove
rtim
e (R
’000
)O
vert
ime
as %
of
Pers
onne
l Co
st
HO
A (R
’000
)H
OA
as
% o
f Pe
rson
nel
Cost
Med
ical
Ass
. (R
’000
)M
edic
al
Ass
. as
% o
f Pe
rson
nel
Cost
Tota
l Pe
rson
nel
Cost
per
Sa
lary
Ban
d (R
’000
)
Low
er s
kille
d (L
evel
s 1-
2)
81
467
65 5
89
0.5
11
659
9.3
14
768
11.8
125
265
Sk
illed
(Lev
els
3-5)
1
17 4
71
66.2
4 6
03
2.6
13
762
7.8
15
335
8.6
177
571
H
ighl
y sk
illed
pro
duct
ion
(Lev
els
6-8)
2
38 5
59
73.1
3 1
26
1 1
3 30
5 4.
1 2
0 94
8 6.
4 3
26 3
63
Hig
hly
skill
ed s
uper
visi
on (L
evel
s 9-
12)
397
592
78
.4 1
311
0.
3 1
2 73
5 2.
5 1
5 95
7 3.
1 5
07 0
61
Seni
or m
anag
emen
t (Le
vels
13-
16)
100
448
81
.5 5
0
6 3
71
5.2
2 2
55
1.8
123
213
Co
ntra
ct (L
evel
s 1-
2)
23
080
101.
6 2
0
00
0 0
22
724
Cont
ract
(Lev
els
3-5)
8
960
10
1.5
15
0.2
00
0 0
8 8
30
Cont
ract
(Lev
els
6-8)
3
4 28
1 10
1 2
32
0.7
00
19
0.1
33
957
Cont
ract
(Lev
els
9-12
) 2
8 23
4 97
.3 1
0
207
0.
7 1
53
0.5
29
025
Cont
ract
(Lev
els
13-1
6)
10
238
83.9
0 0
627
5.
1 1
68
1.4
12
208
Perio
dica
l Rem
uner
atio
n 0
0 0
0
0
0 0
0
6 7
20
Abn
orm
al A
ppoi
ntm
ent
00
0 0
00
0 0
1 6
14
Tota
l1
040
330
75.7
988
4 0.
7 5
8 66
6 4.
3 6
9 60
3 5.
1 1
374
551

104 Department of Public Works | Annual Report 2012/13
4.2. Employment and Vacancies The tables in this section summarise the position with regard to employment and vacancies, the number of posts on the establishment, the number of employees, the vacancy rate, and whether there is any staff that is additional to the establishment. This information is presented in terms of three key variables:
• Programme
• Salary band
• Critical occupations
Table 4.2.1 Employment and vacancies by programme
Programme Number of Posts
Number of Posts
Filled
Vacancy Rate as
a %
Number of Posts Filled
Additional to the Establishment
Programme 1 DPW Administration 728 591 18.8 21
Programme 2 DPW Immovable asset management 5654 4640 17.9 299
Programme 3 DPW Expanded public works programme
298 246 17.4 28
Programme 4 DPW Property and Construction industry policy regulation
25 17 32 2
TOTAL 6705 5494 18.1 350
Table 4.2.2 Employment and vacancies by salary band
Salary Band Number of Posts
Number of Posts Filled
Vacancy Rate Number of Posts Filled Additional to the Establishment
Lower skilled (Levels 1-2), Permanent 1419 1127 20.6 2
Skilled (Levels 3-5), Permanent 1515 1312 13.4 0
Highly skilled production (Levels 6-8), Permanent
1667 1317 21 0
Highly skilled supervision (Levels 9-12), Permanent
1384 1057 23.6 3
Senior management (Levels 13-16), Permanent
190 151 20.5 2
Contract (Levels 1-2), Permanent 266 266 0 187
Contract (Levels 3-5), Permanent 42 42 0 16
Contract (Levels 6-8), Permanent 146 146 0 100
Contract (Levels 9-12), Permanent 59 59 0 38
Contract (Levels 13-16), Permanent 17 17 0 2
TOTAL 6705 5494 18.1 350
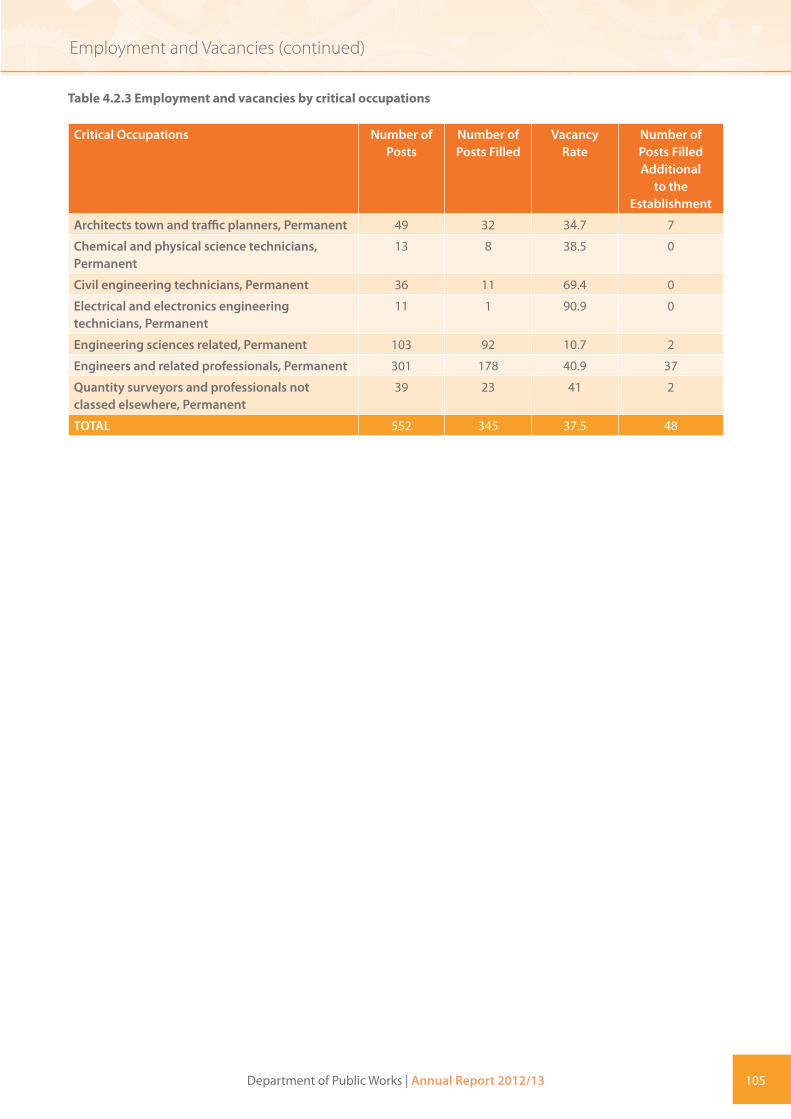
Department of Public Works | Annual Report 2012/13 105
Employment and Vacancies (continued)
Table 4.2.3 Employment and vacancies by critical occupations
Critical Occupations Number of Posts
Number of Posts Filled
Vacancy Rate
Number of Posts Filled Additional
to the Establishment
Architects town and traffic planners, Permanent 49 32 34.7 7
Chemical and physical science technicians, Permanent
13 8 38.5 0
Civil engineering technicians, Permanent 36 11 69.4 0
Electrical and electronics engineering technicians, Permanent
11 1 90.9 0
Engineering sciences related, Permanent 103 92 10.7 2
Engineers and related professionals, Permanent 301 178 40.9 37
Quantity surveyors and professionals not classed elsewhere, Permanent
39 23 41 2
TOTAL 552 345 37.5 48
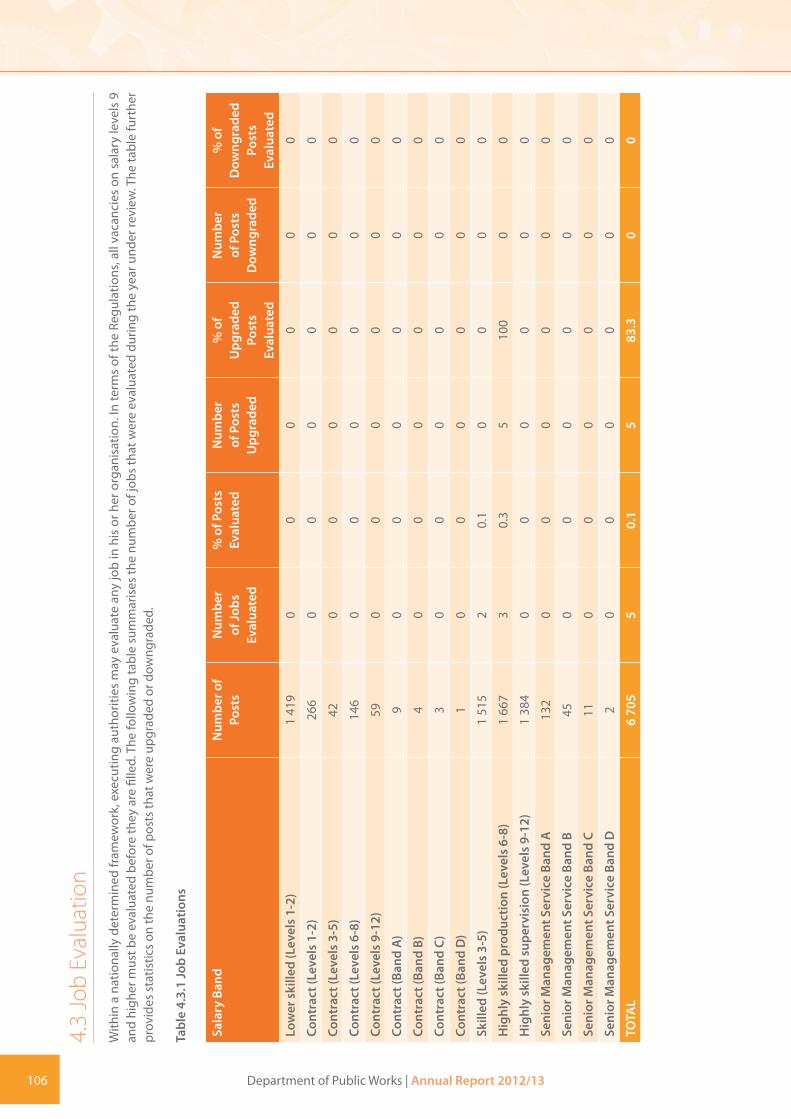
106 Department of Public Works | Annual Report 2012/13
4.3
Job
Eval
uatio
n W
ithin
a n
atio
nally
det
erm
ined
fram
ewor
k, e
xecu
ting
auth
oriti
es m
ay e
valu
ate
any
job
in h
is o
r her
org
anis
atio
n. In
term
s of
the
Regu
latio
ns, a
ll va
canc
ies
on s
alar
y le
vels
9
and
high
er m
ust b
e ev
alua
ted
befo
re th
ey a
re fi
lled.
The
follo
win
g ta
ble
sum
mar
ises
the
num
ber o
f job
s th
at w
ere
eval
uate
d du
ring
the
year
und
er re
view
. The
tabl
e fu
rthe
r pr
ovid
es s
tatis
tics
on th
e nu
mbe
r of p
osts
that
wer
e up
grad
ed o
r dow
ngra
ded.
Tabl
e 4.
3.1
Job
Eval
uatio
ns
Sala
ry B
and
Num
ber o
f Po
sts
Num
ber
of Jo
bs
Eval
uate
d
% o
f Pos
ts
Eval
uate
dN
umbe
r of
Pos
ts
Upg
rade
d
% o
f U
pgra
ded
Post
s Ev
alua
ted
Num
ber
of P
osts
D
owng
rade
d
% o
f D
owng
rade
d Po
sts
Eval
uate
d
Low
er s
kille
d (L
evel
s 1-
2)
1 41
90
00
00
0
Cont
ract
(Lev
els
1-2)
26
60
00
00
0
Cont
ract
(Lev
els
3-5)
42
00
00
00
Cont
ract
(Lev
els
6-8)
14
60
00
00
0
Cont
ract
(Lev
els
9-12
) 59
00
00
00
Cont
ract
(Ban
d A
) 9
00
00
00
Cont
ract
(Ban
d B)
4
00
00
00
Cont
ract
(Ban
d C)
3
00
00
00
Cont
ract
(Ban
d D
) 1
00
00
00
Skill
ed (L
evel
s 3-
5)
1 51
52
0.1
00
00
Hig
hly
skill
ed p
rodu
ctio
n (L
evel
s 6-
8)
1 66
73
0.3
510
00
0
Hig
hly
skill
ed s
uper
visi
on (L
evel
s 9-
12)
1 38
40
00
00
0
Seni
or M
anag
emen
t Ser
vice
Ban
d A
13
20
00
00
0
Seni
or M
anag
emen
t Ser
vice
Ban
d B
450
00
00
0
Seni
or M
anag
emen
t Ser
vice
Ban
d C
110
00
00
0
Seni
or M
anag
emen
t Ser
vice
Ban
d D
2
00
00
00
TOTA
L6
705
50.
15
83.3
00

Department of Public Works | Annual Report 2012/13 107
Job Evaluations (continued)
The table below provides a summary of the number of employees whose positions were upgraded due to their post being upgraded. The number of employees might differ from the number of posts upgraded since not all employees are automatically absorbed into the new posts and some of the posts upgraded may also be vacant.
Table 4.3.2 Profile of employees whose positions were upgraded due to their posts being upgraded
Beneficiaries African Asian Coloured White Total
Female 12 0 2 0 14
Male 4 0 0 0 4
Total 16 0 2 0 18
Employees with a disability 0 0 0 0 0
The table below summarises the number of cases where the remuneration bands exceeded the grade determined by the job evaluation. Reasons for the deviation are provided in each case.
Table 4.3.3 Employees with salary levels higher than those determined by job evaluation by occupation
Occupation Number of Employees
Job Evaluation
Level
Remuneration Level
Reason for Deviation
No of Employees in Department
None 0 0 0 0 0
None 0 0 0 0 0
Total 0 0 0 0 0
Percentage of total employment 0 0 0 0 0
The table below summarises the beneficiaries of the above in terms of race, gender, and disability.
Table 4.3.4 Profile of employees who have salary levels higher than those determined by job evaluation
Beneficiaries African Asian Coloured White Total
Female 0 0 0 0 0
Male 0 0 0 0 0
Total 0 0 0 0 0
Employees with a disability 0 0 0 0 0

108 Department of Public Works | Annual Report 2012/13
4.4. Employment ChangesThis section provides information on changes in employment during the financial year under review. Turnover rates provide an indication of trends in the employment profile of the Department. The tables below provide a summary of the turnover rates by salary band and critical occupations.
Table 4.4.1 Annual turnover rates by salary band
Salary Band Employment at Beginning
of Period (April 2012)
Appointments Terminations Turnover Rate
Lower skilled (Levels 1-2) 1559 135 215 13.8
Skilled (Levels 3-5) 1409 19 132 9.4
Highly skilled production (Levels 6-8) 1538 52 96 6.2
Highly skilled supervision (Levels 9-12) 1149 17 63 5.5
Senior Management Service Band A 107 3 5 4.7
Senior Management Service Band B 41 4 5 12.2
Senior Management Service Band C 8 3 2 25
Senior Management Service Band D 2 1 1 50
Total 5813 234 519 8.9
Table 4.4.2 Annual turnover rates by critical occupation
Occupation Employment at Beginning
of Period (April 2012)
Appointments Terminations Turnover Rate as a %
Architects town and traffic planners, Permanent
36 5 6 16.7
Chemical and physical science technicians, Permanent
8 1 1 12.5
Civil engineering technicians, Permanent 14 0 6 42.9
Electrical and electronics engineering technicians, Permanent
1 0 1 100
Engineers and related professionals, Permanent
186 8 39 21
Mechanical engineering technicians, Permanent
1 0 0 0
Quantity surveyors and related professionals not classed elsewhere, Permanent
29 1 0 0
TOTAL 275 15 53 19.3

Department of Public Works | Annual Report 2012/13 109
Employment Changes (continued)
Notes
The CORE classification, as prescribed by the DPSA, should be used for completion of this table.
The table below identifies the major reasons for staff leaving the Department.
Table 4.4.3 Reasons for staff leaving the Department
Termination Type Number Percentage of Total
Resignations
Percentage of Total
EmploymentDeath, Permanent 30 5.8 0.5Resignation, Permanent 127 24.5 2.2Expiry of contract, Permanent 261 50.3 4.5Discharged due to ill health, Permanent 3 0.6 0.1Dismissal-misconduct, Permanent 6 1.2 0.1Retirement, Permanent 92 17.7 1.6TOTAL 519 100 8.9Resignations as % of Employment 8.9
Table 4.4.4 Promotions by critical occupation
Occupation Employment at Beginning
of Period (April 2012)
Promotions to another
Salary Level
Salary Level Promotions
as a % of Employment
Progressions to another
Notch within Salary Level
Notch progressions
as a % of Employment
Architects town and traffic planners 36 1 2.8 12 33.3Chemical and physical science technicians
8 0 0 6 75
Civil engineering technicians 14 0 0 3 21.4Electrical and electronics engineering technicians
1 0 0 1 100
Engineers and related professionals 186 11 5.9 101 54.3Mechanical engineering technicians 1 0 0 0 0Messengers porters and deliverers 64 0 0 41 64.1Quantity surveyors and related professional not classed elsewhere
29 0 0 17 58.6
TOTAL 339 12 3.5 181 53.4
Table 4.4.5 Promotions by salary band
Salary Band Employment at Beginning
of Period (April 2012)
Promotions to another
Salary Level
Salary Level Promotions
as a % of Employment
Progressions to another
Notch within Salary Level
Notch progressions
as a % of Employment
Lower skilled (Levels 1-2), Permanent 1559 0 0 858 55
Skilled (Levels 3-5), Permanent 1409 2 0.1 1105 78.4
Highly skilled production (Levels 6-8), Permanent
1538 26 1.7 958 62.3
Highly skilled supervision (Levels 9-12), Permanent
1149 45 3.9 753 65.5
Senior management (Levels 13-16), Permanent
158 9 5.7 3 1.9
TOTAL 5813 82 1.4 3677 63.3
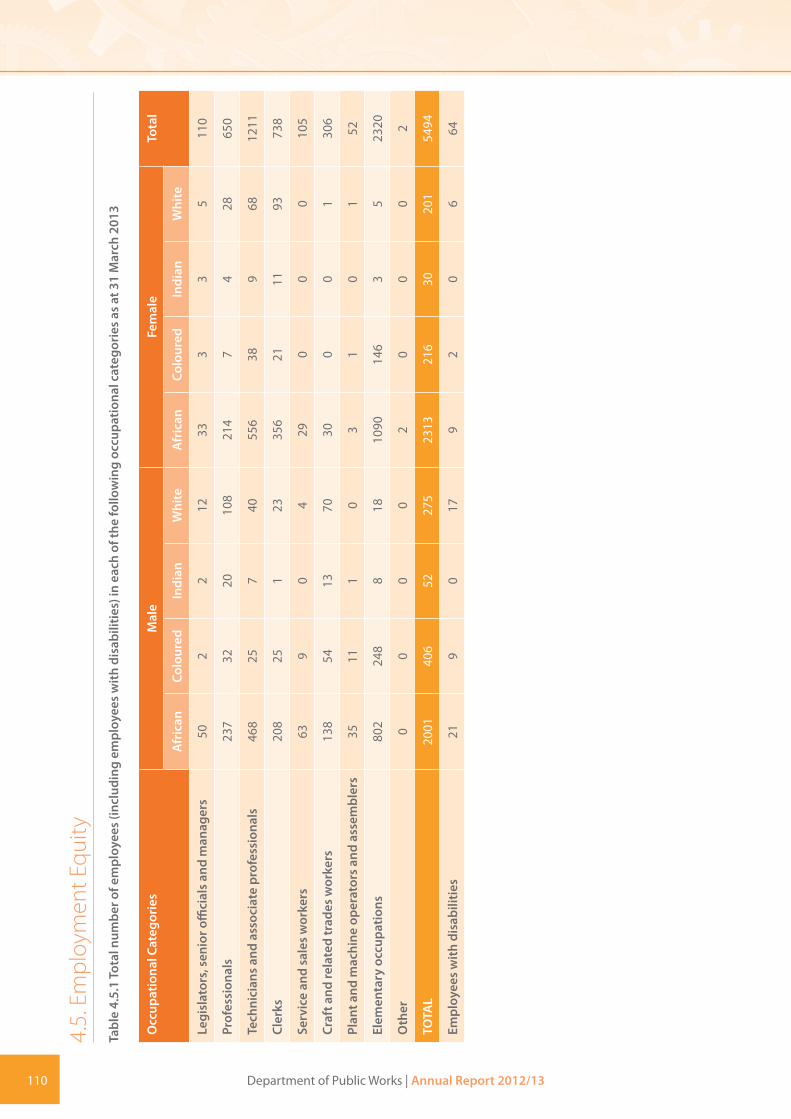
110 Department of Public Works | Annual Report 2012/13
4.5.
Em
ploy
men
t Equ
ityTa
ble
4.5.
1 To
tal n
umbe
r of e
mpl
oyee
s (in
clud
ing
empl
oyee
s w
ith d
isab
ilitie
s) in
eac
h of
the
follo
win
g oc
cupa
tiona
l cat
egor
ies
as a
t 31
Mar
ch 2
013
Occ
upat
iona
l Cat
egor
ies
Mal
eFe
mal
eTo
tal
Afr
ican
Colo
ured
Indi
anW
hite
Afr
ican
Colo
ured
Indi
anW
hite
Legi
slat
ors,
sen
ior o
ffici
als
and
man
ager
s50
22
1233
33
511
0
Prof
essi
onal
s23
732
2010
821
47
428
650
Tech
nici
ans
and
asso
ciat
e pr
ofes
sion
als
468
257
4055
638
968
1211
Cler
ks20
825
123
356
2111
9373
8
Serv
ice
and
sale
s w
orke
rs63
90
429
00
010
5
Craf
t and
rela
ted
trad
es w
orke
rs13
854
1370
300
01
306
Plan
t and
mac
hine
ope
rato
rs a
nd a
ssem
bler
s35
111
03
10
152
Elem
enta
ry o
ccup
atio
ns80
224
88
1810
9014
63
523
20
Oth
er0
00
02
00
02
TOTA
L20
0140
652
275
2313
216
3020
154
94
Empl
oyee
s w
ith d
isab
ilitie
s 21
90
179
20
664

Department of Public Works | Annual Report 2012/13 111
Employment Equity (continued)Ta
ble
4.5.
2 To
tal n
umbe
r of e
mpl
oyee
s (in
clud
ing
empl
oyee
s w
ith d
isab
ilitie
s) in
eac
h of
the
follo
win
g oc
cupa
tiona
l ban
ds o
n 31
Mar
ch 2
013
Occ
upat
iona
l Ban
dsM
ale
Fem
ale
Tota
l
Afr
ican
Colo
ured
Indi
anW
hite
Afr
ican
Colo
ured
Indi
anW
hite
Top
Man
agem
ent
41
01
10
10
8
Seni
or M
anag
emen
t59
12
1950
34
514
3
Prof
essi
onal
ly q
ualifi
ed a
nd e
xper
ienc
ed
spec
ialis
ts a
nd m
iddl
e m
anag
emen
t44
550
3015
431
313
745
1057
Skill
ed te
chni
cal a
nd a
cade
mic
ally
qua
lified
w
orke
rs, j
unio
r man
agem
ent,
supe
rvis
ors,
fo
rem
en
398
625
6859
338
1314
013
17
Sem
i-ski
lled
and
disc
retio
nary
dec
isio
n m
akin
g56
023
66
2139
985
14
1312
Uns
kille
d an
d de
fined
dec
isio
n m
akin
g35
352
44
642
673
211
27
Cont
ract
(Top
Man
agem
ent)
10
11
10
00
4
Cont
ract
(Sen
ior M
anag
emen
t)7
00
23
00
113
Cont
ract
(Pro
fess
iona
lly q
ualifi
ed)
191
15
282
03
59
Cont
ract
(Ski
lled
tech
nica
l)69
10
073
20
114
6
Cont
ract
(Sem
i-ski
lled)
170
30
210
10
42
Cont
ract
(Uns
kille
d)69
20
018
96
00
266
TOTA
L20
0140
652
275
2313
216
3020
154
94
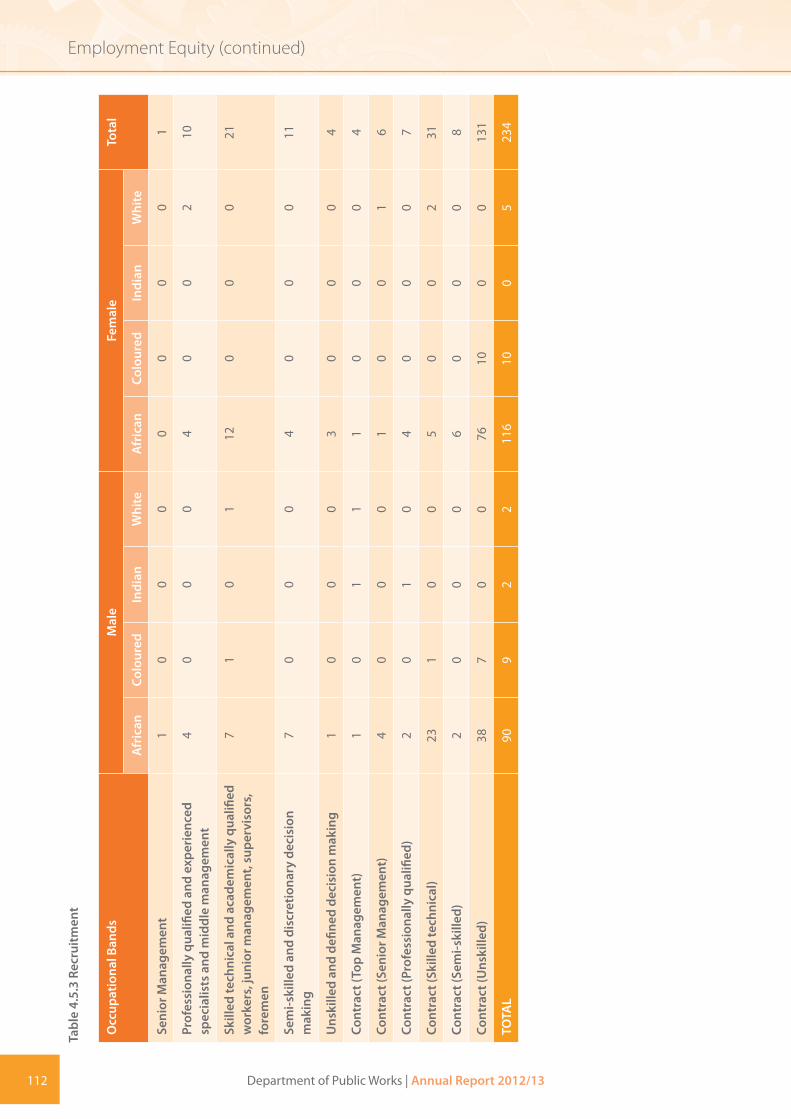
112 Department of Public Works | Annual Report 2012/13
Employment Equity (continued)Ta
ble
4.5.
3 Re
crui
tmen
t
Occ
upat
iona
l Ban
dsM
ale
Fem
ale
Tota
l
Afr
ican
Colo
ured
Indi
anW
hite
Afr
ican
Colo
ured
Indi
anW
hite
Seni
or M
anag
emen
t1
00
00
00
01
Prof
essi
onal
ly q
ualifi
ed a
nd e
xper
ienc
ed
spec
ialis
ts a
nd m
iddl
e m
anag
emen
t4
00
04
00
210
Skill
ed te
chni
cal a
nd a
cade
mic
ally
qua
lified
w
orke
rs, j
unio
r man
agem
ent,
supe
rvis
ors,
fo
rem
en
71
01
120
00
21
Sem
i-ski
lled
and
disc
retio
nary
dec
isio
n m
akin
g7
00
04
00
011
Uns
kille
d an
d de
fined
dec
isio
n m
akin
g1
00
03
00
04
Cont
ract
(Top
Man
agem
ent)
10
11
10
00
4
Cont
ract
(Sen
ior M
anag
emen
t)4
00
01
00
16
Cont
ract
(Pro
fess
iona
lly q
ualifi
ed)
20
10
40
00
7
Cont
ract
(Ski
lled
tech
nica
l)23
10
05
00
231
Cont
ract
(Sem
i-ski
lled)
20
00
60
00
8
Cont
ract
(Uns
kille
d)
387
00
7610
00
131
TOTA
L90
92
211
610
05
234

Department of Public Works | Annual Report 2012/13 113
Employment Equity (continued)Ta
ble
4.5.
4 Pr
omot
ion
Occ
upat
iona
l Ban
dsM
ale
Fem
ale
Tota
l
Afr
ican
Colo
ured
Indi
anW
hite
Afr
ican
Colo
ured
Indi
anW
hite
Seni
or M
anag
emen
t7
00
02
01
111
Prof
essi
onal
ly q
ualifi
ed a
nd e
xper
ienc
ed
spec
ialis
ts a
nd m
iddl
e m
anag
emen
t 31
045
2713
421
310
538
782
Skill
ed te
chni
cal a
nd a
cade
mic
ally
qua
lified
w
orke
rs, j
unio
r man
agem
ent,
supe
rvis
ors,
fo
rem
en
255
413
5244
532
1013
597
3
Sem
i-ski
lled
and
disc
retio
nary
dec
isio
n m
akin
g46
421
26
1732
277
13
1102
Uns
kille
d an
d de
fined
dec
isio
n m
akin
g24
439
33
497
523
184
2
Cont
ract
(Sen
ior M
anag
emen
t)1
00
00
00
01
Cont
ract
(Pro
fess
iona
lly q
ualifi
ed)
60
00
100
00
16
Cont
ract
(Ski
lled
tech
nica
l)3
00
08
00
011
Cont
ract
(Sem
i-ski
lled)
20
00
30
00
5
Cont
ract
(Uns
kille
d)
00
00
151
00
16
TOTA
L12
9233
739
206
1515
172
2017
837
59
Empl
oyee
s w
ith d
isab
ilitie
s 16
90
137
20
552

114 Department of Public Works | Annual Report 2012/13
Employment Equity (continued)Ta
ble
4.5.
5 Te
rmin
atio
ns
Occ
upat
iona
l Ban
dsM
ale
Fem
ale
Tota
l
Afr
ican
Colo
ured
Indi
anW
hite
Afr
ican
Colo
ured
Indi
an W
hite
Top
Man
agem
ent
00
00
10
00
1
Seni
or M
anag
emen
t3
00
31
00
18
Prof
essi
onal
ly q
ualifi
ed a
nd
expe
rien
ced
spec
ialis
ts a
nd m
iddl
e m
anag
emen
t
162
06
70
10
32
Skill
ed te
chni
cal a
nd a
cade
mic
ally
qu
alifi
ed w
orke
rs, j
unio
r m
anag
emen
t, su
perv
isor
s, fo
rem
en
202
02
114
08
47
Sem
i-ski
lled
and
disc
retio
nary
de
cisi
on m
akin
g42
80
125
30
079
Uns
kille
d an
d de
fined
dec
isio
n m
akin
g6
20
111
60
026
Uns
kille
d an
d de
fined
dec
isio
n m
akin
g1
00
00
00
01
Cont
ract
(Top
Man
agem
ent)
11
00
00
00
2
Cont
ract
(Sen
ior M
anag
emen
t)1
00
00
00
12
Cont
ract
(Pro
fess
iona
lly q
ualifi
ed)
912
01
80
01
31
Cont
ract
(Ski
lled
tech
nica
l)20
01
127
00
049
Cont
ract
(Sem
i-ski
lled)
200
00
321
00
53
Cont
ract
(Uns
kille
d)60
70
011
47
00
188
TOTA
L19
934
115
237
211
1151
9
Empl
oyee
s w
ith d
isab
ilitie
s 2
00
02
10
16

Department of Public Works | Annual Report 2012/13 115
Employment Equity (continued)Ta
ble
4.5.
6 D
isci
plin
ary
actio
n
Occ
upat
iona
l Ban
dsM
ale
Fem
ale
Tota
l
Afr
ican
Colo
ured
Indi
anW
hite
Afr
ican
Colo
ured
Indi
an W
hite
TOTA
L52
83
1224
20
210
3
Tabl
e 4.
5.7
Skill
s de
velo
pmen
t
Occ
upat
iona
l Cat
egor
ies
Mal
eFe
mal
eTo
tal
Afr
ican
Colo
ured
Indi
anW
hite
Afr
ican
Colo
ured
Indi
anW
hite
Legi
slat
ors,
Sen
ior O
ffici
als
and
Man
ager
s 10
61
1118
960
619
257
Prof
essi
onal
s 33
016
564
241
2017
4573
8
Tech
nici
ans
and
Ass
ocia
te P
rofe
ssio
nals
46
211
1321
25
310
3
Cler
ks
142
154
1057
041
354
839
Serv
ice
and
Sale
s Wor
kers
15
10
19
00
026
Skill
ed A
gric
ultu
re a
nd F
ishe
ry W
orke
rs
00
00
00
00
0
Craf
t and
rela
ted
Trad
es W
orke
rs
6212
23
230
02
104
Plan
t and
Mac
hine
Ope
rato
rs a
nd A
ssem
bler
s 2
00
02
00
04
Elem
enta
ry O
ccup
atio
ns
839
52
110
135
323
0
TOTA
L 78
656
3811
110
7276
3612
623
01
Empl
oyee
s w
ith d
isab
ilitie
s 9
00
011
00
020

116 Department of Public Works | Annual Report 2012/13
4.6. Performance RewardsTo encourage good performance, the Department granted performance rewards during the year under review. The information is presented in terms of race, gender, and disability, salary bands and critical occupations.
Table 4.6.1 Performance Rewards by race, gender and disability
Demographics Number of Beneficiaries
Total Employment
Percentage of Total
Employment
Cost (R’000) Average Cost per Beneficiary
(R)
African, Female 1 140 2 304 49.5 5 523 4845
African, Male 931 1 980 47 4 878 5 240
Asian, Female 18 30 60 125 6 937
Asian, Male 37 52 71.2 382 10 327
Coloured, Female 148 214 69.2 745 5 031
Coloured, Male 241 397 60.7 1 203 4 993
Total Blacks, Female 1 306 2 548 51.3 6 393 4 895
Total Blacks, Male 1 209 2 429 49.8 6 463 5 346
White, Female 154 195 79 1 298 8 430
White, Male 157 258 60.9 1 805 11 494
Employees with a disability
32 64 50 174 5 424
TOTAL 2 858 5 494 52 16 132 5 645
Table 4.6.2 Performance Rewards by salary band for personnel below Senior Management Service
Salary Band Number of Beneficiaries
Total Employment
Percentage of Total
Employment
Cost (R’000) Average Cost per Beneficiary
(R’000)
Lower skilled (Levels 1-2)
662 1125 58.8 1 593 2 406
Skilled (Levels 3-5)
917 1313 69.8 2 921 3 185
Highly skilled production (Levels 6-8)
719 1317 54.6 4 460 6 203
Highly skilled supervision (Levels 9-12)
540 1057 51.1 6 787 12 569
Total 2 838 4812 59 15 761 5 554

Department of Public Works | Annual Report 2012/13 117
Performance Rewards (continued)
Table 4.6.3 Performance Rewards by critical occupation
Critical Occupations Number of Beneficiaries
Total Employment
% of Total Employment
Cost (R’000) Average Cost per
Beneficiary (R)
Architects town and traffic planners
15 32 46.9 250 16 667
Chemical and physical science technicians
8 8 100 59 7 375
Civil engineering technicians 4 11 36.4 34 8 500
Electrical and electronics engineering technicians
1 1 100 12 12 000
Engineers and related professionals
70 178 39.3 914 13 057
Mechanical engineering technicians
0 1 0 0 0
Messengers porters and deliverers
33 64 51.6 112 3 394
Quantity surveyors and professional not classed elsewhere
9 23 39.1 134 14 889
TOTAL 140 318 44 1 515 10 821
Notes
The CORE classification, as prescribed by the DPSA, was used to complete this table.
Table 4.6.4 Performance related rewards (cash bonus), by salary band for Senior Management Service
SMS Band Number of Beneficiaries
Total Employment
Percentage of Total
Employment
Cost (R’000) Average Cost per
Beneficiary (R)
% of SMS Wage Bill
Band A 4 115 3.5 96 24 000 0.1
Band B 0 42 0 0 0 0
Band C 0 9 0 0 0 0
Band D 0 3 0 0 0 0
TOTAL 4 169 2.4 96 24 000 0.1

118 Department of Public Works | Annual Report 2012/13
4.7. Foreign WorkersThe tables below summarise the employment of foreign nationals in the Department in terms of salary band and major occupation.
Table 4.7.1 Foreign workers by salary band
Salary Band 1 April 2012 31 March 2013 Change
Number % of Total Number % of Total Number % Change
Lower skilled (Levels 1-2) 2 7.7 2 14.3 0 0
Highly skilled supervision (Levels 9-12)
5 19.2 6 42.9 1 -8.3
Senior management (Levels 13-16)
3 11.5 3 21.4 0 0
Contract (Levels 1-2) 1 3.8 1 7.1 0 0
Contract (Levels 9-12) 14 53.8 1 7.1 -13 108.3
Contract (Levels 13-16) 1 3.8 1 7.1 0 0
TOTAL 26 100 14 100 -12 100
Table 4.7.2 Foreign workers by major occupation
Major Occupation 1 April 2012 31 March 2013 Change
Number % of Total Number % of Total Number % Change
Elementary occupations 2 7.7 2 14.3 0 0
Other occupations 1 3.8 0 0 -1 8.3
Professionals and managers 23 88.5 12 85.7 -11 91.7
TOTAL 26 100 14 100 -12 100

Department of Public Works | Annual Report 2012/13 119
4.8.
Lea
ve u
tilis
atio
nTh
e Pu
blic
Ser
vice
Com
mis
sion
iden
tified
the
need
for c
aref
ul m
onito
ring
of si
ck le
ave
with
in th
e pu
blic
serv
ice.
The
follo
win
g ta
bles
indi
cate
the
use
of si
ck le
ave
and
disa
bilit
y le
ave.
In b
oth
case
s, th
e es
timat
ed c
ost o
f the
leav
e is
als
o pr
ovid
ed.
Tabl
e 4.
8.1
Sick
eav
e
Sala
ry B
and
Tota
l Day
s%
Day
s w
ith
Med
ical
Ce
rtifi
catio
n
Num
ber o
f Em
ploy
ees
usin
g Si
ck
Leav
e
% o
f Tot
al
Empl
oyee
s us
ing
Sick
Le
ave
Aver
age
Day
s pe
r Em
ploy
eeEs
timat
ed C
ost
(R’0
00)
Tota
l num
ber
of E
mpl
oyee
s us
ing
Sick
Le
ave
Low
er s
kille
d (L
evel
s 1-
2)
5 31
985
.473
117
.67
1 34
74
160
Skill
ed (L
evel
s 3-
5)
6 36
181
.990
821
.87
2 05
34
160
Hig
hly
skill
ed p
rodu
ctio
n (L
evel
s 6-
8)
8 44
874
.31
140
27.4
75
307
4 16
0
Hig
hly
skill
ed s
uper
visi
on (L
evel
s 9-
12)
5 70
777
.880
719
.47
8 86
04
160
Seni
or m
anag
emen
t (Le
vels
13-
16)
720
79.3
118
2.8
62
087
4 16
0
Cont
ract
(Lev
els
1-2)
69
362
.220
54.
93
128
4 16
0
Cont
ract
(Lev
els
3-5)
31
755
.874
1.8
411
14
160
Cont
ract
(Lev
els
6-8)
53
562
.612
12.
94
307
4 16
0
Cont
ract
(Lev
els
9-12
) 26
675
.952
1.3
530
64
160
Cont
ract
(Lev
els
13-1
6)
1485
.74
0.1
441
4 16
0
TOTA
L28
380
78.2
4160
100
720
547
4 16
0

120 Department of Public Works | Annual Report 2012/13
Leave utilisation (continues)Ta
ble
4.8.
2 D
isab
ility
Lea
ve (t
empo
rary
and
per
man
ent)
Sala
ry B
and
Tota
l Day
s%
Day
s w
ith
Med
ical
Ce
rtifi
catio
n
Num
ber o
f Em
ploy
ees
usin
g D
isab
ility
Le
ave
% o
f Tot
al
Empl
oyee
s us
ing
Dis
abili
ty
Leav
e
Aver
age
Day
s pe
r Em
ploy
eeEs
timat
ed C
ost
(R’0
00)
Low
er s
kille
d (L
evel
s 1-
2)
1 77
010
053
29.6
3344
9
Skill
ed (L
evel
s 3-
5)
1 39
210
046
25.7
3044
7
Hig
hly
skill
ed p
rodu
ctio
n (L
evel
s 6-
8)
1 06
010
038
21.2
2866
0
Hig
hly
skill
ed s
uper
visi
on (L
evel
s 9-
12)
808
100
3117
.326
1 47
3
Seni
or m
anag
emen
t (Le
vels
13-
16)
7910
05
2.8
1622
6
Cont
ract
(Lev
els
1-2)
41
100
10.
641
9
Cont
ract
(Lev
els
3-5)
10
110
03
1.7
3430
Cont
ract
(Lev
els
9-12
) 31
100
21.
116
32
TOTA
L5
282
100
179
100
303
326

Department of Public Works | Annual Report 2012/13 121
Leave utilisation (continues)
The table below summarises the utilisation of annual leave. The wage agreement concluded with trade unions in the PSCBC in 2000 requires the management of annual leave to prevent high levels of accrued leave being paid at the time of termination of service. The number of employees that took leave refers to the leave forms captured.
Table 4.8.3 Annual Leave
Salary Band Total Days Taken Average days per Employee
Number of Employees who took
leave
Lower skilled (Levels 1-2) 21 446.12 20 1 063
Skilled (Levels 3-5) 31 842.2 23 1376
Highly skilled production (Levels 6-8) 31 505.36 22 1421
Highly skilled supervision (Levels 9-12) 24 258.08 22 1094
Senior management (Levels 13-16) 3 910 23 173
Contract (Levels 1-2) 3 906 10 399
Contract (Levels 3-5) 1 141 12 92
Contract (Levels 6-8) 2 290 13 171
Contract (Levels 9-12) 1 138 16 69
Contract (Levels 13-16) 141 14 10
Abnormal Appointment 1 1 1
TOTAL 121 578.76 21 5 869
Table 4.8.4 Capped Leave
Salary Band Total number of days of
capped leave taken
Average number of
days taken per employee
Average capped leave per employee
as at 31 December 2012
Number of Employees who
took capped leave
Lower skilled (Levels 1-2) 40 3 46 13
Skilled (Levels 3-5) 250 4 62 57
Highly skilled production (Levels 6-8)
127 3 41 37
Highly skilled supervision (Levels 9-12)
101 5 55 19
Senior management (Levels 13-16) 13 2 55 7
TOTAL 531 4 55 133
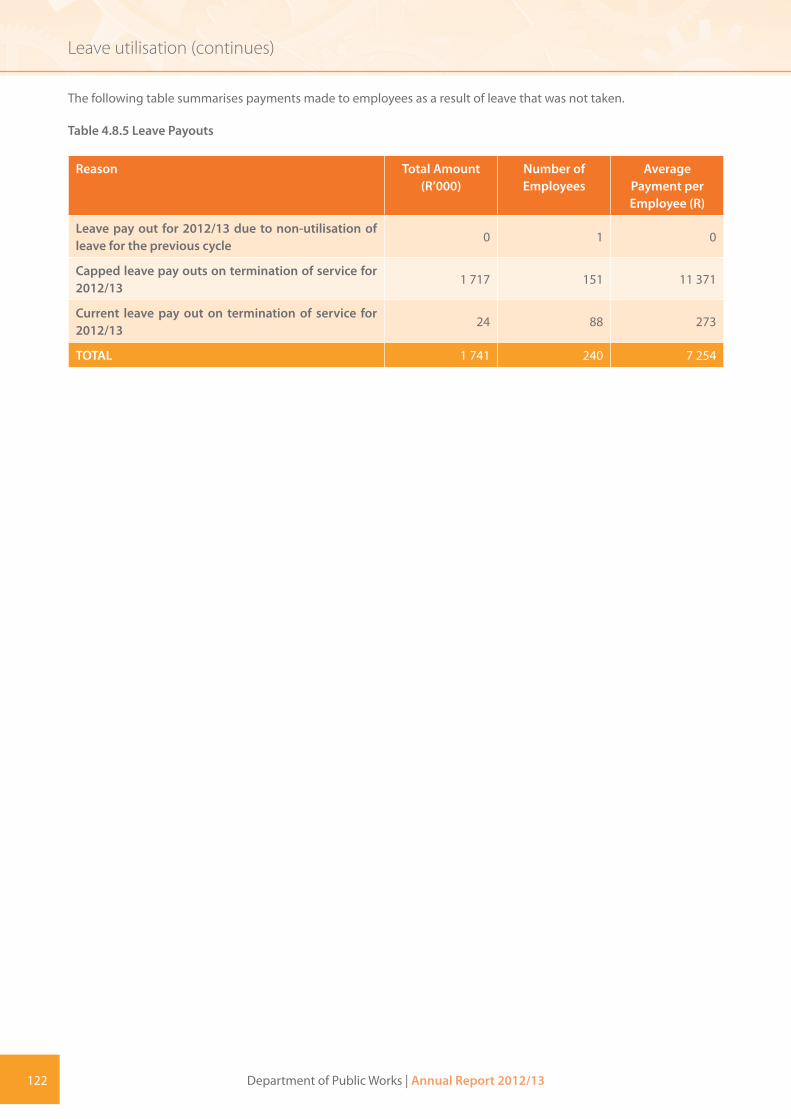
122 Department of Public Works | Annual Report 2012/13
Leave utilisation (continues)
The following table summarises payments made to employees as a result of leave that was not taken.
Table 4.8.5 Leave Payouts
Reason Total Amount (R’000)
Number of Employees
Average Payment per Employee (R)
Leave pay out for 2012/13 due to non-utilisation of leave for the previous cycle
0 1 0
Capped leave pay outs on termination of service for 2012/13
1 717 151 11 371
Current leave pay out on termination of service for 2012/13
24 88 273
TOTAL 1 741 240 7 254

Department of Public Works | Annual Report 2012/13 123
4.9. HIV/AIDS and Health Promotion ProgrammesTable 4.9.1 Steps taken to reduce the risk of occupational exposure
Units/categories of employees identified to be at high risk of contracting HIV and related diseases (if any)
Key steps taken to reduce the risk
Mobility and migration are heavily linked to the spread of HIV particularly in relation to the construction sector.
As custodian and the main player in the construction sector, the National Department of Public Works (DPW) developed and implemented an HIV/AIDS Strategy for the construction sector to protect and support the industry’s workforce
Table 4.9.2 Details of Health Promotion and HIV/AIDS Programmes (tick the applicable boxes and provide the required information)
Question Yes No Details, if yes
1. Has the department designated a member of the SMS to implement the provisions contained in Part VI E of Chapter 1 of the Public Service Regulations, 2001? If so, provide her/his name and position.
Yes Mr Jabulani Nkwanyana: CD: HR and OD
2. Does the department have a dedicated unit or have you designated specific staff members to promote health and wellbeing of your employees? If so, indicate the number of employees who are involved in this task and the annual budget that is available for this purpose.
Yes Advocacy and the Support sub-directorate is dedicated to this programme. 2 permanent staff members are responsible for a staff establishment of about 6700 with the annual budget of R150 000.00.
3. Has the department introduced an Employee Assistance or Health Promotion Programme for your employees? If so, indicate the key elements/services of the programme.
Yes Responsive Programmes Addressing psycho-social health and wellness issues
4. Has the department established (a) committee(s) as contemplated in Part VI E.5 (e) of Chapter 1 of the Public Service Regulations, 2001? If so, please provide the names of the members of the committee and the stakeholder(s) that they represent.
Yes A Department-Wide Committee constituted by HR representatives from 11 regional offices.
5. Has the department reviewed the employment policies and practices of your department to ensure that these do not unfairly discriminate against employees on the basis of their HIV status? If so, list the employment policies/practices so reviewed.
Yes The Departmental HIV and AIDS Policy.
6. Has the department introduced measures to protect HIV-positive employees or those perceived to be HIV-positive from discrimination? If so, list the key elements of these measures.
Yes Stigma Mitigation programme is in place. Key elements include:-Knowledge, Attitudes and Practices surveys; Dialogues and Peer education.

124 Department of Public Works | Annual Report 2012/13
HIV/AIDS and Health Promotion Programmes (continued)
Question Yes No Details, if yes
7. Does the department encourage its employees to undergo Voluntary Counselling and Testing? If so, list the results that you have achieved.
Yes The department collaborates with GEMS and NGOs in providing on-site opportunities for HIV Counselling and Testing and TB screening. 368 employees were counselled and tested for HIV.
8. Has the department developed measures/indicators to monitor and evaluate the impact of your health promotion programme? If so, list these measures/indicators.
Yes Utilisation by employees to the Health and Wellness services offered. Many employees attending wellness events. Number of wellness events, workshops and trainings conducted. Sick leave utilisation (reduction).Number of employees living openly with HIV

Department of Public Works | Annual Report 2012/13 125
4.10. Labour RelationsTable 4.10.1 Collective Agreements
Subject Matter Date
None
The table below summarises the outcome of disciplinary hearings conducted within the Department for the year under review.
Table 4.10.2 Misconduct and disciplinary hearings finalised
Outcomes of disciplinary hearings Number Percentage of Total
Total
Dismissal 6 5.82 6
Suspensions from work without pay 7 6.79 7
Final Written Warnings 42 40 42
Written Warnings 37 33.98 35
Verbal Warnings 7 6.79 7
Not guilty 2 1.94 2
Withdrawals 4 3.88 4
TOTAL 105 100 105
Table 4.10.3 Types of misconduct addressed at disciplinary hearings
Type of misconduct Number % of Total Total
Absent from work without reason or permission 28 27.45 28
Steals, bribes or commits fraud, corruption 11 10.67 11
Gave false information 1 0.97 1
Displayed disrespectful, disgraceful and unacceptable behavior
8 7.76 8
Assault 3 2.91 3
Abuse of state vehicle 4 3.88 4
Negligence of duty 13 12.62 13
Failure to comply with policy or procedures 6 5.82 6
Drinking on duty 3 2.91 3
Irregular, fruitless and wasteful expenditure 4 3.88 4
Undertake remunerative work outside official duties without permission
1 0.97 1
Failure to carry out lawful instruction/ insubordination
20 19.41 20
TOTAL 102 100 102

126 Department of Public Works | Annual Report 2012/13
Labour Relations (continued)
Table 4.10.4 Grievances Lodged
Number of grievances addressed Number % of Total Total
Not resolved 17 11 17
Resolved 136 89 136
TOTAL 153 100 153
Table 4.10.5 Disputes Lodged
Number of disputes addressed Number % of total Number
Upheld 4 33.33 4
Dismissed 8 66.66 8
Total 12 100 12
Table 4.10.6 Strike actions
Strike Actions
Total number of working days lost None
Total cost(R’000) of working days lost R 0.00
Amount (R’000) recovered as a result of no work no pay R 0.00
Table 4.10.7 Precautionary suspensions
Precautionary Suspensions
Number of people suspended 8
Number of people whose suspension exceeded 30 days 8
Average number of days suspended 259
Cost (R’000) of suspensions R4 736 192.50

Department of Public Works | Annual Report 2012/13 127
4.11
. Ski
lls D
evel
opm
ent
This
sec
tion
high
light
s th
e eff
orts
of t
he D
epar
tmen
t with
rega
rd to
ski
lls d
evel
opm
ent.
Tabl
e 4.
11.1
Tra
inin
g ne
eds
iden
tified
Occ
upat
iona
l Cat
egor
ies
Gen
der
Empl
oym
ent
Lear
ners
hips
Skill
s Pr
ogra
mm
es
and
othe
r Sho
rt
Cour
ses
Oth
er F
orm
s of
Tr
aini
ngTo
tal
Legi
slat
ors,
sen
ior o
ffici
als
and
man
ager
s Fe
mal
e 44
087
4212
9
M
ale
660
7270
142
Prof
essi
onal
s Fe
mal
e 25
30
142
9123
3
M
ale
397
014
062
202
Tech
nici
ans
and
asso
ciat
e pr
ofes
sion
als
Fem
ale
671
020
338
241
M
ale
540
018
129
210
Cler
ks
Fem
ale
481
013
934
173
M
ale
257
011
316
129
Serv
ice
and
sale
s w
orke
rs
Fem
ale
290
170
17
M
ale
760
490
49
Skill
ed a
gric
ultu
re a
nd fi
sher
y w
orke
rs
Fem
ale
00
00
0
M
ale
00
00
0
Craf
t and
rela
ted
trad
es w
orke
rs
Fem
ale
310
00
0
M
ale
275
00
00
Plan
t and
mac
hine
ope
rato
rs a
nd a
ssem
bler
s Fe
mal
e 5
07
07
M
ale
470
210
21
Elem
enta
ry o
ccup
atio
ns
Fem
ale
1246
027
027
M
ale
1076
035
035
Gen
der s
ub to
tals
Fe
mal
e 27
600
622
205
827
M
ale
2734
061
117
778
8
Tota
l
5494
012
3338
216
15

128 Department of Public Works | Annual Report 2012/13
Skills Development (continued)Ta
ble
4.11
.2 T
rain
ing
prov
ided
for t
he p
erio
d un
der r
evie
w
Occ
upat
iona
l Cat
egor
ies
Gen
der
Empl
oym
ent
Lear
ners
hips
Skill
s Pr
ogra
mm
es
& o
ther
sho
rt
cour
ses
Oth
er fo
rms
of
trai
ning
Tota
l
Legi
slat
ors,
sen
ior o
ffici
als
and
man
ager
s Fe
mal
e 44
069
5212
1
M
ale
660
6571
136
Prof
essi
onal
s Fe
mal
e 25
30
180
143
323
M
ale
397
031
210
341
5
Tech
nici
ans
and
asso
ciat
e pr
ofes
sion
als
Fem
ale
671
024
731
M
ale
540
032
4072
Cler
ks
Fem
ale
481
038
418
657
0
M
ale
257
070
199
269
Serv
ice
and
sale
s w
orke
rs
Fem
ale
290
63
9
M
ale
760
125
17
Skill
ed a
gric
ultu
re a
nd fi
sher
y w
orke
rs
Fem
ale
00
00
0
M
ale
00
00
0
Craf
t and
rela
ted
trad
es w
orke
rs
Fem
ale
310
817
25
M
ale
275
018
6179
Plan
t and
mac
hine
ope
rato
rs a
nd a
ssem
bler
s Fe
mal
e 5
00
22
M
ale
470
20
2
Elem
enta
ry o
ccup
atio
ns
Fem
ale
1246
037
9413
1
M
ale
1076
020
7999
Gen
der s
ub to
tals
Fe
mal
e 27
600
708
504
1212
M
ale
2734
053
155
810
89
Tota
l
5494
012
3910
6223
01

Department of Public Works | Annual Report 2012/13 129
4.12. Injury on dutyThe tables below provide basic information on injury on duty.
Table 4.12.1 Injury on duty
Nature of injury on duty Number % of total
Required basic medical attention only 37 86
Temporary Total Disablement 6 14
Permanent Disablement 0 0
Fatal 0 0
Total 43 100
Pothole rehabilitation, Soshanguve Pretoria

CHAPTER 5Financial Information

132 Department of Public Works | Annual Report 2012/13

Department of Public Works | Annual Report 2012/13 133
PART A
DPWAnnual Financial Statements
for the year ended 31 March 2013

134 Department of Public Works | Annual Report 2012/13
Notes to the Annual Financial Statementsfor the year ended 31 March 2013
Table of Contents
Report of the Accounting Officer 135
Report of the Auditor-General 171
Appropriation Statement 177
Notes to the Appropriation Statement 192
Statement of Financial Performance 195
Statement of Financial Position 196
Statement of Changes in Net Assets 197
Cash Flow Statement 198
Notes to the Annual Financial Statements (including Accounting policies) 199
Disclosures Notes to the Annual Financial Statements 216
Annexures 246

Department of Public Works | Annual Report 2012/13 135
Report of the Accounting Officerfor the year ended 31 March 2013
1. General review of the state of financial affairsThe 2012/13 financial year has been a landmark in the transformation of the finance and Supply Chain management functions of the Department and the PMTE. Towards the latter part of this financial year, a consortium of service providers was engaged to support the Department with the enhancement of efficiencies of operations in both the regions and at head office level. Notwithstanding the fact that this support was only rolled out in February 2013, very encouraging results were achieved in a very short space in time. This intervention undoubtedly also contributed towards the improved audit outcomes attained for this year for the department’s main account and the PMTE.
Key policy and legislative developments:
During the financial year under review, the Department continued with the development of the following key legislation to enable the Department to direct the execution of its mandate more effectively and to enhance its operational efficiencies:
• the draft Agrément South Africa (ASA) Bill - to establish the entity as a juristic person. A draft Business Case has been developed and is under consideration. A draft Agrément South Africa Bill is being finalised. This Bill will be tabled in Parliament in 2013/2014.
• the draft Built Environment Professions (BEP) Policy - towards the possible amendment of the legislative framework governing the Built Environment Professions. The draft BEP Policy has been developed and is under consideration. The BEP Policy will be finalised in the 2013/2014 financial year.
• the draft Expropriation Bill - to ensure consistency with the Constitution and uniformity in the expropriation of property by all organs of state. The draft Bill and explanatory memorandum was approved by Cabinet for publication and subsequently gazetted for public comments. The Bill will be tabled in Parliament in 2013/2014.
• the Construction Industry Development (cidb) Amendment Regulations, 2013, to ensure improvements of registration requirements for Contractors and to better maintain and upgrade their grades with the cidb. The draft Regulations were published for public comment on 5 October 2012. The public comment phase closed on 5 December 2012. The final Regulations are being reviewed by the department and will be submitted to the Minister for approval in 2013/14.
Further, the Department under the leadership of the Deputy Minister, commenced with the development of business case for the Independent Development Trust (IDT) to review the mandate of IDT. The revised mandate will be submitted to Cabinet for approval in 2013/14.
Construction projects
During the year under review, the Department planned to complete 200 construction projects. This includes projects directed at maintenance, repairs, renovations and new facilities. However, the Department managed to complete 214 projects during this period.
At the end of March 2013, 453 projects were still underway and it is anticipated that they will continue into the next financial year. The latter projects consist of the following:
• 68 resort under the DPW capital program;
• 268 relate to DPW maintenance programmes; and
• 117 are undertaken on behalf of client departments.
If all the projects currently under construction are delivered within the specified completion periods, a further 300 projects will be handed over by end of March 2014. This represents a planned increase of 40% compared year on year.

136 Department of Public Works | Annual Report 2012/13
Report of the Accounting Officer (continued)for the year ended 31 March 2013
The following expenditure against budgets was achieved:
• DPW capital .................................................... 61%;
• Client departments’ capital ....................... 72%; and
• Planned maintenance ................................. 96%.
Programme for the compilation of the Immovable Asset Register
During the year under review, the Department conducted an extensive reconciliation of immovable assets in its Immovable Asset Register (IAR) against Deeds Registry data. The reconciliation exercise was conducted in conjunction with all National and Provincial custodians, and achieved a substantial improvement on the completeness assertion as evidenced by the Audit report for the 2012/13 financial year. The current list of improvements (to the extent that current data in the IAR permits) has been linked to the land parcels in order to provide a more holistic view of immovable assets as contained in the IAR presented for the year under review.
Following the decision to expedite the establishment of the PMTE, the key milestone was set to achieve an IAR that substantially meets business and regulatory requirements, including meeting all GRAP standards. In order to achieve this milestone, the Department will conduct physical verification on its immovable assets and address other management assertions (e.g. accuracy) in the 2013/14 and 2014/15 financial years. The Department will also apply a fair value model and capitalisation practices as a means of establishing a meaningful, consistent and reliable deemed or base cost for its immovable assets. The current carrying values in Note 34 will be adjusted to reflect fair value as soon as such model has been fully applied.
Moving forward, the Department will continue to engage all custodians of State-owned immovable assets in the National and Provincial spheres of government during the processes of re-building its IAR. This is paramount as the objective of achieving a compliant IAR is interdependent on the parallel processes being followed by other custodians to also enhance and maintain accurate Immovable Asset Registers of their own.
Stabilisation interventions
A core driver to the transformation of operations of the Department is the efficiency enhancement of the Finance and Supply Chain Management (SCM) operations. In this regard, a service provider was appointed towards the end of the reporting period to assist with a fundamental review of these functions and the capacitation of the affected units. This intervention will operate until July 2014. Post this intervention, the Department will have all the necessary controls, systems and processes in place for the Department to take full responsibility of these important functions.
The project consists of three core focus areas of operations:
a. the Departmental (DPW) main Account
b. the Property Management Trading Entity (PMTE) Account; and
c. SCM across all regions and head office.
The project deliverables of this intervention are structured to address the immediate technical matters relating to these functions as well as the medium to long term human resource requirements to support such functions. A skills transfer programme by the insourced professionals is paramount and integrated into the deliverables against which the service provider will be measured. The resourcing of the project was similarly prescribed to consist of at least 64 graduated unemployed individuals. These interns will be comprehensively assessed at the end of this calendar year and those who qualify, will be considered for absorption into the approved structure of the department. This capacity enhancement is intended to be a project legacy and has received widespread management support since it directly supports the national strategic objective of skills development.

Department of Public Works | Annual Report 2012/13 137
Report of the Accounting Officer (continued)for the year ended 31 March 2013
Of importance is that this intervention did not start off with a clean slate to deal with current year challenges only. Previous and historical findings by the Auditor General of South Africa (AGSA), e.g. irregular expenditure, placed an enormous burden on the team to resolve before shifting full attention to current challenges and expectations. In this regard, it must be reported that with the time available, the full population of current year transactions for both the main account and PMTE were comprehensively reviewed together with prior year transactions of the DPW main account. Prior year transactions relating to the PMTE will receive the necessary attention early in the next financial year in order to finally also lay this matter to rest.
This project also covers the requirement to set up an appropriate accounting and billing system for the PMTE. This application requires significant infrastructure capability to support its roll-out. Concerns have emanated during other business process enhancement initiatives within this project that the weak Information Technology (IT) backbone will be unable to support the additional processing capability required. This has the potential to jeopardise the roll-out of any new application in support of the finance improvements planned. Given the fact that the Department currently lacks an IT strategy and roadmap to drive the development of the IT capability in the short term, focussed attention has been redirected to this area as a matter of urgency.
The Supply Chain Management function requires a complete transformation to ensure an adequate Supply Chain Management (SCM) system that supports the core business areas of the Department. Although the current efforts to transform SCM are dedicated to improving legislative compliance, efficiency enhancement initiatives have also been identified for priority implementation to support enhanced service delivery and combat potential fraud and corrupt practices. Considerations for efficiencies include differentiated streams for SCM to isolate the core business functions so that appropriate policies, business processes, structures and skills can be advanced. The governance structures operating as Bid Committees’ are being streamlined to enhance the functional performance of these Committees to further improve service delivery and enhance controls.
Re-engineering of business processes is expected to yield further efficiencies in support of the establishment of a comprehensive demand management framework and revised acquisition and procurement framework. In support of this, the decentralisation of supplier databases supporting small value procurement as well as the institutionalisation of term contracts across the Department has been rolled out to promote further efficiencies and improve compliance and service delivery.
In support of the aforementioned, the Chief Procurement Office at the National Treasury has identified the Department as a pilot site for procurement transformation. Work has commenced between the respective teams from National Treasury to develop adequate SCM capability for the core business functional areas of the Department by March 2014. It is expected that the SCM capability emanating from this project will have a positive impact on the establishment and roll out of the differentiated streams and supporting structure for the new SCM dispensation.
Since the commencement of this project early in 2013, very little time was available to achieve the total planned impact on the operational and regularity assessments for this year. However, the policy enhancements, controls and systems improvements already implemented bodes well for expectations in the coming years. It is however, beyond any doubt that the achievements to date on this stabilisation intervention have been encouraging and have directly contributed to the improved audit outcomes for this financial year. It is therefore a firm expectation that the eventual outcome of the project will support the creation of financial centres of excellence for the DPW main account as well as PMTE with an adequately designed SCM system as a shared service.
Spending trends
The Department’s adjusted appropriation for the year under review was R7.891 billion compared to R7.830 billion in 2011/12, which translates to a 1% year-on-year increase. The bulk of the appropriation is allocated to the Programmes that are the core policy implementers of the Department, i.e:
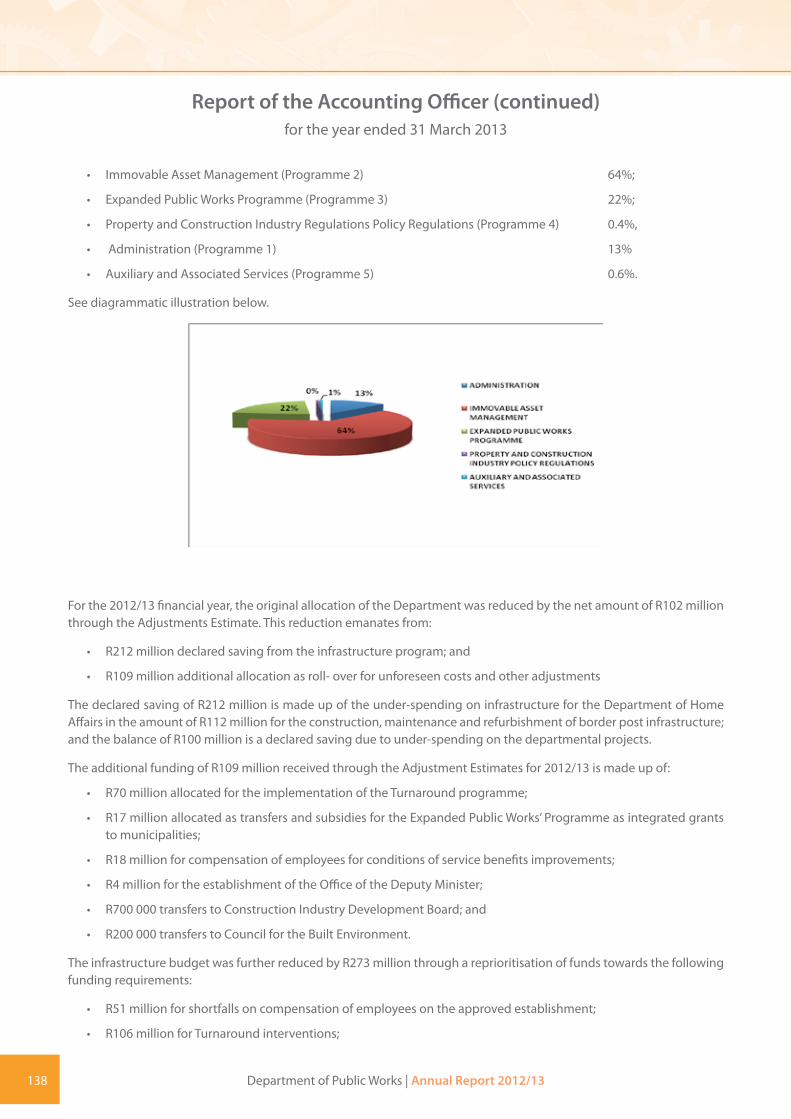
138 Department of Public Works | Annual Report 2012/13
Report of the Accounting Officer (continued)for the year ended 31 March 2013
• Immovable Asset Management (Programme 2) 64%;
• Expanded Public Works Programme (Programme 3) 22%;
• Property and Construction Industry Regulations Policy Regulations (Programme 4) 0.4%,
• Administration (Programme 1) 13%
• Auxiliary and Associated Services (Programme 5) 0.6%.
See diagrammatic illustration below.
For the 2012/13 financial year, the original allocation of the Department was reduced by the net amount of R102 million through the Adjustments Estimate. This reduction emanates from:
• R212 million declared saving from the infrastructure program; and
• R109 million additional allocation as roll- over for unforeseen costs and other adjustments
The declared saving of R212 million is made up of the under-spending on infrastructure for the Department of Home Affairs in the amount of R112 million for the construction, maintenance and refurbishment of border post infrastructure; and the balance of R100 million is a declared saving due to under-spending on the departmental projects.
The additional funding of R109 million received through the Adjustment Estimates for 2012/13 is made up of:
• R70 million allocated for the implementation of the Turnaround programme;
• R17 million allocated as transfers and subsidies for the Expanded Public Works’ Programme as integrated grants to municipalities;
• R18 million for compensation of employees for conditions of service benefits improvements;
• R4 million for the establishment of the Office of the Deputy Minister;
• R700 000 transfers to Construction Industry Development Board; and
• R200 000 transfers to Council for the Built Environment.
The infrastructure budget was further reduced by R273 million through a reprioritisation of funds towards the following funding requirements:
• R51 million for shortfalls on compensation of employees on the approved establishment;
• R106 million for Turnaround interventions;

Department of Public Works | Annual Report 2012/13 139
Report of the Accounting Officer (continued)for the year ended 31 March 2013
• R50 million financial support to the Independent Development Trust;
• R46 million for Expanded Public Works’ Programme integrated grant to municipalities; and
• R20 million for Accounting and Billing system for PMTE.
The Departmental spending for the period under review is R7.204 billion which represents 91% expenditure of the allocation. Under-spending on the allocation can mainly be attributed to unspent funds on infrastructure; devolution of property rates funds and delays in the appointment of service providers for the various projects related to the Departments’ Turnaround Strategy. The funding for the Turnaround Strategy was only confirmed in November 2012 as additional funds during the adjustment estimates of national expenditure. The appointment of service providers could therefore only be finalised after the confirmation of funds was received.
The contributing factors to the under-spending on infrastructure projects are the non-performance of contractors, termination of projects, and technical problems on project sites that may have affected actual expenditure on projects with large budget allocations. As further eluded to later under “capacity constraints”, regional offices are adversely affected by the instability of project leadership due to high vacancy rates. Key positions in the Projects Units cannot be filled because it is unattractive due to lower classification of posts and strict criteria of Occupation Special Dispensation (OSD).
A summary of the departmental financial performance is provided in Tables 1 and 2 below which shows the overall budget and expenditure as well as spending per economic classification
Table 1: Overall expenditure analysis
Details2012/13 2011/12
R`000 R`000
Budget Allocation 7 891 248 7 829 744
Actual expenditure 7 203 925 7 061 437
Spending as a percentage 91% 90%
Unspent funds 687 323 768 307
Unspent funds as a percentage 9% 10%

140 Department of Public Works | Annual Report 2012/13
Report of the Accounting Officer (continued)for the year ended 31 March 2013
Table 2: Spending per economic classification
2012/13 2011/12
Final Appropria-
tion
Actual Expendi-
ture Variance Exp as %
Final Appropria-
tion
Actual Expendi-
ture Exp as %
R’000 R’000 R’000 % R’000 R’000 %
Current payments Compensation of employees 1 381 450 1 374 552 6 898 100% 1 252 469 1 269 579 101%
Goods and services 1 203 845 977 014 226 831 81% 1 034 900 1 032 905 100%
Interest and rent on land 9 774 21 9 753 0.2% 1 586 1 567 99%
Transfers & subsidies
Provinces & municipalities 3 090 982 2 969 955 121 027 96% 2 950 451 2 592 965 88%
Departmental agencies & accounts
752 986 751 640 1 346 100% 734 690 732 486 100%
Foreign governments & international organisations
18 941 15 436 3 505 82% 16 915 12 956 77%
Public corporations & private enterprises
50 800 50 800 - 100% 150 000 150 000 100%
Non-profit institutions 282 724 292 627 (9 903) 104% 154 370 163 801 106%
Households 11 876 11 875 1 100% 3 968 4 012 101%
Gift & donation 3 20 (17) 668% 2 2 100%
Payment for capital assets
Buildings & other fixed structures 999 254 713 003 286 251 71% 1 436 745 1 011 408 70%
Machinery & equipment 59 558 43 283 16 275 73% 84 984 81 162 96%
Software & other intangible assets
25 857 501 25 356 2% 6 639 6 569 99%
Payment for financial assets 3 198 3 198 - 100% 2 025 2 025 100%
Total 7 891 248 7 203 925 687 323 91% 7 829 744 7 061 437 90%
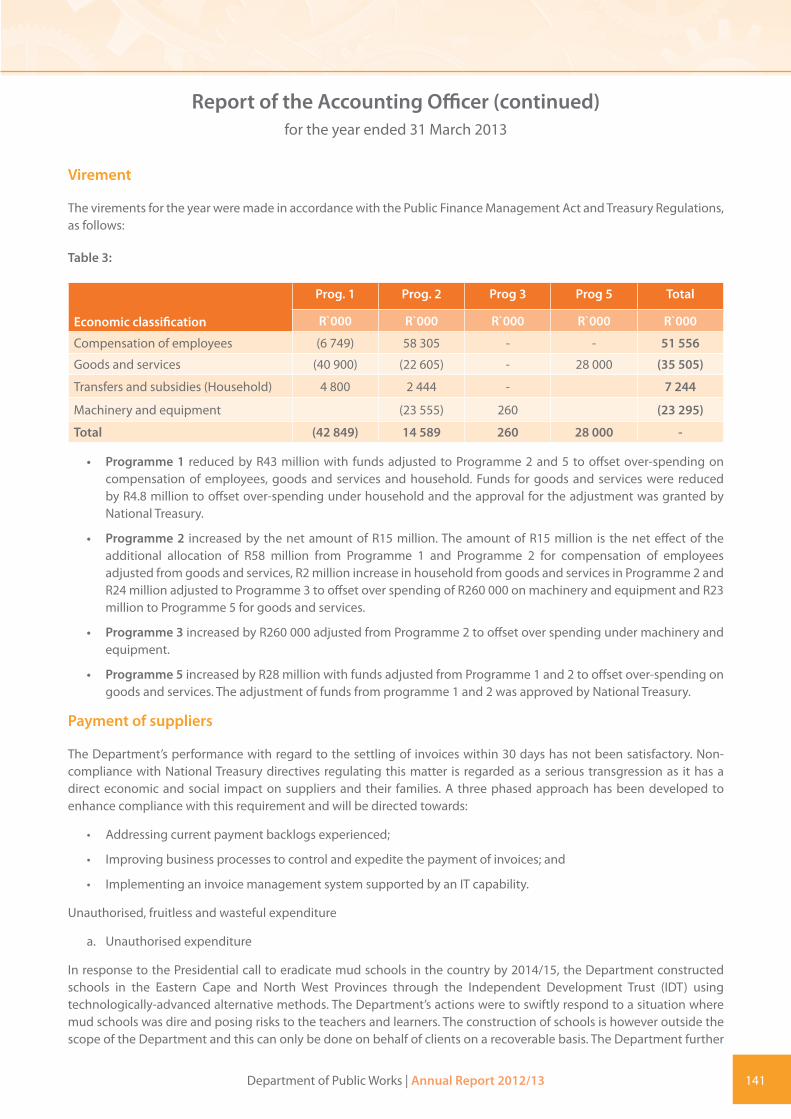
Department of Public Works | Annual Report 2012/13 141
Report of the Accounting Officer (continued)for the year ended 31 March 2013
Virement
The virements for the year were made in accordance with the Public Finance Management Act and Treasury Regulations, as follows:
Table 3:
Economic classification
Prog. 1 Prog. 2 Prog 3 Prog 5 Total
R`000 R`000 R`000 R`000 R`000
Compensation of employees (6 749) 58 305 - - 51 556
Goods and services (40 900) (22 605) - 28 000 (35 505)
Transfers and subsidies (Household) 4 800 2 444 - 7 244
Machinery and equipment (23 555) 260 (23 295)
Total (42 849) 14 589 260 28 000 -
• Programme 1 reduced by R43 million with funds adjusted to Programme 2 and 5 to offset over-spending on compensation of employees, goods and services and household. Funds for goods and services were reduced by R4.8 million to offset over-spending under household and the approval for the adjustment was granted by National Treasury.
• Programme 2 increased by the net amount of R15 million. The amount of R15 million is the net effect of the additional allocation of R58 million from Programme 1 and Programme 2 for compensation of employees adjusted from goods and services, R2 million increase in household from goods and services in Programme 2 and R24 million adjusted to Programme 3 to offset over spending of R260 000 on machinery and equipment and R23 million to Programme 5 for goods and services.
• Programme 3 increased by R260 000 adjusted from Programme 2 to offset over spending under machinery and equipment.
• Programme 5 increased by R28 million with funds adjusted from Programme 1 and 2 to offset over-spending on goods and services. The adjustment of funds from programme 1 and 2 was approved by National Treasury.
Payment of suppliers
The Department’s performance with regard to the settling of invoices within 30 days has not been satisfactory. Non-compliance with National Treasury directives regulating this matter is regarded as a serious transgression as it has a direct economic and social impact on suppliers and their families. A three phased approach has been developed to enhance compliance with this requirement and will be directed towards:
• Addressing current payment backlogs experienced;
• Improving business processes to control and expedite the payment of invoices; and
• Implementing an invoice management system supported by an IT capability.
Unauthorised, fruitless and wasteful expenditure
a. Unauthorised expenditure
In response to the Presidential call to eradicate mud schools in the country by 2014/15, the Department constructed schools in the Eastern Cape and North West Provinces through the Independent Development Trust (IDT) using technologically-advanced alternative methods. The Department’s actions were to swiftly respond to a situation where mud schools was dire and posing risks to the teachers and learners. The construction of schools is however outside the scope of the Department and this can only be done on behalf of clients on a recoverable basis. The Department further

142 Department of Public Works | Annual Report 2012/13
procured desks for the schools since the schools did not have furniture that can accommodate all the classrooms built. The schools and movable assets (desks) have been transferred to the relevant provincial departments.
The total costs incurred for the construction of these schools and desks bought, amount to R166 million. This amount was incurred in the financial year 2010/2011 and was subsequently declared unauthorised as it was outside the scope of the programme from which it was funded. The transactions were reported to National Treasury as required in terms of Section 38(1)(g) of the PFMA. All projects undertaken in response to national priorities will in future be implemented with more circumspect and in collaboration with the relevant department and controlling authorities.
b. Fruitless and Wasteful Expenditure
The Department procured SAS software in the financial year 2005/2006 at a cost of R40 million. This software enables a reporting capability and has not yet been fully operationalised to derive value for money. A further R8 million has since been spent to customise the system and provide training to IT personnel. As the Department has embarked on the development of an IT blueprint which will target the infrastructure and applications requirements of the Department in future, it is anticipated that this software may in future still be customised for proper integration to operational databases.
The Department has established a Steering Committee which will, in future, oversee and control the procurement of IT infrastructure to enhance the efficiency of the IT capability.
c. Irregular Expenditure
The Auditor General has qualified irregular expenditure disclosed by the Department and the PMTE between the 2009/10 to 2011/12 financial years. As these disclosures have balances that roll forward into subsequent financial years, it is inevitable that the entire payment population be revisited to adjust amounts disclosed for the relevant financial years.
The Department has successfully completed this review for the DPW main account and this finding has been cleared in the current financial year. However, the National Treasury published revised directives that impacted on the interpretation and identification of irregular expenditure which had to be applied to the affected prior years as well. Together with additional irregular transactions identified, the cumulative result is that the amount disclosed as irregular expenditure for the main vote has subsequently increased from R171 million in financial year 2011/2012 to R1.045 billion in the financial year 2012/2013.
With regards to PMTE, all payment transactions for the year 2012/2013 were reviewed and analysed to identify additional irregular transactions. This detailed analysis resulted in irregular expenditure to the amount of R1,2 billion being identified in the current year resulting in a total cummulative balance of irregular expenditure of R2,6 billion from the initially reported R1,4 billion. The combined cumulative irregular expenditure for DPW and PMTE has thus risen from a combined opening balance of R1,6 billion to R3,6 billion.
The problems identified in the Department giving rise to this unacceptably high level of irregular expenditure are systemic in nature for both procurement of goods and services as well as leasing of properties. The Department therefore embarked on a project which will assist with the re-engineering of business processes and the updating of various policies and controls that will address the shortcomings identified.
d. Other Investigtions
The Department’s involvement in the security upgrading of the President’s private residence in Nkandla is already public knowledge. This project was undertaken on the strength of a security assessment by the relevant security agencies. Based on this needs assessment it is the functional responsibility and mandate of the department to deliver the project in line with the specified requirements.
Given the deep-seated problems within the Department that have been exposed in the public arena, we suspected in respect of the above mentioned and other related projects, that officials in the Department were complicit in violating
Report of the Accounting Officer (continued)for the year ended 31 March 2013

Department of Public Works | Annual Report 2012/13 143
our policies and procedures and allowing projects to escalate way beyond approved budgets. This included allowing service providers to escalate their prices beyond what is reasonable. Our investigations vindicated our suspicions. We are working with the Public Protector to ensure that her investigation on this matter is concluded. It is our commitment to address her findings and recommendations when presented.
In addition to the above certain cases of expected maladministration were referred to the Special Investigations Unit (SIU) which inter alia include-
• Skilpadshek Borderpost project
• Procurement of the SAS system
• Various procurements within the Prestige environment
• Procurement of leases
The above investigations are at various stages of completion and the recommendations shall be acted upon when presented.
2. Services rendered by the department2.1 Tariff policy
The PMTE mainly derives its revenue from collecting accommodation charges from clients occupying State-owned accommodation. These tariffs were originally calculated on the properties occupied by clients based on information on the Immovable Asset Register as at 2005. Although the entity calculated its required tariff at R 26/m2 on average for office buildings, it was only allowed to devolve and claim back the amount that was on client departments’ baselines at that stage (2006). This effectively decreased the average tariff to R 4.74/m2. Since the devolution in 2006, this charge has increased on average by 19% per annum as approved by National Treasury. The financial impact of this adjustment is that the average charge has increased from approximately R4.74/m2 to R11/m2 for office buildings. However, different facility types are charged out at different rates.
It is important to note that only the total amount allocated per client is adjusted annually when allocations are made by the National Treasury. The main reason for this is that the Immovable Asset Register improvement project has not yet generated confirmed detail information from which a new tariff structure can be accurately calculated.
The entity also derives revenue from a management fee that it charges clients to administer their municipal services accounts. A 5% fee is charged on the baseline of every invoice issued as a recovery for municipal services paid on their behalf.
Furthermore, the Department generates revenue through the letting of state-owned properties consisting mainly of houses and vacant land. Clients are primarily government departments, government officials and members of the pub-lic. According to the Department’s Rental Debtors Management Policy, properties must be let at market related tariffs. However, due to the poor condition of some properties and other factors impacting on the possible demand of these properties, market related rentals could not be charged.
2.2 Free services
The Department is responsible for cleaning and horticultural services at its own buildings as well as those occupied by the Department of Justice. Currently, the Department is paying the salaries and other operating expenses for these services where it makes use of its own staff to perform these functions. The trading entity (PMTE) pays all expenditure where this service is delivered by means of external contractors. The cost involved for PMTE to perform these functions amounted to R158 million during the 2012/13 financial year.
Report of the Accounting Officer (continued)for the year ended 31 March 2013

144 Department of Public Works | Annual Report 2012/13
3. Capacity ConstraintsThe capacity constraints of the Department relate to a structural fissure and lack of technical and professional skills to deliver on its mandate. The symptoms of this structural fissure is clearly evident in the misalignment of responsibilities and lack of technical competencies which have resulted in the inability to deliver on DPW’s and PMTE (Client Departments) infrastructure programmes in an effective and efficient manner. Five of the 11 Regional Offices had no professional services positions on their structure. This created an environment which is not conducive to service delivery.
During the reporting period, the Department identified 219 technical positions that are vacant. This is indicative of the capacity constraints experienced in order to deliver effectively on infrastructure projects, which is the core business of the Department. In order to address this decisively it was decided to:
• Fill the mentioned vacancies as soon as possible. In this regard, 40% of the positions have been advertised and will be filled in the coming year.
• As a bridging strategy, active in-sourcing of professionals are being pursued to fill this vacuum in the interim. This intervention is intended to:
- Promote a value proposition framework with client departments;
- Reconfigure the service delivery branches of the Department; and
- Build capacity through the engagement of professional firms or individuals.
• Joint teams have been established for critical clients that represent 80% of the infrastructure budgets.
• The Minister further made a plea to retired engineers to make their skills and experience available during the transformation phase of the Department. Individuals that have responded will be considered against vacant technical positions that could not be filled through normal recruitment processes.
4. Utilisation of donor fundsNo donor funds were received during the reporting period.
5.Trading entities and public entities4.1 Property Management Trading Entity (PMTE)
National Treasury approved the establishment of the Property Management Trading Entity in March 2006 to manage the Department’s property portfolio. During the reporting period, the Department took decisive action to implement the PMTE in line with the original approval of the National Treasury. An interim solution was conceptualized in terms of structure, systems and human resource requirements. This solution was implemented on 1 April 2013 and also focused on the accounting and reporting requirements that is required for this entity. Although it is only a requirement for all trading entities to adopt the GRAP principles of accounting as from the 2013/14 financial year, it was decided to accommodate an early adoption of GRAP as from 1 April 2012 and align all accounting and reporting templates and processes accordingly.
The adoption of the interim solution for the PMTE will now clearly segregate the functions of the PMTE and DPW’s Main Account. All the current Asset and Property Management functions within DPW will formally be transferred to the PMTE and henceforth be reported on as part of the PMTE’s operations. This is a distinct departure from the historical dispensation where the PMTE simply operated as an account rather than a fully-functional trading entity. It is foreseen that this intervention to properly establish the PMTE will not only address the negative audit opinions received over the past years but will also improve the financial sustainability of the PMTE going forward.
Report of the Accounting Officer (continued)for the year ended 31 March 2013

Department of Public Works | Annual Report 2012/13 145
As a result of the decision to adopt GRAP accounting principles, the following changes were made with regards to the financial statements for PMTE:
• Included a statement of comparison between budgeted and actual amounts
• Revenue and interest is split between revenue from exchange and non-exchange transactions.
• Commitments are not disclosed in PMTE but only in DPW as the properties are held and disclosed within DPW.
In the medium to long term, it is the intention for the PMTE to be suitably positioned and structured to enhance the capacity of the Department to better deliver on its mandate and to directly contribute towards its strategic objectives. For this purpose it was deemed appropriate to position the PMTE as a formalised Trading Entity under the direct control of the Department.
The envisaged future structure and operating model will in the medium to longer term most probably take the form of a government component and lay the foundation for an organization that will:
a) provide fit-for-purpose accommodation to its user departments at appropriate and competitive rates;
b) generate sufficient funding to finance strategic projects to meet the accommodation needs of clients in the short to medium term; and
c) apply revenue towards the optimisation of the asset portfolio.
The current operating model of the PMTE is undoubtedly impacting on the financial efficiency of the PMTE as well as the liquidity of the trading account. This is, inter alia, evidenced by the bank overdraft as at year end. The PMTE only recovers expenditure incurred on behalf of client departments about 60 to 90 days after payment has been made to suppliers. As part of the future operating model, it will be important in conjunction with National Treasury to reconsider the devolution framework, the recovery process and the most appropriate funding model. A strategy to deal with long outstanding debt has also been developed.
The PMTE is still operating without the relevant financial systems that are critical for enabling compliance with GRAP. The business and technical requirements required in terms of GRAP have been developed and documented. The procurement of the new financial system will be put to the open market during the 2013/14 financial year. In the meantime the PMTE has to continue using the Basic Accounting System (BAS), which is a “cash based” system. All balances have to be manually converted to accrual figures at year-end.
Significant progress has been made in terms of completeness and accuracy of figures especially those relating to prior year balances. Similarly, reporting is also dependent on manual processes which have to be updated on a monthly basis and all accounting treatments (e.g. impairments and discounting) may be subject to human error. To ensure accuracy, reconciliations are done on a monthly basis on all accounts and between operational systems to ensure that any discrepancies are identified and dealt with expeditiously.
Net liability position reported by PMTE
The PMTE reported a net liability position of R879 million as at 31 March 2013 and R1.052 billion as at 31 March 2012.This raises a potential concern relating to the technical solvency of the entity.
The reported net liability position resulted from the fact that the PMTE has been incurring operating deficits primarily as a result of -
• Significant impairments cumulatively amounting to some R1.254 billion as at 31 March 2103. This pertains primarily to historic debt of which the recoverability is considered to be doubtful. The implementation of appropriate systems, processes and enhancement of skills as part of the financial turnaround initiatives will ensure that the
Report of the Accounting Officer (continued)for the year ended 31 March 2013

146 Department of Public Works | Annual Report 2012/13
need to impair accounts receivables is minimized in future. This is already evidenced by the significant reduction in the required impairment by some 79 % from R412 million in the 2011/12 financial year to R83 million during 2012/13.
• Inability of the PMTE to recover all its operating lease expenditure incurred within the leasehold property portfolio due to the ineffective property leasing operating environment. During 2012/13 the deficit between accommodation leasehold income and operating lease expenditure amounted to R253 million compared to a deficit of R346 million in 2011/12. Significant attention is already being given to the operational enhancement of this function and effective management of the leasehold property portfolio. This should have a positive financial impact on future PMTE results.
It should however be noted that for the year ended 31 March 2013, State-owned immovable assets have been reported in the Department’s main vote annual financial statements at a cost of R3.568 billion (see disclosure note 34) – of these 129 273 properties were disclosed at R1 each. In the next financial year, these assets will be transferred to the PMTE in line with the PMTE’s proposed business case and operating model. It is planned to have these assets fair valued in line with GRAP requirements applicable to the PMTE. When it is reported on in the PMTE’s financial statements, this will result in a significant turnaround from a net liability to net asset position. The implication of the transfer will be that PMTE would no longer reflect a technically insolvent position as assets and liabilities will be contained in the same set of financial statements and this would be far more representative of the financial position of the entity.
Despite the reported net liability position, the ability of PMTE to meet its obligations in the foreseeable future and to continue as a going concern remains secure. This is supported by the budgeted cash flow forecasts, access to funding generated from its operating activities and the augmentation allocation the PMTE receives annually from National Treasury. The current bank overdraft of some R1.4 billion is directly as a consequence of the PMTE’s operating model whereby it first pays for client expenditure and invoices and recovers afterwards from the affected parties. This timing difference of up to 90 days results in PMTE effectively providing bridging finance to its clients. The PMTE business model must be aligned to provide the most viable solution for both the PMTE and its clients.
5.2 Public entities
5.2.1 cidb
For the financial year 2012/13 the cidb received a grant of R68 million from the Department. A further amount of R43 million was generated in the form of revenue from registrations, as well as other income of R5 million. The total income for the reporting period was R115 million for the year.
The net operating deficit for the financial year was R7 million. This was funded from the accumulated surplus of R59 million carried over from the previous financial year.
The cidb performance achievement according to the approved performance plan was satisfactory.
5.2.2 IDT
The financial year ended 31 March 2013 has been a challenging one for the Independent Development Trust (IDT). The programme portfolio it implemented for client departments grew by over 30% from the 2011/12 financial year to achieve programme expenditure of R5.6 billion. This delivery was achieved despite resources remaining largely unchanged from the previous year.
Management fees charged to client departments grew by more than 33% compared with the previous year to R189 million. Investment income totalled R13 million due to the diminishing investment fund which stood at R170 million at the end of the financial year. The allocation from Treasury of R 51 million assisted in reducing the deficit for the financial year to R111million.
Report of the Accounting Officer (continued)for the year ended 31 March 2013

Department of Public Works | Annual Report 2012/13 147
The cost containment strategy, implemented during the financial year, and aimed at ensuring enhanced efficiencies and the better utilisation of resources, was an enabling factor in containing the operational costs. The organisation has focused on the delivery of infrastructure and reduced its social facilitation deliverables as it awaits confirmation of its mandate which should be finalised 2013/2014 financial year. By so doing the total operational costs have been limited to R370 million.
The IDT’s focus in the coming financial year is on increasing the level of management fees, with the support of the Department and National Treasury. Failure to increase the managment fees will reult in the IDT not remaining a going concern.
5.2.3 Agrément Board
The Department has experienced problems to secure transfer payments to this institution because its mandate and legal status has not yet been formally established in terms of legislation. The Department has now initiated formal processes to correct this.
The overall financial performance of the entity has been satisfactory during the reporting period. It shows an overall 2% increase in revenue to R10 million. On the other hand overhead costs reduced by 8% during the year contributing to a 107% increase in net margin.
5.2.4 Council for the Built Environment
In line with the MTEF allocation, R27 million was received as a transfer payment from the Department. A secondary transfer of R708 000 was subsequently, made bringing the total grant received to R28 million. This allocation was used to pursue the following strategic areas:
• Implementation of processes and systems geared at optimizing delivery of the mandate;
• Driving the skills development for the transformation of the built environment;
• Facilitating the participation of the built environment professions in pursuit of national strategic objectives; and
• Promoting and enforcing professional ethics to ensure public safety within the built environment.
Interim financial results indicate minor movements within key financial components. Overall expenditure declined by 2% due to:
• A decrease in operating expenditure due to a decline of spending on bursaries
• Reduction in the use of consultants
Assets increased by 29% due to the capital investment made on property plant and equipment.
5.2.5 Parliamentary Village Management Board
In accordance with the mandate of the Board, an amount of R8 million was transferred to the Board during the reporting period.
5.2.6 Construction Sector Education Training Authority
In support of training and skills development in the construction industry, an amount of R1,260 million was transferred during the reporting period to the Construction SETA.
Report of the Accounting Officer (continued)for the year ended 31 March 2013

148 Department of Public Works | Annual Report 2012/13
6. Organisations that received transfer payments6.1 EPWP: Integrated grant for Provinces and Municipalities
In the 2012/13 financial year, the EPWP Integrated grant for Provinces and EPWP Integrated grant for Municipalities were changed from a schedule 8 grant to a schedule 5 grant for Provinces and Schedule 6 grant to Municipalities. This was mainly because of the low uptake of the incentive grant by different public bodies when the grant was a schedule 8 grant and public bodies were paid according to their performance.
The change of the schedule of the grants implies that the grants are now planning and performance based. At the beginning of the relevant financial year, 40% of the grant allocation is disbursed to eligible provinces and municipalities based upon them signing an incentive agreement detailing the projects that they are going to implement. The first disbursement for provincial departments was made in May 2012 with two further disbursements in August 2012 and November 2012. For Municipalities, the first disbursement was made in August 2012 with two further disbursements in November 2012 and February 2013. The second and third disbursements of the integrated grant consists of tranches of 30% each and depends on public bodies submitting relevant financial reports and implementing projects according to the relevant business plan.
The change of the schedule of the integrated grant has enabled all the eligible public bodies to access funds and all funds were disbursed. Some of the public bodies have experienced challenges in implementing projects but the Department is providing technical support to the different public bodies to ensure that they implement the different projects and spend their funds.
For the Social sector and the Non-State sector funds have been disbursed to the relevant Provincial Departments and Non-State organisations.
6.2 Devolution of property rates funds to Provinces:
Prior to 1994, the Department was the custodian / owner of most state-owned properties and therefore took the responsibility for the payment of municipal property rates. This continued until the 1st April 2008 when the function and payments of approxiately 50 000 properties were transferred to respective provinces. The funds for the payment of property rates to municipalities were devolved in the form of Conditional Grant. During 2012/13, an allocation of R1.919 billion was made available to the Provinces for the payment of property rates and R1.802 billion (including the approved roll over), was spent by the provinces.
The Department transferred R1.798 billion to the provincial public works departments. This is equivalent to 94% of the allocated budget of R1.919 billion. Kwa-Zulu Natal Provincial Department of Public Works declared a saving of R120 million while Western Cape, Free State and Mpumalanga together had declared shortfall of R109 million of their allocation.
6. Public Private Partnerships (PPP)The Department participates in a PPP for the outsourced provision of Fleet Management Services through the National Department of Transport. The PPP provides full maintenance lease vehicles as per the requirement from each Depart-ment. The contract is a 5 year contract which commenced in November 2006 and ended in November 2011. However, the contract was extended with a further two years in November 2011 until November 2013.
Report of the Accounting Officer (continued)for the year ended 31 March 2013

Department of Public Works | Annual Report 2012/13 149
8. Corporate governance arrangementsThe nature and extent of prior years’ findings was a compelling indicator to take decisive action to remedy the root causes affecting the effectiveness of operations of the Department. An analysis done by the department in collaboration with the National Treasury set the direction for multiple interventions to address matters of regularity, internal controls enhancement and enforcement. This also informed fundamental transformation initiatives to improve efficiencies to deliver on the department’s mandate. From this review, it was clear that challenges were not localised in any particular function or office of the department but was rather a general trend. Due to the nature and extent of the problem, it was decided to target a number of critical functions to urgently stabilise operations on a wide front. This led to the initiation of stabilisation interventions focussing on updating the Immovable Asset Register, performing a comprehensive review of all private leases that the department is currently contractually bound to, and, conducting a comprehensive review of all finance and supply chain functions. These interventions are further elaborated on in more detail in other sections of this report.
A number of additional governance mechanisms were established to enforce corrective action where discrepancies were identified. The operationalization of a Compliance and Inspectorate unit in Head Office and all regions was an intervention to pro-actively avoid the occurrence of irregular and unauthorised activities. Furthermore an Action Plan Committee was established as an oversight structure monitoring interventions to address the root causes of core find-ings raised by the Auditor – General as well as management.
At a senior management level and as a direct support of these initiatives, an Accountability EXCO was also established to oversee the progress and results from these interventions in order to steer the department towards an improved audit outcome. These mechanisms have had significant impact as progress is actively managed, reported on and senior man-agers are held accountable for progress with corrective action.
9. Discontinued activities / activities to be discontinuedNo activities were discontinued during the reporting period.
10. New / proposed activitiesNo new activities were initiated during the reporting period.
Report of the Accounting Officer (continued)for the year ended 31 March 2013
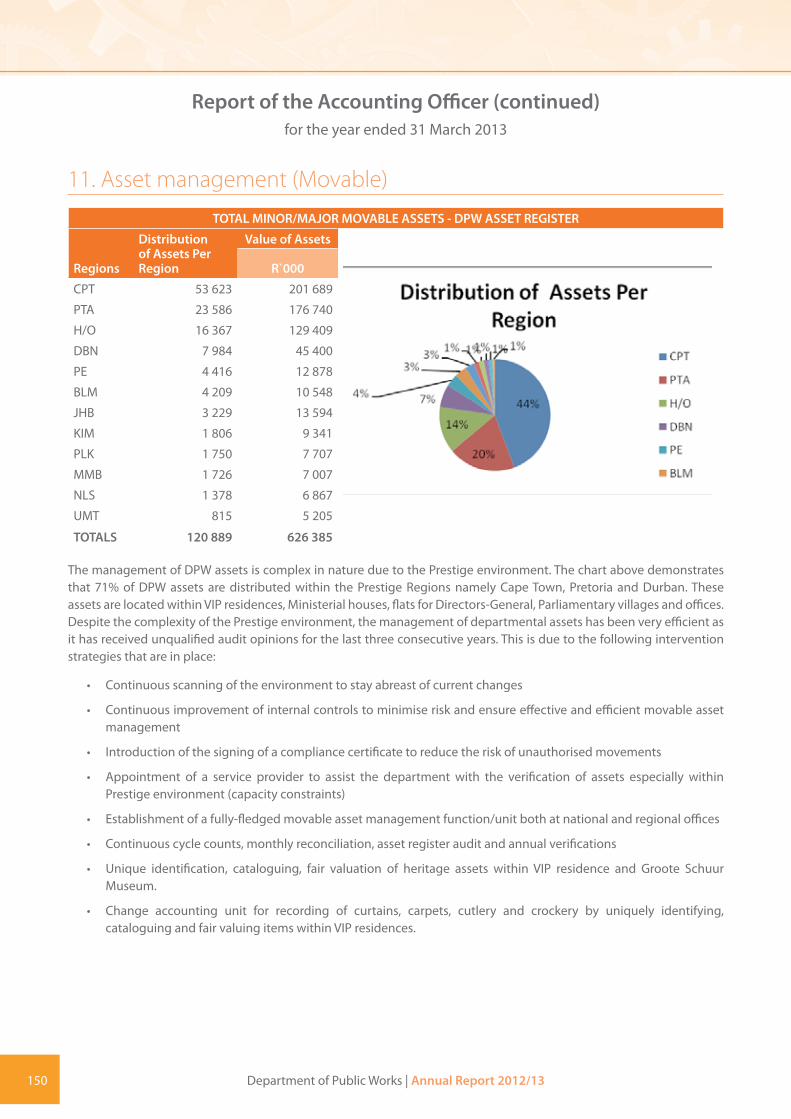
150 Department of Public Works | Annual Report 2012/13
11. Asset management (Movable)
TOTAL MINOR/MAJOR MOVABLE ASSETS - DPW ASSET REGISTER
Regions
Distribution of Assets Per Region
Value of Assets
R`000
CPT 53 623 201 689
PTA 23 586 176 740
H/O 16 367 129 409
DBN 7 984 45 400
PE 4 416 12 878
BLM 4 209 10 548
JHB 3 229 13 594
KIM 1 806 9 341
PLK 1 750 7 707
MMB 1 726 7 007
NLS 1 378 6 867
UMT 815 5 205
TOTALS 120 889 626 385
The management of DPW assets is complex in nature due to the Prestige environment. The chart above demonstrates that 71% of DPW assets are distributed within the Prestige Regions namely Cape Town, Pretoria and Durban. These assets are located within VIP residences, Ministerial houses, flats for Directors-General, Parliamentary villages and offices. Despite the complexity of the Prestige environment, the management of departmental assets has been very efficient as it has received unqualified audit opinions for the last three consecutive years. This is due to the following intervention strategies that are in place:
• Continuous scanning of the environment to stay abreast of current changes
• Continuous improvement of internal controls to minimise risk and ensure effective and efficient movable asset management
• Introduction of the signing of a compliance certificate to reduce the risk of unauthorised movements
• Appointment of a service provider to assist the department with the verification of assets especially within Prestige environment (capacity constraints)
• Establishment of a fully-fledged movable asset management function/unit both at national and regional offices
• Continuous cycle counts, monthly reconciliation, asset register audit and annual verifications
• Unique identification, cataloguing, fair valuation of heritage assets within VIP residence and Groote Schuur Museum.
• Change accounting unit for recording of curtains, carpets, cutlery and crockery by uniquely identifying, cataloguing and fair valuing items within VIP residences.
Report of the Accounting Officer (continued)for the year ended 31 March 2013

Department of Public Works | Annual Report 2012/13 151
12. InventoriesAs a result of the change in accounting policy from historical cost to weighted average cost, the opening balance of inventories held at cost of R12 million has been restated to R5.7 million, representing 580 803 units. The breakdown of the inventories for the financial year 2012/2013 is as follows:
Table 4: Balances of inventories
INVENTORY2012/2013 2011/2012
Quantity R’ 000 Quantity R’ 000
Opening balance 580 803 5 674 662 628 8 321
Add (less): Adjustment to prior year balances - 4 932 (114)
Add: Additions / Purchases – Cash 1 064 142 38 129 910 007 36 125
Add: Additions – Non cash 6 698 184 24 600 416
(Less): Disposals (41) (2) (5 011) (5)
(Less): Issues (961 535) (31 833) (1 004 676) (30 798)
Add / (Less): Adjustments 5 582 456 (7 678) (8 271)
Closing balance 695 649 12 612 580 802 5 674
13. Events after the reporting date No material events occurred after the reporting period.
14. SCOPA resolutions Initiatives to improve audit outcomes
The Department introduced various projects to improve the audit outcomes within the next two years. Substantial progress has been made during the current financial year with regards to the completeness and accuracy of prior year’s irregular expenditure, completeness of immoveable assets, completeness and disclosure of accruals and related party transactions.
The overall quality of the Annual Financial Statements has been improved for both the Department and PMTE. Although the PMTE’s Annual Financial Statements has been prepared in line with Generally Recognized Accounting Practice, the underlying information and lack of a proper accounting system remains a challenge. Audit Action Plans are in place to address the remaining issues identified in the 2012/13 financial year.
Report of the Accounting Officer (continued)for the year ended 31 March 2013
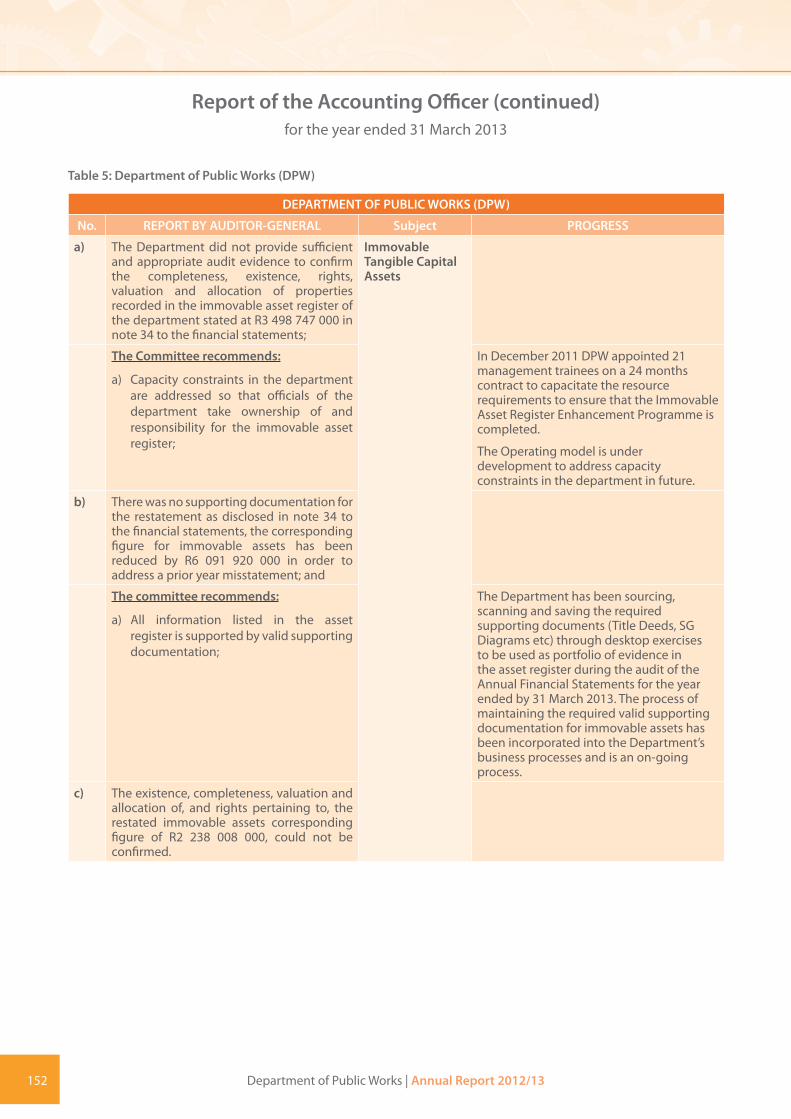
152 Department of Public Works | Annual Report 2012/13
Table 5: Department of Public Works (DPW)
DEPARTMENT OF PUBLIC WORKS (DPW)
No. REPORT BY AUDITOR-GENERAL Subject PROGRESS
a) The Department did not provide sufficient and appropriate audit evidence to confirm the completeness, existence, rights, valuation and allocation of properties recorded in the immovable asset register of the department stated at R3 498 747 000 in note 34 to the financial statements;
Immovable Tangible Capital Assets
The Committee recommends:
a) Capacity constraints in the department are addressed so that officials of the department take ownership of and responsibility for the immovable asset register;
In December 2011 DPW appointed 21 management trainees on a 24 months contract to capacitate the resource requirements to ensure that the Immovable Asset Register Enhancement Programme is completed.
The Operating model is under development to address capacity constraints in the department in future.
b) There was no supporting documentation for the restatement as disclosed in note 34 to the financial statements, the corresponding figure for immovable assets has been reduced by R6 091 920 000 in order to address a prior year misstatement; and
The committee recommends:
a) All information listed in the asset register is supported by valid supporting documentation;
The Department has been sourcing, scanning and saving the required supporting documents (Title Deeds, SG Diagrams etc) through desktop exercises to be used as portfolio of evidence in the asset register during the audit of the Annual Financial Statements for the year ended by 31 March 2013. The process of maintaining the required valid supporting documentation for immovable assets has been incorporated into the Department’s business processes and is an on-going process.
c) The existence, completeness, valuation and allocation of, and rights pertaining to, the restated immovable assets corresponding figure of R2 238 008 000, could not be confirmed.
Report of the Accounting Officer (continued)for the year ended 31 March 2013

Department of Public Works | Annual Report 2012/13 153
DEPARTMENT OF PUBLIC WORKS (DPW)
No. REPORT BY AUDITOR-GENERAL Subject PROGRESS
The committee recommends:
The asset register is updated and maintained throughout the year and adheres to the requirements for asset registers by National Treasury; and
a) Valuation of assets is done in accordance with the applicable accounting framework.
The Department of Public of Works (DPW) has completed the desktop analysis in verifying and validating the properties belonging to National Government under DPW’s custodianship against the Deeds Data, Chief Surveyor-General Data, National and Provincial Immovable Asset Registers. DPW is currently reconciling the properties against the latest Deeds data to track movements in property ownership since the initial analysis.
The verified and validated properties determine the scope of work for physical verification which will commence in the 2013/14 financial years. DPW’s IAR is being maintained and updated on a regular basis by the management trainees at Head Office. In compliance with the applicable accounting frameworks the Department will also apply a fair value model and capitalisation practices as a means of establishing meaningful, consistent and reliable deemed cost for its immovable assets.
a) The department did not have an adequate system in place for identifying and recognizing all irregular expenditure. The completeness of irregular expenditure relating to the current year stated at R1 396 000 (2010: R27 402 000) in note 26 to the financial statements could not be confirmed;
Irregular Expenditure
The committee recommends:
a) The completion of the deviation registers is made compulsory for the head office and regional offices. This is not only for the awarding of tenders , but also where the required number of quotations was not obtained;
The reporting of deviations has been made compulsory through SCM Circular 16 of 2012. In addition a centralized reporting repository has been set in place within the Paper -Trail System to ensure that all the offices upload the deviations within the system as soon as they occur on a weekly basis. All the relevant officials have been trained to ensure that they report accordingly in the system.
Compliance to the reporting requirements has not been adequate and measures are being put in place to follow up outstanding deviation reports from the relevant business units.
b) Irregular expenditure was understated with R16 552 542 due to payments that were made in contravention of supply chain management requirements not being included in irregular expenditure relating to the current year, disclosed at R1 396 000 in note 26 to the financial statements; and
Report of the Accounting Officer (continued)for the year ended 31 March 2013

154 Department of Public Works | Annual Report 2012/13
DEPARTMENT OF PUBLIC WORKS (DPW)
No. REPORT BY AUDITOR-GENERAL Subject PROGRESS
The Committee recommends:
The deviations are monitored, investigated and discussed at top management level, and appropriate disciplinary action is taken immediately against responsible officials where deviations were not justified;
A report on deviations is sent through to the CFO and the ACD: SCM. Such a report is also availed to the Stabilization Team both for quotations and bids. Within the Audit Action. A consolidated report of deviation for transactions above a million has been prepared and presented to management. In respect of transactions below R500 000 a deviation report has also been compiled.
A new circular has also been put in place to devolve the management of deviations to the regions and so as to hold the relevant managers accountable. At national level the delegation for consideration and approval of these deviations has been placed at the National Bid Adjudication Committee.
c) Audit evidence for expenditure transactions with an estimated value of R154 648 753 could not be obtained. The occurrence, accuracy and compliance of goods and services amounting to R819 046 000 and expenditure for capital assets stated at R1 340 569 000 in the statement of financial performance, could not be verified.
The Committee recommends:
Supply chain management policies are updated and circulars to this effect issued, and monitoring controls are strengthened to ensure adherence;
As is SCM policy, designed to incorporate the circular and changes that were effected during the 2012/13 financial is in the process of being finalized by the Financial Service Provider that was appointed in December 2012 for approval by the Accounting Officer.
The Committee recommends:
Capacity constraints in the internal audit are addressed to ensure that all allegations are responded to timeously; and
The Department is considering enhancing the structure of the Unit to ensure that it is adequately and appropriately resourced. The work-study has been commissioned to ensure that the Unit is appropriately structured.
Recruitment process for some of the approved proposed position is underway.
A panel of three service providers has been appointed for two years as a short term measure to address the capacity issue.
The Committee recommends:
A comprehensive policy with corresponding procedures is implemented to ensure proper record-keeping.
We have finalized the records management policy. It is in the process of being rolled out to the Regions.
There is also a task team that has been established by the meeting of the Minister with the Executive Managers to come up with better records management systems for implementation throughout the department.
Report of the Accounting Officer (continued)for the year ended 31 March 2013

Department of Public Works | Annual Report 2012/13 155
DEPARTMENT OF PUBLIC WORKS (DPW)
No. REPORT BY AUDITOR-GENERAL Subject PROGRESS
a) Audit evidence could not be obtained for the restatement of the comparative for operating leases of R115 039 000;
Lease Commitments
b) The obligation, valuation and classification of the operating lease commitments corresponding figure of R115 039 000 as disclosed in note 24.1 to the financial statements, could not be confirmed;
The Committee recommends:
Sufficient audit evidence is made available on time for all disclosure notes in the financial statements, for audit purposes.
Audit evidence was provided for the year ended 31 March 2013 except transactions that relate to PMTE which is under review.
The Committee recommends:
Control measures are implemented to ensure completeness of information disclosed
Implementation of control measures are being implemented, but not yet addressing completeness.
c) Information technology (IT) finance leases entered into in April 2009 were not included in the finance lease commitments during the prior year. Available lease registers did not contain the commitments as at the end of the prior year. The completeness of the finance lease commitments of the prior year, amounting to R7 797 000 as disclosed in note 24.3 to the financial statements, could not be confirmed.
The Committee recommends:
Officials at regional offices are capacitated and trained to perform these functions.
A Financial Statement Framework was introduced by Head Office to capacitate regions where officials can perform the function effectively. This control was developed to ensure that all commitments are disclosed in the AFS. All officials at regional offices were trained between January and February 2013.
Report of the Accounting Officer (continued)for the year ended 31 March 2013

156 Department of Public Works | Annual Report 2012/13
DEPARTMENT OF PUBLIC WORKS (DPW)
No. REPORT BY AUDITOR-GENERAL Subject PROGRESS
a) Claims against the department amounting to R5 095 376 were not included in the contingent liabilities disclosed. Furthermore, the department did not perform any assessment as to the most likely settlement amounts. The valuation and completeness of claims against the department stated at R29 395 000 in note 20 to the financial statements could not be confirmed;
Contingent Liabilities
The Committee recommends:
Assessment of claims are documented and included in audit files submitted with thefinancial statement.
Assessment of contingent liabilities is currently documented on a quarterly basis, submitted to both PMTE and DPW team for verification for ultimate inclusion in audit files submitted with the financial statement.
b) Contingent liabilities were understated by R3 636 000 due to unconfirmed interdepartmental balances not being included in disclosure note 20 to the financial statements.
The Committee recommends:
A reconciliation of the claims disclosed in the department and those disclosed in the Property Management Trading Entity is performed to ensure completeness of disclosures.
There are teams currently set up comprising PMTE and DPW working hand in hand with Legal Services to ensure accuracy and completeness of disclosures in the financial statements in order to avoid understatement.
a) As disclosed in note 30 to the financial statements, the department is participating in a PPP for the lease of vehicles. However, neither lease expenditure nor lease commitments have been included in the disclosure note;
Public Private Partnership
The Committee recommends:
Monitoring controls are implemented to ensure that disclosures are in line with the prescribed accounting framework.
It was successfully performed for the year ended 31 March 2013.
b) Lease expenditure for the current year was understated by R19 955 610 (R17 400 000 for the prior year), but the department’s accounting records did not permit the quantification of the omission of prior year lease expenditure;
c) The extent to which the lease expenditure of the prior year and the lease commitments of the current year had been understated could not be determined.
The Committee recommends:
A comprehensive policy with corresponding procedures is implemented to ensure proper record-keeping.
No policy except the AFS framework developed in line with the Preparation Guide issued by National Treasury.
Report of the Accounting Officer (continued)for the year ended 31 March 2013

Department of Public Works | Annual Report 2012/13 157
Table 5: Property Management Trading Entity (PMTE)
PROPERTY MANAGEMENT TRADING ENTITY (PMTE)
No. REPORT BY AUDITOR-GENERAL Subject PROGRESS
a) The entity did not have adequate systems for identifying and recognizing all irregular expenditure. The completeness of irregular expenditure relating to the current year stated at R138 637 000 (2010: R264 180 000) in note 12 to the financial statements could therefore not be confirmed;
Irregular Expenditure
Supply chain management processes are validated by Inspectorate and Compliance before appointment is finalized. All batches relating to financial year 2012/2013 have been checked to ensure completeness of irregular expenditure.
The Committee recommends:
d)The planned project, to implement a system that enables continuous financial reporting in line with the requirements of the SA statements of GAAP, is prioritized and finalised as a matter of urgency.
The specification for billing and accounting system will be finalised in 2013/14 and award of bid will also be in 2013/14
b) Payments amounting to R291 668 886 were made in contravention of supply chain management requirements. The amount was not included in irregular expenditure, disclosed in note 12 to the financial statements resulting in irregular expenditure being understated by R291 668 886.
The Committee recommends:
The completion of the deviation registers is made compulsory for head office and regional offices. This is not only for the awarding of tenders, but also where the required number of quotations was not obtained.
The deviation register is submitted to Head Office-SCM monthly by all Regional Offices and Head Office.
Compliance to the reporting requirements has not been adequate and measures are being put in place to follow up outstanding deviation reports from the relevant business units.
The Committee recommends:
The deviations are monitored, investigated and discussed at top management level, and appropriate disciplinary action is taken immediately against responsible officials where deviations were not justified.
Due to limited capacity in SCM-Head Office, deviations are not yet investigated to enable management to take appropriate actions.
The Committee recommends:
Supply chain management policies are updated and circulars to this effect issued, and monitoring controls are strengthened to ensure adherence.
Supply Chain Management policy is currently being updated to be in line with current updates.
Report of the Accounting Officer (continued)for the year ended 31 March 2013

158 Department of Public Works | Annual Report 2012/13
PROPERTY MANAGEMENT TRADING ENTITY (PMTE)
No. REPORT BY AUDITOR-GENERAL Subject PROGRESS
The Committee recommends:
Capacity constraints in the internal audit unit are addressed to ensure that all allegations are responded to timeously.
The Department is considering enhancing the structure of the Unit to ensure that it is adequately and appropriately resourced. The work-study has been commissioned to ensure that the Unit is appropriately structured.
Recruitment process for some of the approved proposed position is underway.
A panel of three service providers has been appointed for a period of two years as a short term measure to address the capacity issue.
The Committee recommends:
A comprehensive policy with corresponding procedures is implemented to ensure proper record-keeping.
We have finalized the records management policy. It is in the process of being rolled out to the Regions.
There is also a task team that has been established by the meeting of the Minister with the Executive Managers to come up with better records management systems for implementation throughout the department.
The Auditor-General reported that the entity did not have adequate systems for identifying and recognizing all fruitless and wasteful expenditure. The completeness of fruitless and wasteful expenditure of R6 772 000 in note 12 to the financial statements could therefore not be confirmed.
Fruitless and Wasteful Expenditure
The Committee recommends:
Fruitless and wasteful expenditure register is compiled monthly, and management reviews the register to ensure compliance with Treasury Regulations and the Public Finance Management Act (PFMA).
The register of fruitless and wasteful expenditure is compiled monthly and submitted to National Treasury in compliance with Treasury Regulations and the Public Finance Management Act.
The register is reviewed by each Head of Finance and SCM at Regional Offices and Directorate: Inspectorate & Compliance at Head Office and also the consolidated register.
The Committee recommends:
The entity implements adequate and appropriate systems to identify unutilized or underutilized buildings so as to avoid fruitless and wasteful expenditure.
The Rehabilitation programme is funded by National Treasury and is aligned to UAMPs and CAMP. Consultants are to be appointed to determine highest and best practice use. The programme will be aligned to the Green Building Framework. It will include Facilities management and marketed to users. Action and Implementation Plans have been developed.
Report of the Accounting Officer (continued)for the year ended 31 March 2013
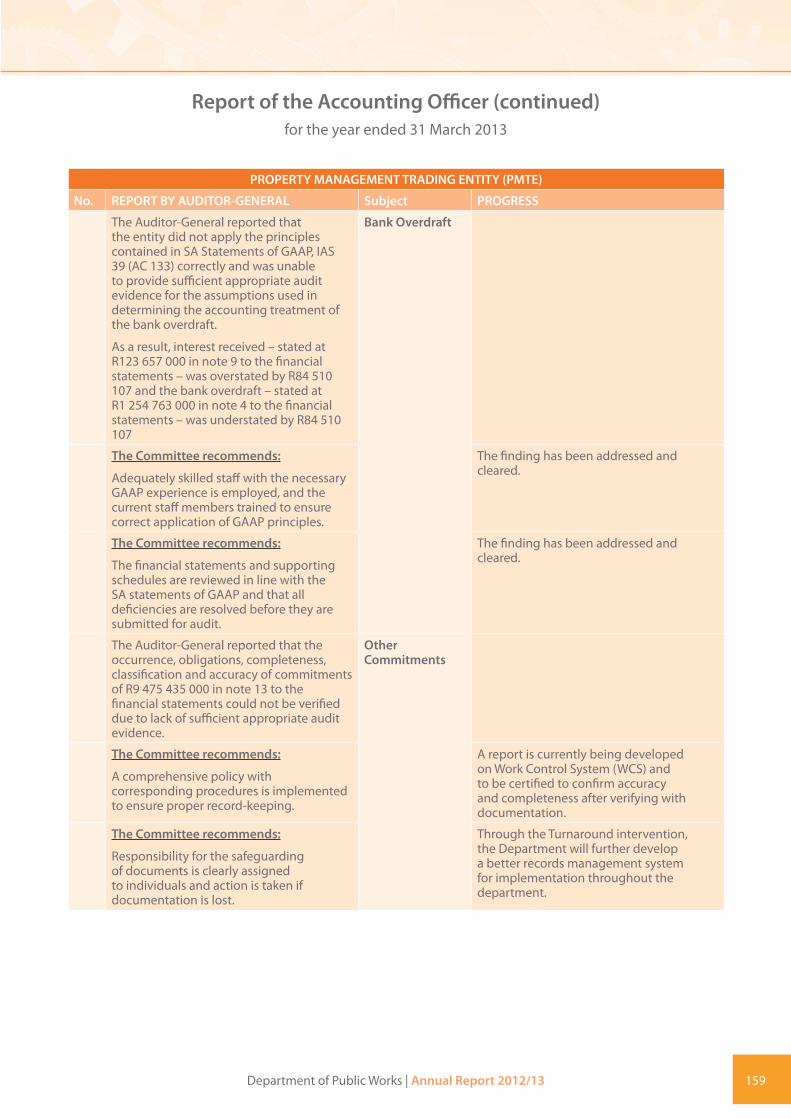
Department of Public Works | Annual Report 2012/13 159
PROPERTY MANAGEMENT TRADING ENTITY (PMTE)
No. REPORT BY AUDITOR-GENERAL Subject PROGRESS
The Auditor-General reported that the entity did not apply the principles contained in SA Statements of GAAP, IAS 39 (AC 133) correctly and was unable to provide sufficient appropriate audit evidence for the assumptions used in determining the accounting treatment of the bank overdraft.
As a result, interest received – stated at R123 657 000 in note 9 to the financial statements – was overstated by R84 510 107 and the bank overdraft – stated at R1 254 763 000 in note 4 to the financial statements – was understated by R84 510 107
Bank Overdraft
The Committee recommends:
Adequately skilled staff with the necessary GAAP experience is employed, and the current staff members trained to ensure correct application of GAAP principles.
The finding has been addressed and cleared.
The Committee recommends:
The financial statements and supporting schedules are reviewed in line with the SA statements of GAAP and that all deficiencies are resolved before they are submitted for audit.
The finding has been addressed and cleared.
The Auditor-General reported that the occurrence, obligations, completeness, classification and accuracy of commitments of R9 475 435 000 in note 13 to the financial statements could not be verified due to lack of sufficient appropriate audit evidence.
Other Commitments
The Committee recommends:
A comprehensive policy with corresponding procedures is implemented to ensure proper record-keeping.
A report is currently being developed on Work Control System (WCS) and to be certified to confirm accuracy and completeness after verifying with documentation.
The Committee recommends:
Responsibility for the safeguarding of documents is clearly assigned to individuals and action is taken if documentation is lost.
Through the Turnaround intervention, the Department will further develop a better records management system for implementation throughout the department.
Report of the Accounting Officer (continued)for the year ended 31 March 2013
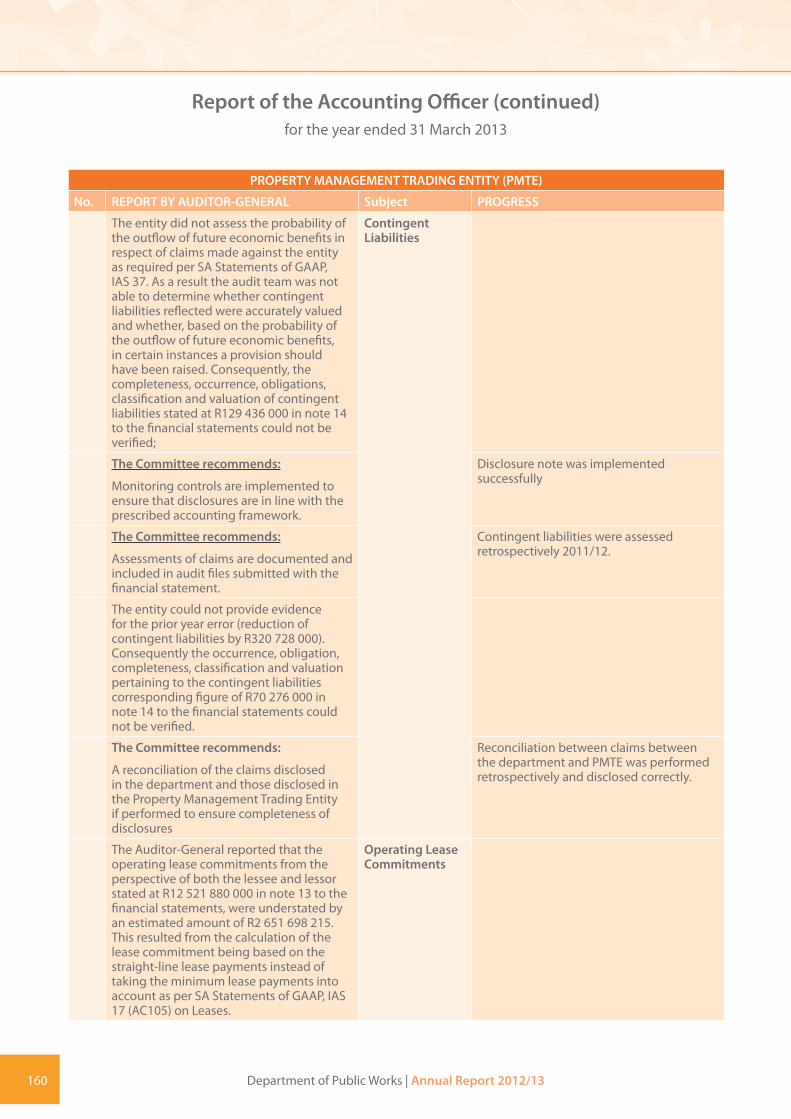
160 Department of Public Works | Annual Report 2012/13
PROPERTY MANAGEMENT TRADING ENTITY (PMTE)
No. REPORT BY AUDITOR-GENERAL Subject PROGRESS
The entity did not assess the probability of the outflow of future economic benefits in respect of claims made against the entity as required per SA Statements of GAAP, IAS 37. As a result the audit team was not able to determine whether contingent liabilities reflected were accurately valued and whether, based on the probability of the outflow of future economic benefits, in certain instances a provision should have been raised. Consequently, the completeness, occurrence, obligations, classification and valuation of contingent liabilities stated at R129 436 000 in note 14 to the financial statements could not be verified;
Contingent Liabilities
The Committee recommends:
Monitoring controls are implemented to ensure that disclosures are in line with the prescribed accounting framework.
Disclosure note was implemented successfully
The Committee recommends:
Assessments of claims are documented and included in audit files submitted with the financial statement.
Contingent liabilities were assessed retrospectively 2011/12.
The entity could not provide evidence for the prior year error (reduction of contingent liabilities by R320 728 000). Consequently the occurrence, obligation, completeness, classification and valuation pertaining to the contingent liabilities corresponding figure of R70 276 000 in note 14 to the financial statements could not be verified.
The Committee recommends:
A reconciliation of the claims disclosed in the department and those disclosed in the Property Management Trading Entity if performed to ensure completeness of disclosures
Reconciliation between claims between the department and PMTE was performed retrospectively and disclosed correctly.
The Auditor-General reported that the operating lease commitments from the perspective of both the lessee and lessor stated at R12 521 880 000 in note 13 to the financial statements, were understated by an estimated amount of R2 651 698 215. This resulted from the calculation of the lease commitment being based on the straight-line lease payments instead of taking the minimum lease payments into account as per SA Statements of GAAP, IAS 17 (AC105) on Leases.
Operating Lease Commitments
Report of the Accounting Officer (continued)for the year ended 31 March 2013

Department of Public Works | Annual Report 2012/13 161
PROPERTY MANAGEMENT TRADING ENTITY (PMTE)
No. REPORT BY AUDITOR-GENERAL Subject PROGRESS
The Committee recommends:
Adequately skilled staff with the necessary GAAP experience is employed, and the current staff members trained to ensure correct application of GAAP principles.
Staffing has been addressed and training to the current staff will be addressed on continues basis.
The Committee recommends:
The financial statements and supporting schedules are reviewed in line with the SA statements of GAAP and that all deficiencies are resolved before they are submitted for audit.
Internal control measures will be addressed with the implementation of the review and audit of the leases.
The Auditor-General reported that due to the lack of a proper accounting systems for trade receivables and unreconciled individual trade receivable balances at year end, the existence, completeness, valuation, rights and obligations of related party balances as well as the occurrence, completeness, accuracy, cut-off and classification of related party transactions, as disclosed in note 15 of the financial statements, could not be verified.
Related Party Transactions
The Committee recommends:
Adequately skilled staff with the necessary GAAP experience is employed, and the current staff members trained to ensure correct application of GAAP principles.
Staffing has been addressed and training to the current staff will be addressed on continues basis.
The Committee recommends:
The financial statements and supporting schedules are reviewed in line with the SA Statements of GAAP and that all deficiencies are resolved before they are submitted for audit.
Internal control measures that addresses the review of financial statement and continually improving.
The Committee recommends:
Policies and procedures to regulate the identification and recording of related parties in line with GAAP are developed.
Policy is in place and will be reviewed.
The Committee recommends:
A register to record all related party transactions is implemented.
Transaction and balances are recorded in the schedules and the aged analysis on a monthly basis.
The Auditor-General reported that the entity did not include a narrative note as per the requirements of SA Statements of GAAP, IAS 8 on the nature of the restatements disclosed.
Restatement of Comparative Amounts
Report of the Accounting Officer (continued)for the year ended 31 March 2013

162 Department of Public Works | Annual Report 2012/13
PROPERTY MANAGEMENT TRADING ENTITY (PMTE)
No. REPORT BY AUDITOR-GENERAL Subject PROGRESS
The Committee recommends:
Adequately skilled staff with the necessary GAAP experience is employed, and the current staff members trained to ensure correct application of GAAP principles.
Staffing has been addressed and training to the current staff will be addressed on continues basis
The Committee recommends:
The financial statements and supporting schedules are reviewed in line with the SA statements of GAAP and that all deficiencies are resolved before they are submitted for audit.
Restatements were implemented successfully.
a) The alleged abuse of urgent and emergency procurement as well as the utilization of sole suppliers. The investigation aims to establish whether there was collusion between officials and service providers and to determine any reckless spending of funds. The investigation was still ongoing at the reporting date.
Investigations
b) Irregular expenditure in respect of the leasing of properties as well as an alleged irregular award of a tender and the incapacity of a contractor to fulfill his duties.
c) Complaints and allegations of maladministration and improper and unlawful conduct by the Department of Public Works and the South African Police Service relating to the leasing of office accommodation in Pretoria.
d) Complaints and allegations of maladministration and improper and unlawful conduct by the Department of Public Works and the South African Police Service relating to the leasing of the South African Police Service’s office accommodation in Durban.
The Committee recommends:
The committee notes the reported investigations, urges the Accounting Officer to ensure their finalization without unnecessary delay, and to apply whatever corrective measures necessary to recover all and any monies found to have been irregular expended.
The investigation has been finalised and disciplinary proceedings have been initiated against an official who was implicated in the identified anomalies. A criminal case has been registered with the SAPS. Works Manager was found guilty and sanctioned to 3 months suspension without pay for failure to declare his relationship to an entity that he awarded contracts to company owned by his son.
Report of the Accounting Officer (continued)for the year ended 31 March 2013
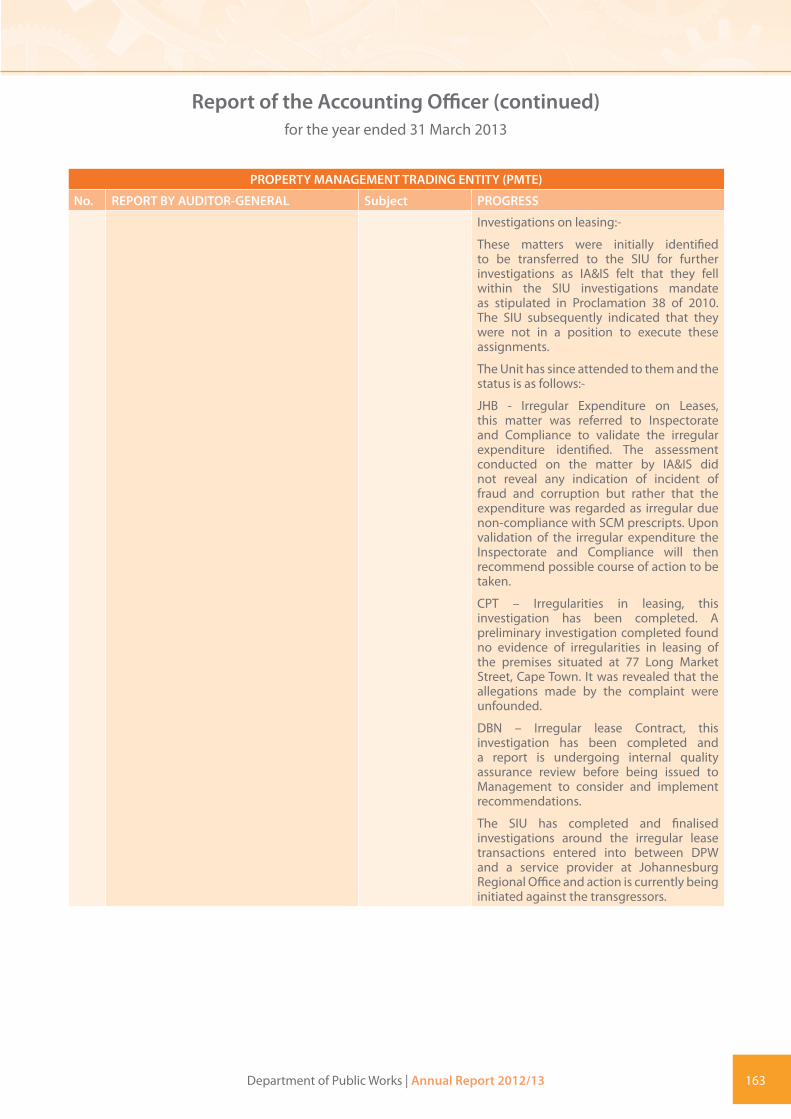
Department of Public Works | Annual Report 2012/13 163
PROPERTY MANAGEMENT TRADING ENTITY (PMTE)
No. REPORT BY AUDITOR-GENERAL Subject PROGRESS
Investigations on leasing:-
These matters were initially identified to be transferred to the SIU for further investigations as IA&IS felt that they fell within the SIU investigations mandate as stipulated in Proclamation 38 of 2010. The SIU subsequently indicated that they were not in a position to execute these assignments.
The Unit has since attended to them and the status is as follows:-
JHB - Irregular Expenditure on Leases, this matter was referred to Inspectorate and Compliance to validate the irregular expenditure identified. The assessment conducted on the matter by IA&IS did not reveal any indication of incident of fraud and corruption but rather that the expenditure was regarded as irregular due non-compliance with SCM prescripts. Upon validation of the irregular expenditure the Inspectorate and Compliance will then recommend possible course of action to be taken.
CPT – Irregularities in leasing, this investigation has been completed. A preliminary investigation completed found no evidence of irregularities in leasing of the premises situated at 77 Long Market Street, Cape Town. It was revealed that the allegations made by the complaint were unfounded.
DBN – Irregular lease Contract, this investigation has been completed and a report is undergoing internal quality assurance review before being issued to Management to consider and implement recommendations.
The SIU has completed and finalised investigations around the irregular lease transactions entered into between DPW and a service provider at Johannesburg Regional Office and action is currently being initiated against the transgressors.
Report of the Accounting Officer (continued)for the year ended 31 March 2013

164 Department of Public Works | Annual Report 2012/13
PROPERTY MANAGEMENT TRADING ENTITY (PMTE)
No. REPORT BY AUDITOR-GENERAL Subject PROGRESS
Investigation on Irregular awarding of ten-der and incapacity of contractor to fulfill his duties has been completed and report issued. A case of possible misrepresentation against the contractor will be reported to the SAPS. The investigation report further made numerous recommendations to be considered for implementation by the DPW SCM Unit to curb future reoccurrences of identified weaknesses in the evaluation methods utilised to evaluate bids and ap-pointment of successful bidders. The De-partment is considering referring the matter to SAPS for further investigation on recom-mendations by the AGSA to consider such.
Report of the Accounting Officer (continued)for the year ended 31 March 2013

Department of Public Works | Annual Report 2012/13 165
15 Corrective action based on prior audit reports
DEPARTMENT OF PUBLIC WORKS
Nature of qualification, disclaimer, adverse opinion and matter of non-
complianceFinancial year in which it first arose Progress made in clearing /
resolving the matter
Audit opinion obtained in the various comparative financial years
• 2008/09 Qualified opinion
• 2009/10 Qualified opinion
• 2010/11 Disclaimer of opinion
• 2011/12 Disclaimer of opinion
See detail below
Immovable assets
The Department did not have a complete asset register of all immovable properties belonging to the national government under the custodianship of the Department of Public Works, as disclosed at R1 in note 31.3.
· 2008/2009 Phase 1: Completed Deeds reconciliation to determine deemed national and provincial properties.
Phase 2 : Reconciliation of national and provincial IAR’s to be completed by 31/03/2013
An Immovable Asset register has been prepared and reconciled to Deeds office database, this register will agree to AFS and includes all registered land parcels with structures thereon.
Irregular Expenditure
Section 38(1)(a)(iii) of the PFMA requires the Department to implement and maintain an appropriate procurement and provisioning system that is fair, equitable, transparent, competitive and cost-effective.
The Department did not have an adequate system in place to identifying and recognizing all irregular expenditure and there were satisfactory alternative procedures to obtain reasonable assurance that all irregular expenditure had been recorded.
· 2009/2010 The policy on irregular expenditure has been reviewed to address all shortcomings identified. Officials have been trained on identifying irregular expenditure. As phase 1 to address the irregular expenditure, the Department has as per AGSA recommendation, embarked on a project to check all payments processed from financial year 2009/10 to 2011/2012. The department completed the review of these batches for the Main Vote . For PMTE, only the current year were reviewed. The PMTE prior year will be resumed as soon as the audit has been completed.
The Department has further implemented Inspectorate and Compliance function. All payments are currently checked by Inspectorate and Compliance directorate. Officials have been employed for regional offices as well .
Operating leases
Sufficient appropriate audit evidence for operating lease expenditure transactions not provided.
· 2010/11 The Department has reconciled all leases from 2006 in order to identify all transaction that must be disclosed
Report of the Accounting Officer (continued)for the year ended 31 March 2013

166 Department of Public Works | Annual Report 2012/13
DEPARTMENT OF PUBLIC WORKS
Nature of qualification, disclaimer, adverse opinion and matter of non-
complianceFinancial year in which it first arose Progress made in clearing /
resolving the matter
Receivables for departmental revenue
Adequate system not in place to maintain records of all properties rented out by the department. The list of properties currently rented out could not be reconciled with the departments immovable asset register.
· 2011/12 Compilation of the Immovable Asset Register fully underway.
Lease module to be compiled post physical verification of the immovable assets.
Lease commitments – Operating lease Revenue
Actual lease agreements could not be submitted. Understatement of lease commitments where lease contracts were submitted. Additionally, in the absence of a complete and accurate immovable asset register the AGSA could not determine whether the department has completely accounted for operating lease revenue commitments with respect to all state-owned properties currently rented out by the department.
· 2010/11 Lease agreements have been provided and quantification of lease commitments determined on the basis of lease agreements.
Commitments
Cost Price Adjustment Provision (CPAP)commitments could not be supported with appropriate audit evidence
· 2011/12
Manual calculations will be performed for the current year, until investigations are finalised on the PMIS/IE-Works/WCS capability.
Related party transactions
The department was unable to supply sufficient appropriate audit evidence in support of the assumptions used for indirect costs.
· 2011/12 Develop checklist as per framework to identify transactions on disclosure note (where transactions were not at arm’s length).
Related party transactions to be disclosed in line with National Treasury directives.
Report of the Accounting Officer (continued)for the year ended 31 March 2013

Department of Public Works | Annual Report 2012/13 167
PMTE
Nature of qualification, disclaimer, adverse opinion and matter of non-
complianceFinancial year in which it first arose Progress made in clearing /
resolving the matter
Audit opinion obtained in the various comparative financial years
• 2008/09 Adverse (incorrect accounting framework applied and trade receivables)
• 2009/10 Qualified opinion
• 2010/11 Disclaimer of opinion
• 2011/12 Disclaimer
See detail below
Irregular, fruitless and wasteful expenditure
• Completeness of irregular expenditure
• Completeness of fruitless and wasteful expenditure
• 2009/10 Irregular Expenditure
• Current year 2012/13 analysis completed and results included in the Annual Financial Statements
• Prior years – (2009/10 to 2011/12) completed. Department Public Work prior years irregular expenditure was prioritized
Fruitless and wasteful expenditure
• Identified through the irregular exercise and updated (see above)
Trade and Other Receivables
• Trade and other receivables: Lack of appropriate audit evidence to support balance
• Trade and other receivables: Lack of appropriate audit evidence to support impairment balance
• Trade and other receivables: Could not provide evidence that they correctly applied IAS 39 on initial recognition of financial assets using the effective interest rate method (discounting)
• Trade and other receivables: Lack of proper accounting system and un-reconciled individual trade receivable accounts
• Trade and other receivables: Straight lining of leases incorrect as based on PMIS (PMIS does not agree to the lease agreements
• 2008/09 Trade and Other Receivables
• Private Leases: Reconstructions (step 1) performed from 2006 to date (have invoice and proof of payments to support age analysis amounts) Step 2 performed for current year Steps 3-5 to be done in 2013/2014
• Other debtors – Step 5 completed
Reconstruction Steps followed-
1. Verified invoices, credit notes and payments received to supporting documents Payments received verified to BAS (2006 to date)
2. Reconciled what was invoiced to the expense paid in PMIS
3. Matching unallocated receipts to invoices
4. Verifying invoiced amounts to leased agreements (taking Lease verification project findings into account)
5. Client meetings to obtain agreement to amounts owed. Assisting with preparing submissions to National Treasury for collection of prior year funds
Report of the Accounting Officer (continued)for the year ended 31 March 2013

168 Department of Public Works | Annual Report 2012/13
PMTE
Nature of qualification, disclaimer, adverse opinion and matter of non-
complianceFinancial year in which it first arose Progress made in clearing /
resolving the matter
• Impairment assessment done per client for all significant debtors per debtor type
Discounting• Addressed via accounting policies
detail included under significant management judgment and estimates. Clients required paying within 30 days. No credit terms given. Interest charged on non-Government debtors for late payment but not on Government institutions, cannot reliably determine when payment can be expected, therefore transaction cost per accounting policy fair value. Non-payment within 30 days for Government institutions assessed during impairment testing
• Business requirement document drafted for new system and in procurement process. Private leases trade receivable accounts reconstruction complete (step 1 and 2), but reconciliation with client still to take placeLease project results not finalised by year end. However some evaluation/cleanup performed (did not just utilise straight PMIS download).
• Prepayments: Lack of supporting information
• 2011/12 Current year - our workbooks allowed for prepayments identification on rates and taxes and operating leases
• Capital expenditure offset incorrectly against revenue
• 2011/12 • Corrected. Expensed in current year and comparative corrected
Trade and Other Payables• Trade and other payables: Lack
of supporting documentation for accruals
• Trade and other payables: Trade and other payables: Could not provide evidence that they correctly applied IAS 39 on initial recognition of financial liabilities using the effective interest rate method (discounting)
• Trade and other payables: Straight lining of leases incorrect as based on PMIS (PMIS does not agree to the lease agreements)
• 2009/10 Trade and Other Payables• Accrual workbooks from regions
available and year-end instruction dealt with this for current year.
• Addressed via working papers and accounting policies – see significant management judgment and estimates
• Lease project results not finalised by year-end.
Report of the Accounting Officer (continued)for the year ended 31 March 2013

Department of Public Works | Annual Report 2012/13 169
PMTE
Nature of qualification, disclaimer, adverse opinion and matter of non-
complianceFinancial year in which it first arose Progress made in clearing /
resolving the matter
Property Rates
• Property rates: Lack of evidence to support expenditure
· Property Rates: Completeness issue
• 2009/10 Property Rates
• Invoices should be available to support payment – workbooks did ask for regions to indicate invoice details
Accruals – regions did assess based on list of properties per latest Infrastructure Assets Register (IAR) info. However the finalization of the IAR project is on going.
Leases rentals on operating leases
• Lease rentals on operating leases: insufficient supporting documents
• Completeness, accuracy, cut off and classification of operating lease expenditure
• Refurbishment costs on private operating leases incorrectly allocated to operating leases expense instead of recovering from private lease debtors
• 2009/10 Leases rentals on operating leases
• Lease audit review not yet completed.
• Refurbishment cost incorrectly allocated to operating lease expenses Regions instructed to correct in current year
Commitments
• Commitments: Insufficient supporting documents
• Commitments: Incomplete, Inaccurate
• Operating lease commitments: based on straight lined lease payments instead of as required by relevant standard
• Operating lease commitments: completeness and accuracy
• 2010/11 Commitments
• Improvement (However capital commitments not relevant this year)
• Improved, completeness accuracy of commitments addressed by including PMIS commitments as well as WCS per workbooks
• Current and comparative period based on rental amounts per PMIS significantly improved
• Contingent assets: classification and valuation
• 2011/12 • Assessment done for current year
• Related parties: indirect costs with DPW
• 2009/10 • Improved for current year: assessment based on related party framework determined
• Split of shared/indirect costs cannot be reliably determined. National Treasury agreement obtained and matter resolved
Report of the Accounting Officer (continued)for the year ended 31 March 2013
170 Department of Public Works | Annual Report 2012/13
17. Exemptions and deviations received from the National Treasury The Department received exemption from National Treasury for the PMTE to continue billing client department’s accom-modation charges for state-owned properties based on devolved amounts.
18. Interim Financial StatementsInterim financial statements were quarterly prepared and submitted to National Treasury as prescribed for the DPW main account. This is not a requirement for PMTE as an authorised trading account. It is however planned to introduce interim financial statements for the PMTE in the coming financial year.
19. OtherThe President appointed the Honourable Deputy Minister Jeremy Cronin as the Deputy Minister of the Department during the reporting period.
20. ApprovalThe Annual Financial Statements set out on pages 177 to 273 have been approved by the Accounting Officer.
Mr Mziwonke Dlabantu
31 May 2013
Report of the Accounting Officer (continued)for the year ended 31 March 2013

Department of Public Works | Annual Report 2012/13 171
Report of the Auditor-General to Parliament on Vote No. 7: The Department of Public Works
Report on the financial statements Introduction
1. I have audited the financial statements of the Department of Public Works set out on pages 177 to 245 , which comprise the appropriation statement, the statement of financial position as at 31 March 2013, the statement of financial performance, statement of changes in net assets and the cash flow statement for the year then ended, and the notes, comprising a summary of significant accounting policies and other explanatory information.
Accounting officer’s responsibility for the financial statements
2. The accounting officer is responsible for the preparation of these financial statements in accordance with the Departmental financial reporting framework prescribed by the National Treasury and the requirements of the Public Finance Management Act of South Africa, 1999 (Act No. 1 of 1999) (PFMA), and for such internal control as the accounting officer determines is necessary to enable the preparation of financial statements that are free from material misstatement, whether due to fraud or error.
Auditor-General’s responsibility
3. My responsibility is to express an opinion on these financial statements based on my audit. I conducted my audit in accordance with the Public Audit Act of South Africa, 2004 (Act No. 25 of 2004) (PAA), the General Notice issued in terms thereof and International Standards on Auditing. Those standards require that I comply with ethical requirements and plan and perform the audit to obtain reasonable assurance about whether the financial statements are free from material misstatement.
4. An audit involves performing procedures to obtain audit evidence about the amounts and disclosures in the financial statements. The procedures selected depend on the auditor’s judgement, including the assessment of the risks of material misstatement of the financial statements, whether due to fraud or error. In making those risk assessments, the auditor considers internal control relevant to the entity’s preparation of the financial statements in order to design audit procedures that are appropriate in the circumstances, but not for the purpose of expressing an opinion on the effectiveness of the entity’s internal control. An audit also includes evaluating the appropriateness of accounting policies used and the reasonableness of accounting estimates made by management, as well as evaluating the overall presentation of the financial statements.
5. I believe that the audit evidence I have obtained is sufficient and appropriate to provide a basis for my qualified audit opinion.
Basis for qualified opinion
Immovable tangible capital assets
6. The Department did not have adequate systems in place to determine whether or not renovations and refurbishment costs disclosed at R664 000 000 should be capitalised to individual immovable tangible capital assets, as determined by the accounting policy relating to subsequent recognition. I was therefore unable to obtain sufficient appropriate audit evidence to satisfy myself as to the value of immovable assets for the current or prior year presented in note 34 to the financial statements. In the absence of my ability to confirm this by alternative means, I was unable to determine the full extent of the potential misstatement in immovable tangible capital assets.
Irregular expenditure
7. Section 38(1)(a)(iii) of the PFMA requires the Department to implement and maintain an appropriate procurement and provisioning system that is fair, equitable, transparent, competitive and cost effective. Furthermore, section 40(3)(b)(i) of the PFMA requires the department to include particulars of all irregular expenditure that had occurred during the financial year in its financial statements.
8. The Department was not able to provide sufficient appropriate evidence for awards amounting to R32 219 847 (2012: R15 813 916 ) resulting in a limitation of scope in determining whether these awards were made in line with

172 Department of Public Works | Annual Report 2012/13
supply chain management prescripts and whether or not the resultant payments were regular. Additionally, the department did not complete the process of identifying and recognising all irregular expenditure incurred by the Property Management Trading Entity on behalf of the Department. There were no satisfactory alternative procedures that I could perform to obtain reasonable assurance that all irregular expenditure had been properly recorded.
9. Consequently, I was unable to obtain sufficient appropriate audit evidence to satisfy myself as to the fair presentation of irregular expenditure relating to the current year stated at R874 514 000 (2012: R168 157 000) in the financial statements.
Commitments
10. I was unable to obtain sufficient appropriate audit evidence regarding the assumptions used to determine contract price adjustment provisions (CPAP) amounting to R37 472 906 (2012: R97 356 000). Furthermore, the Department was unable to provide sufficient, appropriate audit evidence in support of commitments to the value of R89 018 151. I was unable to confirm these commitments by alternative means. Consequently, I was unable to determine whether any adjustment relating to commitments stated at R1 441 031 000 (2012: R1 936 775 000) in the financial statements was necessary.
Qualified opinion
11. In my opinion, except for the possible effects of the matters described in the Basis for qualified opinion paragraphs, the financial statements present fairly, in all material respects, the financial position of the Department of Public Works as at 31 March 2013 and its financial performance and cash flows for the year then ended, in accordance with the Departmental financial reporting framework prescribed by the National Treasury and the requirements of the PFMA.
Emphasis of matters
12. I draw attention to the matters below. My opinion is not modified in respect of these matters.
Restatement of corresponding figures
13. As disclosed in notes 7, 8, 12, 18, 19, 21, 22, 23, 24, 26 and 30 to the financial statements, the corresponding figures for 31 March 2012 have been restated as a result of an error discovered during 2013 in the financial statements of the Department of Public Works at, and for the year ended, 31 March 2012.
Material impairments
14. As disclosed in note 29 to the financial statements, material impairments to the amount of R57 479 000 were provided for as a result of irrecoverable receivables.
Material under-spending of the vote
15. As disclosed in the appropriation statement, the department has materially underspent the budget on programme 2, immovable asset management, to the amount of R489 436 000. As a consequence, the department’s objectives of infrastructure delivery were not fully achieved.
Additional matters
16. I draw attention to the matters below. My opinion is not modified in respect of these matters.
Unaudited supplementary schedules
17. The supplementary information set out on pages 246 to 273 does not form part of the financial statements and is presented as additional information. I have not audited these schedules and, accordingly, I do not express an opinion thereon.
Financial reporting framework
18. The financial reporting framework prescribed by the National Treasury and applied by the department is a compli-ance framework. The wording of my opinion on a compliance framework should reflect that the financial statements
Report of the Auditor-General to Parliament on Vote No. 7: The Department of Public Works

Department of Public Works | Annual Report 2012/13 173
have been prepared in accordance with this framework and not that they “present fairly”. Section 20(2)(a) of the PAA, however, requires me to express an opinion on the fair presentation of the financial statements. The wording of my opinion therefore reflects this requirement.
REPORT ON OTHER LEGAL AND REGULATORY REQUIREMENTS
19. In accordance with the PAA and the General Notice issued in terms thereof, I report the following findings relevant to performance against predetermined objectives, compliance with laws and regulations and internal control, but not for the purpose of expressing an opinion.
Predetermined objectives
20. I performed procedures to obtain evidence about the usefulness and reliability of the information in the annual per-formance report as set out on pages 34 to 75 of the annual report.
21. The reported performance against predetermined objectives was evaluated against the overall criteria of usefulness and reliability. The usefulness of information in the annual performance report relates to whether it is presented in accordance with the National Treasury’s annual reporting principles and whether the reported performance is con-sistent with the planned objectives. The usefulness of information further relates to whether indicators and targets are measurable (i.e. well defined, verifiable, specific, measurable and time bound) and relevant as required by the National Treasury Framework for managing programme performance information.
The reliability of the information in respect of the selected programmes is assessed to determine whether it adequately reflects the facts (i.e. whether it is valid, accurate and complete).
22. The material findings are as follows:
Reliability of information
Programme 2: Immovable asset management and Programme 3: EPWP
23. The National Treasury Framework for managing programme performance information (FMPPI) requires that institutions should have appropriate systems to collect, collate, verify and store performance information to ensure valid, accu-rate and complete reporting of actual achievements against planned objectives, indicators and targets.
Significantly important targets with respect to the above mentioned programmes are not reliable when compared to the source information and evidence provided.
This was due to the lack of standard operating procedures for the accurate recording of actual achievements, monitoring of the completeness of source documentation in support of actual achievements and frequent review of validity of reported achievements against source documentation.
Additional matter
24. I draw attention to the following matter below. This matter does not have an impact on the predetermined objectives audit findings reported above.
Material adjustments to the annual performance report
25. Material audit adjustments in the annual performance report were identified during the audit, some of which were corrected by management and those that were not corrected have been reported on accordingly.
Compliance with laws and regulations
26. I performed procedures to obtain evidence that the entity has complied with applicable laws and regulations regard-ing financial matters, financial management and other related matters. My findings on material non-compliance with specific matters in key applicable laws and regulations as set out in the General Notice issued in terms of the PAA are as follows:
Performance management
27. The accounting officer did not ensure that the department had and maintained an effective, efficient and trans-
Report of the Auditor-General to Parliament on Vote No. 7: The Department of Public Works (continued)
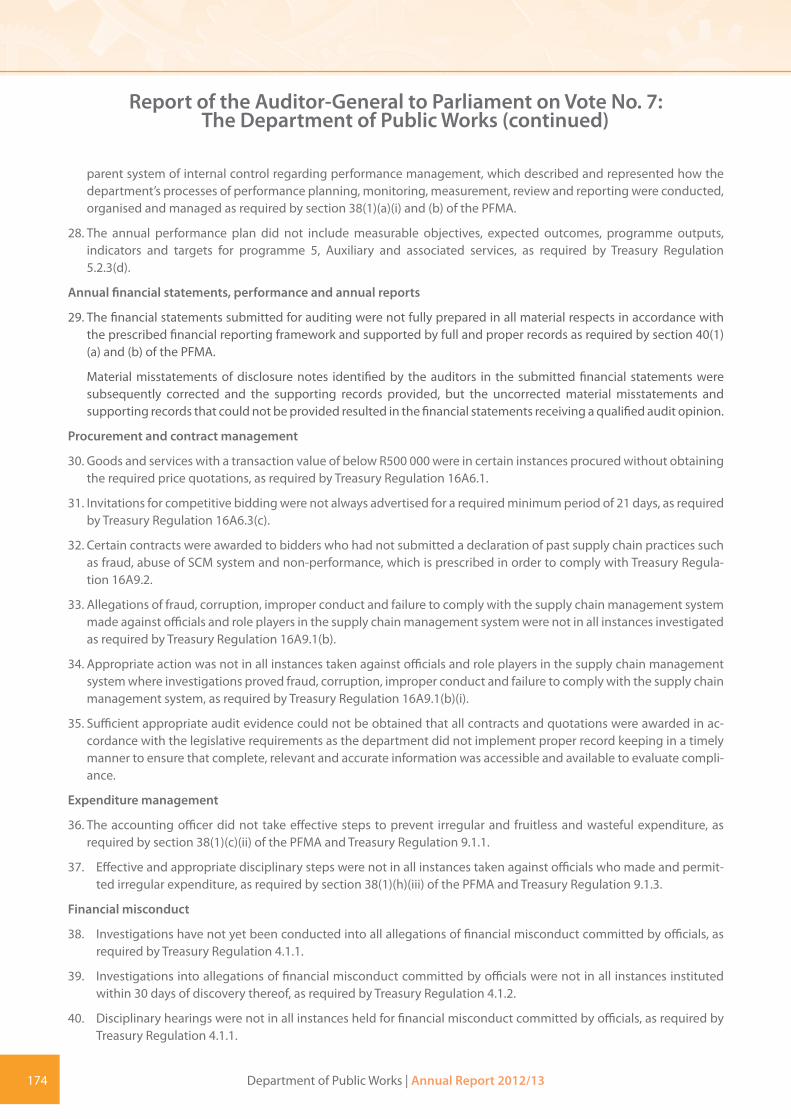
174 Department of Public Works | Annual Report 2012/13
parent system of internal control regarding performance management, which described and represented how the department’s processes of performance planning, monitoring, measurement, review and reporting were conducted, organised and managed as required by section 38(1)(a)(i) and (b) of the PFMA.
28. The annual performance plan did not include measurable objectives, expected outcomes, programme outputs, indicators and targets for programme 5, Auxiliary and associated services, as required by Treasury Regulation 5.2.3(d).
Annual financial statements, performance and annual reports
29. The financial statements submitted for auditing were not fully prepared in all material respects in accordance with the prescribed financial reporting framework and supported by full and proper records as required by section 40(1)(a) and (b) of the PFMA.
Material misstatements of disclosure notes identified by the auditors in the submitted financial statements were subsequently corrected and the supporting records provided, but the uncorrected material misstatements and supporting records that could not be provided resulted in the financial statements receiving a qualified audit opinion.
Procurement and contract management
30. Goods and services with a transaction value of below R500 000 were in certain instances procured without obtaining the required price quotations, as required by Treasury Regulation 16A6.1.
31. Invitations for competitive bidding were not always advertised for a required minimum period of 21 days, as required by Treasury Regulation 16A6.3(c).
32. Certain contracts were awarded to bidders who had not submitted a declaration of past supply chain practices such as fraud, abuse of SCM system and non-performance, which is prescribed in order to comply with Treasury Regula-tion 16A9.2.
33. Allegations of fraud, corruption, improper conduct and failure to comply with the supply chain management system made against officials and role players in the supply chain management system were not in all instances investigated as required by Treasury Regulation 16A9.1(b).
34. Appropriate action was not in all instances taken against officials and role players in the supply chain management system where investigations proved fraud, corruption, improper conduct and failure to comply with the supply chain management system, as required by Treasury Regulation 16A9.1(b)(i).
35. Sufficient appropriate audit evidence could not be obtained that all contracts and quotations were awarded in ac-cordance with the legislative requirements as the department did not implement proper record keeping in a timely manner to ensure that complete, relevant and accurate information was accessible and available to evaluate compli-ance.
Expenditure management
36. The accounting officer did not take effective steps to prevent irregular and fruitless and wasteful expenditure, as required by section 38(1)(c)(ii) of the PFMA and Treasury Regulation 9.1.1.
37. Effective and appropriate disciplinary steps were not in all instances taken against officials who made and permit-ted irregular expenditure, as required by section 38(1)(h)(iii) of the PFMA and Treasury Regulation 9.1.3.
Financial misconduct
38. Investigations have not yet been conducted into all allegations of financial misconduct committed by officials, as required by Treasury Regulation 4.1.1.
39. Investigations into allegations of financial misconduct committed by officials were not in all instances instituted within 30 days of discovery thereof, as required by Treasury Regulation 4.1.2.
40. Disciplinary hearings were not in all instances held for financial misconduct committed by officials, as required by Treasury Regulation 4.1.1.
Report of the Auditor-General to Parliament on Vote No. 7: The Department of Public Works (continued)

Department of Public Works | Annual Report 2012/13 175
Human resource management and compensation
41. Appointments were made in posts which were not approved and funded, as required by Public Service Regulation 1/III/ F.1(a) and (d).
42. Funded vacant posts were not filled within 12 months as required by Public Service Regulation 1/VII/C.1A.2.
43. Persons in charge at pay points did not always certify that the employees receiving payment were entitled to such payment, as required by Treasury Regulation 8.3.4.
Transfer of funds and conditional grants
44. The accounting officer did not in all instances, prior to transferring funds, obtain written assurance from the entity that the entity implements effective, efficient and transparent financial management and internal control systems as required by section 38(1)(j) of the PFMA.
45. Quarterly performance reports were not submitted to the National Treasury within the prescribed time frames, as required by section 10(7) of the Division of Revenue Act.
46. The internal audit function did not assess the operational procedure and monitoring mechanisms over all transfers made and received, including transfers in terms of the annual Division of Revenue Act, as required by Treasury Regu-lation 3.2.8.
Revenue management
47. Sufficient appropriate audit evidence could not be obtained that immovable state property was let at market-related tariffs, as required by Treasury Regulation 16A7.4.
Asset management
48. Proper control systems to safeguard and maintain assets were not implemented, as required by section 38(1)(d) of the PFMA and Treasury Regulation 10.1.1(a).
Internal control
49. I considered internal control relevant to my audit of the financial statements, the annual performance report and compliance with laws and regulations. The matters reported below under the fundamentals of internal control are limited to the significant deficiencies that resulted in the basis for qualified, the findings on the annual performance report and the findings on compliance with laws and regulations included in this report.
Leadership
50. Certain critical appointments were only made in the last quarter of the financial year, thus instability in key leadership positions for the first part of the financial year had a negative impact in the provision of effective leadership in the department.
51. Leadership did not exercise effective oversight of financial and performance reporting and compliance as well as related internal controls.
52. Leadership did not apply effective consequence management for transgressions with regards to non-performance and non-compliance throughout the financial year.
53. Leadership did not in all instances establish and communicate policies and procedures to enable and support the understanding and execution of internal objectives, processes and responsibilities.
Financial and performance management
54. Proper record keeping was not always implemented in a timely manner to ensure that complete, relevant and accurate information was accessible and available to support financial and performance reporting.
55. Implemented controls over daily and monthly processing and reconciling of transactions were not effective in all instances.
Report of the Auditor-General to Parliament on Vote No. 7: The Department of Public Works (continued)

176 Department of Public Works | Annual Report 2012/13
56. Regular, accurate and complete financial and performance reports that were supported and evidenced by reliable information were not prepared throughout the year.
57. The reviewing and monitoring of compliance with applicable laws and regulations were ineffective.
58. The designed and implemented formal controls over the information technology systems were inadequate to ensure the reliability, availability and accuracy of certain information pertaining to immovable assets. Furthermore, the system used for generating performance information was inadequate to facilitate the preparation of complete actual performance information.
Governance
59. Risk management activities, including the consideration of information technology risks and fraud prevention, were not effectively conducted. A risk strategy to address identified risks was not developed and monitored throughout the financial year.
60. The internal audit unit was not adequately resourced to ensure that it could effectively assist in identifying internal control deficiencies and developing recommendations in respect of corrective action to be taken to address the internal control deficiencies identified. This has also resulted in the continued backlog in internal investigations.
OTHER REPORTS
Investigations
61. Numerous internal allegations, mainly relating to transgressions with respect to supply chain management, potential fraud and financial misconduct are being investigated on an ongoing basis.
62. An ongoing investigation is being conducted to probe the alleged abuse of urgent and emergency procurement as well the utilisation of sole suppliers. The investigation aims to establish whether there was collusion between offi-cials and service providers and to determine any reckless spending of funds. The investigation is being conducted in phases, with nine reports having been finalised to date while the majority were still ongoing at the reporting date. The department is in the process of instituting disciplinary action in respect of the finalised reports.
63. An investigation is being conducted by the Public Protector to probe the allegation of the misappropriation of public funds by the Department of Public Works in respect of the installation and implementation of security measures at the President’s private residence at Nkandla. The investigation was still ongoing at the reporting date. I did not con-duct any additional investigation.
Performance audits
64. A performance audit was conducted during the year under review on the Department of Public Works’ readiness to fulfil its performance oversight roles and responsibilities. The report is in the process of being finalised.
Pretoria
16 / 9 / 2013
Report of the Auditor-General to Parliament on Vote No. 7: The Department of Public Works (continued)

Department of Public Works | Annual Report 2012/13 177
Appropriation Statementfor the year ended 31 March 2013
App
ropr
iatio
n pe
r pro
gram
me
2012
/13
2011
/12
APP
ROPR
IATI
ON
STA
TEM
ENT
Adj
uste
d A
ppro
pria
-tio
n
Shift
ing
of
Fund
sVi
rem
ent
Fina
l A
ppro
pria
-tio
n
Act
ual
Expe
ndi-
ture
Vari
ance
Expe
ndi-
ture
as
% o
f Fi-
nal A
ppro
-pr
iatio
n
Fina
l A
ppro
pria
-tio
n
Act
ual
Expe
ndi-
ture
R’00
0R’
000
R’00
0R’
000
R’00
0R’
000
%R’
000
R’00
0
1.
AD
MIN
ISTR
ATIO
N
Curr
ent p
aym
ent
1,00
2,86
5(2
1)(4
7,64
9)95
5,19
583
2,92
512
2,27
087
.2%
769,
551
787,
564
Tran
sfer
s an
d su
bsid
ies
1,17
521
4,80
05,
996
5,98
88
99.9
%59
456
5
Paym
ent f
or c
apita
l ass
ets
43,7
73-
-43
,773
17,2
7226
,501
39.5
%48
,990
48,9
90
1,04
7,81
3-
(42,
849)
1,00
4,96
485
6,18
514
8,77
981
9,13
583
7,11
9
2.
IMM
OVA
BLE
ASS
ET
MA
NA
GEM
ENT
Curr
ent p
aym
ent
1,25
2,63
1-
35,7
001,
288,
331
1,22
0,82
367
,508
94.8
%1,
261,
272
1,26
5,52
1
Tran
sfer
s an
d su
bsid
ies
2,72
3,21
7-
2,44
42,
725,
661
2,60
5,17
712
0,48
495
.6%
2,68
8,69
52,
688,
775
Paym
ent f
or c
apita
l ass
ets
1,06
2,50
0-
(23,
555)
1,03
8,94
573
7,50
130
1,44
471
.0%
1,47
6,66
11,
047,
453
5,03
8,34
8-
14,5
895,
052,
937
4,56
3,50
148
9,43
65,
426,
628
5,00
1,74
9
3.
EXPA
ND
ED P
UBL
IC W
ORK
S PR
OG
RAM
ME
Curr
ent p
aym
ent
272,
174
(3,2
31)
-26
8,94
324
4,35
424
,589
90.9
%21
6,28
521
6,28
5
Tran
sfer
s an
d su
bsid
ies
1,45
5,07
133
-1,
455,
104
1,45
4,58
651
810
0.0%
1,30
1,63
094
4,13
7
Paym
ent f
or c
apita
l ass
ets
1,56
7-
260
1,82
71,
913
(86)
104.
7%2,
593
2,59
3

178 Department of Public Works | Annual Report 2012/13
Appropriation Statementfor the year ended 31 March 2013
App
ropr
iatio
n pe
r pro
gram
me
2012
/13
2011
/12
APP
ROPR
IATI
ON
STA
TEM
ENT
Adj
uste
d A
ppro
pria
-tio
n
Shift
ing
of
Fund
sVi
rem
ent
Fina
l A
ppro
pria
-tio
n
Act
ual
Expe
ndi-
ture
Vari
ance
Expe
ndi-
ture
as
% o
f Fi-
nal A
ppro
-pr
iatio
n
Fina
l A
ppro
pria
-tio
n
Act
ual
Expe
ndi-
ture
R’00
0R’
000
R’00
0R’
000
R’00
0R’
000
%R’
000
R’00
0
Paym
ent f
or fi
nanc
ial a
sset
s-
3,19
8-
3,19
83,
198
-10
0.0%
--
1,72
8,81
2-
260
1,72
9,07
21,
704,
051
25,0
211,
520,
508
1,16
3,01
5
4.
PRO
PERT
Y A
ND
CO
NST
RUCT
ION
IND
UST
RY
POLI
CY R
EGU
LATI
ON
S
Curr
ent p
aym
ent
37,3
12(3
)-
37,3
0916
,851
20,4
5845
.2%
29,8
7822
,715
Tran
sfer
s an
d su
bsid
ies
-3
-3
9,90
6(9
,903
)33
0200
.0%
819,
513
Paym
ent f
or c
apita
l ass
ets
124
--
124
101
2381
.5%
124
100
Paym
ent f
or fi
nanc
ial a
sset
s-
--
--
-2,
025
2,02
5
37,4
36-
-37
,436
26,8
5810
,578
32,1
0834
,353
5.
AUXI
LLIA
RY A
ND
A
SSO
CIAT
ED S
ERVI
CES
Curr
ent p
aym
ent
17,2
91-
28,0
0045
,291
36,6
348,
657
80.9
%11
,967
11,9
67
Tran
sfer
s an
d su
bsid
ies
21,5
48-
-21
,548
16,6
964,
852
77.5
%19
,398
13,2
34
38,8
39-
28,0
0066
,839
53,3
3013
,509
31,3
6525
,201
TOTA
L7,
891,
248
--
7,89
1,24
87,
203,
925
687,
323
91.3
%7,
829,
744
7,06
1,43
7

Department of Public Works | Annual Report 2012/13 179
Appropriation Statementfor the year ended 31 March 2013
2012/13 2011/12
Final Appropriation
Actual Expenditure
Final Appropriation
Actual Expenditure
TOTAL (brought forward)
Reconciliation with statement of financial performance
ADD
Departmental receipts 53,795 75,195
Actual amounts per statement of financial performance (total revenue) 7,945,043 7,904,939
Actual amounts per statement of financial performance (total expenditure)
7,203,925 7,061,437

180 Department of Public Works | Annual Report 2012/13
Appropriation Statementfor the year ended 31 March 2013
App
ropr
iatio
n pe
r eco
nom
ic c
lass
ifica
tion
2012
/13
2011
/12
Adj
uste
d A
ppro
pria
-tio
n
Shift
ing
of
Fund
sVi
rem
ent
Fina
l A
ppro
pria
-tio
n
Act
ual
Expe
nditu
reVa
rian
ce
Expe
nditu
re
as %
of F
inal
A
ppro
pria
-tio
n
Fina
l A
ppro
pria
-tio
n
Act
ual
Expe
nditu
re
R’00
0R’
000
R’00
0R’
000
R’00
0R’
000
%R’
000
R’00
0
Curr
ent p
aym
ents
Com
pens
atio
n of
em
ploy
ees
1,32
9,95
1(5
7)51
,556
1,38
1,45
01,
374,
552
6,89
899
.5%
1,25
2,46
91,
269,
579
Goo
ds a
nd s
ervi
ces
1,24
2,57
0(3
,220
)(3
5,50
5)1,
203,
845
977,
014
226,
831
81.2
%1,
034,
900
1,03
2,90
5
Inte
rest
and
rent
on
land
9,75
222
-9,
774
219,
753
0.2%
1,58
61,
567
Tran
sfer
s an
d su
bsid
ies
Prov
ince
s an
d m
unic
ipal
ities
3,09
0,98
2-
-3,
090,
982
2,96
9,95
512
1,02
796
.1%
2,95
0,45
12,
592,
965
Dep
artm
enta
l age
ncie
s an
d ac
-co
unts
752,
986
--
752,
986
751,
640
1,34
699
.8%
734,
690
732,
486
Fore
ign
gove
rnm
ents
and
inte
rna-
tiona
l org
anis
atio
ns
18,9
41-
-18
,941
15,4
363,
505
81.5
%16
,915
12,9
56
Publ
ic c
orpo
ratio
ns a
nd p
rivat
e en
terp
rises
50,8
00-
-50
,800
50,8
00-
100.
0%15
0,00
015
0,00
0
Non
-pro
fit in
stitu
tions
28
2,72
4-
-28
2,72
4 29
2,62
7(9
,903
) 10
3.5%
154,
370
163,
801
Hou
seho
lds
4,57
8 54
7,24
411
,876
11,8
751
100.
0%3,
968
4,01
2
Gift
s an
d do
natio
ns-
3-
320
(17)
666.
7%2
2
Paym
ents
for c
apita
l ass
ets
Build
ings
and
oth
er fi
xed
stru
ctur
es99
9,25
4-
-99
9,25
471
3,00
328
6,25
171
.4%
1,43
6,74
51,
011,
408
Mac
hine
ry a
nd e
quip
men
t83
,038
(185
)(2
3,29
5)59
,558
43,2
8316
,275
72.7
%84
,984
81,1
62
Soft
war
e an
d ot
her i
ntan
gibl
e as
sets
25,6
7218
5 -
25,8
5750
125
,356
1.9%
6,63
96,
569
Paym
ents
for fi
nanc
ial a
sset
s-
3,19
8-
3,19
83,
198
-10
0.0%
2,02
52,
025
Tota
l7,
891,
248
--
7,89
1,24
87,
203,
925
687,
323
91.3
%7,
829,
744
7,06
1,43
7

Department of Public Works | Annual Report 2012/13 181
Appropriation Statementfor the year ended 31 March 2013
2012
/13
2011
/12
Prog
ram
1 P
er E
cono
mic
cl
assi
ficat
ion
Adj
uste
d A
ppro
pria
-ti
on
Shif
ting
of
Fund
sVi
rem
ent
Fina
l A
ppro
pria
-ti
on
Act
ual
Expe
ndit
ure
Vari
ance
Expe
ndit
ure
as %
of fi
nal
appr
opri
a-ti
on
Fina
l A
ppro
pria
-ti
on
Act
ual
expe
ndit
ure
R’00
0R’
000
R’00
0R’
000
R’00
0R’
000
%R’
000
R’00
0
Curr
ent p
aym
ents
Com
pens
atio
n of
em
ploy
ees
226,
370
(21)
(6,7
49)
219,
600
218,
980
620
99.7
%18
1,39
219
9,40
5
Goo
ds a
nd s
ervi
ces
773,
834
-(4
0,90
0)73
2,93
461
3,92
411
9,01
083
.8%
58
7,94
958
7,94
9
Inte
rest
and
rent
on
land
2,66
1-
-2,
661
212,
640
0.8%
210
210
Tran
sfer
s an
d su
bsid
ies
Prov
ince
s an
d m
unic
ipal
ities
11-
-11
38
27.3
%9
1
Hou
seho
lds
1,16
421
4,80
05,
985
5,98
5-
100.
0%58
456
3
Gift
s an
d do
natio
ns-
--
--
--
11
Paym
ents
for c
apit
al a
sset
s
Mac
hine
ry a
nd e
quip
men
t18
,260
--
18,2
6017
,115
1,14
593
.7%
42,5
0242
,502
Soft
war
e an
d ot
her i
ntan
gibl
e as
sets
25,5
13-
-25
,513
157
25,3
56
0.6%
6,48
86,
488
Tota
l1,
047,
813
-(4
2,84
9)1,
004,
964
856,
185
148,
779
85.2
%81
9,13
583
7,11
9

182 Department of Public Works | Annual Report 2012/13
Appropriation Statementfor the year ended 31 March 2013
2012
/13
2011
/12
Det
ail p
er s
ub-p
rogr
amm
e A
djus
ted
App
ropr
ia-
tion
Shift
ing
of
Fund
sVi
rem
ent
Fina
l A
ppro
pria
-tio
n
Act
ual
Expe
nditu
reVa
rian
ce
Expe
nditu
re
as %
of F
inal
A
ppro
pria
-tio
n
Fina
l A
ppro
pria
-tio
n
Act
ual
Expe
nditu
re
R’00
0R’
000
R’00
0R’
000
R’00
0R’
000
%R’
000
R’00
0
1.1
MIN
ISTR
Y
Curr
ent p
aym
ent
29,1
61(7
,202
)(1
,862
)20
,097
20,0
97-
100.
0%24
,593
24,5
93
Tran
sfer
s an
d su
bsid
ies
11
-1,
331
1,34
21,
334
899
.4%
4141
Paym
ent f
or c
apita
l ass
ets
900
-90
084
852
94.2
%64
064
0
1.2
MA
NA
GEM
ENT
Curr
ent p
aym
ent
128,
171
(18,
221)
(19,
887)
90,0
6388
,202
1,86
197
.9%
51,4
0251
,402
Tran
sfer
s an
d su
bsid
ies
-33
02,
976
3,30
63,
306
-10
0.0%
325
325
Paym
ent f
or c
apita
l ass
ets
914
434
-1,
348
1,34
8-
100.
0%32
132
1
1.3
CORP
ORA
TE S
ERVI
CES
Curr
ent p
aym
ent
376,
481
29,0
71(2
5,90
0)37
9,65
234
9,32
730
,325
92.0
%30
9,18
632
7,19
9
Tran
sfer
s an
d su
bsid
ies
1,16
4(3
09)
493
1,34
81,
348
-10
0.0%
228
199
Paym
ent f
or c
apita
l ass
ets
41,9
59(4
34)
-41
,525
15,0
7626
,449
36.3
%48
,029
48,0
29
1.4
OFF
ICE
ACC
OM
OD
ATIO
N
Curr
ent p
aym
ent
469,
052
(3,6
69)
-46
5,38
337
5,29
990
,084
80.6
%38
4,37
038
4,37
0
Tota
l1,
047,
813
-(4
2,84
9)1,
004,
964
856,
185
148,
779
85.2
%81
9,13
583
7,11
9

Department of Public Works | Annual Report 2012/13 183
Appropriation Statementfor the year ended 31 March 2013
2012
/13
2011
/12
Prog
ram
me
2 Pe
r Eco
nom
ic
clas
sific
atio
nA
djus
ted
App
ropr
ia-
tion
Shift
ing
of
Fund
sVi
rem
ent
Fina
l A
ppro
pria
-tio
n
Act
ual
Expe
ndi-
ture
Vari
ance
Expe
ndi-
ture
as
% o
f Fi-
nal A
ppro
-pr
iatio
n
Fina
l A
ppro
pria
-tio
n
Act
ual
Expe
ndi-
ture
R’00
0R’
000
R’00
0R’
000
R’00
0R’
000
%R’
000
R’00
0
Curr
ent p
aym
ents
Com
pens
atio
n of
em
ploy
ees
988,
450
-58
,305
1,04
6,75
51,
046,
755
-10
0.0%
970,
040
970,
320
Goo
ds a
nd s
ervi
ces
257,
189
-(2
2,60
5)23
4,58
417
4,06
860
,516
74.2
%28
9,97
329
3,93
9
Inte
rest
and
rent
on
land
6,99
2-
-6,
992
-6,
992
1,26
11,
261
Tran
sfer
s an
d su
bsid
ies
to:
Prov
ince
s an
d m
unic
ipal
ities
1,91
8,67
4-
-1,
918,
674
1,79
8,17
312
0,50
193
.7%
1,80
3,23
21,
803,
232
Dep
artm
enta
l age
ncie
s an
d ac
-co
unts
750,
380
--
750,
380
750,
380
-10
0.0%
732,
208
732,
208
Publ
ic c
orpo
ratio
ns a
nd p
rivat
e en
terp
rises
50,8
00-
-50
,800
50,8
00-
100.
0%15
0,00
015
0,00
0
Non
-pro
fit in
stitu
tions
-
--
--
--
-
Hou
seho
lds
3,36
3(3
)2,
444
5,80
45,
804
-10
0.0%
3,25
23,
333
Gift
s an
d do
natio
ns-
3-
320
(17)
666.
7%1
1
Paym
ent f
or c
apita
l ass
ets
Build
ings
and
oth
er fi
xed
stru
c-tu
res
999,
254
--
999,
254
713,
003
286,
251
71.4
%1,
436,
745
1,01
1,40
8
Mac
hine
ry a
nd e
quip
men
t63
,087
(185
)(2
3,55
5)39
,347
24,1
5415
,193
61.4
%39
,765
35,9
66
Soft
war
e an
d ot
her i
ntan
gibl
e as
sets
159
185
-34
434
4-
100.
0%15
181
Tota
l5,
038,
348
-14
,589
5,05
2,93
74,
563,
501
489,
436
90.3
%5,
426,
628
5,00
1,74
9

184 Department of Public Works | Annual Report 2012/13
Appropriation Statementfor the year ended 31 March 2013
2012
/13
2011
/12
Det
ail p
er s
ub-p
rogr
amm
e A
djus
ted
App
ropr
ia-
tion
Shift
ing
of
Fund
sVi
rem
ent
Fina
l A
ppro
pria
-tio
n
Act
ual
Expe
nditu
reVa
rian
ce
Expe
nditu
re
as %
of F
inal
A
ppro
pria
-tio
n
Fina
l A
ppro
pria
-tio
n
Act
ual
Expe
nditu
re
R’00
0R’
000
R’00
0R’
000
R’00
0R’
000
%R’
000
R’00
0
2.1
INFR
AST
RUCT
URE
(PU
BLIC
W
ORK
S)
Paym
ent f
or c
apita
l ass
ets
999,
254
--
999,
254
713,
003
286,
251
71.4
%1,
436,
745
1,01
1,40
8
2.2
PRO
PERT
Y M
AN
AG
EMEN
T
Tran
sfer
s an
d su
bsid
ies
1,91
8,65
9-
-1,
918,
659
1,79
8,17
012
0,48
993
.7%
1,80
3,23
21,
803,
230
2.3
STRA
TEG
IC A
SSET
INVE
STM
ENT
AN
ALY
SIS
Curr
ent p
aym
ent
196,
888
(76,
515)
(19,
000)
101,
373
54,5
8246
,791
53.8
%15
6,82
216
0,78
8
Tran
sfer
s an
d su
bsid
ies
163
(73)
-90
828
91.1
%-
-
Paym
ent f
or c
apita
l ass
ets
11,8
52-
-11
,852
713
11,1
396.
0%95
695
6
2.4
OPE
RATI
ON
MA
NA
GEM
ENT
Curr
ent p
aym
ent
944,
562
76,5
1536
,529
1,05
7,60
61,
057,
019
587
99.9
%97
4,03
897
4,31
9
Tran
sfer
s an
d su
bsid
ies
3,21
5-
2,21
35,
428
5,44
1(1
3)10
0.2%
3,22
23,
222
Paym
ent f
or c
apita
l ass
ets
36,3
24-
(18,
000)
18,3
2415
,386
2,93
884
.0%
23,2
4022
,794
2.5
PRES
TIG
E M
AN
AG
EMEN
T
Curr
ent p
aym
ent
45,1
77-
-45
,177
32,4
9812
,679
71.9
%56
,003
56,0
05
Tran
sfer
s an
d su
bsid
ies
-10
-10
10-
100.
0%9
9
Paym
ent f
or c
apita
l ass
ets
11,0
00(2
,226
)(5
,555
)3,
219
2,10
31,
116
65.3
%11
,269
11,2
69
2.6
SPEC
IAL
PRO
JECT
S
Curr
ent p
aym
ent
66,0
04-
18,1
7184
,175
76,7
247,
451
91.1
%74
,409
74,4
09
Tran
sfer
s an
d su
bsid
ies
-63
231
294
294
-10
0.0%
2410
6
Paym
ent f
or c
apita
l ass
ets
4,07
02,
226
-6,
296
6,29
6-
100.
0%4,
451
1,02
6

Department of Public Works | Annual Report 2012/13 185
Appropriation Statementfor the year ended 31 March 2013
2012
/13
2011
/12
Det
ail p
er s
ub-p
rogr
amm
e A
djus
ted
App
ropr
ia-
tion
Shift
ing
of
Fund
sVi
rem
ent
Fina
l A
ppro
pria
-tio
n
Act
ual
Expe
nditu
reVa
rian
ce
Expe
nditu
re
as %
of F
inal
A
ppro
pria
-tio
n
Fina
l A
ppro
pria
-tio
n
Act
ual
Expe
nditu
re
R’00
0R’
000
R’00
0R’
000
R’00
0R’
000
%R’
000
R’00
0
2.7
CON
STRU
CTIO
N IN
DU
STRY
D
EVEL
OPM
ENT
BOA
RD
Tran
sfer
s an
d su
bsid
ies
67,6
14-
-67
,614
67,6
14-
100.
0%65
,959
65,9
59
2.8
COU
NCI
L FO
R TH
E BU
ILT
ENV
IRO
NM
ENT
Tran
sfer
s an
d su
bsid
ies
28,1
46-
-28
,146
28,1
46-
100.
0%28
,659
28,6
59
2.9
PARL
IAM
ENTA
RY V
ILLA
GE
Tran
sfer
s an
d su
bsid
ies
7,77
1-
-7,
771
7,77
1-
100.
0%7,
401
7,40
1
2.10
AU
GM
ENTA
TIO
N O
F TH
E PR
OPE
RTY
MA
NA
GEM
ENT
Tran
sfer
s an
d su
bsid
ies
646,
849
--
646,
849
646,
849
-10
0.0%
630,
189
630,
189
2.11
IND
EPEN
DEN
T D
EVEL
OPM
ENT
TRU
ST
Tran
sfer
s an
d su
bsid
ies
50,8
00-
-50
,800
50,8
00-
100.
0%15
0,00
015
0,00
0
Tota
l5,
038,
348
-14
,589
5,05
2,93
74,
563,
501
489,
436
90.3
%5,
426,
628
5,00
1,74
9

186 Department of Public Works | Annual Report 2012/13
Appropriation Statementfor the year ended 31 March 2013
2012
/13
2011
/12
Prog
ram
me
3 Pe
r Eco
nom
ic
clas
sific
atio
n
Adj
uste
d A
ppro
pria
-tio
n
Shift
ing
of
Fund
sVi
rem
ent
Fina
l A
ppro
pria
-tio
n
Act
ual
Expe
nditu
reVa
rian
ce
Expe
nditu
re
as %
of F
inal
A
ppro
pria
-tio
n
Fina
l A
ppro
pria
-tio
n
Act
ual
Expe
nditu
re
R’00
0R’
000
R’00
0R’
000
R’00
0R’
000
%R’
000
R’00
0
Curr
ent p
aym
ents
Com
pens
atio
n of
em
ploy
ees
102,
514
(33)
-10
2,48
110
0,90
11,
580
98.5
%91
,905
91,9
05
Goo
ds a
nd s
ervi
ces
169,
596
(3,2
20)
-16
6,37
614
3,45
322
,923
86.2
%12
4,28
712
4,28
7
Inte
rest
and
rent
on
land
6422
-86
-86
-93
93
Tran
sfer
s an
d su
bsid
ies
Prov
ince
s an
d m
unic
ipal
ities
1,17
2,29
7-
-1,
172,
297
1,17
1,77
951
810
0.0%
1,14
7,21
078
9,73
2
Non
-pro
fit in
stitu
tions
28
2,72
4-
-28
2,72
428
2,72
4-
100.
0%15
4,37
015
4,37
0
Hou
seho
lds
5033
-83
83-
100.
0%50
35
Paym
ent f
or c
apit
al a
sset
s
Mac
hine
ry a
nd e
quip
men
t1,
567
-26
01,
827
1,91
3(8
6)10
4.7%
2,59
32,
593
Paym
ents
for fi
nanc
ial a
sset
s-
3,19
8-
3,19
83,
198
-10
0.0%
--
Tota
l1,
728,
812
-26
01,
729,
072
1,70
4,05
125
,021
98.6
%1,
520,
508
1,16
3,01
5

Department of Public Works | Annual Report 2012/13 187
Appropriation Statementfor the year ended 31 March 2013
2012
/13
2011
/12
Det
ail p
er s
ub-p
rogr
amm
e A
djus
ted
App
ropr
ia-
tion
Shift
ing
of
Fund
sVi
rem
ent
Fina
l A
ppro
pria
-tio
n
Act
ual
Expe
nditu
reVa
rian
ce
Expe
nditu
re
as %
of F
inal
A
ppro
pria
-tio
n
Fina
l A
ppro
pria
-tio
n
Act
ual
Expe
nditu
re
R’00
0R’
000
R’00
0R’
000
R’00
0R’
000
%R’
000
R’00
0
3.1
EXPA
ND
ED P
UBL
IC W
ORK
S PR
OG
RAM
ME
Curr
ent p
aym
ent
262,
535
(3,2
31)
- 25
9,30
423
4,76
524
,539
90.5
%20
7,10
520
7,10
5
Tran
sfer
s an
d su
bsid
ies
5033
-83
83-
100.
0%50
35
Paym
ent f
or c
apita
l ass
ets
1,56
7-
260
1,82
71,
913
(86)
104.
7%2,
593
2,59
3
Paym
ent f
or fi
nanc
ial a
sset
s-
3,19
8-
3,19
83,
198
-10
0.0%
--
3.2
PERF
OM
AN
CE B
ASE
IN
CEN
TIVE
ALL
OW
AN
CE
Curr
ent p
aym
ent
9,63
9-
-9,
639
9,58
950
99.5
%9,
180
9,18
0
Tran
sfer
s an
d su
bsid
ies
1,45
5,02
1-
-1,
455,
021
1,45
4,50
351
810
0.0%
1,30
1,58
094
4,10
2
Paym
ent f
or c
apita
l ass
ets
--
--
--
--
Tota
l1,
728,
812
-26
01,
729,
072
1,70
4,05
125
,021
98.6
%1,
520,
508
1,16
3,01
5

188 Department of Public Works | Annual Report 2012/13
Appropriation Statementfor the year ended 31 March 2013
2012
/13
2011
/12
Prog
ram
me
4 Pe
r Eco
nom
ic
clas
sific
atio
n
Adj
uste
d A
ppro
pria
-tio
n
Shift
ing
of
Fund
sVi
rem
ent
Fina
l A
ppro
pria
-tio
n
Act
ual
Expe
nditu
reVa
rian
ce
Expe
nditu
re
as %
of F
inal
A
ppro
pria
-tio
n
Fina
l A
ppro
pria
-tio
n
Act
ual
Expe
nditu
re
R’00
0R’
000
R’00
0R’
000
R’00
0R’
000
%R’
000
R’00
0
Curr
ent p
aym
ents
Com
pens
atio
n of
em
ploy
ees
12,6
17(3
)-
12,6
147,
916
4,69
862
.8%
9,13
27,
949
Goo
ds a
nd s
ervi
ces
24,6
60-
-24
,660
8,93
515
,725
36.2
%20
,724
14,7
63
Inte
rest
and
rent
on
land
35-
-35
-35
223
Tran
sfer
s an
d su
bsid
ies
to:
Non
-pro
fit in
stitu
tions
-
--
-9,
903
(9,9
03)
-9,
431
Hou
seho
lds
-3
-3
3-
100.
0%81
81
Paym
ent f
or c
apita
l ass
ets
Mac
hine
ry a
nd e
quip
men
t12
4-
-12
410
123
81.5
%12
410
1
Paym
ents
for fi
nanc
ial a
sset
s-
--
--
-2,
025
2,02
5
Tota
l37
,436
--
37,4
3626
,858
10,5
7871
.7%
32,1
0834
,353

Department of Public Works | Annual Report 2012/13 189
Appropriation Statementfor the year ended 31 March 2013
2012
/13
2011
/12
Det
ail p
er s
ub-p
rogr
amm
e A
djus
ted
App
ropr
ia-
tion
Shift
ing
of
Fund
sVi
rem
ent
Fina
l A
ppro
pria
-tio
n
Act
ual
Expe
nditu
reVa
rian
ceEx
pend
iture
as
% o
f Fin
al
App
ropr
ia-
tion
Fina
l A
ppro
pria
-tio
n
Act
ual
Expe
nditu
re
R’00
0R’
000
R’00
0R’
000
R’00
0R’
000
%R’
000
R’00
0
4.1
CON
STRU
CTIO
N IN
DU
STRY
D
EVEL
OPM
ENT
PRO
GRA
MM
E
Curr
ent p
aym
ent
20,8
99(3
)-
20,8
967,
997
12,8
9938
.3%
17,1
7710
,014
Tran
sfer
s an
d su
bsid
ies
-3
-3
9,90
6(9
,903
)33
0200
.0%
-9,
432
Paym
ent f
or c
apita
l ass
ets
114
(38)
-76
5026
65.8
%41
17
Paym
ent f
or fi
nanc
ial a
sset
s-
--
--
-2,
025
2,02
5
4.2
PRO
PERT
Y IN
DU
STRY
D
EVEL
OPM
ENT
PRO
GRA
MM
E
Curr
ent p
aym
ent
16,4
13-
-16
,413
8,85
47,
559
53.9
%12
,701
12,7
01
Tran
sfer
s an
d su
bsid
ies
--
--
--
8181
Paym
ent f
or c
apita
l ass
ets
1038
-48
51(3
)10
6.3%
8383
Tota
l37
,436
--
37,4
36
26,8
5810
,578
71.7
%32
,108
34,3
53

190 Department of Public Works | Annual Report 2012/13
Appropriation Statementfor the year ended 31 March 2013
2012
/13
2011
/12
Prog
ram
me
5 Pe
r Eco
nom
ic
clas
sific
atio
n
Adj
uste
d A
ppro
pria
-tio
n
Shift
ing
of
Fund
sVi
rem
ent
Fina
l A
ppro
pria
-tio
n
Act
ual
Expe
nditu
reVa
rian
ce
Expe
nditu
re
as %
of F
inal
A
ppro
pria
-tio
n
Fina
l A
ppro
pria
-tio
n
Act
ual
Expe
nditu
re
R’00
0R’
000
R’00
0R’
000
R’00
0R’
000
%R’
000
R’00
0
Curr
ent p
aym
ents
Goo
ds a
nd s
ervi
ces
17,2
91-
28,0
0045
,291
36,6
348,
657
80.9
%11
,967
11,9
67
Tran
sfer
s an
d su
bsid
ies
Dep
artm
enta
l age
ncie
s an
d ac
coun
ts2,
606
--
2,60
61,
260
1,34
648
.3%
2,48
227
8
Fore
ign
gove
rnm
ents
and
in
tern
atio
nal o
rgan
isat
ions
18
,941
-
-18
,941
15,4
363,
505
81.5
%16
,915
12,9
56
Hou
seho
lds
1-
-1
-1
1-
Tota
l38
,839
-28
,000
66,8
3953
,330
13,5
0979
.8%
31,3
6525
,201

Department of Public Works | Annual Report 2012/13 191
Appropriation Statementfor the year ended 31 March 2013
2012
/13
2011
/12
Det
ail p
er s
ub-p
rogr
amm
eA
djus
ted
App
ropr
ia-
tion
Shift
ing
of
Fund
sVi
rem
ent
Fina
l A
ppro
pria
-tio
n
Act
ual
Expe
nditu
reVa
rian
ce
Expe
nditu
re
as %
of F
inal
A
ppro
pria
-tio
n
Fina
l A
ppro
pria
-tio
n
Act
ual
Expe
nditu
re
R’00
0R’
000
R’00
0R’
000
R’00
0R’
000
%R’
000
R’00
0
5.1
COM
PEN
SATI
ON
FO
R LO
SSES
Curr
ent p
aym
ent
2,16
5-
-2,
165
-2,
165
--
5.2
DIS
TRES
S RE
LIEF
Curr
ent p
aym
ent
1-
-1
-1
--
5.3
LOSK
OP
SETT
LEM
ENT
Tran
sfer
s an
d su
bsid
ies
1-
-1
-1
1-
5.4
ASS
ISTA
NCE
TO
O
RGA
NIS
ATIO
NS
FOR
PRES
ERVA
TIO
N O
F N
ATIO
NA
L M
EMO
RIA
LS
Tran
sfer
s an
d su
bsid
ies
18,9
41-
-18
,941
15,4
363,
505
81.5
%16
,915
12,9
56
5.5
STAT
E FU
NCT
ION
S
Curr
ent p
aym
ent
15,1
25-
28,0
0043
,125
36,6
346,
491
84.9
%11
,967
11,9
67
5.6
SECT
OR
EDU
CATI
ON
AN
D
TRA
ININ
G A
UTH
ORI
TY
Tran
sfer
s an
d su
bsid
ies
2,60
6 -
-2,
606
1,26
01,
346
48.3
%2,
482
278
Tot
al38
,839
-28
,000
66,8
3953
,330
13,5
0979
.8%
31,3
6525
,201

192 Department of Public Works | Annual Report 2012/13
Notes to the Appropriation Statementfor the year ended 31 March 2013
1. Detail of transfers and subsidies as per Appropriation Act (after Virement):
Detail of these transactions can be viewed in the note on Transfers and subsidies, disclosure notes and Annexure 1 (A-H) to the Annual Financial Statements.
2. Detail of specifically and exclusively appropriated amounts voted (after Virement):
Detail of these transactions can be viewed in note 1 (Annual Appropriation) to the Annual Financial Statements.
3. Detail on payments for financial assets
Detail of these transactions per programme can be viewed in the note on Payments for financial assets to the Annual Financial Statements.
4. Explanations of material variances from Amounts Voted (after Virement):
4.1 Per programme Final Appropriation Actual Expenditure Variance R’000
Variance as a % of Final
Appropriation
Administration 1,004,964 856,185 148,779 15%
Expenditure variance of 15% in Programme 1 is due to under-spending on Goods and services and Software and Intangible Asset. The Department received additional funding during the adjustment estimates under goods and services and software and intangible assets for the implementation of the Turnaround and the delay in appointing services providers resulted in funds not being fully spent. Roll over has been requested for unspent goods and services. Goods and services for Office Accommodation were also underspent, and the under-spending is due to delay in completing reconciliation of lease contracts between the department and PMTE. An amount of R20 million for Software and Intangible Asset for the procurement of the Accounting System for the PMTE received as additional funding during the adjustment estimates was not spent.
Immovable asset management 5,052,937 4,563,501 489,436 10%
Expenditure variance of 10% in Programme 2 is due to under-spending in goods and services, transfers and subsidies for the Devolution of Property Rates Fund to Provinces and payments for capital assets for infrastructure and machinery and equipment. Under-spending in goods and services relates to additional funds received during the adjustment estimates allocated for the implementation of the turnaround for Immovable Asset register, lease review and project management support. Under-spending in transfers and subsidies relates to an amount of R120 million for Devolution of Property Rates Fund Grant to Provinces declared as saving by the Kwazulu-Natal Provincial Department of Public Works. The roll over for the declared saving amount has been requested and funding will be allocated to other provinces that had the shortfall during 2012/13. Under-spending in Infrastructure is due to non-performance of contractors and vacant positions for the project managers in some of the regions. Under-spending in machinery and equipment is due to delayed invoices.
Expanded Public Works Programme 1,729,072 1,704,051 25,021 1%
Expenditure and transfers and subsidies variance of 1% in Programme 3 is due to under-spending on goods and services and compensation of employees and transfers and subsidies for payment relating to municipalities. Under-spending on compensation is due to positions that became vacant during the financial year and under-spending on goods and services is due to funds committed but not spent due to fund committed but not spent at the end of the financial year.

Department of Public Works | Annual Report 2012/13 193
Notes to the Appropriation Statementfor the year ended 31 March 2013
Property and Construction Industry Policy Regulations
37,436 26,858 10,578 28%
Expenditure variance of 28% in Programme 4 is due to under-spending in goods and services and compensation of employees. The delay in filling of vacant positions resulted in under-spending on compensation of employees and under-spending on goods and services is due to low spending on allocations for border fencing.
Auxiliary and Associated Services 66,839 53,330 13,509 20%
Expenditure variance of 20% in Programme 5 relates to under-spending on goods and services for the expenditure related to State Function and transfers and subsidies. Under-spending of R6.4 million on good and services was mainly under State function was due to delay in receiving the invoices from service providers for the service rendered. Under-spending in transfers and subsidies relate to saving realised from Commonwealth Wargrave and Sector Education and Training Authority.
4.2 Per economic classification Final Appropriation
Actual Expenditure Variance
Variance as a % of Final
Appropriation
R’000 R’000 R’000
Current payments
Compensation of employees 1,381,450 1,374,552 6,898 0%
Goods and services 1,203,845 977,014 226,831 19%
Interest and rent on land 9,774 21 9,753 100%
Transfers and subsidies
Provinces and municipalities 3,090,982 2,969,955 121,027 4%
Departmental agencies and accounts 752,986 751,640 1,346 0%
Public corporations and private enterprises 18,941 15,436 3,505 19%
Foreign governments and international organi-sations
50,800 50,800 - 0%
Non-profit institutions 282,724 292,627 (9,903) (4)%
Households 11,876 11,875 1 0%
Gifts and donations 3 20 (17) (567%
Payments for capital assets
Buildings and other fixed structures 999,254 713,003 286,251 29%
Machinery and equipment 59,558 43,283 16,275 27%
Software and other intangible assets 25,857 501 25,356 98%
Payments for financial assets 3,198 3,198 - 0%
Expenditure variance is due to under-spending on goods and services, transfers and subsidies for Devolution of Property

194 Department of Public Works | Annual Report 2012/13
Notes to the Appropriation Statementfor the year ended 31 March 2013
Rates Fund; payments for capital assets, expenditure relating to Infrastructure, and machinery and equipment. Good and services under-spending relates to Office Accommodation and additional funds received during adjustment estimates for the implementation of the Turnaround programme. All programmes have had under-spending on goods and services. Transfers and subsidies under-spending relate to funds allocated for Devolution of Property Rates Fund Grant to Provinces declared as saving by the Kwazulu-Natal Provincial Department of Public Works. Infrastructure under-spending is due to non-performance of contractors and vacant positions for the project managers in some of the regions. Machinery and equipment under-spending is due to invoices received late for processing for services rendered prior to the end of the financial year.
4.3 Per conditional grant Final Appropriation
Actual Expenditure Variance
Variance as a % of Final Appropria-
tion
R’000 R’000 R’000
Devolution of Property Rates Fund Grant to Provinces 1,918,659 1,798,170 120,489 6%
EPWP Integrated Grant to Municipalities 662,135 661,535 600 0%
EPWP Integrated Grant to Provinces 292,761 292,843 (82) 0%
EPWP Incentive Grant to Provinces: Social Sector 217,401 217,401 - 0%
Expenditure variance on conditional grants is due to an amount of R120 million declared as saving under the Devolution of Property Rates Fund Grant to Provinces by the Kwazulu-Natal Provincial Department of Public Works.
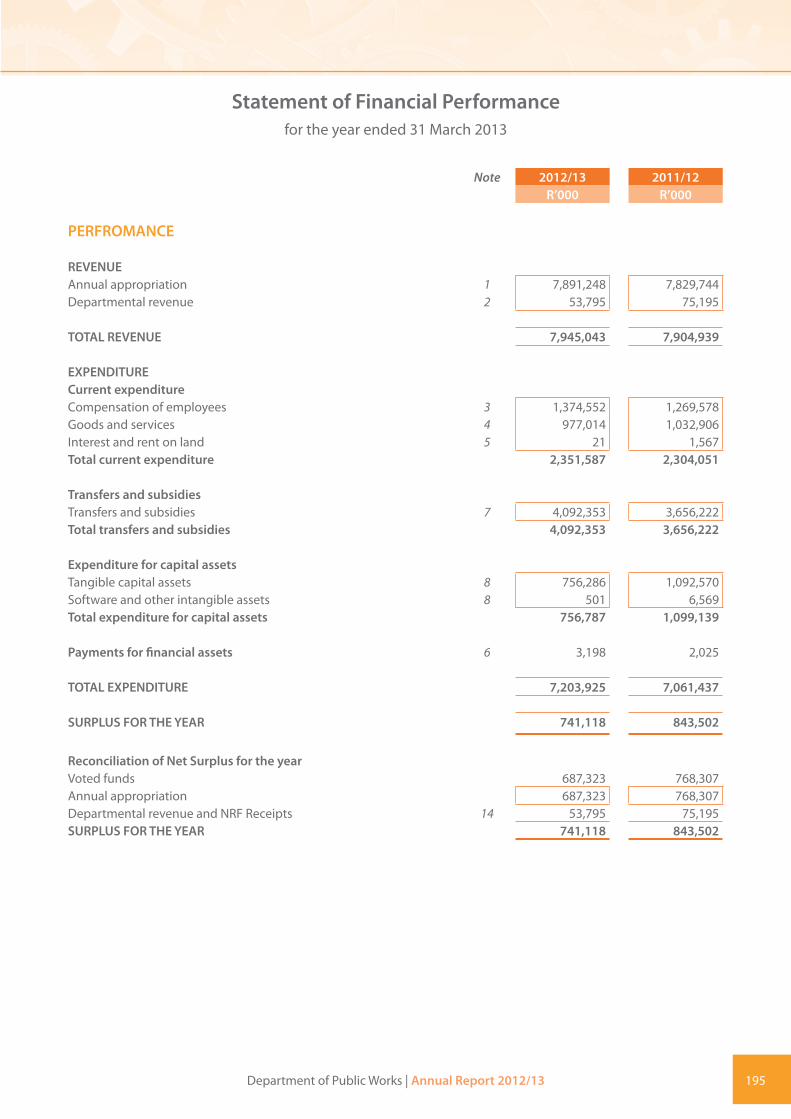
Department of Public Works | Annual Report 2012/13 195
Statement of Financial Performancefor the year ended 31 March 2013
Note 2012/13 2011/12R’000 R’000
PERFROMANCE
REVENUEAnnual appropriation 1 7,891,248 7,829,744Departmental revenue 2 53,795 75,195
TOTAL REVENUE 7,945,043 7,904,939
EXPENDITURECurrent expenditureCompensation of employees 3 1,374,552 1,269,578Goods and services 4 977,014 1,032,906Interest and rent on land 5 21 1,567Total current expenditure 2,351,587 2,304,051
Transfers and subsidiesTransfers and subsidies 7 4,092,353 3,656,222Total transfers and subsidies 4,092,353 3,656,222
Expenditure for capital assetsTangible capital assets 8 756,286 1,092,570Software and other intangible assets 8 501 6,569Total expenditure for capital assets 756,787 1,099,139
Payments for financial assets 6 3,198 2,025
TOTAL EXPENDITURE 7,203,925 7,061,437
SURPLUS FOR THE YEAR 741,118 843,502
Reconciliation of Net Surplus for the yearVoted funds 687,323 768,307Annual appropriation 687,323 768,307Departmental revenue and NRF Receipts 14 53,795 75,195SURPLUS FOR THE YEAR 741,118 843,502

196 Department of Public Works | Annual Report 2012/13
Statement of Financial Positionfor the year ended 31 March 2013
Note 2012/13 2011/12R’000 R’000
POSITION
ASSETS
Current assets 986,396 1,093,024Unauthorised expenditure 9 249,453 83,082Cash and cash equivalents 10 439,804 825,603Prepayments and advances 11 38,244 38,600Receivables 12 258,895 145,739
TOTAL ASSETS 986,396 1,093,024
LIABILITIES
Current liabilities 929,154 1,087,966Voted funds to be surrendered to the Revenue Fund 13 853,713 792,914Departmental revenue and NRF Receipts to be surrendered to the Revenue Fund
14 9,450 7,560
Payables 15 65,991 287,492
TOTAL LIABILITIES 929,154 1,087,966
NET ASSETS 57,242 5,058
Represented by:Recoverable revenue 57,242 5,058
TOTAL 57,242 5,058

Department of Public Works | Annual Report 2012/13 197
Statement of Changes in Net Assetsfor the year ended 31 March 2013
Note 2012/13 2011/12R’000 R’000
NET ASSETS
Recoverable revenueOpening balance 5,058 3,561Transfers: 52,184 1,497
Irrecoverable amounts written off - -Debts revised - -Debts recovered (included in Departmental receipts) - -Debts raised 52,184 1,497
Closing balance 57,242 5,058
TOTAL 57,242 5,058

198 Department of Public Works | Annual Report 2012/13
Cash Flow Statementfor the year ended 31 March 2013
Note 2012/13 2011/12R’000 R’000
CASH FLOW
CASH FLOWS FROM OPERATING ACTIVITIESReceipts 7,945,043 7,901,785
Annual appropriated funds received 1.1 7,891,248 7,829,744Departmental revenue received 2 53,795 72,041
Net (increase)/decrease in working capital (500,672) 223,567Surrendered to Revenue Fund (844,800) (823,455)Current payments (2,185,216) (2,279,464)Payments for financial assets (3,198) (2,025)Transfers and subsidies paid (4,092,353) (3,656,222)Net cash flow available from operating activities 16 318,804 1,364,186
CASH FLOWS FROM INVESTING ACTIVITIESPayments for capital assets 8 (756,787) (1,099,139)Proceeds from sale of capital assets 2.4 - 3,154Net cash flows from investing activities (756,787) (1,095,985)
CASH FLOWS FROM FINANCING ACTIVITIESIncrease in net assets 52,184 1,497Net cash flows from financing activities 52,184 1,497
Net increase/(decrease) in cash and cash equivalents (385,799) 269,698
Cash and cash equivalents at beginning of period 825,603 555,905
Cash and cash equivalents at end of period 17 439,804 825,603

Accounting Policiesfor the year ended 31 March 2013
Department of Public Works | Annual Report 2012/13 199
The Financial Statements have been prepared in accordance with the following policies, that have been applied consistently in all material aspects, unless otherwise indicated. However, where appropriate and meaningful, additional information has been disclosed to enhance the usefulness of the Financial Statements and to comply with the statutory requirements of the Public Finance Management Act, Act 1 of 1999 (as amended by Act 29 of 1999), and the Treasury Regulations issued in terms of the Act and the Division of Revenue Act, Act 1 of 2010.
1. Presentation of the Financial Statements
1.1 Basis of preparation
The financial statements have been prepared on a modified cash basis of accounting.
Under this basis, the effects of transactions and other events are recognised in the financial records when the resulting cash is received or paid. The “modification” results from the recognition of certain near-cash balances in the financial statements, as well as the revaluation of foreign investments and loans and the recognition of resulting revaluation gains and losses.
In addition supplementary information is provided in the disclosure notes to the financial statements where it is deemed to be useful to the users of the financial statements.
1.2 Presentation currency
All amounts have been presented in the currency of the South African Rand (R) that is also the functional currency of the Department.
1.3 Rounding
Unless otherwise stated all financial figures have been rounded to the nearest one thousand Rand (R’000).
1.4 Comparative figures
Prior period comparative information has been presented in the current year’s financial statements. Where necessary figures included in the prior period financial statements have been reclassified to ensure that the format in which the information is presented, is consistent with the format of the current year’s financial statements.
1.5 Comparative figures - Appropriation Statement
A comparison between actual amounts and final appropriation per major classification of expenditure is included in the Appropriation Statement.
2. Revenue
2.1 Appropriated funds
Appropriated funds comprises of Departmental allocations as well as direct charges against revenue fund (i.e. statutory appropriation).
Appropriated funds are recognised in the financial records on the date the appropriation becomes effective. Adjustments made in terms of the adjustments budget process are recognised in the financial records on the date the adjustments becomes effective.
Unexpended appropriated funds are surrendered to the National Revenue Fund. Any amounts owing to the National Revenue Fund at the end of the financial year are recognised as a payable in the statement of financial position.

Accounting Policiesfor the year ended 31 March 2013
200 Department of Public Works | Annual Report 2012/13
Any amount due from the National Revenue Fund at the end of the financial year is recognised as a receivable in the statement of financial position.
2.2 Departmental revenue
All Departmental revenue is recognised in the statement of financial performance when received and is subsequently paid into the National Revenue Fund, unless stated otherwise.
Any amount owing to the National Revenue Fund at the end of the financial year is recognised as a payable in the statement of financial position.
No accrual is made for amounts receivable from the last receipt date to the end of the reporting period. These amounts are however disclosed in the disclosure notes to the annual financial statements.
3. Expenditure
3.1 Compensation of employees
3.1.1 Salaries and wages
Salaries and wages are expensed in the statement of financial performance when the final authorisation for payment is effected on the system (by no later than 31 March of each year).
Other employee benefits that give rise to a present legal or constructive obligation are disclosed in the disclosure notes to the financial statements at its face value and are not recognised in the statement of financial performance or position.
3.1.2 Social contributions
Employer contributions to post employment benefit plans in respect of current employees are expensed in the statement of financial performance when the final authorisation for payment is effected on the system (by no later than 31 March of each year).
No provision is made for retirement benefits in the financial statements of the Department. Any potential liabilities are disclosed in the financial statements of the National Revenue Fund and not in the financial statements of the employer department.
Employer contributions made by the Department for certain of its ex-employees (such as medical benefits) are classified as transfers to households in the statement of financial performance.
3.2 Goods and services
Payments made during the year for goods and/or services are recognised as an expense in the statement of financial performance when the final authorisation for payment is effected on the system (by no later than 31 March of each year).
The expense is classified as capital if the goods and/or services were acquired for a capital project or if the total purchase price exceeds the capitalisation threshold (currently R5, 000). All other expenditures are classified as current.
Rental paid for the use of buildings or other fixed structures is classified as goods and services and not as rent on land.

Accounting Policiesfor the year ended 31 March 2013
Department of Public Works | Annual Report 2012/13 201
3.3 Interest and rent on land
Interest and rental payments are recognised as an expense in the statement of financial performance when the final authorisation for payment is effected on the system (by no later than 31 March of each year). This item excludes rental for the use of buildings or other fixed structures. If it is not possible to distinguish between payment for the use of land and the fixed structures on it, the whole amount should be recorded under goods and services.
3.4 Payments for financial assets
Debts are written-off when identified as irrecoverable. Debts written-off are limited to the amount of savings and/or under-spending of appropriated funds. The write-off occurs at year-end or when funds are available. No provision is made for irrecoverable amounts but an estimate is included in the disclosure notes to the financial statements.
All other losses are recognised when authorisation has been granted for the recognition thereof.
3.5 Transfers and subsidies
Transfers and subsidies are recognised as an expense when the final authorisation for payment is effected on the system (by no later than 31 March of each year).
3.6 Unauthorised expenditure
When confirmed, unauthorised expenditure is recognised as an asset in the statement of financial position until such time as the expenditure is either approved by the relevant authority, recovered from the responsible person or written off as irrecoverable in the statement of financial performance.
Unauthorised expenditure approved with funding is derecognised from the statement of financial position when the unauthorised expenditure is approved and the related funds are received.
Where the amount is approved without funding, it is recognised as expenditure in the statement of financial performance on the date stipulated in the Act.
3.7 Fruitless and wasteful expenditure
Fruitless and wasteful expenditure is recognised as expenditure in the statement of financial performance according to the nature of the payment and not as a separate line item on the face of the statement. If the expenditure is recoverable, it is treated as an asset until it is recovered from the responsible person or written-off as irrecoverable in the statement of financial performance.
3.8 Irregular expenditure
Irregular expenditure is recognised as expenditure in the statement of financial performance. If the expenditure is not condoned by the relevant authority it is treated as an asset until it is recovered or written-off as irrecoverable.
4. Assets
4.1 Cash and cash equivalents
Cash and cash equivalents are carried in the statement of financial position at cost.
Bank overdrafts are shown separately on the face of the statement of financial position.

Accounting Policiesfor the year ended 31 March 2013
202 Department of Public Works | Annual Report 2012/13
For the purposes of the cash flow statement, cash and cash equivalents comprise cash on hand, deposits held, other short-term highly liquid investments and bank overdrafts.
4.2 Prepayments and advances
Amounts prepaid or advanced are recognised in the statement of financial position when the payments are made and are derecognised as and when the goods/services are received or the funds are utilised.
Prepayments and advances outstanding at the end of the year are carried in the statement of financial position at cost.
4.3 Receivables
Receivables included in the statement of financial position arise from cash payments made that are recoverable from another party (including Departmental employees) and are derecognised upon recovery or write-off.
Receivables outstanding at year-end are carried in the statement of financial position at cost plus any accrued interest. Amounts that are potentially irrecoverable are included in the disclosure notes.
4.4 Inventory
Inventories that qualify for recognition must be initially reflected at cost. Where inventories are acquired at no cost, or for nominal consideration, their cost shall be their fair value at the date of acquisition.
All inventory items at year-end are reflected using the weighted average cost or FIFO cost formula.
4.5 Capital assets
4.5.1 Movable assets
Initial recognition
A capital asset is recorded in the asset register on receipt of the item at cost. Cost of an asset is defined as the total cost of acquisition. Where the cost cannot be determined accurately, the movable capital asset is stated at fair value. Where fair value cannot be determined, the capital asset is included in the asset register at R1.
All assets acquired prior to 1 April 2002 are included in the register at R1.
Subsequent recognition
Subsequent expenditure of a capital nature is recorded in the statement of financial performance as “expenditure for capital assets” and is capitalised in the asset register of the Department on completion of the project.
Repairs and maintenance is expensed as current “goods and services” in the statement of financial performance.
4.5.2 Immovable assets
Initial recognition
A capital asset is recorded on receipt of the item at cost. Cost of an asset is defined as the total cost of acquisition. Where the cost cannot be determined accurately, the immovable capital asset is stated at R1 unless the fair value for the asset has been reliably estimated.

Accounting Policiesfor the year ended 31 March 2013
Department of Public Works | Annual Report 2012/13 203
Subsequent recognition
Work-in-progress of a capital nature is recorded in the statement of financial performance as “expenditure for capital assets”. On completion, the total cost of the project is included in the asset register of the department that is accountable for the asset.
Repairs and maintenance is expensed as current “goods and services” in the statement of financial performance.
4.5.3 Intangible assets
Initial recognition
An intangible asset is recorded in the asset register on receipt of the item at cost. Cost of an intangible asset is defined as the total cost of acquisition. Where the cost cannot be determined accurately, the intangible asset is stated at fair value. Where fair value cannot be determined, the intangible asset is included in the asset register at R1.
All intangible assets acquired prior to 1 April 2002 can be included in the asset register at R1.
Subsequent expenditure
Subsequent expenditure of a capital nature is recorded in the statement of financial performance as “expenditure for capital asset” and is capitalised in the asset register of the Department.
Maintenance is expensed as current “goods and services” in the statement of financial performance.
5. Liabilities
5.1 Payables
Recognised payables mainly comprise of amounts owing to other governmental entities, clearing accounts and amounts received in advance. These payables are carried at cost in the statement of financial position.
5.2 Contingent liabilities
Contingent liabilities are included in the disclosure notes to the financial statements when it is possible that economic benefits will flow from the Department, or when an outflow of economic benefits or service potential is probable but cannot be measured reliably.
5.3 Contingent assets
Contingent assets are included in the disclosure notes to the financial statements when it is probable that an inflow of economic benefits will flow to the entity.
5.4 Commitments
Commitments are not recognised in the statement of financial position as a liability or as expenditure in the statement of financial performance but are included in the disclosure notes.
5.5 Accruals
Accruals are not recognised in the statement of financial position as a liability or as expenditure in the statement of financial performance but are included in the disclosure notes.

Accounting Policiesfor the year ended 31 March 2013
204 Department of Public Works | Annual Report 2012/13
5.6 Employee benefits
Short-term employee benefits that give rise to a present legal or constructive obligation are disclosed in the disclosure notes to the financial statements. These amounts are not recognised in the statement of financial performance or the statement of financial position.
5.7 Lease commitments
Finance lease
Finance leases are not recognised as assets and liabilities in the statement of financial position. Finance lease payments are recognised as a capital expense in the statement of financial performance and are not apportioned between the capital and the interest portions. The total finance lease commitments are disclosed in the disclosure notes to the financial statements.
Operating lease
Operating lease payments are recognised as an expense in the statement of financial performance. The operating lease commitments are disclosed in the disclosure notes to the financial statement.
5.8 Impairment
The Department tests for impairment where there is an indication that a receivable, loan or investment may be impaired. An assessment of whether there is an indication of possible impairment is done at each reporting date. An estimate is made for doubtful loans and receivables based on a review of all outstanding amounts at year-end. Impairments on investments are calculated as being the difference between the carrying amount and the present value of the expected future cash flows/service potential flowing from the instrument.
5.9 Provisions
Provisions are disclosed when there is a present legal or constructive obligation to forfeit economic benefits as a result of events in the past and it is probable that an outflow of resources embodying economic benefits will be required to settle the obligation and a reliable estimate of the obligation can be made.
6. Receivables for departmental revenue
Receivables for Departmental revenue are disclosed in the disclosure notes to the annual financial statements. These receivables are written-off when identified as irrecoverable and are disclosed separately.
7. Net Assets
7.1 Recoverable revenue
Amounts are recognised as recoverable revenue when a payment made in a previous financial year becomes recoverable from a debtor in the current financial year. Amounts are either transferred to the National Revenue Fund when recovered or are transferred to the statement of financial performance when written-off.
8. Related party transactions
Specific information with regards to related party transactions is included in the disclosure notes.

Accounting Policiesfor the year ended 31 March 2013
Department of Public Works | Annual Report 2012/13 205
9. Key management personnel
Compensation paid to key management personnel including their family members where relevant, is included in the disclosure notes.
10. Public private partnerships
A description of the PPP arrangement, the contract fees and current and capital expenditure relating to the PPP arrangement is included in the disclosure notes.

206 Department of Public Works | Annual Report 2012/13
Notes to the Annual Financial Statementsfor the year ended 31 March 2013
1. Annual Appropriation
1.1 Annual Appropriation
Included are funds appropriated in terms of the Appropriation Act (and the Adjustments Appropriation Act) for National Departments (Voted funds) and Provincial Departments:
2012/13 2011/12
Final Appropriation
Actual Funds Received
Funds not requested/
not received
Appropriation received
R’000 R’000 R’000 R’000Administration 1,004,964 1,004,964 - 777,521Immovable asset management 5,052,937 5,052,937 - 5,410,545Expanded Public Works Programme 1,729,072 1,729,072 - 1,575,198Property and construction industry pol-icy regulations
37,436 37,436 - 34,900
Auxiliary and associated services 66,839 66,839 - 31,5807,891,248 7,891,248 - 7,829,744
2. Departmental revenue
Note 2012/13 2011/12R’000 R’000
Sales of goods and services other than capital assets 2.1 32,017 36,388Fines, penalties and forfeits 2.2 3 12Interest, dividends and rent on land 2.3 7,835 103Sales of capital assets 2.4 - 3,154Transactions in financial assets and liabilities 2.5 13,940 35,538Departmental revenue collected 53,795 75,195
2.1 Sales of goods and services other than capital assets
2Sales of goods and services produced by the Department 32,013 36,353
Sales by market establishment 445 411Administrative fees 215 2Other sales 31,353 35,940
Sales of scrap, waste and other used current goods 4 35Total 32,017 36,388
2.2 Fines, penalties and forfeits
2Fines 3 12Total 3 12
2.3 Interest, dividends and rent on land
2Interest 7,835 103Total 7,835 103

Note 2012/13 2011/12R’000 R’000
Department of Public Works | Annual Report 2012/13 207
Notes to the Annual Financial Statementsfor the year ended 31 March 2013
2.4 Sale of capital assets
2Tangible assets - 3,154Buildings and other fixed structures 34 - 3,154Total - 3,154
2.5 Transactions in financial assets and liabilities
Receivables 2 315 372Stale cheques written back 2 -Other Receipts including Recoverable Revenue 13,623 35,166Total 13,940 35,538
3. Compensation of employees
3.1 Salaries and Wages
Basic salary 942,960 866,062Performance award 15,886 15,912Service Based 1,800 2,228Compensative/circumstantial 13,963 16,414Periodic payments 4,606 5,854Other non-pensionable allowances 208,283 191,498Total 1,187,498 1,097,968
3.2 Social contributions
Employer contributionsPension 116,983 107,304Medical 69,777 63,948Bargaining council 294 358Total 187,054 171,610
Total compensation of employees 1,374,552 1,269,578
Average number of employees 5,494 5,849

Note 2012/13 2011/12R’000 R’000
208 Department of Public Works | Annual Report 2012/13
Notes to the Annual Financial Statementsfor the year ended 31 March 2013
4. Goods and services
Administrative fees 453 439Advertising 8,637 20,218Assets less than R5,000 4.1 2,698 11,848Bursaries (employees) - 24Catering 2,662 3,122Communication 31,628 29,236Computer services 4.2 36,677 48,466Consultants, contractors and agency/outsourced services 4.3 268,710 285,953Entertainment 795 1,084Audit cost – external 4.4 48,374 40,916Fleet services 21,430 19,970Inventory 4.5 40,721 35,788Operating leases 139,175 189,504Property payments 4.6 257,587 199,511Rental and hiring 2,883 -Travel and subsistence 4.7 86,346 110,077Venues and facilities 7,761 9,937Training and staff development 9,653 13,492Other operating expenditure 4.8 10,824 13,321Total 977,014 1,032,906
4.1 Assets less than R5,000
4Tangible assets 2,698 11,843
Machinery and equipment 2,698 11,843Intangible assets - 5Total 2,698 11,848
4.2 Computer services
SITA computer services 4 22,172 19,965External computer service providers 14,505 28,501Total 36,677 48,466
4.3 Consultants, contractors and agency/outsourced services
4Business and advisory services 78,125 38,036Infrastructure and planning 11,059 10,343Legal costs 13,822 6,063Contractors 49,657 154,763Agency and support/outsourced services 116,047 76,748Total 268,710 285,953

Note 2012/13 2011/12R’000 R’000
Department of Public Works | Annual Report 2012/13 209
Notes to the Annual Financial Statementsfor the year ended 31 March 2013
4.4 Audit cost – External
Regularity audits 4 48,374 40,916Total 48,374 40,916
4.5 Inventory
4Learning and teaching support material - 44Food and food supplies - 8Fuel, oil and gas 9,105 7,621Other consumables 14,943 12,774Materials and supplies 1,111 1,323Stationery and printing 15,557 14,018Medical supplies 5 -Total 40,721 35,788
4.6 Property payments
4Municipal services 251,267 190,264Property management fees 2,601 8,241Other 3,719 1,006Total 257,587 199,511
4.7 Travel and subsistence
4Local 85,458 105,521Foreign 888 4,556Total 86,346 110,077
4.8 Other operating expenditure
4Learnerships 4,720 5,680Professional bodies, membership and subscription fees 1,701 1,373Resettlement costs 770 3,630Other 3,633 2,638Total 10,824 13,321
5. Interest and rent on land
Interest paid 21 1,567Total 21 1,567

Note 2012/13 2011/12R’000 R’000
210 Department of Public Works | Annual Report 2012/13
Notes to the Annual Financial Statementsfor the year ended 31 March 2013
6. Payments for financial assets
Other material losses written-off 6.1 3,198 2,025Total 3,198 2,025
6.1 Other material losses written-off
Nature of losses 6Claims recoverable 281 -Recoverable expenditure 2,890 2,000Prepayments 27 25Total 3,198 2,025
7. Transfers and subsidies
Provinces and municipalities36, Annex 1A, Annex
1B2,969,955 2,592,965
Departmental agencies and accounts Annex 1C 751,640 732,486Foreign governments and international organisations Annex 1E 15,436 12,956Public corporations and private enterprises Annex 1D 50,800 150,000Non-profit institutions Annex 1F 292,627 163,801Households Annex 1G 11,875 4,012Gifts, donations and sponsorships made Annex 1I 20 2Total 4,092,353 3,656,222
Unspent funds transferred to the above beneficiaries 283,509 37,913
Comparative figureAdditional information was included in the transfer and subsidies note relating to unspent funds transferred to beneficiaries. The comparative figure has been updated indicating that R37,913 million of funds were unspent by beneficiaries in the prior year.
8. Expenditure for capital assets
Tangible assets 756,286 1,092,570Buildings and other fixed structures 34 713,003 1,011,407Machinery and equipment 32 43,283 81,163
Software and other intangible assets 501 6,569Computer software 33 501 6,569
Total 756,787 1,099,139
The following amounts have been included as project costs in Expendi-ture for capital assets
Goods and services 609 4,550Total 609 4,550
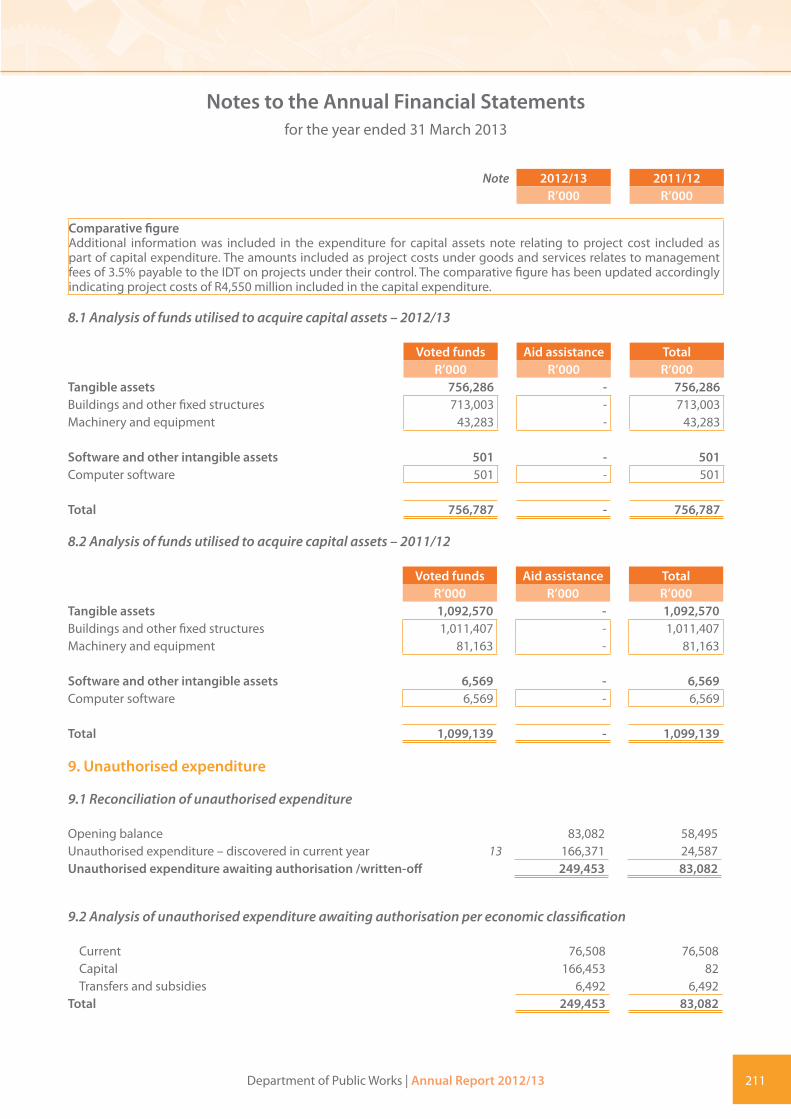
Note 2012/13 2011/12R’000 R’000
Department of Public Works | Annual Report 2012/13 211
Notes to the Annual Financial Statementsfor the year ended 31 March 2013
Comparative figureAdditional information was included in the expenditure for capital assets note relating to project cost included as part of capital expenditure. The amounts included as project costs under goods and services relates to management fees of 3.5% payable to the IDT on projects under their control. The comparative figure has been updated accordingly indicating project costs of R4,550 million included in the capital expenditure.
8.1 Analysis of funds utilised to acquire capital assets – 2012/13
Voted funds Aid assistance TotalR’000 R’000 R’000
Tangible assets 756,286 - 756,286Buildings and other fixed structures 713,003 - 713,003Machinery and equipment 43,283 - 43,283
Software and other intangible assets 501 - 501Computer software 501 - 501
Total 756,787 - 756,787
8.2 Analysis of funds utilised to acquire capital assets – 2011/12
Voted funds Aid assistance TotalR’000 R’000 R’000
Tangible assets 1,092,570 - 1,092,570Buildings and other fixed structures 1,011,407 - 1,011,407Machinery and equipment 81,163 - 81,163
Software and other intangible assets 6,569 - 6,569Computer software 6,569 - 6,569
Total 1,099,139 - 1,099,139
9. Unauthorised expenditure
9.1 Reconciliation of unauthorised expenditure
Opening balance 83,082 58,495Unauthorised expenditure – discovered in current year 13 166,371 24,587Unauthorised expenditure awaiting authorisation /written-off 249,453 83,082
9.2 Analysis of unauthorised expenditure awaiting authorisation per economic classification
Current 76,508 76,508Capital 166,453 82Transfers and subsidies 6,492 6,492
Total 249,453 83,082
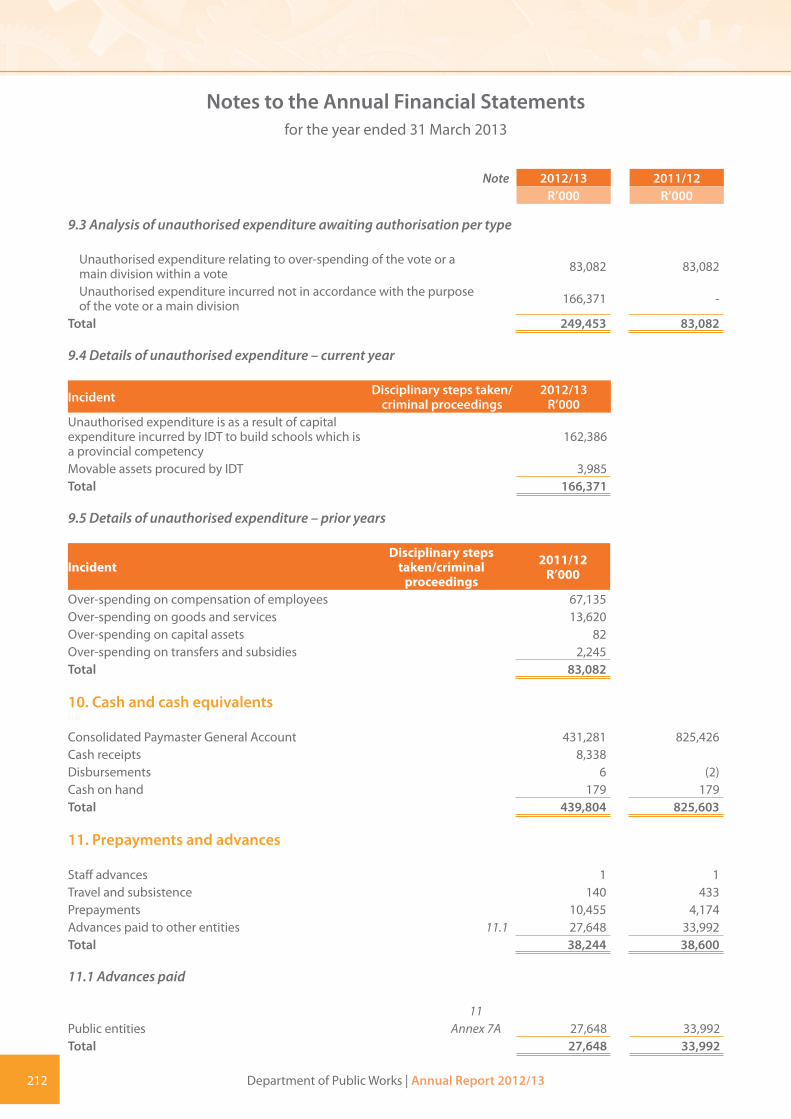
Note 2012/13 2011/12R’000 R’000
212 Department of Public Works | Annual Report 2012/13
Notes to the Annual Financial Statementsfor the year ended 31 March 2013
9.3 Analysis of unauthorised expenditure awaiting authorisation per type
Unauthorised expenditure relating to over-spending of the vote or a main division within a vote 83,082 83,082
Unauthorised expenditure incurred not in accordance with the purpose of the vote or a main division 166,371 -
Total 249,453 83,082
9.4 Details of unauthorised expenditure – current year
Incident Disciplinary steps taken/criminal proceedings
2012/13R’000
Unauthorised expenditure is as a result of capital expenditure incurred by IDT to build schools which is a provincial competency
162,386
Movable assets procured by IDT 3,985Total 166,371
9.5 Details of unauthorised expenditure – prior years
IncidentDisciplinary steps
taken/criminal proceedings
2011/12R’000
Over-spending on compensation of employees 67,135Over-spending on goods and services 13,620Over-spending on capital assets 82Over-spending on transfers and subsidies 2,245Total 83,082
10. Cash and cash equivalents
Consolidated Paymaster General Account 431,281 825,426Cash receipts 8,338Disbursements 6 (2)Cash on hand 179 179Total 439,804 825,603
11. Prepayments and advances
Staff advances 1 1Travel and subsistence 140 433Prepayments 10,455 4,174Advances paid to other entities 11.1 27,648 33,992Total 38,244 38,600
11.1 Advances paid
11Public entities Annex 7A 27,648 33,992Total 27,648 33,992

Note 2012/13 2011/12R’000 R’000
Department of Public Works | Annual Report 2012/13 213
Notes to the Annual Financial Statementsfor the year ended 31 March 2013
12. Receivables
2012/13 2011/12R’000 R’000 R’000 R’000 R’000
Note
Less than one year
One to three years
Older than three years Total Total
Claims recoverable 12.1Annex 3 131,707 7,153 2,281 188,668 82,450
Recoverable expenditure 12.2 1,548 1,848 45,784 49,180 50,277Staff debt 12.3 440 1,487 2,618 4,537 3,746Other debtors 12.4 52,367 1,864 9,798 16,510 9,266Total 186,062 12,352 60,481 258,895 145,739
Comparative figureThe prior year staff debt balance has been reclassified between staff debt and other debtors. This resulted in a decrease of staff debt and an increase of other debtors amounting to R9,266 million (as disclosed in note 12.3 and 12.4).
12.1 Claims recoverable
National departments 12 63,124 76,352Provincial departments 125,544 6,098Total 188,668 82,450
12.2 Recoverable expenditure (disallowance accounts)
Disallowance 12 48,021 48,179Private telephone 45 28Salary accounts 1,114 2,070Total 49,180 50,277
12.3 Staff debt
Personnel debt 12 4,537 3,746Total 4,537 3,746
12.4 Other debtors
Other debtors 12 16,510 9,266Total 16,510 9,266
13. Voted funds to be surrendered to the Revenue Fund
Opening balance 792,914 749,722Transfer from statement of financial performance 687,323 768,307Add: Unauthorised expenditure for current year 9 166,371 24,587Paid during the year (792,895) (749,702)Closing balance 853,713 792,914

Note 2012/13 2011/12R’000 R’000
214 Department of Public Works | Annual Report 2012/13
Notes to the Annual Financial Statementsfor the year ended 31 March 2013
14. Departmental revenue and NRF Receipts to be surrendered to the Revenue Fund
Opening balance 7,560 6,118Transfer from Statement of Financial Performance 53,795 75,195Paid during the year (51,905) (73,753)Closing balance 9,450 7,560
15. Payables – current
Advances received 15.1 57,480 275,960Clearing accounts 15.2 491 1,397Other payables 15.3 8,020 10,135Total 65,991 287,492
15.1 Advances received
15
National departments Annex 7B 46,806 52,147
Provincial departments Annex 7B 10,000 222,979
Public entities Annex 7B 674 834
Total 57,480 275,960
15.2 Clearing accounts
Salary clearing accounts 15 491 1,397Total 491 1,397
15.3 Other payables
Claims and other payables 15 7,743 9,760Tender deposit 269 295Rental deposit 8 80Total 8,020 10,135
16. Net cash flow available from operating activities
Net surplus as per Statement of Financial Performance 741,118 843,502Add back non cash/cash movements not deemed operating activities (422,314) 520,684(Increase)/decrease in receivables – current (113,156) 6,670Decrease in prepayments and advances 356 137,455Increase/(decrease) in payables – current (221,501) 104,029Proceeds from sale of capital assets - (3,154)Expenditure on capital assets 756,787 1,099,139Surrenders to Revenue Fund (844,800) (823,455)Net cash flow generated by operating activities 318,804 1,364,186
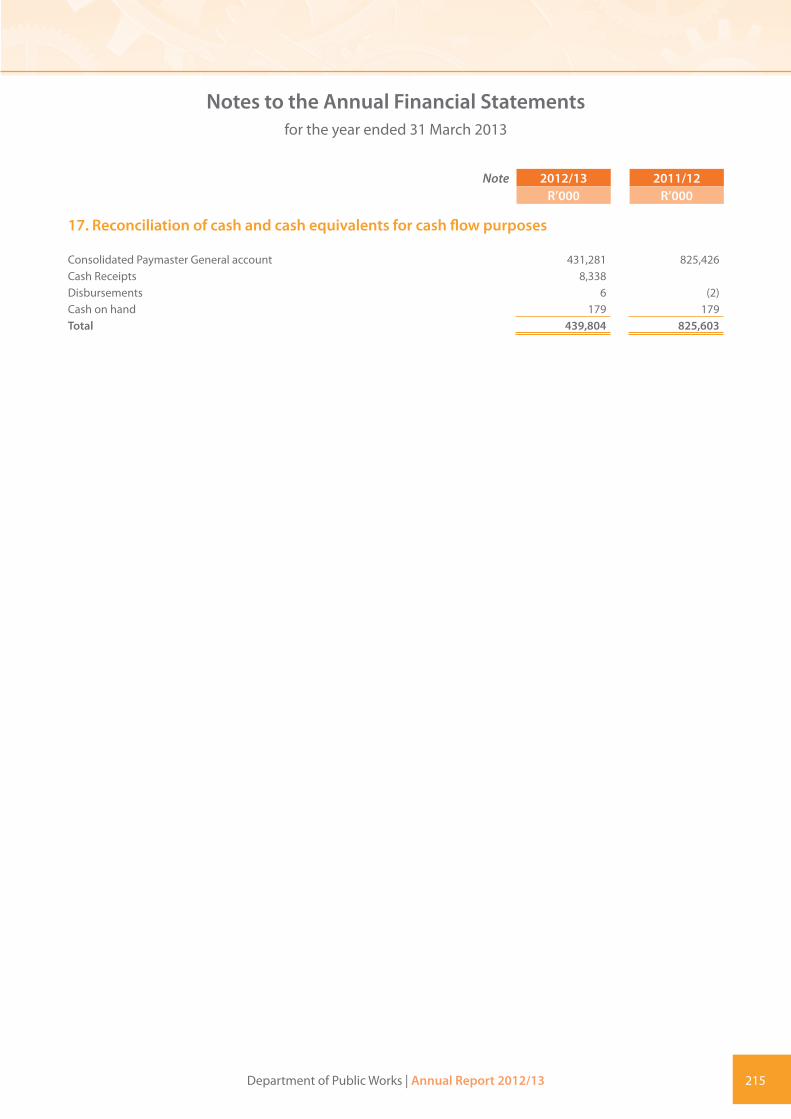
Note 2012/13 2011/12R’000 R’000
Department of Public Works | Annual Report 2012/13 215
Notes to the Annual Financial Statementsfor the year ended 31 March 2013
17. Reconciliation of cash and cash equivalents for cash flow purposes
Consolidated Paymaster General account 431,281 825,426Cash Receipts 8,338Disbursements 6 (2)Cash on hand 179 179Total 439,804 825,603

216 Department of Public Works | Annual Report 2012/13
Disclosure Notes to the Annual Financial Statementsfor the year ended 31 March 2013
Note 2012/13 2011/12R’000 R’000
These amounts are not recognised in the Annual Financial Statements and are disclosed to enhance the usefulness of the Annual Financial Statements.
18. Contingent liabilities and contingent assets
18.1 Contingent liabilities
Liable to NatureMotor vehicle guarantees Employees Annex 2A - 582Housing loan guarantees Employees Annex 2A 521 2,154Other guarantees Annex 2A 1,766 2,355Claims against the Department Annex 2B 12,634 11,908Other departments (inter-departmental unconfirmed balances) Annex 4 6,531 38,700Total 21,452 55,699
Comparative figureThe prior year balance has been restated resulting in an increase of R293k. There is a reduction of R20k relating to a restatement of claims against the Department and an increase of R313k as a result of a foreign exchange revaluation of a foreign currency denominated guarantee issued by the Department.
18.2 Contingent assets
Nature of contingent assetNone - -Total - -
Comparative figureThe prior year balance has been restated to zero resulting in a decrease of R91k. An amount of R66k is restated due to the fact that the amount was previously recognised as a receivable.An amount of R25k was derecognised as a contingent asset as it was written off in 2011.
19. Commitments
Current expenditureApproved and contracted 237,050 87,377Approved but not yet contracted 2,855 41
239,905 87,418Capital expenditureApproved and contracted 1,196,431 1,849,352Approved but not yet contracted 4,695 5
1,201,126 1,849,357Total Commitments 1,441,031 1,936,775
Included in the amount of commitments are projects running under PMTE on behalf of the Department. Most of these projects are multi-year projects.
Comparative figureThe Department has restated the CPAP amount included as part of capital expenditure. As a result, the commitment balance was reduced with R97, 4million.

Department of Public Works | Annual Report 2012/13 217
Disclosure Notes to the Annual Financial Statementsfor the year ended 31 March 2013
Note 2012/13 2011/12R’000 R’000
20. Accruals
Listed by economic classification30 Days 30+ Days Total Total
Goods and services 64,681 1,590 66,271 160,857Interest and rent on land 714 - 714 -Transfers and subsidies 76 93 169 4Capital assets 49,565 3,314 52,879 111,162Other 36 2 38 49Total 115,072 4,999 120,071 272,072
Listed by programme levelProgramme 1 18,579 232,232Programme 2 84,094 16,411Programme 3 16,291 23,350Programme 4 - 30Programme 5 1,107 49Total 120,071 272,072
Confirmed balances with other departments Annex 4 6,840 2,214Confirmed balances with other government entities Annex 4 82,914 148,945Total 89,754 151,159
21 Employee benefits
Leave entitlement 56,342 48,694Service bonus (Thirteenth cheque) 36,888 35,081Performance awards 18,734 16,859Capped leave commitments 69,910 69,384Other 4,217 1,140Total 186,091 171,159
Credit balancesExcluded from the R56 million (2011/12: R49 million) leave entitlement are credit balances amounting to R2,6 million in the current financial year (2011/12: R2 million). The leave credits are caused by leave advances taken by employees.
Comparative figureThe comparative figure has changed due to the reclassification of provisions relating to performance awards to employee benefits. This resulted in employee benefits for the 2011/12 financial year being increased with R16,859 million.

218 Department of Public Works | Annual Report 2012/13
Disclosure Notes to the Annual Financial Statementsfor the year ended 31 March 2013
22. Lease commitments
22.1 Operating leases expenditure
2012/13
Specialised military
equipment Land
Buildings and other
fixed structures
Machinery and
equipment TotalNot later than 1 year - - 43,427 - 43,427Later than 1 year and not later than 5 years - - 33,292 - 33,292Later than five years - - 827 - 827Total lease commitments - - 77,546 - 77,546
2011/12
Specialised military
equipment Land
Buildings and other
fixed structures
Machinery and
equipment TotalNot later than 1 year - - 119,408 - 119,408Later than 1 year and not later than 5 years - - 76,148 - 76,148Later than five years - - 1,398 - 1,398Total lease commitments - - 196,954 - 196,954
Comparative figureThe Department has restated operating lease commitments which were incorrectly disclosed. The restatement in-cludes leases that the Department is funding on behalf of other government departments and certain Chapter 9 in-stitutions as well as leases that were not verified as at 31 March 2012. This resulted in the comparative figure being decreased with R141,761 million.
22.2 Finance leases expenditure**
2012/13
Specialised military
equipment Land
Buildings and other
fixed structures
Machinery and
equipment TotalNot later than 1 year - - - 8,925 8,925Later than 1 year and not later than 5 years - - - 5,700 5,700Later than five years - - - - -Total lease commitments - - - 14,625 14,625

Department of Public Works | Annual Report 2012/13 219
Disclosure Notes to the Annual Financial Statementsfor the year ended 31 March 2013
2011/12
Specialised military
equipment Land
Buildings and other
fixed structures
Machinery and
equipment TotalNot later than 1 year - - - 6,497 6,497Later than 1 year and not later than 5 years - - - 1,778 1,778Total lease commitments - - - 8,275 8,275LESS: finance costs - - - 447 447Total present value of lease liabilities - - - 7,828 7,828
**This note excludes leases relating to public-private partnership as they are separately disclosed in note number 28.
22.3 Operating lease revenue
2012/13
Specialised military
equipment Land
Buildings and other
fixed structures
Machinery and
equipment TotalNot later than 1 year - - 16,849 - 16,849Later than 1 year and not later than 5 years - - 35,662 - 35,662Later than five years - - 23,125 - 23,125Total operating lease revenue receivable - - 75,636 - 75,636
2011/12
Specialised military
equipment Land
Buildings and other
fixed structures
Machinery and
equipment
TotalNot later than 1 year - - 25,135 - 25,135Later than 1 year and not later than 5 years - - 42,193 - 42,193Later than five years - - 31,875 - 31,875Total operating lease revenue receivable - - 99,202 - 99,202
Comparative figureThe Department has restated operating lease revenue commitments which were incorrectly disclosed. The restate-ment includes leases which were not verified as at 31 March 2012. This resulted in the comparative figure being in-creased with R15, 3million.
23. Receivables for departmental revenue
Interest, dividends and rent on land 2,373 3,687Sales of goods and services other than capital assets 15,228 14,958Total 17,601 18,645
Comparative figureThe Department has restated receivables for departmental revenue which were incorrectly disclosed. This resulted in the comparative figure being increased with R1, 922 million.

220 Department of Public Works | Annual Report 2012/13
Disclosure Notes to the Annual Financial Statementsfor the year ended 31 March 2013
Note 2012/13 2011/12R’000 R’000
2012/13 2011/12R’000 R’000
23.1 Analysis of receivables for departmental revenue
Opening balance 17,507 12,586Less: amounts received 31,453 29,519Add: amounts recognised 31,547 35,640Less: amounts written-off/reversed as irrecoverable - 62Closing balance 17,601 18,645
24. Irregular expenditure
24.1 Reconciliation of irregular expenditure
Opening balance 171,643 26,266Add: Irregular expenditure – relating to prior year 442,792 56,225Add: Irregular expenditure – relating to current year 431,722 111,932Less: Amounts condoned (947) (22,780)Irregular expenditure awaiting condonation 1,045,210 171,643
Analysis of awaiting condonation per age classificationCurrent year 431,129 107,610Prior years 614,081 64,033Total 1,045,210 171,643
An amount of R10,133 million was removed from the prior year balance after revision of the balance based on updated National Treasury irregular expenditure guidance.
The Department revisited its entire population of payments processed and bids awarded from financial year 2009/10 to 2012/13 in order to identify all irregular expenditure. This was one of the matters that the Department was disclaimed on in the previous two financial years. An amount of R443 million relates to expenditure incurred in previous financial years and was discovered in the current financial year, during the exercise of revisiting the entire population.
An amount of R432 million relates to expenditure incurred and discovered in the current financial year.
24.2 Details of irregular expenditure – current year
Incident Disciplinary steps taken/criminal proceedings
2012/13R’000
Appropriate approval not obtained by a delegated official or committee
The irregular expenditure is being investigated by the Department for condonement and to determine officials liable.
Currently, no disciplinary steps or criminal proceedings have been initiated.
153,061
Deviations incorrectly approved 8,214Incorrect procurement process followed 230,045Payments in excess of quoted amount 31Evaluation criteria used to evaluate quotations or bids do not match original criteria 10,065
Incorrect evaluation performed in the procurement process 7,770No original valid tax clearance certificate 3,303No original/certified copy BEE certificate and preference points were incorrectly allocated 536
Overtime not approved 112Award of contract to a supplier who does not meet the relevant requirements (cidb and SITA) 8,575
Transfer payment not approved by Treasury 9,903Payment not approved by delegated authority 107Total 431,722

Department of Public Works | Annual Report 2012/13 221
Disclosure Notes to the Annual Financial Statementsfor the year ended 31 March 2013
Note 2012/13 2011/12R’000 R’000
2012/13 2011/12R’000 R’000
24.3 Details of irregular expenditure condoned
Incident Condoned by (condoning authority) 2012/13R’000
Incorrect procurement process followed CFO 947Total 947
24.4 Details of irregular expenditures under investigation
Incident 2012/13R’000
All irregular expenditure incurred has been referred for investigation 1,045,210Total 1,045,210
25. Fruitless and wasteful expenditure
25.1 Reconciliation of fruitless and wasteful expenditure
Opening balance 69,269 -Fruitless and wasteful expenditure – relating to prior year 50,505 69,172Fruitless and wasteful expenditure – relating to current year 4,313 97Fruitless and wasteful expenditure awaiting resolution 124,087 69,269
Analysis of awaiting resolution per economic classificationCurrent 9,580 372Capital 114,507 68,897
Total 124,087 69,269
Included in 2011/12 fruitless expenditure is an amount R68 million in respect of settlement of cancellation of the contract and subsequent payments made after cancellation of contract on the Skilpadhek Boarder Post project.
Included in 2012/13 fruitless and wasteful expenditure is an amount of R45 million for a system procured in financial 2005/06 which the Department has not fully utilised. Furthermore, the Department spent a further R3,5 million on the system for license and training of staff and the amount has also been declared fruitless and wasteful expenditure.
Transactions totalling R5,3 million were investigated and concluded by the Special Investigating Unit (SIU) in the year under review. Disciplinary actions have been recommended against officials of the Department.

222 Department of Public Works | Annual Report 2012/13
Disclosure Notes to the Annual Financial Statementsfor the year ended 31 March 2013
Note 2012/13 2011/12R’000 R’000
2012/13 2011/12R’000 R’000
25.2 Analysis of fruitless and wasteful expenditure – current year
IncidentDisciplinary steps taken/criminal proceedings
2012/13R’000
Additional charges incurred by DPW to print the annual report in portrait instead of landscape
The fruitless and wasteful expenditure is being investigated by the Department for condonement and to determine officials liable. Currently, no disciplinary steps or criminal proceedings have been initiated.
89
Catering for people who did not attend 174Implementation of SAAS IT system 3,594Interest paid 65Goods/services were not rendered according to the contract agreement
121
The validity period of the quotes expired and the quotes became higher
20
Training not attended 87Travel costs incurred for people who did not travel 1VAT was charged by suppliers who are not registered VAT vendors
32
Purchases not in line with Ministerial handbook 36Purchases on lost petrol card 94Total 4,313
26. Related party transactions
Revenue received
Sales of goods and services other than capital assets 42 -Total 42 -
Payments made
Goods and services 119,364 280,716Interest and rent on land 2 1Purchases of capital assets 109 126,879Transfers - -Total 119,475 407,596
Year-end balances arising from revenue/paymentsReceivables from related parties - 37,820Payables to related parties 13,210 1,749Total 13,210 39,569
OtherCommitments 25,305 154,455Total 25,305 154,455

Department of Public Works | Annual Report 2012/13 223
Disclosure Notes to the Annual Financial Statementsfor the year ended 31 March 2013
Related parties to the Department
The following entities/departments have been identified as related parties of the Department:
a) Independent Development Trust (IDT)
Government Development Agency to implement projects commissioned by government.
b) Parliamentary Village Management Board
To provide transport from and to the parliamentary villages for residents (Parliamentarians and sessional officials) who are in Cape Town.
c) Agrément South Africa (ASA)
Promote and support the process of integrated socio-economic development in SA.
d) Council for the Built Environment (CBE)
Oversee built environment professional councils.
e) Construction Industry Development Board (cidb)
Provide strategic direction for sustainable growth, reform and improvements of the construction sector and its role in the economy.
f ) Property Management Trading Entity (PMTE)
To manage devolved accommodation-related costs and user charge.
g) All National Departments and their entities.
Related parties transactions
1. Independent Development trust
The management fee (identified as a non-arm’s length transaction) and the contract cost is disclosed above. The management fee structure varies per project depending on the duration, complexity and labour required and is embedded in the contract cost of the projects undertaken by the IDT for the Department.
2. In kind goods and services provided/received
2.1 Property Management Trading Entity (PMTE)
The Property Management Trading Entity *(PMTE) operates within the administration of the Department of Public Works (DPW) and as such all contracts are entered into in the name of the DPW. The liabilities and obligations arising from these transactions are accounted for by the PMTE if it relates to the PMTE operating activities as these liabilities will be settled using the PMTE funds and resources.
Direct cost
Direct cost consists of overhead costs for the day-to-day running of PMTE. These costs can be measured reliably and are disclosed above. Direct cost compensation of employees is not a standard line item disclosure under ‘payments made’, this amounts to R17,9 million for the 2012/13 financial year and R12,9 million for the 2011/12 financial year.
Indirect cost
Indirect costs include the sharing of corporate services between the Department and PMTE. The nature of the transactions resulted in difficulties in reliably determining the value of the indirect costs paid on behalf of the PMTE, due to the operational structure and functions between the Department and the PMTE.
• Supply chain management

224 Department of Public Works | Annual Report 2012/13
Disclosure Notes to the Annual Financial Statementsfor the year ended 31 March 2013
• Internal audit
• Human Resources (HRM, HROD)
• Gender, people with disabilities, youth and children
• Marketing and communication
• Information system services
• Legal services
• Security management
• Monitoring and evaluation
• Strategic management unit
• Labour relations
• Senior management (Minister, COO, CFO, DDG and DG)
Maintenance cost and rates and taxes
The PMTE pays maintenance costs (planned and unplanned) and rates and taxes on State-owned buildings and private leases occupied by the Department. The total maintenance and rates and taxes costs amounted to R4, 025 billion for the 2012/13 financial year and R3, 885 billion for the 2011/12 financial year. This is broken down as follows:
• Rates and taxes (payments) – R788,6 million
• Rates and taxes (accruals) – R6,1 million
• Cleaning, gardening and security(payments) –R76,8 million
• Cleaning, gardening and security(accruals) – R6,7 million
• Property maintenance(accruals) – R140,3 million
• Day-to-day maintenance – planned and unplanned maintenance(payments) – R 3,007 billion
2.2 Private leases
The Department leases private buildings to other departments for free. This is based on the devolution of funds from National Treasury. The total payments amounted to R76,1 million for the 2012/13 financial year.
2.3 Free accommodation
The Department provides free accommodation and maintenance to the National Museum.
2.4 Department of Defence – capital works paid
The Department paid for capital works to the Department of Defense on certain property. This is a once off ‘service-in-kind’ for the 2012/13 financial year and amounts to R16, 2 million.
3. Comparative figure
The prior year balances were restated to reflect transactions that were not at arm’s length and could not be reliably measured. A significant decrease was noted in the restatement of figures (97% - 100%). This was due to the following:
• Disclosing only non-arm’s length transactions
• Qualitative disclosure of the indirect costs
• Interim approved PMTE structure to reflect only Finance.

Department of Public Works | Annual Report 2012/13 225
Disclosure Notes to the Annual Financial Statementsfor the year ended 31 March 2013
27. Key management personnel
No. of Individuals 2012/13 2011/12
R’000 R’000Political office bearers 2 3,328 3,027Officials: - -
Level 15 to 16 24 19,105 12,118Level 14 (incl. CFO if at a lower level) 54 42,384 37,841
Family members of key management personnel 1 504 683Total 65,321 53,669
The Political Office Bearers are the Minister of the Department of Public Works and the Deputy Minister of the Department of Public Works.
Two members have been seconded to the Department free of charge, hence their cost is not reflected above.
28. Public Private Partnership
Contract fee paid 42,997 37,349Fixed component 6,102 10,279Indexed component 36,895 27,070
Analysis of indexed component 36,895 27,070Goods and services (excluding lease payments) 21,806 25,999Operating leases 14,412 679Suspense 677 392
Capital/ (Liabilities) 6,102 10,279Tangible rights 6,102 10,279
Other 23,588 7,621Other obligations 23,588 7,621
Any guarantees issued by the Department are disclosed in Note 18.
Included in other obligations amounting to R23, 6 million are finance lease commitments of R1, 4 million, operating lease commitments of R17, 5 million and accruals amounting to R4, 8 million.
29. Impairment
ImpairmentDebtors 15,780 10,500Other 41,699 99,367Total 57,479 109,867
30. Provisions
Performance bonus - -Total - -

226 Department of Public Works | Annual Report 2012/13
Disclosure Notes to the Annual Financial Statementsfor the year ended 31 March 2013
Comparative figure
Comparative figure has changed due to the reclassification of provisions relating to performance awards stated under employee benefits. This resulted in provisions for the 2011/12 financial year being reduced by R16, 859 million (refer to note 21).
31. Non-adjusting events after reporting date
There were no non-adjusting events identified for the current year under review.Total - -
32. Movable Tangible Capital Assets
MOVEMENT IN MOVABLE TANGIBLE CAPITAL ASSETS PER ASSET REGISTER FOR THE YEAR ENDED 31 MARCH 2013
Opening balance
Curr Year Adjustments to prior year
balances
Additions Disposals Closing Balance
R’000 R’000 R’000 R’000 R’000
HERITAGE ASSETS 56,210 36,845 4,387 1,579 95,863Heritage assets 56,210 36,845 4,387 1,579 95,863
MACHINERY AND EQUIPMENT 305,167 33,891 29,138 11,584 356,612Transport assets 3,563 - 50 1,026 2,587Computer equipment 70,435 (578) 9,096 3,524 75,429Furniture and office equipment 197,863 19,114 12,121 6,487 222,611Other machinery and equipment 33,306 15,355 7,871 547 55,985
TOTAL MOVABLE TANGIBLE CAPITAL ASSETS 361,377 70,736 33,525 13,163 452,475

Department of Public Works | Annual Report 2012/13 227
Disclosure Notes to the Annual Financial Statementsfor the year ended 31 March 2013
32.1 Additions
ADDITIONS TO MOVABLE TANGIBLE CAPITAL ASSETS PER ASSET REGISTER FOR THE YEAR ENDED 31 MARCH 2013
Cash Non-cash
(Capital Work in Progress
current costs and
finance lease payments)
Received current, not
paid(Paid current year, received
prior year)
Total
R’000 R’000 R’000 R’000 R’000
HERITAGE ASSETS - 4,387 - - 4,387Heritage assets - 4,387 - - 4,387
MACHINERY AND EQUIPMENT 43,199 9,510 (23,717) 146 29,138Transport assets 0 50 - - 50Computer equipment 7,071 2,770 - (745) 9,096Furniture and office equipment 5,444 6,255 - 422 12,121Other machinery and equipment 30,684 435 (23,717) 469 7,871
BIOLOGICAL ASSETS - - - - -Biological assets - - - - -
TOTAL ADDITIONS TO MOVABLE TANGIBLE CAPITAL ASSETS 43,199 13,897 (23,717) 146 33,525
32.2 Disposals
DISPOSALS OF MOVABLE TANGIBLE CAPITAL ASSETS PER ASSET REGISTER FOR THE YEAR ENDED 31 MARCH 2013Sold for cash Transfer out
or destroyed or scrapped
Total disposals Cash Received Actual
R’000 R’000 R’000 R’000
HERITAGE ASSETS - 1,579 1,579 -Heritage assets - 1,579 1,579 -
MACHINERY AND EQUIPMENT - 11,584 11,584 -Transport assets - 1,026 1,026 -Computer equipment - 3,524 3,524 -Furniture and office equipment - 6,487 6,487 -Other machinery and equipment - 547 547 -
TOTAL DISPOSAL OF MOVABLE TANGIBLE CAPITAL ASSETS - 13,163 13,163 -

228 Department of Public Works | Annual Report 2012/13
Disclosure Notes to the Annual Financial Statementsfor the year ended 31 March 2013
32.3 Movement for 2011/12
MOVEMENT IN MOVABLE TANGIBLE CAPITAL ASSETS PER ASSET REGISTER FOR THE YEAR ENDED 31 MARCH 2012Opening balance Additions Disposals Closing
balanceR’000 R’000 R’000 R’000
HERITAGE ASSETS 56,267 - 57 56,210Heritage assets 56,267 - 57 56,210
MACHINERY AND EQUIPMENT 267,036 74,894 36,763 305,167Transport assets 3,544 19 - 3,563Computer equipment 53,020 43,661 26,246 70,435Furniture and office equipment 179,751 26,783 8,671 197,863Other machinery and equipment 30,721 4,431 1,846 33,306
TOTAL MOVABLE TANGIBLE CAPITAL ASSETS 323,303 74,894 36,820 361,377
32.4 Minor assets
MOVEMENT IN MINOR ASSETS PER THE ASSET REGISTER FOR THE YEAR ENDED AS AT 31 MARCH 2013Specialised
military assets
Intangible assets
Heritage assets
Machinery and
equipment
Biological assets Total
R’000 R’000 R’000 R’000 R’000 R’000
Opening balance - 81 1,175 162,321 - 163,577Current year adjustments to prior year balances - (73) 2,513 (4,591) - (2,151)
Additions - - 239 4,101 - 4,340Disposals - - 152 17,200 - 17,352TOTAL MINOR ASSETS - 8 3,775 144,631 - 148,414
Specialised military assets
Intangible assets
Heritage assets
Machinery and
equipment
Biological assets Total
Number of R1 minor assets - 1 112 10,661 - 10,774Number of minor assets at cost - 12 3,291 88,695 - 91,998
TOTAL NUMBER OF MINOR ASSETS - 13 3,403 99,356 - 102,772

Department of Public Works | Annual Report 2012/13 229
Disclosure Notes to the Annual Financial Statementsfor the year ended 31 March 2013
Note 2012/13 2011/12R’000 R’000
MOVEMENT IN MINOR ASSETS AS PER ASSET REGISTER FOR THE YEAR ENDED AS AT 31 MARCH 2012Specialised
military assetsIntangible
assetsHeritage
assetsMachinery
and equipment
Biological assets
Total
R’000 R’000 R’000 R’000 R’000 R’000
Opening balance - 76 1,191 159,775 - 161,042Additions - 5 - 11,704 - 11,709Disposals - - 16 9,158 - 9,174TOTAL MINOR ASSETS - 81 1,175 162,321 - 163,577
Specialised military assets
Intangible assets
Heritage assets
Machinery and
equipment
Biological assets Total
Number of R1 minor assets - 3 86 7,211 - 7,300Number of minor assets at cost - 12 1,018 317,446 - 318,476
TOTAL NUMBER OF MINOR ASSETS - 15 1,104 324,657 - 325,776
33. Intangible Capital Assets
MOVEMENT IN INTANGIBLE CAPITAL ASSETS AS PER ASSET REGISTER FOR THE YEAR ENDED 31 MARCH 2013
Opening balance
Current Year Adjust-
ments to prior year balances
Additions Disposals Closing Balance
R’000 R’000 R’000 R’000 R’000
Computer software 50,852 (174) 420 14 51,084Patents, licences, copyright, brand names, trademarks
- 25 - - 25
Services and operating rights 512 - - - 512TOTAL INTANGIBLE CAPITAL ASSETS 51,364 (149) 420 14 51,621
33.1 Additions
ADDITIONS TO INTANGIBLE CAPITAL ASSETS AS PER ASSET REGISTER FOR THE YEAR ENDED 31 MARCH 2013
Cash Non-Cash
(Develop-ment work in progress
– current costs)
Received current year,
not paid(Paid
current year, received
prior year)
Total
R’000 R’000 R’000 R’000 R’000
Computer software 501 - - (81) 420TOTAL ADDITIONS TO INTANGIBLE CAPITAL ASSETS 501 - - (81) 420

230 Department of Public Works | Annual Report 2012/13
Disclosure Notes to the Annual Financial Statementsfor the year ended 31 March 2013
33.2 Disposals
DISPOSALS OF INTANGIBLE CAPITAL ASSETS AS PER ASSET REGISTER FOR THE YEAR ENDED 31 MARCH 2013
Sold for cashTransfer out or
destroyed or scrapped
Total disposals Cash Received Actual
R’000 R’000 R’000 R’000
Computer software - 14 14 -TOTAL DISPOSALS OF INTANGIBLE CAPITAL ASSETS - 14 14 -
33.3 Movement for 2011/12
MOVEMENT IN INTANGIBLE CAPITAL ASSETS AS PER ASSET REGISTER FOR THE YEAR ENDED 31 MARCH 2012Opening balance Additions Disposals Closing
balanceR’000 R’000 R’000 R’000
Computer software 44,214 6,659 21 50,852Services and operating rights 500 12 - 512TOTAL INTANGIBLE CAPITAL ASSETS 44,714 6,671 21 51,364
34. Immovable Tangible Capital Assets
MOVEMENT IN IMMOVABLE TANGIBLE CAPITAL ASSETSAS PER ASSET REGISTER FOR THE YEAR ENDED 31 MARCH 2013
Opening balance
Curr Year Adjustments to prior year
balances
Additions Disposals Closing Balance
R’000 R’000 R’000 R’000 R’000
BUILDINGS AND OTHER FIXED STRUCTURES 4,057,611 (587,345) 49,168 - 3,519,434Dwellings 502,909 (147,490) - - 355,419Non-residential buildings 3,554,141 (439,294) 49,168 - 3,164,015Other fixed structures 561 (561) - - -
HERITAGE ASSETS 4,547 (4,547) - - -Heritage assets 4,547 (4,547) - - -
LAND AND SUBSOIL ASSETS 51,486 (2,498) - - 48,988Land 51,486 (2,498) - - 48,988
TOTAL IMMOVABLE TANGIBLE CAPITAL AS-SETS 4,113,644 (594,390) 49,168 - 3,568,422
The amount of R3,67 billion includes acquired properties and construction projects completed from 2002 to date, however, the amount excludes expenditure related to renovation and refurbishment of properties.

Department of Public Works | Annual Report 2012/13 231
Disclosure Notes to the Annual Financial Statementsfor the year ended 31 March 2013
34.1 Additions
ADDITIONS TO IMMOVABLE TANGIBLE CAPITAL ASSETS AS PER ASSET REGISTER FOR THE YEAR ENDED 31 MARCH 2013
Cash Non-cash
(Capital Work in
Progress current
costs and finance lease
payments)
Received current, not
paid(Paid
current year, received
prior year)
Total
R’000 R’000 R’000 R’000 R’000
BUILDING AND OTHER FIXED STRUCTURES 713,003 - (663,835) - 49,168
Non-residential buildings 713,003 - (663,835) - 49,168
TOTAL ADDITIONS TO IMMOVABLE TANGIBLE CAPITAL ASSETS 713,003 - (663,835) - 49,168
Included in the amount of R713 million, is R664 million relating to renovations and refurbishment of existing buildings.
34.2 Disposals
DISPOSALS OF IMMOVABLE TANGIBLE CAPITAL ASSETS AS PER ASSET REGISTER FOR THE YEAR ENDED 31 MARCH 2013
Sold for cashTransfer out or
destroyed or scrapped
Total disposals Cash Received Actual
R’000 R’000 R’000 R’000
BUILDINGS AND OTHER FIXED STRUCTURES - - - -Non-residential buildings - - - -
TOTAL DISPOSALS OF IMMOVABLE TANGIBLE CAPITAL ASSETS - - - -

232 Department of Public Works | Annual Report 2012/13
Disclosure Notes to the Annual Financial Statementsfor the year ended 31 March 2013
34.3 Movement for 2011/12
MOVEMENT IN IMMOVABLE TANGIBLE CAPITAL ASSETS AS PER ASSET REGISTER FOR THE YEAR ENDED 31 MARCH 2012
Opening balance Additions Disposals Closing
balanceR’000 R’000 R’000 R’000
BUILDINGS AND OTHER FIXED STRUCTURES 3,439,962 617,649 - 4,057,611Dwellings 502,909 - - 502,909Non-residential buildings 2,936,492 617,649 - 3,554,141Other fixed structures 561 - - 561
HERITAGE ASSETS 4,547 - - 4,547Heritage assets 4,547 - - 4,547
LAND AND SUBSOIL ASSETS 54,238 402 3,154 51,486Land 54,238 402 3,154 51,486
TOTAL IMMOVABLE TANGIBLE ASSETS 3,498,747 618,051 3,154 4,113,644
34.4 Immovable assets valued at R1
IMMOVABLE ASSETS VALUED AT R1 IN THE ASSET REGISTER AS AT 31 MARCH 2013Buildings and
other fixed structures
Heritage assets
Land and subsoil assets Total
R R R R
DPW R1 immovable assets 73,463 124 34, 731 108,318Unregistered land deemed National - 3,127 3,127Deemed Provincial unvested - 13,703 13,703Deemed Provincial surveyed not registered - 4,125 4,125TOTAL 73,463 124 55,686 129,273

Department of Public Works | Annual Report 2012/13 233
Disclosure Notes to the Annual Financial Statementsfor the year ended 31 March 2013
STATE DOMESTIC FACILITIES AS AT 31 MARCH 2013
The State Domestic Facilities on unregistered land or under permission to occupy agreements, amount to 18 687 as at 31 March 2013.The National state functions of these facilities include;BORDER POST 364 COMMUNICATION STRUCTURE 43 HARBOUR 380 LABORATORY 19 MAGISTRATES OFFICE 938 MILITARY BASE 6,090 MONUMENT 4 MORTUARY 30 MUSEUM 58 OFFICE BUILDING 2,121 POLICE STATION 6,098 PRESTIGE 50 PRISON 1,766 PURIFICATION WORKS 78 RESEARCH 37 RESERVOIR 28 SUPREME COURT 10 TRAINING FACILITY 96 WATER WORKS 274 WORKSHOP 203 Grand Total 18,687
IMMOVABLE ASSETS VALUED AT R1 IN THE ASSET REGISTER AS AT 31 MARCH 2012Buildings and
other fixed structures
Heritage assets
Land and subsoil assets Total
R R R R
R1 Immovable assets 73,397 - 35,640 109,037TOTAL 73,397 - 35,640 109,037
During 2012/13 the immovable asset register was completed for registered land and substantially completed for unregistered land. These confirmed land parcels are disclosed at R1 each.

234 Department of Public Works | Annual Report 2012/13
Disclosure Notes to the Annual Financial Statementsfor the year ended 31 March 2013
35. S
TATE
MEN
T O
F CO
ND
ITIO
NA
L G
RAN
TS P
AID
TO
TH
E PR
OVI
NCE
S
NA
ME
OF
PRO
VIN
CE /
GRA
NT
GRA
NT
ALL
OCA
TIO
NTR
AN
SFER
SPEN
T20
11/1
2
Div
isio
n of
Re
venu
e A
ct
Roll
Ove
rsA
djus
t-m
ents
Tota
l Av
aila
ble
Act
ual
Tran
sfer
Fund
s W
ithhe
ld
Re-a
lloca
-tio
ns b
y N
atio
nal
Trea
sury
or
Nat
ion-
al D
epar
t-m
ent
Am
ount
Re
ceiv
ed
by D
epar
t-m
ent
Am
ount
Sp
ent b
y D
epar
t-m
ent
% o
f Av
aila
ble
Fund
s Sp
ent b
y D
epar
t-m
ent
Div
isio
n of
Re
venu
e A
ct
R’00
0R’
000
R’00
0R’
000
R’00
0R’
000
%R’
000
R’00
0%
R’00
0Ea
ster
n Ca
pe28
3,27
9-
-28
3,27
928
3,36
0-
-28
3,36
028
2,26
2-
197,
779
Free
Sta
te27
6,69
8-
-27
6,69
827
6,69
8-
-27
6,70
029
8,75
3-
255,
749
Gau
teng
342,
249
--
342,
249
342,
249
--
342,
249
364,
174
106%
305,
623
Kwaz
ulu-
Nat
al63
2,27
9-
-63
2,27
951
1,79
0-
-51
1,78
851
9,06
010
1%49
3,85
4Li
mpo
po14
2,11
6-
-14
2,11
614
2,11
6-
-14
2,11
610
6,51
775
%62
,386
Mpu
mal
anga
116,
784
--
116,
784
116,
784
--
116,
784
114,
192
98%
87,3
71N
orth
ern
Cape
55,8
99-
-55
,899
55,8
99-
-55
,899
59,4
3410
6%80
,644
Nor
th W
est
218,
193
--
218,
193
218,
193
--
218,
193
140,
947
65%
175,
414
Wes
tern
Cap
e36
1,32
4-
-36
1,32
436
1,32
5-
-36
1,32
440
0,34
511
1%34
4,76
82,
428,
821
--
2,42
8,82
12,
308,
414
--
2,30
8,41
32,
285,
684
2,00
3,58
8
The
Dep
artm
ent c
ertifi
es th
at a
ll tr
ansf
ers
wer
e in
term
s of
the
DO
RA A
ct a
nd d
epos
ited
into
the
prim
ary
bank
acc
ount
of t
he p
rovi
nce
or m
unic
ipal
ity.

Department of Public Works | Annual Report 2012/13 235
Disclosure Notes to the Annual Financial Statementsfor the year ended 31 March 2013
36. S
TATE
MEN
T O
F U
NCO
ND
ITIO
NA
L G
RAN
TS P
AID
TO
TH
E PR
OVI
NCE
S
NA
ME
OF
PRO
VIN
CE /
GRA
NT
GRA
NT
ALL
OCA
TIO
NTR
AN
SFER
SPEN
T20
11/1
2
Am
ount
Roll
Ove
rs
Oth
er
Adj
ust-
men
ts
Tota
l Av
aila
ble
Act
ual
Tran
sfer
% O
f Av
aila
ble
Fund
s Tr
ansf
erre
d
Am
ount
Re
ceiv
ed
by D
epar
t-m
ent
Am
ount
Sp
ent b
y D
epar
tmen
t
% O
f Av
aila
ble
Fund
s Sp
ent b
y D
epar
tmen
t
Div
isio
n O
f Re
venu
e A
ct
R’00
0R’
000
R’00
0R’
000
R’00
0%
R’00
0R’
000
%R’
000
East
ern
Cape
--
--
--
--
-30
,431
Free
Sta
te-
--
--
--
--
10,6
06G
aute
ng-
--
--
--
--
44,2
10Kw
azul
u-N
atal
--
--
--
--
-12
9,83
7Li
mpo
po-
--
--
--
--
9,54
5M
pum
alan
ga-
--
--
--
--
9,48
6N
orth
ern
Cape
--
--
--
--
-4,
809
Nor
th W
est
--
--
--
--
-5,
758
Wes
tern
Cap
e-
--
--
--
--
22,5
87-
--
--
--
--
267,
269

236 Department of Public Works | Annual Report 2012/13
Disclosure Notes to the Annual Financial Statementsfor the year ended 31 March 2013
Disclosure Notes to the Annual Financial Statementsfor the year ended 31 March 2013
37. S
TATE
MEN
T O
F CO
ND
ITIO
NA
L G
RAN
TS P
AID
TO
MU
NIC
IPA
LITI
ES
NA
ME
OF
MU
NIC
IPA
LITY
GRA
NT
ALL
OCA
TIO
NTR
AN
SFER
Div
isio
n of
Re
venu
e A
ctRo
ll O
vers
Adj
ustm
ents
Tota
l Ava
ilabl
eA
ctua
l Tra
nsfe
rFu
nds W
ithhe
ld
Re-a
lloca
tions
by
Nat
iona
l Tr
easu
ry
or N
atio
nal
Dep
artm
ent
R’00
0R’
000
R’00
0R’
000
R’00
0R’
000
%!K
ai! G
arib
1,
000
--
1,00
01,
000
--
!Khe
is
1,00
0-
-1,
000
1,00
0-
-//
Khar
a H
ais
1,00
0-
-1,
000
1,00
0-
-A
baqu
lusi
1,
000
--
1,00
01,
000
--
Agan
ang
1,06
6-
-1,
066
1,06
6-
-A
lber
t Lut
huli
1,38
6-
-1,
386
1,38
6-
-A
lfred
Nzo
Dis
tric
t M
unic
ipal
ity
9,60
4-
-9,
604
9,60
4 -
-
Am
ahla
thi
1,00
0-
-1,
000
1,00
0-
-A
maj
uba
Dis
tric
t M
unic
ipal
ity
1,00
0-
-1,
000
1,00
0-
-
Am
atol
e D
istr
ict
Mun
icip
ality
6,
022
--
6,02
2 6,
022
--
Ba-P
hala
borw
a 1,
000
--
1,00
01,
000
--
Bavi
aans
1,
471
1,28
6 -
2,75
7 2,
757
--
Beau
fort
Wes
t 1,
000
--
1,00
01,
000
--
Bela
Bel
a 1,
000
--
1,00
01,
000
--
Berg
rivie
r 89
6-
-89
689
6-
-Bi
tou
1,00
0-
-1,
000
1,00
0-
-Bl
oube
rg
1,00
0-
-1,
000
1,00
0-
-Bl
ue C
rane
Rou
te
1,00
0-
-1,
000
1,00
0-
-Bo
jana
la P
latin
um D
istr
ict
Mun
icip
ality
1,41
2-
-1,
412
1,41
2-
-
Bree
de V
alle
y 1,
000
--
1,00
01,
000
--
Buffa
lo C
ity
1,48
4-
-1,
484
1,48
4-
-Bu
shbu
ckrid
ge
3,38
0-
-3,
380
3,38
0-
-Ca
cadu
Dis
tric
t M
unic
ipal
ity
1,00
0-
-1,
000
1,00
0-
-
Cam
debo
o 1,
000
--
1,00
01,
000
--
Cape
Agu
lhas
1,
000
--
1,00
01,
000
--

Department of Public Works | Annual Report 2012/13 237
Disclosure Notes to the Annual Financial Statementsfor the year ended 31 March 2013
NA
ME
OF
MU
NIC
IPA
LITY
GRA
NT
ALL
OCA
TIO
NTR
AN
SFER
Div
isio
n of
Re
venu
e A
ctRo
ll O
vers
Adj
ustm
ents
Tota
l Ava
ilabl
eA
ctua
l Tra
nsfe
rFu
nds W
ithhe
ld
Re-a
lloca
tions
by
Nat
iona
l Tr
easu
ry
or N
atio
nal
Dep
artm
ent
R’00
0R’
000
R’00
0R’
000
R’00
0R’
000
%Ca
pe W
inel
ands
Dis
tric
t M
unic
ipal
ity1,
214
--
1,21
41,
214
--
Capr
icor
n D
istr
ict
Mun
icip
ality
2,
924
--
2,92
42,
924
--
Cede
rber
g 1,
000
-16
21,
162
1,16
2-
-Ce
ntra
l Kar
oo D
istr
ict
Mun
icip
ality
1,00
0-
-1,
000
1,00
0-
-
Chris
Han
i Dis
tric
t M
unic
ipal
ity
9,83
5-
-9,
835
9,83
5 -
-
City
Of C
ape
Tow
n20
,205
9,27
9-
29,4
8429
,484
--
City
Of J
ohan
nesb
urg
140,
615
--
140,
615
140,
615
--
City
Of M
atlo
sana
1,
840
--
1,84
01,
840
--
City
Of T
shw
ane
10,1
51-
-10
,151
10,1
51-
-D
elm
as
1,13
8-
1,39
42,
532
2,53
2-
-D
ihla
beng
1,00
0-
-1,
000
1,00
0 -
-D
ikga
tlong
1,00
0-
-1,
000
1,00
0-
-D
ipal
esen
g 96
7-
-96
796
7-
-D
itsob
otla
2,
488
--
2,48
82,
488
--
Dr J
S M
orok
a 1,
000
-87
51,
875
1,87
5-
-D
r Ken
neth
Kau
nda
Dis
tric
t Mun
icip
ality
1,00
0-
-1,
000
1,00
0-
-
Dr R
uth
Sego
mot
si
Mom
pati
Dis
tric
t M
unic
ipal
ity
2,35
0-
336
2,68
62,
686
--
Dra
kens
tein
1,
000
--
1,00
01,
000
--
Eden
Dis
tric
t Mun
icip
ality
1,
000
--
1,00
01,
000
--
eDum
be1,
000
--
1,00
01,
000
--
Ehla
nzen
i Dis
tric
t M
unic
ipal
ity
1,00
0-
407
1,40
71,
407
--
Ekur
hule
ni14
,382
--
14,3
8214
,382
--
Elia
s M
otso
aled
i 1,
000
--
1,00
01,
000
--
Elun
dini
1,00
0-
753
1,75
3 1,
753
--
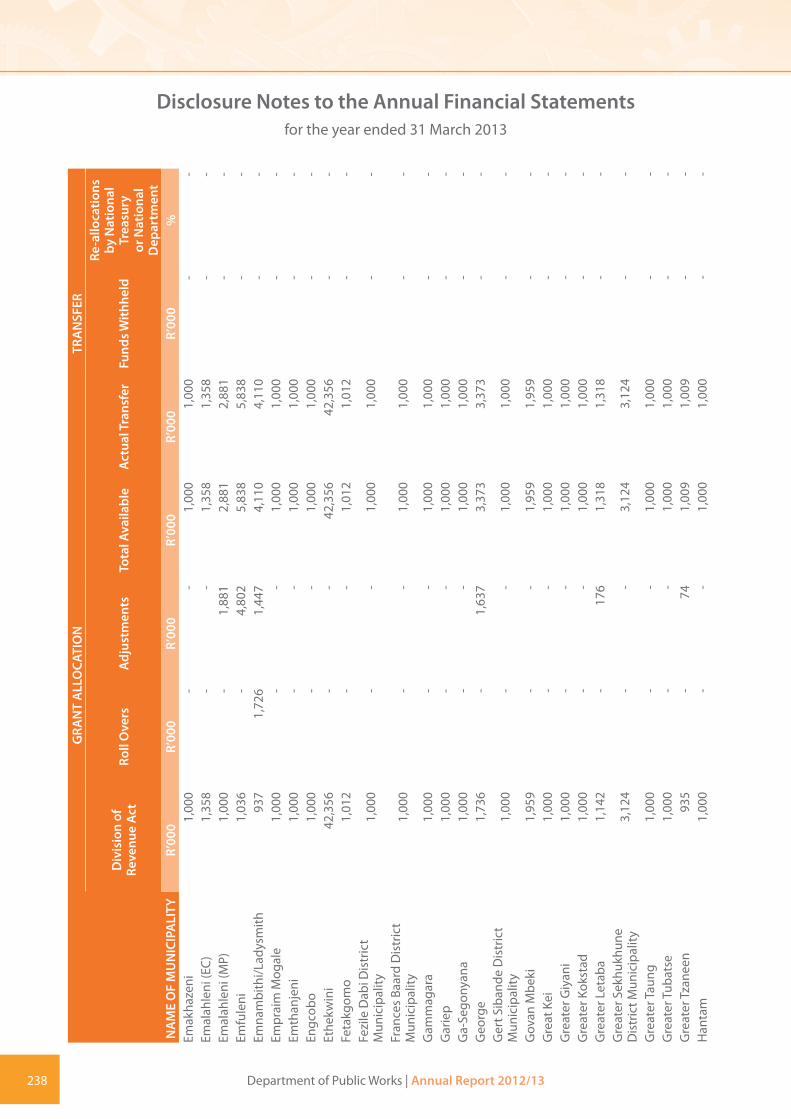
238 Department of Public Works | Annual Report 2012/13
Disclosure Notes to the Annual Financial Statementsfor the year ended 31 March 2013
NA
ME
OF
MU
NIC
IPA
LITY
GRA
NT
ALL
OCA
TIO
NTR
AN
SFER
Div
isio
n of
Re
venu
e A
ctRo
ll O
vers
Adj
ustm
ents
Tota
l Ava
ilabl
eA
ctua
l Tra
nsfe
rFu
nds W
ithhe
ld
Re-a
lloca
tions
by
Nat
iona
l Tr
easu
ry
or N
atio
nal
Dep
artm
ent
R’00
0R’
000
R’00
0R’
000
R’00
0R’
000
%Em
akha
zeni
1,
000
--
1,00
01,
000
--
Emal
ahle
ni (E
C)
1,35
8-
-1,
358
1,35
8 -
-Em
alah
leni
(MP)
1,
000
-1,
881
2,88
12,
881
--
Emfu
leni
1,
036
-4,
802
5,83
85,
838
--
Emna
mbi
thi/L
adys
mith
93
71,
726
1,44
74,
110
4,11
0-
-Em
prai
m M
ogal
e 1,
000
--
1,00
01,
000
--
Emth
anje
ni
1,00
0-
-1,
000
1,00
0-
-En
gcob
o 1,
000
--
1,00
01,
000
--
Ethe
kwin
i 42
,356
--
42,3
5642
,356
--
Feta
kgom
o 1,
012
--
1,01
21,
012
--
Fezi
le D
abi D
istr
ict
Mun
icip
ality
1,
000
--
1,00
01,
000
--
Fran
ces
Baar
d D
istr
ict
Mun
icip
ality
1,
000
--
1,00
01,
000
--
Gam
mag
ara
1,00
0-
-1,
000
1,00
0-
-G
arie
p 1,
000
--
1,00
01,
000
--
Ga-
Sego
nyan
a 1,
000
--
1,00
01,
000
--
Geo
rge
1,73
6-
1,63
73,
373
3,37
3-
-G
ert S
iban
de D
istr
ict
Mun
icip
ality
1,00
0-
-1,
000
1,00
0-
-
Gov
an M
beki
1,
959
--
1,95
91,
959
--
Gre
at K
ei
1,00
0-
-1,
000
1,00
0-
-G
reat
er G
iyan
i 1,
000
--
1,00
01,
000
--
Gre
ater
Kok
stad
1,
000
--
1,00
01,
000
--
Gre
ater
Let
aba
1,14
2-
176
1,31
81,
318
--
Gre
ater
Sek
hukh
une
Dis
tric
t Mun
icip
ality
3,
124
--
3,12
43,
124
--
Gre
ater
Tau
ng
1,00
0-
-1,
000
1,00
0-
-G
reat
er T
ubat
se
1,00
0-
-1,
000
1,00
0-
-G
reat
er T
zane
en
935
-74
1,00
91,
009
--
Han
tam
1,
000
--
1,00
01,
000
--

Department of Public Works | Annual Report 2012/13 239
Disclosure Notes to the Annual Financial Statementsfor the year ended 31 March 2013
NA
ME
OF
MU
NIC
IPA
LITY
GRA
NT
ALL
OCA
TIO
NTR
AN
SFER
Div
isio
n of
Re
venu
e A
ctRo
ll O
vers
Adj
ustm
ents
Tota
l Ava
ilabl
eA
ctua
l Tra
nsfe
rFu
nds W
ithhe
ld
Re-a
lloca
tions
by
Nat
iona
l Tr
easu
ry
or N
atio
nal
Dep
artm
ent
R’00
0R’
000
R’00
0R’
000
R’00
0R’
000
%H
esse
qua
1,00
0-
-1,
000
1,00
0-
-H
ibis
cus
Coas
t 1,
000
--
1,00
01,
000
--
Ikw
ezi
1,00
0-
-1,
000
1,00
0-
-Ile
mbe
Dis
tric
t M
unic
ipal
ity
1,00
0-
168
1,16
81,
168
--
Impe
ndle
1,
000
--
1,00
01,
000
--
Inkw
anca
1,
000
--
1,00
01,
000
--
Ints
ika
Yeth
u 1,
000
--
1,00
01,
000
--
Inxu
ba Y
ethe
mba
1,
000
--
1,00
01,
000
--
Joe
Mor
olon
g 1,
000
--
1,00
01,
000
--
John
Tao
lo G
aets
ewe
Dis
tric
t Mun
icip
ality
1,
000
--
1,00
01,
000
--
Kann
alan
d 1,
000
--
1,00
01,
000
--
Kare
eber
g 1,
000
--
1,00
01,
000
--
Kgat
elop
ele
1,00
0-
-1,
000
1,00
0-
-Kg
etle
ngriv
ier
1,00
0-
-1,
000
1,00
0-
-Ki
ng S
abat
a D
alin
dyeb
o 1,
000
--
1,00
01,
000
--
Knys
na
1,00
0-
-1,
000
1,00
0-
-Ko
pano
ng
1,00
0-
-1,
000
1,00
0-
-Ko
uga
1,22
460
2 54
2 2,
368
2,36
8 -
-Ko
u-Ka
mm
a 1,
000
--
1,00
01,
000
--
Kwa
Sani
1,
000
--
1,00
01,
000
--
Kwad
ukuz
a 1,
000
--
1,00
01,
000
--
Lain
gsbu
rg
1,00
0-
-1,
000
1,00
0-
-La
ngeb
erg
1,00
0-
-1,
000
1,00
0-
-Le
jwel
eput
swa
Dis
tric
t M
unic
ipal
ity1,
000
--
1,00
01,
000
--
Lekw
a 1
757
--
1 75
71
757
--
Lekw
a-Te
eman
e 1,
000
--
1,00
01,
000
--
Lepe
lle-N
kum
pi
1,26
0-
-1,
260
1,26
0-
-Le
phal
ale
1,05
2-
532
1,58
41,
584
--

240 Department of Public Works | Annual Report 2012/13
Disclosure Notes to the Annual Financial Statementsfor the year ended 31 March 2013
NA
ME
OF
MU
NIC
IPA
LITY
GRA
NT
ALL
OCA
TIO
NTR
AN
SFER
Div
isio
n of
Re
venu
e A
ctRo
ll O
vers
Adj
ustm
ents
Tota
l Ava
ilabl
eA
ctua
l Tra
nsfe
rFu
nds W
ithhe
ld
Re-a
lloca
tions
by
Nat
iona
l Tr
easu
ry
or N
atio
nal
Dep
artm
ent
R’00
0R’
000
R’00
0R’
000
R’00
0R’
000
%Le
sedi
1,
000
--
1,00
01,
000
--
Lets
emen
g 1,
000
-74
1,
074
1,07
4-
-Lu
khan
ji 2,
844
--
2,84
4 2,
844
--
Mad
iben
g 1,
411
-76
92,
180
2,18
0-
-M
afike
ng
3,23
22,
572
-5,
804
5,80
4-
-M
afub
e 1,
024
--
1,02
41,
024
--
Mag
aren
g 1,
000
--
1,00
01,
000
--
Mak
ana
1,00
0-
-1,
000
1,00
0-
-M
akha
do
1,92
6-
-1,
926
1,92
6-
-M
akhu
duth
amag
a 96
6-
-96
696
6-
-M
alet
swai
1,
000
--
1,00
01,
000
--
Mal
uti-A
-Pho
fung
8,
062
-5,
044
13,1
0613
,106
--
Mam
usa
1,00
0-
809
1,80
91,
809
--
Man
gaun
g 5,
914
--
5,91
45,
914
--
Man
tsop
a 1,
000
--
1,00
01,
000
--
Maq
uass
i Hill
s 1,
000
--
1,00
01,
000
--
Mar
ulen
g 1,
000
--
1,00
01,
000
--
Mas
ilony
ana
1,16
9-
-1,
169
1,16
9-
-M
atat
iele
3,
430
--
3,43
0 3,
430
--
Mat
jhab
eng
882
-50
51,
387
1,38
7-
-M
atzi
kam
a 1,
058
--
1,05
81,
058
--
Mbh
ashe
1,
000
--
1,00
01,
000
--
Mbi
zana
1,
000
--
1,00
01,
000
--
Mbo
mbe
la
2,95
4-
-2,
954
2,95
4-
-M
eraf
ong
City
1,
762
--
1,76
21,
762
--
Met
sim
ahol
o 1,
395
--
1,39
51,
395
--
Mhl
ontlo
1,
058
--
1,05
8 1,
058
--
Mid
vaal
1,
000
--
1,00
01,
000
--
Mkh
ondo
1,
000
-99
81,
998
1,99
8-
-M
nqum
a 1,
172
--
1,17
2 1,
172
--
Mod
imol
le
912
--
912
912
--

Department of Public Works | Annual Report 2012/13 241
Disclosure Notes to the Annual Financial Statementsfor the year ended 31 March 2013
NA
ME
OF
MU
NIC
IPA
LITY
GRA
NT
ALL
OCA
TIO
NTR
AN
SFER
Div
isio
n of
Re
venu
e A
ctRo
ll O
vers
Adj
ustm
ents
Tota
l Ava
ilabl
eA
ctua
l Tra
nsfe
rFu
nds W
ithhe
ld
Re-a
lloca
tions
by
Nat
iona
l Tr
easu
ry
or N
atio
nal
Dep
artm
ent
R’00
0R’
000
R’00
0R’
000
R’00
0R’
000
%M
ogal
akw
ena
1,75
5-
-1,
755
1,75
5-
-M
ogal
e Ci
ty
1,89
1-
194
2,08
52,
085
--
Moh
okar
e 1,
000
--
1,00
01,
000
--
Mol
emol
e 1,
000
--
1,00
01,
000
--
Mol
opo-
Kagi
sano
1,
000
--
1,00
01,
000
--
Moo
kgop
ong
1,00
0-
-1,
000
1,00
0-
-M
opan
i Dis
tric
t M
unic
ipal
ity
3,80
8-
-3,
808
3,80
8-
-
Moq
haka
1,
259
--
1,25
91,
259
--
Mor
etel
e 2,
169
--
2,16
92,
169
--
Mos
es K
otan
e 1,
428
-38
1,46
61,
466
--
Mos
sel B
ay
2,46
1-
-2,
461
2,46
1-
-M
pofa
na
1,00
0-
-1,
000
1,00
0-
-M
sing
a 1,
000
--
1,00
01,
000
--
Msu
kalig
wa
1,05
6-
-1,
056
1,05
6-
-M
sund
uzi
1,50
1-
-1,
501
1,50
1-
-M
thon
jane
ni
1,00
0-
-1,
000
1,00
0-
-M
usin
a 1,
000
--
1,00
01,
000
--
Mut
ale
1,00
0-
-1,
000
1,00
0-
-N
ala
1,16
6-
-1,
166
1,16
6 -
-N
aled
i (FS
) 1,
000
--
1,00
040
060
0-
Nal
edi (
NW
) 1,
000
7643
91,
515
1,51
5-
-N
ama
Khoi
1,
000
--
1,00
01,
000
--
Nam
akw
a D
istr
ict
Mun
icip
ality
1,
000
--
1,00
01,
000
--
Ndl
ambe
1,
000
--
1,00
01,
000
--
Nel
son
Man
dela
Bay
14
,696
--
14,6
96
14,6
96
--
New
cast
le
1,87
5-
-1,
875
1,87
5-
-N
gaka
Mod
iri M
olem
a D
istr
ict M
unic
ipal
ity
1,00
0-
211,
021
1,02
1-
-
Ngq
ushw
a 1,
000
--
1,00
01,
000
--
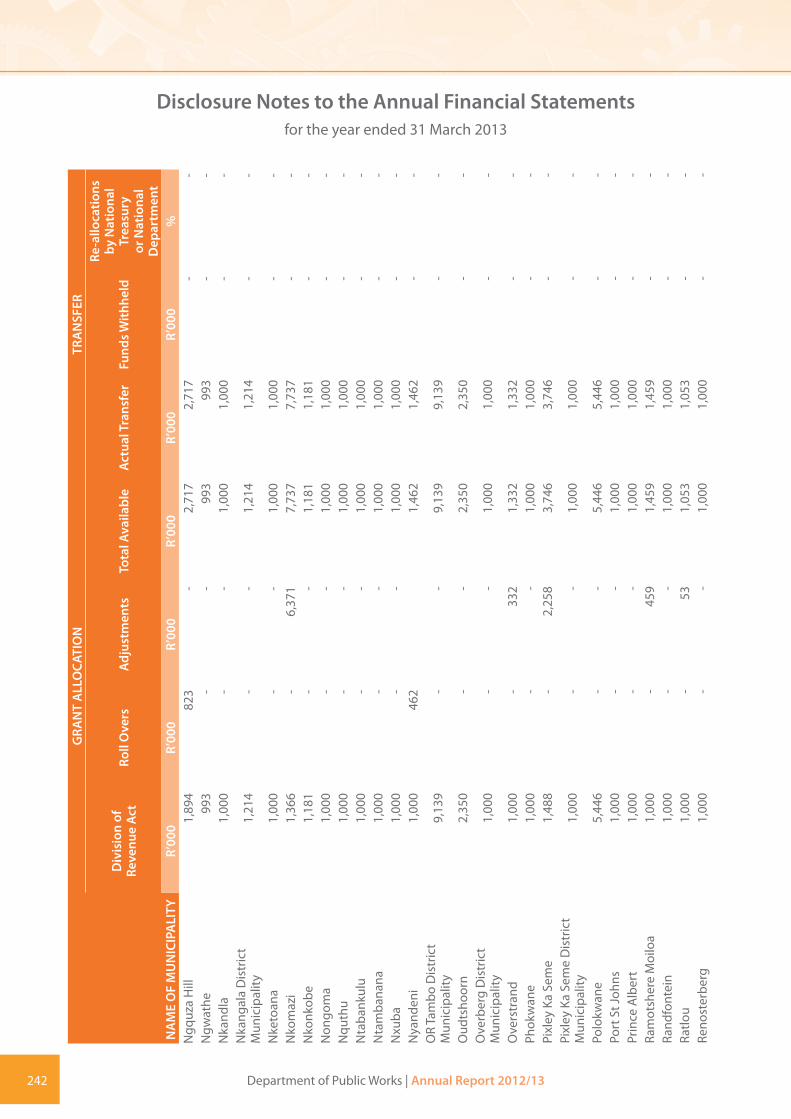
242 Department of Public Works | Annual Report 2012/13
Disclosure Notes to the Annual Financial Statementsfor the year ended 31 March 2013
NA
ME
OF
MU
NIC
IPA
LITY
GRA
NT
ALL
OCA
TIO
NTR
AN
SFER
Div
isio
n of
Re
venu
e A
ctRo
ll O
vers
Adj
ustm
ents
Tota
l Ava
ilabl
eA
ctua
l Tra
nsfe
rFu
nds W
ithhe
ld
Re-a
lloca
tions
by
Nat
iona
l Tr
easu
ry
or N
atio
nal
Dep
artm
ent
R’00
0R’
000
R’00
0R’
000
R’00
0R’
000
%N
gquz
a H
ill
1,89
482
3 -
2,71
7 2,
717
--
Ngw
athe
99
3 -
-99
399
3 -
-N
kand
la
1,00
0-
-1,
000
1,00
0-
-N
kang
ala
Dis
tric
t M
unic
ipal
ity
1,21
4-
-1,
214
1,21
4-
-
Nke
toan
a 1,
000
--
1,00
01,
000
--
Nko
maz
i 1,
366
-6,
371
7,73
77,
737
--
Nko
nkob
e 1,
181
--
1,18
1 1,
181
--
Non
gom
a 1,
000
--
1,00
01,
000
--
Nqu
thu
1,00
0-
-1,
000
1,00
0-
-N
taba
nkul
u 1,
000
--
1,00
01,
000
--
Nta
mba
nana
1,
000
--
1,00
01,
000
--
Nxu
ba
1,00
0-
-1,
000
1,00
0-
-N
yand
eni
1,00
046
2
1,46
21,
462
--
OR
Tam
bo D
istr
ict
Mun
icip
ality
9,
139
--
9,13
9 9,
139
--
Oud
tsho
orn
2,35
0-
-2,
350
2,35
0-
-O
verb
erg
Dis
tric
t M
unic
ipal
ity
1,00
0-
-1,
000
1,00
0-
-
Ove
rstr
and
1,00
0-
332
1,33
21,
332
--
Phok
wan
e 1,
000
--
1,00
01,
000
--
Pixl
ey K
a Se
me
1,48
8-
2,25
83,
746
3,74
6-
-Pi
xley
Ka
Sem
e D
istr
ict
Mun
icip
ality
1,00
0-
-1,
000
1,00
0-
-
Polo
kwan
e 5,
446
--
5,44
65,
446
--
Port
St J
ohns
1,
000
--
1,00
01,
000
--
Prin
ce A
lber
t 1,
000
--
1,00
01,
000
--
Ram
otsh
ere
Moi
loa
1,00
0-
459
1,45
91,
459
--
Rand
font
ein
1,00
0-
-1,
000
1,00
0-
-Ra
tlou
1,00
0-
531,
053
1,05
3-
-Re
nost
erbe
rg
1,00
0-
-1,
000
1,00
0-
-

Department of Public Works | Annual Report 2012/13 243
Disclosure Notes to the Annual Financial Statementsfor the year ended 31 March 2013
NA
ME
OF
MU
NIC
IPA
LITY
GRA
NT
ALL
OCA
TIO
NTR
AN
SFER
Div
isio
n of
Re
venu
e A
ctRo
ll O
vers
Adj
ustm
ents
Tota
l Ava
ilabl
eA
ctua
l Tra
nsfe
rFu
nds W
ithhe
ld
Re-a
lloca
tions
by
Nat
iona
l Tr
easu
ry
or N
atio
nal
Dep
artm
ent
R’00
0R’
000
R’00
0R’
000
R’00
0R’
000
%Ru
sten
burg
7,
837
--
7,83
77,
837
--
Sakh
isiz
we
1,00
0-
-1,
000
1,00
0-
-Sa
ldan
ha B
ay
1,99
7-
-1,
997
1,99
7-
-Se
dibe
ng D
istr
ict
Mun
icip
ality
1,
000
39-
1,03
91,
039
--
Senq
u 1,
857
--
1,85
7 1,
857
--
Sets
oto
1,09
0-
-1,
090
1,09
0 -
-Si
sonk
e D
istr
ict
Mun
icip
ality
3,
028
-1,
566
4,59
44,
594
--
Siya
nda
Dis
tric
t M
unic
ipal
ity
1,00
0-
-1,
000
1,00
0-
-
Siya
them
ba
1,00
0-
-1,
000
1,00
0-
-So
l Pla
atje
7,
659
-2,
919
10,5
7810
,578
--
Stel
lenb
osch
1,
041
--
1,04
11,
041
--
Stev
e Ts
hwet
e 1,
646
--
1,64
61,
646
--
Sund
ays
Rive
r Val
ley
1,00
0-
-1,
000
1,00
0-
-Sw
artla
nd
1,00
0-
-1,
000
1,00
0-
-Sw
elle
ndam
1,
000
--
1,00
01,
000
--
Thab
a Ch
weu
1,
000
--
1,00
01,
000
--
Thab
azim
bi
1,51
4-
-1,
514
1,51
4-
-Th
abo
Mof
utsa
nyan
a D
istr
ict M
unic
ipal
ity
1,73
7-
-1,
737
1,73
7-
-
Thee
wat
ersk
loof
99
4-
-99
499
4-
-Th
embe
lihle
1,
000
--
1,00
01,
000
--
Them
bisi
le
991
-1,
872
2,86
32,
863
--
Thul
amel
a1,
378
--
1,37
81,
378
--
Tlok
we
1,00
0-
-1,
000
1,00
0-
-To
kolo
go1,
444
--
1,44
41,
444
--
Tsan
tsab
ane
1,00
0-
-1,
000
1,00
0-
-Ts
olw
ana
1,00
0-
-1,
000
1,00
0-
-Ts
wai
ng
1,00
042
2-
1,42
21,
422
--
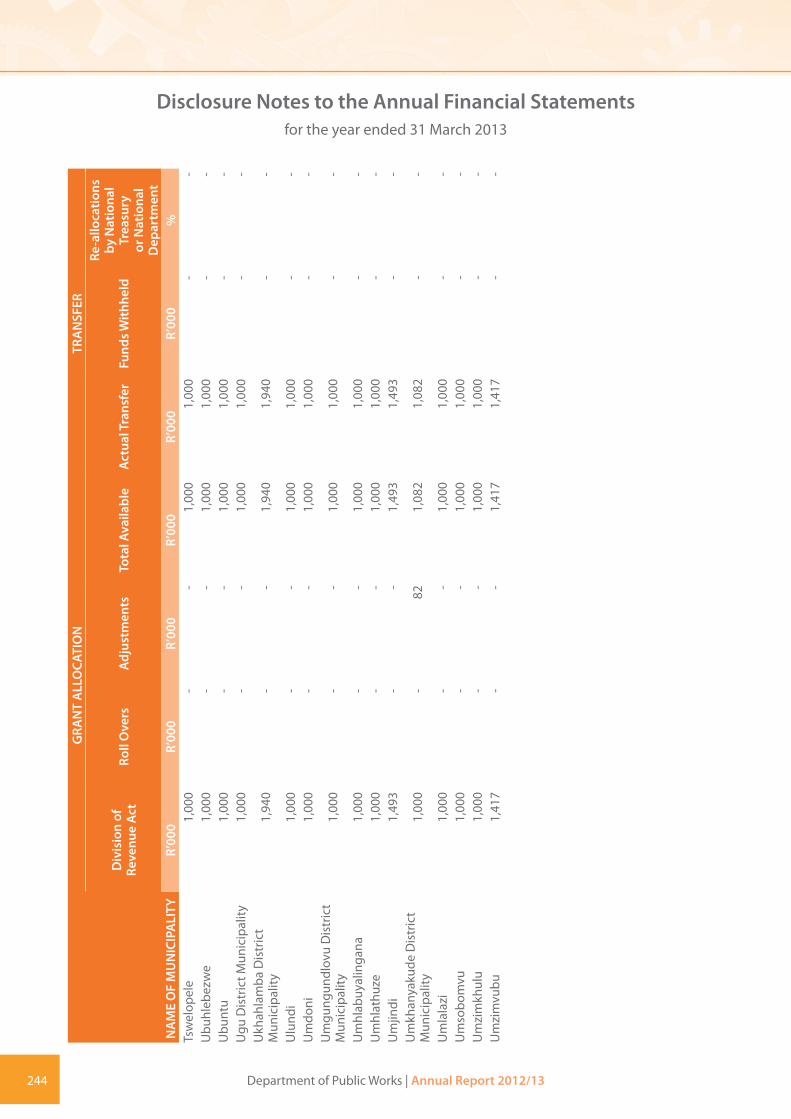
244 Department of Public Works | Annual Report 2012/13
Disclosure Notes to the Annual Financial Statementsfor the year ended 31 March 2013
NA
ME
OF
MU
NIC
IPA
LITY
GRA
NT
ALL
OCA
TIO
NTR
AN
SFER
Div
isio
n of
Re
venu
e A
ctRo
ll O
vers
Adj
ustm
ents
Tota
l Ava
ilabl
eA
ctua
l Tra
nsfe
rFu
nds W
ithhe
ld
Re-a
lloca
tions
by
Nat
iona
l Tr
easu
ry
or N
atio
nal
Dep
artm
ent
R’00
0R’
000
R’00
0R’
000
R’00
0R’
000
%Ts
wel
opel
e 1,
000
--
1,00
01,
000
--
Ubu
hleb
ezw
e 1,
000
--
1,00
01,
000
--
Ubu
ntu
1,00
0-
-1,
000
1,00
0-
-U
gu D
istr
ict M
unic
ipal
ity
1,00
0-
-1,
000
1,00
0-
-U
khah
lam
ba D
istr
ict
Mun
icip
ality
1,
940
--
1,94
0 1,
940
--
Ulu
ndi
1,00
0-
-1,
000
1,00
0-
-U
mdo
ni
1,00
0-
-1,
000
1,00
0-
-U
mgu
ngun
dlov
u D
istr
ict
Mun
icip
ality
1,
000
--
1,00
01,
000
--
Um
hlab
uyal
inga
na
1,00
0-
-1,
000
1,00
0-
-U
mhl
athu
ze
1,00
0-
-1,
000
1,00
0-
-U
mjin
di
1,49
3-
-1,
493
1,49
3-
-U
mkh
anya
kude
Dis
tric
t M
unic
ipal
ity1,
000
-82
1,08
21,
082
--
Um
lala
zi
1,00
0-
-1,
000
1,00
0-
-U
mso
bom
vu
1,00
0-
-1,
000
1,00
0-
-U
mzi
mkh
ulu
1,00
0-
-1,
000
1,00
0-
-U
mzi
mvu
bu
1,41
7-
-1,
417
1,41
7 -
-

Department of Public Works | Annual Report 2012/13 245
Disclosure Notes to the Annual Financial Statementsfor the year ended 31 March 2013
NA
ME
OF
MU
NIC
IPA
LITY
GRA
NT
ALL
OCA
TIO
NTR
AN
SFER
Div
isio
n of
Re
venu
e A
ctRo
ll O
vers
Adj
ustm
ents
Tota
l Ava
ilabl
eA
ctua
l Tra
nsfe
rFu
nds W
ithhe
ld
Re-a
lloca
tions
by
Nat
iona
l Tr
easu
ry
or N
atio
nal
Dep
artm
ent
R’00
0R’
000
R’00
0R’
000
R’00
0R’
000
%U
mzi
nyat
hi D
istr
ict
Mun
icip
ality
1,
765
--
1,76
51,
765
--
Uph
ongo
lo
1,00
0-
-1,
000
1,00
0-
-U
thuk
ela
Dis
tric
t M
unic
ipal
ity
2,87
4-
-2,
874
2,87
4-
-U
thun
gulu
Dis
tric
t M
unic
ipal
ity
2,65
1-
1,30
43,
955
3,95
5-
-Ve
nter
sdor
p 1,
000
--
1,00
01,
000
--
Vhem
be D
istr
ict
Mun
icip
ality
4,
862
--
4,86
24,
862
--
Wat
erbe
rg D
istr
ict
Mun
icip
ality
1,
000
--
1,00
01,
000
--
Wes
t Coa
st D
istr
ict
Mun
icip
ality
1,
000
63-
1,06
31,
063
--
Wes
t Ran
d D
istr
ict
Mun
icip
ality
1,
000
--
1,00
01,
000
--
Wes
tona
ria
1,00
0-
-1,
000
1,00
0-
-W
itzen
berg
1,
000
--
1,00
01,
000
--
Xhar
iep
Dis
tric
t M
unic
ipal
ity
1,00
045
-1,
045
1,04
5-
-Zu
lula
nd D
istr
ict
Mun
icip
ality
1,
000
-4,
207
5,20
75,
207
--
599,
240
17,3
9545
,500
662,
135
661,
535
600
-
The
Dep
artm
ent c
ertifi
es th
at a
ll tr
ansf
ers
wer
e in
term
s of
the
DO
RA A
ct a
nd d
epos
ited
into
the
prim
ary
bank
acc
ount
of t
he p
rovi
nce
or m
unic
ipal
ity.

246 Department of Public Works | Annual Report 2012/13
Annexures to the Annual Financial Statementsfor the year ended 31 March 2013
AN
NEX
URE
1A
STAT
EMEN
T O
F CO
ND
ITIO
NA
L G
RAN
TS P
AID
TO
MU
NIC
IPA
LITI
ES
NA
ME
OF
MU
NIC
IPA
LITY
GRA
NT
ALL
OCA
TIO
NTR
AN
SFER
SPEN
T20
11/1
2
Div
isio
n of
Re
venu
e A
ct
Roll
Ove
rsA
djus
t-m
ents
Tota
l A
vaila
ble
Act
ual
Tran
sfer
Fund
s W
ithh
eld
Re-a
llo-
cati
ons
by N
a-ti
onal
Tr
easu
ry
or N
a-ti
onal
D
epar
t-m
ent
Am
ount
Re
ceiv
ed
by
Mun
ici-
palit
y
Am
ount
Sp
ent b
y M
unic
i-pa
lity
% o
f A
vaila
ble
Fund
s Sp
ent b
y M
unic
i-pa
lity
Div
isio
n of
Re
venu
e A
ct
R’00
0R’
000
R’00
0R’
000
R’00
0R’
000
R’00
0R’
000
R’00
0%
R’00
0!K
ai! G
arib
1,00
0-
-1,
000
1,00
0-
-1,
000
382
38%
-!K
heis
1,00
0-
-1,
000
1,00
0-
-1,
000
597
60%
-//
Khar
a H
ais
1,00
0-
-1,
000
1,00
0-
-1,
000
414%
-A
baqu
lusi
1,
000
--
1,00
01,
000
--
1,00
0-
-35
7Ag
anan
g1,
066
--
1,06
61,
066
--
1,06
667
6%35
7A
lber
t Lut
huli
1,38
6-
-1,
386
1,38
6-
-1,
386
678
49%
966
Alfr
ed N
zo D
istr
ict
Mun
icip
ality
9,
604
--
9,60
49,
604
--
9,60
451
,307
534%
9,53
0
Am
ahla
ti 1,
000
--
1,00
01,
000
--
1,00
021
421
%60
9 A
maj
uba
Dis
tric
t M
unic
ipal
ity
1,00
0-
-1,
000
1,00
0-
-1,
000
1,34
613
5%96
6
Am
atol
e D
istr
ict
Mun
icip
ality
6,
022
--
6,02
26,
022
--
6,02
2-
-7,
803
Ba-P
hala
borw
a 1,
000
--
1,00
01,
000
--
1,00
090
190
%35
7Ba
viaa
ns
1,47
1 1,
286
-2
757
2 75
7 -
-2,
757
1,48
554
%96
6Be
aufo
rt W
est
1,00
0-
-1,
000
1,00
0-
-1,
000
1,05
610
6%35
7Be
la B
ela
1,00
0-
-1,
000
1,00
0-
-1,
000
768
77%
357
Berg
rivie
r89
6-
-89
689
6-
-89
61,
087
121%
357
Bito
u1,
000
--
1,00
01,
000
--
1,00
027
127
%35
7Bl
oube
rg1,
000
--
1,00
01,
000
--
1,00
01,
000
100%
483
Blue
Cra
ne R
oute
1,
000
--
1,00
01,
000
--
1,00
092
993
%35
7Bo
jana
la P
latin
um D
istr
ict
Mun
icip
ality
1,41
2-
-1,
412
1,41
2-
-1,
412
748
53%
1,30
1
Bree
de V
alle
y1,
000
--
1,00
01,
000
--
1,00
052
553
%35
7
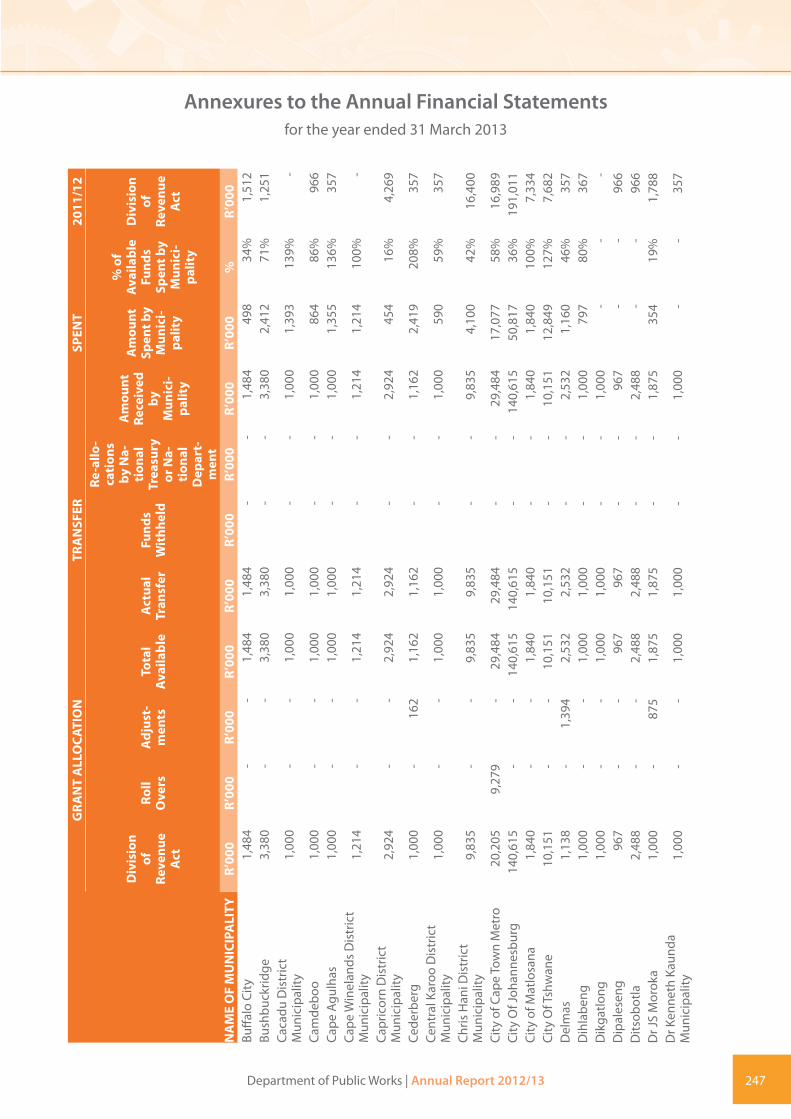
Department of Public Works | Annual Report 2012/13 247
Annexures to the Annual Financial Statementsfor the year ended 31 March 2013
NA
ME
OF
MU
NIC
IPA
LITY
GRA
NT
ALL
OCA
TIO
NTR
AN
SFER
SPEN
T20
11/1
2
Div
isio
n of
Re
venu
e A
ct
Roll
Ove
rsA
djus
t-m
ents
Tota
l A
vaila
ble
Act
ual
Tran
sfer
Fund
s W
ithh
eld
Re-a
llo-
cati
ons
by N
a-ti
onal
Tr
easu
ry
or N
a-ti
onal
D
epar
t-m
ent
Am
ount
Re
ceiv
ed
by
Mun
ici-
palit
y
Am
ount
Sp
ent b
y M
unic
i-pa
lity
% o
f A
vaila
ble
Fund
s Sp
ent b
y M
unic
i-pa
lity
Div
isio
n of
Re
venu
e A
ct
R’00
0R’
000
R’00
0R’
000
R’00
0R’
000
R’00
0R’
000
R’00
0%
R’00
0Bu
ffalo
City
1,
484
--
1,48
41,
484
--
1,48
449
834
%1,
512
Bush
buck
ridge
3,38
0-
-3,
380
3,38
0-
-3,
380
2,41
271
%1,
251
Caca
du D
istr
ict
Mun
icip
ality
1,
000
--
1,00
01,
000
--
1,00
01,
393
139%
-
Cam
debo
o 1,
000
--
1,00
01,
000
--
1,00
086
486
%96
6Ca
pe A
gulh
as1,
000
--
1,00
01,
000
--
1,00
01,
355
136%
357
Cape
Win
elan
ds D
istr
ict
Mun
icip
ality
1,21
4-
-1,
214
1,21
4-
-1,
214
1,21
410
0%-
Capr
icor
n D
istr
ict
Mun
icip
ality
2,92
4-
-2,
924
2,92
4-
-2,
924
454
16%
4,26
9
Cede
rber
g1,
000
-16
21,
162
1,16
2-
-1,
162
2,41
920
8%35
7Ce
ntra
l Kar
oo D
istr
ict
Mun
icip
ality
1,00
0-
-1,
000
1,00
0-
-1,
000
590
59%
357
Chris
Han
i Dis
tric
t M
unic
ipal
ity
9,83
5-
-9,
835
9,83
5-
-9,
835
4,10
042
%16
,400
City
of C
ape
Tow
n M
etro
20,2
059,
279
-29
,484
29,4
84-
-29
,484
17,0
7758
%16
,989
City
Of J
ohan
nesb
urg
140,
615
--
140,
615
140,
615
--
140,
615
50,8
1736
%19
1,01
1Ci
ty o
f Mat
losa
na1,
840
--
1,84
01,
840
--
1,84
01,
840
100%
7,33
4Ci
ty O
f Tsh
wan
e 10
,151
--
10,1
5110
,151
--
10,1
5112
,849
127%
7,68
2D
elm
as1,
138
-1,
394
2,53
22,
532
--
2,53
21,
160
46%
357
Dih
labe
ng
1,00
0-
-1,
000
1,00
0-
-1,
000
797
80%
367
Dik
gatlo
ng1,
000
--
1,00
01,
000
--
1,00
0-
--
Dip
ales
eng
967
--
967
967
--
967
--
966
Dits
obot
la2,
488
--
2,48
82,
488
--
2,48
8-
-96
6D
r JS
Mor
oka
1,00
0-
875
1,87
51,
875
--
1,87
535
419
%1,
788
Dr K
enne
th K
aund
a M
unic
ipal
ity1,
000
--
1,00
01,
000
--
1,00
0-
-35
7
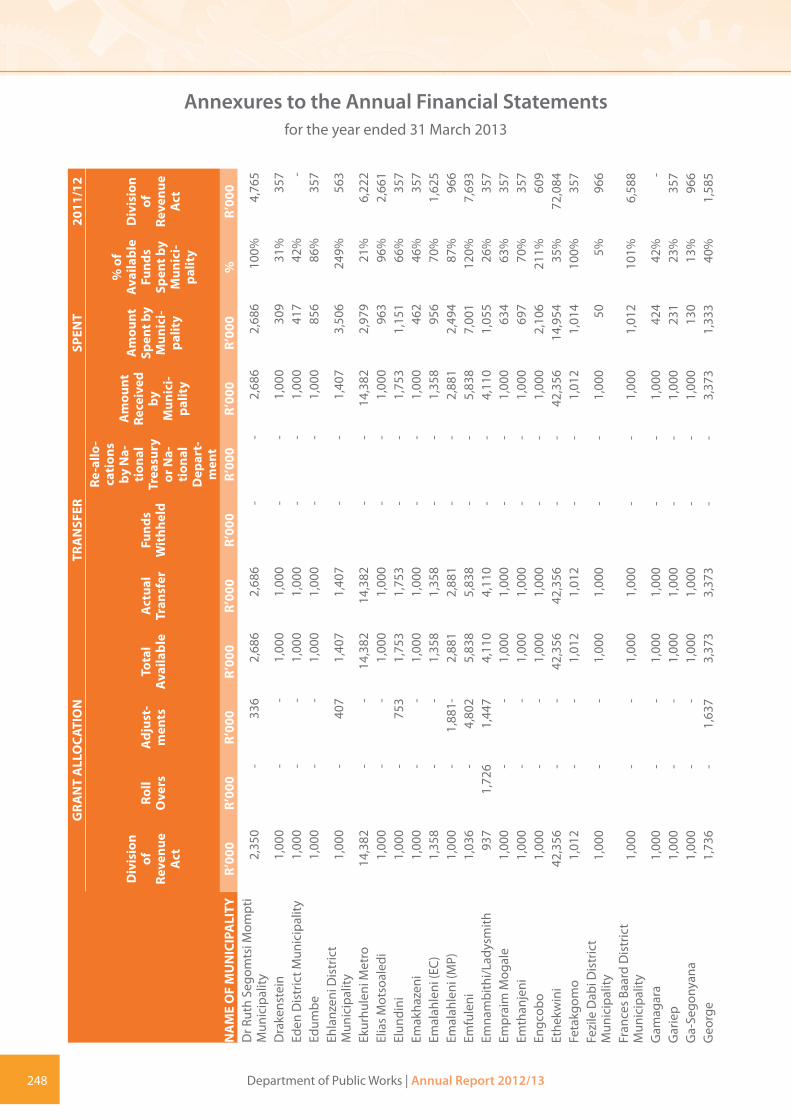
248 Department of Public Works | Annual Report 2012/13
Annexures to the Annual Financial Statementsfor the year ended 31 March 2013
NA
ME
OF
MU
NIC
IPA
LITY
GRA
NT
ALL
OCA
TIO
NTR
AN
SFER
SPEN
T20
11/1
2
Div
isio
n of
Re
venu
e A
ct
Roll
Ove
rsA
djus
t-m
ents
Tota
l A
vaila
ble
Act
ual
Tran
sfer
Fund
s W
ithh
eld
Re-a
llo-
cati
ons
by N
a-ti
onal
Tr
easu
ry
or N
a-ti
onal
D
epar
t-m
ent
Am
ount
Re
ceiv
ed
by
Mun
ici-
palit
y
Am
ount
Sp
ent b
y M
unic
i-pa
lity
% o
f A
vaila
ble
Fund
s Sp
ent b
y M
unic
i-pa
lity
Div
isio
n of
Re
venu
e A
ct
R’00
0R’
000
R’00
0R’
000
R’00
0R’
000
R’00
0R’
000
R’00
0%
R’00
0D
r Rut
h Se
gom
tsi M
ompt
i M
unic
ipal
ity2,
350
-33
62,
686
2,68
6-
-2,
686
2,68
610
0%4,
765
Dra
kens
tein
1,00
0-
-1,
000
1,00
0-
-1,
000
309
31%
357
Eden
Dis
tric
t Mun
icip
ality
1,00
0-
-1,
000
1,00
0-
-1,
000
417
42%
-Ed
umbe
1,
000
--
1,00
01,
000
--
1,00
085
686
%35
7Eh
lanz
eni D
istr
ict
Mun
icip
ality
1,00
0-
407
1,40
71,
407
--
1,40
73,
506
249%
563
Ekur
hule
ni M
etro
14
,382
--
14,3
8214
,382
--
14,3
822,
979
21%
6,22
2El
ias
Mot
soal
edi
1,00
0-
-1,
000
1,00
0-
-1,
000
963
96%
2,66
1El
undi
ni
1,00
0-
753
1,75
31,
753
--
1,75
31,
151
66%
357
Emak
haze
ni1,
000
--
1,00
01,
000
--
1,00
046
246
%35
7Em
alah
leni
(EC)
1,
358
--
1,35
81,
358
--
1,35
895
670
%1,
625
Emal
ahle
ni (M
P)
1,00
0-
1,88
1-2,
881
2,88
1-
-2,
881
2,49
487
%96
6 Em
fule
ni
1,03
6-
4,80
25,
838
5,83
8-
-5,
838
7,00
112
0%7,
693
Emna
mbi
thi/L
adys
mith
93
71,
726
1,44
74,
110
4,11
0-
-4,
110
1,05
526
%35
7Em
prai
m M
ogal
e 1,
000
--
1,00
01,
000
--
1,00
063
463
%35
7Em
than
jeni
1,00
0-
-1,
000
1,00
0-
-1,
000
697
70%
357
Engc
obo
1,00
0-
-1,
000
1,00
0-
-1,
000
2,10
621
1%60
9 Et
hekw
ini
42,3
56-
-42
,356
42,3
56-
-42
,356
14,9
5435
%72
,084
Feta
kgom
o 1,
012
--
1,01
21,
012
--
1,01
21,
014
100%
357
Fezi
le D
abi D
istr
ict
Mun
icip
ality
1,00
0-
-1,
000
1,00
0-
-1,
000
505%
966
Fran
ces
Baar
d D
istr
ict
Mun
icip
ality
1,00
0-
-1,
000
1,00
0-
-1,
000
1,01
210
1%6,
588
Gam
agar
a1,
000
--
1,00
01,
000
--
1,00
042
442
%-
Gar
iep
1,00
0-
-1,
000
1,00
0-
-1,
000
231
23%
357
Ga-
Sego
nyan
a1,
000
--
1,00
01,
000
--
1,00
013
013
%96
6G
eorg
e1,
736
-1,
637
3,37
33,
373
--
3,37
31,
333
40%
1,58
5

Department of Public Works | Annual Report 2012/13 249
Annexures to the Annual Financial Statementsfor the year ended 31 March 2013
NA
ME
OF
MU
NIC
IPA
LITY
GRA
NT
ALL
OCA
TIO
NTR
AN
SFER
SPEN
T20
11/1
2
Div
isio
n of
Re
venu
e A
ct
Roll
Ove
rsA
djus
t-m
ents
Tota
l A
vaila
ble
Act
ual
Tran
sfer
Fund
s W
ithh
eld
Re-a
llo-
cati
ons
by N
a-ti
onal
Tr
easu
ry
or N
a-ti
onal
D
epar
t-m
ent
Am
ount
Re
ceiv
ed
by
Mun
ici-
palit
y
Am
ount
Sp
ent b
y M
unic
i-pa
lity
% o
f A
vaila
ble
Fund
s Sp
ent b
y M
unic
i-pa
lity
Div
isio
n of
Re
venu
e A
ct
R’00
0R’
000
R’00
0R’
000
R’00
0R’
000
R’00
0R’
000
R’00
0%
R’00
0G
ert S
iban
de D
istr
ict
Mun
icip
ality
1,00
0-
-1,
000
1,00
0-
-1,
000
676
68%
3,42
0
Gov
an M
beki
1,95
9-
-1,
959
1,95
9-
-1,
959
3,25
516
6%1,
574
Gre
at K
ei
1,00
0-
-1,
000
1,00
0-
-1,
000
738
74%
-G
reat
er G
iyan
i 1,
000
--
1,00
01,
000
--
1,00
01,
122
112%
357
Gre
ater
Kok
stad
1,
000
--
1,00
01,
000
--
1,00
052
953
%35
7G
reat
er L
etab
a 1,
142
-17
61,
318
1,31
8-
-1,
318
902
62%
2,64
3G
reat
er S
ekhu
khun
e D
istr
ict M
unic
ipal
ity
3,12
4-
-3,
124
3,12
4-
-3,
124
2,88
292
%12
,333
Gre
ater
Tau
ng1,
000
--
1,00
01,
000
--
1,00
090
290
%96
6G
reat
er T
ubat
se
1,00
0-
-1,
000
1,00
0-
-1,
000
--
1,28
4G
reat
er T
zane
en
935
-74
1,00
91,
009
--
1,00
91,
262
125%
911
Han
tam
1,00
0-
-1,
000
1,00
0-
-1,
000
993
99%
-H
esse
qua
1,00
0-
-1,
000
1,00
0-
-1,
000
800
80%
357
Hib
iscu
s Co
ast
1,00
0-
-1,
000
1,00
0-
-1,
000
500
50%
966
Ikw
ezi
1,00
0-
-1,
000
1,00
0-
-1,
000
525
53%
357
Ilem
be D
istr
ict
Mun
icip
ality
1,
000
-16
81,
168
1,16
8-
-1,
168
--
7,06
7
Impe
ndle
1,
000
--
1,00
01,
000
--
1,00
072
072
%-
Inkw
anca
1,
000
--
1,00
01,
000
--
1,00
01,
002
100%
357
Ints
ika
Yeth
u 1,
000
--
1,00
01,
000
--
1,00
071
171
%96
6In
xuba
Yet
hem
ba
1,00
0-
-1,
000
1,00
0-
-1,
000
1,22
612
3%35
7Jo
e M
orol
ong
1,00
0-
-1,
000
1,00
0-
-1,
000
231
231
357
Joe
Gra
bi D
istr
ict
Mun
icip
ality
1,00
0-
-1,
000
1,00
0-
-1,
000
231
23%
3,47
6
John
Tao
lo G
aets
ewe
Dis
tric
t Mun
icip
ality
--
--
--
--
-50
%7,
113
Kann
alan
d1,
000
--
1,00
01,
000
--
1,00
054
154
%35
7

250 Department of Public Works | Annual Report 2012/13
Annexures to the Annual Financial Statementsfor the year ended 31 March 2013
NA
ME
OF
MU
NIC
IPA
LITY
GRA
NT
ALL
OCA
TIO
NTR
AN
SFER
SPEN
T20
11/1
2
Div
isio
n of
Re
venu
e A
ct
Roll
Ove
rsA
djus
t-m
ents
Tota
l A
vaila
ble
Act
ual
Tran
sfer
Fund
s W
ithh
eld
Re-a
llo-
cati
ons
by N
a-ti
onal
Tr
easu
ry
or N
a-ti
onal
D
epar
t-m
ent
Am
ount
Re
ceiv
ed
by
Mun
ici-
palit
y
Am
ount
Sp
ent b
y M
unic
i-pa
lity
% o
f A
vaila
ble
Fund
s Sp
ent b
y M
unic
i-pa
lity
Div
isio
n of
Re
venu
e A
ct
R’00
0R’
000
R’00
0R’
000
R’00
0R’
000
R’00
0R’
000
R’00
0%
R’00
0Ka
reeb
erg
1,00
0-
-1,
000
1,00
0-
-1,
000
--
-Kg
atel
opel
e1,
000
--
1,00
01,
000
--
1,00
076
376
%-
Kget
leng
rivie
r1,
000
--
1,00
01,
000
--
1,00
0-
-35
7Ki
ng S
abat
a D
alin
dyeb
o 1,
000
--
1,00
01,
000
--
1,00
01,
352
135%
609
Knys
na1,
000
--
1,00
01,
000
--
1,00
022
022
%-
Kopa
nong
1,
000
--
1,00
01,
000
--
1,00
01,
147
115%
357
Koug
a 1,
224
602
542
2 36
8 2
368
--
2,36
849
921
%1,
251
Kou-
Kam
ma
1,00
0-
-1,
000
1,00
0-
-1,
000
1,08
510
9%35
7Kw
a Sa
ni
1,00
0-
-1,
000
1,00
0-
-1,
000
142
14%
-Kw
aduk
uza
1,00
0-
-1,
000
1,00
0-
-1,
000
--
-Le
jwel
eput
swa
Dis
tric
t M
unic
ipal
ity1,
000
--
1,00
01,
000
--
1,00
096
10%
966
Lain
gsbu
rg1,
000
--
1,00
01,
000
--
1,00
0-
--
Lang
eber
g1,
000
--
1,00
01,
000
--
1,00
014
214
%-
Lese
di
1,00
0-
-1,
000
1,00
0-
-1,
000
402
40%
-Le
kwa
1,75
7-
-1,
757
1,75
7-
-1,
757
--
966
Lekw
a-Te
eman
e1,
000
--
1,00
01,
000
--
1,00
081
982
%35
7Le
pelle
-Nku
mpi
1,26
0-
-1,
260
1,26
0-
-1,
260
--
966
Leph
alal
e1,
052
-53
21,
584
1,58
4-
-1,
584
131%
2,55
4Le
tsem
eng
1,00
0-
741,
074
1,07
4-
-1,
074
259
24%
357
Lukh
anji
2,84
4-
-2,
844
2,84
4-
-2,
844
1,56
155
%96
6M
adib
eng
1,41
1-
769
2,18
02,
180
--
2,18
02,
180
100%
3,41
7M
afike
ng3,
232
2,57
2-
5,80
45,
804
--
5,80
49,
353
161%
966
Maf
ube
1,02
4-
-1,
024
1,02
4-
-1,
024
--
357
Mag
aren
g1,
000
--
1,00
01,
000
--
1,00
01,
242
124%
-M
akan
a 1,
000
--
1,00
01,
000
--
1,00
034
735
%35
7M
akha
do
1,92
6-
-1,
926
1,92
6-
-1,
926
719
37%
609

Department of Public Works | Annual Report 2012/13 251
Annexures to the Annual Financial Statementsfor the year ended 31 March 2013
NA
ME
OF
MU
NIC
IPA
LITY
GRA
NT
ALL
OCA
TIO
NTR
AN
SFER
SPEN
T20
11/1
2
Div
isio
n of
Re
venu
e A
ct
Roll
Ove
rsA
djus
t-m
ents
Tota
l A
vaila
ble
Act
ual
Tran
sfer
Fund
s W
ithh
eld
Re-a
llo-
cati
ons
by N
a-ti
onal
Tr
easu
ry
or N
a-ti
onal
D
epar
t-m
ent
Am
ount
Re
ceiv
ed
by
Mun
ici-
palit
y
Am
ount
Sp
ent b
y M
unic
i-pa
lity
% o
f A
vaila
ble
Fund
s Sp
ent b
y M
unic
i-pa
lity
Div
isio
n of
Re
venu
e A
ct
R’00
0R’
000
R’00
0R’
000
R’00
0R’
000
R’00
0R’
000
R’00
0%
R’00
0M
akhu
duth
amag
a 96
6-
-96
696
6-
-96
6-
-1,
492
Mal
etsw
ai
1,00
0-
-1,
000
1,00
0-
-1,
000
1,83
518
4%35
7M
alut
i-A-P
hofu
ng
8,06
2-
5,04
413
,106
13,1
06-
-13
,106
5,94
145
%6,
706
Mam
usa
1,00
0-
809
1,80
91,
809
--
1,80
91,
809
100%
357
Man
gaun
g 5,
914
--
5,91
45,
914
--
5,91
422
14%
5,71
3M
ants
opa
1,00
0-
-1,
000
1,00
0-
-1,
000
305
31%
357
Maq
uass
i Hill
s1,
000
--
1,00
01,
000
--
1,00
01,
189
119%
966
Mar
ulen
g 1,
000
--
1,00
01,
000
--
1,00
087
888
%96
6M
asilo
nyan
a 1,
169
--
1,16
91,
169
--
1,16
91,
333
114%
357
Mat
atie
le
3,43
0-
-3,
430
3,43
0-
-3,
430
875
26%
1,93
4M
atjh
aben
g 88
2-
505
1,38
71,
387
--
1,38
7-
-3,
335
Mat
zika
ma
1,05
8-
-1,
058
1,05
8-
-1,
058
1,11
610
5%35
7M
bhas
he
1,00
0-
-1,
000
1,00
0-
-1,
000
--
-M
biza
na
1,00
0-
-1,
000
1,00
0-
-1,
000
423
42%
-M
bom
bela
2,95
4-
-2,
954
2,95
4-
-2,
954
1,12
638
%1,
911
Mer
afon
g Ci
ty
1,76
2-
-1,
762
1,76
2-
-1,
762
--
3,95
2M
etsi
mah
olo
1,39
5-
-1,
395
1,39
5-
-1,
395
1,56
211
2%35
7M
hlon
tlo
1,05
8-
-1,
058
1,05
8-
-1,
058
889
84%
966
Mid
vaal
1,
000
--
1,00
01,
000
--
1,00
081
982
%35
7M
khon
do1,
000
-99
81,
998
1,99
8-
-1,
998
1474
74%
966
Mnq
uma
1,17
2-
-1,
172
1,17
2-
-1,
172
1,04
489
%35
7M
odim
olle
912
--
912
912
--
912
360
39%
357
Mog
alak
wna
1,75
5-
-1,
755
1,75
5-
-1,
755
475
27%
1,69
3M
ogal
e Ci
ty
1,89
1-
194
2,08
52,
085
--
2,08
51,
139
59%
2,70
9M
ohok
are
1,00
0-
-1,
000
1,00
0-
-1,
000
748
75%
357
Mol
emol
e1,
000
--
1,00
01,
000
--
1,00
0-
--
Mol
opo-
Kagi
sano
1,00
0-
-1,
000
1,00
0-
-1,
000
--
357

252 Department of Public Works | Annual Report 2012/13
Annexures to the Annual Financial Statementsfor the year ended 31 March 2013
NA
ME
OF
MU
NIC
IPA
LITY
GRA
NT
ALL
OCA
TIO
NTR
AN
SFER
SPEN
T20
11/1
2
Div
isio
n of
Re
venu
e A
ct
Roll
Ove
rsA
djus
t-m
ents
Tota
l A
vaila
ble
Act
ual
Tran
sfer
Fund
s W
ithh
eld
Re-a
llo-
cati
ons
by N
a-ti
onal
Tr
easu
ry
or N
a-ti
onal
D
epar
t-m
ent
Am
ount
Re
ceiv
ed
by
Mun
ici-
palit
y
Am
ount
Sp
ent b
y M
unic
i-pa
lity
% o
f A
vaila
ble
Fund
s Sp
ent b
y M
unic
i-pa
lity
Div
isio
n of
Re
venu
e A
ct
R’00
0R’
000
R’00
0R’
000
R’00
0R’
000
R’00
0R’
000
R’00
0%
R’00
0M
ookg
opon
g1,
000
--
1,00
01,
000
--
1,00
076
076
%-
Mop
ani D
istr
ict
Mun
icip
ality
3,
808
--
3,80
83,
808
--
3,80
83,
187
84%
7,74
6
Moq
haka
1,
259
--
1,25
91,
259
--
1,25
91,
559
124%
1,72
6M
oret
ele
2,16
9-
-2,
169
2,16
9-
-2,
169
--
1,75
9M
oses
Kot
ane
1,42
8-
381,
466
1,46
6-
-1,
466
185
13%
1,24
2M
osha
wen
g1,
000
--
1,00
01,
000
--
--
-35
7M
osse
l Bay
2,46
1-
-2,
461
2,46
1-
-2,
461
2,01
882
%60
9M
pofa
na
1,00
0-
-1,
000
1,00
0-
-1,
000
--
-M
sing
a 1,
000
--
1,00
01,
000
--
1,00
062
963
%-
Msu
nduz
i 1,
501
--
1,50
11,
501
--
1,50
11,
421
95%
1,51
2M
suka
ligw
a1,
056
--
1,05
61,
056
--
1,05
663
86%
357
Mth
onja
neni
1,
000
--
1,00
01,
000
--
1,00
052
853
%-
Mus
ina
1,00
0-
-1,
000
1,00
0-
-1,
000
237
24%
-M
utal
e 1,
000
--
1,00
01,
000
--
1,00
095
295
%1,
621
Nal
a 1,
166
--
1,16
61,
166
--
1,16
620
918
%35
7N
aled
i (FS
) 1,
000
--
1,00
040
060
0-
400
500
125%
357
Nal
edi (
NW
) 1,
000
7643
91,
515
1,51
5-
-1,
515
1,51
510
0%96
6N
ama
Khoi
1,00
0-
-1,
000
1,00
0-
-10
0025
025
%-
Nam
akw
a D
istr
ict
Mun
icip
ality
1,00
0-
-1,
000
1,00
0-
-1,
000
992
99%
4,40
5
Ndl
ambe
1,
000
--
1,00
01,
000
--
1,00
086
286
%35
7N
elso
n M
ande
la B
ay
14,6
96-
-14
,696
14,6
96-
-14
,696
1,04
67%
8,92
3N
ewca
stle
1,
875
--
1,87
51,
875
--
1,87
55,
846
312%
966
Nga
ka M
odiri
Mol
ema
Dis
tric
t Mun
icip
ality
1,00
0-
211,
021
1,02
1-
-1,
021
1,17
111
5%1,
955
Ngq
ushw
a 1,
000
--
1,00
01,
000
--
1,00
073
7%-
Ngq
uza
Hill
1,
894
823
-2,
717
2,71
7-
-2,
717
1,54
357
%35
7

Department of Public Works | Annual Report 2012/13 253
Annexures to the Annual Financial Statementsfor the year ended 31 March 2013
NA
ME
OF
MU
NIC
IPA
LITY
GRA
NT
ALL
OCA
TIO
NTR
AN
SFER
SPEN
T20
11/1
2
Div
isio
n of
Re
venu
e A
ct
Roll
Ove
rsA
djus
t-m
ents
Tota
l A
vaila
ble
Act
ual
Tran
sfer
Fund
s W
ithh
eld
Re-a
llo-
cati
ons
by N
a-ti
onal
Tr
easu
ry
or N
a-ti
onal
D
epar
t-m
ent
Am
ount
Re
ceiv
ed
by
Mun
ici-
palit
y
Am
ount
Sp
ent b
y M
unic
i-pa
lity
% o
f A
vaila
ble
Fund
s Sp
ent b
y M
unic
i-pa
lity
Div
isio
n of
Re
venu
e A
ct
R’00
0R’
000
R’00
0R’
000
R’00
0R’
000
R’00
0R’
000
R’00
0%
R’00
0N
gwat
he
993
--
993
993
--
993
730
74%
975
Nka
ndla
1,
000
--
1,00
01,
000
--
1,00
0-
--
Nka
ngal
a D
istr
ict
Mun
icip
ality
1,21
4-
-1,
214
1,21
4-
-1,
214
893
74%
3,24
2
Nke
toan
a 1,
000
--
1,00
01,
000
--
1,00
058
358
%35
7N
kom
azi
1,36
6-
6,37
17,
737
7,73
7-
-7,
737
1,01
013
%1,
092
Nko
nkob
e 1,
181
--
1,18
11,
181
--
1,18
173
162
%35
7 N
ongo
ma
1,00
0-
-1,
000
1,00
0-
-1,
000
443
44%
357
Nqu
thu
1,00
0-
-1,
000
1,00
0-
-1,
000
--
-N
taba
nkul
u 1,
000
--
1,00
01,
000
--
1,00
035
536
%96
6N
tam
bana
na
1,00
0-
-1,
000
1,00
0-
-1,
000
614
61%
-N
xuba
1,
000
--
1,00
01,
000
--
1,00
022
321
%-
Nya
nden
i 1,
000
462
-1,
462
1,46
2-
-1,
462
261
18%
-O
r Tam
bo D
istr
ict
Mun
icip
ality
9,
139
--
9,13
99,
139
--
9,13
912
,262
134%
7,79
2
Oud
tsho
orn
2,35
0-
-2,
350
2,35
0-
-2,
350
2,74
711
7%1,
359
Ove
rber
g D
istr
ict
Mun
icip
ality
1,00
0-
-1,
000
1,00
0-
-1,
000
941
94%
357
Ove
rstr
and
1,00
0-
332
1,33
21,
332
--
1,33
21,
009
76%
357
Phok
wan
e1,
000
--
1,00
01,
000
--
1,00
037
538
%35
7Pi
xley
Ka
Sem
e1,
488
-2,
258
3,74
63,
746
--
3,74
61,
258
34%
9,47
7Pi
xley
Ka
Sem
e D
istr
ict
Mun
icip
ality
1,00
0-
-1,
000
1,00
0-
-1,
000
460
46%
-
Polo
kwan
e5,
446
--
5,44
65,
446
--
5,44
61,
866
34%
10,2
44Po
rt S
t Joh
ns
1,00
0-
-1,
000
1,00
0-
-1,
000
199
20%
966
Prin
ce A
lber
t1,
000
--
1,00
01,
000
--
1,00
0-
--

254 Department of Public Works | Annual Report 2012/13
Annexures to the Annual Financial Statementsfor the year ended 31 March 2013
NA
ME
OF
MU
NIC
IPA
LITY
GRA
NT
ALL
OCA
TIO
NTR
AN
SFER
SPEN
T20
11/1
2
Div
isio
n of
Re
venu
e A
ct
Roll
Ove
rsA
djus
t-m
ents
Tota
l A
vaila
ble
Act
ual
Tran
sfer
Fund
s W
ithh
eld
Re-a
llo-
cati
ons
by N
a-ti
onal
Tr
easu
ry
or N
a-ti
onal
D
epar
t-m
ent
Am
ount
Re
ceiv
ed
by
Mun
ici-
palit
y
Am
ount
Sp
ent b
y M
unic
i-pa
lity
% o
f A
vaila
ble
Fund
s Sp
ent b
y M
unic
i-pa
lity
Div
isio
n of
Re
venu
e A
ct
R’00
0R’
000
R’00
0R’
000
R’00
0R’
000
R’00
0R’
000
R’00
0%
R’00
0Ra
mot
sher
e M
oilo
a1,
000
-45
91,
459
1,45
9-
-1,
459
--
609
Rand
font
ein
1,00
0-
-1,
000
1,00
0-
-1,
000
--
2,00
9Ra
tlou
1,00
0-
531,
053
1,05
3-
-1,
053
1,60
215
2%60
9Re
nost
erbe
rg1,
000
--
1,00
01,
000
--
1,00
012
212
%96
6Ru
sten
burg
7,83
7-
-7,
837
7,83
7-
-7,
837
7,36
294
%8,
315
Sakh
isiz
we
1,00
0-
-1,
000
1,00
0-
-1,
000
1,07
310
7%35
7Sa
ldan
ha B
ay1,
997
--
1,99
71,
997
--
1,99
71,
979
99%
-Se
dibe
ng D
istr
ict
Mun
icip
ality
1,
000
39-
1,03
91,
039
--
1,03
961
359
%35
7
Senq
u 1,
857
--
1,85
71,
857
--
1,85
72,
900
156%
966
Sets
oto
1,09
0-
-1,
090
1,09
0-
-1,
090
3,20
529
4%7,
095
Siso
nke
Dis
tric
t M
unic
ipal
ity
3,02
8-
1,56
64,
594
4,59
4-
-4,
594
513
11%
1,97
5
Siya
nda
Dis
tric
t M
unic
ipal
ity1,
000
--
1,00
01,
000
--
1,00
071
271
%8,
888
Siya
them
ba1,
000
--
1,00
01,
000
--
1,00
01,
053
105%
966
Sol P
laat
je7,
659
-2,
919
10,5
7810
,578
--
10,5
7810
,170
96%
16,0
87St
elle
nbos
ch1,
041
--
1,04
11,
041
--
1,04
123
022
%-
Stev
e Ts
hwet
e1,
646
--
1,64
61,
646
--
1,64
637
123
%1,
259
Sund
ays
Rive
r Val
ley
1,00
0-
-1,
000
1,00
0-
-1,
000
722
72%
-Sw
artla
nd1,
000
--
1,00
01,
000
--
1,00
01,
000
100%
-Sw
elle
ndam
1,00
0-
-1,
000
1,00
0-
-1,
000
739
74%
357
Thab
a Ch
weu
1,00
0-
-1,
000
1,00
0-
-1,
000
4,97
649
8%96
6Th
abaz
imbi
1,51
4-
-1,
514
1,51
4-
-1,
514
1,05
870
%35
7Th
abo
Mof
utsa
nyan
a D
ist
Mun
icip
a 1,
737
--
1,73
71,
737
--
1,73
715
59%
1,34
7

Department of Public Works | Annual Report 2012/13 255
Annexures to the Annual Financial Statementsfor the year ended 31 March 2013
NA
ME
OF
MU
NIC
IPA
LITY
GRA
NT
ALL
OCA
TIO
NTR
AN
SFER
SPEN
T20
11/1
2
Div
isio
n of
Re
venu
e A
ct
Roll
Ove
rsA
djus
t-m
ents
Tota
l A
vaila
ble
Act
ual
Tran
sfer
Fund
s W
ithh
eld
Re-a
llo-
cati
ons
by N
a-ti
onal
Tr
easu
ry
or N
a-ti
onal
D
epar
t-m
ent
Am
ount
Re
ceiv
ed
by
Mun
ici-
palit
y
Am
ount
Sp
ent b
y M
unic
i-pa
lity
% o
f A
vaila
ble
Fund
s Sp
ent b
y M
unic
i-pa
lity
Div
isio
n of
Re
venu
e A
ct
R’00
0R’
000
R’00
0R’
000
R’00
0R’
000
R’00
0R’
000
R’00
0%
R’00
0Th
eew
ater
sklo
of99
4-
-99
499
4-
-99
42,
197
221%
1,13
4Th
embe
lihle
1,00
0-
-1,
000
1,00
0-
-1,
000
419
42%
-Th
embi
sile
991
-1,
872
2,86
32,
863
--
2,86
31,
206
42%
966
Thul
amel
a 1,
378
--
1,37
81,
378
--
1,37
81,
378
100%
2,29
1Tl
okw
e1,
000
--
1,00
01,
000
--
1,00
041
441
%96
6To
kolo
go
1,44
4-
-1,
444
1,44
4-
-1,
444
486
34%
357
Tsan
tsab
ane
1,00
0-
-1,
000
1,00
0-
-1,
000
841
84%
357
Tsol
wan
a 1,
000
--
1,00
01,
000
--
1,00
089
289
%35
7Ts
wai
ng1,
000
422
-1,
422
1,42
2-
-1,
422
--
966
Tsw
elop
ele
1,00
0-
-1,
000
1,00
0-
-1,
000
500
50%
357
Ubu
hleb
ezw
e 1,
000
--
1,00
01,
000
--
1,00
022
022
%-
Ubu
ntu
1,00
0-
-1,
000
1,00
0-
-1,
000
479
48%
357
Ugu
Dis
tric
t Mun
icip
ality
1,
000
--
1,00
01,
000
--
1,00
0-
-1,
802
Ukh
ahla
mba
Dis
tric
t M
unic
ipal
ity
1,94
0-
-1,
940
1,94
0-
-1,
940
259
13%
-
Ulu
ndi
1,00
0-
-1,
000
1,00
0-
-1,
000
--
-U
mdo
ni
1,00
0-
-1,
000
1,00
0-
-1,
000
2,83
828
4%-
Um
gung
undl
ovu
Dis
tric
t M
unic
ipal
ity
1,00
0-
-1,
000
1,00
0-
-1,
000
189
19%
-
Um
hlab
uyal
inga
na
1,00
0-
-1,
000
1,00
0-
-1,
000
--
-U
mhl
athu
ze
1,00
0-
-1,
000
1,00
0-
-1,
000
222%
-U
mjin
di1,
493
--
1,49
31,
493
--
1,49
31,
154
77%
357
Um
khan
yaku
de D
istr
ict
Mun
icip
ality
1,00
0-
821,
082
1,08
2-
-1,
082
--
17,3
69
Um
lala
zi
1,00
0-
-1,
000
1,00
0-
-1,
000
784
78%
-U
mso
bom
vu1,
000
--
1,00
01,
000
--
1,00
021
822
%-
Um
zim
khul
u 1,
000
--
1,00
01,
000
--
1,00
047
848
%35
7U
mzi
mvu
bu
1,41
7-
-1,
417
1,41
7-
-1,
417
2,89
420
4%96
6

256 Department of Public Works | Annual Report 2012/13
Annexures to the Annual Financial Statementsfor the year ended 31 March 2013
NA
ME
OF
MU
NIC
IPA
LITY
GRA
NT
ALL
OCA
TIO
NTR
AN
SFER
SPEN
T20
11/1
2
Div
isio
n of
Re
venu
e A
ct
Roll
Ove
rsA
djus
t-m
ents
Tota
l A
vaila
ble
Act
ual
Tran
sfer
Fund
s W
ithh
eld
Re-a
llo-
cati
ons
by N
a-ti
onal
Tr
easu
ry
or N
a-ti
onal
D
epar
t-m
ent
Am
ount
Re
ceiv
ed
by
Mun
ici-
palit
y
Am
ount
Sp
ent b
y M
unic
i-pa
lity
% o
f A
vaila
ble
Fund
s Sp
ent b
y M
unic
i-pa
lity
Div
isio
n of
Re
venu
e A
ct
R’00
0R’
000
R’00
0R’
000
R’00
0R’
000
R’00
0R’
000
R’00
0%
R’00
0U
mzi
nyat
hi D
istr
ict
Mun
icip
ality
1,
765
--
1,76
51,
765
--
1,76
560
034
%3,
537
Uph
ongo
lo
1,00
0-
-1,
000
1,00
0-
-1,
000
--
357
Uth
ukel
a D
istr
ict
Mun
icip
ality
2,
874
--
2,87
42,
874
--
2,87
451
2%11
,153
Uth
ungu
lu D
istr
ict
Mun
icip
ality
2,
651
-1,
304
3,95
53,
955
--
3,95
593
124
%4,
868
Vent
ersd
orp
1,00
0-
-1,
000
1,00
0-
-1,
000
883
88%
966
Vhem
be D
istr
ict
Mun
icip
ality
4,86
2-
-4,
862
4,86
2-
-4,
862
3,18
766
%6,
011
Wat
erbe
rg D
istr
ict
Mun
icip
ality
1,00
0-
-1,
000
1,00
0-
-1,
000
400
40%
966
Wes
t Coa
st D
istr
ict
Mun
icip
ality
1,00
063
-1,
063
1,06
3-
-1,
063
212%
357
Wes
t Ran
d D
istr
ict
Mun
icip
ality
1,
000
--
1,00
01,
000
--
1,00
021
021
%98
9
Wes
tona
ria
1,00
0-
-1,
000
1,00
0-
-1,
000
1,92
419
2%4,
682
Witz
enbe
rg1,
000
--
1,00
01,
000
--
1,00
010
010
%-
Xhar
iep
Dis
tric
t M
unic
ipal
ity
1,00
045
-1,
045
1,04
5-
-1,
045
525%
357
Zulu
land
Dis
tric
t M
unic
ipal
ity
1,00
0-
4,20
75,
207
5,20
7-
-5,
207
1,96
038
%1,
217
599,
240
17,3
9545
,500
662,
135
661,
535
600
-66
1 ,5
3540
0,75
5-
679,
583
The
Dep
artm
ent c
ertifi
es th
at a
ll tr
ansf
ers
wer
e in
term
s of
the
DO
RA A
ct a
nd d
epos
ited
into
the
prim
ary
bank
acc
ount
of t
he p
rovi
nce
or m
unic
ipal
ity.
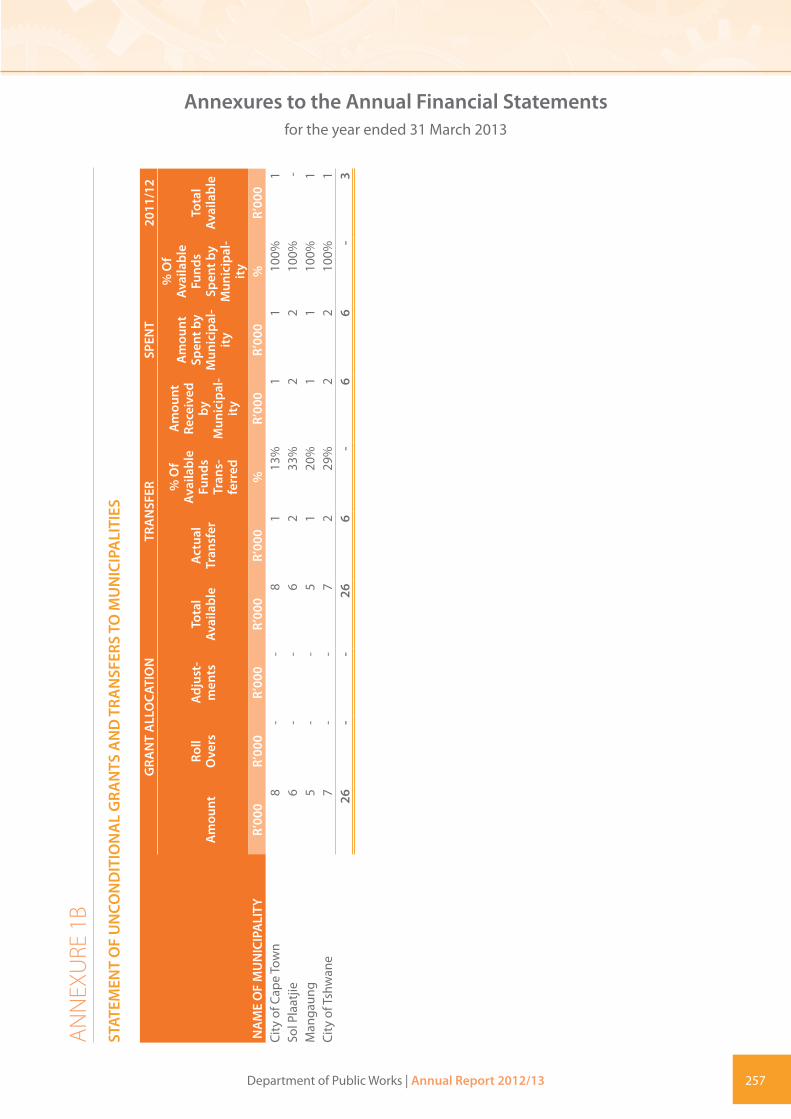
Department of Public Works | Annual Report 2012/13 257
Annexures to the Annual Financial Statementsfor the year ended 31 March 2013
AN
NEX
URE
1B
STAT
EMEN
T O
F U
NCO
ND
ITIO
NA
L G
RAN
TS A
ND
TRA
NSF
ERS
TO M
UN
ICIP
ALI
TIES
NA
ME
OF
MU
NIC
IPA
LITY
GRA
NT
ALL
OCA
TIO
NTR
AN
SFER
SPEN
T20
11/1
2
Am
ount
Roll
Ove
rsA
djus
t-m
ents
Tota
l Av
aila
ble
Act
ual
Tran
sfer
% O
f Av
aila
ble
Fund
s Tr
ans-
ferr
ed
Am
ount
Re
ceiv
ed
by
Mun
icip
al-
ity
Am
ount
Sp
ent b
y M
unic
ipal
-it
y
% O
f Av
aila
ble
Fund
s Sp
ent b
y M
unic
ipal
-it
y
Tota
l Av
aila
ble
R’00
0R’
000
R’00
0R’
000
R’00
0%
R’00
0R’
000
%R’
000
City
of C
ape
Tow
n8
--
81
13%
11
100%
1So
l Pla
atjie
6-
-6
233
%2
210
0%-
Man
gaun
g5
--
51
20%
11
100%
1Ci
ty o
f Tsh
wan
e7
--
72
29%
22
100%
126
--
266
-6
6-
3

258 Department of Public Works | Annual Report 2012/13
Annexures to the Annual Financial Statementsfor the year ended 31 March 2013
AN
NEX
URE
1C
STAT
EMEN
T O
F TR
AN
SFER
S TO
DEP
ART
MEN
TAL
AG
ENCI
ES A
ND
ACC
OU
NTS
DEP
ART
MEN
T/ A
GEN
CY/ A
CCO
UN
T
TRA
NSF
ER A
LLO
CATI
ON
TRA
NSF
ER20
11/1
2 A
djus
ted
App
ro-
pria
tion
Roll
Ove
rs A
djus
t-m
ents
Tot
al
Avai
labl
e A
ctua
l Tr
ansf
er
% o
f Ava
ilabl
e Fu
nds
Tran
sfer
red
App
ro-
pria
tion
Act
R’00
0R’
000
R’00
0R’
000
R’00
0%
R’00
0Co
nstr
uctio
n In
dust
ry D
evel
opm
ent
66,8
82-
732
67,6
1467
,614
100%
65,9
59Co
unci
l for
the
Built
Env
ironm
ent
27,4
38-
708
28,1
4628
,146
100%
28,6
59Pr
oper
ty M
anag
emen
t Tra
ding
Ent
ity64
6,84
9-
-64
6,84
964
6,84
910
0%63
0,18
9Co
nstr
uctio
n SE
TA2,
606
--
2,60
61,
260
48%
2,48
2Pa
rliam
enta
ry V
illag
e M
anag
emen
t Bo
ard
7,77
1-
-7,
771
7,77
110
0%7,
401
751,
546
-1,
440
752,
986
751,
640
734,
690

Department of Public Works | Annual Report 2012/13 259
Annexures to the Annual Financial Statementsfor the year ended 31 March 2013
AN
NEX
URE
1D
STAT
EMEN
T O
F TR
AN
SFER
S/SU
BSID
IES
TO P
UBL
IC C
ORP
ORA
TIO
NS
AN
D P
RIVA
TE E
NTE
RPRI
SES
NA
ME
OF
PUBL
IC
CORP
ORA
TIO
N/P
RIVA
TE E
NTE
R-PR
ISE
TRA
NSF
ER A
LLO
CATI
ON
EXPE
ND
ITU
RE20
11/1
2
Adj
uste
dA
ppro
pria
-ti
on A
ct
Roll
Ove
rsA
djus
t-m
ents
Tota
l A
vaila
ble
Act
ual
Tran
sfer
% o
f A
vaila
ble
Fund
s Tr
ans-
ferr
ed
Capi
tal
Curr
ent
App
ropr
ia-
tion
Act
R’00
0R’
000
R’00
0R’
000
R’00
0%
R’00
0R’
000
R’00
0Pu
blic
Cor
pora
tions
Tran
sfer
sIn
depe
nden
t Dev
elop
men
t Tru
st-
-50
,800
50,8
0050
,800
100%
--
150,
000
TOTA
L-
-50
,800
50,8
0050
,800
--
150,
000

260 Department of Public Works | Annual Report 2012/13
Annexures to the Annual Financial Statementsfor the year ended 31 March 2013
AN
NEX
URE
1E
STAT
EMEN
T O
F TR
AN
SFER
S TO
FO
REIG
N G
OVE
RNM
ENT
AN
D IN
TERN
ATIO
NA
L O
RGA
NIS
ATIO
NS
FORE
IGN
GO
VER
NM
ENT/
IN
TERN
ATIO
NA
L O
RGA
NIS
ATIO
N
TRA
NSF
ER A
LLO
CATI
ON
EXPE
ND
ITU
RE20
11/1
2
Adj
uste
d A
ppro
pria
tion
A
ctRo
ll ov
ers
Adj
ust-
men
tsTo
tal
Ava
ilabl
eA
ctua
l Tr
ansf
er
% o
f A
vaila
ble
Fund
s Tr
ansf
erre
d
App
ropr
iati
on
Act
R’00
0R’
000
R’00
0R’
000
R’00
0%
R’00
0Tr
ansf
ers
Com
mon
Wea
lth19
,441
-(5
00)
18,9
4115
,436
81%
14,3
89To
tal
19,4
41-
(500
)18
,941
15,4
3614
,389

Department of Public Works | Annual Report 2012/13 261
Annexures to the Annual Financial Statementsfor the year ended 31 March 2013
AN
NEX
URE
1F
STAT
EMEN
T O
F TR
AN
SFER
S TO
NO
N-P
ROFI
T IN
STIT
UTI
ON
S
NO
N-P
ROFI
T IN
STIT
UTI
ON
S
TRA
NSF
ER A
LLO
CATI
ON
EXPE
ND
ITU
RE20
11/1
2
Adj
uste
dA
ppro
pria
tion
A
ctRo
ll ov
ers
Adj
ust-
men
tsTo
tal
Ava
ilabl
eA
ctua
l Tr
ansf
er
% o
f A
vaila
ble
Fund
s tr
ansf
erre
d
App
ropr
iati
on
Act
R’00
0R’
000
R’00
0R’
000
R’00
0%
R’00
0Tr
ansf
ers
NPI
: Non
Sta
te S
ecto
r28
2,72
4-
-28
2,72
428
2,72
410
0%15
4,37
0AG
RÉM
ENT
SA-
--
-9,
903
-To
tal
282,
724
--
282,
724
292,
627
154,
370
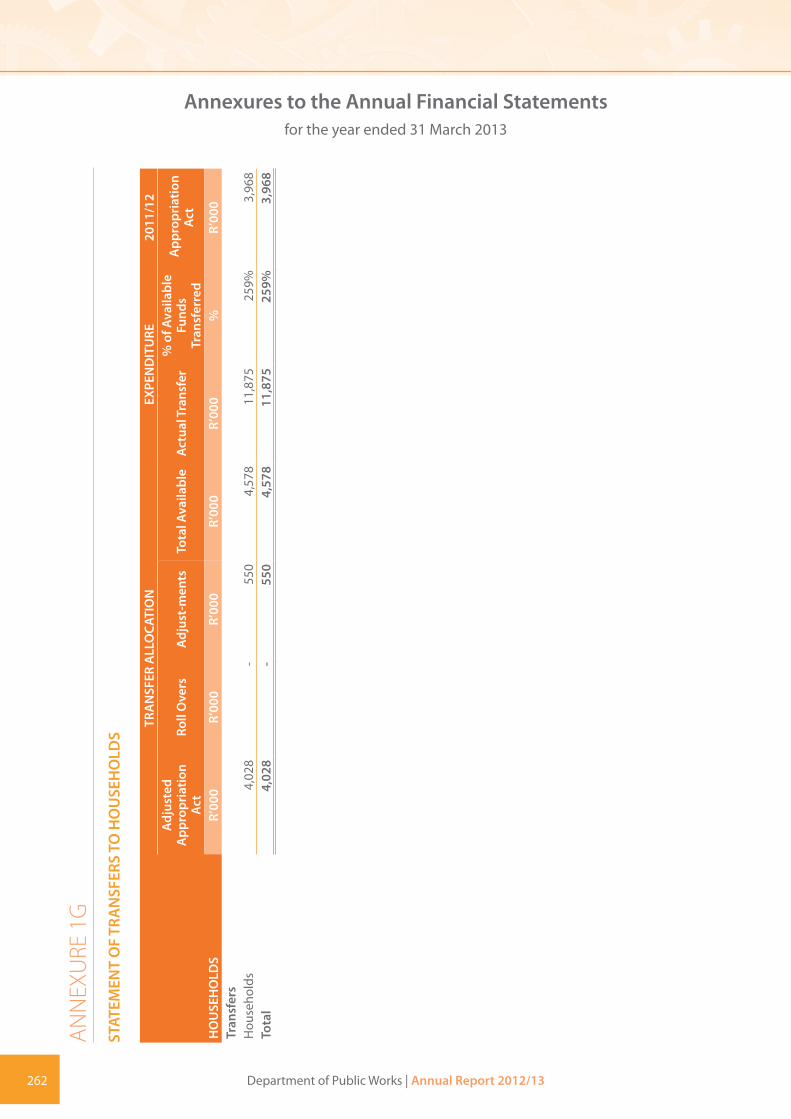
262 Department of Public Works | Annual Report 2012/13
Annexures to the Annual Financial Statementsfor the year ended 31 March 2013
AN
NEX
URE
1G
STAT
EMEN
T O
F TR
AN
SFER
S TO
HO
USE
HO
LDS
HO
USE
HO
LDS
TRA
NSF
ER A
LLO
CATI
ON
EXPE
ND
ITU
RE20
11/1
2A
djus
ted
App
ropr
iatio
n A
ctRo
ll O
vers
Adj
ust-
men
tsTo
tal A
vaila
ble
Act
ual T
rans
fer
% o
f Ava
ilabl
e Fu
nds
Tran
sfer
red
App
ropr
iatio
n A
ct
R’00
0R’
000
R’00
0R’
000
R’00
0%
R’00
0Tr
ansf
ers
Hou
seho
lds
4,02
8-
550
4,57
811
,875
259%
3,96
8To
tal
4,02
8-
550
4,57
811
,875
259%
3,96
8

Department of Public Works | Annual Report 2012/13 263
Annexures to the Annual Financial Statementsfor the year ended 31 March 2013
AN
NEX
URE
1H
STAT
EMEN
T O
F G
IFTS
, DO
NAT
ION
S A
ND
SPO
NSO
RSH
IPS
RECE
IVED
NA
ME
OF
ORG
AN
ISAT
ION
NAT
URE
OF
GIF
T, D
ON
ATIO
N O
R SP
ON
SORS
HIP
2012
/13
2011
/12
R’00
0R’
000
Rece
ived
in c
ash
Trav
el w
ith F
lair
Cont
ribut
ion
tow
ards
str
ateg
ic p
lann
ing
sess
ion
-5
Hla
tsw
anar
eCo
ntrib
utio
n to
war
ds s
trat
egic
pla
nnin
g se
ssio
n-
5M
aexe
cutiv
eCo
ntrib
utio
n to
war
ds s
trat
egic
pla
nnin
g se
ssio
n-
1-
11
Rece
ived
in k
ind
HAT
Spe
cial
ist
2800
of 5
00m
l Stil
l wat
er (R
8260
.00)
was
don
ated
for I
nter
-Reg
iona
l spo
rt to
urna
men
t ho
uste
d by
PLK
in S
ept 2
012
8-
Mau
nga
Proj
ects
Socc
er a
nd n
etba
ll ki
ts-
9Ts
epa
Cons
ultin
gTr
acks
uits
-11
Toko
logo
Din
ner
-4
Mah
esh-
Koos
al &
Ass
ocia
tes
Trac
ksui
ts-
12Ey
ethu
Eng
inee
rsSo
ccer
and
net
ball
kits
-9
SAIB
A E
ngin
eers
Net
ball
and
volle
ybal
l kits
-3
All
the
spon
sor
Spon
sors
and
Dep
artm
ent`
s Lo
gos
prin
ting
-5
Kasu
sCa
kes
dona
ted
for P
rest
ige
team
bui
ldin
g se
ssio
n-
-Su
btot
al8
53
Tota
l8
64

264 Department of Public Works | Annual Report 2012/13
Annexures to the Annual Financial Statementsfor the year ended 31 March 2013
AN
NEX
URE
1I
STAT
EMEN
T O
F G
IFTS
, DO
NAT
ION
S A
ND
SPO
NSO
RSH
IPS
MA
DE
AN
D R
EMM
ISSI
ON
S, R
EFU
ND
S A
ND
PAY
MEN
TS M
AD
E A
S A
N A
CT
OF
GRA
CE
NAT
URE
OF
GIF
T, D
ON
ATIO
N O
R SP
ON
SORS
HIP
(Gro
up m
ajor
cat
egor
ies
but l
ist m
ater
ial i
tem
s in
clud
ing
nam
e of
org
anis
atio
n20
12/1
320
11/1
2R’
000
R’00
0
Paid
in c
ash
Om
ega
Old
Age
Hom
e in
Blo
emfo
ntei
n (B
lank
ets
and
Cate
ring)
17-
Man
dela
Day
at M
mab
atho
with
Lon
ely
Park
Cre
che
Lear
ners
3-
TOTA
L20
-

Department of Public Works | Annual Report 2012/13 265
Annexures to the Annual Financial Statementsfor the year ended 31 March 2013
AN
NEX
URE
2A
STAT
EMEN
T O
F FI
NA
NCI
AL
GU
ARA
NTE
ES IS
SUED
AS
AT 3
1 M
ARC
H 2
013
– LO
CAL
Gua
rant
or In
stitu
tion
Gua
rant
ee
in R
espe
ct
of
Ori
gina
l G
uara
ntee
d Ca
pita
l A
mou
nt
Ope
ning
Ba
lanc
e 1
Apr
il 20
12
Gua
rant
ees
Dra
w D
owns
D
urin
g th
e Ye
ar
Gua
rant
ees
Repa
ymen
ts/
Canc
elle
d/
Redu
ced/
Re
leas
ed
Dur
ing
the
Year
Reva
lua-
tions
Clos
ing
Bala
nce
31
Mar
ch 2
013
Gua
rant
eed
Inte
rest
for
Year
End
ed
31 M
arch
20
13
Real
ised
Lo
sses
Not
Re
cove
rabl
e i.e
. Cla
ims
Paid
Out
R’00
0R’
000
R’00
0R’
000
R’00
0R’
000
R’00
0R’
000
Mot
or
vehi
cles
Stan
nic
299
582
-58
2-
--
-Su
btot
al29
958
2-
582
--
--
Hou
sing
Stan
dard
Ban
k21
293
-27
1-
22-
-N
edba
nk (C
ape
of G
ood-
hope
)-
10-
10-
--
-
Ned
bank
Lim
ited
1818
6-
168
-18
--
Firs
t Ran
d Ba
nk87
411
-32
4-
87-
-A
BSA
212
484
-27
2-
212
--
Uni
que
Fina
nce
-11
-11
--
--
Old
Mut
ual F
inan
ce-
17-
17-
--
-Pe
ople
s Ba
nk F
B-
84-
84-
--
-N
edba
nk LT
D (N
BS)
104
176
-72
-10
4-
-FN
B Fo
rmer
Saa
mbo
u48
82-
35-
47-
-O
ld M
utua
l (N
ed/P
erm
)31
283
-25
2-
31-
-VB
S M
utua
l Ban
k-
15-
15-
--
-N
P D
evel
op C
orp
-83
-83
--
--
NH
FC (M
asik
heni
)-
19-
19-
--
-Su
btot
al52
12,
154
-1,
633
-52
1-
-
TOTA
L82
02,
736
-2,
215
-52
1-
-

266 Department of Public Works | Annual Report 2012/13
Annexures to the Annual Financial Statementsfor the year ended 31 March 2013
AN
NEX
URE
2A
(con
tinue
d)ST
ATEM
ENT
OF
FIN
AN
CIA
L G
UA
RAN
TEES
ISSU
ED A
S AT
31
MA
RCH
201
3 –
FORE
IGN
Gua
rant
or In
stitu
tion
Gua
rant
ee
in R
espe
ct
of
Ori
gina
l G
uara
ntee
d Ca
pita
l A
mou
nt
Ope
ning
Ba
lanc
e 1
Apr
il 20
12
Gua
ran-
tees
Dra
w
Dow
ns
Dur
ing
the
Year
Gua
rant
ees
Repa
y-m
ents
/ Ca
ncel
led/
Re
duce
d/
Rele
ased
D
urin
g th
e Ye
ar
Reva
lua-
tions
Clos
ing
Bala
nce
31
Mar
ch 2
013
Gua
rant
eed
Inte
rest
for
Year
End
ed
31 M
arch
20
13
Real
ised
Lo
sses
Not
Re
cove
r-ab
le i.
e.
Clai
ms
Paid
O
ut
R’00
0R’
000
R’00
0R’
000
R’00
0R’
000
R’00
0R’
000
SA In
stitu
te o
f Arc
hite
ctur
eH
ousi
ng
of U
IA
Conf
eren
ce5,
445
2,35
5-
845
256
1,76
6
Tota
l5,
445
2,35
5-
845
256
1,76
6
Ope
ning
bal
ance
Ope
ning
bal
ance
has
bee
n re
stat
ed a
s in
dica
ted
in n
ote
18.

Department of Public Works | Annual Report 2012/13 267
Annexures to the Annual Financial Statementsfor the year ended 31 March 2013
AN
NEX
URE
2B
STAT
EMEN
T O
F CO
NTI
NG
ENT
LIA
BILI
TIES
AS
AT 3
1 M
ARC
H 2
013
Nat
ure
of L
iabi
lity
Liab
ilitie
s In
curr
ed
Dur
ing
the
Year
Liab
ilitie
s Pa
id/
Canc
elle
d/Re
duce
d D
urin
g th
e Ye
ar
Liab
ilitie
s Re
cove
rabl
e (P
rovi
de
Det
ails
H
ereu
nder
)
O
peni
ngCl
osin
g
Bala
nce
Bala
nce
1 A
pril
2012
31 M
arch
201
3R’
000
R’00
0R’
000
R’00
0R’
000
Clai
ms
agai
nst t
he D
epar
tmen
t
Mer
chan
t Wes
t Ass
et: C
laim
for A
rrea
rs o
n Le
ase
of a
pho
toco
pier
55
-
--
55CJ
Coe
tzee
: Cla
im fo
r dam
ages
cau
sed
by fi
re8,
691
--
-8,
691
Mul
ler:
Mot
or c
ollis
ion
256
109
--
365
Ism
ylin
e PT
Y LT
D: D
amag
e as
a re
sult
of fi
re2,
906
--
-2,
906
Ubu
ntu
Bran
ds: B
reac
h of
con
trac
t-
282
--
282
T.J P
hihl
ela:
Mot
or v
ehic
le a
ccid
ent
-21
--
21TG
Nai
doo:
Dam
ages
to v
ehic
le-
39-
-39
Rebe
cca
Seef
ane:
Cla
im fo
r dam
ages
-27
5-
-27
5TO
TAL
11,9
0872
6-
-12
,634
Ope
ning
bal
ance
Ope
ning
bal
ance
has
bee
n re
stat
ed a
s in
dica
ted
in n
ote
18.
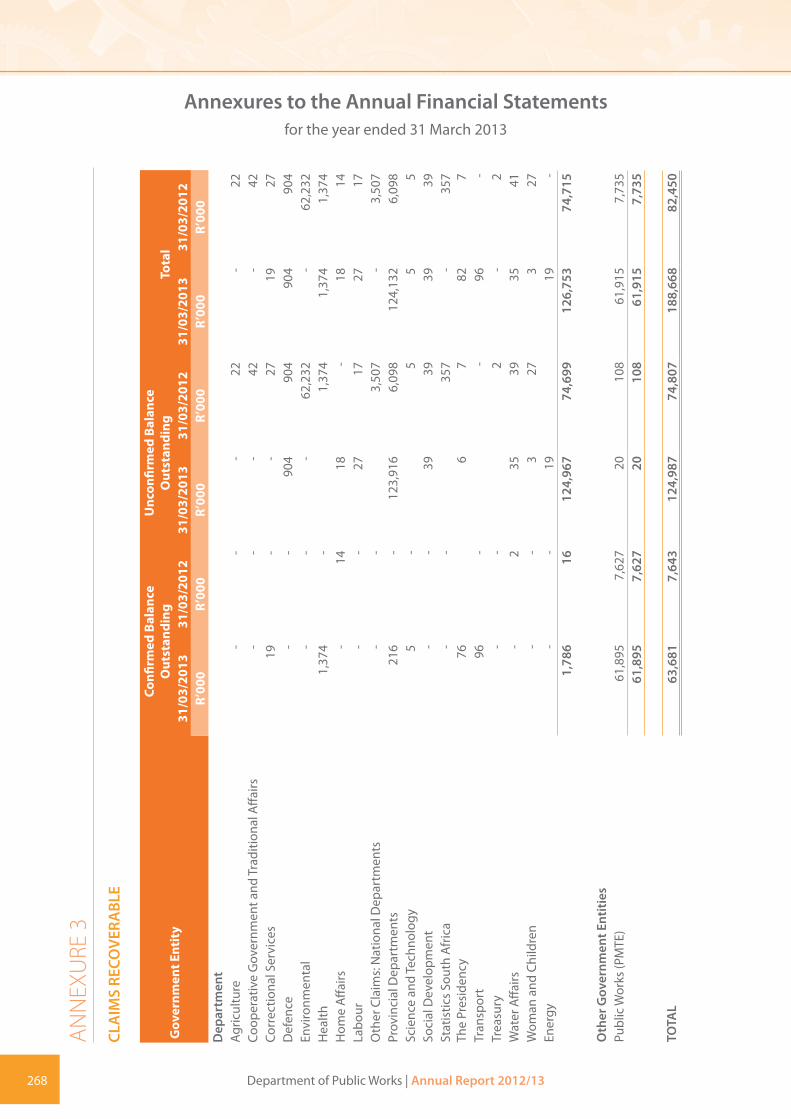
268 Department of Public Works | Annual Report 2012/13
Annexures to the Annual Financial Statementsfor the year ended 31 March 2013
AN
NEX
URE
3CL
AIM
S RE
COVE
RABL
E
Gov
ernm
ent E
ntit
y
Confi
rmed
Bal
ance
O
utst
andi
ngU
ncon
firm
ed B
alan
ce
Out
stan
ding
Tota
l31
/03/
2013
31/0
3/20
1231
/03/
2013
31/0
3/20
1231
/03/
2013
31/0
3/20
12R’
000
R’00
0R’
000
R’00
0R’
000
R’00
0D
epar
tmen
tAg
ricul
ture
--
-22
-22
Coop
erat
ive
Gov
ernm
ent a
nd T
radi
tiona
l Affa
irs-
--
42-
42Co
rrec
tiona
l Ser
vice
s19
--
2719
27D
efen
ce-
-90
490
490
490
4En
viro
nmen
tal
--
-62
,232
-62
,232
Hea
lth1,
374
-1,
374
1,37
41,
374
Hom
e A
ffairs
-14
18-
1814
Labo
ur-
-27
1727
17O
ther
Cla
ims:
Nat
iona
l Dep
artm
ents
--
3,50
7-
3,50
7Pr
ovin
cial
Dep
artm
ents
216
-12
3,91
66,
098
124,
132
6,09
8Sc
ienc
e an
d Te
chno
logy
5-
55
5So
cial
Dev
elop
men
t-
-39
3939
39St
atis
tics
Sout
h A
fric
aTh
e Pr
esid
ency
-76
-6
357 7
-82
357 7
Tran
spor
t96
--
96-
Trea
sury
--
2-
2W
ater
Affa
irs-
235
3935
41W
oman
and
Chi
ldre
n-
-3
273
27En
ergy
--
1919
-
1,78
616
124,
967
74,6
9912
6,75
374
,715
Oth
er G
over
nmen
t Ent
ities
Publ
ic W
orks
(PM
TE)
61,8
957,
627
2010
861
,915
7,73
561
,895
7,62
720
108
61,9
157,
735
TOTA
L63
,681
7,64
312
4,98
774
,807
188,
668
82,4
50

Department of Public Works | Annual Report 2012/13 269
Annexures to the Annual Financial Statementsfor the year ended 31 March 2013
AN
NEX
URE
4IN
TER-
GO
VERN
MEN
T PA
YABL
ES
GO
VERN
MEN
T EN
TITY
Confi
rmed
Bal
ance
O
utst
andi
ngU
ncon
firm
ed B
alan
ce
Out
stan
ding
TOTA
L31
/03/
2013
31/0
3/20
1231
/03/
2013
31/0
3/20
1231
/03/
2013
31/0
3/20
12R’
000
R’00
0R’
000
R’00
0R’
000
R’00
0D
EPA
RTM
ENTS
Curr
ent
Def
ence
504
--
-50
4-
Trad
e an
d In
dust
ry-
--
86-
86G
over
nmen
t Prin
ting
Wor
ks11
8-
5028
168
28Ju
stic
e an
d Co
nstit
utio
nal D
evel
opm
ent
6,02
42,
214
-2,
277
6,02
44,
491
Nat
iona
l Tre
asur
y-
-6
-6
-Pu
blic
Ser
vice
and
Adm
inis
trat
ion
--
-13
-13
Offi
ce o
f Pub
lic S
ervi
ce C
omm
issi
on
148
--
-14
8-
Rura
l Dev
elop
men
t and
Lan
d Re
form
10-
--
10-
Soci
al D
evel
opm
ent
22-
--
22-
Tran
spor
t 14
--
-14
-Ea
ster
n Ca
pe S
port
, Rec
reat
ion,
Art
s an
d Cu
lture
--
1-
1-
Pala
ma
--
756
-75
6-
East
ern
Cape
Hea
lth-
-24
-24
-G
aute
ng D
epar
tmen
t of R
oads
and
Tra
nspo
rt-
-45
9-
459
-To
tal
6,84
02,
214
1,29
52,
404
8,13
54,
618
OTH
ER G
OVE
RNM
ENT
ENTI
TYCu
rren
tPr
oper
ty M
anag
emen
t Tra
ding
Ent
ity (P
MTE
)78
,229
148,
945
5,23
636
,296
83,4
6518
5,24
1ID
T50
8-
--
508
-AG
SA4,
178
--
-4,
178
-To
tal o
ther
gov
ernm
ent e
ntiti
es82
,914
148,
945
5,23
636
,296
88,1
5018
5,24
1
TOTA
L IN
TERG
OV
ERN
MEN
TAL
89,7
5415
1,15
96,
531
38,7
0096
,286
189,
859
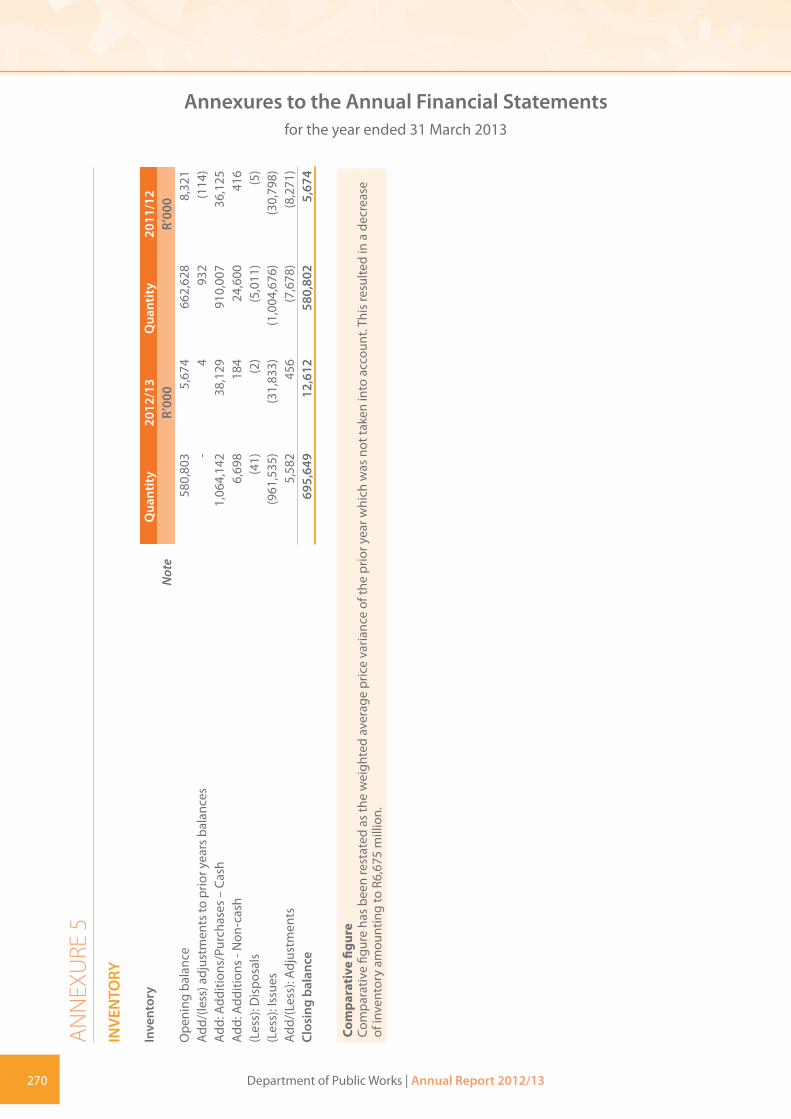
270 Department of Public Works | Annual Report 2012/13
Annexures to the Annual Financial Statementsfor the year ended 31 March 2013
AN
NEX
URE
5IN
VEN
TORY
Inve
ntor
yQ
uant
ity
2012
/13
Qua
ntit
y20
11/1
2N
ote
R’00
0R’
000
Ope
ning
bal
ance
580,
803
5,67
466
2,62
88,
321
Add/
(less
) adj
ustm
ents
to p
rior y
ears
bal
ance
s-
493
2(1
14)
Add:
Add
ition
s/Pu
rcha
ses
– Ca
sh1,
064,
142
38,1
2991
0,00
736
,125
Add:
Add
ition
s - N
on-c
ash
6,69
818
424
,600
416
(Les
s): D
ispo
sals
(41)
(2)
(5,0
11)
(5)
(Les
s): I
ssue
s(9
61,5
35)
(31,
833)
(1,0
04,6
76)
(30,
798)
Add/
(Les
s): A
djus
tmen
ts5,
582
456
(7,6
78)
(8,2
71)
Clos
ing
bala
nce
695,
649
12,6
1258
0,80
25,
674
Com
para
tive
figu
reCo
mpa
rativ
e fig
ure
has
been
rest
ated
as
the
wei
ghte
d av
erag
e pr
ice
varia
nce
of th
e pr
ior y
ear w
hich
was
not
take
n in
to a
ccou
nt. T
his
resu
lted
in a
dec
reas
e of
inve
ntor
y am
ount
ing
to R
6,67
5 m
illio
n.

Department of Public Works | Annual Report 2012/13 271
Annexures to the Annual Financial Statementsfor the year ended 31 March 2013
AN
NEX
URE
6M
OVE
MEN
T IN
CA
PITA
L W
ORK
IN P
ROG
RESS
MO
VEM
ENT
IN C
API
TAL
WO
RK IN
PRO
GRE
SS F
OR
THE
YEA
R EN
DED
31
MA
RCH
201
3O
peni
ng
Bala
nce
Curr
ent Y
ear
Capi
tal W
IPCo
mpl
eted
A
sset
sCl
osin
g Ba
lanc
eR’
000
R’00
0R’
000
R’00
0
BUIL
DIN
GS
AN
D O
THER
FIX
ED S
TRU
CTU
RES
Non
-res
iden
tial b
uild
ings
11,2
99,8
6471
3,00
3-
12,0
12,8
67
TOTA
L11
,299
,864
713,
003
-12
,012
,867

272 Department of Public Works | Annual Report 2012/13
AN
NEX
URE
7A
IN
TER-
ENTI
TY A
DVA
NCE
S PA
ID (n
ote
11)
Confi
rmed
Bal
ance
Unc
onfir
med
Bal
ance
Tota
l31
/03/
2013
31/0
3/20
1231
/03/
2013
31/0
3/20
1231
/03/
2013
31/0
3/20
12R’
000
R’00
0R’
000
R’00
0R’
000
R’00
0PU
BLIC
EN
TITI
ESIn
depe
nden
t Dev
elop
men
t Tru
st26
,576
33,9
92-
-26
,576
33,9
92G
over
nmen
t Com
mun
icat
ion
Info
rmat
ion
Syst
ems
1,07
2-
--
1,07
2-
TOTA
L27
,648
33,9
92-
-27
,648
33,9
92

Department of Public Works | Annual Report 2012/13 273
Notes to the Annual Financial Statementsfor the year ended 31 March 2013
AN
NEX
URE
7B
INTE
R-EN
TITY
AD
VAN
CES
RECE
IVED
(not
e 18
AN
D n
ote
19)
Confi
rmed
Bal
ance
Unc
onfir
med
Bal
ance
Tota
l31
/03/
2013
31/0
3/20
1231
/03/
2013
31/0
3/20
1231
/03/
2013
31/0
3/20
12R’
000
R’00
0R’
000
R’00
0R’
000
R’00
0N
ATIO
NA
L D
EPA
RTM
ENTS
Curr
ent
Hig
her E
duca
tion
and
Trai
ning
46,8
06-
-47
,019
46,8
0647
,019
Oth
er-
--
23-
23D
efen
ce-
--
82-
82PM
TE-
--
1-
1So
cial
Dev
elop
men
t-
--
13-
13W
ater
Affa
irs-
--
5,00
8-
5,00
8Su
btot
al46
,806
--
52,1
4646
,806
52,1
46
PRO
VIN
CIA
L D
EPA
RTM
ENTS
East
ern
Cape
Dep
artm
ent o
f Roa
ds a
nd P
ublic
Wor
ks10
,000
--
-10
,000
-Ea
ster
n Ca
pe-
--
2-
2G
aute
ng-
--
222,
596
-22
2,59
6Kw
azul
u N
atal
--
-1
-1
Lim
popo
--
-29
-29
Mpu
mal
anga
--
-12
0-
120
Nor
th W
est
--
-16
4-
164
Nor
ther
n Ca
pe-
--
47-
47W
este
rn C
ape
--
-20
-20
Subt
otal
10,0
00-
-22
2,97
910
,000
222,
979
PUBL
IC E
NTI
TIES
Inde
pend
ent D
evel
opm
ent T
rust
674
--
742
674
742
Oth
er
--
-7
-7
Parli
amen
tary
Vill
age
--
-86
-86
Subt
otal
674
--
835
674
835
TOTA
L57
,480
--
275,
960
57,4
8027
5,96
0

274 Department of Public Works | Annual Report 2012/13
Notes to the Annual Financial Statementsfor the year ended 31 March 2013

Department of Public Works | Annual Report 2012/13 275
PART B
PROPERTY MANAGEMENT TRADING ENTITYAnnual Financial Statements
for the year ended 31 March 2013

276 Department of Public Works | Annual Report 2012/13
IndexThe reports and statements set out below comprise the financial statements:
Index Page
Report of the Auditor-General 277
Statement of Financial Position 283
Statement of Financial Performance 284
Statement of Changes in Net Assets 285
Cash Flow Statement 286
Statement of Comparison of Budget and Actual Amounts 287
Accounting Policies 288 - 299
Notes to the Financial Statements 300 - 328
The financial statements set out on pages 283 to 328, which have been prepared on the going concern basis, were approved by on 31 May 2013:
Mr. Mziwonke Dlabantu
Director-General

Department of Public Works | Annual Report 2012/13 277
Report of the Auditor-General to Parliament on the Property Management Trading Entity
Report on the financial statements Introduction
1. I was engaged to audit the financial statements of the Property Management Trading Entity set out on pages 283 to 328, which comprise the statement of financial position as at 31 March 2013, the statement of financial performance, statement of changes in net assets, the cash flow statement and the statement of comparison of budget and actual amounts for the year then ended, and the notes, comprising a summary of significant accounting policies and other explanatory information.
Accounting officer’s responsibility for the financial statements
2. The accounting officer is responsible for the preparation and fair presentation of these financial statements in accordance with Standards of Generally Recognised Accounting Practice (GRAP) and the requirements of the Public Finance Management Act of South Africa, 1999 (Act No. 1 of 1999) (PFMA), and for such internal control as the accounting officer determines is necessary to enable the preparation of financial statements that are free from material misstatement, whether due to fraud or error.
Auditor-General’s responsibility
3. My responsibility is to express an opinion on these financial statements based on my audit. I conducted my audit in accordance with the Public Audit Act of South Africa, 2004 (Act No. 25 of 2004) (PAA), the general notice issued in terms thereof and International Standards on Auditing. Because of the matters described in the Basis for disclaimer of opinion paragraphs, however, I was unable to obtain sufficient appropriate audit evidence to provide a basis for an audit opinion.
Basis for disclaimer of opinion
Irregular expenditure
4. Section 38(1)(a)(iii) of the PFMA requires the entity to implement and maintain an appropriate procurement and provisioning system that is fair, equitable, transparent, competitive and cost-effective. Furthermore, section 40(3)(b)(i) of the PFMA requires the entity to include particulars of all irregular expenditure that had occurred during the financial year in its financial statements.
5. I was unable to obtain sufficient appropriate audit evidence for irregular expenditure as the entity did not have an adequate system for identifying and recognising all irregular expenditure. I was unable to confirm the irregular expenditure amount by alternative means. Consequently, I was unable to determine whether any adjustment relating to irregular expenditure stated at R2 609 711 000 (2012: R1 410 817 000) in note 22 to the financial statements was necessary.
Fruitless and wasteful expenditure
6. Section 40(3)(b)(i) of the PFMA requires the entity to include particulars of all fruitless and wasteful expenditure that had occurred during the financial year in its financial statements.
7. I was unable to obtain sufficient appropriate audit evidence for fruitless and wasteful expenditure as the entity did not have an adequate system for identifying and recognising all fruitless and wasteful expenditure. I was unable to confirm the fruitless and wasteful expenditure amount by alternative means. Consequently, I was unable to determine whether any adjustment relating to fruitless and wasteful expenditure stated at R254 514 000 (2012: R239 311 000) in note 21 to the financial statements was necessary.

278 Department of Public Works | Annual Report 2012/13
Report of the Auditor-General to Parliament on the Property Management Trading Entity (continued)
Receivables and revenue from exchange transactions
8. I was unable to obtain sufficient appropriate audit evidence that management had properly charged and accounted for receivables and revenue for accommodation charges: leasehold due to the status of the accounting records. Some of the lease agreements were not available for audit purposes. Furthermore, the amounts disclosed are based on data from the Property Management Information System (PMIS), which did not agree with information per actual signed lease agreements.
9. In addition, I was unable to obtain sufficient appropriate audit evidence regarding construction revenue because the entity was unable to provide sufficient appropriate audit evidence in support of the amount recorded.
10. I was unable to confirm the amounts by alternative means. Consequently, I was unable to determine whether any adjustment to the following items in the financial statements was necessary:
• Accommodation charges: leasehold receivable stated at R473 509 000 (2012: R450 400 000) in note 3.
• Prepaid expenses stated at R339 082 000 (2012: R88 490 000) in note 3.
• Construction contracts receivables stated at R292 497 000 (2012: R396 378 000) in note 5.
• Accommodation charges: leasehold revenue stated at R3 113 217 000 (2012: R2 968 905 000) in note 14.
• Construction revenue stated at R2 351 326 000 (2012: R3 017 957 000) in note 14.
Operating lease assets and associated liabilities
11. I was unable to obtain sufficient appropriate audit evidence that management had properly accounted for operating lease assets and associated liabilities as well as operating lease commitments due to the status of the accounting records. Some of the lease agreements were not available for audit purposes. Furthermore, the amounts disclosed are based on data from the Property Management Information System (PMIS), which did not agree with information per actual signed lease agreements.
12. I was unable to confirm the amounts by alternative means. Consequently, I was unable to determine whether any adjustment to the following items in the financial statements was necessary:
· Operating lease assets and liabilities stated at R892 499 000 (2012: R859 393 000) in note 6.
· Operating lease commitments stated at R7 154 054 000 (2012: R8 642 128 000) in note 6.
· Accruals stated at R 1 112 729 000 (2012: R905 187 561 000) in note 9.
· Operating leases expenditure stated at R3 341 967 000 (2012: R3 315 087 000) in note 16.
Retention liability
13. The entity did not correctly recognise all outstanding amounts meeting the definition of a liability in accordance with Generally Recognised Accounting Practice, GRAP 1, Presentation of financial statements. Consequently, retention liability is misstated by an estimated amount of R156 142 482 (2012: R282 778 068). There is also a consequential impact on construction expenditure and the accumulated surplus.
Disclaimer of opinion
14. Because of the significance of the matter described in the Basis for disclaimer of opinion paragraph, I have not been able to obtain sufficient appropriate audit evidence to provide a basis for an audit opinion. Accordingly, I do not express an opinion on the financial statements.

Department of Public Works | Annual Report 2012/13 279
Report of the Auditor-General to Parliament on the Property Management Trading Entity (continued)
Emphasis of matter
15. I draw attention to the matters below. My opinion is not modified in respect of these matters.
Going concern
16. Note 1.6 to the financial statements indicates that as of 31 March 2013, the PMTE is in a net liability position. This condition, along with other matters as set forth in note 1.6, indicates the existence of a material uncertainty that may cast significant doubt on the trading entity’s ability to operate as a going concern.
Restatement of corresponding figures
17. As disclosed in note 29 to the financial statements, the corresponding figures for 31 March 2012 have been restated as a result of errors discovered during 2013 in the financial statements of the Property Management Trading Entity at, and for the year ended, 31 March 2012.
Material impairments
18. As disclosed in note 3 to the financial statements, material impairments to the amount of R82 971 000 were provided for as a result of irrecoverable receivables.
REPORT ON OTHER LEGAL AND REGULATORY REQUIREMENTS
19. In accordance with the PAA and the general notice issued in terms thereof, I report the following findings relevant to performance against predetermined objectives, compliance with laws and regulations and internal control, but not for the purpose of expressing an opinion.
Compliance with laws and regulations
20. I performed procedures to obtain evidence that the entity had complied with applicable laws and regulations regarding financial matters, financial management and other related matters. My findings on material non-compliance with specific matters in key applicable laws and regulations, as set out in the general notice issued in terms of the PAA, are as follows:
Strategic planning and performance management
21. The accounting officer of the Department of Public Works did not finalise and approve the business case for running the trading entity and consequently did not formulate a policy and reporting framework for the head of the trading entity in accordance with the requirements of Treasury Regulation 19.3.1.
Annual financial statements, performance and annual reports
22. The financial statements submitted for auditing were not prepared in accordance with the prescribed financial reporting framework and supported by full and proper records, as required by section 40(1)(a) and (b) of the PFMA.
Material misstatements of accruals and expenditure identified by the auditors in the submitted financial statements were subsequently corrected and the supporting records provided, but the uncorrected material misstatements and supporting records that could not be provided resulted in the financial statements receiving a disclaimer of audit opinion.

280 Department of Public Works | Annual Report 2012/13
Procurement and contract management
23. Goods and services with a transaction value of below R500 000 were in certain instances procured without obtaining the required number of price quotations, as required by Treasury Regulation 16A6.1.
24. Goods and services of a transaction value of above R500 000 were in certain instances procured without inviting competitive bids, as required by Treasury Regulations 16A6.1. A number of deviations were approved even though it was not impractical to invite competitive bids, in contravention of Treasury Regulation 16A6.4.
25. Construction projects were not always registered with the Construction Industry Development Board (cidb), as required by section 22 of the cidb Act and cidb regulation 18.
26. Persons in service of the trading entity who had a private or business interest in contracts awarded by the trading entity failed to disclose such interest, as required by Treasury Regulation 16A8.4 and Public Service Regulation 3C.
27. Persons in service of the trading entity who had a private or business interest in contracts awarded by the trading entity participated in the process relating to that contract, in contravention of Treasury Regulation 16A8.4.
28. Allegations of fraud, corruption, improper conduct and failure to comply with the supply chain management system made against officials and role players in the supply chain management system were not in all instances investigated as required by Treasury Regulation 16A9.1(b).
29. Appropriate action was not in all instances taken against officials and role players in the supply chain management system where investigations proved fraud and corruption, improper conduct and failure to comply with the supply chain management system, as required by Treasury Regulation 16A9.1(b)(i).
30. Sufficient appropriate audit evidence could not be obtained that all contracts and quotations were awarded in accordance with the legislative requirements as the entity did not implement proper record keeping in a timely manner to ensure that complete, relevant and accurate information was accessible and available to evaluate compliance.
Expenditure management
31. The accounting officer did not take effective steps to prevent irregular and fruitless and wasteful expenditure, as required by section 38(1)(c)(ii) of the PFMA and Treasury Regulation 9.1.1.
32. Effective and appropriate disciplinary steps were not taken against officials who made or permitted irregular expenditure, as required by section 38(1)(h)(iii) of the PFMA and Treasury Regulation 9.1.3.
Revenue management
33. The accounting officer did not develop and implement appropriate processes that provide for the identification, collection, recording, reconciliation and safeguarding of information about revenue to ensure that all money due to the trading entity was collected as per the requirements of section 38(1)(c)(ii) of the PFMA and Treasury Regulation 7.2.1.
34. The accounting officer did not take effective and appropriate steps to collect all money due, as required by section 38(1)(c)(i) of the PFMA and Treasury Regulations 11.2.1, 15.10.1.2(a) and 15.10.1.2(e).
Report of the Auditor-General to Parliament on the Property Management Trading Entity (continued)

Department of Public Works | Annual Report 2012/13 281
Financial misconduct
35. Investigations were not conducted into all allegations of financial misconduct committed by officials, as required by Treasury Regulation 4.1.1.
36. Investigations into allegations of financial misconduct against officials were not instituted within 30 days of discovery thereof, as required by Treasury Regulation 4.1.2.
37. Disciplinary hearings were not held for financial misconduct committed by officials, as required by Treasury Regulation 4.1.1.
Banking and cash management
38. The entity’s main bank account was overdrawn throughout the reporting period, in contravention of Treasury Regulation 19.2.3.
Internal control
39. I considered internal control relevant to my audit of the financial statements and compliance with laws and regulations. The matters reported below under the fundamentals of internal control are limited to the significant deficiencies that resulted in the basis for disclaimer of opinion and the findings on compliance with laws and regulations included in this report.
Leadership
40. Certain critical appointments were only made in the last quarter of the financial year, thus instability in key leadership positions for the first part of the financial year had a negative impact in providing effective leadership in the department.
41. Leadership did not exercise effective oversight of financial and performance reporting and compliance and related internal controls.
42. Leadership did not apply effective consequence management for transgressions with regard to non-performance and non-compliance throughout the financial year.
43. Leadership did not in all instances establish and communicate policies and procedures to enable and support the understanding and execution of internal objectives, processes and responsibilities.
Financial and performance management
44. Proper record keeping was not always implemented in a timely manner to ensure that complete, relevant and accurate information was accessible and available to support financial and performance reporting.
45. Implemented controls over daily and monthly processing and reconciling of transactions were not effective in all instances.
46. Regular, accurate and complete financial and performance reports supported and evidenced by reliable information were not prepared throughout the year.
47. The review and monitoring of compliance with applicable laws and regulations were ineffective.
Report of the Auditor-General to Parliament on the Property Management Trading Entity (continued)

282 Department of Public Works | Annual Report 2012/13
Governance
48. Risk management activities, including the consideration of IT risks and fraud prevention, were not effectively conducted. A risk strategy to address identified risks was not developed and monitored throughout the financial year.
49. The internal audit unit was not adequately resourced to ensure that it could effectively assist in identifying internal control deficiencies and developing recommendations in respect of corrective action to be taken to address the internal control deficiencies identified. This has also resulted in the continued backlog in internal investigations.
OTHER REPORTS
Investigations
50. Numerous internal allegations, mainly relating to transgressions with respect to supply chain management, potential fraud and financial misconduct, are investigated on an ongoing basis.
51. An ongoing investigation is being conducted to probe the alleged abuse of urgent and emergency procurement as well the utilisation of sole suppliers. The investigation aims to establish whether there was collusion between officials and service providers and to determine any reckless spending of funds. The investigation is being conducted in phases, with nine reports having been finalised to date, while the majority were still ongoing at the reporting date. The department is in the process of instituting disciplinary action in respect of the finalised reports.
Pretoria
16 / 9 / 2013
Report of the Auditor-General to Parliament on the Property Management Trading Entity (continued)

Department of Public Works | Annual Report 2012/13 283
Note 2013Restated
2012R’000 R’000
Statement of Financial Positionas at 31 March 2013
AssetsCurrent AssetsReceivables from exchange transactions 3 2 062 804 1 527 646Receivables from non-exchange transactions 4 1 730 1 445Construction contracts receivables 5 292 497 396 378Operating lease assets 6 892 499 859 393Cash and cash equivalents 8 829 1 399
3 250 359 2 786 261
Non-Current AssetsFinance lease receivables 7 33 548 30 803Total Assets 3 283 907 2 817 064
LiabilitiesCurrent LiabilitiesOperating lease liabilities 6 892 499 859 393Payables from exchange transactions 9 1 548 024 1 422 356Bank overdraft 8 1 402 323 1 254 988Retention liabilities 10 75 798 68 240Employee benefit obligations 11 1 730 1 445
3 920 374 3 606 422
Non-Current LiabilitiesRetention liabilities 10 264 759 268 063Provisions 12 34 029 34 029Finance lease obligations 13 33 548 30 803
332 336 332 895Total Liabilities 4 252 710 3 939 317Total Net Liabilities (968 803) (1 122 253)
Net AssetsReservesAccumulated deficit (968 803) (1 122 253)Net Assets (968 803) (1 122 253)

284 Department of Public Works | Annual Report 2012/13
Note 2013Restated
2012R’000 R’000
Statement of Financial Performancefor the year ended 31 March 2013
RevenueRevenue from exchange transactions 14 9 072 859 9 417 889Revenue from non-exchange transactions 15 673 233 649 357Total revenue 9 746 092 10 067 246
ExpensesOperating expenses 16 9 570 713 10 788 275Finance costs 17 4 060 3 988Employee costs 18 17 869 12 893Total expenses 9 592 642 10 805 156Surplus / (deficit) for the year 153 450 (737 910)

Department of Public Works | Annual Report 2012/13 285
Statement of Changes in Net Assetsfor the year ended 31 March 2013
NoteAccumulated
deficitTotal net
assetsR’000 R’000
Opening balance as previously reported 128 134 128 134Prior year adjustments 29 (512 473) (512 473)Balance at 01 April 2011 as restated (384 339) (384 339)Changes in net assetsPrior period error 29 (1 015 423) (1 015 423) Surplus for the year as previously stated 277 513 277 513Total changes: Surplus for the year as restated (737 910) (737 910)Balance as at 1 April 2012 previously reported 405 647 405 647AdjustmentsPrior period error 29 (1 527 900) (1 527 900)Balance as at 1 April 2012 restated (1 122 253) (1 122 253)Changes in net assetsSurplus for the year 153 450 153 450Balance at 31 March 2013 (968 803) (968 803)

286 Department of Public Works | Annual Report 2012/13
Note 2013Restated
2012R’000 R’000
Cash Flow Statementfor the year ended 31 March 2013
Cash flows from operating activities
ReceiptsAccommodation charges - freehold 3 424 556 3 301 804Accommodation charges - lease hold 2 718 328 2 565 199Augmentation 646 849 630 189Contractor fines 7 125 5 077Recoveries 18 650 12 362Municipal services management fee 157 622 140 074Interest received 21 055 16 659
6 994 185 6 671 364
PaymentsFinance costs (308) (541)Bank charges (122) (67)Bursaries and advisory services (4 291) (4 560)Cleaning and gardening (158 380) (165 436)Municipal services (242) (58)Operating leases (3 109 723) (2 896 859)Planned maintenance (capital) (550 284) (557 281)Planned maintenance (current) (166 075) (149 718)Property rates (788 675) (513 222)Rent on land (12 221) (10 848)Security (38 439) (40 807)Tender advertisements (41) (72)Thefts and losses (22 554) (26 692)Unplanned maintenance (2 290 735) (2 221 677)
(7 142 090) (6 587 838)
Net cash flows from operating activities 19 (147 905) 83 526
Cash flows from financing activities
Finance lease payments (1 007) (938)Finance lease receipts 1 007 938Net cash flows from financing activities - -
Net increase/(decrease) in cash and cash equivalents (147 905) 83 526Cash and cash equivalents at the beginning of the year (1 253 589) (1 337 115)Cash and cash equivalents at the end of the year 8 (1 401 494) (1 253 589)

Department of Public Works | Annual Report 2012/13 287
Statement of Comparison of Budget and Actual Amountsfor the year ended 31 March 2013
Approved budget Adjustments Final Budget
Actual amounts on comparable
basis
Difference between
final budget and actual
R’000 R’000 R’000 R’000 R’000
Statement of Financial PerformanceRevenueManagement fees on municipal services recovery 124 155 22 705 146 860 157 622 10 762
Fines - 7 125 7 125 7 125 - Accommodation charges - freehold properties 3 429 892 - 3 429 892 3 424 556 (5 336)
Accommodation charges - leasehold properties 3 171 275 (48 071) 3 123 204 2 718 328 (404 876)
Augmentation 646 849 - 646 849 646 849 -Recoveries - 18 650 18 650 18 650 -Interest received 5 000 (3 978) 1 022 21 055 20 033Total revenue 7 377 171 (3 569) 7 373 602 6 994 185 (379 417)
ExpenditureAdvisory services 7 000 (5 000) 2 000 1 929 (71) Bank charges 70 55 125 122 (3) Bursaries 7 000 - 7 000 2 362 (4 638) Cleaning and gardening 223 771 (46 793) 176 978 158 380 (18 598) Computer services - 99 510 99 510 - (99 510) Interest paid 3 000 (2 680) 320 308 (12) Municipal services 3 000 (2 750) 250 242 (8) Operating leases 3 155 170 (44 833) 3 110 337 3 109 723 (614) Planned maintenance (capital) 887 712 (85 159) 802 553 550 284 (252 269) Planned maintenance (current) 1 552 777 65 952 1 618 729 166 075 (1 452 654) Property rates 716 876 72 054 788 930 788 675 (255) Rent on land 16 105 (3 405) 12 700 12 221 (479) Security 49 505 (9 505) 40 000 38 439 (1 561) Tender advertisements 85 (42) 43 41 (2) Thefts and losses - 23 000 23 000 22 554 (446) Unplanned maintenance 755 100 (63 973) 691 127 2 290 735 1 599 608Total expenditure (7 377 171) 3 569 (7 373 602) (7 142 090) 231 512Cash deficit - - - (147 905) (147 905)
Refer to note 30 for reconciliations and explanations for budget differences.
Accounting Policiesfor the year ended 31 March 2013
288 Department of Public Works | Annual Report 2012/13
1. Presentation of Financial Statements1.1 Statement of Compliance
The annual financial statements have been prepared in accordance with the Standards of Generally Recognised Accounting Practice (“GRAP”) including any interpretations and directives issued by the Accounting Standards Board (“ASB”).
1.2 Adoption of GRAP
The Property Management Trading Entity (“PMTE”) adopted GRAP for the first time in the current financial year in accordance with Directive 9, issued November 2011 by the ASB. The adoption of GRAP resulted in the reclassification and remeasurement of certain items. The PMTE applied Statements of Generally Accepted Accounting Practice (“SA GAAP”) previously. Refer to notes 28 and 29.
The Standards of GRAP included in Annexure G of Directive 5 were applied in developing appropriate accounting policies for PMTE in so far as the Standards are applicable to the transactions of the PMTE.
In addition to the Standards that have to be applied, the PMTE early adopted the amendments to the Standards made as a result of the improvements projects of the ASB in so far as it is applicable to the transactions of the PMTE. The applicable Standards, effective from 1 April 2013 are listed below:
GRAP 1 Presentation of Financial Statements
GRAP 3 Accounting Policies, Change in Accounting Estimates and Errors
GRAP 7 Investments in Associates
GRAP 9 Revenue from Exchange Transactions
GRAP 12 Inventories
GRAP 13 Leases
GRAP 17 Property, Plant and Equipment
1.3.Standards of GRAP issued but not yet effective
The following Standards of GRAP that have been issued by the ASB, but where the Minister of Finance has not determined an effective date, have not been adopted by the PMTE:
1.3.1 Standard utilised in developing accounting policies
The PMTE utilised GRAP 25 - Employee Benefits in developing its accounting policies.
As a result, there will be no impact on the measurement of employee benefits when the Standard becomes effective.
1.3.2 Standards utilised in developing disclosures
The PMTE has utilised GRAP 20 - Related Party Disclosure.
As a result, there will be no impact on the disclosure of related parties when the Standard becomes effective.
Accounting Policiesfor the year ended 31 March 2013
Department of Public Works | Annual Report 2012/13 289
1.3.3 Standards not yet applicable
Accounting policies have not been developed for the following Standards as the transactions and events within the scope of these Standards were not yet applicable:
GRAP 18 - Segment reporting.
GRAP 105 - Transfer of functions between entities under common control.
GRAP 18:
Segments are identified by the way in which information is reported to management, both for purpose of assessing performance and making decisions about how future resources will be allocated to the various activities undertaken by the PMTE. The major classifications of activities identified in budget documentation will usually reflect the segments for which the PMTE reports information to management.
Segment information is either presented based on service or geographical segments. Service segments relate to a distinguishable component of the PMTE that provides specific outputs or achieves particular operating objectives that are in line with the PMTE’s overall mission. Geographical segments relate to specific outputs generated or particular objectives achieved, by the PMTE within a particular region.
The adoption of this Standard is not expected to have an impact on the results of the PMTE, but may result in more disclosure than is currently provided in the financial statements.
Directive 2, containing the transitional provisions applicable to the PMTE, does not require comparative segment information on initial adoption of this Standard.
This Standard has been approved by the ASB but its effective date has not been determined by the Minister of Finance. The effective date indicated is a provisional date and could change depending on the decision of the Minister of Finance.
GRAP 105:
The objective of this Standard is to establish accounting principles for the acquirer and transferor in a transfer of functions between entities under common control.
It requires an acquirer and a transferor that prepares and presents financial statements under the accrual basis of accounting to apply this Standard to a transaction or event that meets the definition of transfer of functions.
It furthermore covers definitions, identifying the acquirer and transferor, determining the transfer date, assets acquired or transferred and liabilities assumed or relinquished, accounting by the acquirer and transferor, disclosure, transitional provisions as well as the effective date of the Standard.
The PMTE is expecting, as a result of the planned transfer of functions from the Department of Public Works (“DPW”) to the PMTE, to recognise the associated assets and liabilities, income and expenses from these functions in its 31 March 2014 financial statements. The expected impact is not yet determinable.
It is unlikely that the following Standards and/or amendments to Standards, that has been issued but are not yet effective, will have a material impact on the financial statements of the PMTE once they become effective:

Accounting Policiesfor the year ended 31 March 2013
290 Department of Public Works | Annual Report 2012/13
GRAP 106 Transfer of functions of entities not under common control
GRAP 107 Mergers
IGRAP 11 Consolidation - Special purpose entities
IGRAP 12 Jointly controlled entities - Non monetary contributions by ventures
GRAP 6 (as revised 2010) Consolidation and separate financial statements
GRAP 7 (as revised 2010) Investments in associates
GRAP 8 (as revised 2010) Interest in joint ventures
GRAP 31 (as revised 2012) Intangible assets (replaces GRAP 102)
GRAP 27 (as revised 2012) Agriculture (replaces GRAP 101)
IGRAP 16 Intangible assets website costs
Based on an analysis of the transactions of the PMTE, these Standards will not have an impact the PMTE.
1.4 Basis of Preparation
The financial statements are prepared on the accrual basis using historical cost as a measurement basis, unless another measurement basis is required by the Standard of GRAP. The significant accounting policies applied are set out below.
1.5 Functional Currency
The financial statements are prepared in South African Rand (“R”) which is also the functional currency of the PMTE. Where values are rounded, they are rounded to the nearest thousand (“R’000”) and indicated as such.
1.6 Going Concern
The financial statements have been prepared on the going concern basis. Although the PMTE is in a net liability position and has a bank overdraft of R1 402 000 for the period ended 31 March 2013, management maintains their assessment that the PMTE is able to continue on a going concern basis into the foreseeable future. The PMTE operates under the control and support of the National Department of Public Works (“NDPW”) and National Treasury is aware of the PMTE’s overdraft position. Management has implemented a strategy to ensure the turnaround of the entity.
1.7 Offsetting
Assets, liabilities, revenue and expenses have not been offset except when offsetting is required or permitted by a Standard of GRAP.
1.8 Comparative figures
Comparative figures have been adjusted to correct errors identified in the current year but relating to prior years and to conform to changes in presentations as a result of the adoption of GRAP. The effect of the restatements is disclosed in note 29.

Accounting Policiesfor the year ended 31 March 2013
Department of Public Works | Annual Report 2012/13 291
1.9 Significant judgements and sources of estimation uncertainty
1.9.1 Initial measurement of financial assets
Short-term financial assets have been measured initially at the transaction price unless there was an indication that the transaction was provided at terms that were longer than 30 days for all receivables. Interest was charged on debt outstanding exceeding the normal credit terms at the rate applicable to debt owed to the State, except for debt owed by Government institutions. The PMTE is unable to determine the interest free period granted to these Government institutions for initial measurement purposes and as a result the transaction price is assumed to be the fair value. The effect of payment outside of the 30 day period is considered during the impairment assessment (refer to note 1.9.2 below).
The applicable discount rate for 2013 is 8.5% (2012: 8.5%).
1.9.2 Impairment of financial assets
An impairment is recognised for estimated losses firstly on individually significant receivables and secondly on a group of receivables with the same credit risk that are assessed to be impaired based on objective evidence as a result of one or more events that occurred during the reporting period. For debtors which have defaulted management made judgements based on history. Should the financial condition of the customer change actual write-offs could differ significantly from the impairment losses recognised. The current year’s provision for impairment is based on management’s best estimate of the expected cashflows for amounts that are outstanding for longer than the normal payment terms discounted at the current rate of debt out to the state. A full provision was made for receivables where we expect payment but cannot determine the exact future payment date.
1.9.3 Commitments
Commitments based on orders relating to capital projects where the goods/services have not been delivered, and are subsequently recovered from client departments, have not been disclosed in the financial records of the entity. The reason for this is that the underlying immoveable assets are recognised in the accounting records of client departments which includes the DPW.
1.9.4 Contingent assets, contingent liabilities and provisions
Contingent assets, contingent liabilities and provisions have been based on the best estimate available. Contingent liabilities relating to litigation has been based on the assessment of the estimated claim against the PMTE as at 31 March 2013.
1.9.5 Maintenance costs, construction revenue and construction receivables
The PMTE incurs expenditure relating to the maintenance and upgrading of buildings under the custodianship of the DPW. Where capital projects are funded by the different client departments and the DPW through their respective capital budgets, the PMTE classifies this revenue as revenue from exchange transactions (construction revenue). Where capital projects are funded partly from the augmentation grant and partly from the accommodation charge on State-owned property, these are expensed and disclosed as a related party transaction to the DPW. Expenditure on maintenance is funded from the accommodation charge on State-owned property and is expensed and disclosed as a related party transaction to the DPW.

Accounting Policiesfor the year ended 31 March 2013
292 Department of Public Works | Annual Report 2012/13
1.9.6 Classification of accommodation charges as lease revenue
The PMTE provides property management services to DPW and in return receives the right to charge users an accommodation fee (lease revenue). As the intention of the PMTE is to provide accommodation at values that are directly equal to the value of the service being delivered, the PMTE categorises all accommodation charges as revenue from exchange transactions notwithstanding the fact that this revenue may or may not equal the value of the service delivered. Furthermore, accommodation charges on State-owned leases are classified as lease revenue notwithstanding the fact that the PMTE has no custodianship of the underlying asset. The intention is that the PMTE will obtain custodianship once the functions relating to asset management is transferred to the PMTE (see note 14).
1.9.7 Classification of leases
The PMTE classifies lease agreements in accordance with risks and rewards incidental to ownership. Where the lessor transfers substantially all the risks and rewards to the lessee, the lease is classified as a finance lease. All other leases are classified as operating leases. Determining whether the risks and rewards of ownership has been transferred to a lessee is a matter of professional judgement. In exercising this judgement, the PMTE considered the following indicators:
• Ownership is transferred to the lessee at the end of lease term;
• Lease term is for major part of economic life of asset;
• At the inception of the lease, the present value of the minimum lease payments amount to, at least, substantially all the fair value of the leased asset;
• The leased asset is of a specialised nature that only the lessee can use it without major modifications;
• The leased asset is not easily replaceable by another asset;
• If the lessee can cancel the lease, the lessee will carry any loss that will be incurred by the lessor as a result of modification; and
• At the end of the initial lease, the lessee has an option to extend the lease at a rent that is substantially lower than the market rent.
Where the PMTE has assessed itself to be a lessee to a finance lease arrangement, it recognises a finance lease liability and a related leasehold asset, which would be disclosed as part of property plant and equipment and depreciated over its useful life. The PMTE enters into these finance leasehold agreements on behalf of its client departments and therefore the assumption is made that all finance lease costs incurred are fully recoverable. The PMTE will in its role as finance lease lessor, derecognise this previously recognised leasehold asset (property, plant and equipment) and recognise a finance lease asset (see note 2.4).
1.9.8 Related party disclosures
The Standard of GRAP provides exemption from detailed disclosures where those transactions are on:
• Normal supplier and/or client/recipient relationships on terms and conditions no more or less favourable than those which it is reasonable to expect the PMTE to have adopted if dealing with that individual entity or person in the same circumstances; and
• Terms and conditions within the normal operating parameters established by our mandate.
Due to the fact that the PMTE has not adopted a final business case, and in the absence of a pricing strategy for leases, certain assumptions were made to avoid disclosures of transactions that would not have been disclosed if the business case has been finalised. In addition, many services have been rendered in-kind to the PMTE stemming from its relationship with the DPW. Due to the nature of these transactions, where amounts could not be measured reliably,

Accounting Policiesfor the year ended 31 March 2013
Department of Public Works | Annual Report 2012/13 293
only a narrative disclosure was made. This is in line with the principle of not recognising certain services-in-kind as it is difficult to measure the value of these services and they are usually consumed within the period contained in accordance with the Standard of GRAP on Revenue from Non-exchange Transactions (GRAP 23). Where amounts could be reliably measured, these have been recognised.
2. Significant accounting policies2.1 Revenue
When the PMTE receives value in the form of an asset and directly provides approximate equal value in exchange, the PMTE classifies revenue received or receivable as revenue from exchange transactions. All other revenue is classified as revenue from non-exchange transactions. Revenue is measured at the fair value of the consideration received or receivable, net of any trade discounts and volume rebates and recognised when it became due to the PMTE.
2.1.1 Revenue from non-exchange transactions
The PMTE recognises the inflow of resources from a non-exchange transaction as revenue, except in cases when a liability is recognised in respect of that inflow. These liabilities are classified as payables from non-exchange transactions until the conditions relating to the liability has been satisfied.
Where services are received in-kind and a reliable estimate can be made, the PMTE recognises the related revenue. In all other cases, the PMTE only discloses the event.
2.1.2 Revenue from exchange transactions
Accommodation charges are recognised either based on the cost of leasing in (in the case of privately owned building) or in the case of state accommodation on the budget devolution as agreed upon with the client departments. The latter is increased annually based on the budget assumptions in a given year. Revenue earned from accommodation charges is classified as lease revenue.
Revenue from construction contracts is classified for disclosure purposes as revenue from exchange transactions (refer to 2.5.) recognised by reference to the stage of completion of the contract when the outcome of a construction contract can be estimated reliably. When the outcome of the construction contract cannot be estimated reliably, construction revenue is recognised to the extent of contract costs incurred that are likely to be recoverable in the period in which they are incurred. An expected loss on a contract is recognised immediately in the surplus or deficit in the period in which it was incurred.
The PMTE pays municipal services on behalf of the client departments and earns 5% commission on the value of the invoice. A receivable is recognised for the amounts due from the client departments.
The commission earned is recognised as revenue from exchange transactions in the surplus or deficit and any amounts owed or overpaid on the commission is recognised either as a receivable or payable as appropriate from exchange transactions.
Interest is recognised using the effective interest method.
Other revenue from exchange transactions is recognised in the surplus or deficit when the revenue becomes due to the PMTE.

Accounting Policiesfor the year ended 31 March 2013
294 Department of Public Works | Annual Report 2012/13
2.1.3 Revenue earned for the recovery of expenses on behalf of third parties
The PMTE pays municipal services on behalf of the client departments and earns 5% commission on the value of the invoice. A receivable is recognised for the amounts due from the client departments.
The commission earned is recognised as revenue from exchange transactions in the surplus or deficit and the amount owed/paid on the commission is recognised in receivables/payables from exchange transactions.
2.2 Expenditure
Expenditure is classified in accordance with the nature of the expenditure.
The PMTE recognises expenditure in the Statement of Financial Position when a decrease in future economic benefits or service potential relates to a decrease in an asset or an increase in a liability, other than those relating to distributions to owners, has risen, that can be measured reliably.
The PMTE recognises expenses immediately in the surplus or deficit when expenses produce no future economic benefits or service potential or when and to the extent that, future economic benefits or service potential do not qualify or cease to qualify for recognition in the Statement of Financial Position as an asset.
The PMTE also recognises expenses in the surplus or deficit in those cases when a liability is incurred without the recognition of an asset, for example, when a liability under a court ruling arises.
Finance cost is recognised as an expense in the surplus or deficit in the period in which it is incurred, using the effective interest method.
2.3 Employee benefits
2.3.1 Short-term employee benefits
The PMTE recognises an undiscounted amount of short-term benefits due to employees in exchange for the rendering of services by employees as follows:
• As a liability in cases where the amounts have not yet been paid. Where the amount paid exceeds undiscounted amount of the benefits due, the PMTE recognises the excess as an asset to the extent that the overpayment will lead to a reduction of future payments or a cash refund.
• As an expense, unless the PMTE uses the services of employees in the construction of an asset and the benefits received meet the recognition criteria of an asset, at which stage it is included as part of the cost of the related property, plant and equipment or intangible asset item.
• A related receivable is recognised as the PMTE recovers the expenditure from the DPW.
2.3.2 Leave benefits
The PMTE recognises the expected cost of short-term employee benefits in the form of compensated absences (paid leave) when the employees render service that increases their entitlement to future compensated absences.
The expected cost of accumulating compensated absences is measured as the additional amount that the PMTE expects to pay as a result of the unused entitlement that has accumulated at the reporting date.

Accounting Policiesfor the year ended 31 March 2013
Department of Public Works | Annual Report 2012/13 295
2.3.3 Performance and service bonuses
The PMTE recognises the expected cost of performance or service bonus payments where there is a present legal or constructive obligation to make these payments as a result of past events and a reliable estimate of the obligation can be made. A liability for service bonus is accrued on a proportionate bases as services are rendered and a liability for performance bonus is raised on the estimated amount payable in terms of the incentive schemes which is based on the employee’s performance in the applicable year.The PMTE considers the present obligation to exist when it has no realistic alternative but to make the payments related to performance bonuses.
2.3.4 Retirement and medical benefits
Payments to the defined contribution plan are charged to the surplus or deficit in the year to which they relate. Once the contributions are paid, the PMTE has no further payment obligations. The contribution paid is charged to employee expenses in the same year as the related service is provided.
2.4 Leases
2.4.1 PMTE as a lessor
Operating lease revenue is recognised as revenue on a straight-line basis over the lease term where the lease term exceeds one month. Initial direct costs incurred in negotiating and arranging operating leases are added to the carrying amount of the leased asset and recognised as an expense over the lease term on the same basis as the lease revenue. The aggregate cost of incentives is recognised as a reduction of rental revenue over the lease term on a straight-line basis. Income for leases is disclosed as revenue from exchange transactions in the surplus or deficit.
The PMTE recognises finance lease receivables resulting from finance leases as assets on the Statement of Financial Position. Such assets are presented as a receivable at an amount equal to the net investment in the lease. Finance revenue is recognised based on a pattern reflecting a constant periodic rate of return on the PMTE’s net investment in the finance lease.
The asset and the liability in the Statement of Financial Position are initially recognised at amounts equal to the fair value of the leased property or if lower, the present value of the minimum lease payments.
2.4.2 PMTE as a lessee
Operating lease payments are recognised as an expense on a straight-line basis over the lease term where the lease term has been determined. The difference between the amounts recognised as an expense and the contractual payments are recognised as an operating lease asset or liability.
The PMTE recognises finance lease liabilities resulting from finance lease as a liability on the Statement of Financial Position. Minimum lease payments shall be apportioned between the finance charge and the reduction of the outstanding liability. Such liabilities are presented as a payable at an amount equal to the net obligation of the lease. Finance costs are recognised based on the effective interest implicit in the finance lease.
The aggregate benefit of incentives is recognised as a reduction of rental expense over the lease term on a straight-line basis.
2.5 Construction contracts
Where the outcome of a construction contract can be estimated reliably, contract revenue and costs are recognised by reference to the stage of completion of the contract activity at the reporting date, as measured by completion of a physical proportion of the contract work. The stage of completion is based on the cost to date and is assessed based

Accounting Policiesfor the year ended 31 March 2013
296 Department of Public Works | Annual Report 2012/13
on surveys of work performed. Variations in contract work, claims and incentive payments are included to the extent that they have been agreed with the customer.
When the outcome of the construction contract cannot be estimated reliably, contract revenue is recognised to the extent that contract costs incurred are recoverable. Contract costs are recognised as an expense in the period in which they are incurred.
When it is probable that total contract costs will exceed total contract revenue, the expected deficit is recognised as an expense immediately.
2.6 Financial instruments
2.6.1 Initial recognition and classification
The PMTE classifies financial instruments or their component parts, on initial recognition as financial asset, financial liability or a residual interest in accordance with the substance of the contractual arrangement.
Financial instruments are recognised initially when the PMTE becomes party to the contractual provisions of the instruments and the PMTE funds are committed or the PMTE receives the related benefits.
The PMTE does not offset a financial asset and a financial liability unless a legally enforceable right to offset the recognised amounts currently exist, the PMTE intends to settle on a net basis or to realise the asset and settle the liability simultaneously.
Interest relating to a financial instrument or a component of a financial instrument is recognised as revenue or expense in the surplus or deficit.
2.6.2 Initial measurement
Financial instruments are initially measured at fair value.
2.6.3 Transaction costs
Transaction costs on financial instruments at fair value are recognised in the surplus or deficit. Transaction costs on other financial instruments are included in the cost of the instrument.
2.6.4 Subsequent measurement
All non-derivative financial assets or non-derivative financial liabilities that have fixed or determinable payments, excluding instruments that has been designated at fair value or are held for trading, are measured at amortised cost. Instruments that does not meet the definition of financial assets or financial liabilities measured at amortised cost are measured at fair value.
Amortised cost is calculated based on the effective interest method.
Net gains or losses on the financial instruments includes transaction costs, interest and foreign exchange gains or losses. A gain or loss arising from a change in the fair value of a financial asset or financial liability measured at fair value is recognised in the surplus or deficit.
2.6.5 Impairment of financial assets
At each reporting date the PMTE assesses all financial assets, other than those at fair value through the surplus or deficit, to determine whether there is objective evidence that a financial asset or group of financial assets has been impaired.
Accounting Policiesfor the year ended 31 March 2013
Department of Public Works | Annual Report 2012/13 297
The inability to redeem amounts due based on the current stream of payments, and default of payments are considered to be indicators of impairment.
If there is objective evidence that an impairment loss on financial assets measured at amortised cost has been incurred, the amount of the loss is measured as the difference between the asset’s carrying amount and the present value of the estimated future cash flows (excluding future credit losses that have not been incurred) discounted at the financial asset’s original effective interest rate (i.e. the effective interest rate computed at initial recognition). Impairment losses are recognised in the surplus or deficit as expenses.
Impairment losses are reversed when an increase in the financial asset’s recoverable amount can be related objectively to an event occurring after the impairment was recognised, subject to the restriction that the carrying amount of the financial asset at the date that the impairment is reversed does not exceed the carrying amount that would have been recognised had the impairment not been recognised.
2.6.6 Derecognition
Financial assets
The PMTE derecognises financial asset using trade date accounting. The PMTE derecognises a financial asset only when:
• The contractual rights to the cash flows from the financial asset expire, are settled or waived;
• The PMTE transfers to another party substantially all of the risks and rewards of ownership of the financial asset; or
• The PMTE, despite having retained some significant risks and rewards of ownership of the financial asset, has transferred control of the asset to another party and the other party has the practical ability to sell the asset in its entirety to an unrelated third party, and is able to exercise that ability unilaterally and without needing to impose additional restrictions on the transfer. In this case, the PMTE:
- Derecognise the asset; and
- Recognise separately any rights and obligations created or retained in the transfer.
The carrying amounts of the transferred asset are allocated between the rights and obligations retained and those transferred on the basis of their relative fair value at the transfer date. Newly created rights and obligations are measured at that date. Any differences between the consideration received and the amounts recognised and derecognised is recognised in the surplus or deficit in the period of the transfer.
Financial liabilities
The PMTE removes a financial liability (or a part of the financial liability) from its Statement of Financial Position when it is extinguished - i.e. when the obligation specified in the contract is discharged, cancelled, expire or waived.
The difference between the carrying amount of a financial liability (or part of a financial liability) extinguished or transferred to another party and the consideration paid, including any non-cash assets transferred or liabilities assumed, is recognised in the surplus or deficit. Any liabilities that are waived, forgiven or assumed by the PMTE by way of a non- exchange transaction are accounted for in accordance with the Standard of GRAP on Revenue from Non-exchange Transactions (taxes and transfers).

Accounting Policiesfor the year ended 31 March 2013
298 Department of Public Works | Annual Report 2012/13
2.7 Cash and cash equivalents
Cash and cash equivalents comprise cash on hand and demand deposits, and other short-term highly liquid investments that are readily convertible to a known amount of cash and are subject to an insignificant risk of changes in value. Cash and cash equivalents are initially measured at fair value, and subsequently at amortised cost.
2.8 Receivables from exchange transactions
Receivables from exchange transactions measured at amortised cost arise from transactions with service providers and trade debtors. Prepayments and advances consist of amounts paid to contractors and employees for which future goods and services are expected to be received. Prepayments and advances are not classified as financial instruments.
2.9 Receivables from non-exchange transactions
Receivables from non-exchange transactions are recognised when the PMTE has a right to receive the monies due to it, which are allocated in terms of the legislation or are due in accordance with an agreement in which the PMTE is receiving non-exchange revenue. Receivables from non-exchange transactions are initially measured at fair value and subsequently measured at amortised cost or cost.
2.10 Payables from exchange transactions
The PMTE recognises payables from exchange transactions where liabilities result in counter performance by respective parties.
Payables from exchange transactions are initially measured at fair value, and are subsequently measured at amortised cost.
The PMTE recognises in payables an amount for accruals where an estimate is made of the amounts due for goods or services that have been received or supplied, but the invoice is outstanding or a formal agreement with the supplier has not been concluded.
2.11 Provisions
Provisions are liabilities, excluding accruals that are recognised where the PMTE has a present, legal or constructive obligation as a result of past events and it is probable that an outflow of resources embodying economic benefits will be required to settle the obligation and a reliable estimate of the amount of the obligation can be made. Provisions are measured at the best estimate of the amount to settle the present obligation at the reporting date, discounting to present value where time value of money is expected to be material.
2.12 Contingent assets and liabilities
Contingent assets and contingent liabilities are not recognised. Contingencies are disclosed in note 20.
2.13 Reserves
The PMTE’s reserves are made up of accumulated reserves.
Accumulated reserves are mainly built up to ensure adequate rehabilitation and maintenance of State-owned infrastructure and future infrastructure development.

Accounting Policiesfor the year ended 31 March 2013
Department of Public Works | Annual Report 2012/13 299
2.14 Budget information
The budget is prepared on a cash basis. The PMTE budgets for revenue including the transfer payment received through the DPW. Expenditure incurred exceeding the transfer payment and other revenue is defrayed from accumulated reserves. The PMTE budget is part of the overall DPW vote.
2.15 Related parties
Parties are considered to be related if one party has the ability to control the other party, exercise significant influence over the other party or jointly controls the other party. Specific information with regard to related party transactions is included in note 23.2.
2.16 Irregular, fruitless and wasteful expenditure and material losses through criminal conduct
Irregular, fruitless and wasteful expenditure and material losses through criminal conduct is recognised as expenditure in the surplus or deficit according to the nature of the payment and disclosed separately in notes 21 to 22. When the amount is subsequently recoverable, it is recognised as revenue in the surplus or deficit. Any receivable recognised as a result of irregular, fruitless and wasteful expenditure or material losses through criminal conduct, are subject to an annual impairment assessment.

2013Restated
2012R’000 R’000
300 Department of Public Works | Annual Report 2012/13
Notes to the Annual Financial Statementsfor the year ended 31 March 2013
3. Receivables from exchange transactions
Financial assetsAccommodation debtors - leasehold 1 178 777 1 106 541Provision for impairment (705 268) (656 141)Net accommodation debtors - leasehold 473 509 450 400Accommodation debtors - freehold 18 189 24 746Provision for impairment (17 972) (22 734)Net accommodation debtors - freehold 217 2 012Construction receivable 571 770 354 191Provision for impairment (177 818) (225 924)Net construction receivables 393 952 128 267Debt account 115 743 60 999Provision for impairment (60 923) (393)Net debt account 54 820 60 606Revenue accrual 250 005 295 743Municipal deposits 8 824 6 811Other debtors 20 20
1 181 347 943 859Non-financial assetsMunicipal services 824 969 751 709Provision for impairment (282 594) (256 412)Net municipal services 542 375 495 297Prepaid expenses 339 082 88 490
881 457 583 7872 062 804 1 527 646
Trade and other receivables past due but not impairedThere were no debtors past due that were not impaired.
Trade and other receivables impaired
As of 31 March 2013, trade and other receivables of R2 062 804 (2012: R1 527 646) were considered for impairment. The total amount of the provision was R1 244 575 as of 31 March 2013 (2012: R1 161 604).
Included in the accommodation debtors-leasehold balance of R1 178 777 (2012: R1 106 541) are invoices, relating to the period from April 2006 to March 2011, amounting to R561 490 (2012: R605 477) that cannot be traced to and substantiated with lease agreements, thus the specific invoices were included in the impairment provision.

2013Restated
2012R’000 R’000
Department of Public Works | Annual Report 2012/13 301
Notes to the Annual Financial Statementsfor the year ended 31 March 2013
3. Receivables from exchange transactions (continued)
Reconciliation of provision for impairmentOpening balance 1 161 604 749 150
Provision for impairment 82 971 412 4541 244 575 1 161 604
Impairment provision consists of the following:Accommodation debtors - leasehold 705 268 656 141Accommodation debtors - freehold 17 972 22 734Construction receivable 177 818 225 924Debt account 60 923 393Municipal charges 282 594 256 412
1 244 575 1 161 604
4. Receivables from non-exchange transactions
Department of Public Works (services in-kind) 1 730 1 445
The receivable above relates to the outstanding employee benefits paid by the Department on behalf of the PMTE (refer to note 11).
5. Construction contracts receivables
Construction work-in-progress 292 497 396 378
The amount of construction work-in-progress represents the gross amount due from customers for contract work.
6. Operating lease asset/liability
Operating leases - as lessee (expense) Minimum lease payments due- within one year 1 666 996 1 920 067- in second to fifth year inclusive 4 206 213 4 673 551- later than five years 1 280 845 2 048 510
7 154 054 8 642 128
Operating lease liability 892 499 859 393
The total future minimum sublease payment expected to be received under non- cancellable sublease 7 154 054 8 642 128

2013Restated
2012R’000 R’000
302 Department of Public Works | Annual Report 2012/13
Notes to the Annual Financial Statementsfor the year ended 31 March 2013
6. Operating lease asset/liability (continued)
Operating leases - as lessor (income)Minimum lease payments due- within one year 1 666 996 1 920 067- in second to fifth year inclusive 4 206 213 4 673 551- later than five years 1 280 845 2 048 510
7 154 054 8 642 128Operating lease asset 892 499 859 393
The above operating leases are sub-lease agreements with various client departments and are on the same terms as those applicable to the lease agreements entered into with the landlords on leasehold property.
7. Finance lease receivables
Gross investment in the lease due- within one year 1 071 996- in second to fifth year inclusive 5 194 4 811- later than five years 9 028 624 9 030 069
9 034 889 9 035 876Less: unearned finance revenue (9 001 341) (9 005 073)
33 548 30 803
Present value of minimum lease payments due- within one year (3 003) (2 746)- in second to fifth year inclusive (15 113) (13 815)- later than five years 51 664 47 364
33 548 30 803
The above finance leases are sub-lease agreements with various client departments and are on the same terms as those applicable to the lease agreements entered into with the landlords on leasehold property (refer to note 13).
8. Cash and cash equivalents
Cash and cash equivalents consist of:
Bank balances 829 1 399
Bank overdraft (1 402 323) (1 254 988)(1 401 494) (1 253 589)
Current assets 829 1 399Current liabilities (1 402 323) (1 254 988)
(1 401 494) (1 253 589)
For the purposes of the Cash Flow Statement, cash and cash equivalents include cash held with banks. The average effective interest rate on short term bank deposit is 3.7% (2012: 4.0%).

2013Restated
2012R’000 R’000
Department of Public Works | Annual Report 2012/13 303
Notes to the Annual Financial Statementsfor the year ended 31 March 2013
9. Payables from exchange transactions
Financial liabilitiesAccrued expenses 1 112 729 905 187Other payables 33 400 518Tender deposits 3 341 3 341
Non-financial liabilitiesUnallocated deposits 358 400 425 609Debtors with credit balances 40 154 87 701
1 548 024 1 422 356
10. Retention liability
Construction retention liabilities 169 217 167 352
Other retention liabilities 171 340 168 951340 557 336 303
Non-current liabilities 264 759 268 063Current liabilities 75 798 68 240
340 557 336 303
Retention liabilities that are recognised on capital projects from client departments are referred to as construction retention liability. Retention liabilities recovered on capital projects are not recovered from client departments and are disclosed as other retention liabilities.
11. Employee benefit obligations
The amounts recognised in the Statement of Financial Position are as follows:
Provision for performance bonusCarrying amount 108 204Current service cost 230 137Benefits utilised (120) (234)
218 107
Provision for leaveCarrying amount 973 649Current service cost 1 906 1 437Benefits utilised (1 743) (1 113)
1 136 973

2013Restated
2012R’000 R’000
304 Department of Public Works | Annual Report 2012/13
Notes to the Annual Financial Statementsfor the year ended 31 March 2013
Provision for service bonusCarrying amount 365 219Current service cost 828 697Benefits utilised (817) (551)
376 365
Total employee benefit obligation 1 730 1 445
12. Provisions
Legal proceedings 34 029 34 029
Provisions consist of claims and litigations or payables where services have been delivered without an indication of the timing of settlement or the amount of settlement. The provision for claims and litigation is based on the amounts confirmed by the legal advisors of the PMTE.
There is a restatement of an amount of R1 298 000 for legal provisions raised by the PMTE which did not meet the requirements for the recognition of provisions in the prior year.
There were no additional provisions raised in the current year and the restated prior year provision amount outstanding at year end remains.
13. Finance lease obligations
Minimum lease payments due- within one year 1 071 996- in second to fifth year inclusive 5 194 4 811- later than five years 9 028 624 9 030 069
9 034 889 9 035 876Less: future finance charges (9 001 341) (9 005 073)Present value of minimum lease payments 33 548 30 803
Present value of minimum lease payments due- within one year (3 003) (2 746)- in second to fifth year inclusive (15 113) (13 815)- later than five years 51 664 47 364
33 548 30 803
The total future minimum sub-lease payment expected to be received under non- cancellable sub-lease 9 034 890 9 035 875
Finance leases consist of those leases that have an overall lease period exceeding 50 years. Due to the long term nature of the finance leases (i.e. most are 99 years), and specifically for those leases that have escalation rates, the interest of the balance exceeds the payment to be made for a large portion of the lease term.
The present value of the lease obligations were calculated based on the applicable rate for State-owned debt at the inception date. The rates vary between 6% and 17% on various contracts from 1958 to 2012.

2013Restated
2012R’000 R’000
Department of Public Works | Annual Report 2012/13 305
Notes to the Annual Financial Statementsfor the year ended 31 March 2013
14. Revenue from exchange transactions
Accommodation charges - leasehold 3 113 217 2 968 905Accommodation charges - freehold 3 417 999 3 268 441Management fees on municipal services 146 860 130 118Construction revenue 2 351 326 3 017 957Finance income* 24 807 20 106Recovery of over payments 18 650 12 362
9 072 859 9 417 889
*Finance income includes the following:Interest received from debtors 20 487 16 630Interest received from finance leases 3 752 3 447Interest from bank balances 568 29
24 807 20 106
15. Revenue from non-exchange transactions
Augmentation 646 849 630 189Contractor fines 7 153 5 050Services in-kind 19 231 14 118
673 233 649 357
16. Operating surplus/(deficit)
Operating surplus/(deficit) for the year is stated after accounting for the following:
Operating leases 3 341 967 3 315 087Property maintenance 3 084 430 3 133 269Construction cost 2 351 326 3 017 957Rates and taxes 483 798 696 277Cleaning and gardening 170 181 141 038Impairment on receivables 82 971 412 454Security 42 675 40 434Thefts and losses 8 492 28 835Bursaries 3 346 1 127Admin/other indirect costs 1 364 1 225Bank charges 122 67Advertising 41 19Loss on construction - 486
9 570 713 10 788 275
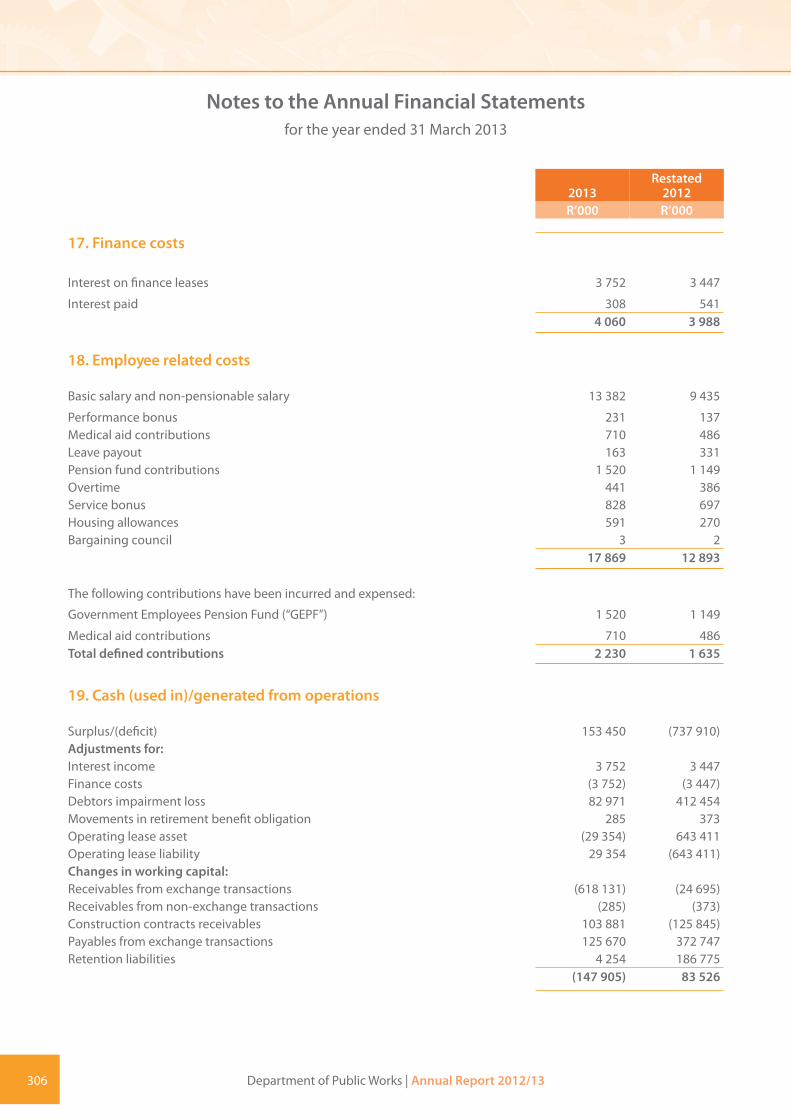
2013Restated
2012R’000 R’000
306 Department of Public Works | Annual Report 2012/13
Notes to the Annual Financial Statementsfor the year ended 31 March 2013
17. Finance costs
Interest on finance leases 3 752 3 447
Interest paid 308 5414 060 3 988
18. Employee related costs
Basic salary and non-pensionable salary 13 382 9 435
Performance bonus 231 137Medical aid contributions 710 486Leave payout 163 331Pension fund contributions 1 520 1 149Overtime 441 386Service bonus 828 697Housing allowances 591 270Bargaining council 3 2
17 869 12 893
The following contributions have been incurred and expensed:
Government Employees Pension Fund (“GEPF”) 1 520 1 149
Medical aid contributions 710 486Total defined contributions 2 230 1 635
19. Cash (used in)/generated from operations
Surplus/(deficit) 153 450 (737 910)Adjustments for:Interest income 3 752 3 447Finance costs (3 752) (3 447)Debtors impairment loss 82 971 412 454Movements in retirement benefit obligation 285 373Operating lease asset (29 354) 643 411Operating lease liability 29 354 (643 411)Changes in working capital:Receivables from exchange transactions (618 131) (24 695)Receivables from non-exchange transactions (285) (373)Construction contracts receivables 103 881 (125 845)Payables from exchange transactions 125 670 372 747Retention liabilities 4 254 186 775
(147 905) 83 526

2013Restated
2012R’000 R’000
Department of Public Works | Annual Report 2012/13 307
Notes to the Annual Financial Statementsfor the year ended 31 March 2013
20. Contingencies
20.1 Contingent liabilities
Municipal rates and taxes 202 119 207 287
Numerous invoices for rates and taxes which were received from municipalities across all regions are currently being disputed by the PMTE. The PMTE are disputing the accuracy of these invoices. These invoices are all dated prior to 1 April 2008. No assessment has been performed to date to conclude on the accuracy of these invoices and whether the PMTE indeed have an obligation to settle these amounts.
R174.5 million of the 2012 outstanding balance was paid during April 2012 to March 2013 and has been raised as an Accrual in the 2012 financial statements.
R5.2 million of the 2013 outstanding balance was paid during April 2013 and May 2013 and has been raised as an Accrual in the 2013 financial statements.
Claims relating to municipal property rates prior to 1 April 2008 were received from municipalities across all regions in which the PMTE operates. The invoices supporting these claims require extensive investigations to ensure that the PMTE only settles valid claims. The values disclosed above, represent an estimation relating to the outstanding invoices which still require assessment by the PMTE to conclude on their validity and whether the PMTE does have an obligation to settle.
Claims against the PMTE 13 475 20 479
The claims against the PMTE arising from capital projects with different third party service providers. The entity’s legal advisors are handling the claims on behalf of the PMTE. They have assessed the probability of each claim in determining the total amount of the legal contingent liability. The outflow of the economic benefits is possible as at reporting date.
There is a restatement for an amount of R20 000 for a legal claim against the PMTE which was erroneously not disclosed in the 2012 financial year.
Total contingent liabilities 215 594 227 766

2013Restated
2012R’000 R’000
308 Department of Public Works | Annual Report 2012/13
Notes to the Annual Financial Statementsfor the year ended 31 March 2013
20. Contingencies (continued)
20.2 Contingent assets
Claims by the PMTE 77 178 74 746
The claims by the PMTE arise from various activities with service providers and are being handled by the entity’s legal advisors. They have assessed the probability of each claim in determining the total amount of the legal contingent asset. The inflow of the economic benefits is possible as at reporting date.
There is a restatement for an amount of R2.4 million for a legal claim by the entity which was erroneously disclosed within the PMTE instead of the DPW as at 31 March 2012.
Total contingent assets 77 178 74 746
21. Fruitless and wasteful expenditure
21.1 Reconciliation of fruitless and wasteful expenditure
Opening balance 239 311 6 772
Less: Amounts condoned (14) (5 582)Incurred during the year 15 217 238 121
254 514 239 311
21.2 Analysis of current year’s fruitless and wasteful expenditure
OccurrenceInterest/penalties 3 064Inappropriate mark-up on goods and services 1 189VAT incorrectly charged 14Expenses incurred without proper needs analysis 9 302Overpayment from the initial contract amount 630Payment for unoccupied building 1 018
15 217
No disciplinary steps have been taken as a consequence of the above expenditure.
22. Irregular expenditure
22.1 Reconciliation of irregular expenditure
Opening balance 1 410 817 658 704Less: Amounts condoned - (555 428)Incurred during current year 1 165 424 1 057 111Incurred in prior years detected in current year 33 470 250 430
2 609 711 1 410 817
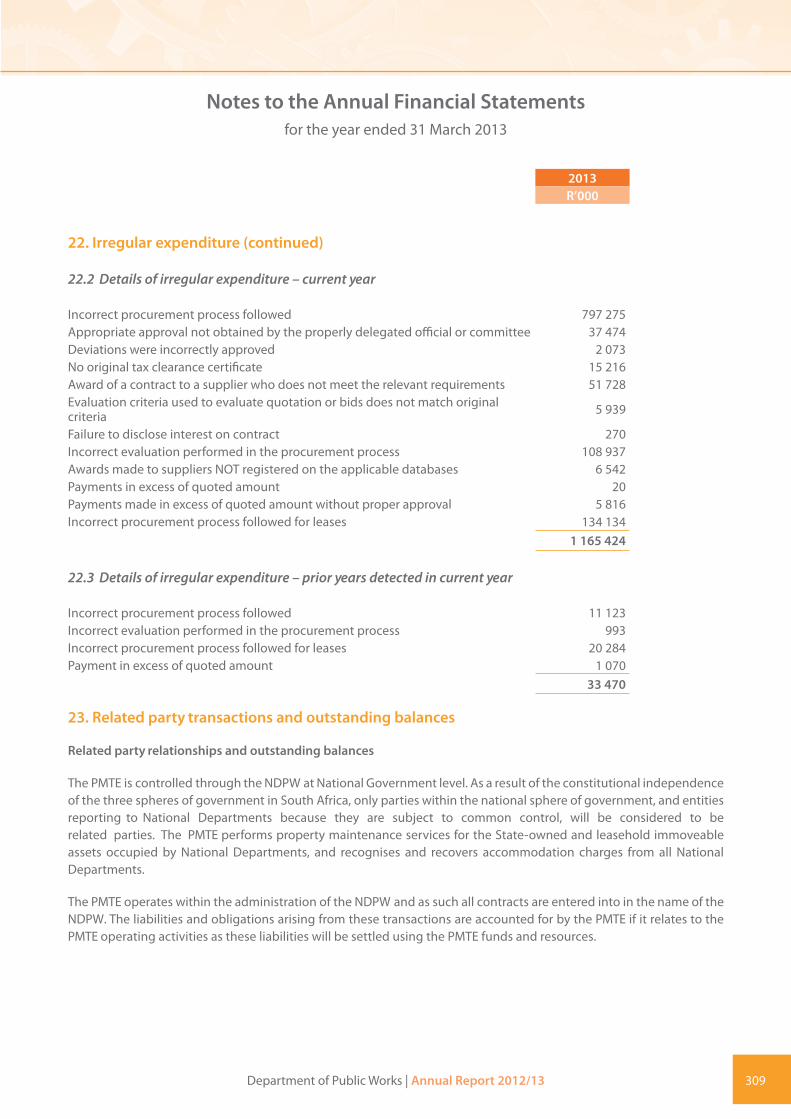
Department of Public Works | Annual Report 2012/13 309
Notes to the Annual Financial Statementsfor the year ended 31 March 2013
2013R’000
22. Irregular expenditure (continued)
22.2 Details of irregular expenditure – current year
Incorrect procurement process followed 797 275Appropriate approval not obtained by the properly delegated official or committee 37 474Deviations were incorrectly approved 2 073No original tax clearance certificate 15 216Award of a contract to a supplier who does not meet the relevant requirements 51 728Evaluation criteria used to evaluate quotation or bids does not match original criteria 5 939
Failure to disclose interest on contract 270Incorrect evaluation performed in the procurement process 108 937Awards made to suppliers NOT registered on the applicable databases 6 542Payments in excess of quoted amount 20Payments made in excess of quoted amount without proper approval 5 816Incorrect procurement process followed for leases 134 134
1 165 424
22.3 Details of irregular expenditure – prior years detected in current year
Incorrect procurement process followed 11 123Incorrect evaluation performed in the procurement process 993Incorrect procurement process followed for leases 20 284Payment in excess of quoted amount 1 070
33 470
23. Related party transactions and outstanding balances
Related party relationships and outstanding balances
The PMTE is controlled through the NDPW at National Government level. As a result of the constitutional independence of the three spheres of government in South Africa, only parties within the national sphere of government, and entities reporting to National Departments because they are subject to common control, will be considered to be related parties. The PMTE performs property maintenance services for the State-owned and leasehold immoveable assets occupied by National Departments, and recognises and recovers accommodation charges from all National Departments.
The PMTE operates within the administration of the NDPW and as such all contracts are entered into in the name of the NDPW. The liabilities and obligations arising from these transactions are accounted for by the PMTE if it relates to the PMTE operating activities as these liabilities will be settled using the PMTE funds and resources.

2013Restated
2012R’000 R’000
310 Department of Public Works | Annual Report 2012/13
Notes to the Annual Financial Statementsfor the year ended 31 March 2013
23. Related party transactions and outstanding balances (continued)
23.1 National Department of Public Works
Revenue
Revenue from exchange transactionsFreehold accommodation 36 086 31 379
Revenue from non-exchange transactions: Services in-kindOverhead services in-kind 17 868 12 893Augmentation 646 849 630 189
664 717 643 082
ExpenditureMunicipal property rates 788 675 513 223Property maintenance 3 007 094 2 928 676Cleaning, gardening and security 76 878 84 762Bursary payments 3 346 7 638
3 875 993 3 534 299
Receivables relating to the abovePrepayments on municipal property rates 139 212 20 356Services in-kind 1 730 1 445
140 942 21 801
Payables relating to the aboveMunicipal property rates accruals 6 191 205 649Property maintenance accruals 140 349 149 177Cleaning, gardening and security 6 714 3 609Bursary accruals 984 7 627
154 238 366 062
Commitments relating to the aboveProperty maintenance commitments 3 517 168 3 700 586Cleaning, gardening and security 16 745 6 482
3 533 913 3 707 068
The PMTE provides the following free services to the DPW:
As a trading entity of the DPW, the PMTE incurs expenditure relating to the immoveable assets of the DPW. These expenses include payments for municipal property rates, maintenance, cleaning, gardening and security services. The PMTE also pays certain of these costs relating to the leasehold properties that is occupied by the Departments employees. The PMTE does not recover these costs from the Department.
The PMTE has made payments relating to external and internal bursary recipients on behalf of the Department.
Department of Public Works | Annual Report 2012/13 311
Notes to the Annual Financial Statementsfor the year ended 31 March 2013
23. Related party transactions and outstanding balances (continued)
The PMTE receives free services from the DPW. The Department paid the following overhead costs for the day-to-day running of the PMTE:
• Employee costs
• Goods and services
• Interest and rent on land
• Transfers and subsidies
• Office and computer equipment.
These overhead costs can be measured reliably and have been included in revenue from non-exchange transactions. These costs are not recovered by the Department from the PMTE. The office and computer equipment has not been recognised as property, plant and equipment in the PMTE’s financial records due to the immateriality of the amount.
Other overhead costs include the sharing of corporate services between the DPW and the PMTE. Due to the nature of these transactions and the operational structures between the PMTE and the Department the value of these shared costs cannot be reliably measured. These costs, paid by the Department on behalf of the PMTE and not recovered, include the following corporate shared services:
• Supply Chain Management (“SCM”);
• Internal Audit;
• Human Resources (HRM, HROD;)
• Gender, people with disabilities, youth and children;
• Marketing and Communication;
• Information Services;
• Legal Services;
• Security Management;
• Monitoring and Evaluation;
• Strategic Management Unit (SMU); and
• Labour Relations.
In addition, the Department and the PMTE share the service cost of certain special interventions entered into in support of the turn around strategy. These cannot be reliably measured.
The PMTE receives an augmentation of funds from National Treasury via the Department to fund its operations.
23.2 Other related parties
The PMTE incurs property maintenance costs relating to cleaning, gardening and security services for leasehold properties occupied by client departments. These costs are not recovered from client departments, and therefore considered a free service.
The PMTE recognises accommodation revenue on State-owned building based on the amount budgeted by client departments. The level of service delivery relating to this accommodation charge is not linked to the value received, it is likely that some clients may benefit to the disadvantage of others. It is not possible to identify the extent of benefit or disadvantage received. The full amount of the transaction is disclosed.

2013Restated
2012R’000 R’000
312 Department of Public Works | Annual Report 2012/13
Notes to the Annual Financial Statementsfor the year ended 31 March 2013
23. Related party transactions and outstanding balances (continued)
Revenue from exchange transactions: State-owned accommodationAgriculture, Forestry and Fishing 56 770 49 365Arts and Culture 23 101 20 088Communications 575 500Correctional Services 828 579 720 504Defence and Military Veterans 939 957 1 104 261Higher Education 481 419Environmental Affairs 11 598 10 086Government Communications 19 16Health 8 968 7 798Health (Civitas) 56 002 58 132Home Affairs 27 675 24 065Human Settlement 294 255Independent Complaints Directorate 308 268Justice and Constitutional Development 296 343 257 690Labour 32 518 28 276Rural Development and Land Reform 15 857 13 789Minerals 1 797 1 563National Treasury 3 366 2 927National Treasury - SARS 19 061 16 575Public Service and Administration 171 148SA Police Services 980 352 852 480Social Development 313 273Sports and Recreation 7 6Statistics SA 809 704Trade and Industry 21 18Water Affairs 76 886 66 858
3 381 828 3 237 064
State-owned accommodation receivable less impairmentCommunications - 109Defence and Military Veterans 215 -Higher Education - 4Environmental Affairs - 1 705Public Service and Administration - 32Sports and Recreation 1 -Statistics SA - 162Trade and Industry - (4)
216 2 008
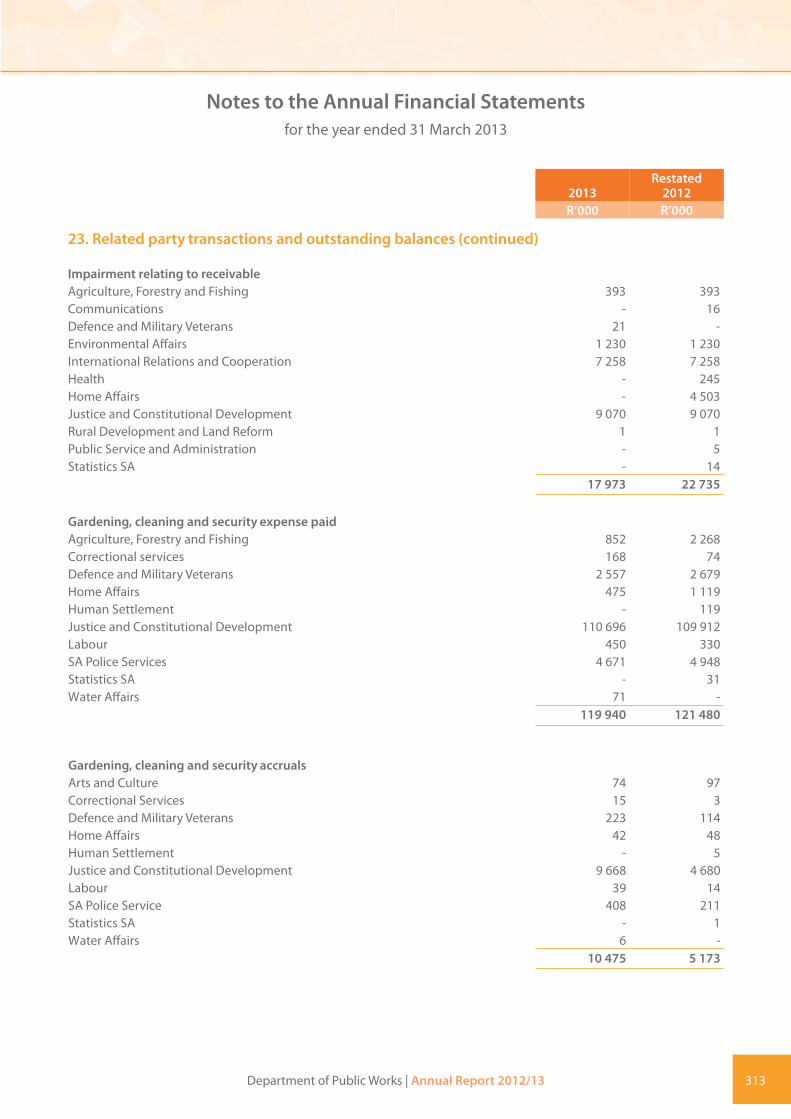
2013Restated
2012R’000 R’000
Department of Public Works | Annual Report 2012/13 313
Notes to the Annual Financial Statementsfor the year ended 31 March 2013
23. Related party transactions and outstanding balances (continued)
Impairment relating to receivableAgriculture, Forestry and Fishing 393 393Communications - 16Defence and Military Veterans 21 -Environmental Affairs 1 230 1 230International Relations and Cooperation 7 258 7 258Health - 245Home Affairs - 4 503Justice and Constitutional Development 9 070 9 070Rural Development and Land Reform 1 1Public Service and Administration - 5Statistics SA - 14
17 973 22 735
Gardening, cleaning and security expense paidAgriculture, Forestry and Fishing 852 2 268Correctional services 168 74Defence and Military Veterans 2 557 2 679Home Affairs 475 1 119Human Settlement - 119Justice and Constitutional Development 110 696 109 912Labour 450 330SA Police Services 4 671 4 948Statistics SA - 31Water Affairs 71 -
119 940 121 480
Gardening, cleaning and security accrualsArts and Culture 74 97Correctional Services 15 3Defence and Military Veterans 223 114Home Affairs 42 48Human Settlement - 5Justice and Constitutional Development 9 668 4 680Labour 39 14SA Police Service 408 211Statistics SA - 1Water Affairs 6 -
10 475 5 173
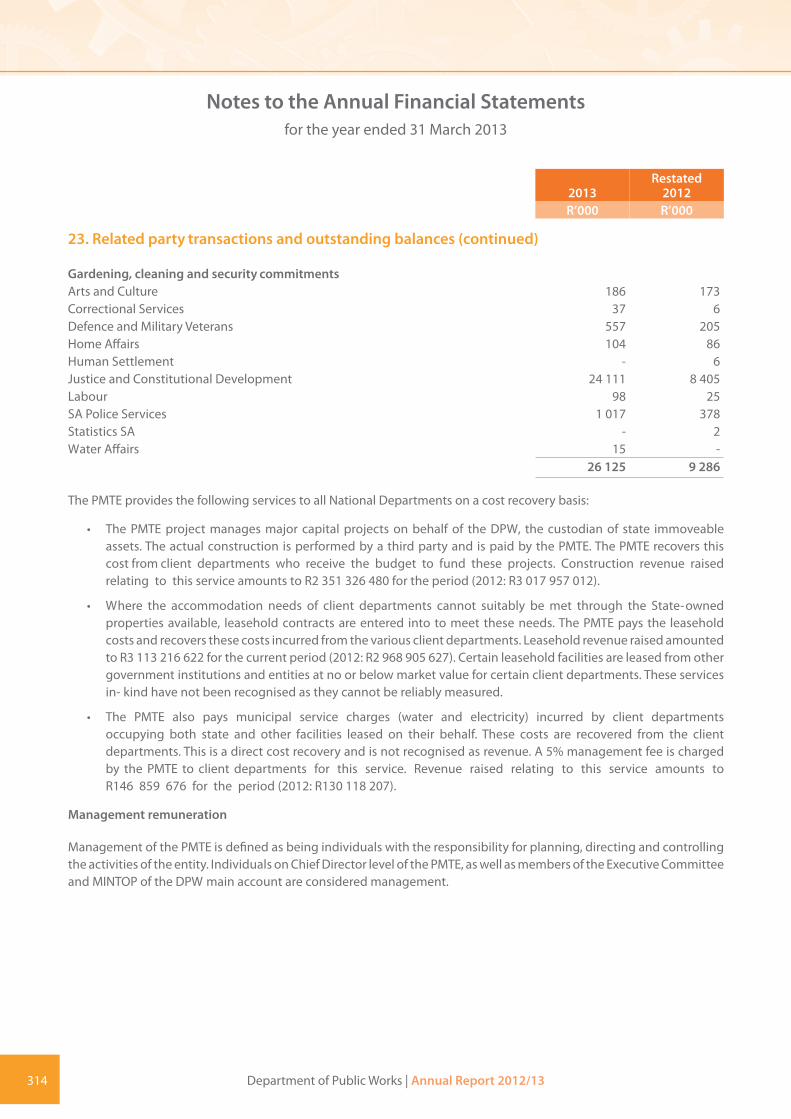
2013Restated
2012R’000 R’000
314 Department of Public Works | Annual Report 2012/13
Notes to the Annual Financial Statementsfor the year ended 31 March 2013
23. Related party transactions and outstanding balances (continued)
Gardening, cleaning and security commitmentsArts and Culture 186 173Correctional Services 37 6Defence and Military Veterans 557 205Home Affairs 104 86Human Settlement - 6Justice and Constitutional Development 24 111 8 405Labour 98 25SA Police Services 1 017 378Statistics SA - 2Water Affairs 15 -
26 125 9 286
The PMTE provides the following services to all National Departments on a cost recovery basis:
• The PMTE project manages major capital projects on behalf of the DPW, the custodian of state immoveable assets. The actual construction is performed by a third party and is paid by the PMTE. The PMTE recovers this cost from client departments who receive the budget to fund these projects. Construction revenue raised relating to this service amounts to R2 351 326 480 for the period (2012: R3 017 957 012).
• Where the accommodation needs of client departments cannot suitably be met through the State-owned properties available, leasehold contracts are entered into to meet these needs. The PMTE pays the leasehold costs and recovers these costs incurred from the various client departments. Leasehold revenue raised amounted to R3 113 216 622 for the current period (2012: R2 968 905 627). Certain leasehold facilities are leased from other government institutions and entities at no or below market value for certain client departments. These services in- kind have not been recognised as they cannot be reliably measured.
• The PMTE also pays municipal service charges (water and electricity) incurred by client departments occupying both state and other facilities leased on their behalf. These costs are recovered from the client departments. This is a direct cost recovery and is not recognised as revenue. A 5% management fee is charged by the PMTE to client departments for this service. Revenue raised relating to this service amounts to R146 859 676 for the period (2012: R130 118 207).
Management remuneration
Management of the PMTE is defined as being individuals with the responsibility for planning, directing and controlling the activities of the entity. Individuals on Chief Director level of the PMTE, as well as members of the Executive Committee and MINTOP of the DPW main account are considered management.

Department of Public Works | Annual Report 2012/13 315
Notes to the Annual Financial Statementsfor the year ended 31 March 2013
23. Related party transactions and outstanding balances (continued)
Designation Name
*Department of Public Works Minister Hon. Thulas Nxesi
*Department of Public Works Deputy Minister Hon. Jeremy Cronin
*Director-General Mziwonke Dlabantu
*Acting Deputy Director-General: CS (Seconded from DPSA) Kenny Govender
*Acting Deputy Director-General: AIM Peter Chiapasco
*Deputy Director-General: Regional Coordination Butcher Matutle
*Deputy Director-General : ICR Sasa Subban
*Deputy Director-General: EPWP Stanley Henderson
*Deputy Director-General: Projects (Seconded from CBE) Mfezeko Gwazube
*Deputy Director-General: KAM Mandla Mabuza
*Deputy Director-General: Policy Lydia Bici
*Chief Financial Officer Cox Mokgoro
*Chief Director: Security Services Zwiitani Rambau
*Chief Director: IGR Adam Mthombeni
*Chief Director: FM and PM Pinkie Modisane
*Chief Director: Internal Audit and Investigations Tebby Tukisi
*Acting Chief Director: M and E Lwazi Mahlangu
*Chief Director: Communications Lucky Mochalibane
*Chief Director: Director General’s Office Manthekeleng Monama
*Chief Director: SMU Mandisa Fatyela
*Team Leader: Turn Around Strategy Mahalingum Govender
*Minister’s Advisor Jon Lewis
*Minister’s Advisor Phillip Masilo
*Chief of Staff George Mudumela
*Administrator: Limpopo (Seconded from National Treasury) Mbuyi Dondashe
*Director: DM’s Office Deon Viljoen
*Ministry Sabelo Mali
Chief Director : Office of the Chief Financial Officer Kenosi Selane
Chief Director : Financial Planning and Reporting Juanita Prinsloo
* These management members are either members of EXCO or MINTOP or both. These officials are paid either by the DPW or by other government institutions that they are seconded from (i.e. Independent Development Trust). The Chief Directors mentioned below constitute management falling within the PMTE itself.

316 Department of Public Works | Annual Report 2012/13
Notes to the Annual Financial Statementsfor the year ended 31 March 2013
24. Management emoluments
Executive
2013
Basic salary
Non- pensionable
salaryPerformance
bonusOther
benefits TotalR ‘000 R ‘000 R ‘000 R ‘000 R ‘000
Chief Director: Office of the Chief Financial Officer 244 106 - - 350
Chief Director: Financial Planning and Reporting 513 219 44 91 867
757 325 44 91 1 217
2012
Basic salary
Non- pensionable
salaryPerformance
bonusOther
benefits TotalR ‘000 R ‘000 R ‘000 R ‘000 R ‘000
Chief Director: Financial Planning and Reporting 508 208 42 88 846
2013Restated
2012R’000 R’000
25. Financial instruments
Categories of financial instruments
Financial assets at amortised costFinance lease receivable 33 548 30 803Receivables from exchange transactions 2 062 804 1 527 646Cash and cash equivalents 829 1 399
2 097 181 1 559 848
Financial liabilities at amortised costFinance lease obligation 33 548 30 803Bank overdraft 1 402 323 1 254 988Payables from exchange transactions 1 548 024 1 422 356Retention liability 340 557 336 303
3 324 452 3 044 450
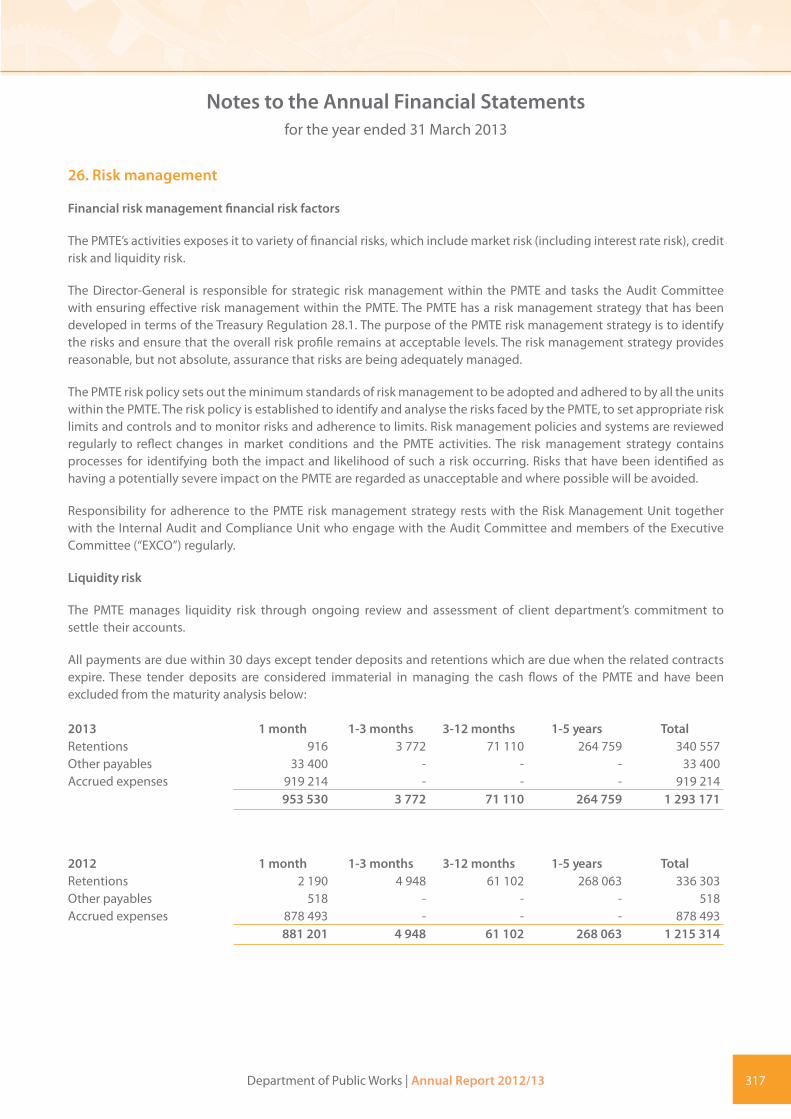
Department of Public Works | Annual Report 2012/13 317
Notes to the Annual Financial Statementsfor the year ended 31 March 2013
26. Risk management
Financial risk management financial risk factors
The PMTE’s activities exposes it to variety of financial risks, which include market risk (including interest rate risk), credit risk and liquidity risk.
The Director-General is responsible for strategic risk management within the PMTE and tasks the Audit Committee with ensuring effective risk management within the PMTE. The PMTE has a risk management strategy that has been developed in terms of the Treasury Regulation 28.1. The purpose of the PMTE risk management strategy is to identify the risks and ensure that the overall risk profile remains at acceptable levels. The risk management strategy provides reasonable, but not absolute, assurance that risks are being adequately managed.
The PMTE risk policy sets out the minimum standards of risk management to be adopted and adhered to by all the units within the PMTE. The risk policy is established to identify and analyse the risks faced by the PMTE, to set appropriate risk limits and controls and to monitor risks and adherence to limits. Risk management policies and systems are reviewed regularly to reflect changes in market conditions and the PMTE activities. The risk management strategy contains processes for identifying both the impact and likelihood of such a risk occurring. Risks that have been identified as having a potentially severe impact on the PMTE are regarded as unacceptable and where possible will be avoided.
Responsibility for adherence to the PMTE risk management strategy rests with the Risk Management Unit together with the Internal Audit and Compliance Unit who engage with the Audit Committee and members of the Executive Committee (“EXCO”) regularly.
Liquidity risk
The PMTE manages liquidity risk through ongoing review and assessment of client department’s commitment to settle their accounts.
All payments are due within 30 days except tender deposits and retentions which are due when the related contracts expire. These tender deposits are considered immaterial in managing the cash flows of the PMTE and have been excluded from the maturity analysis below:
2013 1 month 1-3 months 3-12 months 1-5 years TotalRetentions 916 3 772 71 110 264 759 340 557Other payables 33 400 - - - 33 400Accrued expenses 919 214 - - - 919 214
953 530 3 772 71 110 264 759 1 293 171
2012 1 month 1-3 months 3-12 months 1-5 years TotalRetentions 2 190 4 948 61 102 268 063 336 303Other payables 518 - - - 518Accrued expenses 878 493 - - - 878 493
881 201 4 948 61 102 268 063 1 215 314

318 Department of Public Works | Annual Report 2012/13
Notes to the Annual Financial Statementsfor the year ended 31 March 2013
Interest rate risk
Interest rate risk is the risk that the future cash flows of a financial instrument will fluctuate because of changes in market interest rates. The PMTE is exposed to limited interest rate risk as it sweeps transactions through commercial accounts to the Reserve Bank account.
The PMTE has no significant interest bearing assets, thus the entity’s income and operating cash flows are largely independent of changes in the market interest rates.
Credit risk
Credit risk is the risk of financial loss to the PMTE if a client department or counterparty defaults on its contractual obligations to the PMTE. The maximum exposure to credit risk is represented by the carrying amount of each financial asset in the Statement of Financial Position.
The PMTE may have financial assets arising out of transactions with suppliers due to overpayments and non-delivery.
The PMTE manages this risk by requiring retentions and or guarantees before contract work commences.
The credit risk of financial assets arising out of lease contracts as it relates to transactions with other government departments and institutions is actively managed where there are disagreements about inter governmental debt.
The PMTE first engages with the respective client to resolve the issue and if required involves National Treasury to mediate the situation. These various government institutions have no independent credit ratings.
Outstanding debt is assessed for impairment and amounts are not written off unless the authorised process is followed. However as a result of client department’s inability to accumulate savings to settle debt, a considerable amount of time may expire before the amount is collected.
The PMTE makes provision for this in the impairment calculation by discounting the expected future cash flows taking into account the expected period of payment.
The PMTE does not enter into additional leases with any client departments without first assessing the current outstanding debt of the client department.
Amounts that are neither past due nor impaired are considered to be recoverable as it relates to the current invoices not outstanding later than 30 days.
The nature of the PMTE’s exposure to credit risk and its objectives, policies and processes for managing credit have not changed significantly from the prior period.
2013Restated
2012R’000 R’000
Exposure to credit riskCash and cash equivalents 829 1 399Receivables 1 181 347 943 859

Department of Public Works | Annual Report 2012/13 319
Notes to the Annual Financial Statementsfor the year ended 31 March 2013
The carrying values of the above financial assets are net of any impairments and approximate their fair value.
None of the amounts disclosed above have been pledged as security or collateral for liabilities or contingent liabilities nor have any amounts been renegotiated or have been defaulted on.
Foreign exchange risk
The foreign currency risk of the PMTE is limited to the amount included in payables in foreign currency. The PMTE does not enter into any hedging transactions and does not trade in foreign currencies. The PMTE is currently unable to provide a reliable estimate of the foreign exchange losses included in the surplus / deficit for the year. Neither can it make a reliable estimate of the outstanding balances relating to payables in foreign currency. The loss is considered to be insignificant.
27. Subsequent events
Although National Treasury approved the establishment of the trading entity in 2006, the Department did not meet all the establishment requirements of Treasury and as such the business case for the formation of the PMTE was never formally approved. On the 28 March 2013 an interim business case was approved by the accounting officer to effectively transfer the property management functions and immoveable asset register of the DPW to the trading entity as at 1 April 2013. The recognition of the associated assets, liabilities, income and expenditures from this transfer of functions will be disclosed in the PMTE’s 31 March 2014 annual financial statements for the first time. The expected impact of this transfer is not yet determinable.
28. Changes in accounting policy
28.1 Employee benefits
2013Restated
2012R’000 R’000
The adoption of GRAP 23 had the following impact:
Increase in assets 1 730 1 445Decrease in liabilities (1 730) (1 445)Increase/(decrease) in net assets/(reserves) - -
Increase in revenue from non-exchange transactions 19 231 14 118Increase in employee costs (17 868) (12 893) Increase in operating expenses (1 363) (1 225)Effect on surplus/(deficit) - -
Effect on opening accumulated reserves - -
In the current financial year the PMTE has decided to early adopt GRAP 23 and the financial statements were prepared in such a way to meet the disclosures of GRAP 23. This has resulted in the GRAP 23 being applied retrospectively from the year ended 31 March 2012.
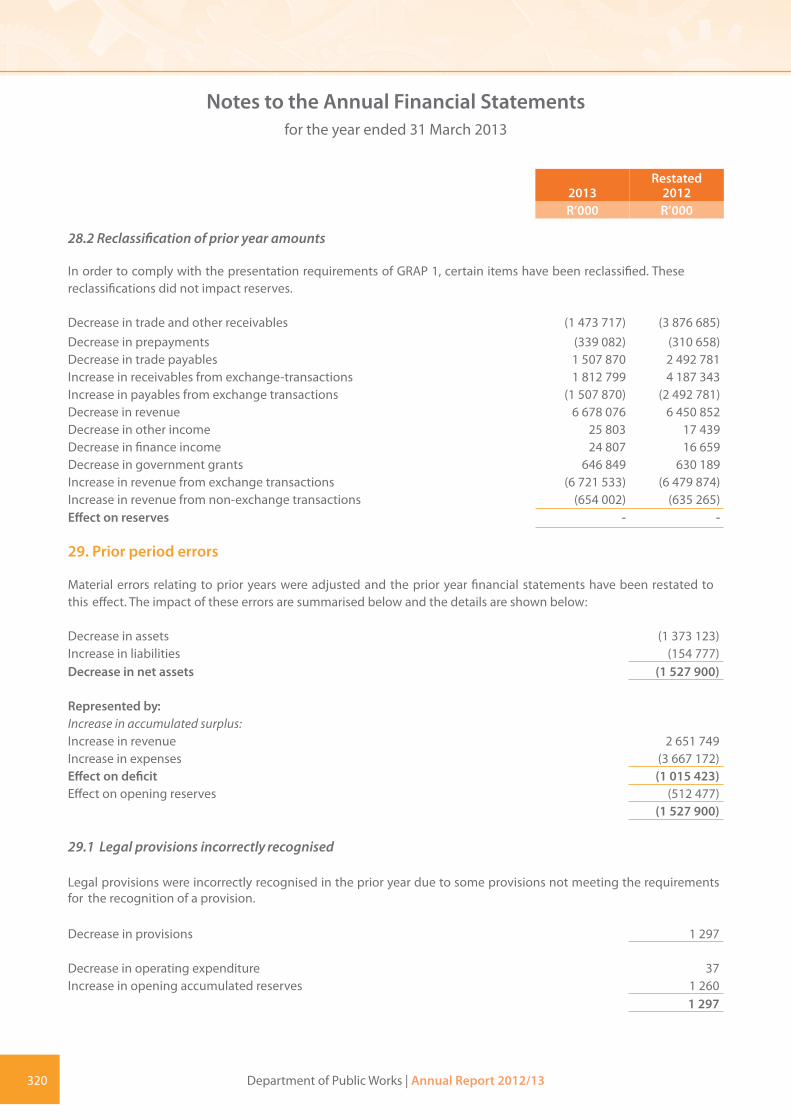
2013Restated
2012R’000 R’000
320 Department of Public Works | Annual Report 2012/13
Notes to the Annual Financial Statementsfor the year ended 31 March 2013
28.2 Reclassification of prior year amounts
In order to comply with the presentation requirements of GRAP 1, certain items have been reclassified. These reclassifications did not impact reserves.
Decrease in trade and other receivables (1 473 717) (3 876 685)Decrease in prepayments (339 082) (310 658)Decrease in trade payables 1 507 870 2 492 781Increase in receivables from exchange-transactions 1 812 799 4 187 343Increase in payables from exchange transactions (1 507 870) (2 492 781)Decrease in revenue 6 678 076 6 450 852Decrease in other income 25 803 17 439Decrease in finance income 24 807 16 659Decrease in government grants 646 849 630 189Increase in revenue from exchange transactions (6 721 533) (6 479 874)Increase in revenue from non-exchange transactions (654 002) (635 265)Effect on reserves - -
29. Prior period errors
Material errors relating to prior years were adjusted and the prior year financial statements have been restated to this effect. The impact of these errors are summarised below and the details are shown below:
Decrease in assets (1 373 123)Increase in liabilities (154 777)Decrease in net assets (1 527 900)
Represented by:Increase in accumulated surplus:Increase in revenue 2 651 749Increase in expenses (3 667 172)Effect on deficit (1 015 423)Effect on opening reserves (512 477)
(1 527 900)
29.1 Legal provisions incorrectly recognised
Legal provisions were incorrectly recognised in the prior year due to some provisions not meeting the requirements for the recognition of a provision.
Decrease in provisions 1 297
Decrease in operating expenditure 37Increase in opening accumulated reserves 1 260
1 297

Department of Public Works | Annual Report 2012/13 321
Notes to the Annual Financial Statementsfor the year ended 31 March 2013
Restated2012R’000
29. Prior period errors (continued)
29.2 Disallowances incorrectly disclosed as an asset
Disallowances were incorrectly disclosed as receivables which were reclassified to expenditure.
Decrease in receivables from exchange transactions (222 151)
Increase in operating expenditure (1 855)Decrease in opening accumulated reserves (220 296)
(222 151)
29.3 Recognition of loss on construction cost
An amount previously disclosed as a debtor is not recoverable, due to the inability to continue the building resulting from an incorrect assessment of the soil type, on a construction contract as we appointed the subcontractors. PMTE became liable for the loss.
Decrease in receivables from exchange transactions (60 086)
Increase in operating expenditure (486)Decrease in opening accumulated reserves (59 600)
(60 086)
29.4 Retention payables not recognised previously
The PMTE did not recognise retention amounts due as a payable in prior year financial statements
Increase in payables from exchange transactions (336 303)
Increase in operating expenditure (336 303)
29.5 Impairment corrections to apply to GRAP
The private lease debtors were restructured and the policy for impairment was updated to ensure compliance with GRAP.
Increase in provision for impairment on financial assets (730 469)
Increase in operating expenditure (201 615) Decrease in opening accumulated reserves (528 854)
(730 469)

322 Department of Public Works | Annual Report 2012/13
Notes to the Annual Financial Statementsfor the year ended 31 March 2013
Restated2012R’000
29. Prior period errors (continued)
29.6 Operating lease asset and liability incorrectly recognised
The entity has corrected its financial statements to comply with the requirement of GRAP 13. Leases were recalculated for both the operating lease (straight-lining) and finance lease.
Decrease in operating lease asset (874 311)
Decrease in revenue (143 590)Decrease in opening accumulated reserves (730 721)
(874 311)
Decrease in operating lease liability 874 311
Decrease in operating expenditure 143 590Increase in opening accumulated reserves 730 721
874 311
29.7 Finance lease receivable not in accordance with GRAP
The entity has corrected its financial statements to comply with the requirement of GRAP 13 – Leases regarding the accounting of certain leases as finance leases based on the substance of the underlying lease agreements (leases over 50 years). This has resulted in a prior period error due to non-compliance with the standard. The impact and details of these errors are summarised below:
Increase in finance lease receivable 30 803
Increase in revenue from exchange transactions 3 447Increase in accumulated reserves 27 356Decrease in opening accumulated reserves 30 803
Increase in finance lease obligation (30 803)
Increase in operating expenditure (3 447) Decrease in accumulated reserves (27 356)Increase in opening accumulated reserves (30 803)

Department of Public Works | Annual Report 2012/13 323
Notes to the Annual Financial Statementsfor the year ended 31 March 2013
Restated2012R’000
29. Prior period errors (continued)
29.8 All outstanding invoices not yet paid not considered for accruals
Invoices were identified that were recognised in the incorrect period.
Increase in payables from exchange transactions (613 271) Increase in receivables from exchange transactions 131 759Decrease in opening accumulated reserves (481 512)
Increase in operating expenditure (546 042) Decrease in revenue from non-exchange transactions (27) Increase in opening accumulated reserves 64 557Decrease in opening accumulated reserves (481 512)
29.9 Prepayment on leases determined based on an estimate
The lease prepayment balance was determined based on an estimate that was performed. The full operating lease balance was divided by 12 assuming that the March payment for all leases were made for the April charge. Adequate support did not exist for this estimate.
Decrease in receivables from exchange transactions (246 372)
Decrease in operating expenditure (246 372)
29.10 Construction projects not accounted for in accordance with GRAP
A WIP construction debtor was not recognised for the amounts that were accrued for (i.e. invoiced but not yet paid) and therefore also not yet billed. According to the Standard of GRAP on Construction Contracts (GRAP 11), construction revenue should be recognised to the extent that costs can be recovered. As the expense is recognised for the accrual the corresponding revenue should be recognised against the WIP construction debtor.
Increase in construction work-in-progress 400 225
Increase in revenue from exchange transactions 3 017 957Increase in operating expenditure (2 607 322)
410 635
29.11 Write-off of municipal services to tie into ageing
There was an unaccounted amount which had no supporting documentation on the municipal services recoverable account. The write-off amount was done to tie to the ageing analysis.
Decrease in receivables from exchange transactions (4 710)
Increase in operating expenditure (4 710)

324 Department of Public Works | Annual Report 2012/13
Notes to the Annual Financial Statementsfor the year ended 31 March 2013
Restated2012R’000
29. Prior period errors (continued)
29.12 Prepayments on municipal rates and taxes not recognised
Payments made in advance were not considered for municipal rates and taxes. Investigation revealed that these payments are made annually in advance for the period July - June. A prepayment was recognised for the three months (April - June) following year end.
Increase in receivables from exchange transactions 20 356
Decrease in operating expenditure 20 356
29.13 Incorrect off-setting
There was an incorrect off-setting of capital construction costs to state-owned accommodation.
Increase in revenue from exchange transactions 684 483
Increase in operating expenditure (684 483)
29.14 Fruitless expenditure included as a payable in error
The fruitless expenditure was incorrectly accounted for as a debt receivable income (credit balance) in prior year. Was cleared
Decrease in payables from exchange transactions 76
Increase in opening accumulated reserves 76
29.15 Restatement of prior year private leases receivable balance due to reconstruction
There was a restatement of the prior year private leases receivable balance due to the reconstruction of the balance that was
Increase in receivables from exchange transactions 246 470Increase in payables form exchange transactions (87 701)
158 769
Decrease in revenue from exchange transactions (948 138)Decrease in operating expenditure 811 890Increase in opening accumulated reserves 295 017
158 769

Department of Public Works | Annual Report 2012/13 325
Notes to the Annual Financial Statementsfor the year ended 31 March 2013
Restated2012R’000
29. Prior period errors (continued)
29.16 Revenue recognised in the incorrect period
Revenue was incorrectly recognised in the prior year as amounts received related to revenue for the 2012/13 financial year.
Increase in payables from exchange transactions (37 617)
Decrease in revenue from exchange transactions (37 617)
29.17 Restatement of prior year construction receivable balance due to reconstruction
There was a restatement of the prior year PACE and CA receivable balances due to the reconstruction of the balances that was performed.
Increase in receivables from exchange transactions 64 637
Increase in opening accumulated reserves 64 637
2013R’000
30. Budget information
Reconciliation of budget to actual
Net cash flows from operating activities (147 905)Net decrease in cash and cash equivalents per cash flow statement (147 905)
Cash surplus/(deficit) per statement of comparison of budget and actual amounts (147 905)(147 905)
Cash surplus/(deficit) per statement of comparison of budget and actual amounts (147 905)Surplus per statement of financial performance 153 450Difference 5 545
The difference between the cash surplus per the Statement of Comparison of Budget and Actual Amounts and the Statement of Financial Performance relates to non-cash movement (see note 19).
Explanations of the variances between the actual amount and final budgeted amount:
Accommodation charges leasehold
The revenue projection is based on the invoices issued, while the actual represents the amount received in the bank account. The balance of the amount not received will be recognised as debtors.

326 Department of Public Works | Annual Report 2012/13
Notes to the Annual Financial Statementsfor the year ended 31 March 2013
Municipal services management fees
This amount is estimated based on the invoices issued on the use of municipal services. The amount will change based on the actual consumption by the client departments.
Bursaries
An amount of R7 million was made available to DPW in accordance to the agreement with the Department, but only R2.4 million was claimed by the Department.
Cleaning and gardening
The expenditure is based on payments made to suppliers contracted to deliver these services. Of the amount outstanding at year-end, R12 million represent accruals where the service was delivered, but not yet paid for.
Computer services
The entity received permission to acquire its own billing and accounting system. It has been decided to look at more than just the basic system, but also to include functionality in terms of the immovable asset register, lease register and other related property management functions. The acquisition was delayed due to the change in requirements.
Planned maintenance (capital)
The budget is based on the cash flow projection of hundreds of projects. These cash flows changes constantly due to SCM processes, conditions on site, etc. Although the fluctuations are managed as much as possible during the year, through interventions where necessary, the situation might change during the last week of the financial year. It also has to be noted that the business system on which these projects are managed (WCS) closed for payments on 27 March 2013 to allow for the changes that had to be implemented in terms of the new SCOA structure.
Details on changes from the approved budget to the final budget
Accommodation charges leasehold
The capital portion of the revenue and expenditure was off-set in prior years and the ENE figures therefore excludes the capital. The amount is R694 million. The private lease budget is based on what the PMTE expects to pay and receive (equal in and out) for private leases based on the information at any given time. The PMTE allow for renewal of leases, but this estimate cannot be accurate before the actual renewal is done. This budget moves during the year as new leases are entered into and others expire. At the beginning of the year (3 months after ENE is finalised) it was known that the leases would be less and adjusted the figures accordingly. This is not an appropriated amount and can fluctuate. The difference between the budget in the ENE and the beginning of the year is R53 million.
Fines
This cannot be accurately predicted as it is based on the actual penalties against contractors. Only a nominal amount is budgeted for.
Interest received
This cannot be accurately predicted as it is based on the interest earned on the bank account on deposits and receivables made into the commercial account. A nominal amount is budgeted for.

Department of Public Works | Annual Report 2012/13 327
Notes to the Annual Financial Statementsfor the year ended 31 March 2013
Municipal services management fees
The management fee is based on 5% of the accounts handled. As accounts are based on actual consumption by users, the amount will adjust during the year.
Recoveries
These are amounts recovered in subsequent years (overpayments to contractors, etc.) and cannot be predicted unless the amount is known.
Advisory services
An amount was budgeted for intervention on the financial statements for PMTE. This project grew to include DPW and SCM and is being funded by DPW through their turnaround budget.
Bank charges
Nominal amount that cannot be predicted in advance.
Cleaning and gardening
The budget is based on contracts in place and new contracts. Not all contracts were renewed as some facilities were taken over by EPWP.
Computer services
Budgeted amount for an Accounting and Billing system for the PMTE. Recent discussions have indicated that a system should be looked at that can include all the PMTE functions.
Interest paid
Nominal amount that cannot be predicted in advance.
Municipal services
Nominal amount that cannot be predicted in advance.
Operating leases
See accommodation charges leasehold and note the relationship between revenue and expenditure on this item.
Planned maintenance (current and capital)
The budget is based on a project list (implementation plan). Due to the nature of these projects and the different variables in terms of SCM etc. the budget is re-aligned on a quarterly basis to ensure optimum expenditure at the end of the year.
Property rates
The increase in this budget was due to arrear rates accounts reconciled and paid by the Regions. The PMTE is still responsible for provincial accounts that might be in arrears from the period prior to the devolution of this budget.

328 Department of Public Works | Annual Report 2012/13
Notes to the Annual Financial Statementsfor the year ended 31 March 2013
Rent on land
See accommodation charges lease hold as rent on land forms part of private leases.
Security
This item relates to security at vacant properties and can change during the year depending on the number of vacant properties and the period of vacancy.
Tender adverts
Nominal amount that cannot be predicted in advance.
Thefts and losses
This item is not budgeted for at the beginning of the year, but funds are made available as savings are realised during the year.
Unplanned maintenance
The nature of this item makes it difficult to forecast as expenditure is based on actual breakdown calls. The budget is assessed during the year and funds are moved to other items if and when necessary.

Department of Public Works | Annual Report 2012/13 329
Appendix A List of Acts
Short Title of the Act Purpose of the Act
Before Union (prior to 1910)
Cape Outspans Act 17 of 1902 Resumption of unused Outspans, and cancellation and delimitation of Outspan Servitudes.
Pretoria and Military Supply Ordinance,1905
To render certain Crown Land to the Municipality of Pretoria upon certain conditions.
During Union (1910 – 1961)
Rhodes Will (Groote Schuur Devolution) Act 09 of 1910
To provide for the surrender of the Groote Schuur Estate to the government of the Union of South Africa in accordance with the Will of the late Cecil John Rhodes and for the release of the Trustees.
Agricultural Holding (Transvaal) Registration Act 22 of 1919
To approve the division and registration of land in formed Transvaal as an agricultural holding and to cancel such certificates at request for owner.
Bethelsdorp Settlement Act 34 of 1921
To provide for the settlement of certain matters in dispute at Bethelsdorp between the London Missionary Society and its successors, the Congregational Union Church Aid and Missionary Society of South Africa and the Bethelsdorp Board of Supervisors.
Mooi River Township Lands Act 05 of 1926
To provide for the granting of certain land to the Local Board of Township of Mooi River and matters incidental therefore.
Carnarvon Outer Commonage Sub-division Act 17 of 1926
To provide for the cancellation of the title issued under section 14 of Act No 19 of 1913 to the Committee of Management of the Carnarvon Outer Commonage, the sale of certain sowing lands on the said Commonage, the subdivision and allocation of the remaining extent of the said Commonage among the owners of ‘opstallen’ and persons having grazing and sowing rights thereon and the issue of individual titled to such owners and persons, the disposal of certain other lands owned by the said Committee, and matters incidental thereto.
Payment of Quitrent (Cape) Act 14 of 1927
To regulate the payment of quitrent by part-owner of land, subject to payment of quitrent and situated in the province of the Cape of Good Hope.
Marburg Immigration Settlement (Social Board of Management) Act 43 of 1927
To provide for the constitution of a local Board of Management for the Marburg Immigration Settlement, County of Alfred, in the Province of Natal and certain incidental matters.
Cape Outspans Act 17 of 1937 To provide for the issue of deeds of grant to divisional and municipal councils in respect of Outspans consisting of Crown Land situated in the Cape of Good Hope.
Municipal Lands (Muizenberg) Act 09 of 1941
To make better provision for attaining the object of certain lands adjoining False Bay that are vested in the Council of the City of Cape Town.
Cape Town Foreshore Act 26 of 1950
To provide for the management, control and development of the Cape Town foreshore and to that end, to establish a board in respect of the said foreshore and to define its functions and to provide for through the incidental matters.
Republic (1961 – 1994)
State Land Disposal Act 48 of 1961 To provide for the disposal of certain State Land and for matters incidental thereto, and to prohibit the acquisition of State Land by prescription.
Paarl Mountain Act 83 of 1970 To provide for the transfer of the ownership of certain land to the Paarl Municipality for certain purposes and the expropriation of certain rights in such land; to empower the said Municipality to donate a portion or portions of the said land to the State for the purpose of a Language Monument, and to provide for other incidental matters.
Marburg Immigration Settlement Regulation Act 50 of 1971
To provide for the subdivision of commonages within the Marburg Immigration Settlement situated in the County of Alfred, province of Natal and the allocation of the relevant portions to, and the dividing of the other assets of the Marburg Immigration Settlement Board, among registered owners of lots within the said Settlement, for matters incidental thereto.

330 Department of Public Works | Annual Report 2012/13
Short Title of the Act Purpose of the Act
Church Square, Pretoria, Development Act 53 of 1972
To provide for the management and upkeep of Church Square in Tshwane.
General Law Amendment Act 102 of 1972
Section 34. Certain conditions of title applying in respect of immovable property owned by the State to lapse in certain circumstances.
The Lake Areas Development Act 39 of 1975
To provide for the establishment of lake areas under the control of a Lake Areas Development Board, and for matters incidental thereto.
Expropriation Act 63 of 1975 To provide for the expropriation of land and other property for public and certain other purpose and for matters incidental thereto.
Rating of State Property Act 79 of 1984
To repeal certain Acts granting exemption in respect of certain State property from rates levied on immovable property by local authorities; provided that such rates may, notwithstanding certain other exemptions, be levied on other State property, make provision for rebates in respect of such rates levied on State property, and provide for matters such rates levied on State property, and provide for matters incidental thereto.
Transfer of Powers and Duties of the State President Act 97 of 1986
To amend certain laws so as to vest certain functions presently assigned to the State President, in the respective Ministers of State who are charged with the administration of those laws; and to provide for incidental matters.
Land Affairs Act 101 of 1987 To provide for the determination of amounts of compensation, purchase prices or rents in respect of immovable property expropriated, purchased or leased by DPW and Land Affairs for public purposes and providing advice with regard to the value of land and purchase prices or rent in respect of certain immovable property; for that purpose to make provision for the establishment of a Land Affairs Board; and to provide for incidental matters.
Commonwealth War Graves Act 08 of 1992
To prohibit the desecration, damage or destruction of Commonwealth War Graves, to regulate the disinterment, removal, reinterment or cremation of Commonwealth war burial and the removal, alteration, repair or maintenance of Commonwealth War Graves and to provide for matters connected therewith.
South Africa (1994 to date)
Parliamentary Village Management Board Act 96 of 1998
To provide for the establishment of a Parliamentary Villages Management Board and matters incidental thereto.
Construction Industry Development Board Act 38 of 2000
To provide for the establishment of the Construction Industry Development Board, and matters incidental thereto.
Council for the Built Environment Act 43 of 2000
To provide for the establishment of the Council for the Built Environment and matters incidental thereto.
Architectural Profession Act 44 of 2000
To provide for the establishment of the Council for the Architectural Profession and matters incidental thereto.
Landscape Architectural Professional Act 45 of 2000
To provide for the establishment of the Council for the Landscape Architectural Profession and matters incidental thereto.
Engineering Profession of South Africa Act 46 of 2000
To provide for the establishment of the Council for the Engineering Profession and matters incidental thereto.
Property Valuers Profession Act 47 of 2000
To provide for the establishment of the Council for the Property Valuers Profession and matters incidental thereto.
Project and Construction Management Profession Act 48 of 2000
To provide for the establishment of the Council for the Project and Construction Management Profession and matters incidental thereto.
Quantity Surveying Profession Act 49 of 2000
To provide for the establishment of the Council for the Quantity Surveying Profession and matters incidental thereto.
Government Immovable Asset Management Act 19 of 2007
The purpose of the Act is to provide for a uniform framework for the management of an immovable asset that is held or used by a national or provincial department to ensure the coordination of the use of an immovable asset with the service delivery objectives of a national or provincial department; to provide for issuing of guidelines and minimum standards in respect of immovable asset management by a national or provincial department.

Department of Public Works | Annual Report 2012/13 331
Notes

332 Department of Public Works | Annual Report 2012/13
Notes

Switchboard: 012 406 2000/3000
Communications Unit: 012 406 1830/1
Fax: 086 276 8958
Website: www.publicworks.gov.za
Department of Public Works
Tshwane Central 0001
CGO Building
264 Madiba Street (Cnr Bosman & Madiba Street)
rP: 285/2013
iSbN: 978-0-621-42222-1
DPW Women’s Day celebration
Related Documents


![TRANSNET PORT TERMINALS · letter. 2 Broad-Based Black Economic Empowerment [B-BBEE] Transnet fully endorses and supports the Government’s Broad-Based Black Economic Empowerment](https://static.cupdf.com/doc/110x72/5ed000fc14976f1c3c16fc7a/transnet-port-terminals-letter-2-broad-based-black-economic-empowerment-b-bbee.jpg)


