Sources of fine sediment stored in agricultural lowland streams, Midwest, USA Jasmeet Lamba a,b, ⁎, A.M. Thompson a , K.G. Karthikeyan a , Faith A. Fitzpatrick c a Department of Biological Systems Engineering, University of Wisconsin, Madison, Madison, WI 53706, USA b USDA-ARS, Pasture Systems & Watershed Management Research Unit, Building 3702 Curtin Road, University Park, PA 16802, USA c U.S. Geological Survey, 8505 Research Way, Middleton, WI 53562, USA abstract article info Article history: Received 11 June 2014 Received in revised form 5 February 2015 Accepted 6 February 2015 Available online 16 February 2015 Keywords: Sediment sources Stream bed sediment Sediment tracers Land use Stream bank erosion Sediment fingerprinting Agricultural activities can accelerate the offsite transport of productive soil from fields leading to stream water quality degradation. Identification of the nature and relative contribution of different sources to fine-grained sediment (e.g., silts, clays) in streams is important to effectively focus agricultural best management practices in watersheds. Sediment fingerprinting techniques through the use of geochemical tracers are commonly used to differentiate relative contribution from various sources. Research was conducted in lowland streams in the Pleasant Valley watershed in South Central Wisconsin (USA) to identify provenance of fine-grained sediment deposits and evaluate the impact of land use on relative contributions from the following potential sources: crop- land, pasture, woodland, and eroding stream banks. Results show that both agriculture (croplands and pastures) and eroding stream banks are primary sources to fine sediment deposits on the stream bed with contributions ranging from 19 to 100% and 0 to 81%, respectively. The increase in area under agricultural land use within a subwatershed results in greater contribution from agriculture (R 2 = 0.846, p = 0.0034). Relative contributions from eroding stream banks increased with increasing area under grasslands and woodlands within a subwatershed (R 2 = 0.814, p = 0.0055). Subwatersheds with greater mass of fine sediment deposited on the stream bed per unit area should be prioritized for best management practices. The conservation practices should be targeted to stream banks or croplands depending on the dominant source of fine sediment within a subwatershed. Site specific changes in relative contributions from different sources to fine-grained sediment in this watershed highlights the complexities involved in sediment transport dynamics. The nested sampling sites helped determine that sediment dynamics at the subwatershed scale need to be considered for application of targeted conservation techniques. © 2015 Elsevier B.V. All rights reserved. 1. Introduction Fine-grained sediment eroded from agricultural landscapes have long been recognized as a major pollutant source causing degradation of surface water bodies (Walling and Fang, 2003; Devereux et al., 2010). Excessive transport of sediment-bound nutrients such as phos- phorus (P) to surface waters causes eutrophication of streams, rivers, and lakes, decreasing their recreational value. Excessive sediment trans- port and deposition degrades habitat by scouring and smothering spawning areas and filling in pools (Wood and Armitage, 1997). Exces- sive sedimentation and nutrient losses combined account for almost 20% of all causes of impairment for U.S. 303(d) listed waters, i.e., list of impaired waters in the U.S. that do not meet water quality standards based on Section 303(d) of the Clean Water Act (USEPA, 2010). Different processes that could contribute to sedimentation problems include erosion of uplands and channel bank collapse/erosion (Wilson et al., 2008). The linkage among upland erosion, sediment mobilization, and downstream sediment yield is complex due to uncertainties associ- ated with sediment retention and storage at intermediate locations such as floodplains, stream beds, and foots of hillslopes (Walling and Collins, 2008). The increase in deposition and storage of fine sediment on stream beds could result in the degradation of the physical, chemical, and biolog- ical status of watersheds (Wood and Armitage, 1997; Collins and Walling, 2007). Fine sediment deposition on stream beds can cause damage to sal- monid spawning beds by reducing the oxygen supply to hatching ova and invertebrates (Walling and Amos, 1999). Dispersion and transport of nu- trients, such as P, are also influenced by fine sediment deposited on the stream bed (Jarvie et al., 2005). The fine sediment stored on the stream bed can create a “legacy” effect, as there is a “lag-time” between best management practice (BMP) implementation and achievement of de- sired water quality goals (Meals et al., 2010; Osmond et al., 2012). Factors responsible for excessive sediment loading to agricultural streams are upland soil erosion and subsequent delivery to streams, gul- lying and channel incision in headwaters, trampling of stream banks by Geomorphology 236 (2015) 44–53 ⁎ Corresponding author. Tel.: +1 814 863 0948; fax: +1 814 863 0935. E-mail address: [email protected] (J. Lamba). http://dx.doi.org/10.1016/j.geomorph.2015.02.001 0169-555X/© 2015 Elsevier B.V. All rights reserved. Contents lists available at ScienceDirect Geomorphology journal homepage: www.elsevier.com/locate/geomorph

Welcome message from author
This document is posted to help you gain knowledge. Please leave a comment to let me know what you think about it! Share it to your friends and learn new things together.
Transcript
Geomorphology 236 (2015) 44–53
Contents lists available at ScienceDirect
Geomorphology
j ourna l homepage: www.e lsev ie r .com/ locate /geomorph
Sources of fine sediment stored in agricultural lowland streams,Midwest, USA
Jasmeet Lamba a,b,⁎, A.M. Thompson a, K.G. Karthikeyan a, Faith A. Fitzpatrick c
a Department of Biological Systems Engineering, University of Wisconsin, Madison, Madison, WI 53706, USAb USDA-ARS, Pasture Systems & Watershed Management Research Unit, Building 3702 Curtin Road, University Park, PA 16802, USAc U.S. Geological Survey, 8505 Research Way, Middleton, WI 53562, USA
⁎ Corresponding author. Tel.: +1 814 863 0948; fax: +E-mail address: [email protected] (J. Lamba).
http://dx.doi.org/10.1016/j.geomorph.2015.02.0010169-555X/© 2015 Elsevier B.V. All rights reserved.
a b s t r a c t
a r t i c l e i n f oArticle history:Received 11 June 2014Received in revised form 5 February 2015Accepted 6 February 2015Available online 16 February 2015
Keywords:Sediment sourcesStream bed sedimentSediment tracersLand useStream bank erosionSediment fingerprinting
Agricultural activities can accelerate the offsite transport of productive soil from fields leading to stream waterquality degradation. Identification of the nature and relative contribution of different sources to fine-grainedsediment (e.g., silts, clays) in streams is important to effectively focus agricultural best management practicesin watersheds. Sediment fingerprinting techniques through the use of geochemical tracers are commonly usedto differentiate relative contribution from various sources. Research was conducted in lowland streams in thePleasant Valley watershed in South Central Wisconsin (USA) to identify provenance of fine-grained sedimentdeposits and evaluate the impact of land use on relative contributions from the following potential sources: crop-land, pasture, woodland, and eroding stream banks. Results show that both agriculture (croplands and pastures)and eroding stream banks are primary sources to fine sediment deposits on the stream bed with contributionsranging from 19 to 100% and 0 to 81%, respectively. The increase in area under agricultural land use within asubwatershed results in greater contribution from agriculture (R2 = 0.846, p = 0.0034). Relative contributionsfrom eroding stream banks increased with increasing area under grasslands and woodlands within asubwatershed (R2 = 0.814, p = 0.0055). Subwatersheds with greater mass of fine sediment deposited on thestream bed per unit area should be prioritized for best management practices. The conservation practices shouldbe targeted to stream banks or croplands depending on the dominant source of fine sediment within asubwatershed. Site specific changes in relative contributions from different sources to fine-grained sediment inthis watershed highlights the complexities involved in sediment transport dynamics. The nested samplingsites helped determine that sediment dynamics at the subwatershed scale need to be considered for applicationof targeted conservation techniques.
© 2015 Elsevier B.V. All rights reserved.
1. Introduction
Fine-grained sediment eroded from agricultural landscapes havelong been recognized as a major pollutant source causing degradationof surface water bodies (Walling and Fang, 2003; Devereux et al.,2010). Excessive transport of sediment-bound nutrients such as phos-phorus (P) to surface waters causes eutrophication of streams, rivers,and lakes, decreasing their recreational value. Excessive sediment trans-port and deposition degrades habitat by scouring and smotheringspawning areas and filling in pools (Wood and Armitage, 1997). Exces-sive sedimentation and nutrient losses combined account for almost20% of all causes of impairment for U.S. 303(d) listed waters, i.e., list ofimpaired waters in the U.S. that do not meet water quality standardsbased on Section 303(d) of the Clean Water Act (USEPA, 2010).
Different processes that could contribute to sedimentation problemsinclude erosion of uplands and channel bank collapse/erosion (Wilson
1 814 863 0935.
et al., 2008). The linkage among upland erosion, sedimentmobilization,and downstream sediment yield is complex due to uncertainties associ-atedwith sediment retention and storage at intermediate locations suchas floodplains, stream beds, and foots of hillslopes (Walling and Collins,2008).
The increase in deposition and storage of fine sediment on streambeds could result in the degradation of the physical, chemical, and biolog-ical status ofwatersheds (Wood andArmitage, 1997; Collins andWalling,2007). Fine sediment deposition on streambeds can cause damage to sal-monid spawning beds by reducing the oxygen supply tohatching ova andinvertebrates (Walling and Amos, 1999). Dispersion and transport of nu-trients, such as P, are also influenced by fine sediment deposited on thestream bed (Jarvie et al., 2005). The fine sediment stored on the streambed can create a “legacy” effect, as there is a “lag-time” between bestmanagement practice (BMP) implementation and achievement of de-sired water quality goals (Meals et al., 2010; Osmond et al., 2012).
Factors responsible for excessive sediment loading to agriculturalstreams are upland soil erosion and subsequent delivery to streams, gul-lying and channel incision in headwaters, trampling of stream banks by

45J. Lamba et al. / Geomorphology 236 (2015) 44–53
livestock, bank erosion due to hydraulic forces during flood events, andland use changes (e.g., Conservation Reserve Program, CRP (a land con-servation program administered by the U.S. Department of AgricultureFarm Service Agency) grasslands to croplands) (Walling and Amos,1999; Wynn, 2006). The linkage between upland soil erosion and sedi-ment and nutrient delivery to streams is complex because of multiplespatial and temporal scales of sediment delivery and associated lag-times between when soil is eroded and when it reaches a stream(Meals et al., 2010). Sediment delivery to streams from uplands is influ-enced by land use type, spatial pattern of land use within a watershed,hillslope-to-river connectivity, management practices, soil type, andslope (Walling, 1983; Koiter et al., 2013a; Lamba et al., 2015). At alocal level, over-widened channels tend to have problems with sedi-mentation because of reduced flow velocities (Walling and Amos,1999). Fine sediment deposition can be an indication of reduced trans-port capacity of streams or that the sediment load delivered tostreams fromupland or streambank erosion has exceeded the transportcapacity (Lisle and Hilton, 1992). Agricultural lowland streams areprone to fine sediment deposition, especially in the Driftless Area ofsouthwest Wisconsin, where soil erosion, gullying, and headcutting insteep uplands since Euro-American settlement in themid-1800s result-ed in thick accumulations of sediment in river bottomlands (Happ et al.,1940; Trimble and Lund, 1982; Faulkner, 1998; Knox, 2001, 2002,2006). Much of the sediment eroded during the 18th, 19th, and 20th cen-turies remains stored in floodplains, along channel margins, and inchannels (Faulkner, 1998; Knox, 2001, 2002, 2006; Fitzpatrick et al.,2009). Consequently, modern channels have unnaturally high banks,and simple lateral migration processes result in more sediment erodedfrom stream banks compared to pre-settlement conditions (Fitzpatricket al., 2009). Extensive conservation practices in the 20th century havereduced upland runoff and erosion, but sedimentation rates in lowlandareas are likely still double to an order of magnitude higher than pre-settlement rates (Knox, 2001; Fitzpatrick et al., 2009).
To successfully reduce sediment loads to surfacewaters andultimate-ly reduce fine sediment deposition in streams caused by an oversupply ofsediment, the source or provenance of fine sediment must be identifiedto effectively target and implement appropriate BMPs. Sediment finger-printing has been increasingly employed to identify contributions fromdifferent sources to in-stream sediment through the use of natural andanthropogenic tracers (Davis and Fox, 2009; Koiter et al., 2013a;Walling, 2013). Different types of fingerprinting properties that havebeen successfully used in the past include, but are not limited to, falloutradionuclides (Wilson et al., 2008; Huisman et al., 2013; Lamba et al.,2014), metals (Walling et al., 2008), base cations (Walling et al., 2008),mineral magnetic properties (Walling et al., 1999), and stable isotopes(Fox and Papanicolaou, 2007). Since numerous factors (e.g., geologic par-ent material, land use) control the distribution of inorganic tracers, in-cluding major and trace elements in the watershed (Davis and Fox,2009), it is difficult to develop a predictive approach to quantify their dis-tribution across the landscape. To address this issue, multivariate ap-proaches are commonly used in which a large number of fingerprintingproperties are selected and statistical analysis is conducted to determinethe optimum number of fingerprinting properties that will best appor-tion sediment to various sources (Davis and Fox, 2009).
Potential sediment sources that have been considered in the past in-clude uplands (woodland, pasture, and cultivated), channel banks, andstreet residue (Collins et al., 1997; Devereux et al., 2010).Most previousstudies have focused on identifying the sources of in-stream suspendedsediment and sediment deposited on floodplains (e.g., Collins et al.,1997; Owens et al., 1999; Walling et al., 1999, 2008; Mukundan et al.,2010; Huisman et al., 2013; Smith and Blake, 2014) and some studieshave been conducted to identify provenance of fine sediment depositedon stream beds (e.g., Collins and Walling, 2007; Collins et al., 2013a,b;Koiter et al., 2013b). Sources of suspended sediment can change spatial-ly within a watershed (Koiter et al., 2013b; Lamba et al., 2015) becauseof different factors such as land use type (Gellis et al., 1999, 2009; Carter
et al., 2003; Lamba et al., 2014) and management operations (Collinset al., 2010; Lamba et al., 2015). The major goal of this study was to in-vestigate the impact of land use distribution on relative contributionsfrom different sources to fine sediment deposited on the stream bed.The specific objectives of this study were to: (a) apportion relative con-tributions from different sources to fine sediment deposited on streambeds at the subwatershed scale, and (b) evaluate the impact of percentarea under managed (croplands and pastures) and unmanaged (wood-lands and grasslands) land use within a subwatershed on the relativesource contributions to fine sediment.
This study was part of a pilot project, evaluating the effectiveness oftargeted conservation efforts to reduce nutrients and sediment deliveryto streams, launched by a group of partners from federal (USGS andUSDA-NRCS), state (Wisconsin Department of Natural Resources),county (Dane County Land Conservation Division (DCLCD)), non-profit (The Nature Conservancy) agencies, and the University ofWisconsin-Madison in 2008. Baseline data were collected from 2006to 2009 for stream water quality, channel geomorphology conditionsand sediment budgeting, and biological integrity. As part of the largerbaseline data collection activities, sediment fingerprinting analysiswas performed on the suspended sediment (Lamba et al., 2014, 2015)as well as stream bed sediment.
2. Methods
2.1. Study site
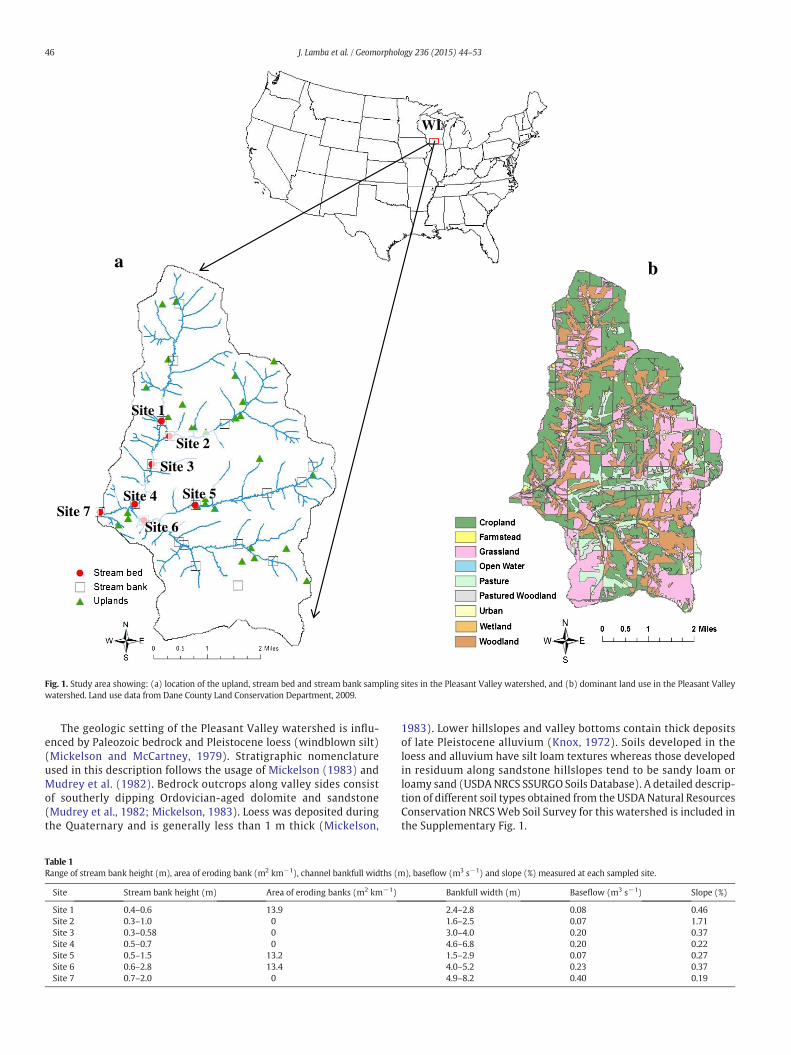
The study was conducted in the Pleasant Valley watershed located inthe unglaciated Driftless Area of south central Wisconsin (Fig. 1a). Thiswatershed is part of the Pecatonica River Basin of the Upper MississippiRiver Basin. Thewatershed area is approximately 5000 hawithmoderateto steep wooded valley slopes with agricultural uplands and valley bot-tomlands and frequent sandstone and dolomite cliffs (Mickelson, 1983).The watershed has average slope of 11% primarily on silt loam soils.
The major land uses in this watershed consist of cropland (34%),Conservation Reserve Program (CRP) grassland (28%), woodland(ungrazed woodland) (22%), pasture (8%), and pastured woodland(grazed woodland) (4%) (Fig. 1b). The land use data were obtainedfrom the DCLCD, Dane County, Wisconsin and were based on data col-lected in 2009. Major row crops grown in this watershed include corn,soybean, and alfalfa. The average flow and sediment load measured atthe watershed outlet between October 2006 and September 2012 was0.59m3 s−1 and 27.2Mg km−2 yr−1, respectively. The average precipita-tion for the same period recorded at the National Oceanic and Atmo-spheric Administration weather station located about 8 km away fromthe watershed outlet was 917 mm. Streams in this watershed are fedby numerous springs and thus have the potential to support cold waterfisheries. The Pleasant Valley branch of this watershed is on theWiscon-sin Impaired Water 303(d) list due to degraded habitat from non-pointsource (NPS) pollution contributions to sediment/total suspended solids(DNR, 2012). Channels along the main stem of the Pleasant Valley havemeandering or straight planforms and riffle/pool geomorphic sequences.Depositional bars, composed of layers of fine sand and silt, are commonwhere the channels widen. Fine sediment deposition is common inslower moving sections where slopes are less steep, in pools, and alongchannel margins. Channel beds are generally sand and gravel, with occa-sional cobbles and boulders. Stream banks are generally composed ofsilty alluvium. Streambank heights and channel bankfull widths vary sig-nificantly within this watershed. For example, at site 1 the stream bankheight and channel bankfull width ranged from 0.4 to 0.6 m and 2.4 to2.8m, respectively, whereas, at site 7 (watershed outlet) the correspond-ing values were higher (stream bank height: 0.7 to 2m; channel bankfullwidth: 4.9 to 8.2 m). The range of stream bank height and channelbankfull widths at each site is included in Table 1. The baseflow andslope measured at fine sediment sample collection sites ranged from0.07 to 0.40 m3 s−1 and 0.19 to 1.71%, respectively (Table 1).
Site 1
Site 5
Site 3
Site 2
Site 7Site 6
Site 4
a b
WI
Fig. 1. Study area showing: (a) location of the upland, stream bed and stream bank sampling sites in the Pleasant Valley watershed, and (b) dominant land use in the Pleasant Valleywatershed. Land use data from Dane County Land Conservation Department, 2009.
46 J. Lamba et al. / Geomorphology 236 (2015) 44–53
The geologic setting of the Pleasant Valley watershed is influ-enced by Paleozoic bedrock and Pleistocene loess (windblown silt)(Mickelson and McCartney, 1979). Stratigraphic nomenclatureused in this description follows the usage of Mickelson (1983) andMudrey et al. (1982). Bedrock outcrops along valley sides consistof southerly dipping Ordovician-aged dolomite and sandstone(Mudrey et al., 1982; Mickelson, 1983). Loess was deposited duringthe Quaternary and is generally less than 1 m thick (Mickelson,
Table 1Range of stream bank height (m), area of eroding bank (m2 km−1), channel bankfull widths (m
Site Stream bank height (m) Area of eroding banks (m2 km−1)
Site 1 0.4–0.6 13.9Site 2 0.3–1.0 0Site 3 0.3–0.58 0Site 4 0.5–0.7 0Site 5 0.5–1.5 13.2Site 6 0.6–2.8 13.4Site 7 0.7–2.0 0
1983). Lower hillslopes and valley bottoms contain thick depositsof late Pleistocene alluvium (Knox, 1972). Soils developed in theloess and alluvium have silt loam textures whereas those developedin residuum along sandstone hillslopes tend to be sandy loam orloamy sand (USDANRCS SSURGO Soils Database). A detailed descrip-tion of different soil types obtained from the USDANatural ResourcesConservation NRCSWeb Soil Survey for this watershed is included inthe Supplementary Fig. 1.
), baseflow (m3 s−1) and slope (%) measured at each sampled site.
Bankfull width (m) Baseflow (m3 s−1) Slope (%)
2.4–2.8 0.08 0.461.6–2.5 0.07 1.713.0–4.0 0.20 0.374.6–6.8 0.20 0.221.5–2.9 0.07 0.274.0–5.2 0.23 0.374.9–8.2 0.40 0.19
47J. Lamba et al. / Geomorphology 236 (2015) 44–53
2.2. Sample collection
Representative samples of sediment sourcematerials were collectedwithin the watershed (Fig. 1a) in the summer of 2010. The potentialsources of sediment considered for this study included: (a) based onland use type: cropland, pasture, andwoodland, and (b) eroding streambank. Some of the pastured fields in this watershed were converted tocroplands (personal communication, Mr. Curt Diehl, DCLCD, DaneCounty, Wisconsin). Rotation of fields between cropland and pastureis common and, therefore, pasture and cropland were combined intoone land use category and referred to as agriculture (Gellis and Noe,2013). Surface soil samples (top 2.5 cm, the layer susceptible to detach-ment and mobilization by surface runoff) from agriculture (n = 19)and, ungrazed and grazed woodland (n = 9) were collected in a20 × 20 m grid with 5 m spacing and composited for analysis.
The sample collection (stream banks and fine sediment deposited instream bed) for this sediment fingerprinting study was part of a largerassessment of channel geomorphic conditions in Pleasant Valley con-ducted by the USGS in 2009–2010. Stream bank samples were collectedfrom eroding banks along 50–100m reaches at 24 sites. Composite sed-iment cores (2.5 cm deep into the eroding face of the stream bank)within a sampling reach were collected from three to six points alongthe eroding bank surface (top to bottom)with a trowel. Composite sam-ples for each eroding bank were combined within a sampling reach ifthere was more than one eroding bank.
Samples of fine sediment deposited on the stream bed were collect-ed from the top 2.0 cm at the outlet of seven different subwatersheds inthe summer of 2009 (Fig. 1a). Fine sediment samples were collectedfrom five representative locations at each site using a 5 cm diameteracrylic tube and a trowel. Sampling points for fine sediment samples(i.e., mid channel or near banks) depended on where the fine sedimentdeposits were located.
Mass of fine sediment per stream length were estimated by theUSGS to identify stream reaches with fine sediment deposition prob-lems in this watershed as part of the watershed geomorphic assess-ment. The thickness of fine sediment was measured with a meter stickalong five transects (perpendicular to the direction of flow) within asampling reach, with reach lengths varying from 50 to 110 m. The fivetransects were optimally placed at two representative riffles, two runs,and one pool. An average thickness of fine sediment for each transectwas calculated, which was then averaged for the five transects. Theaverage thickness of soft sediment wasmultiplied by the average chan-nel width and the reach length to obtain an estimate of the volume offine sediment deposition in each reach. An average bulk density of0.81 g cm−3 was assumed, based on bulk density measurements fromin-channel fine sediment collected by the USGS from a nearby tributaryto the Pecatonica River.
2.3. Laboratory analyses
All soil and sediment samples collected for this study were oven-dried at 40 °C, disaggregated using a pestle and mortar, and dry-sieved through a 63 μm polyester sieve at the University of Wisconsin-Madison Biological Systems Engineering Laboratory. The source (sam-ples collected from agriculture, woodland, and stream banks) and finesediment samples were analyzed for 37 inorganic elements includingLi, Be, Na, Al, P, S, K, Ca, Sc, Ti, V, Cr, Mn, Fe, Co, Ni, Cu, Zn, Ga, As, Rb,Sr, Y, Nb, Mo, Cd, Sn, Sb, Cs, Ba, La, Ce, Ti, Pb, Bi, Th, and U, usingICP-MS microwave assisted acid total digestion in Teflon bombs at theWisconsin State Laboratory of Hygiene. This procedure is based on U.S.Environmental Protection Agency (USEPA) Method 3052 (USEPA,1996). The specific surface area of the samples less than 63 μm (dis-persed using 50 g L−1 sodium hexametaphosphate) was determinedfrom particle size distribution, assuming spherical particles, using aMalvern Mastersizer 2000 (Malvern Instruments, Worcestershire, UK).
2.4. Statistical analyses
An important requirement of geochemical sediment fingerprintingtechnique is that the fingerprinting properties must possess conserva-tive behavior and not change from the source to the sampling point(Gellis and Noe, 2013). Therefore, a mass-conservative test was usedto determine if the fingerprinting property concentrations measuredin the fine sediment samples fall within the range of the source samplefingerprinting property concentrations, corrected for particle size differ-ences,within each subwatershed above thefine sediment collection site(Franz et al., 2014).
The mass-conservative test was followed by a two-stage statisticalselection procedure proposed by Collins et al. (1997) to identify finger-printing properties for use as a composite signature capable of discrim-inating among agriculture, woodland, and stream bank within eachsubwatershed. In stage I, the non-parametric Kruskal–Wallis H-testwas used to determinewhichfingerprinting properties exhibited signif-icant differences among agriculture, woodland, and stream bank. Instage II, a stepwise discriminant function analysis (DFA) based on min-imization of Wilks' lambda was applied to the fingerprinting propertiesthat passed stage I (Walling et al., 1999). AWilks' lambda of 1 indicatesequal means of all groups and Wilks' lambda close to zero correspondsto within group variability that is less than the overall variability.
2.5. Apportioning fine sediment sources to streams
A multivariate mixing model was used to apportion relative contri-butions from different sources to stream bed fine sediment (Collinset al., 1997). Since the mixing model is over-determined, i.e., the num-ber of equations ismore than the number of unknownvariables, relativecontributions fromeach sourcewere determined byminimizing the ob-jective function. The objective function was the sum of squares of theweighted relative errors:
Xni¼1
Cs;i−Xm
s¼1PsSs;iZs
Cs;i
)2
Wi
8<: ð1Þ
where n is the number of fingerprinting properties;m is the number ofsediment sources; Cs,i is the concentration of fingerprinting property (i)in the fine sediment sample; Ps is the relative percentage contributionfrom the source group s; Ss,i is the concentration of fingerprinting prop-erty (i) in the source group s; Zs is the particle size correction factor(i.e., ratio of the specific surface area of the fine sediment to the specificsurface area of the source sediment) in the source group s; andWi is thetracer discriminatory weighting factor.
The model is imposed with two boundary conditions to ensure thatcontributions from all sources are non-negative (Eq. (2)) and contribu-tions from different sources to stream bed fine sediment sum to unity(Eq. (3)).
0≤Ps≤1 ð2Þ
Xms¼1
Ps ¼ 1 ð3Þ
Thefingerprinting property concentration of each source group usedin the mixing model was the mean concentration of a fingerprintingproperty for a given source in each subwatershed. The mean finger-printing property concentrations used to represent a particular sourcewithin each subwatershed is justifiable, since the fine sediment depos-ited on stream beds represent a mixture of sediment eroded from awide range of sites (Walling et al., 2008; Collins et al., 2010). The particlesize exerts an important influence on concentrations of elements in thesediment (Horowitz and Elrick, 1987). Therefore, Zs was used in themixing model to account for differences in particle size between source

Table 3Inorganic elements for each site that passed the Mass-conservative test and the subse-quent Kruskal–Wallis H-test (p = 0.1).
Test Site 1 Site 2 (Site 3 andSite 4)a
Site 5 Site 6 Site 7
1. Mass-conservativetest
Be Y Be Sn Li Rb Be Bi Li Y Li RbNa Nb P Ba Be Sr Na Th Be Nb Na SrAl Mo K La Al Y Al Na Cd Al YP Cd Ca Ce P Nb P Al Sn P NbK Sn Sc Bi S Mo S P Cs S CdCa Sb Ti Th K Cd K S Ba K SnSc Cs Cr Ca Sn Ca K La Ca SbTi Ba Mn Sc Cs Sc Ca Ce Sc CsCr La Co Ti Ba Cu Sc Bi Ti BaMn Ce Ni V La Zn Ti Th V LaFe Pb Zn Cr Ce Rb V U Cr CeCo Bi Ga Mn Tl Sr Cr Mn TlNi Th Rb Fe Pb Y Ni Fe PbZn Sr Co Bi Cd Cu Co BiGa Y Ni Th Cs Zn Ni ThAs Nb Cu Ba Ga Zn URb Mo Zn La Rb GaSr Cd Ga Ce Sr As
2. Kruskal–WallisH-test
Be Mo Mn Be Ba Al Li Bi Li CdNa Ba Sr Al La Ca Al Th Na SnAl La Cd S Ce Sc S Al CsP Ce Ba Ca Pb Cu Sc S BaK Th Bi Sc Th Zn Cu Ca LaCa Ni Rb Ga Sc CeFe Zn Sr Rb Fe PbCo Ga Y Sr Co ThNi Rb Cs Y Ni UZn Sr Ba Sn ZnGa Y La Cs GaRb Mo Ce Ba RbSr Sn Bi La SrY Cs Th Ce Y
a Site 3 and Site 4 subwatersheds had the same source sample; therefore, results ofstatistical analysis were the same for these sites.
48 J. Lamba et al. / Geomorphology 236 (2015) 44–53
material sediment andfine sediment stored on streambeds. The specificsurface area of source andfine sediment sampleswas less than 1m2 g−1
and, therefore, a linear particle size correction factor was used in thisstudy (Russell et al., 2001; Smith and Blake, 2014). However, when spe-cific surface area is greater than 1 m2 g−1, a simple linear particle sizecorrection factor might not be appropriate (Smith and Blake, 2014).The particle size correction factors used in this study for each site are in-cluded in Table 2. We did not use the correction factor for the organiccarbon content in the mixing model, since recent work has shownthat the combined use of organic carbon content and particle size cor-rection factors results in an over-correction of the model (Koiter et al.,2013a; Smith and Blake, 2014), which could produce spurious sourceapportionment results (Smith and Blake, 2014). The tracer discrimina-tory weighting factor (Wi) was used in the mixing model to ensurethat the fingerprinting property with the greatest discriminatorypower exerts the greatest influence on the solutions of the mixingmodel (Collins et al., 2010).
2.6. Goodness-of-fit and uncertainty analyses
The goodness-of-fit of the optimized mixing model was assessed bycomparing the actual fingerprinting property concentration in the finesediment samples with the values predicted by the optimized mixingmodel. The values of relative mean error (RME) of each fingerprintingproperty within the composite signature were averaged to provide anaverage relative error for each site (Collins et al., 1998).
An important source of uncertainty in the sediment fingerprintingapproach is the extent to which the mean fingerprinting property con-centration of the source samples used in the mixing model reflects thetrue value (Collins et al., 2010). To assess this uncertainty we used aMonte Carlo approach. In this approach, one sample from each ofthree source categories was randomly removed and the mixing modelwas run without these samples (Gellis and Noe, 2013). This procedureinvolved 1000 iterations and the average relative source contributionswere determined for each site.
3. Results and discussion
3.1. Statistical analyses
The results of the mass-conservative test and Kruskal–Wallis H-testused for discriminating the three sources (agriculture, woodland, andstream banks) of sediment for each site are included in Table 3. Withineach subwatershed, themajority of fingerprinting properties passed themass conservative test indicating that the concentrations of inorganicelements in the fine sediment samples deposited on the stream bedfell within the range of inorganic element concentrations in the sourcesamples.
Stepwise DFA on the inorganic elements that passed the Kruskal–Wallis H-test showed that the optimum set of fingerprinting propertiesidentified for each site classified≥85%of the sources correctly (Table 4).
Table 2Particle size correction factor (i.e., ratio of the specific surface area of the fine sediment tothe specific surface area of the source sediment) used for different source groups at eachsite.
Particle size correction factor
Site Agriculture Woodland Stream bank
Site 1 0.90 1.27 1.14Site 2 0.95 1.22 1.12Site 3 1.05 1.2 1.08Site 4 1.14 1.30 1.17Site 5 0.96 1.24 1.01Site 6 1.06 1.10 1.08Site 7 0.98 1.22 1.06
These optimum combinations of fingerprinting properties provided astrong discrimination among the three sediment sources for each site.The source elemental concentrations for fingerprinting properties thatwere included in the final optimum set of at least one site are includedin Table 5. Generally, the elemental concentrations were greater instream banks than those measured in surface soils (agriculture andwoodlands). The stream banks are comprised of less weathered sub-surface material, which results in greater concentration of the elementsin the bank sediment than surface soils (Smith and Blake, 2014). Ele-mental concentration of fine sediment samples deposited on the streambed that were included in the final set of optimum tracers for each siteare included in Table 6.
Of the 37 different geochemical element fingerprinting propertiesselected initially for this study, 21 trace elements did not pass one ofthe statistical tests and, therefore, were excluded from the final mixingmodel. The combination and number of inorganic elements used in thefinal mixing model varied among different subwatersheds (Table 4).However, some fingerprinting properties that provided strong discrim-ination between sources were common to several subwatersheds. Forexample, element La was included in the final set of optimum finger-printing properties for five different subwatersheds; and Al, Zn, and Srfor four different subwatersheds. The final set of optimum fingerprint-ing properties is dependent on the ability of the composite signatureto improve source discrimination. Previous studies have also reportedsimilar variability in the number and combination of fingerprintingproperties used in the final set of optimum fingerprinting propertiesat a subwatershed scale (e.g., Collins et al., 2010, 2013a; Smith andBlake, 2014). Increasing the number of source samples within asubwatershed can help to address this issue. However, in our study,the number of source samples that could be collected was constrainedby landowner cooperation. Understanding the environmental behavior
Table 4Optimum set of inorganic elements selected after stepwise discriminant function analysisat each site.
Site Inorganicelement
Wilks'lambda
Percentagesourcesamplesclassifiedcorrectly
Cumulativepercentage sourcesamples classifiedcorrectly
Tracerdiscriminatoryweighting
Site 1 Zn 0.0285 77.8 77.8 1.4Sr 0.0097 77.8 88.9 1.4Y 0.0031 66.7 100.0 1.2Ni 0.0005 88.9 100.0 1.6Fe 0.0001 77.8 100.0 1.4Ce 0.0000 55.6 100.0 1.0Ba 0.0000 66.7 100.0 1.2La 0.0000 77.8 100.0 1.4
Site 2 Mn 0.2004 90.0 90.0 1.1Sr 0.0495 80.0 90.0 1.0Bi 0.0155 80.0 90.0 1.0Cd 0.0023 80.0 100.0 1.0
(Site 3 andSite 4)a
Sr 0.2906 75.0 75.0 1.9Mo 0.1943 75.0 80.0 1.9Ni 0.1160 60.0 85.0 1.5Al 0.0793 40.0 85.0 1.0La 0.0560 55.0 90.0 1.4Zn 0.0386 65.0 95.0 1.6Sn 0.0271 55.0 100.0 1.4
Site 5 Sc 0.0250 80.0 80.0 1.6Ce 0.0036 70.0 100.0 1.4Ba 0.0012 70.0 100.0 1.4Al 0.0002 80.0 100.0 1.6Zn 0.0001 50.0 100.0 1.0
Site 6 Al 0.4124 77.8 77.8 1.3Ce 0.3123 63.0 70.4 1.1La 0.2510 70.4 77.8 1.2Sc 0.1994 59.3 85.2 1.0
Site 7 La 0.3638 69.2 69.2 1.6Sc 0.2793 63.5 76.9 1.5Ga 0.1998 42.3 82.7 1.0Fe 0.1518 50.0 86.5 1.2Cd 0.1308 50.0 88.5 1.2
a Site 3 and Site 4 subwatersheds had the same source sample; therefore, results ofstatistical analysis were the same for these sites.
Table 6Inorganic element concentrations (μg g−1) in fine sediment deposited on stream bedfor fingerprinting properties that were included in the optimum set of fingerprintingproperties for at least one site.
Fingerprintingproperty
Site 1 Site 2 Site 3 Site 4 Site 5 Site 6 Site 7
Al –a – 47,500 47,112 41,364 43,447 –
Sc – – – – 6.0 6.6 7.3Mn – 706 – – – – –
Fe 23,323 – – – – – 22,001Ni 21.3 – 20.5 20.7 – – –
Zn 104 – 110 111 93 – –
Ga – – – – – – 10.3Sr 121 123 116 109 – – –
Y 19.2 – – – – – –
Mo – – 0.7 0.7 – – –
Cd – 0.2 – – – – 0.4Sn – – 2.2 1.9 – – –
Ba 539 – – – 483 – –
La 22.2 – 21.5 22.5 – 20.2 21.7Ce 44.6 – – – 37.2 41.2 –
Bi – 0.34 – – – – –
a Fingerprinting property was not included in the final optimum set of fingerprintingproperties for this site.
49J. Lamba et al. / Geomorphology 236 (2015) 44–53
of geochemical fingerprinting properties is an area of further research(Koiter et al., 2013a) as different factors such as erosional processes,water chemistry, sediment transit times, watershed size, climate, hy-drology, parent material, and landforms (Davis and Fox, 2009; Koiteret al., 2013a) can affect the element concentrations within a watershed.
Table 5Average source elemental concentrations (μg g−1) ± standard error for fingerprintingproperties that were included in the optimum set of fingerprinting properties for at leastone site.
Fingerprintingproperty
Agriculture(n = 19)
Woodland(n = 9)
Stream bank(n = 24)
Al 36,671 ± 1185 33,800 ± 1255 48,033 ± 1637Sc 4.8 ± 0.5 4.8 ± 0.7 7.4 ± 0.3Mn 854 ± 43.5 961 ± 60.3 902 ± 73.2Fe 21,207 ± 517 21,085 ± 22,11 23,202 ± 618Ni 18.2 ± 0.6 17.1 ± 1.4 20.5 ± 0.6Zn 69.1 ± 3.6 79.2 ± 14.7 93. 2± 4.8Ga 9.9 ± 0.24 9.1 ± 0.35 10.7 ± 0.2Sr 100 ± 2.6 102 ± 3.0 120 1± 2.2Y 9.1 ± 1.2 8.3 ± 1.6 18.2 ± 0.6Mo 0.86 ± 0.03 1.01 ± 0.11 0.58 ± 0.06Cd 0.3 ± 0.02 0.4 ± 0.08 0.38 ± 0.02Sn 1.7 ± 0.13 1.4 ± 0.07 1.1 ± 0.14Ba 456 ± 15.4 451 ± 14.1 532 ± 7.6La 8.8 ± 1.4 7.6 ± 1.9 22.5 ± 1.0Ce 24.2 ± 2.7 26.0 ± 3.0 45.4 ± 2Bi 0.12 ± 0.01 0.15 ± 0.02 0.28 ± 0.09
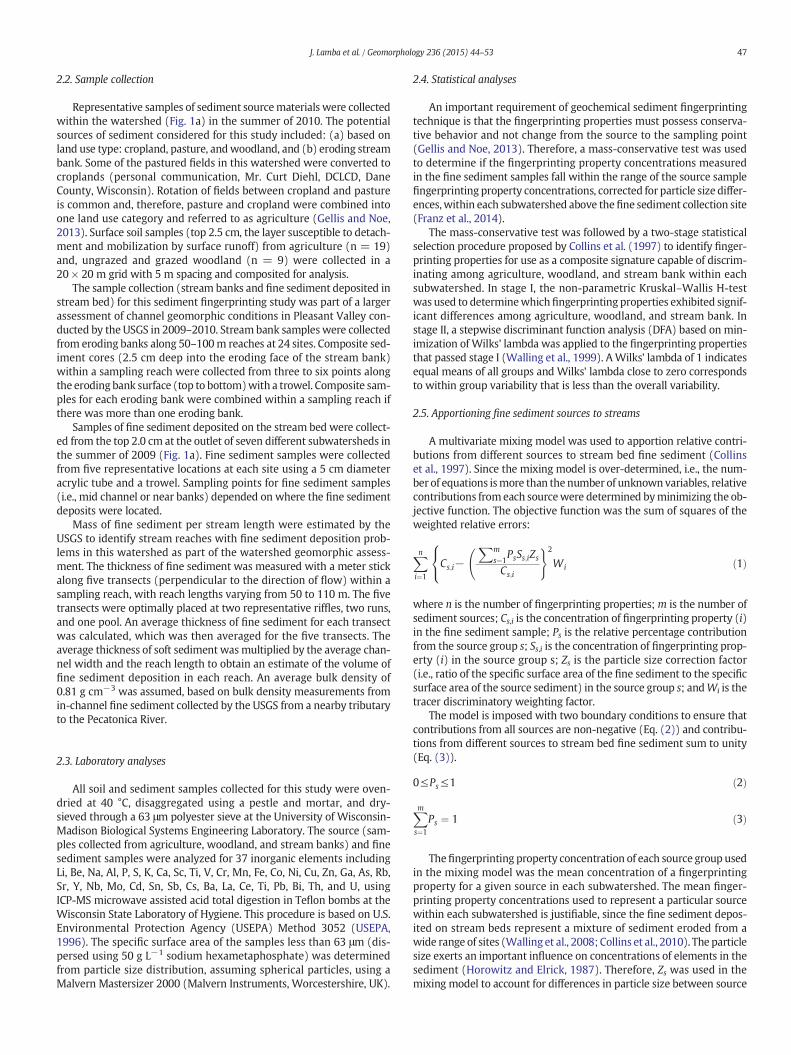
3.2. Source apportionment
The dominant sources contributing to fine sediment varied amongthe seven subwatershed sites based on results from the optimizedmixingmodel (Table 7). At site 1, streambankswere the dominant con-tributor (66%) followed by agriculture (34%) (Table 7). This sitewas oneof three reaches sampled in an active bank erosion zone (Table 1). Theland use under woodland and grassland in this subwatershed accountsfor 51% of the subwatershed area (Table 8), which could reduce therelative amount of sediment delivered due to upland soil erosion tostream channels in comparison to stream banks. The riparian land inthis subwatershed is also dominated by CRP grassland and woodlands,which could prevent eroded upland sediment from reaching thestreams. Cooper et al. (1987) found that riparian woodlands provid-ed an effective buffer to trap eroded sediment in the Cyprus Creekand Panther Swamp watersheds in North Carolina. Site 2 was an ex-ception compared to the other sites because agriculture contributed100% of the fine sediment. The dominant land use within thissubwatershed is agriculture (58%; Table 8), which likely resulted inmore eroded sediment compared to site 1. The riparian land use withinthe proximity of site 2 is also cropland, which combinedwith the great-er percentage of upland agricultural land use may have resulted in sub-stantial contributions from agriculture to fine sediment. Carter et al.(2003) also reported that the close proximity of cultivated fields tostreams resulted in higher contributions of sediment from cultivatedfields to streams.
At site 3, which is downstream of sites 1 and 2, both stream banksand agriculture were important sources. The similarity in relative con-tribution from agriculture and stream banks at site 3 indicates thatthis site received contributions from both the upstream subwatersheds;site 1 (stream bank as dominant source) and site 2 (agriculture as dom-inant source). Site 4 (downstream of site 3) contained similar sourcecontributions as site 3. At site 5, both stream banks and agriculturewere important sources of fine sediment and woodlands had minorcontributions (8%) to fine sediment. The riparian land use within theproximity and upstream of site 5 is pasture mainly for cattle. Cattlegrazing can cause soil compaction and removal of vegetation exposingbare soil that can result in more surface runoff and soil erosion, therebyincreasing agricultural contributions to fine sediment. Unrestrictedcattle access (personal communication, Mr. Curt Diehl, DCLCD, DaneCounty, Wisconsin) to streams in the site 5 subwatershed likely causedsediment contributions from stream bank erosion. Trimble (1994) re-ported that banks grazed by cattle eroded three to six times faster
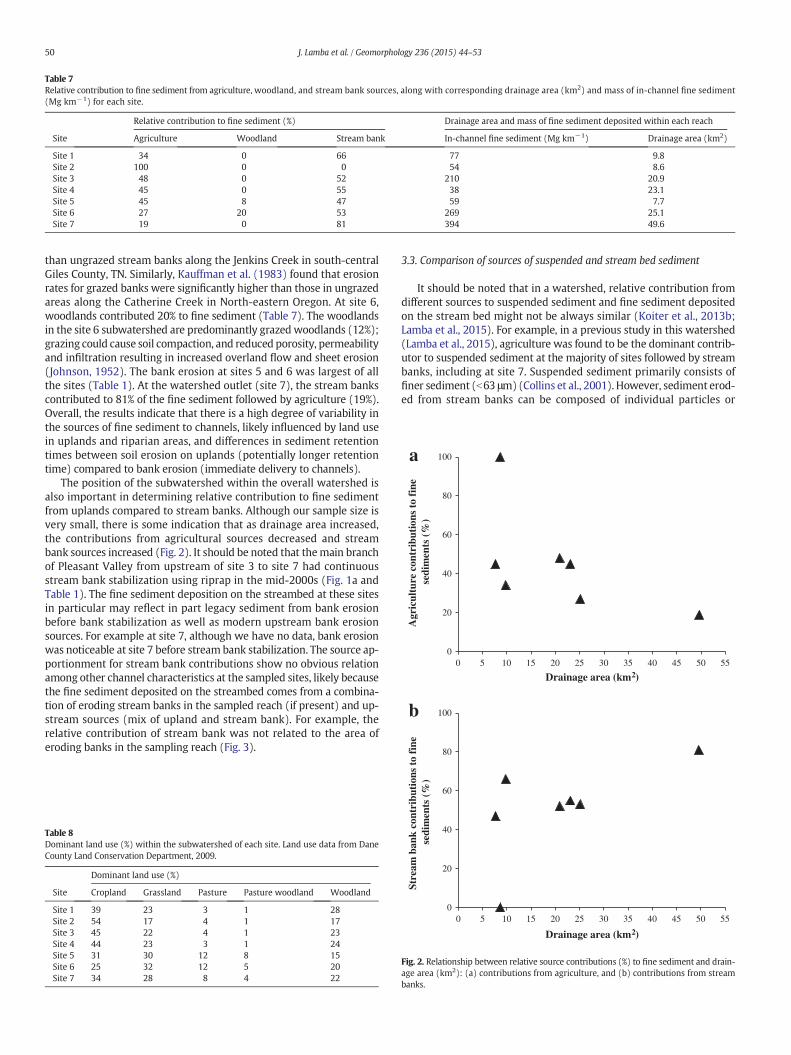
Table 7Relative contribution to fine sediment from agriculture, woodland, and stream bank sources, along with corresponding drainage area (km2) and mass of in-channel fine sediment(Mg km−1) for each site.
Relative contribution to fine sediment (%) Drainage area and mass of fine sediment deposited within each reach
Site Agriculture Woodland Stream bank In-channel fine sediment (Mg km−1) Drainage area (km2)
Site 1 34 0 66 77 9.8Site 2 100 0 0 54 8.6Site 3 48 0 52 210 20.9Site 4 45 0 55 38 23.1Site 5 45 8 47 59 7.7Site 6 27 20 53 269 25.1Site 7 19 0 81 394 49.6
0
20
40
60
80
100
0 5 10 15 20 25 30 35 40 45 50 55
Agr
icul
ture
con
trib
utio
ns to
fin
e se
dim
ents
(%
)
a
80
100
fin
e
Drainage area (km2)
b
50 J. Lamba et al. / Geomorphology 236 (2015) 44–53
than ungrazed stream banks along the Jenkins Creek in south-centralGiles County, TN. Similarly, Kauffman et al. (1983) found that erosionrates for grazed banks were significantly higher than those in ungrazedareas along the Catherine Creek in North-eastern Oregon. At site 6,woodlands contributed 20% to fine sediment (Table 7). The woodlandsin the site 6 subwatershed are predominantly grazed woodlands (12%);grazing could cause soil compaction, and reduced porosity, permeabilityand infiltration resulting in increased overland flow and sheet erosion(Johnson, 1952). The bank erosion at sites 5 and 6 was largest of allthe sites (Table 1). At the watershed outlet (site 7), the stream bankscontributed to 81% of the fine sediment followed by agriculture (19%).Overall, the results indicate that there is a high degree of variability inthe sources of fine sediment to channels, likely influenced by land usein uplands and riparian areas, and differences in sediment retentiontimes between soil erosion on uplands (potentially longer retentiontime) compared to bank erosion (immediate delivery to channels).
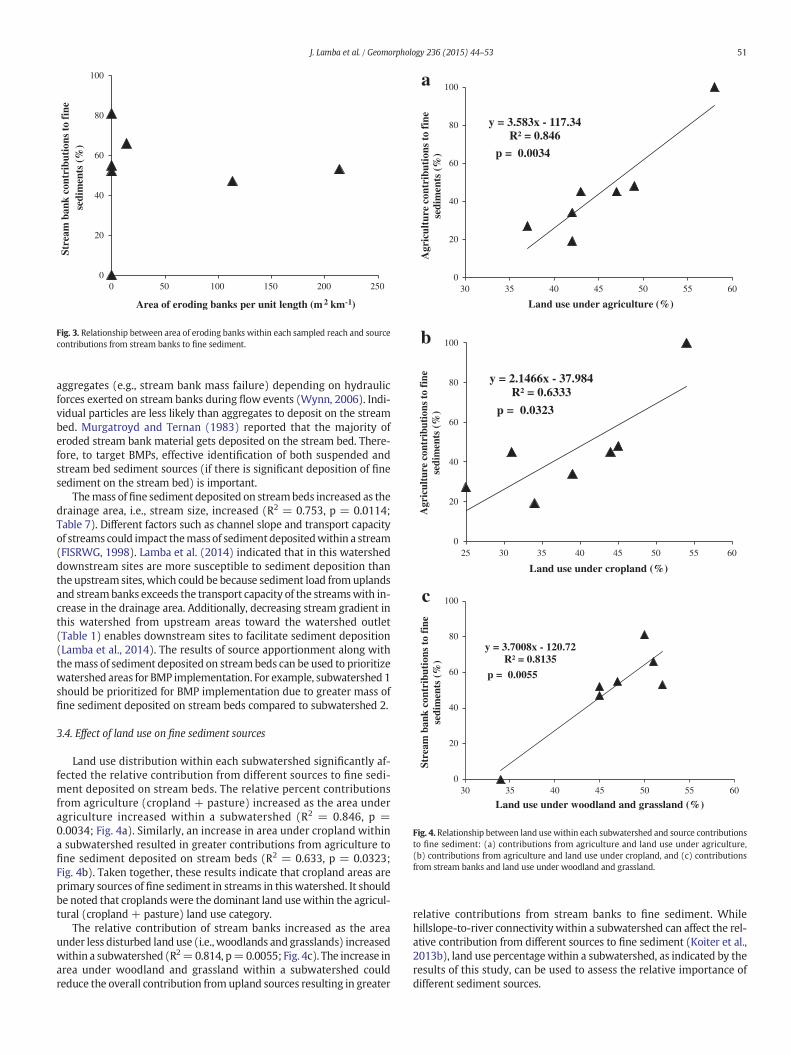
The position of the subwatershed within the overall watershed isalso important in determining relative contribution to fine sedimentfrom uplands compared to stream banks. Although our sample size isvery small, there is some indication that as drainage area increased,the contributions from agricultural sources decreased and streambank sources increased (Fig. 2). It should be noted that themain branchof Pleasant Valley from upstream of site 3 to site 7 had continuousstream bank stabilization using riprap in the mid-2000s (Fig. 1a andTable 1). The fine sediment deposition on the streambed at these sitesin particular may reflect in part legacy sediment from bank erosionbefore bank stabilization as well as modern upstream bank erosionsources. For example at site 7, although we have no data, bank erosionwas noticeable at site 7 before stream bank stabilization. The source ap-portionment for stream bank contributions show no obvious relationamong other channel characteristics at the sampled sites, likely becausethe fine sediment deposited on the streambed comes from a combina-tion of eroding stream banks in the sampled reach (if present) and up-stream sources (mix of upland and stream bank). For example, therelative contribution of stream bank was not related to the area oferoding banks in the sampling reach (Fig. 3).
Table 8Dominant land use (%) within the subwatershed of each site. Land use data from DaneCounty Land Conservation Department, 2009.
Dominant land use (%)
Site Cropland Grassland Pasture Pasture woodland Woodland
Site 1 39 23 3 1 28Site 2 54 17 4 1 17Site 3 45 22 4 1 23Site 4 44 23 3 1 24Site 5 31 30 12 8 15Site 6 25 32 12 5 20Site 7 34 28 8 4 22
3.3. Comparison of sources of suspended and stream bed sediment
It should be noted that in a watershed, relative contribution fromdifferent sources to suspended sediment and fine sediment depositedon the stream bed might not be always similar (Koiter et al., 2013b;Lamba et al., 2015). For example, in a previous study in this watershed(Lamba et al., 2015), agriculture was found to be the dominant contrib-utor to suspended sediment at the majority of sites followed by streambanks, including at site 7. Suspended sediment primarily consists offiner sediment (b63 μm) (Collins et al., 2001). However, sediment erod-ed from stream banks can be composed of individual particles or
0
20
40
60
0 5 10 15 20 25 30 35 40 45 50 55
Stre
am b
ank
cont
ribu
tion
s to
sedi
men
ts (
%)
Drainage area (km2)
Fig. 2. Relationship between relative source contributions (%) to fine sediment and drain-age area (km2): (a) contributions from agriculture, and (b) contributions from streambanks.
0
20
40
60
80
100
0 50 100 150 200 250
Stre
am b
ank
cont
ribu
tion
s to
fin
e se
dim
ents
(%
)
Area of eroding banks per unit length (m 2 km-1)
Fig. 3. Relationship between area of eroding banks within each sampled reach and sourcecontributions from stream banks to fine sediment.
y = 3.583x - 117.34R² = 0.846
0
20
40
60
80
100
30 35 40 45 50 55 60
Agr
icul
ture
con
trib
utio
ns to
fin
e se
dim
ents
(%
)
Land use under agriculture (%)
a
p = 0.0034
y = 2.1466x - 37.984R² = 0.6333
0
20
40
60
80
100
25 30 35 40 45 50 55 60
enifot
snoitubirtnocerutlucirg
Ase
dim
ents
(%)
Land use under cropland (%)
b
p = 0.0323
y = 3.7008x - 120.72R² = 0.8135
0
20
40
60
80
100
30 35 40 45 50 55 60
enifot
snoitubirtnocknab
maertSse
dim
ents
(%
)
Land use under woodland and grassland (%)
c
p = 0.0055
Fig. 4. Relationship between land use within each subwatershed and source contributionsto fine sediment: (a) contributions from agriculture and land use under agriculture,(b) contributions from agriculture and land use under cropland, and (c) contributionsfrom stream banks and land use under woodland and grassland.
51J. Lamba et al. / Geomorphology 236 (2015) 44–53
aggregates (e.g., stream bank mass failure) depending on hydraulicforces exerted on stream banks during flow events (Wynn, 2006). Indi-vidual particles are less likely than aggregates to deposit on the streambed. Murgatroyd and Ternan (1983) reported that the majority oferoded stream bank material gets deposited on the stream bed. There-fore, to target BMPs, effective identification of both suspended andstream bed sediment sources (if there is significant deposition of finesediment on the stream bed) is important.
Themass of fine sediment deposited on streambeds increased as thedrainage area, i.e., stream size, increased (R2 = 0.753, p = 0.0114;Table 7). Different factors such as channel slope and transport capacityof streams could impact themass of sediment depositedwithin a stream(FISRWG, 1998). Lamba et al. (2014) indicated that in this watersheddownstream sites are more susceptible to sediment deposition thanthe upstream sites, which could be because sediment load from uplandsand streambanks exceeds the transport capacity of the streamswith in-crease in the drainage area. Additionally, decreasing stream gradient inthis watershed from upstream areas toward the watershed outlet(Table 1) enables downstream sites to facilitate sediment deposition(Lamba et al., 2014). The results of source apportionment along withthemass of sediment deposited on streambeds can be used to prioritizewatershed areas for BMP implementation. For example, subwatershed 1should be prioritized for BMP implementation due to greater mass offine sediment deposited on stream beds compared to subwatershed 2.
3.4. Effect of land use on fine sediment sources
Land use distribution within each subwatershed significantly af-fected the relative contribution from different sources to fine sedi-ment deposited on stream beds. The relative percent contributionsfrom agriculture (cropland + pasture) increased as the area underagriculture increased within a subwatershed (R2 = 0.846, p =0.0034; Fig. 4a). Similarly, an increase in area under cropland withina subwatershed resulted in greater contributions from agriculture tofine sediment deposited on stream beds (R2 = 0.633, p = 0.0323;Fig. 4b). Taken together, these results indicate that cropland areas areprimary sources of fine sediment in streams in this watershed. It shouldbe noted that croplandswere the dominant land usewithin the agricul-tural (cropland + pasture) land use category.
The relative contribution of stream banks increased as the areaunder less disturbed land use (i.e., woodlands and grasslands) increasedwithin a subwatershed (R2=0.814, p=0.0055; Fig. 4c). The increase inarea under woodland and grassland within a subwatershed couldreduce the overall contribution from upland sources resulting in greater
relative contributions from stream banks to fine sediment. Whilehillslope-to-river connectivity within a subwatershed can affect the rel-ative contribution from different sources to fine sediment (Koiter et al.,2013b), land use percentagewithin a subwatershed, as indicated by theresults of this study, can be used to assess the relative importance ofdifferent sediment sources.
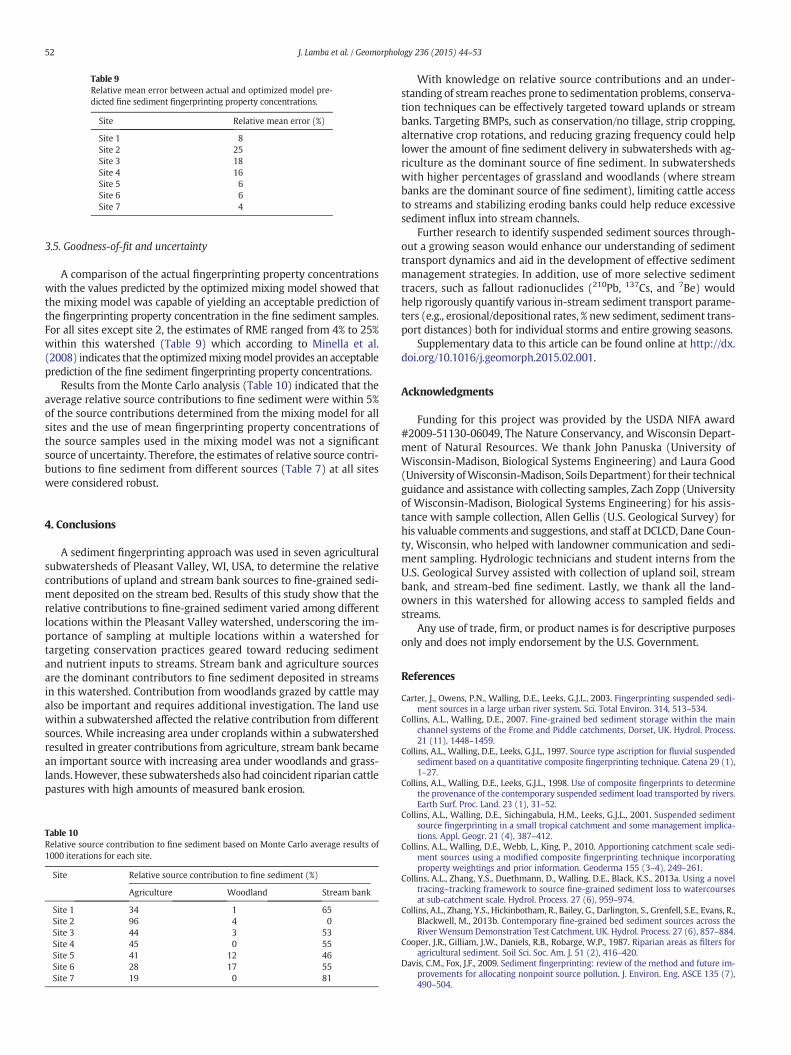
Table 9Relative mean error between actual and optimized model pre-dicted fine sediment fingerprinting property concentrations.
Site Relative mean error (%)
Site 1 8Site 2 25Site 3 18Site 4 16Site 5 6Site 6 6Site 7 4
52 J. Lamba et al. / Geomorphology 236 (2015) 44–53
3.5. Goodness-of-fit and uncertainty
A comparison of the actual fingerprinting property concentrationswith the values predicted by the optimized mixing model showed thatthe mixing model was capable of yielding an acceptable prediction ofthe fingerprinting property concentration in the fine sediment samples.For all sites except site 2, the estimates of RME ranged from 4% to 25%within this watershed (Table 9) which according to Minella et al.(2008) indicates that the optimizedmixingmodel provides an acceptableprediction of the fine sediment fingerprinting property concentrations.
Results from the Monte Carlo analysis (Table 10) indicated that theaverage relative source contributions to fine sediment were within 5%of the source contributions determined from the mixing model for allsites and the use of mean fingerprinting property concentrations ofthe source samples used in the mixing model was not a significantsource of uncertainty. Therefore, the estimates of relative source contri-butions to fine sediment from different sources (Table 7) at all siteswere considered robust.
4. Conclusions
A sediment fingerprinting approach was used in seven agriculturalsubwatersheds of Pleasant Valley, WI, USA, to determine the relativecontributions of upland and stream bank sources to fine-grained sedi-ment deposited on the stream bed. Results of this study show that therelative contributions to fine-grained sediment varied among differentlocations within the Pleasant Valley watershed, underscoring the im-portance of sampling at multiple locations within a watershed fortargeting conservation practices geared toward reducing sedimentand nutrient inputs to streams. Stream bank and agriculture sourcesare the dominant contributors to fine sediment deposited in streamsin this watershed. Contribution from woodlands grazed by cattle mayalso be important and requires additional investigation. The land usewithin a subwatershed affected the relative contribution from differentsources. While increasing area under croplands within a subwatershedresulted in greater contributions from agriculture, stream bank becamean important source with increasing area under woodlands and grass-lands. However, these subwatersheds also had coincident riparian cattlepastures with high amounts of measured bank erosion.
Table 10Relative source contribution to fine sediment based on Monte Carlo average results of1000 iterations for each site.
Site Relative source contribution to fine sediment (%)
Agriculture Woodland Stream bank
Site 1 34 1 65Site 2 96 4 0Site 3 44 3 53Site 4 45 0 55Site 5 41 12 46Site 6 28 17 55Site 7 19 0 81
With knowledge on relative source contributions and an under-standing of stream reaches prone to sedimentation problems, conserva-tion techniques can be effectively targeted toward uplands or streambanks. Targeting BMPs, such as conservation/no tillage, strip cropping,alternative crop rotations, and reducing grazing frequency could helplower the amount of fine sediment delivery in subwatersheds with ag-riculture as the dominant source of fine sediment. In subwatershedswith higher percentages of grassland and woodlands (where streambanks are the dominant source of fine sediment), limiting cattle accessto streams and stabilizing eroding banks could help reduce excessivesediment influx into stream channels.
Further research to identify suspended sediment sources through-out a growing season would enhance our understanding of sedimenttransport dynamics and aid in the development of effective sedimentmanagement strategies. In addition, use of more selective sedimenttracers, such as fallout radionuclides (210Pb, 137Cs, and 7Be) wouldhelp rigorously quantify various in-stream sediment transport parame-ters (e.g., erosional/depositional rates, % new sediment, sediment trans-port distances) both for individual storms and entire growing seasons.
Supplementary data to this article can be found online at http://dx.doi.org/10.1016/j.geomorph.2015.02.001.
Acknowledgments
Funding for this project was provided by the USDA NIFA award#2009-51130-06049, The Nature Conservancy, and Wisconsin Depart-ment of Natural Resources. We thank John Panuska (University ofWisconsin-Madison, Biological Systems Engineering) and Laura Good(University ofWisconsin-Madison, Soils Department) for their technicalguidance and assistance with collecting samples, Zach Zopp (Universityof Wisconsin-Madison, Biological Systems Engineering) for his assis-tance with sample collection, Allen Gellis (U.S. Geological Survey) forhis valuable comments and suggestions, and staff at DCLCD, Dane Coun-ty, Wisconsin, who helped with landowner communication and sedi-ment sampling. Hydrologic technicians and student interns from theU.S. Geological Survey assisted with collection of upland soil, streambank, and stream-bed fine sediment. Lastly, we thank all the land-owners in this watershed for allowing access to sampled fields andstreams.
Any use of trade, firm, or product names is for descriptive purposesonly and does not imply endorsement by the U.S. Government.
References
Carter, J., Owens, P.N., Walling, D.E., Leeks, G.J.L., 2003. Fingerprinting suspended sedi-ment sources in a large urban river system. Sci. Total Environ. 314, 513–534.
Collins, A.L., Walling, D.E., 2007. Fine-grained bed sediment storage within the mainchannel systems of the Frome and Piddle catchments, Dorset, UK. Hydrol. Process.21 (11), 1448–1459.
Collins, A.L., Walling, D.E., Leeks, G.J.L., 1997. Source type ascription for fluvial suspendedsediment based on a quantitative composite fingerprinting technique. Catena 29 (1),1–27.
Collins, A.L., Walling, D.E., Leeks, G.J.L., 1998. Use of composite fingerprints to determinethe provenance of the contemporary suspended sediment load transported by rivers.Earth Surf. Proc. Land. 23 (1), 31–52.
Collins, A.L., Walling, D.E., Sichingabula, H.M., Leeks, G.J.L., 2001. Suspended sedimentsource fingerprinting in a small tropical catchment and some management implica-tions. Appl. Geogr. 21 (4), 387–412.
Collins, A.L., Walling, D.E., Webb, L., King, P., 2010. Apportioning catchment scale sedi-ment sources using a modified composite fingerprinting technique incorporatingproperty weightings and prior information. Geoderma 155 (3–4), 249–261.
Collins, A.L., Zhang, Y.S., Duethmann, D., Walling, D.E., Black, K.S., 2013a. Using a noveltracing–tracking framework to source fine-grained sediment loss to watercoursesat sub-catchment scale. Hydrol. Process. 27 (6), 959–974.
Collins, A.L., Zhang, Y.S., Hickinbotham, R., Bailey, G., Darlington, S., Grenfell, S.E., Evans, R.,Blackwell, M., 2013b. Contemporary fine-grained bed sediment sources across theRiver Wensum Demonstration Test Catchment, UK. Hydrol. Process. 27 (6), 857–884.
Cooper, J.R., Gilliam, J.W., Daniels, R.B., Robarge, W.P., 1987. Riparian areas as filters foragricultural sediment. Soil Sci. Soc. Am. J. 51 (2), 416–420.
Davis, C.M., Fox, J.F., 2009. Sediment fingerprinting: review of the method and future im-provements for allocating nonpoint source pollution. J. Environ. Eng. ASCE 135 (7),490–504.
53J. Lamba et al. / Geomorphology 236 (2015) 44–53
Devereux, O.H., Prestegaard, K.L., Needelman, B.A., Gellis, A.C., 2010. Suspended-sedimentsources in an urban watershed, Northeast Branch Anacostia River, Maryland. Hydrol.Process. 24 (11), 1391–1403.
DNR, 2012. Purposed List of Impaired Waters. http://dnr.wi.gov/water/impairedSearch.aspx (Accessed August 12, 2013).
Faulkner, D.J., 1998. Spatially variable historical alluviation and channel incision in west-central Wisconsin. Ann. Assoc. Am. Geogr. 88 (4), 666–685.
FISRWG, 1998. Stream corridor restoration: principles, processes, and practices. GPO ItemNo. 0120-A. Federal Interagency Stream Restoration Working Group, Washington(DC).
Fitzpatrick, F.A., Knox, J.C., Schubauer-Berigan, J.P., 2009. Channel, floodplain, and wetlandresponses to floods and overbank sedimentation, 1846–2006, Halfway Creek Marsh,Upper Mississippi Valley, Wisconsin. In: James, L.A., Rathburn, S.L., Whittecar, G.R.(Eds.), Management andRestoration of Fluvial SystemsWith BroadHistorical Changesand Human ImpactsGeol. Soc. Am. Spec. Pap. 451, 23–42.
Fox, J.F., Papanicolaou, A.N., 2007. The use of carbon and nitrogen isotopes to study water-shed erosion processes. J. Am. Water Res. Assoc. 43 (4), 1047–1064.
Franz, C., Makeschin, F., Weiß, H., Lorz, C., 2014. Sediments in urban river basins: identi-fication of sediment sources within the Lago Paranoá catchment, Brasilia DF,Brazil — using the fingerprint approach. Sci. Total Environ. 466–467, 513–523.
Gellis, A., Noe, G., 2013. Sediment source analysis in the Linganore Creek watershed,Maryland, USA, using the sediment fingerprinting approach: 2008 to 2010. J. SoilsSediments 13 (10), 1735–1753.
Gellis, A.C., Webb, R.M.T., Wolfe, W.J., McIntyre, S.C.I., 1999. Effects of land use on uplanderosion, sediment transport, and reservoir sedimentation, Lago Loiza Basin, PuertoRico. U.S. Geological SurveyWater-Resources Investigations Report 99-4010 (60 pp.).
Gellis, A.C., Hupp, C.R., Pavich, M.J., Landwehr, J.M., Banks, W.S.L., Hubbard, B.E., Langland,M.J., Ritchie, J.C., Reuter, J.M., 2009. Sources, transport, and storage of sediment atselected sites in the Chesapeake Bay watershed. U.S. Geological Survey ScientificInvestigations Report 2008-5186 (95 pp.).
Happ, S.C., Rittenhouse, G., Dobson, G.C., 1940. Some principles of accelerated stream andvalley sedimentation. US Dep. Agric. Tech. Bull. 695.
Horowitz, A.J., Elrick, K.A., 1987. The relation of stream sediment surface area, grain sizeand composition to trace element chemistry. Appl. Geochem. 2 (4), 437–451.
Huisman, N.H., Karthikeyan, K.G., Lamba, J., Thompson, A., Peaslee, G., 2013. Quantifica-tion of seasonal sediment and phosphorus transport dynamics in an agricultural wa-tershed using radiometric fingerprinting techniques. J. Soils Sediments http://dx.doi.org/10.1007/s11368-013-0769-0.
Jarvie, H.P., Jürgens, M.D., Williams, R.J., Neal, C., Davies, J.J.L., Barrett, C., White, J., 2005.Role of river bed sediments as sources and sinks of phosphorus across two major eu-trophic UK river basins: the Hampshire Avon and Herefordshire Wye. J. Hydrol. 304(1), 51–74.
Johnson, E.A., 1952. Effect of farmwoodland grazing on watershed values in the SouthernAppalachian mountains. J. For. 50 (2), 109–113.
Kauffman, J.B., Krueger, W.C., Vavra, M., 1983. Impacts of cattle on streambanks in north-eastern Oregon. J. Range Manag. 36 (6), 683–685.
Knox, J.C., 1972. Valley alluviation in south westernWisconsin. Ann. Assoc. Am. Geogr. 62(3), 401–410.
Knox, J.C., 2001. Agricultural influence on landscape sensitivity in the Upper MississippiRiver Valley. Catena 42 (2–4), 193–224.
Knox, J.C., 2002. Agriculture, erosion, and sediment yields. In: Orme, A.R. (Ed.), The Phys-ical Geography of North America. Oxford University Press, pp. 482–500.
Knox, J.C., 2006. Floodplain sedimentation in the Upper Mississippi Valley: natural versushuman accelerated. Geomorphology 79 (3–4), 286–310.
Koiter, A.J., Owens, P.N., Petticrew, E.L., Lobb, D.A., 2013a. The behavioural characteristicsof sediment properties and their implications for sediment fingerprinting as an ap-proach for identifying sediment sources in river basins. Earth Sci. Rev. 125, 24–42.
Koiter, A., Lobb, D., Owens, P., Petticrew, E., Tiessen, K.D., Li, S., 2013b. Investigating therole of connectivity and scale in assessing the sources of sediment in an agriculturalwatershed in the Canadian prairies using sediment source fingerprinting. J. SoilsSediments 13 (10), 1676–1691.
Lamba, J., Karthikeyan, K.G., Thompson, A.M., 2014. Using radiometric fingerprinting andphosphorus to elucidate sediment transport dynamics in an agricultural watershed.Hydrol. Process. http://dx.doi.org/10.1002/hyp.10396.
Lamba, J., Karthikeyan, K.G., Thompson, A.M., 2015. Apportionment of suspended sedi-ment sources in an agricultural watershed using sediment fingerprinting. Geoderma239–240, 25–33.
Lisle, T.E., Hilton, S., 1992. The volume of fine sediment in pools: an index of sedimentsupply in gravel-bed streams. J. Am. Water Resour. Assoc. 28 (2), 371–383.
Meals, D.W., Dressing, S.A., Davenport, T.E., 2010. Lag time in water quality response tobest management practices: a review. J. Environ. Qual. 39 (1), 85–96.
Mickelson, D.M., 1983. A guide to glacial landscapes of Dane County, Wisconsin. Wiscon-sin Geological and Natural History Survey, Field Trip Guide Book 6 (53 pp.).
Mickelson, D.M., McCartney, M.C., 1979. Glacial geology of Dane County, Wisconsin:Unversity of Wisconsin-Extension, Scale 1:100,000.
Minella, J.P.G., Walling, D.E., Merten, G.H., 2008. Combining sediment source tracing tech-niques with traditional monitoring to assess the impact of improved land manage-ment on catchment sediment yields. J. Hydrol. 348 (3–4), 546–563.
Mudrey, M.G., Jr., Brown, B.A., Greenberg, J.K., 1982. Bedrock Geologic Map ofWisconsin: University of Wisconsin—Extension, Geological and Natural History Survey,Scale = 1:1,000,000.
Mukundan, R., Ritchie, J., Risse, L., McKinley, R., Radcliffe, D., 2010. Sediment fingerprint-ing to determine the source of suspended sediment in a southern Piedmont stream.J. Environ. Qual. 39 (4), 1328–1337.
Murgatroyd, A.L., Ternan, J.L., 1983. The impact of afforestation on stream bank erosionand channel form. Earth Surf. Proc. Land. 8 (4), 357–369.
Osmond, D., Meals, D., Hoag, D., Arabi, M., Luloff, A., Jennings, G., McFarland, M., Spooner,J., Sharpley, A., Line, D., 2012. Improving conservation practices programming to pro-tect water quality in agricultural watersheds: lessons learned from the National Insti-tute of Food and Agriculture—Conservation Effects Assessment Project. J. Soil WaterConserv. 67 (5), 122A–127A (Ankeny).
Owens, P.N., Walling, D.E., Leeks, G.J.L., 1999. Use of floodplain sediment cores to investi-gate recent historical changes in overbank sedimentation rates and sediment sourcesin the catchment of the River Ouse, Yorkshire, UK. Catena 36 (1–2), 21–47.
Russell, M.A., Walling, D.E., Hodgkinson, R.A., 2001. Suspended sediment sources in twosmall lowland agricultural catchments in the UK. J. Hydrol. 252 (1–4), 1–24.
Smith, H.G., Blake, W.H., 2014. Sediment fingerprinting in agricultural catchments: a crit-ical re-examination of source discrimination and data corrections. Geomorphology204, 177–191.
Trimble, S.W., 1994. Erosional effects of cattle on streambanks in Tennessee, U.S.A. EarthSurf. Proc. Land. 19 (5), 451–464.
Trimble, S.W., Lund, S.W., 1982. Soil conservation and the reduction of erosion and sedi-mentation in the Coon Creek Basin, Wisconsin. U.S. Geological Survey ProfessionalPaper 1234.
USEPA, 2010. National Summary of Impaired Waters and TMDL Information. http://iaspub.epa.gov/waters10/attains_nation_cy.control?p_report_type=T#status_of_data (Accessed November 3, 2014).
USEPA (U.S. Environmental Protection Agency), 1996. Microwave Assisted Acid Digestionof Siliceous and Organically Based Matrices, Method 3052. U.S. Government PrintingOffice, Washington, DC.
Walling, D.E., 1983. The sediment delivery problem. J. Hydrol. 65 (1–3), 209–237.Walling, D., 2013. The evolution of sediment source fingerprinting investigations in fluvial
systems. J. Soils Sediments 13 (10), 1658–1675.Walling, D.E., Amos, C.M., 1999. Source, storage and mobilisation of fine sediment in a
chalk stream system. Hydrol. Process. 13 (3), 323–340.Walling, D.E., Collins, A.L., 2008. The catchment sediment budget as a management tool.
Environ. Sci. Pol. 11 (2), 136–143.Walling, D.E., Fang, D., 2003. Recent trends in the suspended sediment loads of the
world's rivers. Glob. Planet. Chang. 39 (1–2), 111–126.Walling, D.E., Owens, P.N., Leeks, G.J.L., 1999. Fingerprinting suspended sediment sources
in the catchment of the River Ouse, Yorkshire, UK. Hydrol. Process. 13 (7), 955–975.Walling, D.E., Collins, A.L., Stroud, R.W., 2008. Tracing suspended sediment and particulate
phosphorus sources in catchments. J. Hydrol. 350 (3–4), 274–289.Wilson, C.G., Kuhnle, R.A., Bosch, D.D., Steiner, J.L., Starks, P.J., Tomer, M.D., Wilson, G.V.,
2008. Quantifying relative contributions from sediment sources in ConservationEffects Assessment Project watersheds. J. Soil Water Conserv. 63 (6), 523–532.
Wood, P.J., Armitage, P.D., 1997. Biological effects of fine sediment in the lotic environ-ment. Environ. Manag. 21 (2), 203–217.
Wynn, T., 2006. Streambank retreat: a primer watershed update, January–March 2006.American Water Resources Association Hydrology and Watershed ManagementTechnical Committee 4(1), pp. 1–14.
Related Documents

![AJPS 17:2 (2014), pp. 171-186] HEALING IN THE LOWLAND ... · religious practices among lowland Filipinos, this research can be broadly used throughout the lowland cultures. Since](https://static.cupdf.com/doc/110x72/5e28aaca5b3b5737b60974b2/ajps-172-2014-pp-171-186-healing-in-the-lowland-religious-practices-among.jpg)