Click Here for Full Article SOURCES AND PROPERTIES OF AMAZONIAN AEROSOL PARTICLES Scot T. Martin, 1 Meinrat O. Andreae, 2 Paulo Artaxo, 3 Darrel Baumgardner, 4 Qi Chen, 1 Allen H. Goldstein, 5 Alex Guenther, 6 Colette L. Heald, 7 Olga L. Mayol‐Bracero, 8 Peter H. McMurry, 9 Theotonio Pauliquevis, 10 Ulrich Pöschl, 2 Kimberly A. Prather, 11,12 Gregory C. Roberts, 13 Scott R. Saleska, 14 M. A. Silva Dias, 15 Dominick V. Spracklen, 16 Erik Swietlicki, 17 and Ivonne Trebs 2 Received 8 December 2008; revised 7 August 2009; accepted 22 September 2009; published 16 April 2010. [ 1] This review provides a comprehensive account of what is known presently about Amazonian aerosol particles and concludes by formulating outlook and priorities for further research. The review is organized to follow the life cycle of Amazonian aerosol particles. It begins with a discussion of the primary and secondary sources relevant to the Amazonian particle burden, followed by a presentation of the particle properties that characterize the mixed populations present over the Amazon Basin at different times and places. These properties include number and mass concentrations and distributions, chemical composition, hygroscopicity, and cloud nucleation ability. The review presents Amazonian aerosol particles in the context of natural compared to anthropogenic sources as well as variability with season and meteorology. This review is intended to facilitate an understanding of the current state of knowledge on Amazonian aerosol particles specifically and tropical continental aerosol particles in general and thereby to enhance future research in this area. Citation: Martin, S. T., et al. (2010), Sources and properties of Amazonian aerosol particles, Rev. Geophys., 48, RG2002, doi:10.1029/2008RG000280. TABLE OF CONTENTS 1. Introduction ............................. 2 2. Sources ................................ 8 2.1. Primary Particles ...................... 8 2.2. Secondary Gas‐to‐Particle Conversion ...... 10 3. Properties ............................. 18 3.1. Mass Concentration ................... 18 3.2. Number‐Diameter Distribution ........... 21 3.3. Chemical Composition ................. 24 3.4. Hygroscopicity ...................... 29 3.5. Cloud Condensation Nuclei .............. 29 4. Outlook and Future Priorities ................ 31 4.1. Priorities for Improved Models ........... 34 4.2. Priorities for Improved Measurements ...... 34 5. Concluding Remarks ..................... 35 Copyright 2010 by the American Geophysical Union. Reviews of Geophysics, 48, RG2002 / 2010 1 of 42 8755‐1209/10/2008RG000280 Paper number 2008RG000280 1 School of Engineering and Applied Sciences and Department of Earth and Planetary Sciences, Harvard University, Cambridge, Massachusetts, USA. 2 Biogeochemistry Department, Max Planck Institute for Chemistry, Mainz, Germany. 3 Institute of Physics, University of São Paulo, São Paulo, Brazil. 4 Centro de Ciencias de la Atmosfera, Universidad Nacional Autonoma de Mexico, Mexico City, Mexico. 5 Department of Environmental Science, Policy, and Management, University of California, Berkeley, California, USA. 6 Biosphere-Atmosphere Interactions Group, Atmospheric Chemistry Division, National Center for Atmospheric Research, Boulder, Colorado, USA. 7 Department of Atmospheric Science, Colorado State University, Fort Collins, Colorado, USA. 8 Institute for Tropical Ecosystem Studies, University of Puerto Rico, San Juan, Puerto Rico. 9 Department of Mechanical Engineering, University of Minnesota, Minneapolis, Minnesota, USA. 10 Climate and Environmental Modelling Group, Instituto Nacional de Pesquisas da Amazônia, Manaus, Brazil. 11 Department of Chemistry and Biochemistry, University of California, San Diego, La Jolla, California, USA. 12 Scripps Institution of Oceanography, University of California, San Diego, La Jolla, California, USA. 13 Center for Atmospheric Sciences, Scripps Institution of Oceanography, University of California, San Diego, La Jolla, California, USA. 14 Department of Ecology and Evolutionary Biology, University of Arizona, Tucson, Arizona, USA. 15 Center for Weather Forecasting and Climate Studies, National Institute for Space Research, University of São Paulo, São Paulo, Brazil. 16 Institute for Climate and Atmospheric Science, School of Earth and Environment, University of Leeds, Leeds, UK. 17 Department of Physics, Lund University, Lund, Sweden. RG2002

Welcome message from author
This document is posted to help you gain knowledge. Please leave a comment to let me know what you think about it! Share it to your friends and learn new things together.
Transcript

ClickHere
for
FullArticle
SOURCES AND PROPERTIES OF AMAZONIANAEROSOL PARTICLES
Scot T. Martin,1 Meinrat O. Andreae,2 Paulo Artaxo,3 Darrel Baumgardner,4 Qi Chen,1
Allen H. Goldstein,5 Alex Guenther,6 Colette L. Heald,7 Olga L. Mayol‐Bracero,8
Peter H. McMurry,9 Theotonio Pauliquevis,10 Ulrich Pöschl,2 Kimberly A. Prather,11,12
Gregory C. Roberts,13 Scott R. Saleska,14 M. A. Silva Dias,15 Dominick V. Spracklen,16
Erik Swietlicki,17 and Ivonne Trebs2
Received 8 December 2008; revised 7 August 2009; accepted 22 September 2009; published 16 April 2010.
[1] This review provides a comprehensive account ofwhat is known presently about Amazonian aerosol particlesand concludes by formulating outlook and priorities forfurther research. The review is organized to follow the lifecycle of Amazonian aerosol particles. It begins with adiscussion of the primary and secondary sources relevant tothe Amazonian particle burden, followed by a presentationof the particle properties that characterize the mixed populationspresent over the Amazon Basin at different times and places.These properties include number and mass concentrations
and distributions, chemical composition, hygroscopicity,and cloud nucleation ability. The review presents Amazonianaerosol particles in the context of natural compared toanthropogenic sources as well as variability with seasonand meteorology. This review is intended to facilitatean understanding of the current state of knowledge onAmazonian aerosol particles specifically and tropicalcontinental aerosol particles in general and thereby toenhance future research in this area.
Citation: Martin, S. T., et al. (2010), Sources and properties of Amazonian aerosol particles, Rev. Geophys., 48, RG2002,doi:10.1029/2008RG000280.
TABLE OF CONTENTS
1. Introduction . . . . . . . . . . . . . . . . . . . . . . . . . . . . . 22. Sources . . . . . . . . . . . . . . . . . . . . . . . . . . . . . . . . 8
2.1. Primary Particles . . . . . . . . . . . . . . . . . . . . . . 82.2. Secondary Gas‐to‐Particle Conversion . . . . . . 10
3. Properties . . . . . . . . . . . . . . . . . . . . . . . . . . . . . 183.1. Mass Concentration . . . . . . . . . . . . . . . . . . . 183.2. Number‐Diameter Distribution . . . . . . . . . . . 21
3.3. Chemical Composition . . . . . . . . . . . . . . . . . 243.4. Hygroscopicity . . . . . . . . . . . . . . . . . . . . . . 293.5. Cloud Condensation Nuclei . . . . . . . . . . . . . . 29
4. Outlook and Future Priorities . . . . . . . . . . . . . . . . 314.1. Priorities for Improved Models . . . . . . . . . . . 344.2. Priorities for Improved Measurements . . . . . . 34
5. Concluding Remarks . . . . . . . . . . . . . . . . . . . . . 35
Copyright 2010 by the American Geophysical Union. Reviews of Geophysics, 48, RG2002 / 20101 of 42
8755‐1209/10/2008RG000280 Paper number 2008RG000280
1School of Engineering and Applied Sciences and Departmentof Earth and Planetary Sciences, Harvard University, Cambridge,Massachusetts, USA.
2Biogeochemistry Department, Max Planck Institute for Chemistry,Mainz, Germany.
3Institute of Physics, University of São Paulo, São Paulo, Brazil.4Centro deCiencias de la Atmosfera,Universidad Nacional Autonoma
de Mexico, Mexico City, Mexico.5Department of Environmental Science, Policy, and Management,
University of California, Berkeley, California, USA.6Biosphere-Atmosphere Interactions Group, Atmospheric Chemistry
Division, National Center for Atmospheric Research, Boulder, Colorado,USA.
7Department of Atmospheric Science, Colorado State University,Fort Collins, Colorado, USA.
8Institute for Tropical Ecosystem Studies, University of Puerto Rico,San Juan, Puerto Rico.
9Department of Mechanical Engineering, University of Minnesota,Minneapolis, Minnesota, USA.
10Climate and Environmental Modelling Group, Instituto Nacionalde Pesquisas da Amazônia, Manaus, Brazil.
11Department ofChemistry andBiochemistry,University of California,San Diego, La Jolla, California, USA.
12Scripps Institution of Oceanography, University of California, SanDiego, La Jolla, California, USA.
13Center for Atmospheric Sciences, Scripps Institution of Oceanography,University of California, San Diego, La Jolla, California, USA.
14Department of Ecology and Evolutionary Biology, University ofArizona, Tucson, Arizona, USA.
15Center for Weather Forecasting and Climate Studies, NationalInstitute for Space Research, University of São Paulo, São Paulo, Brazil.
16Institute for Climate and Atmospheric Science, School of Earthand Environment, University of Leeds, Leeds, UK.
17Department of Physics, Lund University, Lund, Sweden.
RG2002
1. INTRODUCTION
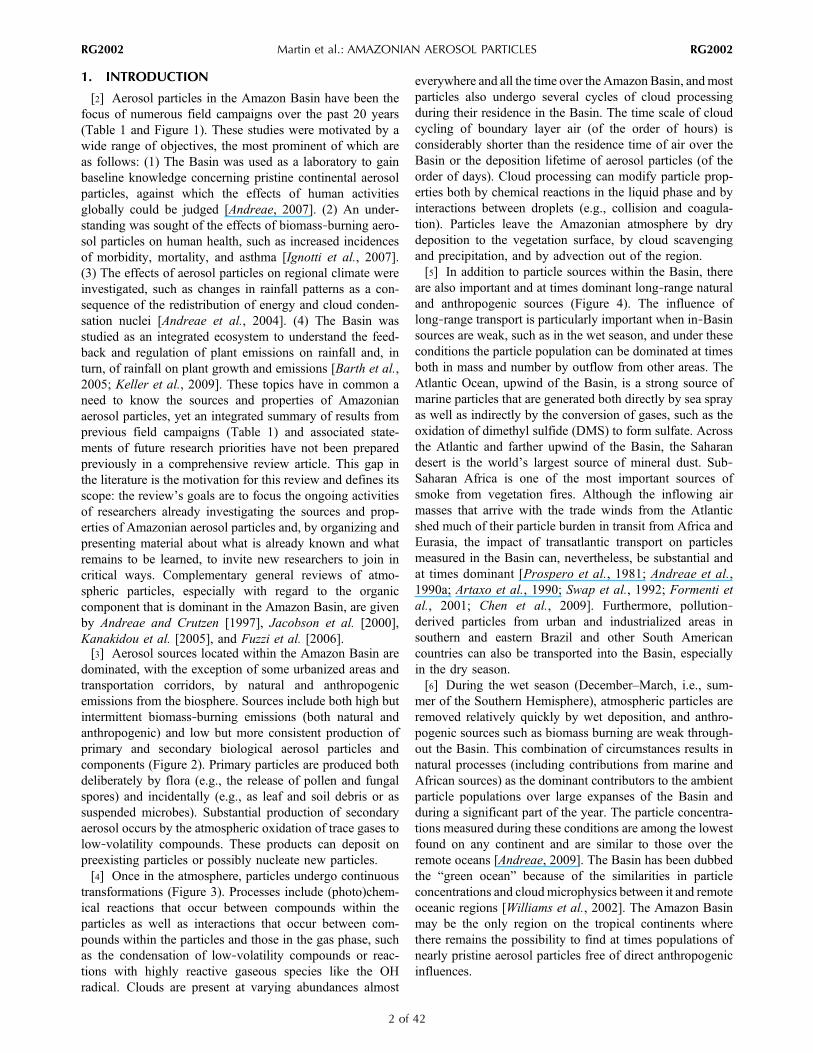
[2] Aerosol particles in the Amazon Basin have been thefocus of numerous field campaigns over the past 20 years(Table 1 and Figure 1). These studies were motivated by awide range of objectives, the most prominent of which areas follows: (1) The Basin was used as a laboratory to gainbaseline knowledge concerning pristine continental aerosolparticles, against which the effects of human activitiesglobally could be judged [Andreae, 2007]. (2) An under-standing was sought of the effects of biomass‐burning aero-sol particles on human health, such as increased incidencesof morbidity, mortality, and asthma [Ignotti et al., 2007].(3) The effects of aerosol particles on regional climate wereinvestigated, such as changes in rainfall patterns as a con-sequence of the redistribution of energy and cloud conden-sation nuclei [Andreae et al., 2004]. (4) The Basin wasstudied as an integrated ecosystem to understand the feed-back and regulation of plant emissions on rainfall and, inturn, of rainfall on plant growth and emissions [Barth et al.,2005; Keller et al., 2009]. These topics have in common aneed to know the sources and properties of Amazonianaerosol particles, yet an integrated summary of results fromprevious field campaigns (Table 1) and associated state-ments of future research priorities have not been preparedpreviously in a comprehensive review article. This gap inthe literature is the motivation for this review and defines itsscope: the review’s goals are to focus the ongoing activitiesof researchers already investigating the sources and prop-erties of Amazonian aerosol particles and, by organizing andpresenting material about what is already known and whatremains to be learned, to invite new researchers to join incritical ways. Complementary general reviews of atmo-spheric particles, especially with regard to the organiccomponent that is dominant in the Amazon Basin, are givenby Andreae and Crutzen [1997], Jacobson et al. [2000],Kanakidou et al. [2005], and Fuzzi et al. [2006].[3] Aerosol sources located within the Amazon Basin are
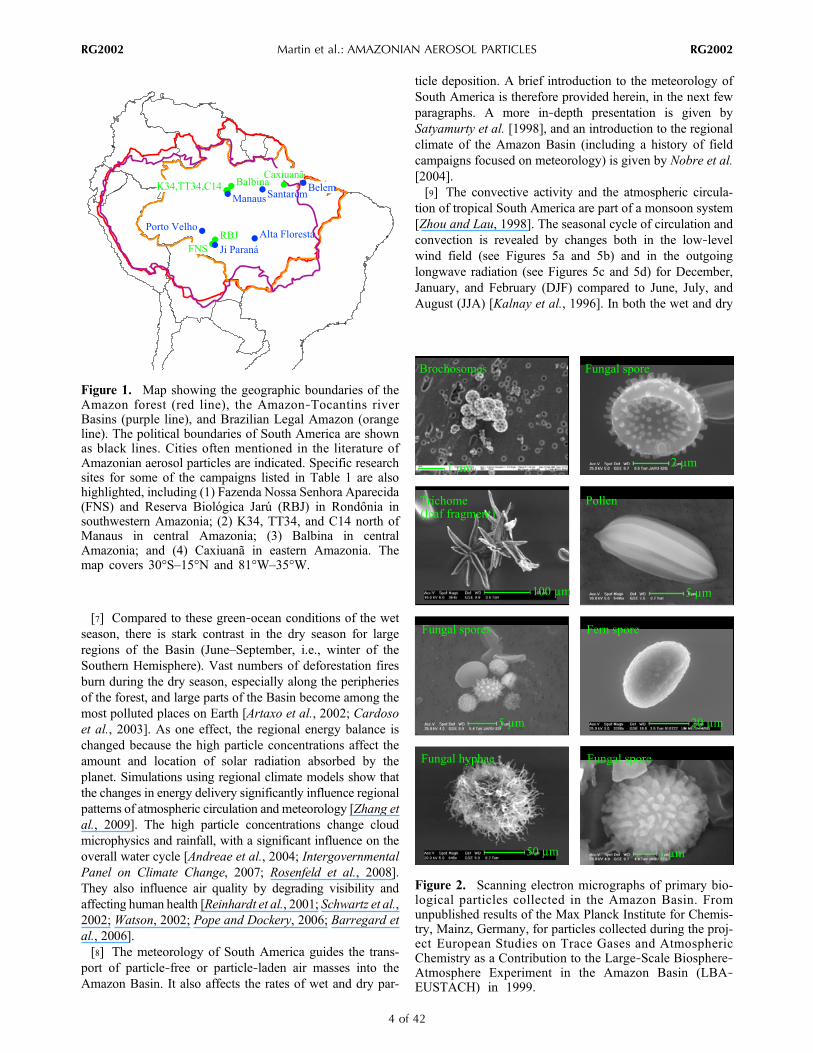
dominated, with the exception of some urbanized areas andtransportation corridors, by natural and anthropogenicemissions from the biosphere. Sources include both high butintermittent biomass‐burning emissions (both natural andanthropogenic) and low but more consistent production ofprimary and secondary biological aerosol particles andcomponents (Figure 2). Primary particles are produced bothdeliberately by flora (e.g., the release of pollen and fungalspores) and incidentally (e.g., as leaf and soil debris or assuspended microbes). Substantial production of secondaryaerosol occurs by the atmospheric oxidation of trace gases tolow‐volatility compounds. These products can deposit onpreexisting particles or possibly nucleate new particles.[4] Once in the atmosphere, particles undergo continuous
transformations (Figure 3). Processes include (photo)chem-ical reactions that occur between compounds within theparticles as well as interactions that occur between com-pounds within the particles and those in the gas phase, suchas the condensation of low‐volatility compounds or reac-tions with highly reactive gaseous species like the OHradical. Clouds are present at varying abundances almost
everywhere and all the time over the Amazon Basin, andmostparticles also undergo several cycles of cloud processingduring their residence in the Basin. The time scale of cloudcycling of boundary layer air (of the order of hours) isconsiderably shorter than the residence time of air over theBasin or the deposition lifetime of aerosol particles (of theorder of days). Cloud processing can modify particle prop-erties both by chemical reactions in the liquid phase and byinteractions between droplets (e.g., collision and coagula-tion). Particles leave the Amazonian atmosphere by drydeposition to the vegetation surface, by cloud scavengingand precipitation, and by advection out of the region.[5] In addition to particle sources within the Basin, there
are also important and at times dominant long‐range naturaland anthropogenic sources (Figure 4). The influence oflong‐range transport is particularly important when in‐Basinsources are weak, such as in the wet season, and under theseconditions the particle population can be dominated at timesboth in mass and number by outflow from other areas. TheAtlantic Ocean, upwind of the Basin, is a strong source ofmarine particles that are generated both directly by sea sprayas well as indirectly by the conversion of gases, such as theoxidation of dimethyl sulfide (DMS) to form sulfate. Acrossthe Atlantic and farther upwind of the Basin, the Saharandesert is the world’s largest source of mineral dust. Sub‐Saharan Africa is one of the most important sources ofsmoke from vegetation fires. Although the inflowing airmasses that arrive with the trade winds from the Atlanticshed much of their particle burden in transit from Africa andEurasia, the impact of transatlantic transport on particlesmeasured in the Basin can, nevertheless, be substantial andat times dominant [Prospero et al., 1981; Andreae et al.,1990a; Artaxo et al., 1990; Swap et al., 1992; Formenti etal., 2001; Chen et al., 2009]. Furthermore, pollution‐derived particles from urban and industrialized areas insouthern and eastern Brazil and other South Americancountries can also be transported into the Basin, especiallyin the dry season.[6] During the wet season (December–March, i.e., sum-
mer of the Southern Hemisphere), atmospheric particles areremoved relatively quickly by wet deposition, and anthro-pogenic sources such as biomass burning are weak through-out the Basin. This combination of circumstances results innatural processes (including contributions from marine andAfrican sources) as the dominant contributors to the ambientparticle populations over large expanses of the Basin andduring a significant part of the year. The particle concentra-tions measured during these conditions are among the lowestfound on any continent and are similar to those over theremote oceans [Andreae, 2009]. The Basin has been dubbedthe “green ocean” because of the similarities in particleconcentrations and cloudmicrophysics between it and remoteoceanic regions [Williams et al., 2002]. The Amazon Basinmay be the only region on the tropical continents wherethere remains the possibility to find at times populations ofnearly pristine aerosol particles free of direct anthropogenicinfluences.
Martin et al.: AMAZONIAN AEROSOL PARTICLES RG2002RG2002
2 of 42
TABLE
1.Major
International
MeasurementCam
paign
sof
Amazon
ianAerosol
Particles
a
Dates
Acron
ymCam
paign
LocationandDescriptio
nGroun
dAirbo
rne
Science
Focus
Reference
Jul–Aug
1985
ABLE‐2A
Amazon
Bou
ndaryLayer
Exp
erim
ent:dryseason
dryseason
inAmazon
iaY
(Manaus)
Y(ER‐2
andElectra)
tracegasand
meteorological
measurements
Harriss
etal.[198
8]
Apr–M
ay19
87ABLE‐2B
Amazon
Bou
ndaryLayer
Exp
erim
ent:wet
season
wet
season
inAmazon
iaY
(Manaus)
Y(ER‐2
andElectra)
tracegasand
meteorological
measurements
Harriss
etal.[199
0]
Aug–S
ep19
95SCAR‐B
Smok
e,Cloud
s,and
Radiatio
n–Brazil
dryseason
indisturbed
southern
Amazon
ia(Brasilia
andAlta
Florestain
southern
Amazon
ia)
YY
(ER‐2
andCon
vair)
effectsof
biom
ass
burningon
clim
ate
(directeffect)
Kau
fman
etal.[199
8]
Mar–A
pr19
98CLAIRE‐98
Coo
perativ
eLBA
Airbo
rneRegional
Exp
erim
ent
wet
season
inun
disturbedcentral
Amazon
ia(Balbina
incentralAmazon
ia)
Ychem
istryand
physicsof
biog
enic
aerosols
Avissar
etal.[200
2]
Apr–M
ay19
99and
Sep–O
ct19
99
LBA‐
EUSTACH
Europ
eanStudies
onTrace
Gases
andAtm
osph
eric
Chemistryas
aCon
tributionto
the
Large‐Scale
Biosphere‐A
tmosph
ere
Exp
erim
entin
Amazon
ia
wet
season
indisturbed
western
Amazon
ia(FNS
andRBJin
Ron
dônia
insouthw
estern
Amazon
ia,
K34
andC14
incentral
Amazon
ia,andCaxiuanã
ineasternAmazon
ia)
YY
(Bandeirante)
chem
istryand
physicsof
wet
season
biog
enic
aerosolsand
tracegasem
ission
sandreactiv
ity
And
reae
etal.[200
2]
Jul20
01CLAIRE‐01
Coo
perativ
eLBA
Airbo
rneRegional
Exp
erim
ent
transitio
nof
wet
todry
season
inun
disturbed
centralAmazon
ia(Balbina)
YY
(Bandeirante)
chem
istryand
physicsof
biog
enic
aerosolsandtrace
gasem
ission
sandreactiv
itySep–N
ov20
02LBA‐
SMOCC
Large‐Scale
Biosphere‐
Atm
osph
ereExp
erim
ent
inAmazon
ia:Smok
e,Aerosols,Cloud
s,Rainfall,andClim
ate
Field
Cam
paign
dryseason
biom
ass
burningexperiment
inpastureandforest
sitesin
disturbed
Amazon
ia(FNSand
RBJRon
dônia)
YY
(Bandeirante)
effectsof
biom
ass
burningon
clou
ds(ind
irecteffect)
Fuzziet
al.[200
7]
Aug–S
ep20
04TROFFEE
TropicalForestand
FireEmission
sExp
erim
ent
dryseason
indisturbed
southern
Amazon
ia(A
ltaFloresta)
Y(Bandeirante)
measurementsof
aerosol
andtracegasem
ission
factorsfrom
biom
ass
burning
Yokelsonet
al.[200
7]
Feb–M
ar20
08AMAZE‐08
Amazon
ianAerosol
Characterization
Exp
erim
ent
wet
season
inun
disturbedcentral
Amazon
ia(TT34
north
ofManausin
central
Amazon
ia)
YN
chem
istryandph
ysics
ofbiog
enic
aerosols
andtracegasem
ission
sandreactiv
ity
S.T.Martin
etal.
(manuscriptin
preparation,
2010
)
a Beginning
inthe19
80s,large‐scalemeasurementcam
paigns
focusing
ontheatmosph
ericsciences
beganin
theAmazon
Basin,and
manyof
them
hadatleasta
compo
nent
devo
tedto
aerosolresearch.
Overthesame
timespan,these
limited‐term
campaigns
have
been
complem
entedby
someextend
edmeasurementseries
atfixedgrou
ndstations.K
ey:Y,y
es;N,n
o;FNS,F
azenda
Nossa
Senho
raAparecida;RBJ,Reserva
Biológica
Jarú.
Martin et al.: AMAZONIAN AEROSOL PARTICLES RG2002RG2002
3 of 42
[7] Compared to these green‐ocean conditions of the wetseason, there is stark contrast in the dry season for largeregions of the Basin (June–September, i.e., winter of theSouthern Hemisphere). Vast numbers of deforestation firesburn during the dry season, especially along the peripheriesof the forest, and large parts of the Basin become among themost polluted places on Earth [Artaxo et al., 2002; Cardosoet al., 2003]. As one effect, the regional energy balance ischanged because the high particle concentrations affect theamount and location of solar radiation absorbed by theplanet. Simulations using regional climate models show thatthe changes in energy delivery significantly influence regionalpatterns of atmospheric circulation and meteorology [Zhang etal., 2009]. The high particle concentrations change cloudmicrophysics and rainfall, with a significant influence on theoverall water cycle [Andreae et al., 2004; IntergovernmentalPanel on Climate Change, 2007; Rosenfeld et al., 2008].They also influence air quality by degrading visibility andaffecting human health [Reinhardt et al., 2001; Schwartz et al.,2002; Watson, 2002; Pope and Dockery, 2006; Barregard etal., 2006].[8] The meteorology of South America guides the trans-
port of particle‐free or particle‐laden air masses into theAmazon Basin. It also affects the rates of wet and dry par-
ticle deposition. A brief introduction to the meteorology ofSouth America is therefore provided herein, in the next fewparagraphs. A more in‐depth presentation is given bySatyamurty et al. [1998], and an introduction to the regionalclimate of the Amazon Basin (including a history of fieldcampaigns focused on meteorology) is given by Nobre et al.[2004].[9] The convective activity and the atmospheric circula-
tion of tropical South America are part of a monsoon system[Zhou and Lau, 1998]. The seasonal cycle of circulation andconvection is revealed by changes both in the low‐levelwind field (see Figures 5a and 5b) and in the outgoinglongwave radiation (see Figures 5c and 5d) for December,January, and February (DJF) compared to June, July, andAugust (JJA) [Kalnay et al., 1996]. In both the wet and dry
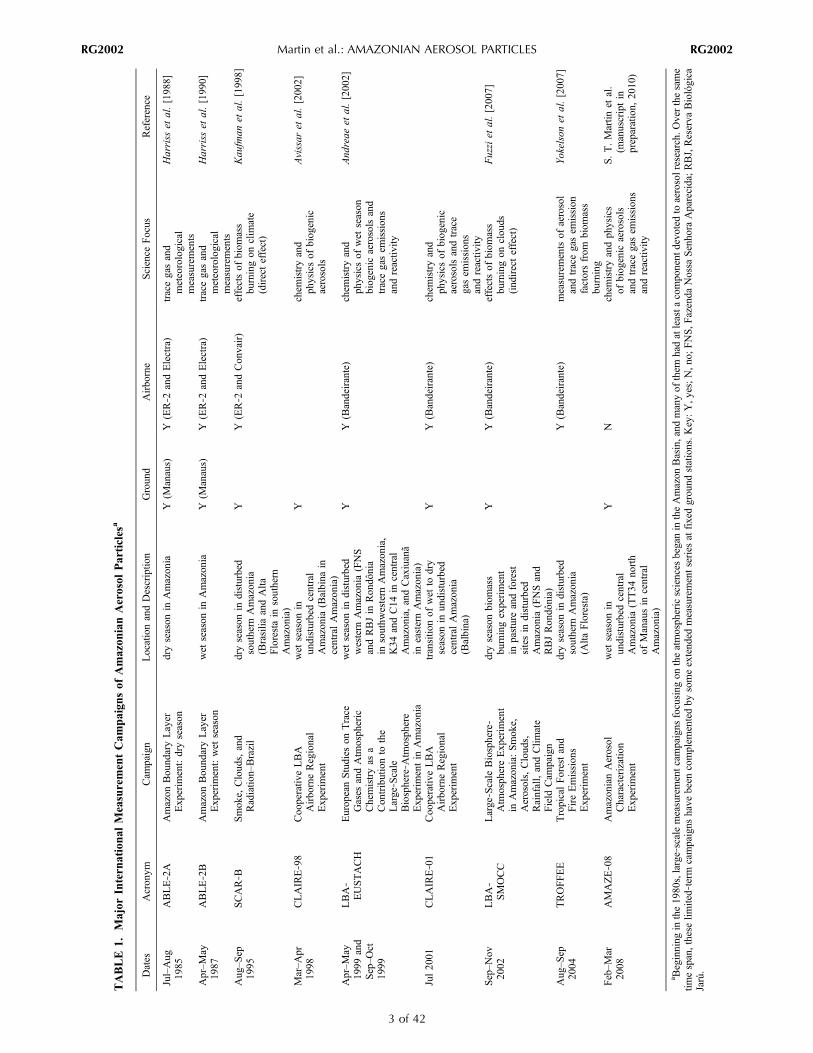
Figure 1. Map showing the geographic boundaries of theAmazon forest (red line), the Amazon‐Tocantins riverBasins (purple line), and Brazilian Legal Amazon (orangeline). The political boundaries of South America are shownas black lines. Cities often mentioned in the literature ofAmazonian aerosol particles are indicated. Specific researchsites for some of the campaigns listed in Table 1 are alsohighlighted, including (1) Fazenda Nossa Senhora Aparecida(FNS) and Reserva Biológica Jarú (RBJ) in Rondônia insouthwestern Amazonia; (2) K34, TT34, and C14 north ofManaus in central Amazonia; (3) Balbina in centralAmazonia; and (4) Caxiuanã in eastern Amazonia. Themap covers 30°S–15°N and 81°W–35°W.
Figure 2. Scanning electron micrographs of primary bio-logical particles collected in the Amazon Basin. Fromunpublished results of the Max Planck Institute for Chemis-try, Mainz, Germany, for particles collected during the proj-ect European Studies on Trace Gases and AtmosphericChemistry as a Contribution to the Large‐Scale Biosphere‐Atmosphere Experiment in the Amazon Basin (LBA‐EUSTACH) in 1999.
Martin et al.: AMAZONIAN AEROSOL PARTICLES RG2002RG2002
4 of 42

seasons, there is considerable inflow coming from the eastinto the Basin. These air masses originate in the Atlantic,and many of them pass through the semiarid region ofnortheastern Brazil before entering central and southernregions of the Basin [Satyamurty et al., 1998].[10] Several aspects of Figure 5 are important for under-
standing the variability of particle concentrations and com-positions observed in the Amazon Basin. For northern andcentral Amazonia, the Intertropical Convergence Zone(ITCZ), which is the confluence between the northeasternand southeastern trade winds extending from West Africa toSouth America (Figures 5a and 5b), has an important in-fluence. The ITCZ reaches the northern coast of SouthAmerica just south of the equator in DJF but just north of itin JJA. When the ITCZ is located to the south of the equatorin DJF (i.e., a large part of the Basin is under the influenceof air from the Northern Hemisphere), low‐level winds from
the global northeast reach the northern coast of SouthAmerica and open up the possibility of advection of Africandust and biomass‐burning particles [e.g., Artaxo andHansson, 1995; Formenti et al., 2001]. During the wetseason, Figure 5c shows that the outgoing longwave radia-tion has a minimum over central Amazonia, implying coldcloud tops and hence deep clouds with strong convectionand high rates of wet deposition. There is also strong ver-tical transport and redistribution of particles [Freitas et al.,2000; Andreae et al., 2001]. In comparison, during thedry season the convection weakens and shifts to the north-western edge of geographical Amazonia (Figure 5d).[11] In the southern part of the Amazon Basin, north-
westerlies prevail during the wet season and are associatedwith the South Atlantic Convergence Zone (SACZ), aregion of enhanced convective activity extending from cen-tral Amazonia to the southeast [Kodama, 1992]. The SACZ
Figure 3. Illustration of vertical mixing processes that affect the particle number‐diameter distribution ofaerosol particles in the Amazon Basin. The region of the lowest 4 km represents daytime conditions with afully developed mixing layer and shallow convection in the transition layer. Upward transport is controlledby deep convection and fair‐weather cumulus clouds. Subsidence dominates the large‐scale downwardtransport. Figure 3 is based on Krejci et al. [2003, Figure 9]; the original intent was to describe observa-tions over Suriname, but the processes depicted are applicable to the wider Amazon Basin.
Martin et al.: AMAZONIAN AEROSOL PARTICLES RG2002RG2002
5 of 42
forms a quasi‐stationary front with significant intraseasonalvariability. As the remains of midlatitude fronts reach thetropical region [Garreaud and Wallace, 1998], the SACZ isreinforced. In the absence of perturbations coming from thesouth, the SACZ weakens and may disappear. This vari-ability leads to a change in low‐level winds from easterliesin the break periods to westerlies in the periods of well‐defined SACZ. The active and break periods are related tointraseasonal oscillations [Nogues‐Paegle and Mo, 1997]that affect the whole region from the northern coast [Wangand Fu, 2002] to the more continental area [Jones andCarvalho, 2002]. During the break periods, deep convec-tive systems are commonly isolated, and (given the absenceof sinks) particle concentrations are relatively high. By
comparison, during SACZ events convection and rainfall aremore widespread, the atmosphere is clean, and particleconcentrations are relatively low [Silva Dias et al., 2002;Williams et al., 2002].[12] With the coming of the dry season, the low‐level
winds in the southern part of the Basin reverse, changingfrom northwesterlies to southeasterlies (Figures 5a and 5b).These patterns favor the flow of pollution from urban andindustrial Brazil into this region of Amazonia, thereby in-creasing particle concentrations. Alternatively, cold‐frontsoutherlies (i.e., winter in the Southern Hemisphere) canbring clean air into the southern part of Amazonia, in somecases extending as far as the equator [Marengo et al., 1997].At these times, particle concentrations in southern Amazo-nia can drop considerably. More typically, however, bio-mass burning in the Basin leads to sustained high particleconcentrations regardless of southerlies or southeasterlies[Artaxo et al., 2002].[13] The diel evolution of the planetary boundary layer
(see Figure 6) also affects particle concentrations measuredat the surface. During the afternoon, the boundary layer iswell mixed by strong turbulence that is driven by sensibleheat flux from the surface. The depth of this convectiveboundary layer (CBL) is variable depending on land coverand on the meteorology. By late afternoon CBL depths>1000 m are typical in the Amazon Basin, although vari-ability is high. Fisch et al. [2004] observed differences be-tween the wet and dry seasons (e.g., lower than 1500 m inthe former and up to 2000 m in the latter) and between forestand pasture landscapes. At sunset, radiative cooling at thesurface generates a nocturnal stable layer. The nocturnalboundary layer usually has a depth of a few hundred metersor less. The residual layer above the nocturnal stable layer istypically without turbulence or mixing, although there areexceptions at times when higher‐altitude shearing jets arepresent that induce turnover and hence the cleansing of theresidual layer with cleaner higher‐altitude air. In the absenceof cleansing, the nighttime residual layer conserves theproperties (such as particle and gas concentrations) of theprevious afternoon until the following morning.[14] These basic characteristics of the daytime and
nighttime boundary layers affect particle concentrationsmeasured at the surface. During the afternoon, emissionsfrom the surface get mixed though the whole volume of theconvective boundary layer, diluting their concentrations.Moreover, at the top of the boundary layer, turbulence in fairweather conditions maintains an entrainment of cleaner airfrom higher altitudes while convective clouds associatedwith rainy weather pump the aerosol particles to higherlevels. These effects favor a dip of particle concentrations inthe early afternoon. In comparison, the stable nocturnalboundary layer traps emissions in a volume near the surface,thereby favoring higher particle concentrations at night. Thiseffect is amplified during the dry season because biomassburning usually begins at midday and continues into theevening hours. The residual layer above the nocturnalboundary layer influences the surface concentrations thefollowing morning because the development of the con-
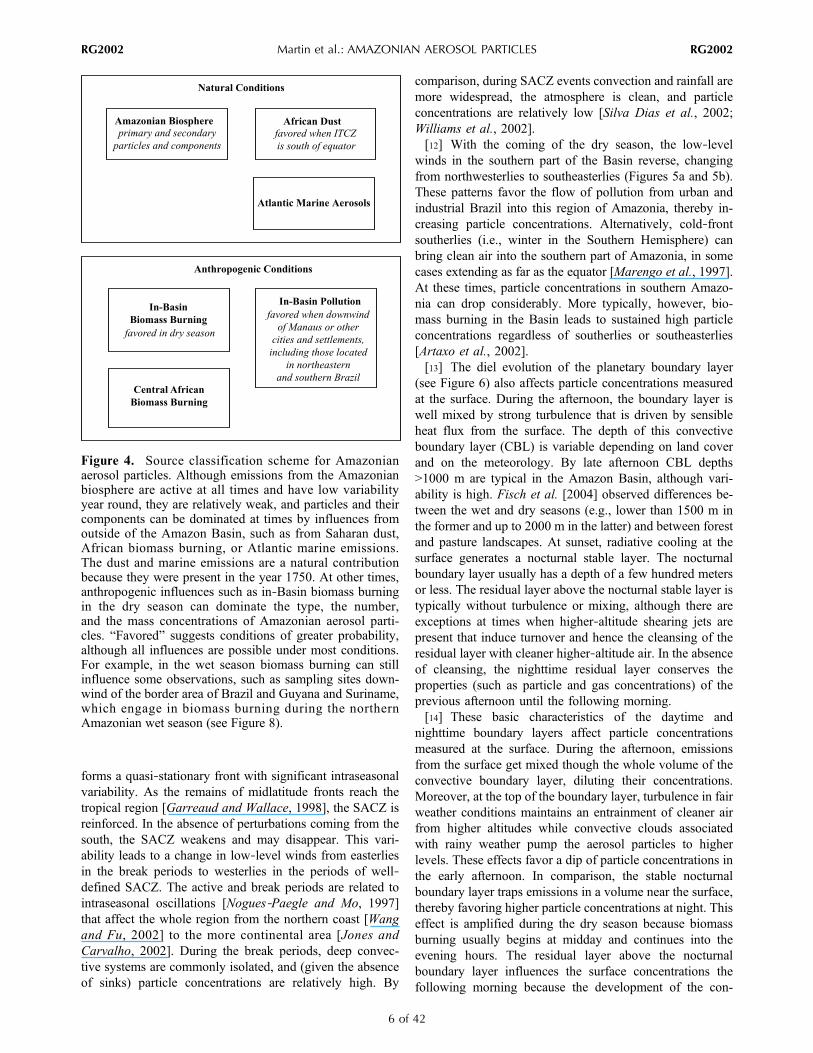
Figure 4. Source classification scheme for Amazonianaerosol particles. Although emissions from the Amazonianbiosphere are active at all times and have low variabilityyear round, they are relatively weak, and particles and theircomponents can be dominated at times by influences fromoutside of the Amazon Basin, such as from Saharan dust,African biomass burning, or Atlantic marine emissions.The dust and marine emissions are a natural contributionbecause they were present in the year 1750. At other times,anthropogenic influences such as in‐Basin biomass burningin the dry season can dominate the type, the number,and the mass concentrations of Amazonian aerosol parti-cles. “Favored” suggests conditions of greater probability,although all influences are possible under most conditions.For example, in the wet season biomass burning can stillinfluence some observations, such as sampling sites down-wind of the border area of Brazil and Guyana and Suriname,which engage in biomass burning during the northernAmazonian wet season (see Figure 8).
Martin et al.: AMAZONIAN AEROSOL PARTICLES RG2002RG2002
6 of 42
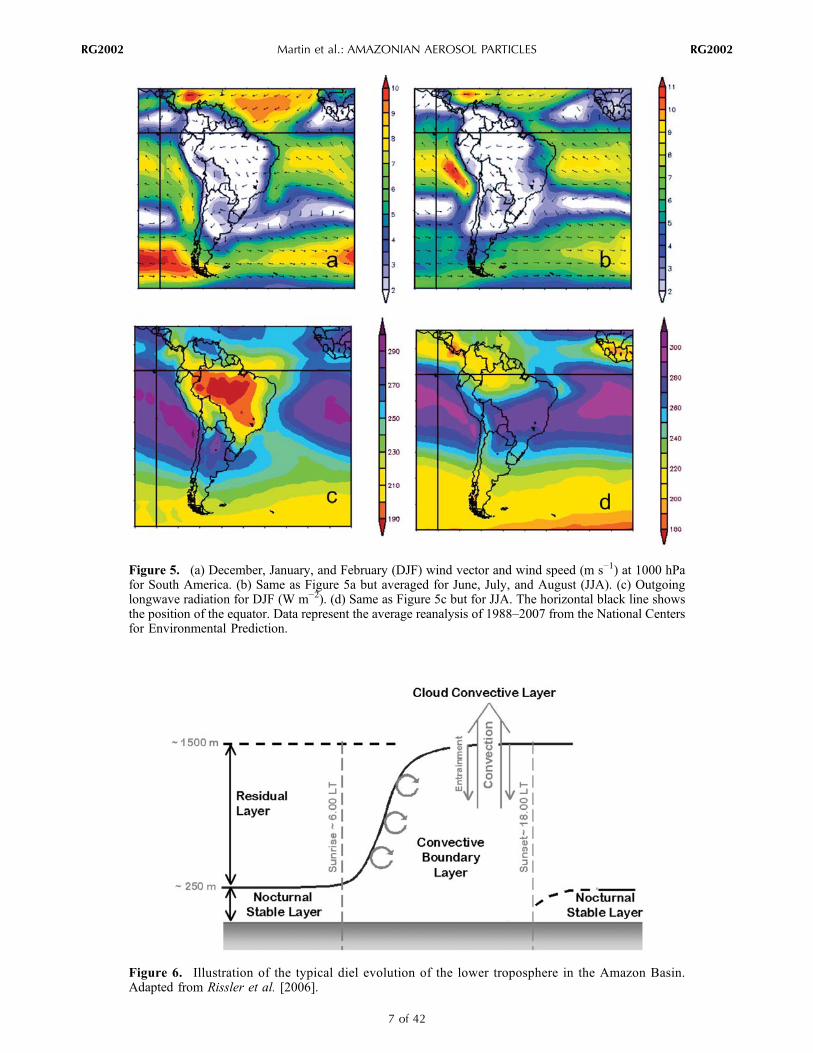
Figure 6. Illustration of the typical diel evolution of the lower troposphere in the Amazon Basin.Adapted from Rissler et al. [2006].
Figure 5. (a) December, January, and February (DJF) wind vector and wind speed (m s−1) at 1000 hPafor South America. (b) Same as Figure 5a but averaged for June, July, and August (JJA). (c) Outgoinglongwave radiation for DJF (W m−2). (d) Same as Figure 5c but for JJA. The horizontal black line showsthe position of the equator. Data represent the average reanalysis of 1988–2007 from the National Centersfor Environmental Prediction.
Martin et al.: AMAZONIAN AEROSOL PARTICLES RG2002RG2002
7 of 42

vective boundary layer mixes the nocturnal layer into theresidual layer. As a result, middle to late morning surfaceconcentrations (in the absence of nighttime cleansing of theresidual layer) can be similar to nighttime concentrationsmeasured the afternoon before in the convective boundarylayer [Rissler et al., 2006].[15] Given the seasonal and regional variability of the
contributions from different aerosol sources, the changingtransport paths of air masses, and the different removal ratesin the dry and wet seasons, the inference (which is supportedby the observations) is that Amazonian aerosol particleshave considerable variations in space and time, and conse-quently, there is a considerable body of literature to review.Our approach in this review is to follow the life cycle ofAmazonian aerosol particles, as outlined in the previousparagraphs. The review begins with a discussion of theprimary and secondary sources relevant to the Amazonianparticle burden, followed by a presentation of the particleproperties that characterize the mixed populations presentover the Amazon Basin at different times and places. Theseproperties include number and mass concentrations anddistributions, chemical composition, hygroscopicity, andcloud nucleation ability. The review presents Amazonianaerosol particles in the context of natural compared toanthropogenic sources as well as variability with season andmeteorology. The review concludes with an outlook andpriorities for further research.
2. SOURCES
[16] Amazonian aerosol particles have a wide range ofnatural and anthropogenic sources, and the integrated effectsof emission and processing in the atmosphere lead tocomplex internal and external mixtures of particles, evenwithin an apparently homogeneous air mass. The com-plexity can be usefully dissected by conceptualizing a singleparticle as composed of components. Depending on theirorigin, components are usually classified as primary orsecondary. Primary components are directly emitted from asource into the atmosphere; secondary components areformed in the atmosphere [Fuzzi et al., 2006]. A singleparticle composed mainly of primary components can becalled a primary aerosol particle, and a single particlecomposed mainly of secondary components can be called asecondary aerosol particle. After some air mass aging,many, if not most, individual particles can be composed ofsignificant quantities of both types of components. In theAmazon Basin, organic components typically constitute∼70%–90% of the particle mass concentration in both thefine and coarse size fractions [Graham et al., 2003a; Fuzzi etal., 2007].[17] Examples of primary biological aerosol (PBA) par-
ticles emitted in the Amazon Basin include pollen, bacteria,fungal and fern spores, viruses, and fragments of plants andanimals [Elbert et al., 2007]. Anthropogenic biomassburning is also an important and at times dominant sourceat some locations, especially during the dry season. Inaddition to sources within the Amazon Basin, primary par-
ticles are also brought in by long‐range transport, such asmarine particles from the Atlantic Ocean and desert dustor biomass‐burning particles from Africa [Andreae et al.,1990a; Artaxo et al., 1990; Swap et al., 1992; Formenti etal., 2001; Chen et al., 2009]. Regional urban and industrialactivities, including traffic and industry in Manaus and othercities and settlements in northeastern and southern Brazil,also have outflow plumes containing combustion‐derivedparticles and dust, and these plumes are significant when asampling location lies within them.[18] Examples of components of secondary organic
aerosol (SOA) are the low‐volatility molecules that resultfrom the reactions of O3 and OH with biogenic volatileorganic compounds (BVOCs), such as isoprene and ter-penes. BVOCs are emitted in large quantities to the gasphase by plants. Low‐volatility BVOC oxidation productscan condense from the gas phase onto preexisting particlesor alternatively can contribute to new‐particle formation.Liquid‐phase reactions inside cloud droplets can also yieldlow‐volatility BVOC oxidation products, serving as anothersource of organic components in particles for cloud dropletsthat evaporate [Blando and Turpin, 2000; Lim et al., 2005;Carlton et al., 2006].
2.1. Primary Particles
2.1.1. Primary Biological Particles[19] Emissions of primary biological particles are often
wind‐driven, such as suspension of pollen, plant debris, orsoil dust [Jaenicke, 2005; Pöschl, 2005]. In addition to wind‐driven release, certain biological organisms also actively ejectmaterials into the air for reproductive purposes, such as wet‐discharged fungal spores [Elbert et al., 2007]. Coarse‐modePBA particles in the Amazon Basin have sizes ranging fromseveral to tens of micrometers and include fragments ofplants and insects, pollen grains, algae, fern spores, andfungal spores [Graham et al., 2003a]. Microscopic analysesof collected particles show that in the absence of Africandust and Atlantic marine emissions, morphologically identifi-able biological particles dominate both the number‐diameterand volume‐diameter distributions of the coarse fraction fornatural conditions (Figure 7). PBA components like carbo-hydrates, proteins, and lipids, as well as elemental tracers, havealso been detected in the fine fraction [Artaxo and Hansson,1995; Andreae and Crutzen, 1997; Graham et al., 2003a].Observations during the Amazonian Aerosol CharacterizationExperiment 2008 (AMAZE‐08) by Sinha et al. [2009] andChen et al. [2009], however, suggest that PBA componentscontribute in a minor way to the size class below 1 mm. Nev-ertheless, the actual number, mass, and size of PBA particlesemitted to the fine fraction remain to be fully quantified forAmazonia, and the abundance and composition of PBAparticles are highly variable and still poorly characterized,partially because the distinction between biological and othercarbonaceous components requires advanced analyticaltechniques and intensive investigation [Pöschl, 2005;Fuzzi etal., 2006; Despres et al., 2007].[20] Fungi are an especially important source of coarse‐
mode PBA particles in the Basin. They actively discharge
Martin et al.: AMAZONIAN AEROSOL PARTICLES RG2002RG2002
8 of 42
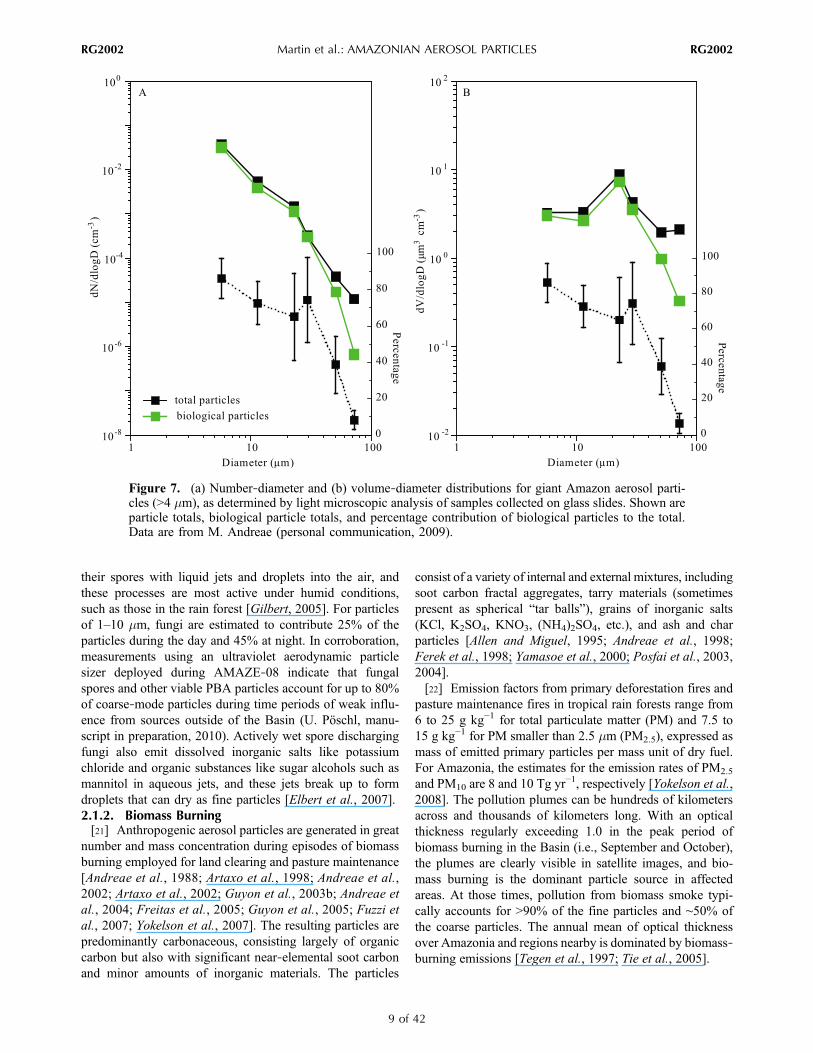
their spores with liquid jets and droplets into the air, andthese processes are most active under humid conditions,such as those in the rain forest [Gilbert, 2005]. For particlesof 1–10 mm, fungi are estimated to contribute 25% of theparticles during the day and 45% at night. In corroboration,measurements using an ultraviolet aerodynamic particlesizer deployed during AMAZE‐08 indicate that fungalspores and other viable PBA particles account for up to 80%of coarse‐mode particles during time periods of weak influ-ence from sources outside of the Basin (U. Pöschl, manu-script in preparation, 2010). Actively wet spore dischargingfungi also emit dissolved inorganic salts like potassiumchloride and organic substances like sugar alcohols such asmannitol in aqueous jets, and these jets break up to formdroplets that can dry as fine particles [Elbert et al., 2007].2.1.2. Biomass Burning[21] Anthropogenic aerosol particles are generated in great
number and mass concentration during episodes of biomassburning employed for land clearing and pasture maintenance[Andreae et al., 1988; Artaxo et al., 1998; Andreae et al.,2002; Artaxo et al., 2002; Guyon et al., 2003b; Andreae etal., 2004; Freitas et al., 2005; Guyon et al., 2005; Fuzzi etal., 2007; Yokelson et al., 2007]. The resulting particles arepredominantly carbonaceous, consisting largely of organiccarbon but also with significant near‐elemental soot carbonand minor amounts of inorganic materials. The particles
consist of a variety of internal and external mixtures, includingsoot carbon fractal aggregates, tarry materials (sometimespresent as spherical “tar balls”), grains of inorganic salts(KCl, K2SO4, KNO3, (NH4)2SO4, etc.), and ash and charparticles [Allen and Miguel, 1995; Andreae et al., 1998;Ferek et al., 1998; Yamasoe et al., 2000; Posfai et al., 2003,2004].[22] Emission factors from primary deforestation fires and
pasture maintenance fires in tropical rain forests range from6 to 25 g kg−1 for total particulate matter (PM) and 7.5 to15 g kg−1 for PM smaller than 2.5 mm (PM2.5), expressed asmass of emitted primary particles per mass unit of dry fuel.For Amazonia, the estimates for the emission rates of PM2.5
and PM10 are 8 and 10 Tg yr−1, respectively [Yokelson et al.,
2008]. The pollution plumes can be hundreds of kilometersacross and thousands of kilometers long. With an opticalthickness regularly exceeding 1.0 in the peak period ofbiomass burning in the Basin (i.e., September and October),the plumes are clearly visible in satellite images, and bio-mass burning is the dominant particle source in affectedareas. At those times, pollution from biomass smoke typi-cally accounts for >90% of the fine particles and ∼50% ofthe coarse particles. The annual mean of optical thicknessover Amazonia and regions nearby is dominated by biomass‐burning emissions [Tegen et al., 1997; Tie et al., 2005].
Figure 7. (a) Number‐diameter and (b) volume‐diameter distributions for giant Amazon aerosol parti-cles (>4 mm), as determined by light microscopic analysis of samples collected on glass slides. Shown areparticle totals, biological particle totals, and percentage contribution of biological particles to the total.Data are from M. Andreae (personal communication, 2009).
Martin et al.: AMAZONIAN AEROSOL PARTICLES RG2002RG2002
9 of 42
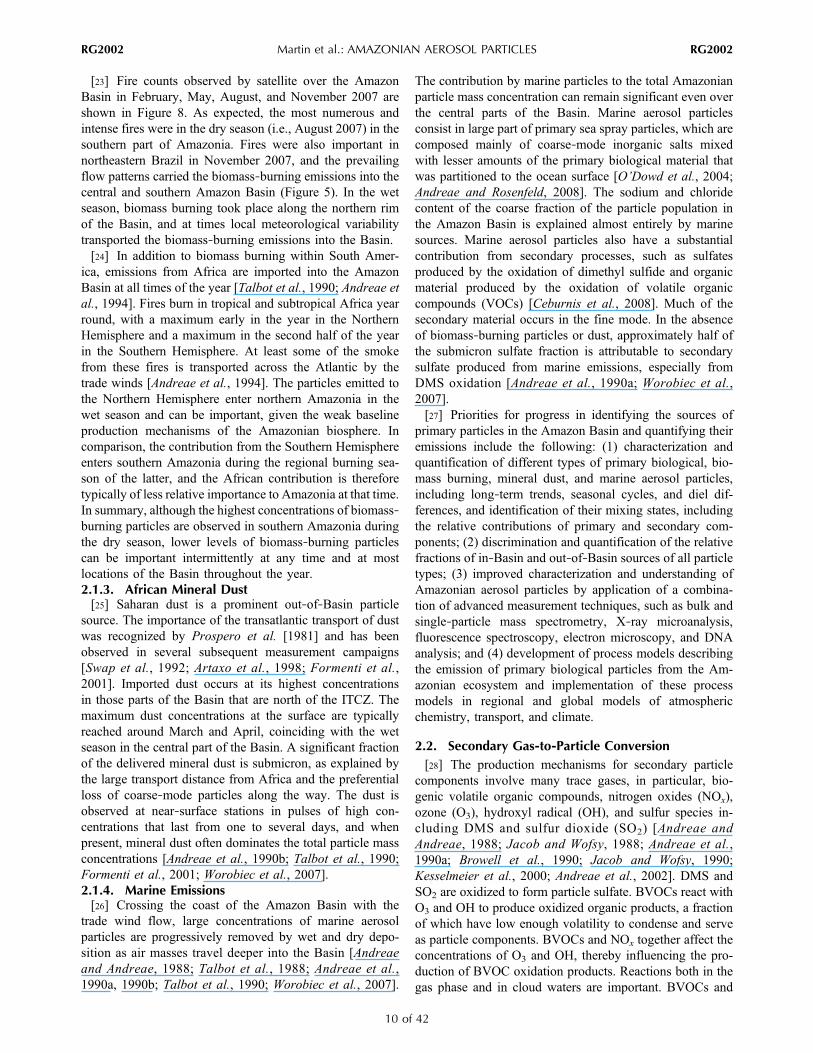
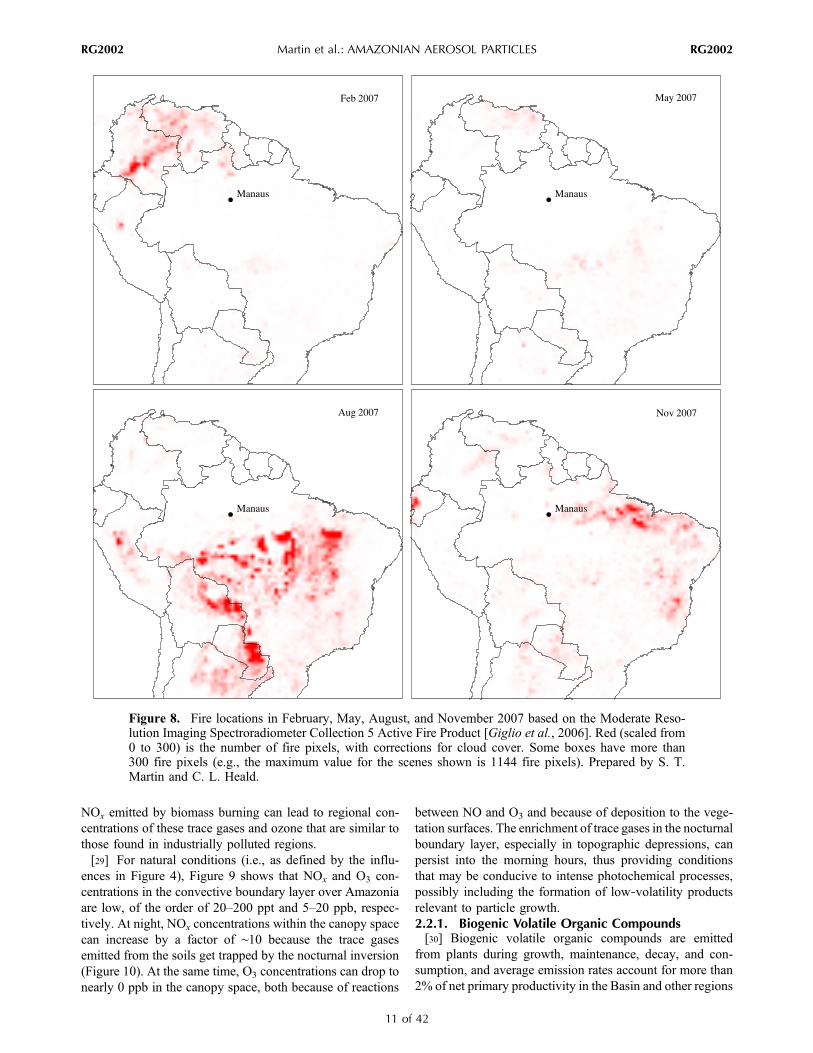
[23] Fire counts observed by satellite over the AmazonBasin in February, May, August, and November 2007 areshown in Figure 8. As expected, the most numerous andintense fires were in the dry season (i.e., August 2007) in thesouthern part of Amazonia. Fires were also important innortheastern Brazil in November 2007, and the prevailingflow patterns carried the biomass‐burning emissions into thecentral and southern Amazon Basin (Figure 5). In the wetseason, biomass burning took place along the northern rimof the Basin, and at times local meteorological variabilitytransported the biomass‐burning emissions into the Basin.[24] In addition to biomass burning within South Amer-
ica, emissions from Africa are imported into the AmazonBasin at all times of the year [Talbot et al., 1990; Andreae etal., 1994]. Fires burn in tropical and subtropical Africa yearround, with a maximum early in the year in the NorthernHemisphere and a maximum in the second half of the yearin the Southern Hemisphere. At least some of the smokefrom these fires is transported across the Atlantic by thetrade winds [Andreae et al., 1994]. The particles emitted tothe Northern Hemisphere enter northern Amazonia in thewet season and can be important, given the weak baselineproduction mechanisms of the Amazonian biosphere. Incomparison, the contribution from the Southern Hemisphereenters southern Amazonia during the regional burning sea-son of the latter, and the African contribution is thereforetypically of less relative importance to Amazonia at that time.In summary, although the highest concentrations of biomass‐burning particles are observed in southern Amazonia duringthe dry season, lower levels of biomass‐burning particlescan be important intermittently at any time and at mostlocations of the Basin throughout the year.2.1.3. African Mineral Dust[25] Saharan dust is a prominent out‐of‐Basin particle
source. The importance of the transatlantic transport of dustwas recognized by Prospero et al. [1981] and has beenobserved in several subsequent measurement campaigns[Swap et al., 1992; Artaxo et al., 1998; Formenti et al.,2001]. Imported dust occurs at its highest concentrationsin those parts of the Basin that are north of the ITCZ. Themaximum dust concentrations at the surface are typicallyreached around March and April, coinciding with the wetseason in the central part of the Basin. A significant fractionof the delivered mineral dust is submicron, as explained bythe large transport distance from Africa and the preferentialloss of coarse‐mode particles along the way. The dust isobserved at near‐surface stations in pulses of high con-centrations that last from one to several days, and whenpresent, mineral dust often dominates the total particle massconcentrations [Andreae et al., 1990b; Talbot et al., 1990;Formenti et al., 2001; Worobiec et al., 2007].2.1.4. Marine Emissions[26] Crossing the coast of the Amazon Basin with the
trade wind flow, large concentrations of marine aerosolparticles are progressively removed by wet and dry depo-sition as air masses travel deeper into the Basin [Andreaeand Andreae, 1988; Talbot et al., 1988; Andreae et al.,1990a, 1990b; Talbot et al., 1990; Worobiec et al., 2007].
The contribution by marine particles to the total Amazonianparticle mass concentration can remain significant even overthe central parts of the Basin. Marine aerosol particlesconsist in large part of primary sea spray particles, which arecomposed mainly of coarse‐mode inorganic salts mixedwith lesser amounts of the primary biological material thatwas partitioned to the ocean surface [O’Dowd et al., 2004;Andreae and Rosenfeld, 2008]. The sodium and chloridecontent of the coarse fraction of the particle population inthe Amazon Basin is explained almost entirely by marinesources. Marine aerosol particles also have a substantialcontribution from secondary processes, such as sulfatesproduced by the oxidation of dimethyl sulfide and organicmaterial produced by the oxidation of volatile organiccompounds (VOCs) [Ceburnis et al., 2008]. Much of thesecondary material occurs in the fine mode. In the absenceof biomass‐burning particles or dust, approximately half ofthe submicron sulfate fraction is attributable to secondarysulfate produced from marine emissions, especially fromDMS oxidation [Andreae et al., 1990a; Worobiec et al.,2007].[27] Priorities for progress in identifying the sources of
primary particles in the Amazon Basin and quantifying theiremissions include the following: (1) characterization andquantification of different types of primary biological, bio-mass burning, mineral dust, and marine aerosol particles,including long‐term trends, seasonal cycles, and diel dif-ferences, and identification of their mixing states, includingthe relative contributions of primary and secondary com-ponents; (2) discrimination and quantification of the relativefractions of in‐Basin and out‐of‐Basin sources of all particletypes; (3) improved characterization and understanding ofAmazonian aerosol particles by application of a combina-tion of advanced measurement techniques, such as bulk andsingle‐particle mass spectrometry, X‐ray microanalysis,fluorescence spectroscopy, electron microscopy, and DNAanalysis; and (4) development of process models describingthe emission of primary biological particles from the Am-azonian ecosystem and implementation of these processmodels in regional and global models of atmosphericchemistry, transport, and climate.
2.2. Secondary Gas‐to‐Particle Conversion[28] The production mechanisms for secondary particle
components involve many trace gases, in particular, bio-genic volatile organic compounds, nitrogen oxides (NOx),ozone (O3), hydroxyl radical (OH), and sulfur species in-cluding DMS and sulfur dioxide (SO2) [Andreae andAndreae, 1988; Jacob and Wofsy, 1988; Andreae et al.,1990a; Browell et al., 1990; Jacob and Wofsy, 1990;Kesselmeier et al., 2000; Andreae et al., 2002]. DMS andSO2 are oxidized to form particle sulfate. BVOCs react withO3 and OH to produce oxidized organic products, a fractionof which have low enough volatility to condense and serveas particle components. BVOCs and NOx together affect theconcentrations of O3 and OH, thereby influencing the pro-duction of BVOC oxidation products. Reactions both in thegas phase and in cloud waters are important. BVOCs and
Martin et al.: AMAZONIAN AEROSOL PARTICLES RG2002RG2002
10 of 42
NOx emitted by biomass burning can lead to regional con-centrations of these trace gases and ozone that are similar tothose found in industrially polluted regions.[29] For natural conditions (i.e., as defined by the influ-
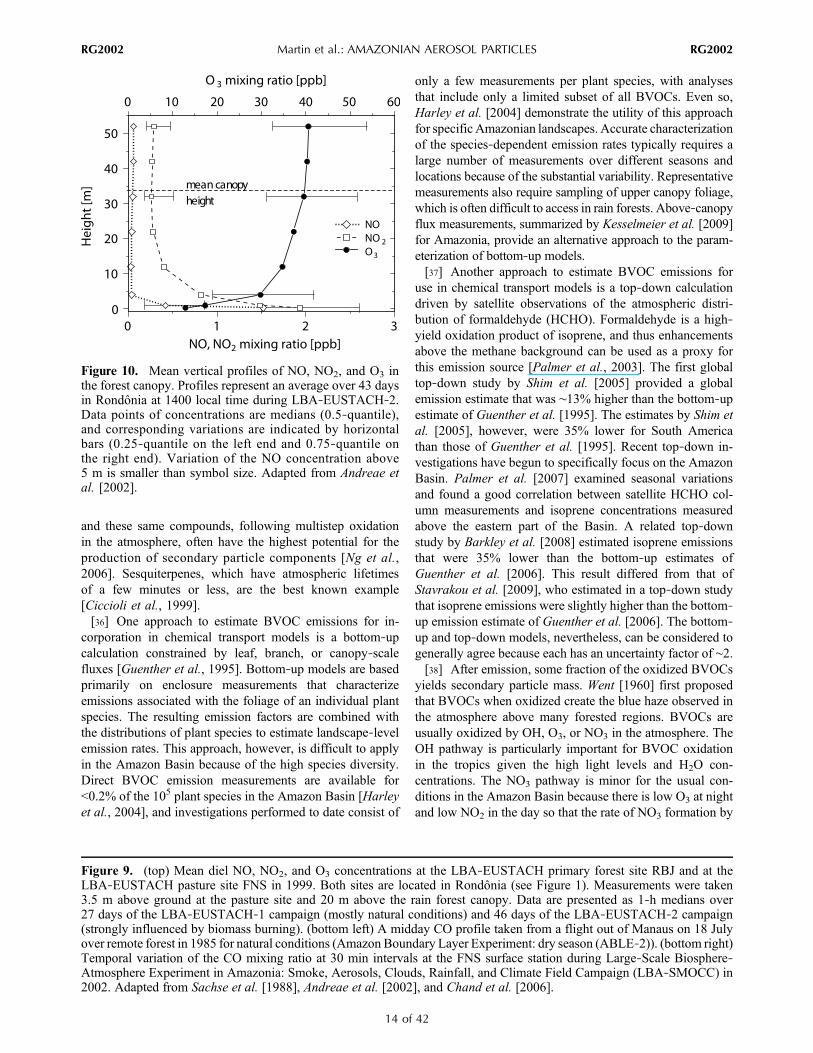
ences in Figure 4), Figure 9 shows that NOx and O3 con-centrations in the convective boundary layer over Amazoniaare low, of the order of 20–200 ppt and 5–20 ppb, respec-tively. At night, NOx concentrations within the canopy spacecan increase by a factor of ∼10 because the trace gasesemitted from the soils get trapped by the nocturnal inversion(Figure 10). At the same time, O3 concentrations can drop tonearly 0 ppb in the canopy space, both because of reactions
between NO and O3 and because of deposition to the vege-tation surfaces. The enrichment of trace gases in the nocturnalboundary layer, especially in topographic depressions, canpersist into the morning hours, thus providing conditionsthat may be conducive to intense photochemical processes,possibly including the formation of low‐volatility productsrelevant to particle growth.2.2.1. Biogenic Volatile Organic Compounds[30] Biogenic volatile organic compounds are emitted
from plants during growth, maintenance, decay, and con-sumption, and average emission rates account for more than2% of net primary productivity in the Basin and other regions
Figure 8. Fire locations in February, May, August, and November 2007 based on the Moderate Reso-lution Imaging Spectroradiometer Collection 5 Active Fire Product [Giglio et al., 2006]. Red (scaled from0 to 300) is the number of fire pixels, with corrections for cloud cover. Some boxes have more than300 fire pixels (e.g., the maximum value for the scenes shown is 1144 fire pixels). Prepared by S. T.Martin and C. L. Heald.
Martin et al.: AMAZONIAN AEROSOL PARTICLES RG2002RG2002
11 of 42
[Zimmerman et al., 1988]. The Amazon Basin contains onthe order of 105 plant species, each having unique signaturesof BVOC emissions. Estimates of BVOC emissions from thewhole of the Amazon Basin represent a challenging butimportant task. Prior to new studies conducted in the pastdecade, Amazonian BVOC emission estimates were basedon a small set of measurements conducted by Zimmerman etal. [1988]. Kuhn et al. [2007] and Karl et al. [2007] showedthat under some circumstances for specific compoundsmodels of biogenic emissions accurately simulated measuredBVOC fluxes in the region. The substantial recent progressin understanding Amazonian BVOC emissions and themajor remaining uncertainties are described in detail byKesselmeier et al. [2009].[31] The specific BVOC compounds emitted and their
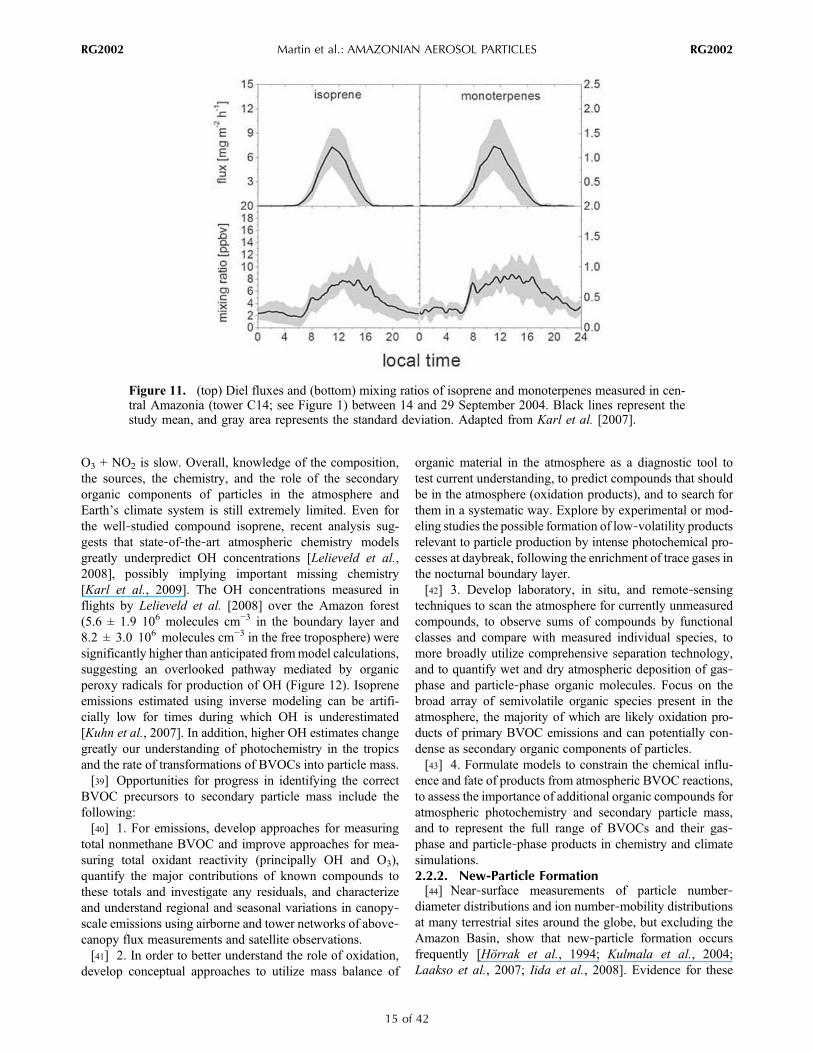
relative rates of emissions vary widely by plant species andenvironmental conditions. Major BVOCs emitted includeisoprene (C5H8), monoterpenes (i.e., compounds composedof two isoprene moieties), sesquiterpenes (i.e., three iso-prene moieties), ethane, and oxygenated VOCs. BVOCemissions typically increase exponentially with temperature,doubling every 5–15 K depending on the compound. Forsome compounds such as isoprene, emissions also increasewith available sunlight, and light‐dependent monoterpeneemissions result in a pronounced diel flux and mixing ratiocycle (Figure 11). The controlling mechanisms for emissiondiffer among compounds. Some are emitted immediatelyfollowing production, and others are stored in plant tissues.Examples of directly emitted compounds include isopreneand some types of monoterpenes and sesquiterpenes.Examples of stored compounds include other types of mono-terpenes and sesquiterpenes, some oxygenated terpenes, andsome components of plant oils. The factors influencing theemission of stored compounds to the atmosphere are complex,depending on molecular vapor pressure, animal herbivory,and plant phenology, moisture, or stress.[32] Although tropical forests are the dominant global
source of atmospheric BVOCs and the Amazon Basin is amajor contributor [Rasmussen and Khalil, 1988], BVOCemissions have been studied more extensively in temperateregions. The high species diversity in the Amazon Basin iscoupled with an ecological complexity and a seasonality,however, that is very different from temperate regions,yielding significantly different emission trends with differ-ent forest types. For example, because of the consistentlyhigh temperatures over the Amazon Basin, BVOC emis-sions do not exhibit large seasonality there. Isoprene andmonoterpene emissions and concentrations are also stronglycorrelated in the Amazon (Figure 11), in contrast to theiranticorrelated behavior in temperate forests. Isoprene con-centrations are highest at midday in temperate forests whilemonoterpene concentrations are highest at night, correspondingto their emission into a shallow boundary layer. Monoter-pene release by plants in those forests is dominated by theemission of stored compounds, and the diel monoterpeneemission pattern is therefore significantly different from thatof isoprene, which favors release during time periods ofintense sunlight. The explanation for the different diel
monoterperene emission pattern in the Amazon rain forest isnot yet fully known.[33] Emissions of BVOCs have been incorporated into
global chemical transport models, and the contribution oflow‐volatility BVOC oxidation products to the mass con-centration of organic particles has been predicted [Chungand Seinfeld, 2002; Tsigaridis and Kanakidou, 2003;Hoyle et al., 2007; Heald et al., 2008]. Heald et al. [2008]estimated that the conversion of South American BVOCsinto secondary particle mass contributes 40% of the annualglobal production of this particle component. Simulated con-centrations over the AmazonBasin varied from0.6 to 3mgm−3
and peaked in the dry season, corresponding to decreasedwet deposition during that time period.[34] A significant underestimate by models of ambient
organic particle concentrations, as reported for a number ofanthropogenically influenced environments, has been attrib-uted to underestimated conversion yields of oxidized VOCsto secondary particle mass [Volkamer et al., 2007]. Themodels employ laboratory‐based yields of a few percent forisoprene and 10%–15% for most terpenes [Chung andSeinfeld, 2002; Henze and Seinfeld, 2006]. These yields,however, may significantly underestimate what occurs overlonger time scales in the atmosphere [Ng et al., 2006]. Recentlaboratory studies carried out for BVOC concentrationspresent in the atmosphere have also shown that yields ofsecondary particle mass are higher than those obtained by theextrapolation of earlier laboratory results carried out athigher BVOC concentrations [Shilling et al., 2008], and thisfinding could potentially bring models and observations intocloser agreement. A mass balance approach, based on anal-ysis of the fate of BVOCs as either (1) oxidation to CO andCO2 or (2) deposition with the remainder assumed to formparticle mass, leads to much higher production estimates ofsecondary particle mass [Goldstein and Galbally, 2007]. Forthe Amazon Basin, the underpredictions by chemical trans-port models of observed concentrations appear significantlyless (e.g., 35% reported by Chen et al. [2009]) than thosereported for anthropogenically influenced regions of theworld.[35] Further refinement of the mass balance approach
requires better measurements of BVOC oxidation productsand their rates of wet and dry deposition. Studies of plantsignaling, defense, and food and flavor chemistry have ledto the detection of thousands of individual BVOCs [Hines,2006], yet only a few of these have been studied for theiremission rates, their atmospheric chemistry, and their con-tribution to secondary particle mass. Given the limitations inknowledge of emissions rates, oxidation pathways, andyields of particle mass, monoterpene, sesquiterpene, andother BVOC emissions are generally lumped into a fewcategories for both emission modeling and atmosphericchemistry modeling. As analytical techniques have im-proved in recent decades, a much broader array of highlyreactive and oxygenated BVOCs and their oxidation pro-ducts has been identified [Holzinger et al., 2005; Lee et al.,2006; Surratt et al., 2008]. The hardest to measure of thedirectly emitted compounds tend to be the most reactive,
Martin et al.: AMAZONIAN AEROSOL PARTICLES RG2002RG2002
12 of 42
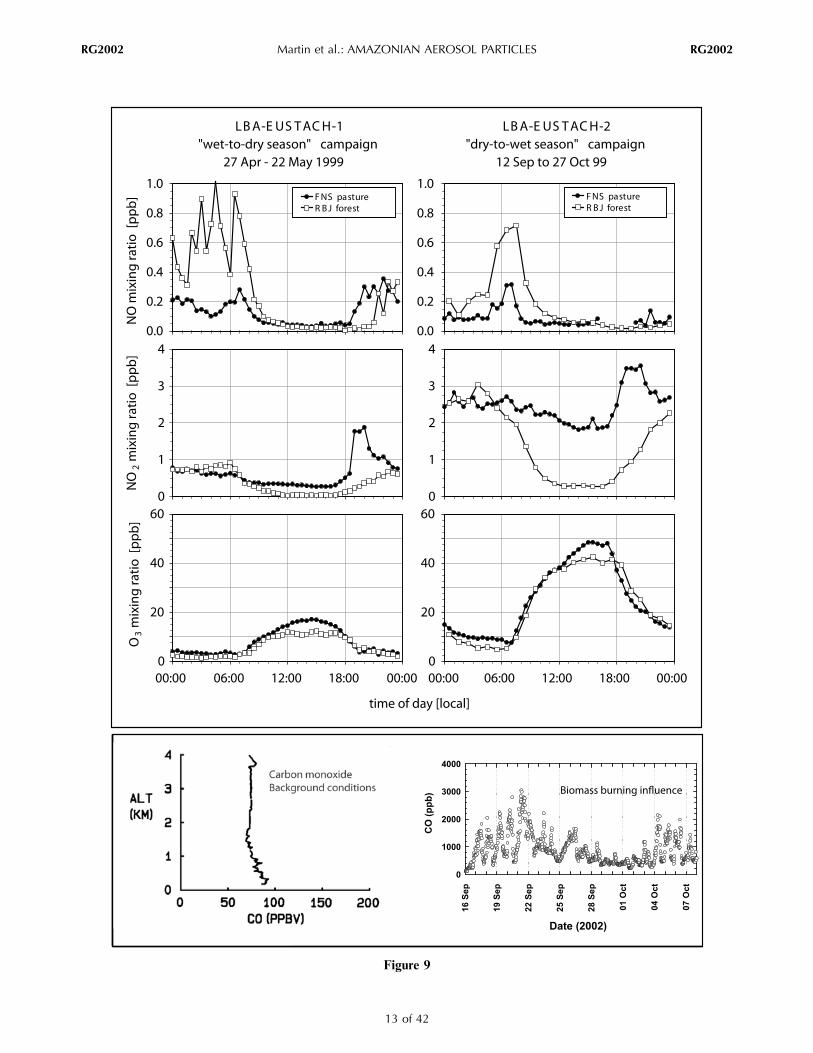
Figure 9
Martin et al.: AMAZONIAN AEROSOL PARTICLES RG2002RG2002
13 of 42
and these same compounds, following multistep oxidationin the atmosphere, often have the highest potential for theproduction of secondary particle components [Ng et al.,2006]. Sesquiterpenes, which have atmospheric lifetimesof a few minutes or less, are the best known example[Ciccioli et al., 1999].[36] One approach to estimate BVOC emissions for in-
corporation in chemical transport models is a bottom‐upcalculation constrained by leaf, branch, or canopy‐scalefluxes [Guenther et al., 1995]. Bottom‐up models are basedprimarily on enclosure measurements that characterizeemissions associated with the foliage of an individual plantspecies. The resulting emission factors are combined withthe distributions of plant species to estimate landscape‐levelemission rates. This approach, however, is difficult to applyin the Amazon Basin because of the high species diversity.Direct BVOC emission measurements are available for<0.2% of the 105 plant species in the Amazon Basin [Harleyet al., 2004], and investigations performed to date consist of
only a few measurements per plant species, with analysesthat include only a limited subset of all BVOCs. Even so,Harley et al. [2004] demonstrate the utility of this approachfor specific Amazonian landscapes. Accurate characterizationof the species‐dependent emission rates typically requires alarge number of measurements over different seasons andlocations because of the substantial variability. Representativemeasurements also require sampling of upper canopy foliage,which is often difficult to access in rain forests. Above‐canopyflux measurements, summarized by Kesselmeier et al. [2009]for Amazonia, provide an alternative approach to the param-eterization of bottom‐up models.[37] Another approach to estimate BVOC emissions for
use in chemical transport models is a top‐down calculationdriven by satellite observations of the atmospheric distri-bution of formaldehyde (HCHO). Formaldehyde is a high‐yield oxidation product of isoprene, and thus enhancementsabove the methane background can be used as a proxy forthis emission source [Palmer et al., 2003]. The first globaltop‐down study by Shim et al. [2005] provided a globalemission estimate that was ∼13% higher than the bottom‐upestimate of Guenther et al. [1995]. The estimates by Shim etal. [2005], however, were 35% lower for South Americathan those of Guenther et al. [1995]. Recent top‐down in-vestigations have begun to specifically focus on the AmazonBasin. Palmer et al. [2007] examined seasonal variationsand found a good correlation between satellite HCHO col-umn measurements and isoprene concentrations measuredabove the eastern part of the Basin. A related top‐downstudy by Barkley et al. [2008] estimated isoprene emissionsthat were 35% lower than the bottom‐up estimates ofGuenther et al. [2006]. This result differed from that ofStavrakou et al. [2009], who estimated in a top‐down studythat isoprene emissions were slightly higher than the bottom‐up emission estimate of Guenther et al. [2006]. The bottom‐up and top‐down models, nevertheless, can be considered togenerally agree because each has an uncertainty factor of ∼2.[38] After emission, some fraction of the oxidized BVOCs
yields secondary particle mass. Went [1960] first proposedthat BVOCs when oxidized create the blue haze observed inthe atmosphere above many forested regions. BVOCs areusually oxidized by OH, O3, or NO3 in the atmosphere. TheOH pathway is particularly important for BVOC oxidationin the tropics given the high light levels and H2O con-centrations. The NO3 pathway is minor for the usual con-ditions in the Amazon Basin because there is low O3 at nightand low NO2 in the day so that the rate of NO3 formation by
Figure 9. (top) Mean diel NO, NO2, and O3 concentrations at the LBA‐EUSTACH primary forest site RBJ and at theLBA‐EUSTACH pasture site FNS in 1999. Both sites are located in Rondônia (see Figure 1). Measurements were taken3.5 m above ground at the pasture site and 20 m above the rain forest canopy. Data are presented as 1‐h medians over27 days of the LBA‐EUSTACH‐1 campaign (mostly natural conditions) and 46 days of the LBA‐EUSTACH‐2 campaign(strongly influenced by biomass burning). (bottom left) A midday CO profile taken from a flight out of Manaus on 18 Julyover remote forest in 1985 for natural conditions (Amazon Boundary Layer Experiment: dry season (ABLE‐2)). (bottom right)Temporal variation of the CO mixing ratio at 30 min intervals at the FNS surface station during Large‐Scale Biosphere‐Atmosphere Experiment in Amazonia: Smoke, Aerosols, Clouds, Rainfall, and Climate Field Campaign (LBA‐SMOCC) in2002. Adapted from Sachse et al. [1988], Andreae et al. [2002], and Chand et al. [2006].
Figure 10. Mean vertical profiles of NO, NO2, and O3 inthe forest canopy. Profiles represent an average over 43 daysin Rondônia at 1400 local time during LBA‐EUSTACH‐2.Data points of concentrations are medians (0.5‐quantile),and corresponding variations are indicated by horizontalbars (0.25‐quantile on the left end and 0.75‐quantile onthe right end). Variation of the NO concentration above5 m is smaller than symbol size. Adapted from Andreae etal. [2002].
Martin et al.: AMAZONIAN AEROSOL PARTICLES RG2002RG2002
14 of 42
O3 + NO2 is slow. Overall, knowledge of the composition,the sources, the chemistry, and the role of the secondaryorganic components of particles in the atmosphere andEarth’s climate system is still extremely limited. Even forthe well‐studied compound isoprene, recent analysis sug-gests that state‐of‐the‐art atmospheric chemistry modelsgreatly underpredict OH concentrations [Lelieveld et al.,2008], possibly implying important missing chemistry[Karl et al., 2009]. The OH concentrations measured inflights by Lelieveld et al. [2008] over the Amazon forest(5.6 ± 1.9 106 molecules cm−3 in the boundary layer and8.2 ± 3.0 106 molecules cm−3 in the free troposphere) weresignificantly higher than anticipated frommodel calculations,suggesting an overlooked pathway mediated by organicperoxy radicals for production of OH (Figure 12). Isopreneemissions estimated using inverse modeling can be artifi-cially low for times during which OH is underestimated[Kuhn et al., 2007]. In addition, higher OH estimates changegreatly our understanding of photochemistry in the tropicsand the rate of transformations of BVOCs into particle mass.[39] Opportunities for progress in identifying the correct
BVOC precursors to secondary particle mass include thefollowing:[40] 1. For emissions, develop approaches for measuring
total nonmethane BVOC and improve approaches for mea-suring total oxidant reactivity (principally OH and O3),quantify the major contributions of known compounds tothese totals and investigate any residuals, and characterizeand understand regional and seasonal variations in canopy‐scale emissions using airborne and tower networks of above‐canopy flux measurements and satellite observations.[41] 2. In order to better understand the role of oxidation,
develop conceptual approaches to utilize mass balance of
organic material in the atmosphere as a diagnostic tool totest current understanding, to predict compounds that shouldbe in the atmosphere (oxidation products), and to search forthem in a systematic way. Explore by experimental or mod-eling studies the possible formation of low‐volatility productsrelevant to particle production by intense photochemical pro-cesses at daybreak, following the enrichment of trace gases inthe nocturnal boundary layer.[42] 3. Develop laboratory, in situ, and remote‐sensing
techniques to scan the atmosphere for currently unmeasuredcompounds, to observe sums of compounds by functionalclasses and compare with measured individual species, tomore broadly utilize comprehensive separation technology,and to quantify wet and dry atmospheric deposition of gas‐phase and particle‐phase organic molecules. Focus on thebroad array of semivolatile organic species present in theatmosphere, the majority of which are likely oxidation pro-ducts of primary BVOC emissions and can potentially con-dense as secondary organic components of particles.[43] 4. Formulate models to constrain the chemical influ-
ence and fate of products from atmospheric BVOC reactions,to assess the importance of additional organic compounds foratmospheric photochemistry and secondary particle mass,and to represent the full range of BVOCs and their gas‐phase and particle‐phase products in chemistry and climatesimulations.2.2.2. New‐Particle Formation[44] Near‐surface measurements of particle number‐
diameter distributions and ion number‐mobility distributionsat many terrestrial sites around the globe, but excluding theAmazon Basin, show that new‐particle formation occursfrequently [Hörrak et al., 1994; Kulmala et al., 2004;Laakso et al., 2007; Iida et al., 2008]. Evidence for these
Figure 11. (top) Diel fluxes and (bottom) mixing ratios of isoprene and monoterpenes measured in cen-tral Amazonia (tower C14; see Figure 1) between 14 and 29 September 2004. Black lines represent thestudy mean, and gray area represents the standard deviation. Adapted from Karl et al. [2007].
Martin et al.: AMAZONIAN AEROSOL PARTICLES RG2002RG2002
15 of 42

events (outside the Amazon) is the appearance of neutral andelectrically charged nanoparticles at diameters well below10 nm and their subsequent growth to larger diameters.Measurements carried out in parallel at sites located dis-tances of several hundred kilometers apart show that theevents are often regional [Stanier et al., 2004; Vana et al.,2004; Komppula et al., 2006]. In contrast, measurementsin the Amazon Basin provide little evidence for near‐surfaceregional‐scale production of new particles [Zhou et al.,
2002; Krejci et al., 2003, 2005; Rissler et al., 2004,2006]. Whereas in other continental locations 3‐nm particlesare regularly observed at near‐surface measurement sitesand also seen to grow into the Aitken mode above 30 nm, inthe Amazon Basin the smallest particles typically have sizesof 10–20 nm, and continuous growth to larger diameters israrely observed. Growth rates for Amazonia under pristineconditions have been reported as 5 nm h−1 in one location fora limited set of measurements [Zhou et al., 2002], implying
Figure 12. Scatterplots between the amount of OH observed from aircraft and that modeled for theboundary layer over Suriname in October 2005. (a) The standard model. (b) An updated model includingthe role of organic peroxy radicals. The solid lines indicate ideal agreement, and the dashed lines indicatethe ±40% range based on the measurement accuracy. (c) Percentage difference in the annual mean OH, ascalculated using the updated model compared to the standard model (the arrow indicates the location ofSuriname). The aircraft measurements were performed in October 2005 over the pristine forests ofSuriname, Guyana, and Guyane (French Guiana). Adapted by permission from Macmillan PublishersLtd [Lelieveld et al., 2008], copyright 2008.
Martin et al.: AMAZONIAN AEROSOL PARTICLES RG2002RG2002
16 of 42

that the observed ultrafine particles nucleated 2–4 h prior tothe observations. Further observations are needed, how-ever, to define the possible variability of growth rates inthe Amazon Basin.[45] A constraint on an observable new‐particle mode is
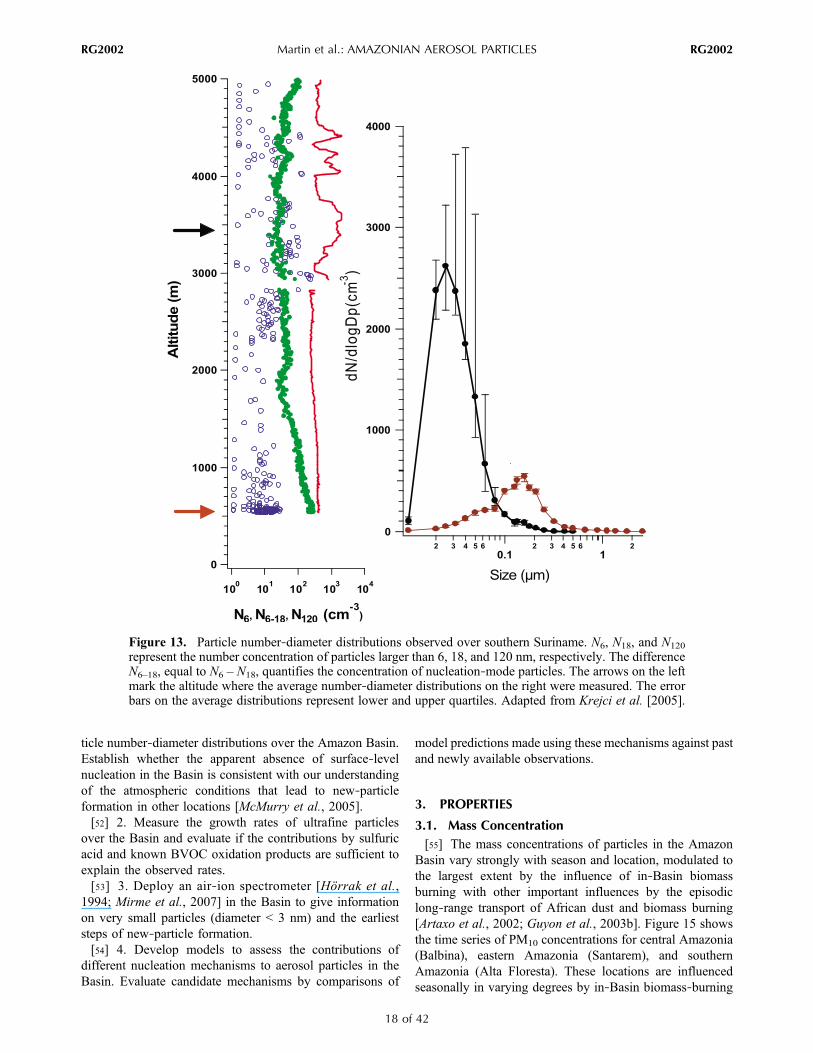
that freshly nucleated particles must grow more quickly thanthey are scavenged by coagulation with preexisting largerparticles. The likelihood of satisfying this condition in-creases both with faster growth rates of the nucleated par-ticles and with lower concentrations of preexisting particles[McMurry and Friedlander, 1979; Kerminen and Kulmala,2002; McMurry et al., 2005; Lehtinen et al., 2007]. Theconstraint on an observable new‐particle mode is typicallysatisfied for growth rates of 1–10 nm h−1. The condensationof sulfuric acid vapor typically accounts for only a fractionof this growth [Fiedler et al., 2005; Stolzenburg et al.,2005], with most of the balance due to condensation ofVOC oxidation products [Smith et al., 2008]. Under theassumption that the growth rate of 5 nm h−1 reported by Zhouet al. [2002] can be broadly extrapolated to the AmazonBasin (i.e., both geographically and seasonally), the dis-cussed constraint should be satisfied, and nucleation eventsshould therefore be observable as new‐particle modes. Theirabsence in observations therefore suggests that near‐surfacenucleation is not widespread.[46] Some evidence for the Amazon Basin shows that
nucleation occurs at high altitudes and that the entrainmentof these particles to the near‐surface layer explains surfaceobservations of ultrafine particles. Aircraft measurementsabove Suriname in northern Amazonia observed enhancedultrafine number concentrations at 2–4 km in regions ofcloud outflow (Figure 13), suggesting nucleation [Krejci etal., 2003, 2005], which is in broad agreement with ob-servations of cloud outflow from other locations worldwide[Perry and Hobbs, 1994; Clarke et al., 1998, 1999]. Forcomparison, measurements of vertical profiles with a teth-ered balloon in Melpitz, Germany, showed that nucleationfirst occurred aloft in the residual layer prior to breakup ofthe nocturnal inversion and then continued in the mixedlayer during and after breakup, all in the absence of clouds[Stratmann et al., 2003]. Over the boreal forests of Finland,a similar measurement program showed that nucleationoccurred within the boundary layer but not aloft [Laakso etal., 2007]. In the Amazon Basin, nocturnal events of ap-parent nucleation, which cannot be explained by outflowfrom deep convective clouds, have also been observed in-termittently for short periods [Rissler et al., 2004, 2006].Diel patterns of intermittent nucleation were similar for awide variety of conditions, including periods of intensivebiomass burning as well as natural conditions. Nucleation‐mode particle concentrations were highest at sunrise andsunset, with average concentrations exceeding 1000 cm−3
(Figure 14). Similar nocturnal events were observed in anAustralian eucalypt forest [Suni et al., 2008].[47] The implications of these observations for the Ama-
zon Basin compared to those worldwide are that severaldifferent chemical processes may be capable of separately
inducing nucleation and growth and, further, that thesedifferent processes may occur in different regions of theatmosphere. Further research, however, may yet succeed inunifying these presently disparate observations by using amechanistic approach to the problem. A comprehensiveanalysis of particle formation events recorded at continentallocations around the world shows that the nucleation rates J,which quantify the rates at which stable molecular clustersare produced, satisfy the following empirical expression[Riipinen et al., 2007; Kuang et al., 2008]: J = k[H2SO4]
p
for 1 < p < 2, where [H2SO4] is the sulfuric acid vaporconcentration and k is a kinetic prefactor that varies fromlocation to location. Mechanisms responsible for the vari-ability in k are not yet understood. One hypothesis is that kaccounts for the concentrations of species that conucleatewith sulfuric acid. Laaksonen et al. [2008] have proposedthat BVOC oxidation products may be important con-ucleating species over forested regions.[48] Of critical importance for the application of this nu-
cleation equation to the near‐surface layer over the AmazonBasin are the weak sulfur sources within the Basin, whichlead to sulfur dioxide concentrations of typically 20–30 ppt[Andreae and Andreae, 1988; Andreae et al., 1990a]. Thisvalue is more than an order of magnitude lower than thevalues commonly found under remote conditions over thecontinents of the Northern Hemisphere. This concentrationof SO2 plausibly implies correspondingly low gas‐phaseH2SO4 concentrations, although no direct observations haveever been made in the Amazon Basin to provide confir-mation. Simulated peak daytime near‐surface H2SO4 con-centrations are <5 × 105 cm−3 (0.019 ppt) [Spracklen et al.,2005]. By the above nucleation equation, this modeled H2SO4
concentration is too low to result in near‐surface particleformation because preexisting particles should scavenge anyincipient molecular clusters before they grow to new particles[Spracklen et al., 2006]. An alternative mechanism to theH2SO4 pathway, namely, ion‐mediated nucleation, is alsomodeled as an unimportant source of nuclei over the Basin[Yu et al., 2008].[49] In comparison to the absence of predicted new par-
ticle formation in the near‐surface region of the Basin,models predict that new‐particle formation upwind or aloft,in particular, within the upper troposphere followed bygrowth and entrainment into the near‐surface layer, con-tributes significantly to the Amazonian particle numberconcentrations, especially during the wet season [Spracklenet al., 2005]. Although sufficient for nucleation at higheraltitudes, modeled H2SO4 concentrations are insufficient toexplain the subsequent rate of particle growth observed inconvective outflow over the Basin, suggesting that othergas‐phase species such as the oxidation products of BVOCsmay have a role [Ekman et al., 2008].[50] Opportunities for progress to better constrain and
quantify mechanisms of new‐particle formation over theAmazon include the following:[51] 1. Perform simultaneous observations of sulfuric
acid vapor concentrations, particle nucleation rates, and par-
Martin et al.: AMAZONIAN AEROSOL PARTICLES RG2002RG2002
17 of 42
ticle number‐diameter distributions over the Amazon Basin.Establish whether the apparent absence of surface‐levelnucleation in the Basin is consistent with our understandingof the atmospheric conditions that lead to new‐particleformation in other locations [McMurry et al., 2005].[52] 2. Measure the growth rates of ultrafine particles
over the Basin and evaluate if the contributions by sulfuricacid and known BVOC oxidation products are sufficient toexplain the observed rates.[53] 3. Deploy an air‐ion spectrometer [Hörrak et al.,
1994; Mirme et al., 2007] in the Basin to give informationon very small particles (diameter < 3 nm) and the earlieststeps of new‐particle formation.[54] 4. Develop models to assess the contributions of
different nucleation mechanisms to aerosol particles in theBasin. Evaluate candidate mechanisms by comparisons of
model predictions made using these mechanisms against pastand newly available observations.
3. PROPERTIES
3.1. Mass Concentration[55] The mass concentrations of particles in the Amazon
Basin vary strongly with season and location, modulated tothe largest extent by the influence of in‐Basin biomassburning with other important influences by the episodiclong‐range transport of African dust and biomass burning[Artaxo et al., 2002; Guyon et al., 2003b]. Figure 15 showsthe time series of PM10 concentrations for central Amazonia(Balbina), eastern Amazonia (Santarem), and southernAmazonia (Alta Floresta). These locations are influencedseasonally in varying degrees by in‐Basin biomass‐burning
Figure 13. Particle number‐diameter distributions observed over southern Suriname. N6, N18, and N120
represent the number concentration of particles larger than 6, 18, and 120 nm, respectively. The differenceN6–18, equal to N6 – N18, quantifies the concentration of nucleation‐mode particles. The arrows on the leftmark the altitude where the average number‐diameter distributions on the right were measured. The errorbars on the average distributions represent lower and upper quartiles. Adapted from Krejci et al. [2005].
Martin et al.: AMAZONIAN AEROSOL PARTICLES RG2002RG2002
18 of 42

emissions. In Alta Floresta (August 1992 to February 2005),two different prevailing regimes of mass concentrationoccur. In the wet season, in the absence of biomass burning,the PM10 concentration is 9–12 mg m−3, with a fine fractionof 2–3 mg m−3. In the dry season, the PM10 concentrationapproaches 300–600 mg m−3, producing an optical thicknessof more than 4 at 500 nm [Schafer et al., 2008].[56] For comparison, in central Amazonia where the
influence of biomass burning is less, the mass concentrationis low even in the dry season (Figure 15, Balbina), with anaverage PM10 concentration of 11 mg m−3 (October 1998 toFebruary 2005). The typical concentration of fine particlesincreases from 2 mg m−3 in the wet season to 4 mg m−3 in thedry season. The corresponding fine‐mode black‐carbon‐equivalent (BCe) (see section 3.3.1) mass concentrationranges from 100 to 150 ng m−3 during the wet season andfrom 600 to 800 ng m−3 during the dry season. Abruptpulses of relatively high mass concentration can occur inboth the fine and coarse fractions (Figure 15, Balbina), andthese pulses are explained by African dust outflow thatreaches the observation site.[57] The influence of biomass burning on mass concen-
tration in Santarem in eastern Amazonia is intermediatecompared to Balbina and Alta Floresta. From March 2000 toJanuary 2005 in Santarem, the PM10 concentration increasesfrom ∼10 mg m−3 in the wet season to 40 mg m−3 in the dryseason. The fine fraction, typically as low as 2 mg m−3 in thewet season, reaches 20–30 mg m−3 in the dry season. Duringthe wet season, the ratio of the fine‐to‐coarse fraction islower for Santarem than Balbina, possibly suggesting anincreased relative importance of out‐of‐Basin coarse‐modeparticles over eastern Amazonia. Figure 15 also shows thatthe influence of biomass burning is strongest in the fourth
quarter of each year at Santarem, whereas it is strongest inthe third quarter at Alta Floresta. These seasonal patternsmatch those of vegetation fires in eastern and southernAmazonia, as is apparent in Figure 8.[58] Figure 16 (top) shows that the particle mass‐diameter
distribution is dominated for natural conditions by coarse‐mode particles, corresponding to primary biological parti-cles possibly coated by secondary material. These data wereobtained by gravimetric analysis of the stages of a multi-orifice uniform deposit impactor (MOUDI) during Marchand April 2008 as part of AMAZE‐08 in central Amazonia(S. T. Martin et al., Amazonian Aerosol CharacterizationExperiment 2008 (AMAZE‐08), manuscript in prepara-tion, 2010). The selected data correspond to time periodsduring which the influence of sources outside of the AmazonBasin was weak [Chen et al., 2009]. Artaxo and Hansson[1995] applied principal component analysis to the elemen-tal composition and the mass concentrations recorded on fivestages of a cascade impactor for various levels within thecanopy and found that the concentrations of potassium andphosphorus, indicative of primary particles, were prominentin the coarse fraction, especially during the night.[59] The mass‐diameter distribution shifts from the coarse
to the fine fraction during times of strong influence byin‐Basin biomass burning. Figure 16 (bottom) shows MOUDImeasurements recorded during Large‐Scale Biosphere‐Atmosphere Experiment in Amazonia: Smoke, Aerosols,Clouds, Rainfall, and Climate Field Campaign (LBA‐SMOCC) in southwestern Amazonia (Rondônia). The totalparticle mass concentration was 154 mgm−3, emphasizing theoverwhelming influence of biomass‐burning particles com-pared to any other types at the time of sampling. Figure 16(bottom) shows that the mass‐diameter distribution is
Figure 14. Diel variation in the number concentration of nucleation‐mode (namely, <25 nm) particles.Shown are averages for periods of LBA‐SMOCC that were weakly, moderately, and strongly influencedby biomass burning. Adapted from Rissler et al. [2006].
Martin et al.: AMAZONIAN AEROSOL PARTICLES RG2002RG2002
19 of 42
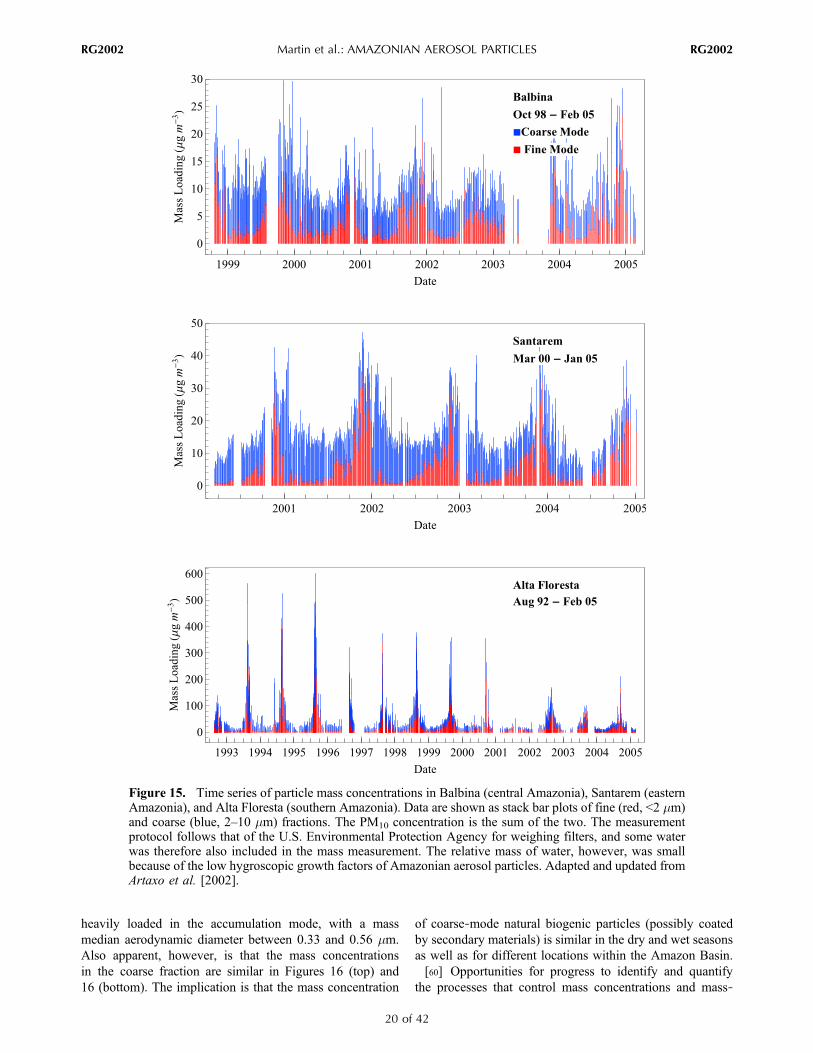
heavily loaded in the accumulation mode, with a massmedian aerodynamic diameter between 0.33 and 0.56 mm.Also apparent, however, is that the mass concentrationsin the coarse fraction are similar in Figures 16 (top) and16 (bottom). The implication is that the mass concentration
of coarse‐mode natural biogenic particles (possibly coatedby secondary materials) is similar in the dry and wet seasonsas well as for different locations within the Amazon Basin.[60] Opportunities for progress to identify and quantify
the processes that control mass concentrations and mass‐
Figure 15. Time series of particle mass concentrations in Balbina (central Amazonia), Santarem (easternAmazonia), and Alta Floresta (southern Amazonia). Data are shown as stack bar plots of fine (red, <2 mm)and coarse (blue, 2–10 mm) fractions. The PM10 concentration is the sum of the two. The measurementprotocol follows that of the U.S. Environmental Protection Agency for weighing filters, and some waterwas therefore also included in the mass measurement. The relative mass of water, however, was smallbecause of the low hygroscopic growth factors of Amazonian aerosol particles. Adapted and updated fromArtaxo et al. [2002].
Martin et al.: AMAZONIAN AEROSOL PARTICLES RG2002RG2002
20 of 42
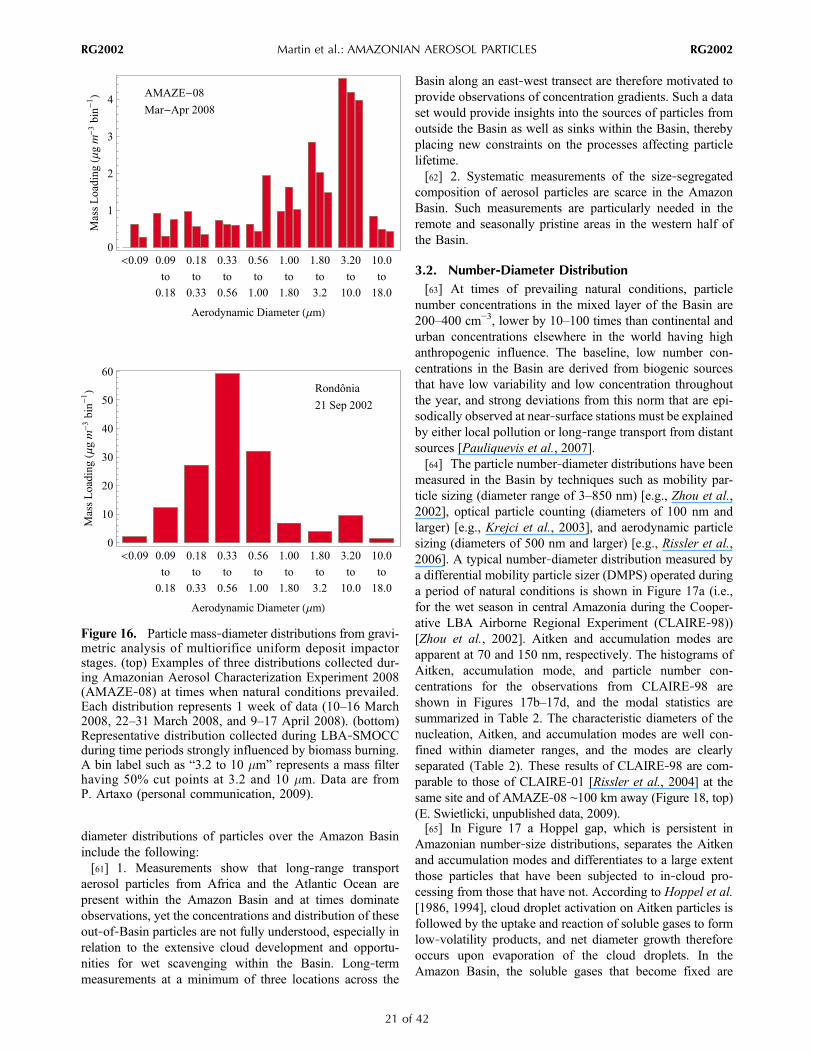
diameter distributions of particles over the Amazon Basininclude the following:[61] 1. Measurements show that long‐range transport
aerosol particles from Africa and the Atlantic Ocean arepresent within the Amazon Basin and at times dominateobservations, yet the concentrations and distribution of theseout‐of‐Basin particles are not fully understood, especially inrelation to the extensive cloud development and opportu-nities for wet scavenging within the Basin. Long‐termmeasurements at a minimum of three locations across the
Basin along an east‐west transect are therefore motivated toprovide observations of concentration gradients. Such a dataset would provide insights into the sources of particles fromoutside the Basin as well as sinks within the Basin, therebyplacing new constraints on the processes affecting particlelifetime.[62] 2. Systematic measurements of the size‐segregated
composition of aerosol particles are scarce in the AmazonBasin. Such measurements are particularly needed in theremote and seasonally pristine areas in the western half ofthe Basin.
3.2. Number‐Diameter Distribution[63] At times of prevailing natural conditions, particle
number concentrations in the mixed layer of the Basin are200–400 cm−3, lower by 10–100 times than continental andurban concentrations elsewhere in the world having highanthropogenic influence. The baseline, low number con-centrations in the Basin are derived from biogenic sourcesthat have low variability and low concentration throughoutthe year, and strong deviations from this norm that are epi-sodically observed at near‐surface stations must be explainedby either local pollution or long‐range transport from distantsources [Pauliquevis et al., 2007].[64] The particle number‐diameter distributions have been
measured in the Basin by techniques such as mobility par-ticle sizing (diameter range of 3–850 nm) [e.g., Zhou et al.,2002], optical particle counting (diameters of 100 nm andlarger) [e.g., Krejci et al., 2003], and aerodynamic particlesizing (diameters of 500 nm and larger) [e.g., Rissler et al.,2006]. A typical number‐diameter distribution measured bya differential mobility particle sizer (DMPS) operated duringa period of natural conditions is shown in Figure 17a (i.e.,for the wet season in central Amazonia during the Cooper-ative LBA Airborne Regional Experiment (CLAIRE‐98))[Zhou et al., 2002]. Aitken and accumulation modes areapparent at 70 and 150 nm, respectively. The histograms ofAitken, accumulation mode, and particle number con-centrations for the observations from CLAIRE‐98 areshown in Figures 17b–17d, and the modal statistics aresummarized in Table 2. The characteristic diameters of thenucleation, Aitken, and accumulation modes are well con-fined within diameter ranges, and the modes are clearlyseparated (Table 2). These results of CLAIRE‐98 are com-parable to those of CLAIRE‐01 [Rissler et al., 2004] at thesame site and of AMAZE‐08 ∼100 km away (Figure 18, top)(E. Swietlicki, unpublished data, 2009).[65] In Figure 17 a Hoppel gap, which is persistent in
Amazonian number‐size distributions, separates the Aitkenand accumulation modes and differentiates to a large extentthose particles that have been subjected to in‐cloud pro-cessing from those that have not. According to Hoppel et al.[1986, 1994], cloud droplet activation on Aitken particles isfollowed by the uptake and reaction of soluble gases to formlow‐volatility products, and net diameter growth thereforeoccurs upon evaporation of the cloud droplets. In theAmazon Basin, the soluble gases that become fixed are
Figure 16. Particle mass‐diameter distributions from gravi-metric analysis of multiorifice uniform deposit impactorstages. (top) Examples of three distributions collected dur-ing Amazonian Aerosol Characterization Experiment 2008(AMAZE‐08) at times when natural conditions prevailed.Each distribution represents 1 week of data (10–16 March2008, 22–31 March 2008, and 9–17 April 2008). (bottom)Representative distribution collected during LBA‐SMOCCduring time periods strongly influenced by biomass burning.A bin label such as “3.2 to 10 mm” represents a mass filterhaving 50% cut points at 3.2 and 10 mm. Data are fromP. Artaxo (personal communication, 2009).
Martin et al.: AMAZONIAN AEROSOL PARTICLES RG2002RG2002
21 of 42

expected mostly to be BVOCs, which then react in the cloudwaters to form, at least in part, low‐volatility BVOC oxi-dation products (i.e., SOA particle components) [Blandoand Turpin, 2000; Lim et al., 2005; Carlton et al., 2006].
Alternative mechanisms for converting Aitken particles intothe accumulation mode, such as out‐of‐cloud coagulationand condensational growth, are too slow in clean atmo-spheres such as the green‐ocean Amazon.[66] In fair weather, a diel pattern during CLAIRE‐98 in
the number concentration of the two modes, specifically thatthe Aitken number concentration decreased while that of theaccumulation mode increased as the day progressed, waslinked to the diel variation of the lower atmosphere (Figure 6)[Zhou et al., 2002]. Cloud processing above the boundarylayer led to the depletion of Aitken particles and to thegrowth of accumulation‐mode particles in that layer, andthis cloud convective layer mixed into the surface layerduring the day, strongly influencing observations there. Inrainy weather, the behavior was interrupted by strong scav-enging of particle number, volume, and mass, followed byquick recovery (due to regional mixing) after rainfall ceased.[67] Measurements in CLAIRE‐98 showed that the diameters
of both the Aitken and accumulation modes continuouslyincreased from sunrise to sunset, with few exceptions. Thegrowth of the accumulation‐mode particles was attributed tocloud processing, with downward mixing of these largerparticles throughout the day. The growth of the Aitken parti-cles (∼5 nm h−1) was plausibly explained by the condensationof low‐volatility vapors resulting from the photo‐oxidation ofBVOCs (i.e., SOA production) (see section 2.2.1). Much ofthis particle growth was proposed to occur in the boundarylayer itself. Rainfall temporarily halted the steady diametergrowth of the Aitken particles. This observation suggested adown‐mixing of somewhat smaller Aitken particles in asso-ciation with cold downdrafts.[68] These near‐surface observations in central Amazonia
during CLAIRE‐98, CLAIRE‐01, and AMAZE‐08 weremade on air masses that had spent several days within theBasin and thus were highly processed (e.g., ecosystememissions, cloud cycles, and so forth). For contrast, mea-surements were made during flights over Suriname andFrench Guyana as part of CLAIRE‐98 as air masses firstentered the Amazon Basin and to some extent can thereforebe considered the initialization conditions for processingwithin the Amazon Basin [Krejci et al., 2003]. The averagenumber‐diameter distribution from the lowest flight levelwithin the well‐mixed boundary layer (0.2–1.2 km) is shownin Figure 18 (bottom). The distribution was depleted inAitken particles compared to the near‐surface measurementsdescribed for central Amazonia (e.g., CLAIRE‐98) (seeFigures 18 (top) and 18 (bottom)), offering evidence for theformation of Aitken particles within the Basin.[69] The particle number‐diameter distribution changes
greatly at locations in the Basin that are influenced by in‐
Figure 17. (a) A typical particle number‐diameter distribu-tion observed for natural conditions in central Amazoniaduring the Cooperative LBA Airborne Regional Experiment(CLAIRE‐98). Whole‐campaign histograms of (b) Aitken,(c) accumulation‐mode, and (d) total particle number con-centrations. Natural conditions mostly prevailed. Adaptedfrom Zhou et al. [2002].
Martin et al.: AMAZONIAN AEROSOL PARTICLES RG2002RG2002
22 of 42

Basin biomass burning [Reid et al., 2005]. The mode of thedistribution is typically between 100 and 160 nm. Thehigher values are found in more aged pollution plumes as aresult of coagulation with other particles and the conden-sation from the gas phase of low‐volatility species. Giventhese high concentrations, when they are present, aerosolparticles resulting from in‐Basin biomass burning dominatethe overall features of the Amazonian aerosol, tending tominimize the impact of other processes such as particlesimported from outside of the Basin or the processes of thenatural Amazonian biosphere.[70] DMPS measurements conducted at a ground site dur-
ing LBA‐SMOCC showed a single number median diameterof 135 nm for fresh smoke and average particle numberconcentrations of 10,500 cm−3 for the diameter range of30–850 nm [Rissler et al., 2006]. The number concentrationof particles in the nucleation mode (i.e., from 3 to 30 nmdiameter) was also relatively high, averaging 800–1000 cm−3,although their presence was intermittent. Airborne measure-ments of particle number‐diameter distributions were alsoperformed [Guyon et al., 2005], and the geometric meandiameters were 110 ± 15 nm in 69 plumes within the boundarylayer and 139 ± 17 nm for 50 smoke plumes detrained abovethe boundary layer, mostly from nonprecipitating clouds.Biomass‐burning particles that enter higher altitudes andescape wet deposition can be exported out of the Basin,affecting particle number and mass concentrations in distantregions of the Southern Hemisphere.[71] Opportunities for progress in identifying and quanti-
fying the processes that control the number concentrationand the number‐diameter distribution of particles in theAmazon Basin include the following:[72] 1. The consistent appearance of the Aitken and
accumulation modes in confined diameter windows pointsto the importance of in‐cloud processing, but the sourceand sink rates of Aitken and accumulation‐mode particles,as well as the vertical structure and mixing of particles(including quantifying of cloud convective mixing andassociated downdrafts as mechanisms for entraining parti-cles into the boundary layer), must yet be quantified.[73] 2. Long‐term measurements (i.e., years) of size dis-
tributions are needed. Needed instruments include an air ionspectrometer, twin scanning mobility particle sizers, andultraviolet and normal aerodynamic particle sizers, prefera-bly both just over the canopy as well as higher on a tall towerto observe vertical gradients. Measurements should be madeof size‐resolved particle number fluxes by eddy‐covariancetechniques, preferably at several altitudes in a high tower.Tethered balloons should be equipped with condensation
particle counters having various smaller cutoff diameters ordiffusion batteries to locate altitudes having increased new‐particle formation. Ground‐based long‐term lidar measure-ments should be employed for vertical profiling. This setof instruments should be applied to closure studies between(1) number and mass, (2) the number‐diameter distributionand light scattering, and (3) the number‐diameter distribu-tion (including hygroscopic properties) and the concentrationof cloud condensation nuclei.
TABLE 2. Statistics of Particle Number‐Diameter Distributions Measured During CLAIRE‐98
ModeFrequency of
Occurrence (%)
Number Concentration (# cm−3) Geometric MeanDiameter (nm)
Geometric StandardDeviationMean ± Standard Deviation Geometric Mean Median
Ultrafine 18 92 ± 99 55 48 24 ± 10 1.31 ± 0.15Aitken 100 239 ± 154 200 200 68 ± 12 1.40 ± 0.14Accumulation 100 177 ± 115 137 146 151 ± 22 1.40 ± 0.10
Figure 18. Average particle number‐diameter distributionsobserved in the Amazon Basin for periods during which natu-ral conditions prevailed. (top) CLAIRE‐98 (Balbina, 18 daysof data) [Zhou et al., 2002], CLAIRE‐01 (Balbina, 2 days ofdata) [Rissler et al., 2004], and AMAZE‐08 (approximatelyequidistant to Manaus and Balbina, 22 February to 12 March2008) (E. Swietlicki, personal communication, 2009). (bottom)Airborne measurements over Suriname during CLAIRE‐98[Krejci et al., 2003]. Altitude ranges were from (1) 0.2 to1.2 km and (2) 1.2 to 2.4 km.
Martin et al.: AMAZONIAN AEROSOL PARTICLES RG2002RG2002
23 of 42
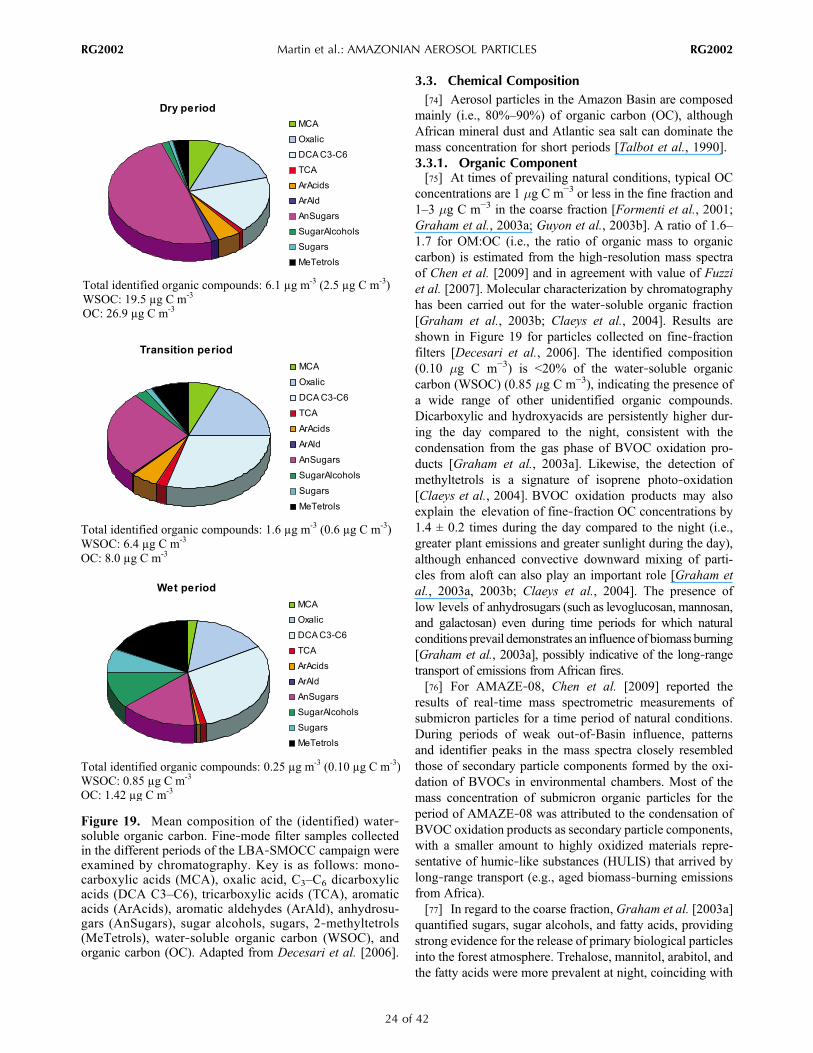
3.3. Chemical Composition[74] Aerosol particles in the Amazon Basin are composed
mainly (i.e., 80%–90%) of organic carbon (OC), althoughAfrican mineral dust and Atlantic sea salt can dominate themass concentration for short periods [Talbot et al., 1990].3.3.1. Organic Component[75] At times of prevailing natural conditions, typical OC
concentrations are 1 mg C m−3 or less in the fine fraction and1–3 mg C m−3 in the coarse fraction [Formenti et al., 2001;Graham et al., 2003a; Guyon et al., 2003b]. A ratio of 1.6–1.7 for OM:OC (i.e., the ratio of organic mass to organiccarbon) is estimated from the high‐resolution mass spectraof Chen et al. [2009] and in agreement with value of Fuzziet al. [2007]. Molecular characterization by chromatographyhas been carried out for the water‐soluble organic fraction[Graham et al., 2003b; Claeys et al., 2004]. Results areshown in Figure 19 for particles collected on fine‐fractionfilters [Decesari et al., 2006]. The identified composition(0.10 mg C m−3) is <20% of the water‐soluble organiccarbon (WSOC) (0.85 mg C m−3), indicating the presence ofa wide range of other unidentified organic compounds.Dicarboxylic and hydroxyacids are persistently higher dur-ing the day compared to the night, consistent with thecondensation from the gas phase of BVOC oxidation pro-ducts [Graham et al., 2003a]. Likewise, the detection ofmethyltetrols is a signature of isoprene photo‐oxidation[Claeys et al., 2004]. BVOC oxidation products may alsoexplain the elevation of fine‐fraction OC concentrations by1.4 ± 0.2 times during the day compared to the night (i.e.,greater plant emissions and greater sunlight during the day),although enhanced convective downward mixing of parti-cles from aloft can also play an important role [Graham etal., 2003a, 2003b; Claeys et al., 2004]. The presence oflow levels of anhydrosugars (such as levoglucosan, mannosan,and galactosan) even during time periods for which naturalconditions prevail demonstrates an influence of biomass burning[Graham et al., 2003a], possibly indicative of the long‐rangetransport of emissions from African fires.[76] For AMAZE‐08, Chen et al. [2009] reported the
results of real‐time mass spectrometric measurements ofsubmicron particles for a time period of natural conditions.During periods of weak out‐of‐Basin influence, patternsand identifier peaks in the mass spectra closely resembledthose of secondary particle components formed by the oxi-dation of BVOCs in environmental chambers. Most of themass concentration of submicron organic particles for theperiod of AMAZE‐08 was attributed to the condensation ofBVOC oxidation products as secondary particle components,with a smaller amount to highly oxidized materials repre-sentative of humic‐like substances (HULIS) that arrived bylong‐range transport (e.g., aged biomass‐burning emissionsfrom Africa).[77] In regard to the coarse fraction, Graham et al. [2003a]
quantified sugars, sugar alcohols, and fatty acids, providingstrong evidence for the release of primary biological particlesinto the forest atmosphere. Trehalose, mannitol, arabitol, andthe fatty acids were more prevalent at night, coinciding with
Figure 19. Mean composition of the (identified) water‐soluble organic carbon. Fine‐mode filter samples collectedin the different periods of the LBA‐SMOCC campaign wereexamined by chromatography. Key is as follows: mono-carboxylic acids (MCA), oxalic acid, C3–C6 dicarboxylicacids (DCA C3–C6), tricarboxylic acids (TCA), aromaticacids (ArAcids), aromatic aldehydes (ArAld), anhydrosu-gars (AnSugars), sugar alcohols, sugars, 2‐methyltetrols(MeTetrols), water‐soluble organic carbon (WSOC), andorganic carbon (OC). Adapted from Decesari et al. [2006].
Martin et al.: AMAZONIAN AEROSOL PARTICLES RG2002RG2002
24 of 42
a nocturnal biological activity that increased the release ratesof yeasts and other small fungal spores. Glucose, fructose,and sucrose were persistently higher during the day, coin-ciding with a daytime increase in large fungal spores, fernspores, pollen grains, and, to a lesser extent, plant fragments,as driven by lowered relative humidity and enhanced windspeeds and convective activity during the day. Althoughmassemissions were reduced at night, coarse‐fraction OC con-centrations were, nevertheless, elevated at night compared today by a mean factor of 1.9 ± 0.4, which was explained bytrapping of emitted particles in the nocturnal boundary layer.[78] The organic compounds constituting the natural par-
ticles can be light absorbing. Although the BCe concentra-tions are typically <0.1 mg m−3 and represent under 5% ofthe total carbon concentration [Formenti et al., 2001;Grahamet al., 2003b], they are nevertheless higher than those ofelemental carbon, implying that organic components arecontributing to the absorption of light [Guyon et al., 2003a,2003c]. Because these compounds have a steep increase oflight absorption with decreasing wavelength, resulting in abrown color of the filter samples, they have been termed“brown carbon” [Andreae and Gelencser, 2006]. The light‐absorbing material is mainly in the coarse fraction and canbe explained mostly by chromophores present in primarybiological particles and certain BVOC oxidation products.[79] In addition to natural particles, the composition of
biomass‐burning particles in the Basin has also been ex-tensively studied [Penner et al., 1991; Andreae, 1993;Falkovich et al., 2005; Decesari et al., 2006; Fuzzi et al.,2007]. The biomass‐burning particles, found mostly in thefine size fraction (see section 3.2), are most predominant insouthern Amazonia and downwind of it (Figure 5), but evenremote areas in northern and central Amazonia are subject tothe large‐scale transport of biomass‐burning emissions[Pauliquevis et al., 2007]. The particles consist of 85%–90% organic carbon [Talbot et al., 1990; Yamasoe et al.,2000; L. L. Soto‐García et al., Evaluation of differentmethods for the determination of BC and OC during biomassburning in the Brazilian Amazon, manuscript in preparation,2010], of whichmore than half is water soluble [Graham et al.,2002;Mayol‐Bracero et al., 2002; Decesari et al., 2006]. Thebalance of 10%–15% has typically been operationally definedas black carbon (i.e., apparent elemental carbon). The OC andBCe concentrations have a diel variability arising both fromvariations in the thickness of the atmospheric boundary layerand the frequency of fires (Soto‐García et al., manuscript inpreparation, 2010). Biomass‐burning particles also are animportant source of water‐soluble organic nitrogen, includingurea and several amino acids. For example,Mace et al. [2003]reported concentrations of 0.9 mg N m−3 in the dry seasoncompared to 0.05 mg N m−3 in the wet season (i.e., a 20‐folddifference).[80] Figure 20 shows the composition of biomass‐burning
particles in Amazonia, as obtained from a synthesis of datafrom multiple complementary techniques (e.g., gas chro-matography mass spectrometry (GC‐MS) and high‐pressureliquid chromatography (HPLC)) [Mayol‐Bracero et al.,
2002]. The organic compounds were a complex mixture ofdiffering molecular structures, physical properties, andreactivities. Molecular speciation using GC‐MS accountedfor ∼10% of the WSOC. The identified species weremostly pyrolysis products of cellulose, hemicellulose, andlignin [Graham et al., 2002; Zdrahal et al., 2002; Claeyset al., 2004; Trebs et al., 2005; Decesari et al., 2006].Levoglucosan, a primary vegetation combustion product, wasthe single most abundant compound identified [Schkolnik etal., 2005; Fuzzi et al., 2007]. It was enriched in samplescollected at night compared to those from the day, reflectingthe shift from flaming fires in the day to smoldering fires atnight [Fuzzi et al., 2007]. The balance of ∼90% that eludedanalysis by molecular chromatography is expected to bechemical compounds that are predominantly of high molec-ular weight [Mayol‐Bracero et al., 2002;Hoffer et al., 2006].The HPLC results showed that neutral molecules, monocar-boxylic and dicarboxylic acids, and polycarboxylic acidsrepresented ∼70% of the WSOC. Decesari et al. [2006]proposed model compounds to reproduce quantitatively theaverage chemical structure of the WSOC, with the intentionthat these model compounds can be used as best guess sur-rogates in microphysical models.[81] Fuzzi et al. [2006] provide excellent recommenda-
tions in a general context on the research needs for improvedchemical characterization of organic aerosol particles. For thespecific context of the Amazon, high‐priority opportunitiesfor increased chemical characterization include the following:[82] 1. Use sampling techniques such as denuders and
real‐time measurements that reduce positive and negativesampling artifacts. As necessary, develop new techniquesfor these purposes. Control sampling with wind direction tofacilitate the interpretation of the results. Increase use ofsize‐segregated sampling.[83] 2. Develop analytical methods to improve chemically
resolved mass balance at both the molecular and commonproperty levels. Develop innovative new methods for theanalysis of high molecular weight compounds. Determinethe composition of light‐absorbing material. Develop ana-lytical techniques for airborne measurements having asimilar capability as ground‐level measurements.[84] 3. Identify and characterize the molecules and the
molecular families constituting the water‐insoluble organicfraction. Determine the relative contributions of humic‐likesubstances and BVOC oxidation products to OC mass con-centrations during the wet and dry seasons. Characterize andimprove the understanding of water‐soluble organic nitrogenin biomass‐burning particles.3.3.2. Inorganic Component[85] Table 3 summarizes the composition of the inorganic
component of Amazonian aerosol particles. The inorganiccomponent typically constitutes 10%–20% of the total massin the fine fraction and less in the coarse fraction, with thebalance largely from organic components and at timesAfrican dust and African and South American biomassburning.[86] The two most commonly applied techniques for the
study of the inorganic composition have been off‐line ion
Martin et al.: AMAZONIAN AEROSOL PARTICLES RG2002RG2002
25 of 42

chromatography and proton‐induced X‐ray emission. Sam-ples were collected for at least half a day up to several dayson a single filter to obtain sufficient quantities for analysis.The LBA‐SMOCC campaign (Table 1) introduced the useof selective semicontinuous measurements of water‐solubleinorganic compounds (i.e., SO4
2−, NO3−, Cl−, and NH4
+) via asteam‐jet aerosol collector and their gaseous precursors (i.e.,SO2, HNO3, HCl, and NH3) by use of a rotating wet annulardenuder [Trebs et al., 2004, 2005]. In AMAZE‐08, anAerodyne aerosol mass spectrometer was employed toquantify nonrefractory sulfate, nitrate, and ammonium every5 min (Figure 21) [Chen et al., 2009].[87] Sulfate is the major water‐soluble inorganic anion
and is primarily distributed in the fine fraction. Sulfate isformed by the reactions of DMS, H2S, and CS2 emitted byplants and micro‐organisms within the Amazon Basin, andthe in‐Basin source contributes ∼0.05 mg m−3 to the sulfatemass concentration [Andreae et al., 1990a]. Even for naturalconditions, however, sulfate concentrations averaged overseveral weeks are 3–5 times greater than this in‐Basincontribution (Table 3) [Artaxo et al., 1990; Formenti et al.,2001; Artaxo et al., 2002; Fuzzi et al., 2007]. Part of theexplanation is that marine DMS is persistently importedfrom the Atlantic Ocean, representing an integral part of thenatural processes of the Basin. Episodic importation ofsulfate included as part of African dust and biomass‐burning
particles also occurs, and these episodes can increase sulfateconcentrations in both the fine and coarse fractions by fac-tors of 2–3 or more [Talbot et al., 1990; Formenti et al.,2001]. In the dry season, the average sulfate concentrationincreases by a factor of 2–3 (Table 3), even for nominallyclean conditions. The increase is attributed in large part tothe reduction in wet deposition as well as to the presence ofbiomass‐burning particles diluted throughout the Basin,rather than a change in biogenic gaseous emissions or shiftsin the patterns of imported sulfate precursors [Artaxo et al.,1988; Talbot et al., 1988; Artaxo et al., 2002; Graham et al.,2003a; Fuzzi et al., 2007]. At sampling locations and timesrepeatedly and heavily affected by biomass burning (e.g., inplumes), the average sulfate concentration can increase by afactor of 10 or more.[88] Nitrate is found predominately in the coarse fraction
of natural Amazonian aerosol particles and, compared tosulfate, is a minor component by mass (Table 3) [Talbot etal., 1988, 1990; Graham et al., 2003a; Fuzzi et al., 2007].The ambient HNO3 concentrations are too low and thetemperatures typical of the Basin are too high to favor ele-vated concentrations of particle‐phase nitrate. Significantnitrate enrichment to the fine fraction occurs, however, forlocations affected by in‐Basin biomass burning, which canbe attributed to increased NOx emissions followed by oxi-dation and subsequent condensation of HNO3 [Trebs et al.,
Figure 20. Total carbon apportionment for biomass‐burning particles collected during the dry season(LBA‐EUSTACH). Total carbon is divided into black carbon and organic carbon, organic carbon is parti-tioned into water‐insoluble and water‐soluble fractions, the portion of the water‐soluble fraction that iselutable and identifiable by high‐pressure liquid chromatography (HPLC) is indicated, the fraction of thateluate that is identifiable by gas chromatography mass spectrometry (GC‐MS) is indicated, and the par-titioning of that fraction into the chemical species is shown. This final fraction is also represented inFigure 19. “BC water” is based on thermal analysis for black carbon after washing the sample withwater. Adapted from Mayol‐Bracero et al. [2002].
Martin et al.: AMAZONIAN AEROSOL PARTICLES RG2002RG2002
26 of 42
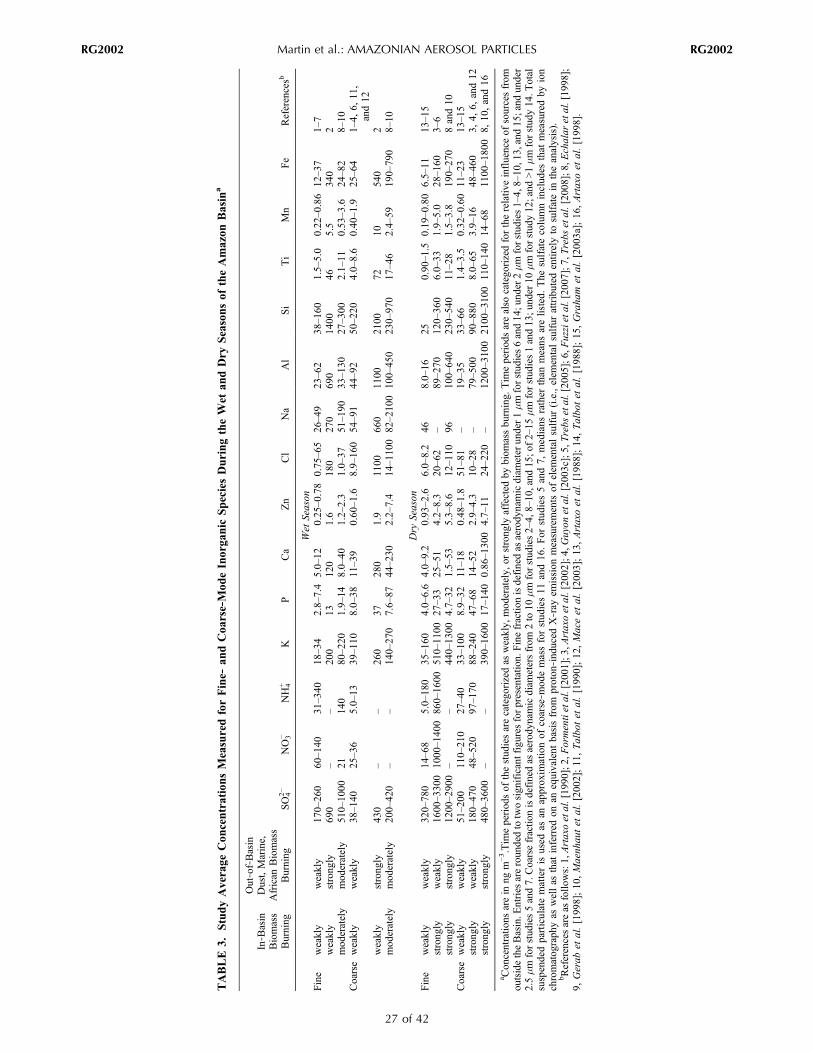
TABLE
3.StudyAverage
Con
centrationsMeasuredforFine‐
andCoa
rse‐Mod
eInorga
nic
SpeciesDuringtheW
etan
dDry
Seasonsof
theAmazon
Basin
a
In‐B
asin
Biomass
Burning
Out‐of‐Basin
Dust,Marine,
African
Biomass
Burning
SO42−
NO3−
NH4+
KP
Ca
Zn
Cl
Na
Al
Si
Ti
Mn
Fe
Referencesb
Wet
Season
Fine
weakly
weakly
170–26
060–140
31–340
18–3
42.8–7.4
5.0–12
0.25–0
.78
0.75–65
26–4
923–6
238
–160
1.5–5.0
0.22–0
.86
12–37
1–7
weakly
strong
ly69
0–
–20
013
120
1.6
180
270
690
1400
465.5
340
2mod
erately
mod
erately
510–10
0021
140
80–2
201.9–14
8.0–40
1.2–2.3
1.0–37
51–1
9033–1
3027
–300
2.1–11
0.53–3
.624–82
8–10
Coarse
weakly
weakly
38–140
25–36
5.0–13
39–1
108.0–38
11–3
90.60–1
.68.9–16
054–9
144–9
250
–220
4.0–8.6
0.40–1
.925–64
1–4,
6,11
,and12
weakly
strong
ly43
0–
–26
037
280
1.9
1100
660
1100
2100
7210
540
2mod
erately
mod
erately
200–42
0–
–14
0–27
07.6–87
44–2
302.2–7.4
14–1
100
82–2
100
100–45
023
0–97
017
–46
2.4–59
190–79
08–
10
Dry
Season
Fine
weakly
weakly
320–78
014–68
5.0–18
035–1
604.0–6.6
4.0–9.2
0.93–2
.66.0–8.2
468.0–16
250.90–1.5
0.19–0
.80
6.5–11
13–15
strong
lyweakly
1600–330
010
00–140
086
0–16
0051
0–11
0027
–33
25–5
14.2–8.3
20–6
2–
89–2
7012
0–36
06.0–33
1.9–5.0
28–160
3–6
strong
lystrong
ly12
00–290
0–
–44
0–13
004.7–32
1.5–53
5.3–8.6
12–1
1096
100–64
023
0–54
011
–28
1.5–3.8
190–27
08and10
Coarse
weakly
weakly
51–200
110–21
027
–40
33–1
008.9–32
11–1
80.48–1
.851–8
1–
19–3
533
–66
1.4–3.5
0.32–0
.60
11–23
13–15
strong
lyweakly
180–47
048–520
97–170
88–2
4047
–68
14–5
22.9–4.3
10–2
8–
79–5
0090
–880
8.0–65
3.9–16
48–460
3,4,
6,and12
strong
lystrong
ly48
0–36
00–
–39
0–16
0017
–140
0.86–130
04.7–11
24–2
20–
1200–310
021
00–310
011
0–14
014
–68
1100–180
08,
10,and16
a Con
centratio
nsarein
ngm
−3.Tim
eperiod
sof
thestud
iesarecatego
rizedas
weakly,
mod
erately,
orstrong
lyaffected
bybiom
assbu
rning.
Tim
eperiod
sarealso
catego
rizedfortherelativ
einfluenceof
sourcesfrom
outsidetheBasin.E
ntries
areroun
dedto
twosign
ificantfigures
forpresentatio
n.Finefractio
nisdefinedas
aerody
namicdiam
eter
under1mm
forstud
ies6and14
;und
er2mm
forstud
ies1–4,8–
10,13,and15
;and
under
2.5mm
forstud
ies5and7.
Coarsefractio
nisdefinedas
aerody
namicdiam
etersfrom
2to
10mm
forstud
ies2–
4,8–10
,and
15;o
f2–15
mmforstud
ies1and13
;und
er10
mmforstud
y12
;and
>1mm
forstud
y14
.Total
suspendedparticulatematteris
used
asan
approx
imationof
coarse‐m
odemassforstud
ies11
and16
.For
stud
ies5and7,
medians
rather
than
means
arelisted.
The
sulfatecolumninclud
esthat
measuredby
ion
chromatog
raph
yas
wellas
that
inferred
onan
equivalent
basisfrom
proton‐ind
uced
X‐ray
emission
measurementsof
elem
entalsulfur
(i.e.,elem
entalsulfur
attributed
entirelyto
sulfatein
theanalysis).
bReferencesareas
follo
ws:1,Artaxoetal.[19
90];2,Formentietal.[20
01];3,Artaxoetal.[20
02];4,
Guyon
etal.[20
03c];5
,Trebs
etal.[20
05];6,
Fuzzietal.[20
07];7,Trebs
etal.[20
08];8,
Echalar
etal.[19
98];
9,Gerab
etal.[199
8];10
,Maenh
autet
al.[200
2];11
,Talbo
tet
al.[199
0];12
,Maceet
al.[200
3];13
,Artaxoet
al.[198
8];14
,Talbo
tet
al.[198
8];15
,Graha
met
al.[200
3a];16
,Artaxoet
al.[199
8].
Martin et al.: AMAZONIAN AEROSOL PARTICLES RG2002RG2002
27 of 42
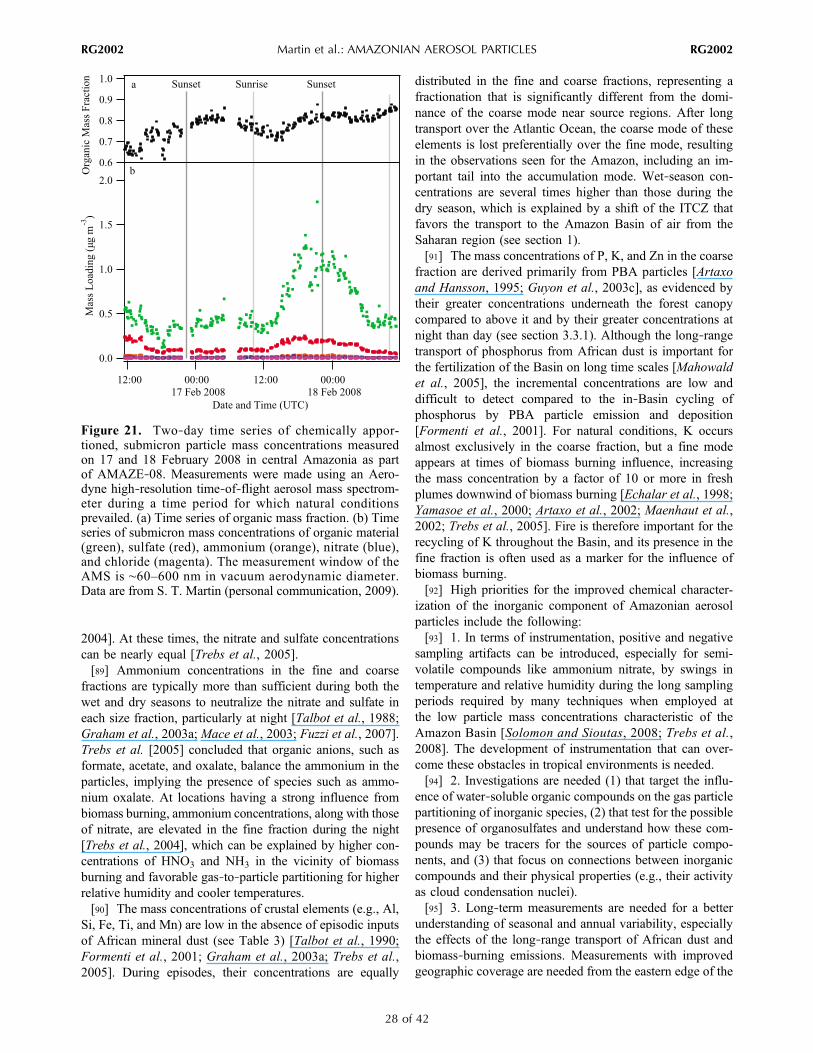
2004]. At these times, the nitrate and sulfate concentrationscan be nearly equal [Trebs et al., 2005].[89] Ammonium concentrations in the fine and coarse
fractions are typically more than sufficient during both thewet and dry seasons to neutralize the nitrate and sulfate ineach size fraction, particularly at night [Talbot et al., 1988;Graham et al., 2003a; Mace et al., 2003; Fuzzi et al., 2007].Trebs et al. [2005] concluded that organic anions, such asformate, acetate, and oxalate, balance the ammonium in theparticles, implying the presence of species such as ammo-nium oxalate. At locations having a strong influence frombiomass burning, ammonium concentrations, along with thoseof nitrate, are elevated in the fine fraction during the night[Trebs et al., 2004], which can be explained by higher con-centrations of HNO3 and NH3 in the vicinity of biomassburning and favorable gas‐to‐particle partitioning for higherrelative humidity and cooler temperatures.[90] The mass concentrations of crustal elements (e.g., Al,
Si, Fe, Ti, and Mn) are low in the absence of episodic inputsof African mineral dust (see Table 3) [Talbot et al., 1990;Formenti et al., 2001; Graham et al., 2003a; Trebs et al.,2005]. During episodes, their concentrations are equally
distributed in the fine and coarse fractions, representing afractionation that is significantly different from the domi-nance of the coarse mode near source regions. After longtransport over the Atlantic Ocean, the coarse mode of theseelements is lost preferentially over the fine mode, resultingin the observations seen for the Amazon, including an im-portant tail into the accumulation mode. Wet‐season con-centrations are several times higher than those during thedry season, which is explained by a shift of the ITCZ thatfavors the transport to the Amazon Basin of air from theSaharan region (see section 1).[91] The mass concentrations of P, K, and Zn in the coarse
fraction are derived primarily from PBA particles [Artaxoand Hansson, 1995; Guyon et al., 2003c], as evidenced bytheir greater concentrations underneath the forest canopycompared to above it and by their greater concentrations atnight than day (see section 3.3.1). Although the long‐rangetransport of phosphorus from African dust is important forthe fertilization of the Basin on long time scales [Mahowaldet al., 2005], the incremental concentrations are low anddifficult to detect compared to the in‐Basin cycling ofphosphorus by PBA particle emission and deposition[Formenti et al., 2001]. For natural conditions, K occursalmost exclusively in the coarse fraction, but a fine modeappears at times of biomass burning influence, increasingthe mass concentration by a factor of 10 or more in freshplumes downwind of biomass burning [Echalar et al., 1998;Yamasoe et al., 2000; Artaxo et al., 2002; Maenhaut et al.,2002; Trebs et al., 2005]. Fire is therefore important for therecycling of K throughout the Basin, and its presence in thefine fraction is often used as a marker for the influence ofbiomass burning.[92] High priorities for the improved chemical character-
ization of the inorganic component of Amazonian aerosolparticles include the following:[93] 1. In terms of instrumentation, positive and negative
sampling artifacts can be introduced, especially for semi-volatile compounds like ammonium nitrate, by swings intemperature and relative humidity during the long samplingperiods required by many techniques when employed atthe low particle mass concentrations characteristic of theAmazon Basin [Solomon and Sioutas, 2008; Trebs et al.,2008]. The development of instrumentation that can over-come these obstacles in tropical environments is needed.[94] 2. Investigations are needed (1) that target the influ-
ence of water‐soluble organic compounds on the gas particlepartitioning of inorganic species, (2) that test for the possiblepresence of organosulfates and understand how these com-pounds may be tracers for the sources of particle compo-nents, and (3) that focus on connections between inorganiccompounds and their physical properties (e.g., their activityas cloud condensation nuclei).[95] 3. Long‐term measurements are needed for a better
understanding of seasonal and annual variability, especiallythe effects of the long‐range transport of African dust andbiomass‐burning emissions. Measurements with improvedgeographic coverage are needed from the eastern edge of the
Figure 21. Two‐day time series of chemically appor-tioned, submicron particle mass concentrations measuredon 17 and 18 February 2008 in central Amazonia as partof AMAZE‐08. Measurements were made using an Aero-dyne high‐resolution time‐of‐flight aerosol mass spectrom-eter during a time period for which natural conditionsprevailed. (a) Time series of organic mass fraction. (b) Timeseries of submicron mass concentrations of organic material(green), sulfate (red), ammonium (orange), nitrate (blue),and chloride (magenta). The measurement window of theAMS is ∼60–600 nm in vacuum aerodynamic diameter.Data are from S. T. Martin (personal communication, 2009).
Martin et al.: AMAZONIAN AEROSOL PARTICLES RG2002RG2002
28 of 42

Basin into central parts to quantify gradients in African andAtlantic aerosol particles and thereby to understand bettertheir influence.
3.4. Hygroscopicity[96] The hygroscopic properties of submicron Amazonian
aerosol particles have been studied both for the wet seasonduring periods of weak out‐of‐Basin influence [Zhou et al.,2002] and for the dry season at times of strong in‐Basinbiomass burning [Rissler et al., 2004, 2006]. Irrespective ofseason and the air mass type, the hygroscopic diametergrowth factor measured at 90% relative humidity (RH) byuse of a tandem differential mobility analyzer is typically1.05–1.35, with few exceptions. This finding differentiatesAmazonia from rural sites on other continents, for which“highly hygroscopic” particles having growth factors of 1.7that approach those of inorganic salts are observed for atleast a fraction of the particles [Swietlicki et al., 2008]. Theconsistently high organic fraction of submicron particles(see section 3.3) can explain the absence of highly hygro-scopic particles in the Amazon Basin. As the exception,“highly hygroscopic” particles have, however, been ob-served in the Amazon Basin at least once [Zhou et al., 2002],plausibly corresponding to the presence of marine particlesimported with an Atlantic air mass [Formenti et al., 2001].[97] For natural conditions, “moderately hygroscopic”
particles dominate the submicron particle population in theAmazon Basin [Zhou et al., 2002; Rissler et al., 2004]. Zhouet al. [2002] find that the hygroscopic growth factor in-creases from 1.17 at 35 nm to 1.32 at 264 nm. Ammoniumbisulfate dry‐volume fractions ranging from 0.17 at 35 nmto 0.27 at 265 nm, with the balance of the dry‐volumefraction corresponding to an insoluble core, can equivalentlyrepresent the observed hygroscopic growth. This equivalentrepresentation must not, however, be interpreted as implyingthat the water‐soluble components of the real particles arecomposed solely of ammonium and bisulfate ions. Water‐soluble organic compounds constitute a large fraction of theparticle components (see Figures 19 and 20), although manyof the substances, such as the larger dicarboxylic acids,fulvic acids [Svenningsson et al., 2006], or HULIS [Ziese etal., 2008], have low water uptake. There is also the im-portant possibility of a difference between the WSOCfraction measured for relatively dilute aqueous solution (i.e.,as represented in Figures 19 and 20) and that relevant to thelower water activity of 90% RH at which measurements ofhygroscopic growth have been made.[98] For locations strongly influenced by fresh in‐Basin
biomass burning, an external mixture of “moderatelyhygroscopic” (as described above) and “barely hygroscopic”particles is observed [Rissler et al., 2006; Vestin et al.,2007]. “Barely hygroscopic” particles have growth factorsfrom 1.06 at 20 nm to 1.12 at 440 nm, corresponding toinorganic‐equivalent dry‐volume fractions of ∼0.07. The“barely hygroscopic” particles can dominate the numberbalance of the external mixture by a factor of 5–10, with alarger fraction at smaller particle sizes. Open‐air biomass
burning produces particles largely composed of organiccomponents that have a limited propensity for water uptake.[99] In an advance compared to the inorganic‐equivalent
representation for hygroscopicity, Mircea et al. [2005]provided a more comprehensive treatment of chemicalhygroscopic closure that included a treatment of the organiccomponent. Growth factors observed during LBA‐SMOCC(i.e., moderately to strongly influenced by biomass burning)for particles 420 nm and smaller were compared with thepredictions of a water‐uptake model that incorporated thesize‐segregated chemical composition. Inorganic compo-nents accounted for ∼10% of the size‐segregated massconcentrations, and the balance was carbonaceous [Fuzzi etal., 2007]. Water‐soluble organic compounds constituted50%–60% of the mass concentrations [Decesari et al.,2006]. The water‐uptake model used for the hygroscopicclosure simplified the organic composition by choosing ninemodel compounds derived from functional group analysesand other analytical techniques (see further description insection 3.3). The model, combined with the size‐segregatedchemical composition, accurately predicted the measuredgrowth factors for an assumption of limited solubility ofthe organic compounds at 90% RH. Closure could not beobtained for other candidate assumptions, including completesolubility or complete insolubility.[100] Priorities for progress to better constrain the hygro-
scopic behavior of Amazonian aerosol particles include thefollowing:[101] 1. Amazonian biomass‐burning particles were ex-
tensively characterized during the LBA‐SMOCC experi-ment in 2002. Less is known about natural particles inpristine rain forest environments, essentially based on18 days of data from Zhou et al. [2002] and two days of datafrom Rissler et al. [2004], and further measurements aretherefore highly motivated with a focus on understandingtemporal and geographic variability.[102] 2. The links between size‐segregated chemical
composition and hygroscopic behavior, for instance, byimplementing new instrumentation such as aerosol massspectrometers, as well as between hygroscopic growth andradiative properties, for instance, by conducting experimentsusing humidity‐controlled nephelometers, should be pursued.[103] 3. The presence of PBA particles should be quanti-
fied by utilizing the ability of a tandem differential mobilityanalyzer to determine the hygroscopic growth of individualparticles. The intermittent appearance of externally mixed“barely hygroscopic” particles during the wet season ofZhou et al. [2002] (i.e., a frequency of occurrence of 5%–9% in the Aitken mode and 11%–14% in the accumulationmode) might indicate an influence from PBA particlesources, although anthropogenic pollution was not entirelyruled out as having an influence during that study.
3.5. Cloud Condensation Nuclei[104] The concentrations of cloud condensation nuclei
(CCN), in the absence of an influence by in‐Basin biomassburning, are 200–300 cm−3 for 1% supersaturation [Roberts
Martin et al.: AMAZONIAN AEROSOL PARTICLES RG2002RG2002
29 of 42

et al., 2001, 2002; Andreae et al., 2004; Gunthe et al.,2009]. These CCN concentrations are comparable to thetotal particle concentration, and they are lower than typicallyobserved for other rural sites worldwide, a finding which isindicative of strong anthropogenic influence for most othercontinental locations worldwide [Andreae, 2007, 2009]. TheCCN properties for natural conditions can be described inlarge part by an effective CCN hygroscopicity parameter �of 0.15 [Gunthe et al., 2009]. Such particles in the Aitkenand accumulation modes are sufficiently hygroscopic thatthey activate at supersaturations of 0.1–1% [Zhou et al.,2002; Svenningsson et al., 2006]. For comparison, � islarger by a factor of two for other continental locations andby a factor of four for typical marine particles [Andreae andRosenfeld, 2008]. The lower � in Amazonia is consistentwith the properties of SOA material reported in laboratorystudies [King et al., 2007, 2009; Prenni et al., 2007] andwith the report of Chen et al. [2009] for AMAZE‐08 thathigh proportions of secondary organic matter constitute thecomponents of submicron particles. Supermicron PBAparticles present at relatively low number concentrations canalso be important under some circumstances by serving as“giant” CCN, which activate at supersaturations below 0.1%because of their large diameters and enhance the collision‐coalescence stage of precipitation formation, especially underpolluted conditions [Yin et al., 2000]. PBA particles arealso an important source of ice nuclei in the Basin [Prenniet al., 2009].[105] In stark contrast to the low CCN concentrations ob-
served for natural conditions, regions affected by in‐Basin bio-mass burning can have CCN concentrations of 10,000 cm−3
or more (Figure 22) [Roberts et al., 2003; Rissler et al.,2004; Vestin et al., 2007]. The contribution to CCN numberconcentration arises not only from the increase in particlenumber concentration but also from increases in modediameter and in water‐soluble fraction, both of which furtherfavor CCN activation [Mayol‐Bracero et al., 2002; Decesariet al., 2006; Fuzzi et al., 2007]. For the observations ofLBA‐SMOCC, Mircea et al. [2005] show that CCN closurein the supersaturated regime (i.e., >100%RH) is best achievedby assuming complete water solubility of organic species atthe high water activities of CCN activation.[106] The difference in CCN concentrations between
natural and anthropogenically influenced conditions hassignificant consequences on the microphysical properties ofclouds, particularly the average droplet diameter, themaximum in‐cloud supersaturation, and the precipitationdynamics. Microphysical properties are most susceptible toincreasing CCN concentrations for low base concentrations,such as those of natural Amazonia. The input of additionalparticles from biomass burning greatly alters the pathwaysof cloud development. When smoke plumes spread overlarge areas, shallow clouds are inhibited, causing a reductionin cloud cover [Koren et al., 2004, 2005]. Feingold et al.[2005] and Jiang and Feingold [2006] also suggest thatthe extinction of radiation by elevated particle concentra-tions in the middle troposphere reduces the surface heat flux,thereby stabilizing the boundary layer and further reducing
cloud cover. Furthermore, enhanced CCN concentrationsthat result from biomass burning reduce the cloud dropletdiameter below the collision‐coalescence threshold, aneffect which reduces warm‐cloud precipitation [Andreae etal., 2004]. Another potential effect of increased CCN con-centrations, which is enhanced cloud albedo as a result ofboth the smaller droplet diameter and more numerous dro-plets [Twomey, 1977], is small or negligible in the AmazonBasin because the clouds are usually already optically thick[Platnick and Twomey, 1994; Roberts et al., 2003].[107] The range of microphysical regimes observed in
the Basin, including blue‐ocean clouds, green‐ocean clouds,smoky clouds, and pyroclouds, is illustrated by the mass‐diameter distributions of liquid water content (Figure 23)[Andreae et al., 2004]. There is a narrowing of the distribu-tions and a slowing of their rate of broadening with increasingheight for the progressively more particle‐rich regimes fromFigures 23a to 23d. For lowCCN concentrations (Figures 23aand 23b), the droplet distributions over the ocean and theAmazon Basin grow and broaden in a similar manner as theparcel rises. In contrast, for the very high CCN concentrationsof pyroclouds (Figure 23d) that form in the invigoratedupdrafts of the smoke plume over an active fire, the dropletdistribution stops growing once the air parcel rises above acritical altitude (e.g., above 2800m in Figure 23). The stuntedgrowth is explained by reduced in‐cloud supersaturationthat inhibits droplet growth and has the consequence ofsuppressing precipitation. Pyroclouds embedded in a smokyatmosphere also reduce ground heating by blocking sunlight,and they therefore reduce convective vigor and precipitation.Smoky clouds (Figure 23c) represent an intermediate casecompared to green‐ocean clouds and pyroclouds. In smokyclouds, the altitude for the onset of precipitation, which cor-responds to a modal diameter of the liquid water content thatis greater than an approximate threshold of 24 mm, shiftshigher compared to natural conditions. The consequence isthat rain either does not occur or occurs from higher altitudes,including more precipitation initiated through the ice phase.Consequently, there is a vertical redistribution of releasedheat and, in the case of ice, invigorated convection and light-ning [Rosenfeld et al., 2008].[108] The need to understand how the CCN activity of
organic particles evolves and the associated implications fordirect and indirect radiative forcing have been highlighted ingeneral reviews [Kanakidou et al., 2005; Fuzzi et al., 2006;McFiggans et al., 2006; Andreae and Rosenfeld, 2008].Specific priorities for better understanding and predictingthe CCN activity of Amazonian aerosol particles and theireffects on climate include the following:[109] 1. In terms of measurements, data sets of CCN
activity in the Basin are restricted in both time and spaceand can be considered sparse in comparison to the seasonaland spatial heterogeneities of the Amazon Basin. Most mea-surements in available data sets were carried out duringintensive campaigns lasting a short number of weeks at asingle location [Roberts et al., 2002; Rissler et al., 2004;Vestin et al., 2007; Gunthe et al., 2009]. Long‐term anddistributed measurements are therefore highly motivated so
Martin et al.: AMAZONIAN AEROSOL PARTICLES RG2002RG2002
30 of 42
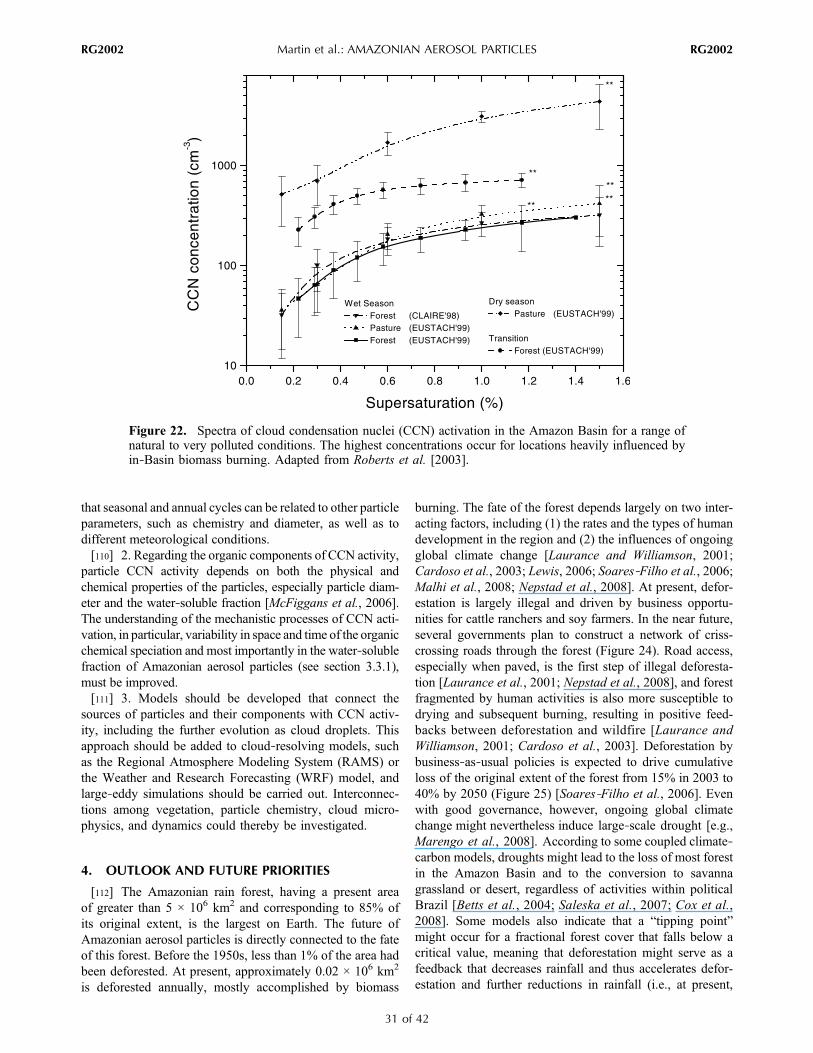
that seasonal and annual cycles can be related to other particleparameters, such as chemistry and diameter, as well as todifferent meteorological conditions.[110] 2. Regarding the organic components of CCN activity,
particle CCN activity depends on both the physical andchemical properties of the particles, especially particle diam-eter and the water‐soluble fraction [McFiggans et al., 2006].The understanding of the mechanistic processes of CCN acti-vation, in particular, variability in space and time of the organicchemical speciation and most importantly in the water‐solublefraction of Amazonian aerosol particles (see section 3.3.1),must be improved.[111] 3. Models should be developed that connect the
sources of particles and their components with CCN activ-ity, including the further evolution as cloud droplets. Thisapproach should be added to cloud‐resolving models, suchas the Regional Atmosphere Modeling System (RAMS) orthe Weather and Research Forecasting (WRF) model, andlarge‐eddy simulations should be carried out. Interconnec-tions among vegetation, particle chemistry, cloud micro-physics, and dynamics could thereby be investigated.
4. OUTLOOK AND FUTURE PRIORITIES
[112] The Amazonian rain forest, having a present areaof greater than 5 × 10⁶ km2 and corresponding to 85% ofits original extent, is the largest on Earth. The future ofAmazonian aerosol particles is directly connected to the fateof this forest. Before the 1950s, less than 1% of the area hadbeen deforested. At present, approximately 0.02 × 10⁶ km2
is deforested annually, mostly accomplished by biomass
burning. The fate of the forest depends largely on two inter-acting factors, including (1) the rates and the types of humandevelopment in the region and (2) the influences of ongoingglobal climate change [Laurance and Williamson, 2001;Cardoso et al., 2003; Lewis, 2006; Soares‐Filho et al., 2006;Malhi et al., 2008; Nepstad et al., 2008]. At present, defor-estation is largely illegal and driven by business opportu-nities for cattle ranchers and soy farmers. In the near future,several governments plan to construct a network of criss-crossing roads through the forest (Figure 24). Road access,especially when paved, is the first step of illegal deforesta-tion [Laurance et al., 2001; Nepstad et al., 2008], and forestfragmented by human activities is also more susceptible todrying and subsequent burning, resulting in positive feed-backs between deforestation and wildfire [Laurance andWilliamson, 2001; Cardoso et al., 2003]. Deforestation bybusiness‐as‐usual policies is expected to drive cumulativeloss of the original extent of the forest from 15% in 2003 to40% by 2050 (Figure 25) [Soares‐Filho et al., 2006]. Evenwith good governance, however, ongoing global climatechange might nevertheless induce large‐scale drought [e.g.,Marengo et al., 2008]. According to some coupled climate‐carbon models, droughts might lead to the loss of most forestin the Amazon Basin and to the conversion to savannagrassland or desert, regardless of activities within politicalBrazil [Betts et al., 2004; Saleska et al., 2007; Cox et al.,2008]. Some models also indicate that a “tipping point”might occur for a fractional forest cover that falls below acritical value, meaning that deforestation might serve as afeedback that decreases rainfall and thus accelerates defor-estation and further reductions in rainfall (i.e., at present,
Figure 22. Spectra of cloud condensation nuclei (CCN) activation in the Amazon Basin for a range ofnatural to very polluted conditions. The highest concentrations occur for locations heavily influenced byin‐Basin biomass burning. Adapted from Roberts et al. [2003].
Martin et al.: AMAZONIAN AEROSOL PARTICLES RG2002RG2002
31 of 42
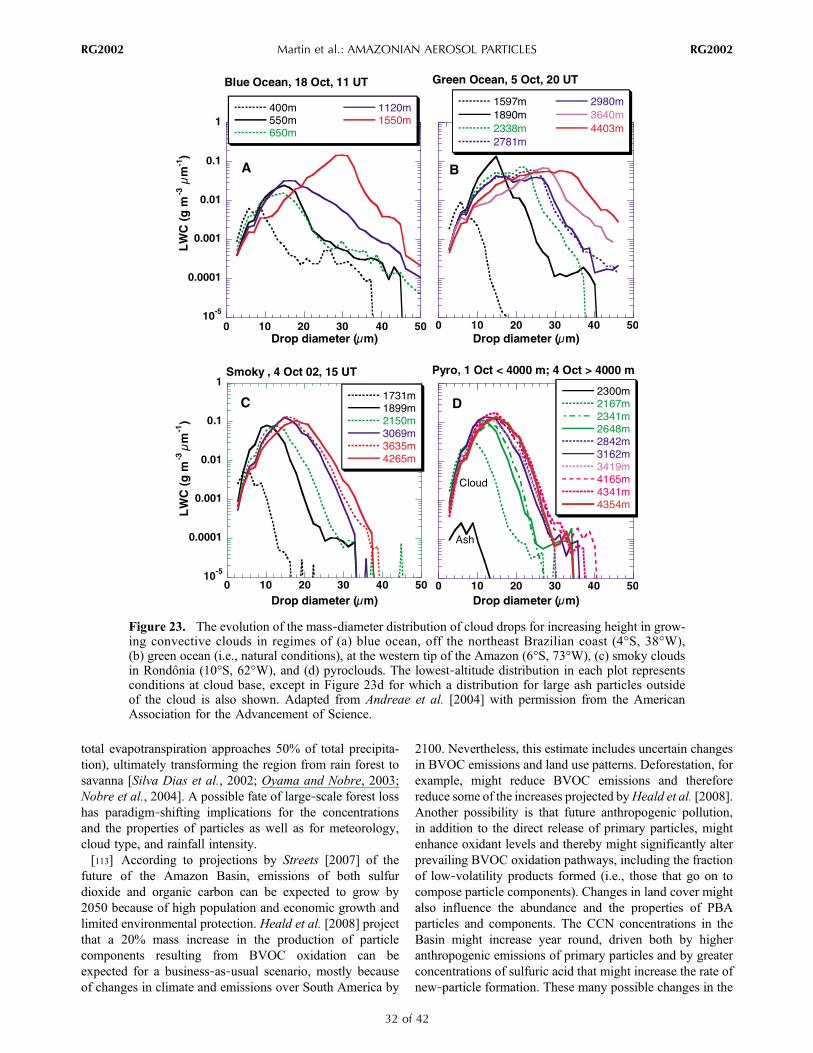
total evapotranspiration approaches 50% of total precipita-tion), ultimately transforming the region from rain forest tosavanna [Silva Dias et al., 2002; Oyama and Nobre, 2003;Nobre et al., 2004]. A possible fate of large‐scale forest losshas paradigm‐shifting implications for the concentrationsand the properties of particles as well as for meteorology,cloud type, and rainfall intensity.[113] According to projections by Streets [2007] of the
future of the Amazon Basin, emissions of both sulfurdioxide and organic carbon can be expected to grow by2050 because of high population and economic growth andlimited environmental protection. Heald et al. [2008] projectthat a 20% mass increase in the production of particlecomponents resulting from BVOC oxidation can beexpected for a business‐as‐usual scenario, mostly becauseof changes in climate and emissions over South America by
2100. Nevertheless, this estimate includes uncertain changesin BVOC emissions and land use patterns. Deforestation, forexample, might reduce BVOC emissions and thereforereduce some of the increases projected byHeald et al. [2008].Another possibility is that future anthropogenic pollution,in addition to the direct release of primary particles, mightenhance oxidant levels and thereby might significantly alterprevailing BVOC oxidation pathways, including the fractionof low‐volatility products formed (i.e., those that go on tocompose particle components). Changes in land cover mightalso influence the abundance and the properties of PBAparticles and components. The CCN concentrations in theBasin might increase year round, driven both by higheranthropogenic emissions of primary particles and by greaterconcentrations of sulfuric acid that might increase the rate ofnew‐particle formation. These many possible changes in the
Figure 23. The evolution of the mass‐diameter distribution of cloud drops for increasing height in grow-ing convective clouds in regimes of (a) blue ocean, off the northeast Brazilian coast (4°S, 38°W),(b) green ocean (i.e., natural conditions), at the western tip of the Amazon (6°S, 73°W), (c) smoky cloudsin Rondônia (10°S, 62°W), and (d) pyroclouds. The lowest‐altitude distribution in each plot representsconditions at cloud base, except in Figure 23d for which a distribution for large ash particles outsideof the cloud is also shown. Adapted from Andreae et al. [2004] with permission from the AmericanAssociation for the Advancement of Science.
Martin et al.: AMAZONIAN AEROSOL PARTICLES RG2002RG2002
32 of 42
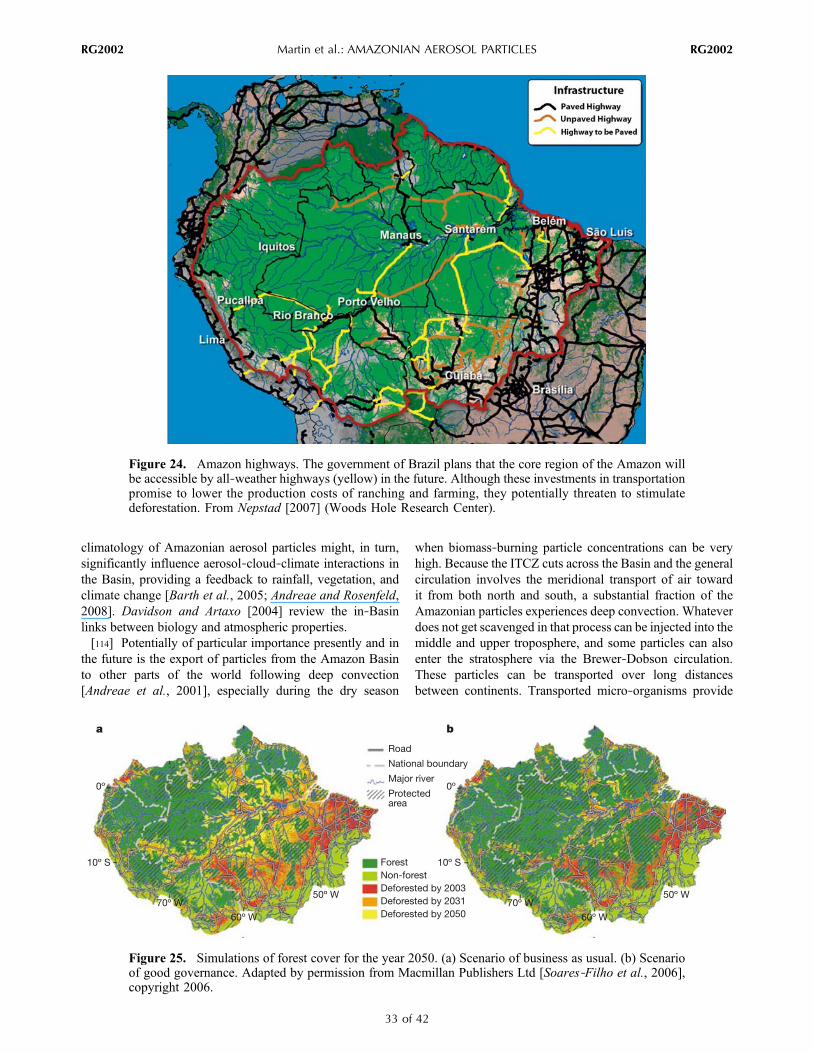
climatology of Amazonian aerosol particles might, in turn,significantly influence aerosol‐cloud‐climate interactions inthe Basin, providing a feedback to rainfall, vegetation, andclimate change [Barth et al., 2005; Andreae and Rosenfeld,2008]. Davidson and Artaxo [2004] review the in‐Basinlinks between biology and atmospheric properties.[114] Potentially of particular importance presently and in
the future is the export of particles from the Amazon Basinto other parts of the world following deep convection[Andreae et al., 2001], especially during the dry season
when biomass‐burning particle concentrations can be veryhigh. Because the ITCZ cuts across the Basin and the generalcirculation involves the meridional transport of air towardit from both north and south, a substantial fraction of theAmazonian particles experiences deep convection. Whateverdoes not get scavenged in that process can be injected into themiddle and upper troposphere, and some particles can alsoenter the stratosphere via the Brewer‐Dobson circulation.These particles can be transported over long distancesbetween continents. Transported micro‐organisms provide
Figure 24. Amazon highways. The government of Brazil plans that the core region of the Amazon willbe accessible by all‐weather highways (yellow) in the future. Although these investments in transportationpromise to lower the production costs of ranching and farming, they potentially threaten to stimulatedeforestation. From Nepstad [2007] (Woods Hole Research Center).
Figure 25. Simulations of forest cover for the year 2050. (a) Scenario of business as usual. (b) Scenarioof good governance. Adapted by permission from Macmillan Publishers Ltd [Soares‐Filho et al., 2006],copyright 2006.
Martin et al.: AMAZONIAN AEROSOL PARTICLES RG2002RG2002
33 of 42

a clear demonstration of these processes [Griffin et al., 2006;Griffin, 2008]. The Amazon Basin may thus represent asignificant global source, both of primary particles and ofgaseous precursors to secondary components, and thesecontributions may strongly influence the pristine conditionsthat otherwise prevail in the upper troposphere and thestratosphere.
4.1. Priorities for Improved Models[115] Few modeling studies have focused on aerosol par-
ticles in the Amazon Basin. In particular, very little effort hasbeen invested in understanding particle sources for naturalconditions when concentrations are low. Regional modelshave been used, however, to characterize the importance ofbiomass burning to particle number and mass concentrationsas well as to climate [Freitas et al., 2005; Liu, 2005;Martinsand Pereira, 2006]. An intercomparison of global modelsshowed that model skill over Amazonia for the annual averageoptical thickness misleadingly appeared to be good becauseof compensation by an underestimate of optical thickness forregions influenced by biomass burning and an overestimatefor periods during which natural conditions prevailed [Kinneet al., 2003]. The overestimate for natural conditions waspuzzling because the global models did not include emis-sions of PBA particles and had very rudimentary descriptions,if any, of the production of particle‐phase BVOC oxidationproducts. The bias for natural conditions was thereforeattributed to one or more of the following: an overestimateof out‐of‐Basin particles into the region, an underestimate oftheir in‐Basin deposition rates, or a poor characterization ofthe optical properties of Amazonian particles. Kanakidouet al. [2005] summarized the uncertainties and challengesrelated to global climate model simulations of organic aerosolparticles. There is a critical need to validate these modelestimates with observations over the Amazon Basin.[116] High‐priority research needs for improving the re-
gional modeling of Amazonian aerosol particles include thefollowing: (1) development of model schemes for emissionsof PBA particles in the Amazon Basin (these schemes areentirely absent in state‐of‐the‐art chemical transport models);(2) investigation and implementation of models at the scalenecessary to capture how vegetative heterogeneity withinthe rain forest canopy affects BVOC and PBA particleemissions; (3) inclusion in models at the level of compoundsor families of all BVOC emissions contributing to the sec-ondary components of particles (Amazonian vegetationmight be a more or less efficient emitter of specific com-pounds compared to other locations for which standardemissions in models have been calibrated); (4) incorporationin models of new BVOC chemistry, such as the reactions ofisoprene in the chemical regimes prevailing in the AmazonBasin (e.g., pristine low NOx) and more generally of organicperoxy radicals; and (5) attention in models, validated bymeasurements, of how efficiently particles over the AmazonBasin are removed by precipitation and how this sink term isaffected by the processing and alteration of particles duringtheir residence in the atmosphere.
4.2. Priorities for Improved Measurements[117] There have been many technological advances in the
past 10 years for the characterization of aerosol particlesglobally, yet many of the new instruments have yet to bedeployed in the Amazon Basin. The logistical difficultiesthere have constrained measurements temporally, spatially,and technically to levels insufficient for fully accuratedescriptions of Amazonian aerosol particles and the pro-cesses affecting them. These difficulties notwithstanding,new instruments, defined in the context of Amazonianaerosol particles both as truly new instruments in the broadscientific community and as more familiar instruments thathave never been deployed before for studies in the Basin,should be used to obtain more precise and accurate mea-surements of key properties of Amazonian particles. Theinstruments should be deployed to provide complementaryinformation on complex properties, especially related toparticle chemical composition. Chemical information can beemployed, in conjunction with models, to understandmechanisms of particle formation and subsequent agingprocesses. In addition, more creative applications should bemade of real‐time displays and airborne remote sensors forbetter placement of aircraft, particularly when sampling clouds.[118] The particle properties that are the most uncertain
and thus limit our ability to assess their environmentaleffects include (1) the molecular composition of the organiccomponent as quantitative tracers of sources and age, (2) thehygroscopicity and mixing states as affected by atmosphericprocessing, (3) the activity as cloud and ice nuclei, and (4) theoptical activity (i.e., extinction, absorption, single‐scatteringalbedo, and asymmetry factor). State‐of‐the‐art measure-ment systems have the potential to significantly reduce theuncertainties surrounding these properties. For example,improvements in measuring the chemistry of aerosol particleswith instruments like mass spectrometers [Prather et al.,1994; Jayne et al., 2000] have provided a detailed look intothe chemistry of particles, yet an aerosol mass spectrometerwent to Amazonia for the first time only recently as part ofAMAZE‐08 [Chen et al., 2009]. Similarly, single‐columnand multicolumn continuous flow CCN counters, includinginstruments with size‐selective inlets, have opened newpossibilities for measurements of particle hygroscopicity[Roberts and Nenes, 2005], and these state‐of‐the‐art instru-ments also were deployed in Amazonia for the first time in2008 as part of AMAZE‐08. There are many other instru-ments that are currently under development or that have onlyjust been made operational. For example, the single‐particlesoot photometer is the first instrument to measure the massin single, light‐absorbing carbon particles, and its use instudying biomass‐burning particles could improve the con-nections between the particle chemistry and the particleradiation field [Baumgardner et al., 2004; Schwarz et al.,2006; Moteki et al., 2007]. When an aircraft is available,airborne lidar and radar with real‐time displays could beused to locate optimum areas for cloud penetration tounderstand and quantify the effects of cloud processing onparticles.
Martin et al.: AMAZONIAN AEROSOL PARTICLES RG2002RG2002
34 of 42

[119] The use of measurements to understand the evolu-tion of Amazonian aerosol particles, their interactions withclouds and radiation, and their impacts on climate mustultimately be facilitated by global climate models coupledwith chemical transport models. These models, however,must be based on particle properties and processes definedby a combination of laboratory and ambient measurements,and significant uncertainties exist in the treatments presentlyemployed for Amazonian aerosol particles (see section 4.1),traceable in part to an insufficient set of measurements. Asan example of how the uncertainty in measurements pro-pagates into models, the optical thickness predicted by sev-eral different global models varies by more than 50% in theBasin [Kinne et al., 2003, 2006]. These intermodel differencesare primarily attributable to uncertainties in the parameteriza-tion of particle composition and residence time [Textor et al.,2006]. Reductions in these uncertainties requires knowl-edge, to be gained through well‐designed measurementprograms, that focuses on closure studies, where the closureto be achieved is between the predicted and measured particleproperties, particularly their hygroscopic, chemical, micro-physical, and optical properties. Another important closure,though less precisely defined, is that of particle residencetime, meaning an evaluation of sources and sinks.[120] As one example, obtaining closure for CCN activa-
tion requires measuring the chemical composition of parti-cles as a function of size and accurately predicting the number‐diameter distribution of CCN as a function of supersaturationthat is measured with in situ instrumentation. Gunthe et al.[2009] provide one example for studies in the AmazonBasin. The results of this type of closure should be incor-porated into modules of cloud microphysics to improve howthe aerosol indirect effect is forecast. As a second example,radiation closure requires ground‐based and satellite mea-surements of optical thickness, at multiple wavelengths, tocompare with the optical thickness derived from measure-ments of the chemical and optical properties of particles overa range of altitudes and geographic locations.[121] The ideal field program to implement the above
closure studies would span several dry and wet seasons inthe Basin, would require in situ and remote sensing mea-surements from multiple ground‐based and airborne plat-forms, and would be complemented by satellite observationsfrom which particle and trace gas properties are derived.Autonomous, unmanned aerial vehicles have recently beenused to make measurements of particles over the IndianOcean [Corrigan et al., 2008] and could be extremely usefulin the Basin. Establishment of a tall‐tower atmosphericobservatory could greatly facilitate long‐term, high‐qualitymeasurements of particle properties, gaseous tracers, andmeteorological variables. A tall tower could additionallyprovide the opportunity to measure vertical profiles throughthe atmosphere over the forest.
5. CONCLUDING REMARKS
[122] The goal of this review was to provide a synthesis ofaerosol research in the Amazon Basin, most of which has
been published during the last two decades. By integratingthe information that has been published by a considerablenumber of authors in a variety of journals over a long spanof time, we sought to provide a comprehensive picture aboutwhat is known about Amazonian aerosol particles and tobring together the various aspects that are now scatteredthroughout the literature. We intend that this effort will fa-cilitate an understanding of the current state of knowledgeon Amazonian aerosol particles specifically and tropicalcontinental aerosol particles in general and will therebyenhance future research in this area. This review barelytouched on the transformations of particles by interactionsbetween particle‐ and gas‐phase species (i.e., condensation,evaporation, and reactions), reactions within the particles,and cloud processing of particles. These processes, thoughundoubtedly important, have hardly been researched in theAmazon Basin. We therefore identify future studies designedtoward these ends as being urgently needed.
[123] ACKNOWLEDGMENTS. The authors of this articlewere part of the International Workshop: Aerosol Particles in theAmazon—Changes and Their Consequences From Past and FutureHuman Activities, which took place 18–22 February 2008 at AriaúAmazon Towers, north of Manaus, Brazil. Special thanks go toC. H. Martin. Support was received from the U.S. National ScienceFoundation (NSF) (OISE‐0651836), the Brazil LBA MillenniumInstitute, the Harvard Brazil Studies Program of the David Rocke-feller Center of Latin American Studies, Atmospheric CompositionChange: The European Network of Excellence (ACCENT), theMax Planck Society, and the Brazilian Large‐Scale Biosphere‐Atmosphere (LBA) Experiment. S.T.M. also acknowledges supportfrom a Humboldt Research Fellowship: Summer Research Fellow-ship for U.S. Scientists and Scholars and a Visiting ResearcherAward, State of São Paulo Research Foundation (FAPESP), Brazil.This article is dedicated to the memory of Conceição Moreira Silva.[124] The Editor responsible for this paper was Gerald North.
He thanks two anonymous reviewers.
REFERENCES
Allen, A. G., and A. H. Miguel (1995), Biomass burning in theAmazon—Characterization of the ionic component of aerosolsgenerated from flaming and smoldering rain‐forest and savanna,Environ. Sci. Technol., 29, 486–493, doi:10.1021/es00002a026.
Andreae, M. O. (1993), The influence of tropical biomass burningon climate and the atmospheric environment, in Biogeochemistryof Global Change: Radiatively Active Trace Gases, edited byR. S. Oremland, pp. 113–150, Chapman and Hall, New York.
Andreae, M. O. (2007), Aerosols before pollution, Science, 315,50–51, doi:10.1126/science.1136529.
Andreae, M. O. (2009), Correlation between cloud condensationnuclei concentration and aerosol optical thickness in remoteand polluted regions, Atmos. Chem. Phys., 9, 543–556.
Andreae, M. O., and T. W. Andreae (1988), The cycle of biogenicsulfur‐compounds over the Amazon Basin: 1. Dry season,J. Geophys. Res., 93, 1487–1497, doi:10.1029/JD093iD02p01487.
Andreae, M. O., and P. J. Crutzen (1997), Atmospheric aerosols:Biogeochemical sources and role in atmospheric chemistry,Science, 276, 1052–1058, doi:10.1126/science.276.5315.1052.
Andreae, M. O., and A. Gelencser (2006), Black carbon or browncarbon? The nature of light‐absorbing carbonaceous aerosols,Atmos. Chem. Phys., 6, 3131–3148.
Martin et al.: AMAZONIAN AEROSOL PARTICLES RG2002RG2002
35 of 42

Andreae, M. O., and D. Rosenfeld (2008), Aerosol‐cloud‐precipitationinteractions. Part 1. The nature and sources of cloud‐active aerosols,Earth Sci. Rev., 89, 13–41, doi:10.1016/j.earscirev.2008.03.001.
Andreae, M. O., et al. (1988), Biomass‐burning emissions andassociated haze layers over Amazonia, J. Geophys. Res., 93,1509–1527, doi:10.1029/JD093iD02p01509.
Andreae, M. O., H. Berresheim, H. Bingemer, D. J. Jacob, B. L.Lewis, S. M. Li, and R. W. Talbot (1990a), The atmospheric sul-fur cycle over the Amazon Basin: 2. Wet season, J. Geophys.Res., 95, 16,813–16,824, doi:10.1029/JD095iD10p16813.
Andreae, M. O., R. W. Talbot, H. Berresheim, and K. M. Beecher(1990b), Precipitation chemistry in central Amazonia, J. Geophys.Res., 95, 16,987–16,999, doi:10.1029/JD095iD10p16987.
Andreae, M. O., B. E. Anderson, D. R. Blake, J. D. Bradshaw, J. E.Collins, G. L. Gregory, G. W. Sachse, and M. C. Shipham(1994), Influence of plumes from biomass burning on atmosphericchemistry over the equatorial Atlantic during CITE‐3, J. Geophys.Res., 99, 12,793–12,808.
Andreae, M. O., et al. (1998), Airborne studies of aerosol emissionsfrom savanna fires in southern Africa: 2. Aerosol chemical compo-sition, J. Geophys. Res., 103, 32,119–32,128, doi:10.1029/98JD02280.
Andreae, M. O., et al. (2001), Transport of biomass burningsmoke to the upper troposphere by deep convection in the equa-torial region, Geophys. Res. Lett., 28, 951–954, doi:10.1029/2000GL012391.
Andreae, M. O., et al. (2002), Biogeochemical cycling of carbon,water, energy, trace gases, and aerosols in Amazonia: TheLBA‐EUSTACH experiments, J. Geophys. Res., 107(D20),8066, doi:10.1029/2001JD000524.
Andreae, M. O., D. Rosenfeld, P. Artaxo, A. A. Costa, G. P. Frank,K. M. Longo, and M. A. F. Silva‐Dias (2004), Smoking rainclouds over the Amazon, Science, 303, 1337–1342, doi:10.1126/science.1092779.
Artaxo, P., and H. C. Hansson (1995), Size distribution of biogenicaerosol‐particles from the Amazon Basin, Atmos. Environ., 29,393–402, doi:10.1016/1352-2310(94)00178-N.
Artaxo, P., H. Storms, F. Bruynseels, R. Van Grieken, andW. Maenhaut (1988), Composition and sources of aerosols fromthe Amazon Basin, J. Geophys. Res. , 93 , 1605–1615,doi:10.1029/JD093iD02p01605.
Artaxo, P., W. Maenhaut, H. Storms, and R. Van Grieken (1990),Aerosol characteristics and sources for the Amazon Basin duringthe wet season, J. Geophys. Res. , 95 , 16,971–16,985,doi:10.1029/JD095iD10p16971.
Artaxo, P., E. T. Fernandes, J. V. Martins, M. A. Yamasoe, P. V.Hobbs,W.Maenhaut, K.M. Longo, and A. Castanho (1998), Large‐scale aerosol source apportionment in Amazonia, J. Geophys. Res.,103, 31,837–31,847, doi:10.1029/98JD02346.
Artaxo, P., J. V. Martins, M. A. Yamasoe, A. S. Procopio, T. M.Pauliquevis, M. O. Andreae, P. Guyon, L. V. Gatti, and A. M.C. Leal (2002), Physical and chemical properties of aerosols inthe wet and dry seasons in Rondônia, Amazonia, J. Geophys.Res., 107(D20), 8081, doi:10.1029/2001JD000666.
Avissar, R., P. L. S. Dias, M. Dias, and C. Nobre (2002), TheLarge‐Scale Biosphere‐Atmosphere Experiment in Amazonia(LBA): Insights and future research needs, J. Geophys. Res.,107(D20), 8086, doi:10.1029/2002JD002704.
Barkley, M. P., P. I. Palmer, U. Kuhn, J. Kesselmeier, K. Chance,T. P. Kurosu, R. V. Martin, D. Helmig, and A. Guenther (2008),Net ecosystem fluxes of isoprene over tropical South America in-ferred from GOME observations of HCHO columns, J. Geophys.Res., 113, D20304, doi:10.1029/2008JD009863.
Barregard, L., G. Sallsten, P. Gustafson, L. Andersson, L. Johansson,S. Basu, and L. Stigendal (2006), Experimental exposure to wood‐smoke particles in healthy humans: Effects on markers of inflam-mation, coagulation, and lipid peroxidation, Inhal. Toxicol., 18,845–853, doi:10.1080/08958370600685798.
Barth, M., et al. (2005), Coupling between land ecosystems and theatmospheric hydrologic cycle through biogenic aerosol path-ways, Bull. Am. Meteorol. Soc., 86, 1738–1742, doi:10.1175/BAMS-86-12-1738.
Baumgardner, D., G. Kok, and G. Raga (2004), Warming of theArctic lower stratosphere by light absorbing particles, Geophys.Res. Lett., 31, L06117, doi:10.1029/2003GL018883.
Betts, R. A., P. M. Cox, M. Collins, P. P. Harris, C. Huntingford,and C. D. Jones (2004), The role of ecosystem‐atmosphere inter-actions in simulated Amazonian precipitation decrease and forestdieback under global climate warming, Theor. Appl. Climatol.,78, 157–175.
Blando, J. D., and B. J. Turpin (2000), Secondary organic aerosolformation in cloud and fog droplets: A literature evaluation ofplausibility, Atmos. Environ., 34, 1623–1632, doi:10.1016/S1352-2310(99)00392-1.
Browell, E. V., G. L. Gregory, R. C. Harriss, and V. Kirchhoff(1990), Ozone and aerosol distributions over the Amazon Basinduring the wet season, J. Geophys. Res., 95, 16,887–16,901,doi:10.1029/JD095iD10p16887.
Cardoso, M. F., G. C. Hurtt, B. Moore, C. A. Nobre, and E. M. Prins(2003), Projecting future fire activity in Amazonia,Global ChangeBiol., 9, 656–669, doi:10.1046/j.1365-2486.2003.00607.x.
Carlton, A. G., B. J. Turpin, H.‐J. Lim, K. E. Altieri, and S. P.Seitzinger (2006), Link between isoprene and secondary organicaerosol (SOA): Pyruvic acid oxidation yields low volatilityorganic acids in clouds, Geophys. Res. Lett., 33, L06822,doi:10.1029/2005GL025374.
Ceburnis, D., C. D. O’Dowd, G. S. Jennings, M. C. Facchini,L. Emblico, S. Decesari, S. Fuzzi, and J. Sakalys (2008),Marine aerosol chemistry gradients: Elucidating primary andsecondary processes and fluxes, Geophys. Res. Lett., 35,L07804, doi:10.1029/2008GL033462.
Chand, D., P. Guyon, P. Artaxo, O. Schmid, G. P. Frank, L. V.Rizzo, O. L. Mayol‐Bracero, L. V. Gatti, and M. O. Andreae(2006), Optical and physical properties of aerosols in the bound-ary layer and free troposphere over the Amazon Basin during thebiomass burning season, Atmos. Chem. Phys., 6, 2911–2925.
Chen, Q., et al. (2009), Mass spectral characterization of submi-cron biogenic organic particles in the Amazon Basin, Geophys.Res. Lett., 36, L20806, doi:10.1029/2009GL039880.
Chung, S. H., and J. H. Seinfeld (2002), Global distribution andclimate forcing of carbonaceous aerosols, J. Geophys. Res.,107(D19), 4407, doi:10.1029/2001JD001397.
Ciccioli, P., et al. (1999), Emission of reactive terpene compoundsfrom orange orchards and their removal by within‐canopy pro-cesses, J. Geophys. Res., 104, 8077–8094, doi:10.1029/1998JD100026.
Claeys, M., et al. (2004), Formation of secondary organic aerosolsthrough photooxidation of isoprene, Science, 303, 1173–1176,doi:10.1126/science.1092805.
Clarke, A. D., J. L. Varner, F. Eisele, R. L. Mauldin, D. Tanner,and M. Litchy (1998), Particle production in the remote marineatmosphere: Cloud outflow and subsidence during ACE 1,J. Geophys. Res., 103, 16,397–16,409, doi:10.1029/97JD02987.
Clarke, A. D., V. N. Kapustin, F. L. Eisele, R. J. Weber, and P. H.McMurry (1999), Particle production near marine clouds: Sulfuricacid and predictions from classical binary nucleation, Geophys.Res. Lett., 26, 2425–2428, doi:10.1029/1999GL900438.
Corrigan, C. E., G. C. Roberts, M. V. Ramana, D. Kim, andV. Ramanathan (2008), Capturing vertical profiles of aerosolsand black carbon over the Indian Ocean using autonomousunmanned aerial vehicles, Atmos. Chem. Phys., 8, 737–747.
Cox, P. M., P. P. Harris, C. Huntingford, R. A. Betts, M. Collins,C. D. Jones, T. E. Jupp, J. A. Marengo, and C. A. Nobre (2008),Increasing risk of Amazonian drought due to decreasing aerosolpollution, Nature, 453, 212–217, doi:10.1038/nature06960.
Martin et al.: AMAZONIAN AEROSOL PARTICLES RG2002RG2002
36 of 42
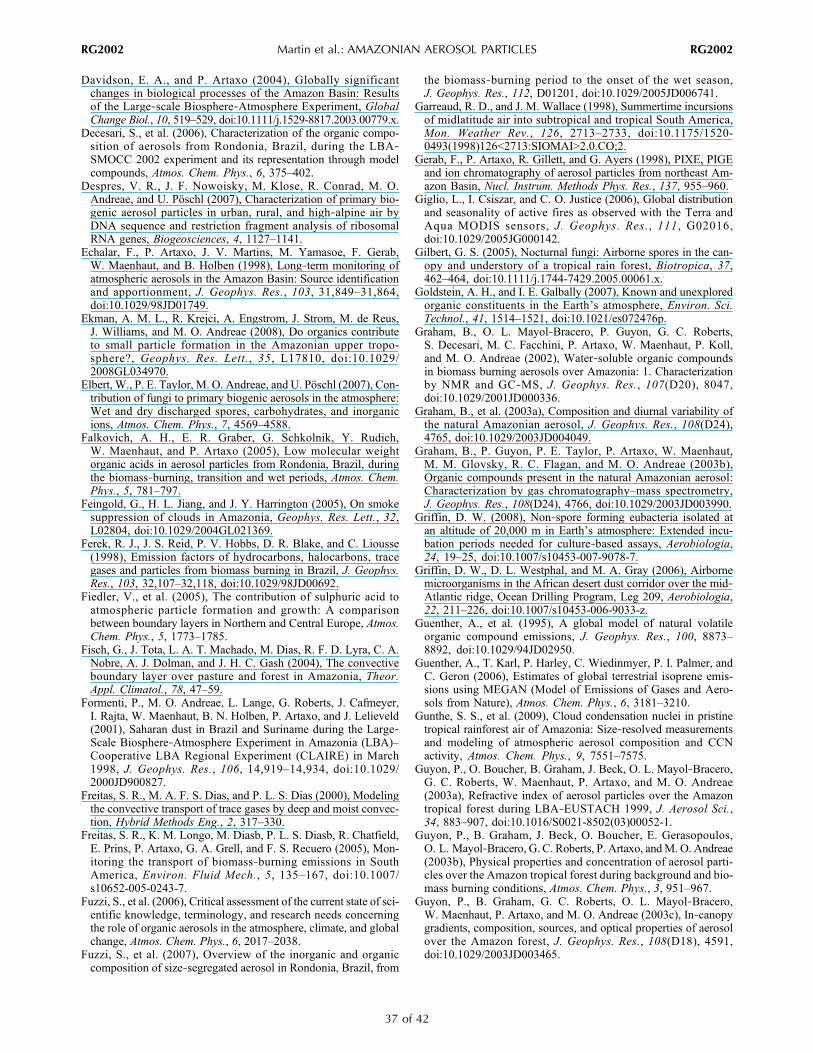
Davidson, E. A., and P. Artaxo (2004), Globally significantchanges in biological processes of the Amazon Basin: Resultsof the Large‐scale Biosphere‐Atmosphere Experiment, GlobalChange Biol., 10, 519–529, doi:10.1111/j.1529-8817.2003.00779.x.
Decesari, S., et al. (2006), Characterization of the organic compo-sition of aerosols from Rondonia, Brazil, during the LBA‐SMOCC 2002 experiment and its representation through modelcompounds, Atmos. Chem. Phys., 6, 375–402.
Despres, V. R., J. F. Nowoisky, M. Klose, R. Conrad, M. O.Andreae, and U. Pöschl (2007), Characterization of primary bio-genic aerosol particles in urban, rural, and high‐alpine air byDNA sequence and restriction fragment analysis of ribosomalRNA genes, Biogeosciences, 4, 1127–1141.
Echalar, F., P. Artaxo, J. V. Martins, M. Yamasoe, F. Gerab,W. Maenhaut, and B. Holben (1998), Long‐term monitoring ofatmospheric aerosols in the Amazon Basin: Source identificationand apportionment, J. Geophys. Res., 103, 31,849–31,864,doi:10.1029/98JD01749.
Ekman, A. M. L., R. Krejci, A. Engstrom, J. Strom, M. de Reus,J. Williams, and M. O. Andreae (2008), Do organics contributeto small particle formation in the Amazonian upper tropo-sphere?, Geophys. Res. Lett., 35, L17810, doi:10.1029/2008GL034970.
Elbert, W., P. E. Taylor, M. O. Andreae, and U. Pöschl (2007), Con-tribution of fungi to primary biogenic aerosols in the atmosphere:Wet and dry discharged spores, carbohydrates, and inorganicions, Atmos. Chem. Phys., 7, 4569–4588.
Falkovich, A. H., E. R. Graber, G. Schkolnik, Y. Rudich,W. Maenhaut, and P. Artaxo (2005), Low molecular weightorganic acids in aerosol particles from Rondonia, Brazil, duringthe biomass‐burning, transition and wet periods, Atmos. Chem.Phys., 5, 781–797.
Feingold, G., H. L. Jiang, and J. Y. Harrington (2005), On smokesuppression of clouds in Amazonia, Geophys. Res. Lett., 32,L02804, doi:10.1029/2004GL021369.
Ferek, R. J., J. S. Reid, P. V. Hobbs, D. R. Blake, and C. Liousse(1998), Emission factors of hydrocarbons, halocarbons, tracegases and particles from biomass burning in Brazil, J. Geophys.Res., 103, 32,107–32,118, doi:10.1029/98JD00692.
Fiedler, V., et al. (2005), The contribution of sulphuric acid toatmospheric particle formation and growth: A comparisonbetween boundary layers in Northern and Central Europe, Atmos.Chem. Phys., 5, 1773–1785.
Fisch, G., J. Tota, L. A. T. Machado, M. Dias, R. F. D. Lyra, C. A.Nobre, A. J. Dolman, and J. H. C. Gash (2004), The convectiveboundary layer over pasture and forest in Amazonia, Theor.Appl. Climatol., 78, 47–59.
Formenti, P., M. O. Andreae, L. Lange, G. Roberts, J. Cafmeyer,I. Rajta, W. Maenhaut, B. N. Holben, P. Artaxo, and J. Lelieveld(2001), Saharan dust in Brazil and Suriname during the Large‐Scale Biosphere‐Atmosphere Experiment in Amazonia (LBA)–Cooperative LBA Regional Experiment (CLAIRE) in March1998, J. Geophys. Res., 106, 14,919–14,934, doi:10.1029/2000JD900827.
Freitas, S. R., M. A. F. S. Dias, and P. L. S. Dias (2000), Modelingthe convective transport of trace gases by deep and moist convec-tion, Hybrid Methods Eng., 2, 317–330.
Freitas, S. R., K. M. Longo, M. Diasb, P. L. S. Diasb, R. Chatfield,E. Prins, P. Artaxo, G. A. Grell, and F. S. Recuero (2005), Mon-itoring the transport of biomass‐burning emissions in SouthAmerica, Environ. Fluid Mech., 5, 135–167, doi:10.1007/s10652-005-0243-7.
Fuzzi, S., et al. (2006), Critical assessment of the current state of sci-entific knowledge, terminology, and research needs concerningthe role of organic aerosols in the atmosphere, climate, and globalchange, Atmos. Chem. Phys., 6, 2017–2038.
Fuzzi, S., et al. (2007), Overview of the inorganic and organiccomposition of size‐segregated aerosol in Rondonia, Brazil, from
the biomass‐burning period to the onset of the wet season,J. Geophys. Res., 112, D01201, doi:10.1029/2005JD006741.
Garreaud, R. D., and J. M. Wallace (1998), Summertime incursionsof midlatitude air into subtropical and tropical South America,Mon. Weather Rev., 126, 2713–2733, doi:10.1175/1520-0493(1998)126<2713:SIOMAI>2.0.CO;2.
Gerab, F., P. Artaxo, R. Gillett, and G. Ayers (1998), PIXE, PIGEand ion chromatography of aerosol particles from northeast Am-azon Basin, Nucl. Instrum. Methods Phys. Res., 137, 955–960.
Giglio, L., I. Csiszar, and C. O. Justice (2006), Global distributionand seasonality of active fires as observed with the Terra andAqua MODIS sensors, J. Geophys. Res., 111, G02016,doi:10.1029/2005JG000142.
Gilbert, G. S. (2005), Nocturnal fungi: Airborne spores in the can-opy and understory of a tropical rain forest, Biotropica, 37,462–464, doi:10.1111/j.1744-7429.2005.00061.x.
Goldstein, A. H., and I. E. Galbally (2007), Known and unexploredorganic constituents in the Earth’s atmosphere, Environ. Sci.Technol., 41, 1514–1521, doi:10.1021/es072476p.
Graham, B., O. L. Mayol‐Bracero, P. Guyon, G. C. Roberts,S. Decesari, M. C. Facchini, P. Artaxo, W. Maenhaut, P. Koll,and M. O. Andreae (2002), Water‐soluble organic compoundsin biomass burning aerosols over Amazonia: 1. Characterizationby NMR and GC‐MS, J. Geophys. Res., 107(D20), 8047,doi:10.1029/2001JD000336.
Graham, B., et al. (2003a), Composition and diurnal variability ofthe natural Amazonian aerosol, J. Geophys. Res., 108(D24),4765, doi:10.1029/2003JD004049.
Graham, B., P. Guyon, P. E. Taylor, P. Artaxo, W. Maenhaut,M. M. Glovsky, R. C. Flagan, and M. O. Andreae (2003b),Organic compounds present in the natural Amazonian aerosol:Characterization by gas chromatography–mass spectrometry,J. Geophys. Res., 108(D24), 4766, doi:10.1029/2003JD003990.
Griffin, D. W. (2008), Non‐spore forming eubacteria isolated atan altitude of 20,000 m in Earth’s atmosphere: Extended incu-bation periods needed for culture‐based assays, Aerobiologia,24, 19–25, doi:10.1007/s10453-007-9078-7.
Griffin, D. W., D. L. Westphal, and M. A. Gray (2006), Airbornemicroorganisms in the African desert dust corridor over the mid‐Atlantic ridge, Ocean Drilling Program, Leg 209, Aerobiologia,22, 211–226, doi:10.1007/s10453-006-9033-z.
Guenther, A., et al. (1995), A global model of natural volatileorganic compound emissions, J. Geophys. Res., 100, 8873–8892, doi:10.1029/94JD02950.
Guenther, A., T. Karl, P. Harley, C. Wiedinmyer, P. I. Palmer, andC. Geron (2006), Estimates of global terrestrial isoprene emis-sions using MEGAN (Model of Emissions of Gases and Aero-sols from Nature), Atmos. Chem. Phys., 6, 3181–3210.
Gunthe, S. S., et al. (2009), Cloud condensation nuclei in pristinetropical rainforest air of Amazonia: Size‐resolved measurementsand modeling of atmospheric aerosol composition and CCNactivity, Atmos. Chem. Phys., 9, 7551–7575.
Guyon, P., O. Boucher, B. Graham, J. Beck, O. L. Mayol‐Bracero,G. C. Roberts, W. Maenhaut, P. Artaxo, and M. O. Andreae(2003a), Refractive index of aerosol particles over the Amazontropical forest during LBA‐EUSTACH 1999, J. Aerosol Sci.,34, 883–907, doi:10.1016/S0021-8502(03)00052-1.
Guyon, P., B. Graham, J. Beck, O. Boucher, E. Gerasopoulos,O. L. Mayol‐Bracero, G. C. Roberts, P. Artaxo, andM. O. Andreae(2003b), Physical properties and concentration of aerosol parti-cles over the Amazon tropical forest during background and bio-mass burning conditions, Atmos. Chem. Phys., 3, 951–967.
Guyon, P., B. Graham, G. C. Roberts, O. L. Mayol‐Bracero,W. Maenhaut, P. Artaxo, and M. O. Andreae (2003c), In‐canopygradients, composition, sources, and optical properties of aerosolover the Amazon forest, J. Geophys. Res., 108(D18), 4591,doi:10.1029/2003JD003465.
Martin et al.: AMAZONIAN AEROSOL PARTICLES RG2002RG2002
37 of 42
Guyon, P., et al. (2005), Airborne measurements of trace gas andaerosol particle emissions from biomass burning in Amazonia,Atmos. Chem. Phys., 5, 2989–3002.
Harley, P., et al. (2004), Variation in potential for isoprene emis-sions among Neotropical forest sites, Global Change Biol., 10,630–650, doi:10.1111/j.1529-8817.2003.00760.x.
Harriss, R. C., et al. (1988), The Amazon Boundary Layer Exper-iment (ABLE‐2A): Dry season 1985, J. Geophys. Res., 93,1351–1360, doi:10.1029/JD093iD02p01351.
Harriss, R. C., et al. (1990), The Amazon Boundary Layer Exper-iment: Wet season 1987, J. Geophys. Res., 95, 16,721–16,736,doi:10.1029/JD095iD10p16721.
Heald, C. L., et al. (2008), Predicted change in global secondaryorganic aerosol concentrations in response to future climate,emissions, and land use change, J. Geophys. Res., 113,D05211, doi:10.1029/2007JD009092.
Henze, D. K., and J. H. Seinfeld (2006), Global secondary organicaerosol from isoprene oxidation, Geophys. Res. Lett., 33,L09812, doi:10.1029/2006GL025976.
Hines, P. J. (2006), The invisible bouquet—Introduction, Science,311, 803–803, doi:10.1126/science.311.5762.803.
Hoffer, A., A. Gelencser, M. Blazso, P. Guyon, P. Artaxo, andM. O. Andreae (2006), Diel and seasonal variations in the chem-ical composition of biomass burning aerosol, Atmos. Chem.Phys., 6, 3505–3515.
Holzinger, R., A. Lee, K. T. Paw, and A. H. Goldstein (2005), Ob-servations of oxidation products above a forest imply biogenicemissions of very reactive compounds, Atmos. Chem. Phys., 5,67–75.
Hoppel, W. A., G. M. Frick, and R. E. Larson (1986), Effects ofnon‐precipitating clouds on the aerosol size distribution in themarine boundary layer, Geophys. Res. Lett., 13, 125–128,doi:10.1029/GL013i002p00125.
Hoppel, W. A., G. M. Frick, J. W. Fitzgerald, and R. E. Larson(1994), Marine boundary layer measurements of new particleformation and the effects of nonprecipitating clouds on the aero-sol size distribution, J. Geophys. Res., 99, 14,443–14,459,doi:10.1029/94JD00797.
Hörrak, U., H. Iher, A. Luts, J. Salm, and H. Tammet (1994),Mobility spectrum of air ions at Tahkuse Observatory, J. Geo-phys. Res., 99, 10,697–10,700, doi:10.1029/93JD02291.
Hoyle, C. R., T. Berntsen, G. Myhre, and I. S. A. Isaksen (2007),Secondary organic aerosol in the global aerosol—Chemicaltransport model Oslo CTM2, Atmos. Chem. Phys., 7, 5675–5694.
Ignotti, E., J. Valente, S. Hacon, K. Longo, and S. Freitas (2007),Proportional mortality due to respiratory diseases (RD) and expo-sure to PM2.5 in Amazon region, Epidemiology, 18, S94–S94.
Iida, K., M. R. Stolzenburg, P. H. McMurry, and J. N. Smith (2008),Estimating nanoparticle growth rates from size‐dependentcharged fractions: Analysis of new particle formation events inMexico City, J. Geophys. Res., 113, D05207, doi:10.1029/2007JD009260.
Intergovernmental Panel on Climate Change (2007), ClimateChange 2007: The Physical Science Basis—Contribution ofWorking Group I to the Fourth Assessment Report of the Inter-governmental Panel on Climate Change, edited by S. Solomonet al., 996 pp., Cambridge Univ. Press, Cambridge, U. K.
Jacob, D. J., and S. C. Wofsy (1988), Photochemistry of biogenicemissions over the Amazon forest, J. Geophys. Res., 93, 1477–1486, doi:10.1029/JD093iD02p01477.
Jacob, D. J., and S. C. Wofsy (1990), Budgets of reactive nitrogen,hydrocarbons, and ozone over the Amazon forest during the wetseason, J. Geophys. Res., 95, 16,737–16,754, doi:10.1029/JD095iD10p16737.
Jacobson, M. C., H.‐C. Hansson, K. J. Noone, and R. J. Charlson(2000), Organic atmospheric aerosols: Review and state ofthe science, Rev. Geophys., 38, 267–294, doi:10.1029/1998RG000045.
Jaenicke, R. (2005), Abundance of cellular material and proteins inthe atmosphere, Science, 308, 73, doi:10.1126/science.1106335.
Jayne, J. T., D. C. Leard, X. F. Zhang, P. Davidovits, K. A. Smith,C. E. Kolb, and D. R. Worsnop (2000), Development of an aero-sol mass spectrometer for size and composition analysis of sub-micron particles, Aerosol Sci. Technol., 33, 49–70, doi:10.1080/027868200410840.
Jiang, H. L., and G. Feingold (2006), Effect of aerosol on warmconvective clouds: Aerosol‐cloud‐surface flux feedbacks in anew coupled large eddy model, J. Geophys. Res., 111 ,D01202, doi:10.1029/2005JD006138.
Jones, C., and L. M. V. Carvalho (2002), Active and break phasesin the South American monsoon system, J. Clim., 15, 905–914,doi:10.1175/1520-0442(2002)015<0905:AABPIT>2.0.CO;2.
Kalnay, E., et al. (1996), The NCEP/NCAR 40‐year reanalysisproject, Bull. Am. Meteorol. Soc., 77, 437–471, doi:10.1175/1520-0477(1996)077<0437:TNYRP>2.0.CO;2.
Kanakidou, M., et al. (2005), Organic aerosol and global climatemodelling: A review, Atmos. Chem. Phys., 5, 1053–1123.
Karl, T., A. Guenther, R. J. Yokelson, J. Greenberg, M. Potosnak,D. R. Blake, and P. Artaxo (2007), The tropical forest and fireemissions experiment: Emission, chemistry, and transport of bio-genic volatile organic compounds in the lower atmosphere overAmazonia, J. Geophys. Res., 112, D18302, doi:10.1029/2007JD008539.
Karl, T., A. Guenther, A. Turnipseed, P. Artaxo, and S. Martin(2009), Rapid formation of isoprene photo‐oxidation productsobserved in Amazonia, Atmos. Chem. Phys., 9, 7753–7767.
Kaufman, Y. J., et al. (1998), Smoke, Clouds, and Radiation–Brazil (SCAR‐B) experiment, J. Geophys. Res., 103, 31,783–31,808, doi:10.1029/98JD02281.
Keller, M., M. Bustamante, J. Gash, and P. Dias (Eds.) (2009),Amazonia and Global Change, Geophys. Monogr. Ser.,vol. 186, AGU, Washington, D. C.
Kerminen, V. M., and M. Kulmala (2002), Analytical formulaeconnecting the “real” and the “apparent” nucleation rate andthe nuclei number concentration for atmospheric nucleationevents, J. Aerosol Sci., 33, 609–622, doi:10.1016/S0021-8502(01)00194-X.
Kesselmeier, J., et al. (2000), Atmospheric volatile organic com-pounds (VOC) at a remote tropical forest site in central Amazo-nia, Atmos. Environ., 34, 4063–4072, doi:10.1016/S1352-2310(00)00186-2.
Kesselmeier, J., A. Guenther, T. Hoffmann, M. T. Piedade, andJ. Warnke (2009), Natural volatile organic compound emis-sions from plants and their roles in oxidant balance and parti-cle formation, in Amazonia and Global Change, Geophys.Monogr. Ser., vol. 186, edited by M. Keller et al., pp. 183–206, AGU, Washington, D. C.
King, S. M., T. Rosenoern, J. E. Shilling, Q. Chen, and S. T. Martin(2007), Cloud condensation nucleus activity of secondary organicaerosol particles mixed with sulfate, Geophys. Res. Lett., 34,L24806, doi:10.1029/2007GL030390.
King, S. M., T. Rosenoern, J. E. Shilling, Q. Chen, and S. T. Martin(2009), Increased cloud activation potential of secondary organicaerosol for atmospheric mass loadings, Atmos. Chem. Phys., 9,2959–2972.
Kinne, S., et al. (2003), Monthly averages of aerosol properties: Aglobal comparison among models, satellite data, and AERONETground data, J. Geophys. Res., 108(D20), 4634, doi:10.1029/2001JD001253.
Kinne, S., et al. (2006), An AeroCom initial assessment—Opticalproperties in aerosol component modules of global models,Atmos. Chem. Phys., 6, 1815–1834.
Kodama, Y. (1992), Large‐scale common features of subtropicalprecipitation zones (the Baiu frontal zone, the SPCZ, and theSACZ). 1. Characteristics of subtropical frontal zones, J. Meteorol.Soc. Jpn., 70, 813–836.
Martin et al.: AMAZONIAN AEROSOL PARTICLES RG2002RG2002
38 of 42

Komppula, M., S. L. Sihto, H. Korhonen, H. Lihavainen, V. M.Kerminen, M. Kulmala, and Y. Viisanen (2006), New particleformation in air mass transported between two measurement sitesin northern Finland, Atmos. Chem. Phys., 6, 2811–2824.
Koren, I., Y. J. Kaufman, L. A. Remer, and J. V. Martins (2004),Measurement of the effect of Amazon smoke on inhibitionof cloud formation, Science, 303, 1342–1345, doi:10.1126/science.1089424.
Koren, I., Y. J. Kaufman, D. Rosenfeld, L. A. Remer, and Y. Rudich(2005), Aerosol invigoration and restructuring of Atlantic convec-tive clouds, Geophys. Res. Lett., 32, L14828, doi:10.1029/2005GL023187.
Krejci, R., J. Strom, M. de Reus, P. Hoor, J. Williams, H. Fischer,and H. C. Hansson (2003), Evolution of aerosol properties overthe rain forest in Surinam, South America, observed from aircraftduring the LBA‐CLAIRE 98 experiment, J. Geophys. Res., 108(D18), 4561, doi:10.1029/2001JD001375.
Krejci, R., J. Strom, M. de Reus, J. Williams, H. Fischer, M. O.Andreae, and H. C. Hansson (2005), Spatial and temporal distri-bution of atmospheric aerosols in the lowermost troposphereover the Amazonian tropical rainforest, Atmos. Chem. Phys., 5,1527–1543.
Kuang, C., P. H. McMurry, A. V. McCormick, and F. L. Eisele(2008), Dependence of nucleation rates on sulfuric acid vaporconcentrations in diverse atmospheric locations, J. Geophys.Res., 113, D10209, doi:10.1029/2007JD009253.
Kuhn, U., et al. (2007), Isoprene and monoterpene fluxes fromCentral Amazonian rainforest inferred from tower‐based andairborne measurements, and implications on the atmosphericchemistry and the local carbon budget, Atmos. Chem. Phys.,7, 2855–2879.
Kulmala, M., H. Vehkamaki, T. Petaja, M. Dal Maso, A. Lauri,V. M. Kerminen, W. Birmili, and P. H. McMurry (2004), Forma-tion and growth rates of ultrafine atmospheric particles: A reviewof observations, J. Aerosol Sci., 35, 143–176, doi:10.1016/j.jaerosci.2003.10.003.
Laakso, L., et al. (2007), Hot‐air balloon as a platform for bound-ary layer profile measurements during particle formation, BorealEnviron. Res., 12, 279–294.
Laaksonen, A., et al. (2008), The role of VOC oxidation productsin continental new particle formation, Atmos. Chem. Phys., 8,2657–2665.
Laurance, W. F., and G. B. Williamson (2001), Positive feedbacksamong forest fragmentation, drought, and climate change in theAmazon, Conserv. Biol., 15, 1529–1535, doi:10.1046/j.1523-1739.2001.01093.x.
Laurance, W. F., M. A. Cochrane, S. Bergen, P. M. Fearnside,P. Delamonica, C. Barber, S. D’Angelo, and T. Fernandes (2001),Environment—The future of the Brazilian Amazon, Science, 291,438–439, doi:10.1126/science.291.5503.438.
Lee, A., A. H. Goldstein, J. H. Kroll, N. L. Ng, V. Varutbangkul,R. C. Flagan, and J. H. Seinfeld (2006), Gas‐phase products andsecondary aerosol yields from the photooxidation of 16 differentterpenes, J. Geophys. Res. , 111 , D17305, doi:10.1029/2006JD007050.
Lehtinen, K. E. J., M. Dal Maso, M. Kulmala, and V. M. Kerminen(2007), Estimating nucleation rates from apparent particle forma-tion rates and vice versa: Revised formulation of the Kerminen‐Kulmala equation, J. Aerosol Sci., 38, 988–994, doi:10.1016/j.jaerosci.2007.06.009.
Lelieveld, J., et al. (2008), Atmospheric oxidation capacity sus-tained by a tropical forest, Nature, 452, 737–740, doi:10.1038/nature06870.
Lewis, S. L. (2006), Tropical forests and the changing Earth sys-tem, Philos. Trans. R. Soc. London, Ser. B, 361, 195–210,doi:10.1098/rstb.2005.1711.
Lim, H.‐J., A. G. Carlton, and B. J. Turpin (2005), Isoprene formssecondary organic aerosol through cloud processing: Model
simulations, Environ. Sci. Technol. , 39 , 4441–4446,doi:10.1021/es048039h.
Liu, Y. Q. (2005), Atmospheric response and feedback to radiativeforcing from biomass burning in tropical South America, Agric.For. Meteorol., 133, 40–53, doi:10.1016/j.agrformet.2005.03.011.
Mace, K. A., P. Artaxo, and R. A. Duce (2003), Water‐solubleorganic nitrogen in Amazon Basin aerosols during the dry (bio-mass burning) and wet seasons, J. Geophys. Res., 108(D16),4512, doi:10.1029/2003JD003557.
Maenhaut, W., M. T. Fernandez‐Jimenez, I. Rajta, and P. Artaxo(2002), Two‐year study of atmospheric aerosols in Alta Floresta,Brazil: Multielemental composition and source apportionment,Nucl. Instrum. Methods Phys. Res., Sect. B, 189, 243–248,doi:10.1016/S0168-583X(01)01050-3.
Mahowald, N. M., P. Artaxo, A. R. Baker, T. D. Jickells, G. S.Okin, J. T. Randerson, and A. R. Townsend (2005), Impacts ofbiomass‐burning emissions and land use change on Amazonianatmospheric phosphorus cycling and deposition, Global Biogeo-chem. Cycles, 19, GB4030, doi:10.1029/2005GB002541.
Malhi, Y., J. T. Roberts, R. A. Betts, T. J. Killeen, W. H. Li,and C. A. Nobre (2008), Climate change, deforestation, andthe fate of the Amazon, Science, 319, 169–172, doi:10.1126/science.1146961.
Marengo, J. A., C. A. Nobre, and A. D. Culf (1997), Climaticimpacts of “friagens” in forested and deforested areas of theAmazon Bas in , J . Appl . Meteorol . , 36 , 1553–1566,doi:10.1175/1520-0450(1997)036<1553:CIOFIF>2.0.CO;2.
Marengo, J. A., C. A. Nobre, J. Tomasella, M. D. Oyama, G. S.De Oliveira, R. De Oliveira, H. Camargo, L. M. Alves, and I. F.Brown (2008), The drought of Amazonia in 2005, J. Clim., 21,495–516, doi:10.1175/2007JCLI1600.1.
Martins, F. R., and E. B. Pereira (2006), Parameterization of aerosolsfrom burning biomass in the Brazil‐SR radiative transfer model,Sol. Energy, 80, 231–239, doi:10.1016/j.solener.2005.03.008.
Mayol‐Bracero, O. L., P. Guyon, B. Graham, G. Roberts, M. O.Andreae, S. Decesari, M. C. Facchini, S. Fuzzi, and P. Artaxo(2002), Water‐soluble organic compounds in biomass burningaerosols over Amazonia: 2. Apportionment of the chemical com-position and importance of the polyacidic fraction, J. Geophys.Res., 107(D20), 8091, doi:10.1029/2001JD000522.
McFiggans, G., et al. (2006), The effect of physical and chemicalaerosol properties on warm cloud droplet activation, Atmos.Chem. Phys., 6, 2593–2649.
McMurry, P. H., and S. K. Friedlander (1979), New particle forma-tion in the presence of an aerosol, Atmos. Environ., 13, 1635–1651, doi:10.1016/0004-6981(79)90322-6.
McMurry, P. H., et al. (2005), A criterion for new particle forma-tion in the sulfur‐rich Atlanta atmosphere, J. Geophys. Res., 110,D22S02, doi:10.1029/2005JD005901.
Mircea, M., et al. (2005), Importance of the organic aerosol frac-tion for modeling aerosol hygroscopic growth and activation:A case study in the Amazon Basin, Atmos. Chem. Phys., 5,3111–3126.
Mirme, A., E. Tamm, G. Mordas, M. Vana, J. Uin, S. Mirme,T. Bernotas, L. Laakso, A. Hirsikko, and M. Kulmala (2007), Awide‐range multi‐channel air ion spectrometer, Boreal Environ.Res., 12, 247–264.
Moteki, N., Y. Kondo, Y. Miyazaki, N. Takegawa, Y. Komazaki,G. Kurata, T. Shirai, D. R. Blake, T. Miyakawa, and M. Koike(2007), Evolution of mixing state of black carbon particles: Air-craft measurements over the western Pacific in March 2004,Geophys. Res. Lett., 34, L11803, doi:10.1029/2006GL028943.
Nepstad, D. C. (2007), The Amazon’s vicious cycles: A report tothe World Wide Fund for Nature (WWF), World Wide Fund forNat., Gland, Switzerland.
Nepstad, D. C., C. M. Stickler, B. Soares, and F. Merry (2008),Interactions among Amazon land use, forests and climate:Prospects for a near‐term forest tipping point, Philos. Trans.
Martin et al.: AMAZONIAN AEROSOL PARTICLES RG2002RG2002
39 of 42
R. Soc. London, Ser. B, 363, 1737–1746, doi:10.1098/rstb.2007.0036.
Ng, N. L., J. H. Kroll, M. D. Keywood, R. Bahreini, V. Varutbangkul,R. C. Flagan, J. H. Seinfeld, A. Lee, and A. H. Goldstein (2006),Contribution of first‐ versus second‐generation products tosecondary organic aerosols formed in the oxidation of biogenichydrocarbons, Environ. Sci. Technol., 40, 2283–2297,doi:10.1021/es052269u.
Nobre, C. A., M. A. Silva Dias, A. D. Culf, J. A. Polcher, J. H. C.Gash, J. A. Marengo, and R. Avissar (2004), The Amazonian cli-mate, in Vegetation, Water, Humans and the Climate: A NewPerspective on an Interactive System, edited by P. Kabat et al.,pp. 79–92, Springer, Berlin.
Nogues‐Paegle, J., and K. C. Mo (1997), Alternating wet and dryconditions over South America during summer, Mon. WeatherRev., 125, 279–291, doi:10.1175/1520-0493(1997)125<0279:AWADCO>2.0.CO;2.
O’Dowd, C. D., M. C. Facchini, F. Cavalli, D. Ceburnis, M. Mircea,S. Decesari, S. Fuzzi, Y. J. Yoon, and J. P. Putaud (2004), Biogeni-cally driven organic contribution to marine aerosol, Nature,431, 676–680, doi:10.1038/nature02959.
Oyama, M. D., and C. A. Nobre (2003), A new climate‐vegetationequilibrium state for tropical South America, Geophys. Res. Lett.,30(23), 2199, doi:10.1029/2003GL018600.
Palmer, P. I., D. J. Jacob, A. M. Fiore, R. V. Martin, K. Chance,and T. P. Kurosu (2003), Mapping isoprene emissions overNorth America using formaldehyde column observations fromspace, J. Geophys. Res. , 108(D6), 4180, doi:10.1029/2002JD002153.
Palmer, P. I., M. P. Barkley, T. P. Kurosu, A. C. Lewis, J. E.Saxton, K. Chance, and L. V. Gatti (2007), Interpreting satellitecolumn observations of formaldehyde over tropical SouthAmerica, Philos. Trans. R. Soc. A , 365 , 1741–1751,doi:10.1098/rsta.2007.2042.
Pauliquevis, T., L. L. Lara, M. L. Antunes, and P. Artaxo (2007),Aerosol and precipitation chemistry in a remote site in CentralAmazonia: The role of biogenic contribution, Atmos. Chem.Phys. Discuss., 7, 11,465–11,509.
Penner, J. E., S. J. Ghan, and J. J. Walton (1991), The role of bio-mass burning in the budget and cycle of carbonaceous soot aero-sols and their climate impact, in Global Biomass Burning, editedby J. Levine, pp. 432–438, MIT Press, Cambridge, Mass.
Perry, K. D., and P. V. Hobbs (1994), Further evidence for par-ticle nucleation in clear air adjacent to marine cumulus clouds,J. Geophys. Res., 99, 22,803–22,818, doi:10.1029/94JD01926.
Platnick, S., and S. Twomey (1994), Determining the susceptibilityof cloud albedo to changes in droplet concentration with theadvanced very high‐resolution radiometer, J. Appl. Meteorol., 33,334–347, doi:10.1175/1520-0450(1994)033<0334:DTSOCA>2.0.CO;2.
Pope, C. A., and D. W. Dockery (2006), Health effects of fine par-ticulate air pollution: Lines that connect, J. Air Waste Manage.Assoc., 56, 709–742.
Pöschl, U. (2005), Atmospheric aerosols: Composition, transfor-mation, climate and health effects, Angew. Chem., 44, 7520–7540, doi:10.1002/anie.200501122.
Posfai, M., R. Simonics, J. Li, P. V. Hobbs, and P. R. Buseck(2003), Individual aerosol particles from biomass burning insouthern Africa: 1. Compositions and size distributions of carbo-naceous particles, J. Geophys. Res., 108(D13), 8483, doi:10.1029/2002JD002291.
Posfai, M., A. Gelencser, R. Simonics, K. Arato, J. Li, P. V.Hobbs, and P. R. Buseck (2004), Atmospheric tar balls: Particlesfrom biomass and biofuel burning, J. Geophys. Res., 109,D06213, doi:10.1029/2003JD004169.
Prather, K. A., T. Nordmeyer, and K. Salt (1994), Real‐time char-acterization of individual aerosol‐particles using time‐of‐flightmass‐spectrometry, Anal. Chem., 66, 1403–1407, doi:10.1021/ac00081a007.
Prenni, A. J., M. D. Petters, S. M. Kreidenweis, and P. J. DeMott(2007), Cloud droplet activation of secondary organic aerosol,J. Geophys. Res., 112, D10223, doi:10.1029/2006JD007963.
Prenni, A. J., M. D. Petters, S. M. Kreidenweis, C. L. Heald, S. T.Martin, P. Artaxo, R. M. Garland, A. G. Wollny, and U. Poeschl(2009), Relative roles of biogenic emissions and Saharan dust asice nuclei in the Amazon Basin, Nat. Geosci., 2, 402–405,doi:10.1038/ngeo517.
Prospero, J. M., R. A. Glaccum, and R. T. Nees (1981), Atmo-spheric transport of soil dust from Africa to South America,Nature, 289, 570–572, doi:10.1038/289570a0.
Rasmussen, R. A., and M. A. K. Khalil (1988), Isoprene over theAmazon Basin, J. Geophys. Res., 93, 1417–1421, doi:10.1029/JD093iD02p01417.
Reid, J. S., R. Koppmann, T. F. Eck, and D. P. Eleuterio (2005), Areview of biomass‐burning emissions part II: Intensive physicalproperties of biomass‐burning particles, Atmos. Chem. Phys.,5, 799–825.
Reinhardt, T. E., R. D. Ottmar, and C. Castilla (2001), Smoke im-pacts from agricultural burning in a rural Brazilian town, J. AirWaste Manage. Assoc., 51, 443–450.
Riipinen, I., et al. (2007), Connections between atmospheric sul-phuric acid and new particle formation during QUEST III–IVcampaigns in Hyytiala and Heidelberg, Atmos. Phys. Chem., 7,1899–1914.
Rissler, J., E. Swietlicki, J. Zhou, G. Roberts, M. O. Andreae, L. V.Gatti, and P. Artaxo (2004), Physical properties of the sub‐micrometer aerosol over the Amazon rain forest during the wet‐to‐dry season transition—Comparison of modeled and measuredCCN concentrations, Atmos. Chem. Phys., 4, 2119–2143.
Rissler, J., A. Vestin, E. Swietlicki, G. Fisch, J. Zhou, P. Artaxo,and M. O. Andreae (2006), Size distribution and hygroscopicproperties of aerosol particles from dry‐season biomass burningin Amazonia, Atmos. Chem. Phys., 6, 471–491.
Roberts, G. C., and A. Nenes (2005), A continuous‐flow stream-wise thermal‐gradient CCN chamber for atmospheric measure-ments, Aerosol Sci. Technol., 39, 206–221, doi:10.1080/027868290913988.
Roberts, G. C., M. O. Andreae, J. C. Zhou, and P. Artaxo (2001),Cloud condensation nuclei in the Amazon Basin: “Marine” con-ditions over a continent?, Geophys. Res. Lett., 28, 2807–2810,doi:10.1029/2000GL012585.
Roberts, G. C., P. Artaxo, J. C. Zhou, E. Swietlicki, and M. O.Andreae (2002), Sensitivity of CCN spectra on chemical andphysical properties of aerosol: A case study from the Amazon Ba-s in , J. Geophys . Res . , 107 (D20) , 8070, doi :10.1029/2001JD000583.
Roberts, G., A. Nenes, J. Seinfeld, and M. Andreae (2003), Impactof biomass burning on cloud properties in the Amazon Basin,J. Geophys. Res., 108(D2), 4062, doi:10.1029/2001JD000985.
Rosenfeld, D., U. Lohmann, G.B. Raga, C.D.O’Dowd,M.Kulmala,S. Fuzzi, A. Reissell, andM. O. Andreae (2008), Flood or drought:How do aerosols affect precipitation?, Science, 321, 1309–1313,doi:10.1126/science.1160606.
Sachse, G. W., R. C. Harriss, J. Fishman, G. F. Hill, and D. R.Cahoon (1988), Carbon‐monoxide over the Amazon Basin duringthe 1985 dry season, J. Geophys. Res., 93 , 1422–1430,doi:10.1029/JD093iD02p01422.
Saleska, S. R., K. Didan, A. R. Huete, and H. R. da Rocha (2007),Amazon forests green‐up during 2005 drought, Science, 318,612, doi:10.1126/science.1146663.
Satyamurty, P., C. A. Nobre, and P. S. Dias (1998), South America,in Meteorology of the Southern Hemisphere, edited by D. Karolyand D. G. Vincent, Meteorol. Monogr., 27, 119–139.
Schafer, J. S., T. F. Eck, B. N. Holben, P. Artaxo, and A. F. Duarte(2008), Characterization of the optical properties of atmosphericaerosols in Amazonia from long‐term AERONET monitoring(1993–1995 and 1999–2006), J. Geophys. Res., 113, D04204,doi:10.1029/2007JD009319.
Martin et al.: AMAZONIAN AEROSOL PARTICLES RG2002RG2002
40 of 42

Schkolnik, G., A. H. Falkovich, Y. Rudich, W. Maenhaut, andP. Artaxo (2005), New analytical method for the determination oflevoglucosan, polyhydroxy compounds, and 2‐methylerythritoland its application to smoke and rainwater samples, Environ.Sci. Technol., 39, 2744–2752, doi:10.1021/es048363c.
Schwartz, J., F. Laden, and A. Zanobetti (2002), The concentration‐response relation between PM2.5 and daily deaths, Environ.Health Perspect., 110, 1025–1029.
Schwarz, J. P., et al. (2006), Single‐particle measurements of mid-latitude black carbon and light‐scattering aerosols from theboundary layer to the lower stratosphere, J. Geophys. Res.,111, D16207, doi:10.1029/2006JD007076.
Shilling, J. E., Q. Chen, S. M. King, T. Rosenoern, J. H. Kroll,D. R. Worsnop, K. A. McKinney, and S. T. Martin (2008), Par-ticle mass yield in secondary organic aerosol formed by the darkozonolysis of alpha‐pinene, Atmos. Chem. Phys., 8, 2073–2088.
Shim, C., Y. H. Wang, Y. Choi, P. I. Palmer, D. S. Abbot, andK. Chance (2005), Constraining global isoprene emissions withGlobal Ozone Monitoring Experiment (GOME) formaldehydecolumn measurements, J. Geophys. Res., 110, D24301,doi:10.1029/2004JD005629.
Silva Dias, M. A. F., et al. (2002), Cloud and rain processes in abiosphere‐atmosphere interaction context in the Amazon region,J. Geophys. Res., 107(D20), 8072, doi:10.1029/2001JD000335.
Sinha, B. W., et al. (2009), Composition and mixing state of wetseason fine mode aerosol collected in the Amazonian tropicalrain forest, paper presented at General Assembly, Eur. Geosci.Union, Manaus, Brazil.
Smith, J.N.,M. J.Dunn, T.M.VanReken, K. Iida,M. R. Stolzenburg,P. H. McMurry, and L. G. Huey (2008), Chemical composition ofatmospheric nanoparticles formed from nucleation in Tecamac,Mexico: Evidence for an important role for organic speciesin nanoparticle growth, Geophys. Res. Lett., 35, L04808,doi:10.1029/2007GL032523.
Soares‐Filho, B. S., D. C. Nepstad, L. M. Curran, G. C. Cerqueira,R. A. Garcia, C. A. Ramos, E. Voll, A. McDonald, P. Lefebvre,and P. Schlesinger (2006), Modelling conservation in the Ama-zon Basin, Nature, 440, 520–523, doi:10.1038/nature04389.
Solomon, P. A., and C. Sioutas (2008), Continuous and semicon-tinuous monitoring techniques for particulate matter mass andchemical components: A synthesis of findings from EPA’sparticulate matter supersites program and related studies,J. Air Waste Manage. Assoc., 58, 164–195, doi:10.3155/1047-3289.58.2.164.
Spracklen, D. V., K. J. Pringle, K. S. Carslaw, M. P. Chipperfield,and G. W. Mann (2005), A global off‐line model of size‐resolved aerosol microphysics: I. Model development and pre-diction of aerosol properties, Atmos. Chem. Phys., 5, 2227–2252.
Spracklen, D. V., K. S. Carslaw, M. Kulmala, V. M. Kerminen,G. W.Mann, and S. L. Sihto (2006), The contribution of boundarylayer nucleation events to total particle concentrations on regionaland global scales, Atmos. Chem. Phys., 6, 5631–5648.
Stanier, C. O., A. Y. Khlystov, and S. N. Pandis (2004), Nucle-ation events during the Pittsburgh air quality study: Descriptionand relation to key meteorological, gas phase, and aerosolparameters, Aerosol Sci. Technol., 38, 253–264, doi:10.1080/02786820390229570.
Stavrakou, T., J.‐F. Muller, I. D. Smedt, M. V. Roozendael, G. R.van der Werf, L. Giglio, and A. Guenther (2009), Global emis-sions of non‐methane hydrocarbons deduced from SCIAMACHYformaldehyde columns through 2003–2006, Atmos. Chem. Phys.,9, 3663–3679.
Stolzenburg, M. R., P. H. McMurry, H. Sakurai, J. N. Smith, R. L.Mauldin, F. L. Eisele, and C. F. Clement (2005), Growth rates offreshly nucleated atmospheric particles in Atlanta, J. Geophys.Res., 110, D22S05, doi:10.1029/2005JD005935.
Stratmann, F., et al. (2003), New‐particle formation events in acontinental boundary layer: First results from the SATURN ex-periment, Atmos. Chem. Phys., 3, 1445–1459.
Streets, D. G. (2007), Dissecting future aerosol emissions: Warm-ing tendencies and mitigation opportunities, Clim. Change, 81,313–330, doi:10.1007/s10584-006-9112-8.
Suni, T., et al. (2008), Formation and characteristics of ions andcharged aerosol particles in a native Australian Eucalypt forest,Atmos. Chem. Phys., 8, 129–139.
Surratt, J. D., et al. (2008), Organosulfate formation in biogenicsecondary organic aerosol, J. Phys. Chem. A, 112, 8345–8378,doi:10.1021/jp802310p.
Svenningsson, B., et al. (2006), Hygroscopic growth and criticalsupersaturations for mixed aerosol particles of inorganic and or-ganic compounds of atmospheric relevance, Atmos. Chem. Phys.,6, 1937–1952.
Swap, R., M. Garstang, S. Greco, R. Talbot, and P. Kållberg(1992), Saharan dust in the Amazon Basin, Tellus, Ser. B, 44,133–149.
Swietlicki, E., et al. (2008), Hygroscopic properties of submicrom-eter atmospheric aerosol particles measuredwith H‐TDMA instru-ments in various environments—A review, Tellus, Ser. B, 60,432–469.
Talbot, R. W., M. O. Andreae, T. W. Andreae, and R. C. Harriss(1988), Regional aerosol chemistry of the Amazon Basin duringthe dry season, J. Geophys. Res., 93, 1499–1508, doi:10.1029/JD093iD02p01499.
Talbot, R.W.,M.O.Andreae, H.Berresheim, P.Artaxo,M.Garstang,R. C. Harriss, K. M. Beecher, and S. M. Li (1990), Aerosol chem-istry during the wet season in central Amazonia: The influence oflong‐range transport, J. Geophys. Res., 95, 16,955–16,969,doi:10.1029/JD095iD10p16955.
Tegen, I., P. Hollrig, M. Chin, I. Fung, D. Jacob, and J. Penner(1997), Contribution of different aerosol species to the globalaerosol extinction optical thickness: Estimates frommodel results,J. Geophys. Res., 102, 23,895–23,915, doi:10.1029/97JD01864.
Textor, C., et al. (2006), Analysis and quantification of the diver-sities of aerosol life cycles within AeroCom, Atmos. Chem.Phys., 6, 1777–1813.
Tie, X. X., S. Madronich, S. Walters, D. P. Edwards, P. Ginoux,N. Mahowald, R. Y. Zhang, C. Lou, and G. Brasseur (2005),Assessment of the global impact of aerosols on troposphericoxidants, J. Geophys. Res., 110, D03204, doi:10.1029/2004JD005359.
Trebs, I., F. X. Meixner, J. Slanina, R. Otjes, P. Jongejan, andM. O. Andreae (2004), Real‐time measurements of ammonia,acidic trace gases and water‐soluble inorganic aerosol speciesat a rural site in the Amazon Basin, Atmos. Chem. Phys., 4,967–987.
Trebs, I., et al. (2005), The NH4+NO3
−‐Cl−‐SO42−‐H2O aerosol sys-
tem and its gas phase precursors at a pasture site in the AmazonBasin: How relevant are mineral cations and soluble organicacids?, J. Geophys. Res. , 110 , D07303, doi:10.1029/2004JD005478.
Trebs, I., et al. (2008), Aerosol inorganic composition at a tropicalsite: Discrepancies between filter‐based sampling and a semi‐continuous method, Aerosol Sci. Technol., 42, 255–269,doi:10.1080/02786820801992899.
Tsigaridis, K., and M. Kanakidou (2003), Global modelling of sec-ondary organic aerosol in the troposphere: A sensitivity analysis,Atmos. Chem. Phys., 3, 1849–1869.
Twomey, S. (1977), The influence of pollution on the short‐wavealbedo of clouds, J. Atmos. Sci., 34, 1149–1152, doi:10.1175/1520-0469(1977)034<1149:TIOPOT>2.0.CO;2.
Vana, M., M. Kulmala, M. Dal Maso, U. Horrak, and E. Tamm(2004), Comparative study of nucleation mode aerosol particlesand intermediate air ions formation events at three sites, J. Geo-phys. Res., 109, D17201, doi:10.1029/2003JD004413.
Vestin, A., J. Rissler, E. Swietlicki, G. P. Frank, and M. O. Andreae(2007), Cloud‐nucleating properties of the Amazonian biomassburning aerosol: Cloud condensation nuclei measurements and
Martin et al.: AMAZONIAN AEROSOL PARTICLES RG2002RG2002
41 of 42
modeling, J. Geophys. Res., 112, D14201, doi:10.1029/2006JD008104.
Volkamer, R., F. S. Martini, L. T. Molina, D. Salcedo, J. L. Jimenez,and M. J. Molina (2007), A missing sink for gas‐phase glyoxal inMexico City: Formation of secondary organic aerosol, Geophys.Res. Lett., 34, L19807, doi:10.1029/2007GL030752.
Wang, H., and R. Fu (2002), Cross‐equatorial flow and seasonalcycle of precipitation over South America, J. Clim., 15, 1591–1608, doi:10.1175/1520-0442(2002)015<1591:CEFASC>2.0.CO;2.
Watson, J. G. (2002), Visibility: Science and regulation, J. AirWaste Manage. Assoc., 52, 628–713.
Went, F. W. (1960), Blue hazes in the atmosphere, Nature, 187,641–643, doi:10.1038/187641a0.
Williams, E., et al. (2002), Contrasting convective regimes over theAmazon: Implications for cloud electrification, J. Geophys. Res.,107(D20), 8082, doi:10.1029/2001JD000380.
Worobiec, A., I. Szaloki, J. Osan, W. Maenhaut, E. A. Stefaniak,and R. Van Grieken (2007), Characterisation of Amazon Basinaerosols at the individual particle level by X‐ray microanalyticaltechniques, Atmos. Environ., 41, 9217–9230, doi:10.1016/j.atmosenv.2007.07.056.
Yamasoe, M. A., P. Artaxo, A. H. Miguel, and A. G. Allen (2000),Chemical composition of aerosol particles from direct emissionsof vegetation fires in the Amazon Basin: Water‐soluble speciesand trace elements, Atmos. Environ. , 34 , 1641–1653,doi:10.1016/S1352-2310(99)00329-5.
Yin, Y., Z. Levin, T. G. Reisin, and S. Tzivion (2000), The effectsof giant cloud condensation nuclei on the development of precip-itation in convective clouds—A numerical study, Atmos. Res.,53, 91–116, doi:10.1016/S0169-8095(99)00046-0.
Yokelson, R. J., T. Karl, P. Artaxo, D. R. Blake, T. J. Christian,D. W. T. Griffith, A. Guenther, and W. M. Hao (2007), TheTropical Forest and Fire Emissions Experiment: Overview andairborne fire emission factor measurements, Atmos. Chem. Phys.,7, 5175–5196.
Yokelson, R. J., T. J. Christian, T. G. Karl, and A. Guenther(2008), The tropical forest and fire emissions experiment: Labo-ratory fire measurements and synthesis of campaign data, Atmos.Chem. Phys., 8, 3509–3527.
Yu, F., Z. Wang, G. Luo, and R. Turco (2008), Ion‐mediatednucleation as an important global source of tropospheric aero-sols, Atmos. Chem. Phys., 8, 2537–2554.
Zdrahal, Z., J. Oliveira, R. Vermeylen, M. Claeys, andW.Maenhaut(2002), Improved method for quantifying levoglucosan andrelated monosaccharide anhydrides in atmospheric aerosols andapplication to samples from urban and tropical locations, Envi-ron. Sci. Technol., 36, 747–753, doi:10.1021/es015619v.
Zhang, Y., R. Fu, H. B. Yu, Y. Qian, R. Dickinson, M. Dias, P. L.D. Dias, and K. Fernandes (2009), Impact of biomass burningaerosol on the monsoon circulation transition over Amazonia,Geophys. Res. Lett., 36, L10814, doi:10.1029/2009GL037180.
Zhou, J. C., E. Swietlicki, H. C. Hansson, and P. Artaxo (2002),Submicrometer aerosol particle size distribution and hygroscopicgrowth measured in the Amazon rain forest during the wet season,J. Geophys. Res., 107(D20), 8055, doi:10.1029/2000JD000203.
Zhou, J. Y., and K. M. Lau (1998), Does a monsoon climate existover South America?, J. Clim., 11, 1020–1040, doi:10.1175/1520-0442(1998)011<1020:DAMCEO>2.0.CO;2.
Ziese, M., H. Wex, E. Nilsson, I. Salma, R. Ocskay, T. Hennig,A. Massling, and F. Stratmann (2008), Hygroscopic growth andactivation of HULIS particles: Experimental data and a newiterative parameterization scheme for complex aerosol particles,Atmos. Chem. Phys., 8, 1855–1866.
Zimmerman, P. R., J. P. Greenberg, and C. E. Westberg (1988),Measurements of atmospheric hydrocarbons and biogenic emis-sion fluxes in the Amazon boundary layer, J. Geophys. Res.,93, 1407–1416, doi:10.1029/JD093iD02p01407.
M. O. Andreae, U. Pöschl, and I. Trebs, BiogeochemistryDepartment, Max Planck Institute for Chemistry, D‐55128 Mainz,Germany.P. Artaxo, Institute of Physics, University of São Paulo, 05315‐970
São Paulo, Brazil.D. Baumgardner, Centro de Ciencias de la Atmosfera, Universidad
Nacional Autonoma de Mexico, 04510 Mexico City, Mexico.Q. Chen and S. T. Martin, School of Engineering and Applied
Sciences, Harvard University, Cambridge, MA 02138, USA.([email protected])A. H. Goldstein, Department of Environmental Science, Policy, and
Management, University of California, Berkeley, CA 94720, USA.A. Guenther, Biosphere‐Atmosphere Interactions Group,
Atmospheric Chemistry Division, National Center for AtmosphericResearch, 1850 Table Mesa Dr., Boulder, CO 80307, USA.C. L. Heald, Department of Atmospheric Science, Colorado State
University, Fort Collins, CO 80523, USA.O. L. Mayol‐Bracero, Institute for Tropical Ecosystem Studies,
University of Puerto Rico, San Juan, PR 00936, Puerto Rico.P. H. McMurry, Department of Mechanical Engineering, University
of Minnesota, Rm. 1101 MechE, Minneapolis, MN 55455, USA.T. Pauliquevis, Climate and Environmental Modelling Group,
Instituto Nacional de Pesquisas da Amazônia, 69060‐001, Manaus,Brazil.K. A. Prather, Department of Chemistry and Biochemistry, University
of California, San Diego, La Jolla, CA 92093, USA.G. C. Roberts, Center for Atmospheric Sciences, Scripps Institution of
Oceanography, University of California, San Diego, La Jolla, CA92037, USA.S. R. Saleska, Department of Ecology and Evolutionary Biology,
University of Arizona, Tucson, AZ 85721, USA.M. A. Silva Dias, Center for Weather Forecasting and Climate
Studies, National Institute for Space Research, University of SãoPaulo, 12630‐000 São Paulo, Brazil.D. V. Spracklen, Institute for Climate and Atmospheric Science,
School of Earth and Environment, University of Leeds, Leeds LS2 9JT,UK.E. Swietlicki, Department of Physics, Lund University, SE‐221 00
Lund, Sweden.
Martin et al.: AMAZONIAN AEROSOL PARTICLES RG2002RG2002
42 of 42
Related Documents