Sources and Measurement of Agricultural Productivity and Efficiency in Canadian Provinces: Crops and Livestock BY Alexander B. Darku 1 , Stavroula Malla 2 and Kien C. Tran 3 1 2 3 Department of Economics, University of Lethbridge, Alberta, Canada December 13, 2012

Welcome message from author
This document is posted to help you gain knowledge. Please leave a comment to let me know what you think about it! Share it to your friends and learn new things together.
Transcript
Sources and Measurement of Agricultural Productivity and Efficiency in Canadian
Provinces: Crops and Livestock
BY
Alexander B. Darku1, Stavroula Malla2 and Kien C. Tran3
1 2 3 Department of Economics, University of Lethbridge, Alberta, Canada
December 13, 2012
1
Sources and Measurement of Agricultural Productivity and
Efficiency in Canadian Provinces: Crops and Livestock
Alexander B. Darku †
Stavroula Malla
and
Kien C. Tran
Abstract This study measures and assesses the variation in total factor productivity (TFP) growth
among all the Canadian provinces in crops and livestock production over the period 1940-
2009. It also determines if agricultural productivity growth in Canada has recently slowed
down. The paper uses the stochastic frontier approach which incorporates inefficiency to decompose TFP growth into technical change, scale effect, and technical efficiency change.
The results indicate that productivity changes were mainly driven by technical changes for
crops, while the productivity change in livestock was mainly driven by scale effects. Technical progress contribution to productivity growth in livestock was also significant.
Though change in technical efficiency is mainly positive (except for New Brunswick and
Nova Scotia), its contribution to productivity growth was rather very little for the Provinces.
We also found that, over the entire period, the productivity growth rates for the crop sub-sector are on average higher for the Prairie Provinces than for the Eastern and Atlantic
Provinces. On the other hand, the productivity growth rates in the livestock sub-sector are on
the average higher in Eastern and Atlantic Provinces than in the Prairie region with the exception of Manitoba. Finally, we found no evidence that agricultural productivity growth in
Canada has recently slowed down. The decomposition of the TFP growth provides useful
insights into the vital role of research and development (R&D) and in turn government support in agricultural sector productivity growth.
JEL Classification: Q1, Q10, Q13, Q22.
Keywords: Agricultural Productivity; Growth, Crops Farming, Livestock Farming, Total
Factor Productivity, Technical Progress, Technical Efficiency, Scale Effect, Canada,
Stochastic Production Frontier.
† Department of Economics University of Lethbridge, Alberta, Canada This research was financially supported by the CAIRN Research Network. An earlier version
of this paper was presented at the 46th
CEA Annual Meeting, Calgary, Alberta. We thank the
participants of the session for valuable comments and suggestion. Also, we would like to thank Mike Tsionas for invaluable comments, suggestions and stimulating discussions. The
usual disclaimer applies.
2
Introduction
This paper uses Canadian provincial data from 1940 to 2009 to measure and assess
variation in total factor productivity (TFP) growth in the crops and livestock sub-
sectors. The paper also investigates the pattern of agricultural productivity growth in
Canada. The importance of such study, particularly for Canada, cannot be over
emphasized. Agricultural productivity growth and efficiency in Canada has become a
topic of continuing interest to policy makers and researchers who aim to improve on
economic sustainability, efficiency, living standards, and international
competitiveness. However, measuring agricultural productivity growth is a difficult
task, but very important for various reasons. Firstly, agricultural productivity growth
is an important indicator to the analysis of the overall economic growth. Secondly,
expansion in the industrial sectors of all countries relies significantly on agricultural
productivity growth even in today’s world of synthetic substitutes for raw materials.
Finally, it is an important concept in the discussions on global food security and
poverty alleviation, especially in the developing world. Bruinsma (2009) stated that
by 2050 the world population is expected to grow by 40% and allowing for increase
in income and changes in diet, global demand for food and fiber is expected to grow
by 70%. However, there are many different approaches to measuring agricultural
productivity growth and their interpretation must be done carefully.
Recently, there has been debate on the direction of global agricultural
productivity growth. Alston et al (2010a, b) used a range of partial productivity
measures to examine productivity growth in the world. They found that with the
exception of China and Latin America, there is evidence of an economically
significant slow-down in agricultural productivity growth in most of the world since
1990. They concluded that in some part of the world the slow-down in agricultural
3
productivity growth has been substantial and widespread. On the other hand Fuglie
(2008, 2010) concluded differently when he examined long-run productivity trends in
the global agriculture sector using an index number approach. He found that contrary
to some other authors, there is no evidence of a general slow-down in sector-wide
agricultural productivity, at least through 2007. He stated that the growth rate in
agricultural Total Factor Productivity (TFP) has actually accelerated in recent decades
because of rapid productivity gains in several developing countries, led by Brazil and
China, and more recently to a recovery of agricultural growth in the countries of the
former Soviet bloc.
In the case of Canada, recent evidence suggests that agricultural productivity
growth has significantly slowed down as well as lagging behind that of the U.S. and
many OECD countries (Rao et al 2008, Agriculture and Agri-Food Canada 2009).
Moreover, Stewart et al, (2009) indicated that TFP growth rate for crops and livestock
in the prairies has slowed down considerably. Veeman and Gray (2009) agreed with
Stewart et al, 2009 by concluding that productivity growth in crop production has
slowed down since 1990. On the contrary, the study by de Avillez (2011a, b)
concluded that over the period 1961-2007, the primary agriculture sector in Canada
experienced impressive productivity growth. . He also reported that the productivity
growth performance in the agriculture sector by far exceeded productivity growth in
the Canadian business sector as a whole.
The methodology and assumptions used in measuring agricultural productivity
growth affect the magnitude of the estimates, as well as the direction of effects, as
reflected in the studies discussed above and the general agricultural productivity
literature. For example, most productivity measures have the underlying assumption
that firms are efficient. If firms are actually inefficient, then the productivity measure
4
could be misleading. Furthermore, the use of disaggregate data is very essential in
measuring productivity growth, in order to reveal any possible idiosyncrasies of each
provinces/regions and in turn appropriate policies to be implemented. Very few
studies on Canadian agricultural productivity have used disaggregate data such as
provincial data (e.g., Echevarria 1998, Steward 2006, Steward et al 2009).
Furthermore, some Canadian studies have examined agricultural productivity growth
while allowing for inefficiencies but for a specific crop or type of livestock farm
within a specific province (Amara et al 1999, Giannakas et al 2000, Weersink et al
1990, Cloutier et al 1993).
The purpose of this paper is to use a stochastic frontier approach which
incorporates inefficiency to decompose the TFP growth in Canadian agricultural
sector into technical change, scale effect, and technical efficiency change1. We use
provincial agriculture data (all provinces except Newfoundland) on Crops and
Livestock sub-sectors for the period of 1940-2009. The paper also determines if
agricultural productivity growth in Canada has slowed down as claimed by earlier
studies. To the best of our knowledge, this is the first paper that examines TFP growth
for all provinces in Canada for crops and livestock as well as decomposes TFP growth
into technical change, scale effect, and technical efficiency change.
The rest of the paper is organized as follows. Section 2 provides a brief
overview of mainly Canadian productivity and efficiency studies. Section 3 describes
the theory behind the stochastic frontier approach used to decompose the TFP growth.
1 We decomposed total factor productivity into three components: Technological progress; Scale effect;
Technical efficiency. Technological progress captures the idea that production function can shift
overtime. It refers to the situation in which a firm can achieve more output from a given combination
of inputs or equivalently, the same amount of output from fewer inputs. Scale effect refers to the proportionate increase in output due to proportionate increase in all inputs in the production process.
Technical efficiency is the situation where it is impossible for a firm to produce with a given
technology either (a) more output from the same inputs, or (b) the same output with less of one or more
inputs without increasing the amount of other inputs. Hence, technical inefficiency indicates the
amount by which actual output falls short of the max possible output.
5
Section 4 provides a brief description of the data used in the estimation. Details
collections of the data are relegated to Appendix A. Section 5 describes the estimation
procedure, while Section 6 provides the main estimation results. Concluding remarks
are given in Section 7.
2. Productivity Growth and Efficiency Studies
There exists a large and growing literature on total factor productivity (TFP) growth
in the Canadian agricultural sector, see for example, Fantino and Veeman (1997),
Echervarria (1998), Steward (2006), Steward et al (2009), and Veeman and Gray
(2009, 2010) for reference therein. However, with the exception of Echevarria (1998),
Steward (2006) and Steward, Veeman and Unterschultz (2009), all of these studies
used aggregate data. The main disadvantage of using aggregate data is that it does not
allow for the identification of more productive provinces/regions versus less
productive ones, and consequently, common policy may not be appropriate to
promote productivity growth for all provinces/regions. However, finding agriculture
data that is disaggregated enough, such as provincial or regions within each province,
proves difficult due to the lack of available data. This is probably the main reason
why previous studies have used aggregate data.
Echevarria (1998) managed to find provincial data on agriculture value added
and three basic factors of production (capital, labor and land) for the period of 1971 to
1991, to examine TFP growth in the agriculture, services and industrial sectors. She
used the standard Solow (1957) growth accounting technique along with constant
return to scales Cobb-Douglas production function to compute the TFP growth across
provinces. Her results indicated that Canadian agriculture is less labor intensive than
both services and industry, while capital intensity is similar in the three sectors. In
6
addition, the average TFP growth in the agriculture sector is approximately 0.3%
which is similar to that of TFP growth in the Canadian industry.
Steward (2006) and Steward et al (2009) used Prairie region (Alberta,
Saskatchewan and Manitoba) agriculture data on crop and livestock along with four
factors of production (capital, labor, land and materials) for the period 1940 to 2004 to
decompose the TFP growth into technological progress and scale effects. Their
approach is based on Tornqvist-Theil indexing procedure coupled with econometric
estimation of a Translog cost system. For the given period, they found that the
productivity growth in the Prairie agriculture was at a rate of 1.56% per year, and that
the productivity growth in crops is significantly higher than productivity in livestock.
Furthermore, their results indicated that productivity growth in crops has largely been
the result of technological progress while economies of scale have been the main
source in generating productivity growth in livestock sector.
However, the main shortcoming of the above mentioned studies and many
others is that the approaches used in computing TFP growth implicitly assumed that
provinces/regions are fully efficiency in their production process (technically as well
as allocatively). This may not be appropriate since at any given point in time,
provinces/regions may not be fully efficient. Thus, by assuming provinces/regions are
fully efficient in their production process when in fact they are not, the approach can
provide misleading results and policy recommendations to enhance productivity
growth. This shortcoming has been recognized in the literature. For instance, Tsionas
and Kumbhakar (2004) pointed out that the approach or approaches that incorporate
inefficiency is more attractive because it helps to identify which provinces/regions are
inefficient and, if so, to what extent. By identifying the inefficient provinces/regions,

7
policies designed to promote efficiency can be made more effective by directing the
necessary aid to those who are in the greatest need of assistance.
Agricultural efficiency studies have mostly focused on agricultural practices in
the Unites States and Europe. These studies have used diverse methodologies to
identify the nature and the dynamics of efficiency in agriculture production. (see
Barnes (2008), Zhu and Lansink (2010) Mayen et al, (2010) Serra et al (2008) and
Guzman and Arcas (2008) for recent methodologies and results). A very notable study
is the one by Bravo-Ureta et al (2007) which used meta-regression analysis of 167
frontier studies of technical efficiency in the agricultural sectors to determine the
sensitivity of results to various methodologies. Though Canadian provincial studies
are limited, a few notable ones are Amara et al, (1999) for Quebec potato farms;
Giannakas et al (2000) for Saskatchewan wheat farms; Weersink et al (1990) for
Ontario dairy farms; and Cloutier et al (1993) for Quebec dairy farms. The mean
technical efficiency reported by the above Canadian studies range from 76.9 to 91.8,
indicating that farms are not fully efficient and hence, there is a room for
improvement in this front. While, the overall mean technical efficiency of all the 167
frontier studies included in Bravo-Ureta et al (2007) meta-regression analysis was
76.6.
3. Methodology
The method used in this paper is based on stochastic production frontier approach
originally proposed by Lovell and Schmidt (1977), and Meeusen and van den Broeck
(1977). A specification of a stochastic production frontier function can be generally
written as:
( , ; )exp( )it it it itY f X t v u (1)
8
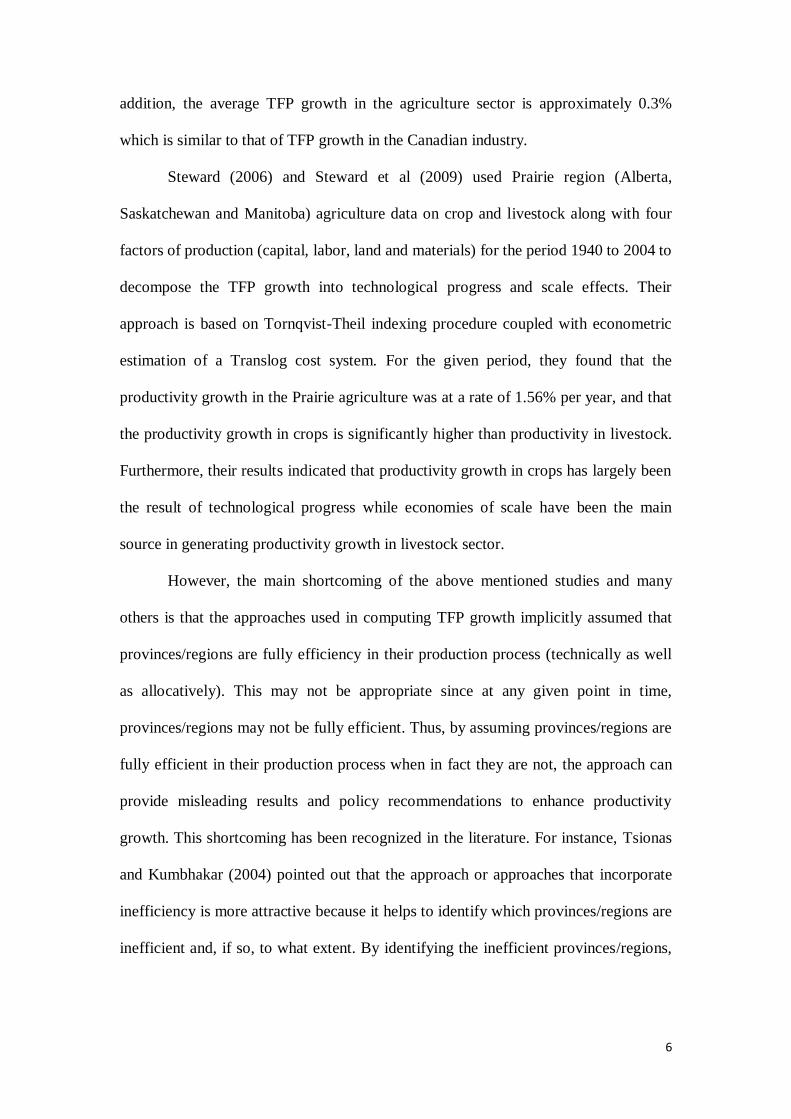
where itY denotes the output of province i at time t ,
itX is a 1k vector of input
factors used in the production process, t is a time trend which capture the technical
change, is a 1k vector of unknown parameters to be estimated, itv is an i.i.d.
symmetric random disturbance such that 2(0, )it vv N , 0
itu is an i.i.d.
nonnegative random variable representing technical inefficiency and the function
(.,.)f is the production technology and we assume it takes a specific form. The idea
behind model (1) is that for a given technology and at any point in time, provinces are
not always fully efficient in implementing the best possible practice from the present
stock of knowledge. Following the stochastic frontier literature, it is assumed that
2(0, )it uu N , albeit other nonnegative distributions such as exponential, gamma,
etc. could be considered. However, it is known that the estimation results are not
sensitive to the distributional assumption on itu (see Greene (2002).)
Let lnit ity Y and similarly ln
it itx X . Following Kumbhakar and Lovell
(2000), in the primal approach, when price information is available, TFP changes can
be decomposed into four components: technical change (TC), scale effect (SE),
technical efficiency change (TEC) and changes in allocative inefficiency (AEC). To
do this, let z denotes the growth rate of a variable Z , that is, ln /z Z t ; and
define TFP growth as output growth unexplained by input growth. That is,
1
k
j jj
TFP y s x (2)
where js is the thj input share of production cost and ln /
j jx X t . The output
growth y can be computed based on Farrel’s definition of technical efficiency:
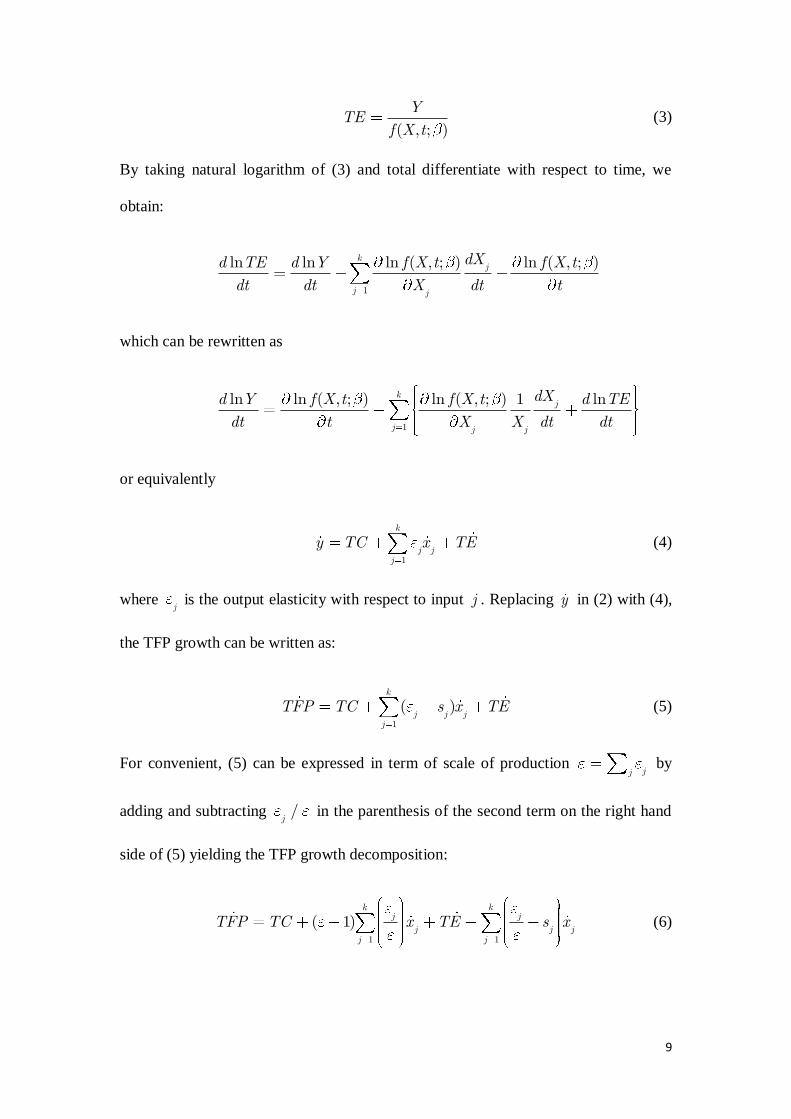
9
( , ; )
YTE
f X t (3)
By taking natural logarithm of (3) and total differentiate with respect to time, we
obtain:
1
ln ln ln ( , ; ) ln ( , ; )kj
j j
dXd TE d Y f X t f X t
dt dt X dt t
which can be rewritten as
1
ln ln ( , ; ) ln ( , ; ) 1 lnkj
j j j
dXd Y f X t f X t d TE
dt t X X dt dt
or equivalently
1
k
j jj
y TC x TE (4)
where j is the output elasticity with respect to input j . Replacing y in (2) with (4),
the TFP growth can be written as:
1
( )k
j j jj
TFP TC s x TE (5)
For convenient, (5) can be expressed in term of scale of production jj by
adding and subtracting /j
in the parenthesis of the second term on the right hand
side of (5) yielding the TFP growth decomposition:
1 1
( 1)k k
j j
j j jj j
TFP TC x TE s x (6)

10
The first term on the right hand side of (6) measures the TC which relates to the
technological progress including not only advances in physical technologies but also
innovation in the overall knowledge base that lead to better decision making and
planning. It captures the upward shift of the production function. The second term on
the right hand side of (6) measures the SE which refers to the proportionate increase
in output due to proportionate increase in all inputs in the production process. Note
that in the presence of constant returns to scale, 1 , this term vanishes. The third
term on the right hand side of (6) measures the changes in TEC and the last term
measures AEC which refers to the deviation of each input value of marginal
productivity from output normalized cost. The AEC will vanish if the
provinces/regions/farms are allocatively efficient. However, in the present study, we
do not make adjustment for the AEC since input prices data are incomplete. We hope
to address the AEC in the near future.
The data used in this paper comes from various Statistics Canada publications
and Census of Agriculture years. We used nine provinces in this study.
Newfoundland, the Yukon and the Northwest Territories are excluded because they
are practically deserted and few statistics available from them. The period chosen in
this study is from 1940 to 2009. The length of this data series is unusual since few
studies of Canadian agricultural productivity have access to approximately 70 years of
data. This enables us to make assessment of various provincial agriculture growths
and productivity performance both for relatively long period of time and for different
time periods.
Most of the data was retrieved from CANSIM and in some situation multiple
tables had to be combined in order to cover the time period of interest, as some tables
had been terminated. The census data, which was required for input allocation, was
11
retrieved partially from CANSIM, namely data from the Census years 2001 and 2006.
Data from the census years 1941 to 1996 was retrieved from printed Census of
Agriculture documents found in the University Library. Census data is available
online through CANSIM for the census years between 1991 and 2006, with select
historical data being available prior to these years.
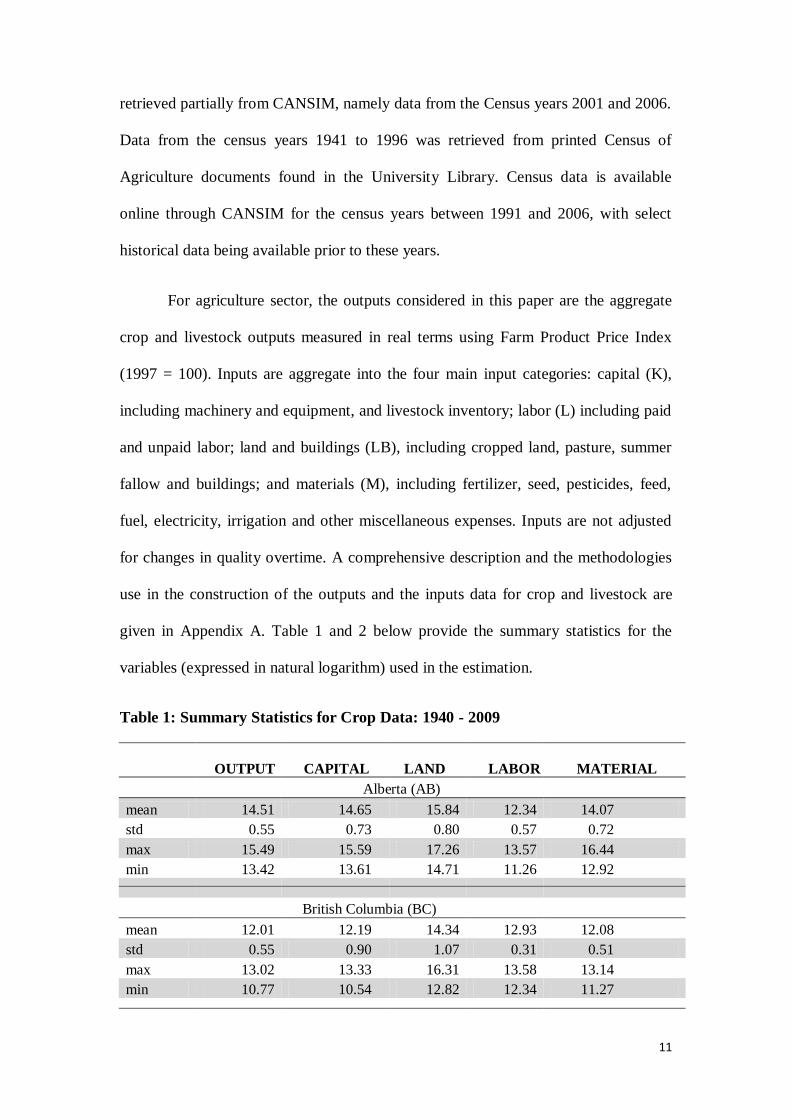
For agriculture sector, the outputs considered in this paper are the aggregate
crop and livestock outputs measured in real terms using Farm Product Price Index
(1997 = 100). Inputs are aggregate into the four main input categories: capital (K),
including machinery and equipment, and livestock inventory; labor (L) including paid
and unpaid labor; land and buildings (LB), including cropped land, pasture, summer
fallow and buildings; and materials (M), including fertilizer, seed, pesticides, feed,
fuel, electricity, irrigation and other miscellaneous expenses. Inputs are not adjusted
for changes in quality overtime. A comprehensive description and the methodologies
use in the construction of the outputs and the inputs data for crop and livestock are
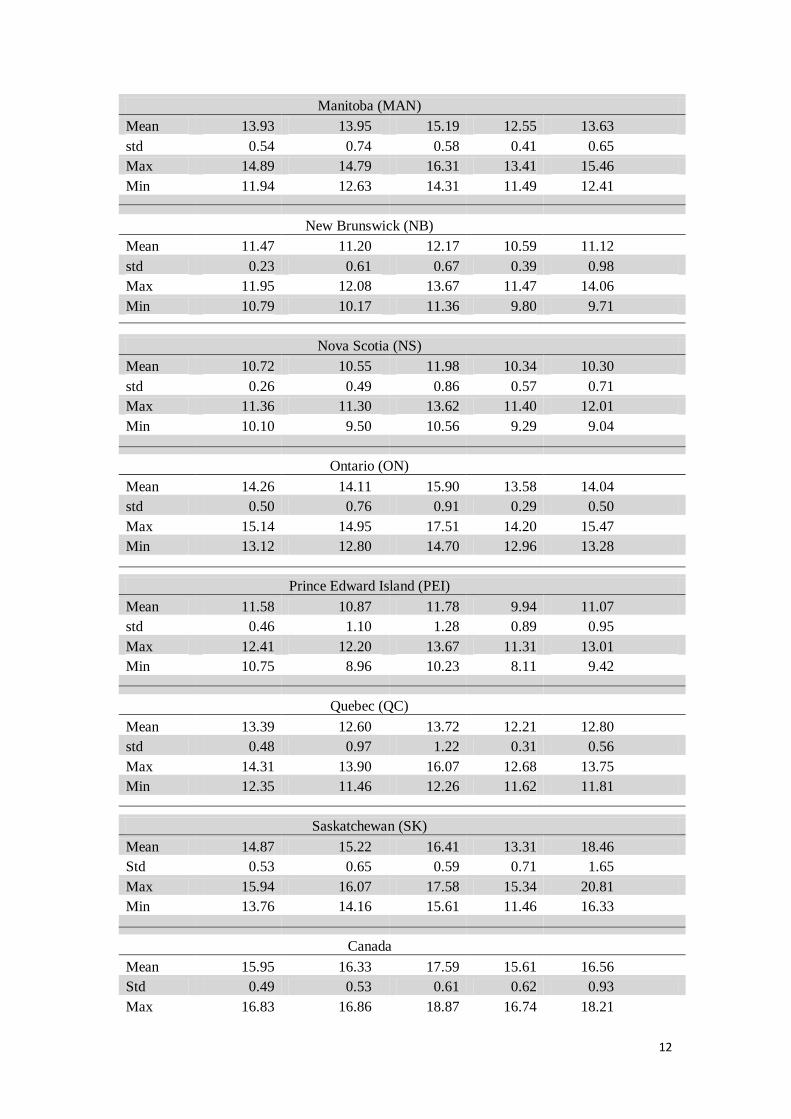
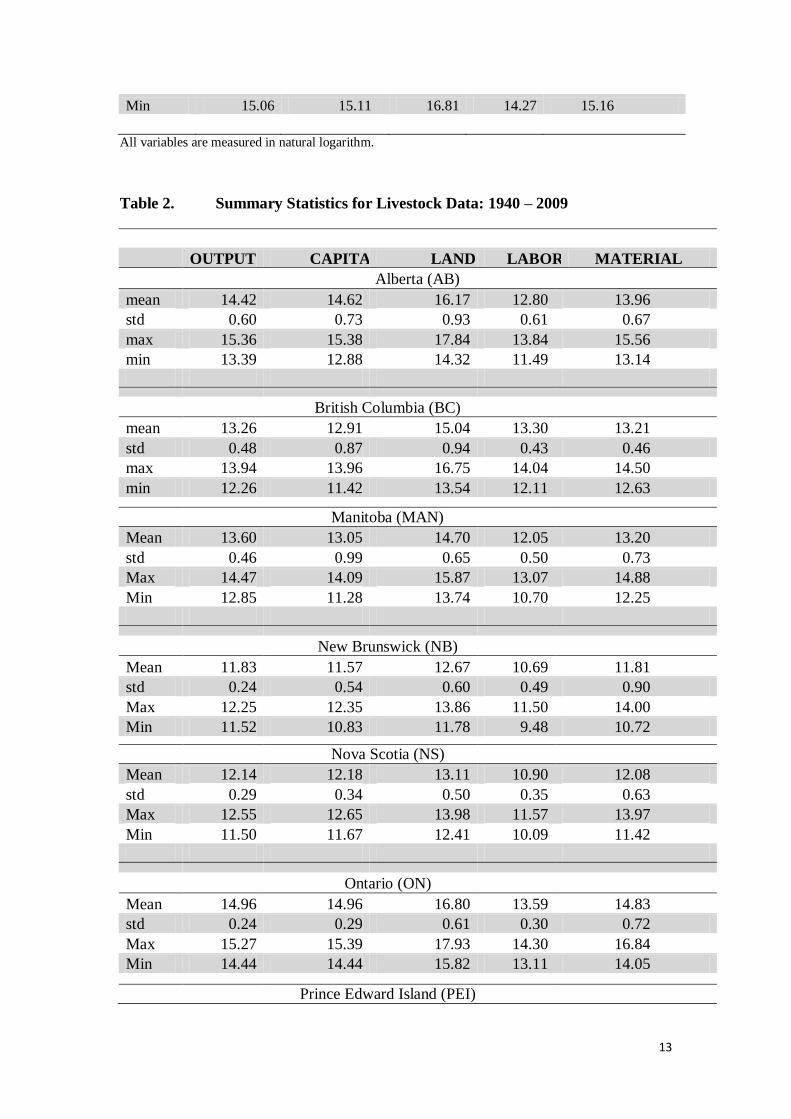
given in Appendix A. Table 1 and 2 below provide the summary statistics for the
variables (expressed in natural logarithm) used in the estimation.
Table 1: Summary Statistics for Crop Data: 1940 - 2009
OUTPUT CAPITAL
LAND LABOR MATERIAL
Alberta (AB)
mean 14.51 14.65 15.84 12.34 14.07
std 0.55 0.73 0.80 0.57 0.72
max 15.49 15.59 17.26 13.57 16.44
min 13.42 13.61 14.71 11.26 12.92
British Columbia (BC)
mean 12.01 12.19 14.34 12.93 12.08
std 0.55 0.90 1.07 0.31 0.51
max 13.02 13.33 16.31 13.58 13.14
min 10.77 10.54 12.82 12.34 11.27
12
Manitoba (MAN)
Mean 13.93 13.95 15.19 12.55 13.63
std 0.54 0.74 0.58 0.41 0.65
Max 14.89 14.79 16.31 13.41 15.46
Min 11.94 12.63 14.31 11.49 12.41
New Brunswick (NB)
Mean 11.47 11.20 12.17 10.59 11.12
std 0.23 0.61 0.67 0.39 0.98
Max 11.95 12.08 13.67 11.47 14.06
Min 10.79 10.17 11.36 9.80 9.71
Nova Scotia (NS)
Mean 10.72 10.55 11.98 10.34 10.30
std 0.26 0.49 0.86 0.57 0.71
Max 11.36 11.30 13.62 11.40 12.01
Min 10.10 9.50 10.56 9.29 9.04
Ontario (ON)
Mean 14.26 14.11 15.90 13.58 14.04
std 0.50 0.76 0.91 0.29 0.50
Max 15.14 14.95 17.51 14.20 15.47
Min 13.12 12.80 14.70 12.96 13.28
Prince Edward Island (PEI)
Mean 11.58 10.87 11.78 9.94 11.07
std 0.46 1.10 1.28 0.89 0.95
Max 12.41 12.20 13.67 11.31 13.01
Min 10.75 8.96 10.23 8.11 9.42
Quebec (QC)
Mean 13.39 12.60 13.72 12.21 12.80
std 0.48 0.97 1.22 0.31 0.56
Max 14.31 13.90 16.07 12.68 13.75
Min 12.35 11.46 12.26 11.62 11.81
Saskatchewan (SK)
Mean 14.87 15.22 16.41 13.31 18.46
Std 0.53 0.65 0.59 0.71 1.65
Max 15.94 16.07 17.58 15.34 20.81
Min 13.76 14.16 15.61 11.46 16.33
Canada
Mean 15.95 16.33 17.59 15.61 16.56
Std 0.49 0.53 0.61 0.62 0.93
Max 16.83 16.86 18.87 16.74 18.21
13
Min 15.06 15.11 16.81 14.27 15.16
All variables are measured in natural logarithm.
Table 2. Summary Statistics for Livestock Data: 1940 – 2009
OUTPUT CAPITAL LAND LABOR MATERIAL
Alberta (AB)
mean 14.42 14.62 16.17 12.80 13.96
std 0.60 0.73 0.93 0.61 0.67
max 15.36 15.38 17.84 13.84 15.56
min 13.39 12.88 14.32 11.49 13.14
British Columbia (BC)
mean 13.26 12.91 15.04 13.30 13.21
std 0.48 0.87 0.94 0.43 0.46
max 13.94 13.96 16.75 14.04 14.50
min 12.26 11.42 13.54 12.11 12.63
Manitoba (MAN)
Mean 13.60 13.05 14.70 12.05 13.20
std 0.46 0.99 0.65 0.50 0.73
Max 14.47 14.09 15.87 13.07 14.88
Min 12.85 11.28 13.74 10.70 12.25
New Brunswick (NB)
Mean 11.83 11.57 12.67 10.69 11.81
std 0.24 0.54 0.60 0.49 0.90
Max 12.25 12.35 13.86 11.50 14.00
Min 11.52 10.83 11.78 9.48 10.72
Nova Scotia (NS)
Mean 12.14 12.18 13.11 10.90 12.08
std 0.29 0.34 0.50 0.35 0.63
Max 12.55 12.65 13.98 11.57 13.97
Min 11.50 11.67 12.41 10.09 11.42
Ontario (ON)
Mean 14.96 14.96 16.80 13.59 14.83
std 0.24 0.29 0.61 0.30 0.72
Max 15.27 15.39 17.93 14.30 16.84
Min 14.44 14.44 15.82 13.11 14.05
Prince Edward Island (PEI)
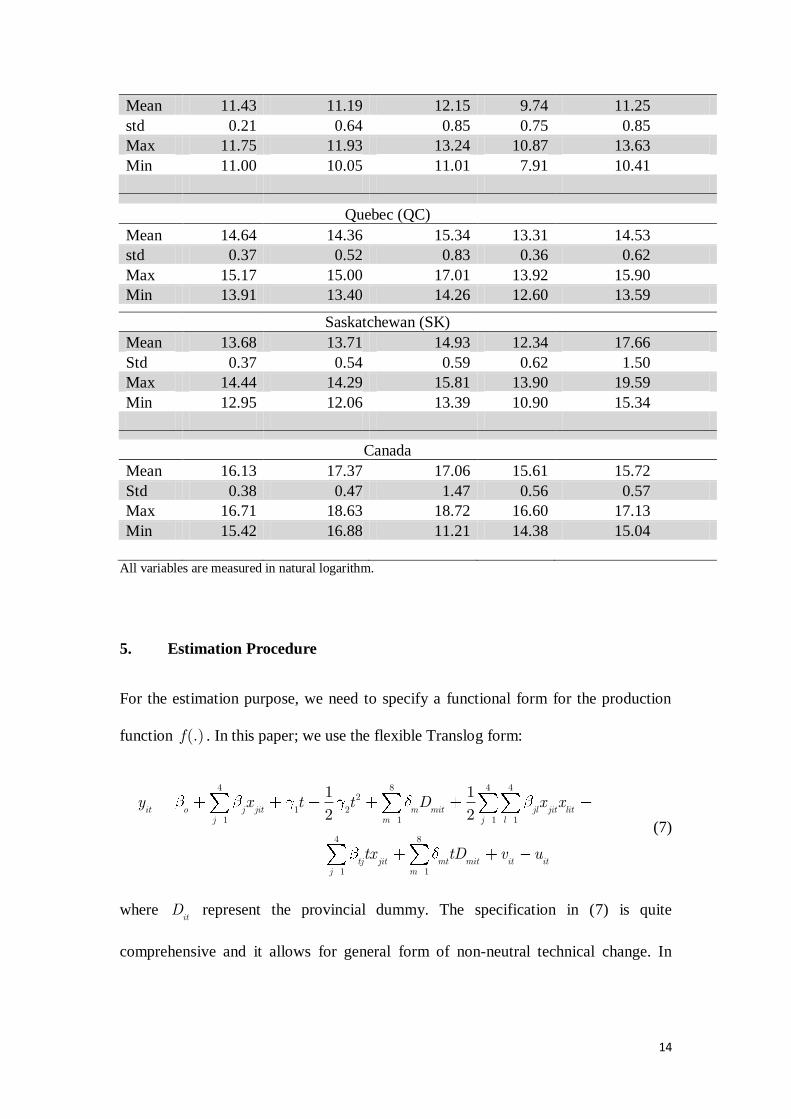
14
Mean 11.43 11.19 12.15 9.74 11.25
std 0.21 0.64 0.85 0.75 0.85
Max 11.75 11.93 13.24 10.87 13.63
Min 11.00 10.05 11.01 7.91 10.41
Quebec (QC)
Mean 14.64 14.36 15.34 13.31 14.53
std 0.37 0.52 0.83 0.36 0.62
Max 15.17 15.00 17.01 13.92 15.90
Min 13.91 13.40 14.26 12.60 13.59
Saskatchewan (SK)
Mean 13.68 13.71 14.93 12.34 17.66
Std 0.37 0.54 0.59 0.62 1.50
Max 14.44 14.29 15.81 13.90 19.59
Min 12.95 12.06 13.39 10.90 15.34
Canada
Mean 16.13 17.37 17.06 15.61 15.72
Std 0.38 0.47 1.47 0.56 0.57
Max 16.71 18.63 18.72 16.60 17.13
Min 15.42 16.88 11.21 14.38 15.04
All variables are measured in natural logarithm.
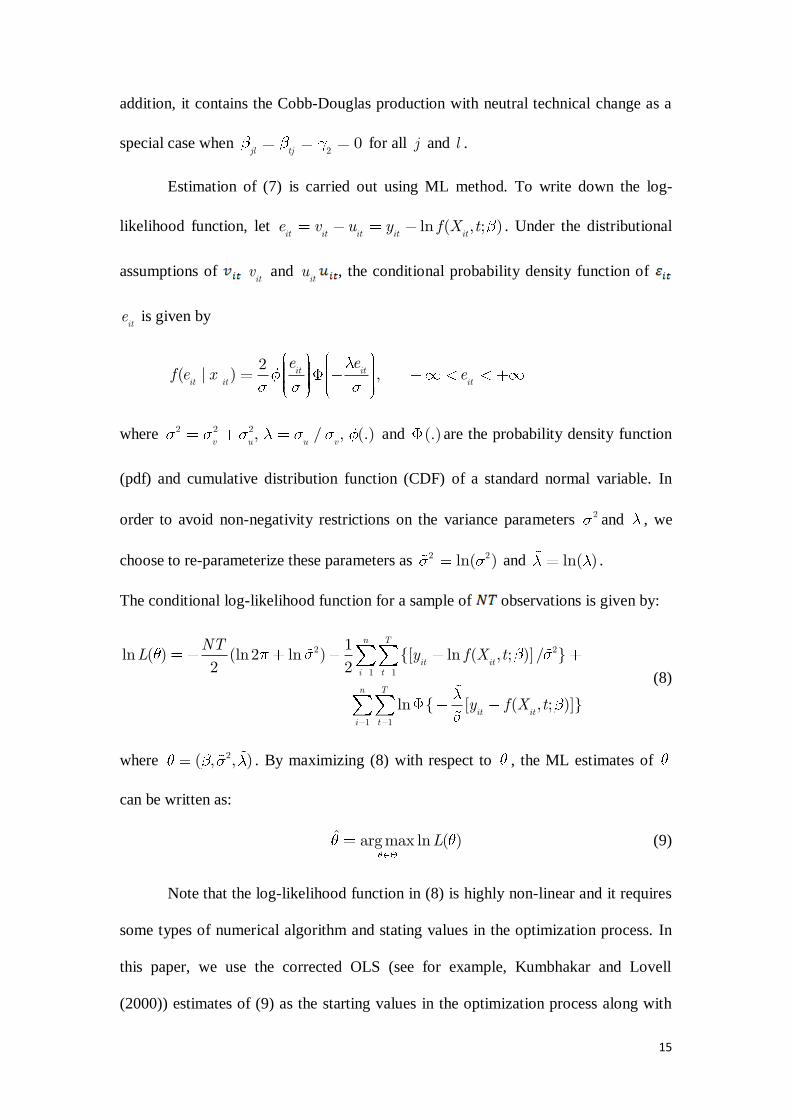
5. Estimation Procedure
For the estimation purpose, we need to specify a functional form for the production
function (.)f . In this paper; we use the flexible Translog form:
4 8 4 42
1 21 1 1 1
4 8
1 1
1 1
2 2it o j jit m mit jl jit litj m j l
tj jit mt mit it itj m
y x t t D x x
tx tD v u
(7)
where itD represent the provincial dummy. The specification in (7) is quite
comprehensive and it allows for general form of non-neutral technical change. In
15
addition, it contains the Cobb-Douglas production with neutral technical change as a
special case when 20
jl tj for all j and l .
Estimation of (7) is carried out using ML method. To write down the log-
likelihood function, let ln ( , ; )it it it it ite v u y f X t . Under the distributional
assumptions of itv and
itu , the conditional probability density function of
ite is given by
2( | ) ,it itit it it
e ef e x e
where 2 2 2, / , (.)v u u v
and (.)are the probability density function
(pdf) and cumulative distribution function (CDF) of a standard normal variable. In
order to avoid non-negativity restrictions on the variance parameters 2
and , we
choose to re-parameterize these parameters as 2 2ln( ) and ln( ) .
The conditional log-likelihood function for a sample of observations is given by:
2 2
1 1
1 1
1ln ( ) (ln2 ln ) {[ ln ( , ; )]/ }
2 2
ln { [ ( , ; )]}
n T
it iti t
n T
it iti t
NTL y f X t
y f X t
(8)
where 2( , , ) . By maximizing (8) with respect to , the ML estimates of
can be written as:
ˆ argmax ln ( )L (9)
Note that the log-likelihood function in (8) is highly non-linear and it requires
some types of numerical algorithm and stating values in the optimization process. In
this paper, we use the corrected OLS (see for example, Kumbhakar and Lovell
(2000)) estimates of (9) as the starting values in the optimization process along with
16
David-Fletcher algorithm. The convergence criterion is set at 510 . In our estimation,
we did not encounter any numerical problems and the parameter estimates converged
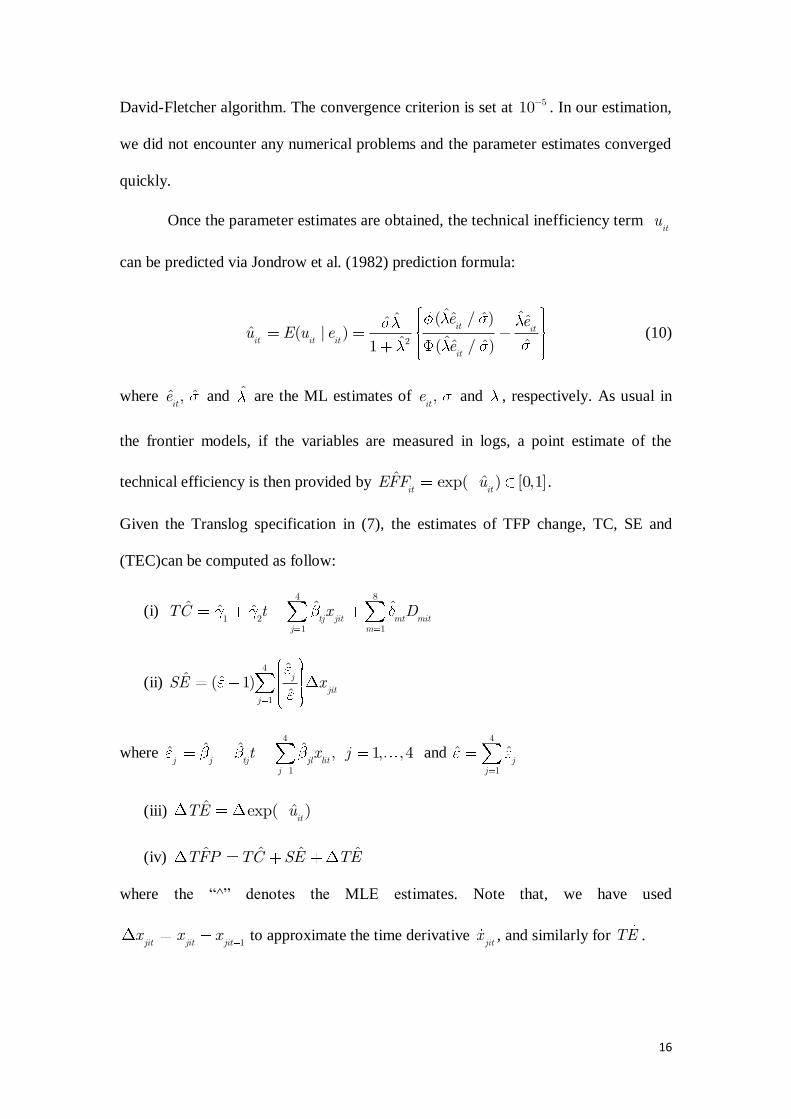
quickly.
Once the parameter estimates are obtained, the technical inefficiency term itu
can be predicted via Jondrow et al. (1982) prediction formula:
2
ˆ ˆˆ ˆˆ ( / ) ˆˆˆ ( | )
ˆˆ ˆˆ ˆ( / )1
it itit it it
it
e eu E u e
e (10)
where ˆ ˆ,ite and ˆ are the ML estimates of ,
ite and , respectively. As usual in
the frontier models, if the variables are measured in logs, a point estimate of the
technical efficiency is then provided by ˆ ˆexp( ) [0,1]it it
EFF u .
Given the Translog specification in (7), the estimates of TFP change, TC, SE and
(TEC)can be computed as follow:
(i) 4 8
1 21 1
ˆ ˆ ˆˆ ˆtj jit mt mit
j m
TC t x D
(ii) 4
1
ˆˆ ˆ( 1)
ˆj
jitj
SE x
where 4
1
ˆ ˆ ˆˆ , 1, ,4j j tj jl lit
j
t x j and 4
1
ˆj
j
(iii) ˆ ˆexp( )it
TE u
(iv) ˆ ˆ ˆ ˆTFP TC SE TE
where the “^” denotes the MLE estimates. Note that, we have used
1jit jit jitx x x to approximate the time derivative
jitx , and similarly for TE .

17
6. Estimation Results
The average annual TFP growth rates for crops and livestock for the entire period are
depicted in Figure 1 and 2 respectively. For comparison purposes and to determine if
there has been agricultural productivity decline in Canada, we also provided the
average annual TFP growth for the last two decades, 1990-2009. It is evident that for
each province and Canada, there are notable differences in TFP growth between crops
and livestock.
Overall, from 1940 to 2009 the TFP growth rates are on average higher for
crops in each of the Prairie provinces, namely Alberta, Saskatchewan and Manitoba,
than for the Eastern and Atlantic provinces. For example, the average TFP growth in
Alberta, Saskatchewan and Manitoba was 1.57, 1.69 and 2.03% per annum
respectively, compare with 1.21% in Ontario, 1.05% in Quebec and less than 1% in
Atlantic Provinces. Overall, Canada experienced crop productivity growth of 0.65%
per annum.
Comparing average productivity growth in the crop sector for the period 1940
to 2009 to the period 1990 to 2009 we conclude the following. The average crop
productivity growth is higher for the period 1990 to 2009 for Saskatchewan (2.06%),
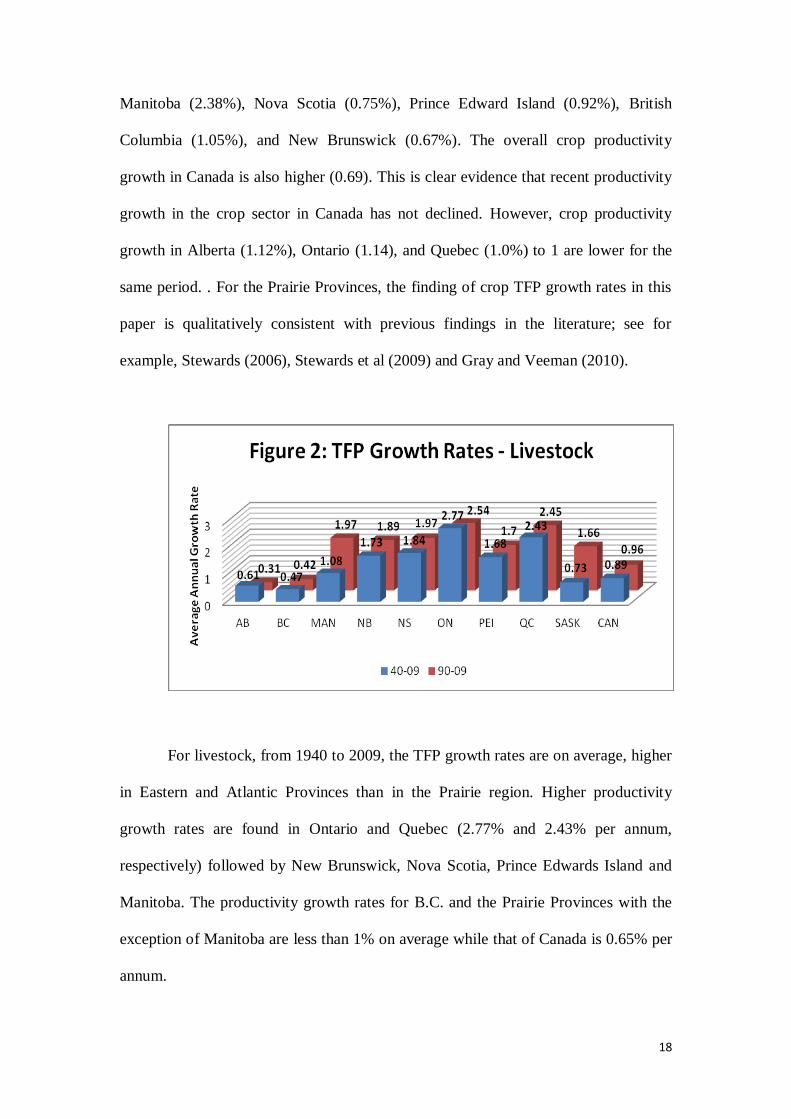
18
Manitoba (2.38%), Nova Scotia (0.75%), Prince Edward Island (0.92%), British
Columbia (1.05%), and New Brunswick (0.67%). The overall crop productivity
growth in Canada is also higher (0.69). This is clear evidence that recent productivity
growth in the crop sector in Canada has not declined. However, crop productivity
growth in Alberta (1.12%), Ontario (1.14), and Quebec (1.0%) to 1 are lower for the
same period. . For the Prairie Provinces, the finding of crop TFP growth rates in this
paper is qualitatively consistent with previous findings in the literature; see for
example, Stewards (2006), Stewards et al (2009) and Gray and Veeman (2010).
For livestock, from 1940 to 2009, the TFP growth rates are on average, higher
in Eastern and Atlantic Provinces than in the Prairie region. Higher productivity
growth rates are found in Ontario and Quebec (2.77% and 2.43% per annum,
respectively) followed by New Brunswick, Nova Scotia, Prince Edwards Island and
Manitoba. The productivity growth rates for B.C. and the Prairie Provinces with the
exception of Manitoba are less than 1% on average while that of Canada is 0.65% per
annum.

19
However, comparing the results to those over the period 1990 to 2009, our
results indicated that average livestock productivity growth in Saskatchewan,
Manitoba, the Eastern Provinces, Atlantic Provinces and Canada were higher during
the last 20 years. Again, the evidence indicates that during the last two decades,
productivity growth in the livestock sector has not declined. However, it is noted that
Alberta and British Columbia experienced lower livestock productivity growth during
the last 20 years. For the period 1990 o 2009 the productivity growth rates in the
livestock sub-sector are on the average still higher in Eastern and Atlantic Provinces
than in the Prairie region with the exception of Manitoba which has TFP growth rate
similar to those of the Atlantic Provinces.
The finding of higher productivity growth rates for crops relative to livestock
for the Prairie Provinces compared to Eastern and Atlantic Provinces perhaps, can be
explained by longer production cycle and slower progress in controlled genetic
technology associated with Cattle production in the Prairie region, especially in
Alberta and Saskatchewan. Manitoba is an exception since traditionally, livestock in
Manitoba has been more diversified with swine, poultry and dairy; and it is possible
that these have been benefited from faster progress in controlled genetics. Conversely,
the finding of higher productivity growth rates for livestock relative to crop in Eastern
and Atlantic provinces compare to the West, may be due to improvement of genetics,
feed conversion and exploitation of economies of scale in the livestock production
such as intensive livestock operations especially regarding feedlots and hog barn.
Finally, it was noted that productivity growth in Alberta slowed down possibly due to
reallocation of resources from agriculture to Alberta’s oil and gas sector.
To get more insight into how crops and livestock productivity occurs, we turn
our attention to the TFP growth decomposition. Table 3 and 4 provide the
20
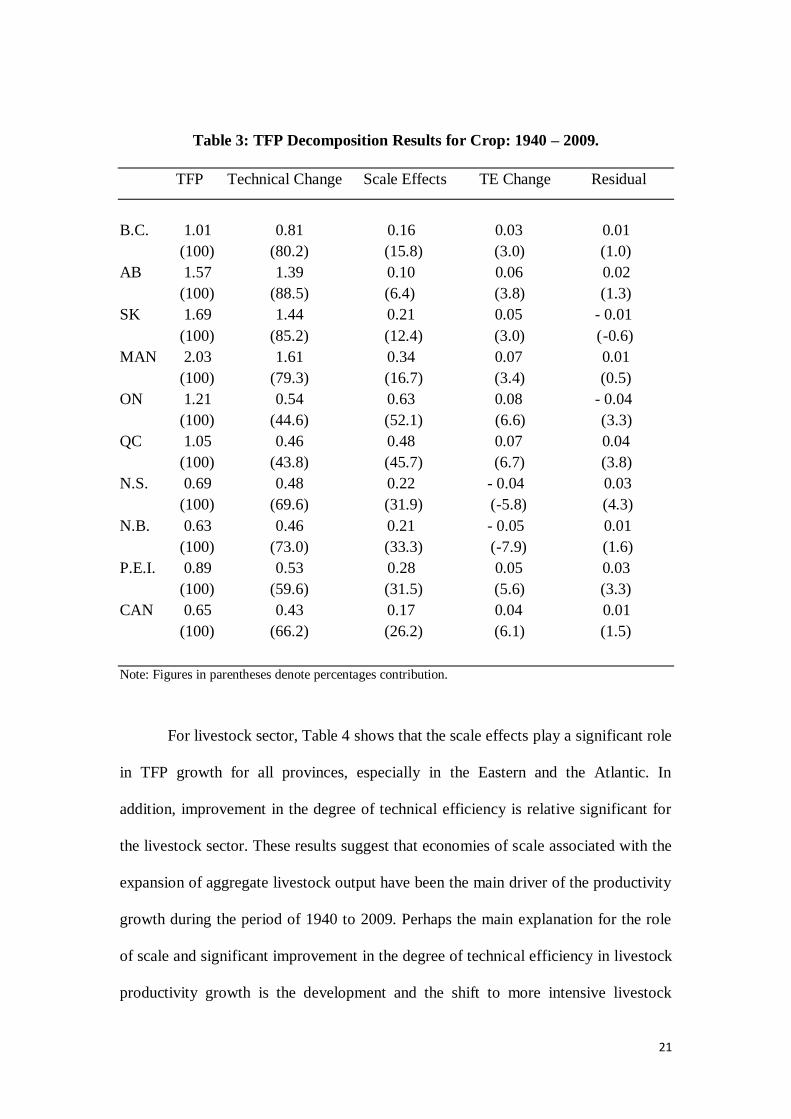
decomposition of estimated TFP growth into technical change, scale effects and
technical efficiency change. As seen in Table 3, technical change seems to be the
dominant component of the estimated productivity growth for crops in in all provinces
except Ontario and Quebec as well as for Canada. For example, Alberta,
Saskatchewan, Manitoba, New Brunswick and Nova Scotia, from 1940-2009, 88.5%,
85.2%, 79.3%, 73.0% and 69.6% respectively of the TFP growth were driven by
technical change.
For these provinces, with the exception of Alberta, the role of scale effects is
also economically important ranging from 15.8 % in British Columbia to 33.3% in
New Brunswick. The scale effect is much less for Alberta crops with only 6.4%
contribution to TFP growth. For Ontario and Quebec, both technological progress
(44.6 and 43.8% respectively) and scale effects (52.1 and 45.7% respectively) play
important role in the estimated TFP growth. One implication of these results is that
the TFP growth in crops is mainly driven by technological progress. This in turn,
suggests the vital role of research and development as well as extension activities in
the development and adoption of new seed varieties and cropping practice. The
change in technical efficiency is mainly positive (except for New Brunswick and
Nova Scotia) but has relatively small contributions to the TFP growth for most
provinces as well as in Canada. Finally, the residuals which account for the
unexplained component of the TFP growth are very small which indicated that factors
such as measurement errors and changes in allocative efficiency have very little role
in the contribution of productivity growth.
21
Table 3: TFP Decomposition Results for Crop: 1940 – 2009.
TFP Technical Change Scale Effects TE Change Residual
B.C. 1.01 0.81 0.16 0.03 0.01
(100) (80.2) (15.8) (3.0) (1.0)
AB 1.57 1.39 0.10 0.06 0.02
(100) (88.5) (6.4) (3.8) (1.3)
SK 1.69 1.44 0.21 0.05 - 0.01
(100) (85.2) (12.4) (3.0) (-0.6)
MAN 2.03 1.61 0.34 0.07 0.01
(100) (79.3) (16.7) (3.4) (0.5)
ON 1.21 0.54 0.63 0.08 - 0.04
(100) (44.6) (52.1) (6.6) (3.3)
QC 1.05 0.46 0.48 0.07 0.04
(100) (43.8) (45.7) (6.7) (3.8)
N.S. 0.69 0.48 0.22 - 0.04 0.03
(100) (69.6) (31.9) (-5.8) (4.3)
N.B. 0.63 0.46 0.21 - 0.05 0.01
(100) (73.0) (33.3) (-7.9) (1.6)
P.E.I. 0.89 0.53 0.28 0.05 0.03
(100) (59.6) (31.5) (5.6) (3.3)
CAN 0.65 0.43 0.17 0.04 0.01
(100) (66.2) (26.2) (6.1) (1.5)
Note: Figures in parentheses denote percentages contribution.
For livestock sector, Table 4 shows that the scale effects play a significant role
in TFP growth for all provinces, especially in the Eastern and the Atlantic. In
addition, improvement in the degree of technical efficiency is relative significant for
the livestock sector. These results suggest that economies of scale associated with the
expansion of aggregate livestock output have been the main driver of the productivity
growth during the period of 1940 to 2009. Perhaps the main explanation for the role
of scale and significant improvement in the degree of technical efficiency in livestock
productivity growth is the development and the shift to more intensive livestock
22
operations such as improvement in genetics, feedlots conversion and management
practices that have emerged overtime as aggregate provincial output of livestock
expand.
The productivity changes in the two sub-sectors were mainly driven by
technical changes (such as new seed varieties, progress in controlled genetic
technology; better quality machinery and equipment) and scale effects (arising from
intensive livestock operations, cropping practices). Specifically, technical change is
the dominant component of the estimated productivity growth for crops in all the
provinces (AB 88%; SK 85.2%; B.C. 80.2%; MAN 79.3%; N.B 73%; N.S. 69.6%;
P.E.I 59.6%) and Canada (66.2%) except Ontario and Quebec. However, the scale
effect is the dominant component of the estimated productivity growth for livestock in
all provinces (ON 69.3%; QC 65.4%; P.E.I. 62.5%; N.B. 58.4%; N.S. 57.1%; SK
56.2%; MAN 51.9%; B.C. 51.1%; AB 50.8%) and for Canada (58.4%). The
contribution of technical progress to productivity growth in livestock was also
significant. Finally, though change in technical efficiency is mainly positive (except
for New Brunswick and Nova Scotia in the crop sector), its contribution to
productivity growth in both sectors were rather very little for the Provinces.

23
Table 4. TFP Decomposition Results for Livestock: 1940 – 2009.
TFP Technical Change Scale Effects TE Change Residual
B.C. 0.47 0.13 0.24 0.08 0.02
(100) (27.7) (51.1) (17.0) (4.2)
AB 0.61 0.20 0.31 0.09 0.01
(100) (32.8) (50.8) (14.8) (1.6)
SK 0.73 0.23 0.41 0.08 0.01
(100) (31.5) (56.2) (11.0) (1.3)
MAN 1.08 0.38 0.56 0.12 0.02
(100) (35.1) (51.9) (11.1) (1.9)
ON 2.77 0.72 1.92 0.26 -0.12
(100) (29.6) (69.3) (9.3) (-4.7)
QC 2.43 0.61 1.59 0.20 0.03
(100) (25.1) (65.4) (8.2) (1.2)
N.S. 1.84 0.64 1.05 0.24 -0.09
(100) (34.8) (57.1) (13.0) (-4.9)
N.B. 1.73 0.59 1.01 0.21 -0.08
(100) (34.1) (58.4) (12.1) (-4.6)
P.E.I. 1.68 0.48 1.05 0.18 -0.03
(100) (28.6) (62.5) (10.7) (-1.8)
CAN 0.89 0.32 0.52 0.06 -0.01
(100) (36.0) (58.4) (6.7) (-1.1)
Note: Figures in parentheses denote percentages contribution
7. Concluding Remarks.
Agricultural productivity growth is important with regards to economic efficiency,
living standards, international competitiveness, and economic sustainability. Recent
studies have concluded that agricultural productivity growth in Canada has been
lagging behind that of the United States and many OECD countries. Other research
evidence also suggests an economically significant slow-down in agricultural
productivity growth in Canada. However, studies by de Avillez (2011a, b) have
showed that the Canadian agricultural sector has experienced significant labour
productivity growth. Furthermore, some Canadian studies have examined agricultural
24
productivity growth and efficiency for a specific crop or type of livestock farm within
a specific province. Regarding technical efficiency, it has been shown by earlier
studies that methodological characteristics (estimation technique) and other study-
specific characteristics (e.g., functional form, sample size, product analysis,
dimensionality, and geographical region or income level for the region where the farm
data was collected) could affect the empirical estimates of technical efficiency
indicator and lead to conflicting views or evidences.
Hence, to the best of our knowledge, there is no study that examines
productivity growth using data on crops and livestock production in all the provinces
in Canadian while allowing for production inefficiencies as well as further
decomposing TFP growth into scale effects, technical efficiency change and technical
change. In this paper, we address the above issues by using a stochastic frontier
approach that allows for inefficiencies, and disaggregated agricultural data on crops
and livestock from 1940 to 2009 to examine and decompose the TFP growth into
scale effects, technical efficiency change and technical change. The paper also
investigates if agricultural productivity growth in Canada has recently slowed down.
The results indicate that from 1940 to 2009 the productivity growth rates for
the crop sub-sector were on average higher for the Prairie Provinces than for the
Eastern and Atlantic Provinces. During the same period, the productivity growth rates
in the livestock sub-sector were on the average higher in Eastern and Atlantic
Provinces than in the Prairie region with the exception of Manitoba whose TFP
growth is similar to Atlantic Provinces for the period 1990 to 2009. Comparing
average productivity growth in both the crop and livestock sectors for the period 1940
to 2009 to the period 1990 to 2009 we conclude that for most of the provinces and
Canada, the recent average productivity growth rate are higher than the overall
25
average of the entire period. The result implies that there is no evidence of slow-down
in agricultural productivity growth in Canada. However, there is evidence suggesting
a slow-down in productivity growth in the crop sectors in Alberta and Quebec as well
as a slow-down in productivity growth in the livestock sectors in Alberta and British
Columbia.
The productivity changes in the two sub-sectors were mainly driven by
technical changes (such as new seed varieties, progress in controlled genetic
technology; better quality machinery and equipment) and scale effects (arising from
intensive livestock operations, and cropping practices). Specifically, technical change
is the dominant component of the estimated productivity growth for crops in all the
provinces and Canada except Ontario and Quebec. However, the scale effect is the
dominant component of the estimated productivity growth for livestock in all
provinces and for Canada. The contribution of technical progress to productivity
growth in livestock was also significant. Finally, though change in technical
efficiency is mainly positive for both sectors (except for New Brunswick and Nova
Scotia for the crop sector), its contribution to productivity growth was rather very
little for the Provinces.
The decomposition of the TFP growth provides useful insights into the vital
role of research and development (R&D) and in turn government support in
agricultural sector productivity growth. Government support could include measures
such as increasing investment in innovation (for example, improving the stock of
knowledge/basic research, new seed varieties, progress in controlled genetic
technology, cost-effective cropping practices and livestock operations that also reduce
environmental impacts), fostering and facilitating innovation adoption, improving
R&D infrastructure and farmers’ education. Government policies that promote the
26
development of institutions which would improve farmers’ education are very
important to ensure that farmers use existing technologies very effectively as well as
to introduce new and advanced methods of production.
The productivity growth rate that the Canadian agricultural sector has
experienced in the last few decades provides no guarantee that this rate would be
attained in the future. A number of recent studies have suggested that among
developed countries agricultural productivity growth appears to have slowed
significantly during the most recent 10-20 years. The decomposition analysis
undertaken in this paper showed that technical progress is an important determinant of
productivity growth in Canada. Therefore, increasing funding for agricultural research
that increases technical progress is an essential part of the overall agriculture policies.
For instance, private and public investment in agricultural science and technology
could improve agricultural productivity growth significantly. Hence, there is a need
for federal and provincial government intervention to maintain and even increase
productivity growth in Canada.
27
References
Aigner, D., Lovell, C.A.K., and Schmidt, P. (1977). “Formulation and Estimation of
Stochastic Frontier Production Function Models.” Journal of Economics 6:
21–37.
Alston, J. M., Babcock, B. A., and Pardey, P. G. (2010a). Shifting Patterns of Global
Agricultural Productivity: Synthesis and Conclusion. In J. M. Alston, B. A.
Babcock, and P. G. Pardey (Eds.), The Shifting Patterns of Agricultural
Production and Productivity Worldwide. Midwest Agribusiness Trade
Research and Information Center, Iowa State University, Ames, Iowa.
Alston, J. M.,. Beddow, J. M., and Pardey, P. G. (2010b). Global patterns of crop
yields and other partial productivity measures and prices. In J. M. Alston, B.
A. Babcock, and P. G. Pardey (Eds.), The Shifting Patterns of Agricultural
Production and Productivity Worldwide. Midwest Agribusiness Trade
Research and Information Center, Iowa State University, Ames, Iowa.
Amara, N., Traoré, N., Landry, R., & Remain, R. (1999). “Technical Efficiency and
Farmers' Attitudes toward Technological Innovation: The Case of the Potato
Farmers in Quebec”. Canadian Journal of Agricultural Economics, 47, 31-43.
Bravo-Ureta, B., Solís, D., Moreira López, V., Maripani, J., Thiam, A., & Rivas, T.
(2007). “Technical efficiency in farming: a meta-regression analysis”. Journal
of Productivity Analysis, 27, 57-72.
Bruinsma, J. (2009). “The resource outlook to 2050: how much do land, water and
crop yield need to increase by 2050”? Paper presented at the Export Meeting
on How to feed the World in 2050, Rome, Italy, 24-26 June 2009.
Cloutier L, Rowley R (1993), “Relative Technical Efficiency: Data Envelopment
Analysis and Quebec’s Dairy Farms.” Canadian Journal of Agricultural
Economics 41: 169–176.
de Avillez, Ricardo (2011a) “A Detailed Analysis of the Productivity Performance of
the Canadian Primary Agriculture Sector,” CSLS Research Report 2011-06.
Prepared for Agriculture and Agri-Food Canada (Ottawa: Centre for the Study
of Living Standards). http://www.csls.ca/reports/csls2011-06.pdf
de Avillez R (2011b). “A Half-Century of Productivity Growth and Structural
Change in Canadian Agriculture: An Overview.” International Productivity
Monitor 22, pp. 82-99.
Echevarria, C. (1998). “A Three-Factor Production Function: The Case of Canada.”
International Economic Journal 12, pp. 63-75.
Fantino, A.A. and T.S. Veeman (1997) “The Choice of Index Numbers in Measuring
Agricultural Productivity: A Canadian Empirical Case Study.” In Rose, R.,
Tanner, C. and Bellamy, M.A., Issues in Agricultural Competitiveness:
Market and Policies, IAAE Occasional Paper 7: 222-230.
Giannakas K, Schoney R, Tzouvelekas V (2001), “Technical efficiency, technological
change and output growth of wheat farms in Saskatchewan.” Canadian
Journal of Agricultural Economics 49: 135–152.
Gray, R. (2008), “Agricultural Research at a Crossroads”, Canadian Journal of
Agricultural Economics, 56, 1-11.
Green, W.H. (2002), Econometric Analysis, Prentice Hall.
Jondrow, J., Lovell, C.A.K., Materov, I.S. and Schmidt, P. (1982). "On the Estimation
of Technical Inefficiency in the Stochastic Frontier Production Function
Model." Journal of Econometrics 19: 233-238.
28
Kumbhakar S.C. and Lovell C.A.K. (2000). Stochastic Frontier Analysis, Cambridge
University Press.
Aigner, D.J.; Lovell, C.A.K.; Schmidt, P. (1977). “Formulation and Estimation of
Stochastic Frontier Production Functions.” Journal of Econometrics 6:21–37. Tsionas, E. G. and S. C. Kumbhakar (2004). "Markov Switching Stochastic Frontier
Model." The Econometrics Journal 7: 398-425.
Meeusen, W., and van der Broeck, J. (1977). “Efficiency estimation from Cobb–
Douglas Production Functions with Composed Error”, International Economic
Review, 18, 435–444.
Samarajeewa, S., Hailu, G., Jeffrey, S. R., & Bredahl, M. (2011). “Analysis of
production efficiency of beef cow/calf farms in Alberta”. Applied Economics,
1-10.
Statistics Canada. 1991,1996, 2001, 2006. Census of Agriculture. Ottawa.
Stewart, B. (2006). Measures and Causes of Productivity Growth in Prairie
Agriculture: 1940-2004. MS thesis, University of Alberta.
Stewart, B., T.S. Veeman, and J. Unterschultz (2009). “Crops and Livestock
Productivity Growth in the Prairies: The Impacts of Technical Change and
Scale.” Canadian Journal of Agricultural Economics 57(September): 379-394.
Solow, R. M. (1957). “Technical Change and the Aggregate Production Function,”
The Review of Economics and Statistics 39: 312-320.
Veeman, T. S., and Gray, R. (2009). “Agricultural Production and Productivity in
Canada”. Choices 24(4).
Veeman, T. S., and Gray, R. (2010). The Shifting Patterns of Agricultural Production
and Productivity in Canada. In J. M. Alston, B. A. Babcock, and P. G. Pardey
(Eds.), The Shifting Patterns of Agricultural Production and Productivity
Worldwide. Midwest Agribusiness Trade Research and Information Center,
Iowa State University, Ames, Iowa.
Weersink, A., Turvey, C. G., & Godah, A. (1990). “Decomposition Measures of
Technical Efficiency for Ontario Dairy Farms”. Canadian Journal of
Agricultural Economics/Revue canadienne d'agroeconomie, 38, 439-456.
29
APPENDIX A: DATA DESCRIPTION AND METHODODOLOGIES
In this appendix, we provide detail construction of the crop and livestock output and
inputs data use in the paper.
Crops
Crop production in Canada is divided into four categories; field crops, potatoes, fruits,
and vegetables. Field crops comprise the majority of crop cash receipts in Canada,
with the Prairie Provinces having the highest proportions. Saskatchewan has about 98
percent of total crop cash receipts coming from field crops. Field crops include
eighteen different types of crops: wheat, barley, rye, mixed grain, corn for grain,
buckwheat, dry field peas, and others. A number of smaller specialty crops are not
included in total output of field crops; these include Triticale, Canary seed,
Fababeans, Coriander, Safflower, Caraway seed, Borage seed, and Chick peas. These
were left out of total real production because adequate price information was not
available to convert them into real terms. Also, the combined total production of these
specialty crops was found to be less than one percent of the total production of all
field crops in Canada from 1940-2009, and therefore would not affect total production
very much. The data for field crops came from CANSIM table, and the real
production value was determined using the Farm Product Price Index (1997=100) as
follows:
Real production t = (nominal value t / FPPI value t) x 100
The real production of each crop was then added up to obtain a total real production
for Canada and each province. The sum of the total real production of all the
provinces was then compared to the Canada total. The difference between the two
ranged between plus or minus three percent for a given year, but averaged out to be -
30
0.43 percent over the entire period 1940-2009. This means that on average, total real
production for Canada was 0.43 percent lower than the sum of all of the provinces
total production. This difference could easily be from rounding errors and the use of
an average price of all the provinces at the Canada level.
Potatoes are reported separate from field crops by Statistics Canada. Potatoes
comprise about five percent of total crop cash receipts in Canada, with Prince Edward
Island having the largest portion of cash receipts coming from potatoes at 81 percent.
The production of potatoes was converted to real production using the 1997 average
farm price for each province.
Livestock
Livestock output was found using farm cash receipts from 1947 to 2009. The total
production of livestock is comprised of the production of cattle, calves, hogs, sheep,
lambs, dairy products, poultry, eggs, and other livestock and products. These are the
nominal values of livestock production. The farm product price index (FPPI) is then
used to convert the production into real terms as follows:
Real production t = (nominal value t / FPPI value t) x 100
The FPPI did not report values for individual livestock products (cattle and calves,
hogs, poultry, eggs, dairy) prior to 1981. However, a total livestock and animal
products index is reported from 1971 on, and prior to this the total index value is
reported back to 1935. Therefore, the missing values from 1947 to 1981 have been
estimated using a moving average:
FPPI t = Average (FPPI t-1 to FPPI t-12) / Average (FPPI t-2 to FPPI t-13)

31
This data was reported monthly so a twelve period (one year) moving average is used
as it yielded the most reasonable trend when compared to five-year or longer period
moving averages. A yearly average of the index was then used in the transfer of
livestock production from nominal to real terms.
After the farm cash receipts were changed into real terms, an inventory adjustment
was done to account for any sales of livestock products that were produced the
previous year and production in the current year, which was not sold. Yearly closing
stock values were used to do this, with the closing stock of one year equal to the
opening stock of the following year. The FPPI was used to transform these
opening/closing stocks into real terms.2 Therefore, the real value of production is
equal to the real value of livestock cash receipts plus the real value of the inventory
adjustment (closing – opening stocks):
Real value of = Real value of + Real value of - Real value of
production farm cash receipts closing stocks opening
stocks
Dairy products are the only category that did not have an inventory adjustment. This
is because inventory production data was not available. It was believed that, because
dairy products are perishable, inventory would be small or non-existent and thus have
little effect on production levels.
Inputs
The input data has been organized following Stewart (2006). The data is organized
into four main categories; capital, land, labour, and materials. Capital contains the
value of machinery and equipment used in production, the cost of repairs to
2 Inventory adjustment is seen in the “Real and Inventory Adjusted” tab of the livestock output file.
Inventory data comes from various sources which are outlined detailed in the file by product.
32
machinery and equipment, the depreciation value of machinery and equipment, and
the value of livestock inventory. Land is comprised of the value of cropped land, land
in summer fallow, pasture land, buildings, building repairs, building depreciation, and
property tax. Labour contains unpaid and paid labour. Materials include the cost of
fuel, electricity, telephone, custom work, twine, business and crop insurance, fertilizer
and lime, pesticides, commercial seed, feed, artificial insemination and vet fees, and
miscellaneous other expenses.3
Capital inputs come from three different tables. Table 002-0007 contained the data
needed for machinery and equipment, and livestock inventories. It is reported in
thousands of dollars and covered the entire span of this study, 1940-2009. Repair and
depreciation values come from two separate tables, the values for 1940-1970 come
from table 002-0015 and for 1971-2009 table 002-0005 is used. Both are reported in
thousands of dollars. The only manipulation made in the capital section was for the
value of machinery and equipment repairs for the year 1950. This had to be
extrapolated using data from the previous and following year.4 Prior to 1950, fuel
costs were included under the category of “machinery repairs and other machinery
expenses”. After 1950, fuel costs are reported separately, and are recorded in the
materials section of inputs.
Most of the data for land inputs come from the same tables as capital inputs. Land and
building values come from table 002-0007, depreciation, property tax, and building
repair values come from table 002-0005 and table 002-0015. Building repairs include
any costs of repairing fences as well. Cropped land data was obtained from table 001-
0017, and is calculated as the total area, in acres, of seeded land. Pasture land data is
3 All of this data is contained in the file Total Inputs, it is in both nominal and real terms. 4 This can be seen in the file “farm operating expenses and depreciation charges, table 002-0015”.
33
from table 001-0037 for the years 1951-1992. The years prior to and following this
time period was estimated using a five year moving average.5
Pasture land t = pasture land t-1 x [(average pasture land for periods t-1 to t-5)
(average pasture land for periods t-2 to t-6)]
Labour consists of unpaid and paid labour; paid labour is separated into hired labour
and operator labour in the nominal section of labour inputs. Hired labour consists of
paid wages to employees and family members and was obtained from table 002-0015
for the years 1940-1970, and table 002-0005 for 1971-2009. These paid wages include
room and board as well as cash wages, and the value before rebates was used.
Statistics Canada defines operators as those persons responsible for the management
decisions made in the operation of a census farm or agricultural operation, and up to
three operators can be reported per farm. The net income received by farm operators
from farm production was taken as the value of operator labour, from table 380-
0052.6 Unpaid labour was calculated as 70 percent of operator labour, following
Veeman and Fantino (1985).
Data for the materials section came from table 002-0005 and table 002-0015. The cost
of containers is included in pesticides from 1940-1947, after this it was included along
with twine and wire. This is the reason for the drop in pesticide costs between 1947
and 1948.7 Irrigation data was only reported for Canada, Saskatchewan, Alberta, and
British Columbia. The cost of irrigation for Canada is equal to the sum of the cost of
irrigation for Saskatchewan, Alberta, and British Columbia.8 Twine, wire and
containers are reported together starting in 1970, prior to this they were reported
separately except for the period where containers were included in the cost of
5 File “Pasture area, table 001-0037” 6 File “Net income received by farm operators, table 380-0052” 7 The value of pesticides or containers for the period 1940-1947 was not available so the two could not
be separated from “pesticides and containers”. 8 This was the value given for Canada in table 002-0015 and 002-0005, it was not calculated.

34
pesticides, as mentioned before. Therefore, the cost of twine, wire and containers was
calculated by adding the three values together until 1970 when they were reported
together. Artificial insemination and veterinary expenses were also reported together
starting in 1970, prior to this they were reported separately and thus were added
together. The cost of electricity, telephone, custom work, and business insurance are
taken as is from the tables and are reported starting in 1951. Crop insurance is also
taken as is but it is not reported before 1971.
The preceding comprises the nominal value of inputs; this was converted into real
value using the farm product price index. The following conversion formula was
used:
Real Value t = (Nominal Value t / input price index value t) x 100
Some inputs had no input price index (IPI) so alternatives were required. For
depreciation of machinery and equipment (M & E), and buildings the asset IPI was
used. Therefore, IPI for M & E is used for the depreciation of M & E, while the IPI of
building is used for the building depreciation. Some inputs had not IPI so the average
yearly price was used to convert them into real terms. The input was divided by the
current year price per unit, and then multiplied by the 1997 base year price. This was
done for and land values such as summer fallow, cropped land, and pasture land.
Allocating Inputs
Allocating inputs between the livestock and crop sectors requires the use of census of
agriculture data, which is more detailed and separates data by farm type. These farm
types are categorized as follows: wheat, fruits and vegetables, field crops, cattle,
hogs, poultry, mixed farms, and subsistence farms. To be categorized as one of these
35
at least 51 percent (50 percent prior to 1961) of total output must come from the titled
crop (i.e. a farm classified as a cattle farm must have 51 percent of its total output
coming from cattle production). In some census years mixed farms are subdivided
into mixed livestock farms, mixed crop farms, and mixed other. A mixed crop farm is
a farm that has 51 percent of its total production from two or more crop categories
(wheat, fruits and vegetables, field crops). When retrieving the required data, it is
recorded as livestock sector or crop sector, with livestock being equal to the sum of all
farms classified as cattle, hogs, poultry, and mixed livestock. The crop sector is the
sum of all farms classified as wheat, fruits and vegetables, field crop, and mixed crop
farms. Further categories are later added on including grain farms, dairy farms, and
fruits and vegetables are separated.
The required data is cropped land, livestock capital, operator labour, paid
labour, and the value of land and buildings. This is all separated between crops and
livestock.9 After the data was recorded, the share of each category (cropped land,
livestock capital, etc.) was determined for each sector following the methodology
outlined by Stewart (2006). Most of the census data was retrieved from published
Census of Agriculture documents in the University Library. These sector shares were
then used to allocate the inputs between the Livestock and Crop sectors. The share of
machinery and equipment was used to allocate all of the Capital inputs except
livestock Inventory, which did not require allocation as it is solely a livestock input.
The allocation was completed by simply taking the total input value of capital and
multiplying it by the sector share. All Land inputs were allocated using the sector
share of the value of land and buildings. Some land was only used for one sector;
cropped land and summer fallow land are entirely crop inputs while pasture land is
9 The file “Census Data Requirements” contains all this data; it is categorized by census year, and
province. The table number from which the data was obtained is also recorded for each census year.
36
exclusively a livestock input. Two sector shares were used to allocate Labour inputs.
The share of operator labour was used to allocate unpaid labour as well as operator
labour, while the share of paid labour was used to allocate paid wages.
This leaves the inputs in the materials category to be allocated. Irrigation, fertilizer
and lime, pesticides, commercial seed, and crop insurance are solely a crop sector
input while feed, artificial insemination and vet expenses are livestock sector inputs
and thus do not need to be allocated. The remaining materials inputs are allocated
using one of the above methods or on the crop and livestock’s share of value of total
output. Fuel is allocated using the capital shares, electricity using the land and
building shares, and telephone using the labour share. Custom work, miscellaneous
expenses, business insurance, and twine, wire, and containers are allocated using the
crop and livestock’s share of value of total output. This was done using the total crop
cash receipts and total livestock cash receipts as proxies for the value of total crop
output in each year.
Related Documents


![Agricultural Productivity, Comparative Advantage, and ...lib.cufe.edu.cn/upload_files/other/4_20140530024310_[59]matsuyama... · Agricultural Productivity, Comparative Advantage,](https://static.cupdf.com/doc/110x72/5b1eab367f8b9a22028bd7eb/agricultural-productivity-comparative-advantage-and-libcufeeducnuploadfilesother42014053002431059matsuyama.jpg)


