Paleoclimate record in the Nubian Sandstone Aquifer, Sinai Peninsula, Egypt Abdou Abouelmagd a,b , Mohamed Sultan a, ⁎, Neil C. Sturchio c , Farouk Soliman b , Mohamed Rashed b , Mohamed Ahmed a,b , Alan E. Kehew a , Adam Milewski d , Kyle Chouinard a a Department of Geosciences, Western Michigan University, Kalamazoo, MI 49008-5200, USA b Department of Geology, Suez Canal University, Ismailia, 41522, Egypt c Department of Earth and Environmental Sciences, University of Illinois at Chicago, Chicago, IL 60607-7059, USA d Department of Geology, University of Georgia, Athens, GA 30602, USA abstract article info Article history: Received 15 April 2013 Available online 4 December 2013 Keywords: Paleoclimate Nubian Sandstone Aquifer System (NSAS) Sinai Peninsula Noble gases 14 C adjusted model age Paleowesterlies Paleomonsoon Sixteen groundwater samples collected from production wells tapping Lower Cretaceous Nubian Sandstone and fractured basement aquifers in Sinai were analyzed for their stable isotopic compositions, dissolved noble gas con- centrations (recharge temperatures), tritium activities, and 14 C abundances. Results define two groups of samples: Group I has older ages, lower recharge temperatures, and depleted isotopic compositions (adjusted 14 C model age: 24,000–31,000 yr BP; δ 18 O: -9.59‰ to -6.53‰; δ 2 H: -72.9‰ to -42.9‰; b 1 TU; and recharge T: 17.5–22.0°C) compared to Group II (adjusted 14 C model age: 700–4700 yr BP; δ 18 O: -5.89‰ to -4.84‰; δ 2 H: -34.5‰ to - 24.1‰; b 1 to 2.78 TU; and recharge T: 20.6–26.2°C). Group II samples have isotopic compositions similar to those of average modern rainfall, with larger d-excess values than Group I waters, and locally measurable tritium activity (up to 2.8 TU). These observations are consistent with (1) the Nubian Aquifer being largely recharged prior to and/or during the Last Glacial Maximum (represented by Group I), possibly through the intensification of paleowesterlies; and (2) continued sporadic recharge during the relatively dry and warmer interglacial period (represented by Group II) under conditions similar to those of the present. © 2013 University of Washington. Published by Elsevier Inc. All rights reserved. Introduction The Nubian Sandstone Aquifer System (NSAS) is one of the largest fresh groundwater reserves in the world (area: 2 × 10 6 km 2 ; volume: 780 × 10 3 km 3 )(Thorweihe, 1990). This transboundary aquifer is pres- ent throughout a large area of North Africa, including northwestern Sudan, northeastern Chad, eastern Libya, and western Egypt (inset Fig. 1a). The Nubian Sandstone extends in the Sinai Peninsula; it is ex- posed at the foothills of the Precambrian basement outcrops in Sinai and in the Negev desert and underlies large segments of the central Sinai Peninsula and the southern part of the Negev desert (Said, 1962; Issar et al., 1972)(Fig. 1). The NSAS is composed of thick (up to 3 km in basin center) sequences of unfossiliferous continental sandstone with intercalated shale of shallow marine and deltaic origin, uncon- formably overlying basement rocks (Himida, 1970; Shata, 1982; Hesse et al., 1987). There is a general consensus that the paleoclimatic regimes of the North African Sahara Desert alternated between dry and wet periods throughout the Pleistocene Epoch and that it was during these wet pe- riods that the NSAS was recharged. However, the nature of these wet periods remains a subject of debate. Two main hypotheses have been advocated to address the origin of the fossil water of the NSAS: (1) in- tensification of paleowesterlies during glacial periods (Sonntag et al., 1978; Sultan et al., 1997; Frumkin et al., 2000; Bartov et al., 2002; Brookes, 2003; Issar, 2003; Issar and Zohar, 2004; Sturchio et al., 2004; Vaks et al., 2006; Issar, 2010; Abouelmagd et al., 2012) or (2) intensifi- cation of paleomonsoons during interglacial periods (Yan and Petit- Maire, 1994; Bar-Yosef and Meadow, 1995; Bar-Matthews et al., 2003; Almogi-Labin et al., 2004; Osmond and Dabous, 2004). The model pertaining to intensification of paleowesterlies during the glacial pe- riods is supported by a variety of field, geochronologic, and isotopic ev- idence. For example, glacial periods were humid in the eastern Mediterranean, as indicated by (1) the isotopic compositions of speleothems collected from a cave in Jerusalem (Frumkin et al., 2000) and from a cave in the central mountain range in Israel (Vaks et al., 2003); (2) the areal extent of deposits from Lake Lisan (precursor of the Dead Sea), which reached its maximum level during the Last Glacial Maximum (Bartov et al., 2002, 2003; Torfstein et al., 2013) or just prior to it (Lisker et al., 2009); and (3) identification of modern westerly wind regimes that produce precipitation that has isotopic compositions sim- ilar to those of the NSAS paleowaters (Abouelmagd et al., 2012). The monsoonal hypothesis, in contrast, is supported by a number of argu- ments including the age record of sapropels over the past 250 ka (Rossignol-Strick, 1983). The organic-rich black layers that were Quaternary Research 81 (2014) 158–167 ⁎ Corresponding author at: Department of Geosciences, Western Michigan University, 1903 W. Michigan Avenue, Kalamazoo, Michigan 49008, USA. Fax: +1 269 387 5513. E-mail address: [email protected] (M. Sultan). 0033-5894/$ – see front matter © 2013 University of Washington. Published by Elsevier Inc. All rights reserved. http://dx.doi.org/10.1016/j.yqres.2013.10.017 Contents lists available at ScienceDirect Quaternary Research journal homepage: www.elsevier.com/locate/yqres

Welcome message from author
This document is posted to help you gain knowledge. Please leave a comment to let me know what you think about it! Share it to your friends and learn new things together.
Transcript
Quaternary Research 81 (2014) 158–167
Contents lists available at ScienceDirect
Quaternary Research
j ourna l homepage: www.e lsev ie r .com/ locate /yqres
Paleoclimate record in the Nubian Sandstone Aquifer, SinaiPeninsula, Egypt
Abdou Abouelmagd a,b, Mohamed Sultan a,⁎, Neil C. Sturchio c, Farouk Soliman b, Mohamed Rashed b,Mohamed Ahmed a,b, Alan E. Kehew a, Adam Milewski d, Kyle Chouinard a
a Department of Geosciences, Western Michigan University, Kalamazoo, MI 49008-5200, USAb Department of Geology, Suez Canal University, Ismailia, 41522, Egyptc Department of Earth and Environmental Sciences, University of Illinois at Chicago, Chicago, IL 60607-7059, USAd Department of Geology, University of Georgia, Athens, GA 30602, USA
⁎ Corresponding author at: Department of Geosciences1903 W. Michigan Avenue, Kalamazoo, Michigan 49008, U
E-mail address: [email protected] (M. Sul
0033-5894/$ – see front matter © 2013 University of Wahttp://dx.doi.org/10.1016/j.yqres.2013.10.017
a b s t r a c t
a r t i c l e i n f oArticle history:Received 15 April 2013Available online 4 December 2013
Keywords:PaleoclimateNubian Sandstone Aquifer System (NSAS)Sinai PeninsulaNoble gases14C adjusted model agePaleowesterliesPaleomonsoon
Sixteen groundwater samples collected from production wells tapping Lower Cretaceous Nubian Sandstone andfractured basement aquifers in Sinai were analyzed for their stable isotopic compositions, dissolved noble gas con-centrations (recharge temperatures), tritium activities, and 14C abundances. Results define two groups of samples:Group I has older ages, lower recharge temperatures, and depleted isotopic compositions (adjusted 14Cmodel age:24,000–31,000 yr BP; δ18O:−9.59‰ to−6.53‰; δ2H:−72.9‰ to−42.9‰; b1 TU; and recharge T: 17.5–22.0°C)compared to Group II (adjusted 14C model age: 700–4700 yr BP; δ18O: −5.89‰ to −4.84‰; δ2H: −34.5‰ to −24.1‰; b1 to 2.78 TU; and recharge T: 20.6–26.2°C). Group II samples have isotopic compositions similar tothose of average modern rainfall, with larger d-excess values than Group I waters, and locally measurable tritiumactivity (up to 2.8 TU). These observations are consistent with (1) the Nubian Aquifer being largely rechargedprior to and/or during the Last Glacial Maximum (represented by Group I), possibly through the intensificationof paleowesterlies; and (2) continued sporadic recharge during the relatively dry and warmer interglacial period(represented by Group II) under conditions similar to those of the present.
© 2013 University of Washington. Published by Elsevier Inc. All rights reserved.
Introduction
The Nubian Sandstone Aquifer System (NSAS) is one of the largestfresh groundwater reserves in the world (area: 2 × 10⁶ km2; volume:780 × 103 km3) (Thorweihe, 1990). This transboundary aquifer is pres-ent throughout a large area of North Africa, including northwesternSudan, northeastern Chad, eastern Libya, and western Egypt (insetFig. 1a). The Nubian Sandstone extends in the Sinai Peninsula; it is ex-posed at the foothills of the Precambrian basement outcrops in Sinaiand in the Negev desert and underlies large segments of the centralSinai Peninsula and the southern part of the Negev desert (Said, 1962;Issar et al., 1972) (Fig. 1). The NSAS is composed of thick (up to 3 kmin basin center) sequences of unfossiliferous continental sandstonewith intercalated shale of shallow marine and deltaic origin, uncon-formably overlying basement rocks (Himida, 1970; Shata, 1982; Hesseet al., 1987).
There is a general consensus that the paleoclimatic regimes of theNorth African Sahara Desert alternated between dry and wet periodsthroughout the Pleistocene Epoch and that it was during these wet pe-riods that the NSAS was recharged. However, the nature of these wet
, Western Michigan University,SA. Fax: +1 269 387 5513.
tan).
shington. Published by Elsevier Inc. A
periods remains a subject of debate. Two main hypotheses have beenadvocated to address the origin of the fossil water of the NSAS: (1) in-tensification of paleowesterlies during glacial periods (Sonntag et al.,1978; Sultan et al., 1997; Frumkin et al., 2000; Bartov et al., 2002;Brookes, 2003; Issar, 2003; Issar and Zohar, 2004; Sturchio et al., 2004;Vaks et al., 2006; Issar, 2010; Abouelmagd et al., 2012) or (2) intensifi-cation of paleomonsoons during interglacial periods (Yan and Petit-Maire, 1994; Bar-Yosef and Meadow, 1995; Bar-Matthews et al., 2003;Almogi-Labin et al., 2004; Osmond and Dabous, 2004). The modelpertaining to intensification of paleowesterlies during the glacial pe-riods is supported by a variety of field, geochronologic, and isotopic ev-idence. For example, glacial periods were humid in the easternMediterranean, as indicated by (1) the isotopic compositions ofspeleothems collected from a cave in Jerusalem (Frumkin et al., 2000)and from a cave in the central mountain range in Israel (Vaks et al.,2003); (2) the areal extent of deposits from Lake Lisan (precursor ofthe Dead Sea), which reached its maximum level during the Last GlacialMaximum (Bartov et al., 2002, 2003; Torfstein et al., 2013) or just priorto it (Lisker et al., 2009); and (3) identification ofmodernwesterlywindregimes that produce precipitation that has isotopic compositions sim-ilar to those of the NSAS paleowaters (Abouelmagd et al., 2012). Themonsoonal hypothesis, in contrast, is supported by a number of argu-ments including the age record of sapropels over the past 250 ka(Rossignol-Strick, 1983). The organic-rich black layers that were
ll rights reserved.
159A. Abouelmagd et al. / Quaternary Research 81 (2014) 158–167
deposited by the River Nile during heavy Africanmonsoons in the easternMediterranean were found to coincide in their depositional age with theastronomically driven maximum summer insolation in the northern tro-pics. Simulations (fromgeneral circulationmodels) also revealed contem-poraneous intensification of African monsoons with increasing summerinsolation in the Northern Hemisphere (Prell and Kutzbach, 1987).
There is also a general consensus that the NSAS was largelyrecharged in previous wet climatic periods. However, geochemicaldata (O, H stable isotope compositions) for groundwater samplesfrom recharge areas in southern Sinai (Fig. 2), geophysical (electrical re-sistivity soundings) data, and rainfall – runoff modeling have shownthat in some areas where relatively high precipitation occurs, as is thecase in Sinai, local recharge areas are still receiving modern recharge(Sultan et al., 2011).
In this study, we investigate the nature of the wet climatic periodsthat recharged the NSAS and examine whether the NSAS was rechargingduring relatively dry climatic conditions similar to the ones currently pre-vailing. Our approach involves (1) estimation of 14Cmodel ages of Nubianpaleowaters to identify the timing of paleo-recharge periods; (2) estima-tion of recharge temperatures for paleowaters from dissolved noble gasconcentrations and through comparisons to current mean annual airtemperature (MAAT) to examine the nature of recharge periods (lowtemperatures are indicative of recharge during glacial periods, whereashigh temperatures are consistent with recharge during interglacial pe-riods); and (3) examination of the tritium activities in the groundwaterfrom the NSAS and comparison of stable isotopic composition with thatof modern precipitation in the region to evaluate the extent of additionalmodern recharge. The Sinai Peninsula in Egypt was selected as our studyarea for the reasons discussed below.
Study area
Twomain groups of rock units are exposed across the Sinai Peninsula(Fig. 1): (1) the Precambrian basement complex consisting of gneisses,volcano-sedimentary successions, and granitoids of the Arabian–NubianShield Massif in the south; and (2) the Phanerozoic sedimentary succes-sions to the north (Sultan et al., 1988; Stern and Kroner, 1993; Blasbandet al., 2000). The Phanerozoic successions vary in thickness and composi-tion from south to north. Continental facies (up to 2000 m thick) aredominant in the south, and thickmarine facies (~8000 m thick) are dom-inant in the north (Alsharhan and Salah, 1996). From south to north,gently inclined sedimentary rocks of Paleozoic to Eocene age in centralSinai give way to strongly folded Triassic to Cretaceous Formations thatare overlain by Paleocene and Eocene formations. These Precambrianrocks and Phanerozoic sequences are covered by dune fields of Quaterna-ry age in northern Sinai (JICA, 1999).
The NSAS is composed of unfossiliferous continental sandstone ofLower Cretaceous age intercalated with shale of shallowmarine and del-taic origin of theMalha Formation in central and southern Sinai (Abdallahet al., 1963) and marine limestone of the Risan Aneiza Formation innorthern Sinai (Said, 1971). The Malha and the Risan Aneiza Formationsare part of the Nubian Sandstone group that rests unconformably on thebasement rock units (Shata, 1982) and is overlain by calcareous se-quences of Cenomanian to Upper Eocene age (Said, 1962) (Fig. 1b).
The Sinai Peninsula (61 × 103 km2) receives relatively high amountsof precipitation compared to the other Egyptian desert areas. Using 3-hourly precipitation data (1998 to 2011) from the Tropical Rainfall Mea-suring Mission (TRMM; v7A), the average annual precipitation over theWestern Desert, Eastern Desert, and Sinai was found to be 9 mm/yr,13 mm/yr, and 70 mm/yr, respectively. TRMM is a joint space missionbetween NASA and the Japan Aerospace Exploration Agency (JAXA)thatwas designed tomonitor tropical and subtropical rainfall. Themoun-tainous basement complex in southern Sinai receives the highestamounts of precipitation in Sinai (EMA, 1996; Geb, 2000); precipitationis collected and channeled throughmain streams by the extensive streamnetwork in the area. The main streams at the foothills and north of the
basement complex are floored by the NSAS outcrop, which providesopportunities for infiltration and recharge through initial and transmis-sion losses (Fig. 1). Rainfall in the area is caused primarily by cyclonicwinter storms passing over the Mediterranean depressions and trackingsoutheast. Because of their sporadic nature and the presence of extensivestream networks that channel runoff from large watersheds into a fewmain valleys, these storms are often associated with flash-floodingevents.
Analytical methods
Fieldwork was conducted in January and June of 2010 to samplegroundwater from 12 drilled wells and from the Ayun Musa spring,which taps the NSAS and from three open wells in the fractured base-ment. The wells are evenly distributed over the northern, central, andsouthern parts of the Sinai Peninsula and along the Gulf of Suez coastalzone (Fig. 1). The samples from theNSAS define two groups on the basisof total well depth (TD), depth to static water level (DWL), and proxim-ity to recharge areas. Group I samples were collected from eight deepwells (TD: 747–1250 m; DWL: 137–377 m) and from a spring, all ofwhich are located far (N150 km) from recharge areas (Fig. 1). These in-clude Arif El Naqa 2, El Themed 2, El Hasana 3, Sudr El Hetan 3, ElKuntella 3, Nekhel 5, Egirah El Far 4, El Berouk 4, and Ayun Musa.Group II samples (El Rueikna 3, Mekatab 3, Nadya El Soda, and Regwa12) were collected from four shallow wells (TD: 63–366 m; DWL:19–56 m) that are proximal (b40 km) to recharge areas (Fig. 1).Three additional samples were collected from wells (Haroun, Halwagy,and Dir El Banat) tapping alluvial and fractured basement aquifers insouthern Sinai. Samples were collected to be analyzed for (1) stable iso-topic compositions of hydrogen and oxygen in water and carbon in dis-solved inorganic carbon (DIC); (2) 14C abundance in DIC for model ageestimation; (3) dissolved noble gas concentrations for estimation ofnoble gas recharge temperatures; and (4) tritium (3H) activities. Theanalytical methods used for each of these analyses are briefly describedbelow.
Wells were pumped for a minimum of 30 min prior to sample col-lection. The wells were purged until the pH and Ec readings stabilizedand the sampled groundwater was clear. Unfiltered and unacidifiedwater samples were collected in tightly capped 30-mL glass bottles forstable isotopic (δ2H, δ18O, and δ13C) analyses (Tables 1 and 2). The Hand O isotopic ratios were analyzed using a Picarro Cavity Ring-downSpectroscopy (CRDS) laser system (Lehmann et al., 2009). Carbon iso-tope analysis of DIC was performed on CO2 released by acid digestionusing H3PO4 andmeasured by dual-inlet isotope-ratio mass spectrome-try. Hydrogen, oxygen, and carbon stable isotope ratios are reportedusing conventional delta (δ) notation, in units of per mil (‰) deviationrelative to theVienna StandardMeanOceanWater (V-SMOW)whereby
δ;‰ ¼ Rsample–Rstd
� �=Rstd
h i� 1000
and R = 2H/1H, 18O/16O or 13C/12C (Coplen, 1996). Reproducibility of δvalues for 2H is ± 1‰ and those of 18O and 13C are ±0.2‰ and ±0.1‰, respectively.
Tritium (3H), the radioactive isotope of hydrogen, was producedduring the atmospheric testing of nuclear fusion bombs between 1953and 1964 and is used as a tracer for recharge,flow, andmixingprocessesof young groundwater (Plummer et al., 1993). Because natural back-ground tritium activity in the atmosphere was low (about 5 TU) priorto bomb testing, groundwater with tritium activities less than about0.5 TU must have been derived from precipitation that fell before1953. Tritium activity was determined by counting after tritium enrich-ment by electrolysis of the water. A half-life of 12.43 yr was used to cal-culate the resulting TU (tritium unit) values, where 1 TU is equal to atritium/hydrogen ratio of 10−18. Analyses (O, H, 3H) were conductedat Isotech Laboratories, in Champaign, Illinois.
160 A. Abouelmagd et al. / Quaternary Research 81 (2014) 158–167
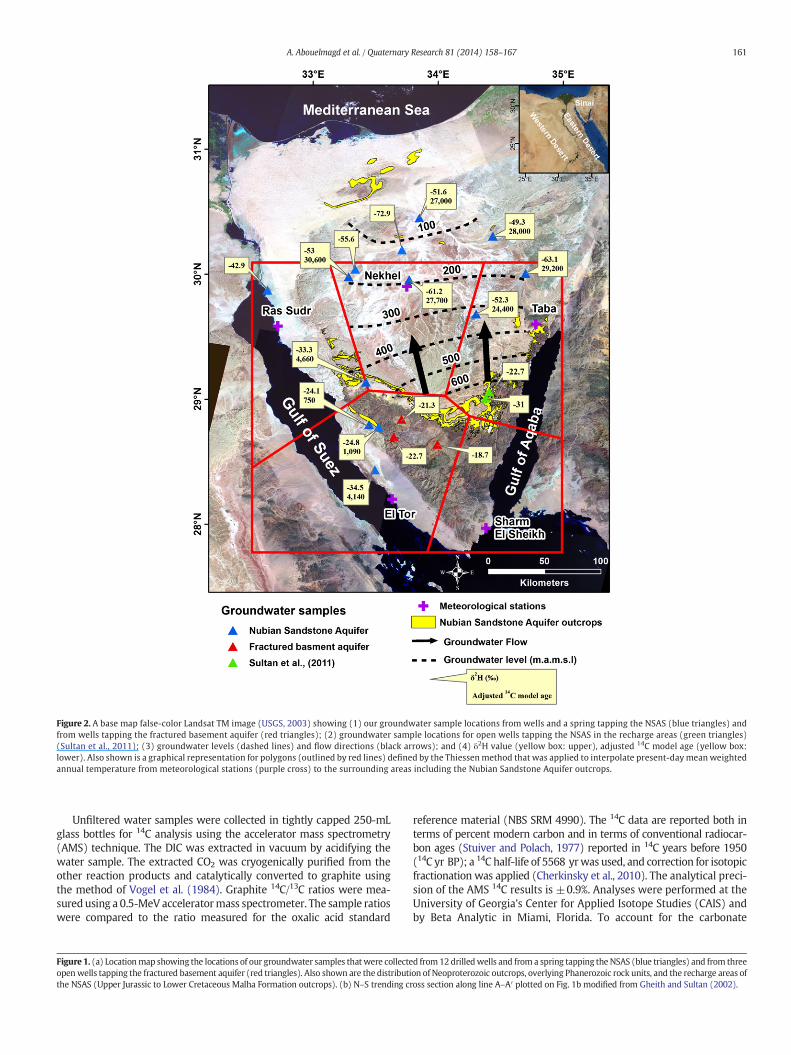
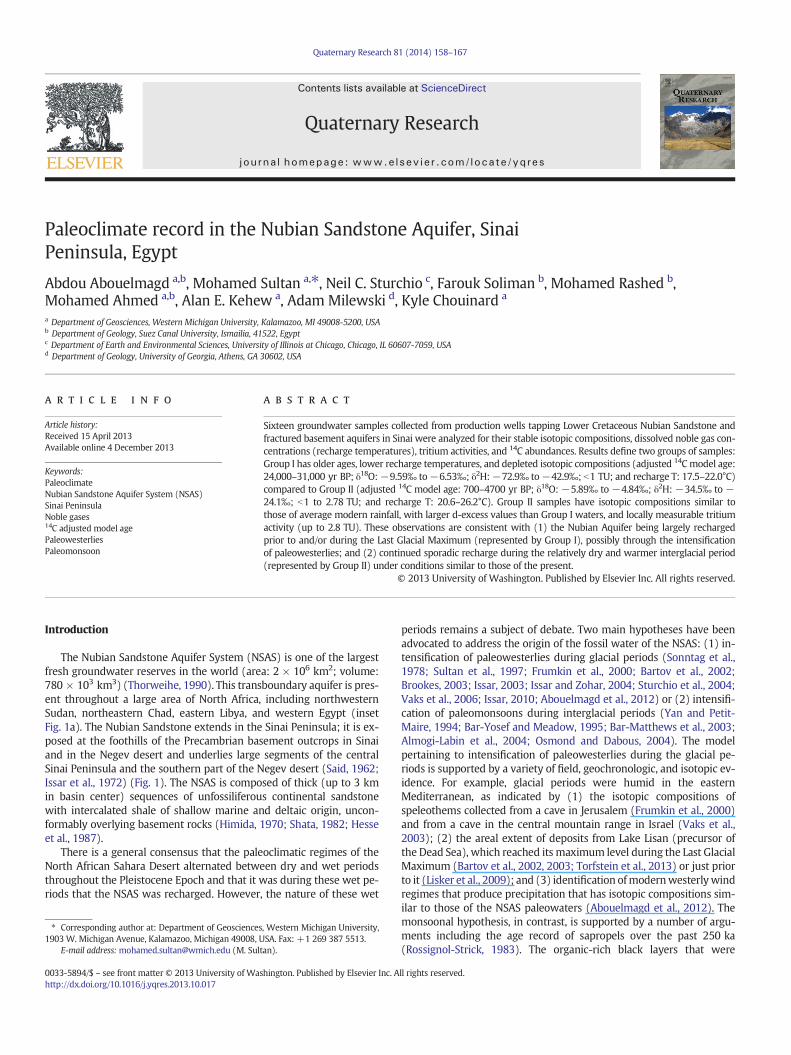
Figure 2. A base map false-color Landsat TM image (USGS, 2003) showing (1) our groundwater sample locations from wells and a spring tapping the NSAS (blue triangles) andfrom wells tapping the fractured basement aquifer (red triangles); (2) groundwater sample locations for open wells tapping the NSAS in the recharge areas (green triangles)(Sultan et al., 2011); (3) groundwater levels (dashed lines) and flow directions (black arrows); and (4) δ2H value (yellow box: upper), adjusted 14C model age (yellow box:lower). Also shown is a graphical representation for polygons (outlined by red lines) defined by the Thiessenmethod that was applied to interpolate present-daymeanweightedannual temperature from meteorological stations (purple cross) to the surrounding areas including the Nubian Sandstone Aquifer outcrops.
161A. Abouelmagd et al. / Quaternary Research 81 (2014) 158–167
Unfiltered water samples were collected in tightly capped 250-mLglass bottles for 14C analysis using the accelerator mass spectrometry(AMS) technique. The DIC was extracted in vacuum by acidifying thewater sample. The extracted CO2 was cryogenically purified from theother reaction products and catalytically converted to graphite usingthe method of Vogel et al. (1984). Graphite 14C/13C ratios were mea-suredusing a 0.5-MeV acceleratormass spectrometer. The sample ratioswere compared to the ratio measured for the oxalic acid standard
Figure 1. (a) Locationmap showing the locations of our groundwater samples that were collecteopenwells tapping the fractured basement aquifer (red triangles). Also shown are the distributithe NSAS (Upper Jurassic to Lower Cretaceous Malha Formation outcrops). (b) N–S trending cr
reference material (NBS SRM 4990). The 14C data are reported both interms of percent modern carbon and in terms of conventional radiocar-bon ages (Stuiver and Polach, 1977) reported in 14C years before 1950(14C yr BP); a 14C half-life of 5568 yrwas used, and correction for isotopicfractionation was applied (Cherkinsky et al., 2010). The analytical preci-sion of the AMS 14C results is ±0.9%. Analyses were performed at theUniversity of Georgia's Center for Applied Isotope Studies (CAIS) andby Beta Analytic in Miami, Florida. To account for the carbonate
d from12 drilledwells and from a spring tapping the NSAS (blue triangles) and from threeon of Neoproterozoic outcrops, overlying Phanerozoic rock units, and the recharge areas ofoss section along line A–A′ plotted on Fig. 1b modified from Gheith and Sultan (2002).
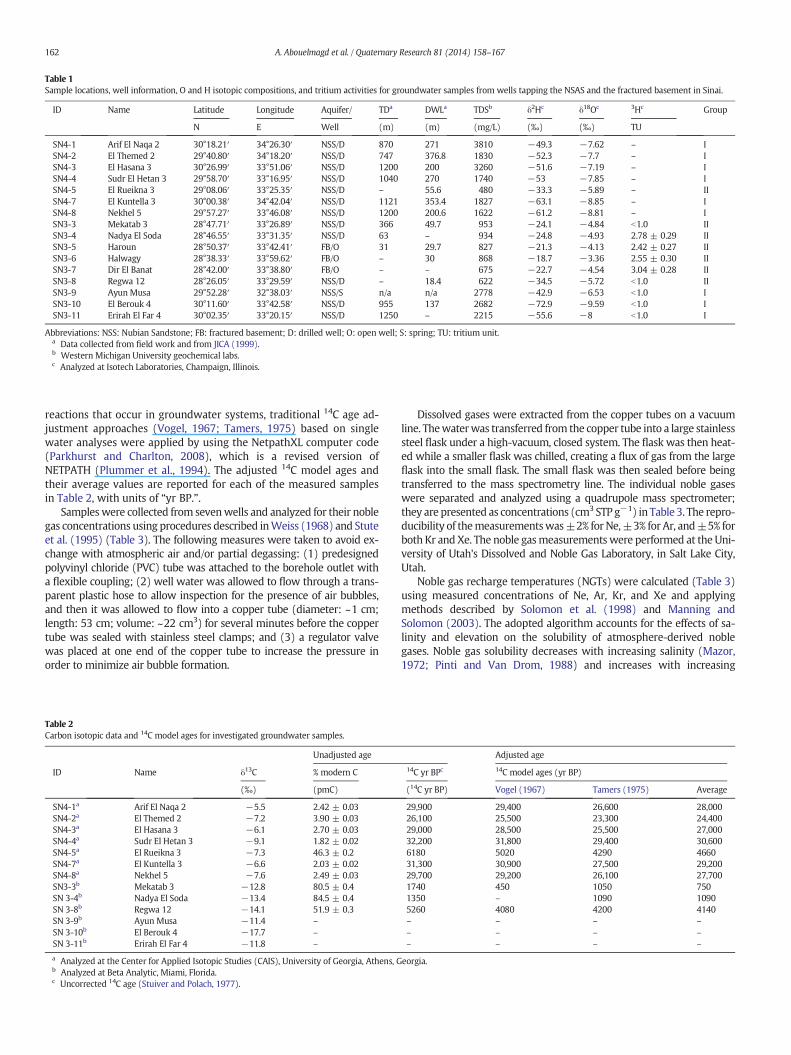
Table 1Sample locations, well information, O and H isotopic compositions, and tritium activities for groundwater samples from wells tapping the NSAS and the fractured basement in Sinai.
ID Name Latitude Longitude Aquifer/ TDa DWLa TDSb δ2Hc δ18Oc 3Hc Group
N E Well (m) (m) (mg/L) (‰) (‰) TU
SN4-1 Arif El Naqa 2 30°18.21′ 34°26.30′ NSS/D 870 271 3810 −49.3 −7.62 – ISN4-2 El Themed 2 29°40.80′ 34°18.20′ NSS/D 747 376.8 1830 −52.3 −7.7 – ISN4-3 El Hasana 3 30°26.99′ 33°51.06′ NSS/D 1200 200 3260 −51.6 −7.19 – ISN4-4 Sudr El Hetan 3 29°58.70′ 33°16.95′ NSS/D 1040 270 1740 −53 −7.85 – ISN4-5 El Rueikna 3 29°08.06′ 33°25.35′ NSS/D – 55.6 480 −33.3 −5.89 – IISN4-7 El Kuntella 3 30°00.38′ 34°42.04′ NSS/D 1121 353.4 1827 −63.1 −8.85 – ISN4-8 Nekhel 5 29°57.27′ 33°46.08′ NSS/D 1200 200.6 1622 −61.2 −8.81 – ISN3-3 Mekatab 3 28°47.71′ 33°26.89′ NSS/D 366 49.7 953 −24.1 −4.84 b1.0 IISN3-4 Nadya El Soda 28°46.55′ 33°31.35′ NSS/D 63 – 934 −24.8 −4.93 2.78 ± 0.29 IISN3-5 Haroun 28°50.37′ 33°42.41′ FB/O 31 29.7 827 −21.3 −4.13 2.42 ± 0.27 IISN3-6 Halwagy 28°38.33′ 33°59.62′ FB/O – 30 868 −18.7 −3.36 2.55 ± 0.30 IISN3-7 Dir El Banat 28°42.00′ 33°38.80′ FB/O – – 675 −22.7 −4.54 3.04 ± 0.28 IISN3-8 Regwa 12 28°26.05′ 33°29.59′ NSS/D – 18.4 622 −34.5 −5.72 b1.0 IISN3-9 Ayun Musa 29°52.28′ 32°38.03′ NSS/S n/a n/a 2778 −42.9 −6.53 b1.0 ISN3-10 El Berouk 4 30°11.60′ 33°42.58′ NSS/D 955 137 2682 −72.9 −9.59 b1.0 ISN3-11 Erirah El Far 4 30°02.35′ 33°20.15′ NSS/D 1250 – 2215 −55.6 −8 b1.0 I
Abbreviations: NSS: Nubian Sandstone; FB: fractured basement; D: drilled well; O: open well; S: spring; TU: tritium unit.a Data collected from field work and from JICA (1999).b Western Michigan University geochemical labs.c Analyzed at Isotech Laboratories, Champaign, Illinois.
162 A. Abouelmagd et al. / Quaternary Research 81 (2014) 158–167
reactions that occur in groundwater systems, traditional 14C age ad-justment approaches (Vogel, 1967; Tamers, 1975) based on singlewater analyses were applied by using the NetpathXL computer code(Parkhurst and Charlton, 2008), which is a revised version ofNETPATH (Plummer et al., 1994). The adjusted 14C model ages andtheir average values are reported for each of the measured samplesin Table 2, with units of “yr BP.”.
Sampleswere collected from sevenwells and analyzed for their noblegas concentrations using procedures described inWeiss (1968) and Stuteet al. (1995) (Table 3). The following measures were taken to avoid ex-change with atmospheric air and/or partial degassing: (1) predesignedpolyvinyl chloride (PVC) tube was attached to the borehole outlet witha flexible coupling; (2) well water was allowed to flow through a trans-parent plastic hose to allow inspection for the presence of air bubbles,and then it was allowed to flow into a copper tube (diameter: ~1 cm;length: 53 cm; volume: ~22 cm3) for several minutes before the coppertube was sealed with stainless steel clamps; and (3) a regulator valvewas placed at one end of the copper tube to increase the pressure inorder to minimize air bubble formation.
Table 2Carbon isotopic data and 14C model ages for investigated groundwater samples.
Unadjusted age
ID Name δ13C % modern C
(‰) (pmC)
SN4-1a Arif El Naqa 2 −5.5 2.42 ± 0.03SN4-2a El Themed 2 −7.2 3.90 ± 0.03SN4-3a El Hasana 3 −6.1 2.70 ± 0.03SN4-4a Sudr El Hetan 3 −9.1 1.82 ± 0.02SN4-5a El Rueikna 3 −7.3 46.3 ± 0.2SN4-7a El Kuntella 3 −6.6 2.03 ± 0.02SN4-8a Nekhel 5 −7.6 2.49 ± 0.03SN3-3b Mekatab 3 −12.8 80.5 ± 0.4SN 3-4b Nadya El Soda −13.4 84.5 ± 0.4SN 3-8b Regwa 12 −14.1 51.9 ± 0.3SN 3-9b Ayun Musa −11.4 –
SN 3-10b El Berouk 4 −17.7 –
SN 3-11b Erirah El Far 4 −11.8 –
a Analyzed at the Center for Applied Isotopic Studies (CAIS), University of Georgia, Athens, Gb Analyzed at Beta Analytic, Miami, Florida.c Uncorrected 14C age (Stuiver and Polach, 1977).
Dissolved gases were extracted from the copper tubes on a vacuumline. Thewaterwas transferred from the copper tube into a large stainlesssteel flask under a high-vacuum, closed system. The flask was then heat-ed while a smaller flask was chilled, creating a flux of gas from the largeflask into the small flask. The small flask was then sealed before beingtransferred to the mass spectrometry line. The individual noble gaseswere separated and analyzed using a quadrupole mass spectrometer;they are presented as concentrations (cm3 STP g−1) in Table 3. The repro-ducibility of themeasurementswas±2% forNe,±3% for Ar, and±5% forboth Kr and Xe. The noble gasmeasurementswere performed at the Uni-versity of Utah's Dissolved and Noble Gas Laboratory, in Salt Lake City,Utah.
Noble gas recharge temperatures (NGTs) were calculated (Table 3)using measured concentrations of Ne, Ar, Kr, and Xe and applyingmethods described by Solomon et al. (1998) and Manning andSolomon (2003). The adopted algorithm accounts for the effects of sa-linity and elevation on the solubility of atmosphere-derived noblegases. Noble gas solubility decreases with increasing salinity (Mazor,1972; Pinti and Van Drom, 1988) and increases with increasing
Adjusted age
14C yr BPc 14C model ages (yr BP)
(14C yr BP) Vogel (1967) Tamers (1975) Average
29,900 29,400 26,600 28,00026,100 25,500 23,300 24,40029,000 28,500 25,500 27,00032,200 31,800 29,400 30,6006180 5020 4290 466031,300 30,900 27,500 29,20029,700 29,200 26,100 27,7001740 450 1050 7501350 – 1090 10905260 4080 4200 4140– – – –
– – – –
– – – –
eorgia.
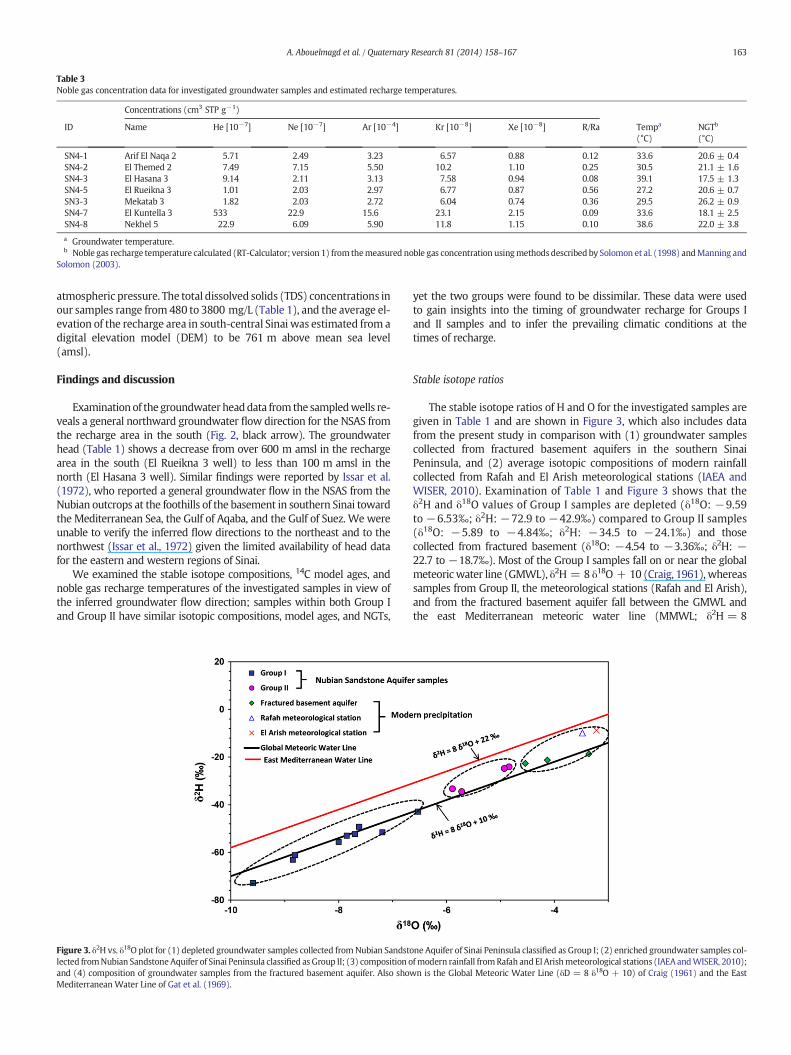
Table 3Noble gas concentration data for investigated groundwater samples and estimated recharge temperatures.
Concentrations (cm3 STP g−1)
ID Name He [10−7] Ne [10−7] Ar [10−4] Kr [10−8] Xe [10−8] R/Ra Tempa
(°C)NGTb
(°C)
SN4-1 Arif El Naqa 2 5.71 2.49 3.23 6.57 0.88 0.12 33.6 20.6 ± 0.4SN4-2 El Themed 2 7.49 7.15 5.50 10.2 1.10 0.25 30.5 21.1 ± 1.6SN4-3 El Hasana 3 9.14 2.11 3.13 7.58 0.94 0.08 39.1 17.5 ± 1.3SN4-5 El Rueikna 3 1.01 2.03 2.97 6.77 0.87 0.56 27.2 20.6 ± 0.7SN3-3 Mekatab 3 1.82 2.03 2.72 6.04 0.74 0.36 29.5 26.2 ± 0.9SN4-7 El Kuntella 3 533 22.9 15.6 23.1 2.15 0.09 33.6 18.1 ± 2.5SN4-8 Nekhel 5 22.9 6.09 5.90 11.8 1.15 0.10 38.6 22.0 ± 3.8
a Groundwater temperature.b Noble gas recharge temperature calculated (RT-Calculator; version 1) from themeasured noble gas concentration usingmethods described by Solomon et al. (1998) andManning and
Solomon (2003).
163A. Abouelmagd et al. / Quaternary Research 81 (2014) 158–167
atmospheric pressure. The total dissolved solids (TDS) concentrations inour samples range from 480 to 3800 mg/L (Table 1), and the average el-evation of the recharge area in south-central Sinai was estimated from adigital elevation model (DEM) to be 761 m above mean sea level(amsl).
Findings and discussion
Examinationof the groundwater headdata from the sampledwells re-veals a general northward groundwater flow direction for the NSAS fromthe recharge area in the south (Fig. 2, black arrow). The groundwaterhead (Table 1) shows a decrease from over 600 m amsl in the rechargearea in the south (El Rueikna 3 well) to less than 100 m amsl in thenorth (El Hasana 3 well). Similar findings were reported by Issar et al.(1972), who reported a general groundwater flow in the NSAS from theNubian outcrops at the foothills of the basement in southern Sinai towardthe Mediterranean Sea, the Gulf of Aqaba, and the Gulf of Suez. We wereunable to verify the inferred flow directions to the northeast and to thenorthwest (Issar et al., 1972) given the limited availability of head datafor the eastern and western regions of Sinai.
We examined the stable isotope compositions, 14C model ages, andnoble gas recharge temperatures of the investigated samples in view ofthe inferred groundwater flow direction; samples within both Group Iand Group II have similar isotopic compositions, model ages, and NGTs,
Figure 3. δ2H vs. δ18O plot for (1) depleted groundwater samples collected fromNubian Sandstolected fromNubian SandstoneAquifer of Sinai Peninsula classified as Group II; (3) composition oand (4) composition of groundwater samples from the fractured basement aquifer. Also showMediterranean Water Line of Gat et al. (1969).
yet the two groups were found to be dissimilar. These data were usedto gain insights into the timing of groundwater recharge for Groups Iand II samples and to infer the prevailing climatic conditions at thetimes of recharge.
Stable isotope ratios
The stable isotope ratios of H and O for the investigated samples aregiven in Table 1 and are shown in Figure 3, which also includes datafrom the present study in comparison with (1) groundwater samplescollected from fractured basement aquifers in the southern SinaiPeninsula, and (2) average isotopic compositions of modern rainfallcollected from Rafah and El Arish meteorological stations (IAEA andWISER, 2010). Examination of Table 1 and Figure 3 shows that theδ2H and δ18O values of Group I samples are depleted (δ18O: −9.59to −6.53‰; δ2H: −72.9 to −42.9‰) compared to Group II samples(δ18O: −5.89 to −4.84‰; δ2H: −34.5 to −24.1‰) and thosecollected from fractured basement (δ18O: −4.54 to −3.36‰; δ2H: −22.7 to −18.7‰). Most of the Group I samples fall on or near the globalmeteoricwater line (GMWL), δ2H = 8 δ18O + 10 (Craig, 1961), whereassamples from Group II, the meteorological stations (Rafah and El Arish),and from the fractured basement aquifer fall between the GMWL andthe east Mediterranean meteoric water line (MMWL; δ2H = 8
ne Aquifer of Sinai Peninsula classified as Group I; (2) enriched groundwater samples col-fmodern rainfall fromRafah and El Arishmeteorological stations (IAEA andWISER, 2010);n is the Global Meteoric Water Line (δD = 8 δ18O + 10) of Craig (1961) and the East

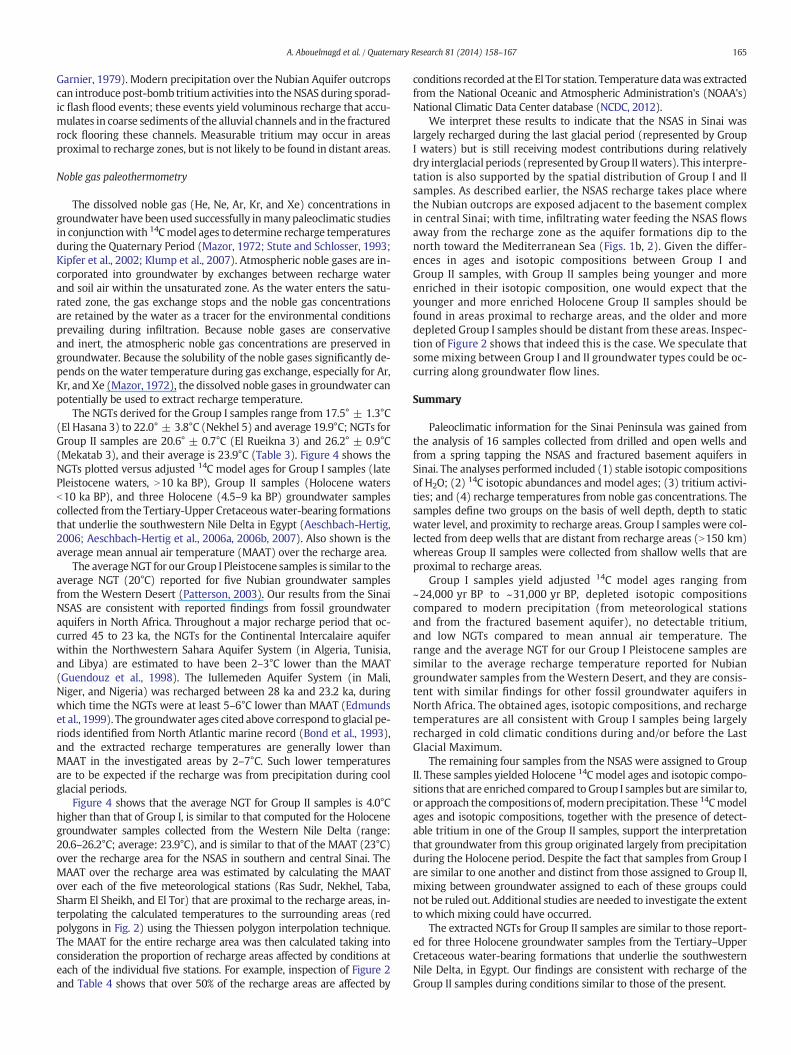
Figure 4. Calculated noble gas recharge temperatures vs. adjusted 14C model ages for Group I Pleistocene samples, Group II Holocene samples, and three Holocene groundwater samplescollected from Western Nile Delta (Aeschbach-Hertig, 2006; Aeschbach-Hertig et al., 2006a, 2006b, 2007).
164 A. Abouelmagd et al. / Quaternary Research 81 (2014) 158–167
δ18O + 22) (Gat et al., 1969) indicating differences in precipitationmois-ture sources.
The basement samples are believed to represent modern me-teoric precipitation, and they have isotopic compositions similar tothose of average rainfall compositions over the Rafah (δ18O: −3.48‰; δ2H: −9.86‰) and El Arish (δ18O: −3.22‰; δ2H: −8.81‰)meteorological stations (Fig. 1). The depleted nature of the Group Isamples and the enriched nature of the Group II samples are consis-tent with the former being rechargedmainly under conditions coolerthan those of the present day (Gat et al., 1969) and the latter beingrecharged primarily during warmer periods, similar to the present.The wide range of isotopic compositions for Group I samples andthe fact that a few have compositions that approach those of GroupII could be interpreted to indicate mixing of older Group I waterswith younger Group II waters.
Radiocarbon model ages
The calculation of accurate groundwater age from 14C measurementscan be complicated by the effects of carbonate rock–water interactions,groundwater mixing, and diffusive exchange of 14C with aquitards(Fontes and Garnier, 1979; Sanford, 1997). Depending on aquifer-specific considerations, these processes can affect apparent groundwaterages substantially, such that all 14C groundwater ages are highly model-dependent (e.g., Plummer and Sprinkle, 2001). Fortunately, the effectsof carbonate rock–water interaction and diffusive exchange with
Table 4Calculation of the modern average weighted temperatures over Nubian Sandstonerecharge areas in central Sinai Peninsula using the Thiessen polygon method.
Station name Latitude(DD)
Longitude(DD)
MAATstationa
(°C)
Rechargeareab
(km2)
Rechargeareac
(fraction)
MAATd
(°C)
Ras Sudr 29.58300 33.71700 20.6 246 0.182 3.76Nekhel 29.68000 34.30333 17.8 47 0.352 0.63Taba 30.44983 33.85100 25 695 0.516 12.9El Tor 29.97833 33.28250 21.7 216 0.161 3.48Sharm El Sheikh 29.13433 33.42250 21.7 143 0.107 2.31TOTAL 1347 0.100 23.1
a Average temperature recorded over the past 35 yr (NCDC, 2012).b Area of Nubian outcrops (recharge areas) that were assigned to each of the fivemete-
orological stations using the Thiessen polygon method.c Proportion of Nubian outcrops that were assigned to each of the five stations.d MAAT for recharge area (23.1°C) calculated from the product of the MAAT for each
station and the proportion of recharge areas affected by the individual stations.
aquitards are relatively minimal in thick sandstone aquifers. We reportconventional 14C ages that are uncorrected for these effects, along withadjusted 14C model ages calculated by NetPath XL (Parkhurst andCharlton, 2008) using the adjustments proposed by Vogel (1967) andTamers (1975). The reasonable agreement between the calculated 14Cmodel ages indicates to us that they are reliable indicators of mean sub-surface residence time, albeit with significant errors. Nonetheless, adjust-ed 14Cmodel ages (Table 2, Figs. 2 and 4) showdistinct ranges for GroupsI and II. Group I samples are older and originated from precipitationduring the late Pleistocene (adjusted 14C model ages: ~24,000 yrBP to ~31,000 yr BP), which we infer to have been a period of wetclimate, whereas Group II samples are younger and were formed fromprecipitation during the Holocene (adjusted 14C model ages: ~700 yr BPto ~4700 yr BP). The adjusted 14C model ages of the Group I samplesshould be further corrected by adding 3000 to 4000 yr to account forthe offset of the 14C time scale determined from calibration of the 14Ctime scale with precise comparison of mass spectrometricmeasurementsof 14C and 230Th–234U–238U systematics of pristine corals (Fairbanks et al.,2005). This correction yields a corresponding model age range of27,000–35,000 yr BP; this range slightly pre-dates the 19,000–26,500 yr BP Last Glacial Maximum (Clark et al., 2009) and it over-laps the 31–35 ka high stand of Lake Lisan (Pleistocene precursorof the Dead Sea) according to U–Th dates on cave stromatolites(Lisker et al., 2009). However, we cannot be certain that potential re-actions with carbonate rocks and diffusive effects have not increasedthe apparent 14C ages in our Group I water samples. The youngerages of our Group II water samples support the interpretation thatthe NSAS has also received recharge contributions during the Holo-cene Period.
Tritium activities
Tritium activities for the groundwater samples collected from frac-tured basement ranged from 2.4 ± 0.3 to 3.0 ± 0.3 TU, indicatingthat all waters were derived at least partly from precipitation that oc-curred within the past 60 yr. None of the analyzed Group I sampleshad detectable tritium activities (b1 TU), whereas one of the Group IIsamples (Nadya El Soda) had tritium activity (2.8 ± 0.3) indicative ofthe presence of post-bomb precipitation (younger than ~60 yr;Table 1). This sample also had slightly less 14C activity than modernwater (84.5% modern C), indicating possible mixing of older and youn-ger water in this well, which is located in a wide wadi near thebasement-Nubian Sandstone contact. Alternatively, it may reflect thecharacteristic 14C activity of recharge water in this region (Fontes and
165A. Abouelmagd et al. / Quaternary Research 81 (2014) 158–167
Garnier, 1979). Modern precipitation over the Nubian Aquifer outcropscan introduce post-bomb tritiumactivities into theNSAS during sporad-ic flash flood events; these events yield voluminous recharge that accu-mulates in coarse sediments of the alluvial channels and in the fracturedrock flooring these channels. Measurable tritium may occur in areasproximal to recharge zones, but is not likely to be found in distant areas.
Noble gas paleothermometry
The dissolved noble gas (He, Ne, Ar, Kr, and Xe) concentrations ingroundwater have been used successfully inmany paleoclimatic studiesin conjunctionwith 14Cmodel ages to determine recharge temperaturesduring the Quaternary Period (Mazor, 1972; Stute and Schlosser, 1993;Kipfer et al., 2002; Klump et al., 2007). Atmospheric noble gases are in-corporated into groundwater by exchanges between recharge waterand soil air within the unsaturated zone. As the water enters the satu-rated zone, the gas exchange stops and the noble gas concentrationsare retained by the water as a tracer for the environmental conditionsprevailing during infiltration. Because noble gases are conservativeand inert, the atmospheric noble gas concentrations are preserved ingroundwater. Because the solubility of the noble gases significantly de-pends on the water temperature during gas exchange, especially for Ar,Kr, and Xe (Mazor, 1972), the dissolved noble gases in groundwater canpotentially be used to extract recharge temperature.
The NGTs derived for the Group I samples range from 17.5° ± 1.3°C(El Hasana 3) to 22.0° ± 3.8°C (Nekhel 5) and average 19.9°C; NGTs forGroup II samples are 20.6° ± 0.7°C (El Rueikna 3) and 26.2° ± 0.9°C(Mekatab 3), and their average is 23.9°C (Table 3). Figure 4 shows theNGTs plotted versus adjusted 14C model ages for Group I samples (latePleistocene waters, N10 ka BP), Group II samples (Holocene watersb10 ka BP), and three Holocene (4.5–9 ka BP) groundwater samplescollected from the Tertiary-Upper Cretaceous water-bearing formationsthat underlie the southwestern Nile Delta in Egypt (Aeschbach-Hertig,2006; Aeschbach-Hertig et al., 2006a, 2006b, 2007). Also shown is theaverage mean annual air temperature (MAAT) over the recharge area.
The average NGT for our Group I Pleistocene samples is similar to theaverage NGT (20°C) reported for five Nubian groundwater samplesfrom the Western Desert (Patterson, 2003). Our results from the SinaiNSAS are consistent with reported findings from fossil groundwateraquifers in North Africa. Throughout a major recharge period that oc-curred 45 to 23 ka, the NGTs for the Continental Intercalaire aquiferwithin the Northwestern Sahara Aquifer System (in Algeria, Tunisia,and Libya) are estimated to have been 2–3°C lower than the MAAT(Guendouz et al., 1998). The Iullemeden Aquifer System (in Mali,Niger, and Nigeria) was recharged between 28 ka and 23.2 ka, duringwhich time the NGTs were at least 5–6°C lower than MAAT (Edmundset al., 1999). The groundwater ages cited above correspond to glacial pe-riods identified from North Atlantic marine record (Bond et al., 1993),and the extracted recharge temperatures are generally lower thanMAAT in the investigated areas by 2–7°C. Such lower temperaturesare to be expected if the recharge was from precipitation during coolglacial periods.
Figure 4 shows that the average NGT for Group II samples is 4.0°Chigher than that of Group I, is similar to that computed for the Holocenegroundwater samples collected from the Western Nile Delta (range:20.6–26.2°C; average: 23.9°C), and is similar to that of the MAAT (23°C)over the recharge area for the NSAS in southern and central Sinai. TheMAAT over the recharge area was estimated by calculating the MAATover each of the five meteorological stations (Ras Sudr, Nekhel, Taba,Sharm El Sheikh, and El Tor) that are proximal to the recharge areas, in-terpolating the calculated temperatures to the surrounding areas (redpolygons in Fig. 2) using the Thiessen polygon interpolation technique.The MAAT for the entire recharge area was then calculated taking intoconsideration the proportion of recharge areas affected by conditions ateach of the individual five stations. For example, inspection of Figure 2and Table 4 shows that over 50% of the recharge areas are affected by
conditions recorded at the El Tor station. Temperature datawas extractedfrom the National Oceanic and Atmospheric Administration's (NOAA's)National Climatic Data Center database (NCDC, 2012).
We interpret these results to indicate that the NSAS in Sinai waslargely recharged during the last glacial period (represented by GroupI waters) but is still receiving modest contributions during relativelydry interglacial periods (represented byGroup II waters). This interpre-tation is also supported by the spatial distribution of Group I and IIsamples. As described earlier, the NSAS recharge takes place wherethe Nubian outcrops are exposed adjacent to the basement complexin central Sinai; with time, infiltrating water feeding the NSAS flowsaway from the recharge zone as the aquifer formations dip to thenorth toward the Mediterranean Sea (Figs. 1b, 2). Given the differ-ences in ages and isotopic compositions between Group I andGroup II samples, with Group II samples being younger and moreenriched in their isotopic composition, one would expect that theyounger and more enriched Holocene Group II samples should befound in areas proximal to recharge areas, and the older and moredepleted Group I samples should be distant from these areas. Inspec-tion of Figure 2 shows that indeed this is the case. We speculate thatsome mixing between Group I and II groundwater types could be oc-curring along groundwater flow lines.
Summary
Paleoclimatic information for the Sinai Peninsula was gained fromthe analysis of 16 samples collected from drilled and open wells andfrom a spring tapping the NSAS and fractured basement aquifers inSinai. The analyses performed included (1) stable isotopic compositionsof H2O; (2) 14C isotopic abundances and model ages; (3) tritium activi-ties; and (4) recharge temperatures from noble gas concentrations. Thesamples define two groups on the basis of well depth, depth to staticwater level, and proximity to recharge areas. Group I samples were col-lected from deep wells that are distant from recharge areas (N150 km)whereas Group II samples were collected from shallow wells that areproximal to recharge areas.
Group I samples yield adjusted 14C model ages ranging from~24,000 yr BP to ~31,000 yr BP, depleted isotopic compositionscompared to modern precipitation (from meteorological stationsand from the fractured basement aquifer), no detectable tritium,and low NGTs compared to mean annual air temperature. Therange and the average NGT for our Group I Pleistocene samples aresimilar to the average recharge temperature reported for Nubiangroundwater samples from the Western Desert, and they are consis-tent with similar findings for other fossil groundwater aquifers inNorth Africa. The obtained ages, isotopic compositions, and rechargetemperatures are all consistent with Group I samples being largelyrecharged in cold climatic conditions during and/or before the LastGlacial Maximum.
The remaining four samples from the NSAS were assigned to GroupII. These samples yielded Holocene 14C model ages and isotopic compo-sitions that are enriched compared to Group I samples but are similar to,or approach the compositions of,modern precipitation. These 14Cmodelages and isotopic compositions, together with the presence of detect-able tritium in one of the Group II samples, support the interpretationthat groundwater from this group originated largely from precipitationduring the Holocene period. Despite the fact that samples from Group Iare similar to one another and distinct from those assigned to Group II,mixing between groundwater assigned to each of these groups couldnot be ruled out. Additional studies are needed to investigate the extentto which mixing could have occurred.
The extracted NGTs for Group II samples are similar to those report-ed for three Holocene groundwater samples from the Tertiary–UpperCretaceous water-bearing formations that underlie the southwesternNile Delta, in Egypt. Our findings are consistent with recharge of theGroup II samples during conditions similar to those of the present.
166 A. Abouelmagd et al. / Quaternary Research 81 (2014) 158–167
We interpret these results to indicate that the NSAS was largelyrecharged during the last glacial period (represented byGroup I waters)but that it is still receiving modest contributions during the Holoceneperiod (represented by Group II waters). This model is also supportedby the spatial distribution of Group I and II samples, where the youngerHolocene Group II samples are found in areas proximal to rechargeareas, and the older Group II samples are found in areas distant from re-charge areas. Our findings suggest that the wet periods in northernAfrica were glacial periods; during these periods paleowesterlies wereintensified and the Saharan aquifers were recharged. During the inter-leaving dry periods such as the one prevailing at present, recharge ismodest and is localized to areas where the aquifer crops out andwhere precipitation is relatively high (e.g., southern Sinai inNSAS). Sim-ilar studies are recommended to investigate the validity of this hypoth-esis over the remaining Saharan aquifers.
Acknowledgments
This study is supported by the National Aeronautics and Space Ad-ministration (NASA) (grant NNX08AJ85G) and by the North AtlanticTreaty Organization (NATO) Science for Peace (grant SFP 982614) grantstoWestern Michigan University. We thank the Editor and the Reviewersof Quaternary Research for their instructive comments and suggestions,Professor K. Solomon and Mr. A. Rigby (The University of Utah, SaltLake City, Utah) for providing the required field training for samplingnoble gases, Professor W. Aeschbach-Hertig (University of Heidelberg)for the constructive discussion about the paleotemperatures of thesouthwestern Nile Delta region.
References
Abdallah, A.M., Adindani, A., Fahmy, N., 1963. Stratigraphy of Upper Paleozoic Rocks,Western Side of the Gulf of Suez, Egypt. Egyptian Geological Survey 1–18.
Abouelmagd, A., Sultan,M.,Milewski, A., Kehew, A.E., Sturchio, N.C., Soliman, F., Krishnamurthy,R.V., Cutrim, E., 2012. Toward a better understanding of palaeoclimatic regimes thatrecharged the fossil aquifers in North Africa: inferences from stable isotope and remotesensing data. Palaeogeography, Palaeoclimatology, Palaeoecology 329–330, 137–149.
Aeschbach-Hertig, W., 2006. Environmental tracer study of groundwater recharge nearthe Nile Delta, Egypt. DPG-Tagung, Heidelberg, unpublished report.
Aeschbach-Hertig,W., El-Gamal, H., Dahab, K., Kipfer, R., Bonani, G., 2006a. Environmentaltracer study of groundwater recharge near the Nile Delta, Egypt. Determiningpaleotemperature and other variables by using an error-weighted, nonlinear inver-sion of noble gas concentrations in water. Geochimica et Cosmochimica Acta 63,2315–2336.
Aeschbach-Hertig, W., El-Gamal, H., Dahab, K., Kipfer, R., Hajdas, I., Bonani, G., 2006b.Using environmental tracers to assess groundwater resources in reclamation areasof Egypt. Geophysical Research Abstracts 8, A-05515.
Aeschbach-Hertig, W., El-Gamal, H., Dahab, K., Friedrich, R., Kipfer, R., Hajdase, I.,2007. Identifying and dating the origin of groundwater resources in reclamationareas of Egypt. Advances in Isotope Hydrology and its Role in Sustainable WaterResources Management. International Atomic Energy Agency (IAEA), Vienna,pp. 395–403.
Almogi-Labin, A., Bar-Matthews,M., Ayalon, A., 2004. Climate variability in the Levant andnortheast Africa during the Late Quaternary based on marine and land records. In:Goren-Inbar, N., Speth, J.D. (Eds.), Human Paleoecology in the Levantine Corridor.Oxbow Press, Oxford, pp. 117–134.
Alsharhan, A.S., Salah, M.G., 1996. Geologic setting and hydrocarbon potential of NorthSinai, Egypt. Bulletin of Canadian Petroleum Geology 44, 615–631.
Bar-Matthews, M., Ayalon, A., Gilmour, M., Matthews, A., Hawkesworth, C.J., 2003. Sea–land oxygen isotopic relationships from planktonic foraminifera and speleothemsin the Eastern Mediterranean region and their implication for paleorainfall during in-terglacial intervals. Geochimica et Cosmochimica Acta 67, 3181–3199.
Bartov, Y., Stein, M., Enzel, Y., Agnon, A., Reches, Z., 2002. Lake levels and sequence stra-tigraphy of Lake Lisan, the late Pleistocene precursor of the Dead Sea. Quaternary Re-search 57, 9–21.
Bartov, Y., Goldstein, S.L., Stein, M., Enzel, Y., 2003. Catastrophic arid episodes in the eastMediterranean linked with the Atlantic Heinrich events. Geology 31, 439–442.
Bar-Yosef, O., Meadow, R., 1995. The origins of agriculture in the Near East. In: Price, T.D.,Gebauer, A.B. (Eds.), The Last Hunters—First Farmers: Perspectives on the PrehistoricTransition to Agriculture. School of American Research Press, Santa Fe, New Mexico,pp. 39–94.
Blasband, B., White, S., Brooijmans, P., De Boorder, H., Visser, W., 2000. Late Proterozoicextensional collapse in the Arabian–Nubian Shield. Journal of the Geological Societyof London 157, 615–628.
Bond, G., Broecker, W., Johnson, S., McManus, J., Labeyrie, L., Jouzel, J., Bonani, G.B., 1993.Correlation between climate records from North Atlantic sediments and Greenlandice. Nature 365, 507–508.
Brookes, I.A., 2003. Geomorphic indicators of Holocene winds in Egypt's Western Desert.Geomorphology 56, 155–166.
Cherkinsky, A.E., Culp, R.A., Dvoracek, D.K., Noakes, J.E., 2010. Status of the AMS facility atthe University of Georgia. Nuclear Instruments and Methods in Physics Research 268,867–870.
Clark, P.U., Dyke, A.S., Sakun, J.D., Carlson, A.E., Clark, J., Wohlfarth, B., Mitrovica, J.X.,Hostetler, S.W., McCabe, A.M., 2009. The last glacial maximum. Science 325, 710–714.
Coplen, T.B., 1996. New guidelines for reporting stable hydrogen, carbon, and oxygenisotope-ratio data. Geochimica et Cosmochimica Acta 60, 3359–3360.
Craig, H., 1961. Isotopic variations in meteoric waters. Science 133, 1702–1703.Edmunds, W.M., Fellman, E., Goni, I.B., 1999. Lakes, groundwater and paleohydrology in
the Sahel of NE Nigerai: evidence from hydrogeochemistry. Journal of the GeologicalSociety of London 156, 45–355.
Egyptian Meteorological Authority (EMA), 1996. Climatic Atlas of Egypt. Egyptian Meteo-rological Authority, Ministry of Transport and Communications, Cairo, Egypt.
Fairbanks, R.G., Mortlock, R.A., Chiu, T.-C., Cao, L., Kaplan, A., Guilderson, T.P., Fairbanks,T.W., Bloom, A.L., Grootes, P.M., Nadeau, M.-J., 2005. Radiocarbon calibration curvespanning 0 to 50,000 years BP based on paired 230Th/234U/238U and 14C dates on pris-tine corals. Quaternary Science Reviews 24, 1781–1796.
Fontes, J.-C., Garnier, J.-M., 1979. Determination of the initial 14C activity of the total dis-solved carbon: a review of the existing models and a new approach.Water ResourcesResearch 15, 399–413.
Frumkin, A., Ford, D.C., Schwarcz, H.P., 2000. Paleoclimate and vegetation of the last glacialcycles in Jerusalem from a speleothem record. Global Biogeochemical Cycles 1, 1–9.
Gat, J.R., Mazor, E., Tzur, Y., 1969. The stable isotope composition of mineral waters in theJordan Rift Valley, Israel. Journal of Hydrology 7, 334–352.
Geb, M., 2000. Factors favouring precipitation in North Africa: seen from the viewpoint ofpresent-day meteorology. Global and Planetary Change 26, 85–96.
Gheith, H., Sultan, M., 2002. Construction of a hydrologic model for estimating wadi runoffandgroundwater recharge in the EasternDesert, Egypt. Journal ofHydrology263, 36–55.
Guendouz, A., Moulla, A.S., Edmunds, W.M., Shand, P., Poole, J., Zouari, K., Mamou, A.,1998. Palaeoclimatic information contained in groundwater of the Grand ERG Orien-tal, North Africa. Isotope Techniques in the Study of Past and Current EnvironmentalChanges in the Hydrosphere and Atmosphere. IAEA, Vienna, pp. 555–571.
Hesse, K.H., Hissese, A., Kheir, O., Schnacker, E., Schneider, M., Thorweihe, U., 1987.Hydrogeological investigations in the Nubian Aquifer system, Eastern Sahara. In:Kilitzsch, E., Schranck, E. (Eds.), Research in Egypt and Sudan. Dietrich Reimer, Berlin,pp. 397–464.
Himida, H., 1970. The Nubian artesian basin, its regional hydrogeological aspects andpalaeohydrological reconstruction. Journal of Hydrology 9, 89–116.
International Atomic Energy Agency (IAEA), Water Isotope System for Data Analysis,Visualization, Electronic Retrieval (WISER), 2010. Water Isotope System for DataAnalysis, Visualization, and Electronic Retrieval, 7th ed.
Issar, A., 2003. Climate Changes During the Holocene and their Impact on HydrologicalSystems. Cambridge University Press, Cambridge, United Kingdom 144.
Issar, A., 2010. Climate change as a draw bridge between Africa and theMiddle East. Glob-al and Planetary Change 72, 451–454.
Issar, A., Zohar, M., 2004. Climate Change—Environment and Civilization in the MiddleEast. Springer, Berlin 252.
Issar, A., Bein, A., Michaeli, A., 1972. On the ancient water of the Upper Nubian Sandstoneaquifer in central Sinai and southern Israel. Journal of Hydrology 17, 353–374.
Japan International Cooperation Agency (JICA), 1999. South Sinai Groundwater ResourcesStudy in the Arab Republic of Egypt, Tokyo, Japan. 220.
Kipfer, R., Aeschbach-Hertig, W., Peeters, F., Stute, M., 2002. Noble gases in lakes andground waters. In: Porcelli, D., Ballentine, C., Wieler, R. (Eds.), Reviews in Mineralogyand Geochemistry, Noble gases in Geochemistry and Cosmochemistry. MineralogicalSociety of America and Geochemical Society, Washington, DC, pp. 615–700.
Klump, S., Tomonaga, Y., Kienzler, P., Kinzelbach, W., Baumann, T., Imboden, D.M., Kipfer,R., 2007. Field experiments yield new insights into gas exchange and excess air for-mation in natural porous media. Geochimica et Cosmochimica Acta 71, 1385–1397.
Lehmann, K.K., Berden, G., Engeln, R., 2009. An Introduction to Cavity Ring-Down Spec-trometry. In: Berden, G., Engeln, R. (Eds.), Cavity Ring-Down Spectrometry Tech-niques and Applications. John Wiley & Sons Ltd., United Kingdom, pp. 1–26.
Lisker, S., Vaks, A., Bar-Matthews, M., Porat, R., Frumkin, A., 2009. Stromatolites in caves ofthe Dead Sea Fault Escarpment: implications to latest Pleistocene lake levels and tec-tonic subsidence. Quaternary Science Reviews 28, 80–92.
Manning, A.H., Solomon, D.K., 2003. Using noble gases to investigate mountain-front re-charge. Journal of Hydrology 275, 194–207.
Mazor, E., 1972. Paleotemperatures and other hydrological parameters deduced fromnoble gases dissolved in groundwaters; Jordan Rift Valley, Israel. Geochimica etCosmochimica Acta 36, 1321–1336.
National Climate Data Center (NCDC), 2012. Surface Data, Global Summary of the Day andHourly Global. URL: http://www7.ncdc.noaa.gov/CDO/cdo.
Osmond, J.K., Dabous, A.A., 2004. Timing and intensity of groundwater movement duringEgyptian Sahara pluvial periods by U-series analysis of secondary U in ores and car-bonates. Quaternary Research 61, 85–94.
Parkhurst, D.L., Charlton, S.R., 2008. NetpathXL—An Excel® Interface to the ProgramNETPATH: U.S. Geological Survey Techniques and Methods 6–A26 (11 pp.).
Patterson, L.J., 2003. Chlorine-36 and stable chlorine isotopes in the Nubian Aquifer,WesternDesert, Egypt. Earth and Environmental Sciences.University of Illinois, Chicago 81.
Pinti, D.L., Van Drom, E., 1988. PALEOTEMP: a Mathematica® program for evaluatingpaleotemperatures from the concentration of atmosphere-derived noble gases ingroundwater. Computers & Geosciences 24, 33–41.
167A. Abouelmagd et al. / Quaternary Research 81 (2014) 158–167
Plummer, L.N., Sprinkle, C.L., 2001. Radiocarbon dating of dissolved inorganic carbon ingroundwater from confined parts of the Upper Floridan aquifer, Florida, USA. Hydro-geology Journal 9, 127–150.
Plummer, L.N., Michel, R.L., Thurman, E.M., Glynn, P.D., 1993. Environmental tracers forage dating young ground water. Regional ground-water quality.Van NostrandReinhold, New York 255–294.
Plummer, L.N., Prestemon, E.C., Parkhurst, D.L., 1994. An interactive code (NETPATH) formodeling net geochemical reactions along a flow path Version 2.0. U.S. GeologicalSurvey Water-Resources Investigations Report 94–4169.
Prell, W.L., Kutzbach, J.E., 1987. Monsoon variability over the past 150,000 years. Journalof Geophysical Research 92, 8411–8425.
Rossignol-Strick, M., 1983. African monsoons, an immediate climate response to orbitalinsolation. Nature 304, 46–49.
Said, R., 1962. The Geology of Egypt. Elsevier, Amsterdam 377.Said, R., 1971. Explanatory Notes to Accompany the Geological Map of Egypt. Geological
Survey of Egypt, Cairo 123.Sanford,W.E., 1997. Correcting for diffusion in carbon-14 dating of groundwater. Ground-
water 35, 357–361.Shata, A., 1982. Hydrogeology of the Great Nubian Sandstone basin, Egypt. Quarterly Jour-
nal of Engineering Geology 15, 127–133.Solomon, D.K., Cook, P.G., Sanford, W.E., 1998. Dissolved gases in subsurface hydrology.
In: Kendall, C., McDonnell, J.J. (Eds.), Isotope Tracers in Catchment Hydrology.Elsevier, Amsterdam, pp. 291–318.
Sonntag, C., Klitzsch, E., Lohnert, E.P., El Shazly, E.M., Munnich, K.O., Junghans, C.,Thorweihe, U., Weistroffer, K., Swailem, F.M., 1978. Paleoclimatic Information fromDeuterium and Oxygen-18 in Carbon-14-dated North Saharian groundwaters. Iso-tope Hydrology International Atomic Energy Agency (IAEA), Vienna 569–581.
Stern, R.J., Kroner, A., 1993. Late Precambrian crustal evolution in NE Sudan: isotopic andgeochronologic constraints. Journal of Geology 101, 555–574.
Stuiver, M., Polach, H.A., 1977. Reporting of 14C data. Radiocarbon 19, 355–363.Sturchio, N.C., et al., 2004. One million year old groundwater in the Sahara revealed by
krypton-81 and chlorine-36. Geophysical Research Letters 31, L05503.Stute,M., Schlosser, P., 1993. Principles and applications of the noble gas paleo-thermometer.
In: Swart, P.K., Lohmann, K.C., Savin, S. (Eds.), Climatic Change in Continental IsotopicRecords. Geophysical Monograph Series. American Geophysical Union, pp. 89–100.
Stute, M., Clark, J.F., Schlosser, P., Broecker, W.S., 1995. A 30,000 yr continentalpaleotemperature record derived from noble gases dissolved in groundwater fromthe San Juan Basin, New Mexico. Quaternary Research 43, 209–220.
Sultan, M., Arvidson, R.E., Duncan, I.J., Stern, R.J., El Kaliouby, B., 1988. Extension of theNajd shear system from Saudi Arabia to the central Eastern Desert of Egypt basedon integrated field and Landsat observations. Tectonics 7, 1291–1306.
Sultan, M., Sturchio, N., Hassan, F.A., Hamdan, M.A.R., Mahmood, A.M., El Alfy, Z., Stein, T.,1997. Precipitation source inferred from stable isotopic composition of Pleistocenegroundwater and carbonate deposits in the Western Desert of Egypt. Quaternary Re-search 48, 29–37.
Sultan, M., Metwally, S., Milewski, A., Becker, D., Ahmed, M., Sauck, W., Soliman, F.,Sturchio, N., Yan, E., Rashed, M., Wagdy, A., Becker, R., Welton, B., 2011. Modern re-charge to fossil aquifers: geochemical, geophysical, and modeling constraints. Journalof Hydrology 403, 14–24.
Tamers, M.A., 1975. Validity of radiocarbon dates on groundwater. Geophysical Surveys 2,217–239.
Thorweihe, U., 1990. Nubian aquifer system. In: Said, R. (Ed.), Geology of Egypt. Balkema,Rotterdam, pp. 601–611.
Torfstein, A., Goldstein, S.L., Stein,M., Enzel, Y., 2013. Impacts of abrupt climate changes inthe Levant from last glacial Dead Sea levels. Quaternary Science Reviews 69, 1–7.
United States Geological Survey (USGS), 2003. USGS Global Visualization Viewer(GLOVIS). URL: http://glovis.usgs.gov.
Vaks, A., Bar-Matthews, M., Ayalon, A., Schilman, B., Gilmour, M., Hawkesworth, C.J.,Frumkin, A., Kaufman, A., Matthews, A., 2003. Paleoclimate reconstruction based onthe timing of speleothem growth and oxygen and carbon isotope composition in acave located in the rain shadow in Israel. Quaternary Research 59, 139–284.
Vaks, A., Bar-Matthews, M., Ayalon, A., Matthews, A., Frumkin, A., Dayan, U., Halicz, L.,Almogi-Labin, A., Schilman, B., 2006. Paleoclimate and location of the border betweenMediterranean climate region and the Saharo–Arabian Desert as revealed byspeleothems from the northern Negev Desert, Israel. Earth and Planetary Science Let-ters 249, 384–399.
Vogel, J.C., 1967. Investigation of groundwater flow with radiocarbon. Isotopes in Hydrol-ogy. International Atomic Energy Agency, Vienna, pp. 255–368.
Vogel, J.S., Southon, J.R., Nelson, D.E., Brown, T.A., 1984. Performance of catalytically con-densed carbon for use in accelerator mass spectrometry. Nuclear Instruments andMethods in Physics Research Section B: Beam Interactions with Materials andAtoms 5, 289–293.
Weiss, R.F., 1968. Piggyback samplers for dissolved gas studies on sealed water samples.Deep-Sea Research 15, 695–699.
Yan, Z., Petit-Maire, N., 1994. The last 140 Ka in the Afro–Asian arid/semi-arid transitionalzone. Palaeogeography, Palaeoclimatology, Palaeoecology 110, 217–233.
Related Documents