INTERNATIONAL TELECOMMUNICATION UNION REGULATORY IMPLICATIONS OF BROADBAND WORKSHOP Document 3 12 July 2001 GENEVA — ITU NEW INITIATIVES PROGRAMME — 2-4 MAY 2001 THE ECONOMIC AND REGULATORY IMPLICATIONS OF BROADBAND Briefing paper 1 , (June 2001) 1 INTRODUCTION........................................................2 1.1 Regulatory challenges............................................. 2 1.2 What role for government in promoting network development?........3 1.3 Structure of the paper............................................ 5 2. BROADBAND TECHNOLOGY................................................5 2.1 How broad is my band?............................................. 5 2.2 The capacity of transmission media, their applications and relative benefits............................................................... 6 2.3 Analogue and digital technology and broadband capacity...........13 3 BROADBAND ECONOMICS................................................14 3.1 Demand for integrated services...................................14 3.2 Competition in a converged market................................18 3.3 Economics of infrastructures.....................................20 4 REGULATORY CONCERNS OF BROADBAND...................................22 4.1 Promoting dynamic competition....................................23 4.2 Encouraging private investment...................................26 4.3 Defining an adaptable regulatory framework.......................28 4.4 Providing open access to networks................................30 5 REGULATORY IMPLICATIONS OF BROADBAND: ISSUES FOR DISCUSSION........32 5.1 Outlook for broadband............................................ 32 1 This paper has been prepared by Lucy Firth ([email protected] ) and Tim Kelly ([email protected] ) of the ITU Secretariat. It has been revised following discussions at the strategic planning workshop on the Regulatory Implications of Broadband, 2-4 May 2001. The views expressed in this paper are those of the authors and do not necessarily reflect the opinions of the ITU or its membership. More information on this topic, including copies of specially commissioned case studies covering Australia, Italy, Malaysia and South Africa, can be found at the ITU website at: <www.itu.int/broadband >.

Welcome message from author
This document is posted to help you gain knowledge. Please leave a comment to let me know what you think about it! Share it to your friends and learn new things together.
Transcript

INTERNATIONAL TELECOMMUNICATION UNION
REGULATORY IMPLICATIONS OF BROADBAND
WORKSHOP
Document 312 July 2001
GENEVA — ITU NEW INITIATIVES PROGRAMME — 2-4 MAY 2001
THE ECONOMIC AND REGULATORY IMPLICATIONS OF BROADBAND
Briefing paper1, (June 2001)
1 INTRODUCTION.........................................................................................................................2
1.1 Regulatory challenges...........................................................................................................................2
1.2 What role for government in promoting network development?....................................................3
1.3 Structure of the paper..........................................................................................................................5
2. BROADBAND TECHNOLOGY..................................................................................................5
2.1 How broad is my band?........................................................................................................................5
2.2 The capacity of transmission media, their applications and relative benefits.................................6
2.3 Analogue and digital technology and broadband capacity.............................................................13
3 BROADBAND ECONOMICS...................................................................................................14
3.1 Demand for integrated services.........................................................................................................14
3.2 Competition in a converged market..................................................................................................18
3.3 Economics of infrastructures.............................................................................................................20
4 REGULATORY CONCERNS OF BROADBAND.....................................................................22
4.1 Promoting dynamic competition.......................................................................................................23
4.2 Encouraging private investment........................................................................................................26
4.3 Defining an adaptable regulatory framework..................................................................................28
4.4 Providing open access to networks....................................................................................................30
5 REGULATORY IMPLICATIONS OF BROADBAND: ISSUES FOR DISCUSSION................32
5.1 Outlook for broadband.......................................................................................................................32
5.2 Regulatory convergence.....................................................................................................................33
5.3 Cross-ownership, cross-sectoral service provision...........................................................................33
5.4 Network access....................................................................................................................................33
5.5 Competition policy..............................................................................................................................33
5.6 International co-operation.................................................................................................................34
5.7 Other issues arising from broadband...............................................................................................34
1 This paper has been prepared by Lucy Firth ([email protected]) and Tim Kelly ([email protected]) of the ITU Secretariat. It has been revised following discussions at the strategic planning workshop on the Regulatory Implications of Broadband, 2-4 May 2001. The views expressed in this paper are those of the authors and do not necessarily reflect the opinions of the ITU or its membership. More information on this topic, including copies of specially commissioned case studies covering Australia, Italy, Malaysia and South Africa, can be found at the ITU website at: <www.itu.int/broadband>.

ITU Briefing Paper
1 INTRODUCTION
1.1 Regulatory challenges1. There are many competing visions of what future form the telecommunications sector will take. In one version, the Internet becomes the unifying platform for a cornucopia of interactive, multimedia services. In another, fixed-line networks are slowly replaced by a new generation of digital mobile networks. In yet another vision, a fleet of satellites provide anywhere-to-anywhere connectivity from small hand-held terminals. While there may be fierce debate over the nature of the medium that will herald this brave new world—copper, fibre, wireless or satellite—there is little doubt that future networks will be ‘broadband’ in their capabilities.
2. But what does broadband mean and how soon can a broadband future be realised? The term is a moving target. Twenty years ago, anything faster than basic rate ISDN, which offered speeds of up to 144 kbit/s, might have been considered broadband 2. Over the last five years, as broadband networks based on either Digital Subscriber Line (DSL) or cable modem technology have slowly been deployed, speeds of around 250 kbit/s and upwards are generally regarded as broadband. Strictly speaking, according to ITU-T Recommendation I.113, broadband means transmission capacity that is faster than primary rate ISDN3, at 1.5 or 2.0 Mbit/s. For the moment, these speeds are theoretical, and rarely offered in interactive services to individual users (though higher speeds may be available for downloading than for uplinking). The popular conception of what constitutes broadband is likely to continue to evolve.
3. So what does broadband mean for regulators? Is broadband not just a newer, faster version of the narrowband services that have been around for more than 100 years? There are reasons to believe the transition to broadband might pose new challenges to regulators that may require a radically different approach to how they do their jobs:
Although most developed country markets already have competition in services provision, competition at the level of network provision has been slower to materialise, especially in the local loop. There are signs that broadband networks, because of their high barriers to entry and ability to deliver multiple services via the same point of entry, may have a tendency towards monopoly provision, at least for residential consumers. Consequently, regulators may need to review whether existing market structures are capable of delivering the competitive benefits they are seeking, and what safeguards might be necessary. Might it be necessary, for instance, to mandate the sharing of broadband infrastructures and the unbundling of the local loop?
At least in the early stages of network roll-out, broadband is costly to provide, especially in low-density rural areas and on a nationwide basis. Consequently, governments may find that policy objectives, such as balanced regional development, are thwarted. Traditional concepts of universal service may also need to be revisited in a broadband future.
Telecommunication tariffs have traditionally been charged, in most countries, by the minute, by the mile and by the megabyte (i.e., according to usage). In a broadband world, with higher entry costs but minimal incremental costs, other types of tariff structures might be more appropriate, for instance, in order to offer “always on” services. Where regulators have applied controls to retail and interconnect tariffs on the basis of per minute charges (e.g., price cap regulation), a new approach might be necessary.
In most countries, broadcast services such as television and radio have traditionally been regulated in a different manner to switched services such as telephone or fax. Equally, within the telecommunications world, voice services have often been treated differently to data services. Broadband blurs these distinctions and is forcing a move towards converged regulatory structures. Malaysia is one country that has changed its regulatory framework in order to accommodate convergence (see Box 1.1).
2 A kilobit is one thousand bits. 1 kbit/s means 1’000 (i.e. 103) bits of information are transmitted each second. A megabit is one million bits. 1 Mbit/s means 1’000’000 (i.e.106) bits of information are transmitted each second. A gigabit is one billion bits. 1 Gbit/s means 1’000’000’000 (i.e. 109) bits of information are transmitted each second. A terabit is one trillion bits. 1 Tbit/s means 1’000’000’000’000 (i.e. 1012) bits of information are transmitted each second.
3 The primary rate is a multiple of standard 64 kbit/s telephone connections Because different conventions have been adopted, there are two primary rates. In North America and Japan the primary rate is equal to 1.5 Mbit/s (24 x 64 kbit/s). Elsewhere, the primary rate is 2Mbit/s (32 x 64 kbit/s).
2

Regulatory implications of broadband
1.2 What role for government in promoting network development?4. The regulatory issues listed above cover how broadband networks are provided, how coverage is extended, how access is priced and how regulation is administered. But the implications of broadband for governments go beyond issues of regulation. In the transition to an information-rich society and economy, access to broadband networks might be considered a vital component of national and corporate competitiveness. Governments may seek to guarantee that their citizens as well as their firms have access to the best networks and services in order to access social benefits and be able to compete on the world stage. But therein lies a dilemma: throughout the world, governments are giving up a direct stake in the telecommunications industry by privatising their incumbent operators and separating the functions of regulation from those of policy-making. The mantra du jour is that free markets will deliver the desired outcomes in terms of private investment and consumer welfare, without direct government participation. But will free markets be able to deliver broadband networks that reach all citizens and all firms? And will they do it quickly enough?
5. There is a long history of direct government involvement in infrastructure projects. The origins of both the telegraph and the telephone networks are tied up with the state in most, though not all, countries. Governments also played an important early role in establishing satellite networks. Governments in Europe ensured that GSM was adopted as a regional standard for cellular mobile. The US government funded the development of the Internet during its early formative years. But times have changed. So, what is the proper role of government in a market characterised by open entry and competition? Should a government play a role in promoting broadband, even if it risks favouring one firm, or selecting one technology, over another? Equally, can a government afford not to intervene if its industrial competitors and trade partners choose to do so?
6. Because the history of broadband competition is still so recent, and because the opportunity to build a new network comes along so rarely, there is no real precedent for addressing these questions. But there are certainly signs that governments are not willing just to sit on the sidelines:
In Europe, the European Commission took the unusual step, in December 2000, of issuing a ‘Regulation’ in order to force the pace of local loop unbundling. The political pressure to do this came from the highest level, following a Summit of European Ministers to discuss the Information Society held earlier that year in Lisbon.
In the United States, government funds have been directed to creating a “next generation Internet”.
In Singapore, the government has played a leading role in creating the “Singapore One” nationwide broadband network as a way of delivering its services to its citizens, and also as a way of establishing a lead for the city-state in the global information economy (see Box 1.2).
7. At the regional and city level too, local government has sometimes taken on a more active role as a potential supplier of broadband services. In Stockholm, for instance, a company called Stokab AB (<www.stokab.se>), which is jointly owned by the City of Stockholm and the County Council, is building and operating a fibre-optic network, on an operator-neutral basis. It acts as a wholesaler, offering dark fibre to operators that provide services to business and residential customers. As of early 2001, it had provided 3’500 km of fibre-optic cable with 400’000 km of individual fibres. Concord (Mass.), Lynchburg (Va.) and Palo Alto (Ca.) are examples of US cities which have taken, or are planning, a similar approach. City and regional development agencies have sometimes taken the initiative in creating science parks or other zones (see Box 1.1 for the case of Malaysia) that are ready-cabled for broadband access, in an attempt to attract high-tech investors. One advantage that city governments sometimes have is control of rights of way and access to homes and business, for instance, water or sewerage pipes that can be used for laying cable.
8. The early signs are that broadband will not take off as quickly as might have been hoped or expected. Access technologies, such as DSL or cable modems, have been deployed only slowly, partly due to technical difficulties but also because the price was often prohibitive for consumers. Unbundling of the local loop has been delayed by regulatory and pricing disputes. No single “killer application” has yet emerged to drive broadband consumer demand. One of the applications that might have filled this role—free music on-demand delivered by services such as Napster—has been declared to infringe copyright4.
4 For further information see <http://news.cnet.com/news/0-1005-200-5039135.html?tag=tp_pr>
3

ITU Briefing Paper
9. The worst news of all for those promoting broadband is the fact that, since the dot.com stock market bubble burst in March 2000, an estimated US$ 1 trillion has been wiped off the share values of firms in the technology, media and telecommunications sector. That precipitous decline has left venture capital firms, who might otherwise be expected to underwrite the investment in broadband networks, extremely wary of long-term investment. There are many competing demands on a public telecommunication operator’s purse strings—bidding for 3G mobile licences, entering foreign markets, diversification through acquisitions etc.,—so, unless there is a strong competitive push to invest in broadband networks straightaway, the temptation may be to wait until the economic climate looks better.
10. At the start of a new millennium, following a period of sustained economic expansion driven by information and communications technology, the world is once again facing economic recession. In previous recessions, governments have sought to kick-start economic growth by infrastructure investment projects. Could they, would they, should they do so again?
Box 1.1: Malaysia prepares for a broadband future
Malaysia began preparing for a broadband future as early as 1994 when it established the National Information Technology Commission (NITC) and set about identifying possible barriers to an IT-led leapfrog towards developed-nation status. A major finding was that too many regulations (and too many regulators) did not suit the needs of industry. Subsequently, the Communications and Multimedia Commission (CMC) was established in 1999 under the Communications and Multimedia Act to regulate the activities of:
Network facilities providers, regardless of their transmission medium; Network services providers, regardless of the network technology; Application service providers, regardless of whether the service be voice, data, broadcast, video, radio, etc; Content applications service providers, regardless of transmission medium and application.
The CMC can therefore be regarded as a converged regulator with a technologically-neutral stance.
There are however, legacy regulations that are not yet consistent with a totally converged environment. For instance, universal service obligations relate only to basic telephony, and the interconnectivity regime does not require local loop access to applications other than telephony. The main regulatory reform expected over the next two years is a complete review and modification of this legacy regulation.
Malaysia’s obsession with all things to do with multimedia means that preparation for a broadband future has involved much more than changing the regulatory framework. The seedbed is the Multimedia Super Corridor (MSC) with its totally planned ‘Silicon Valley’ environment, in a manicured tropical garden setting. The business hub of Cyberjaya and the neighbouring new national administrative capital of Putrajaya have universal broadband connectivity, smart houses and the world’s first multimedia university. Currently 40 of the top 50 “world class companies” that Malaysia sought to attract have a presence in the MSC.
At a national level, the government has established several programmes to kick start broadband use by individuals and companies, including:
E-services — bringing access to government services to individuals and companies; E-labour market — where the government acts as an agent bringing together workers and companies; E- procurement where government agencies buy common requisites; Smart schools – targeting the one-third of the Malaysian population in schools.
These programmes are currently being piloted. But, there are many barriers to overcome before a national roll-out of broadband-based services will succeed. With no history of cable TV, cable modem access is an unlikely future. While a fibre optic broadband backbone is in place, connectivity to homes and small businesses is via twisted copper wires. Therefore, with the incumbent’s local loop not unbundled, companies seek wireless solutions for the last mile. These solutions are hampered by lack of spectrum allocation in ranges far enough away from 2.4 MHz to be robust in tropical weather.
In some Malaysian states, 25 per cent of households do not have mains electricity, and 35 per cent of households do not have a telephone. Although there are some community telephone and Internet services, some citizen live as many as three days walk from the nearest telephone!
Source: ITU Malaysia country case study, available at: <www.itu.int/broadband>.
4

Regulatory implications of broadband
1.3 Structure of the paper11. This briefing paper was originally prepared in support of an ITU Strategic Planning Workshop on the regulatory implications of broadband. It was the fourth such workshop, and was held in line with the provisions of ITU Council Decision 496. Chapter two of the briefing paper looks at the technology underpinning broadband, in particular different technological solutions that are available for providing high-speed network access. Chapter three reviews the economics of broadband, notably the arguments over economies of scale and scope. Chapter four examines the regulatory issues posed by broadband, exploring further the questions raised in chapter one. Finally chapter, five suggests issues requiring discussion and further research. Throughout the paper, maximum use is made of individual country experiences and case studies, particularly in the form of boxes, charts and tables. The development of broadband is a global challenge and no single country or region can claim to have all the answers.
2. BROADBAND TECHNOLOGY
2.1 How broad is my band?12. The common usage of the term broadband is not nearly as precise as the technical definition would imply. A recent study carried out by the Canadian National Broadband Task Force 5 noted that national definitions ranged from as low as 200 kbit/s to as high as 30 Mbit/s among the 14 countries studied. We have avoided setting a “number”, or a minimum speed that would constitute broadband. Rather we accept that broadband is defined primarily by access technologies, of which ADSL and cable modems are currently the most popular. An alternative approach to defining broadband would be to state a minimum level of functionality, rather than a minimum speed. For instance, any network capable of carrying full motion video would fit the popular image of a broadband network. With advances in data encoding and compression, this is becoming possible at ever-lower speeds.
13. Convergence of technologies is facilitated by the ability offered by broadband to transmit various types of communication signals on the same media. The integration of historically separate networks (telephony, data and cable TV) into a single network, with flat-rate tariffs, enables ‘always-on’ access. When coupled with the anticipated cheapness and speed of transmission, this opens up frontiers for commercial exchange of large data files and for entertainment and information to the home.
Figure 1.1: Technology push, and the payoff, in SingaporeGovernment expenditure on information and communication technologies, 1995-99, and penetration rate, mid 2000
70.658.4
48.7
8.8
Mobile Fixed-lines Internetsubscribers
Broadbandusers
Source: ITU Internet Diffusion case study of Singapore, <www.itu.int/ti/casestudies>. Penetration rate data are per 100 inhabitants and are accurate for April 2001 for mobile, Internet subscribers and broadband and for July 2000 for fixed-lines.
5 <http://broadband.gc.ca/english>
5

ITU Briefing Paper
Box 1.2: A ring around Singapore
Singapore has one of the most advanced communication networks in the world with high levels of access and penetration. This has been possible due to the small size of the country—essentially a city state—as well as rising income levels and a government commitment to excellence in communications. The telecommunication market has been characterised by progressive liberalisation from a state-owned monopoly provider to full competition.
The Singaporean regulator, the Info-Communications Development Authority (IDA) is a good example of a converged regulatory authority. It was created in 1999 through the merger of the formerly separate Telecommunications Authority of Singapore and the National Computer Board, and reports to a Ministry of Communications and Information Technology (MCIT). Rapid global changes have persuaded it to bring forward the full opening to market competition to 1 April 2000, some seven years ahead of the original schedule. The incumbent, SingTel, is partially privatised, independent of government and has had a fully digital network since 1994.
The main push for broadband has come from the government-led Singapore ONE (one network for everyone) initiative. Singapore ONE is a 622 Mbit/s fibre backbone network running ATM. Singapore ONE passes every home in the country and, as of September 2000, had a quarter of a million users. It is run by 1-Net whose original shareholders sold their shares to MediaCorp of Singapore, a 100 per cent state-owned company which is the major shareholder in Singapore CableVision, the monopoly cable TV operator and ISP, as well as a minority shareholder in Pacific Internet, an ISP. The development of Singapore ONE has been part of a technology push by the state, designed to ensure that all citizens have access to broadband (see <www.s-one.gov.sg/mainmenu.html>). For instance, although Singapore already has 48.7 per cent household Internet penetration, one of the highest levels in the world (see Figure 1.1), 1-Net has nevertheless established a series of 500 or so public Internet kiosks across the island, especially in tourist areas.
One of the government’s aims is to use Singapore ONE for the delivery of government services. It has established a government portal (<www.sg.gov>) and plans to make all government over-the-counter services available online within three years. It launched an eCitizen initiative in April 1999 offering 60 service packages and more than 200 services. It has a separate portal site for government-to-business (G2B) dealings at <www.gebiz.gov>.
In addition to Singapore ONE, broadband services are also available via DSL (e.g., SingTel ADSL Magix service) and via cable modems (from Singapore CableVision). The cable modem service appeared to offer the better value in June 2001, with unlimited Internet access being available to existing cable subscribers at the rate of US$32 per month compared with US$69 for 60 hours ADSL access from SingTel. However, in November 2000, SingNet (SingTel’s ISP subsidiary) introduced flat-rate volume-based packages for ADSL, for packages of between 250-1’000 Megabytes per month with an additional charge of US$1.70 per 10 Megabytes once the limit has been exceeded. There were some 300’000 broadband users as of April 2001.
Further mobile competition is coming soon with the auction, in May 2000, of five lots of spectrum for Fixed Wireless Broadband, based on LMDS technology and offering speeds of up to 155 Mbit/s. However, some technical problems, such as the deterioration of service under heavy rain, need to be addressed.
Such quality of service (QoS) issues are being pursued by the IDA, which holds service providers accountable for failure to meet specified minimum QoS standards. For example, recent complaints about slow cable modem service for Internet access were identified by the IDA as being due to insufficient bandwidth during peak hours, and inappropriate parameter settings—both of which have been remedied by the company concerned (SCV).
Source: ITU Internet Diffusion case study of Singapore, available at <www.itu.int/ti/casestudies>. IDA, press release, 13 April, 2000. Company web sites: <www.scv.com.sg> and <www.singtelmagix.com.sg>
2.2 The capacity of transmission media, their applications and relative benefits14. There are many different routes to a possible broadband future, according to which transmission media are chosen. A basic distinction can be drawn between wireless and fixed-line (guided and unguided) media. Guided media include twisted copper cable, coaxial cable and fibre optic cable. Unguided media (signals transmitted by air interface) include satellite and terrestrial wireless systems. These media can support various capacities, ranging from 9.6 kbit/s for GSM mobile communications to virtually unlimited capacity for fibre optics.
2.2.1 Wireless media
Mobile communications
15. Current second generation (2G) digital mobile services offer low-speed (9.6 kbit/s) transmission that is best suited to voice or text messaging applications. Intermediate 2.5G services, such as GPRS (General Packet Radio Service) promise to raise this, though not to broadband speeds. Third generation (3G) mobile
6

Regulatory implications of broadband
offers theoretical speeds of up to 388 kbit/s in fast-moving vehicles and up to 2 Mbit/s for pedestrian or stationary users. The first 3G services were offered launched as a trial on 30 May 2001 when NTT DoCoMo launched its FOMA (freedom of mobile multimedia access) service in Japan. Hand set problems were delaying the trials in mid June, but an October date for a full commercial launch was still anticipated. 63G could be an important step towards offering high-speed mobile Internet access to consumer devices, particularly in regions where the fixed-line network is not well developed.
16. But the potential for wireless systems in delivering broadband may lie with the evolution of future mobile systems. NTT DoCoMo is again pioneering this technology and has announced specifications for a service that could theoretically accommodate speeds of 10 Mbit/s or higher, starting around 2007-107.
17. In the meantime, there is likely to be development of wireless technologies that offer high-speed access to certain “hot-spots” such as in office towers, airports, railway stations, and office blocks using so-called wireless LANs. One promising technology to provide local connectivity at speeds of up to 10 Mbit/s is Bluetooth, an industry standard allowing mobile phones, computers, and personal digital assistants to interconnect with each other using short-range wireless. Another is the Multimedia Mobile Access Communications (MMAC) concept being pioneered in Japan (see Box 2.1).
Satellite
18. Satellites are radio relay stations in orbit above the earth that receive, amplify and redirect analogue and digital signals. There are two main kinds:
Geostationary (GEO) satellites are in orbit 35’650 km above the earth and rotate with the earth, thus appearing stationary. A fleet of 3 GEOs would give complete global coverage.
Low-earth orbit (LEO) satellites generally track somewhere between 650 km and 2’575 km above the earth and revolve around the globe every couple of hours. Each LEO is only in view for a few minutes, and multiple LEOs are required to maintain continuous coverage by having one in sight at all times. LEO constellations have the advantage of shorter transmission delays and may carry out call routing via the LEO satellite networks or terrestrial networks.
19. Satellite use for broadband communication is constrained by the fact that, with current technology, it is effectively a one-way transmission medium for broadcast (or download) of information. The vast majority of satellite antennae in use in ITU Member States are used for receiving direct-to-home broadcast television (Figure 2.1). However, interactive services, such as web-browsing are slowly being introduced. Where the traffic flow is highly asymmetric, the return leg can be provided by a terrestrial connection, such as a telephone line. This is the approach taken by BskyB in the UK, for instance. An interactive satellite service using satellite uplinks as well as downlinks was launched in the United States by EarthLink in May 2001, though this is initially being offered in locations not served with either broadband or ADSL. New generation LEO systems, such as the one proposed by Teledesic, to offer two-way satellite communication, including to mobile terminals. However, the recent commercial failure of narrowband Global Mobile Personal Communications by Satellite (GMPCS) systems, such as Iridium, has cast doubt on the viability of such global systems, although satellites are successfully used for extending international Internet connectivity, especially in landlocked countries or in remote locations.
6 NTT DoCoMo’s 3G trial stalled by faulty handsets, Simon Marshall, Total Telecom, 15 June 2001, <http://www.totaltele.com/view.asp?articleID=41056&Pub=TT&categoryid=625&kw=docomo>7 Yumiko Okamura, 18 March 2001, Bloomberg
7

ITU Briefing Paper
Figure 2.1: Growth of Satellite TV Direct to Home (DTH), 1994-99, and regional breakdown, 1999
0
10
20
30
40
50
60
70
80
90
1994 1995 1996 1997 1998 1999
G7 Rest of w orld
Satellite DTH worldw ide, 1994-99 (millions of antennae)
North America
21%
Europe44%
LAC2%
Africa2%
Asia-Pacif ic31%
Satellite DTH, regional breakdow n, 1999
Note: “G7” means the Group of Seven nations: Canada, France, Germany, Italy, Japan, United Kingdom and United States.Source: ITU World Telecommunication Indicators Database.
Terrestrial wireless
20. Transmission of terrestrial microwave signals involves the installation of antennas at high points where the line of sight is clearest. Terrestrial microwave is used as an alternative to coaxial cable and to fibre optic cable for long distance telephony, for television and increasingly for mobile communications. Frequency bands above 17 GHz, High Density Systems in the Frequency Spectrum (HDFS), are used for point-to-point and point-to-multipoint applications and can provide broadband access for subscriber-based applications. In the United States, the band at 38 GHz is widely used. Another application is HAPS (High Altitude Platform Stations – balloons) operating at 32 GHz and 47/48 GHz, which may be established in the near future.
21. Laser beams offer a further alternative, and are typically targeted on separate offices from a central location. The signal travels though glass and so is suited to the provision of spot services in office towers surrounding the source of the beam. A new technology, so-called free-space laser, that promises to bring capacities of up to 155 Mbit/s over distances of up 6 km, is due to be launched in mid 2001 in Manchester, UK by a small company, PAV8. The laser aims a low frequency beam across city rooftops or from the window of one office building through the window of another. The immaturity of the technology and its lack of widespread availability make it difficult to assess. Problems found in earlier trials indicated that line of sight is necessary, and that poor weather can reduce the range to 2 km. TerraBeam (backed by Lucent) and AirFibre (backed by Nortel), amongst others, are working on this technology9.
22. Spectrum availability is a problem for terrestrial wireless communication. The low frequency ranges, which are robust and offer point-to-multi-point transmission, are subject to congestion because they offer little bandwidth, much of which has already been allocated. Higher bandwidths, for example laser and visible light, are more subject to attenuation and are generally suited to point-to-point transmission only, although they offer greater bandwidth. The intermediate frequency ranges, which are generally robust, offer substantial bandwidth and are suited to some point-to-multipoint as well as to point-to-point transmission, and are thus highly sought after. With blind spots at 2.4 MHz and 60 GHz in the microwave range, and with 3.5 GHz already allocated to IMT-2000, potential applications for the remaining spectrum face severe competition.
2.2.2 Fixed-line media
Copper wire
23. The traditional telephony local loop comprises twisted pair copper wires with a capacity of 56/64 kbit/s. This capacity effectively limits their application to telephony and data transmission. A movie, such as Titanic, would take almost a whole day to download via a twisted pair wire and a 56 kbit/s modem.
8 For further information see <http://www.conversantcomm.com/news.html>.9 For more information see <http://156.54.253.12/tentelecom/en/watpartA_11_2000.html>
8

Regulatory implications of broadband
Moreover, switched circuit technology (see section 2.3) and usage-based pricing models generally preclude offering ‘always on’ tariff options.
24. The development of Integrated Services Digital Networks (ISDN) enhances the capacity of twisted copper wires up to 144 kbit/s for basic rate ISDN by enabling digital communication through the circuit switched network. Primary rate ISDN combines basic rate circuits together to offer speeds of up to 1.5 or 2.0 Mbit/s, though this would typically be available over a private leased line rather than over the public switched network. ISDN requires that both the subscriber and the local exchange install an adapter. Market penetration is limited but growing by around 50 per cent per year (see Figure 2.2), thanks mainly to demand generated for web browsing. The slow roll-out of the ISDN service (it took more than 20 years from the definition of the standard to reach even a modest penetration level) offers a salutary lesson for the prospects of broadband. Critics of ISDN see it as a 1970s technology that was stymied by the user-unfriendly pricing policies of the incumbent operators. Broadband ISDN (B-ISDN) has the potential to provide local loop network services on optical fibre and radio with yet to be determined capacities above 2 Mbit/s.
25. Considerable hopes have been placed in the development of Digital Subscriber Line (DSL) technology in which, by using different frequencies, data can travel over the same line as voice. DSL speeds are influenced by the distance of the subscriber from the local exchange and the degree of symmetry of the traffic flow. Asymmetric DSL (ADSL) is suited to web browsing, where downloading of large files is more important than uploading, because it enables speeds up to 8 Mbit/s downstream and a maximum of 1 Mbit/s upstream. ADSL is available at a maximum distance of 6 km from the local exchange. It is well suited to residential users because it shares a single twisted copper pair with voice, simultaneously.
Box 2.1: MMAC– Japan promises to be multi-mobile and multi-media
Future generations of mobile communications systems are expected to provide a wide variety of services, from high-quality voice to high-definition video through high-data-rate wireless channels. High data rates require broad frequency bands. For wireless media, it is possible to achieve broadband capacity using higher frequency bands such as microwave, Ka-band, and millimetre-wave.
As far back as 1996, Japan started an R&D programme to tap into the potential of wireless broadband. The program was entitled MMAC for Multimedia Mobile Access Communication (see Figure 2.1). MMAC promises the transmission of ultra high-speed and high-quality multimedia information "anytime and anywhere" through seamless connections to optical fibre networks. This high-performance wireless system will be introduced after IMT-2000 in Japan: the current target launch date is 2002. MMAC will enable four categories of high-speed wireless access communications:
High Speed Wireless Access – Outdoor and Indoor: Transmission speeds of up to 30 Mbit/s using the Super High Frequency (SHF) band (3-30 GHz) and other bands (3-60 GHz). This would be sufficient for mobile video telephone conversations.
Ultra High Speed Wireless Local Area Network (LAN) – Indoor only: Wireless LAN with speeds up to 156 Mbit/s using the millimetre-wave radio band (30-300 GHz). This can be used, for instance, for high quality video-conferencing.
5 GHz Band Mobile Access – Outdoor and Indoor: This service offers an ATM-like (Asynchronous Transfer Mode) Wireless Access and Ethernet-type Wireless LAN using the 5 GHz band. Each system can transmit multimedia application at speeds up to 20–25 Mbit/s. These systems cannot provide wide coverage areas, nor can they provide services in vehicle environments. Their main applications are limited to a "hot spot" (i.e. covering indoors and premises).
Wireless Home-Link – Indoor only: Transmission speeds of up to 100 Mbit/s using the SHF and other bands (3-60 GHz). This can be used for communications between personal computers and audio-visual equipment for the exchange of multimedia information.
Source: Adapted from Association of Radio Industries and Business (ARIB), Japan.
9
ITU Briefing Paper
Figure 2.2: Growth of ISDN worldwide, 1994-99, and regional breakdown of primary rate connections, 1999
0
10
20
30
40
50
60
70
1994 1995 1996 1997 1998 1999
G7 Rest of w orld
ISDN worldw ide, 1994-99 (millions of 56/64 kbit/s circuits)
Regional breakdown, 1999
Europe52.2%
Asia Pacif ic 27.7%
North America19.1%
Africa0.4%
LAC0.6%
Note: “G7” means the Group of Seven nations: Canada, France, Germany, Italy, Japan, United Kingdom and United States. “LAC” = Latin America and the Caribbean.
Source: ITU World Telecommunication Indicators Database.
26. Symmetrical DSL (SDSL), as the name suggests, offers equivalent traffic flow in each direction, but it cannot share the line with analogue signals, thus posing significant installation/modification costs in the local loop. SDSL is suited to commercial and academic institutions that need both to send and receive files (e.g., for business-to-business e-commerce applications). SDSL adjusts the capacity according to signal quality and offers speeds and distance combinations ranging from 160 kbit/s over 7 km to 1.5 Mbit/s over 3 km. Higher speeds are possible by combining multiple twisted pair wires together (e.g., High bit rate DSL or HDSL and Very high bit rate DSL or VDSL).
27. The various flavours of DSL have the potential to offer broadband access to wide sections of urban populations, and to meet the requirements of different market sectors. Unlike ISDN, DSL is perceived as a market-driven standard. However, the pattern of roll-out around the world suggests it is, nevertheless, being driven by incumbent telecommunication operators rather than new market entrants. This may, in part, be due to reluctance to open the local loop on the part of the telecommunications companies that own and operate the local exchange as well as the local loop. But even where regulatory intervention has forced the pace of unbundling, DSL take-up has been slow (see section 3.1). The Republic of Korea is a significant exception and leads the world, at present, in terms of number of subscribers with broadband access via DSL, see Box 3.2.
Coaxial cable
28. Coaxial cable uses copper wire in a more sophisticated way than twisted pairs in order to achieve a greater capacity. With frequency division multiplexing, a single coaxial cable can carry more than 1’000 voice messages, or 60 analogue TV channels simultaneously. Coaxial cable has long been used for television distribution (cable TV), long distance telephony and for Local Area Networks (LANs), and more recently for voice over cable networks. Cable has two advantages over twisted pairs – firstly, it offers speeds ranging from 500 kbit/s to 1.5 Mbit/s; and secondly, as a result of network architecture and pricing, it can be offered as ‘always on’. However, it is not as widely available as twisted pair copper, and it has generally been used in network configurations that preclude offering switched services without an upgrade.
29. Traditional cable TV networks have to be upgraded to facilitate two-way communication, for example, for Internet access or cable telephony. Often, this has been undertaken by laying a second copper wire alongside the coaxial cable. This was the solution adopted in the United Kingdom, which pioneered the concept of cable TV/telephony. But, it is technically possible to use the same coaxial cable for both television and telecommunication applications, for instance, by using cable modems and by using a switched network architecture. Figure 2.4 shows the availability and penetration rate of cable TV in various countries.
10

Regulatory implications of broadband
Figure 2.3: Broadband deployment for major marketsBroadband subscribers per 100 inhabitants, for major markets, December 2000
0 2 4 6 8 10
Korea (Rep.)
Singapore
Hongkong SAR
Canada
USA
Austria
Netherlands
Belgium
Sw eden
Denmark
Taiw an-China
Iceland
Finland
Japan
Sw itzerland
Australia
Norw ay
France
New Zealand
Portugal
Germany
Italy
Spain
UK
DSL
Cable modems
Fibre to the home
Source: ITU, The development of broadband access in OECD countries, original draft, June 2001, due for derestriction in late 2001, early 2002 (see the OECD website at <www.oecd.org/dsti>).
Figure 2.4: Cable TV worldwide, 1994-99 and regional breakdown, 1999
0
50
100
150
200
250
300
350
1994 1995 1996 1997 1998 1999
G7 Rest of w orld
Cable TV worldw ide, 1994-99 (millions of subscribers)
North America25.7%
Europe26.1%
Africa0.0%
LAC5.2%
Asia-Pacif ic43.0%
Cable TV, regional breakdow n, 1999
Source: ITU World Telecommunication Indicators Database.
11

ITU Briefing Paper
Table 2.1: Assessing different broadband access technologiesTechnology Definition Bandwidth Advantages Disadvantages
ADSL
Asymmetric Digital Subscriber Line
Transmission of voice and data over copper
Up to 8 Mbit/s downstream
Up to 1.5 Mbit/s upstream
Makes full use of existing copper
Ideal for web-browsing
Good platform for voice
Limited video capability
Distance limitation
Limited upstream bandwidth
VDSLVery High Rate Digital Subscriber Line
Transmission of video, voice and data over copper
Up to 52 Mbit/s downstream
Up to 26 Mbit/s symmetrical
Supports broadcast video, Video-on-demand, Internet TV, and interactive TV
Offers always-on network for voice, video, and data
Requires short distance
Non-standard products and technology
Limited scalability
Microwave multipoint fixed services
Microwave transmission of video and dataPoint-to-point or point-to-multipoint
Up to 1 Gbit/s downstream and downstream
Fast time-to-market Point-to-multipoint
cells have limited geographical area
Needs line of sight to complete transmission
HFCHybrid Fibre/Coax
Transmission of video, voice, and data over coaxial and fibre cable
10 to 42 Mbit/s downstream
2 Mbit/s upstream
Supports broadcast video, Video-on-demand, Internet TV, and interactive TV
Offers always-on network for voice, video, and data
Voice requires special engineering
Difficult to guarantee speed
High cost of upgrades and build-outs
Source: ITU, Merrill Lynch
Fibre optic cable
30. Fibre optic technology can provide transmission rates of 10 Gbit/s, but with speeds of up to 100 times greater over short distances being recorded in tests and soon to be available via transatlantic submarine cables. A trillion bits per second is equal to downloading one hundred hours of digital video per second!
31. The main deterrent to widespread fibre optic cable roll-out to the home is the cost, which is a function of the distance from the subscriber to the fibre optic network. While businesses may be willing to pay for the effectively unlimited capacity provided by connection to the fibre optic network in high-density central business districts, it is generally prohibitively expensive in other areas. Nevertheless, Japan has announced plans for a nationwide roll-out of fibre optic cables (see Box 3.1). Only two countries currently have operational fibre-to-the-home services on anything other than a trial basis:
In Sweden, Bredbansbolaget (B2) had some 18’700 subscribers as of 1Q 2001 for its symmetrical 10 Mbit/s service. However, recent losses have forced it to lay-off staff and rein back its ambitions for expansion. In the foreseeable future, its operations are likely to be restricted to the Stockholm service.
In Iceland, Lina.Net (a subsidiary of the Reykjavik Energy Company), together with Ericsson, is establishing a residential network capable of delivering speeds of up to 100 Mbit/s.
Hybrid networks
32. Increasingly, today’s networks are hybrid in nature, using the best available and cheapest solutions in different parts. An all-fibre network would be rare, except perhaps for private corporate networks. Instead, hybrid fibre/coaxial is much more common. Satellite and wireless access may be the most cost-effective way of reaching the consumer, but fibre is probably the best way of transporting large quantities of data between two points. In determining what is the best way of delivering broadband to a particular target group, the
12

Regulatory implications of broadband
optimal solution may well be path-dependent. The medium of choice may depend upon a variety of factors including the legacy medium (if one exists), the regulatory framework and the supporting institutional arrangements. Governments that seek to build a broadband future for their country must address these issues.
2.3 Analogue and digital technology and broadband capacity33. The provision of new, ever higher capacity networks, is one route to a broadband future. But there is another equally valid route, which is to enhance the capacity of today’s networks by compressing the data more efficiently.
2.3.1 Coding and decoding signals for transmission
34. Historically, remote communication (for example, Morse code and telegraphy) was digital and required coding of the message before sending and decoding upon receipt. Telephony revolutionised remote communication by enabling naturalistic analogue messages to be sent and received without the coding/decoding process. TV followed suit providing video as well as voice. Computers reverted to digitising information by reducing text to strings of binomial bits for processing. Recent developments in communication have used digital technology to convert voice and video into strings of binomial bits for transmission.
35. The convergence of transmission technologies that enables the integrated transmission of both analogue and digital signals implies a need to code and decode messages. A modem (MOdulator-DEModulator) is a device that converts digital pulses to analogue and vice versa. Modems enable analogue signals to benefit from the compression and multiplexing efficiencies of digital transmission. Similarly, they enable digital signals to be sent on media other than copper. Miniaturised wireless modems enable digital mobile communication of both voice and data.
36. Currently, typical modems have a maximum speed of only 56 kbit/s, though ISDN modems allow speeds of up to 144 kbit/s. The promise of higher speeds, particularly for Internet access, is one of the greatest drivers of the demand for DSL and other modem-free broadband access technologies.
2.3.2 Transmission efficiency
37. The efficiency of networks can also be improved by transitioning from traditional circuit-switched to newer packet-switched, or Internet Protocol (IP) based, networks
38. Circuit switching requires the exclusive use of a dedicated line between the calling and receiving party, for the duration of the connection. With packet switching, the original data are broken into ‘packets’ for transmission and then reassembled for delivery. Packet switching of data enhances efficiency, in terms of being able to send more information at a given error rate in a given period over a given infrastructure. But, because packets are queued at busy nodes and then have to wait to be reassembled, there can be a delay in the message. While this delay is a nuisance in data communication, it can be unacceptable in voice and video communication. The greater the capacity of the transmission medium, the less congestion and the shorter the delays. Broadband promises undetectable delays in packetised voice transmission. One of the factors driving demand for voice over Internet Protocol (VoIP) is the fact that, with always-on services and a flat-rate tariffs, domestic calls are effectively free and international calls greatly reduced in price (see the case study of Korea in Box 3.2).10
39. Compression and multiplexing offer further efficiency gains. Compression technology uses a variety of techniques to remove redundant elements of a message, and to replace repeated elements with a single one. Compression saves transmission time and so reduces costs and congestion. Multiplexing enables multiple messages to be transmitted simultaneously. In this way, several cable TV channels, for example, can be multiplexed for simultaneous transmission.
10 For more detail, see the ITU country case study of IP Telephony in the Republic of Korea (January 2001) available from the ITU website at: <www.itu.int/wtpf/casestudies >
13

ITU Briefing Paper
1 BROADBAND ECONOMICS
40. The emergence of the information economy suggests that broadband, as one of the building stones of that economy, has the capacity to drive economic growth. While the production (as much as the use) of information and communications technology has been found to have driven economic growth in the United States during the second half of the 1990s11, the macroeconomic impacts of broadband are still to come12. Nevertheless, the microeconomic impact of broadband is already significant.
41. The broadband market is driven by the demand (both real and anticipated) for end-user services (both residential and commercial). That demand is increasing, not only because more homes and businesses are coming online, but also because new and emerging applications require greater bandwidth capacity. While this trend is somewhat accommodated by technologies that increase transmission efficiency, the net effect is that capacity demand is growing rapidly. This is particularly true for Internet backbone capacity on inter-continental route, which grew by 280 per cent in the year to September 2000 (TeleGeography Inc.).
42. Broadband economics is a complexity of converging markets, with disparate supply and demand conditions and legacy regulations that impose different levels of knowledge, uncertainty and ignorance with which players must contend. A common thread is the role of regulation and other government tools in developing and shaping the broadband market. The end-user broadband market can be broken down into several sub-markets that constitute the ‘supply side’. There is, for example, a market for infrastructure and an intermediate market for bandwidth capacity.
1.1 Demand for integrated services43. Demand for broadband is derived from the demand for the goods and services that it offers. The market for residential services may be assumed to differ from that for commercial services in terms of critical attributes (speed, price, etc.) and in terms of elasticities of demand. Therefore, they are treated separately here.
44. What seems clear is that, in the broadband world, customers (both residential and commercial) will demand and have access to many different services and several networks. This suggests different market dynamics to those that exist in the narrowband market in which access is determined by separate contractual arrangements (e.g., for cable TV, telephone services, etc.) and by interconnectivity agreements among operators. Companies competing in the broadband world will need to find value-added services to attract and keep customers who, for instance, have a choice between different networks to access the Internet.
Residential
45. Residential demand for broadband is largely for services that already exist (e.g., TV, web browsing, email, etc.) that could now be quicker (faster response times), more reliable, more convenient, and possibly cheaper per unit of service. The search continues for a ‘killer’ broadband application, i.e., an application that most consumers feel that they must have and that they cannot have without broadband. The three candidates that are put forward most often are:
High-speed Internet access (permitting, for instance, quick downloading of higher-quality video clips or MP3 audio files);
Interactive digital television permitting delivery of multiple channels with convenient subscriber access control, and some measure of video-on-demand, or a near equivalent;
Interactive video games (see Box 3.3).
46. It may be that these three potential killer applications are effectively the same: multimedia entertainment. In the UK, for instance, the otherwise delayed uptake of broadband 13 is being led by the demand for digital TV, with 28 per cent of consumers receiving digital TV in April 2000 14. In Korea, by contrast, it appears to be high-speed Internet delivery by DSL that is driving the residential broadband market, see Box 3.2.
11 Oliner, S. and D. Sichel, 2000, The Resurgence of Growth in the late 1990s: is information technology the story, Federal Reserve Board, Washington.
12 Galbi, D. 2001, Growth in the ‘new economy’,<http://www.tpeditor.com/contents/2001/galbi.htm>13 Telecomworldwire, April 6, 200114 Consumer attitudes towards digital TV,< http://www.pace.co.uk/documents/PR/pacereport01.pdf>
14
Regulatory implications of broadband
47. The lack of an obvious killer application that is specific to broadband means that while subscriber numbers are available for a series of the converging sectors, these do not necessarily apply only to broadband networks. Moreover, as broadband infrastructure is not currently available in many residential areas, the rate of uptake may reflect locational peculiarities of service rather than the intentions of consumers. Penetration rates for various applications and for the major broadband access technologies for selected countries were presented in chapter two.
Box 3.1: Japan’s roll-out of fibre to the home
The government of Japan aims to spread a fibre-optic network throughout the country. However, according to the vision document, “Making efforts to complete a nationwide fibre-optic subscriber local loop by FY2005”15, it is the private sector which is expected to undertake the job. As a measure of how far there is to go to achieve this vision, as of March 2000, around one-third of all cables (measured by cable length) were fibre, though the ratio is much higher in the long-distance network (86 per cent) than in the subscriber local loop (18 per cent).
The Ministry of Public Management, Home Affairs, Posts and Telecommunications (MPHPT) has taken a number of measures to assist the private sector in the task of network roll-out:
The Ministry applies the same regulations and licenses to data services over both the ordinary telephone network and over broadband;
A special financing system for the development of fibre direct to the subscriber was started in 1995. This system aims to subsidise the operator’s costs by up to 2 per cent of the loan interest;
Tax incentives are offered via a special rate of depreciation chargeable against corporate tax paid by operators and a reduction in the standard rate of assessment for the fixed property tax payable for fibre optic networks;
In March 2001, Telecommunication Council issued a report on NTT’s opening its unused fibre optic infrastructure to other operators of MPHPT.
In March 2001, the IT strategy Headquarters (of which the Director-General was the former Japanese Prime Minister, Mr. Mori) announced the “e-Japan Priority Policy Programme”. The plan emphasises the goal of establishing a fibre optic network and a further push for competition in the telecommunications market. The following points concern broadband services:
Enactment of a new interconnection rule between operators;
Utilisation of NTT’s telephone poles and underground pipes by other operators to support the smooth roll-out of their fibre optic network;
Establishment of a new telecommunications regulatory category for operators that offer their fibre optic infrastructures only to other operators (wholesalers), which will enable them to offer their fibre optic infrastructures easily.
NTT is, by some margin, the biggest fixed-line operator in Japan. It started its fibre-to-the-home trial in December 2000, offering a maximum speed of 10 Mbit/s in some areas in Tokyo and Osaka. In March 2001, a new operator, USEN Broad Networks, started its service to the home in some areas of Tokyo, offering a maximum speed of 100 Mbit/s. The monthly charge is ¥ 5’800 (US$47). Additional charges are levied for content, for instance movies and music on demand. It plans to cover major cities by April 2003.
Source :e-Japan Priority Policy Program, IT Strategy Headquarters, Japan: <http://www.kantei.go.jp/foreign/moritoku_e/2001/03/29e_japan/>Outline of the Telecommunications Business in Japan, MPHPT Japan, <http://www.mpt.go.jp/eng/>NTT, <http://www.ntt.co.jp/index_e.html>USEN Broad Networks, <http://www.usen.co.jp/>
15 Policy Measures for Economic Rebirth by Advanced Information and Telecommunications Society, Promotion Headquarters, November 1999.
15

ITU Briefing Paper
Box 3.2 Korea’s success with ADSL
Since the introduction of Internet services in 1994, Korea has experienced an explosion in the size of the Internet service market to 19 million users (38 per cent of the population, as of December 2000). This has been followed by a boom in broadband Internet access.
With fierce competition in the broadband Internet access market, the number of subscribers reached more than 4.6 million in February 2001 (one in every four households). Although broadband access via cable TV networks came first, with the launch of a cable modem service by Thrunet in July 1998, it is ADSL services that have taken off faster. By February 2001, the majority of broadband subscribers (almost 3 million) were using ADSL (see Box Figure 3.2), with Korea Telecom supplying more than 70 per cent of the market. Next in popularity comes broadband Internet via cable TV networks (1.5 million). Here, thanks to its early start, Thrunet controls just over half the market but there are at least six companies offering services. LAN Internet services to larger apartment complexes and satellite-based Internet services account for the rest of the broadband Internet subscribers.
The pattern of household residents in Korea can partly explain the success of ADSL. More than 90 per cent of households live within 4 km of a local exchange Most offices and half of the households - about 7,500,000 out of 15,000,000 – are in apartment complexes. With short distances, not only is one of the main disadvantages of ADSL technology avoided, but also economies of scale are achieved in providing ADSL service using Fibre cable.
Behind this successful uptake of broadband Internet—one of the fastest growth rates in the world (Box Figure 3.2)—lies the Government’s strong policy drive. This involved a long-term plan for broadband Internet infrastructure being drawn up back in 1995, and the implementation of various information projects aimed at creating demand for ICT services, such as providing all primary and secondary schools with free Internet access. Moreover, competition in the broadband Internet access market spurred an aggressive tug-of-war between facility-based service providers (FSPs) utilizing different access technologies. The explosive growth in subscribers is attributed to competition between multiple operators and services, which has had the effect of lowering prices even during the early phase of market development.
One application that has proved popular for broadband subscribers, perhaps surprisingly, is voice telephony. Although, telephone calls only require a fraction of the bandwidth offered by a broadband connection, the flat-rate pricing structure makes it a popular application when combined with a technology such as “Voice over DSL”. Some Korean service providers, notably Serome Technology (Dialpad.com), offer domestic IP Telephony free of charge, at least initially. The growth of broadband has been co-incident with a rapid expansion in the number of IP Telephony subscribers who numbered around 7.6 million in Korea by the end of 2000 (see the ITU IP Telephony country case study, available at: <http://www.itu.int/wtpf/casestudies/korea.pdf>).
In order to further drive the growth in the broadband Internet access market, the government is scheduled to implement open access for ISPs and unbundling of the local loops of incumbent public telecom operators during the course of 2001.
Box Figure 3.2: Broadband access in the Republic of Korea, over time and by access technology
0
500
1'000
1'500
2'000
2'500
3'000
3'500
Jan-00 Apr-00 Jul-00 Oct-00 Jan-01
ADSL Cable
Broadband subscribers, thousands
2'957
1'581
72 10
ADSL Cable LAN Satellite
Broadband subscribers, by access technology, in thousands, February 2001
Source: Korean Ministry of Information and Communications.
16

Regulatory implications of broadband
Box 3.3: Waiting for broadband
While it may be true to say that, as yet, no single application has emerged that makes broadband a ‘must-have’ service for consumers, there are many actual and potential applications for which broadband is a ‘must have’ for service suppliers. Indeed, because the arrival of broadband has been slower than was predicted by some, the commercial viability of the first-movers in these markets has been seriously challenged. Here are just three examples of the many applications that are “waiting for broadband”.
Video games. The latest games consoles, such as Sony’s Playstation 2 or Microsoft’s X-box, come ready armed with Internet connections, DVD drives and high-powered graphics chips that make even top of the range PCs seem slow. However, gamers are amongst the most demanding interactive users. For them, even the slightest delay between a signal being sent and a response being shown on screen is intolerable. So, while many video game companies see the Internet as a way of earning new revenues, today’s narrowband networks just won’t cut it. A high-speed broadband connection could make the business models of companies such as SegaNet (<www.sega.net>) actually make sense. For gamers, a broadband connection opens up the chance of playing against friends and unknown rivals and also offers a chance to try out new games before purchasing them. For suppliers, the idea of pay-per-play, as well as monthly subscription income (SegaNet charges US$21.95 per month) promise to provide a more even revenue stream than the normal pre-Christmas rush for the latest software and consoles.
Short films. In an entertainment world that is dominated on the one hand by Hollywood blockbusters and on the other, by television, it is not easy for makers of short films to get airplay. Short films fit within the 30 seconds to 30 minutes category and may be animated or real-life. Many offer short visual jokes or spoofs of advertisements. While the Internet, as potentially the largest video-library in the world, provides an obvious outlet for short films, viewers with 56 kbit/s may still end up spending many minutes, if not hours, downloading the film of their choice. When it arrives, the picture might be small and the quality, for streaming media, poor. This turns off users, which turns off potential advertisers. Broadband promises to cut-through the log-jam and is a godsend to companies like AtomFilms (<www.atomfilms.com>), which has been waiting patiently since 1998 for it to arrive. In the meantime, many of its competitors have gone bankrupt and AtomFilms itself has only survived by using the Internet as one of many distribution channels. But every new broadband subscriber increases its potential market.
Application service providers. The basic idea behind an application service provider (ASP) is that, instead of buying packaged software on a CD-ROM, subscribers would rent it and pay for it either on a “pay-as-you-go” or a flat rate monthly fee basis. Similarly, instead of hosting your own website, you could outsource this mission-critical task. For the software company, selling via an ASP offers a new marketing channel, allowing potential users to try out software without heavy up-front costs, but without the possibility to make an illegal copy before returning it to the vendor. For the user, sourcing from an ASP means that you always have the very latest release of the software available and an online help facility when problems arise. Market leaders in the business include USinternetworking (<www.usi.net > ) and Loudcloud (<www.loudcloud.com>) but perhaps the biggest splash to date was made by Microsoft’s announcement of its .Net strategy which promises to change the way software is sold and used by making it available over the Internet from anywhere in the world. Like the other applications listed above, such a move from local to distributed information storage depends crucially on being able to have equivalent access speeds over a wide-area network to those enjoyed over a local-area network. Again, that sounds like a job for broadband.
Sources: For video games, see Wired Magazine, May 2001 “Game on” at <http://www.wired.com/wired/archive/9.05/>. For short films, see Business 2.0, April 2001 “Web Movies: the Sequel”: <http://www.business2.co.uk/content/channels/infront/article.asp?ID=354>.For application service providers, see The Economist, 14 April, 2001, “The beast of complexity: Survey of software” at: <http://www.economist.com/surveys/displaystory.cfm?story_id=568249>.
Commercial
48. Broadband is quickly becoming an essential resource for business activities as companies move beyond using the Internet for email and for exchanging small data files towards more data-intensive communications. One of the drivers for this is business-to-business (B2B) e-commerce. Broadband is a mission-critical imperative to knowledge-based companies, and for those using computer-aided design packages or company-wide enterprise resource planning packages. Broadband is also a great asset to companies engaged in business-to-consumer (B2C) e-commerce, although the asymmetric nature of B2C means that the capacity-consuming download of information is typically at the consumer’s end. Ideally, all companies with critical broadband needs should have access to it. However, this may be the converse of the actual situation, as Box 3.4 indicates.
49. The early focus on providing broadband services to large companies, where economies of scale can be reaped during installation, has meant that the majority of companies, which are small or medium enterprises (SMEs), are under serviced, and the majority of commercial broadband demand is unsatisfied. Two recent innovations that are aimed at customising broadband local loop access to SMEs are laser broadband (see
17

ITU Briefing Paper
section 2.2) and the provision of broadband facilities during construction of Multi-Tenant Units (MTUs). The advantage of this latter strategy is that economies of scale can be reaped at the building level during installation, while services can be tailored to the needs of eventual occupiers.
50. The benefits that companies seek from broadband fall under the general headings of improved efficiency, cost savings and international competitiveness. To reap the benefits, businesses require integrated services with greater reliability and performance, backed up by service level agreements. This means, for instance, that Cable TV companies, which have traditionally supplied services to the home, but are now entering a new industry sector, must upgrade their facilities and review their company policies and practices in order to meet corporate expectations.
1.2 Competition in a converged market51. Competition between companies to provide services to customers may be either between companies in the same industry, or between companies that were traditionally in distinct industries. The second of these two is perhaps more interesting as companies seek to enter and compete in new environments. Competitive advantage within the same industry can be gained through economies of scale whereby companies seek to lower their costs, and the degree of substitutability of their products and services, in order to establish a degree of monopoly power. Competitive advantage for companies in (erstwhile) distinct industries is more a matter of seeking economies of scope.
52. Economies of scale and scope in a broadband world imply that few consumers will have, or need, access to more than one or two fixed-line networks (such as telephone and cable TV). While there may be competition from wireless alternatives (such as mobile communications and satellite), it is likely that there will be a strong first mover advantage, giving the locally-dominant company an effective monopoly power. Which technology comes out on top will be largely a function of which one gets there first.
53. There is a proliferation of companies attempting to enter new converged service markets, including: Cable TV operators, upgrading their networks in order to offer digital video as well as switched
voice and data services. One factor driving them to do so is high consumer demand for high-speed internet access.
Radio stations, attempting to achieve a closer integration between their on-air broadcast and their web activities. As their target audience spends more time on the Internet, the path of integration may be crucial in retaining loyalties. Radio is having to re-evaluate its strengths in the wake of the Internet just as it did in the wake of TV.
In the United States, a group of national TV stations is testing services to beam high-speed data such as software programs, music, or video - directly into homes. A computer, or set top box, will act as a TV decoder . The move relies on the move to digital TV, which has been delayed by content battles and technical issues. The iBlast coalition is an example of the TV industry’s attempts to reinvent itself in the wake of convergence. iBlast hopes to illustrate to consumers that their service overcomes the bottleneck problems of the Internet.
18

Regulatory implications of broadband
Box 3.4 Broadband (DSL) reaches the indulged few, not the drivers of the economy
The potential of broadband to enhance economic growth depends on its benefits reaching the core economic drivers. A recent analysis by the Precursor Group indicates that, in the United States at least, the distribution of broadband services is contrary to that which might promote growth. Small and Medium sized Enterprises (SMEs), which account for 85 per cent of US employment and one third of output, are underserved with only 6 per cent having access to broadband. One barrier for greater take-up of broadband is the critical cost parameter of density/distance. The outcome is that companies based in downtown commercial hubs have good access to broadband services.
The paradox is that the companies that require broadband most are not those found downtown. There is a surprising correlation between activities that require a lot of physical space and those that have the most mission critical need for broadband. Examples include engineering companies that require broadband to transmit computer-aided design (CAD) formats; only 10 per cent were found to have broadband. Rural doctors also require bandwidth to view x-rays and CAT scans from hospitals and specialists. Some 90 per cent of those SMEs that have broadband use DSL. But the distance limitations on DSL prevent the provisions of integrated services to employees in the suburbs and this effectively bars teleworking. Other countries with shorter local loops than North America may be better positioned in this regard.
If broadband is a prerequisite for growth, and is a mission-critical tool for industry, one result will be the ongoing flight of knowledge-intensive workers to the hubs, with associated economic, environmental and social implications.
Source: Precursor Group, How Broadband Deployment Skews Economic/Business Growth, Feb 2001.
54. The challenges for these companies moving into new, converged industry sectors are typically not technical but operational as they strive to develop business models responsive to their new environment. ISPs, for instance, may not face technical problems in offering voice over VoDSL, but it imposes billing and number management issues with which ISPs may be inexperienced.
Bandwidth exchanges
55. Under-utilised fixed-line broadband capacity on key routes is now being bought and sold under markedly different conditions to those that prevailed previously. The old market model was based on long-term contracts with lengthy delay before fulfilment. The price for the half circuit was typically held artificially high by the (monopoly) incumbent. This is not suited to a dynamic market-focused environment where margins are cut to the minimum. The emerging model is for bandwidth to be differentiated by peak/off-peak use and by interruptability and bursty types of services, with each being priced and sold to targeted buyers. There are now many more buyers, as well as new classes of buyers –ISP, local exchange carriers and mobile operators. And new players are entering the market such as power companies (e.g., Enron, Williams) that are used to and experienced in commodity markets for which there is already a well-developed spot-market for capacity futures. This is providing bandwidth customers with greater choice and innovative pricing. Electricity and gas companies have a competitive advantage in their infrastructure, their rights of way, and the staff on hand for maintenance, billing services and their customer base.
56. The development of bandwidth exchanges is enabling a level of risk management that was not possible in the previous telecommunications market model. This suits companies with a history of trading in other markets such as electricity and oil, but is new to players in the telecommunications and cable markets. Incumbent cable companies that choose to join in this trading will have to learn the language and methods of the exchange floor where ‘derivatives’ have become standard risk-management tools.
57. The nascent bandwidth markets are suffering from teething troubles – falling margins, lack of standards, too many new players, and too much hype. The fall in prices to barely sustainable levels may hamper commodification of the market as it will not be in sellers’ interests to participate. Low volumes hamper efforts to develop credible price indices, which are a prerequisite for derivative trading. Moreover, the low volumes impact on the revenue of the exchanges, with some giving away their services in the hope of building the market. In other cases payment defaults are a major problem because online trading is conducted on an honour system governed by the individual provider’s terms and conditions. Despite these troubles, the enthusiasm for bandwidth exchanges continues. But equally, it should be remembered that although it took many years for the establishment of an effective oil futures market in the 1970s, the volume of trade in oil derivative instruments is now up to 20 times the trade in oil for physical delivery. It should also be remembered that the semiconductor derivatives market has not succeeded to date and the same fate may lie ahead for broadband exchanges.
19

ITU Briefing Paper
Figure 3.1: Bandwidth prices fell sharply in 2000, in indices, October 1998 = 100
Source: Based on data from Band-X Ltd. <www.band-x.com>
58. Meanwhile, the capacity on trans-Atlantic route rose from 23 Gbit/s in 1997 to 5 Tbit/s in 2001 – a compound annual growth rate of 280 per cent. This, and the deregulation of the supply side of the bandwidth market has seen the price of bandwidth fall by 50-60 per cent per annum on competitive routes, notwithstanding the increase in demand, see Figure 3.1. The end user demand is a function of the rate of uptake and the bandwidth requirements of applications, conditioned by the bandwidth capacity of local infrastructure. This makes it difficult to predict.
1.3 Economics of infrastructures
International Broadband Infrastructures
59. The economics of broadband infrastructure are, at best, hard to understand. While some argue that there is an on-going surplus of fixed-line bandwidth on certain major routes, others argue on the contrary that there is a broadband gap (Phillips Tarifica, 2001) especially on some so-called ‘thin routes’. Prices are plummeting as companies continue to install fibre optic cable. FLAG and Global Telesystems, for instance, announced in 2001 a joint venture to build a 1.28 Tbit/s fibre optic cable between USA and Europe (see Figure 3.1 for the recent price movements on the New York to London route). The initial 160 Gbit/s, costing US$1 billion, will be upgraded as demand warrants. Pre-sales of bandwidth on the trans-Atlantic routes exceed 25 per cent of the capacity. Moreover, while compression technologies and the freeing up of spectrum for more efficient applications are increasing the effective supply of bandwidth, the ITU faces a constant stream of applications for satellite slots16. It seems that, in the face of uncertainty, rather than wait, companies are channelling funds into broadband infrastructure – perhaps from fear of being left behind. The global extent of submarine cables, and the growth 1999-2002, is indicated by the maps in Figure 3.2.
60. The conundrum of over/under supply is partly answered by the fact that fibre optic is route specific and on some routes the demand is growing in excess of 100 per cent per year. Bandwidth demand in Asia grew almost 700 per cent17 in 2000, while Internet traffic between Asia and North America grew by almost 300 per cent. Supply of bandwidth lags in Asia partly due to reasons of slow opening up of market access but also due to high demand growth. For instance, bandwidth costs up to 40 fold more within Asia, and 9 fold more between Japan and the United States than on the trans-Atlantic route.
16 For more detail, see <www.itu.int/brspace/statistics/ssdrep_s9.html > 17 Total Telecom Asia, Bandwidth demand in Asia outstrips demand says report, 19 December 2000
20

Regulatory implications of broadband
Figure 3.2: Global submarine cable, 1999 (left), 2002 projected (right)
Source: Telegeography <www.telegeography .com >
Box 3.4. AT&T, AOL and the FCC head to head on the open access issue.
The recent mergers of AT&T with Media One, and AOL with Time Warner have produced the two largest cable companies in the USA. Previously, as an ISP, AOL together with more than 100 other ISPs including Mindspring had established the openNet coalition to fight for access to cable TV pipes. AT&T had fought against opening their assets to companies that did not contribute to the cost of installation. One of their main arguments was that the cost of upgrading to enable ISP access would be an excessive burden on them at an estimated cost of US$120bn. In an about face AT&T-Media One announced an exclusive agreement for ISP services with Mindspring until end of 2002. Proponents of open access welcomed this admission that, while technically challenging, sharing with ISP was viable. Meanwhile, AOL Time Warner has remained a member of openNET though it now favours commercial negotiation rather than regulation. In fact, it has entered an exclusive access agreement with the ISP Road Runner.
The open access lobby continues to fight in local and state courts on the grounds that competition will be good for the industry and for the consumer by promoting growth and interconnectivity. The counter argument is that the roll-out to date has been extensive, has directly benefited consumers by enabling the service, and has indirectly benefited the industry by promoting innovation. Without the roll-out there would be no network, no services and no prospect of competition. AT&T has threatened that those cities that impose burdensome, open access regulations will be the last to see broadband.
The FCC has been pleased by the agreements with Roadrunner and with Mindspring, which they see as evidence that the nascent industry is opening up under market conditions. Further evidence of competitive service provision is that digital TV services are available by satellite. Digital direct-to-home satellites are pulling ahead of digital cable TV. The benefits include that coverage is instant across an entire region rather than rolled out on a neighbourhood-by-neighbourhood process. While both satellite and cable offer digital video services, interactive services are more prevalent among satellite. Therefore, while prospective entrants to the market are fearful that they will not have access in time to build the market in a way that suits their companies, the FCC has decided against intervention.
In a saga not short of twists, AT&T blocked access to Qwest although they have an agreement to use Qwest’s network to offer DSL to AT&T customers where the cable alternative doesn’t exist. As recently, as March 2001 AT&T announced that it is seeking a buyer for the TW Entertainment component.
Sources: <http://www.totaltele.com/view.asp?articleID=34901&Pub=TT&categoryid=626&kw=qwest>.Broadband the beast, Reason, January, 2000, available at <http://www.reason.com/0001/fe.rs.broadband.html> Open-access lockout, America’s Network, April 2000, available at: <http://www.americasnetwork.com/issues/2000issues/20000401/20000401_openacess.htm>
Competition between media
61. The choice of media for the transmission of services to the consumer is not as wide as indicated by the range of transmission media outlined in chapter 2. Cost, topographical considerations and legacy networks limit the media that are suited to particular situations. Most broadband users either have ADSL or a cable modem, and the majority of potential users can only choose one of these technologies, or none at all.
21

ITU Briefing Paper
Nevertheless, as a recent OECD study demonstrates18, there is a high degee of correlation between availability of ADSL and cable modems. Where one is available, so usually is the other. Where only one is available, the take up of that service is usually slow, perhaps because of the lack of competitive pressure on prices. The degree of competition in any particular case depends on the degree of substitutability between higher and lower bandwidth services, whether there are restrictions on the bandwidth capacity which may limit competition in the markets, and the opportunities for economies of scale and scope, as well as legacy regulatory and institutional support for particular media. Despite the difficulties of generalising, some observations about competition between transmission media, and between access technologies are possible:
It is likely that DSL and cable modems will offer the initial routes toward broadband. Of the 15 million or so subscribers worldwide with access to broadband at the start of 2001, just over half were using cable modems and the rest were using ADSL (see Figure 2.3). For instance, in the United States, (see Box 3.4) and Japan, cable modems are currently ahead while in the Republic of Korea and Germany it seems to be DSL that is winning. This would seem to suggest that there is likely to be robust competition between the two media, thus reducing the requirement for regulatory intervention. However, there may not be competition in some locations due to the geographical limitations on DSL and due to the need to upgrade older cable systems.
Satellite is likely to be a ‘fill-in’ rather than a ‘first choice’ technology for broadband. Where Internet traffic growth is outpacing the installation of fibre optic capacity, an opportunity is created for satellite to satisfy some of the excess demand for backbone capacity. The competitive position of satellite broadband is helped at the moment by the fact that most SMEs are not reached by DSL. Where they are, satellite services may have to reduce their prices to be competitive.
Wireless broadband may compete effectively within a few kilometres from a base station. At present, where DSL is not available, fixed wireless may be the technology best suited to the SME market, and for rural and remote areas because it is rapidly deployable, scalable and has a lower implementation cost.
Fixed wireless is ideally suited to academic institutions, residential (including remote), telecommuters, branch offices, and businesses in the urban sprawl. Its primary disadvantages are that it is vulnerable to weather due to shortness of its waves, but it requires line of sight. Fixed wireless’s competitive advantage lies in that subscribers can be added without modifying the infrastructure and without the associated need to negotiate rights of way to private land, and poles, and remote subscribes can be included without laying cable or fibre.
All of the top three countries by market penetration worldwide are in Asia, with Korea in the lead, just ahead of Singapore and Hong Kong SAR. Each of these economies benefits from competitive markets for infrastructure competition and, because they each have relatively modern networks, the level of upgrading that needs to be done to accommodate broadband is modest. Each of these economies is also characterised by a strong government commitment to rolling out broadband.
2 REGULATORY CONCERNS OF BROADBAND
62. The regulatory issues of broadband are many and varied, and complex in their interaction. This is understandable given the disparate histories of the convergent industries and markets involved. When services were distinct (telephony, broadcasting and online computing) and they operated on different networks with different platforms (telephones, TV sets and computers) each was regulated by a different authority. Convergence is blurring distinctions, and raising questions as to the best regulatory framework to address the new environment. Convergence places pressure on existing regulatory regimes by highlighting the differences in regulatory requirements between converging sectors.
63. Much regulation can be interpreted as removing bottlenecks that hinder competition, and therefore service development and access. In technologically dynamic industries that are converging, the removal of one bottleneck does not imply that the markets, either individually or converged, are less subject to bottleneck barriers to competition. The position is quite to the contrary, as is evidenced by the example from the broadcast sector in Box 4.1.
18 The development of broadband access in OECD countries, original draft, June 2001, due for derestriction in late 2001, early 2002 (see the OECD website at <www.oecd.org/dsti>).
22

Regulatory implications of broadband
64. An appropriate framework in which to analyse the regulatory implications of broadband is that of the strategies and objectives of a particular Government. More generally, the G-7 Ministerial Conference on the Information Society (1995) identified the following eight core principles, which are used to structure the analysis below.
Promoting dynamic competition;
Encouraging private investment;
Defining an adaptable regulatory framework;
Providing open access to networks;
Ensuring universal provision of and access to services;
Promoting diversity of content; including cultural and linguistic diversity;
Recognising the necessity of world-wide co-operation, with particular attention to less developed countries;
Promoting equality of opportunity to the citizen (see Box 4.4).
23

ITU Briefing Paper
Box 4.1: Bottlenecks – an example from Cable/Satellite TV.
Bottlenecks can be defined in terms of a technology without access to which it is difficult for a third party to provide a service, or as an essential facility which it is not economically feasible to by-pass. Either way, they have the potential to undermine competition by:
Denying access to competitive services; Applying undue pressure in support of proprietary solutions; Allowing access only on a discriminatory basis; Allowing non-discriminatory access on the basis of monopoly fees; Bundling proprietary services in with non-proprietary ones to leverage market power in related markets; Imposing unreasonable access clauses such as platform exclusivity.In the world of analogue TV broadcasting a spectrum shortage (either technically or administratively imposed) is a barrier to entry that reduced the potential for competition. Consequently, there was a bottleneck whereby content providers competed for scarce outlets, encouraging governments in many countries to regulate content in the public interest. Digital TV allows for compression that reduces the impact of spectrum scarcity, reversing the former imbalance so that now an abundance of service providers compete for scarce content.
Market power in the form of control of bottlenecks also exists further down the supply chain for subscriber TV services, at the level of the household’s reception equipment – specifically the application program interface (API) in the set-top decoder. An API functions much the same as the operating system (e.g., Windows) in a PC – it defines the software interface that the applications expect to find on the decoder. It can therefore block consumer access to value-added services from companies that do not have compatible software. Such access denial is only an issue where there is vertical integration of control of the key facilities. While it may be possible to avoid the issues of vertical integration of control by developing a decoder that does not need an API, this would deny consumers access to value added services including interactive programming, navigation, and transaction technologies. In Italy, for example, where A grade football matches are deemed events of ‘national interest’, the growth of the broadband market appears to have been delayed by the fight over decoder standards used by the two companies with broadcast rights. To overcome the outcome that fans must have two decoders or settle for only receiving half of their team’s games, a law was passed in March 2000 mandating an inter-operable decoder by July 2000. During the second half of 2000 the two operators introduced new conditional access systems with no interoperability, in open violation of the legislative framework. The Italian NRA opened an inquiry in September 2000, and began to fine the two operators. In November 2000, D+ and Stream struck a deal on Simulcrypt technology, which will allow the simultaneous transmission of multiple cipher keys, belonging to different operators. Therefore, from April 2001 onwards, Italian digital TV subscribers should have been able to switch operators without changing the box: this has however not happened yet.
Regulatory moves to mandate access may be overzealous and remove the incentive to innovate if the resulting rent is due to first mover advantage to the innovator, rather than to anti-competitive behaviour. The difficulty is, to distinguish the sources of rent in a volatile and immature market. Moreover, these issues are novel in television because of previously strict regulation, vertical separation and government ownership of bottleneck facilities.
Source: Cowrie and Marsden, 1998 <http://www.digital-law.net/IJCLP/1_1998/ijclp_webdoc_6_1_1998.html>
2.1 Promoting dynamic competition65. Following from the success of competition in telecommunications in lowering prices, increasing consumer choice, and promoting innovation, governments have sought to enhance competition in the markets for individual services provided by broadband including cable television, broadcasting and data. In the United States, for example, in an attempt to foster competition, the FCC restricted cable or satellite television companies from providing services to more than 30 per cent of the nation’s total market. This regulation was overturned in March 2001 on the basis of constitutional freedom of speech. In Hungary, cable TV providers are restricted to a maximum of one sixth of the total market19.
66. Broadband competition, in a converged environment, is more complex because of cross-media ownership issues (see for instance, the case of Canada profiled in Box 4.2). In fact, the OECD20 argues that convergence is the result of changes in the economies of scope in the joint provision of telecommunications services and broadcasting services. Cross-media ownership has been regulated in many countries in order to prevent monopoly power in one market being used to leverage a power base in another market. In view of the changing technological, service and market developments arising mainly from the convergence process, it may now be necessary to reconsider whether the current regulations on cross-ownership and joint-
19 ITU case study: Internet in a transition economy: Hungary case study, available at <www.itu.int/wtpf/casestudies>20 OECD (1999) Regulation and competition issues in broadcasting in the light of convergence, available at
<http://www.oecd.org//daf/clp/Roundtables/broad00.htm>
24

Regulatory implications of broadband
provision continue to represent best practice regulation. Current regulations, which aim to promote competition in separate markets, may be barriers to competition and the development of new services and applications in the broadband world. Indeed, the huge investments necessary to construct broadband networks may only be cost-justified if there are multiple revenue streams generated.
67. The development of appropriate competition regulation for the transition from separate to converged markets may require that new market definitions be established. Australia, another early mover in applying competition policies across the economy, identifies the following issues in defining the market across sectors21:
While it is necessary to define the market, too narrow a definition may yield an expected competitive outcome greater than that which actually occurs, and too broad a market definition may yield a competitive outcome greater than anticipated.
It is difficult to distinguish markets in media where the rapid growth of alternative forms of service provision market boundaries change, and where new markets may emerge in the near future.
The services that consumers consider to be close substitutes for the product, and which geographic sources of supply they consider to be substitutable need to be identified for each service. The test for competition is a high cross-price elasticity. That is, that two goods are competing in the same market if when the price of one goes up the consumers switch to the alternative services to such an extent that the overall revenue of the price increaser goes down. Services with high cross price elasticities are said to be in the same market. A market can be said to exist if there is the potential for close competition (i.e. high cross price elasticity) even if none in fact exists at present.
68. The OECD22 notes that its Member States acknowledge that, while broadcasting competes with other forms of media for both viewers and advertisers, most countries have tended to distinguish broadcasting markets from other media markets. Markets for free-to-air television have also been systematically distinguished from the market for pay television. It remains to be seen whether separate markets for cable and satellite services will be distinguished. The OECD identifies various regulations between PSTN and mobile operators, between telecommunications and cable TV, between telecommunications and broadcast, between cable TV and broadcast, and within TV sector. Something of the range of these regulations is illustrated by those between the telecommunications sector and broadcasting, and between cable and broadcasting, as set out in Box 4.3.
69. The extent of regulation against cross-sector activities by telecommunications companies and cable companies among ITU Member States is indicated in Figure 4.1.
Figure 4.1: Regulation of Cross-sector activities in selected ITU Member States
0%
10%
20%
30%
40%
50%
60%
70%
80%
90%
100%
Africa Americas AsiaPacific
ArabStates
Europe &CIS
Can cable TV companies provide telephony?
Yes
No
0%
10%
20%
30%
40%
50%
60%
70%
80%
90%
100%
Africa Americas AsiaP acific
ArabStates
Europe &CIS
Can telecommunication companies provide cable television services?
Yes
no
Source: ITU, Telecommunication Regulatory Survey, 2000 (Data includes all Member States that responded to the survey).
21 The Relevant Market: <http://www.accc.gov.au/docs/pubreg_temp/exec5.htm>, see also the ITU case study of Regulatory implications of Broadband in Australia, available at <http://www.itu.int/broadband>.22 OECD (1998) Cross-ownership and convergence: policy issue, at <http://www.oecd.org//dsti/sti/it/cm/prod/tisp98-3.htm>
25

ITU Briefing Paper
Box 4.2: Canada’s pro-competitive approach to broadbandCanada was an early mover in applying pro-competitive policies in all aspects of the information highway. Internet Service Providers (ISPs) need no licenses or authorizations to carry on business, and do not pay any special access or per-minute charges to the telephone companies that connect them to their customers. Industry Canada estimates that there are 700 ISPs in Canada, mostly small, independent ISPs, which account for approximately 40 per cent of Internet subscribers. A handful of large ISPs, affiliated with established telephone and cable television companies, account for the other 60 per cent. One appeal of the larger, national ISPs, of course, is broadband: which in Canada means primarily cable modems and DSL.
Canada has taken a very aggressive approach to ‘opening up’ the broadband network facilities of those large telephone and cable companies to independent ISPs, so that they can resell broadband services (referred to by the regulator as ‘higher speed Internet services’) and compete with the incumbents which own the ‘last kilometre’ infrastructure.
With respect to cable TV companies, the CRTC ruled in July 1998 that it would not regulate the rates at which broadcast carriers (cable companies) offer retail level Internet services, but it would require them to file tariffs for the terms on which they would provide access to their telecommunications facilities to competitive providers of retail level Internet services.
Due in part to the Canadian cable industry’s having to develop the ability to allow third party access at a time when their American counterparts did not (and when the latter arguably wanted to maintain the appearance that such arrangements were technically impossible), it was another year before the Commission finally approved these wholesale rates and terms. Even then, it took another full year for most of the details to be worked out. The process of facilitating third party access to cable Internet infrastructure has grown in many ways to resemble the local competition process, with a great deal of industry and regulatory effort being put into creating a multi-provider environment out of a monopoly environment.
With respect to digital subscriber line (DSL) service, independent ISPs can purchase the underlying high-speed Internet service facilities that they need to provide DSL service at wholesale rates, and thus compete with the telephone companies directly. In the early days of DSL, though, the Canadian Association of Internet Providers (CAIP) asked the CRTC to prevent Bell Canada’s unregulated affiliates from allegedly selling these same services below cost to drive such competitors out of the market. However, the CRTC ruled in June 1999 that the market was competitive enough that such action was unnecessary. There are now dozens of registered resellers of high-speed Internet access services in Canada.
DSL service providers enjoy the same rights as competitive local exchange carriers (CLECs) with respect to access to unbundled network elements. There was early enthusiasm that DSL-based competitive local exchange carriers (or ‘DLECs’) would have a market opportunity selling broadband Internet service bundled with cheap telephone service, given DSL’s ability to carry up to eight voice channels over the same twisted copper pair. However, Canadian DLECs are having the same troubles as their American counterparts (indeed, the largest proposed DLECs in Canada were affiliates of the largest American ones – Covad and Northpoint). Each has effectively pulled out of the Canadian market, and the remaining Canadian entrants, such as C1 Communications, is in precarious financial condition.
In June 2001, the National Broadband Task Force submitted its final report in which it outlines steps that will enable private sector provision of broadband services providing 1.5 mbit/s symmetrically to end users, to up to 85% of Canadians by 2004. The rest should be met by a variety of programmes that combine competitive and public interests.
Source: Based on Industry Canada, The Canadian Telecommunications Service Industry - An Overview, 1999-2000 (forthcoming). See Industry Canada, Spectrum Management and Telecommunications, Statistics and Reports, <http://strategis.ic.gc.ca/SSG/sf01703e.html>.
Telecom Decision CRTC 98-9, Regulation Under the Telecommunications Act of Certain Telecommunications Services Offered by “Broadcast Carriers” (July 9, 1998). Final report http://broadband.g.ca/broadband-document/english/table_content.htm
26

Regulatory implications of broadband
Box 4.3: Cross-ownership and cross-sector service provision regulations between telecommunications and broadcasting, and between cable television and broadcasting.
There is remarkable similarity in the relevant regulations identified by the OECD, as can be seen from the list:
Restrictions on telecom/cable television operators from operating a legally separate enterprise in the broadcasting market;
Share limitations on telecom/cable television operators in broadcasting companies;
Restrictions on broadcasting companies from operating legally separate enterprise in the telecom-munications/cable television market;
Share ownership limitations on broadcasting companies in telecom/cable television operators;
Restrictions on telecom/cable television operators in obtaining a broadcasting license;
Restrictions on broadcasting companies in providing telecom infrastructure/cable television networks;
Restrictions on broadcast companies in providing telecom/cable television services.
Source: OECD (1998) Cross-ownership and convergence policy issues, available at <http://www.oecd.org//dsti/sti/it/cm/prod/tisp98-3.htm>
70. Cross-ownership and cross-sectoral service provision can have either a positive or a negative impact on the development of broadband, with the evidence, among OECD countries at least, pointing more to the latter. For instance, the Nordic countries, which are usually towards the top of any table showing penetration rates for Internet or mobile or other ICTs, are generally doing badly in broadband 23. One explanation of this is that incumbent telecommunication operators in those countries are generally also the leading cable TV providers. Relieved of one possible source of competitive pressure, they may be inclined to focus on exploiting profitable leased lines and ISDN services rather than offering consumers broadband. Nevertheless, some have argued that restrictions on cross-ownership can dampen investment. The issue for governments to decide is whether the monopoly position is due, or can lead, to non-competitive behaviour or whether it is temporary, for instance due to first-mover advantages of innovation, or to natural economies of scale and scope. If the monopoly power is due to economies of scale and scope, attempting to regulate them may impose long-term operational inefficiencies.
2.2 Encouraging private investment71. A national commitment to establishing broadband infrastructure and promoting broadband services is very common as countries seek to lead the world or fear being left behind (see discussion in chapter one). While the promotion of a particular technology harkens back to the now-eschewed 1980s policies of ‘picking winners’, the difference is that countries seek to grow broadband as a fundamental infrastructure and building block of the emerging information economy/society. While reliance on private investment to establish the infrastructure basis for broadband (cables, satellites, terrestrial) is consistent with an overall push to establish competitive market-based broadband, public encouragement of private investment, or even direct public investment, may be necessary to provide broadband access to poor and remote areas. Policies adopted by various countries include tax incentives and loan guarantees – see for example, Japan (Box 3.1). The case of Denmark is of interest because of the extensive policies and initiatives to reach the national goal of being a leader in technology (see Box 4.4).
72. The emphasis on private investment does not, of course, exclude public investment. China’s state-owned carrier, China Telecommunications Corp., for example, has plans to build a national broadband network of 15’000 kilometres serving twenty million users. China has been investing billions of dollars in network development in order to keep pace with growing demand24.
23 OECD 2001 The development of broadband access in OECD countries, original draft, June 2001, due for derestriction in late 2001, early 2002 (see the OECD website at www.oecd.org/dsti).
24 Dean, J (2001) China Telecom Plans to Build National Network, Wall Street Journal, <http://interactive.wsj.com/articles/SB983390941526883127.htm>
27

ITU Briefing Paper
Box 4.4: Denmark’s extensive policy platform for the Information Society
Denmark’s push into the broadband environment dates from 1994 when, in order to upgrade the political priority given to ICTs, they were brought under the jurisdiction of the Ministry of Research and Information Technology. Based on the argument that, in order to join the world market, Denmark would have to not only become an info-society, but also do so quickly in order to ‘get the jobs’, the Danish Government viewed broadband networks as a beachhead for the incursion.
An info-society per se was considered too risky if:
The public and private sectors were unable to redefine work routines, and develop IT-based products;
There is an increasing polarization into a two-tiered society of IT winners and losers;
The information society takes on features of centralist, surveillance society.
The Danish Model insists that the info-society is too important to be left to market forces because it should enable free access to information, support democracy and individual opportunity, support the individual at work and at leisure, make public service more transparent and efficient, and sustain the least advantaged in society. Therefore, the Government developed a 13 point political agenda supported by some 26 policies and 53 initiatives. The 13 political guidelines are listed in Figure 4.2.
The right hand side of this diagram shows the take-up of broadband services in Denmark. It is one of the few countries where the incumbent operator does not dominate the ADSL market. However, given that Denmark already has a substantial level of ISDN penetration, it may be difficult for ADSL to make substantial inroads.
Figure 4.2: Broadband in DenmarkPolicy guidelines and market development
1. Electronic network of the public service;
2. Utilisation of data and protection of personal data;
3. Security;
4. Better health service providing faster treatments;
5. ’Global village’ of research;
6. Ways in the educational system;
7. Cultural network Denmark;
8. Mass media through new channels;
9. Disabled persons in the information society;
10. IT – means to improve traffic management;
11. Network of companies;
12. World’s best and cheapest telecom services;
13. Open network of society.
0
50
100
150
200
250
300
350
400
Jun.98 Dec.98 Jun.99 Dec.99 Jun.00 Dec.00
Basic rate ISDN
Primary rate ISDN
ADSL
Broadband access in Denmark, '000 subscribers
Cable modems
Note: In the chart, to aid comparison, primary rate ISDN has been converted to users by multiplying connections by 15.Sources: From vision to Action – Info-Society 2000, available at <www.fsk.dk/publ/it95-uk/clean.> Data from Telecom statistics - second half of 2000, at:<http://www.tst.dk/index_uk.htm.>
73. The issue of the unbundling of the local loop is an example of how private investment may not lead to the full benefits of competition without some degree of regulatory intervention. The cost of duplicating the local loop is considered to be a major barrier for companies seeking to provide services over an existing twisted pair telecommunications network or over a cable TV network. Governments have regulated to open the local loops to competitors both within the same sector (e.g., cable TV competitors accessing cable TV local loop) and across sectors (e.g. DSL on telephone local loop – see Box 4.6). There is perhaps no better example of the intertwinedness between the economics of broadband and its regulation, and of the subsequent potential for policy tools to conflict or lead to unwarranted outcomes.
28

Regulatory implications of broadband
74. Another example of regulation that contains a large degree of ‘common good’, but which may be counterproductive in that it can reduce investment, is that of universal access obligations. OFTEL in the UK decided against regulation for universal broadband access in 1999 because regulation is generally considered to be inappropriate for such an immature industry and a mandated roll-out might imply higher prices. But, BT’s universal (telephony) service obligation has not been removed. Australia introduced universal service obligation for data services in 199925. The DDSO (Digital Data Service Obligation) is not broadband as it offers only the equivalent of ISDN (144 kbit/s), but it is available to 96 per cent of households in Australia. 26
Universal service has a higher level of urgency in developing nations, particularly those with a history of inequitable service provision. One such country is South Africa, see Box 4.4 Before such problems of inequality of basic services are addressed, it is hard to think about extending broadband access.
2.3 Defining an adaptable regulatory framework75. Establishing an appropriate regulatory framework is considered to be essential to promoting broadband. It is widely agreed that convergence should not lead to additional regulation 27. Rather, extant regulation should be checked for relevance and for unwarranted distortions in the light of convergence. There is less general agreement over the need for a converged regulator with responsibility for the converged broadband technologies and infrastructures. Some countries, such as Malaysia, and South Africa, have established a single converged regulator for both broadcasting and telecommunication services. Other countries like the United States have long had a regulatory body with responsibility for both telecommunications and broadcasting. However, these countries are still in the minority.
Box 4.5: Universal service access in South Africa
South Africa’s recent history of apartheid not only led to a markedly inequitable income distribution but also inequitable service distribution. Teledensity per household, for example, while 28.8 per cent nationally (fixed and cellular) is 18 per cent in black households and 82 percent in white households. Only 9 per cent of rural households have a telephone, compared with 64 percent of urban households. Universal access, defined as a 30 minute walk to the nearest phone, achieves 80 per cent coverage nationally, which is similar to the geographical coverage of mobile.
The barriers to telephone penetration rates among the historically underserved include, on the supply side:
geographical barriers and the tyranny of distance;
a high churn rate with 16 per cent cancellations due to lack of affordability making business models difficult to determine;
poor last mile infrastructure.
On the demand side:
low literacy levels;
high cost of usage – 40 percent of the population could not afford line rental even if it was set at just 2 per cent of their income.
Possible solutions to the lack of access include:
public telephones (120,000 public phones are to be installed by Telekom as part of its monopoly until 2002 agreement);
an expedited roll-out by existing licensees such as South Africa Telekom (partly funded by their partnership with SBC Communications International Inc and Telekom Malaysia Berhad) or by new market entrants.
prepaid mobile phones which bypassing the last mile issues, and avoiding credit problems faced by the poor. The number of prepaid subscribers on both national networks has now outstripped the number of post-paid subscribers, and the number of mobile subscribers has outstripped the number of fixed-line ones.
Source: ITU case study of Broadband in South Africa: available at <www.itu.int/.broadband>
76. A special workshop on “The impact of convergence”, convened at ITU’s Development Symposium for Regulators, November 2000, found that convergence raises the need for an active role of regulation due to:
25 For further information see <http://www.dcita.gov.au/nsapi-text/?MIval=dca_dispdoc&ID=4935>26 ACA (2000) Telecommunications Performance Report 1999-2000, ACA, Canberra.27 c.f. EC Green Paper on Convergence of Telecommunications, Media and Information Sectors
<www.europa.eu.int/ISPO/convergencegp/greenp>
29

ITU Briefing Paper
The immaturity of the industry;
Asymmetries in the relative strengths of the converging industries;
The need to enable the entry of competitive players.
77. It also concluded that regulation should be ex post, with the regulator promoting and monitoring rather than controlling and restricting. Regulation should be technologically-neutral, to allow operators to choose the technology that best fits their service, and which provides services to their customers rather than government ‘picking winners’. Licenses should migrate towards general authorizations rather than undermine convergence by limiting competitive activities, that is, should be technologically-neutral (see Box 4.5). Content regulation should remain separate because the fundamental role of the telecommunications regulator is to promote the production and distribution of content, which is philosophically distinct from the role of controlling that content.
78. However, the creation of a converged regulator was not found to be a necessary precursor to good regulation in a converging environment. It is possible to manage the transition to convergence with well-coordinated and cooperative existing agencies. Those countries that have established a single regulatory entity have, in some cases, kept functionally distinct divisions. Moreover, in some of the countries with a converged institution, the legislative framework lags behind the restructuring process and so the regulatory frameworks remain distinct. The key advantages and disadvantages of converged or multi-sector regulators, as identified by the World Bank, are set out in Table 4.1.
79. The key issue, then, is not so much whether the regulator is converged in name, but rather the decision-making capacity of the selected institutional approach. This means, not only making good decisions for the current situation, but having the speed and flexibility to make decisions for evolving and emerging situations. It was argued in chapter three that broadband industry is fundamentally different to the individual narrowband industries from which it evolves and emerges. According to Ure28, in order to ensure rapid uptake, that would avoid the problems that beset ISDN, radically different behaviour by both regulators and operators is required. This is because it is the collective action of all operators that will drive the market.
Table 4.1: Key advantages and disadvantages of converged regulators.
Issue Advantage Disadvantage
Risk of industry capture of rule-making process
Decreased risk of capture by one interest group reduced by responsibility for multiple sectors.
Increased risk that ‘industry capture’ by a dominant player could influence multiple sectors.
Risk of ‘political capture’ of rule-making process by minister
Reduced because single issues relate to various ministers.
Increased risk that capture by a dominant minister has multi-sector impact.
More precedents set More certainty as precedents set in one sector can be understood to apply in others.
Increased risk that precedent set in one industry could be applied inappropriately to other sectors.
Common source of professional staff Economies of scale, which particularly important if there is a shortage of regulatory experience and expertise.
Dilution of sector-specific technical expertise.
Source: Based on World Bank, 2000, Telecommunications Regulation Handbook available at <www.infodev.org/projects/314regulationhandbook>
28 Ure J, (2000), Broadband: an era of uncertainty and confusion in strategy and policy, ITU, AsiaTelecom 2000.
30

Regulatory implications of broadband
Box 4.6: Technological neutrality.
One of the thorny issues raised by broadband is that of technological neutrality with regards to regulation. Technological neutrality provides for equitable treatment of different technologies and spurs innovation. The regulator should create an environment in which, for example, the use of satellite rather than cable to provide a service is of no consequence to the consumer. Competition between technologies spurs innovation and accelerates deployment of advanced services. Regulation that is not technologically neutral may inadvertently select winners and losers in the information economy.
An example of technological neutrality comes from electronic signature and authentication techniques. To the extent that legislation seeks to enable diverse techniques – some of which have not been thought of yet – it becomes progressively more difficult to specify meaningful consequences for their use. Legislators may be unwilling to grant a high level of legal benefits to techniques that are unknown, or that have no imprimatur other than marketplace acceptance. This conundrum is inevitable in establishing a legal framework against a background of rapid technological change. An attempt to codify a known authentication mechanism runs the risk of stunting the development of other mechanisms, or of giving an unfair first-mover advantage to a technology that is in its infancy. Moreover, any such premature legislation may place the country outside the mainstream of technological and legislative developments internationally. For these reasons, technological neutrality in electronic legislation has, become an increasingly prevalent objective.
Source: Baker, S. and M. Yeo (1999) Survey of International Electronic and Digital Signature Initiatives, International Law and Policy Forum, < http://www.ilpf.org/digsig/survey.htm >.
2.4 Providing open access to networks80. Unbundling the local loop is expected to introduce competition into local copper wire networks to hasten the deployment of high-speed Internet access at a substantially reduced cost. In April 2000, the EC acknowledged that despite progress towards these goals in some Member States, non-binding measures are unlikely to achieve local loop unbundling at a pace warranted by the dynamic nature of the industry. Subsequently, a regulation was passed, in December 2000, which requires that:
Incumbent operators to provide competitors with full access to local copper loops on fair, reasonable and non-discriminatory terms;
Physical access be granted at any technically feasible point on the copper loop, including collocation;
The price of access must be cost-based;
Operators must publish prices, terms and conditions.
81. However, even with mandated unbundling, prices in Europe range from between 8 and 16 Euro (US$7-14) per month for unbundled access and few countries currently permit shared access. According to the World Bank there are both advantages and disadvantages from unbundling the local loop. These are summarised in Table 4.2. At issue are the fees that dominant telecommunications companies can charge for access to their lines. The fees set by the FCC, for example, are based on the hypothetical future cost of maintaining and operating the networks, giving no return on the cost of establishing the infrastructure. The incumbents are seeking a ruling that will set fees based on the billions of dollars that the network cost to set up. Otherwise, they claim, a future cost-based fee will be a disincentive to build new networks. The OECD presents evidence that may indicate that unbundling the local loop does not decrease investment.29
82. The process by which the UK made regulatory decisions to unbundle the local loop is set out in Box 4.6.
29 OECD, (2001) The development of broadband access in OECD countries, original draft, June 2001, due for derestriction in late 2001, early 2002 (see the OECD website at <www.oecd.org/dsti>).
31

ITU Briefing Paper
Table 4.2 Advantages and disadvantages of unbundling the local loopAdvantages Disadvantages
Encourages competition by reducing the economic barriers to entry by allowing new entrants to construct some components of their networks and obtain other components from the incumbent operator.
Reduces incentive for construction of competitive network facilities.
Encourages innovation, since new entrants can combine new technologies with components of existing networks.
Undermines investment in alternative access networks (wireline and wireless).
Avoids unnecessary and inefficient duplication of components. Can enrich the new entrant at the expense of the incumbent operator.
Facilitates access to rights of way, towers, etc, by new entrants, and avoids the disruption to streets and to the environment during a duplicate roll-out.
Requires detailed regulatory intervention and technical co-ordination.
Provides a new revenue stream to incumbent. Requires technical coordination between operators.
Source: Based on World Bank (2000), World Telecommunications Regulation Handbook, Module 3. <www.onfodev.org/projects/314regulationhandbook>
Box 4.7: The Process of Local Loop Unbundling in the UK
Because DSL offers the greatest potential for broadband access in the near future for both SMEs and residential consumers, BT’s network is considered too valuable a resource to leave in monopoly control. OFTEL consequently decided to mandate that BT opens its local loop to competitive service providers, even though BT was planning to introduce ADSL services itself. OFTEL considered two options to achieve unbundling:
BT would make local access lines available to other operators. This would give operators the flexibility to create their own access offerings choosing when and where to roll-out, and the technology with which to upgrade the lines;
Service providers and operators could access customers over BT’s upgraded network. This would enable access to a number of customers without the need for significant investment in infrastructure, but would be less flexible than the first option.
On the balance of cost-benefit analyses the first of these options was adopted. The operator purchasing the service would be able to install equipment in the local exchange (as BT makes space available) and on customer premises. There is to be no limit on the technology used to upgrade the loop other than the adherence to certain technical standards. Competitive operators should be able to offer services on or before 1 July 2001 under the following conditions:
Unbundled loops and collocation will be available to operators with interconnection rights and obligations;
Loops will be available at a cost-based price, allowing for reasonable profit.
By January 2001 it was apparent that the plans to unbundle the local loop were failing, despite BT’s attempts to separate ownership and service delivery over the local loop, and even though BT announced that it would commence collocation in April 2001 rather than July, to enable competitors to establish broadband equipment in its local exchanges. When the first 25 of BT’s exchanges were open to collocation bids, its rivals placed orders for only 14 of them. The prices proposed by BT and the loss of investor confidence in the telecommunications sector, apparently had a dissuasive effect.
In Feb 2001 the UK Government decided against spending £1 billion (US$1.43bn) to upgrade telephone exchanges to make them compatible with DSL. It had been anticipated that the Government would pay for the upgrade of the exchanges in order to resuscitate the ailing plans for “broadband Britain”, in the face of BT’s delay in unbundling of the local loop. At issue, is the question as to who should pay for the upgrade of the exchanges. The upgrade is needed because voice over DSL (VoDSL), as a digital signal occupies only part of the DSL channel and so must be treated before connection with the PSTN. BT has installed technology that does not allow for this.
Sources: OFTEL, (1999), Access to Bandwidth: Delivering Competition for the Information Age, available at <www.oftel.gov.uk/competition/a2b1199.htm> Broadband Britain Plan Scaled Down, FT.Com Financial Times, 14 February 2001
32
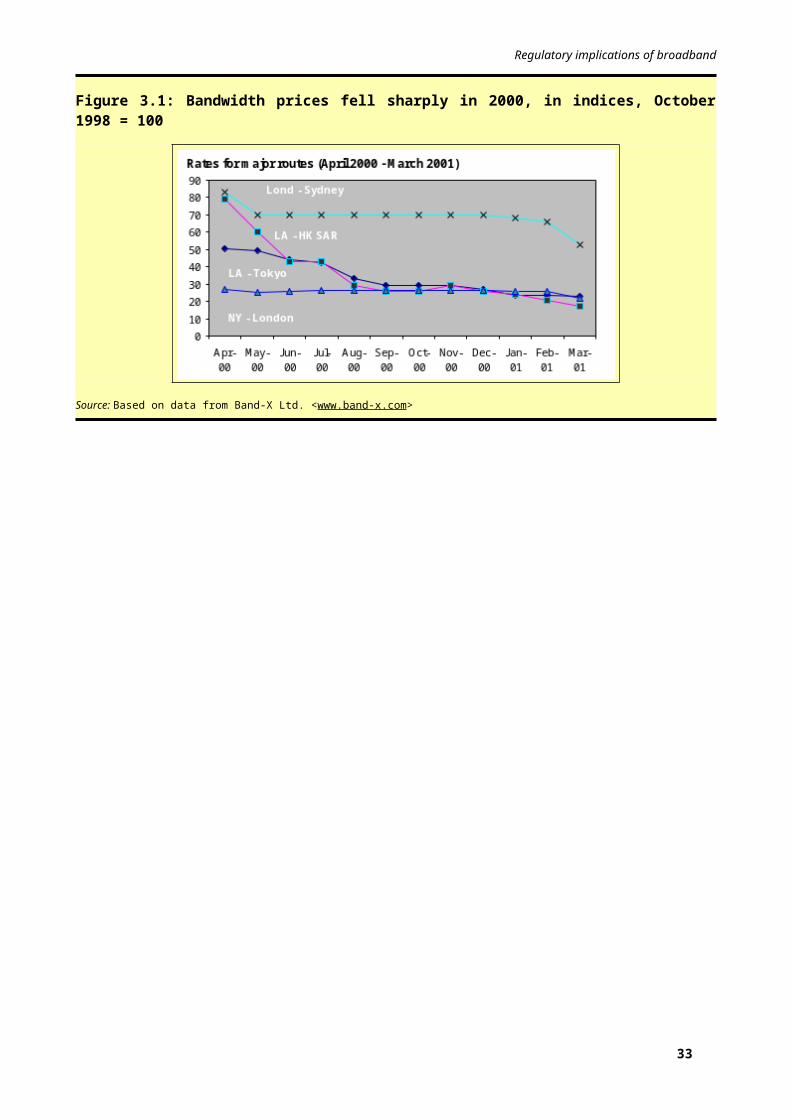
Regulatory implications of broadband
83. In the narrowband world, horizontal interconnection (between similar services by different companies) was a major issue. There was a case to be made for incumbents making interconnection as difficult as possible. In the broadband world, according to Ure30, vertical integration between, say, the broadband access network and the world of the Internet is the major issue. But, because a failure to connect will frustrate customers and be self-defeating, the issue should not be one that requires heavy-handed regulation. Horizontal connectivity is virtually guaranteed if there is vertical connectivity because the Internet provides an all-embracing interconnection. In a submission to Hong Kong’s Office of Telecommunications Authority (OFTA), Cable and Wireless HKT (now Pacific Century Cyber Works) argued that the broadband world is completely removed form the old narrowband PSTN interconnection debates. Therefore, drawing the same regulatory conclusions could be dangerously unreliable. Cable and Wireless HKT made the following arguments against forced interconnection and access to broadband networks:
In a broadband world it is necessary for OFTA to consider the development of the entire broadband industry rather than focusing on the fixed network because that would introduce distortions.
Due to the immaturity of broadband, even market driven outcomes are highly unpredictable. The potential for ill-conceived regulation to do enormous harm is greater than in stable narrowband telephony markets. The outcome could be a stifled broadband market. Good decision making would require a full and proper understanding of broader market implications of imposing regulations on broadband networks at a time of extraordinary change, including the nature of broadband networks, how they are changing, existing and potential future competitive constraints on them.
As evidence that market forces, rather than regulation should be relied upon, the Internet has evolved - largely in the absence of regulatory intervention. Only persistent market failure in a mature market can justify intervention. There are a number of technologies capable of delivering broadband services that compete with those provided by fixed networks. Therefore, the fixed networks are not bottleneck barriers to competition.
84. Such arguments, and the disadvantages of unbundling identified by the World Bank, have not changed the decisions of the many regulators who continue to require unbundling access even at the possible expense of investment and innovation. In October 2000, for example, the Canadian regulator ruled that companies providing wholesale high-speed access to ISP on DSL should have access to the local loop at the same rates and same conditions as the competitive local exchange carriers (CLEC). Such companies will now be able to offer fast broadband access without having to build their own lines.
3 REGULATORY IMPLICATIONS OF BROADBAND: ISSUES FOR DISCUSSION
85. The transition towards broadband networks has a number of implications reviewed in this paper, both for regulators and more generally for governments. The following list presents a selection of issues that participants in the ITU Workshop may wish to discuss, from the perspective of their own countries:
3.1 Outlook for broadband86. There are many possible routes to a broadband future, for instance via copper wires, fibre optics, wireless or satellite. Which is the optimal medium, from technical, commercial and consumer perspectives? Should regulators care?
87. Broadband networks are likely to require huge investments over many years. Is there a role for government in creating a favourable investment environment or promoting awareness? If so, which policies are likely to work best?
88. Local and city governments often own much of the physical infrastructure (e.g., pipes, roads, high sites) and rights of way that could theoretically be used to construct broadband networks, and they often have an economic interest in seeing networks rolled out, for instance to improve competitiveness or to attract investors? Should they become involved in the supply side as some city governments, such as Stockholm, have been?
30 Ure, J. (2000) Broadband: an era of uncertainty and confusion in strategy and policy, Paper presented at the ITU Telecom Asia 2000, December.
33

ITU Briefing Paper
89. The telecommunications, wireless and Internet sectors are currently in the financial doldrums and are experiencing difficulties in raising capital for investment projects. Is there any role for government here?
Some argue that broadband is a luxury affordable only in rich countries, and that developing countries should concentrate on rolling out basic service first. Is this argument valid? Can developing countries leapfrog directly to a broadband future?
3.2 Regulatory convergence90. Some countries have reorganized their regulatory frameworks so that responsibilities for broadcasting, telecommunications and Internet fall under the same agency. Other countries have always had a converged structure. What are the advantages and disadvantages of such a structure?
91. If a country decides against moving towards a converged regulatory structure, how should broadband issues, which cut across today’s sectors, be handled?
92. Should regulations applied to programmes broadcast over television networks (e.g., relating to decency, political balance, restrictions on advertising, etc.) be applied also to similar services made available over broadband Internet?
93. Should regulations applied to telecommunications (e.g., universal service obligations, tariff control, interconnection obligations, etc.) be applied also to similar services made available over broadband Internet?
3.3 Cross-ownership, cross-sectoral service provision94. What instances, if any, might justify regulation to prevent telecommunications companies from owning video entertainment companies or broadcasting companies from owning telecommunication operators?
95. What instances, if any, might justify regulation to prevent telecommunications companies from offering video entertainment services or broadcasting companies from offering telecommunication services?
96. What constraints, if any, might be applied to companies that succeed in building dominant positions in more than one sector?
3.4 Network access97. Companies that invest to build local access networks seek a return on those assets. But control of local access networks can become a bottleneck facility.
a) Should incumbent telecommunication operators be obliged to provide unbundled access to the local loop?
b) Should cable TV operators be obliged to provide unbundled access to their subscriber networks?
c) Should 3rd generation wireless operators be obliged to provide unbundled access to their subscriber networks?
d) What is a fair price for local loop access and how can this price be determined?
98. Should companies that are constructing broadband networks be obliged to share facilities or infrastructure with service providers? Under what circumstances, if any, might they be obliged to share with competitors?
99. Are there any circumstances in which the owner of a broadband network should be obliged to carry a particular service or to interconnect with a particular network?
100. Is there any logic in obliging separation between content and carriage on a broadband network?
101. Is broadband a potential natural monopoly?
3.5 Competition policy102. Do concepts and definitions of market dominance change in a converged world?
103. How appropriate are legacy competition policy regulations to the broadband environment? Are they compatible with ‘technological neutrality’?
34

Regulatory implications of broadband
3.6 International co-operation104. What market entry or investment limitations, if any, might be justified on the ownership and operation of broadband networks by foreign entities?
105. When broadband networks interconnect at the international level, do any issues arise which go beyond national legislation or regulation?
106. If a single company owns both ends of an international broadband connection, are there any particular policy concerns that might arise (e.g., due to transfer pricing, location for regulatory purposes, etc.)?
3.7 Other issues arising from broadband 107. What other regulatory issues are likely to arise from the roll-out of broadband networks and services?
35

ITU Briefing Paper
Annex 1: Penetration rates for various broadband services and access technologies.Telephone main line
density per 100 inhabitants
TV sets densityper 100
inhabitants
Internet host density per 10'000
inhabitants
Cellular mobile subscriber density
per 100 inhabitantsOverallRank
Economy 1999 Rank 1999 Rank 1999 Rank 1999 Rank
1 Norway 71.2 5 58.50 16 1'694.55 3 61.75 4
2 Finland 55.2 18 64.30 10 1'850.51 2 65.12 1
3 Denmark 68.5 7 62.10 12 1'134.50 6 49.47 10
4 Iceland 67.7 9 52.00 25 1'895.69 1 61.93 3
5 United States 68.2 8 84.90 2 1'386.99 4 31.15 25
6 Sweden 66.5 10 53.10 23 1'116.40 7 58.29 5
7 Bermuda 85.7 1 109.40 1 840.01 11 19.64 42
8 Netherlands 60.6 12 55.30 18 1'011.21 9 43.54 17
9 United Kingdom 57.5 16 64.50 9 549.93 18 46.28 13
10 Australia 52.1 23 70.50 7 1'028.81 8 34.28 22
11 Canada 65.5 11 71.50 5 976.98 10 22.65 35
12 Switzerland 69.9 6 51.80 26 714.00 12 41.08 19
13 Japan 49.4 27 71.20 6 371.81 24 44.94 16
14 France 57.9 14 60.30 13 313.22 27 36.40 20
15 Austria 48.2 31 51.60 27 583.87 16 51.44 8
16 Hongkong SAR 57.6 15 43.40 38 305.00 28 63.61 2
17 Germany 58.8 13 58.00 17 361.48 26 28.57 28
18 Luxembourg 72.4 4 38.90 50 399.91 22 48.70 11
19 Taiwan-China 54.5 20 41.60 41 482.19 19 52.24 7
20 Belgium 50.2 26 52.30 24 582.19 17 31.45 23
21 New Zealand 49.0 28 51.20 28 1'262.38 5 23.01 34
22 Italy 46.2 34 48.80 30 142.60 41 52.83 6
23 Portugal 42.4 41 54.20 21 149.22 38 46.81 12
24 Faroe Islands 55.7 17 38.50 51 375.93 23 24.13 32
25 Ireland 47.8 32 40.70 48 298.40 29 45.67 15
26 Greece 52.8 22 47.20 34 128.14 43 31.06 26
27 Estonia 35.7 55 55.30 18 368.11 25 26.77 29
28 Spain 41.8 43 50.80 29 201.80 32 31.20 24
29 Greenland 45.7 36 41.00 46 693.24 14 24.11 33
30 Israel 45.9 35 32.80 60 424.95 21 45.89 14
31 Virgin Islands (US) 54.8 19 59.20 14 38.94 64 21.13 36
32 Singapore 48.2 30 29.00 70 679.92 15 41.88 18
32 Malta 51.2 25 54.90 20 178.22 35 9.72 66
34 Czech Republic 37.1 50 46.70 35 205.32 31 18.95 46
35 Slovenia 38.0 48 35.60 55 199.50 34 30.86 27
36 Korea (Rep.) 44.1 38 34.60 57 44.92 61 50.03 9
37 Brunei Darussalam 24.7 72 63.50 11 77.94 47 20.52 38
38 Hungary 37.1 50 44.20 36 200.76 33 16.21 49
38 United Arab Emirates 40.7 45 30.60 67 163.80 36 34.71 21
40 Latvia 30.0 61 74.10 4 121.78 44 11.25 62
41 Andorra 44.1 39 40.00 49 157.00 37 18.82 47
42 Antigua & Barbuda 48.9 29 44.00 37 57.35 55 11.38 61
36

Regulatory implications of broadband
Telephone main line density per 100
inhabitants
TV sets densityper 100
inhabitants
Internet host density per 10'000
inhabitants
Cellular mobile subscriber density
per 100 inhabitantsOverallRank
Economy 1999 Rank 1999 Rank 1999 Rank 1999 Rank
43 Guam 46.6 33 67.10 8 13.38 85 12.16 57
44 Slovak Republic 30.8 60 41.30 42 90.14 45 17.06 48
45 Uruguay 27.1 64 53.20 22 136.82 42 9.54 67
46 Qatar 26.3 67 84.60 3 18.53 93 14.32 53
47 Bahrain 24.9 70 41.30 42 35.39 66 20.48 39
48 Cyprus 54.5 21 15.80 113 143.08 40 19.04 45
49 Kuwait 24.0 74 48.00 31 38.21 65 15.82 50
50 Lithuania 31.4 59 42.00 40 65.27 53 8.97 69
51 Poland 26.3 68 41.30 42 81.25 46 10.21 65
52 Guadeloupe 44.7 37 27.10 78 21.77 73 19.59 43
53 Bahamas 36.9 52 24.30 85 0.24 20 5.28 85
54 New Caledonia 24.1 73 48.00 31 13.34 86 12.11 59
55 Aruba 37.2 49 22.30 95 62.98 54 12.21 56
56 Macau 40.8 44 28.70 71 6.57 102 20.24 40
57 Lebanon 19.4 88 35.10 56 23.45 71 19.38 44
58 Puerto Rico 33.3 57 32.40 61 6.01 104 20.92 37
59 Bulgaria 35.4 56 40.80 47 31.55 68 4.23 90
60 Argentina 20.1 85 29.30 69 69.49 50 12.12 58
61 Guernsey 81.2 2 n.a. 199 211.37 30 24.51 31
62 Turkey 26.5 66 31.50 65 22.02 72 11.91 60
63 Croatia 36.5 54 27.90 75 57.20 56 6.59 79
64 Martinique 43.8 40 15.40 115 15.05 79 26.00 30
65 Chile 20.7 81 23.60 91 47.74 59 15.05 51
66 Jersey 75.2 3 0.00 199 148.93 39 19.96 41
67 Barbados 42.2 42 28.70 71 4.49 108 11.14 63
68 Brazil 14.9 95 32.40 61 47.41 60 8.95 70
69 Neth. Antilles 36.7 53 32.90 59 8.24 99 7.52 76
70 Trinidad & Tobago 21.6 78 33.50 58 67.10 52 2.99 100
71 Costa Rica 20.4 83 37.40 52 33.92 67 3.53 96
72 Oman 9.0 113 58.80 15 13.81 84 4.92 89
73 French Polynesia 22.6 76 18.30 108 67.25 51 9.49 68
74 Mexico 11.2 101 26.10 80 74.19 49 7.94 74
75 Romania 16.7 90 31.20 66 24.84 69 6.05 81
76 Malaysia 20.3 84 17.00 111 48.23 58 13.70 54
77 French Guyana 28.3 62 22.20 96 13.12 87 10.34 64
78 Yugoslavia 21.4 79 27.30 77 17.27 77 5.69 82
79 South Africa 13.8 97 13.40 120 74.96 48 13.21 55
80 Russia 20.6 82 42.10 39 15.78 78 0.92 126
81 Mauritius 22.4 77 22.70 93 12.77 89 8.88 71
82 St. Kitts and Nevis 51.8 24 25.70 81 1.57 124 1.81 109
83 Colombia 16.0 92 20.30 100 17.41 76 7.54 75
84 TFYR Macedonia 23.4 75 25.00 84 12.98 88 2.37 103
85 Dominica 27.9 63 21.10 98 40.36 63 0.86 128
37

ITU Briefing Paper
Telephone main line density per 100
inhabitants
TV sets densityper 100
inhabitants
Internet host density per 10'000
inhabitants
Cellular mobile subscriber density
per 100 inhabitantsOverallRank
Economy 1999 Rank 1999 Rank 1999 Rank 1999 Rank
86 Georgia 12.3 100 47.40 33 2.99 112 1.88 107
87 Venezuela 10.9 103 18.50 107 10.75 94 14.34 52
88 Grenada 31.5 58 36.80 53 0.59 142 2.15 105
89 Ukraine 19.9 87 41.30 42 9.85 95 0.43 136
90 Panama 16.5 91 19.20 102 7.84 101 8.61 72
91 Belize 15.6 93 18.30 108 20.52 75 2.63 102
92 St. Lucia 26.6 65 36.20 54 0.68 139 1.25 120
93 Saudi Arabia 14.3 96 26.30 79 3.05 111 4.00 93
94 Thailand 8.6 115 24.00 86 11.78 91 3.84 94
95 Jamaica 19.9 86 18.90 106 2.56 117 5.64 83
96 Seychelles 24.8 71 21.50 97 0.45 146 4.98 88
97 Belarus 25.7 69 32.20 63 1.55 182 0.22 154
98 Réunion 38.9 47 19.10 103 0.03 125 7.38 78
99 Dominican Rep. 9.3 109 9.60 133 14.41 82 5.02 87
100 Moldova 12.7 98 29.70 68 5.16 107 0.39 139
101 China 8.6 114 28.70 71 1.01 133 3.42 97
102 El Salvador 7.6 122 19.10 103 2.83 114 6.22 80
103 Ecuador 9.1 110 20.50 99 2.76 115 3.09 98
104 Azerbaijan 9.5 108 25.40 82 0.91 135 2.34 104
105 Armenia 15.5 94 23.80 88 8.35 98 0.23 153
106 Fiji 9.8 106 11.00 128 7.91 100 2.90 101
107 Botswana 7.5 123 2.00 166 24.82 70 7.51 77
108 Tonga 7.9 120 6.10 146 712.21 13 0.20 157
109 Peru 6.7 127 14.50 116 6.53 103 4.02 92
110 Paraguay 5.5 133 10.10 131 5.53 105 8.13 73
111 Kazakhstan 10.8 104 23.80 88 5.32 106 0.30 146
112 Northern Marianas 40.4 46 0.00 199 2.50 118 5.59 84
113 Bolivia 6.2 131 11.70 122 2.08 120 5.16 86
114 Bosnia 9.6 107 11.20 127 2.73 116 1.37 116
115 Namibia 6.4 129 3.80 156 21.57 74 1.77 110
116 Suriname 17.1 89 23.70 90 0.00 199 4.21 91
117 Philippines 4.0 140 11.00 128 2.97 113 3.66 95
118 Swaziland 3.1 148 11.30 125 12.03 90 1.43 115
119 Jordan 8.3 116 8.50 138 2.25 119 1.83 108
120 Maldives 8.0 119 3.80 156 14.53 81 1.05 124
121 St. Vincent 20.9 92 22.80 92 0.00 199 1.25 119
122 Zimbabwe 2.1 110 18.00 110 3.21 109 1.51 113
123 S. Tomé & Principe 2.7 93 22.70 93 56.96 56 0.00 192
124 Morocco 5.3 112 16.30 112 1.00 133 1.34 117
125 Guatemala 5.5 146 6.10 146 1.75 122 3.05 99
126 Iran (I.R.) 12.5 114 15.70 114 0.24 162 0.73 131
127 Turkmenistan 8.2 101 20.10 101 1.81 120 0.09 170
128 Indonesia 2.9 118 13.60 118 1.79 121 1.06 123
38

Regulatory implications of broadband
Telephone main line density per 100
inhabitants
TV sets densityper 100
inhabitants
Internet host density per 10'000
inhabitants
Cellular mobile subscriber density
per 100 inhabitantsOverallRank
Economy 1999 Rank 1999 Rank 1999 Rank 1999 Rank
129 Egypt 7.0 121 12.00 121 0.89 135 0.72 132
130 Tunisia 9.0 105 19.00 105 0.11 174 0.58 133
131 Nicaragua 3.0 141 7.00 141 3.71 108 0.90 127
132 Sri Lanka 3.6 132 9.80 132 1.16 128 1.22 122
133 Gabon 3.2 83 25.10 83 0.20 167 0.74 130
134 Tajikistan 3.5 64 31.60 64 1.12 129 0.01 191
135 Samoa 4.9 150 5.20 150 0.69 137 1.69 112
136 Uzbekistan 6.7 76 27.80 76 0.15 171 0.17 161
137 Micronesia 8.0 166 2.00 166 43.86 61 0.00 192
138 Kyrgyzstan 7.6 151 4.70 151 11.60 92 0.06 175
139 Cape Verde 11.2 188 0.50 188 0.42 146 1.93 106
140 Honduras 4.4 135 9.40 135 0.34 153 1.24 121
141 Kiribati 3.4 162 2.20 162 9.37 95 0.24 151
142 Mongolia 4.0 146 6.10 146 0.34 152 1.32 118
143 Libya 9.1 118 13.60 118 0.01 187 0.36 141
144 Côte d'Ivoire 1.5 141 7.00 141 0.53 143 1.77 111
144 Zambia 0.9 116 14.50 116 1.07 131 0.31 144
146 Cuba 3.9 87 23.90 87 0.27 158 0.05 177
147 Albania 3.7 125 11.30 125 0.38 151 0.29 147
147 Guyana 7.5 145 6.50 145 0.33 154 0.33 143
149 Senegal 1.8 155 4.10 155 1.28 126 0.95 125
150 Vanuatu 2.8 179 1.20 179 14.08 83 0.16 162
151 Solomon Islands 1.9 173 1.40 173 8.71 96 0.25 150
152 Yemen 1.7 74 28.40 74 0.03 180 0.15 164
153 Pakistan 2.2 133 9.60 133 0.63 140 0.21 156
154 Algeria 5.2 130 10.60 130 0.07 176 0.23 152
155 Bhutan 1.8 166 2.00 166 14.65 80 0.00 192
156 India 2.7 140 7.50 140 0.42 148 0.19 159
156 Marshall Islands 6.2 199 0.00 199 0.59 141 0.58 134
158 Ghana 0.8 124 11.50 124 0.22 164 0.36 142
159 Lesotho 1.0 171 1.50 171 0.42 147 0.48 135
160 Viet Nam 2.7 153 4.60 153 0.03 181 0.42 138
161 Kenya 1.0 162 2.20 162 1.30 125 0.08 172
162 Togo 0.9 169 1.80 169 0.47 144 0.38 140
163 Djibouti 1.3 151 4.70 151 1.12 130 0.04 182
164 Syria 10.2 143 6.90 143 0.00 196 0.03 184
165 Equatorial Guinea 1.3 123 11.60 123 0.11 175 0.07 173
165 Guinea 0.6 154 4.40 154 0.29 156 0.28 148
167 West Bank and Gaza 5.8 199 0.00 199 0.00 199 1.45 114
167 Papua New Guinea 1.1 192 0.40 192 1.28 127 0.15 166
169 Gambia 2.3 195 0.30 195 0.17 168 0.42 137
170 Mauritania 0.7 136 9.10 136 0.40 149 0.00 192
171 Cambodia 0.3 184 0.90 184 0.25 160 0.81 129
39

ITU Briefing Paper
Telephone main line density per 100
inhabitants
TV sets densityper 100
inhabitants
Internet host density per 10'000
inhabitants
Cellular mobile subscriber density
per 100 inhabitantsOverallRank
Economy 1999 Rank 1999 Rank 1999 Rank 1999 Rank
171 Iraq 3.0 139 8.30 139 0.00 193 0.00 192
173 Madagascar 0.3 162 2.20 162 0.39 150 0.08 171
174 Uganda 0.3 159 2.80 159 0.14 172 0.27 149
175 D.P.R. Korea 4.6 149 5.60 149 0.00 199 0.00 192
176 Sudan 0.9 137 8.70 137 0.00 199 0.05 178
177 Tanzania 0.5 165 2.10 165 0.12 173 0.16 163
178 Comoros 1.0 192 0.40 192 0.87 136 0.00 192
179 Cameroon 0.7 158 3.40 158 0.16 169 0.03 183
180 Benin 0.7 181 1.10 181 0.24 161 0.11 169
181 Angola 0.8 177 1.40 173 0.01 188 0.19 158
182 Haiti 0.9 172 0.50 188 0.00 192 0.31 145
183 Nigeria 0.4 190 6.80 144 0.06 177 0.02 187
184 Burkina Faso 0.4 187 1.10 181 0.32 155 0.04 179
185 Congo 0.8 176 1.30 177 0.02 185 0.12 167
186 Nepal 1.1 167 0.40 192 0.22 165 0.04 181
187 Rwanda 0.2 202 0.00 199 0.64 139 0.15 165
188 Mayotte 7.3 125 0.00 199 0.00 199 0.00 192
189 Sierra Leone 0.4 190 1.30 177 0.29 157 0.00 192
190 Mozambique 0.4 188 0.50 188 0.15 170 0.06 174
191 Mali 0.3 198 1.20 179 0.21 166 0.04 180
192 Eritrea 0.7 178 1.60 170 0.02 184 0.00 192
193 Lao P.D.R. 0.7 183 1.00 183 0.00 199 0.17 160
194 Niger 0.2 201 2.70 161 0.05 178 0.01 188
195 Guinea-Bissau 0.7 179 0.00 199 0.27 159 0.00 192
195 Malawi 0.4 189 0.20 196 0.00 194 0.21 155
197 Central African Rep. 0.3 196 0.50 188 0.04 179 0.05 176
197 Bangladesh 0.3 192 0.70 185 0.00 198 0.12 168
199 Burundi 0.3 195 1.50 171 0.00 191 0.01 189
199 Liberia 0.2 200 2.80 159 0.00 199 0.00 192
201 Myanmar 0.6 185 0.70 185 0.00 195 0.03 185
202 Ethiopia 0.3 193 0.60 187 0.02 183 0.01 190
203 Somalia 0.2 203 1.40 173 0.00 189 0.00 192
204 Afghanistan 0.1 204 1.40 173 0.00 197 0.00 192
205 D.R. Congo 0.0 206 0.20 196 0.00 190 0.02 186
206 Chad 0.1 204 0.10 198 0.01 186 0.00 192
Top 60 average 50.24 51.36 432.47 30.85
60-120 average 17.07 23.16 14.45 5.03
120-180 average 3.35 5.68 0.58 0.37
180-206 average 0.34 0.39 0.01 0.01
Note: Figures in italics refer to year-end 1998 or earlier data.Source: ITU World Telecommunication Indicators Database. Partially based on data from the Internet Software Consortium (< www.isc.org>), and RIPE (<www.ripe.net>).
40
Related Documents


