A P P L I C A T I O N N O T E In order to quantify the noise emitted by an equipment, a measurement of sound power is usually performed. This quantity is a unique descriptor that allows an operator to compare noise sources. Furthermore, recent European directives dealing with noise protection of workers specify that the noise power of industrial machinery must be estimated and clearly labelled if the noise nuisance may cause hearing damage (Leq > 85 dB (A)). Some international standards for measuring sound power are based on sound pressure measurements. However, such measurements are clearly not exploitable if the piece of machinery under test cannot be installed in a protected environment (anechoic or reverberant room) because of its size or if other noise sources that cannot be switched off are present in the test room – a common problem on a factory floor. The mathematical relationship between sound power and sound intensity has drawn acousticians to develop sound intensity techniques and intensity meters for the determination of sound power on-site. Specific measurement procedures for sound power determination using sound intensity have been defined in the international standards ISO9614, part 1 and part 2. The equipment required (a sound intensity meter and a sound intensity probe) must comply with the specifications of the IEC1043 standard. This application note explains how to use the Type 1 intensity meter developed by 01dB in the context of sound power determination using sound intensity according to ISO9614. Some practical examples are given to illustrate the measurement procedures. Theoretical, practical and standardisation aspects are also dealt with. Sound Power determination according to ISO9614 standard (dBFA32)

Welcome message from author
This document is posted to help you gain knowledge. Please leave a comment to let me know what you think about it! Share it to your friends and learn new things together.
Transcript

APPLICATION
NOTE
In order to quantify the noise emitted by an equipment, a measurement of sound power isusually performed. This quantity is a unique descriptor that allows an operator to compare noisesources.
Furthermore, recent European directives dealing with noise protection of workers specify thatthe noise power of industrial machinery must be estimated and clearly labelled if the noisenuisance may cause hearing damage (Leq > 85 dB (A)).
Some international standards for measuring sound power are based on sound pressuremeasurements. However, such measurements are clearly not exploitable if the piece ofmachinery under test cannot be installed in a protected environment (anechoic or reverberantroom) because of its size or if other noise sources that cannot be switched off are present in thetest room – a common problem on a factory floor. The mathematical relationship betweensound power and sound intensity has drawn acousticians to develop sound intensity techniquesand intensity meters for the determination of sound power on-site.
Specific measurement procedures for sound power determination using sound intensity havebeen defined in the international standards ISO9614, part 1 and part 2. The equipmentrequired (a sound intensity meter and a sound intensity probe) must comply with thespecifications of the IEC1043 standard.
This application note explains how to use the Type 1 intensity meter developed by01dB in the context of sound power determination using sound intensity accordingto ISO9614. Some practical examples are given to illustrate the measurementprocedures. Theoretical, practical and standardisation aspects are also dealt with.
Sound Power determinationaccording to ISO9614 standard
(dBFA32)


Copyright ©
SOUND POWER DETERMINATIONACCORDING TO ISO9614 STANDARD
SYMPHONIE measurement system – dBFA32 software packageApplication Notice
!!!! [email protected]!!!! www.01dB-stell.com
01dB-Stell Head Office565, rue de Sans-Souci
F-69760 LimonestFRANCE
" (33) 4 72 20 91 00# (33) 4 72 20 91 01
01dB-Stell Italia s.r.l.Via Berchet, 1335131 Padova
ITALY" (39) 49 92 00 966# (39) 49 92 01 239
01dB-Stell Inc.1583 East Genesse Street
P.O. Box 796Skaneateles NY 13152
USA" (1) 315 685 3141# (1) 315 685 3194
01dB-Stell do BrasilRua Tatui, 501Cep: 09015-620Santo André - SP
BRAZIL" (55) 11 4992 3600# (55) 11 4432 1783
The specifications are subject to change without notice (E&OE)
SYMPHONIE® is a registered trademark of 01dBMICROSOFT® is a registered trademark of Microsoft Corporation
Windows 95™, Windows 98™ are trademarks of Microsoft Corporation
gb_dBFA32_Intensity_ISO9614.doc - Updated 15/06/01


01DB APPLICATION NOTE: SOUND POWER MEASUREMENT ACCORDING TO ISO9614 STANDARD
TABLE OF CONTENTS PAGE 5
TABLE OF CONTENTS
1. THEORETICAL ASPECTS .............................................................................................................................7
1.1. ACOUSTIC INTENSITY....................................................................................................................................71.2. STANDING WAVE MEASUREMENTS ...............................................................................................................81.3. DETERMINATION OF SOUND POWER ............................................................................................................10
2. PRACTICAL ASPECTS .................................................................................................................................15
2.1. HISTORICAL ASPECT....................................................................................................................................152.2. THE TWO MICROPHONE METHOD PRINCIPLE ................................................................................................162.3. LIMITATIONS TO MICROPHONE BASED INTENSITY METER............................................................................18
2.3.1. Systematic errors : finite difference approximation principle............................................................182.3.2. Systematic errors : microphone transducers......................................................................................192.3.3. Systematic errors : distortions of measuring instruments ..................................................................192.3.4. Statistical errors .................................................................................................................................22
2.4. CALCULATION OF SOUND POWER IN A NOISY ENVIRONMENT ......................................................................23
3. STANDARDISATION.....................................................................................................................................25
3.1. REMARKS FOR SOUND POWER DETERMINATION USING SOUND INTENSITY...................................................253.2. ISO9614 PART 1 STANDARD (MEASUREMENT AT DISCRETE POINTS) ..........................................................26
3.2.1. Overview.............................................................................................................................................263.2.2. How to perform sound power measurements according to standard .................................................27
3.3. ISO9614 PART 2 STANDARD (MEASUREMENT BY SCANNING).....................................................................313.3.1. Overview.............................................................................................................................................313.3.2. How to perform sound power measurements according to standard .................................................31
4. 01DB EQUIPMENT REQUIRED ..................................................................................................................35
4.1. TRANSDUCER ..............................................................................................................................................354.2. ACCESSORIES (OPTIONS) .............................................................................................................................354.3. MEASUREMENT SYSTEM .............................................................................................................................36
5. MEASUREMENT PROCEDURES................................................................................................................37
5.1. SYSTEM SET-UP...........................................................................................................................................375.2. CALIBRATION..............................................................................................................................................37
5.2.1. Pressure calibration of the sound intensity probe microphones ........................................................375.2.2. Phase calibration of the sound intensity probe (to do at least one time)............................................375.2.3. Residual pressure intensity index measurement .................................................................................37
5.3. HARDWARE CONFIGURATION (FOR SOUND POWER MEASUREMENTS)..........................................................375.4. SOUND POWER MEASUREMENTS : DBFA32.................................................................................................38
5.4.1. Definition of the measurement surface (mesh) ...................................................................................385.4.2. Acquisition..........................................................................................................................................385.4.3. Pre-processing of the results ..............................................................................................................38
5.5. TAKE ACTIONS TO ACHIEVE THE DESIRED GRADE OF ACCURACY (ISO9614 CONFORMITY).........................385.6. RESULTS' EXPLOITATION.............................................................................................................................38
6. CALIBRATION : DBSOND32 .......................................................................................................................39
6.1. HARDWARE CONFIGURATION......................................................................................................................396.2. DEFINITION OF THE SOUND INTENSITY PROBE .............................................................................................40
6.2.1. Important notice .................................................................................................................................416.3. PRESSURE CALIBRATION OF THE MICROPHONES..........................................................................................416.4. PHASE CALIBRATION OF THE SOUND INTENSITY PROBE...............................................................................426.5. PRESSURE RESIDUAL INTENSITY INDEX MEASUREMENT ..............................................................................45
6.5.1. Manual entry ......................................................................................................................................456.5.2. Measurement ......................................................................................................................................46
7. HARDWARE CONFIGURATION OF INTENSITY METER : DBFA32.................................................49
8. SOUND POWER MEASUREMENTS : DBFA32.........................................................................................53

01DB APPLICATION NOTE: SOUND POWER MEASUREMENT ACCORDING TO ISO9614 STANDARD
TABLE OF CONTENTS PAGE 6
8.1. SELECTION OF THE MEASUREMENT METHOD AND THE MEASUREMENT SURFACE ........................................538.1.1. Definition of a parallelepiped mesh ...................................................................................................548.1.2. Definition of a mesh from a list of points and surfaces ......................................................................54
8.2. ACQUISITION – PRELIMINARY MEASUREMENTS..........................................................................................558.2.1. Measurement information window and save options .........................................................................558.2.2. Pressure calibration of the microphones ...........................................................................................568.2.3. Stationarity check of the sound field (ISO9614 – part 1 only) ...........................................................568.2.4. Calibration check by inverting the probe...........................................................................................59
8.3. ACQUISITION – SOUND POWER MEASUREMENTS.........................................................................................618.3.1. Parameters .........................................................................................................................................618.3.2. Sound power measurements without remote control..........................................................................638.3.3. Sound power measurements with a remote control............................................................................638.3.4. General remarks.................................................................................................................................64
9. PROCESSING OF THE RESULTS...............................................................................................................65
9.1. MESH DISPLAY............................................................................................................................................659.2. POINTS' LIST................................................................................................................................................659.3. LISTING OF THE RESULTS PER POINT............................................................................................................669.4. GRAPHICAL PLOT OF THE RESULTS PER POINT.............................................................................................689.5. LISTING OF OVERALL RESULTS....................................................................................................................719.6. GRAPHICAL PLOT OF OVERALL RESULTS .....................................................................................................739.7. NOISE MAP (ISO CONTOURS) OF THE OVERALL RESULTS............................................................................76
10. OBTAINING THE DESIRED GRADE OF ACCURACY : ISO9614.....................................................79
10.1. STATIONARITY CHECK (DISCRETE POINT METHOD – PART 1)...................................................................7910.2. SOUND POWER MEASUREMENTS..............................................................................................................81
10.2.1. Procedures to improve criterion 1 of the standard (Ld > F2) ............................................................8110.2.2. Procedures to improve criterion 2 of the standard (ISO9614 part 1 only) ........................................81
10.3. EXAMPLE OF MEASUREMENT USING THE ACTIONS TO IMPROVE THE GRADE OF ACCURACY ....................8310.3.1. Problematic ........................................................................................................................................8310.3.2. Improving Stationarity criterion (F1 indicator).................................................................................8410.3.3. Improving criterion 2 .........................................................................................................................84
11. RESULT EXPLOITATION........................................................................................................................89
11.1. EXPORTING DATA TO A SPREADSHEET OR WORD PROCESSOR..................................................................8911.2. PRINCIPLE AND CONFIGURATION OF THE COPY COMMAND .....................................................................9011.3. PRINTING RESULTS..................................................................................................................................90
12. BIBLIOGRAPHY ........................................................................................................................................91
12.1. PRE-ACOUSTIC INTENSITY MEASUREMENT..............................................................................................9112.2. RECENT DEVELOPMENT OF THE TWO MICROPHONE METHOD ..................................................................91
12.2.1. Principle and general themes.............................................................................................................9112.2.2. Particular aspects ..............................................................................................................................9212.2.3. Applications........................................................................................................................................9212.2.4. Standards ...........................................................................................................................................92
01DB APPLICATION NOTE: SOUND POWER MEASUREMENT ACCORDING TO ISO9614 STANDARD
CHAPTER 1 - THEORETICAL ASPECTS PAGE 7
1. THEORETICAL ASPECTS
We deal in this chapter with the theoretical aspects of sound intensity measurements and sound powerdetermination using sound intensity.
1.1. Acoustic intensity
Acoustic intensity is a magnitude that corresponds to an energy flux density per unit time. It isexpressed in W/m2 and is determined from the product of acoustic pressure and particle velocity.
( ) ( ) ( )Π→ →
= ×t p t V t (1)
The pressure may be represented by P tcos( )ω and the velocity as V t→
+cos( )ω θ at a point in space,
for a sound wave of rotational frequency ω. θ being the phase angle between pressure and velocity.
Hence an equation is obtained that defines the instantaneous acoustic intensity:
( ) ( ) ( ) ( ) ( )Π→ →
→
= −t PV tPV
tcos cos sin sin2
22ω θ ω θ (2)
The first term describes an energy transfer conveyed by the sound wave. The term ( )cos θ indicates
that this part is in phase with pressure and velocity. The second term corresponds to an oscillation ofenergy around a fixed point for which the mean value in time is zero. Analogous with electricalphenomena, it is described as reactive intensity.
It is the time-averaged value of the instantaneous intensity defined by equation (1) that is the magnitudecurrently used
( ) ( )I p V LimT
p t V t dtT
T→ →
∞
→=< >= ∫.
α
1
0
(3)
It is only dependent on the first term of equation (2) as the reactive part is eliminated by integration (termsin( )2ωt ).
The average intensity I→
only represents the energy transfer. According to equation (2), whenpressure and speed are separated by a 90°-phase shift, the average intensity is zero, the phenomena ispurely reactive and no energy transfer produced by the sound wave is observed.
As it is particularly difficult to measure particle velocity directly, approximations have developed that arebased on a measurement of RMS pressure using the equation.
Ipc
→≈ < >2
ρ(4)
(ρc is the characteristic impedance the propagation medium where ρ is the density of air and the speedof sound).

01DB APPLICATION NOTE: SOUND POWER MEASUREMENT ACCORDING TO ISO9614 STANDARD
CHAPTER 1 - THEORETICAL ASPECTS PAGE 8
This formula assumes free field radiation where pressure and velocity are in phase, thus cos( )θ = 1 forequation (2) such is the case for a progressive plane for which:
( )V tp t
c= ( )
ρ
In practice, conditions vary from this ideal and the relationship is not sufficient, particularly where soundsources are in close proximity or where reactive components or interference are present.
In addition, the scalar nature of the approximation < >p c2 /ρ means that all vector information is lostfrom the acoustic intensity concept.
Two examples are discussed in order to clarify these problems:
$ Standing wave measurements.
$ Calculation of acoustic pressure in a noisy fluid.
1.2. Standing Wave measurements
A pressure wave P t kxcos( )ω − P t kxcos( )ω − incident at 90° to a perfectly reflective surfaceproduces an identical reflected wave but propagated in the inverse sense:P t kxcos( )ω + (k c= ω / isthe wave number).
Superposition of these two phenomena produces a standing wave.
( ) [ ]p t P t kx t kx
p t P kx t
= − + +
=
cos( ) cos( )
( ) cos( )cos( )
ω ωω2
And ( )< > = = +p
c
P
ckx
P
ckx
2 22
221 2
ρ ρ ρcos ( ) cos( )
The approximation < >p c2 /ρ describes the succession of nodes and pressure anti-nodescharacteristic of a standing wave. One can equally notice that the speed is out of phase by 90° with thepressure at all points, indicating that the intensity is zero everywhere. There is no energy transfer in anideal standing wave.
If the surface in not perfectly reflective (a Reflection coefficient R< 1), some energy transfer will occur.
The approximation < >p c2 /ρ always appears as level fluctuations.
( )< > = + +p
c
P
cR R kx
2 222
1 2 2ρ ρ
cos( )
While the acoustic intensity corresponding to the equation (3) contains a constant value:
( )IP
cR
→= −
22
21
ρ
The factor 1 - R² represents the absorption coefficient (of the surface).

01DB APPLICATION NOTE: SOUND POWER MEASUREMENT ACCORDING TO ISO9614 STANDARD
CHAPTER 1 - THEORETICAL ASPECTS PAGE 9
Figure 1: Intensity of a standing wave.
In the conditions of standing waves and more generally in diffuse fields, the approximation of theacoustic intensity by the quadratic pressure is no longer useful to describe acoustical energy transfer.
Examples of interference are commonly found in industrial environments where they are caused byreflections from walls or by different sound sources having a common mechanical excitation (coherentsource).
In some instances, the results given by the quadratic pressure measurements totally obscure the energytransfer phenomena produced by the acoustic influence of a particular piece of equipment. The followingchapter examines the limitations of the quadratic pressure estimation with regard to industrialapplications.

01DB APPLICATION NOTE: SOUND POWER MEASUREMENT ACCORDING TO ISO9614 STANDARD
CHAPTER 1 - THEORETICAL ASPECTS PAGE 10
1.3. Determination of sound power
Sound power W radiated from a sound source is defined as the total sum of the sound energy flux thatcrosses a surface that completely envelopes this source.
Mathematically this may be defined by:
( )W = flux density dS∑∫ (5a)
The flux density that crosses the area (Σ) corresponds to the acoustical intensity vector component I→
ofthe vector normal to a surface element dS:
(Flux density)= ρ )I.n = In (5b)
Where it is impossible to directly measure the acoustic intensity in the normal direction of themeasurement envelope, it is possible to substitute the quadratic pressure measurement:
I < p² >
cn ≅ρ
(6)
It is this measurement that is adopted for existing standards regarding sound power calculations.
The approximation is effective providing certain conditions are met simultaneously:
$ H1: Pressure and velocity are in phase.
$ H2: The measurement envelope corresponds to the wave front produced by the sourcerays.
$ H3: The source is under free field conditions.
$ H4: The noise source does not contain perturbations.

01DB APPLICATION NOTE: SOUND POWER MEASUREMENT ACCORDING TO ISO9614 STANDARD
CHAPTER 1 - THEORETICAL ASPECTS PAGE 11
H3 and H4 are fulfilled when measurements are carried out in an anechoic environment. For pressureand speed to be in phase (H1) it is necessary to distance the field from the source. (H2) is more difficultto satisfy but acceptable results can be obtained by choosing a spherical measurement envelope (orhemisphere for a source on a reflective plane) where the radiated beams are sufficiently greater thanthe dimensions of the source which should be considered as a point source.
For H1, H3 and H4, the scalar quantity < >p c2 /ρ corresponds to the acoustic intensity modulus I→
.The choice of an spherical or hemispherical envelope in order to measure a source of very small
dimensions can result in the acoustic intensity vector I→
being coincident with the vector normal (H2
condition): the normal component In is then equated to the modulus I ρ
.
Figure 2: Determination of sound power over a hemispherical envelope.
For machines with significant dimensions, it is necessary to choose a parallelepipedal measurementenvelope that is more suitable for the geometry of the machine: the hypothesis (H2) is not fulfilled thus aprojection error is introduced that increases the true value.
Figure 3: Determination of the sound power on a parallelepiped envelope.

01DB APPLICATION NOTE: SOUND POWER MEASUREMENT ACCORDING TO ISO9614 STANDARD
CHAPTER 1 - THEORETICAL ASPECTS PAGE 12
For very large machines, where when the free space around the source is significantly reduced, theparallelepiped measurement envelope is within the near field of the source, thus invalidating thehypothesis (H1). The approximation based on the quadratic pressure gives quantities greater than theintensity module. A near field error factor can be added to the accuracy projection.
Figure 4: Determination of the sound power in the near field.
For industrial site applications, the measurement envelopes are frequently found in close proximity toreflective surfaces or within a reverberating medium. In many cases, the test area is particularly noisy.Hypothesis (H3) and (H4) are invalid and the power radiated by the source becomes caught up in theenvironment and added to disruptive sources.
01DB APPLICATION NOTE: SOUND POWER MEASUREMENT ACCORDING TO ISO9614 STANDARD
CHAPTER 1 - THEORETICAL ASPECTS PAGE 13
Standards have defined calculation methods for a correction coefficient, which takes account of theenvironment. However, these methods are restrictive and often prove to be ineffective for industrialenvironments, particularly when perturbed noise sources are very close to the envelope or that theirnoise level is high.
The calculation of acoustic pressure by approximation of the quadratic pressure gives results that aretotally erroneous.
These examples illustrate the limiting nature of the approximation < >p c2 /ρ when attempting to
measure acoustic intensity directly ∆r < >→
p V .
Another particularly important advantage, not developed in this paper, concerns the vector aspect of the
intensity < >→
p V . This has particular application in the location of noise sources and in spatial analysisof energy transfer fields.

01DB APPLICATION NOTE: SOUND POWER MEASUREMENT ACCORDING TO ISO9614 STANDARD
CHAPTER 2 - PRACTICAL ASPECTS PAGE 15
2. PRACTICAL ASPECTS
In this chapter, we deal with the theoretical and practical aspects of sound intensity and sound powermeasuring instruments.
2.1. Historical aspect
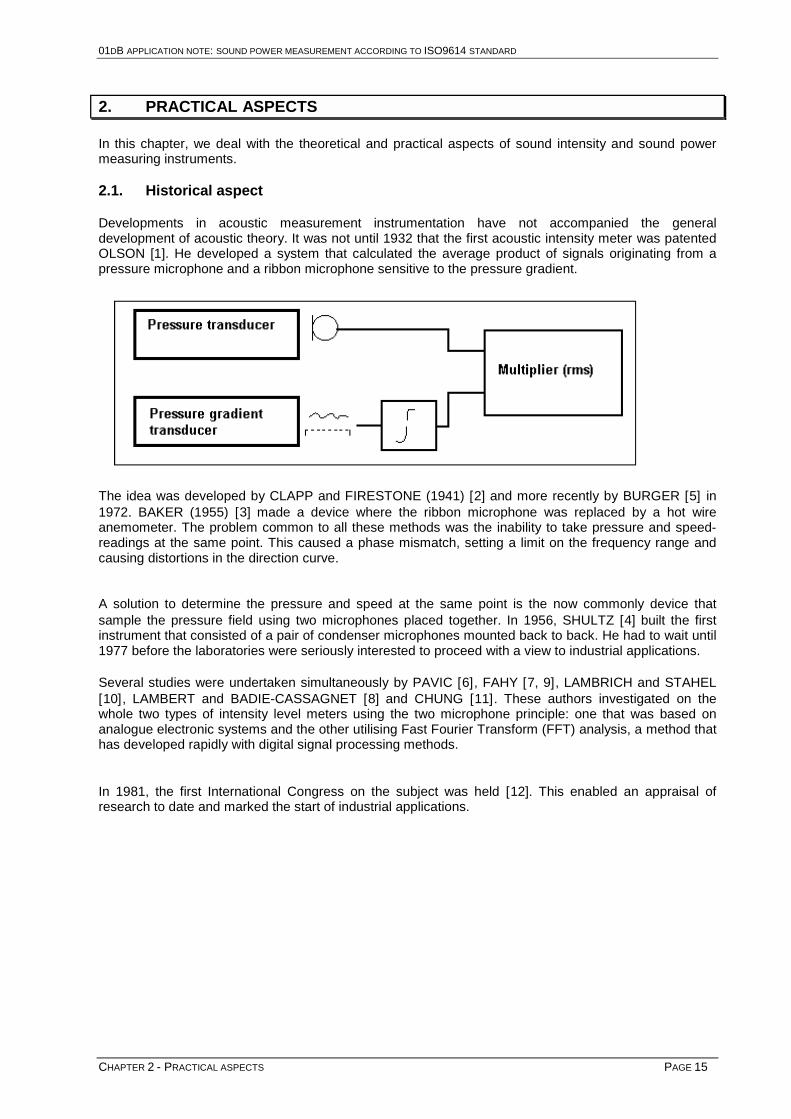
Developments in acoustic measurement instrumentation have not accompanied the generaldevelopment of acoustic theory. It was not until 1932 that the first acoustic intensity meter was patentedOLSON [1]. He developed a system that calculated the average product of signals originating from apressure microphone and a ribbon microphone sensitive to the pressure gradient.
The idea was developed by CLAPP and FIRESTONE (1941) [2] and more recently by BURGER [5] in1972. BAKER (1955) [3] made a device where the ribbon microphone was replaced by a hot wireanemometer. The problem common to all these methods was the inability to take pressure and speed-readings at the same point. This caused a phase mismatch, setting a limit on the frequency range andcausing distortions in the direction curve.
A solution to determine the pressure and speed at the same point is the now commonly device thatsample the pressure field using two microphones placed together. In 1956, SHULTZ [4] built the firstinstrument that consisted of a pair of condenser microphones mounted back to back. He had to wait until1977 before the laboratories were seriously interested to proceed with a view to industrial applications.
Several studies were undertaken simultaneously by PAVIC [6], FAHY [7, 9], LAMBRICH and STAHEL[10], LAMBERT and BADIE-CASSAGNET [8] and CHUNG [11]. These authors investigated on thewhole two types of intensity level meters using the two microphone principle: one that was based onanalogue electronic systems and the other utilising Fast Fourier Transform (FFT) analysis, a method thathas developed rapidly with digital signal processing methods.
In 1981, the first International Congress on the subject was held [12]. This enabled an appraisal ofresearch to date and marked the start of industrial applications.

01DB APPLICATION NOTE: SOUND POWER MEASUREMENT ACCORDING TO ISO9614 STANDARD
CHAPTER 2 - PRACTICAL ASPECTS PAGE 16
2.2. The two microphone method principle
Both the above methods use the same principle of measuring the pressure gradient by finite differenceapproximation. Two signals are captured from two microphones separated by a small spacer: onemethod derives an expression of the intensity in the time domain (analogue intensity measurement)while the other derives an equivalent spectral formula using Fast Fourier Transform analysis (FFTintensity level meter).
As the particle velocity in the acoustic field is not measured directly, the relationship defined by Eulermay be employed that states equivalence between the velocity and the pressure gradient under linearand steady state conditions:
v = -1
r ρ∂∂p
rdt∫ (7)
The velocity is obtained by integration of the pressure gradient estimated for the acoustic centre of theprobe, by taking the difference in pressure from the two readings and dividing by the distance betweenthem. This is referred to as the finite difference approximation of the acoustic velocity, calculated in thedirection r, from pressures measured by two microphones separated by a distance dr:
~v = -1
dtr
ρP P
r2 1−
∫ ∆(8)
With %p = P P
22 1+
as approximation of the average pressure for the acoustic centre, a point situated
between the two microphones. The value approaching the component in the r direction of the acousticintensity is (according to equation (3)):
( ) ( )~ ~ ~I p.v r r= < > = < + − >∫1
2 1 2 1 2ρ∆rp p p p dt (9)
This formula for acoustic intensity is derived from the sound pressure signals captured from twomicrophones as a function of time. The schematic representation below shows the structure of ameasurement instrument that uses analogue electronic circuits [7, 10].
Figure 6: Schematic of the structure of a time based acoustic intensity meter
-
+
+
-
1
2
< p.v >

01DB APPLICATION NOTE: SOUND POWER MEASUREMENT ACCORDING TO ISO9614 STANDARD
CHAPTER 2 - PRACTICAL ASPECTS PAGE 17
If some filters (third octave for example) were included in the circuit, one would obtain a spectralanalysis of the acoustic intensity. There is another method to bring about a spectral representation ofthe acoustic intensity: the use of the Fourier Transform.
For stationary signals, one notes an equivalent spectral representation according to equation (3):
( )I = = Ir r-
+< >
∞
∞
∫p vd
r. ω ω2Π
(10a)
Where ( )Ir ω is the spectral density of the intensity represented by the real part of the cross spectrum
between pressure and velocity (Parseval theory):
( ) { }I = Re S r pvω
By using Eulers relationship in terms of the Fourier Transform and approximations for ∂ ∂p r/ and p , itis possible to reach an expression describing the spectral intensity using the imaginary part of the crossspectra of the pressure signals obtained from the two microphones. [9, 11]:
( ) { }~I =
1
r Im S
r21ω
ρ ω∆(11)
This formula is a significant development in the two-microphone method as it offers a simplemeasurement system for acoustic intensity using FFT spectra for 2 channels: The principle is illustratedbelow:
Figure 7: Diagram of an acoustic intensity meter based on F.F.T. analysis

01DB APPLICATION NOTE: SOUND POWER MEASUREMENT ACCORDING TO ISO9614 STANDARD
CHAPTER 2 - PRACTICAL ASPECTS PAGE 18
2.3. Limitations to microphone based intensity meter
This chapter examines the degree of accuracy inherent in the two-microphone intensity level meterdiscussed in the preceding chapters.
2.3.1. Systematic errors : finite difference approximation principle
The first source of error is linked directly to the finite difference approximation underlying themeasurements. Spatial information is lost as soon as their order of magnitude corresponds to thedistance ∆r that separates the two microphones. It is an effect known as “instrumental convolution” thatamounts to a low frequency limit as it tends the intensity meter range towards the high frequencies. It isrepresented by the convolution factor, described by the following relationship [15]:
δr
r
Iintensity real
I~ intensity gapproachin
=
For a progressive wave, the fading is greatest when the wave propagates in the direction r according tothe alignment of the microphones, as illustrated by figure 8. Thus it is possible to define an operativefrequency limit that tends towards the high frequencies by using the attenuation criteria of 3Db for aplane wave (convolution factor δ = ½).
r 2/9.1 F frequency offcut lTheoretica T ∆= πc (12)
The instrumental convolution effect can also create errors when the two-microphone device is too closeto a point source. Increasing the distance between point source and microphones quickly reduces theinfluence of these additional errors. As a precaution it is advisable to have a distance of atleast( )≈ 5∆r between the point of measurement and local noise sources.
Figure 8: Graph to show the limitation linked to the principle of the two-microphone method,Convolution factor for a plane wave and theoretical cut off frequency FT
01DB APPLICATION NOTE: SOUND POWER MEASUREMENT ACCORDING TO ISO9614 STANDARD
CHAPTER 2 - PRACTICAL ASPECTS PAGE 19
2.3.2. Systematic errors : microphone transducers
The second source of error is due to the microphone transducers that cause interactive disturbances inthe pressure field.
The effects of diffraction may be observed whose severity depends on the size and geometry of themicrophones. If diffraction effects are on a small scale compared to the distance ∆r (for example, 1/8-inch microphones for a distance ∆r in the order of cm) the perturbations are barely perceptible.
If this condition is not satisfied (for example ½ inch microphones for ∆r = 1 cm) the arrangement of themicrophones is more serious. Several experimental studies have been undertaken in order to define theoptimum arrangement for a progressive wave [12] though little is understood for more complex fields.
2.3.3. Systematic errors : distortions of measuring instruments
Thirdly, the disturbance caused by the measurement apparatus may introduce significant errors to theintensity calculation even if the apparatus meets current Standard requirements.
In particular the relative phase difference between measurement channels is the most important factor indetermining the accuracy of the results.
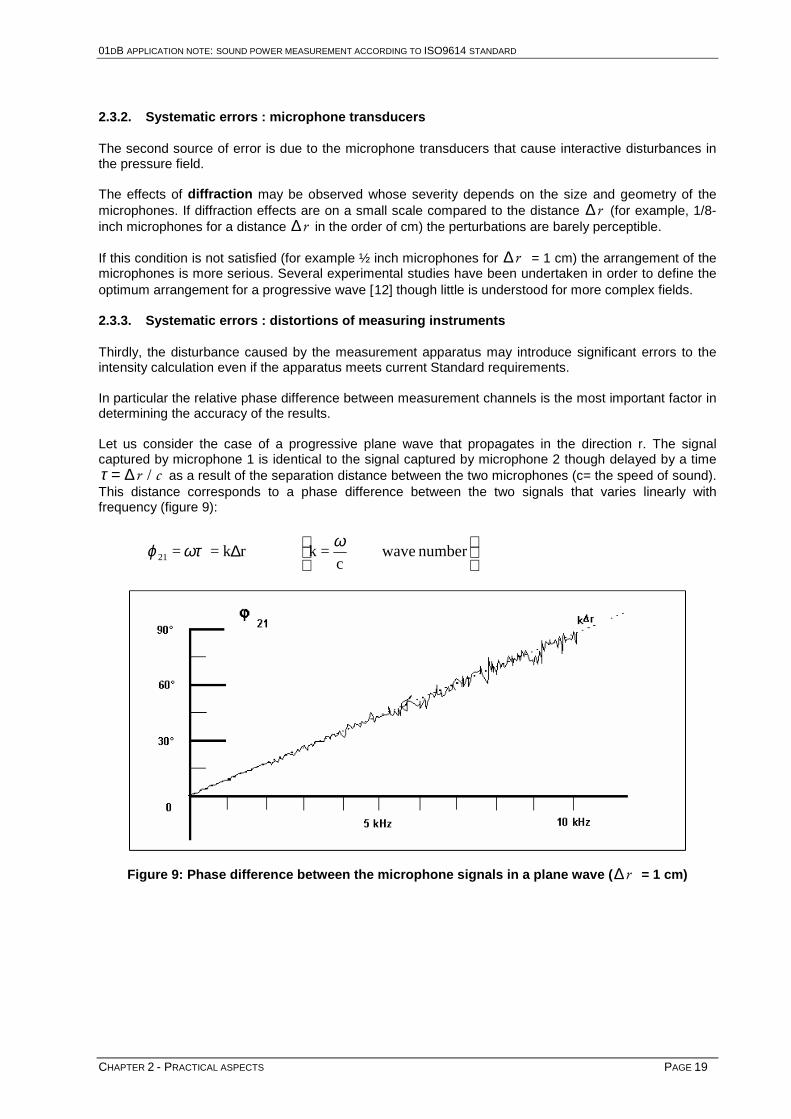
Let us consider the case of a progressive plane wave that propagates in the direction r. The signalcaptured by microphone 1 is identical to the signal captured by microphone 2 though delayed by a timeτ = ∆r c/ as a result of the separation distance between the two microphones (c= the speed of sound).This distance corresponds to a phase difference between the two signals that varies linearly withfrequency (figure 9):
number ave wc
=k r k = = 21
∆ ωωτϕ
Figure 9: Phase difference between the microphone signals in a plane wave (∆r = 1 cm)

01DB APPLICATION NOTE: SOUND POWER MEASUREMENT ACCORDING TO ISO9614 STANDARD
CHAPTER 2 - PRACTICAL ASPECTS PAGE 20
The equation that describes the intensity spectrum (equation 11) may also be written under the form
{ }~I =
1
r Im S
= S
c sin
k rr21 21 21
ρ ω ρϕ
∆ ∆(13)
Illustrating the fine line that exists between acoustic intensity and the phase measurement ϕ21. As aresult a relative phase between caused by the instrument channels will have significant consequences tothe accuracy of the intensity measurement, particularly in lower frequencies whereϕ21 becomes veryweak.
For the case of a progressive plane wave measurement having a phase distortion∆ϕ between thechannels, the transfer characteristic is defined by the relationship:
→
→
=I
I r
modulusintensity true
rdirection in thet measuremenintensity theofComponent
is of the form [15]
∃I I
= cos + k r
rρ α φ∆∆
Π
(14)
This transfer characteristic for an ideal intensity meter corresponds to its curve of directivity: cosα(projection of the intensity vector modulus I
→ on the direction r as a function of the incidence angle α ).
From a position below the theoretical cut off frequency FT the convolution factor Π is close to 1 and theequation (14) shows that the directivity curve is affected by the phase error ∆ϕ (see figure 9).
This effect is so sensitive that the factor k r∆ tends towards the same order of magnitude as ∆ϕ withthe result that the measurement inclines towards the lower frequencies.
It may be concluded that the intensity level meter is limited in practice to lower frequencies by phasedifference effects: to achieve an order of magnitude of 200 Hz, a relative phase mismatch of one degreebetween the two channels would result in an error of 3dB for a distance ∆r of 1 cm betweenmicrophones.
For a given phase mismatch the significance of the error depends on ∆r and more precisely on thefactor k r∆ . The high frequency limitation also depends on k r∆ , since the magnitude of the relativephase error determines the upper frequency limit of the intensimeter.
Using the preceding example a phase mismatch of 1° allows a pass band of 3 dB of approximately 5octaves and half.

01DB APPLICATION NOTE: SOUND POWER MEASUREMENT ACCORDING TO ISO9614 STANDARD
CHAPTER 2 - PRACTICAL ASPECTS PAGE 21
Figure 10 Distortions of the directivity characteristic of a two-microphone intensity level meterunder the influence of instrumental phase mismatch between the measurement channels and a
progressive wave.
Important notice:The preceding analysis considers measurements of a pure progressive wave for which the phasedifference between the microphones in the direction of propagation would be k r∆ . For a more complexfield, for example in a standing wave or in a diffuse field; the phase measurement ϕ21 is often much lessthan k r∆ . Phase mismatch effects may be much more noticeable than have been discussed so far.
So far the discussion has concerned phase errors introduced by microphones with rear mountedelectronic circuits The time based intensity level meter described by figure 6 can introduce another typeof instrument based phase difference for circuits place in front of the averaging multiplier.
At this level, the signals are analogous to acoustic pressure and acoustic velocity. It has been shown inequation (2) that active and reactive intensities are proportional respectively to the cosine and sine of thephase θ of velocity with respect to pressure. In this way, if these two quantities are in phase, cosθ isequal to 1 and the intensity is purely active: a fluctuating phase mismatch ∆Ψ due to the electronics willhave negligible influence on the intensity level meter readings. In the case of a measurement in apredominantly reactive field (in a near field or interference zone…) most of the signal is out of phase,thus cosθ <<1. A phase mismatch on θ would cause part of the reactive component of the intensitymeasurement to be transformed into an active part, creating distortion in the measurement.

01DB APPLICATION NOTE: SOUND POWER MEASUREMENT ACCORDING TO ISO9614 STANDARD
CHAPTER 2 - PRACTICAL ASPECTS PAGE 22
2.3.4. Statistical errors
So far we have examined systematic errors. For industrial noise applications, errors due to statisticalestimations during the calculation time T must also be considered.
For example, for the quadratic pressure < >p c2 /ρ , the relative standard deviation is equivalent to
1/ BT (B is the width of the pass band used during the measurement).
The acoustic intensity measurement is not simply an estimation of level. Its accuracy depends on theestimation of phase difference between the pressure signals captured by the two microphones in a wavewhich is propagated in a free space; these signals are perfectly coherent and their phase relationship ispurely deterministic: the standard deviation of the intensity corresponds to that of a simple pressuresquared calculation.
If on the other hand we consider several independent sound sources active within the space, thepressure signals sampled at two points in the field are not totally coherent. [16].
It is the phenomena of diffusion in which the extreme case is that of a reverberating room. Therelationship of instantaneous phase that exists between these pressures is in part uncertain and theestimation of the mean value is influenced by an additional statistical uncertainty on the phase that hasas for all systematic errors; an influence particularly in the lower frequencies which contributes to thelimitation on the dynamic range of the intensity level meter.
Important remark: All these errors are linked to the nature of the acoustic field.

01DB APPLICATION NOTE: SOUND POWER MEASUREMENT ACCORDING TO ISO9614 STANDARD
CHAPTER 2 - PRACTICAL ASPECTS PAGE 23
2.4. Calculation of sound power in a noisy environment
In the preceding chapters we have discussed various error sources that increase the acoustic power
measurement when the approximation c
p
ρ>< 2
is employed. Direct measurement of the acoustic
intensity component in the normal direction to the measurement envelope enables errors in the nearfield to be eliminated (when p and v are no longer in phase) and the projection errors (when themeasurement surface does not correspond to a wave front)
The measurement envelope can be chosen to be in proximity to the machine, as industrial site conditionsusually impose. However, of most interest in acoustic intensity measurements is the ability to extract theacoustic power measurement from the surrounding noise.
This is based on Gauss theorem for acoustic energy transfer fields: the sum of the total energy flux thatcrosses a closed surface is zero. This problem of calculating acoustic power in a noisy environment isshown schematically in Figure 12.
Figure 12: Determination of acoustic pressure in a noisy environment.
The summation of Figure 12 under represents an infinite number of measurement points that does nottake account of sampling estimation errors.
In this way, the effectiveness of the intensity measurement method to diminish the influence of theenvironment is limited by the reduction of the number of points in the measurement. As a result, dueto some ambiguity in the flux level crossing the system boundary, there is a residual power, which bringssome uncertainty into the calculation. The significance of this uncertainty depends on the level of background noise in relation to the noise emanating from the measurement source.
Observations have recorded a reduction in the influence of noise perturbations of 10 to 15 dB withrespect to the pressure readings. In these circumstances it is possible to calculate acoustic pressureusing methods that are not normally effective.

01DB APPLICATION NOTE: SOUND POWER MEASUREMENT ACCORDING TO ISO9614 STANDARD
CHAPTER 3 - STANDARDISATION PAGE 25
3. STANDARDISATION
The measurement of sound power using sound intensity would not be possible without a strict definitionof the measuring equipment itself. These requirements are regrouped in the international standardIEC1043 – The North American equivalent being named ANSI S1-12.
This standard classifies the measurement instruments in two categories: Type 1 and Type 2. Amongstother requirements, it specifies a minimum pressure-residual intensity index δPIo of the intensitymeasurement system in each frequency and of measurement, and for every probe configuration used.
The measurement standards are classified according to the methodology used: measurements atdiscrete points and measurement by scanning.
The discrete points' technique is now very precisely described in the international standard ISO 9614part 1 and their national equivalents. The North Americans have adopted the standard ANSI S12-21,which is greatly different from the ISO9614-1 standard, especially for the number of field indicators tovalidate the measurement results.
The scanning technique is more recent. It is described in the international standard ISO 9614 part 2and their national equivalents. This technique aims to lighten the measurement process in order to obtainresults faster, but at the expense of a high grade of accuracy.
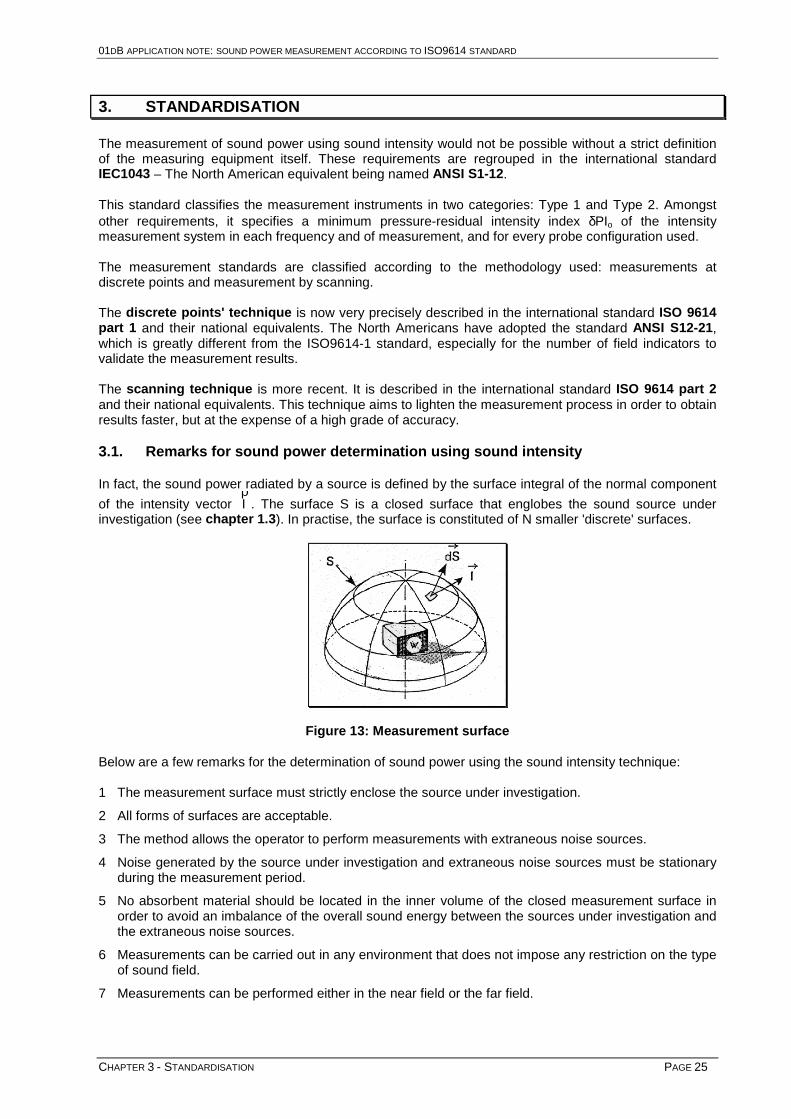
3.1. Remarks for sound power determination using sound intensity
In fact, the sound power radiated by a source is defined by the surface integral of the normal component
of the intensity vector ρI . The surface S is a closed surface that englobes the sound source under
investigation (see chapter 1.3). In practise, the surface is constituted of N smaller 'discrete' surfaces.
Figure 13: Measurement surface
Below are a few remarks for the determination of sound power using the sound intensity technique:
1 The measurement surface must strictly enclose the source under investigation.
2 All forms of surfaces are acceptable.
3 The method allows the operator to perform measurements with extraneous noise sources.
4 Noise generated by the source under investigation and extraneous noise sources must be stationaryduring the measurement period.
5 No absorbent material should be located in the inner volume of the closed measurement surface inorder to avoid an imbalance of the overall sound energy between the sources under investigation andthe extraneous noise sources.
6 Measurements can be carried out in any environment that does not impose any restriction on the typeof sound field.
7 Measurements can be performed either in the near field or the far field.

01DB APPLICATION NOTE: SOUND POWER MEASUREMENT ACCORDING TO ISO9614 STANDARD
CHAPTER 3 - STANDARDISATION PAGE 26
3.2. ISO9614 Part 1 standard (measurement at discrete points)
3.2.1. Overview
This standard is different from classical based on sound pressure measurements. First of all, soundcalculations are based upon discrete point sampling of the intensity field normal to the measurementsurface, which modify greatly the practical measurement process. Secondly, the uncertainty of thedetermination of sound power level is estimated from measurement results as well as calculations of fieldindicators.
In the standard, three grades of accuracy are defined:
$ Precision (grade 1),
$ Engineering (grade 2),
$ Survey (grade 3),
The uncertainties associated to the grades of accuracy are given in table 1.
Standards deviations s1
Octave band centrefrequencies Hz One-third octave band
centre frequencies HzSurvey
(grade 3)dB
Engineering(grade 2)
dB
Precision(grade 1)
dB63 - 125 50 - 160 - 3 2250 - 500 200 - 630 - 2 1,5
1 000 - 4 000 800 - 5 000 - 1,5 18 000 6 300 - 10 000 - 2,5 2
A weighted 2 4 3
1. The true value of the sound power level is to be expected with a certainty of 95% in the range of +/-2s about the measured value.
2. 63 Hz to 4 kHz or 50 Hz à 6.3 kHz3. Because of great variety of instruments available for application of this standard, this value is only
given as test value.
Table 1 – uncertainty of determination of sound power level
Four field indicators have to be calculated to validate the measurement result:
$ F1: Sound field temporal variability indicator.
$ F2: Surface pressure – intensity indicator.
$ F3: Negative partial power indicator.
$ F4: Field non-uniformity indicator.
Finally, the grade of accuracy to obtain depends upon two criteria:
$ Criterion 1: Adequacy of the measurement equipment
$ Criterion 2: Adequacy of the test environment

01DB APPLICATION NOTE: SOUND POWER MEASUREMENT ACCORDING TO ISO9614 STANDARD
CHAPTER 3 - STANDARDISATION PAGE 27
3.2.2. How to perform sound power measurements according to standard
In order to determine a sound power level using sound intensity, three different types of measurementsare required:
$ Measurement of the pressure-residual intensity index corresponding to the intensity meterused.
$ Measurement of sound intensity level in each characteristic point of the surface.
$ Measurements of sound intensity levels and sound pressure levels for each point definingthe measurement surface enclosing the noise source under investigation.
Optionally, to check the quality of the measurement equipment, a calibration check by inverting theprobe on one point of the measurement mesh can be performed. The two values of intensity normal tothe surface must have opposite signs and the difference between the two sound intensity levels shall beless than 1.5dB in octave or third octave frequency bands.
The first step will allow the operator to determine the dynamic capability index of the intensimeter by theformula:
Ld = δpIo - K (dB) (15)
Where δpIo is the pressure-residual intensity index (in dB) measured when the intensity probe is placedand oriented in a sound field such that the sound intensity is zero and K is a bias error factor selectedaccording to the grade of accuracy required (see table 2).
Table 2
Grade of accuracy K in dBISO 9614 - 1
Survey 7Engineering 10
Precision 10
The second step will allow the operator to estimate the temporal variability of the sound field by theformula:
( )FI M
In k Inn
K
M
12
1
1 11
= − −=
∑ , (16)
Where:
In_
is the mean energy value in W/m2 of M measurements of sound intensity normal to the surfacefor a given discrete point selected by the operator.
In,k is the Kth measurement performed. A recommended short averaging time is between 8 and12 seconds, or any integer of cycles for periodic signals.
M will normally take a value of 10.
The F1 indicator is in fact a standard deviation.
Finally, the third step will give all the required elements to calculate the sound power levels, but also thefield indicators F2, F3 et F4.
01DB APPLICATION NOTE: SOUND POWER MEASUREMENT ACCORDING TO ISO9614 STANDARD
CHAPTER 3 - STANDARDISATION PAGE 28
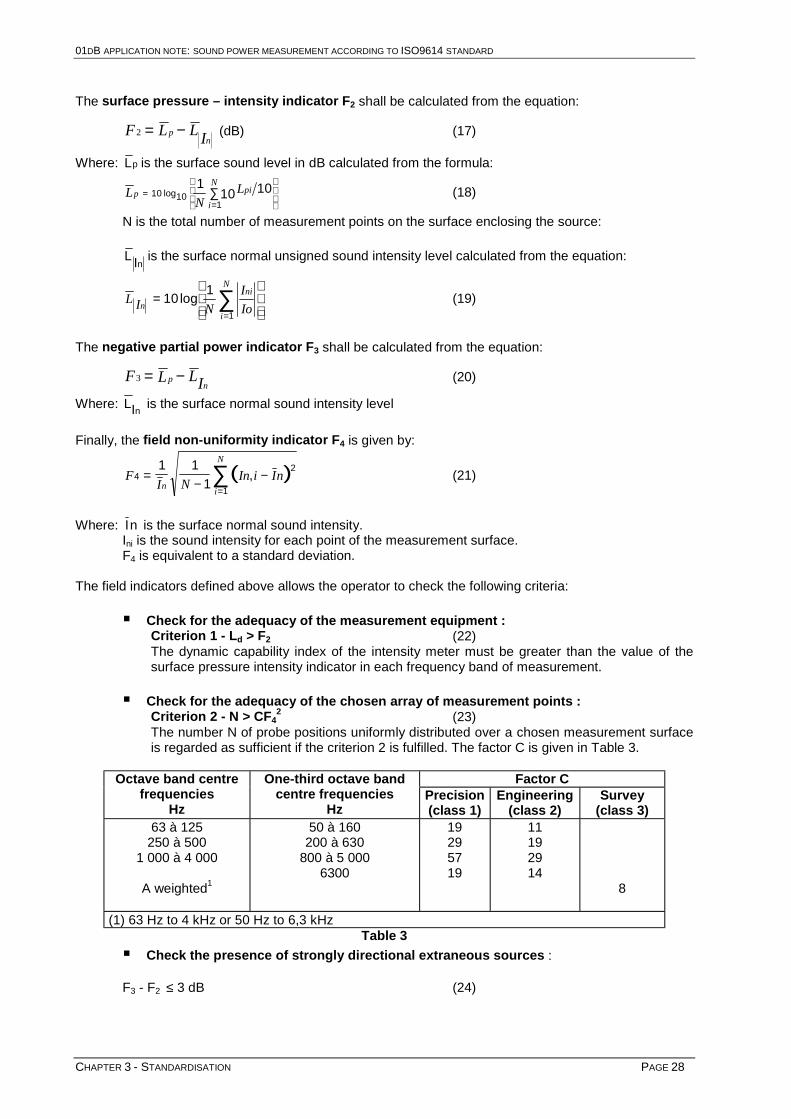
The surface pressure – intensity indicator F2 shall be calculated from the equation:
F L L Ipn
2 = − (dB) (17)
Where: Lp is the surface sound level in dB calculated from the formula:
LN
Lp pi
i
N=
=
∑10 10
1
1 1010log (18)
N is the total number of measurement points on the surface enclosing the source:
L In is the surface normal unsigned sound intensity level calculated from the equation:
L I N
I
Ion
ni
i
N
=
=
∑101
1
log (19)
The negative partial power indicator F3 shall be calculated from the equation:
F L LIpn
3 = − (20)
Where: LIn is the surface normal sound intensity level
Finally, the field non-uniformity indicator F4 is given by:
( )FI N
In i Inn
i
N
42
1
1 11
=−
−=∑ , (21)
Where: In is the surface normal sound intensity.Ini is the sound intensity for each point of the measurement surface.F4 is equivalent to a standard deviation.
The field indicators defined above allows the operator to check the following criteria:
$ Check for the adequacy of the measurement equipment :Criterion 1 - Ld > F2 (22)The dynamic capability index of the intensity meter must be greater than the value of thesurface pressure intensity indicator in each frequency band of measurement.
$ Check for the adequacy of the chosen array of measurement points :Criterion 2 - N > CF4
2 (23)The number N of probe positions uniformly distributed over a chosen measurement surfaceis regarded as sufficient if the criterion 2 is fulfilled. The factor C is given in Table 3.
Factor COctave band centrefrequencies
Hz
One-third octave bandcentre frequencies
HzPrecision(class 1)
Engineering(class 2)
Survey(class 3)
63 à 125250 à 500
1 000 à 4 000
A weighted1
50 à 160200 à 630
800 à 5 0006300
19295719
11192914
8
(1) 63 Hz to 4 kHz or 50 Hz to 6,3 kHzTable 3
$ Check the presence of strongly directional extraneous sources :
F3 - F2 ≤ 3 dB (24)
01DB APPLICATION NOTE: SOUND POWER MEASUREMENT ACCORDING TO ISO9614 STANDARD
CHAPTER 3 - STANDARDISATION PAGE 29
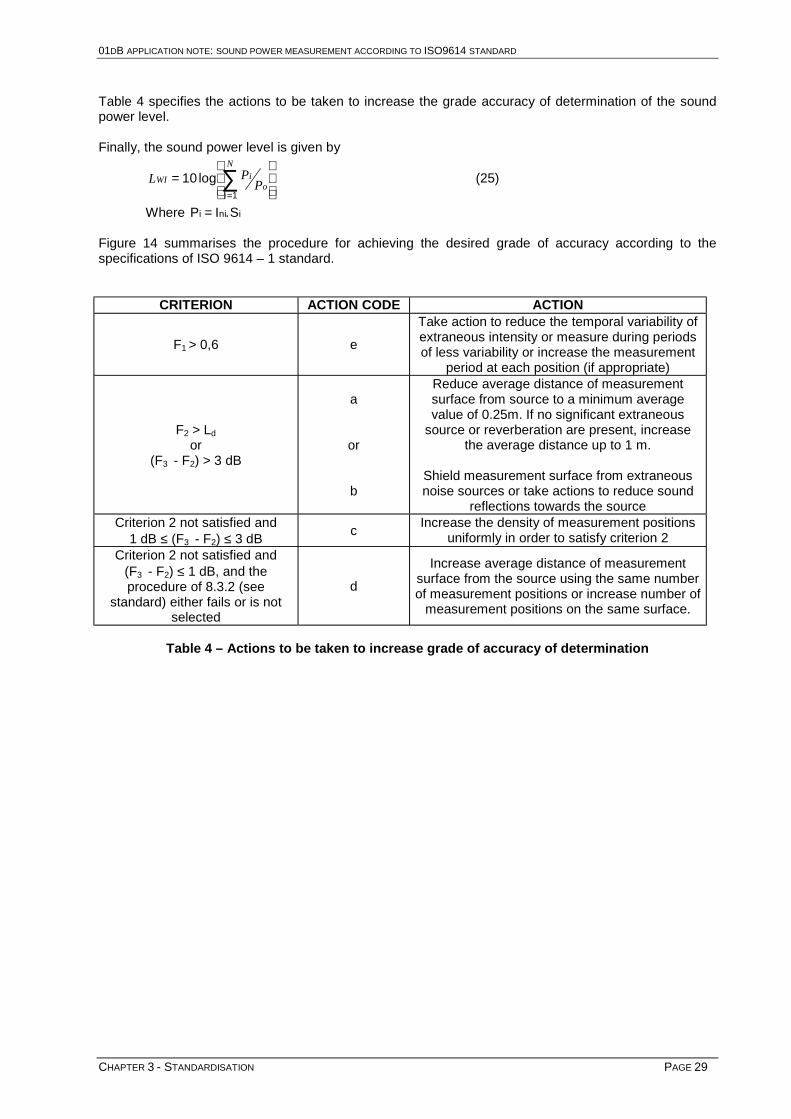
Table 4 specifies the actions to be taken to increase the grade accuracy of determination of the soundpower level.
Finally, the sound power level is given by
L PPWI i
oi
N
=
=
∑101
log (25)
Where P I Si ni i= .
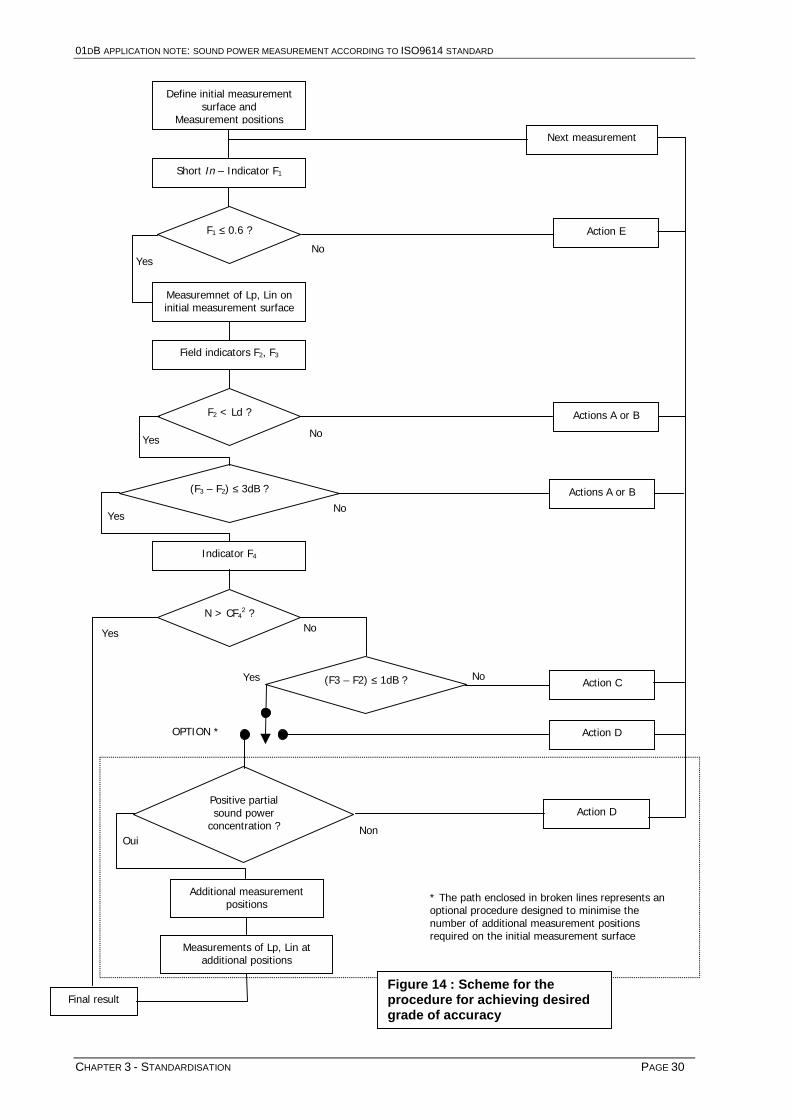
Figure 14 summarises the procedure for achieving the desired grade of accuracy according to thespecifications of ISO 9614 – 1 standard.
CRITERION ACTION CODE ACTION
F1 > 0,6 e
Take action to reduce the temporal variability ofextraneous intensity or measure during periodsof less variability or increase the measurement
period at each position (if appropriate)
F2 > Ld
or(F3 - F2) > 3 dB
a
or
b
Reduce average distance of measurementsurface from source to a minimum averagevalue of 0.25m. If no significant extraneous
source or reverberation are present, increasethe average distance up to 1 m.
Shield measurement surface from extraneousnoise sources or take actions to reduce sound
reflections towards the sourceCriterion 2 not satisfied and
1 dB ≤ (F3 - F2) ≤ 3 dBc
Increase the density of measurement positionsuniformly in order to satisfy criterion 2
Criterion 2 not satisfied and(F3 - F2) ≤ 1 dB, and theprocedure of 8.3.2 (see
standard) either fails or is notselected
d
Increase average distance of measurementsurface from the source using the same numberof measurement positions or increase number of
measurement positions on the same surface.
Table 4 – Actions to be taken to increase grade of accuracy of determination
01DB APPLICATION NOTE: SOUND POWER MEASUREMENT ACCORDING TO ISO9614 STANDARD
CHAPTER 3 - STANDARDISATION PAGE 30
OPTION *
Final result
Additional measurementpositions
Measurements of Lp, Lin atadditional positions
Action D
Next measurement
Action E
Actions A or B
Action C
Action D
(F3 – F2) ≤ 1dB ?
Positive partialsound power
concentration ?
Define initial measurementsurface and
Measurement positions
Short In – Indicator F1
F1 ≤ 0.6 ?
Measuremnet of Lp, Lin oninitial measurement surface
Field indicators F2, F3
F2 < Ld ?
(F3 – F2) ≤ 3dB ?
Indicator F4
N > CF42 ?
Yes
Yes
Yes
Actions A or B
Yes
Oui
Yes No
No
No
No
No
Non
* The path enclosed in broken lines represents anoptional procedure designed to minimise thenumber of additional measurement positionsrequired on the initial measurement surface
Figure 14 : Scheme for theprocedure for achieving desiredgrade of accuracy

01DB APPLICATION NOTE: SOUND POWER MEASUREMENT ACCORDING TO ISO9614 STANDARD
CHAPTER 3 - STANDARDISATION PAGE 31
3.3. ISO9614 Part 2 standard (measurement by scanning)
3.3.1. Overview
This norm is different from ISO 9614 - 1 because it uses a scanning method over the surface enclosingthe source. Indeed, sampling of the measurement surface is achieved by continuous sweptmeasurements over a surface, as if the surface is being painted. This gives a single-value spatialaverage intensity. Multiplying by the area gives the sound power from this surface. Then the soundpower for all the surfaces is added. Similarly to the first part of the standard, the same general remarksapply. However, only two grade of accuracy can be achieved: Engineering (grade 2) and Survey (grade3). The uncertainty of determination of sound power level is given in Table 5.
Octave band centrefrequencies
(Hz)
One-third octave bandcentre frequencies
(Hz)
Standard deviation(S**) in dB
Engineering(grade 2)
Survey(grade 3)
dB63 – 125 50 - 160 3
250 – 500 200 - 630 21 000 - 4 000 800 - 5 000 1,5
6 300 2,5A weighted
(63 Hz - 4 kHz or 50 Hz - 6,3 kHz)4
Table 5
2 fields indicators validates the measurements:
$ F+/- : negative partial power indicator
$ FPI : sound field pressure-intensity indicator
3 criteria allow the user to achieve the desired grade of accuracy:
$ Criterion 1: Adequacy of the measurement equipment,
$ Criterion 2: Suitability of the measurement conditions (limit on negative partial power)
$ Criterion 3: Partial power repeatability check.
3.3.2. How to perform sound power measurements according to standard
As for the discrete point method (part 1), sound power determination requires three types ofmeasurements. However, a few differences exist.
If measurement of the pressure-residual intensity index for the intensimeter is still required calculation ofthe temporal variability of the sound field (F1 indicator) is replaced by a double measurement of soundintensity on each measurement surface.It allows the user to estimate the repeatability of partial sound power measurements, hence of the overallsound power for the source under test.
Measurement of the pressure-residual intensity allows the user to determine the dynamic capability indexof the intensimeter by the formula:
Ld = δpIo - K (dB) (26)Where δpIo is the pressure-residual intensity index (in dB) measured when the intensity probe is placedand oriented in a sound field such that the sound intensity is zero and K is a bias error factor selectedaccording to the grade of accuracy required (see table 6).
* The true value of the sound power level is to be expected with a certainty of 95% in the range +/- 2Sabout the measured value.
01DB APPLICATION NOTE: SOUND POWER MEASUREMENT ACCORDING TO ISO9614 STANDARD
CHAPTER 3 - STANDARDISATION PAGE 32
Grade of accuracy Bias errordB
EngineeringSurvey
(grade 2)(grade 3)
107
Tableau 6
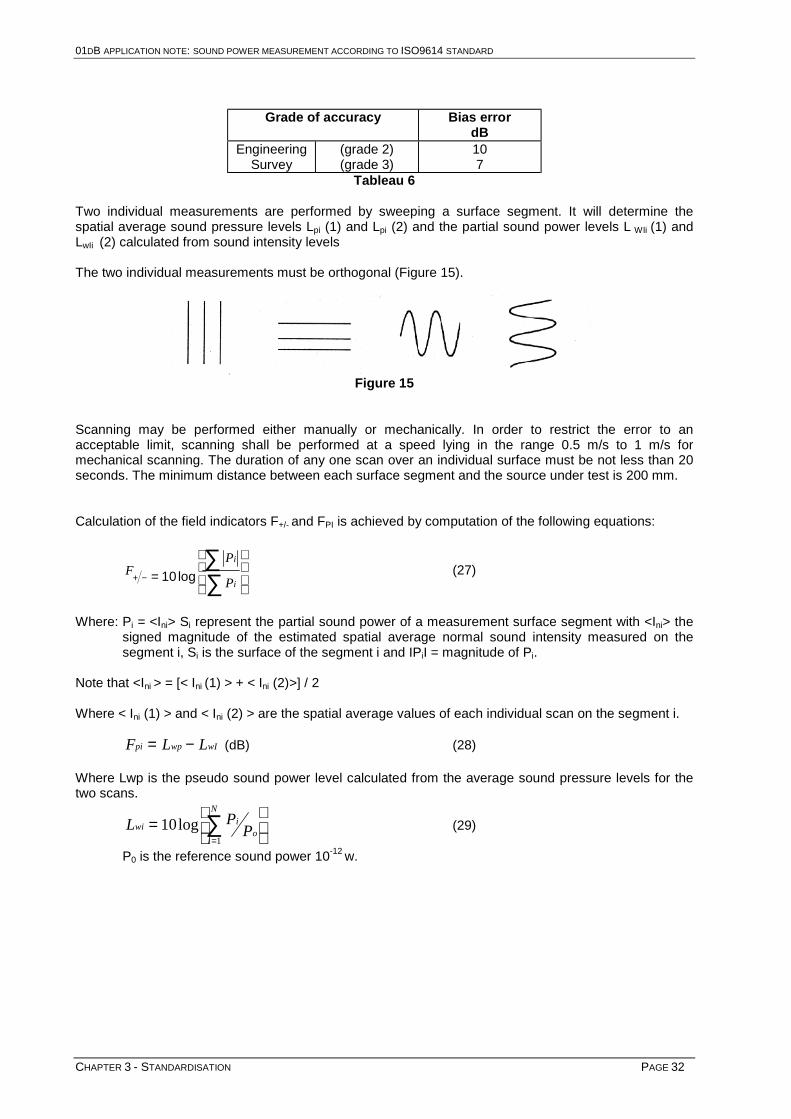
Two individual measurements are performed by sweeping a surface segment. It will determine thespatial average sound pressure levels Lpi (1) and Lpi (2) and the partial sound power levels L WIi (1) andLwIi (2) calculated from sound intensity levels
The two individual measurements must be orthogonal (Figure 15).
Figure 15
Scanning may be performed either manually or mechanically. In order to restrict the error to anacceptable limit, scanning shall be performed at a speed lying in the range 0.5 m/s to 1 m/s formechanical scanning. The duration of any one scan over an individual surface must be not less than 20seconds. The minimum distance between each surface segment and the source under test is 200 mm.
Calculation of the field indicators F+/- and FPI is achieved by computation of the following equations:
FP
P
i
i+ − =
∑∑10 log (27)
Where: Pi = <Ini> Si represent the partial sound power of a measurement surface segment with <Ini> thesigned magnitude of the estimated spatial average normal sound intensity measured on thesegment i, Si is the surface of the segment i and IPiI = magnitude of Pi.
Note that <Ini > = [< Ini (1) > + < Ini (2)>] / 2
Where < Ini (1) > and < Ini (2) > are the spatial average values of each individual scan on the segment i.
F L Lpi wp wI= − (dB) (28)
Where Lwp is the pseudo sound power level calculated from the average sound pressure levels for thetwo scans.
L PPwi
io
i
N
=
=∑10
1
log (29)
P0 is the reference sound power 10-12 w.
01DB APPLICATION NOTE: SOUND POWER MEASUREMENT ACCORDING TO ISO9614 STANDARD
CHAPTER 3 - STANDARDISATION PAGE 33
The calculated field indicators allows the operator to check:
$ Criterion 1 by the inequality Ld > FPI
The dynamic capability index of the intensity meter must be greater than the value of the surfacepressure intensity indicator in each frequency band of measurement.
$ Criterion 2 by the inequality F+/- ≤ 3 dBThe negative partial power indicator must be greater or equal to 3.
$ Criterion 3 that characterises the measurement repeatability check of partial sound powerfor each segment i based on the comparison between LwIi(1), LwIi(2) of equation (17).
I Lwi (1) - Lwi (2) I ≤ S (30)
Where S is defined in table 6.Lwi = 10 log10 [ IPiI /Po ] (dB).
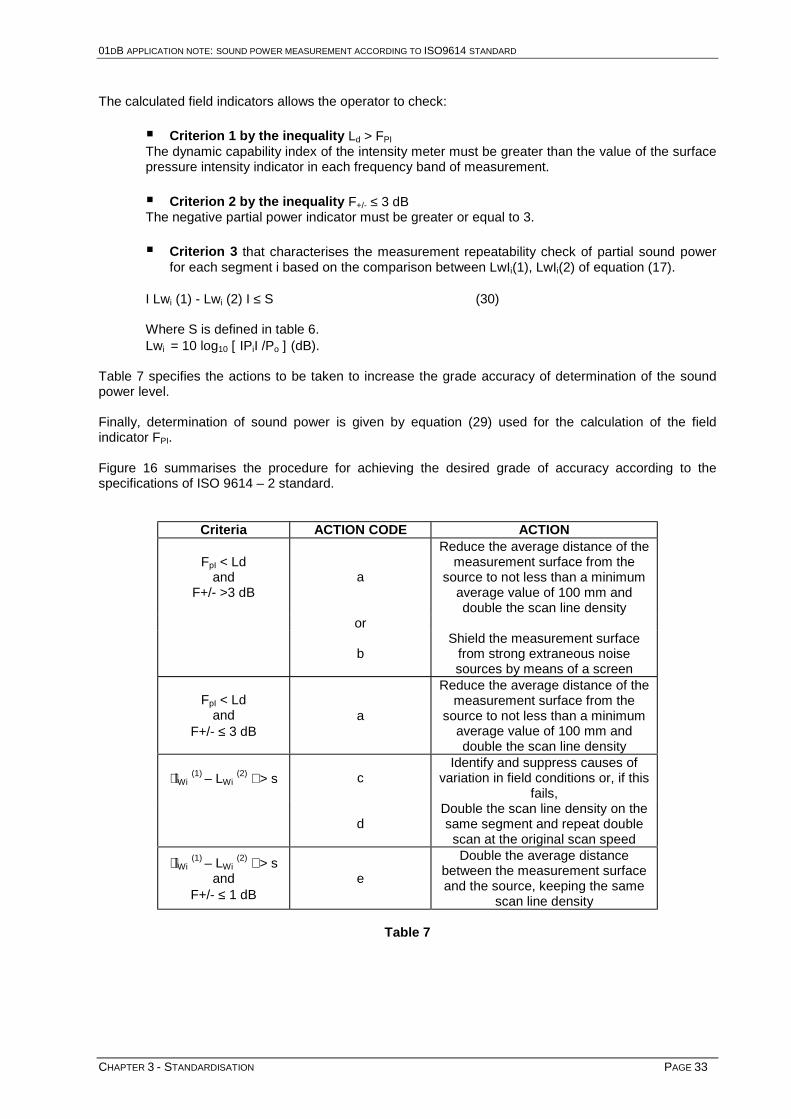
Table 7 specifies the actions to be taken to increase the grade accuracy of determination of the soundpower level.
Finally, determination of sound power is given by equation (29) used for the calculation of the fieldindicator FPI.
Figure 16 summarises the procedure for achieving the desired grade of accuracy according to thespecifications of ISO 9614 – 2 standard.
Criteria ACTION CODE ACTION
FpI < Ldand
F+/- >3 dBa
Reduce the average distance of themeasurement surface from the
source to not less than a minimumaverage value of 100 mm anddouble the scan line density
or
bShield the measurement surface
from strong extraneous noisesources by means of a screen
FpI < Ldand
F+/- ≤ 3 dBa
Reduce the average distance of themeasurement surface from the
source to not less than a minimumaverage value of 100 mm anddouble the scan line density
lWi (1) – LWi
(2) > s cIdentify and suppress causes of
variation in field conditions or, if thisfails,
dDouble the scan line density on thesame segment and repeat doublescan at the original scan speed
lWi (1) – LWi
(2) > sand
F+/- ≤ 1 dBe
Double the average distancebetween the measurement surfaceand the source, keeping the same
scan line density
Table 7

01DB APPLICATION NOTE: SOUND POWER MEASUREMENT ACCORDING TO ISO9614 STANDARD
CHAPTER 3 - STANDARDISATION PAGE 34
Figure 16: Scheme for the procedure for achieving desired grade of accuracy
Final result
Next measurement
Action A or B
Action C or D
Action E
F+/- ≤ 1 ?
Define initial measurementsurface and
Measurement positions
Measurement of Lp, Lin oninitial measurement surface
Field indicators FPI, F+/-
FpI < Ld ?
F+/- ≤ 3 ?
Yes
Yes
Action A or B
Yes
Yes No
No
No
Nol LwI (1) - LwI (2) l < sfor each i ?
F+/- ≤ 3 ?
No
Action AYes
01DB APPLICATION NOTE: SOUND POWER MEASUREMENT ACCORDING TO ISO9614 STANDARD
CHAPTER 4 - 01DB EQUIPMENT REQUIRED PAGE 35
4. 01DB EQUIPMENT REQUIRED
You will find below the list of 01dB hardware and software elements required to perform sound powermeasurements using an intensimeter.
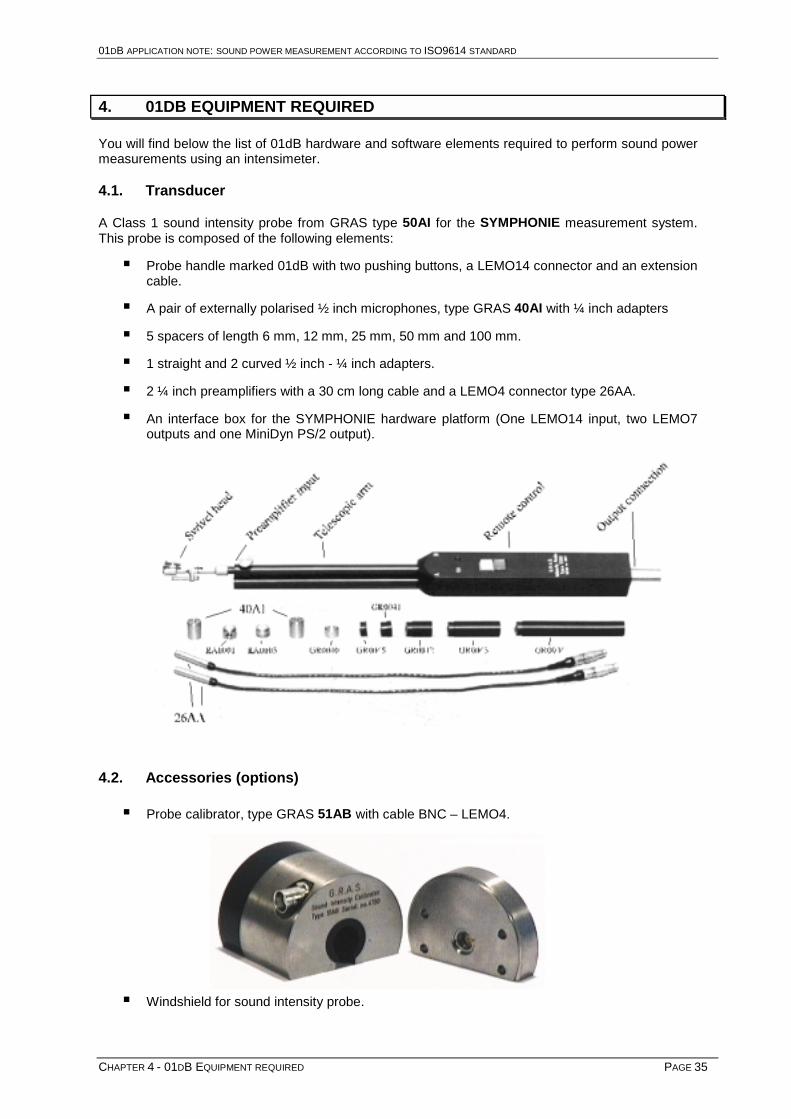
4.1. Transducer
A Class 1 sound intensity probe from GRAS type 50AI for the SYMPHONIE measurement system.This probe is composed of the following elements:
$ Probe handle marked 01dB with two pushing buttons, a LEMO14 connector and an extensioncable.
$ A pair of externally polarised ½ inch microphones, type GRAS 40AI with ¼ inch adapters
$ 5 spacers of length 6 mm, 12 mm, 25 mm, 50 mm and 100 mm.
$ 1 straight and 2 curved ½ inch - ¼ inch adapters.
$ 2 ¼ inch preamplifiers with a 30 cm long cable and a LEMO4 connector type 26AA.
$ An interface box for the SYMPHONIE hardware platform (One LEMO14 input, two LEMO7outputs and one MiniDyn PS/2 output).
4.2. Accessories (options)
$ Probe calibrator, type GRAS 51AB with cable BNC – LEMO4.
$ Windshield for sound intensity probe.

01DB APPLICATION NOTE: SOUND POWER MEASUREMENT ACCORDING TO ISO9614 STANDARD
CHAPTER 4 - 01DB EQUIPMENT REQUIRED PAGE 36
$ Tripod.
$ Measurement case for SYMPHONIE system.
$ Type 1 acoustical calibrator Cal01.
4.3. Measurement system
$ Notebook, desktop or industrial PC that meets the minimum requirements specified to run01dB applications software, and Windows 95/98 operating system.
$ Acquisition unit connected to the PC type SYMPHONIE.
$ DBSOND32 intensity calibration software package – require a white noise generator.
$ DBFA32 software package to measure sound power according to ISO9614 standards andprocess the measurement results. The following software modules are required:
% Base module.
% Real-time intensity module.
% ISO9614 (part 1 and 2) module.
& All the above elements are available from 01dB. Contact your agent for further information and/or aquote.

01DB APPLICATION NOTE: SOUND POWER MEASUREMENT ACCORDING TO ISO9614 STANDARD
CHAPTER 5 - MEASUREMENT PROCEDURES PAGE 37
5. MEASUREMENT PROCEDURES
Let summarise the procedures to determine sound power by sound intensity measurements according tothe standard ISO9614, part 1 and 2, using a SYMPHONIE measurement system such as described inchapter 4.
5.1. System set-up
$ Mount the sound intensity probe 50AI (see instruction manual delivered with the probe).
$ Connect the probe to the SYMPHONIE acquisition box with the interface box.
$ Boot the SYMPHONIE measurement system (see installation manual delivered with thesystem)
5.2. Calibration
Two types of calibration have to be performed: pressure calibration of the microphone and phasecalibration of the sound intensity probe.
5.2.1. Pressure calibration of the sound intensity probe microphones
$ Dismount the microphones from the probe handle and place them in the cavity of the Type 1acoustical calibrator.
$ Perform the hardware configuration in the dBSOND32 (or dBFA32) software package.
$ Perform the pressure calibration of the microphones in dBSOND32 (or dBFA32).
5.2.2. Phase calibration of the sound intensity probe (to do at least one time)
$ Connect the BNC – LEMO4 cable between the probe calibrator 51AB and the output of theSYMPHONIE acquisition box.
$ Dismount the microphones from the probe handle and place them in the cavity of the probecalibrator.
$ Perform the hardware configuration in the dBSOND32 software package.
$ Perform phase calibration of the probe in the dBSOND32 software package.
$ Create a phase correction datafile.
5.2.3. Residual pressure intensity index measurement
$ Measure the pressure – residual intensity index in the dBSOND32 software package.
5.3. Hardware configuration (for sound power measurements)
$ Define the transducers associated with each channel in coherence with the configurationused at the calibration stage in the dBSOND32 software package.
$ Load the phase correction datafile corresponding to the intensity probe to be used.
$ Configure and define a remote control (if applicable)
01DB APPLICATION NOTE: SOUND POWER MEASUREMENT ACCORDING TO ISO9614 STANDARD
CHAPTER 5 - MEASUREMENT PROCEDURES PAGE 38
5.4. Sound power measurements : dBFA32
$ Open a new or existing ISO9614 measurement session
$ Give a title and comments for the measurements
$ Select the measurement method (discrete point method as defined in ISO9614-1 orscanning method as defined in ISO9614-2)
5.4.1. Definition of the measurement surface (mesh)
$ Select the shape of the measurement surface : parallelepiped or list of points
Parallelepiped surface
$ Enter the dimensions of the source
$ The mesh dimensions are automatically defined as a function of the sources' dimensionsand the standard specifications.
$ Modify the automatic mesh
$ Note the co-ordinates of the measurement positions
Surface made of a list of points
$ Edit the number of points for the measurement mesh and the associated surface
5.4.2. Acquisition
Preliminary measurements
$ Perform a stationary check (discrete point method only)
$ Perform a calibration check by inverting the probe
Sound power measurements
$ Choose the acquisition order
$ Define and apply measurement marks around the source under test
$ Perform the measurements according to defined acquisition order
5.4.3. Pre-processing of the results
$ List and plot results point by point
$ List and plot overall results with calculation of the field indicators according to thespecifications of ISO9614 standard
$ Plot results as noise maps (ISO contours)
5.5. Take actions to achieve the desired grade of accuracy (ISO9614 conformity)
If one (or more) criteria of the ISO9614 are not fulfilled, we illustrate with an example the procedure toachieve the desired grade of accuracy:
$ In the stationary measurement
$ In the sound power measurements
5.6. Results' exploitation
$ Export values and graphics to a spreadsheet or word processor
$ Print the results

01DB APPLICATION NOTE: SOUND POWER MEASUREMENT ACCORDING TO ISO9614 STANDARD
CHAPTER 6 - CALIBRATION : DBSOND32 PAGE 39
6. CALIBRATION : DBSOND32
The first step, compulsory before any sound power measurement, is to calibrate the probe'smicrophones (pressure calibration) then the probe itself (phase correction).
These operations can be performed in the dBSOND32 software package and the results are saved in aprobe calibration data file (extension .AU), that also features two important parameters useful duringthe measurement process:
$ The value of the pressure-residual intensity index for the complete intensity measurement system,used to calculate criterion 1 in the standard ISO 9614 (part 1 and part 2).
$ The pattern of the intrinsic phase difference spectra of the intensity meter, in order to apply aphase correction during measurements.
6.1. Hardware configuration
Hardware configuration of the measurement chain is compulsory before proceeding with calibrationoperations and pressure-residual intensity index measurement.
' To access hardware configuration, use the command File /Hardware Configuration, the hardware configuration window shownaside appears on screen.
This window allows the user to select the hardware acquisition platform,defined in the software utility dBCONFIG32.
( For the SYMPHONIE system, select the SYMPHONIE platform (bythe key >>), then click on the Configuration key.
Check in this dialog box that the signal conditioning option 200V isticked. This is an important feature because the microphone pair ofthe 50AI probe requires an external polarisation voltage of 200V.Once this parameter has been activated, click on OK to return to theprevious dialog box.
) Select as well an acoustical calibrator, in the list of calibratorsdefined in the software utility dBCONFIG32.
& Consult the SYMPHONIE installation manual for further details ontransducer, calibrator and hardware platform management for 01dB-measurement systems.
If, when selecting the hardware platform, the warningmessage shown aside appears on screen, it means thatthe hardware platform has not been defined indBCONFIG32.
Open this software utility and update the list of hardwareplatform available for measurements with 01dBapplications software packages.

01DB APPLICATION NOTE: SOUND POWER MEASUREMENT ACCORDING TO ISO9614 STANDARD
CHAPTER 6 - CALIBRATION : DBSOND32 PAGE 40
6.2. Definition of the sound intensity probe
' The user may either define a new probe by thecommand File / New or use an existing probe definitionby the command File / Open / *.AU file. The followingdialog box appears on screen when defining a newprobe.
The dialog shown aside allows the user to give a title tothe probe definition datafile with comments and, mostof all to associate to each measurement channel theappropriate probe transducer, such as defined indBCONFIG32.
( Click on Micro 1 and Micro 2 to select a microphonein the list defined in dBCONFIG32, respectively forChannel 1 and Channel 2 of the acquisition unit. Thefollowing dialog box appears on screen.
It shows the list of transducers availableand, for each one, additional informationsuch as sensitivity, serial number, model,etc.
The key Options gives, for eachtransducer, the type of signal conditioningrequired.
) On validation, a new probe definition datafile is created and its information window is displayed onscreen.
The user may then visualise the titles andcomments associated with the data file, thecharacteristics of the probe microphones, the datesof creation and modification of the datafile.
Furthermore, the information window notifies theuser if the pressure residual intensity indexmeasurement has been performed, as well as thelow and high frequency phase differencemeasurements.
While the latter measurements are not performed,the information window indicates "matched" tostate that the operator prefers using phasematched microphones rather than measuring aphase difference and applies a phase correctionduring sound power measurements.
If a phase correction has been carried out, the indication "done" is displayed.
01DB APPLICATION NOTE: SOUND POWER MEASUREMENT ACCORDING TO ISO9614 STANDARD
CHAPTER 6 - CALIBRATION : DBSOND32 PAGE 41
In this information window, it is also possible to modify:
$ the transducers used by the command Setup / Microphones
$ the title or the comments on the probe data file by the command Setup / Title andcomments
6.2.1. Important notice
In the information window of the probe datafile, write down the model and serial number of themicrophones for each measurement channel.The user will therefore be able to check, during the hardware configuration stage in dBFA32, thatthe transducers defined for each measurement channel are exactly the same than that use in thiscalibration procedure in dBSOND32.Loading the AU phase correction file will result otherwise in increasing the phase error (or evendouble the phase difference if the microphones are inverted on the measurement channels).
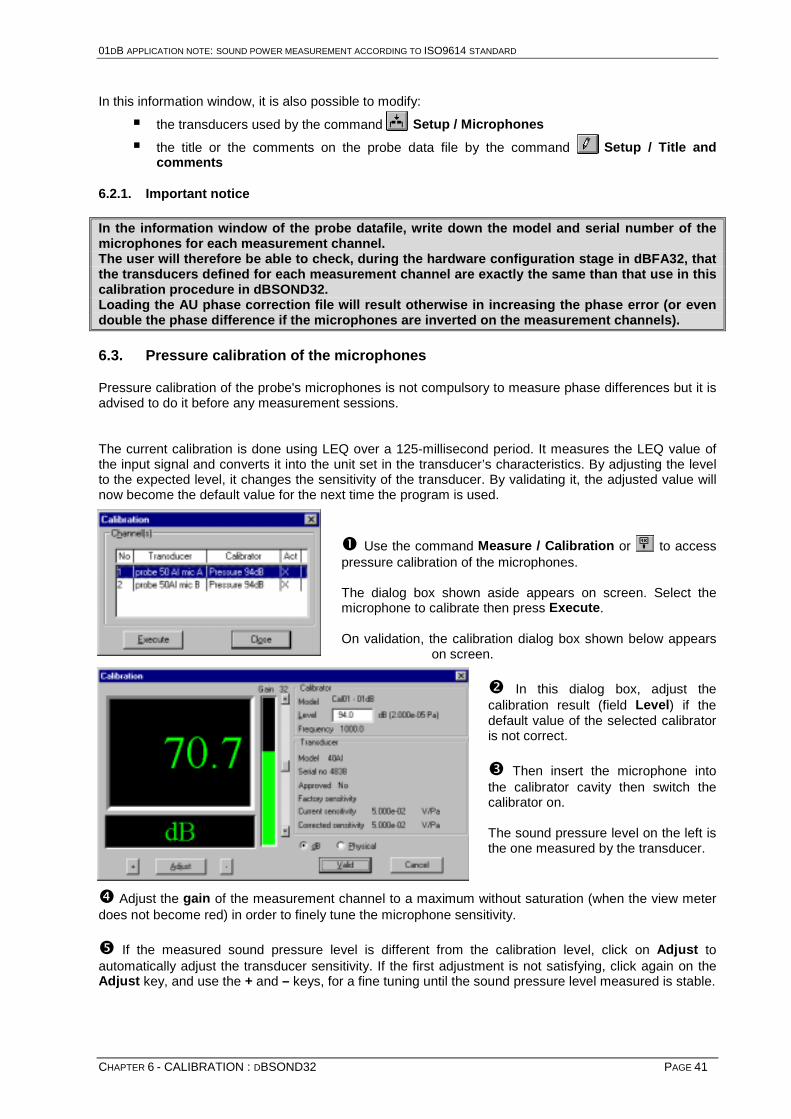
6.3. Pressure calibration of the microphones
Pressure calibration of the probe's microphones is not compulsory to measure phase differences but it isadvised to do it before any measurement sessions.
The current calibration is done using LEQ over a 125-millisecond period. It measures the LEQ value ofthe input signal and converts it into the unit set in the transducer’s characteristics. By adjusting the levelto the expected level, it changes the sensitivity of the transducer. By validating it, the adjusted value willnow become the default value for the next time the program is used.
' Use the command Measure / Calibration or to accesspressure calibration of the microphones.
The dialog box shown aside appears on screen. Select themicrophone to calibrate then press Execute.
On validation, the calibration dialog box shown below appearson screen.
( In this dialog box, adjust thecalibration result (field Level) if thedefault value of the selected calibratoris not correct.
) Then insert the microphone intothe calibrator cavity then switch thecalibrator on.
The sound pressure level on the left isthe one measured by the transducer.
* Adjust the gain of the measurement channel to a maximum without saturation (when the view meterdoes not become red) in order to finely tune the microphone sensitivity.
+ If the measured sound pressure level is different from the calibration level, click on Adjust toautomatically adjust the transducer sensitivity. If the first adjustment is not satisfying, click again on theAdjust key, and use the + and – keys, for a fine tuning until the sound pressure level measured is stable.

01DB APPLICATION NOTE: SOUND POWER MEASUREMENT ACCORDING TO ISO9614 STANDARD
CHAPTER 6 - CALIBRATION : DBSOND32 PAGE 42
Caution! Before calibration:
$ Verify that the calibration signal remains constant for a sufficiently long period.
$ Verify that the gain view meter is correctly positioned (neither too weak, nor overloading).
$ It is preferable to place the calibrator on foam to reduce the effect of vibrations.
Caution! After calibration:
$ If, for the same transducer / calibrator pair, the sensitivity after calibration differs greatly from theoriginal sensitivity, damage to the microphone may have occurred.
$ If the measured values are not correct but the calibration value is OK, it could mean that thesensitivity of the microphone is correct only at 1 000 Hz. Check the microphone membrane.
A microphone is very fragile equipment. A fall of 10-cm may damage the microphone membrane.
As general rule, if the measured value in dB varies by +/- 1.5 dB from the value that would bemeasured with the microphone according to the original sensitivity (see calibration data sheet),consider your microphone as faulty.
Example: For a microphone that as a factory sensitivity of 50 mV / Pa and a calibrator thatdelivers 94 dB at 1000 Hz.
The microphone is able to perform correct measurements if:
$ The measured calibration level lies between 92.5 dB and 95.5 dB.
$ The current microphone 'sensitivity lies between (around) 40 mV/Pa and 60 mV/Pa ( multiplyor divide the original value by a factor of 1.1885)
For greater or lower microphone 'sensitivities, consider the microphone as faulty. Return it toyour 01dB agent
6.4. Phase calibration of the sound intensity probe
The principle of phase calibration of the probe is to measure the intrinsic phase difference of the probe inorder to obtain a phase correction spectrum that will weight the acquired spectrum before calculation of asound intensity spectrum.
Measurement of the phase difference spectrum can be performed either for low frequencies (from 0 to1250 Hz), for high frequencies (from 0 to 10000Hz) or for low and high frequencies simultaneously. Thisis due to the fact that 01dB acquisition software packages are using two FFT passes (one low and onehigh) and also that some probe calibrators can only be used on one or the other frequency ranges.
% To calibrate the probe only at low frequencies, use the command Measure / Low frequencyphase difference
% To calibrate the probe only at high frequencies, use the command Measure / Highfrequency phase difference
% To calibrate the probe on both FFT passes, use the command Measure / Low and highfrequency phase differences

01DB APPLICATION NOTE: SOUND POWER MEASUREMENT ACCORDING TO ISO9614 STANDARD
CHAPTER 6 - CALIBRATION : DBSOND32 PAGE 43
On selection of one of these commands, two windows are displayed: an intensity measurement window,containing one or two FFT passes and an overload window. The measurement process is then identicalfor the three types of measurements.
We will illustrate phase calibration by a measurement of low and high frequency phase differences.
' Place both microphones in the 51AB calibrator cavity, as shownaside and connect the BNC – LEMO4 cable between the BNCconnector of the calibrator and the LEMO4 output of the SYMPHONIEacquisition unit.
The phase difference is zero in the cavity of the calibrator.
( To measure the phase difference of the probe, it is require to generate a whitenoise in the calibrator. You may use and external noise source or the built-ingenerator of the SYMPHONIE system.
To do so, use the command Config / generator and activate it by ticking the boxOn/Off in the dialog box shown aside. Select a signal type White to produce whitenoise.
The signal is generated as soon as OK validates this dialog.
) It is also possible set the output level of the signalgenerator by clicking with the right button of the mouse ontothe Symphonie icon in Windows 95 task bar and to selectthe menu position Configuration.
Adjust the output level and click on OK to validate.

01DB APPLICATION NOTE: SOUND POWER MEASUREMENT ACCORDING TO ISO9614 STANDARD
CHAPTER 6 - CALIBRATION : DBSOND32 PAGE 44
* For phase calibration of the probe, it is important to select an adequateaveraging time, so that the stationary criterion of standard ISO9614 is fulfilled.
In the averaging dialog box (Command Config./ Average), the defaultnumber of linear averages is 256, corresponding to about 82 seconds ofmeasurements.
Click on Modify to edit the measurement duration. We will see later on in this notice how to select anappropriate averaging duration.
+ During calibration measurements, the acquisition will be stopped and would have to be started againif an overload occurs. However, underloads will not stop acquisition. For these reasons, it is important toset correctly the gains of each measurement channel before starting an acquisition.
Use the command Config / gain and threshold to accessthe dialog box shown opposite.
Applying a gain introduces a phase difference. However, thephase difference would be the same on both channels if thegain setting is the same. There would be therefore no phasedifference if the gains were linked and identical on both channels.
This is the reason why gains are identical by default on bothchannels (options Linked and Identical always activated).
Set the gains with the view meter to a maximum without overload(when overloads are detected, the view meter is shown in red –set the levels in the top quarter of the view meter) in order toavoid underload and to increase the measurement accuracy.
& Perform this operation will the generator is activated and the microphones are placed in thecalibrator cavity.
, Before starting measuring, use the command Config /Parameters, to enter the exact characteristics of the medium (speedof sound and medium density – those of air by default)
The user may also select an automatic autorange to automaticallyadjust the gains of the acquisition channels before each singlemeasurement.
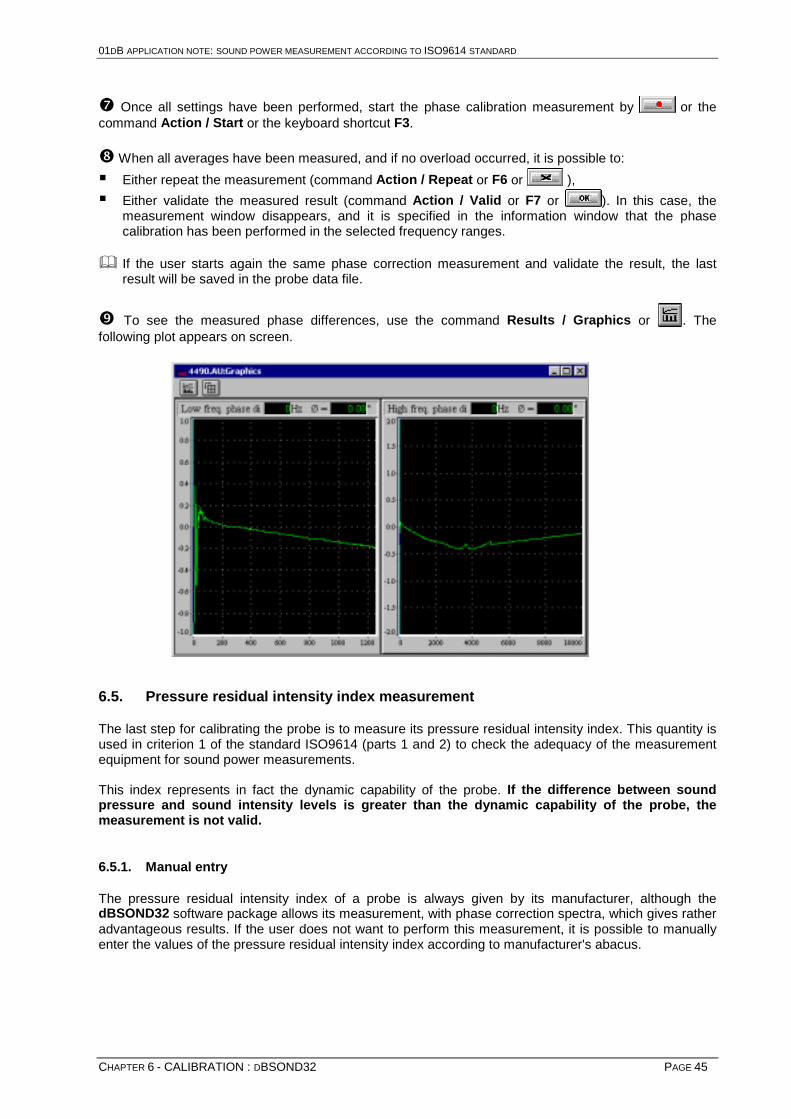
01DB APPLICATION NOTE: SOUND POWER MEASUREMENT ACCORDING TO ISO9614 STANDARD
CHAPTER 6 - CALIBRATION : DBSOND32 PAGE 45
- Once all settings have been performed, start the phase calibration measurement by or thecommand Action / Start or the keyboard shortcut F3.
. When all averages have been measured, and if no overload occurred, it is possible to:
$ Either repeat the measurement (command Action / Repeat or F6 or ),
$ Either validate the measured result (command Action / Valid or F7 or ). In this case, themeasurement window disappears, and it is specified in the information window that the phasecalibration has been performed in the selected frequency ranges.
& If the user starts again the same phase correction measurement and validate the result, the lastresult will be saved in the probe data file.
/ To see the measured phase differences, use the command Results / Graphics or . Thefollowing plot appears on screen.
6.5. Pressure residual intensity index measurement
The last step for calibrating the probe is to measure its pressure residual intensity index. This quantity isused in criterion 1 of the standard ISO9614 (parts 1 and 2) to check the adequacy of the measurementequipment for sound power measurements.
This index represents in fact the dynamic capability of the probe. If the difference between soundpressure and sound intensity levels is greater than the dynamic capability of the probe, themeasurement is not valid.
6.5.1. Manual entry
The pressure residual intensity index of a probe is always given by its manufacturer, although thedBSOND32 software package allows its measurement, with phase correction spectra, which gives ratheradvantageous results. If the user does not want to perform this measurement, it is possible to manuallyenter the values of the pressure residual intensity index according to manufacturer's abacus.

01DB APPLICATION NOTE: SOUND POWER MEASUREMENT ACCORDING TO ISO9614 STANDARD
CHAPTER 6 - CALIBRATION : DBSOND32 PAGE 46
' Use the command Measure / ResidualP/I index: Edition to manually enter the values ofthe pressure residual intensity index.
( Enter the values for each one-third-octavecentre frequencies (between 50Hz and 8 kHz)from the manufacturer's abacus.
By convention, the values of the index are givenfor 25mm microphone spacer.
If during measurements longer or shorter spacersare used, the dBFA32 software package willautomatically convert these values.
6.5.2. Measurement
' First of all, configure the acquisition by the command Measure / Residual P/I index:Configuration. The following dialog box appears on screen.
This dialog box allows the user to select the frequency range for the acquisition. .This range can include all one-third-octave frequency bands from 50 Hz to 6.3kHZ.
The options Complete and Replace allows the user respectively to complete aprevious pressure residual intensity index spectrum with results in frequency bandsthat were not measured at the time or to replace entirely the values of the pressureresidual intensity index spectrum by the measured values.
( Once the acquisition has been configured, use the command Measure Residual P/I index:Acquisition to start the measurement process. An acquisition window, with the associatedmeasurement window, appears on screen.
The dark (red) spectrum represents theaveraged sound pressure spectrumand the light (green) spectrumrepresent the sound intensity spectrum(positive or negative).
) Before starting the measurement,apply the same gain settings andaveraging time than for the phasecorrection measurements.
* Select a Pink noise for thegenerator this time.
& See paragraph 6.4 for thesesettings.

01DB APPLICATION NOTE: SOUND POWER MEASUREMENT ACCORDING TO ISO9614 STANDARD
CHAPTER 6 - CALIBRATION : DBSOND32 PAGE 47
+ Once all settings have been performed, start the residual P/I index measurement by or thecommand Action / Start or the keyboard shortcut F3.
, When all averages have been measured, and if no overload occurred, it is possible to:
$ Either repeat the measurement (command Action / Repeat or F6 or ),
$ Either validate the measured result (command Action / Valid or F7 or ). In this case, themeasurement window disappears, and it is specified in the information window that the residual P/Iindex measurement has been performed in the selected frequency ranges.
& If the user starts again the same residual P/I index measurement and validate the result, the lastresult will be saved in the probe data file.
- To see the measured phase differences and the residual P/I index, use the command Results /Graphics. The following plot appears on screen.
. The probe calibrator is not efficient at high frequencies (at about 5000 Hz for the GRAS 51ABcalibrator). The phase correction plot is therefore not acceptable at these frequencies.
To display the plot after this value, the high frequency phase difference can be extrapolated above thiscut-off frequency (Fmax Extrapolation) by calculating the slope of the straight line by the least meansquare method between Fmin Extrapolation and Fmax Extrapolation
These two frequencies and the extrapolation flag (Extrapolation) may be modified in the configurationfile dBSOND32.INI at the section [Meas Config]. Default values: Extrapolation=1 (activated), FMinExtrapolation = 3000, Fmax Extrapolation = 5000.
The measured residual P/I index is always very important, thanks to the phase correction plot. In order tobe realistic, the software limits itself by a pattern accounting for the errors of the measurement chain (inparticular the tolerances of the calibrator between 45 and 1000 Hz, given in the standard IEC 1043). Thislimitation, under normal atmospheric pressure and at ambient temperature, is 26,8 dB for a microphone'spacer of 25 mm.
This is the default limit that is defined in the section [Meas Config] of the file dBSOND32.INI under thename Residual Limit. The values of the limit are given per third-octave band, starting at 50Hz. A commaseparates each value.
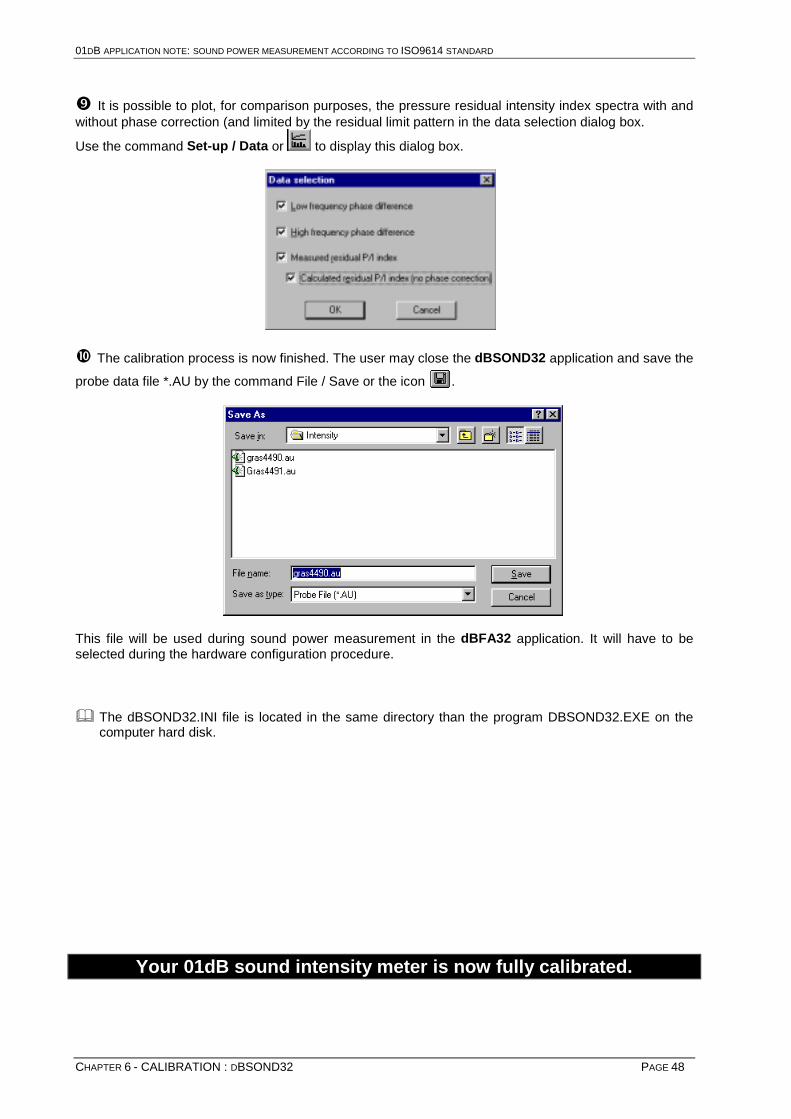
01DB APPLICATION NOTE: SOUND POWER MEASUREMENT ACCORDING TO ISO9614 STANDARD
CHAPTER 6 - CALIBRATION : DBSOND32 PAGE 48
/ It is possible to plot, for comparison purposes, the pressure residual intensity index spectra with andwithout phase correction (and limited by the residual limit pattern in the data selection dialog box.
Use the command Set-up / Data or to display this dialog box.
0 The calibration process is now finished. The user may close the dBSOND32 application and save the
probe data file *.AU by the command File / Save or the icon .
This file will be used during sound power measurement in the dBFA32 application. It will have to beselected during the hardware configuration procedure.
& The dBSOND32.INI file is located in the same directory than the program DBSOND32.EXE on thecomputer hard disk.
Your 01dB sound intensity meter is now fully calibrated.

01DB APPLICATION NOTE: SOUND POWER MEASUREMENT ACCORDING TO ISO9614 STANDARD
CHAPTER 7 - HARDWARE CONFIGURATION OF INTENSITY METER : DBFA32 PAGE 49
7. HARDWARE CONFIGURATION OF INTENSITY METER : DBFA32
Hardware specification and settings are required before any measurement. Use the commandAcquisition / Hardware configuration in the dBFA32 application to access the following dialog box.
From here, define:
$ The type of acquisition platform
$ The active channels for measurement
$ For each active measurement channel, acalibrator/transducer pair of the same type.
$ Where applicable, the remote control to start anacquisition from the handle buttons of the probe.
1 The phase correction datafile that containscalibration data for the probe (phase differencesand pressure residual intensity index measured indBSOND32).
The set-up parameters are saved by default in a HCFfile.
The acquisition platforms, transducers and calibrators are selected from the group previously definedunder the hardware configuration programme dBCONFIG32.
We describe in this chapter an example of hardware configuration for an intensity meter made of theSYMPHONIE measurement system and the sound intensity probe 50AI, such as described in chapter 4.
' Hardware peripheral tab : Select first of all, the hardware platform. Click on >> and selectSYMPHONIE in the dialog box. Then click on the Configure key and check that the option 200V isactivated on both measurement channels.
2 This is an important feature because the microphone pair of the 50AI probe requires anexternal polarisation voltage of 200V that should be provided by the acquisition box.
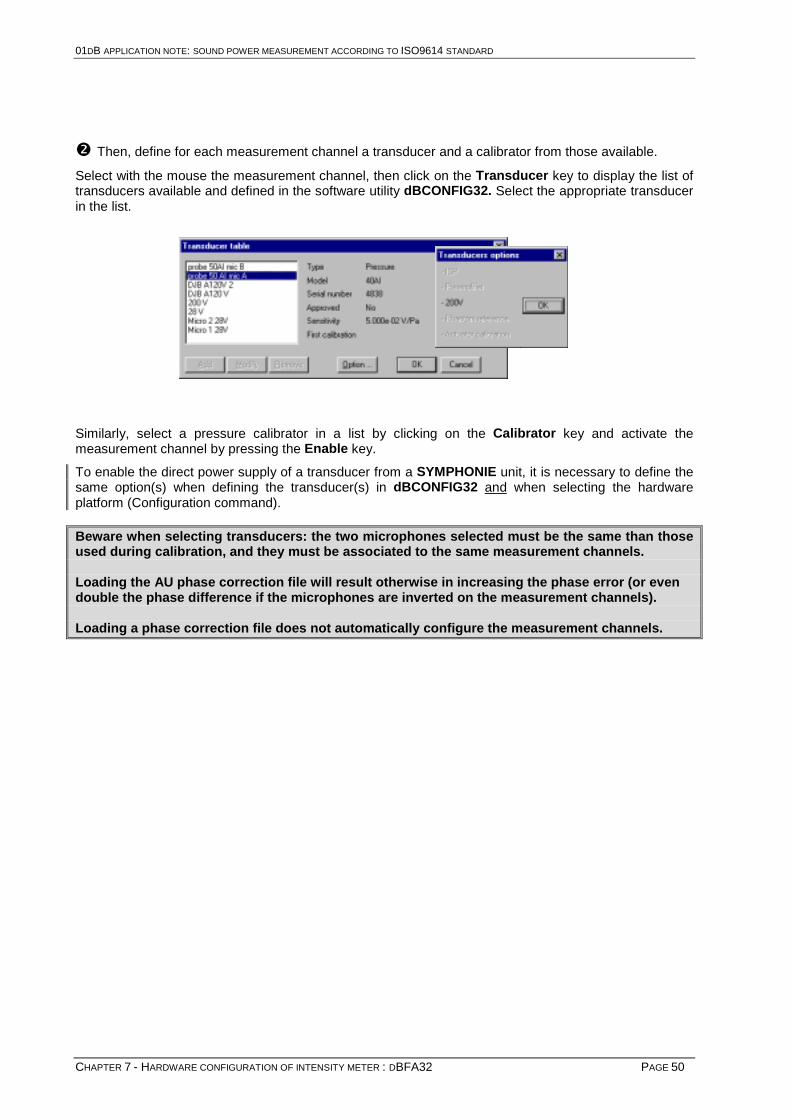
01DB APPLICATION NOTE: SOUND POWER MEASUREMENT ACCORDING TO ISO9614 STANDARD
CHAPTER 7 - HARDWARE CONFIGURATION OF INTENSITY METER : DBFA32 PAGE 50
( Then, define for each measurement channel a transducer and a calibrator from those available.
Select with the mouse the measurement channel, then click on the Transducer key to display the list oftransducers available and defined in the software utility dBCONFIG32. Select the appropriate transducerin the list.
Similarly, select a pressure calibrator in a list by clicking on the Calibrator key and activate themeasurement channel by pressing the Enable key.
To enable the direct power supply of a transducer from a SYMPHONIE unit, it is necessary to define thesame option(s) when defining the transducer(s) in dBCONFIG32 and when selecting the hardwareplatform (Configuration command).
Beware when selecting transducers: the two microphones selected must be the same than thoseused during calibration, and they must be associated to the same measurement channels.
Loading the AU phase correction file will result otherwise in increasing the phase error (or evendouble the phase difference if the microphones are inverted on the measurement channels).
Loading a phase correction file does not automatically configure the measurement channels.

01DB APPLICATION NOTE: SOUND POWER MEASUREMENT ACCORDING TO ISO9614 STANDARD
CHAPTER 7 - HARDWARE CONFIGURATION OF INTENSITY METER : DBFA32 PAGE 51
) Remote Control tab : If the user wishes to use a remote control to perform measurements, it needsto be selected in the list of available remote control by pressing the >> key.
Using a remote control for sound power measurements allows the user to start, stop and validsuccessive acquisitions by simple key pushes on the handle of the 50AI probe.The settings of the remote controls are defined in the file dBCD32.INI.
Select the GRAS probe in the list of available remote controls for the sound intensity probe 50AI.
Then press the Configure key and select the Symphonie in the communication field.
This is important because the interface box between the probe and the acquisition unit uses the digitalinputs / outputs (Mini PS/2 connector) to pass remote control signals.
The duration parameters apply to the LEDs on the probe handle.

01DB APPLICATION NOTE: SOUND POWER MEASUREMENT ACCORDING TO ISO9614 STANDARD
CHAPTER 7 - HARDWARE CONFIGURATION OF INTENSITY METER : DBFA32 PAGE 52
* Phase tab : For sound power measurement according to ISO9614 standard, a phase correction datafile needs to be activated. Tick the Active field and select an AU file by the >> key.
Phase correction data files (Au extension) are created or can be modified in the dBSOND32 softwareapplication (see chapter 6).
& If the operator uses phase matched microphones, or if phase calibration has not been done, an AUfile is still required as it contains the pressure residual intensity index for the probe. Even if it has notbeen measured in dBSOND32, manually enter the manufacturer values in an AU file.
+ Once these parameters have been defined, save the hardware configuration of the sound intensitymeter in a configuration file of type HCF.
To do so, click on the key Save As and give a name to the configuration file.
Previous configurations can also be loaded by clicking on the Open key. A new configuration can beperformed by pressing on the New key.
& For further details on hardware configuration, consult the installation manual of your system aswell as the on-line help file of the application software.
Your 01dB sound intensity meter is now ready for sound powermeasurements according to ISO9614 standard.
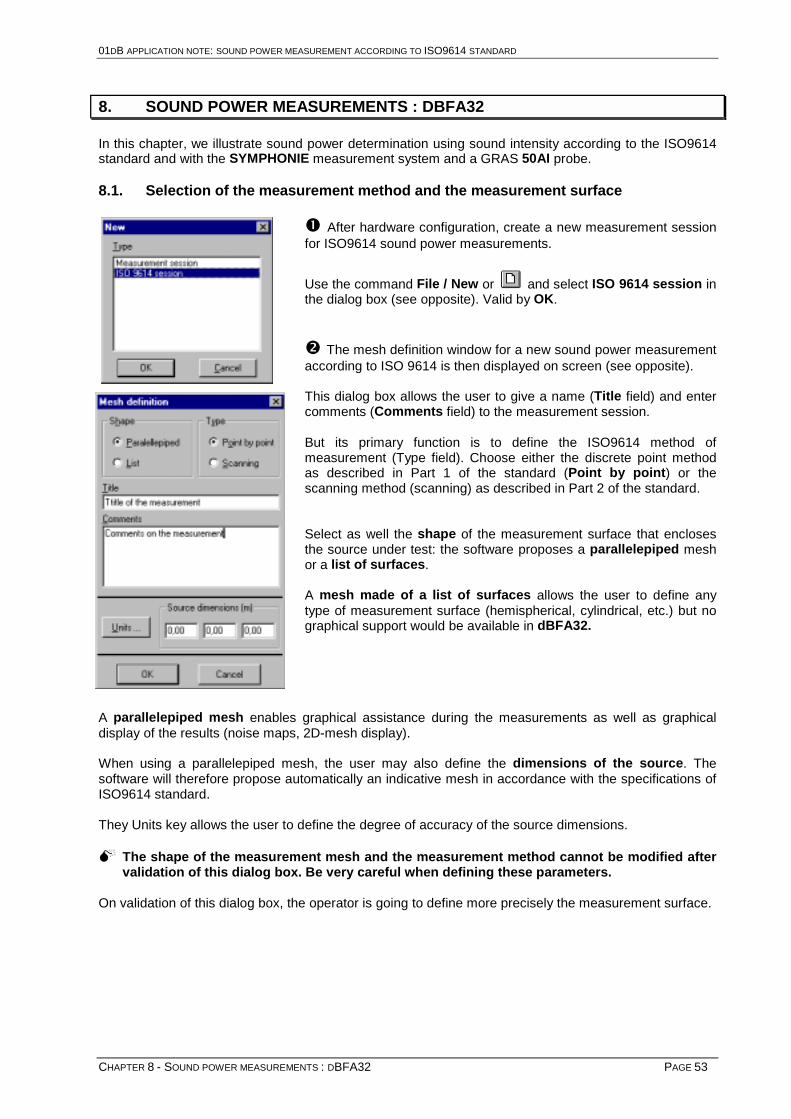
01DB APPLICATION NOTE: SOUND POWER MEASUREMENT ACCORDING TO ISO9614 STANDARD
CHAPTER 8 - SOUND POWER MEASUREMENTS : DBFA32 PAGE 53
8. SOUND POWER MEASUREMENTS : DBFA32
In this chapter, we illustrate sound power determination using sound intensity according to the ISO9614standard and with the SYMPHONIE measurement system and a GRAS 50AI probe.
8.1. Selection of the measurement method and the measurement surface
' After hardware configuration, create a new measurement sessionfor ISO9614 sound power measurements.
Use the command File / New or and select ISO 9614 session inthe dialog box (see opposite). Valid by OK.
( The mesh definition window for a new sound power measurementaccording to ISO 9614 is then displayed on screen (see opposite).
This dialog box allows the user to give a name (Title field) and entercomments (Comments field) to the measurement session.
But its primary function is to define the ISO9614 method ofmeasurement (Type field). Choose either the discrete point methodas described in Part 1 of the standard (Point by point) or thescanning method (scanning) as described in Part 2 of the standard.
Select as well the shape of the measurement surface that enclosesthe source under test: the software proposes a parallelepiped meshor a list of surfaces.
A mesh made of a list of surfaces allows the user to define anytype of measurement surface (hemispherical, cylindrical, etc.) but nographical support would be available in dBFA32.
A parallelepiped mesh enables graphical assistance during the measurements as well as graphicaldisplay of the results (noise maps, 2D-mesh display).
When using a parallelepiped mesh, the user may also define the dimensions of the source. Thesoftware will therefore propose automatically an indicative mesh in accordance with the specifications ofISO9614 standard.
They Units key allows the user to define the degree of accuracy of the source dimensions.
2 The shape of the measurement mesh and the measurement method cannot be modified aftervalidation of this dialog box. Be very careful when defining these parameters.
On validation of this dialog box, the operator is going to define more precisely the measurement surface.
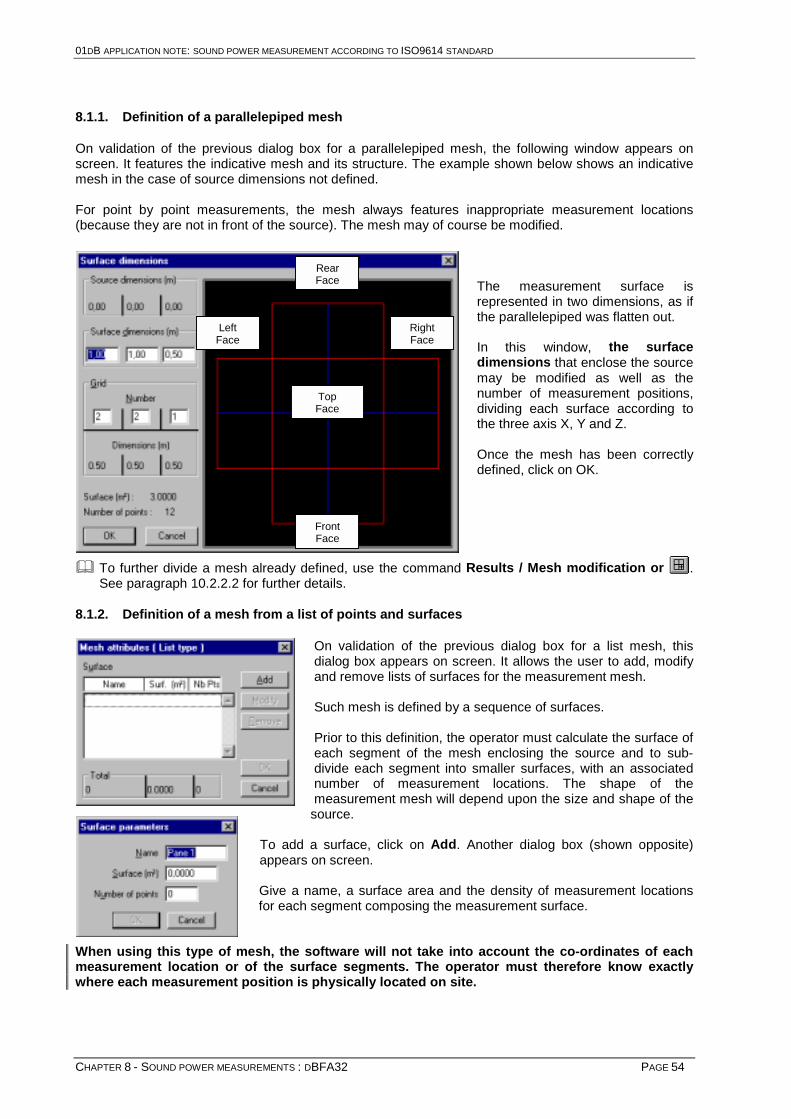
01DB APPLICATION NOTE: SOUND POWER MEASUREMENT ACCORDING TO ISO9614 STANDARD
CHAPTER 8 - SOUND POWER MEASUREMENTS : DBFA32 PAGE 54
8.1.1. Definition of a parallelepiped mesh
On validation of the previous dialog box for a parallelepiped mesh, the following window appears onscreen. It features the indicative mesh and its structure. The example shown below shows an indicativemesh in the case of source dimensions not defined.
For point by point measurements, the mesh always features inappropriate measurement locations(because they are not in front of the source). The mesh may of course be modified.
The measurement surface isrepresented in two dimensions, as ifthe parallelepiped was flatten out.
In this window, the surfacedimensions that enclose the sourcemay be modified as well as thenumber of measurement positions,dividing each surface according tothe three axis X, Y and Z.
Once the mesh has been correctlydefined, click on OK.
& To further divide a mesh already defined, use the command Results / Mesh modification or .See paragraph 10.2.2.2 for further details.
8.1.2. Definition of a mesh from a list of points and surfaces
On validation of the previous dialog box for a list mesh, thisdialog box appears on screen. It allows the user to add, modifyand remove lists of surfaces for the measurement mesh.
Such mesh is defined by a sequence of surfaces.
Prior to this definition, the operator must calculate the surface ofeach segment of the mesh enclosing the source and to sub-divide each segment into smaller surfaces, with an associatednumber of measurement locations. The shape of themeasurement mesh will depend upon the size and shape of thesource.
To add a surface, click on Add. Another dialog box (shown opposite)appears on screen.
Give a name, a surface area and the density of measurement locationsfor each segment composing the measurement surface.
When using this type of mesh, the software will not take into account the co-ordinates of eachmeasurement location or of the surface segments. The operator must therefore know exactlywhere each measurement position is physically located on site.
FrontFace
RearFace
RightFace
LeftFace
TopFace

01DB APPLICATION NOTE: SOUND POWER MEASUREMENT ACCORDING TO ISO9614 STANDARD
CHAPTER 8 - SOUND POWER MEASUREMENTS : DBFA32 PAGE 55
8.2. Acquisition – Preliminary measurements
For the rest of this notice, we illustrate the measurement process for sound power determinationaccording to the discrete point method, described in Part 1 of the ISO9614 standard, and for aparallelepiped measurement surface.
8.2.1. Measurement information window and save options
When the mesh has been defined (list of surfaces orparallelepiped), an information window for the measurementis displayed on screen (see aside). It features all theparameters already defined.
This information window means that the sound intensitymeasurement session has been created.
' Save this file (File / Save) to disk and start themeasurement process, analyse the results, etc.
( It is possible to save at the same time the analysisparameters and the results as well as the size and positionof all the windows open in the software.
Like so, when opening an existing ISO9614 file (File / Open/*.CMG), the windows that will be displayed will be the onesleft opened previously.
To do so, tick the box Save windows in the following dialog,accessed by the menu position Preferences / ISO9614 module thensave the measurement session by the command File / Save.
) It is also possible to automatically save the measurement results by the command Measure /Configuration.
In the example shown aside, the results will beautomatically saved after each stationaritymeasurement (or probe inversion) and after eachmeasurement point for sound power determination.

01DB APPLICATION NOTE: SOUND POWER MEASUREMENT ACCORDING TO ISO9614 STANDARD
CHAPTER 8 - SOUND POWER MEASUREMENTS : DBFA32 PAGE 56
8.2.2. Pressure calibration of the microphones
If pressure calibration of the microphones is not required for the probe phase calibration, it is highlyrecommended to do it before any sound intensity measurement session. To perform calibration, use thecommand Measure / Calibration and proceed as described in paragraph 6.3.
8.2.3. Stationarity check of the sound field (ISO9614 – part 1 only)
Determination of sound power by sound intensity measurements in different points of a surface enclosingthe source is based on the hypothesis that the sound field is stationary. In other words, the noise levelmust not vary significantly with time.
This preliminary measurement is therefore very important: It means to find a measurement durationfor which the source noise level is stationary, and then to keep this duration for all sound powermeasurements in order to guarantee accurate results. The stationarity check corresponds to the F1 fieldindicator of the standard ISO9614. To conform to its specifications, F1 must be less than 0.6 (F1 < 0.6).
' A stationarity check is made over N successive measurementsthat are compared with one another to see if the noise is the same.The number N can be set in the measurement configurationwindow, accessible by the command Measure / Configuration.
In the Stationarity field, set the number of successive acquisitions.
The Chained acquisitions option allows the user to performsuccessively the N stationarity measurements automatically.
( To perform the measurement itself, use the command Measure / Stationarity or . A soundintensity acquisition window is displayed on screen.
The interspectra of sound pressureand sound intensity levels betweenchannel 1 and channel 2 aredisplayed by default.
The vertical toolbar featuresacquisition parameters andanalyser commands, while thevertical toolbar is used to setgraphical parameters.
Before acquisition, the user mustset parameters such as the inputgains, the measurement duration,etc.

01DB APPLICATION NOTE: SOUND POWER MEASUREMENT ACCORDING TO ISO9614 STANDARD
CHAPTER 8 - SOUND POWER MEASUREMENTS : DBFA32 PAGE 57
) Analysis parameters. Use the command Config / Parameters or .
This dialog box allows the user to determine the datastorage mode.By default, in the customised mode, the analyser onlysave the results that are used in sound powerdetermination.
Then, set the physical characteristics associatedwith the measurement: the microphone 'spacing used,the celerity of sound and the medium density (air bydefault).
It is also possible to perform an automaticautorange before each acquisition and to use anoverlap for the FFT analysis of the signal.
The convolution correction option allows the user toadjust the high frequency limit due to the finitedifference approximation errors (see below) to amaximum of 3 dB.
Select as well the frequency limits of analysis. They depend upon the microphone spacing, theminimum frequency band required and if the convolution correction is activated or not.
The table below summarises these interactions for various microphone spacing. The values betweenbrackets give the high frequency limit when the convolution correction is activated.
Fmin (Hz)Spacing (mm)
3333 20 25 to 40 50 to 80 100 and more
50 12,5 – 1K(1,6K)
25 – 1K(1,6K)
50 – 1K(1,6K)
100 – 1K(1,6K)
25 25 – 2K(2K)
25 – 2K(3,15K)
50 – 2K(3,15K)
100 – 2K(3,15K)
12 50 – 2K(2K)
50 – 4K(4K)
50 – 4K(6,3K)
100 – 4K(6,3K)
6 100 – 2K(2K)
100 – 4K(4K)
100 – 8K(8K)
100 – 8K(12,5K)
The option Adjust to physical frequency limits when activated automatically reduces the frequencylimits to a frequency range in which sound intensity can be calculated.
The physical limitation of the frequency range is due, for high frequencies to the approximation of thepressure gradient and, for low frequencies to the microphone spacing (the lager the spacer, the lower thefrequency band accessible).
With a 12 mm spacer (and the convolution correction activated), the software the frequency rangerequired by the international standard (50 Hz - 6,3 kHz) but the user can advantageously perform itssound intensity measurements in two stages:
$ A first series of measurements with a 12mm spacer for high frequency bands,
$ Then a second series with a 25-mm spacer to cover low frequency bands.
& For more details on the intensity meter physical limitations at low and high frequencies, refer toparagraph 2.3.

01DB APPLICATION NOTE: SOUND POWER MEASUREMENT ACCORDING TO ISO9614 STANDARD
CHAPTER 8 - SOUND POWER MEASUREMENTS : DBFA32 PAGE 58
If the measurements are performed in two steps, with differentspacers, check the option complete spectra in the measurementconfiguration window (command Measure / Configuration).
This option allows the user to complete the spectra resulting fromthe first series of measurements with the frequency bands of thespectra resulting from the second series of measurements.
Example: A measurement is made in one point of the mesh overthe frequency range 25Hz–4kHz with a 12 mm spacer, then overthe range 80Hz – 8kHz with a 25 mm spacer. The result will coverthe range 25Hz – 8kHz, the frequency bands with centrefrequencies ranging from 25 Hz to 63 Hz are taken from the firstmeasurement, the other bands from the current measurement.
& This option will be applied to any measurement made.
* Use the command Config / Gain and threshold toaccess the set-up dialog box aside.
Adjust the gains (that are linked and identical for both channels)with the probe placed on the surface enclosing the source. Thesource must be switched on. Set the gains with the view meter toa maximum without overload (when overloads are detected, theview meter is shown in red – set the levels in the top quarter ofthe view meter).
+ Use the command Config / Average or to set the measurement duration.
First perform a stationarity measurement for a relatively short duration (example:32 averages).
If the result is not satisfying, use longer measurement duration in order to obtain astationarity criterion that complies with the standard specifications.
Example: If the user performs sound power measurements for a printer or a copier, the sound field willnot be considered as stationarity if the measurements are not performed over the complete printing cycle(warm up, sheet capture, inking, noise of the rollers, form feed).
When a satisfying averaging time is found, use it for all successive sound power measurements.
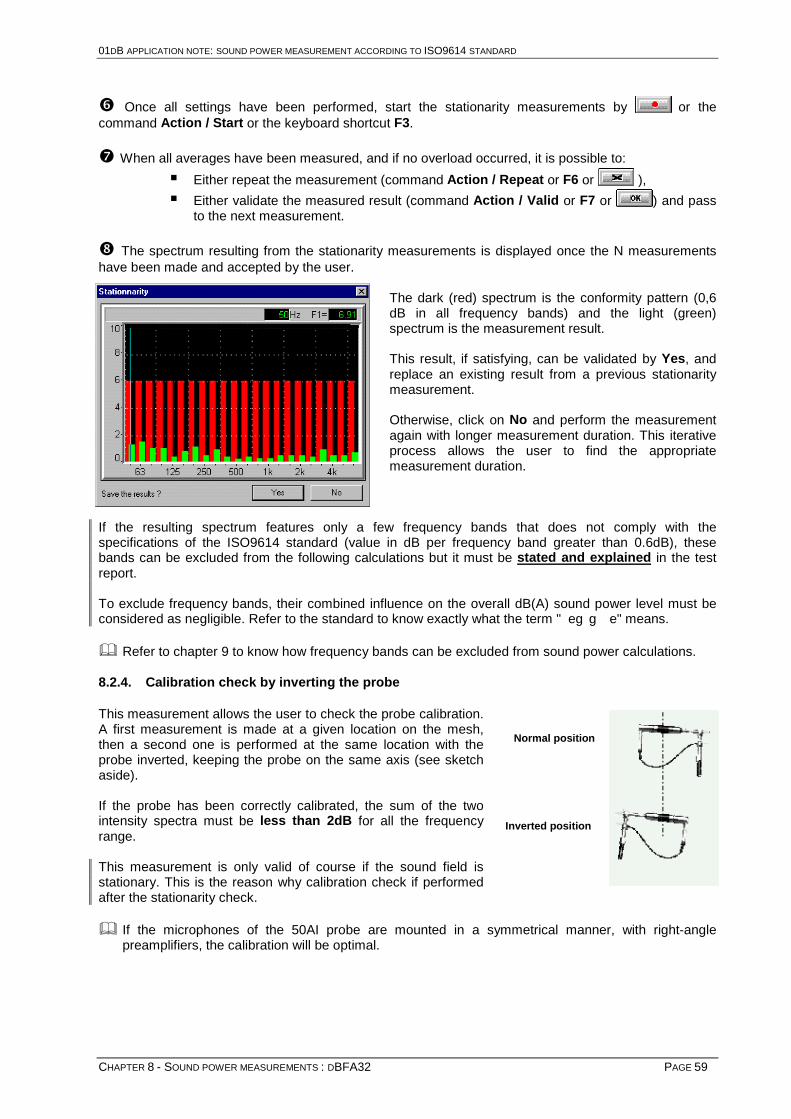
01DB APPLICATION NOTE: SOUND POWER MEASUREMENT ACCORDING TO ISO9614 STANDARD
CHAPTER 8 - SOUND POWER MEASUREMENTS : DBFA32 PAGE 59
Normal position
Inverted position
, Once all settings have been performed, start the stationarity measurements by or thecommand Action / Start or the keyboard shortcut F3.
- When all averages have been measured, and if no overload occurred, it is possible to:
$ Either repeat the measurement (command Action / Repeat or F6 or ),
$ Either validate the measured result (command Action / Valid or F7 or ) and passto the next measurement.
. The spectrum resulting from the stationarity measurements is displayed once the N measurementshave been made and accepted by the user.
The dark (red) spectrum is the conformity pattern (0,6dB in all frequency bands) and the light (green)spectrum is the measurement result.
This result, if satisfying, can be validated by Yes, andreplace an existing result from a previous stationaritymeasurement.
Otherwise, click on No and perform the measurementagain with longer measurement duration. This iterativeprocess allows the user to find the appropriatemeasurement duration.
If the resulting spectrum features only a few frequency bands that does not comply with thespecifications of the ISO9614 standard (value in dB per frequency band greater than 0.6dB), thesebands can be excluded from the following calculations but it must be stated and explained in the testreport.
To exclude frequency bands, their combined influence on the overall dB(A) sound power level must beconsidered as negligible. Refer to the standard to know exactly what the term " eg g e" means.
& Refer to chapter 9 to know how frequency bands can be excluded from sound power calculations.
8.2.4. Calibration check by inverting the probe
This measurement allows the user to check the probe calibration.A first measurement is made at a given location on the mesh,then a second one is performed at the same location with theprobe inverted, keeping the probe on the same axis (see sketchaside).
If the probe has been correctly calibrated, the sum of the twointensity spectra must be less than 2dB for all the frequencyrange.
This measurement is only valid of course if the sound field isstationary. This is the reason why calibration check if performedafter the stationarity check.
& If the microphones of the 50AI probe are mounted in a symmetrical manner, with right-anglepreamplifiers, the calibration will be optimal.
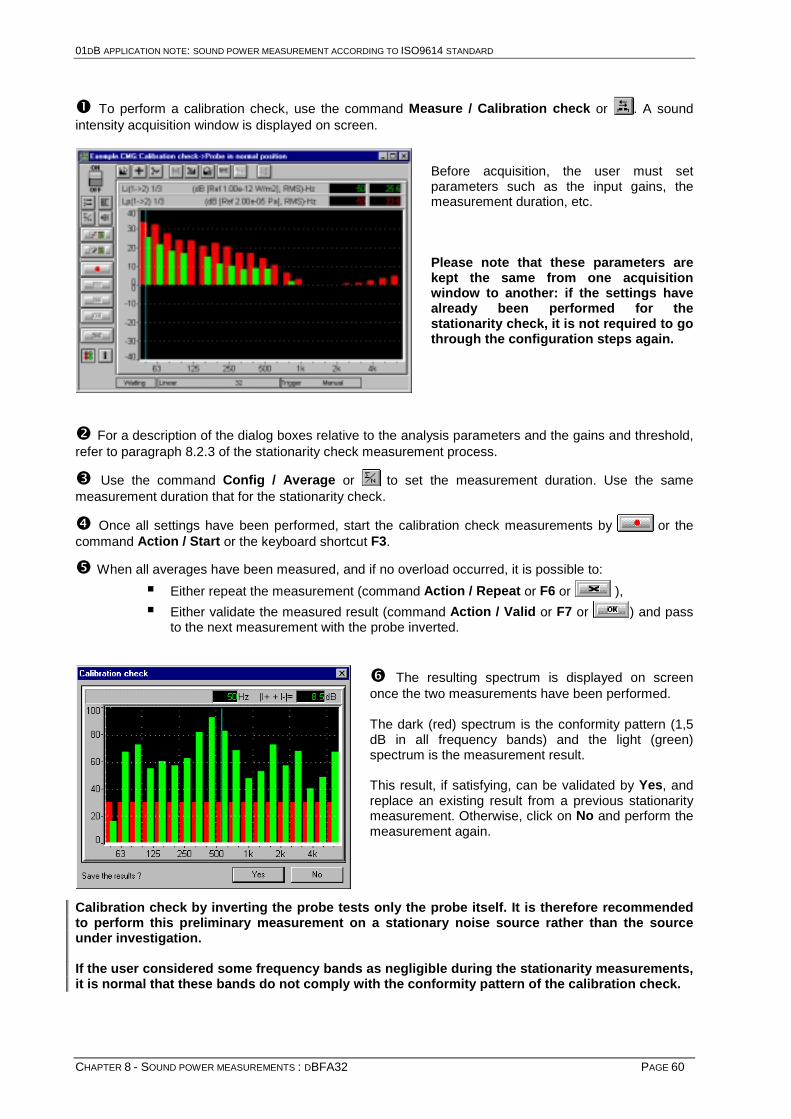
01DB APPLICATION NOTE: SOUND POWER MEASUREMENT ACCORDING TO ISO9614 STANDARD
CHAPTER 8 - SOUND POWER MEASUREMENTS : DBFA32 PAGE 60
' To perform a calibration check, use the command Measure / Calibration check or . A soundintensity acquisition window is displayed on screen.
Before acquisition, the user must setparameters such as the input gains, themeasurement duration, etc.
Please note that these parameters arekept the same from one acquisitionwindow to another: if the settings havealready been performed for thestationarity check, it is not required to gothrough the configuration steps again.
( For a description of the dialog boxes relative to the analysis parameters and the gains and threshold,refer to paragraph 8.2.3 of the stationarity check measurement process.
) Use the command Config / Average or to set the measurement duration. Use the samemeasurement duration that for the stationarity check.
* Once all settings have been performed, start the calibration check measurements by or thecommand Action / Start or the keyboard shortcut F3.
+ When all averages have been measured, and if no overload occurred, it is possible to:
$ Either repeat the measurement (command Action / Repeat or F6 or ),
$ Either validate the measured result (command Action / Valid or F7 or ) and passto the next measurement with the probe inverted.
, The resulting spectrum is displayed on screenonce the two measurements have been performed.
The dark (red) spectrum is the conformity pattern (1,5dB in all frequency bands) and the light (green)spectrum is the measurement result.
This result, if satisfying, can be validated by Yes, andreplace an existing result from a previous stationaritymeasurement. Otherwise, click on No and perform themeasurement again.
Calibration check by inverting the probe tests only the probe itself. It is therefore recommendedto perform this preliminary measurement on a stationary noise source rather than the sourceunder investigation.
If the user considered some frequency bands as negligible during the stationarity measurements,it is normal that these bands do not comply with the conformity pattern of the calibration check.

01DB APPLICATION NOTE: SOUND POWER MEASUREMENT ACCORDING TO ISO9614 STANDARD
CHAPTER 8 - SOUND POWER MEASUREMENTS : DBFA32 PAGE 61
8.3. Acquisition – Sound power measurements
8.3.1. Parameters
' To start sound power measurements, use the command Measure / Power or . Two windows aredisplayed on screen: an acquisition window (left below) and an acquisition order window (right below)showing the measurement progresses with a mesh display.
The light greyed (Yellow) parts of the mesh in the acquisition order window represent the points alreadymeasured while the dark (Green) greyed parts represent the points not yet measured. The blinking point(Bottom left hand corner on the example above) represents the active measurement position and thearrows represent the order of the successive acquisitions. When starting a new measurement, theacquisition order is not yet defined and it must be done before starting any measurement.
( Definition of the acquisition order
Use the command Set-up / Measurement order or . The acquisition order definition window is thendisplayed on screen.
To define the acquisition order, click with the mouseon the different parts of the mesh in the order thatsuits best the measurement conditions.
There are also two automatic orders that can bedefined: face by face or horizontal.
It is also possible to recall the previous acquisitionorder defined or to clear all the selected points.
If measurements have already been made, and ifyou close down dBFA32 during a measurementsession, the last acquisition order will be recalledexactly where it was left.
The user may change the last acquisition order for the points not yet measured. If it has to be changedfor all the points of the mesh, click on the option Measured points.

01DB APPLICATION NOTE: SOUND POWER MEASUREMENT ACCORDING TO ISO9614 STANDARD
CHAPTER 8 - SOUND POWER MEASUREMENTS : DBFA32 PAGE 62
However, if the user wishes to re-do existing measurements (because the measurement conditions havechanged or when using a different microphone spacer), the option Measured points must be validatedto be able to select automatically an acquisition order taking into account the measured points.
& For a mesh made of a list of points and surfaces, the user must add one by one the points in theacquisition order by adding points (it will be the last one measured) or by inserting points (it will bepositioned at the current position). It is possible to select automatically all the points, in the order theywere defined, and the option Measured points has the same meaning.
) Mesh set-up around the source
Now that the acquisition order has been defined, the user must prepare physically the measurementenvironment around the source. That is to use precise markers to place the probe exactly at the definedmeasurement locations.
The most practical is to use markers on the floor, a tripod to fix the probe and a ruler.
Use the command Results / points' list tovisualise the co-ordinates of each measurementlocations of the mesh. A mesh listing is displayed onscreen.
$ The co-ordinates of the current point are recalledin the header of the acquisition window.
$ The icon allows the user to select which facesof the mesh have to be listed (Command Set-up /zone). By default, all points of each and every faceare listed.
These co-ordinates are given for a direct orthonormalmarking: the software only knows the measurementsurfaces.
The origin and the orientation of the source in themesh are left to the user, as long as the meshcompletely enclose the source (a good practice is toplace the source at the centre of the mesh).
& For a mesh made of a list of points and surfaces, the software does not manage the co-ordinatesof the measurement points. The physical markers should be placed manually.
Now that the mesh is physically defined, the sound power measurements can be performed.

01DB APPLICATION NOTE: SOUND POWER MEASUREMENT ACCORDING TO ISO9614 STANDARD
CHAPTER 8 - SOUND POWER MEASUREMENTS : DBFA32 PAGE 63
8.3.2. Sound power measurements without remote control
' Configure the analysis parameters, the averaging time and the gains as previously explained (seeparagraph 8.2.3 for the stationarity measurement). By default, these settings are the same than forthe previous acquisition window.
( Place the probe at the exact location of the first measurement position, according to the definedacquisition order.
) Start calibration check by or the command Action / Start or the keyboard shortcut F3.
* When all averages have been measured, and if no overload occurred, it is possible to:
$ Either repeat the measurement (command Action / Repeat or F6 or ),
$ Either validate the measured result (command Action / Valid or F7 or ).
+ If the measurement has been validated, re-do operations ) and * for all the following points,according to the defined acquisition order. If the measurement has not been accepted, re-do the samemeasurement.
, In order to re-do some measurements with a different probe configuration (i.e. for a differentfrequency range), make sure that the option Complete spectra has been activated in the dialogaccessed by the command Measure / Configuration. This option allows the user to complete thespectra resulting from the first series of measurements with the frequency bands of the spectra resultingfrom the second series of measurements.
As long as an acquisition order is not defined, sound power measurements are not accessible.
During acquisition, check the input gains: if an overload occurs, re-do the measurement for theactive point.
Before each measurement, manually or automatically (autorange) adjust the input gains. Somemeasurement locations may be noisier than others (real-life sound sources are very rarely omni-directional).
The option "Automatic autorange" in the analysis parameter dialog box, command Config /Parameters can be useful to automatically adjust the input gains before each measurement.
& Consult chapter 3 for more details on the sound power measurement process according to ISO9614,part 1 and part 2.
8.3.3. Sound power measurements with a remote control
If you are using a sound intensity probe type GRAS 50AI with a remote control, the measurementprocess is simplified because the operator does not need to use the keyboard or the mouse to start,stop, valid a measurement. The remote control is very useful if the source under test is located at acertain height or in a location difficult to access.
The handle of the sound intensity probe features two remote control buttons that can be used to pilot theacquisition process and two LEDs to inform the user on the measurement progress.
$ The Blue button is a 'positive' button: it is used to start and validate a measurement.
$ The Grey button is a 'negative' button: it is used to prematurely stop an acquisition or to repeatthe current measurement.

01DB APPLICATION NOTE: SOUND POWER MEASUREMENT ACCORDING TO ISO9614 STANDARD
CHAPTER 8 - SOUND POWER MEASUREMENTS : DBFA32 PAGE 64
' Place the sound intensity probe at the first measurement location, according to the definedacquisition order. When the Green LED blinks, it means that the system waits to start an acquisition.
( Press the Blue button. The acquisition starts. At the end of the acquisition, the two LEDs blink. Itmeans that the system waits for a decision:
$ validation of the measurement by the blue button
$ repetition of the measurement by the grey button
) Whatever the choice, the system waits for another measurement start action: for the samemeasurement points if the last acquisition has been eliminated, for the next measurement point if it hasbeen validated.
The Red LED indicates a possible overload during acquisition.
* Perform the measurement again for each point, according to the defined acquisition order.
8.3.4. General remarks
In the measurement configuration (command Measure /Configuration), there is an option called Keepinterrupted measurement. If activated, this option allows the user to consider an acquisition that wasstopped before the end of the averaging duration (by the use of the grey button or the command Actions/ Stop or F4 or ) as valid. The software therefore proposes to accept or eliminates thismeasurement.
If this option is not activated, interrupting a measurement before the end of the averaging duration willresult in repeating the same acquisition.
When using the scanning method, this option should always be validated and the measurement durationshould be as long as possible. Like so, a measurement surface can be swept and manually interruptedat the end of scanning. The remote control is particularly recommended for sound powermeasurement using the scanning technique.
It is also possible to display windows containing results during the measurement process. They will beupdated in real-time each time an acquisition has been validated. This can be useful to monitor theresults as we go along (see chapter 9).
For measurement by scanning, the standard recommend to sweep the probe over each measurementsurface according to orthogonal directions. See sketch below.
& Consult chapter 3 for more details on the measurement process according to the standard ISO9614,part 1 and part 2.

01DB APPLICATION NOTE: SOUND POWER MEASUREMENT ACCORDING TO ISO9614 STANDARD
CHAPTER 9 - PROCESSING OF THE RESULTS PAGE 65
9. PROCESSING OF THE RESULTS
In dBFA32, the user can display the measurement results in different ways:
$ Graphics or tables of the measurement results for a given point of the mesh
$ Graphics or tables of the overall measurement results
$ Noise maps (ISO contours) of the overall measurement results for parallelepipedic meshes only.
These results can be displayed while performing the measurements. The results will then beupdated after validation of every acquisition, in order to know if the given measurement point as to beperformed again.
9.1. Mesh display
' Use the command Results / Mesh plot or .
This command is used to plot a parallelepipedic mesh.
The dark greyed (green) points are the points alreadymeasured. The light greyed surfaces (yellow) are the pointsnot yet measured.
9.2. Points' list
' Use the command Results / Points' list.
This command is used to display the characteristics of themesh: the co-ordinates of every measurement locations andtheir associated surface, their positions on the mesh (back,front, right, left, top) and if the measurement has been doneyet at this location.
( With the command Set-up / zone or , it is possible todisplay the points' characteristics for a given face only.
The example shown aside corresponds to a list of points fora parallelepipedic mesh and a mesh made of a list ofsurfaces.

01DB APPLICATION NOTE: SOUND POWER MEASUREMENT ACCORDING TO ISO9614 STANDARD
CHAPTER 9 - PROCESSING OF THE RESULTS PAGE 66
9.3. Listing of the results per point
' Use the command Results / List per point or .
This command is used to display the sound intensity and/orsound pressure values for given frequency bands and at onemeasurement location.
It is possible to open such result window for severalmeasurement points.
( Use the command Set-up / Point or to select which themeasurement point for which the listing will be displayed.
To select a point, use the mouse or the keyboard arrows (spacebarto select). Valid by OK.
) Use the command Set-up / Data or to select which type of data will be displayed.
It is possible to display the sound intensity and/orsound pressure spectra in octaves or thirdoctaves.
* It is also possible to select the frequencybands that will be considered for overall levelcalculations by pressing the Select key.
The frequencies displayed are the centrefrequencies of the third-octave or octave bands, according to the previous choice.
When opening this dialog box, the frequencies selected by default are those of thefrequency range of the last acquisition.
Add or exclude frequency bands by a simple mouse click on the appropriatefrequency value. Two keys can be used to include all or clear all the frequenciesfor calculating overall noise levels.
To exclude negligible frequency bands from subsequent calculations (seechapter 8.2.3 page 56), perform this operation in this dialog box.

01DB APPLICATION NOTE: SOUND POWER MEASUREMENT ACCORDING TO ISO9614 STANDARD
CHAPTER 9 - PROCESSING OF THE RESULTS PAGE 67
+ Use the command Set-up / Displayed frequencies or to select the frequency bands for whichsound pressure and/or sound intensity spectra values will be displayed as a table of results.
Select with the mouse the frequency bands to display in the results' list.
The keys All and Clear All allows the user respectively to select automaticallyall the frequencies or to clear them all.
Some frequency bands are preceded by a mark *.
They correspond to the frequency bands excluded from the calculation ofoverall noise levels in the data selection dialog box.
These frequency bands cannot be selected for display either manually orautomatically.
, The command Set-up / Optimise frame size or allows the user, when activated, to automaticallyresize the listing window. It is recommended to activate this option if the results are displayed inreal-time during the measurements.

01DB APPLICATION NOTE: SOUND POWER MEASUREMENT ACCORDING TO ISO9614 STANDARD
CHAPTER 9 - PROCESSING OF THE RESULTS PAGE 68
9.4. Graphical plot of the results per point
' Use the command Results / Display per point or .
This command is used to display sound pressure and/or sound intensity spectra in octaves or thirdoctaves for a given point of the mesh. It is possible to open such plot several measurement points.
( Activate the option Set-up / Mesh Display or to display the mesh plot. The measured points aredisplayed in light grey (yellow) and the selected points are displayed in dark grey (green). The mesh,featuring the selected points, is displayed with the spectra in the graphic window.
) Use the command Setup / Zoneto select the mesh points for which thegraphical results will be displayed.
To select a point, use the mouse or thekeyboard arrows (spacebar to select).Valid by OK.
Automatic selection keys can also beused to select all the points, the points ofa given mesh surface or clear all theselected points.
& If you click again on a point already selected, it will be unselected.
The option Non measured points allows the user to only select the points that have not yet beenmeasured.
Tick this option if you wish to display the results in real-time during the measurements.
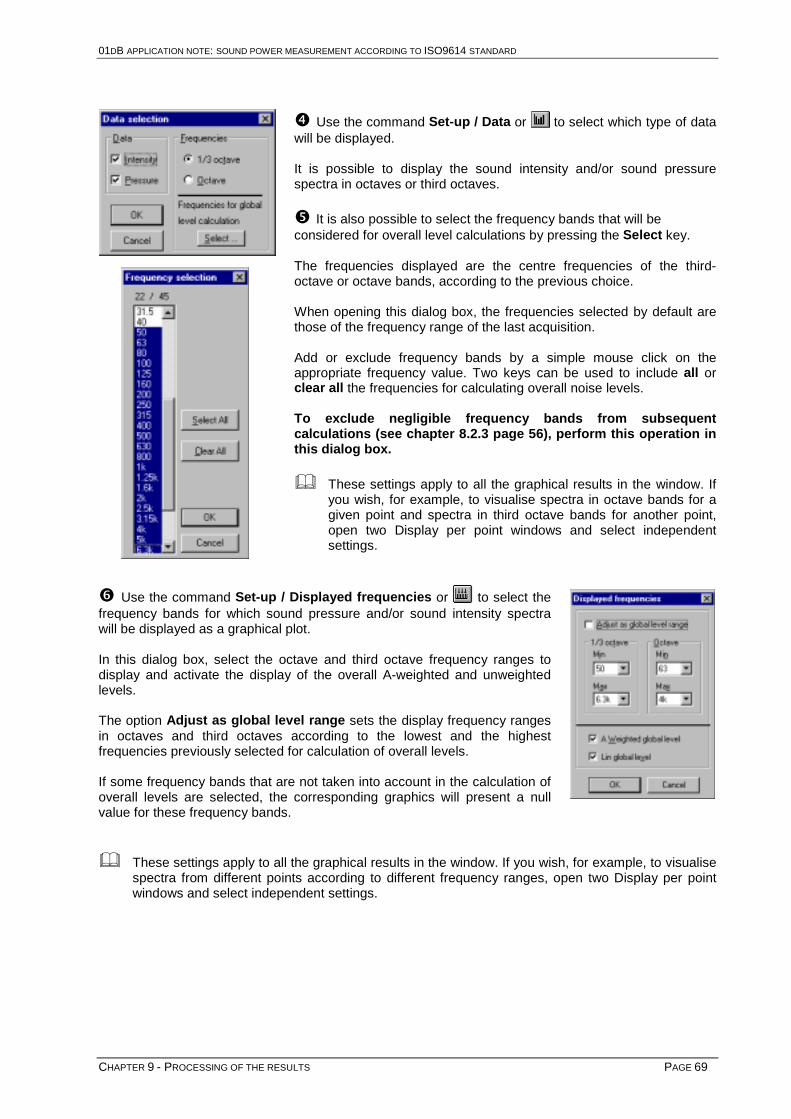
01DB APPLICATION NOTE: SOUND POWER MEASUREMENT ACCORDING TO ISO9614 STANDARD
CHAPTER 9 - PROCESSING OF THE RESULTS PAGE 69
* Use the command Set-up / Data or to select which type of datawill be displayed.
It is possible to display the sound intensity and/or sound pressurespectra in octaves or third octaves.
+ It is also possible to select the frequency bands that will beconsidered for overall level calculations by pressing the Select key.
The frequencies displayed are the centre frequencies of the third-octave or octave bands, according to the previous choice.
When opening this dialog box, the frequencies selected by default arethose of the frequency range of the last acquisition.
Add or exclude frequency bands by a simple mouse click on theappropriate frequency value. Two keys can be used to include all orclear all the frequencies for calculating overall noise levels.
To exclude negligible frequency bands from subsequentcalculations (see chapter 8.2.3 page 56), perform this operation inthis dialog box.
& These settings apply to all the graphical results in the window. Ifyou wish, for example, to visualise spectra in octave bands for agiven point and spectra in third octave bands for another point,open two Display per point windows and select independentsettings.
, Use the command Set-up / Displayed frequencies or to select thefrequency bands for which sound pressure and/or sound intensity spectrawill be displayed as a graphical plot.
In this dialog box, select the octave and third octave frequency ranges todisplay and activate the display of the overall A-weighted and unweightedlevels.
The option Adjust as global level range sets the display frequency rangesin octaves and third octaves according to the lowest and the highestfrequencies previously selected for calculation of overall levels.
If some frequency bands that are not taken into account in the calculation ofoverall levels are selected, the corresponding graphics will present a nullvalue for these frequency bands.
& These settings apply to all the graphical results in the window. If you wish, for example, to visualisespectra from different points according to different frequency ranges, open two Display per pointwindows and select independent settings.

01DB APPLICATION NOTE: SOUND POWER MEASUREMENT ACCORDING TO ISO9614 STANDARD
CHAPTER 9 - PROCESSING OF THE RESULTS PAGE 70
- Use the command Setup / Options or to configure general displayparameters.
The automatic Y-axis option is used to perform an autoscale automatically foreach plot, while the Global optimisation option set the same Y-axis dynamicrange for all plots (useful to compare spectra from different points).
The Synchronised cursors option can be used to synchronise the cursors on the different graphics.
It is a useful option to find "hot spots" when trying to locate a source: the sound levels are more importantat given locations than others (see paragraph 10.2.2.1) and for a given frequency band.
. Other graphical settings for each individual plot, are available by the command Setup / Setup.
/ The command Setup / Layout or allows the user to define the graphical plot layout in thewindow.
& When opening a new result window, the software keeps all compatible settings from the previousresult window. As most of the settings for a listing table and a graphical plot are similar, thefrequency bands selected for calculation of overall results and for display are kept the same for thetwo types of result windows.

01DB APPLICATION NOTE: SOUND POWER MEASUREMENT ACCORDING TO ISO9614 STANDARD
CHAPTER 9 - PROCESSING OF THE RESULTS PAGE 71
9.5. Listing of overall results
' Use the command Results / Globallist.
This command allows the user to calculate theoverall results of the sound powermeasurement (power, preliminarymeasurements, field indicators and conformitycriteria) as a listing table.
The greyed areas of the table correspond to theresults that do not comply with thespecifications of the standard, according to thedesired grade of accuracy.
In order to improve the accuracy of the results,several actions can be taken (see chapter 10).
2 Even if some criteria are not displayed inthe table, they are calculated by dBFA32.For example, if F2 and F3 are displayedbut not criterion 1 (Ld and F2), F2 andF3, and F2 might be greyed because of anon-conformance of criterion 1.
( The command Setup / Zone or to select the mesh points for which the overall results will becalculated.
To select a point, use the mouse or thekeyboard arrows (spacebar to select).Valid by OK. Automatic selection keyscan also be used to select all the points,the points of a given mesh surface orclear all the selected points.
It can be useful for example to eliminate amesh surface that cannot be measured ifthe source is located against a wall.
When clicking again on a point, it will beunselected.
The option Non measured points allows the user to only select the points that have not yet beenmeasured. Tick this option if you wish to display the results in real-time during the measurements.

01DB APPLICATION NOTE: SOUND POWER MEASUREMENT ACCORDING TO ISO9614 STANDARD
CHAPTER 9 - PROCESSING OF THE RESULTS PAGE 72
) Use the command Setup / Data or to select whichtype of data will be displayed.
It is possible to display the field indicators F1, F3 and F2, F4,the conformity criteria 1 and 2, the measured powerspectrum, the calibration and stationarity check spectra – inoctave bands or third octave bands.
Select as well the grade of accuracy required (Precision,Engineering or Survey). The greyed areas in the table willdepend of the grade of accuracy selected. The Precisiongrade is the most selective.
& For measurements according to the scanning technique, the criteria 1 and 2, the sound powerspectrum or the calibration check by inverting the probe can be displayed. The user can selecteither the Engineering or Survey grade of accuracy.
* It is also possible to select the frequency bands that will be considered for overall level calculationsby pressing the Select key. The frequencies displayed are the centre frequencies of the third-octave oroctave bands, according to the previous choice (octave bands or third octave bands).
When opening this dialog box, the frequencies selected by default are those of the frequency range ofthe last acquisition.
Add or exclude frequency bands by a simple mouse click on the appropriatefrequency value. Two keys can be used to include all or clear all thefrequencies for calculating overall noise levels.
To exclude negligible frequency bands from subsequent calculations(see chapter 8.2.3 page 56), perform this operation in this dialog box.
+ Use the command Set-up / Displayed frequencies or to select thefrequency bands for which overall levels will be calculated.
Select with the mouse the frequency bands to display in the results' list.
The keys All and Clear All allows the user respectively to selectautomatically all the frequencies or to clear them all.
Some frequency bands are preceded by a mark *.
They correspond to the frequency bands excluded from the calculationof overall noise levels in the data selection dialog box.
These frequency bands cannot be selected for display either manually or automatically.

01DB APPLICATION NOTE: SOUND POWER MEASUREMENT ACCORDING TO ISO9614 STANDARD
CHAPTER 9 - PROCESSING OF THE RESULTS PAGE 73
, The command Set-up / Optimise frame size or allows the user, when activated, to automaticallyresize the listing window. It is recommended to activate this option if the results are displayed inreal-time during the measurements.
& Consult chapter 3 for more details on the measurement process according to the standard ISO9614,part 1 and part 2
9.6. Graphical plot of overall results
' Use the command Results / Global display or .
This command is used to display the following overall results: display the field indicators F1, F3 and F2,F4, the conformity criteria 1 and 2, the measured power spectrum, the calibration and stationarity checkspectra – in octave bands or third octave bands.
( Activate the option Set-up / Mesh Display or to display the mesh plot. The measured points aredisplayed in light grey (yellow) and the selected points are displayed in dark grey (green). The mesh,featuring the selected points, is displayed with the results in the graphic window.
) Use the command Setup / Zoneto select the mesh points for which thegraphical results will be calculated.
To select a point, use the mouse or thekeyboard arrows (spacebar to select).Valid by OK. Automatic selection keyscan also be used to select all the points,the points of a given mesh surface orclear all the selected points.
It can be useful for example to eliminate amesh surface that cannot be measured ifthe source is located against a wall.When clicking again on a point, it will beunselected.

01DB APPLICATION NOTE: SOUND POWER MEASUREMENT ACCORDING TO ISO9614 STANDARD
CHAPTER 9 - PROCESSING OF THE RESULTS PAGE 74
The option Non measured points allows the user to only select the points that have not yet beenmeasured. Tick this option if you wish to display the results in real-time during the measurements.
* Use the command Setup / Data or to select which type of data will be displayed.
It is possible to display the field indicators F1, F3 and F2, F4,the conformity criteria 1 and 2, the measured power spectrum,the calibration and stationarity check spectra – in octavebands or third octave bands.
Select as well the grade of accuracy required (Precision,Engineering or Survey). The greyed areas in the table willdepend of the grade of accuracy selected. The Precisiongrade is the most selective.
& For measurements according to the scanning technique,the criteria 1 and 2, the sound power spectrum or thecalibration check by inverting the probe can be displayed. Theuser can select either the Engineering or Survey grade ofaccuracy.
+ It is also possible to select the frequency bands that will be considered foroverall level calculations by pressing the Select key. The frequencies displayedare the centre frequencies of the third-octave or octave bands, according to theprevious choice.
When opening this dialog box, the frequencies selected by default are those ofthe frequency range of the last acquisition.
Add or exclude frequency bands by a simple mouse click on the appropriatefrequency value. Two keys can be used to include all or clear all thefrequencies for calculating overall noise levels.
To exclude negligible frequency bands from subsequent calculations (seechapter 8.2.3 page 56), perform this operation in this dialog box.
, Use the command Set-up / Displayed frequencies or to selectthe frequency bands for which overall levels will be displayed as agraphical plot.
In this dialog box, select the octave and third octave frequency ranges todisplay and activate the display of the overall A-weighted and unweightedlevels.
The option Adjust as global level range sets the display frequencyranges in octaves and third octaves according to the lowest and thehighest frequencies previously selected for calculation of overall levels.
If some frequency bands that are not taken into account in the calculation of overall levels are selected,the corresponding graphics will present a null value for these frequency bands.
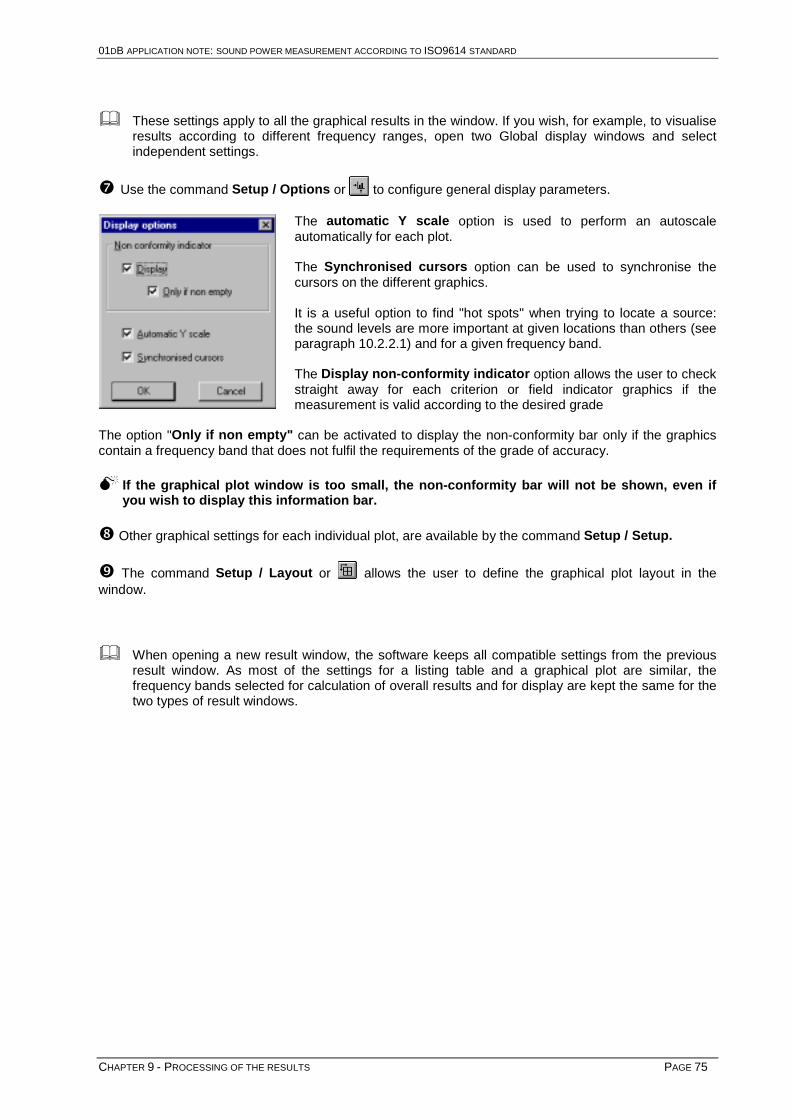
01DB APPLICATION NOTE: SOUND POWER MEASUREMENT ACCORDING TO ISO9614 STANDARD
CHAPTER 9 - PROCESSING OF THE RESULTS PAGE 75
& These settings apply to all the graphical results in the window. If you wish, for example, to visualiseresults according to different frequency ranges, open two Global display windows and selectindependent settings.
- Use the command Setup / Options or to configure general display parameters.
The automatic Y scale option is used to perform an autoscaleautomatically for each plot.
The Synchronised cursors option can be used to synchronise thecursors on the different graphics.
It is a useful option to find "hot spots" when trying to locate a source:the sound levels are more important at given locations than others (seeparagraph 10.2.2.1) and for a given frequency band.
The Display non-conformity indicator option allows the user to checkstraight away for each criterion or field indicator graphics if themeasurement is valid according to the desired grade
The option "Only if non empty" can be activated to display the non-conformity bar only if the graphicscontain a frequency band that does not fulfil the requirements of the grade of accuracy.
2 If the graphical plot window is too small, the non-conformity bar will not be shown, even ifyou wish to display this information bar.
. Other graphical settings for each individual plot, are available by the command Setup / Setup.
/ The command Setup / Layout or allows the user to define the graphical plot layout in thewindow.
& When opening a new result window, the software keeps all compatible settings from the previousresult window. As most of the settings for a listing table and a graphical plot are similar, thefrequency bands selected for calculation of overall results and for display are kept the same for thetwo types of result windows.
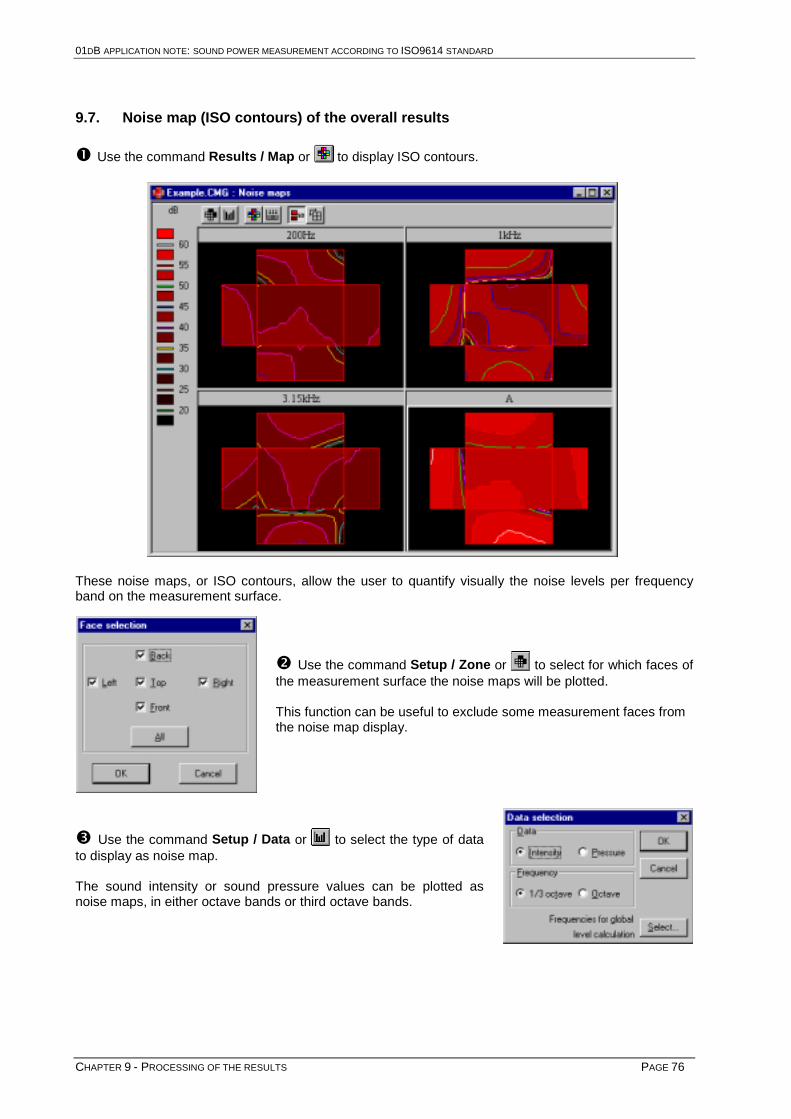
01DB APPLICATION NOTE: SOUND POWER MEASUREMENT ACCORDING TO ISO9614 STANDARD
CHAPTER 9 - PROCESSING OF THE RESULTS PAGE 76
9.7. Noise map (ISO contours) of the overall results
' Use the command Results / Map or to display ISO contours.
These noise maps, or ISO contours, allow the user to quantify visually the noise levels per frequencyband on the measurement surface.
( Use the command Setup / Zone or to select for which faces ofthe measurement surface the noise maps will be plotted.
This function can be useful to exclude some measurement faces fromthe noise map display.
) Use the command Setup / Data or to select the type of datato display as noise map.
The sound intensity or sound pressure values can be plotted asnoise maps, in either octave bands or third octave bands.
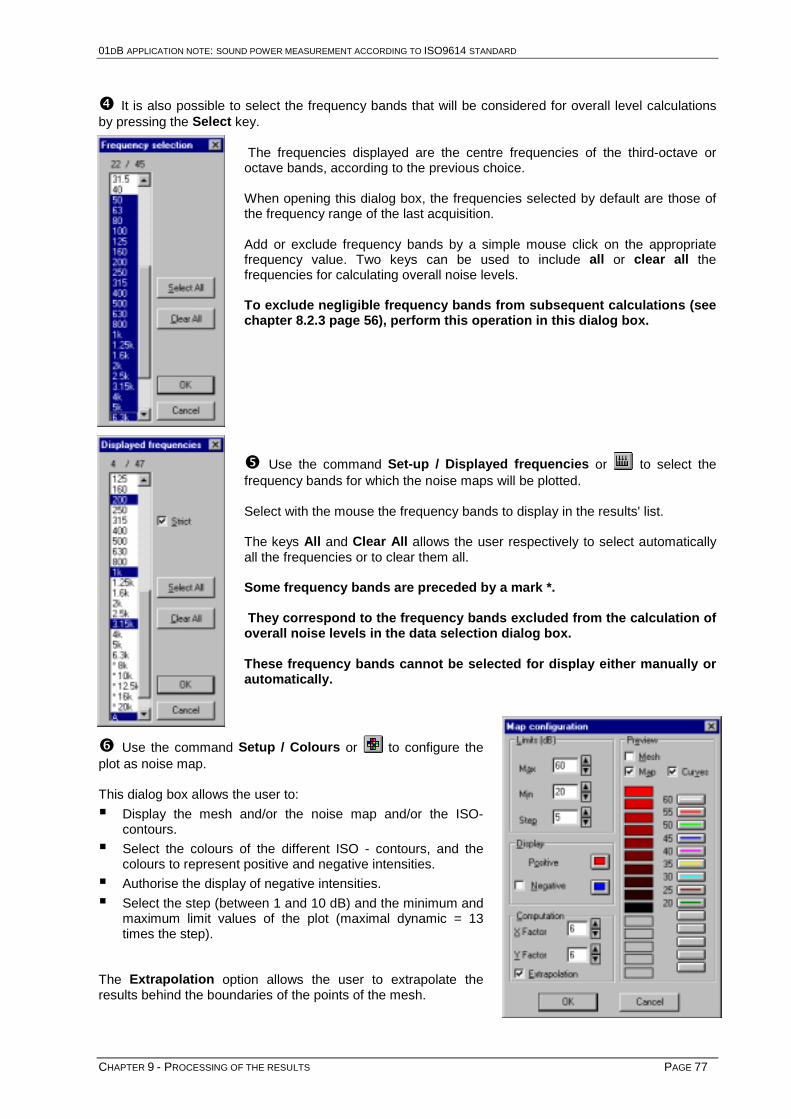
01DB APPLICATION NOTE: SOUND POWER MEASUREMENT ACCORDING TO ISO9614 STANDARD
CHAPTER 9 - PROCESSING OF THE RESULTS PAGE 77
* It is also possible to select the frequency bands that will be considered for overall level calculationsby pressing the Select key.
The frequencies displayed are the centre frequencies of the third-octave oroctave bands, according to the previous choice.
When opening this dialog box, the frequencies selected by default are those ofthe frequency range of the last acquisition.
Add or exclude frequency bands by a simple mouse click on the appropriatefrequency value. Two keys can be used to include all or clear all thefrequencies for calculating overall noise levels.
To exclude negligible frequency bands from subsequent calculations (seechapter 8.2.3 page 56), perform this operation in this dialog box.
+ Use the command Set-up / Displayed frequencies or to select thefrequency bands for which the noise maps will be plotted.
Select with the mouse the frequency bands to display in the results' list.
The keys All and Clear All allows the user respectively to select automaticallyall the frequencies or to clear them all.
Some frequency bands are preceded by a mark *.
They correspond to the frequency bands excluded from the calculation ofoverall noise levels in the data selection dialog box.
These frequency bands cannot be selected for display either manually orautomatically.
, Use the command Setup / Colours or to configure theplot as noise map.
This dialog box allows the user to:
$ Display the mesh and/or the noise map and/or the ISO-contours.
$ Select the colours of the different ISO - contours, and thecolours to represent positive and negative intensities.
$ Authorise the display of negative intensities.
$ Select the step (between 1 and 10 dB) and the minimum andmaximum limit values of the plot (maximal dynamic = 13times the step).
The Extrapolation option allows the user to extrapolate theresults behind the boundaries of the points of the mesh.

01DB APPLICATION NOTE: SOUND POWER MEASUREMENT ACCORDING TO ISO9614 STANDARD
CHAPTER 9 - PROCESSING OF THE RESULTS PAGE 78
The noise maps below are represented without the Extrapolation option:
The X and Y computation factors are used to interpolate the measured values on each surface in orderto obtain a better definition of the noise maps. Below are two examples for which the results areextrapolated and for different computation factors:
- The command Setup / Legend or is used to display a legend on the noise map.
. The command Setup / Layout or is used to choose the type of layout in the display window.
Facteurs X et Y = 1 Facteurs X et Y = 10

01DB APPLICATION NOTE: SOUND POWER MEASUREMENT ACCORDING TO ISO9614 STANDARD
CHAPTER 10 - OBTAINING THE DESIRED GRADE OF ACCURACY : ISO9614 PAGE 79
10. OBTAINING THE DESIRED GRADE OF ACCURACY : ISO9614
In this chapter, we deal with the actions that can be taken to improve the accuracy on the measurementresults according to the specifications of ISO9614, part 1 and part 2. This chapter should be readsimultaneously to chapter 3 that deal with the standardisation aspects of sound power determinationusing sound intensity measurement.
10.1. Stationarity check (discrete point method – part 1)
As previously seen, the principle of the ISO 9614- Part 1 (discrete point method) is based on thehypothesis that the sound field is stationary. It is therefore required to fulfil this criterion (F1 < 0.6 dB) inorder to obtain accurate results.
The first stationarity check is made for a short averaging duration. If the criterion is not fulfilled, the firstaction to take is to increase the measurement duration.
If this measurement cannot be improved, and if only a few frequency bands do not fulfil the condition, thestandard allows the user to exclude these frequency bands from the calculation of the A weighted soundpower level of the source.
In order to exclude one frequency band, the A weighted level for this band must be inferior by 10dB to the highest A weighted band level.
To exclude several frequency bands, the sum of the A weighted sound power level for thesebands must be inferior by 10 dB to the highest A weighted band level.
Here is the practical process to exclude frequency bands:
' Realise the sound power measurements.
( Open a global result display window (or global listing window) and display the F1 criterion(stationarity) and the sound power spectrum for all the acquired frequency bands, according to therequired grade of accuracy. Take into account all the measured points for the calculations of the overallresults, display the non-conformity bar and synchronise the cursors.

01DB APPLICATION NOTE: SOUND POWER MEASUREMENT ACCORDING TO ISO9614 STANDARD
CHAPTER 10 - OBTAINING THE DESIRED GRADE OF ACCURACY : ISO9614 PAGE 80
) If a band level is less than at least 10dB with respect to the highest band level obtained in dB(A), theuser is allowed to remove this band from calculation.
* If you wish to exclude several bands of level Lwi:
$ Calculate the power Wi: Wi = 10-12. 10 (Lwi / 10)
$ Add the power values for these bands : Wtotal = ∑Wi
$ Calculate the overall level for these bands in dB : LWtotal = 10.log (Wtotal / 10-12)
General formulae: LWtotal = 10.log ( 10(Lw1/10) + 10(Lw2/10)+…+ 10(Lwi/10) )
, If Lwtotal is inferior by 10 dB to the highest A weighted band level, you are allowed to exclude thesebands from the sound power calculation.
01DB APPLICATION NOTE: SOUND POWER MEASUREMENT ACCORDING TO ISO9614 STANDARD
CHAPTER 10 - OBTAINING THE DESIRED GRADE OF ACCURACY : ISO9614 PAGE 81
10.2. Sound power measurements
As seen in chapter 3, the uncertainty on the sound power determination according to ISO9614 is definedby the grade of accuracy (Survey, Engineering or Precision for the discrete point method).
The main interest of the standard ISO 9614 part 1 and part 2 is therefore to accurately measure thesound power of a source.
& Schemes for procedures for achieving the desired grade of accuracy and the actions to increasethe grade of accuracy are available in the Annex B of ISO 9614 part 1 (respectively Figure B1 andTable B3), and in the Annex B of ISO 9614 part 2 (respectively Figure B1 and Table B1).
& They also are available in chapter 3.
10.2.1. Procedures to improve criterion 1 of the standard (Ld > F2)
If the surface pressure intensity field indicator F2 is greater or equal to the dynamic capability index ofthe intensity meter, sound power measurements have to be performed again in different conditions:
$ Reduce the average distance of measurement surface from source to a minimum average valueof 0.25m in presence of significant extraneous source or reverberation.
$ Increase the average distance of measurement surface from up to 1m if no significantextraneous source or reverberation is present.
10.2.2. Procedures to improve criterion 2 of the standard (ISO9614 part 1 only)
Criterion 2 of ISO9614 part 1 standard (N > CF42), the discrete points' method, can be improved byincreasing the density of the measurement positions called 'hot spots', that is the mesh surfaces forwhich the criterion is not fulfilled at given frequency bands.
10.2.2.1. Find hot spots
' Perform sound power measurements has described in chapter 8.3.)
( Open a global result display window (or global listing window) and display Criterion 2 for all themeasurement frequencies, according to the desired grade of accuracy. Take into account all measuredpoints for the calculation and display the non-conformity bar. Note in which frequency bands the criterionis not fulfilled.
) Open a graphical plot of the results per point (or a listing per point) and display the sound powerspectrum for all the measurement positions. Synchronise the cursors and increase the size of thewindow if you do not see the cursors' values.
* Place the cursors on the first frequency band that does not fulfil the criterion and note which graphicspresent the highest sound power level in the band.
+ Identify on the mesh the points corresponding to these graphics (they are the hot spots). To do souse the co-ordinates of the point displayed on each graphic.
, Repeat this operation for all the frequency bands that do not fulfil the criterion.

01DB APPLICATION NOTE: SOUND POWER MEASUREMENT ACCORDING TO ISO9614 STANDARD
CHAPTER 10 - OBTAINING THE DESIRED GRADE OF ACCURACY : ISO9614 PAGE 82
10.2.2.2. Increase the density of measurement positions for the hot spots
Now that you have identified which surfaces of the mesh require complementary measurements, youneed to sub-divide the mesh for these surfaces.
' Use the command Results / Mesh modification.
Select with the mouse the mesh points tosub-divide or use the automatic selectionkeys.
The option "Non measured points "allows the user to take into account duringthe automatic selection only themeasurement positions that have not yetbeen measured.
( Once the points have been selected, press on the key Factor.
Determine here the sub-division factors according to two axes for each point.
) You may now perform the measurements for each new point after selecting an acquisition order(automatic selection is not possible anymore).

01DB APPLICATION NOTE: SOUND POWER MEASUREMENT ACCORDING TO ISO9614 STANDARD
CHAPTER 10 - OBTAINING THE DESIRED GRADE OF ACCURACY : ISO9614 PAGE 83
10.3. Example of measurement using the actions to improve the grade of accuracy
10.3.1. Problematic
The following example deals with sound power measurement of a printer. During a first measurementsession, we tried to perform the measurements according to the scanning method (ISO9614 part 2) bysweeping the probe on the surfaces of a parallelepipedic mesh.
We did not obtain very good results because the measurement repeatability was impossible to obtain.Indeed, as the acoustic field of the printer varies greatly during a printing cycle and the position of theprobe in the sound field also varies during the scan, it was pretty much impossible to exactly repeat ameasurement.
The graphical plot below shows conformity results for these first measurement results:
We see that criterion 3 (repeatability) is not fulfilled for all the mesh surfaces. We therefore used thediscrete points' method (ISO9614 part 1) to determine the sound power level of the printer.
A first measurement made with the default parallelepipedic mesh given by the software gave poorresults. Most of the measurement locations were not placed in front of the printer. We therefore carriedanother measurement session with a mesh more adapted to the layout of the printer. The definedmeasurement surface is shown below:

01DB APPLICATION NOTE: SOUND POWER MEASUREMENT ACCORDING TO ISO9614 STANDARD
CHAPTER 10 - OBTAINING THE DESIRED GRADE OF ACCURACY : ISO9614 PAGE 84
10.3.2. Improving Stationarity criterion (F1 indicator)
Sound power determination of a printer is a good example to illustrate how to find an appropriateaveraging time to obtain a stationary sound field: the printing cycle of a page consists of different stages.Each one generates a different noise: warm up, sheet capture, inking, noise of the rollers, form feed. It istherefore impossible to correctly measure the printer 'sound power level is the averaging time (ormeasurement duration) does not cover a complete printing cycle.
We therefore timed the printing cycle, and then used this duration as the measurement averaging time(156 averages, 50 seconds). We did not use the chained acquisition option (measurement configurationcommand) because it was required to print a page for each stationarity measurement.
The F1 indicator spectrum thereby obtained fulfilled the requirements of the standard:
10.3.3. Improving criterion 2
The criterion 2 spectrum shows that the third-octave bands' values of centre frequencies ranging from 50Hz to 125 Hz and 1,6 kHz do not fulfil the standard requirements:

01DB APPLICATION NOTE: SOUND POWER MEASUREMENT ACCORDING TO ISO9614 STANDARD
CHAPTER 10 - OBTAINING THE DESIRED GRADE OF ACCURACY : ISO9614 PAGE 85
$ Let first check if we can exclude some frequency bands from the results' calculations:
Frequencies (Hz) 50 63 80 100 125 1600Level (dBA) 16 17.6 8.9 9.8 17.1 47
$ The highest sound power band level is the band centred on 1,25 kHz with 53,3 dB, that is 53.9dB(A).
$ If we sum the sound energy for all the above frequency bands, we obtain:
Lwtot1 = 10.log (101,6 + 101,76 + 100,89 + 100,98 + 100,171 + 104,7) = 47 dB(A)
These bands can therefore be neglected because they are inferior by 10 dB to the highest A-weightedsound power band level, calculated previously.
$ However, let perform the same calculation without the frequency band centred on 1600Hz, weobtain:
Lwtot1 = 10.log (101,6 + 101,76 + 100,89 + 100,98 + 100,171) = 20,7 dB(A)
We will therefore neglect the frequency bands ranging from 50 Hz to 125 Hz without any doubt but wewill try to improve the result obtained at 1600 Hz.
$ Let display point by point graphics, with synchronised cursors located on the frequency band centredon 1 600 Hz :
$ We now locate the graphics for which the 1.6 kHz band level is the greatest. There are the plots 1and 2 of the first line, of value 47.3 dB and 51.4 dB respectively.
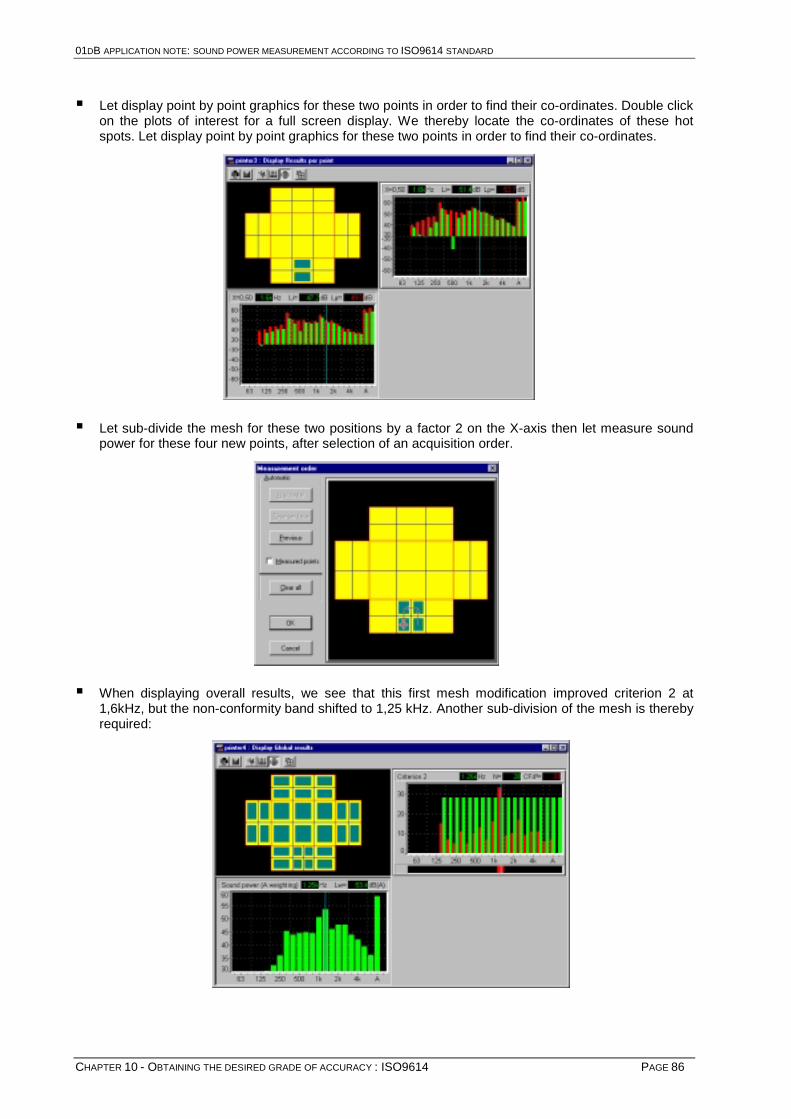
01DB APPLICATION NOTE: SOUND POWER MEASUREMENT ACCORDING TO ISO9614 STANDARD
CHAPTER 10 - OBTAINING THE DESIRED GRADE OF ACCURACY : ISO9614 PAGE 86
$ Let display point by point graphics for these two points in order to find their co-ordinates. Double clickon the plots of interest for a full screen display. We thereby locate the co-ordinates of these hotspots. Let display point by point graphics for these two points in order to find their co-ordinates.
$ Let sub-divide the mesh for these two positions by a factor 2 on the X-axis then let measure soundpower for these four new points, after selection of an acquisition order.
$ When displaying overall results, we see that this first mesh modification improved criterion 2 at1,6kHz, but the non-conformity band shifted to 1,25 kHz. Another sub-division of the mesh is therebyrequired:
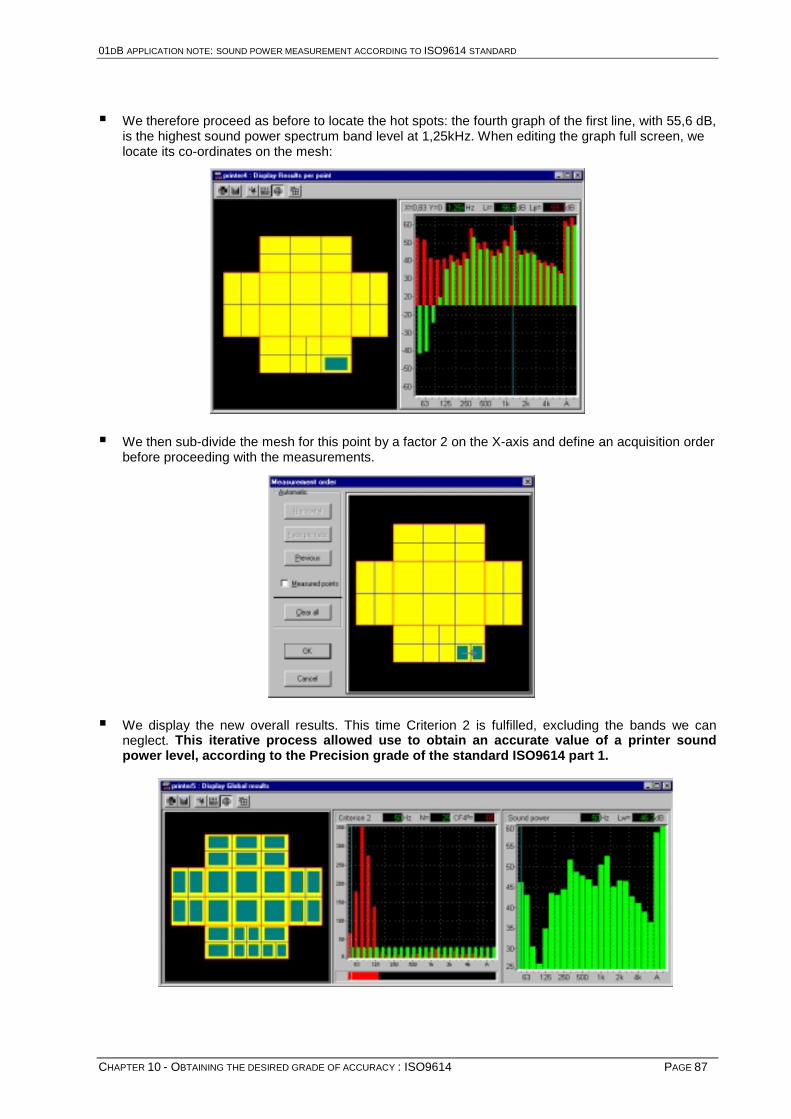
01DB APPLICATION NOTE: SOUND POWER MEASUREMENT ACCORDING TO ISO9614 STANDARD
CHAPTER 10 - OBTAINING THE DESIRED GRADE OF ACCURACY : ISO9614 PAGE 87
$ We therefore proceed as before to locate the hot spots: the fourth graph of the first line, with 55,6 dB,is the highest sound power spectrum band level at 1,25kHz. When editing the graph full screen, welocate its co-ordinates on the mesh:
$ We then sub-divide the mesh for this point by a factor 2 on the X-axis and define an acquisition orderbefore proceeding with the measurements.
$ We display the new overall results. This time Criterion 2 is fulfilled, excluding the bands we canneglect. This iterative process allowed use to obtain an accurate value of a printer soundpower level, according to the Precision grade of the standard ISO9614 part 1.


01DB APPLICATION NOTE: SOUND POWER MEASUREMENT ACCORDING TO ISO9614 STANDARD
CHAPTER 11- RESULT EXPLOITATION PAGE 89
11. RESULT EXPLOITATION
11.1. Exporting data to a spreadsheet or word processor
The user may either export results as graphics (time history plots and results listings) by the commandEdit / copy / Image or export the results as values by the command Edit / Copy / Values. After the copycommand of dBFA32, simply paste (Edit / Paste) the data in a word processor or a spreadsheetprocessor as shown below:
Copy Values Copy Image

01DB APPLICATION NOTE: SOUND POWER MEASUREMENT ACCORDING TO ISO9614 STANDARD
CHAPTER 11- RESULT EXPLOITATION PAGE 90
11.2. Principle and configuration of the Copy command
The copy command may be configured to work in different ways in dBBATI32. Use the commandPreferences / Copy to define how the copy command will work. The following dialog box appears onscreen.
By default, for all graphical views, the command Edit / Copy can be used to copy the image of thegraphical view. The data values cannot be copied.
$ Copy of tables of resultsIn some cases, for a table of results mainly, it is possible to copyeither an image of the table or the data values of the table at theASCII format.
The default option Be prompted for the type of copy each timeallows the user to display a dialog box for choosing to copy eitherthe image or the values of the table of results.
The option Copy the values only canbe used to copy directly the data values.The option Copy the image only canbe used to directly copy the image ofthe table.
$ Copy of an item when a study zone has been definedFor items where a study zone can be defined (an audio signal forexample), it is possible to copy the image of the view over thecomplete duration of the item (option Copy the whole) or to copyonly the image of the view over the defined study zone (Copy onlythe study zone).
The default option Be prompted for the type of copy each time allows the user to display a messageto either copy the image of the view over the complete duration or the study zone. The followingmessage appears on screen:
$ Copy data items at ASCII formatWhen copying directly data items from the measurement session window at ASCII format, an additionalparameter is the way it will be pasted in a word or spreadsheet processor.
The data values can be displayed vertically (default value) : data of X-axis and Y-axis are displayed incolumns. Alternatively, they can be displayed horizontally : data of X-axis and Y-axis are displayed inlines.
11.3. Printing results
Using the commands of the File menu, results can be directly printed by dBFA32, if a printer isconnected to the computer. Use the command File / Print to display the Print dialog box.

01DB APPLICATION NOTE: SOUND POWER MEASUREMENT ACCORDING TO ISO9614 STANDARD
CHAPTER 12 - BIBLIOGRAPHY PAGE 91
12. BIBLIOGRAPHY
12.1. Pre- acoustic intensity measurement
1 H.F. OLSONField-Type Acoustic WattmeterJ. Audio Eng. Soc., 22 (5), 1974, pp 321-327
2 C.W CLAPP et F.A. FIRESTONE The Acoustic Wattmeter, an Instrument for Measuring Sound Energy FlowJ. Acoust. Soc. Am., 13, 1941, pp 124-136.
3 S. BAKERAn Acoustic Intensity MeterJ. Acoust. Sic. Am., 27 (2), 1955, pp 269-273
4 T.J. SHULTZAcoustic WattmeterJ. Acoust. Soc. Am., 28 (4), 1956, pp 693-699.
5 J.F. BURGER, C.J.J. Van der MERWE, B.G. YAN ZYL et L. JOFFEMeasurement of sound intensity applied to the determination of radiated sound power.J. Acoust. Soc. Am., 53 (4), 1973, pp 1167-1168.
12.2. Recent development of the two microphone method
12.2.1. Principle and general themes
6 G. PAVICMeasurement of sound intensityJ. Sound Vib., 51 (4), 1977, pp 533-545
7 F.J. FAHYA Technique for Measuring Sound Intensity with a Sound Level Meter Noise ControlEngineering, 9 (3), 1977, pp 155-162.
8 J.M. LAMBERT et A. BADIE-CASSAGNETLa mesure directe de l'intensité acoustique ; application à la détermination de la puissanceacoustique des machines en environnement industriel.CETIM-Informations n°53, 1977, pp 78-91
9 F.J. FAHYMeasurements of acoustic intensity using the cross-spectral density of the two microphonessignals.J. Acoust. Soc. Am., 62 (4), 1977 pp 1057-1059.
10 H.P. LAMBRICH et W.A. STAHELA sound intensity meter and its applications in car acoustics. Inter Noise 77 Proceedin, Zurich,1-3 March 1977, pp 142-147.
11 J.Y. CHUNGCross-Spectral method of measuring acoustic intensity without error caused by instrumentphase mismatch.J. Acoust. Soc. Am., 64 (6), 1978, pp 1613-1616.
12 Recueil des conférences du "Congrès International sur les Progrès Récents dans la Mesure del'Intensité Acoustique", Senlis (France) 30 Sept.-2 Oct. 1981, (40 articles).

01DB APPLICATION NOTE: SOUND POWER MEASUREMENT ACCORDING TO ISO9614 STANDARD
CHAPTER 12 - BIBLIOGRAPHY PAGE 92
13 G. RASMUSSEN (GRAS) et A. ROZWADOWSKI (01dB)ISO9614 : From high quality probe through to softwareEuronoise95, Vol. 3, pp 933-937
14 G.RASMUSSEN (GRAS)Internoise 94,
12.2.2. Particular aspects
15 J.C. PASCALDétermination de la puissance acoustique des machines de grandes dimensionsThèses Docteur-Ingénieur, Université de Paris-VI, 1980
16 A.F. SEYBERTStatistical errors in Acoustic intensity measurementsJ. Sound Vib., 75 (4), 1981, pp 519-526.
12.2.3. Applications
17 A. BADIE-CASSAGNET, M. BOCKHOFF, J.M. LAMBERT et J. TOURRET. La mesure directede l'intensité acoustique : son intérêt pour la détermination de la puissance acoustique deséquipements industriels sur site.Rev. Acoust., 54, 1980, pp 190-194.
18 J.C. PASCAL et G. SALVANDiscrimination du rayonnement acoustique d'une vanne sur un circuit de vapeur.Tenth International Congress on Acoustics, Sydney,6-16 July 1981, C1-5.1.
12.2.4. Standards
19 ISO 9614-1 standard : Acoustics: Determination of sound power levels of noise sources usingsound intensity – Part 1 : Measurement at discrete points
20 ISO 9614-2 standard : Acoustics: Determination of sound power levels of noise sources usingsound intensity – Part 2 : Measurement by scanning
21 IEC 1043 standard: Instruments for the measurement of sound intensity – Instruments whichmeasure intensity with pairs of pressure sensing microphones
Related Documents