Sound frequency representation in cat auditory cortex Vassiliy Tsytsarev, 1 Tadashi Yamazaki, Je ´ro ˆme Ribot, and Shigeru Tanaka * Laboratory for Visual Neurocomputing, RIKEN Brain Science Institute, Wako, Saitama 351-0198, Japan Received 23 December 2003; revised 24 May 2004; accepted 18 August 2004 Using the intrinsic signal optical recording technique, we reconstructed the two-dimensional pattern of stimulus-evoked neuronal activities in the auditory cortex of anesthetized and paralyzed cats. The average magnitude of intrinsic signal in response to a pure tone stimulus increased steadily as the sound pressure level increased. A detailed analysis demonstrated that the evoked signals at early frames were scaled by the sound pressure level, which in turn indicated the presence of a minimum level of sound pressure beyond which stimulus-related intrinsic signal can be generated. Intrinsic signals evoked significantly by pure tone stimuli of different frequencies were localized and arranged in an orderly manner in the middle ectosylvian gyrus, which indicates that the primary auditory field (AI) is tonotopically organized. The arrangement of optimal frequencies obtained from optical recordings of the same auditory cortex, which were conducted on different days, was highly reproducible. Furthermore, other auditory fields surrounding AI in the recorded area were allocated based on the observed tonotopicity. We also conducted unit recordings on the cats used for optical recording with the same set of acoustic stimuli. The gross feature of the arrangement of optimal frequencies determined by unit recordings agreed with the tonotopic arrangement determined by the optical recording, although the precise agreement was not obtained. D 2004 Elsevier Inc. All rights reserved. Keywords: Optical recording; Intrinsic signal; Auditory cortex; Tonotopy; Cat; In vivo Introduction Elucidating the structure of cortical maps is important to obtain a better understanding of the neural substrate for information representation and processing in the cerebral cortex. It is widely accepted that the mammalian sensory cortices contain the maps whose topography mirrors the physical arrangement of sensory inputs in the body. The somatosensory cortex contains a map of the body (Mountcastle, 1957), the visual cortex a topographically arranged map of the visual space (Talbot, 1940), and the auditory cortex a map of sound frequencies (Woolsey and Walzl, 1942). In the last decade, the technique of optical recording of intrinsic signals has developed rapidly, thus enabling the visualization of various cortical maps (Bonhoeffer and Grinvald, 1991; Ts’o et al., 1990). The intrinsic signal optical recording technique, which detects small changes in the reflected light intensity caused by neuronal activities in the brain tissue, has been proven to be useful for visualizing particularly the tangential organization of orienta- tion and ocular dominance columns in the visual cortex with a high spatial resolution (Bonhoeffer and Grinvald, 1991; Ts’o et al., 1990). Recent studies using optical recording of intrinsic signals have revealed the presence of tonotopic maps in the auditory cortex of guinea pigs (Bakin et al., 1996), rats (Bakin et al., 1996; Tsytsarev and Tanaka, 2002), chinchillas (Harel et al., 2000), cats (Dinse et al., 1997; Spitzer et al., 2001), and ferrets (Versnel et al., 2002). Spitzer et al. (2001) have shown the tendency of optimal frequency shift: low frequencies are represented caudally and high frequencies rostrally in the cat primary auditory field (AI). Harel et al. (2000) have visualized tonotopic maps not only in AI but also in anterior auditory field (AAF) and the secondary auditory field (AII) in the auditory cortex of chinchillas. In the present study, we conducted intrinsic signal optical recording on the cat auditory cortex to examine how far the stimulus-related signal is reliable for the investigation of tonotopic organization. It was found that the evoked signals were scaled by the sound pressure level. The presence of the minimum sound pressure level at approximately 20 dB SPL, beyond which stimulus- related intrinsic signals are generated, is consistent with the average minimum sound pressure level for neuronal spike generation in unit recordings (Mendelson et al., 1997; Sutter and Schreiner, 1995). It was demonstrated that optimal frequencies were systematically arranged in the middle ectosylvian gyrus. The optimal frequency maps were almost identical between two recordings in the same auditory cortex conducted with a 4-day interval. The systematic behavior of stimulus-related intrinsic signal such as the scaling property and map reproducibility guarantee the reliability of our optical recording. On the basis of the tonotopic representation obtained from the optical recordings, we identified interareal 1053-8119/$ - see front matter D 2004 Elsevier Inc. All rights reserved. doi:10.1016/j.neuroimage.2004.08.021 * Corresponding author. Laboratory for Visual Neurocomputing, RIKEN Brain Science Institute, 2-1 Hirosawa, Wako, Saitama 351-0198, Japan. Fax: +81 48 467 9685. E-mail address: [email protected] (S. Tanaka). 1 Current address: Human Brain Research Center, Kyoto University School of Medicine, 54 Shogoin Kawahara-cho, Sakyo-ku, Kyoto 606- 8507, Japan. Available online on ScienceDirect (www.sciencedirect.com.) www.elsevier.com/locate/ynimg NeuroImage 23 (2004) 1246 – 1255

Welcome message from author
This document is posted to help you gain knowledge. Please leave a comment to let me know what you think about it! Share it to your friends and learn new things together.
Transcript

www.elsevier.com/locate/ynimg
NeuroImage 23 (2004) 1246–1255
Sound frequency representation in cat auditory cortex
Vassiliy Tsytsarev,1 Tadashi Yamazaki, Jerome Ribot, and Shigeru Tanaka*
Laboratory for Visual Neurocomputing, RIKEN Brain Science Institute, Wako, Saitama 351-0198, Japan
Received 23 December 2003; revised 24 May 2004; accepted 18 August 2004
Using the intrinsic signal optical recording technique, we reconstructed
the two-dimensional pattern of stimulus-evoked neuronal activities in
the auditory cortex of anesthetized and paralyzed cats. The average
magnitude of intrinsic signal in response to a pure tone stimulus
increased steadily as the sound pressure level increased. A detailed
analysis demonstrated that the evoked signals at early frames were
scaled by the sound pressure level, which in turn indicated the presence
of a minimum level of sound pressure beyond which stimulus-related
intrinsic signal can be generated. Intrinsic signals evoked significantly
by pure tone stimuli of different frequencies were localized and
arranged in an orderly manner in the middle ectosylvian gyrus, which
indicates that the primary auditory field (AI) is tonotopically
organized. The arrangement of optimal frequencies obtained from
optical recordings of the same auditory cortex, which were conducted
on different days, was highly reproducible. Furthermore, other
auditory fields surrounding AI in the recorded area were allocated
based on the observed tonotopicity. We also conducted unit recordings
on the cats used for optical recording with the same set of acoustic
stimuli. The gross feature of the arrangement of optimal frequencies
determined by unit recordings agreed with the tonotopic arrangement
determined by the optical recording, although the precise agreement
was not obtained.
D 2004 Elsevier Inc. All rights reserved.
Keywords: Optical recording; Intrinsic signal; Auditory cortex; Tonotopy;
Cat; In vivo
Introduction
Elucidating the structure of cortical maps is important to obtain
a better understanding of the neural substrate for information
representation and processing in the cerebral cortex. It is widely
accepted that the mammalian sensory cortices contain the maps
1053-8119/$ - see front matter D 2004 Elsevier Inc. All rights reserved.
doi:10.1016/j.neuroimage.2004.08.021
* Corresponding author. Laboratory for Visual Neurocomputing,
RIKEN Brain Science Institute, 2-1 Hirosawa, Wako, Saitama 351-0198,
Japan. Fax: +81 48 467 9685.
E-mail address: [email protected] (S. Tanaka).1 Current address: Human Brain Research Center, Kyoto University
School of Medicine, 54 Shogoin Kawahara-cho, Sakyo-ku, Kyoto 606-
8507, Japan.
Available online on ScienceDirect (www.sciencedirect.com.)
whose topography mirrors the physical arrangement of sensory
inputs in the body. The somatosensory cortex contains a map of the
body (Mountcastle, 1957), the visual cortex a topographically
arranged map of the visual space (Talbot, 1940), and the auditory
cortex a map of sound frequencies (Woolsey and Walzl, 1942). In
the last decade, the technique of optical recording of intrinsic
signals has developed rapidly, thus enabling the visualization of
various cortical maps (Bonhoeffer and Grinvald, 1991; Ts’o et al.,
1990). The intrinsic signal optical recording technique, which
detects small changes in the reflected light intensity caused by
neuronal activities in the brain tissue, has been proven to be useful
for visualizing particularly the tangential organization of orienta-
tion and ocular dominance columns in the visual cortex with a high
spatial resolution (Bonhoeffer and Grinvald, 1991; Ts’o et al.,
1990). Recent studies using optical recording of intrinsic signals
have revealed the presence of tonotopic maps in the auditory cortex
of guinea pigs (Bakin et al., 1996), rats (Bakin et al., 1996;
Tsytsarev and Tanaka, 2002), chinchillas (Harel et al., 2000), cats
(Dinse et al., 1997; Spitzer et al., 2001), and ferrets (Versnel et al.,
2002). Spitzer et al. (2001) have shown the tendency of optimal
frequency shift: low frequencies are represented caudally and high
frequencies rostrally in the cat primary auditory field (AI). Harel et
al. (2000) have visualized tonotopic maps not only in AI but also in
anterior auditory field (AAF) and the secondary auditory field
(AII) in the auditory cortex of chinchillas.
In the present study, we conducted intrinsic signal optical
recording on the cat auditory cortex to examine how far the
stimulus-related signal is reliable for the investigation of tonotopic
organization. It was found that the evoked signals were scaled by
the sound pressure level. The presence of the minimum sound
pressure level at approximately 20 dB SPL, beyond which stimulus-
related intrinsic signals are generated, is consistent with the average
minimum sound pressure level for neuronal spike generation in unit
recordings (Mendelson et al., 1997; Sutter and Schreiner, 1995). It
was demonstrated that optimal frequencies were systematically
arranged in the middle ectosylvian gyrus. The optimal frequency
maps were almost identical between two recordings in the same
auditory cortex conducted with a 4-day interval. The systematic
behavior of stimulus-related intrinsic signal such as the scaling
property and map reproducibility guarantee the reliability of our
optical recording. On the basis of the tonotopic representation
obtained from the optical recordings, we identified interareal
V. Tsytsarev et al. / NeuroImage 23 (2004) 1246–1255 1247
borders among the AI, AAF, AII, and the dorsoposterior auditory
field (DP). Furthermore, unit recording experiments were con-
ducted using two cats in which tonotopic maps were optically
reconstructed. The arrangement of optimal frequencies roughly
agreed with the tonotopic arrangement obtained by the optical
recording, even if the agreement was not so excellent.
Methods
Preparation of animals
Experiments were conducted using four cats (cat ID: EH, EL,
EM, and EU) between 9 weeks and 12 months of age. The animals
(500–1500 g) were initially anesthetized with ketamine (15 mg/kg,
i.m.) and xylazine (2.5 mg/kg, i.m.). Intratracheal intubation was
performed and the animals were artificially ventilated with a 1:1
mixture of N2O/O2 containing 0.5–1.0% isoflurane. The electro-
cardiogram, end-tidal CO2, arterial oxygen saturation, and rectal
temperature were continuously monitored and maintained within
normal limits throughout the experiments. The animals were
paralyzed with pancuronium bromide (0.1 mg/kg/h, i.v.). The
initial surgery was performed preceding a series of optical
recording and electrophysiological recording. During the opera-
tion, a chamber made of dental cement was mounted on the skull
with anchoring stainless-steel screws, and the skull (about 8 � 12
mm2) located above the putative cortex was removed. A metal
holder for head fixation during the experiments was installed on
the cranium and fixed also with screws and dental cement. The
dura mater covering the recording area was removed. The interior
of the chamber was filled with 2% agar containing gentamicin
sulfate and dexamethasone sodium phosphate, and sealed with a
polyvinylidene chloride thin film to protect infection by virus and
bacteria. Finally, the chamber was covered with a plastic lid for the
protection of the cortex from mechanical damage. In optical
recording experiments, the lid, thin film, and agar were removed,
the chamber was filled again with fresh agar, and a cover glass was
placed on the agar surface before the solidification of the agar. In
the electrophysiological experiments, the cover glass was not used,
but a few drops of silicon oil were deposited on the agar surface to
prevent it from drying. At the end of the final session of recording,
the animals were sacrificed by an overdose injection with
nembutal. The animals were cared for in accordance with the
dGuiding Principles for the Care and Use of Animals in the Field of
Physiological ScienceT of the Japanese Physiological Society and
the dNIH Guide for the Care and Use of Laboratory AnimalsT.
Acoustic stimulation
Acoustic stimuli were generated digitally (SigGen and RPvds,
Tucker–Davis Technology, USA) and presented via earphones,
whose shape was designed for the external ears of cats. Acoustic
properties of the earphones were calibrated by a measuring
amplifier (ACO 6030, Japan) equipped with a capacitive micro-
phone (type 2124, ACO, Japan). Individual acoustic stimuli were
presented binaurally. Each stimulus was composed of five identical
pure tone peeps (10-ms cosine rise and fall, 100-ms duration, and
500-ms interpeep interval for intrinsic signal optical recording; 5-
ms cosine rise and fall, and 50-ms duration for unit recording). The
pure tones were of four frequencies: 5, 10, 15, and 20 kHz at a
sound pressure level of 40–60 dB SPL.
Intrinsic signal optical recording
The animal was firmly fixed by the headholder on a
vibroisolated table. Intrinsic signals were measured to visualize
functional maps around the AI area using standard techniques
(Bonhoeffer and Grinvald, 1996). The cortex was illuminated with
monochromatic light of 540-nm wavelength (Tsytsarev and
Tanaka, 2002; Versnel et al., 1998) using two fiber-optical light
guides to achieve uniform illumination of the cortical surface as
much as possible. The focal plane was adjusted at 500 Am below
the cortical surface using a tandem-lens microscope arrangement.
Images were obtained using a CCD camera (320 � 240 pixels) and
digitized using a differential video-enhancement system, Capos
(Tsunoda et al., 2001). Video images of the gyral surface between
the dorsal tips of the anterior ectosylvian and posterior ectosylvian
sulci were acquired in 15 frames; the duration of each frame was
660 ms. An optical imaging session began at least 3 h after the
induction of anesthesia and continued for 5–8 h. Acquisition of
intrinsic signals was synchronized with acoustic stimulus presen-
tation so that the stimulus onset was delayed by three frames (1980
ms) in each recording. The data acquisition period was followed by
a silent interval of 12 s. Optical recording experiments were
conducted twice at certain intervals for two cats examined.
In the data analysis, first of all, we subtracted the average signals
over the first three frames preceding the stimulus onset from the
recorded signals at each frame to extract stimulus-related intrinsic
signals. This procedure was applied to the recorded signals at each
trial. Next, we reconstructed intrinsic signals elicited in response to
each acoustic stimulus using the generalized indicator function
method, which can project the optical imaging data onto a subspace
of high signal-to-noise ratios (Yokoo et al., 2001).
Electrophysiological recording
Electrophysiological recording was performed on the two cats
(EM and EU) 5–10 days after the final recording of intrinsic
signals. A reference image of the cortical surface collected under
the illumination of light with 540-nm wavelength was used for
guiding electrode penetration and for the subsequent alignment of
optical and electrophysiological data. After removing the glass
cover, a tungsten microelectrode (about 3.0 MV impedance at 1
kHz) attached to a stepping motor microdrive (PC-5N, Narishige,
Japan) was introduced perpendicularly to the cortical surface. In
most cases, the recording depth ranged from 300 to 700 Am below
the cortical surface. For each recording site, the sound pressure
level was determined to be that at which a click tone could evoke
minimum spike activities. A single peep of pure tone at the sound
pressure level ranging from 40 to 50 dB SPL was presented to each
animal 50 times with 3-s interstimulus intervals. The same set of
pure tone stimuli was used as in optical imaging. Response signals
were amplified (�10000 gain), filtered using a 0.3–3.0 kHz band-
pass filter, and then fed to a window discriminator to construct
raster displays and peristimulus time histograms.
Results
Dependence on sound pressure level
Intrinsic signals evoked by a pure tone stimulus of 10 kHz at
four different sound pressure levels (40, 50, 55, and 60 dB SPL)

V. Tsytsarev et al. / NeuroImage 23 (2004) 1246–12551248
were recorded using cat EH. Fig. 1a shows the spatial patterns of
the signals at the 5th frame for the four sound pressure levels. We
observed steady increase of the magnitude of intrinsic signal
evoked by the pure tone stimulus with the increase of the sound
pressure level. Comparison between the stimulations at 55 and 60
dB SPL showed similar basic structure of active domains. This
indicates that the locations of the cores of activated domains did
not change, whereas the magnitudes of the signals differ at
different sound pressure levels.
Particularly, inside the cortical region delimited by the dotted
square, we examined at different sound pressure levels the number
of pixels whose intrinsic signal is stronger than a given control
threshold T. These numbers N plotted for different sound pressure
levels S decreased monotonically as control threshold T increased,
as shown in Fig. 1b. When the sound pressure level increased, the
plotted curve extended to larger T. Next, we plotted the control
thresholds TN that gave N = 500, 1000, 2000, 3000, and 4000 for
different sound pressure levels S = 40, 50, 55, and 60 dB SPL, as
shown in Fig. 1c. The TN for each N depended linearly on the
sound pressure levels, and all the regression lines crossed the
horizontal axis at approximately Smin = 21.5 dB SPL. This analysis
reveals that the relation TN = a(S � Smin) holds, which indicates
that only the slope a depends on N. Inversely, N is uniquely
determined by a. This means that plotting N against T/(S � Smin)
for different sound pressure levels should yield a single curve
irrespective of S, as shown in Fig. 1d. Therefore, intrinsic signals
have a scaling property at least in a local domain exhibiting
significant responses and monotonic behavior for the sound
pressure level. This scaling property suggests that when conducting
optical recording at a single sound pressure level, we can obtain a
sufficient amount of information on activity patterns at least inside
monotonic domains (Sutter and Schreiner, 1995). Accordingly, in
Fig. 1. Dependence of stimulus-related intrinsic signals in response to 15-kHz aco
maps for different sound pressure levels, 40, 50, 55, and 60 dB SPL. The region in
as the sound pressure level increased. (b) Number of pixels that elicited stimulu
against the signal strength for four sound pressure levels. (c) The signal strength b
level. (d) Figure b was replotted against the scaled control threshold.
the present study, the sound pressure level was set at 60 dB SPL for
all other optical recordings.
From the scaling property, we obtained another important
feature: the presence of a minimum sound pressure level around
Smin = 21.5 dB SPL, beyond which stimulus-related intrinsic signal
was elicited. Even if we really changed the sound pressure level
from 0 to 40 dB SPL, we could not have seen clearly the onset of
signal response, because of unreliably weak stimulus-related
intrinsic signal below 40 dB SPL. Instead, utilizing the scaling
property obtained from the reliable signals between 40 and 60 dB
SPL, we could successfully determine the minimum sound
pressure level by extrapolating the regression lines of TN vs. S
beyond the range that we used for recording. Thus determined
minimum sound pressure level is close to the average threshold of
the sound pressure level for the generation of spike activities in the
unit recordings (Mendelson et al., 1997; Sutter and Schreiner,
1995). The existence of the common minimum sound pressure
level implies that the intrinsic signals at very early frames are
correlated with neuronal spike activities.
Intrinsic signals in response to different frequencies
Fig. 3 shows the temporal evolution of the spatial pattern of
intrinsic signals evoked by pure tone stimuli of four frequencies (5,
10, 15, and 20 kHz) at six frames (4th, 6th, 8th, 10th, 12th, and
14th frames), where the data were acquired in the first optical
recording of cat EL. For all the stimulus frequencies, localized
activities increased steadily from the 4th to 10th frames and then
decreased. The activated domains appeared as spots of irregular
shape and not necessarily as strips that might be expected from
isofrequency bands obtained by the conventional electrophysio-
logical mapping. It is likely that the evoked signals expand and
ustic frequency on the sound pressure level for cat EH. (a) Single-condition
side the dotted square shows that stimulus-related intrinsic signals increased
s-related intrinsic signals stronger than a given signal strength was plotted
eyond which N pixels were activated was plotted against the sound pressure
V. Tsytsarev et al. / NeuroImage 23 (2004) 1246–1255 1249
shrink without changing the locations of the cores of activated
domains.
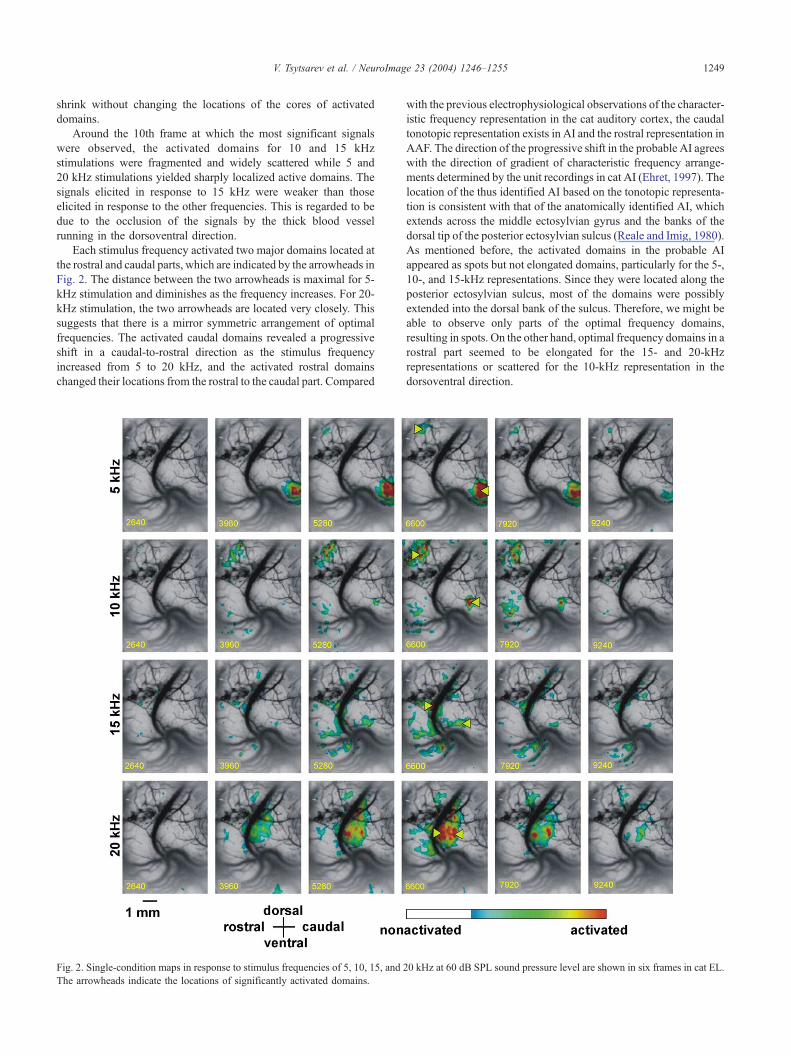
Around the 10th frame at which the most significant signals
were observed, the activated domains for 10 and 15 kHz
stimulations were fragmented and widely scattered while 5 and
20 kHz stimulations yielded sharply localized active domains. The
signals elicited in response to 15 kHz were weaker than those
elicited in response to the other frequencies. This is regarded to be
due to the occlusion of the signals by the thick blood vessel
running in the dorsoventral direction.
Each stimulus frequency activated two major domains located at
the rostral and caudal parts, which are indicated by the arrowheads in
Fig. 2. The distance between the two arrowheads is maximal for 5-
kHz stimulation and diminishes as the frequency increases. For 20-
kHz stimulation, the two arrowheads are located very closely. This
suggests that there is a mirror symmetric arrangement of optimal
frequencies. The activated caudal domains revealed a progressive
shift in a caudal-to-rostral direction as the stimulus frequency
increased from 5 to 20 kHz, and the activated rostral domains
changed their locations from the rostral to the caudal part. Compared
Fig. 2. Single-condition maps in response to stimulus frequencies of 5, 10, 15, and 2
The arrowheads indicate the locations of significantly activated domains.
with the previous electrophysiological observations of the character-
istic frequency representation in the cat auditory cortex, the caudal
tonotopic representation exists in AI and the rostral representation in
AAF. The direction of the progressive shift in the probable AI agrees
with the direction of gradient of characteristic frequency arrange-
ments determined by the unit recordings in cat AI (Ehret, 1997). The
location of the thus identified AI based on the tonotopic representa-
tion is consistent with that of the anatomically identified AI, which
extends across the middle ectosylvian gyrus and the banks of the
dorsal tip of the posterior ectosylvian sulcus (Reale and Imig, 1980).
As mentioned before, the activated domains in the probable AI
appeared as spots but not elongated domains, particularly for the 5-,
10-, and 15-kHz representations. Since they were located along the
posterior ectosylvian sulcus, most of the domains were possibly
extended into the dorsal bank of the sulcus. Therefore, we might be
able to observe only parts of the optimal frequency domains,
resulting in spots. On the other hand, optimal frequency domains in a
rostral part seemed to be elongated for the 15- and 20-kHz
representations or scattered for the 10-kHz representation in the
dorsoventral direction.
0 kHz at 60 dB SPL sound pressure level are shown in six frames in cat EL.

V. Tsytsarev et al. / NeuroImage 23 (2004) 1246–12551250
Time courses of intrinsic signals
Fig. 3 depicts the time courses of the number of pixels activated
stronger than given signal strengths for individual stimulus
frequencies inside the ROI. The signal strengths for thresholding
were given as one, two, and three times the standard deviation of
the evoked signals for each stimulus frequency as shown in Figs.
Fig. 3. Time courses of the number of pixels at which stimulus-related
intrinsic signals were stronger than three different thresholds for the four
stimulus frequencies. The thresholds of intrinsic signals in a, b, and c were
given by SD, 2SD, and 3SD of signals over the ROI for the first recording
(SD: standard deviation). The timings of stimulation of pure tone peeps are
indicated by the gray short vertical line segments.
4a,b, and c, respectively. In Fig. 3a, evoked signals emerged at the
4th frame immediately after the stimulus onset. Even after the
stimulus offset in the middle of the 7th frame, the signal strengths
still built up steadily to reach maxima around the 10th to 11th
frames (2.6–3.3 s after the stimulus offset), and then the signal
strengths decreased. For higher signal strengths for thresholding,
however, the number of pixels tended to decrease and be more
sharply localized around the 10th frame. For 10- and 15-kHz
frequency stimulation, the number of activated pixels markedly
decreased as the signal strength for thresholding increased. This is
consistent with the observation that the activated domains were
rather scattered for 10- and 15-kHz stimulation, while the activated
domains were closely localized for 5- and 20-kHz stimulation.
Organization of optimal frequency domains
When we define a stimulus frequency that evoked the
maximum strength of intrinsic signal to be an optimal frequency
at each pixel, we can draw the optimal frequency maps as
illustrated in Fig. 4 according to the color code shown below the
figure. The map in Fig. 4a was obtained from the first optical
recording of cat EL. We can find the above-mentioned progressive
shift of optimal frequency domains as the frequency changes from
low to high.
Such a progressive shift can also be seen in the matrix of
correlation coefficients shown in Table 1, where the correlation
coefficient c( f1, f2) between two frequencies f1 and f2 is defined by
the normalized overlap integral of stimulus-related intrinsic signal
strengths:
c f1; f2ð Þ ¼RROI
s xY; f1ð Þs xY; f2ð ÞdxYffiffiffiffiffiffiffiffiffiffiffiffiffiffiffiffiffiffiffiffiffiffiffiffiffiffiffiffiffiffiffiffiffiffiffiffiRROI
s xY; f1ð Þ½ �2dxYq ffiffiffiffiffiffiffiffiffiffiffiffiffiffiffiffiffiffiffiffiffiffiffiffiffiffiffiffiffiffiffiffiffiffiffiffiR
ROIs xY; f2ð Þ½ �2dxY
q ð1Þ
Here, s xY; f1ð Þ represents the strength of stimulus-related intrinsic
signal at cortical position xY in response to frequency f1. The
diagonal elements of the correlation matrix are all unity because
they are the normalized overlaps between the identical stimulus
frequencies. As shown in Table 1, the correlation coefficients
decreased with the difference between two frequencies. This
indicates that domains activated by two frequencies were farther
separated as the difference between the frequencies increased. This
supports the visually observed progressive shift of the activated
domains with the stimulus frequency. Thus, part of the auditory
cortex of cat EL is tonotopically organized.
Map reproducibility in intrinsic signal optical recording
To confirm that we could successfully reconstruct tonotopic
maps by the optical recording, we examined the reproducibility of
the maps in the same cat between different recordings conducted
with a certain interexperimental interval. To this end, we compared
optimal frequency maps between the first and second recordings
conducted with a 4-day interval using cat EL. The optimal
frequency map shown in Fig. 4b was obtained from the second
optical recording conducted with a low magnification. The arrange-
ments of optimal frequencies were almost the same between the two
recordings (Figs. 4a,b). Fig. 4c is a montage composed of Figs.
4a,b: The map in Fig. 4a was superimposed on the map in Fig. 4b so
that the blood vessel images between the two figures coincided at
the border of the ROI for the first recording. The continuity in the

Fig. 4. Optimal frequency maps in a and b obtained from the first and second recordings of cat EL with a 5-day interexperimental interval, respectively. (c) Map
a was superimposed in map b so that the images of blood vessels were continuously connected at the edges of the ROI for the first recording.
V. Tsytsarev et al. / NeuroImage 23 (2004) 1246–1255 1251
optimal frequency representation seen in Fig. 4c supports the
reproducibility of the map in different optical recordings.
The coefficients of cross-correlations of intrinsic signals
between the two recordings were estimated using the normalized
overlap integrals between the two recordings:
ccross f1; f2ð Þ¼RROI
s1 xY; f1ð Þs2 xY; f2ð ÞdxYffiffiffiffiffiffiffiffiffiffiffiffiffiffiffiffiffiffiffiffiffiffiffiffiffiffiffiffiffiffiffiffiffiffiffiffiffiffiRROI
s1 xY; f1ð Þ½ �2dxYq ffiffiffiffiffiffiffiffiffiffiffiffiffiffiffiffiffiffiffiffiffiffiffiffiffiffiffiffiffiffiffiffiffiffiffiffiffiffiR
ROIs2 xY; f2ð Þ½ �2dxY
q : ð2Þ
Table 2 shows the symmetrized coefficients of cross-correlations
between the first and second recordings; that is, [ccross( f1, f2) +
ccross( f2, f1)]/2. The correlation coefficients in the diagonal
elements are about 0.5 and evidently larger than those in the off-
diagonal elements, whereas the coefficients decrease with the
difference between pairs of frequencies. The large values of the
diagonal elements and small values of the off-diagonal elements
substantiate the reliability of the recorded signals in response to
pure tone stimuli as well as biological plausibility of the tonotopic
map.
Different auditory fields
As found in Fig. 4c, different remote locations were activated by
a common acoustic frequency. Particularly, there were optimal
frequency domains for 15-kHz stimulation (green domains) both
rostrally and caudally to the optimal frequency domain for 20-kHz
stimulation (blue domain). This reveals the mirror symmetric
representation of acoustic frequencies, as pointed out in the
previous subsection. It has been reported that isofrequency domains
in AI and AAF appeared in a mirror-symmetric fashion (Reale and
Imig, 1980). Therefore, it is expected that the interareal border
between AI and AAF is located along the middle of the 20-kHz
optimal frequency domain parallel to the dorsoventral axis. There
was an ambiguous tonotopic representation in the region caudal to
the 5-kHz domain. According to the previous observations of
Table 1
Correlation matrix of tonotopic representation in the first recording, which
was obtained from the calculation based on Eq. (1) given in the text
5 kHz 10 kHz 15 kHz 20 kHz
5 kHz 1.0000 0.2576 0.1188 0.0497
10 kHz 1.0000 0.2477 0.1435
15 kHz 1.0000 0.6046
20 kHz 1.0000
characteristic frequencies in several auditory fields (Reale and Imig,
1980), the larger caudal region exhibiting ambiguous tonotopicity
may correspond to the dorsoposterior auditory field (DP).
We attempted to allocate several different auditory fields in the
two cats examined, which are shown in Fig. 5a for cat EL and Fig.
5b for EM. Fig. 5b again reveals that optimal frequency domains
are elongated or scattered along the dorsoventral axis. It has also
been revealed that the characteristic frequencies are inconsistent
across the interareal border between AI and DP (Reale and Imig,
1980). Therefore, in Fig. 5b for cat EM, the interareal border
between AI and DP was determined by the discontinuity in
frequency representation, across which the 5-kHz representation
(red) abruptly changed to the 15-kHz representation (green). As
seen in Figs. 5a,b, the location of interareal borders determined by
optical recording varies among individual cats. We could not detect
any significantly intense signals in the dorsal part of the probable
AI in cat EL. The area in which significantly intense signals could
not be detected may correspond to AII because neurons in AII are
broadly tuned and have relatively higher thresholds in the sound
pressure level (Schreiner and Cynader, 1984). In cat EM, we
accidentally removed the skull and dura mater covering the
suprasylvian gyrus (area 7). We could detect significant signals
in response to pure tone stimuli even in this area, which is regarded
to be outside the proper auditory fields (Fig. 5b). This unexpected
observation of intrinsic signals in response to pure tone stimuli
may corroborate the idea that area 7 works as an association cortex
integrating polysensory information (Thompson et al., 1963a,b).
Comparison with electrophysiological recordings
Extracellular unit recordings were also performed on two cats
(cats EM and EU) before the off-line analysis of recorded intrinsic
signals was conducted. Examples of electrophysiological responses
obtained from eight recording sites in cat EU are illustrated in Fig. 6.
Table 2
Cross-correlation matrix of tonotopic representations between the first and
second recordings, which was obtained from the calculation based on Eq.
(2) and the symmetrization procedure described in the text
5 kHz 10 kHz 15 kHz 20 kHz
5 kHz 0.5019 0.3702 0.1271 0.0354
10 kHz 0.5823 0.3548 0.1641
15 kHz 0.4616 0.4805
20 kHz 0.4854

Fig. 5. Hypothetical interareal borders are indicated by the dotted curves superimposed on the optical frequency maps for cat EL in a and for cat EM in b. The
sulci were indicated by solid curves. AI: primary auditory field; AAF: anterior auditory field; DP: dorsoposterior auditory field; SSS: suprasylvian sulcus; AES:
anterior ectosylvian sulcus; PES: posterior ectosylvian sulcus.
V. Tsytsarev et al. / NeuroImage 23 (2004) 1246–12551252
Spike activities were recorded by level triggering only at recording
sites where spikes of a unit could be clearly distinguished visually
using an oscilloscope. In practice, most of the recordings were
obtained at depths between 300 and 700 Am. First, the minimum
Fig. 6. Peristimulus time histogram of units recorded in the auditory cortex of cat
indicated by the hatched band in gray. Most of the units exhibited a single optimal
for h. Two units showed double optimal frequencies: 5 kHz and 10 kHz for c; an
sound pressure level for a click tone stimulus, beyond which spike
activities were elicited, was determined at each recording site. For
all subsequent recordings of responses to pure tone stimuli, we used
sound pressure levels higher than thus determined minimum sound
EU. The range of fluctuations in spontaneous spike activity of each unit is
frequency: 5 kHz for a and b; 10 kHz for e; 15 kHz for f and g; and 20 kHz
d 10 kHz and 15 kHz for d.
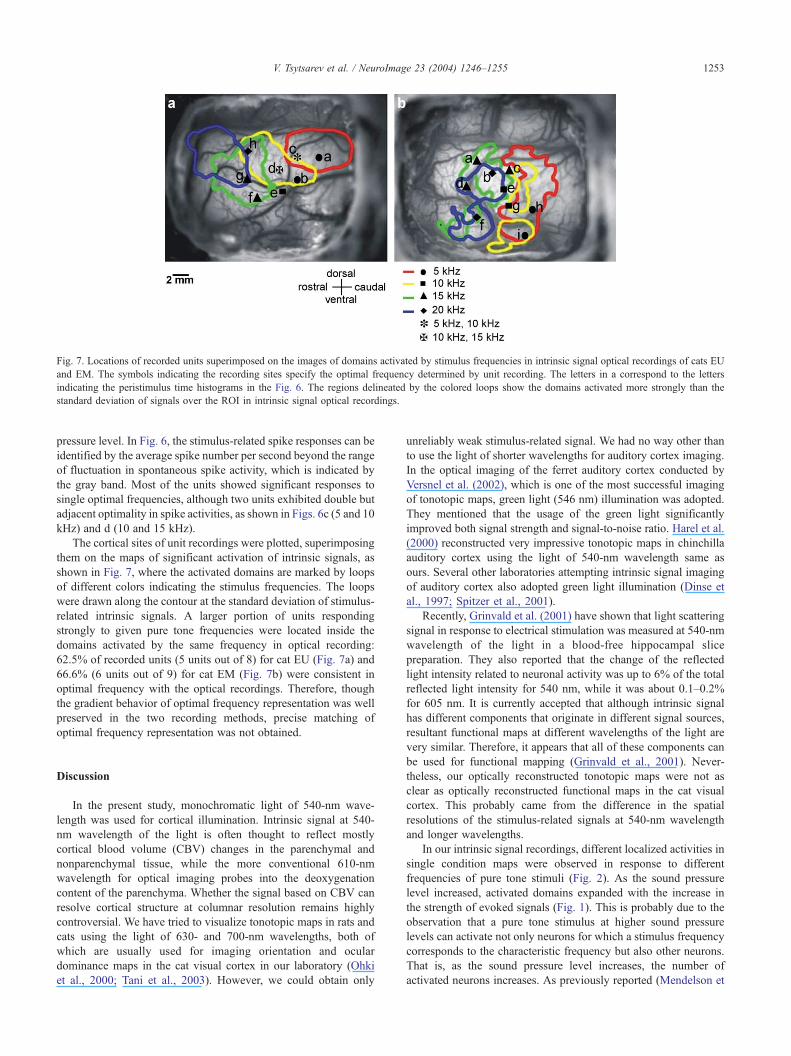
Fig. 7. Locations of recorded units superimposed on the images of domains activated by stimulus frequencies in intrinsic signal optical recordings of cats EU
and EM. The symbols indicating the recording sites specify the optimal frequency determined by unit recording. The letters in a correspond to the letters
indicating the peristimulus time histograms in the Fig. 6. The regions delineated by the colored loops show the domains activated more strongly than the
standard deviation of signals over the ROI in intrinsic signal optical recordings.
V. Tsytsarev et al. / NeuroImage 23 (2004) 1246–1255 1253
pressure level. In Fig. 6, the stimulus-related spike responses can be
identified by the average spike number per second beyond the range
of fluctuation in spontaneous spike activity, which is indicated by
the gray band. Most of the units showed significant responses to
single optimal frequencies, although two units exhibited double but
adjacent optimality in spike activities, as shown in Figs. 6c (5 and 10
kHz) and d (10 and 15 kHz).
The cortical sites of unit recordings were plotted, superimposing
them on the maps of significant activation of intrinsic signals, as
shown in Fig. 7, where the activated domains are marked by loops
of different colors indicating the stimulus frequencies. The loops
were drawn along the contour at the standard deviation of stimulus-
related intrinsic signals. A larger portion of units responding
strongly to given pure tone frequencies were located inside the
domains activated by the same frequency in optical recording:
62.5% of recorded units (5 units out of 8) for cat EU (Fig. 7a) and
66.6% (6 units out of 9) for cat EM (Fig. 7b) were consistent in
optimal frequency with the optical recordings. Therefore, though
the gradient behavior of optimal frequency representation was well
preserved in the two recording methods, precise matching of
optimal frequency representation was not obtained.
Discussion
In the present study, monochromatic light of 540-nm wave-
length was used for cortical illumination. Intrinsic signal at 540-
nm wavelength of the light is often thought to reflect mostly
cortical blood volume (CBV) changes in the parenchymal and
nonparenchymal tissue, while the more conventional 610-nm
wavelength for optical imaging probes into the deoxygenation
content of the parenchyma. Whether the signal based on CBV can
resolve cortical structure at columnar resolution remains highly
controversial. We have tried to visualize tonotopic maps in rats and
cats using the light of 630- and 700-nm wavelengths, both of
which are usually used for imaging orientation and ocular
dominance maps in the cat visual cortex in our laboratory (Ohki
et al., 2000; Tani et al., 2003). However, we could obtain only
unreliably weak stimulus-related signal. We had no way other than
to use the light of shorter wavelengths for auditory cortex imaging.
In the optical imaging of the ferret auditory cortex conducted by
Versnel et al. (2002), which is one of the most successful imaging
of tonotopic maps, green light (546 nm) illumination was adopted.
They mentioned that the usage of the green light significantly
improved both signal strength and signal-to-noise ratio. Harel et al.
(2000) reconstructed very impressive tonotopic maps in chinchilla
auditory cortex using the light of 540-nm wavelength same as
ours. Several other laboratories attempting intrinsic signal imaging
of auditory cortex also adopted green light illumination (Dinse et
al., 1997; Spitzer et al., 2001).
Recently, Grinvald et al. (2001) have shown that light scattering
signal in response to electrical stimulation was measured at 540-nm
wavelength of the light in a blood-free hippocampal slice
preparation. They also reported that the change of the reflected
light intensity related to neuronal activity was up to 6% of the total
reflected light intensity for 540 nm, while it was about 0.1–0.2%
for 605 nm. It is currently accepted that although intrinsic signal
has different components that originate in different signal sources,
resultant functional maps at different wavelengths of the light are
very similar. Therefore, it appears that all of these components can
be used for functional mapping (Grinvald et al., 2001). Never-
theless, our optically reconstructed tonotopic maps were not as
clear as optically reconstructed functional maps in the cat visual
cortex. This probably came from the difference in the spatial
resolutions of the stimulus-related signals at 540-nm wavelength
and longer wavelengths.
In our intrinsic signal recordings, different localized activities in
single condition maps were observed in response to different
frequencies of pure tone stimuli (Fig. 2). As the sound pressure
level increased, activated domains expanded with the increase in
the strength of evoked signals (Fig. 1). This is probably due to the
observation that a pure tone stimulus at higher sound pressure
levels can activate not only neurons for which a stimulus frequency
corresponds to the characteristic frequency but also other neurons.
That is, as the sound pressure level increases, the number of
activated neurons increases. As previously reported (Mendelson et

V. Tsytsarev et al. / NeuroImage 23 (2004) 1246–12551254
al., 1997; Sutter and Schreiner, 1995), the single-unit threshold for
evoking spike responses was approximately 20 dB SPL, below the
sound pressure levels for the reliable induction of intrinsic signals.
Therefore, the suprathreshold stimulation in intrinsic signal optical
recording may activate a larger cortical territory beyond an iso-
frequency band determined by the characteristic frequency-based
electrophysiological mapping. On the other hand, the spatial
profiles of stimulus-related intrinsic signals for 55 and 60 dB
SPL were evidently similar. This indicates that the location of a
core region in the activated domain does not change so much
whereas the activated domain expands.
To confirm the reliability of our optical recordings for the
reconstruction of tonotopic maps, we carried out optical recordings
twice from the same cortex with a 4-day interexperimental interval
and compared tonotopic maps between the two recordings. We
could find excellent reproducibility even though the interexper-
imental interval was as long as 4 days. Furthermore, we carried out
unit recordings from the auditory cortex, in which optical
recording had been conducted. We compared the locations of
units exhibiting optimal frequencies with the tonotopic maps
obtained from the optical recording, and found that the optimal
frequencies were roughly consistent on the whole between the two
measurements.
It has been reported that neurons tuned to particular sound
pressure levels were observed in AI of an anesthetized cat (Brugge
et al., 1969; Phillips and Irvine, 1981). Sutter and Schreiner (1995)
have found a cluster of neurons exhibiting nonmonotonic behavior.
A similar nonmonotonic behavior has also been observed by Dinse
et al. (1997) by using intrinsic signal optical recordings of the cat
auditory cortex. Regarding the dependence of intrinsic signals on
the sound pressure level, we rather analyzed signals in the
monotonic domain to show the scaling property and the presence
of a minimum sound pressure level for the generation of stimulus-
related intrinsic signals. The minimum sound pressure level
obtained from this analysis was about 21.5 dB SPL, which is
close to the average threshold of sound pressure level for the
generation of neuronal spikes (Mendelson et al., 1997). This
implies that stimulus-related intrinsic signals are correlated with
neuronal spike activities.
The tonotopic arrangement was almost consistent with the
previously reported electrophysiological mapping of the character-
istic frequencies in the cat auditory cortex. We observed, however,
that the active domains in the single condition maps often
appeared as spots of irregular shape and not as strips elongated
in the dorso-ventral direction. In addition, the agreement of
optimal frequency arrangements between optical and unit record-
ings was not excellent. Spitzer et al. (2001) pointed out a
discrepancy in the tonotopic representation in cat AI between
characteristic frequency-based tonotopic maps and activated
domains in intrinsic signal optical recordings. Intrinsic signal
optical recordings of the rat AI also revealed the presence of spot-
like activated domains (Bakin et al., 1996), whereas in the
electrophysiological mapping, narrow iso-frequency bands were
observed (Ehret, 1997). They suggested that the major source of
the discrepancy is the involvement of subthreshold neuronal
activity in stimulus-related intrinsic signals. In our analysis of the
dependence of intrinsic signals on the sound pressure level, we
found that intrinsic signals were correlated with suprathreshold
neuronal activities at least in early frames of recordings. Therefore,
the discrepancy between unit recordings and intrinsic signal
optical recordings may not simply be accounted for by the
contribution of subthreshold neuronal activity to the stimulus-
related intrinsic signals. The discrepancy may be attributable to
variability in the dependence of neuronal activities on sound
intensity. Different neurons possess different thresholds of sound
pressure levels for spike generation. Even at the same sound
intensity, neurons with lower thresholds may respond vigorously
to stimuli and elicit strong intrinsic signals, while neurons with
higher thresholds may show sluggish responses and elicit weak
intrinsic signals. In addition, some neuronal population has a
nonmonotonic property of response to the sound intensity. Such
variability in the sound intensity dependence of neuronal activities
is likely to produce nonuniform signal distribution, which may
form spot-like activated domains.
Based on the acoustic frequency representation obtained from
optical recording, we attempted to allocate different auditory fields
in the two cats examined, which are shown in Fig. 5. It is likely
that we can allocate not only AI but also other auditory fields such
as AAF, AII, and DP. The anterior auditory field was identified by
the mirror symmetric representation of the optimal frequencies, and
AII and DP were identified by the absence of tonotopic
organization and discontinuous changes in optimal frequency
representation beyond AI and AAF. Particularly, in AI, the high-
frequency domains were likely to be in the rostral part and the low-
frequency domains in the caudal part. This consistency in
representation may guarantee that our intrinsic signal optical
recording could work well for the visualization of a tonotopic
map in the cat auditory cortex.
We found that there were disadvantages of the intrinsic signal
optical recording from the cat auditory cortex. The optically
reconstructed tonotopic maps were not necessarily as clear as
orientation maps reconstructed in the same recording technique
from the cat visual cortex (Bonhoeffer and Grinvald, 1991; Ohki
et al., 2000), due to worse spatial resolution at 540-nm
wavelength of the light. We could see only rough agreement
in the location of optimal acoustic frequencies between the unit
recording and the optical recording. Nevertheless, the optical
recording still has an advantage in that we can visualize wide-
field tonotopic organization over the ectosylvian gyrus only by
several hours recording, even if the tonotopic map may not be as
precise as that reconstructed by unit recording. Therefore,
intrinsic signal optical recording can be safely used to obtain
rough tonotopic organization and broad allocation of different
auditory fields as a reference map for electrode penetration in
the subsequent electrophysiological recording, which may reduce
the time for searching optimal frequencies in unit recording
experiments.
Conclusion
The intrinsic signal optical recording technique was applied to
the visualization of acoustic frequency representation in the cat
auditory cortex. The tonotopic arrangements were visualized in the
middle ectosylvian gyrus, in which AI and AAF were identified
based on the mirror symmetric representation of acoustic frequen-
cies. The surrounding auditory fields such as AII and DP were also
distinguished by the absence of tonotopicity. The reproducibility of
optically reconstructed tonotopic maps indicates that the optical
recording technique is a reliable method for the visualization of
tonotopic organization and the allocation of different auditory
fields in the cat auditory cortex.
V. Tsytsarev et al. / NeuroImage 23 (2004) 1246–1255 1255
Acknowledgments
We thank Dr. Kazuyuki Imamura (Lab. for Visual Neuro-
computing, RIKEN BSI) and Dr. Hisayuki Ojima (Lab. for Cortical
Organization and Systematics, RIKEN BSI) for valuable advice
concerning the electrophysiological part of experiments, Dr. Dmitri
Sibarov (St. Petersburg State University, Russia) for help in data
analysis, and Mr. Yuji Akimoto and Katsuya Ozawa (Lab. for
Visual Neurocomputing, RIKEN BSI) for technical support in all
our experiments.
References
Bakin, J.S., Kwon, M.C., Masino, S.A., Weinberger, N.M., Frostig, R.D.,
1996. Suprathreshold auditory cortex activation visualized by intrinsic
optical imaging. Cereb. Cortex 6, 120–130.
Bonhoeffer, T., Grinvald, A., 1991. Iso-orientation domains in cat
visual cortex are arranged in pinwheel-like patterns. Nature 353,
429–431.
Bonhoeffer, T., Grinvald, A., 1996. Optical imaging based on intrinsic
signals: the methodology. In: Toga, A.W., Mazziotta, J.C. (Eds.), Brain
Mapping: The Methods. Academic Press, San Diego, p. 55.
Brugge, J.F., Dubrovsky, N.A., Aitkin, L.M., Anderson, D.J., 1969.
Sensitivity of single neurons in auditory cortex of cat to binaural tonal
stimulation; effects of varying interaural time and intensity. J. Neuro-
physiol. 32, 1005–1024.
Dinse, H., Godde, B., Hilger, T., Reuter, G., Cords, S.M., Lenarz, T., von
Seelen, W., 1997. Optical imaging of cat auditory cortex: cochleotopic
selectivity evoked by acute electrical stimulation of a multichannel
cochlear implant. Eur. J. Neurosci. 9, 113–119.
Ehret, G., 1997. The auditory cortex. J. Comp. Physiol 181, 547–557.
Grinvald, A., Shoham, D., Shmuel, A., Glaser, D., Vanzetta, I., Shtoyer-
man, E., Slovin, H., Sterkin, A., Wijnbergen, C., Hildesheim, R., Arieli,
A., 2001. In-vivo optical imaging of cortical architecture and dynamics.
In: Windhorst, U., Johansson, H. (Eds.), Modern Techniques in
Neuroscience Research. Springer.
Harel, N., Mori, N., Sawada, S., Mount, R.J., Harrison, R.V., 2000. Three
distinct auditory areas of cortex (AI, AII and AAF) defined by optical
imaging of intrinsic signals. NeuroImage 11, 302–312.
Ohki, K., Matsuda, Y., Ajima, A., Kim, D.-S., Tanaka, S., 2000.
Arrangement of orientation pinwheel centers around area 17/18
transition zone in cat visual cortex. Cereb. Cortex 10, 593–601.
Mountcastle, V.B., 1957. Modality and topographic properties of
single neurons of cat’s somatic sensory cortex. J. Neurophysiol. 20,
408–434.
Mendelson, J.R., Schreiner, C.E., Sutter, M.L., 1997. Functional
topography of cat auditory cortex: response latencies. J. Comp. Physiol.,
A 181, 615–633.
Phillips, D.P., Irvine, D.R.F., 1981. Responses of single neurons in
physiologically defined primary auditory cortex (AI) of the cat:
frequency tuning and response to intensity. J. Neurophysiol. 45, 48–58.
Reale, R., Imig, T., 1980. Tonotopic organization in auditory cortex of the
cat. J. Comp. Neurol. 192, 265–291.
Schreiner, C.E., Cynader, M.S., 1984. Basic functional organization of
second auditory cortical field (AII) of the cat. J. Neurophysiol. 51,
1284–1305.
Spitzer, M.W., Calford, M.B., Clarey, J.C., Pettigrew, J.D., Roe, A.W.,
2001. Spontaneous and stimulus-evoked intrinsic signals in primary
auditory cortex of the cat. J. Neurophysiol. 85, 1283–1298.
Sutter, M.L., Schreiner, C.E., 1995. Topography of intensity tuning in cat
primary auditory cortex: Single-neuron versus multiple-neuron record-
ings. J. Neurophysiol. 73, 190–204.
Talbot, S.A., 1940. Arrangement of visual field on cat’s cortex. Am. J.
Physiol. 129, 477–478.
Tani, T., Yokoi, I., Ito, M., Tanaka, S., Komatsu, H., 2003. Functional
organization of the cat visual cortex in relation to the representation of a
uniform surface. J. Neurophysiol. 89, 1112–1125.
Thompson, R., Johnson, R., Hoopes, J., 1963a. Organization of auditory,
somatic sensory, and visual projections to association fields of cerebral
cortex in the cat. J. Neurophysiol. 26, 343–364.
Thompson, R., Smith, H., Bliss, D., 1963b. Auditory, somatic sensory, and
visual response interactions and interrelations in association and
primary cortical fields of the cat. J. Neurophysiol. 26, 365–378.
Tsunoda, K., Yamane, Y., Nishizaki, M., Tanifuji, M., 2001. Complex
objects are represented in macaque inferotemporal cortex by the
combination of feature columns. Nat. Neurosci. 4, 832–838.
Ts’o, D.Y., Frostig, R.D., Lieke, E., Grinvald, A., 1990. Functional
organization of primate visual cortex revealed by high-resolution
optical imaging. Science 249, 417–420.
Tsytsarev, V., Tanaka, S., 2002. Intrinsic optical signal from rat primary
auditory cortex in response to sound stimuli presented to contralateral,
ipsilateral and bilateral ears. NeuroReport 13, 1661–1665.
Versnel, H., Mossop, J.E., Moore, D.R., 1998. Optical imaging of intrinsic
signals in ferret auditory cortex. Br. J. Audiol. 32, 93–94.
Versnel, H., Mossop, J.E., Mrsic-Flogel, T.D., Ahmed, B., Moore, D.R.,
2002. Optical imaging of intrinsic signals in ferret auditory cortex: Res-
ponses to narrow-band sound stimuli. J. Neurophysiol. 88, 1545–1558.
Woolsey, C.N., Walzl, E.M., 1942. Topical projection of nerve fibers from
local regions of the cochlea to the cerebral cortex of the cat. Bull. Johns
Hopkins Hosp. 71, 315–344.
Yokoo, T., Knight, B.W., Sirovich, L., 2001. An optimization approach
to signal extraction from noisy multivariate data. NeuroImage 14,
1309–1326.
Related Documents