1 1 1 Student/Community Profile

SONORA HIGH WASC REPORT 2005-2011
Mar 10, 2016
Sonora Self-Study Report
Welcome message from author
This document is posted to help you gain knowledge. Please leave a comment to let me know what you think about it! Share it to your friends and learn new things together.
Transcript
1
11
Student/Community Profile

2
Chapter 1
Student/Community Profile
Introduction
Sonora High School was the seventh comprehensive high school in the Fullerton Joint
Union High School District when it opened in 1966. At that time, the population of North
Orange County was experiencing rapid growth, and schools were overcrowded with Sonora
being designed to alleviate these conditions at especially two of the other schools, La Habra and
Sunny Hills High Schools. Designed for approximately two thousand students, the school
rapidly grew to about 1900, but in the late eighties the enrollment began to decline severely in
the North County, resulting in the closure of one comprehensive high school, Lowell, and
reducing the enrollment at Sonora to just over 1100. Since that time, enrollment has grown
steadily to an average of 1950-2100 students. Last year, 2009-2010, the school reached its all-
time peak for students being served with an enrollment of 2182. A number of factors have
resulted in this relative enrollment boom, with the school having been privileged to essentially
extend its attendance area to many more surrounding communities. This has occurred through
the unique offerings of the Medical Careers Academy, the International Baccalaureate Program,
the award-winning Agricultural Program, the Army Junior Reserve Officer Training Corps, and
the special programs designed to meet the needs of its English Learner population, among others.
Most recently, the school has become one of two schools designated in the district to provide
Community Based Instruction (CBI) services, and just last school year, being designated to
educate autistic high school students. The ensuing description, accompanied when appropriate
with supporting charts and graphs, will provide the context in which the unique learning
environment that is Sonora High School serves the community.
The Community
While Sonora serves a number of communities, the school is located in the North Orange
County city of La Habra. La Habra is situated primarily in a valley, with portions of the city in
the hills on both sides. The pass through the northern hills, leading from the San Gabriel Valley
to La Habra, is thought to have given the city its name. The name apparently is derived from a
colloquial Spanish expression meaning “the opening”, or “the pass through the hills”. La Habra
was a former citrus, walnut and avocado agricultural center, being the birthplace of the famed
and nutritious Haas avocado. Experiencing its first big population boom in the early 1920’s, La
Habra now occupies 7.3 square miles 298 feet above sea level with a population of
approximately 59,155, a growth of 0.3% since 2000. As the northernmost city in Orange
County, La Habra residents enjoy being just a relatively short drive from the beach, the local
mountains and the desert.
3
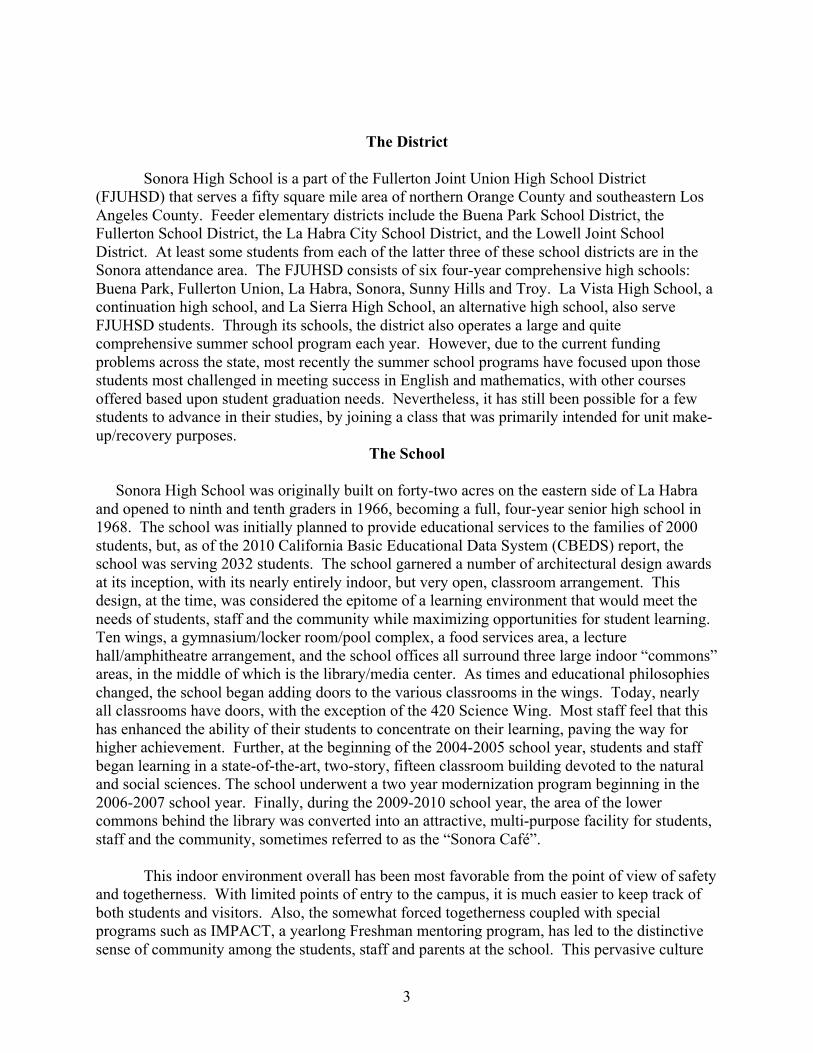
The District
Sonora High School is a part of the Fullerton Joint Union High School District
(FJUHSD) that serves a fifty square mile area of northern Orange County and southeastern Los
Angeles County. Feeder elementary districts include the Buena Park School District, the
Fullerton School District, the La Habra City School District, and the Lowell Joint School
District. At least some students from each of the latter three of these school districts are in the
Sonora attendance area. The FJUHSD consists of six four-year comprehensive high schools:
Buena Park, Fullerton Union, La Habra, Sonora, Sunny Hills and Troy. La Vista High School, a
continuation high school, and La Sierra High School, an alternative high school, also serve
FJUHSD students. Through its schools, the district also operates a large and quite
comprehensive summer school program each year. However, due to the current funding
problems across the state, most recently the summer school programs have focused upon those
students most challenged in meeting success in English and mathematics, with other courses
offered based upon student graduation needs. Nevertheless, it has still been possible for a few
students to advance in their studies, by joining a class that was primarily intended for unit make-
up/recovery purposes.
The School
Sonora High School was originally built on forty-two acres on the eastern side of La Habra
and opened to ninth and tenth graders in 1966, becoming a full, four-year senior high school in
1968. The school was initially planned to provide educational services to the families of 2000
students, but, as of the 2010 California Basic Educational Data System (CBEDS) report, the
school was serving 2032 students. The school garnered a number of architectural design awards
at its inception, with its nearly entirely indoor, but very open, classroom arrangement. This
design, at the time, was considered the epitome of a learning environment that would meet the
needs of students, staff and the community while maximizing opportunities for student learning.
Ten wings, a gymnasium/locker room/pool complex, a food services area, a lecture
hall/amphitheatre arrangement, and the school offices all surround three large indoor “commons”
areas, in the middle of which is the library/media center. As times and educational philosophies
changed, the school began adding doors to the various classrooms in the wings. Today, nearly
all classrooms have doors, with the exception of the 420 Science Wing. Most staff feel that this
has enhanced the ability of their students to concentrate on their learning, paving the way for
higher achievement. Further, at the beginning of the 2004-2005 school year, students and staff
began learning in a state-of-the-art, two-story, fifteen classroom building devoted to the natural
and social sciences. The school underwent a two year modernization program beginning in the
2006-2007 school year. Finally, during the 2009-2010 school year, the area of the lower
commons behind the library was converted into an attractive, multi-purpose facility for students,
staff and the community, sometimes referred to as the “Sonora Café”.
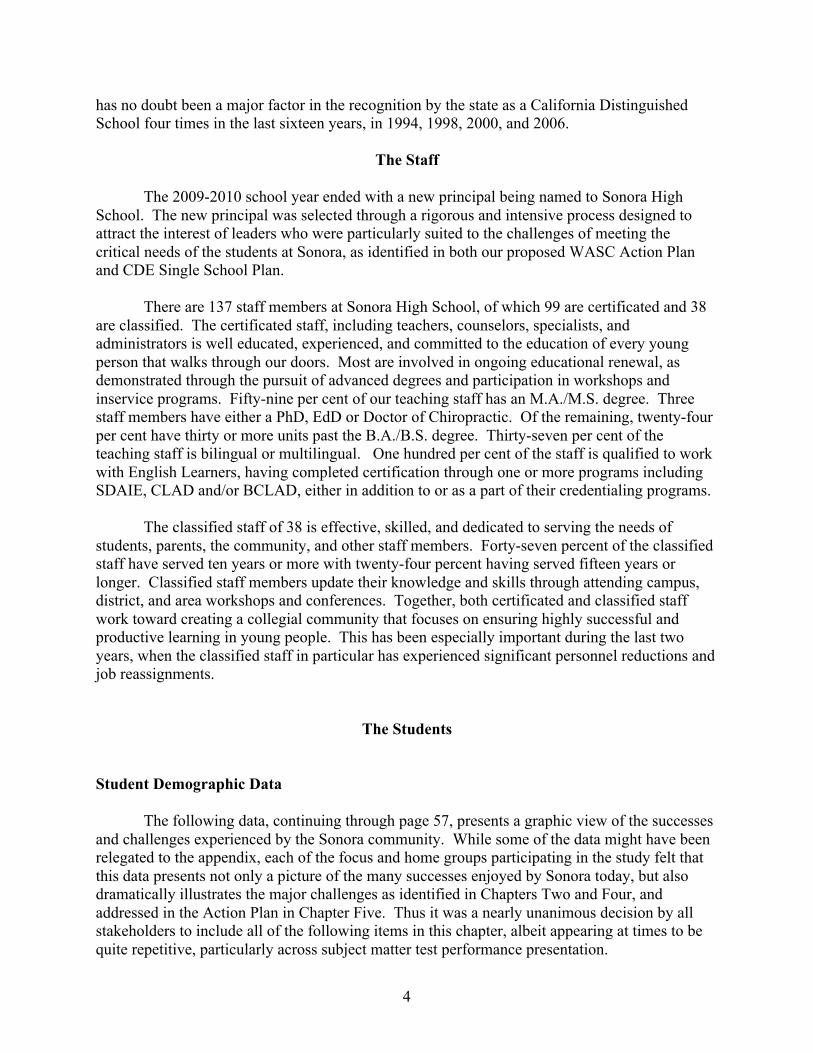
This indoor environment overall has been most favorable from the point of view of safety
and togetherness. With limited points of entry to the campus, it is much easier to keep track of
both students and visitors. Also, the somewhat forced togetherness coupled with special
programs such as IMPACT, a yearlong Freshman mentoring program, has led to the distinctive
sense of community among the students, staff and parents at the school. This pervasive culture
4
has no doubt been a major factor in the recognition by the state as a California Distinguished
School four times in the last sixteen years, in 1994, 1998, 2000, and 2006.
The Staff
The 2009-2010 school year ended with a new principal being named to Sonora High
School. The new principal was selected through a rigorous and intensive process designed to
attract the interest of leaders who were particularly suited to the challenges of meeting the
critical needs of the students at Sonora, as identified in both our proposed WASC Action Plan
and CDE Single School Plan.
There are 137 staff members at Sonora High School, of which 99 are certificated and 38
are classified. The certificated staff, including teachers, counselors, specialists, and
administrators is well educated, experienced, and committed to the education of every young
person that walks through our doors. Most are involved in ongoing educational renewal, as
demonstrated through the pursuit of advanced degrees and participation in workshops and
inservice programs. Fifty-nine per cent of our teaching staff has an M.A./M.S. degree. Three
staff members have either a PhD, EdD or Doctor of Chiropractic. Of the remaining, twenty-four
per cent have thirty or more units past the B.A./B.S. degree. Thirty-seven per cent of the
teaching staff is bilingual or multilingual. One hundred per cent of the staff is qualified to work
with English Learners, having completed certification through one or more programs including
SDAIE, CLAD and/or BCLAD, either in addition to or as a part of their credentialing programs.
The classified staff of 38 is effective, skilled, and dedicated to serving the needs of
students, parents, the community, and other staff members. Forty-seven percent of the classified
staff have served ten years or more with twenty-four percent having served fifteen years or
longer. Classified staff members update their knowledge and skills through attending campus,
district, and area workshops and conferences. Together, both certificated and classified staff
work toward creating a collegial community that focuses on ensuring highly successful and
productive learning in young people. This has been especially important during the last two
years, when the classified staff in particular has experienced significant personnel reductions and
job reassignments.
The Students
Student Demographic Data
The following data, continuing through page 57, presents a graphic view of the successes
and challenges experienced by the Sonora community. While some of the data might have been
relegated to the appendix, each of the focus and home groups participating in the study felt that
this data presents not only a picture of the many successes enjoyed by Sonora today, but also
dramatically illustrates the major challenges as identified in Chapters Two and Four, and
addressed in the Action Plan in Chapter Five. Thus it was a nearly unanimous decision by all
stakeholders to include all of the following items in this chapter, albeit appearing at times to be
quite repetitive, particularly across subject matter test performance presentation.
5
Enrollment Data
Sonora’s enrollment has been relatively stable during the past six years. Both the school
and the district allow and encourage students to find special programs in which they are
interested. Students can transfer to Sonora by way of the two-week district Open Enrollment
period. Additionally, students may transfer to Sonora with approved interdistrict or intradistrict
permits for special programs not available at their home school. This contributes to the year to
year enrollment fluctuation shown below.
Enrollment by Academic Grade and Total
Year
Grade 9 # of Students
Grade 10 # of Students
Grade 11 # of Students
Grade 12 # of Students
Total
2005-2006 613 434 511 470 2028
2006-2007 682 515 402 381 1980
2007-2008 724 516 442 383 2065
2008-2009 648 478 567 433 2126
2009-2010 596 538 570 478 2182
2010-2011 483 560 485 504 2032
During the 2006-2007 school year, as a response to national, state and local needs for
successfully educating every student, students were classified not only according to the calendar
years they had attended high school, but also by the number of units they had completed relative
to the requirements for eventual graduation. This was both in response to federal and state
guidelines, as well as to the evident difficulty for new-comers to immediately adjust to their new
language of instruction, academically and socially. This dual classification will lead to some
anomalies in the subsequent data, particularly with reference to the 2007-2008 school year.
These anomalies are the result of what is generally referred to as the “social grade” of certain
students.
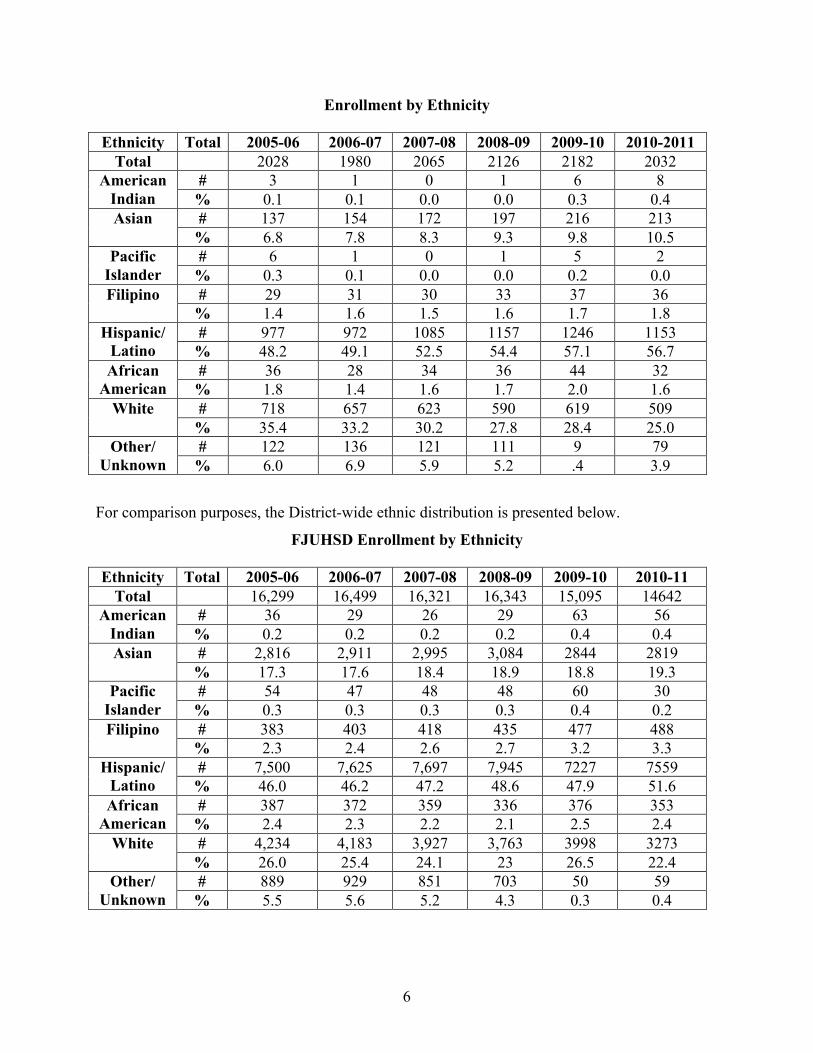
Student Ethnicity Data
Sonora has continued to experience a continued, yet gradual, change in the ethnic
composition of the student body. The two most significant ethnic sub-groups continue to be the
Hispanic and White populations. It will be noted, however, that the Asian population has
consistently grown over the past five years at a much greater rate than the Asian population
throughout the district.
6
Enrollment by Ethnicity
Ethnicity Total 2005-06 2006-07 2007-08 2008-09 2009-10 2010-2011
Total 2028 1980 2065 2126 2182 2032
# 3 1 0 1 6 8 American
Indian % 0.1 0.1 0.0 0.0 0.3 0.4
# 137 154 172 197 216 213 Asian
% 6.8 7.8 8.3 9.3 9.8 10.5
# 6 1 0 1 5 2 Pacific
Islander % 0.3 0.1 0.0 0.0 0.2 0.0
# 29 31 30 33 37 36 Filipino
% 1.4 1.6 1.5 1.6 1.7 1.8
# 977 972 1085 1157 1246 1153 Hispanic/
Latino % 48.2 49.1 52.5 54.4 57.1 56.7
# 36 28 34 36 44 32 African
American % 1.8 1.4 1.6 1.7 2.0 1.6
# 718 657 623 590 619 509 White
% 35.4 33.2 30.2 27.8 28.4 25.0
# 122 136 121 111 9 79 Other/
Unknown % 6.0 6.9 5.9 5.2 .4 3.9
For comparison purposes, the District-wide ethnic distribution is presented below.
FJUHSD Enrollment by Ethnicity
Ethnicity Total 2005-06 2006-07 2007-08 2008-09 2009-10 2010-11
Total 16,299 16,499 16,321 16,343 15,095 14642
# 36 29 26 29 63 56 American
Indian % 0.2 0.2 0.2 0.2 0.4 0.4
# 2,816 2,911 2,995 3,084 2844 2819 Asian
% 17.3 17.6 18.4 18.9 18.8 19.3
# 54 47 48 48 60 30 Pacific
Islander % 0.3 0.3 0.3 0.3 0.4 0.2
# 383 403 418 435 477 488 Filipino
% 2.3 2.4 2.6 2.7 3.2 3.3
# 7,500 7,625 7,697 7,945 7227 7559 Hispanic/
Latino % 46.0 46.2 47.2 48.6 47.9 51.6
# 387 372 359 336 376 353 African
American % 2.4 2.3 2.2 2.1 2.5 2.4
# 4,234 4,183 3,927 3,763 3998 3273 White
% 26.0 25.4 24.1 23 26.5 22.4
# 889 929 851 703 50 59 Other/
Unknown % 5.5 5.6 5.2 4.3 0.3 0.4
7
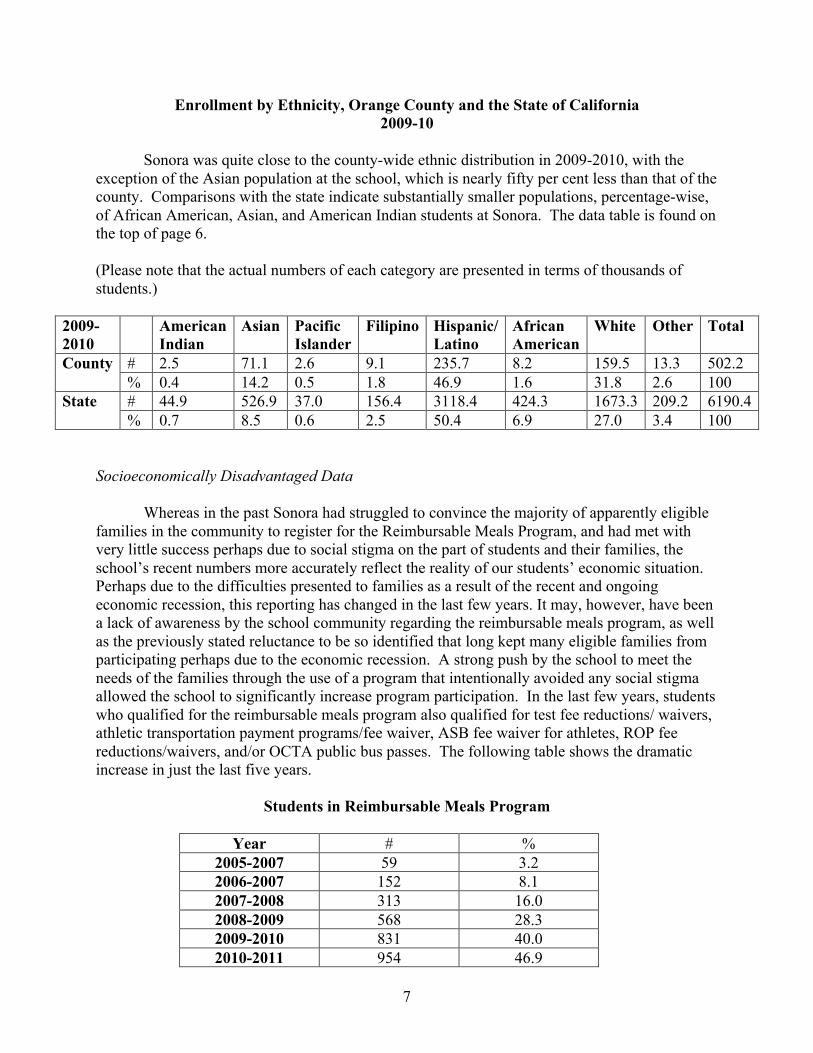
Enrollment by Ethnicity, Orange County and the State of California
2009-10
Sonora was quite close to the county-wide ethnic distribution in 2009-2010, with the
exception of the Asian population at the school, which is nearly fifty per cent less than that of the
county. Comparisons with the state indicate substantially smaller populations, percentage-wise,
of African American, Asian, and American Indian students at Sonora. The data table is found on
the top of page 6.
(Please note that the actual numbers of each category are presented in terms of thousands of
students.)
2009-
2010
American
Indian
Asian Pacific
Islander
Filipino Hispanic/
Latino
African
American
White Other Total
# 2.5 71.1 2.6 9.1 235.7 8.2 159.5 13.3 502.2 County
% 0.4 14.2 0.5 1.8 46.9 1.6 31.8 2.6 100
# 44.9 526.9 37.0 156.4 3118.4 424.3 1673.3 209.2 6190.4 State
% 0.7 8.5 0.6 2.5 50.4 6.9 27.0 3.4 100
Socioeconomically Disadvantaged Data
Whereas in the past Sonora had struggled to convince the majority of apparently eligible
families in the community to register for the Reimbursable Meals Program, and had met with
very little success perhaps due to social stigma on the part of students and their families, the
school’s recent numbers more accurately reflect the reality of our students’ economic situation.
Perhaps due to the difficulties presented to families as a result of the recent and ongoing
economic recession, this reporting has changed in the last few years. It may, however, have been
a lack of awareness by the school community regarding the reimbursable meals program, as well
as the previously stated reluctance to be so identified that long kept many eligible families from
participating perhaps due to the economic recession. A strong push by the school to meet the
needs of the families through the use of a program that intentionally avoided any social stigma
allowed the school to significantly increase program participation. In the last few years, students
who qualified for the reimbursable meals program also qualified for test fee reductions/ waivers,
athletic transportation payment programs/fee waiver, ASB fee waiver for athletes, ROP fee
reductions/waivers, and/or OCTA public bus passes. The following table shows the dramatic
increase in just the last five years.
Students in Reimbursable Meals Program
Year # %
2005-2007 59 3.2
2006-2007 152 8.1
2007-2008 313 16.0
2008-2009 568 28.3
2009-2010 831 40.0
2010-2011 954 46.9

8
Parent Education Level
It is well-documented that the level of education achieved by the parents in a family tends to
be a strong indicator of that pursued by their children. The relative level of parent education at
Sonora has not changed dramatically over the past six years for those who report their level.
What is dramatic, however, is the near-doubling of those in the “Decline-to-State” category,
from 10.5% in 2005-06 to 19.6% in 2009-10. There is a drop in every other category, except
high school graduate which shows a modest 1.4% increase. Correspondingly, the “Not a High
School Graduate” category had a 1.3% drop.
Parent Education Level
Year Total Not a High
School
Graduate
High
School
Graduate
Some
College
College
Graduate
Graduate
School
Decline
to State
# % # % # % # % # % # %
2005-
06
1866 264 14.1 322 17.3 420 22.5 389 20.8 275 14.7 196 10.5
2006-
07
1883 266 14.1 320 17.0 410 21.8 400 21.2 254 13.5 233 12.4
2007-
08
1958 278 14.2 324 16.5 403 20.6 412 21.0 253 12.9 288 14.7
2008-
09
2009 294 14.6 361 18.0 398 19.8 407 20.3 246 12.2 303 15.1
2009-
10
2074 265 12.8 387 18.7 363
17.5 401 19.3 252 12.2 406 19.6
2010-
11
2032 265 13.0 379 18.7 369 18.2 396 19.5 261 12.8 362 17.8
9
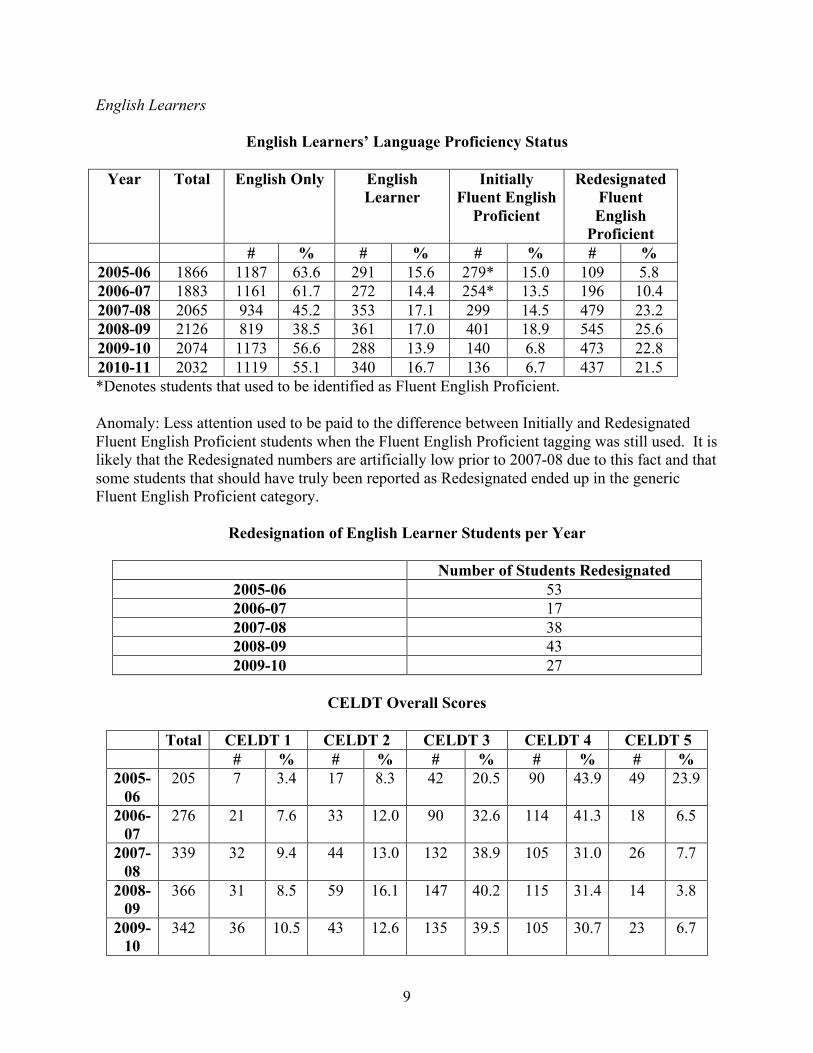
English Learners
English Learners’ Language Proficiency Status
Year Total English Only English
Learner
Initially
Fluent English
Proficient
Redesignated
Fluent
English
Proficient
# % # % # % # %
2005-06 1866 1187 63.6 291 15.6 279* 15.0 109 5.8
2006-07 1883 1161 61.7 272 14.4 254* 13.5 196 10.4
2007-08 2065 934 45.2 353 17.1 299 14.5 479 23.2
2008-09 2126 819 38.5 361 17.0 401 18.9 545 25.6
2009-10 2074 1173 56.6 288 13.9 140 6.8 473 22.8
2010-11 2032 1119 55.1 340 16.7 136 6.7 437 21.5
*Denotes students that used to be identified as Fluent English Proficient.
Anomaly: Less attention used to be paid to the difference between Initially and Redesignated
Fluent English Proficient students when the Fluent English Proficient tagging was still used. It is
likely that the Redesignated numbers are artificially low prior to 2007-08 due to this fact and that
some students that should have truly been reported as Redesignated ended up in the generic
Fluent English Proficient category.
Redesignation of English Learner Students per Year
Number of Students Redesignated
2005-06 53
2006-07 17
2007-08 38
2008-09 43
2009-10 27
CELDT Overall Scores
Total CELDT 1 CELDT 2 CELDT 3 CELDT 4 CELDT 5
# % # % # % # % # %
2005-
06
205 7 3.4 17 8.3 42 20.5 90 43.9 49 23.9
2006-
07
276 21 7.6 33 12.0 90 32.6 114 41.3 18 6.5
2007-
08
339 32 9.4 44 13.0 132 38.9 105 31.0 26 7.7
2008-
09
366 31 8.5 59 16.1 147 40.2 115 31.4 14 3.8
2009-
10
342 36 10.5 43 12.6 135 39.5 105 30.7 23 6.7
10
*Beginning in 2006-07, CELDT results are reported with a different common scale than in
previous years. As a result, 2005-06 results cannot be compared to those of later years.
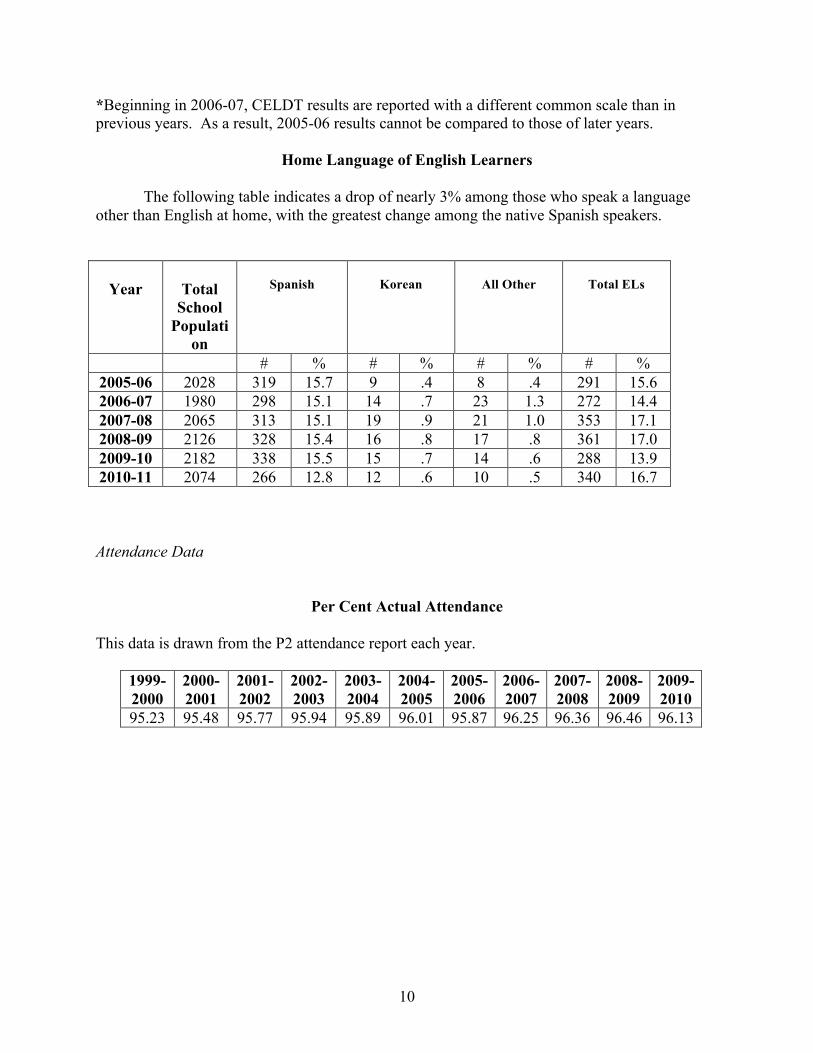
Home Language of English Learners
The following table indicates a drop of nearly 3% among those who speak a language
other than English at home, with the greatest change among the native Spanish speakers.
Year
Total
School
Populati
on
Spanish
Korean
All Other
Total ELs
# % # % # % # %
2005-06 2028 319 15.7 9 .4 8 .4 291 15.6
2006-07 1980 298 15.1 14 .7 23 1.3 272 14.4
2007-08 2065 313 15.1 19 .9 21 1.0 353 17.1
2008-09 2126 328 15.4 16 .8 17 .8 361 17.0
2009-10 2182 338 15.5 15 .7 14 .6 288 13.9
2010-11 2074 266 12.8 12 .6 10 .5 340 16.7
Attendance Data
Per Cent Actual Attendance
This data is drawn from the P2 attendance report each year.
1999-
2000
2000-
2001
2001-
2002
2002-
2003
2003-
2004
2004-
2005
2005-
2006
2006-
2007
2007-
2008
2008-
2009
2009-
2010
95.23 95.48 95.77 95.94 95.89 96.01 95.87 96.25 96.36 96.46 96.13

11
Student Dropout Data
Student Dropout Data
The traceable dropout number is almost negligible among all ethnic groups, and was the largest
in the past six years among Hispanic/Latino students in their senior year during the 2005-2006
school year. We attribute our very low dropout rates to many intervention programs, such as
Opportunity at La Sierra High School and to continuing and alternative programs that our district
offers at La Vista and La Sierra High Schools.
Ethnicity Grades 2005-06 2006-07 2007-08 2008-09 2009-10
9 0 0 0 0 0
10 0 0 0 0 0
11 0 0 0 0 0
Asian
12 0 0 0 0 0
9 0 2 2 1 0
10 0 0 0 0 0
11 1 2 2 3 0
Hispanic/Latino
12 13 3 3 2 2
9 0 0 0 0 0
10 0 0 0 0 0
11 0 0 0 0 0
African
American
12 1 1 1 0 0
9 0 0 0 0 0
10 0 0 0 0 0
11 0 1 1 0 0
White
12 1 1 1 0 0
9 0 0 0 0 0
10 0 0 0 0 0
11 0 0 0 0 0
Other
12 0 0 0 0 0
12
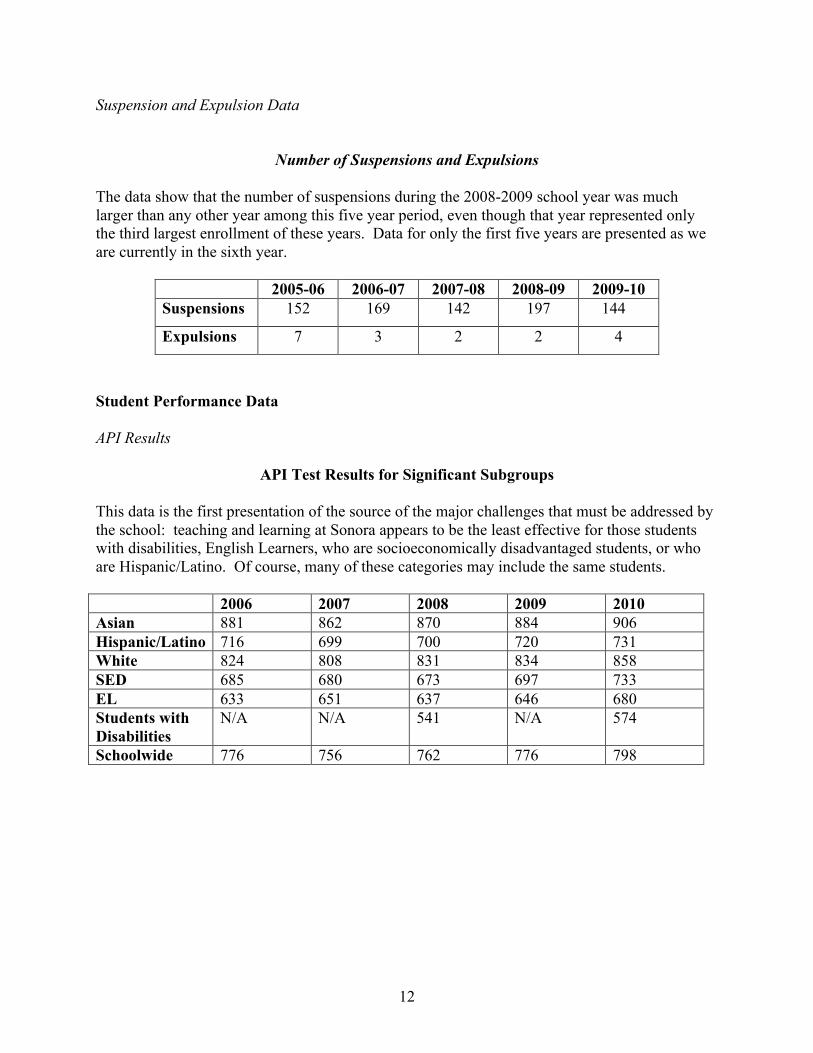
Suspension and Expulsion Data
Number of Suspensions and Expulsions
The data show that the number of suspensions during the 2008-2009 school year was much
larger than any other year among this five year period, even though that year represented only
the third largest enrollment of these years. Data for only the first five years are presented as we
are currently in the sixth year.
2005-06 2006-07 2007-08 2008-09 2009-10
Suspensions 152 169 142 197 144
Expulsions 7 3 2 2 4
Student Performance Data
API Results
API Test Results for Significant Subgroups
This data is the first presentation of the source of the major challenges that must be addressed by
the school: teaching and learning at Sonora appears to be the least effective for those students
with disabilities, English Learners, who are socioeconomically disadvantaged students, or who
are Hispanic/Latino. Of course, many of these categories may include the same students.
2006 2007 2008 2009 2010
Asian 881 862 870 884 906
Hispanic/Latino 716 699 700 720 731
White 824 808 831 834 858
SED 685 680 673 697 733
EL 633 651 637 646 680
Students with
Disabilities
N/A N/A 541 N/A 574
Schoolwide 776 756 762 776 798

13
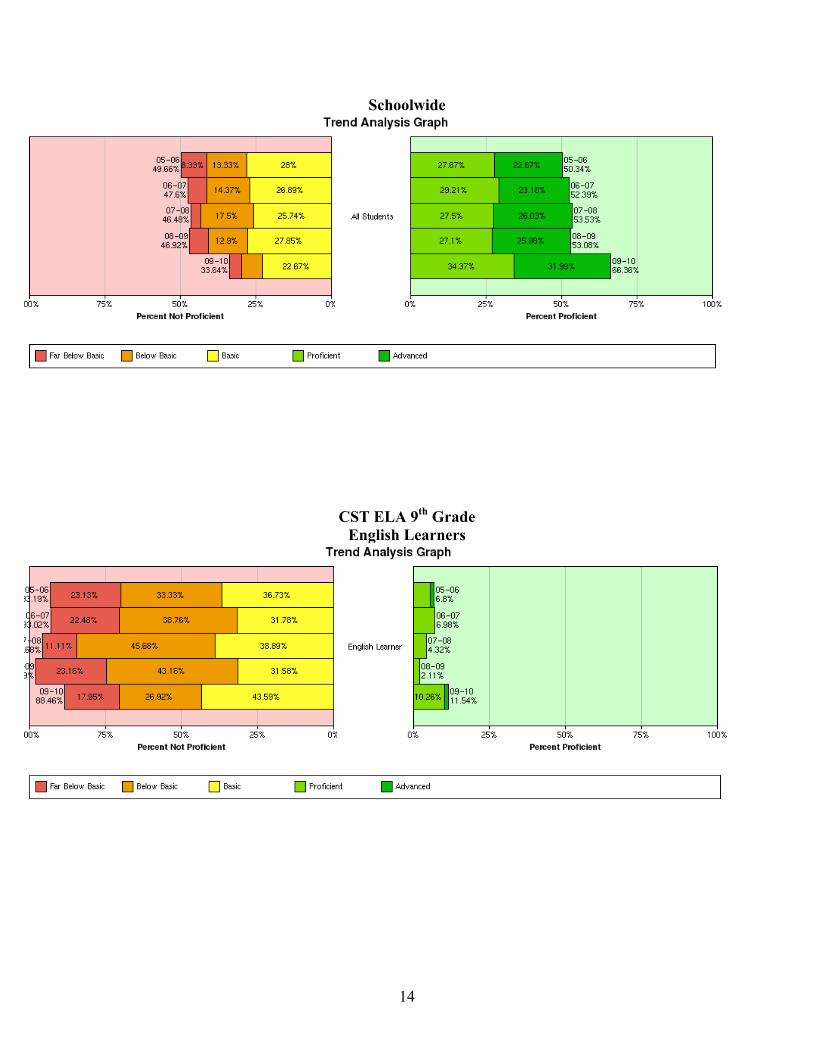
CST Results
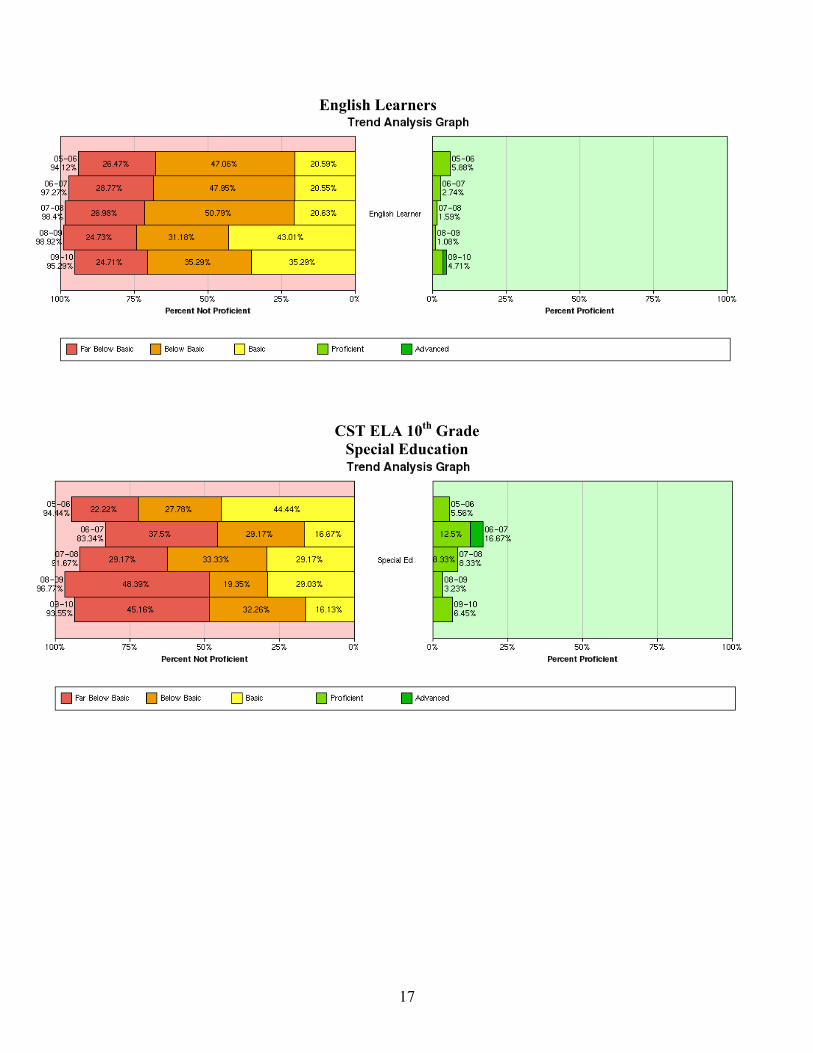
The following examination results appear to clearly demonstrate not only the areas of
high achievement by the students at Sonora, but also somewhat strikingly identify at least three
areas of high need: English Learners, Special Education Students, and students from
Socioeconomically Disadvantaged home environments, as indicated in the general data table
immediately preceding.
Each set of results, beginning with the English Language Arts examinations, are first
presented by grade level data, followed by Trend Analysis Graphs that nearly inevitably show
reasonable performance among all students, followed by clear deficiencies in the English
Learner, Special Education and Socioeconomically Disadvantaged subgroups. As the data
proceeds through the grade levels, the English Learner population tends to perform even less
ably, while the Special Education and Socioeconomically Disadvantaged students appear to
perform somewhat better each year.
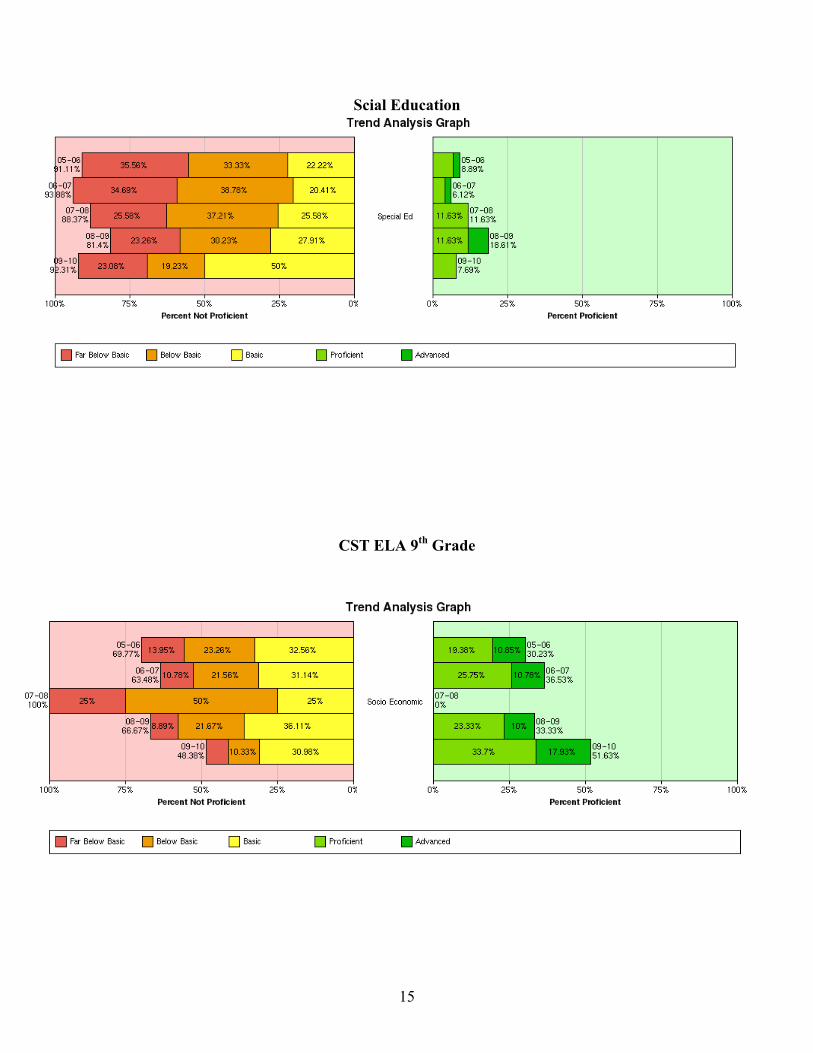
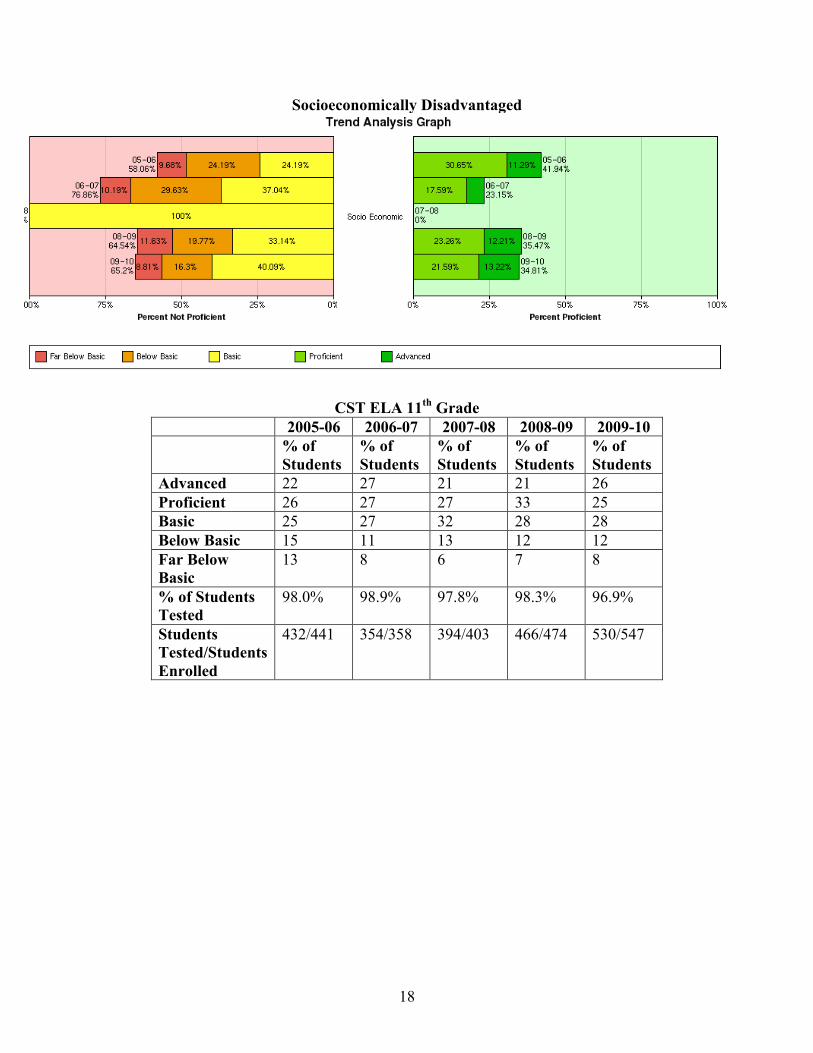
In 2007-2008, the socioeconomically disadvantaged data appears to be unreliable. That
year apparently corresponds with the Fullerton Joint Union High School District transition to the
federally funded reimbursable meals program. During the change from the old program to the
new, our economically challenged students were not properly tagged in our student data base.
This anomaly will appear in all of the following CST subgroup analysis charts.
CST ELA 9th
Grade
2005-06 2006-07 2007-08 2008-09 2009-10
% of
Students
% of
Students
% of
Students
% of
Students
% of
Students
Advanced 23 23 27 26 32
Proficient 28 29 28 27 35
Basic 28 27 25 27 22
Below Basic 13 14 16 13 7
Far Below
Basic
8 6 3 6 4
% of Students
Tested
98.9% 99.4% 96.0% 98.1% 94.2%
Students
Tested/Students
Enrolled
603/610 647/651 651/678 530/540 537/570
14
Schoolwide
CST ELA 9th
Grade
English Learners
15
Scial Education
CST ELA 9th
Grade
16
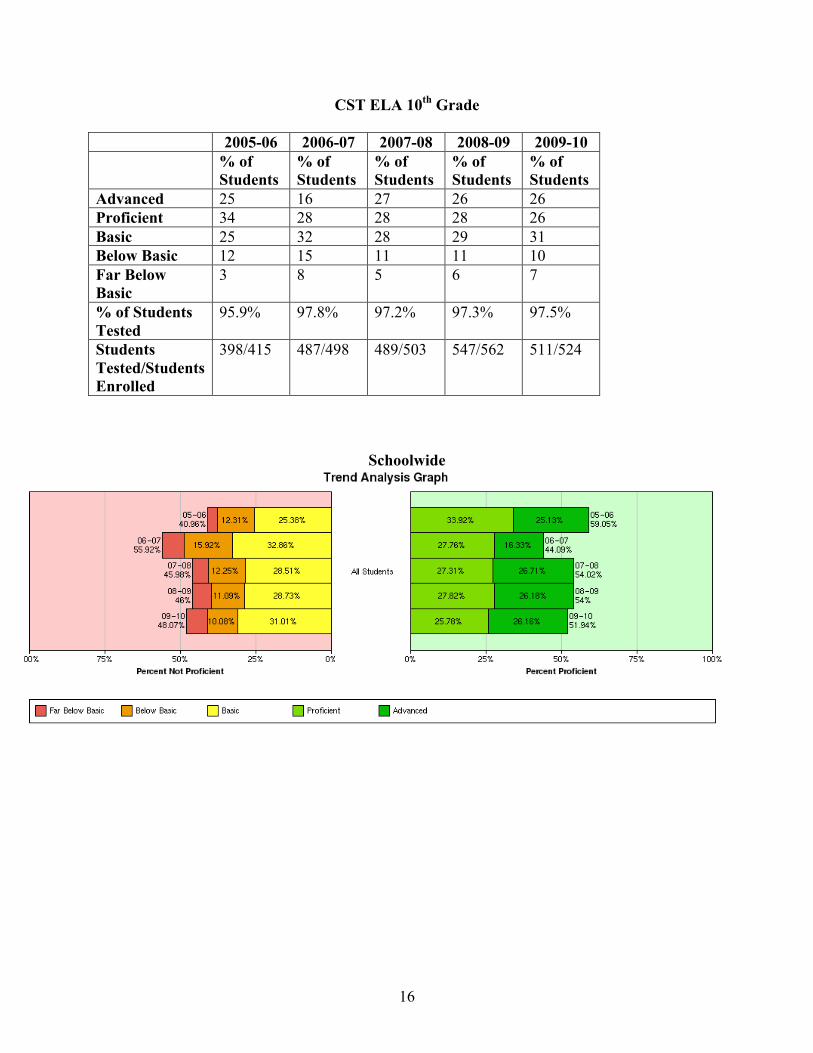
CST ELA 10th
Grade
2005-06 2006-07 2007-08 2008-09 2009-10
% of
Students
% of
Students
% of
Students
% of
Students
% of
Students
Advanced 25 16 27 26 26
Proficient 34 28 28 28 26
Basic 25 32 28 29 31
Below Basic 12 15 11 11 10
Far Below
Basic
3 8 5 6 7
% of Students
Tested
95.9% 97.8% 97.2% 97.3% 97.5%
Students
Tested/Students
Enrolled
398/415 487/498 489/503 547/562 511/524
Schoolwide
17
English Learners
CST ELA 10th
Grade
Special Education
18
Socioeconomically Disadvantaged
CST ELA 11
th Grade
2005-06 2006-07 2007-08 2008-09 2009-10
% of
Students
% of
Students
% of
Students
% of
Students
% of
Students
Advanced 22 27 21 21 26
Proficient 26 27 27 33 25
Basic 25 27 32 28 28
Below Basic 15 11 13 12 12
Far Below
Basic
13 8 6 7 8
% of Students
Tested
98.0% 98.9% 97.8% 98.3% 96.9%
Students
Tested/Students
Enrolled
432/441 354/358 394/403 466/474 530/547

19
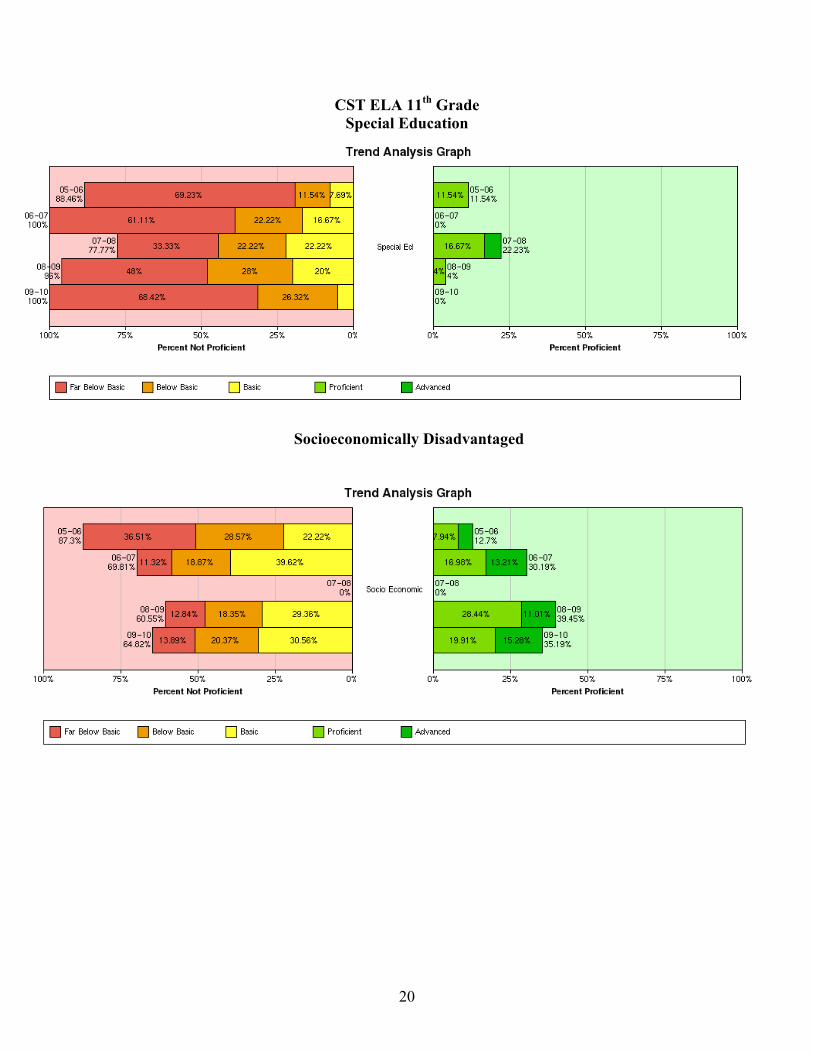
CST ELA 11th
Grade
Schoolwide
English Learners
20
CST ELA 11th
Grade
Special Education
Socioeconomically Disadvantaged
21
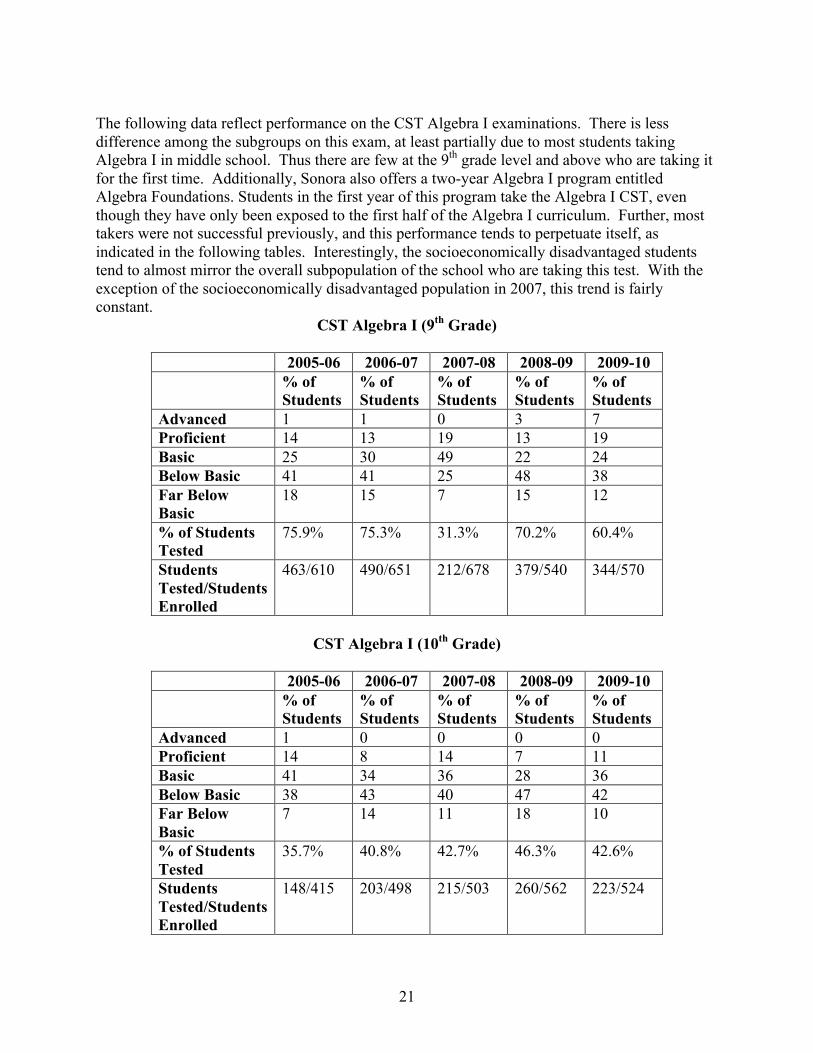
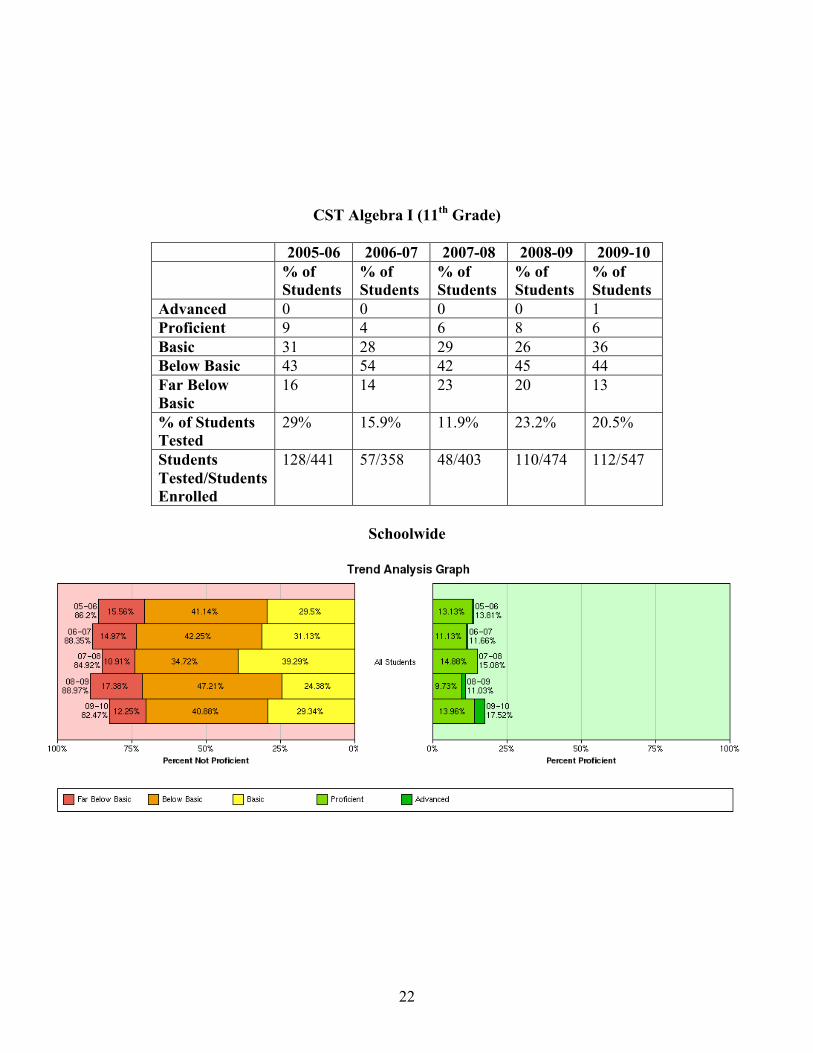
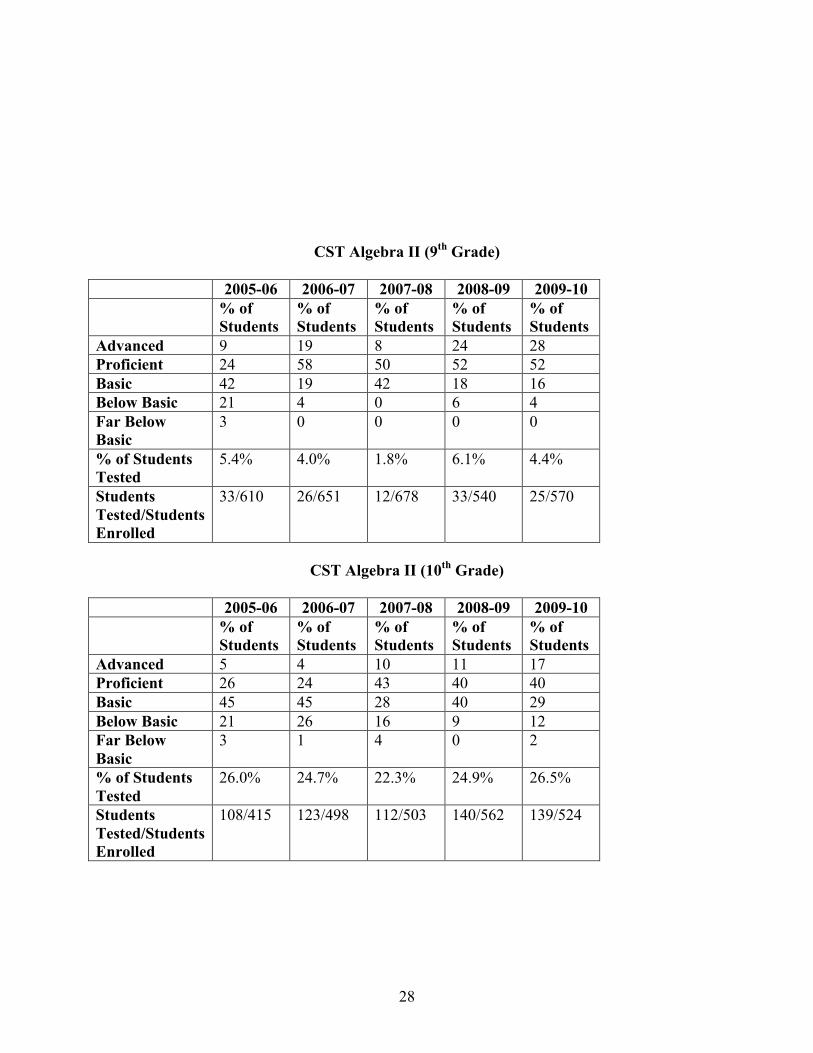
The following data reflect performance on the CST Algebra I examinations. There is less
difference among the subgroups on this exam, at least partially due to most students taking
Algebra I in middle school. Thus there are few at the 9th
grade level and above who are taking it
for the first time. Additionally, Sonora also offers a two-year Algebra I program entitled
Algebra Foundations. Students in the first year of this program take the Algebra I CST, even
though they have only been exposed to the first half of the Algebra I curriculum. Further, most
takers were not successful previously, and this performance tends to perpetuate itself, as
indicated in the following tables. Interestingly, the socioeconomically disadvantaged students
tend to almost mirror the overall subpopulation of the school who are taking this test. With the
exception of the socioeconomically disadvantaged population in 2007, this trend is fairly
constant.
CST Algebra I (9th
Grade)
2005-06 2006-07 2007-08 2008-09 2009-10
% of
Students
% of
Students
% of
Students
% of
Students
% of
Students
Advanced 1 1 0 3 7
Proficient 14 13 19 13 19
Basic 25 30 49 22 24
Below Basic 41 41 25 48 38
Far Below
Basic
18 15 7 15 12
% of Students
Tested
75.9% 75.3% 31.3% 70.2% 60.4%
Students
Tested/Students
Enrolled
463/610 490/651 212/678 379/540 344/570
CST Algebra I (10th
Grade)
2005-06 2006-07 2007-08 2008-09 2009-10
% of
Students
% of
Students
% of
Students
% of
Students
% of
Students
Advanced 1 0 0 0 0
Proficient 14 8 14 7 11
Basic 41 34 36 28 36
Below Basic 38 43 40 47 42
Far Below
Basic
7 14 11 18 10
% of Students
Tested
35.7% 40.8% 42.7% 46.3% 42.6%
Students
Tested/Students
Enrolled
148/415 203/498 215/503 260/562 223/524
22
CST Algebra I (11th
Grade)
2005-06 2006-07 2007-08 2008-09 2009-10
% of
Students
% of
Students
% of
Students
% of
Students
% of
Students
Advanced 0 0 0 0 1
Proficient 9 4 6 8 6
Basic 31 28 29 26 36
Below Basic 43 54 42 45 44
Far Below
Basic
16 14 23 20 13
% of Students
Tested
29% 15.9% 11.9% 23.2% 20.5%
Students
Tested/Students
Enrolled
128/441 57/358 48/403 110/474 112/547
Schoolwide
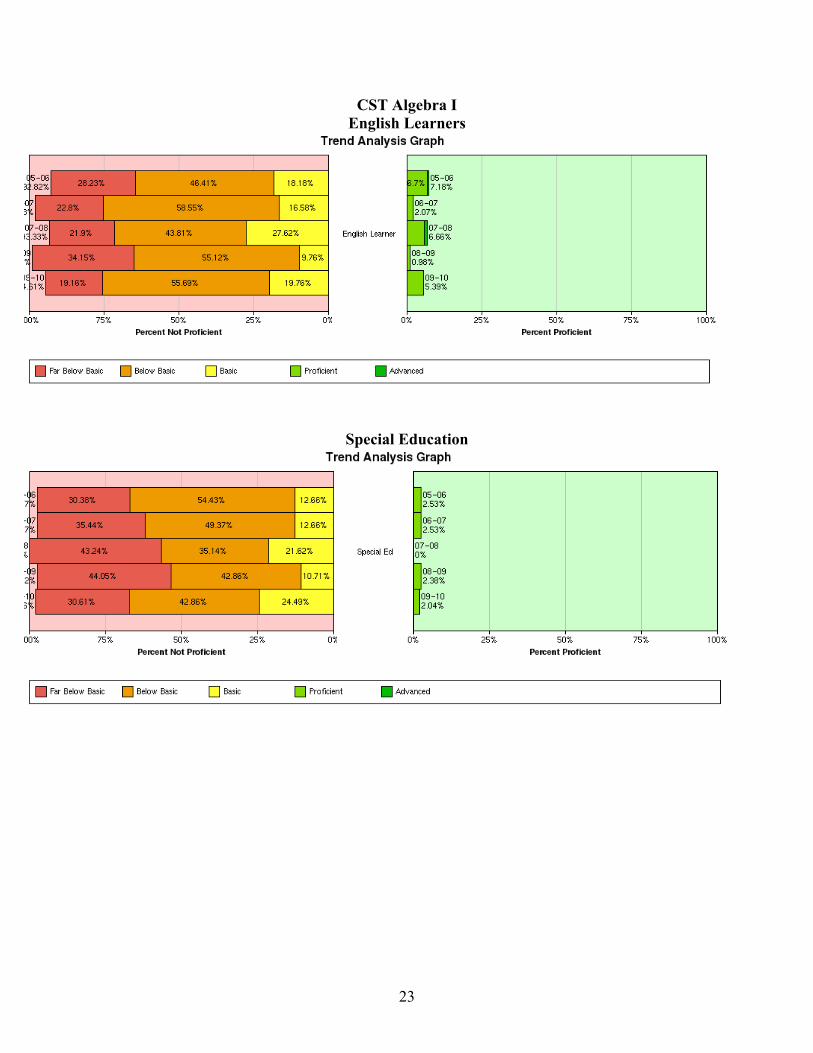
23
CST Algebra I
English Learners
Special Education

24
CST Algebra I
Socioeconomically Disadvantaged
Following are the CST Geometry performances for the 9th
, 10th
and 11th
grades. Interestingly,
the performance of the subgroups that generally are the most challenged tend to appear more
successful when compared to the general population on the geometry assessments. As would be
expected, those students who enrolled in Geometry when beginning high school in the ninth
grade performed better than those who began their Geometry studies as tenth or eleventh graders,
which show progressive declines in performance with each successive year of high school.
CST Geometry (9th
Grade)
2005-06 2006-07 2007-08 2008-09 2009-10
% of
Students
% of
Students
% of
Students
% of
Students
% of
Students
Advanced 8 19 30 19 15
Proficient 36 31 30 36 43
Basic 41 41 23 28 32
Below Basic 13 9 15 17 10
Far Below
Basic
2 0 1 0 0
% of Students
Tested
16.4% 17.8% 20.2% 21.5% 24.6%
Students
Tested/Students
Enrolled
110/610 116/651 137/678 116/540 140/570

25
CST Geometry (10th
Grade)
2005-06 2006-07 2007-08 2008-09 2009-10
% of
Students
% of
Students
% of
Students
% of
Students
% of
Students
Advanced 1 2 2 2 1
Proficient 21 8 17 21 21
Basic 48 40 37 38 52
Below Basic 27 41 39 36 24
Far Below
Basic
4 9 5 3 3
% of Students
Tested
29.9% 29.1% 25.6% 23.1% 19.5%
Students
Tested/Students
Enrolled
124/415 145/498 129/503 130/562 102/524
CST Geometry (11th
Grade)
2005-06 2006-07 2007-08 2008-09 2009-10
% of
Students
% of
Students
% of
Students
% of
Students
% of
Students
Advanced 0 1 0 0 0
Proficient 9 6 4 3 5
Basic 30 20 33 37 25
Below Basic 56 63 48 50 60
Far Below
Basic
6 9 15 10 10
% of Students
Tested
18.4% 22.1% 23.3% 21.5% 23.0%
Students
Tested/Students
Enrolled
81/441 79/358 94/403 102/474 126/547
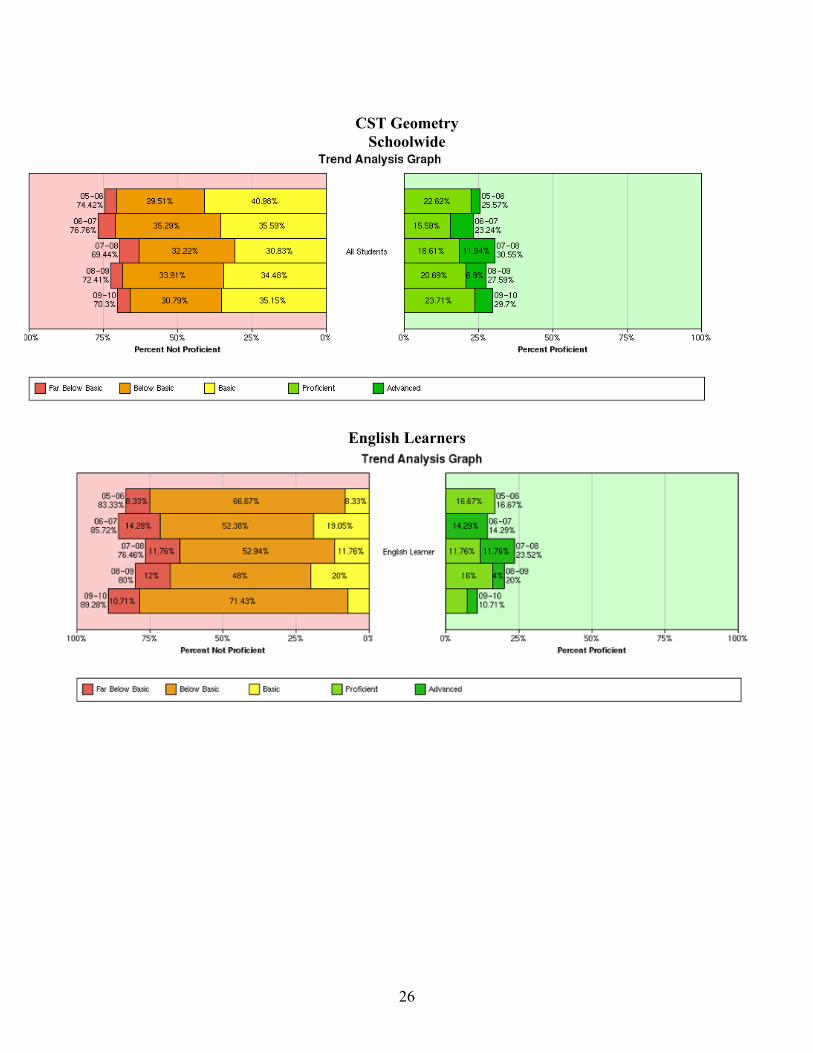
26
CST Geometry
Schoolwide
English Learners

27
CST Geometry
Special Education
Socioeconomically Disadvantaged
The CST Algebra II results follow, with the trend noted in the geometry comments again
reflected in these performances. The major difference in achievement, however, occurs, as
would be expected, between the 10th
and 11th
grades. Again, the 11th
grade scores largely
represent students who began their Algebra I course at the high school level instead of at the
middle school.
28
CST Algebra II (9th
Grade)
2005-06 2006-07 2007-08 2008-09 2009-10
% of
Students
% of
Students
% of
Students
% of
Students
% of
Students
Advanced 9 19 8 24 28
Proficient 24 58 50 52 52
Basic 42 19 42 18 16
Below Basic 21 4 0 6 4
Far Below
Basic
3 0 0 0 0
% of Students
Tested
5.4% 4.0% 1.8% 6.1% 4.4%
Students
Tested/Students
Enrolled
33/610 26/651 12/678 33/540 25/570
CST Algebra II (10th
Grade)
2005-06 2006-07 2007-08 2008-09 2009-10
% of
Students
% of
Students
% of
Students
% of
Students
% of
Students
Advanced 5 4 10 11 17
Proficient 26 24 43 40 40
Basic 45 45 28 40 29
Below Basic 21 26 16 9 12
Far Below
Basic
3 1 4 0 2
% of Students
Tested
26.0% 24.7% 22.3% 24.9% 26.5%
Students
Tested/Students
Enrolled
108/415 123/498 112/503 140/562 139/524

29
CST Algebra II (11th
Grade)
2005-06 2006-07 2007-08 2008-09 2009-10
% of
Students
% of
Students
% of
Students
% of
Students
% of
Students
Advanced 1 2 2 1 2
Proficient 12 10 21 21 19
Basic 38 35 41 43 45
Below Basic 36 45 27 31 28
Far Below
Basic
13 8 8 4 7
% of Students
Tested
37.0% 43.0% 36.5% 32.9% 32%
Students
Tested/Students
Enrolled
163/441 154/358 147/403 156/474 175/547
Schoolwide

30
CST Algebra II
English Learners
Special Education

31
CST Algebra II
Socioeconomically Disadvantaged
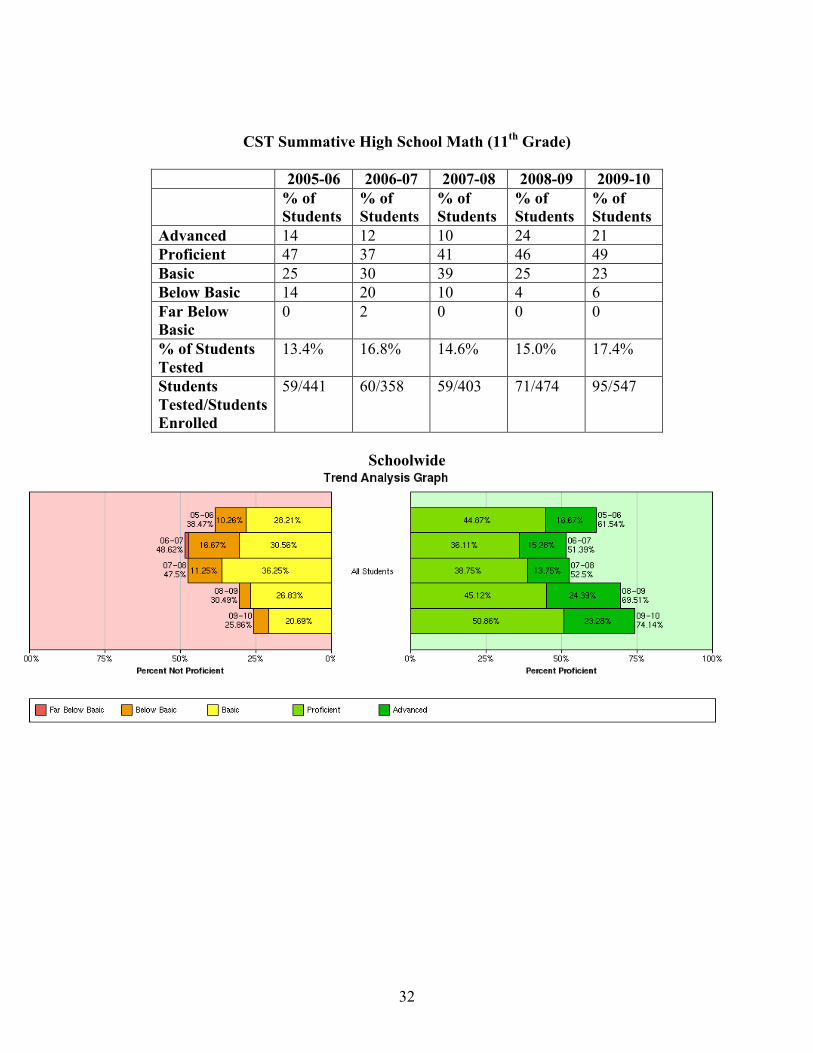
The Summative High School Math scores, presented in the following two charts, also
reflect higher achievement overall in the 10th
grade as compared to the 11th
. It may also
be noted that fewer ELs take this examination, with resulting higher performance
for those that do.
CST Summative High School Math (10th
Grade)
2005-06 2006-07 2007-08 2008-09 2009-10
% of
Students
% of
Students
% of
Students
% of
Students
% of
Students
Advanced 22 31 24 27 30
Proficient 39 38 33 36 60
Basic 39 31 29 36 10
Below Basic 0 0 14 0 0
Far Below
Basic
0 0 0 0 0
% of Students
Tested
4.3% 2.6% 4.2% 2.0% 3.8%
Students
Tested/Students
Enrolled
18/415 13/498 21/503 11/562 20/524
32
CST Summative High School Math (11th
Grade)
2005-06 2006-07 2007-08 2008-09 2009-10
% of
Students
% of
Students
% of
Students
% of
Students
% of
Students
Advanced 14 12 10 24 21
Proficient 47 37 41 46 49
Basic 25 30 39 25 23
Below Basic 14 20 10 4 6
Far Below
Basic
0 2 0 0 0
% of Students
Tested
13.4% 16.8% 14.6% 15.0% 17.4%
Students
Tested/Students
Enrolled
59/441 60/358 59/403 71/474 95/547
Schoolwide

33
CST Summative High School Math
English Learners
Socioeconomically Disadvantaged
34
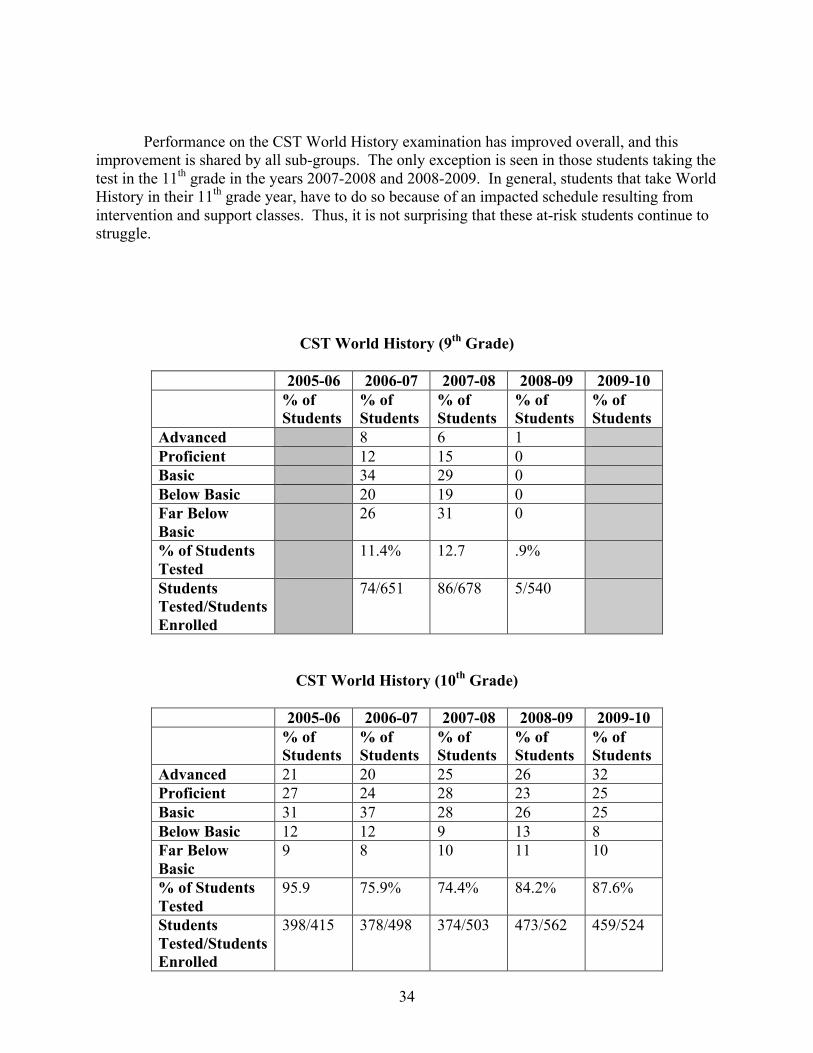
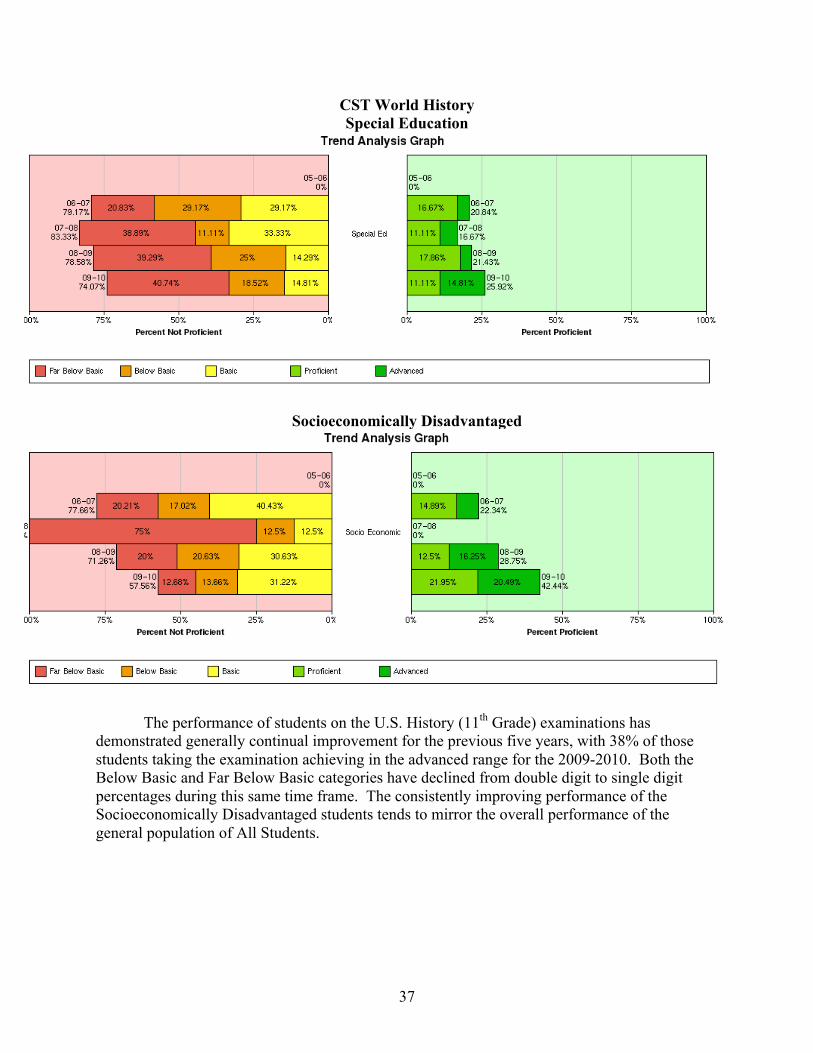
Performance on the CST World History examination has improved overall, and this
improvement is shared by all sub-groups. The only exception is seen in those students taking the
test in the 11th
grade in the years 2007-2008 and 2008-2009. In general, students that take World
History in their 11th
grade year, have to do so because of an impacted schedule resulting from
intervention and support classes. Thus, it is not surprising that these at-risk students continue to
struggle.
CST World History (9th
Grade)
2005-06 2006-07 2007-08 2008-09 2009-10
% of
Students
% of
Students
% of
Students
% of
Students
% of
Students
Advanced 8 6 1
Proficient 12 15 0
Basic 34 29 0
Below Basic 20 19 0
Far Below
Basic
26 31 0
% of Students
Tested
11.4% 12.7 .9%
Students
Tested/Students
Enrolled
74/651 86/678 5/540
CST World History (10th
Grade)
2005-06 2006-07 2007-08 2008-09 2009-10
% of
Students
% of
Students
% of
Students
% of
Students
% of
Students
Advanced 21 20 25 26 32
Proficient 27 24 28 23 25
Basic 31 37 28 26 25
Below Basic 12 12 9 13 8
Far Below
Basic
9 8 10 11 10
% of Students
Tested
95.9 75.9% 74.4% 84.2% 87.6%
Students
Tested/Students
Enrolled
398/415 378/498 374/503 473/562 459/524
35
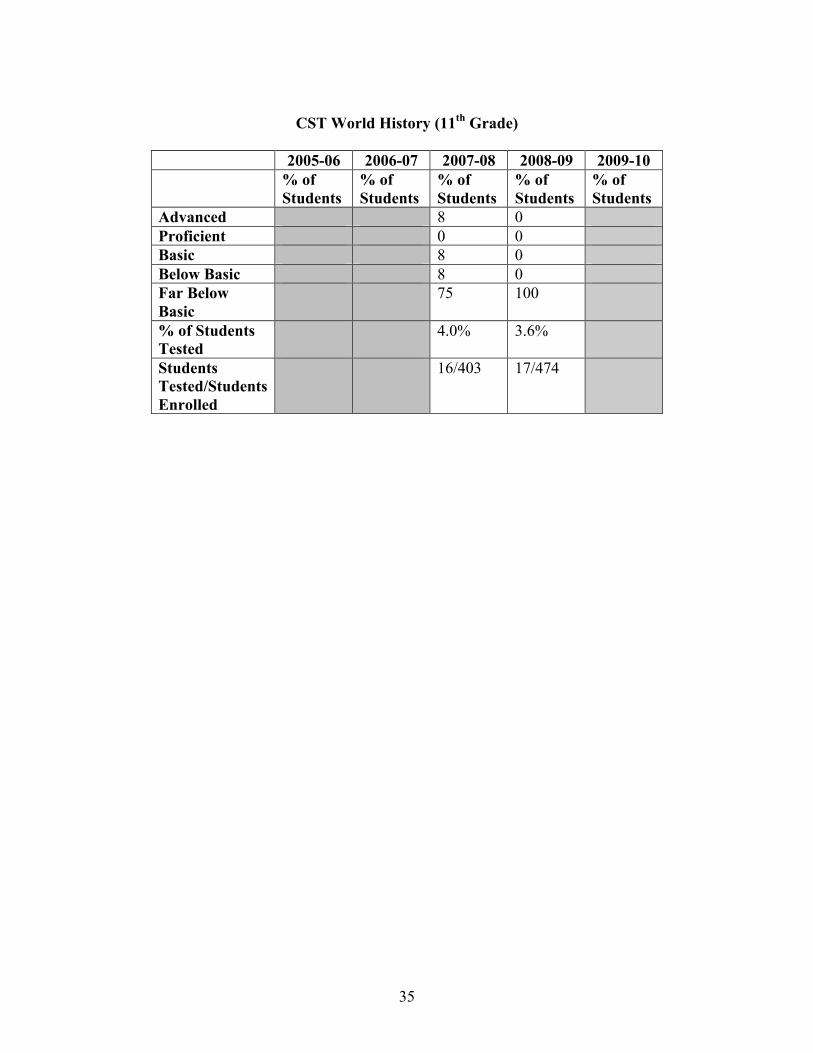
CST World History (11th
Grade)
2005-06 2006-07 2007-08 2008-09 2009-10
% of
Students
% of
Students
% of
Students
% of
Students
% of
Students
Advanced 8 0
Proficient 0 0
Basic 8 0
Below Basic 8 0
Far Below
Basic
75 100
% of Students
Tested
4.0% 3.6%
Students
Tested/Students
Enrolled
16/403 17/474
36
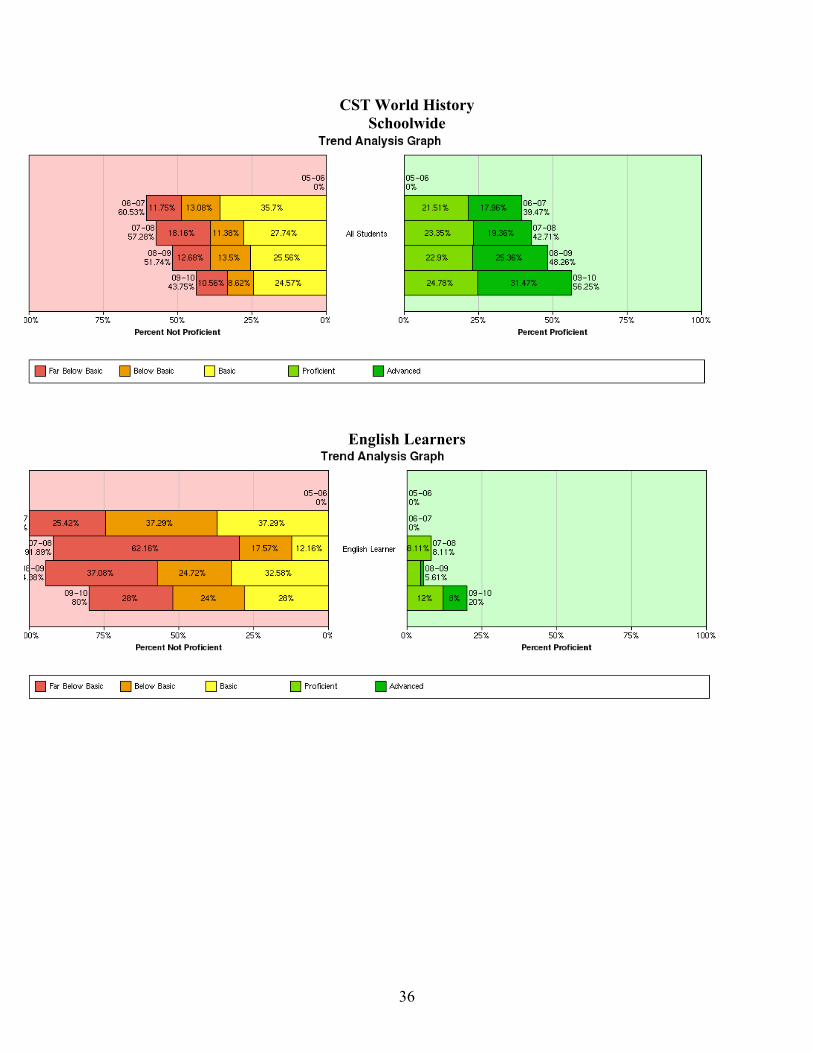
CST World History
Schoolwide
English Learners
37
CST World History
Special Education
Socioeconomically Disadvantaged
The performance of students on the U.S. History (11
th Grade) examinations has
demonstrated generally continual improvement for the previous five years, with 38% of those
students taking the examination achieving in the advanced range for the 2009-2010. Both the
Below Basic and Far Below Basic categories have declined from double digit to single digit
percentages during this same time frame. The consistently improving performance of the
Socioeconomically Disadvantaged students tends to mirror the overall performance of the
general population of All Students.

38
CST U.S. History (11th
Grade)
2005-06 2006-07 2007-08 2008-09 2009-10
% of
Students
% of
Students
% of
Students
% of
Students
% of
Students
Advanced 18 20 28 33 38
Proficient 28 33 35 32 31
Basic 29 31 21 19 18
Below Basic 14 11 9 8 6
Far Below
Basic
11 5 7 9 7
% of Students
Tested
97.5% 97.2% 97.3% 98.1% 96.3%
Students
Tested/Students
Enrolled
430/441 348/358 392/403 465/474 527/547
Schoolwide

39
CST U.S. History
English Learners
Special Education

40
CST U.S. History
Socioeconomically Disadvantaged
The Department of Natural Sciences at Sonora has undergone a major curricular change
over the past nine years, with the major changes having been finalized just at the beginning of
the second half of this current accreditation cycle. The department had been entirely in an
Integrated Science curriculum, combining Earth Science, Biology, Chemistry and Physics at both
the standard and honors levels. Other science electives, however, were offered and continue to
be available to all students. These include Astronomy, Marine Science, Organic/Biochemistry
and Physiology.
The transition back to the more traditional science curriculum model began with allowing
new incoming students to select either Integrated Science I or Biology (Honors or Regular) for
their freshman course. Their second course then would be either Biology or Chemistry. The
school has maintained the Integrated Science I course for all students, should they choose to
begin with such a survey course. A major result of this is a large current Physics offering,
including Regular, Honors, and Honors/IB. The current school year is the third year of offering
the traditional Physics course after approximately an eight-year absence during the Integrated
Science period. During the entire time of both total Integrated Sciences and the transition,
Higher Level International Baccalaureate Biology has been successfully maintained.
Also during this transition time, the Agriculture program, in line with Agriculture
programs across the state, began offering certain curricula with an Agriculture emphasis. On the
Sonora campus, in terms of the sciences, this has included Biology with an Agriculture
emphasis, and Earth Science. Following these courses, interested students generally transition
into the standard science curricula for Chemistry, Physics, and/or the previously described
science elective courses.
Knowledge of the existence of two different methods of science education during this
current accreditation cycle, the transition years between the two, and the interrelationship with
the Agriculture Program may help the reader better understand the data tables presenting science
achievement that follow.
41
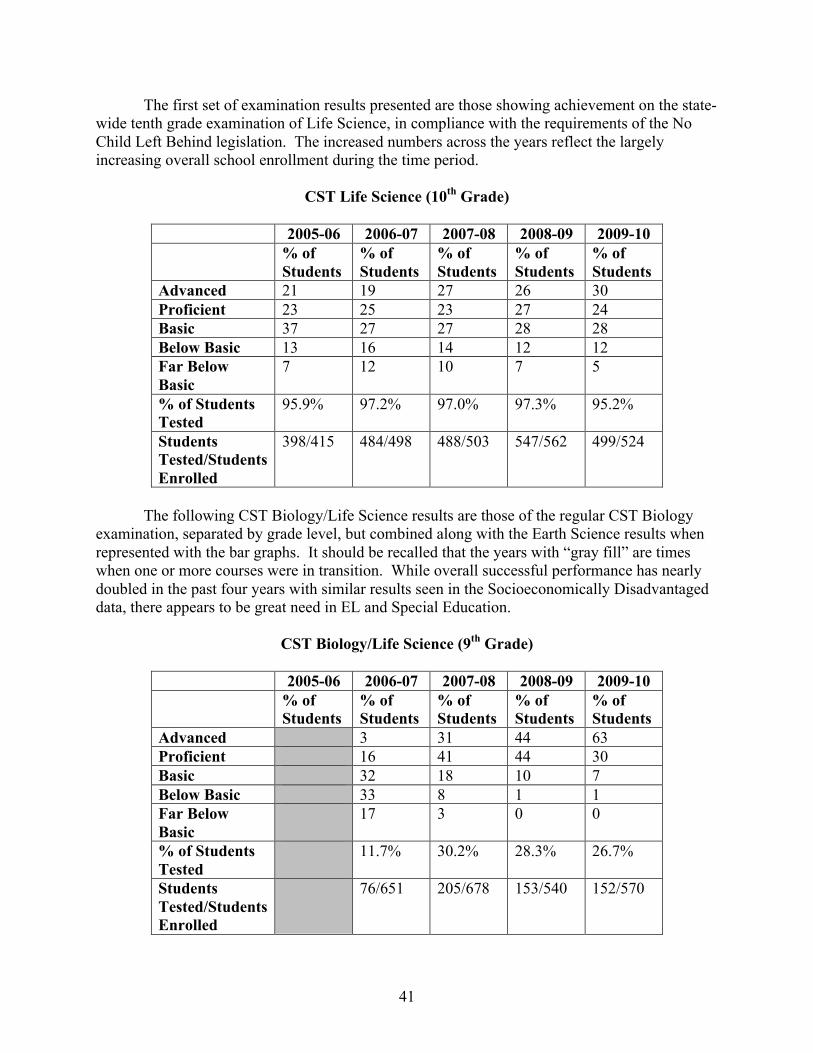
The first set of examination results presented are those showing achievement on the state-
wide tenth grade examination of Life Science, in compliance with the requirements of the No
Child Left Behind legislation. The increased numbers across the years reflect the largely
increasing overall school enrollment during the time period.
CST Life Science (10th
Grade)
2005-06 2006-07 2007-08 2008-09 2009-10
% of
Students
% of
Students
% of
Students
% of
Students
% of
Students
Advanced 21 19 27 26 30
Proficient 23 25 23 27 24
Basic 37 27 27 28 28
Below Basic 13 16 14 12 12
Far Below
Basic
7 12 10 7 5
% of Students
Tested
95.9% 97.2% 97.0% 97.3% 95.2%
Students
Tested/Students
Enrolled
398/415 484/498 488/503 547/562 499/524
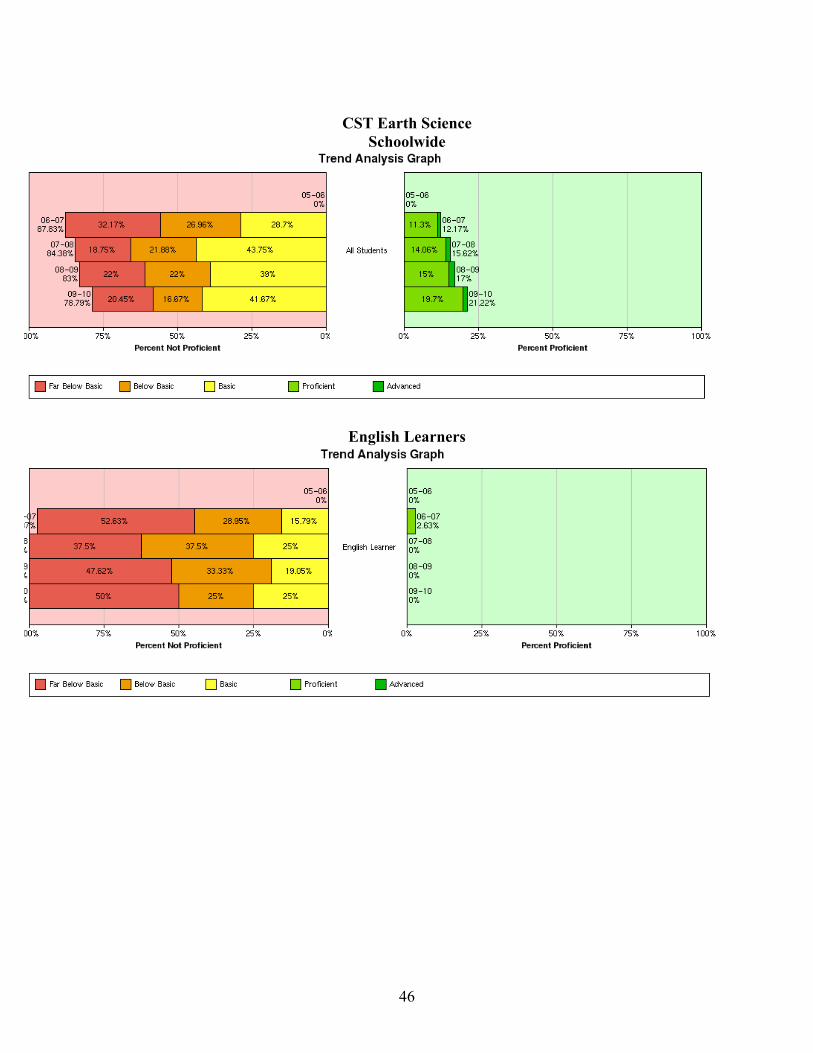
The following CST Biology/Life Science results are those of the regular CST Biology
examination, separated by grade level, but combined along with the Earth Science results when
represented with the bar graphs. It should be recalled that the years with “gray fill” are times
when one or more courses were in transition. While overall successful performance has nearly
doubled in the past four years with similar results seen in the Socioeconomically Disadvantaged
data, there appears to be great need in EL and Special Education.
CST Biology/Life Science (9th
Grade)
2005-06 2006-07 2007-08 2008-09 2009-10
% of
Students
% of
Students
% of
Students
% of
Students
% of
Students
Advanced 3 31 44 63
Proficient 16 41 44 30
Basic 32 18 10 7
Below Basic 33 8 1 1
Far Below
Basic
17 3 0 0
% of Students
Tested
11.7% 30.2% 28.3% 26.7%
Students
Tested/Students
Enrolled
76/651 205/678 153/540 152/570
42
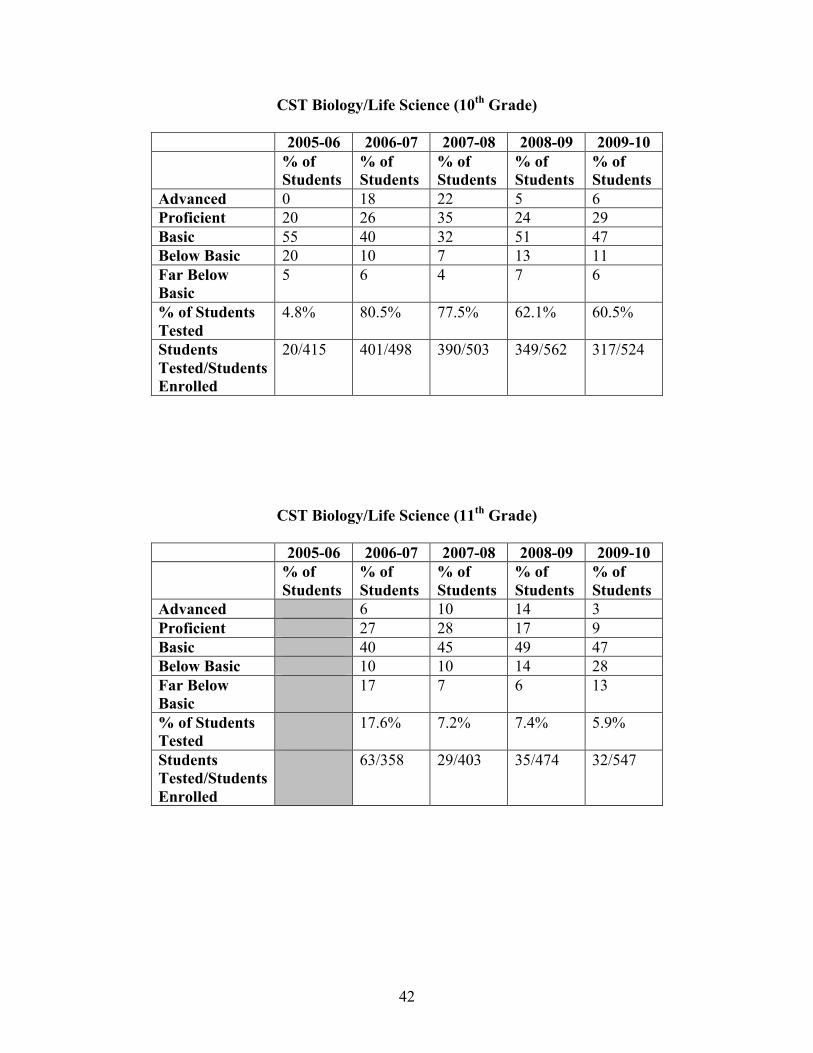
CST Biology/Life Science (10th
Grade)
2005-06 2006-07 2007-08 2008-09 2009-10
% of
Students
% of
Students
% of
Students
% of
Students
% of
Students
Advanced 0 18 22 5 6
Proficient 20 26 35 24 29
Basic 55 40 32 51 47
Below Basic 20 10 7 13 11
Far Below
Basic
5 6 4 7 6
% of Students
Tested
4.8% 80.5% 77.5% 62.1% 60.5%
Students
Tested/Students
Enrolled
20/415 401/498 390/503 349/562 317/524
CST Biology/Life Science (11th
Grade)
2005-06 2006-07 2007-08 2008-09 2009-10
% of
Students
% of
Students
% of
Students
% of
Students
% of
Students
Advanced 6 10 14 3
Proficient 27 28 17 9
Basic 40 45 49 47
Below Basic 10 10 14 28
Far Below
Basic
17 7 6 13
% of Students
Tested
17.6% 7.2% 7.4% 5.9%
Students
Tested/Students
Enrolled
63/358 29/403 35/474 32/547

43
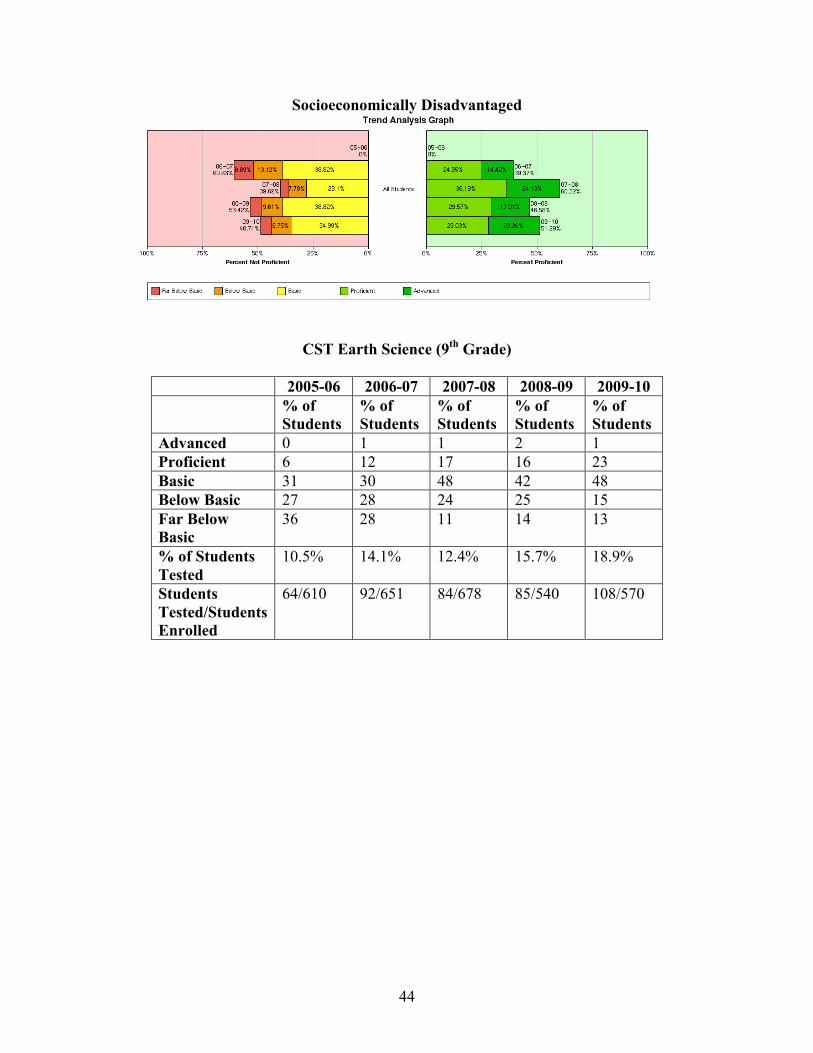
CST Biology/Life Science
Schoolwide
English Learners
Special Education
44
Socioeconomically Disadvantaged
CST Earth Science (9th
Grade)
2005-06 2006-07 2007-08 2008-09 2009-10
% of
Students
% of
Students
% of
Students
% of
Students
% of
Students
Advanced 0 1 1 2 1
Proficient 6 12 17 16 23
Basic 31 30 48 42 48
Below Basic 27 28 24 25 15
Far Below
Basic
36 28 11 14 13
% of Students
Tested
10.5% 14.1% 12.4% 15.7% 18.9%
Students
Tested/Students
Enrolled
64/610 92/651 84/678 85/540 108/570
45
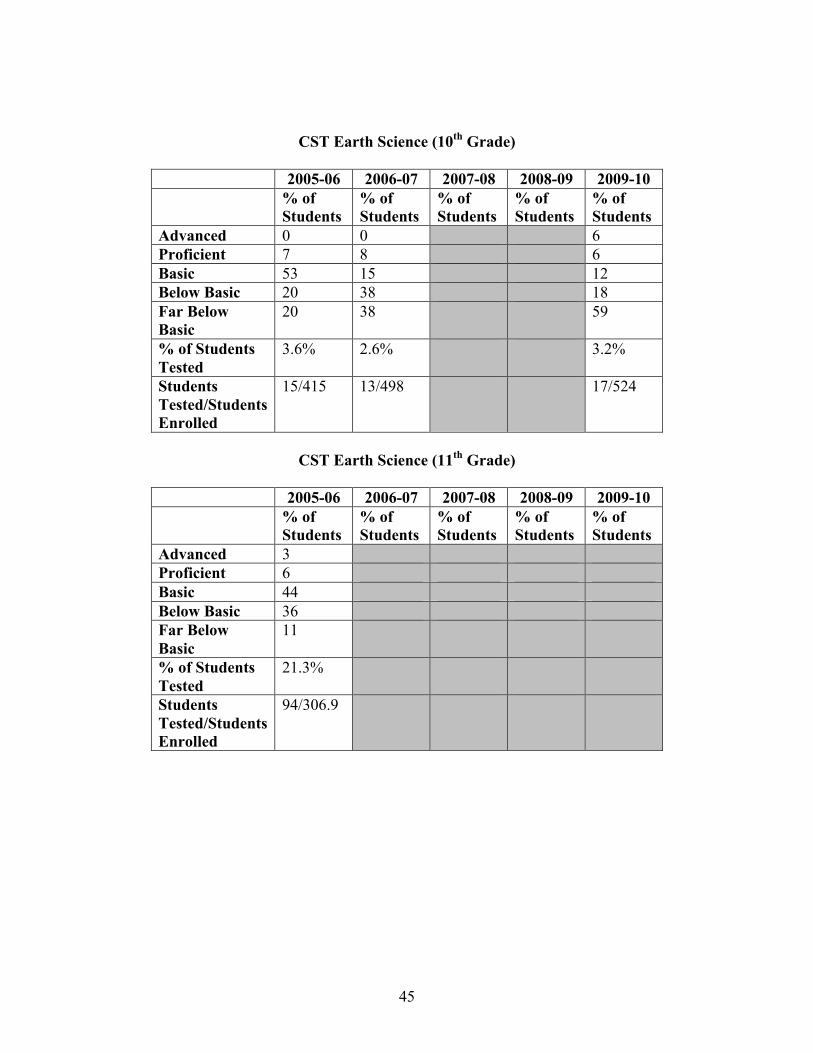
CST Earth Science (10th
Grade)
2005-06 2006-07 2007-08 2008-09 2009-10
% of
Students
% of
Students
% of
Students
% of
Students
% of
Students
Advanced 0 0 6
Proficient 7 8 6
Basic 53 15 12
Below Basic 20 38 18
Far Below
Basic
20 38 59
% of Students
Tested
3.6% 2.6% 3.2%
Students
Tested/Students
Enrolled
15/415 13/498 17/524
CST Earth Science (11th
Grade)
2005-06 2006-07 2007-08 2008-09 2009-10
% of
Students
% of
Students
% of
Students
% of
Students
% of
Students
Advanced 3
Proficient 6
Basic 44
Below Basic 36
Far Below
Basic
11
% of Students
Tested
21.3%
Students
Tested/Students
Enrolled
94/306.9
46
CST Earth Science
Schoolwide
English Learners
47
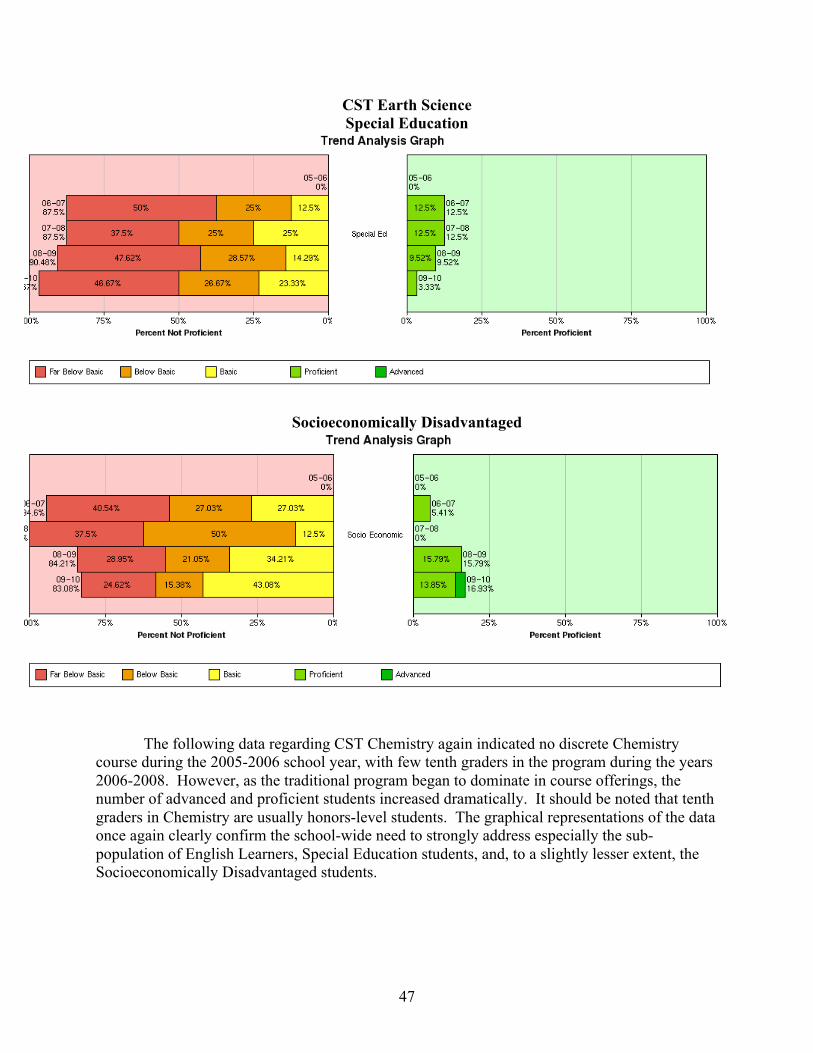
CST Earth Science
Special Education
Socioeconomically Disadvantaged
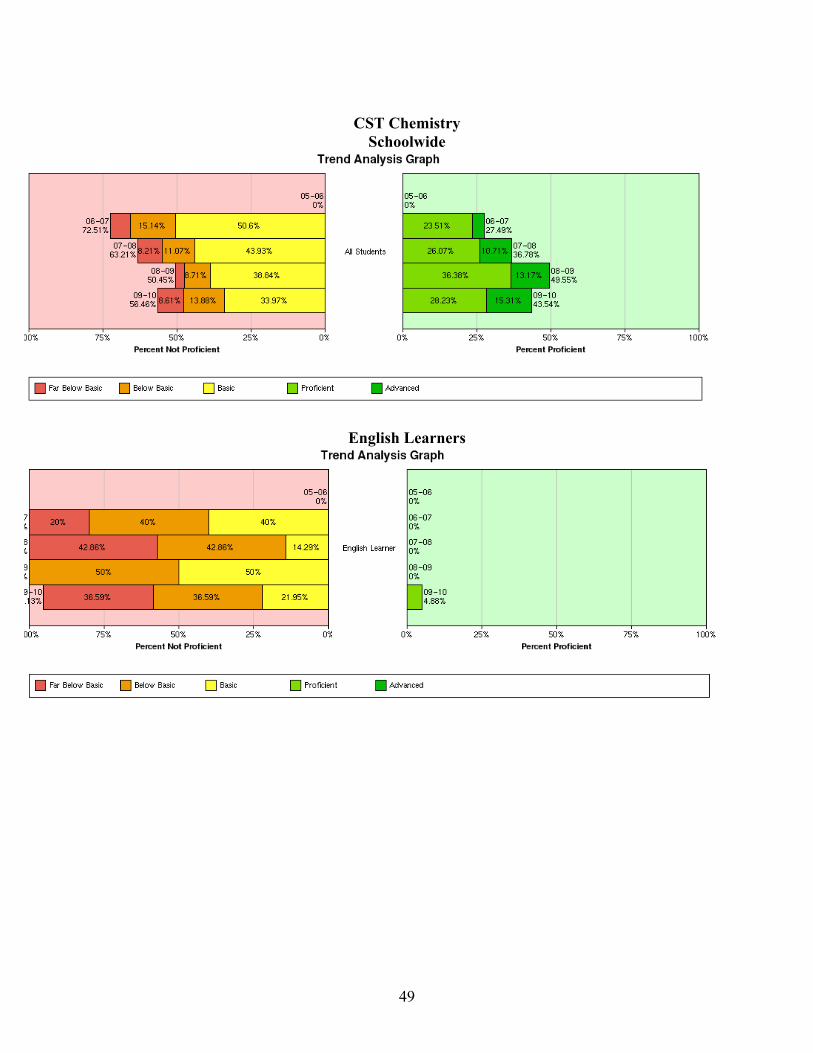
The following data regarding CST Chemistry again indicated no discrete Chemistry
course during the 2005-2006 school year, with few tenth graders in the program during the years
2006-2008. However, as the traditional program began to dominate in course offerings, the
number of advanced and proficient students increased dramatically. It should be noted that tenth
graders in Chemistry are usually honors-level students. The graphical representations of the data
once again clearly confirm the school-wide need to strongly address especially the sub-
population of English Learners, Special Education students, and, to a slightly lesser extent, the
Socioeconomically Disadvantaged students.
48
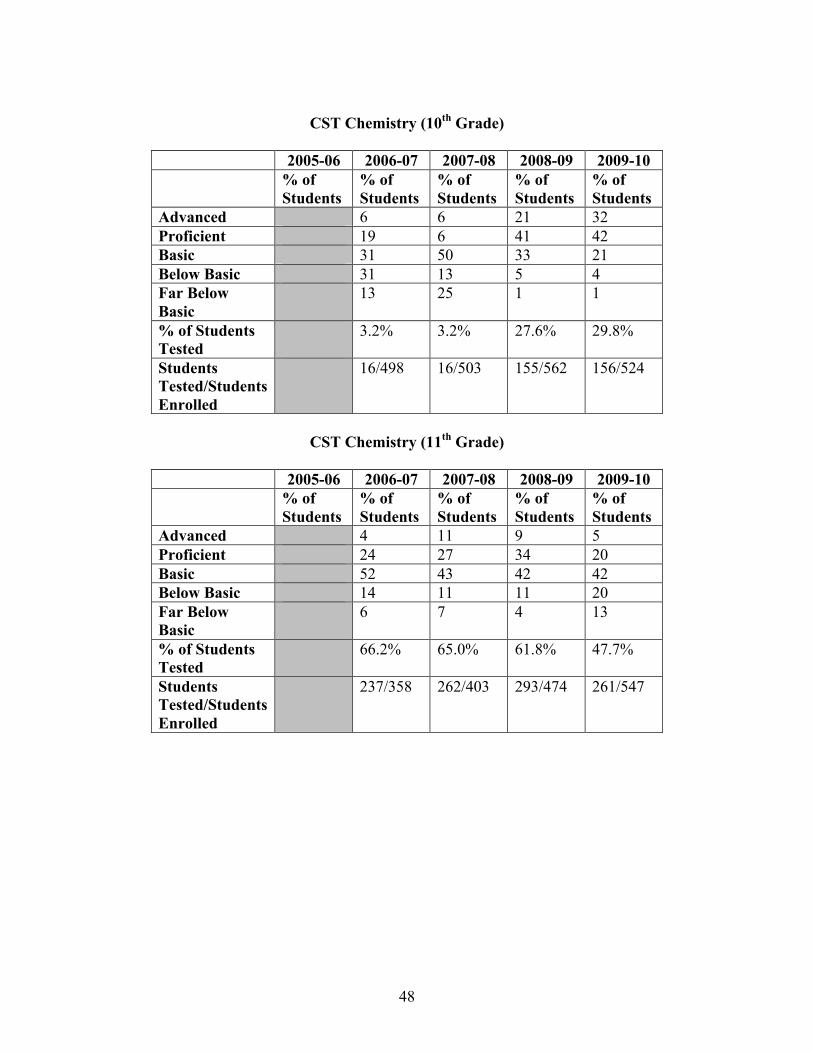
CST Chemistry (10th
Grade)
2005-06 2006-07 2007-08 2008-09 2009-10
% of
Students
% of
Students
% of
Students
% of
Students
% of
Students
Advanced 6 6 21 32
Proficient 19 6 41 42
Basic 31 50 33 21
Below Basic 31 13 5 4
Far Below
Basic
13 25 1 1
% of Students
Tested
3.2% 3.2% 27.6% 29.8%
Students
Tested/Students
Enrolled
16/498 16/503 155/562 156/524
CST Chemistry (11th
Grade)
2005-06 2006-07 2007-08 2008-09 2009-10
% of
Students
% of
Students
% of
Students
% of
Students
% of
Students
Advanced 4 11 9 5
Proficient 24 27 34 20
Basic 52 43 42 42
Below Basic 14 11 11 20
Far Below
Basic
6 7 4 13
% of Students
Tested
66.2% 65.0% 61.8% 47.7%
Students
Tested/Students
Enrolled
237/358 262/403 293/474 261/547
49
CST Chemistry
Schoolwide
English Learners

50
CST Chemistry
Special Education
Socioeconomically Disadvantaged
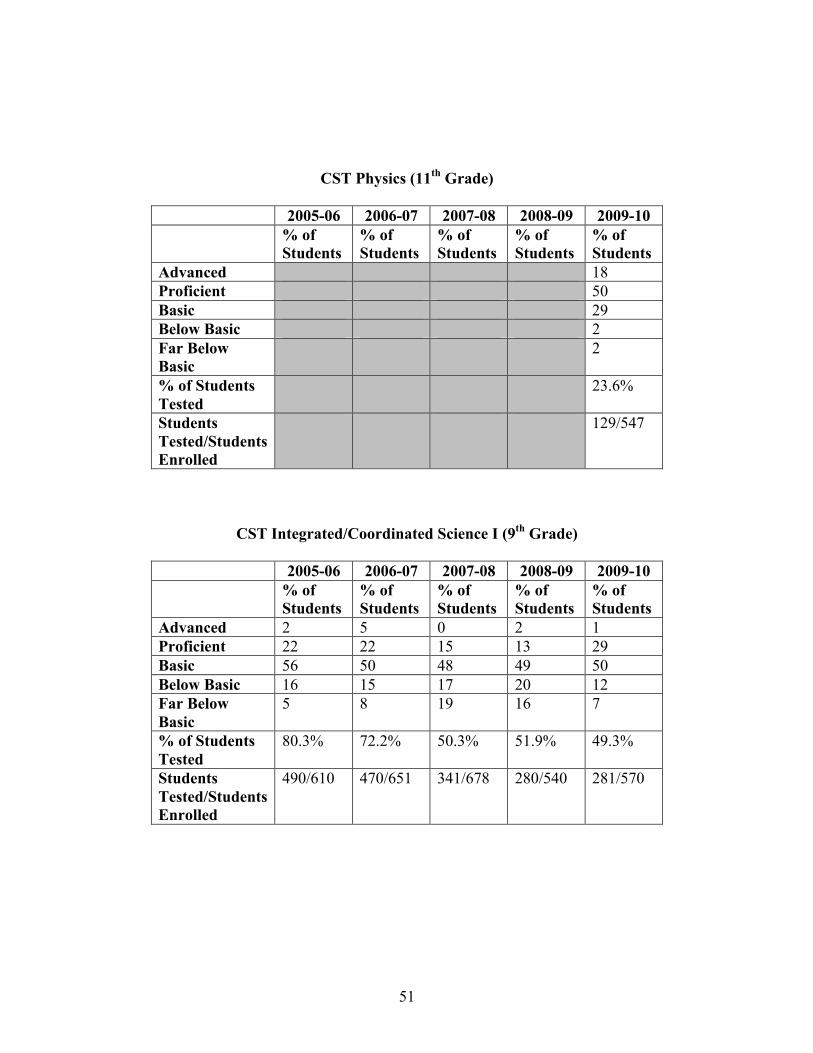
The final science course to complete the cycle in the Integrated to Classical Science
pattern of instruction was Physics, as indicated in the CST Physics. In this first year of CST
testing, 2009-2010, 68 students, or 53%, of those tested were Proficient or Advanced. It might
be reasonable at this point to remind readers that students do not sit for CST exams as seniors,
the grade level of many Physics students.
51
CST Physics (11th
Grade)
2005-06 2006-07 2007-08 2008-09 2009-10
% of
Students
% of
Students
% of
Students
% of
Students
% of
Students
Advanced 18
Proficient 50
Basic 29
Below Basic 2
Far Below
Basic
2
% of Students
Tested
23.6%
Students
Tested/Students
Enrolled
129/547
CST Integrated/Coordinated Science I (9th
Grade)
2005-06 2006-07 2007-08 2008-09 2009-10
% of
Students
% of
Students
% of
Students
% of
Students
% of
Students
Advanced 2 5 0 2 1
Proficient 22 22 15 13 29
Basic 56 50 48 49 50
Below Basic 16 15 17 20 12
Far Below
Basic
5 8 19 16 7
% of Students
Tested
80.3% 72.2% 50.3% 51.9% 49.3%
Students
Tested/Students
Enrolled
490/610 470/651 341/678 280/540 281/570
52
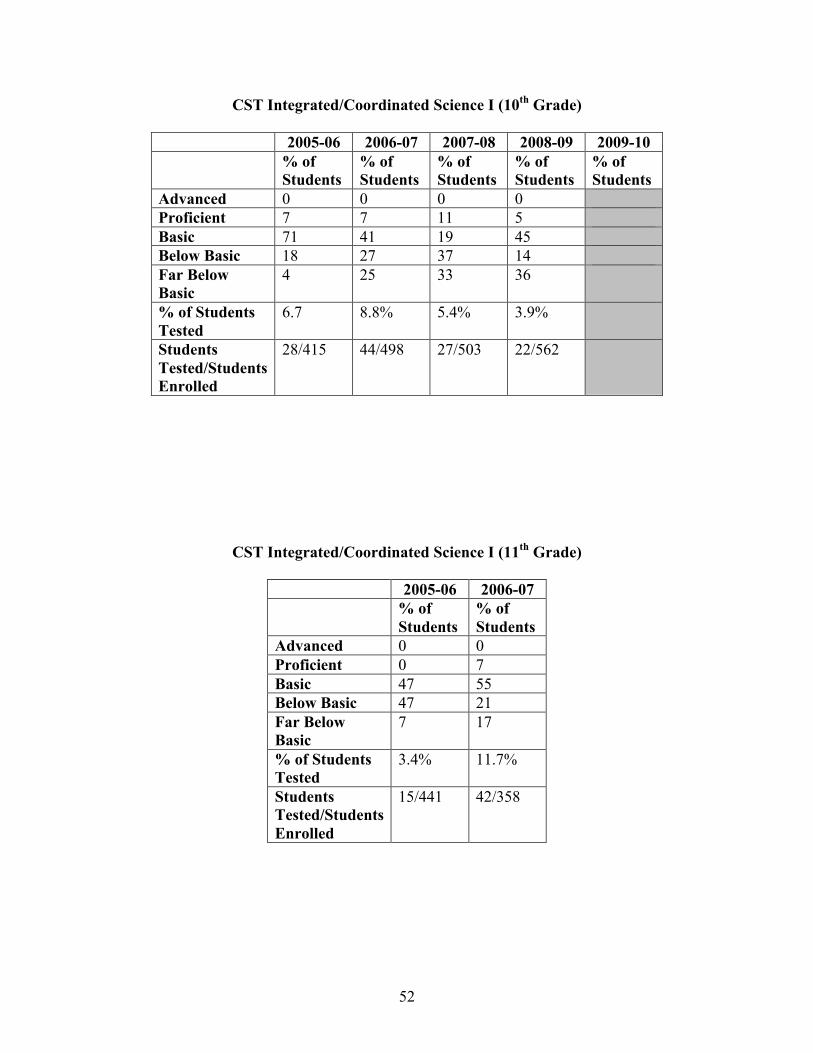
CST Integrated/Coordinated Science I (10th
Grade)
2005-06 2006-07 2007-08 2008-09 2009-10
% of
Students
% of
Students
% of
Students
% of
Students
% of
Students
Advanced 0 0 0 0
Proficient 7 7 11 5
Basic 71 41 19 45
Below Basic 18 27 37 14
Far Below
Basic
4 25 33 36
% of Students
Tested
6.7 8.8% 5.4% 3.9%
Students
Tested/Students
Enrolled
28/415 44/498 27/503 22/562
CST Integrated/Coordinated Science I (11th
Grade)
2005-06 2006-07
% of
Students
% of
Students
Advanced 0 0
Proficient 0 7
Basic 47 55
Below Basic 47 21
Far Below
Basic
7 17
% of Students
Tested
3.4% 11.7%
Students
Tested/Students
Enrolled
15/441 42/358
53
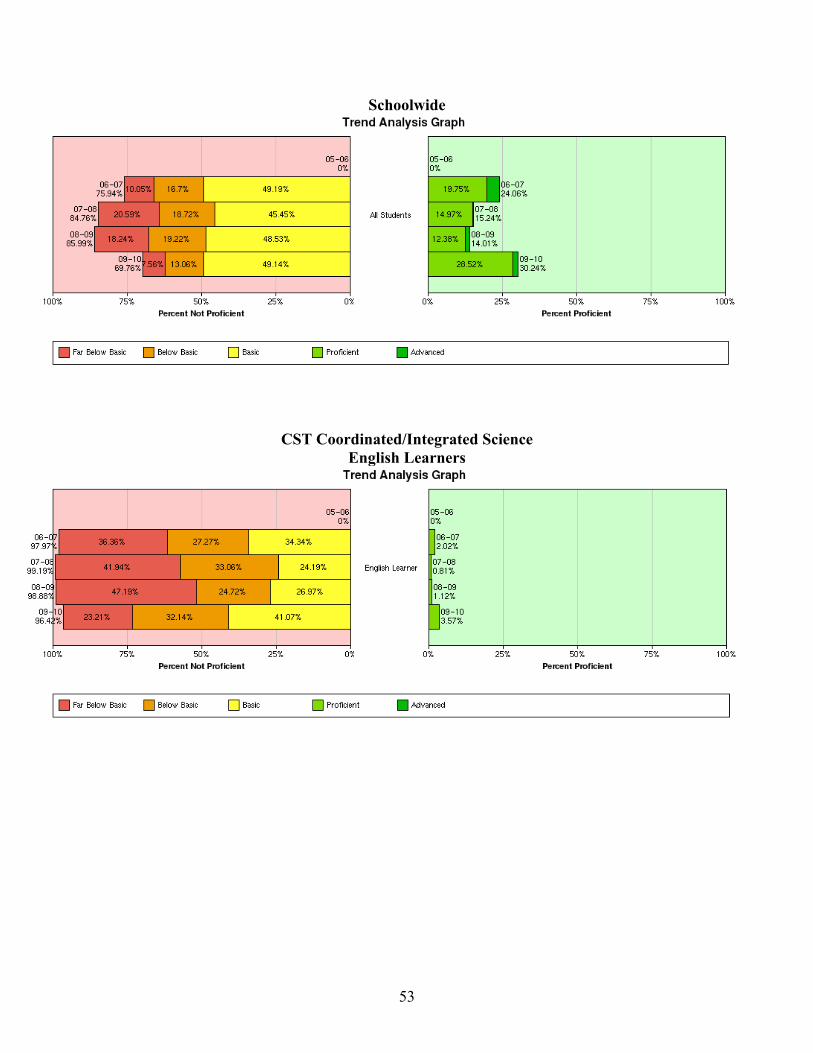
Schoolwide
CST Coordinated/Integrated Science
English Learners

54
Special Education
CST Coordinated/Integrated Science
Socioeconomically Disadvantaged

55
CST Integrated/
Coordinated Science II
(9th
Grade)
2005-06
% of
Students
Advanced 0
Proficient 2
Basic 29
Below
Basic
45
Far Below
Basic
24
% of
Students
Tested
6.9%
Students
Tested/
Students
Enrolled
42/610
CST Integrated/
Coordinated Science II
(10th
Grade)
2005-06
% of
Students
Advanced 3
Proficient 19
Basic 50
Below
Basic
20
Far Below
Basic
7
% of
Students
Tested
80.7%
Students
Tested/
Students
Enrolled
335/415
CST Integrated/
Coordinated Science II
(11th
Grade)
2005-06
% of
Students
Advanced 0
Proficient 11
Basic 54
Below
Basic
24
Far Below
Basic
11
% of
Students
Tested
14.3%
Students
Tested/
Students
Enrolled
63/441
56
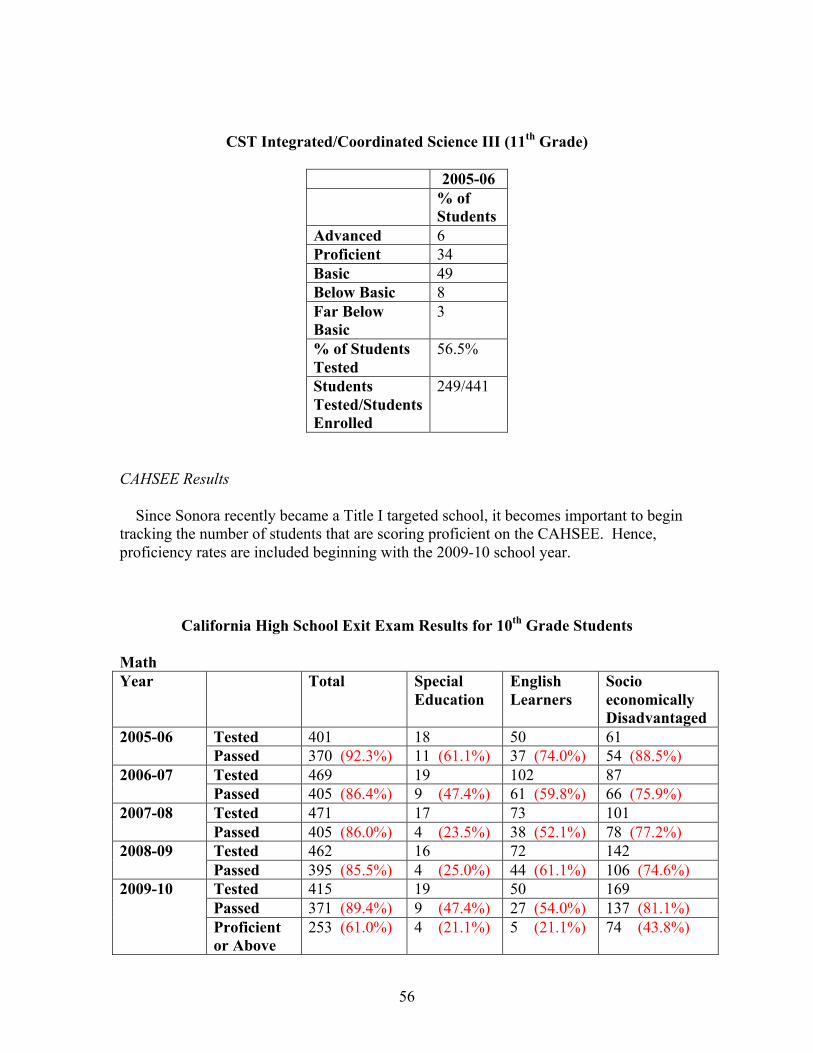
CST Integrated/Coordinated Science III (11th
Grade)
2005-06
% of
Students
Advanced 6
Proficient 34
Basic 49
Below Basic 8
Far Below
Basic
3
% of Students
Tested
56.5%
Students
Tested/Students
Enrolled
249/441
CAHSEE Results
Since Sonora recently became a Title I targeted school, it becomes important to begin
tracking the number of students that are scoring proficient on the CAHSEE. Hence,
proficiency rates are included beginning with the 2009-10 school year.
California High School Exit Exam Results for 10th
Grade Students
Math
Year Total Special
Education
English
Learners
Socio
economically
Disadvantaged
Tested 401 18 50 61 2005-06
Passed 370 (92.3%) 11 (61.1%) 37 (74.0%) 54 (88.5%)
Tested 469 19 102 87 2006-07
Passed 405 (86.4%) 9 (47.4%) 61 (59.8%) 66 (75.9%)
Tested 471 17 73 101 2007-08
Passed 405 (86.0%) 4 (23.5%) 38 (52.1%) 78 (77.2%)
Tested 462 16 72 142 2008-09
Passed 395 (85.5%) 4 (25.0%) 44 (61.1%) 106 (74.6%)
Tested 415 19 50 169
Passed 371 (89.4%) 9 (47.4%) 27 (54.0%) 137 (81.1%)
2009-10
Proficient
or Above
253 (61.0%) 4 (21.1%) 5 (21.1%) 74 (43.8%)
57
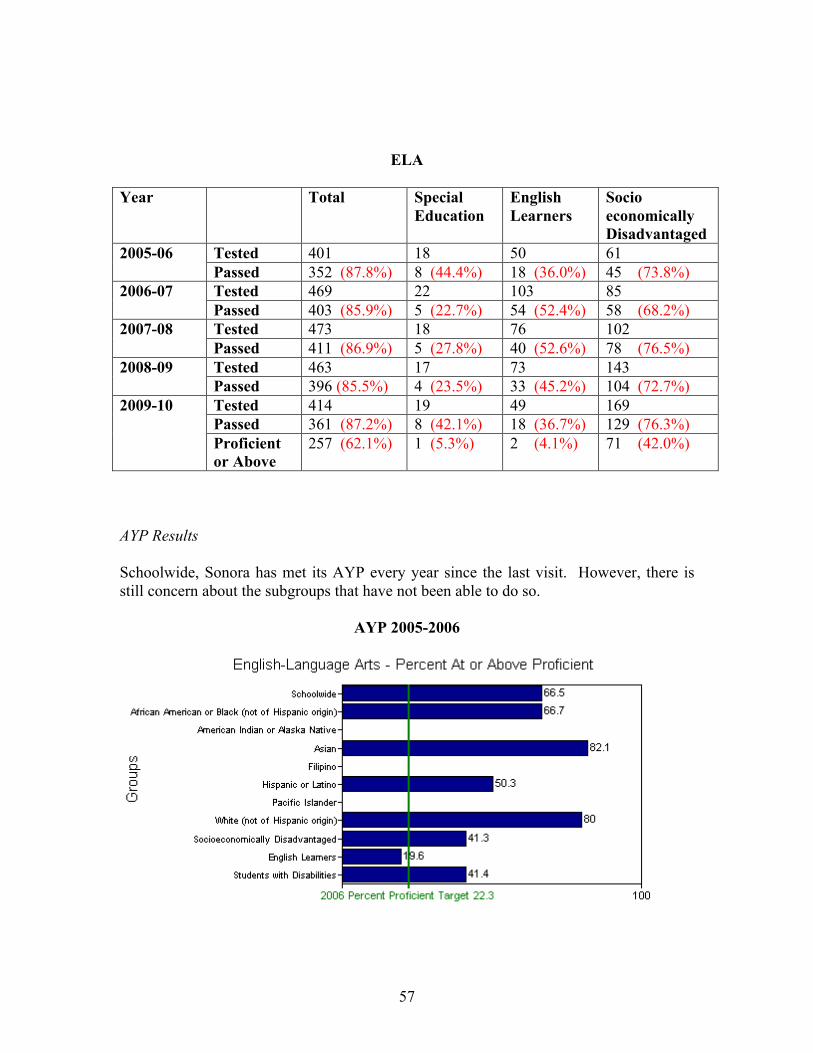
ELA
Year Total Special
Education
English
Learners
Socio
economically
Disadvantaged
Tested 401 18 50 61 2005-06
Passed 352 (87.8%) 8 (44.4%) 18 (36.0%) 45 (73.8%)
Tested 469 22 103 85 2006-07
Passed 403 (85.9%) 5 (22.7%) 54 (52.4%) 58 (68.2%)
Tested 473 18 76 102 2007-08
Passed 411 (86.9%) 5 (27.8%) 40 (52.6%) 78 (76.5%)
Tested 463 17 73 143 2008-09
Passed 396 (85.5%) 4 (23.5%) 33 (45.2%) 104 (72.7%)
Tested 414 19 49 169
Passed 361 (87.2%) 8 (42.1%) 18 (36.7%) 129 (76.3%)
2009-10
Proficient
or Above
257 (62.1%) 1 (5.3%) 2 (4.1%) 71 (42.0%)
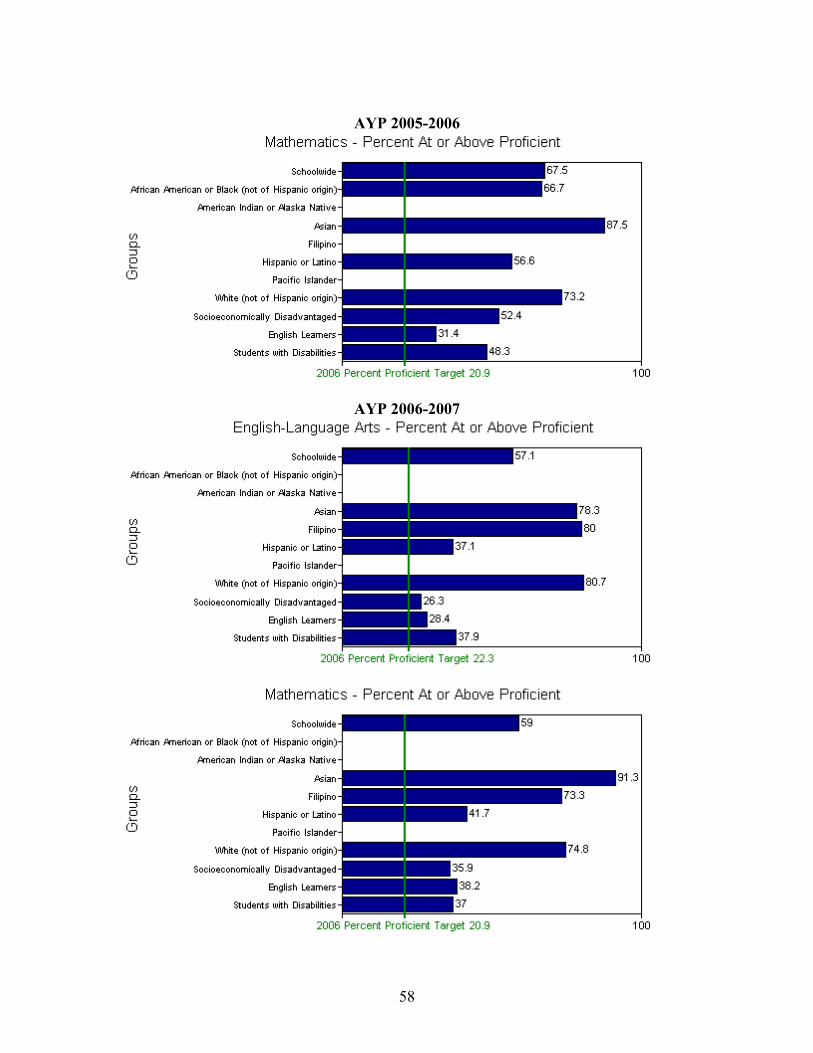
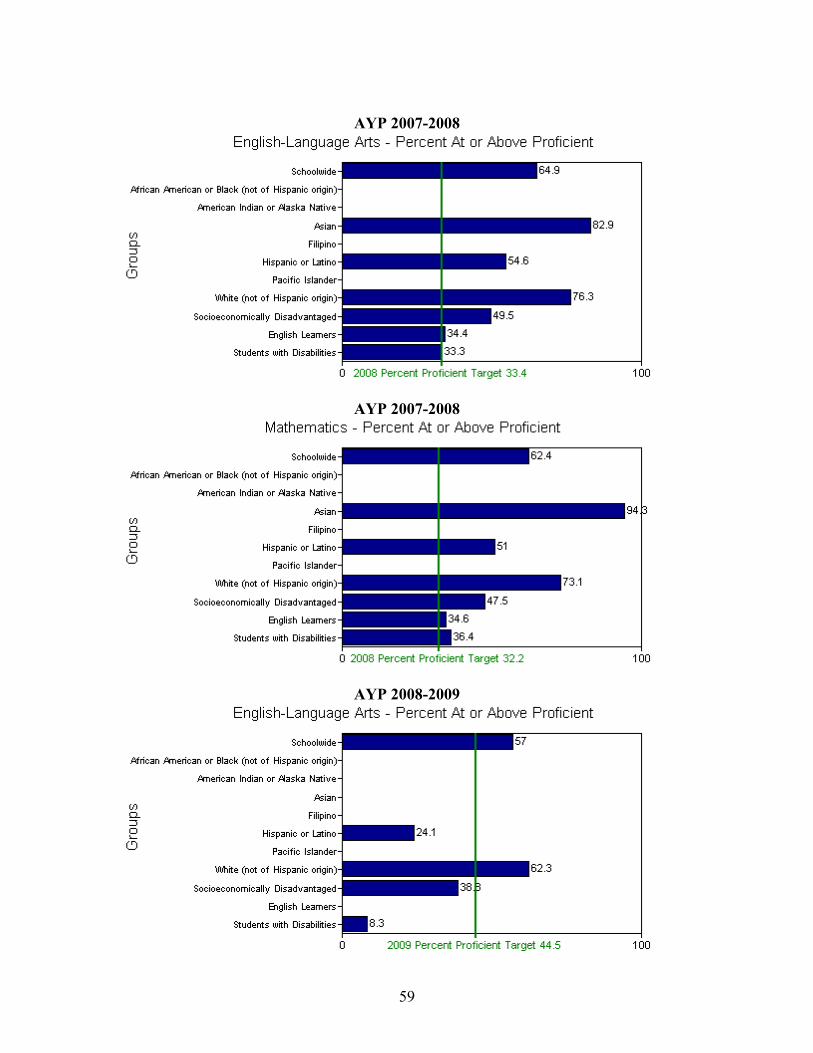
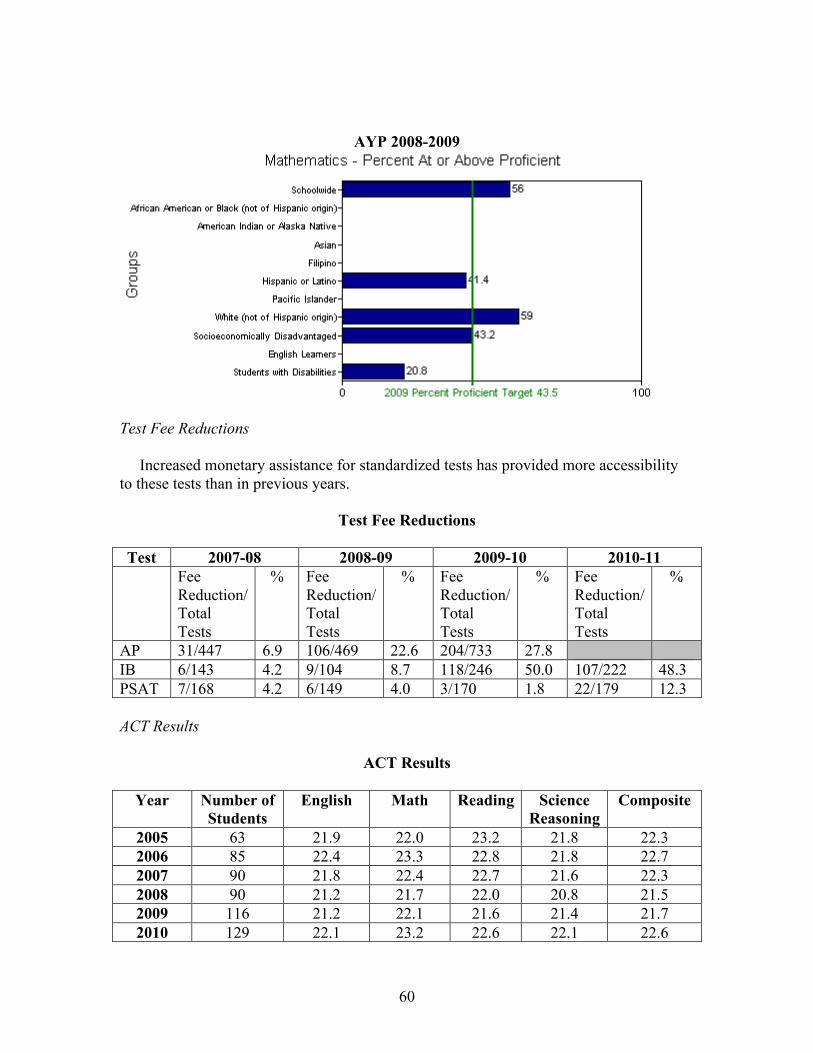
AYP Results
Schoolwide, Sonora has met its AYP every year since the last visit. However, there is
still concern about the subgroups that have not been able to do so.
AYP 2005-2006
58
AYP 2005-2006
AYP 2006-2007
59
AYP 2007-2008
AYP 2007-2008
AYP 2008-2009
60
AYP 2008-2009
Test Fee Reductions
Increased monetary assistance for standardized tests has provided more accessibility
to these tests than in previous years.
Test Fee Reductions
Test 2007-08 2008-09 2009-10 2010-11
Fee
Reduction/
Total
Tests
% Fee
Reduction/
Total
Tests
% Fee
Reduction/
Total
Tests
% Fee
Reduction/
Total
Tests
%
AP 31/447 6.9 106/469 22.6 204/733 27.8
IB 6/143 4.2 9/104 8.7 118/246 50.0 107/222 48.3
PSAT 7/168 4.2 6/149 4.0 3/170 1.8 22/179 12.3
ACT Results
ACT Results
Year Number of
Students
English Math Reading Science
Reasoning
Composite
2005 63 21.9 22.0 23.2 21.8 22.3
2006 85 22.4 23.3 22.8 21.8 22.7
2007 90 21.8 22.4 22.7 21.6 22.3
2008 90 21.2 21.7 22.0 20.8 21.5
2009 116 21.2 22.1 21.6 21.4 21.7
2010 129 22.1 23.2 22.6 22.1 22.6

61
SAT I Results
SAT I Results
Year
Number of
Students Tested
Math Scores
Critical
Reading
Scores
Writing
Scores
2006 219 523 516 519
2007 207 514 504 506
2008 191 517 507 510
2009 193 501 486 482
2010 186 528 514 513
Advanced Placement Exam Results
The data indicate strong performance in that while nearly increasing the total students
taking the Advanced Placement Examinations by approximately 2.5 times, the passage
rate, instead of stagnating or lowering, actually increased by 6 %.
Total Advanced Placement Exams
Year 2006 2007 2008 2009 2010
Number of
Tests Taken
244 220 249 286 719
Passage
rate, %
67 70 65 78 73
Advanced Placement Examination results for the years 2006-2010 may be found
below, presented by year and by subject area tested within that year.
Advanced Placement Exam Results
(The data appears on the following page.)

62
Advanced Placement Exam Results
AP
Ex
am
Sco
re
Bio
log
y
Ca
lcu
lus A
B
Ca
lcu
lus B
C
Eco
n M
acro
En
glish
La
ng
ua
ge
En
glish
Lit/C
om
p
Eu
ro
pea
n H
istory
Fren
ch
La
ng
ua
ge
U.S
. Go
vern
men
t
Ph
ysic
s B
Psy
ch
olo
gy
Sp
an
ish L
an
gu
ag
e
Sp
an
ish L
itera
ture
Sta
tistics
Stu
dio
Art-D
ra
win
g
Stu
dio
Art 2
D
U.S
. Histo
ry
Hu
ma
n G
eo
gra
ph
y
To
tal G
ra
des R
ep
orte
d
Percen
tag
e o
f To
tal
2006 Total # of Tests: 244
5 3 1 1 5 3 1 1 4 8 0 0 0 11 38 9
4 10 5 2 17 6 0 8 20 10 1 2 0 12 93 22
3 8 5 4 26 36 0 19 17 10 2 4 0 20 15
1
36
2 12 12 3 3 19 2 15 4 9 0 2 4 12 97 23
1 1 10 5 0 5 3 0 2 6 4 5 0 1 42 10
Tot 34 33 15 51 69 6 43 47 43 7 13 4 56 42
1
100
2007 Total # of Tests: 220
5 3 1 1 0 5 4 0 1 6 8 0 0 0 10 39 10
4 16 7 0 2 10 15 0 4 28 11 2 0 0 20 11
5
30
3 9 2 0 1 22 23 1 10 16 6 0 5 2 17 11
4
30
2 6 8 0 5 8 9 0 14 3 9 0 2 0 7 71 18
1 4 16 0 7 0 4 1 3 5 6 0 0 0 0 46 12
Tot 38 34 1 15 45 55 2 32 58 40 2 7 2 54 38
5
100
2008 Total # of Tests: 249
5 6 8 0 5 3 0 1 9 3 1 0 8 44 11
4 5 10 0 12 5 0 1 18 10 2 1 22 86 21
3 2 9 1 19 44 1 9 15 12 4 6 16 13
8
33
2 7 4 8 2 10 2 14 9 15 4 9 10 94 23
1 6 2 8 0 9 2 5 3 11 1 4 1 52 13
Tot 26 33 17 38 71 5 30 54 51 1
2
20 57 41
4
100
2009 Total # of Tests: 286
5 12 6 2 1 1 4 17 1 3 0 18 17 0 0 0 10 92 20
4 6 9 5 2 6 10 23 1 3 0 27 15 0 3 2 24 13
6
30
3 6 12 0 1 18 10 32 0 5 1 12 9 0 2 0 19 12
7
28
2 5 6 0 4 11 4 7 0 6 0 4 4 0 2 0 9 62 14
1 5 4 0 3 2 0 4 2 4 0 3 5 1 1 0 3 37 8
Tot 34 37 7 11 38 28 83 4 21 1 64 50 1 8 2 65 45 100
63
4
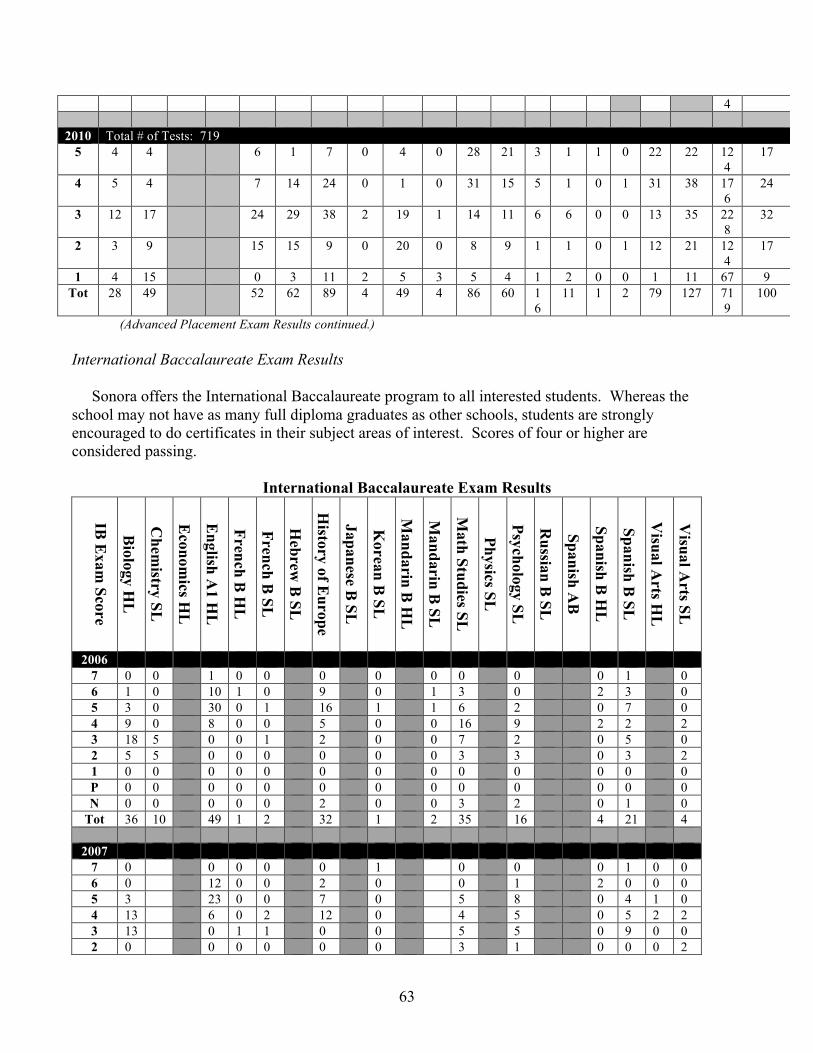
2010 Total # of Tests: 719
5 4 4 6 1 7 0 4 0 28 21 3 1 1 0 22 22 12
4
17
4 5 4 7 14 24 0 1 0 31 15 5 1 0 1 31 38 17
6
24
3 12 17 24 29 38 2 19 1 14 11 6 6 0 0 13 35 22
8
32
2 3 9 15 15 9 0 20 0 8 9 1 1 0 1 12 21 12
4
17
1 4 15 0 3 11 2 5 3 5 4 1 2 0 0 1 11 67 9
Tot 28 49 52 62 89 4 49 4 86 60 1
6
11 1 2 79 127 71
9
100
(Advanced Placement Exam Results continued.)
International Baccalaureate Exam Results
Sonora offers the International Baccalaureate program to all interested students. Whereas the
school may not have as many full diploma graduates as other schools, students are strongly
encouraged to do certificates in their subject areas of interest. Scores of four or higher are
considered passing.
International Baccalaureate Exam Results
IB E
xam
Sco
re
Bio
logy H
L
Ch
emistry
SL
Eco
nom
ics HL
En
glish
A1 H
L
Fren
ch B
HL
Fren
ch B
SL
Heb
rew B
SL
Histo
ry o
f Eu
rop
e
HL
Jap
an
ese B S
L
Korea
n B
SL
Man
darin
B H
L
Man
darin
B S
L
Math
Stu
dies S
L
Ph
ysics S
L
Psy
cholo
gy S
L
Ru
ssian
B S
L
Sp
an
ish A
B
Sp
an
ish B
HL
Sp
an
ish B
SL
Visu
al A
rts HL
Visu
al A
rts SL
2006
7 0 0 1 0 0 0 0 0 0 0 0 1 0
6 1 0 10 1 0 9 0 1 3 0 2 3 0
5 3 0 30 0 1 16 1 1 6 2 0 7 0
4 9 0 8 0 0 5 0 0 16 9 2 2 2
3 18 5 0 0 1 2 0 0 7 2 0 5 0
2 5 5 0 0 0 0 0 0 3 3 0 3 2
1 0 0 0 0 0 0 0 0 0 0 0 0 0
P 0 0 0 0 0 0 0 0 0 0 0 0 0
N 0 0 0 0 0 2 0 0 3 2 0 1 0
Tot 36 10 49 1 2 32 1 2 35 16 4 21 4
2007
7 0 0 0 0 0 1 0 0 0 1 0 0
6 0 12 0 0 2 0 0 1 2 0 0 0
5 3 23 0 0 7 0 5 8 0 4 1 0
4 13 6 0 2 12 0 4 5 0 5 2 2
3 13 0 1 1 0 0 5 5 0 9 0 0
2 0 0 0 0 0 0 3 1 0 0 0 2
64
1 0 0 0 0 0 0 0 0 0 0 0 0
P 0 0 0 0 0 0 0 0 0 0 0 0
N 0 0 0 0 0 0 9 0 0 1 0 0
Tot 29 41 1 3 21 1 17 20 2 19 3 40
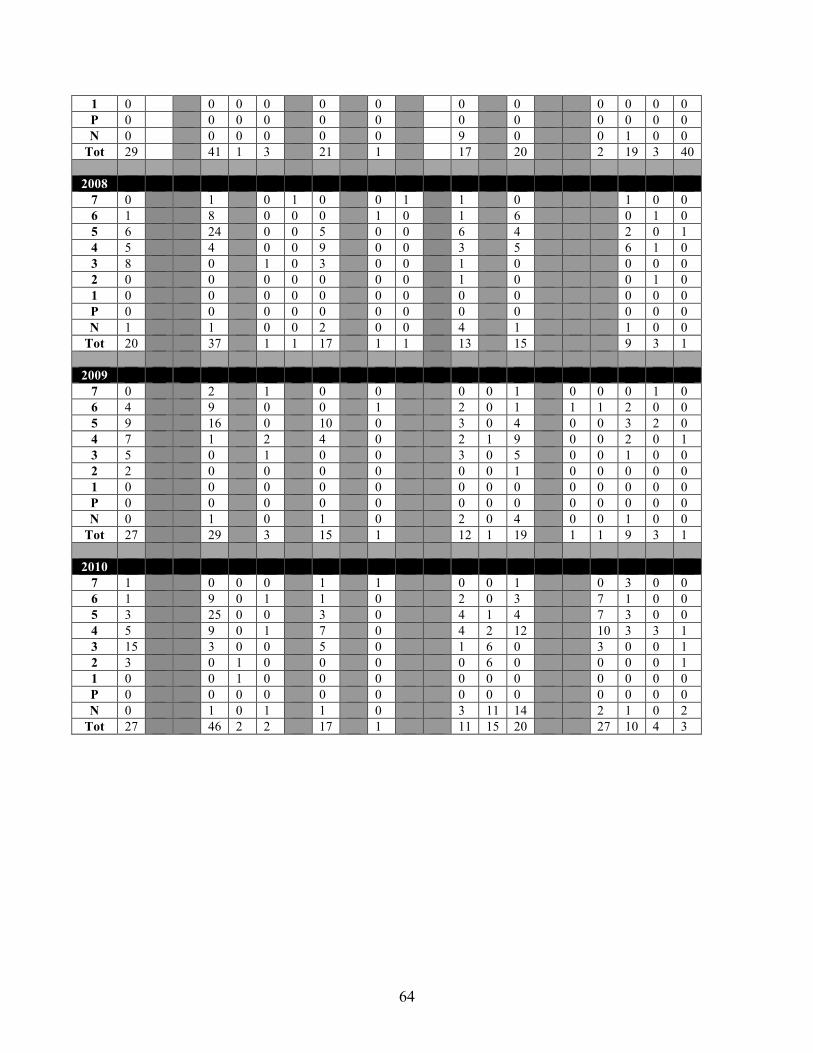
2008
7 0 1 0 1 0 0 1 1 0 1 0 0
6 1 8 0 0 0 1 0 1 6 0 1 0
5 6 24 0 0 5 0 0 6 4 2 0 1
4 5 4 0 0 9 0 0 3 5 6 1 0
3 8 0 1 0 3 0 0 1 0 0 0 0
2 0 0 0 0 0 0 0 1 0 0 1 0
1 0 0 0 0 0 0 0 0 0 0 0 0
P 0 0 0 0 0 0 0 0 0 0 0 0
N 1 1 0 0 2 0 0 4 1 1 0 0
Tot 20 37 1 1 17 1 1 13 15 9 3 1
2009
7 0 2 1 0 0 0 0 1 0 0 0 1 0
6 4 9 0 0 1 2 0 1 1 1 2 0 0
5 9 16 0 10 0 3 0 4 0 0 3 2 0
4 7 1 2 4 0 2 1 9 0 0 2 0 1
3 5 0 1 0 0 3 0 5 0 0 1 0 0
2 2 0 0 0 0 0 0 1 0 0 0 0 0
1 0 0 0 0 0 0 0 0 0 0 0 0 0
P 0 0 0 0 0 0 0 0 0 0 0 0 0
N 0 1 0 1 0 2 0 4 0 0 1 0 0
Tot 27 29 3 15 1 12 1 19 1 1 9 3 1
2010
7 1 0 0 0 1 1 0 0 1 0 3 0 0
6 1 9 0 1 1 0 2 0 3 7 1 0 0
5 3 25 0 0 3 0 4 1 4 7 3 0 0
4 5 9 0 1 7 0 4 2 12 10 3 3 1
3 15 3 0 0 5 0 1 6 0 3 0 0 1
2 3 0 1 0 0 0 0 6 0 0 0 0 1
1 0 0 1 0 0 0 0 0 0 0 0 0 0
P 0 0 0 0 0 0 0 0 0 0 0 0 0
N 0 1 0 1 1 0 3 11 14 2 1 0 2
Tot 27 46 2 2 17 1 11 15 20 27 10 4 3
65
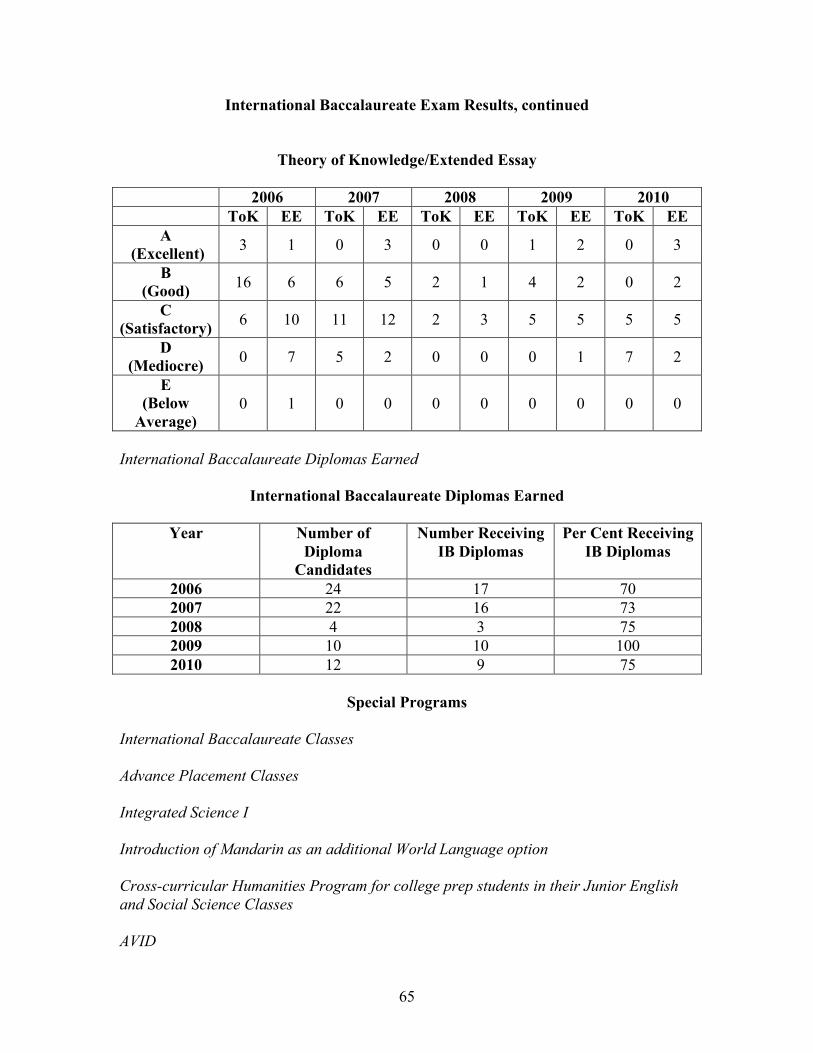
International Baccalaureate Exam Results, continued
Theory of Knowledge/Extended Essay
2006 2007 2008 2009 2010
ToK EE ToK EE ToK EE ToK EE ToK EE
A
(Excellent) 3 1 0 3 0 0 1 2 0 3
B
(Good) 16 6 6 5 2 1 4 2 0 2
C
(Satisfactory) 6 10 11 12 2 3 5 5 5 5
D
(Mediocre) 0 7 5 2 0 0 0 1 7 2
E
(Below
Average)
0 1 0 0 0 0 0 0 0 0
International Baccalaureate Diplomas Earned
International Baccalaureate Diplomas Earned
Year Number of
Diploma
Candidates
Number Receiving
IB Diplomas
Per Cent Receiving
IB Diplomas
2006 24 17 70
2007 22 16 73
2008 4 3 75
2009 10 10 100
2010 12 9 75
Special Programs
International Baccalaureate Classes
Advance Placement Classes
Integrated Science I
Introduction of Mandarin as an additional World Language option
Cross-curricular Humanities Program for college prep students in their Junior English
and Social Science Classes
AVID

66
Medical Careers Academy
JROTC
Agriculture
ROP
Community Based Instruction (CBI)
AB 1802 Counseling meetings
Student Activities, Co-Curricular and Extra-Curricular
Sonora students enjoy the opportunity to participate in a wide range of activities,
including:
Academic Clubs: Academic Decathlon, Art Club, AP/IB Club, Book Club, Choir Club,
French Club, Math Club, Science Club, Spanish Club, Speech and Debate
Special Interest Clubs: Fellowship of Christian Athletes, Future Farmers of America
(FFA), Girls’ Athletic Association, Girls’ League, Home Economics Club, Journalism
Club
Service Clubs and Organizations: Best Buds, Conflict Management, Friday Night Live,
Holiday Food Drive, Key Club, Leos, MEChA, PALS,
Honorary Organizations: California Scholarship Federation (CSF), National Honor
Society (NHS)
Student Government (ASB)
Freshman Mentoring Impact Program
Performing Organizations: Choir, Concert Band, Dance, Dance Production, Drama,
Drum Line, Jazz Band, Madrigals, Marching Band, Pep Squads, Raiderette Drill Team,
and Tall Flags
Publications: School Paper, Yearbook
Dances: Welcome Back, Homecoming, Winter Formal, Sadie Hawkins, Spring Fiesta,
Prom, as well as others from time to time, including Valentine’s, and Hula Hawkins
67
Special Nights: Dancing with the Staff, Lip Sync, Talent Show, Mr. Sonora, Raiderette
Show, Dance Show, Fall and Spring Plays, Spring Musical
Special Weeks: Spirit Week, Holiday Food Drive, March Olympics
Special Events: Academic Awards, Cross the Line, Freshman Awards, Senior Breakfast,
Senior Luau, Senior Awards
Athletics: Two-four levels (Freshman, Sophomore, Frosh-Soph, Junior Varsity and
Varsity) of many CIF team sports, including
Fall: Football, Men’s Water Polo, Men and Women’s Cross Country, Women’s
Tennis, Women’s Volleyball,
Winter: Men and Women’s Basketball, Women’s Water Polo, Men and Women’s
Soccer, Wrestling,
Spring: Baseball, Softball, Golf, Men’s Tennis, Men and Women’s Swimming and
Diving, Men’s and Women’s Track and Field
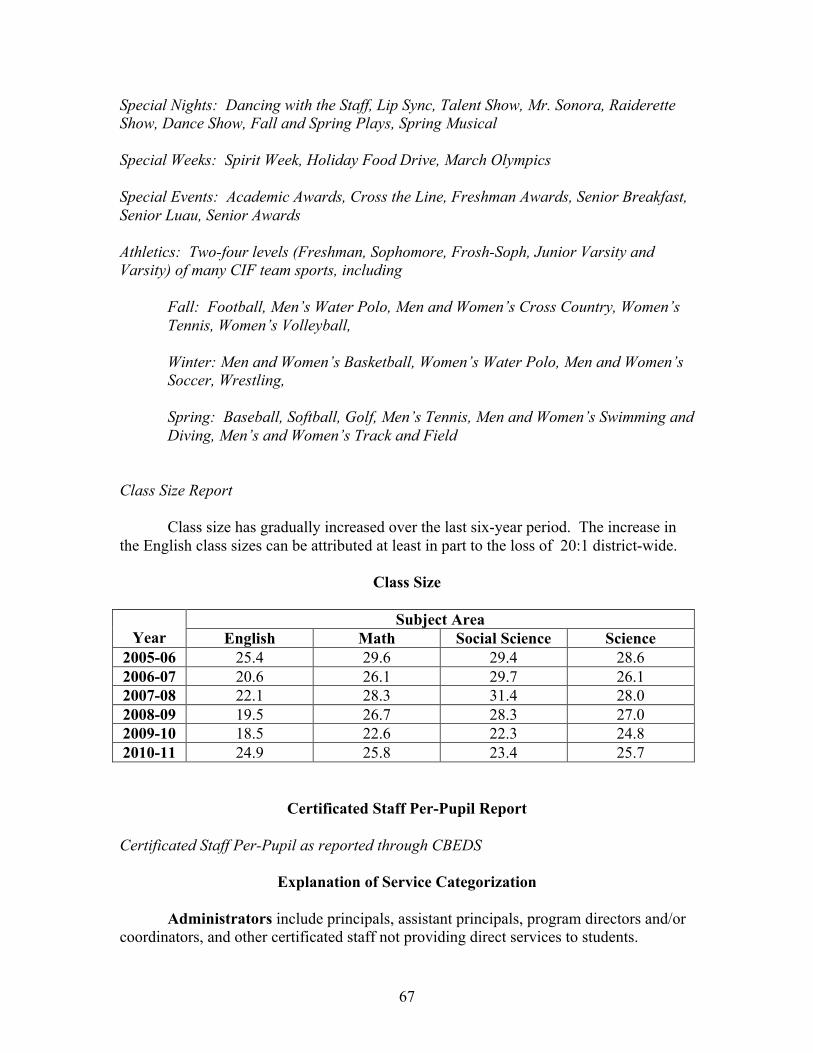
Class Size Report
Class size has gradually increased over the last six-year period. The increase in
the English class sizes can be attributed at least in part to the loss of 20:1 district-wide.
Class Size
Subject Area
Year English Math Social Science Science
2005-06 25.4 29.6 29.4 28.6
2006-07 20.6 26.1 29.7 26.1
2007-08 22.1 28.3 31.4 28.0
2008-09 19.5 26.7 28.3 27.0
2009-10 18.5 22.6 22.3 24.8
2010-11 24.9 25.8 23.4 25.7
Certificated Staff Per-Pupil Report
Certificated Staff Per-Pupil as reported through CBEDS
Explanation of Service Categorization
Administrators include principals, assistant principals, program directors and/or
coordinators, and other certificated staff not providing direct services to students.
68
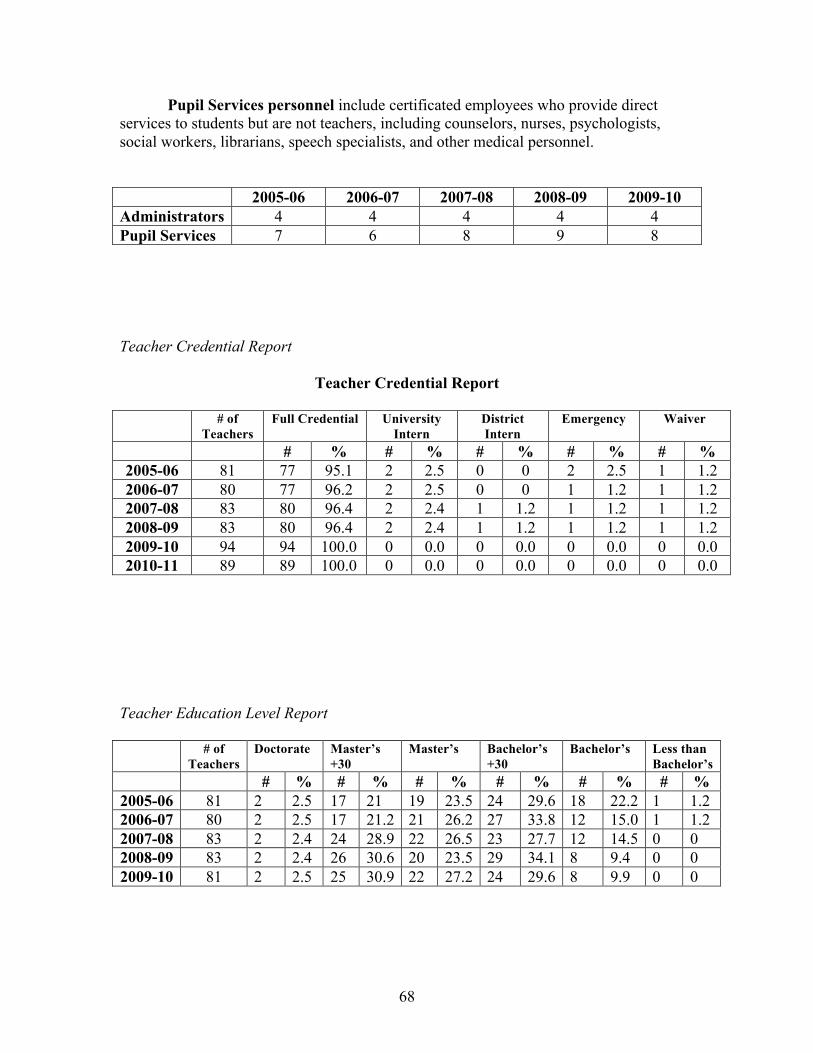
Pupil Services personnel include certificated employees who provide direct
services to students but are not teachers, including counselors, nurses, psychologists,
social workers, librarians, speech specialists, and other medical personnel.
2005-06 2006-07 2007-08 2008-09 2009-10
Administrators 4 4 4 4 4
Pupil Services 7 6 8 9 8
Teacher Credential Report
Teacher Credential Report
# of
Teachers
Full Credential University
Intern
District
Intern
Emergency Waiver
# % # % # % # % # %
2005-06 81 77 95.1 2 2.5 0 0 2 2.5 1 1.2
2006-07 80 77 96.2 2 2.5 0 0 1 1.2 1 1.2
2007-08 83 80 96.4 2 2.4 1 1.2 1 1.2 1 1.2
2008-09 83 80 96.4 2 2.4 1 1.2 1 1.2 1 1.2
2009-10 94 94 100.0 0 0.0 0 0.0 0 0.0 0 0.0
2010-11 89 89 100.0 0 0.0 0 0.0 0 0.0 0 0.0
Teacher Education Level Report
# of
Teachers
Doctorate Master’s
+30
Master’s Bachelor’s
+30
Bachelor’s Less than
Bachelor’s
# % # % # % # % # % # %
2005-06 81 2 2.5 17 21 19 23.5 24 29.6 18 22.2 1 1.2
2006-07 80 2 2.5 17 21.2 21 26.2 27 33.8 12 15.0 1 1.2
2007-08 83 2 2.4 24 28.9 22 26.5 23 27.7 12 14.5 0 0
2008-09 83 2 2.4 26 30.6 20 23.5 29 34.1 8 9.4 0 0
2009-10 81 2 2.5 25 30.9 22 27.2 24 29.6 8 9.9 0 0

69
Teachers by Ethnicity Report
Teachers by Ethnicity Reported by Per Cent
Year
Ameri-
can
Indian
or
Alaska
Native
Asian Pacific
Islander
Filipino Hispanic
Or
Latino
African
American
(not
Hispanic)
White
(not
Hispanic)
Multiple
Or no
Response
Total
2005-06 0 7 0 0 10 0 64 0 81
2006-07 0 7 0 0 12 0 61 0 80
2007-08 0 5 0 0 12 0 66 0 83
2008-09 0 5 0 0 13 0 67 0 85
2009-10 0 6 0 0 13 0 62 0 81
Classified Staff
Classified Staff
Paraprofessional Office/Clerical Other Total
# % # % # % #
2005-06 10 27.8 12 33.3 14 38.9 36
2006-07 8 23.5 13 38.2 13 38.2 34
2007-08 16 36.4 14 31.8 14 31.8 44
2008-09 16 37.2 14 32.6 13 30.2 43
2009-10 16 36.4 12 27.2 16 36.4 44
Opportunities for Parent and Community Participation
Activity Booster Clubs, Athletic Booster Clubs, Grad Night, Parent Institute, PTSA and
Academic Boosters, ROP Course Offerings, School Site Council, ELAC, DELAC
Technology
Computers purchased since the last visit
32 (Library)
40 (Intervention Courses such as Read 180 & Accelerated Math)
30 laptops (Agriculture)
Computer Software/Instructional Programs Purchased since the last visit
Read 180

70
Accelerated Math
Rosetta Stone
Modernization
New LCD projectors in all the classrooms
Additional electrical outlets in all the classrooms
Additional data jacks throughout the campus
Internet Sites
Aeries Browser Interface (ABI) has attendance, student information, and gradebook
available on-line for teachers, parents, and students
New school website
Projected Improvements for 2010-11
4th
T1 line will improve internet access school wide
Fiber Optic line which will allow for the use of streaming video in instruction
VoIP telephone system in the entire school
Student Feedback Clickers for Medical Careers
Critical Academic Needs of Sonora High School
Based on all the data gathered during the self study process, Sonora High School
will:
1. Improve academic achievement of all students in all content areas as
measured by the CSTs and the CAHSEE by providing all teachers with the
training, tools and materials to conduct effective instruction and assessment
and by providing students with the necessary supports and courses to promote
their academic success.
2. Support our English Learners and Special Education subgroups to close the
achievement gaps.
3. Develop and implement a system to support students to learn and achieve
grade-level standards in English Language Arts, mathematics, science, and
social science.
Related Documents

![[2014] WASC 187](https://static.cupdf.com/doc/110x72/613ca162f046235e845cde37/2014-wasc-187.jpg)


