Inorganica ChimicaActa, 31 (1978) 49-58 @Elsevier Sequoia S.A., Lausanne - Printed in Switzerland 49 Some Spectroscopic Properties of Platinum(I1) and Palladium(I1) Complexes of Aryl Alkyl Sulfides 0. A. SERRA and L. R. M. PITOMBO Institute de Quimica, Universidade de so”0 Paula, C. Postal20.780, a-0 Paula, Brasil Y. IAMAMOTO Departamento de Quimica da FFCLRP-USP, Ribeirao Preto, SP, Brasil Received February 20,1978 Compounds of the MClz(R-S-R1j2 type, where M = Pt(II) and Pd(II), R = methyl and R, = phenyl, o-, m-, p- tolyl, have been prepared. The trans-struc- ture for some of these compounds was characterized by IR, Raman and ‘H-NMR measurements, Elec- tronic spectra of the mentioned compounds in solid state and solutions were studied. Molecular orbital diagrams were developed for MC12(pms)z where pms = phenylmethylsulfide. The electronic spectra were in reasonable agree- ment with the proposed diagrams, thus clarifying the electronic structure of the compounds. The shifting of the ligand to metal electron transfer (LMET) transition due to factors such as complex central atoms and different radicals bounded to the sulfur atom, supplied important information, making the interpretation of the data previously obtained from palladium(H) compounds possible. It was also possible to situate the phenylmethylsulfide in the spectrochemical series indicating stronger n bonding and weaker o bonding for aryl alkyl sulfide com- plexes as compared to the alkyl sulfide complexes. Introduction Electronic spectra of platinum(B) and palladium- (II) compounds with aryl alkyl sulfides as ligands have been briefly studied [2,3]. On previous occasions it was observed that in the palladium(B) compounds the intense band in the near ultraviolet region shifted with the change of aryl or alkyl radicals of the ligands [4]. Now, the character- ization of the electronic structure of these com- pounds, including platinum(H) compounds, was done in order to interpret those facts. Semi-empirical molecular orbital calculations have been made to determine the energies of the molecular orbital of the nickel(H) maleonitrile- dithiolate [S] , dithioacetylacetonate [6] complexes and others. The optical spectra for these compounds have been interpreted on the basis of the molecular orbital calculations, and the electronic spectra for analogous complexes of platinum( II) and palladium- (H) have been interpreted using as a model a molec- ular orbital diagram calculated for nickel(H) com- pounds. In this work, the interpretation of the electronic spectra data was made on the basis of molecular orbital diagrams that were developed for MClz(pms)2 where M = Pt( II), Pd( II). These diagrams were evolved bearing in mind the information for the MClf ions which have been obtained from self-consistent-field Xo-scattered wave calculations (SCF-Xo-SW) [7], and the order of energy level provided by photo- electronic spectra for phenylmethylsulfide [8]. Experimental Materials The ligands aryl alkyl sulfides were obtained by usual methods [9, lo] or from commercial samples (Eastman Kodak), distilled at low pressure until pure. BDH tetrachloroplatinate was used to prepare platinum(H) compounds and K & K palladium chloride was used to prepare palladium(B) com- plexes. The solvents used to prepare and to recrystallize the complexes were Carlo Erba or Baker. The solutions for absorption spectra were prepared using acetonitrile and n-hexane spectral grade (Merck- Uvasol) . Preparation of the Complexes The complexes PtCIZLa (L = phenylmethylsulfide (pms), o-tolylmethylsulfide (o-tms), p-tolylmethyl- sulfide (p-tms), m-tolylmethylsulfide (m-tms)) were prepared by the method described by Haake and Turley [ll] . The resulting compounds were pale yellow.

Welcome message from author
This document is posted to help you gain knowledge. Please leave a comment to let me know what you think about it! Share it to your friends and learn new things together.
Transcript

Inorganica Chimica Acta, 31 (1978) 49-58 @Elsevier Sequoia S.A., Lausanne - Printed in Switzerland
49
Some Spectroscopic Properties of Platinum(I1) and Palladium(I1) Complexes of Aryl Alkyl Sulfides
0. A. SERRA and L. R. M. PITOMBO
Institute de Quimica, Universidade de so”0 Paula, C. Postal 20.780, a-0 Paula, Brasil
Y. IAMAMOTO
Departamento de Quimica da FFCLRP-USP, Ribeirao Preto, SP, Brasil
Received February 20,1978
Compounds of the MClz(R-S-R1j2 type, where M = Pt(II) and Pd(II), R = methyl and R, = phenyl, o-, m-, p- tolyl, have been prepared. The trans-struc- ture for some of these compounds was characterized by IR, Raman and ‘H-NMR measurements, Elec- tronic spectra of the mentioned compounds in solid state and solutions were studied. Molecular orbital diagrams were developed for MC12(pms)z where pms = phenylmethylsulfide.
The electronic spectra were in reasonable agree- ment with the proposed diagrams, thus clarifying the electronic structure of the compounds. The shifting of the ligand to metal electron transfer (LMET) transition due to factors such as complex central atoms and different radicals bounded to the sulfur atom, supplied important information, making the interpretation of the data previously obtained from palladium(H) compounds possible. It was also possible to situate the phenylmethylsulfide in the spectrochemical series indicating stronger n bonding and weaker o bonding for aryl alkyl sulfide com- plexes as compared to the alkyl sulfide complexes.
Introduction
Electronic spectra of platinum(B) and palladium- (II) compounds with aryl alkyl sulfides as ligands have been briefly studied [2,3].
On previous occasions it was observed that in the palladium(B) compounds the intense band in the near ultraviolet region shifted with the change of aryl or alkyl radicals of the ligands [4]. Now, the character- ization of the electronic structure of these com- pounds, including platinum(H) compounds, was done in order to interpret those facts.
Semi-empirical molecular orbital calculations have been made to determine the energies of the molecular orbital of the nickel(H) maleonitrile- dithiolate [S] , dithioacetylacetonate [6] complexes and others. The optical spectra for these compounds
have been interpreted on the basis of the molecular orbital calculations, and the electronic spectra for analogous complexes of platinum( II) and palladium- (H) have been interpreted using as a model a molec- ular orbital diagram calculated for nickel(H) com- pounds.
In this work, the interpretation of the electronic spectra data was made on the basis of molecular orbital diagrams that were developed for MClz(pms)2 where M = Pt( II), Pd( II). These diagrams were evolved bearing in mind the information for the MClf ions which have been obtained from self-consistent-field Xo-scattered wave calculations (SCF-Xo-SW) [7], and the order of energy level provided by photo- electronic spectra for phenylmethylsulfide [8].
Experimental
Materials The ligands aryl alkyl sulfides were obtained by
usual methods [9, lo] or from commercial samples (Eastman Kodak), distilled at low pressure until pure.
BDH tetrachloroplatinate was used to prepare platinum(H) compounds and K & K palladium chloride was used to prepare palladium(B) com- plexes.
The solvents used to prepare and to recrystallize the complexes were Carlo Erba or Baker.
The solutions for absorption spectra were prepared using acetonitrile and n-hexane spectral grade (Merck- Uvasol) .
Preparation of the Complexes The complexes PtCIZLa (L = phenylmethylsulfide
(pms), o-tolylmethylsulfide (o-tms), p-tolylmethyl- sulfide (p-tms), m-tolylmethylsulfide (m-tms)) were prepared by the method described by Haake and Turley [ll] . The resulting compounds were pale yellow.

50
TABLE I. Analytical Data.’
Y. Iamamoto, 0. A. Serra and L. R. M. A’tombo
Compounds M.p. Interval “C
%C
Calcd. Found
%H -
Calcd. Found
%S
Calcd. Found
Yield %
PtCl?(o -tms)r* 154-155 35.4 35.3 3.1 3.6 11.8 11.8 94
PtCl& -tms)r* 172-176 35.4 35.4 3.1 3.5 11.8 11.7 65
PtCl&r-tms)sb 120-l 23 35.4 35.1 3.1 3.6 11.8 11.9 81
PdCl*(o -tms)ab 141-146 42.3 42.6 4.4 4.1 14.1 14.3 99
PdCl& -tms)sb 137-139 42.3 42.8 4.4 4.4 14.1 14.1 99
PdClr(m-tms)rb 90-93 42.3 42.0 4.4 4.2 14.1 14.1 99
*Compounds analysed at the microanalytical laboratory, “Alfred Bernhardt”, West Germany. bCompounds analysed at the microanalytical laboratory, Instituto de Qut’mica-USP.
The complexes PdClaLa (L= pms, o-tms, p-tms, m-tms) were prepared according to the procedure described by Mann and Purdue [ 121. The products were recrystallized from acetone and they were intense yellow.
spectrometer, using an argon ion laser (514.5 nm) for excitation.
Analytical data of the compounds obtained for the first time are given in Table I.
The N.M.R. spectra were obtained using a Varian T-60 spectrometer at 60 MHz with Me4Si as an internal standard. Deuterochloroform was used as a solvent.
Physical Measurements Results and Discussion Electronic spectral data were obtained using a
Cary model 17 recording spectrophotometer in the region ranging from 190 to 780 nm for the following compounds: ligands (L = pms, o-tms, p-tms, m-tms) and complexes MClzLz (M = Pt(II), Pd(II)). The spectra of the solid were obtained by fluorolube mull technique using Hellma 106-QS cells with path length of 0.50 and 0.10 mm [ 131.
Characterization of Trans-Structure of MC12(pms)2
Acetonitrile solution spectra of platinum(I1) complexes about lop3 to lo+ M were obtained using Hellma 1 lo-QS cells with path length of 1 .O mm and Hellma 114-QS cells with path length of 10.0 mm. For palladium(I1) compounds and ligands spectra acetonitrile solutions about 10-4-10-5 M, in Hellma 1 lo-QS cells with path length of 1 .O mm, were used.
In n-hexane, these compounds have low solubility; the accurate determination of the concentration becomes quite difficult by the usual way. To over- come this problem, a method of determination of the concentration of the studied compounds in n-hexane was developed. After recording the spectra of n- hexane saturated solutions, the solvent was evapo- rated and the residue redissolved quantitatively in acetonitrile. The spectrum was recorded again and since the molar absorptivity was known, the concentration of the complex could be calculated.
For palladium(H) complexes of this type, the trans-structure has been proposed [2, 141 through IR and Raman spectroscopy. For the platinum(H) complexes there is evidence of cis- and trans-isomers and the identification of these isomers was the subject of some studies [15, 161 . For cis- com- plexes with point group C?, there is expected from group-theory analysis one symmetrical stretching v, (Pt-Cl) and one antisymmetrical stretching v,(Pt- Cl) with activity coincidents in both infrared and Raman. For trans-complexes with point group Da, one expects one symmetrical v,(Pt-Cl) Raman active, and one antisymmetrical stretching v,(PtCl) infra- red active. These bands are easily identified because they are very strong. Accordingly, the results obtained indicate a trans- structure for PtCla(pms)a. The values for the stretching frequencies v,(%Cl) and v,(PtCl) are respectively 334 cm-’ (R) and 341 cm-’ (IR); these data are in agreement with those of Reed [3] who found 332 (R) and 341 cm-’ (IR).
The infrared spectra were recorded with a Perkin- Elmer model 180 spectrophotometer, using Nujol mulls for the complexes between CsI and polyethy- lene plates.
Proton nuclear magnetic resonance techniques were also used to identify the cis- or tram- isomers for platinum(H) complexes of the PtC12L2 type where L = dimethylsulfide, dibenzylsulfide, diethyl- sulfide and phenylmethylsulfide [ 11, 16-l 81.
The Raman spectra of the solid samples were recorded by a Jarrel-Ash model 25-300 Raman laser
Platinum presents the isotope r95Pt (I = %) and it is possible to observe the coupling JPt_a_oH. The spectra of r H-NMR show a doublet superimposed to a singlet leading to three peaks with intensity ratios
Complexes of Aryl Alkyl Sulfides 51
A
A
A
L I L__..- 440 Hz 44.0 Hz
I I1 1 I1 I ,,I I1 I I I 1 I 1 1 1 I I I I I I , 1 ,
30 20 4.0 3.0 2.0
b(wm) 6 (wm)
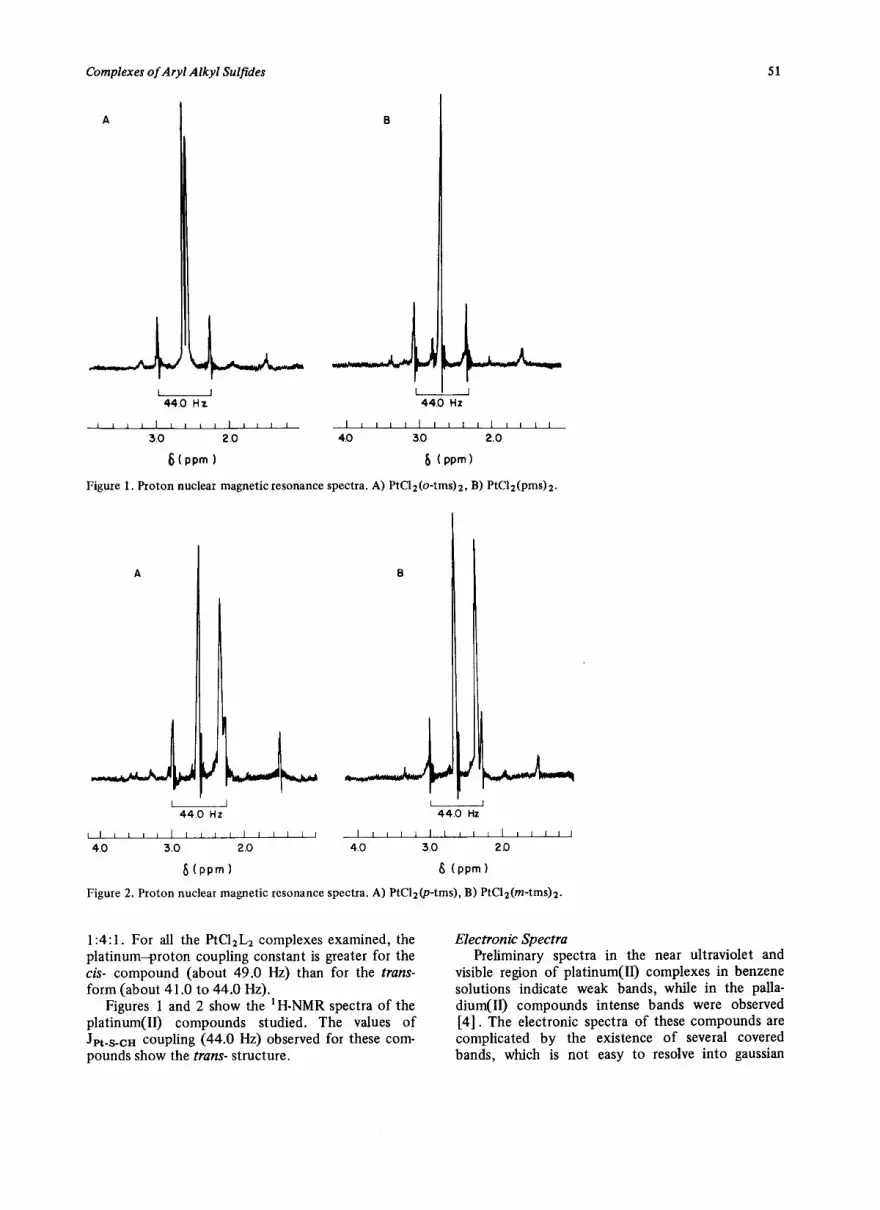
Figure 1. Proton nuclear magnetic resonance spectra. A) PtClz(o-tms)2, B) PtClz(pms)2.
b L 44.0 Hz 44.0 Hz
II I I I II I I I I 11 II11 I I I I / I I I I / I I I I I,
4.0 3.0 2.0 4.0 3.0 20
b(ppm) 6 (ppm)
Figure 2. Proton nuclear magnetic resonance spectra. A) PtClz@-tms), B) PtCl2(m-tms)2.
1:4:1. For all the PtC12L2 complexes examined, the platinum-proton coupling constant is greater for the cis- compound (about 49.0 Hz) than for the trans- form (about 41 .O to 44.0 Hz).
Figures 1 and 2 show the ‘H-NMR spectra of the platinum(I1) compounds studied. The values of JR.,,, coupling (44.0 Hz) observed for these com- pounds show the tram- structure.
Electronic Spectra Preliminary spectra in the near ultraviolet and
visible region of platinum(U) complexes in benzene solutions indicate weak bands, while in the palla- dium(I1) compounds intense bands were observed [4]. The electronic spectra of these compounds are complicated by the existence of several covered bands, which is not easy to resolve into gaussian

52 Y. Iamamoto, 0. A. Serra and L. R. M. Potombo
I I I I
350 400 450 500 550
)rlllRl)
Figure 3. Absorption spectrum of Fluorolube mull of PtCl2- (pms)2 in the visible and near ultraviolet region, and the gaussian components.
TABLE 11. Absorption Spectrum of Fluorolube Mull of the Compound PtClz(pms)z and the d-d Transition Assign- ments.a
V, kK Assignments
b Singlet d,l (alg) + dX2_,,2 (blp)
29.1 Singlet d,,, d&g) -+ dx*-+(blg)
25.4 Singlet d,,(bzg) --+ d,2+ (bl,)
23.4 Triplet cl,,, d,.,(eg) --* dx2-+@lg)
:Energy of the gaussian components as shown in Fig. 3. Covered by intense bands.
components. The study was made in terms of region and it was possible to identify some bands. Figure 3 shows the absorption spectrum for PtC12(pms)2 and the gaussian components in the visible and near ultraviolet region, that permitted the assignment of d-d transitions according to Table II and to discuss ligand field splitting of the d-orbitals. In palladium(H) compounds the intense bands of ligand to metal electron transfer (LMET) transitions cover the d-d bands. The microsymmetry Dab was considered and the ligand field splitting parameters were calculated utilizing equations proposed by Gray and Ballhau- sen [19].
dxy(b2g) + d,+,g(brgl transition
E[‘A2z +- ‘A,s] = Ar - C
d,,, d&e& + d&,.~(b 3 transition
E[‘E, +- ‘A,,] = A, + A2 - 3B - C
TABLE III. Ligand Field Parameters (in kK) for Square Planar Complexes.
Compounds A1 A2 A3 Ref.
PtCl2(pms)2 28.4 5.7 a -
ptc1:- 28.2 6.2 8.0 20
PtBr;- 26.6 5.2 3.6 20
Pt(NH&- 46.6 1.5 3.5 20
‘Insufficient experimental data.
d,l(ard + d,+l(b,g) transition
E[‘B,, + ‘Arz] = A, + A, + A3 - 4B - C
The results compared with other data are presented in the Table III.
Studies accomplished by Jbrgensen [21] about the position of R2S (R = alkyl) in spectrochemical series show that it is located between Hz0 and NH3 in this series:
mnt2-< Br-< Cl- < dtp- < F- < Hz0 <
< R2S (R = alkyl) < NH3 < SO’,- < NOT <<CN-.
Applying the rule average environment [22] A, was calculated for the hypothetical Pt(dm$’ using experimental data of the compounds [PtBr,(dms)]- and [PtCl(dms)3]’ [3]. The values obtained were 38.8 kK and 38.4 kK respectively. If dialkylsulfide was of the same nature as the phenylmethylsulflde, A, for FtC12(pms)2 would be expected at about 35.5 kK; however the result was 28.4 kK, as shown in the Table III. This value could be interpreted by the presence of the aromatic ring: the sulfur of the phenylmethylsulfide has two lone pairs and one of these participates in a molecular orbital with the II system of the aromatic ring. This facts causes a delocalization of the lone pairs, resulting in the weakening of the aL + M bond. Consequently d,+l is decreased and d,, energy level is increased and therefore d,, +- dxz__vz transition has the energy lowered. As a result, the pms can be located near to the chloride and the following spectrochemical series is suggested:
mnt’-<Br-<Cl-<pms<dtp-<F<HsO<
< R2S (R = alkyl) < NH, < SO’,\
This result made it possible to evolve a molecular orbital diagram using the sequence of the orbital energy levels in the MCly ions. These tetrachloride ion systems were extensively studied by several methods of molecular orbital calculations [20, 23, 241 including the SCF-Xo-SW [7]. This method is today indicated as the best one, and offers results

Complexes of Aryl Alkyd Sulfides 53
TABLE IV. Allowed Transitions and Range of Energies for PtC12(pms)z.
Spectral Region Transition Transition Character
I
32 kK (310 nm) to 38 kK (263 nm)
3b, h 6a,(B, +)
5b, --+ 4bu(Au+)
4b, + 4b,(A,+)
5b, + 2a,(B, +)
II
38 kK (263 nm) to 40 kK (250 nm)
III
40 kK (250 nm) to 44 kK (228 nm)
Sal -r 4b,(B, t)
Sb, + 2a,(B, +)
4b, -* 2a,@, +-I Sa, + 2a,(A, +)
3b, -. 4b,(A,+)
4% -+ 4b,@,p) 4b, -, Sb,(A,+)
3b, -* 2au(B, +)
3b, --, 7ag(B, +)
IV
44 kK (228 nm) to 48 kK (208 nm)
5aB --* 5b,(B, +)
4a8 + 2a,,(A, +)
3bp -, Sb,(A,+)
4aB + 5b,(B, +)
2bu + 6aB(B, +-)
Cl,,nb -+ Md,? __,,z
Mdx, -, MP,
Mdxz --, MP,
Mdxy h MP,
Md,, -+ MP, Md XY * MP,
Md xz * MP, Md YZ-‘MIjr C@” --* Mp,
Md,z + Mp,
Mdxz -, MP, CI,,nb * Mp,
Cl,, b +Ms
Md,., -+MP, Md,z +Mpx
Cbnb + Mp,
Md,z * Mp,
Cl, S, II + Md.&$
cl 8) f f I
I + ---s---- __- ___y qzi Y
+ I -
aO , I b”
Figure 4. Overlap of a) d,, with nh(C1) functions; b) d,, with nv(D1) functions: c) dyz with n*(pms) functions; d) pz with W&I) and ~*(pms) functions.
that confirm experimental data of photoelectronic spectra [25].
Electronic Structure and Spectra To discuss and to interpret the most intense bands
as electron transfer transitions, .molecular orbital diagrams for the PtClz(pms)2 and PdC12(pms)2 compounds were evolved. Figures 4-c and d show the overlap of the d,, and pz of the metal with n anti- bonding orbitals of the phenylmethylsulfide. The n anti-bonding orbital of the ligand has its origin in the overlap of one of the two lone pairs with the ?r system of the aromatic ring. The symmetry group for these compounds is normally Dza, but it can be seen in Figure 4-d that the C2 axis perpendicular to the principal axis Cs (which contain Cl-M-Cl) disappears and for the sake of discussion the point group Csh is considered.
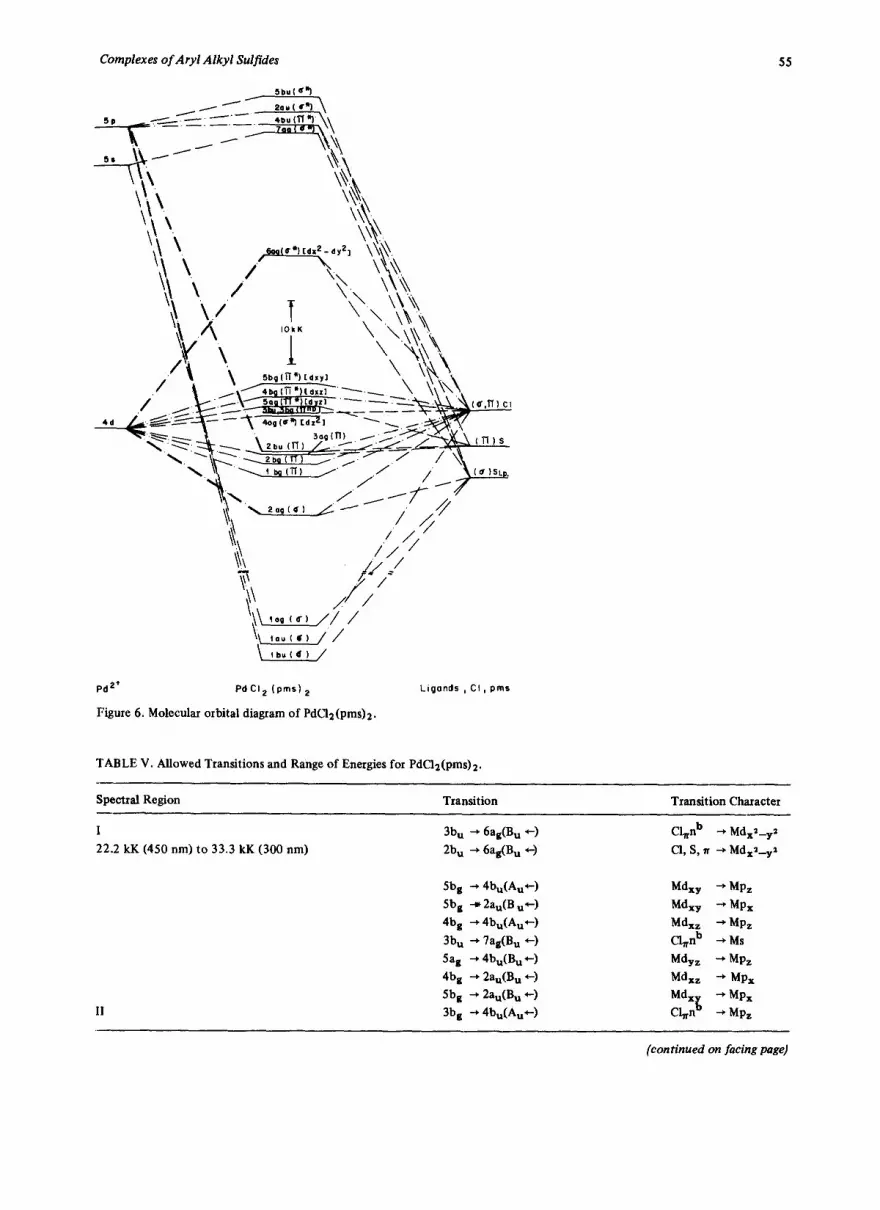
Figures 5 and 6 show the molecular orbital diagrams of the compounds PtClz(pms)s and PdCls- (pms)? respectively. Energy levels of the tetrachloride ions (SCF-Xc&w) [7] and some data of photoelec- tronic spectra of phenylmethylsulfide [8] were used. Every combinations of the metal orbitals with the ligands o and n molecular orbitals were analysed, and the changes expected with the substitution of the chloride by phenylmethylsulfide were considered. For example, to establish the sequence of the 2b,(n)

Y. Iamamoto, 0. A. Serra and L. R. M. Fitombo
pt2+ PtCI2 (pms)p
Figure 5. Molecular orbital diagram of PtCl2(pms)z.
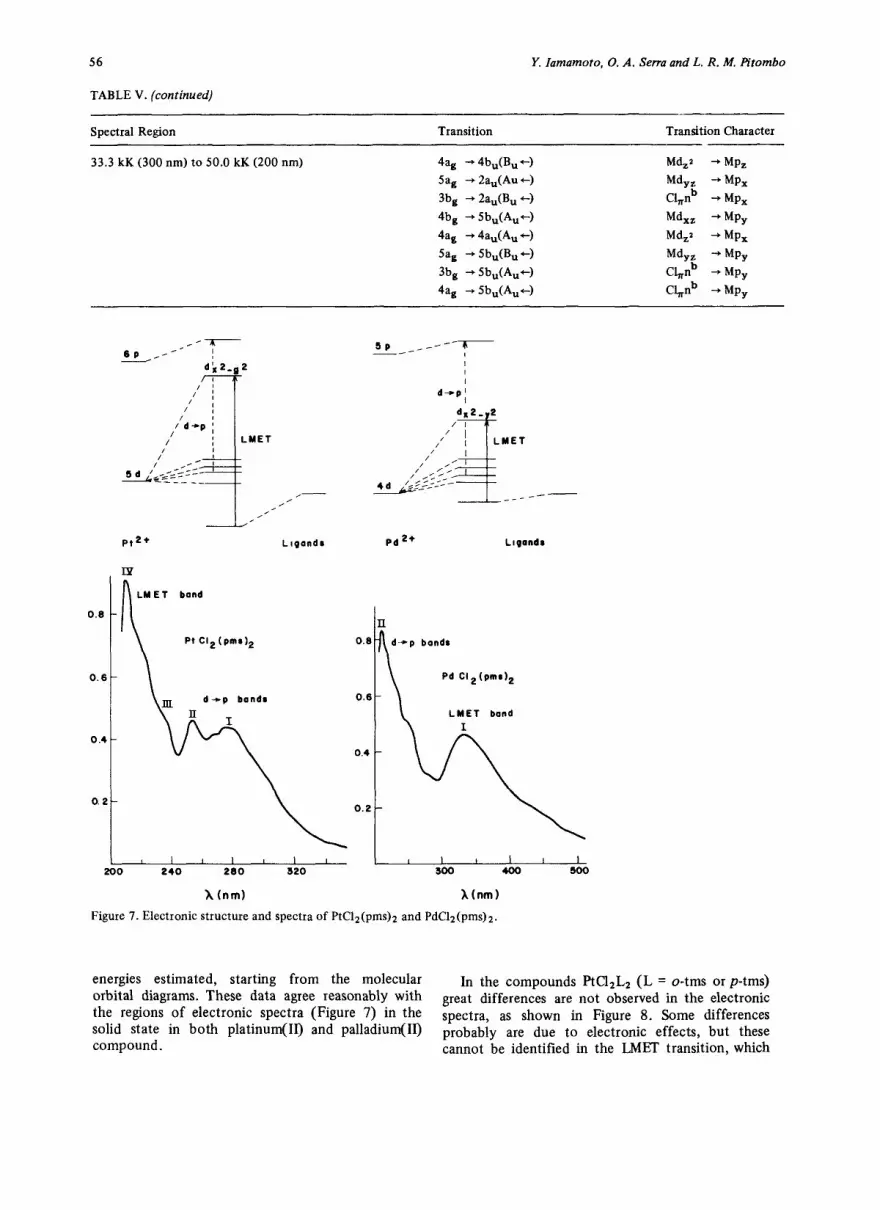
(Figure 4-d) in the complexes MCIZ(pms)z, the ioniza- tion energy data of higher energy of n* filled of the free pms could not be considered (8.07 ev.) [S]. When the phenylmethylsulfide was complexed, the ionization energy was lowered, consequently the orbital 2b,(n) was located at higher energy. This fact agrees with experimental data of electronic spectra of PdClz(pms)z. The intense band at 332 nm (Figure 7) is typically LMET transition (2b, + 6a, (B, +)) which indicates the high energy of 2b, orbital. According to the analysis of d-d transitions (Table IV) the energy level of the molecular orbital 6a, with dxl_,.l character is similar to the tetra- chloride ions.
Some generalizations can be considered regarding the electronic structures of these compounds. Observ- ing the Figure 7, differences are visible between palla-
Ligonds Cl , pms
dium(II) and platinum(R) compounds. The 5dxa+ orbital of the platinum(H) has greater participation in the u bond than 4dX2.+ orbital of the palladium- (II), thus d splitting is smaller in the latter, conse- quently 4dX+z is at lower energy. Accordingly, the experimental results of electronic spectra show the LMET transition located at lower energy for the palladium( II) compound (Figure 7).
The separation Sd-6p in platinum(II) is smaller than 4d-Sp in palladium(I1) by about 5 kK [26], and Figure 7 shows d-p transitions (Rydberg transi- tions) for platinum(I1) compound at about 300 to 220 nm, while for palladium(II) compound these bands are located between 250 and 200 nm.
Selection rules were considered for the Csr, symmetry. Tables IV and V show attempts to locate the allowed transitions according to the relative
Complexes of Aryl Alkyl Sulfides 55
Pd2* PdCl, (pms) 2
Figure 6. Molecular orbital diagram of PdClz(pms)2.
Llgonds , Cl, pms
TABLE V. Allowed Transitions and Range of Energies for PdClz(pms)z.
Spectral Region Transition Transition Character
I
22.2 kK (450 nm) to 33.3 kK (300 nm)
3b, + 6a,(B, *)
2b, + 6ae(B, +)
II
Sb, -+ 4b,(A,+)
Sb, * 2a,(B u+)
4b, -, 4b,(A,+)
3b, -+ 7as(B, +)
Sal + 4b,(B, +)
4b, + 2a,(B, *)
5ba + Za,(B, +)
3b, + 4b,(A,+)
C&nb + Mdx+a
Cl, S, n -, Mdx+a
(continued on facing page)
56 Y. Iamamoto. 0. A. Serra and L. R. M. A’tombo
TABLE V. (continued)
Spectral Region Transition Transition Character
33.3 kK (300 nm) to 50.0 kK (200 nm) 4ae. + 4b,(B, +)
5aB -+ 2a,(Au +)
3b, + 2a,(Bu 6)
4b, -, 5b,(A,+-)
4ag + 4a,(A, +)
5ap -+ 5b,(B, +)
3b, + Sb,(A,+
4a2 --t Sb,(A,t)
Md,a -+ MP,
Mdyz -+ MP, &nb --* MP,
Mdxz -+ MP, Md,l -, MP,
Mdw -+ MP, CC4 -, MP, Cbnb -t MP,
m
LM ET band
0.6
PI C12(Prnl)2
0.6
LMET bond
I
o.2~ , , , , ,\:: cr\ I I 8 I 1 I
200 240 260 320 300 400 300
BP __-- ----7
1
Lagandr Pd ‘+ Llgondr
bonds
Pd Cl 2 (pm*),
X (nm) Xtnm)
Figure 7. Electronic structure and spectra of PtC12(pms)2 and PdClz(pms)z.
energies estimated, starting from the molecular orbital diagrams. These data agree reasonably with
In the compounds F’tC12L2 (L = o-tms or p-tms)
the regions of electronic spectra (Figure 7) in the great differences are not observed in the electronic
solid state in both platinum(H) and palladium(II) spectra, as shown in Figure 8. Some differences
compound. probably are due to electronic effects, but these cannot be identified in the LMET transition, which

Complexes of Aryl Alkyd Sulfides 51
- PtCIZ(pmsIZ ___-_ PtCIz (o.tmrIg
0.2-
O.l-
I I 1 I I I I 200 250 500 350 400 450 500
X(nm)
Figure 8. Absorption spectra of platinum(i1) compounds in Fluorolube mull.
is covered by other intense d -+ p transitions (see Table V, 2b, + 6a&B, +-) transition). Only m-tolyl- methylsulfide complex showed a peculiar spectrum (Figure 8), probably due to the different conforma- tion in the solid state. Spectra in solvents of the m- compound did not show differences in relation to analogous o-, or p-compounds.
Figure 9 presents the absorption L2 type compounds and the shift
spectra of PdClz- of LMET transi-
- PdC12 ( pms12
_--__ PdCl2 b.tms)2
--- PdCl 2 htms)p
-- PdCl 2 (p.tmr) a
TABLE VI. vmax of the LMET Transition for PdClzL2 Type Compounds.
L Fluorolube nhexane
~,ax, kK vmax, kK
pms 30.1 31.3 p-tms 27.8 30.9 m-tms 26.0 31.0 o-tms 23.8 30.7
tion is observed when L is changed. This is probably due to steric effects. The energy of the LMET transi- tion is affected by the position of the methyl group in the ligand L. The shift to low energy is observed in the following sequence: pms < p-tms < m-tms < o-tms, (Table VI). It seems that the bulk of the ligands causes stabilization in the molecular orbital 6a, of character d+,,l, which is due to the weaken- ing of the u bond between metal and ligand L. Elec- tronic effects probably are present but the steric effects mask these in the solid state. In solvents as n-hexane steric effects are smaller and electronic effects are approximately of the same extent, and it becomes more difficult to identify these effects as shown in Table VI. In acetonitrile solution the LMET disappears from this region, and it is doubtful if a large shift is due to the donor effect of the solvent as in the halopalladate ions [26]. Justification of the
W I.0 - 0 z a m 0.8 - a 0 * al a 0.6-
0.4-
0.2-
t I I I I I I I 200 260 300 350 400 450 500 550
Xtnm)
Figure 9. Absorption spectra of palladium(I1) compounds in Fluorolube mull.
58 Y. Iamamoto. 0. A. Serra and L. R. M. A’tombo
above phenomean requires further study and experi- mentation.
Acknowledgment
Thanks are due to the Coordenagao de Aperfei- Coamento do Pessoal de Ensino Superior (CAPES) for financial assistance. We also express our thanks to Dr. H. E. Toma for valuable discussions.
References
1 Presented at the XVIII International Conference on Coordination Chemistry, Sao Paulo, Bras& July (1977).
2 J. E. Fergusson and K. S. Loh, Aust. J. Chem., 26, 2615 (1973).
3 F. J. S. Reed, Ph.D. Thesis, University of Bristol (1972). 4 L. R. M. Pitombo, Anal. Chim. Acta, 62, 103 (1972). 5 S. I. Shupack, E. Bilhg, R. 1. H. Clark, R. Williams and
H. B. Gray, J. Am. Chem. Sot., 86.4594 (1964). 6 0. Siimann and J. Fresco, J. Am. Chem. Sot., 92, 2652
(1970). 7 R. P. Messmer, L. V. Interrante and K. H. Johnson, J.
Am. Chem. Sot.. 96,3847 (1974). 8 H. Bock, G. Wagner and J. Kroner, Tetrahedron Lett.,
40, 3713 (1971). 9 G. Illuminati and H. Gilman, J. Am. Chem. Sot., 89,
4617 (1967). 10 V. N. Ipatieff, H. Pines and B. S. Friedman, J. Am. Chem.
Sot.. 60, 2733 (1938).
11 P. C. Turley and P. Haake, J. Am. Chem. Sot., 89, 4617 (1967).
12 F. G. Mann and D. Purdie, J. Chem. Sot., 1935. 1549. 13 0. A. Serra, M. Perrier, V. K. Lakatos Osorio and Y.
Kawano. Inorg. Chim. Acta. 17. 135 (1976). 14 R. J. H.‘Clark, G. NatiIe, U. Bklluco~ L. Cattalini and C.
Filippin, J. Chem. Sot. A, 659 (1970). 15 M. L. Arruda Temperini, Master Dissertation, Instituto de
Quimica, Universidade de Sao Paulo (1974). 16 P. L. Go&n, R. J. Goodfellow and F. J. S. Reed, J.
Chem. Sot. Dalton, 576 (1974). 17 W. McFarlane, J. Chem. Sot. Dalton, 324 (1974). 18 R. Roulet and C. Barbey, Helv. Chim. Acta, 56, 2179
(1973). 19 C. J. BaIlhausen and H. B. Gray, in “Coordination Chem-
istry”, Ed. by A. E. Martell, Van Nostrand Reinhold, New York (1971) p. 69.
20 W. R. Mason, III, and H.B. Gray, J. Am. Chem. SOC., 90, 5721 (1968).
21 C. K. Jdrgensen, J. Inorg. Nucl. Chem., 24, 1571(1962). 22 C. K. Jlmensen, “Absorption Spectra and Chemical
Bonding in-Complexes”, PergamonPress, Oxford (1962) p. 107.
23 F. A. Cotton and C. B. Harris, Inorg. Chem., 6, 369 (1967).
24 E. TondeIlo, L. Di Sipio, G. De Michelis and L. Oleari, Inorg. Chim. Acta, 5, 305 (1971).
25 P. Biloen and R. Prins, Chem. Phys. Lett., 16, 611 (1972).
26 B. G. Anex and N. Takeuchi, J. Am. Chem. Sot., 96, 4411(1972).
27 C. M. Harris, S. E. Linvingstone and I. H. Reece, J. Chem. sot., 1505 (1959).
Related Documents