Some examples of statistical inference in genomics Peter J. Bickel Peter J. Bickel Department of Statistics Department of Statistics University of California at University of California at Berkeley, USA Berkeley, USA Joint work with Ben Brown, Haiyan Huang, Nancy Zhang, Nathan Boley, Jessica Li, and the ENCODE Consortium

Some examples of statistical inference in genomics Peter J. Bickel Department of Statistics University of California at Berkeley, USA Joint work with Ben.
Dec 18, 2015
Welcome message from author
This document is posted to help you gain knowledge. Please leave a comment to let me know what you think about it! Share it to your friends and learn new things together.
Transcript
Some examples of statistical
inference in genomics
Peter J. BickelPeter J. BickelDepartment of StatisticsDepartment of Statistics
University of California at Berkeley, USAUniversity of California at Berkeley, USA
Joint work with Ben Brown, Haiyan Huang, Nancy Zhang,Nathan Boley, Jessica Li, and the ENCODE Consortium
OutlineOutline The ENCODE ProjectThe ENCODE Project The first questionThe first question: Testing the hypothesis of lack of : Testing the hypothesis of lack of
association between two features of the genomeassociation between two features of the genome a) Modeling issuesa) Modeling issues b) A minimal nonparametric modelb) A minimal nonparametric model c) Theory and practical applications of our nonparametric c) Theory and practical applications of our nonparametric
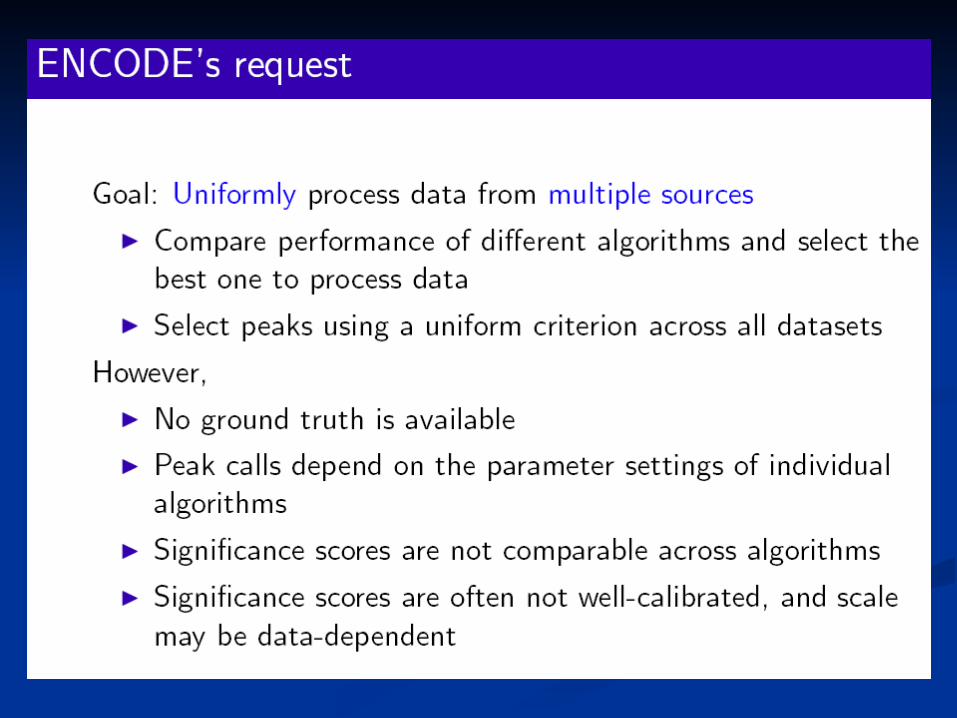
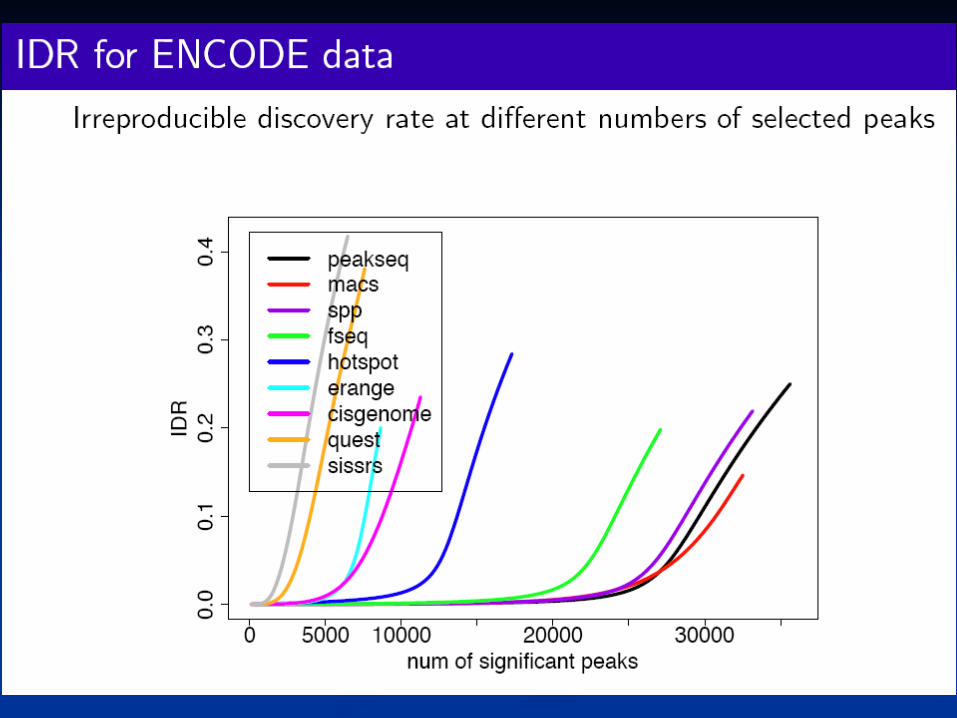
viewview The second questionThe second question: Determining the reliability of genomic : Determining the reliability of genomic
features derived by different algorithms from ChIP-seq and features derived by different algorithms from ChIP-seq and other assaysother assays a) The method is based on consistency of biological a) The method is based on consistency of biological
replicates since ground truth is rarely, if ever, availablereplicates since ground truth is rarely, if ever, available b) A curve, a copula model, and an analogue of the False b) A curve, a copula model, and an analogue of the False
Discovery RateDiscovery Rate
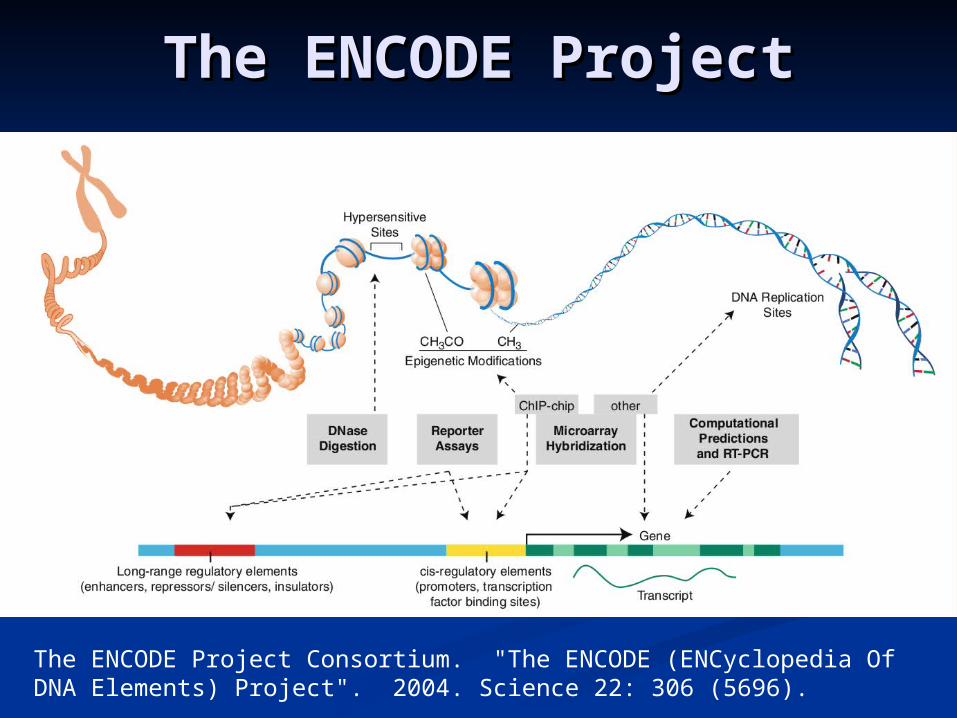
The ENCODE ProjectThe ENCODE Project
The ENCODE Project Consortium. "The ENCODE (ENCyclopedia Of DNA Elements) Project". 2004. Science 22: 306 (5696).
The Genome Structural CorrectionThe Genome Structural CorrectionReferences for Part IReferences for Part I
Peter J. Bickel, Nathan Boley, James B. Brown, Haiyan Huang, Peter J. Bickel, Nathan Boley, James B. Brown, Haiyan Huang, and Nancy R. Zhang. “Subsampling methods for genomic and Nancy R. Zhang. “Subsampling methods for genomic inference”. Annals of Applied Statistics, Volume 4, Number 4 inference”. Annals of Applied Statistics, Volume 4, Number 4 (2010), 1660-1697.(2010), 1660-1697.
The ENCODE Project Consortium. “Initial Analysis of the The ENCODE Project Consortium. “Initial Analysis of the Encyclopedia of DNA Elements in the Human Genome”. 2012. Encyclopedia of DNA Elements in the Human Genome”. 2012. Nature, in press.Nature, in press.
Gerstein et al. Integrative Analysis of the Caenorhabditis Gerstein et al. Integrative Analysis of the Caenorhabditis elegans Genome by the modENCODE Project”. Science. elegans Genome by the modENCODE Project”. Science. (2010): Vol. 330 no. 6012 pp. 1775-1787 (2010): Vol. 330 no. 6012 pp. 1775-1787
Birney E et al (2007). “Identification and analysis of functional Birney E et al (2007). “Identification and analysis of functional elements in 1% of the human genome by the ENCODE pilot elements in 1% of the human genome by the ENCODE pilot project”. Nature. 447: 799-816.project”. Nature. 447: 799-816.
Margulies EM, et al. (2007). “Analysis of deep mammalian Margulies EM, et al. (2007). “Analysis of deep mammalian sequence alignments and constraint predictions for 1% of the sequence alignments and constraint predictions for 1% of the human genome”. Genome Research. 17: 760-774.human genome”. Genome Research. 17: 760-774.

Association of functional annotations in Association of functional annotations in the Human Genomethe Human Genome
5' 3'
→ Transcription Start Sites (TSSs)
→ GENCODE Exons
3' 5'
The ENCODE Consortium found that many Transcription The ENCODE Consortium found that many Transcription Start Sites are anti-sense to GENCODE exonsStart Sites are anti-sense to GENCODE exons
They also found vastly more TSSs than previously They also found vastly more TSSs than previously supposedsupposed
Is the association between TSSs and exons in the anti-Is the association between TSSs and exons in the anti-sense direction real, or experimental noise in TSS sense direction real, or experimental noise in TSS identification? identification?
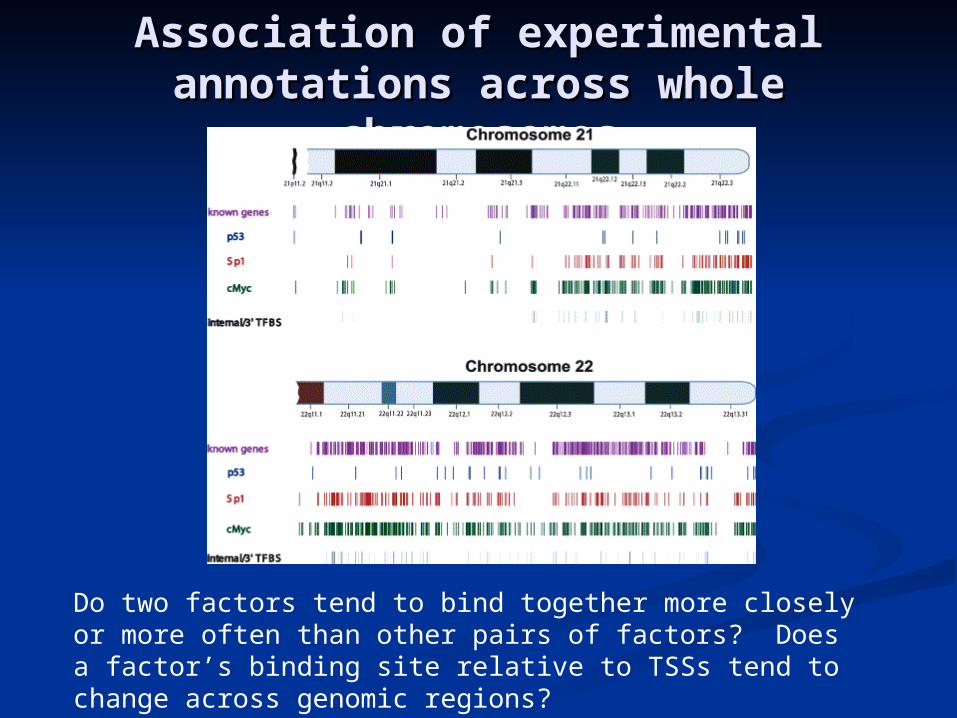
Association of experimental Association of experimental annotations across whole annotations across whole
chromosomeschromosomes
Do two factors tend to bind together more closely or more often than other pairs of factors? Does a factor’s binding site relative to TSSs tend to change across genomic regions?

Feature Overlap: the Feature Overlap: the questionquestion
A mathematical question arises:A mathematical question arises:
Do these features overlap more, or Do these features overlap more, or less than “expected at random”? less than “expected at random”?
5' 3'
→Transcription Fragments
→ Conserved sequence
Our formulationOur formulation
Defining “expectation” and “at Defining “expectation” and “at random”:random”: The genome is highly structuredThe genome is highly structured Analysis of feature inter-dependence Analysis of feature inter-dependence
must account for superficial structuremust account for superficial structure ““Expected at random” becomes:Expected at random” becomes:
Overlap between two feature sets Overlap between two feature sets bearing structure, under no biological bearing structure, under no biological constraintsconstraints
Naïve MethodNaïve Method Treating bases as being independent with same Treating bases as being independent with same
distribution (ordinary bootstrap)distribution (ordinary bootstrap) Hypothesis: Feature markings are independent Hypothesis: Feature markings are independent Specific Object Test based on Specific Object Test based on % Feature Overlap – (% Feature1)(% Feature2) % Feature Overlap – (% Feature1)(% Feature2) and standard statistics and standard statistics
Why naïve ? Bases are NOT independentWhy naïve ? Bases are NOT independent Better method: keeping one type of feature fixed Better method: keeping one type of feature fixed
and simulating moving start site of another and simulating moving start site of another feature uniformly (feature bootstrap)feature uniformly (feature bootstrap)
Why still a problem?Why still a problem? Even if feature occurrences are independent Even if feature occurrences are independent
functionally, there can be clumping caused by the functionally, there can be clumping caused by the complex underlying genome sequence structure complex underlying genome sequence structure
(i.e. inhomogeneity, local sequence dependence) (i.e. inhomogeneity, local sequence dependence)
A non parametric modelA non parametric model
Requirements:Requirements:a)a) It should roughly reflect known It should roughly reflect known
statistics of the genomestatistics of the genome
b)b) It should encompass methods listedIt should encompass methods listed
c)c) It should be possible to do inference, It should be possible to do inference, tests, set confidence bounds tests, set confidence bounds meaningfullymeaningfully
Segmented Stationary Segmented Stationary ModelModel
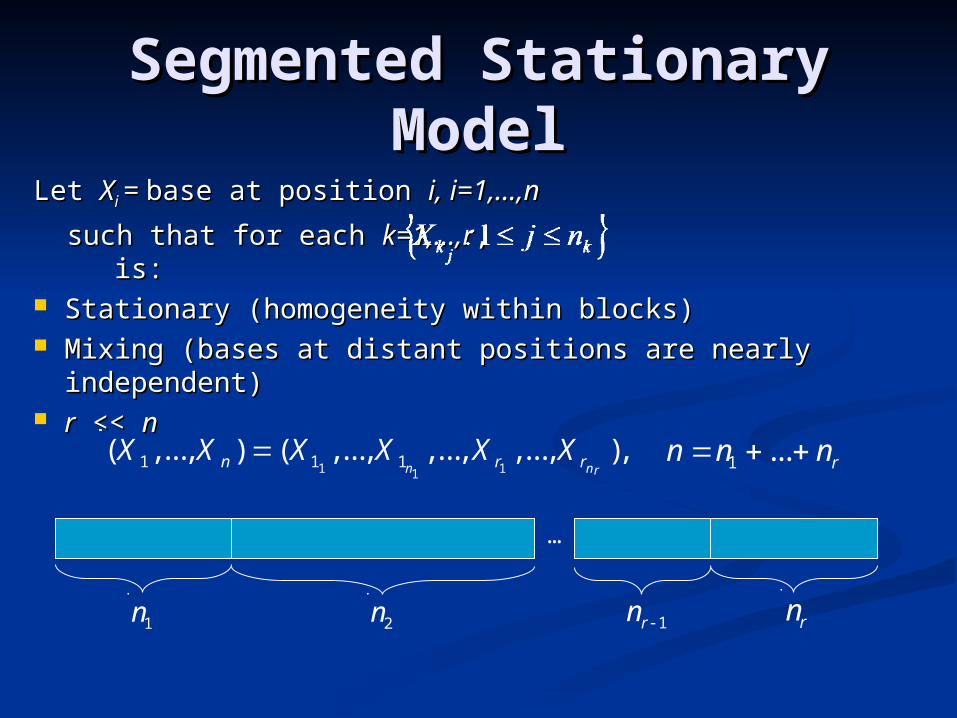
Let Let XXi i = = base at position base at position i, i=1,…,ni, i=1,…,n
such that for each such that for each k=1,…,rk=1,…,r, is: , is: Stationary (homogeneity within blocks) Stationary (homogeneity within blocks) Mixing (bases at distant positions are nearly Mixing (bases at distant positions are nearly
independent)independent) rr << << n n
1 111 1 1( , ..., ) ( , ..., , ..., , ..., ),
n nrn r rX X X X X X= 1 ... rn n n= + +
…
1n 2n 1rn - rn
Empirical InterpretationsEmpirical Interpretations Within a segment:Within a segment:
For For kk small compared to minimum small compared to minimum segment length, statistics of random segment length, statistics of random kmers do not differ between large kmers do not differ between large subsegments of segmentsubsegments of segment
Knowledge of the first kmer does not Knowledge of the first kmer does not help in predicting a distant kmerhelp in predicting a distant kmer
Remark: Remark: If this model holds it also applies to If this model holds it also applies to
derived local features, e.g. {derived local features, e.g. {II11,…,,…,IInn} } where where IIkk = 1 if position = 1 if position kk belongs to belongs to binding site for given factorbinding site for given factor
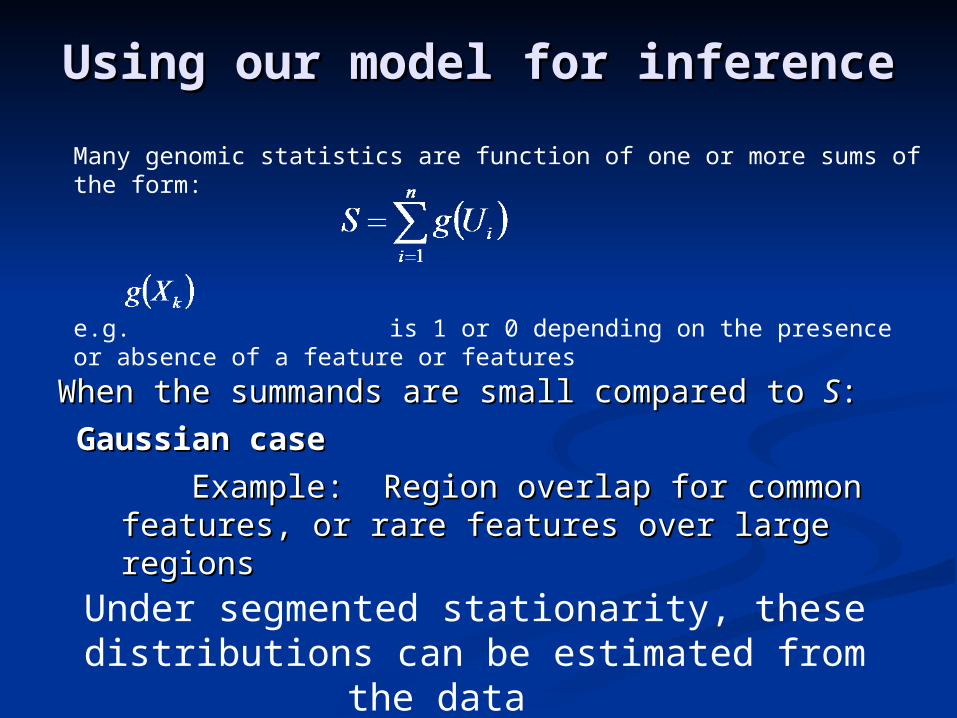
Many genomic statistics are function of one or more sums of the form:
e.g. is 1 or 0 depending on the presence or absence of a feature or features
Using our model for inferenceUsing our model for inference
When the summands are small compared to When the summands are small compared to SS::
Gaussian case Gaussian case
Example: Region overlap for common features, Example: Region overlap for common features, or rare features over large regions or rare features over large regions
Under segmented stationarity, these distributions can be estimated from the data
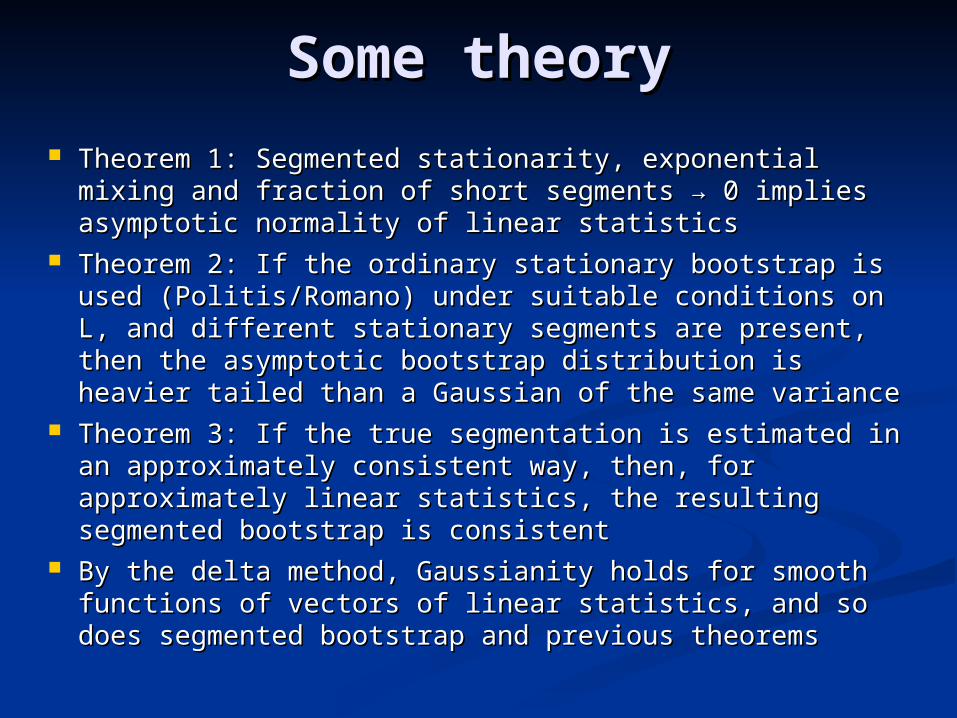
Some theorySome theory Theorem 1: Segmented stationarity, exponential mixing Theorem 1: Segmented stationarity, exponential mixing
and fraction of short segments → 0 implies asymptotic and fraction of short segments → 0 implies asymptotic normality of linear statisticsnormality of linear statistics
Theorem 2: If the ordinary stationary bootstrap is used Theorem 2: If the ordinary stationary bootstrap is used (Politis/Romano) under suitable conditions on L, and (Politis/Romano) under suitable conditions on L, and different stationary segments are present, then the different stationary segments are present, then the asymptotic bootstrap distribution is heavier tailed than a asymptotic bootstrap distribution is heavier tailed than a Gaussian of the same varianceGaussian of the same variance
Theorem 3: If the true segmentation is estimated in an Theorem 3: If the true segmentation is estimated in an approximately consistent way, then, for approximately approximately consistent way, then, for approximately linear statistics, the resulting segmented bootstrap is linear statistics, the resulting segmented bootstrap is consistentconsistent
By the delta method, Gaussianity holds for smooth By the delta method, Gaussianity holds for smooth functions of vectors of linear statistics, and so does functions of vectors of linear statistics, and so does segmented bootstrap and previous theoremssegmented bootstrap and previous theorems
Distributions of feature Distributions of feature overlapsoverlaps
The Block BootstrapThe Block Bootstrap Can’t observe independent Can’t observe independent
occurrences of ENCODE regions, occurrences of ENCODE regions, but if our hypothesis of segmented but if our hypothesis of segmented stationarity holds then the stationarity holds then the distribution of sum statistics and distribution of sum statistics and their functions can be their functions can be approximated as followsapproximated as follows
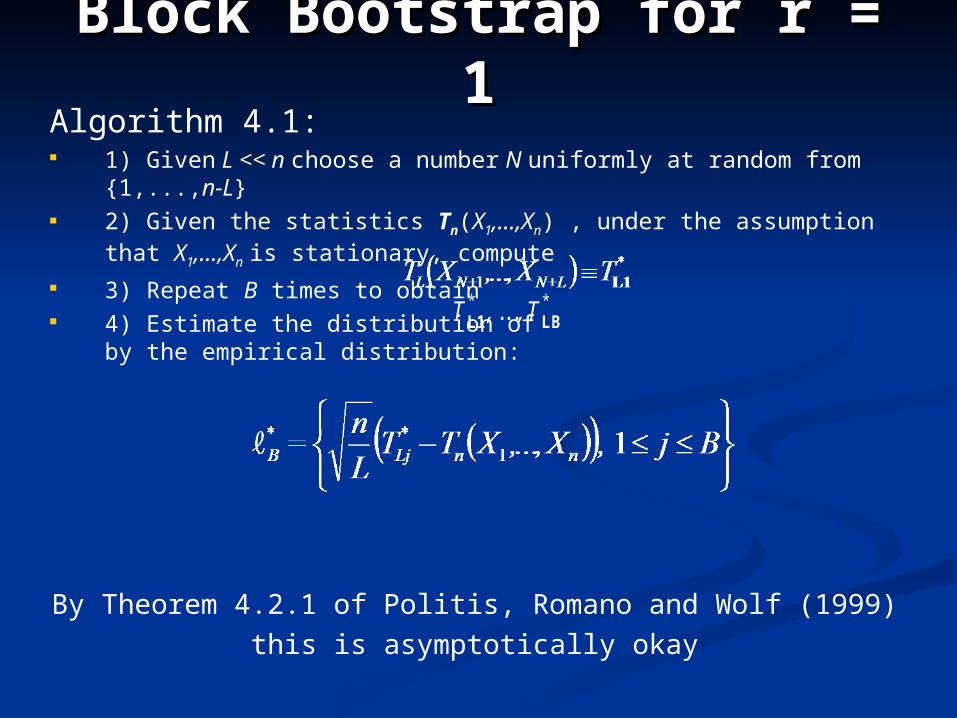
Block Bootstrap for r = 1Block Bootstrap for r = 1Algorithm 4.1: 1) Given L << n choose a number N uniformly at random from
{1,...,n-L} 2) Given the statistics Tn(X1,…,Xn) , under the assumption that
X1,…,Xn is stationary, compute 3) Repeat B times to obtain 4) Estimate the distribution of by the empirical
distribution:
By Theorem 4.2.1 of Politis, Romano and Wolf (1999)this is asymptotically okay
TL1* , .. . , TLB
*

Block Bootstrap AnimationBlock Bootstrap Animationr = 1r = 1
XB*
Observed Sequence (X): Statistic:
S=f(X)
…… …
Draw a block of length L from original sequence, this is the block-bootstrapped sequence.
Calculate statistic on the block bootstrapped sequence.Repeat this procedure identically B times.
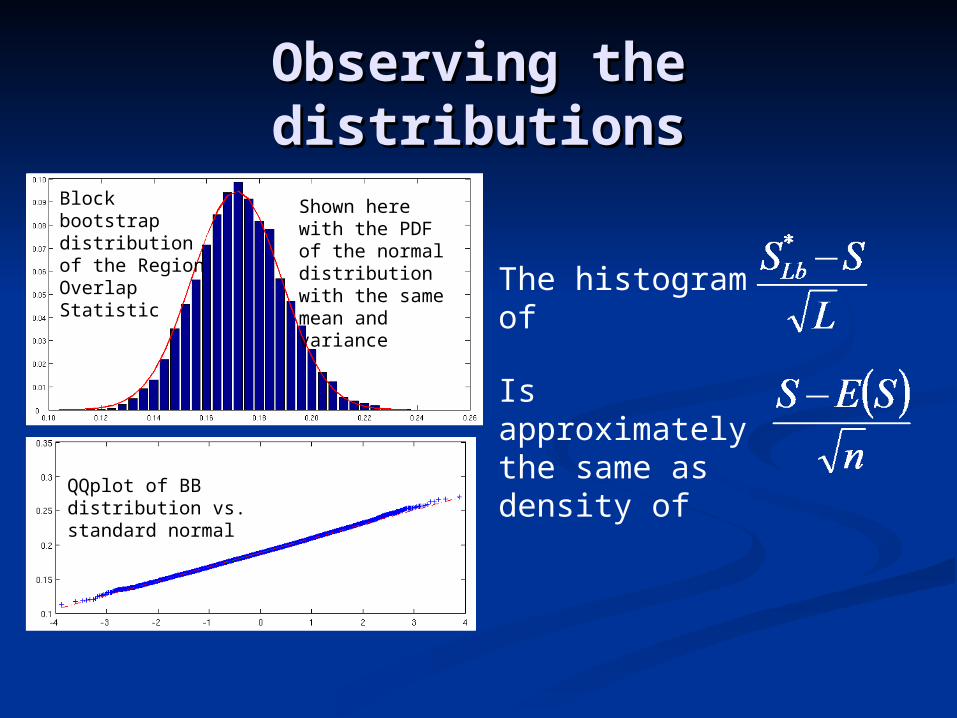
Observing the distributionsObserving the distributions
Block bootstrap distribution of the Region Overlap Statistic
Shown here with the PDF of the normal distribution with the same mean and variance
QQplot of BB distribution vs. standard normal
The histogram of
Is approximately the same as density of
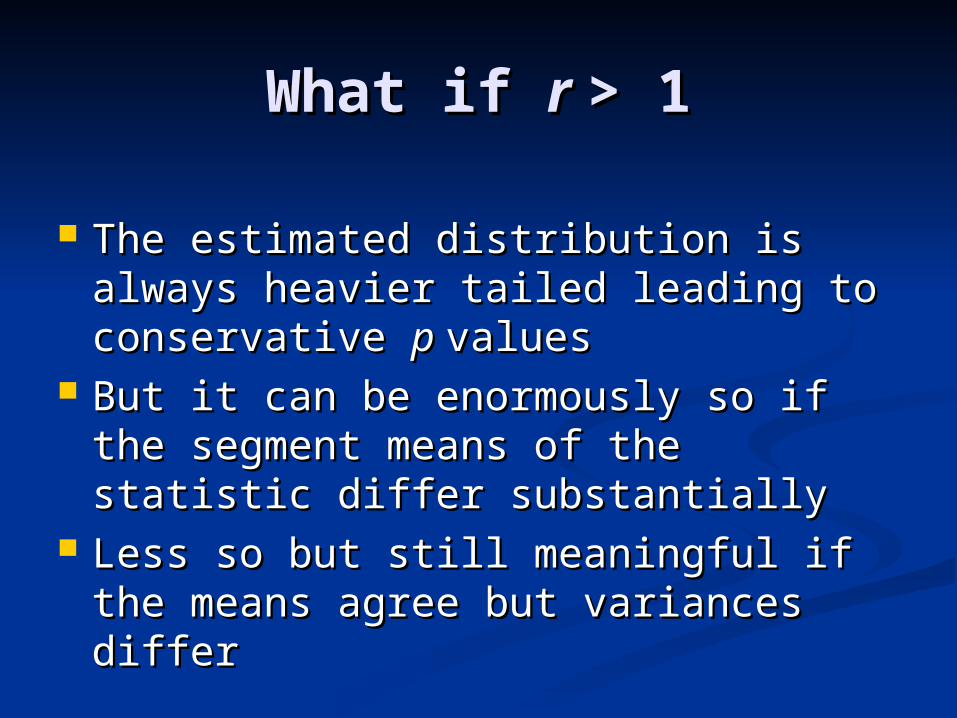
What if What if r r > 1> 1
The estimated distribution is always The estimated distribution is always heavier tailed leading to heavier tailed leading to conservative conservative p p valuesvalues
But it can be enormously so if the But it can be enormously so if the segment means of the statistic differ segment means of the statistic differ substantiallysubstantially
Less so but still meaningful if the Less so but still meaningful if the means agree but variances differ means agree but variances differ
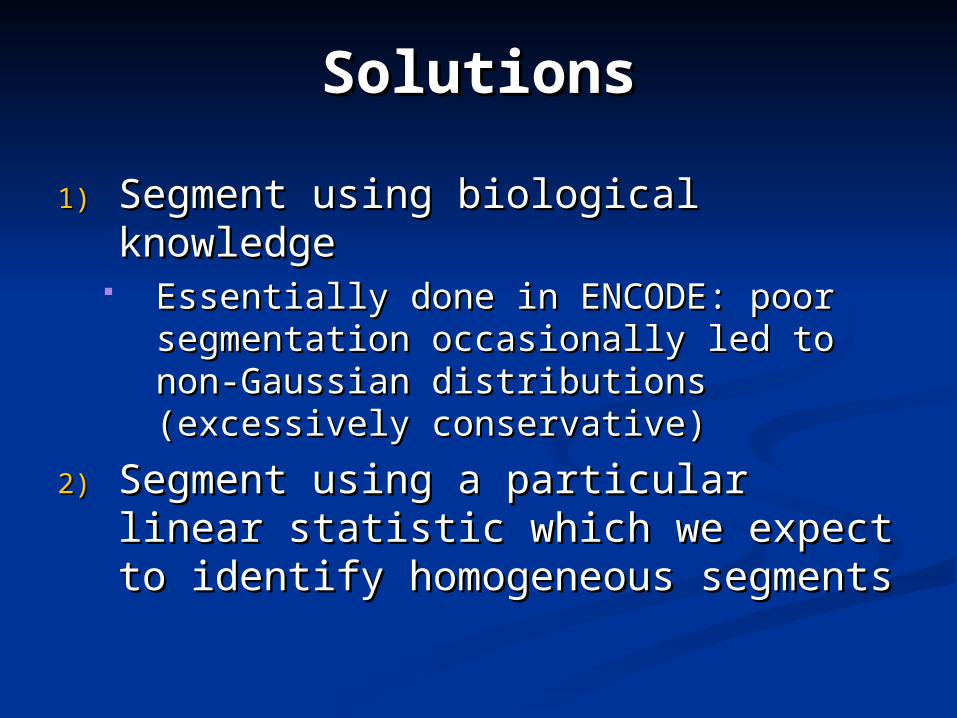
SolutionsSolutions
1)1) Segment using biological Segment using biological knowledgeknowledge
Essentially done in ENCODE: poor Essentially done in ENCODE: poor segmentation occasionally led to non-segmentation occasionally led to non-Gaussian distributions (excessively Gaussian distributions (excessively conservative)conservative)
2)2) Segment using a particular linear Segment using a particular linear statistic which we expect to statistic which we expect to identify homogeneous segments identify homogeneous segments
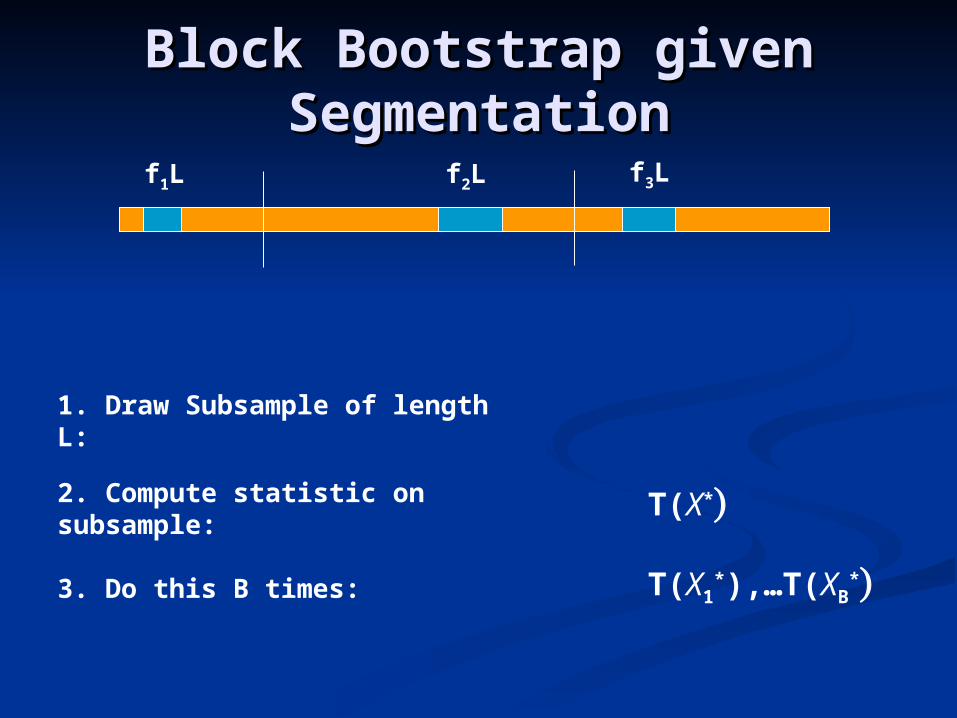
Block Bootstrap given Block Bootstrap given SegmentationSegmentation
1. Draw Subsample of length L:
f1L f2L f3L
2. Compute statistic on subsample:
T(X*)
3. Do this B times: T(X1*),…T(XB
*)
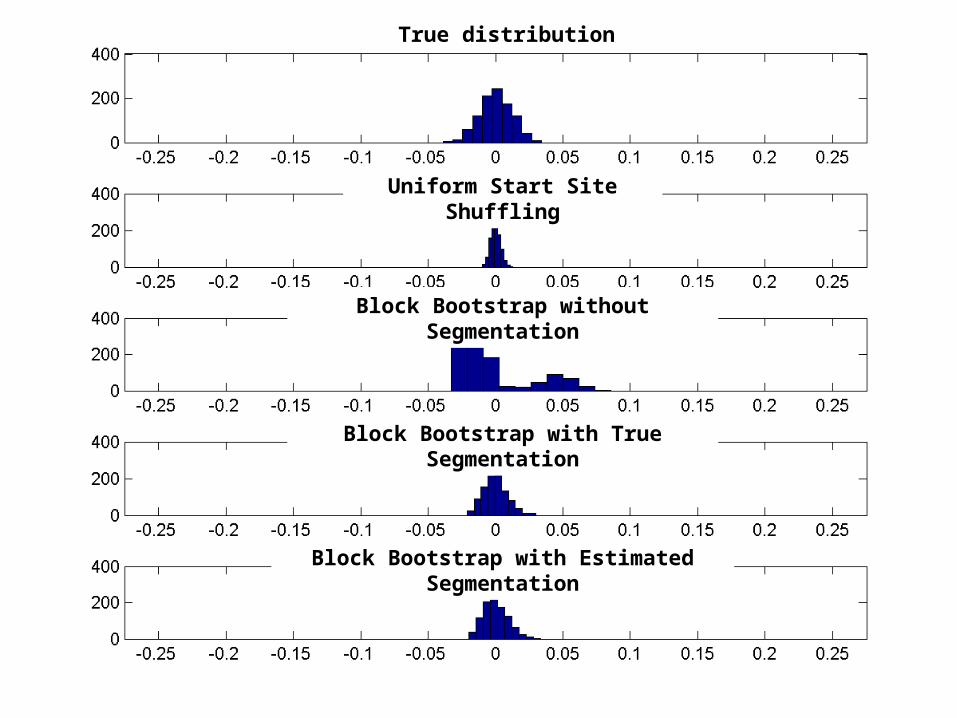
True distribution
Uniform Start Site Shuffling
Block Bootstrap without Segmentation
Block Bootstrap with True Segmentation
Block Bootstrap with Estimated Segmentation

Testing AssociationTesting Association
Question: How do we Question: How do we estimate null distribution estimate null distribution given only data for which we given only data for which we believe the null is false?believe the null is false?
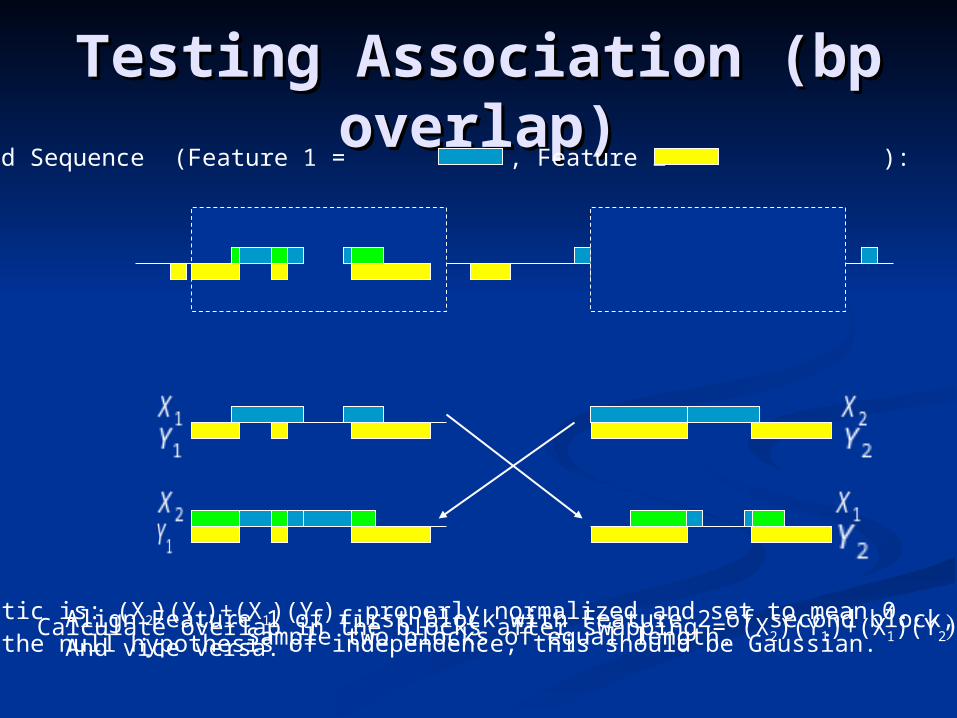
Testing Association (bp Testing Association (bp overlap)overlap)
Observed Sequence (Feature 1 = , Feature 2 = ):
Sample two blocks of equal length.Align Feature 1 of first block with Feature 2 of second block,And vice versa.
Calculate overlap in the blocks after swapping = (X2)(Y1)+(X1)(Y2)Statistic is: (X2)(Y1)+(X1)(Y2), properly normalized and set to mean 0. Under the null hypothesis of independence, this should be Gaussian.
Correlating DNA copy number variation Correlating DNA copy number variation with genomic contentwith genomic content
Redon et al (2007) claimed that copy number Redon et al (2007) claimed that copy number variant regions (CNVs) are significantly (< 0.05 variant regions (CNVs) are significantly (< 0.05 with multiple testing correction) negatively with multiple testing correction) negatively correlated with coding regions, i.e. have less than correlated with coding regions, i.e. have less than randomly expected overlap. Their analysis is randomly expected overlap. Their analysis is based on random shufflings of start positions. Our based on random shufflings of start positions. Our analysis is that the effect is probably an artifact.analysis is that the effect is probably an artifact.
IssuesIssues
Choosing a method of segmentation, Choosing a method of segmentation, e.g. dyadic, and its tuning e.g. dyadic, and its tuning parametersparameters
Block size for bootstrap using:Block size for bootstrap using: stabilitystability segmentationsegmentation
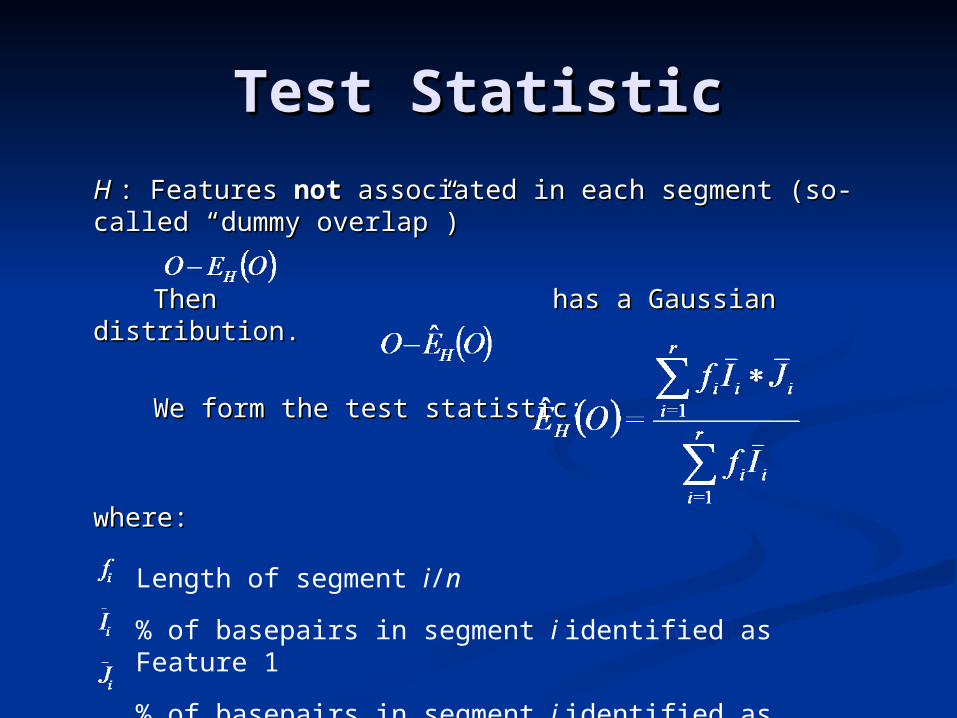
Test StatisticTest Statistic
H H : Features : Features not not associated in each segment (so-called associated in each segment (so-called “dummy overlap”)“dummy overlap”)
Then has a Gaussian distribution. Then has a Gaussian distribution.
We form the test statistic:We form the test statistic:
where: where:
Length of segment i/n
% of basepairs in segment i identified as Feature 1
% of basepairs in segment i identified as Feature 2


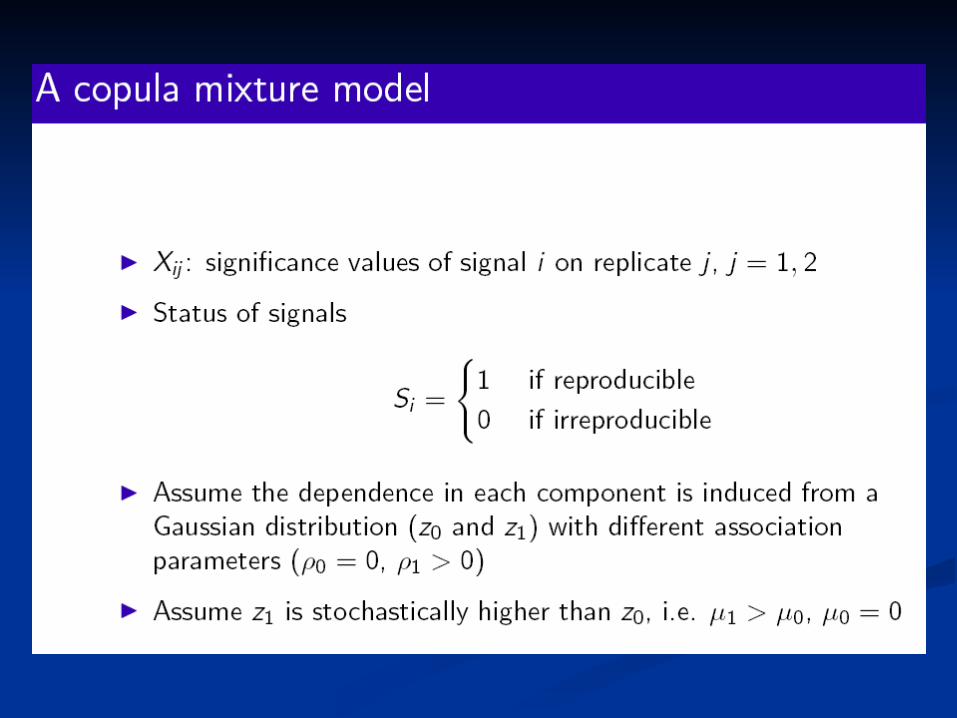
Measuring reproducibility of high-throughput experimentsQunhua Li, James B. Brown, Haiyan Huang, and Peter J. BickelAnnals of Applied Statistics, Volume 5, Number 3 (2011), 1752-1779.

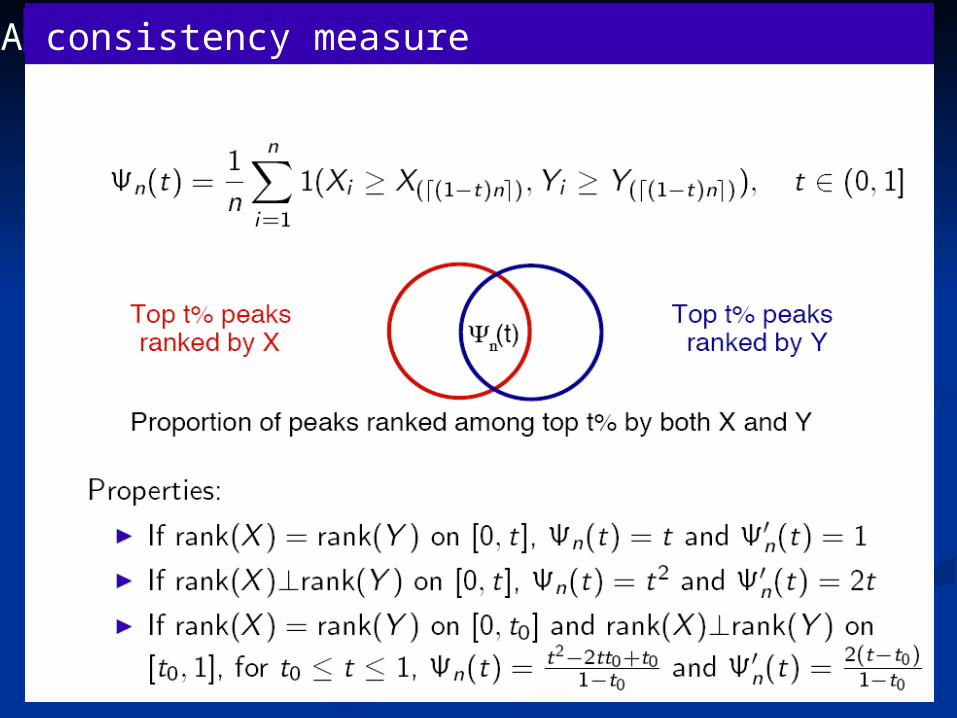
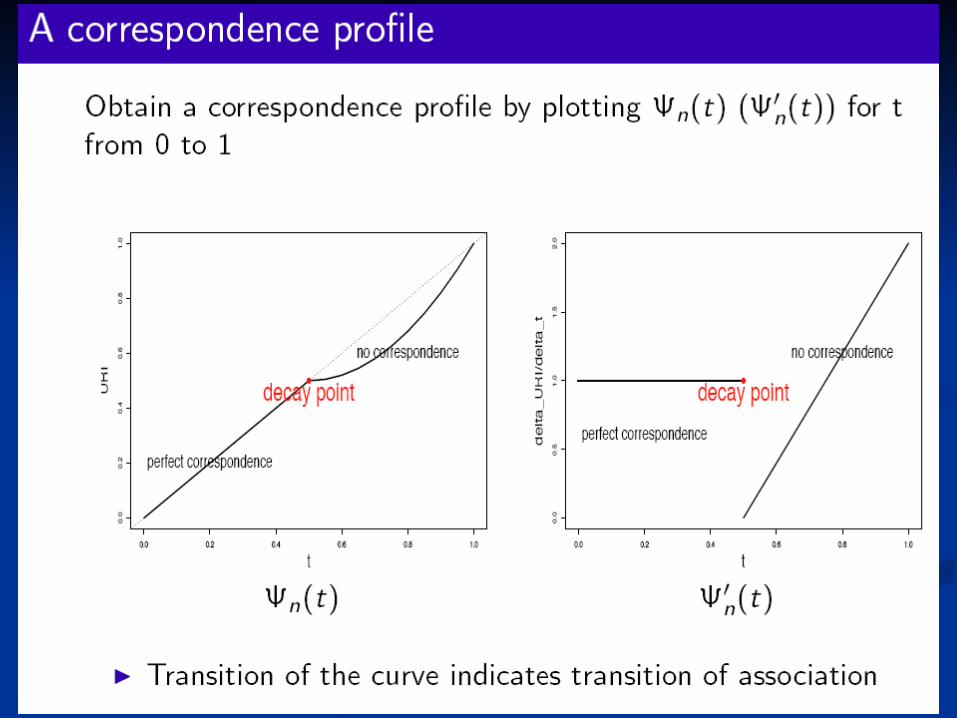
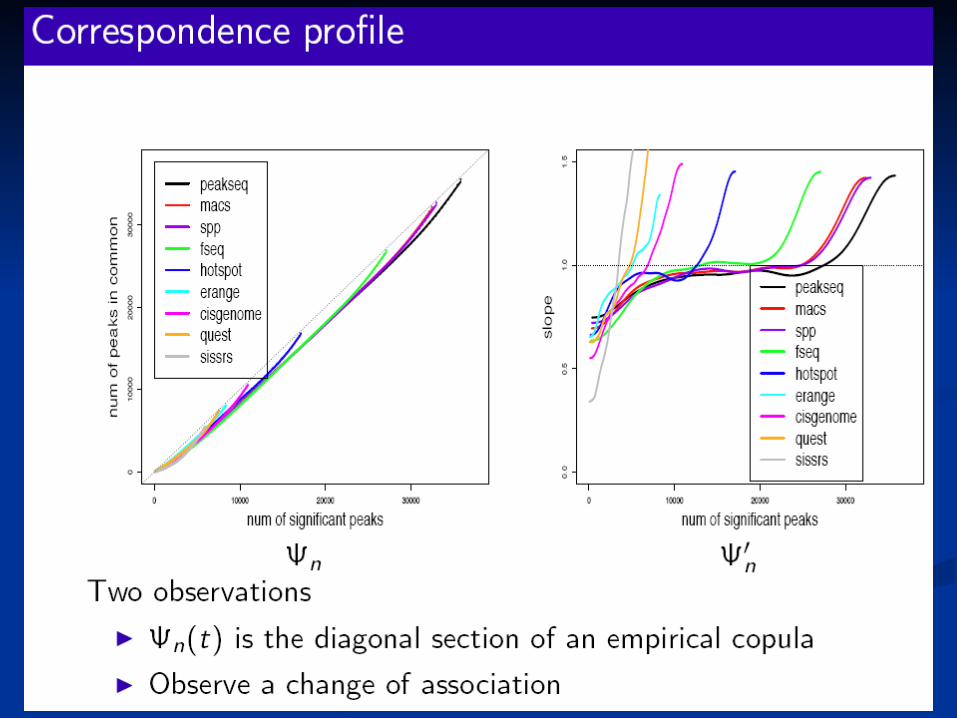
A consistency measure
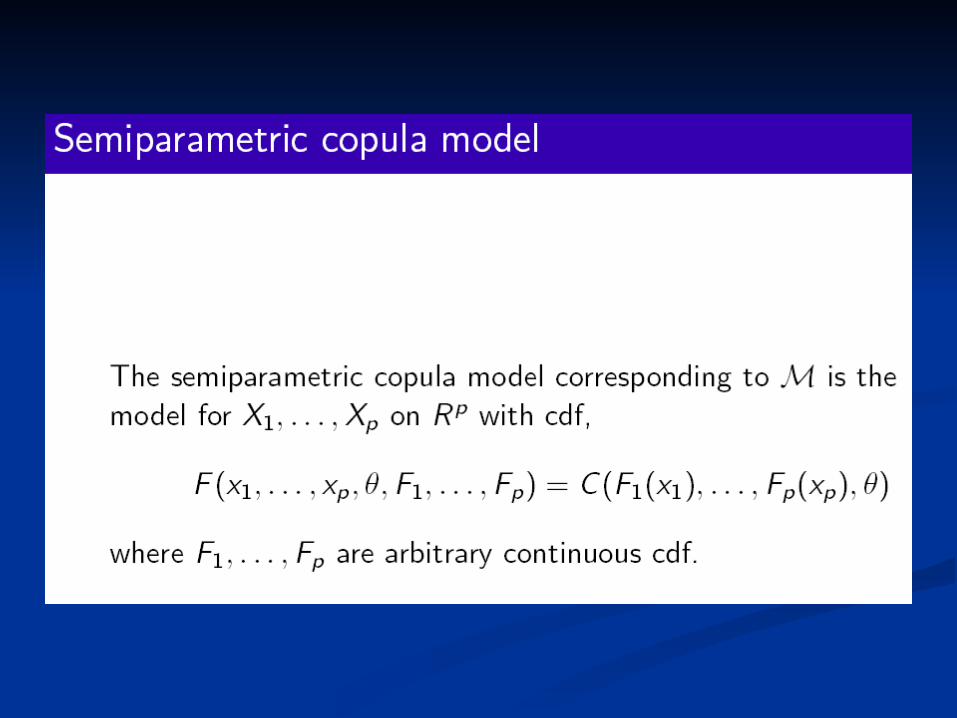
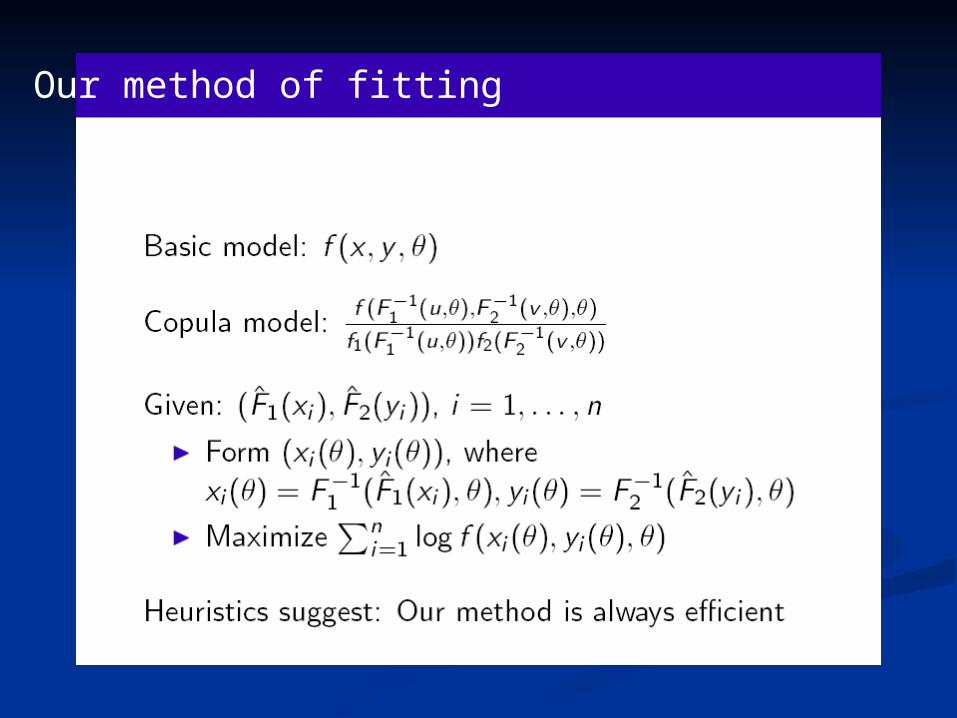
Our method of fitting

Nancy Zhang Ben Brown Qunhua Li Nathan Boley
Jessica Li Anshul Kundaje Haiyan Huang Peter Bickel
Related Documents