Lakehead University Knowledge Commons,http://knowledgecommons.lakeheadu.ca Electronic Theses and Dissertations Retrospective theses 1969 Some dielectric studies Cooke, Brian James http://knowledgecommons.lakeheadu.ca/handle/2453/851 Downloaded from Lakehead University, KnowledgeCommons

Welcome message from author
This document is posted to help you gain knowledge. Please leave a comment to let me know what you think about it! Share it to your friends and learn new things together.
Transcript

Lakehead University
Knowledge Commons,http://knowledgecommons.lakeheadu.ca
Electronic Theses and Dissertations Retrospective theses
1969
Some dielectric studies
Cooke, Brian James
http://knowledgecommons.lakeheadu.ca/handle/2453/851
Downloaded from Lakehead University, KnowledgeCommons

SOME DIELECTRIC STUDIES
A THESIS PRESENTED BY
BRIAN JAMES COOKE
IN CANDIDACY FOR THE DEGREE
OF MASTER OF SCIENCE IN
LAKEHEAD UNIVERSITY
SEPTEMBER 1969
T/j BSBS
Al ‘Sc-
7/ c.,1
(§) I9G3 B-ricoo, CT Cooke
TPtea^S on Mtcrrojpi Im Ho,. I^.3'H’3

ProQuest Number: 10611560
All rights reserved
INFORMATION TO ALL USERS The quality of this reproduction is dependent upon the quality of the copy submitted.
In the unlikely event that the author did not send a complete manuscript and there are missing pages, these will be noted. Also, if material had to be removed,
a note will indicate the deletion.
ProOuest
ProQuest 10611560
Published by ProQuest LLC (2017). Copyright of the Dissertation is held by the Author.
All rights reserved. This work is protected against unauthorized copying under Title 17, United States Code
Microform Edition © ProQuest LLC.
ProQuest LLC. 789 East Eisenhower Parkway
P.O. Box 1346 Ann Arbor, Ml 48106 - 1346

Summary
Two methods of approach are current in the literature
for the interpretation of dielectric relaxation. One is that
due to Debye which assumes that the relaxation process has its
origin in the retardation of mol ecu Tar reorientation due to
frictional forces acting on the molecule. The other treats
dipole rotation as a rate process in which the dipole must
acquire a certain amount of energy in order to surmount a
barrier separating two equilibrium positions of orientation.
The dielectric relaxation times of some large ketones have
been determined at four temperatures using a cell which does not
appear to have been used up to this time for measuring the
dielectric constant and loss of low loss liquids. The molecules
measured were selected because of their size and shape, five
were el 1ipsoidal^and one was disc-like. For the ellipsoidal
molecules^ the position of the dipole within the molecule was
varied to investigate its effect on the relaxation time. A
number of equations, based on the Debye model, which attempt to,
account for the size of molecular relaxation time are examined.
It is found that only the Fischer'equation is satisfactory in
predicting the effects of dipole direction within the molecule.
The experimentally measured activation energies for all
the large molecules were found to be similar and only a little
higher than those observed for smaller molecules. In an attempt
to understand these values a model is proposed based on the

energy expended by the molecule during its reorientation process.
The approach leads to a method for predicting the effect of
solvent on dielectric relaxation time. It is found that the
relaxation time depends exponentially on the internal pressure
of the medium surrounding the relaxing species, and the
activation energy can be accounted for in terms of the product
of an activation volume and the internal pressure. From the
activation volume an estimate is obtained of the angle through
which the dipole rotates. For small molecules it is found that
the angle is of the order of 20®, which indicates a fairly
large jump accompanying the reorientation. For the larger
molecules, however, the angle is much smaller^hence^the behaviour
resembles Brownian rotational diffusion.

Acknow!edgmen ts
I wish to thank my research supervisor* Dr. S, Walker for
his encouragement and many helpful discussions throughout this
work.
I also wish to thank:
Dr. D, G. Frood for his advice and useful discussions.
Dr, *L. D, Hawton for many helpful discussions on acti-
vation processes,
Mr. B. K. Morgan for his invaluable technical assistance.
Mr. D. Lough of the Science Workshop for constructing the
cp-axial cell.
Dr. H. Lpubat and Dr. S. Zingel for providing trans-
lations of French and German papers.
Lakehead University for a graduate assistantship.

CONTENTS
Page
CHAPTER 1 BASIC THEORY AND EXPERIMENTAL METHODS.
Ac Dielectric pGlarisatton and relaxation. 1
Bo The complex dielectric constant, 4
Co Dielectric dispersion equations. 5
Do Apparatus. 9
Eo Determination of e* and e". 15
Fo Analysis of results, 25
Go Dipole moment determination, 34
Ho Preparation and purification of materials, 35
lo Additional measurements. 36
Jo Experimental results, 37
CHAPTER 2 THE DEBYE MODEL AND ITS MODIFICATIONS.
Introduction, 39
Discussion, 40
CHAPTER 3 DIELECTRIC RELAXATION AS A RATE PROCESS.
Introduction. 84
Discussion, 84
Appendix, 141

- 2 - Page
APPENDIX
Experimental Results. 148
Suggestions for Further Work. 159
Bibliography 161

CHAPTER ONE
BASIC THEORY AND EXPERIMENTAL
METHODS

- 1 -
A.Dielectric Polaization and Relaxation (41) (69) (70;„
If a dielectric material replaces a vacuum as the medium between
two parallel plates of a charged ca^p^citor it is observed that the
voltage across the plates is reduced. The ratio of the voltage for
the evacuated capacitor to that containing the dielectric is known
as the permitivity, or dielectric constant, of the medium. The
effect of the electric field on the dielectric is equivalent to
charging the surface of the material with a sign opposite to that
of the capacitor plate in which it is in contact , but since the
material contains no net charges this is a result of the dis-
placement of the positive and negative centres of the material hy
the field. Thus^positive charges are displaced towards the negative
capacitor plate and vice-versa.
The total charge passing through unit area within the dielectric
parallel to the capacitor plates, is called the polarisation of the
dielectric and is given the symbol P. Three component parts make up
the polarisation and they are defined by the relation:
p = Pg + p^ + Pg 1.1
where, P^ is the electronic polarisation and is due to the dis-
placement of the electrons in the atoms of the material, P^, is the
atomic polarisation and arises from the displacement of the nuclei
of the atoms, , is the orientation polarisation due to the orientation of permanent molecular dipoles in the field. The
total polarisation of one mole of the material can be written in
terms of its dielectric constant and polarisability in the form:

- 2
P = £ - 1 e + 2
= 4 TT N
M d
a + y' _1 1.2
1.3
3kT -1'
where M is the molecular weight, d is the density, is the
polarisability of the molecule, /A is its permanent dipole moment,
k is Boltzmann’s constant, and T is the absolute temperature. The
term is the part of the molecular polarizability due
to the atomic and electronic displacements and is thus known as
distortion polarisation. The other term 4TTNyW
the orientation polarization and is observed only in molecules
which pcTSse^ a permenent dipole.
When the dielectric constant is measured at fields of low
alternating frequency it has its maximum value which is termed fhe
static dielectric constant, . As the frequency is increased,
however, the dielectric constant is observed to decrease, this
phenomenon is known as dispersion of the dielectric constant apd
has its origin in the response of the molecules of the material to
the field. Under the influence of a torque exerted by the field
the dipoles rotate towards an equilibrium distribution of
orientation against a restraining force. At low frequencies,
providing that the molecule is sufficiently smell and the retard-
ing force is not great, the dipoles respond instantaneously to the
field variation with time, but, as the frequency is increased the
motion of the molecules is not sufficiently rapid to maintain
equilibrium with the field variation. Hence, there is a time lag
in the responce of the molcules with respect to the field and the
polarization P’b at any time t. , is less than the equilibrium value.

, as described by the equation:
Pfc = Po P ^ I ■
where is the relaxation rate of the dielectric. Since is
rec'orcccl defined as the^rate at which the polarization comes into equilibrium
in responce to a change in the external field to which the material
is subjected it follows from equation 1,4 that V is time required
for the polarisation of the medium to decay to 1/e of its
equilibrium value.

- 4 -
B„ The Complex Pi eteetHc Constant.^
In a perfect capaettor the charging current is TT/2 out
of phase with the alternating potential,hcwever, when the motion
of the molecuTes of the-dtetectrtc"“suffer refaxation effects the
current acquires a component tn phase with the voltage, This gives
rise to dissipation of the energy of the field in the form of Joule
heating, and under th4se conditions the dielectric constant is
represented as a complex numberj viz:
e* = e' - ie"
where e' represents the ability of the medium to store the energy
of the field and e" a measure of its ability to dissipate the
field energy. . When the field frequency is low e" is zero and e'
approaches frequency approaches the dipoles are no
longer able to alter their orientation and the dielectric constant
approaches that of a non-polar material. Under these conditions
e" approaches zero and e' is termed the optical dielectric
constant.

- 5 -
C. DteTectrtc Dispersion Equations,
Debye (41) showed that when the polarization of a
dielectric was characterized by an exponential variation with time,
the complex dielectric cpnstant could be related to the relaxation
time and the field frequency, oo, by the equation
- e + - e -^18 1 + i
0.5) U)T
On separation into real and imaginary parts
8 ' =8 ^0 -
1 + 03^ (1.6)
e" = (.""o - 0.7) 1 +
These are known as the Debye dispersion equations and
describe the behaviour of the complex dielectric constant as a
function of frequency.
Examination of equation (1.7) shows that e" approaches
zero when COT is either small or large, while for the value
COT = 1 it is a maximum. Hence, by determining the frequency at
which e" has its maximum the relaxation time can be evaluated.
The behaviour of 8* and e", as represented by equations (1.6) and
(1.7) is illustrated in fig. 1,1.
Elimination of COT from equations (1.6) and (1.7) gives
the relationship between e' and e":

- 6 -
P
9^
^ ^ lo u \X i.OQr
eVwp e* AS A fUMcnoN OP 4)Y
- 7 -
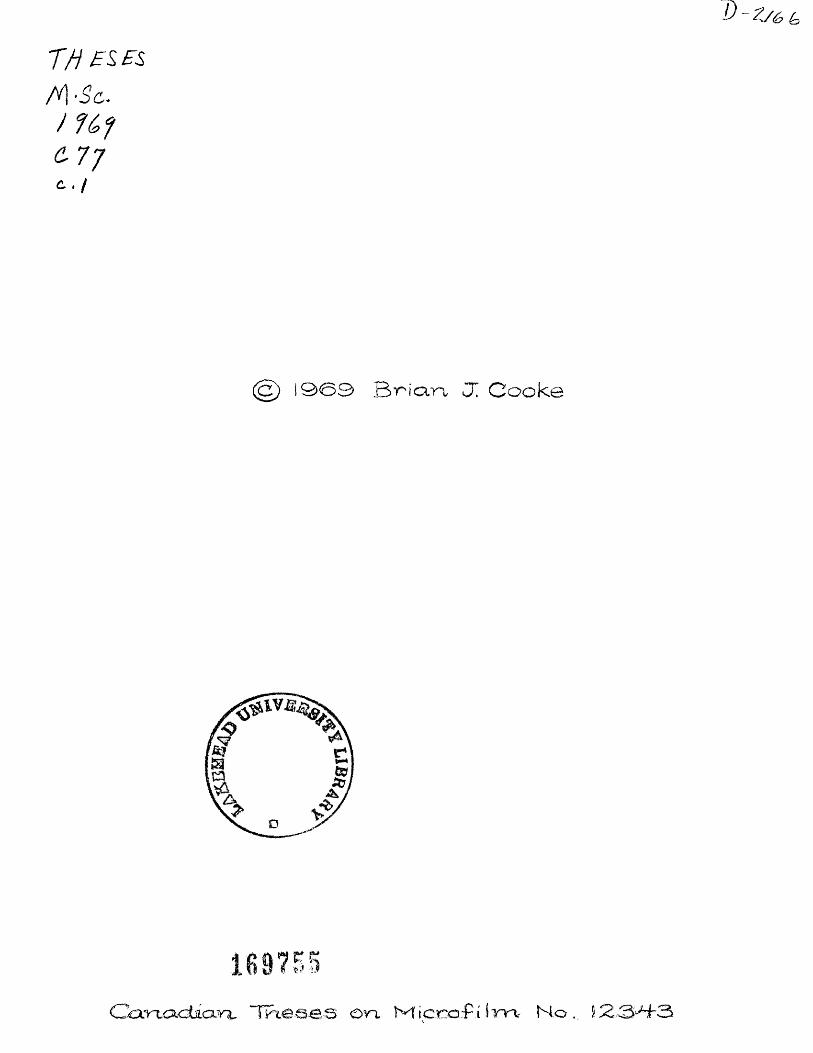
(e- - + (e")2 « (fSUl±l)2 (1.8) 2 2
which is the equation of a circle. ; The locus of e' and e" in
an Argand diagram is a semi-circTe of radius - e<x./2 and centre
of co-ordinates (^.^ , 0. This is known as a Cole-Cole (71)
plot and it is seen that the centre of the semi-circle lies on
the axis of reals. ;
For many dielectric systems the Cole-Cole plot is found to
be an arc which corresponds to a clockwise rotation of the semi-
circle about the point. Hence the centre of the semi-circle is
below the axis of reals, and the behaviour of is represented by:
£*=£„+ ""O ~ ^ 0 -9) (1 + iu>To)^-“
in which TO is the most probable, or mean, relaxation time and
corresponds to the reciproGaT of the angular frequency at which
e" is a maximum, and a, the so-called distribution coefficient,
is a measure of the spread of relaxation times about TO and has
the range of values 1 > a > 0. When a is zero (1.9) reduces to^
(1.5).
Separation of (1.9) into real and imaginary parts yields:
_ + (gp - gco)[l + (t4T^)^“°^ sin(a7)] (1.10)
1 + 2(U)TQ)^ ^ sin(a^/2) +
^11 Up ~ gpc.)COs(gTT/2) (l.Tl) . .1-a . , 'rr,„x 2(l-a) 1 + 2(COT,Q) Sin(a /2) + 03TQ

- 8 -
For systems which are characterized by two independent re-.
Taxation times Budo (12) assumed that the complex dielectric
constant could be represented by the superimposition of two over«
lapping Debye absorptions. Such behaviour is described by the
equations:
(1.12)
C, + C 2
(1.14)
where T-| and T2 are the relaxation times of the two processes
and C“| and C2 weight the importance of each contributing
absorption.
9
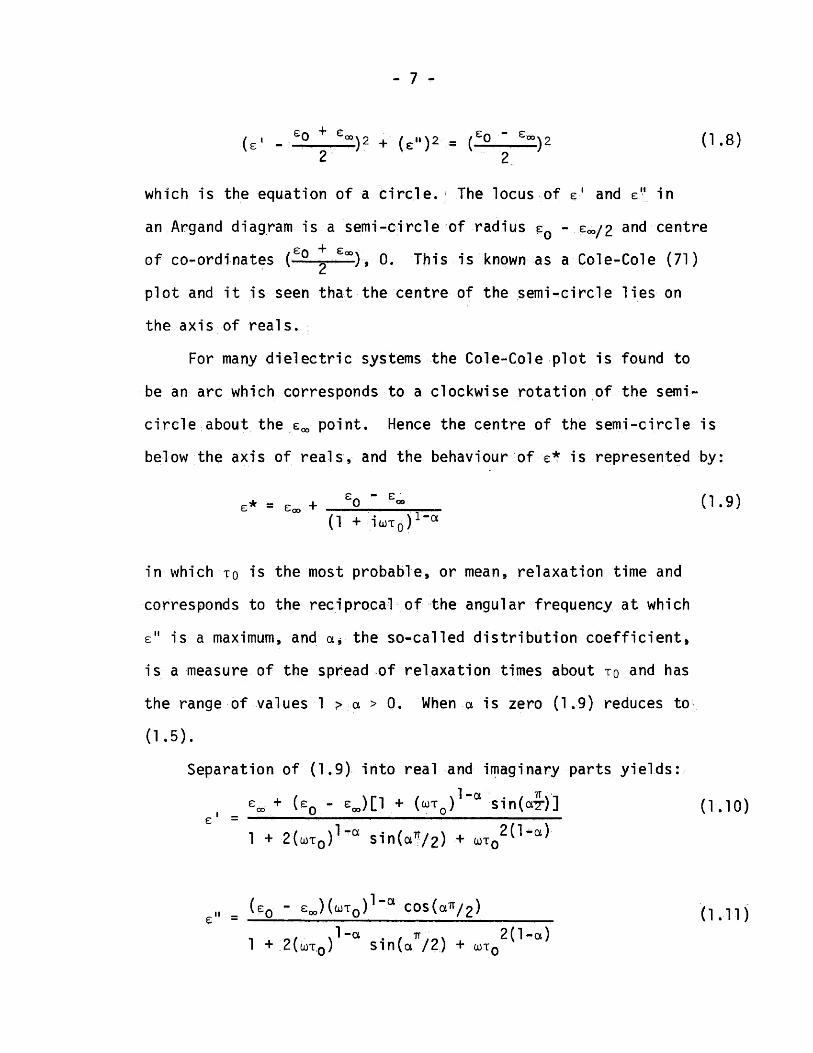
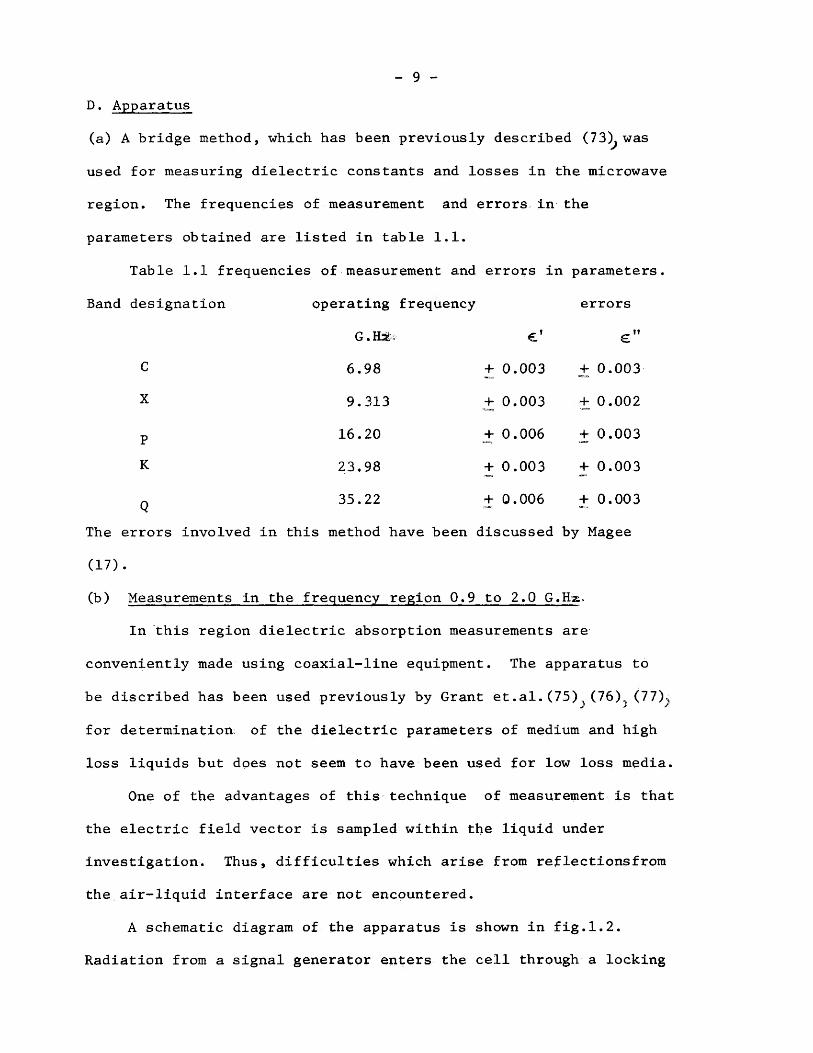
D. Apparatus
(a) A bridge method, which has been previously described (73)^ was
used for measuring dielectric constants and losses in the microwave
region. The frequencies of measurement and errors in the
parameters obtained are listed in table 1.1.
Table 1.1 frequencies of measurement and errors in parameters.
Band designation operating frequency
C
X
P
K
G.m.
6.98
9.313
16.20
23.98
35.22
± 0.0G3
± 0.003
+ 0.006
+ 0.003
+ 0.006
errors
G"
± 0.003
± 0.002
± 0.003
+ 0.003
+ 0.003
The errors involved in this method have been discussed by Magee
(17).
(b) Measurements in the frequency region 0.9 to 2.0 G.H^.
In this region dielectric absorption measurements are
conveniently made using coaxial-line equipment. The apparatus to
be discribed has been used previously by Grant et.al.(75)^(76)^ (77)^
for determination: of the dielectric parameters of medium and high
loss liquids but does not seem to have been used for low loss media.
One of the advantages of this technique of measurement is that
the electric field vector is sampled within the liquid under
investigation. Thus, difficulties which arise from reflectionsfrom
the air-liquid interface are not encountered.
A schematic diagram of the apparatus is shown in fig.1.2.
Radiation from a signal generator enters the cell through a locking

10
FiQ- t-a ScHEriATJC DlAGrf^AH op CoA>4tAL. CEUL-
I ftC UiT

11 -
coniie^ctor and is reflected from a silver short circuiting plate at
the opposite end. The electric vector of the resulting standing
wave pattern is sampled, within the liquid, by a probe which
projects from the inner conductor of the coaxial cell. The output
from the probe passes into a mixer where it meets with a signal
from the local oscillator tuned to a frequency 30 MHz„ away from
the input signal. The resulting beat frequency is fed into an
intermediate frequency amplifier which has a calibrated db. scale
and allows the power level to be determined at the probe position.
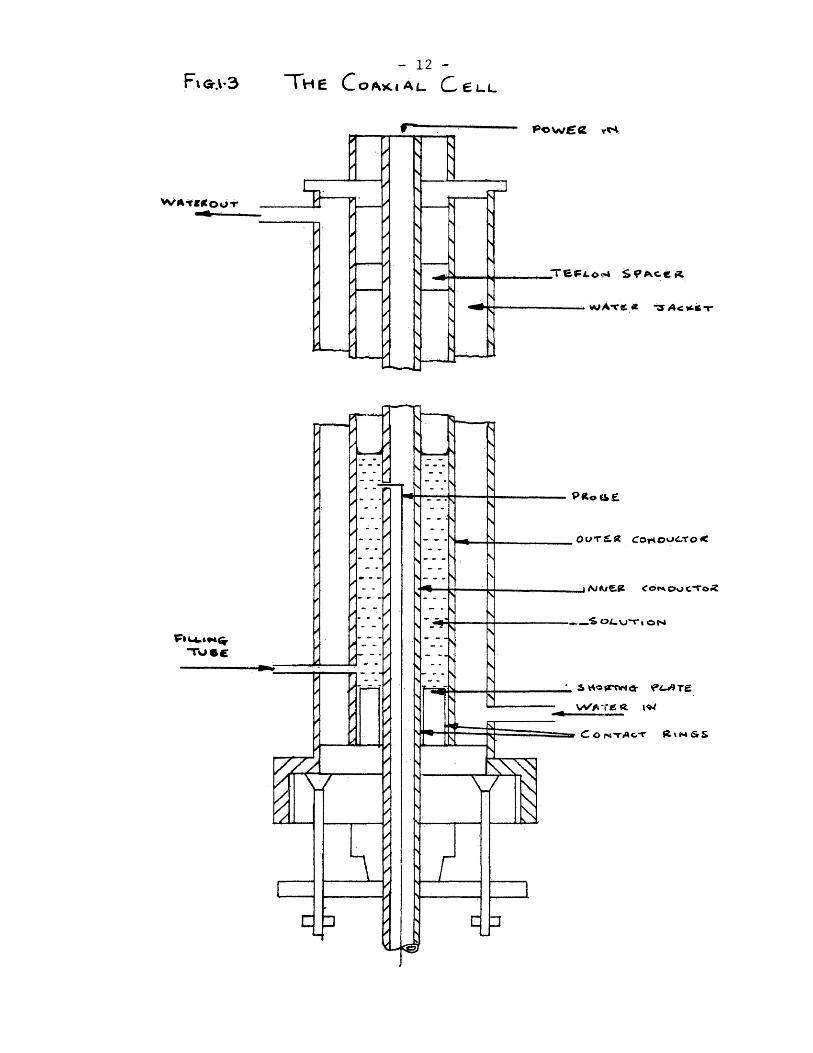
The cell is hown in fig.1.3. It consists of a coaxial line
made from a silver outer conductor of i.d. 14.3 mmcand a silver
inner conductor of o.d, 4.1 mm. To ensure good electrical contact
between the conductors and the shorting plate contact springs, made
from silver collars, were inserted between both conductors and the
short circuit. The centre conductor passes through a telescopic
tube which ensures that it moves along the axis of the cell. Two
teflon plugs hold the guide tube in position and its top, at the
input end*which is connected to the centre contact of the input locking
connector. The probe is the termination of the core of a length
of cpaxial cable which passes down the centre of the silver inner
conductor. It is held in position by a plug of polyethylene which
was melted within the centre conductor to provide a seal and eliminate
the possibility of solution entering the tube. The position of the
probe within the cell is measured on a vernier caliper which can be
read to an accuracy of 0.02 m/m. The cell is filled through a small
tube which passes through the water jacket into the centre conductor.
The cell temperature could be controlled to + 0.05°C, by circulating
- 12 - Rai-3 THE C OAKIAL. C,eL-L
OurEft COHOOC.TO<
jAJA^€.fi£ Coi^OoC'ToiS
i..^S 04.VJ*^i 0^4
ftHofCTiNet: 'Pi-*9Te
W'^Tg R
CoHn-Ac-r R\M6TS

- 13 -
water from a thermostat bc^th through an outer jacket.
The frequency of the input radiation was measured using a
Rodhe and Swartz U.H.F, Resonance Frequency meter type WAL.
BN 4321/2.
A pad attenuator was inserted in the line between the
oscillator and the cell to prevent pulling of the oscillator,
Tuners were used in the line between the signal source and cell,
and between the cell and mixer^ to match the impedances of the
circuit components. In order to eliminate harmonics generated by
the source low pass filters^covering the appropriate measuring
ranges^ were inserted in the line between the oscillator and the
cell. All connectors between components were General Radio Type
QBL locking connectors to reduce reflections in the line and avoid
any stray electromagnetic fields.
Table 1.2 lists the oscillators and components used in this
Table 1.2
Frequency Range
G.Hx,
Supplier
Rohde & Schwartz
apparatus.
Component
Oscillators
Low-Pass
Filters
Tuners
Mixe^'
G.50 - 2.50
0.90 - 2,00
<1.0 <2.0
0.90 - 2.0
0.90 " 2.0
General Radio
General Radio
General Radio
Microlab
General Radio
Model
SLRD
1218B
874 FIOOOL
874 F2000L
874LTL
S305N
MRAL

Table 1.2 eontlnuecl.
Component Frequency Range Supplier
G.Hz.
I.F.Amplifier
and db. meter 30 M.Hz General Radio
Model
1236

- 15 -
E, Peterminatj-on of and €*'
The variation of electric field strength of an electro^
magnetic plane wave, travelling through a medium, as a function
of time^ t^and distance^X, is described (79) by the equation ~
6 £o o ooh ^ 1.15
where Eo is the amplitude of the elactric vector, 60 is the angular
frequency, and hf is known as the propagation coefficient defined
by the equation:
ok L/S 1.16
The significance of ^ and/S is understood when 1.16 is re-
written in the form 1.17
E- CE© C ^
The first term on the right hand side is the amplitude of the wave
and it is seen that in travelling through a distance x the electric
veotor has been reduced by a factor exp - (®^x). Hence ok is known
as the attenuation constant and is a measure of the dirainu^tion of
the electric field intensity of the wave per cm^of the medium. The
second term indicates that the phase of the wave has been reduced by
/Sxradians, henee^ ^ is known as the phase constant.
When fhe incident wave, travelling in the +x direction, meets
the shorting plate it is reflected back towards the source. The
reflected wave returns to the -x direction and combines with the
incident wave to form a standing wave^ the resultant field strength
of which is given by'
1.18
1.19
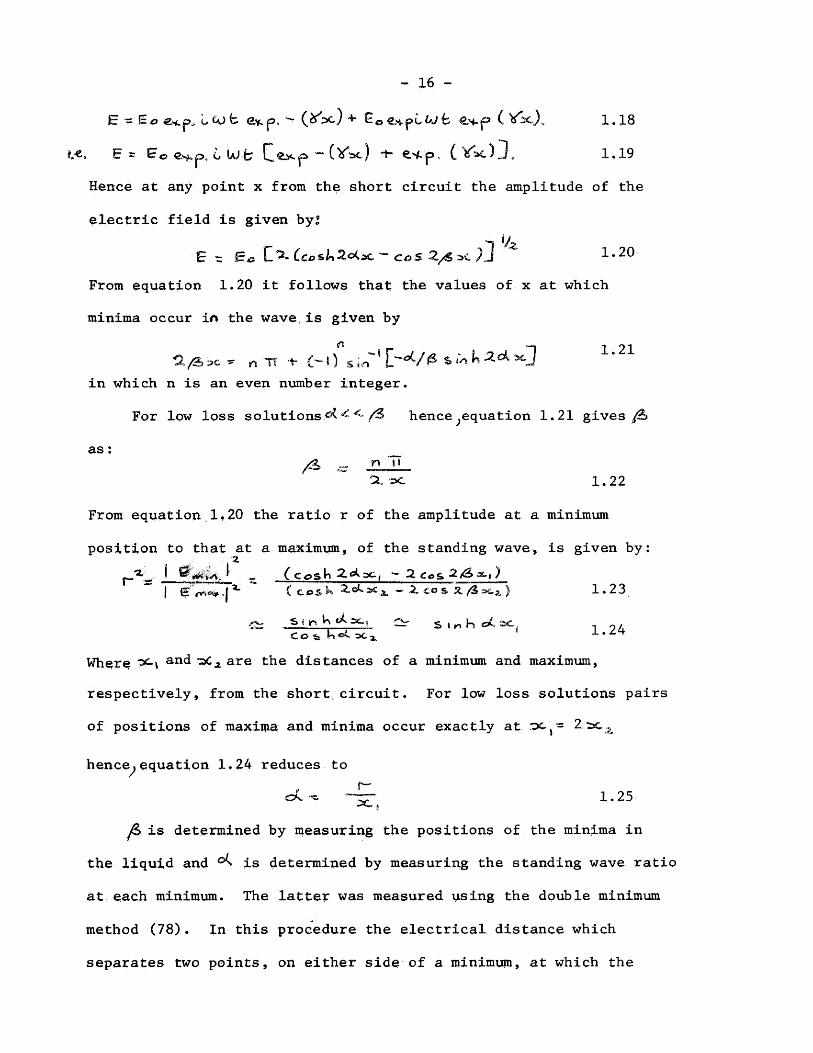
- 16 -
E - Eo Lco b <€.M-p C
?.«, E = Eo e^^p, c U^fcr C^p €.s^p- ( V»c)D
Hence at any point x from the short circuit the amplitude of the
electric field is given byj
E := ^cx>s/^2oCa>c ~ ccS 2,^ PJ 1.20
From equation 1.20 it follows that the values of x at which
minima occur in the wave,is given by
r * L"^/^ s aVi k >c^ eger.
For low loss solutions ^ ^ hence ^equation 1.21 gives ^
■>C 3? 'IT -V C'“U Sin
in which n is an even number integer.
as: n n
1,22
From equation 1.20 the ratio r of the amplitude at a minimum
position to that at a maximum, of the standing wave, is given by: 3.
L - C Cosh 2,C^3C| — ^CoS^i^3fc{) .IL Cios K 3LO*^3C^ - Z C0 S X /Ssc^ )
^ Ssr^Kfclsc, Cr Si<ih«3^S5«^
1.23
1.24 Co ts 5>Ca,
Where andare the distances of a minimum and maximum,
respectively, from the short, circuit. For low loss solutions pairs
of positions of maxima, and minima occur exactly at
hence^equation 1.24 reduces to
f~ IxT 1.25
in J$ is determined by measuring the positions of the minima i
the liquid and ^ is determined by measuring the standing wave ratio
at each minimum. The latter was measured using the double minimum
method (78). In this procedure the electrical distance which
separates two points, on either side of a minimum, at which the

17 -
output Is twice the mlnlinum value, is measured* The s«w«r. Is
then given by the equation:
t tt A m r- ^ (1.27)
whereArytls the length ol the wave in the liquid ^and A ^ Is the
distance between 2 points on either side of the minimum separated
by 3db.
and are related to and C* for coaxially propagated
wav«sby: AJ^
(1,28)
and <2% at/S Xp (1.29)
4TT*'
where^ is the free space length of the wave, Hence^by sub-
stituting values of^ and ^ from equations (1.22) and (1.23)
In (1*28) and (1.29) and 6"may be obtained.
The above theory was deduced on the assumption that the short
circuit was perfectly reflecting and that the probe had no perturbing
effect on the field* Buchanan andGrant showed that errors in ^
result If these two conditions, are hot fulfilled. Minimal errors
In owing to reflections from the probe^ are introduced when the
length of the; latter Is 0.3 m/m or less, Thus^thls was the
optimum length selected for the probe. The above authors found
that for a reflecting probe the apparent values of ^ increased as
the distance from the short circuit Increased, whereas If the short
circuit Is dissipative decreases with increasing distance from
the short circuitt
To test the efficiency of the short circuit and the suitability
of^the probe the cell was filled with acetone, which gave a large

18 -
number of minima, and was measured at each minimum. The cell was
found to be satisfactory up to a frequency of 2.5 G.Hz, at this
short which indicated errors due to reflections from the probe.
Measurements were thus limited to an upper frequency of 2.0 G.Hz.
It was found impossible to reduce the probe length, to extend the
usable frequency range, since this resulted in a large decrease in
the level of the detected power.
(c) Assessment of the cell
Since the data obtained from the cell described forms a major
part of the Cole - Cole plot the apparatus was evaluated by
measuring the dielectric absorption of five dilute solutions of
A Cholestadlene-7-one covering a range of concentration. The
solvent used was p-xylene^and in addition to the above, measurements
the static dielectric constant ,at. 2 MHz, and the refractive index,
at the frequency of the sodium D line, were measured for each
solution. A Cole - Cole plot,was constructed for each concentration
and the data analysed using the Cole - Cole computer program.
It has been shown (80) that the dielectric parameters
can be represented as functions of concentration by the
linear equations:
value, however, increased with increasing distance from the
jf II (1.30)
’2. (1.31)
(1.32)
£ :r j + CL • •4.
(1.33)

- 19 -
Where ^ is the slope of the line, U>2, is the weight fraction of
the solu+e , and is the dielectric constant of the solvent. From
the oc values a Cole - Cole plot can be constructed and analysed to
give the required parameters ^ . For each plot the
I a dipole moment was evaluated. The moment from the a — o. plot
was obtained from the equation.
SI rn C s J 4" 2. )
(1.34)
Hencejcomparison of the data from each concentration plot with that
j from the a “ ou plot gives an assessment of the accuracy of the
method. In addition the dipole, moment was evaluated by the
Guggenheim method (55), to compare with the values obtained from the
plots. Such a comparison is an invaluable aid as a check on the
analysed value, since errors in this parameter seriously affect
the relaxation time.
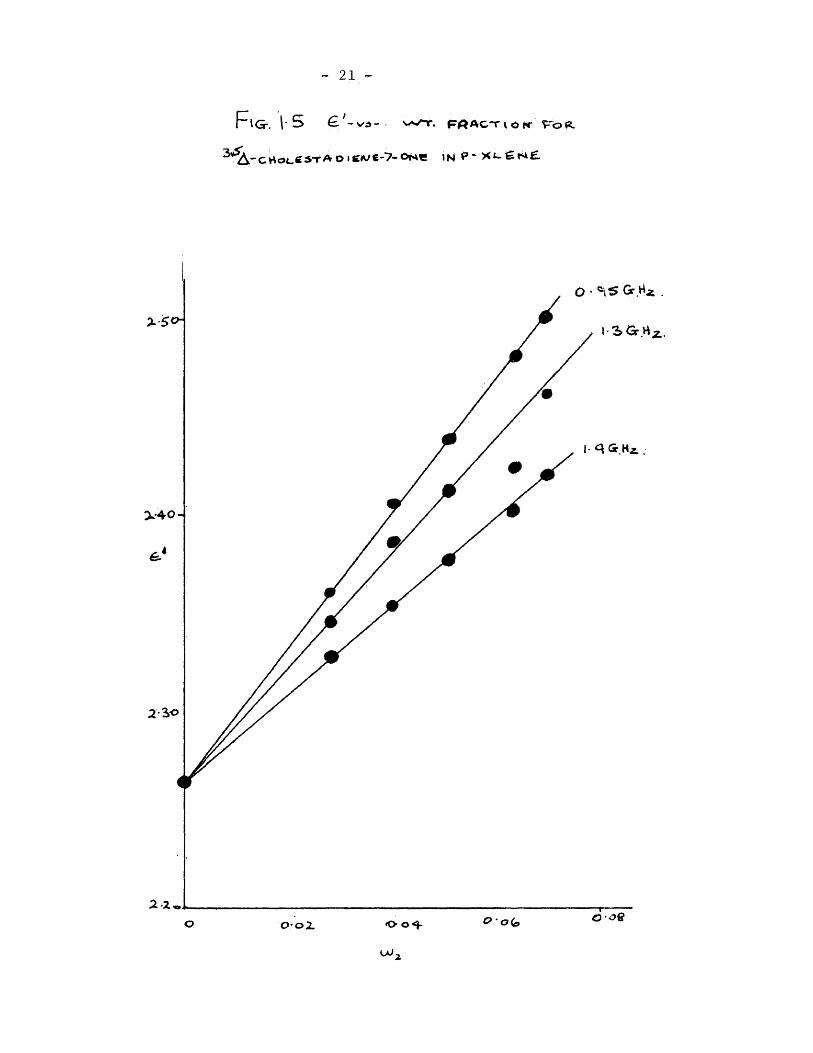
f * A typical Cole- Cole plot, at one concentration and the ©1 ” Q-
I plot^are shown in fig. 1.4. The ^and ^ against concentration
plots are shown in figures 1.5 and 1.6 for the three frequencies at
which the cell was employed. It is seen that the ^ vs, concentra-
tion plots do not pass through the origin. The intercept on the
^ axis at zero concentration was taken to be due to wall losses
within the cell.
The results of the analyses of the data are given in table 1.3.

FIG-
20 \ "
a •“ Q PLOT
IN
FOR. A-Cv40LST’ADl£Ne -'7«-ONE
P-V.TL.ENE. N
FIG Cove-CoL-e PLOT f=^oR A-CH6LESTADfENE-*7-0NE
IN p-viLENe 7"c C7 0^0^<i',
- 21 -
FIG-. 1-5 w^.
CSTA O Ie-'?-ONC IN P * ><G

22
Fldr V t>. ^-V5- loH
<:HOL.esTADiew6»H
Fo^
P->c^L.E«se
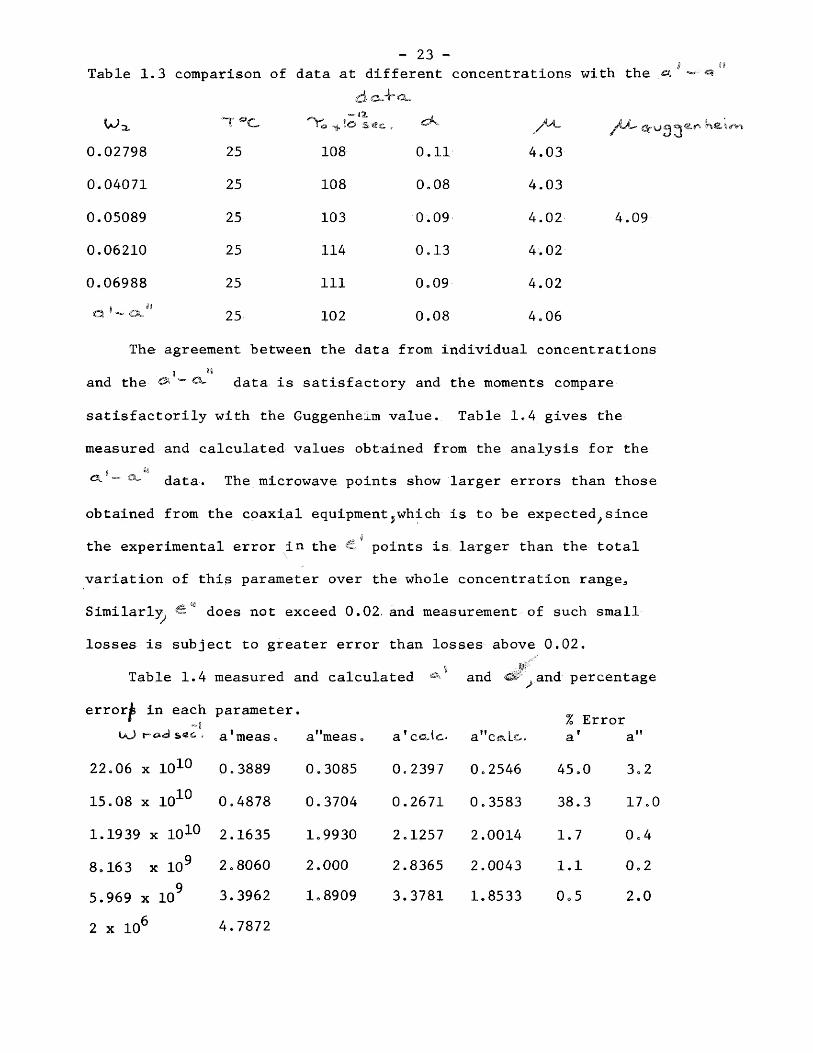
- 23 -
Table 1.3 comparison of data at different concentrations with the
0.02798
0.04071
0.05089
0.06210
0.06988
25
25
25
25
25
25
— Ji
r® ^ !o
108
108
103
114
111
102
0.11
0.08
0.09
0.13
0.09
0.08
4.03
4.03
4.02
4.02
4.02
4.06
4.09
The agreement between the data from individual concentrations
and the ^ Q- data is satisfactory and the moments compare
satisfactorily with the Guggenheim value. Table 1.4 gives the
measured and calculated values obtained from the analysis for the
j »8 <3L ” a, data. The microwave points show larger errors than those
obtained from the coaxial equipmentjwhich is to be expected^since
the experimental error in the points is larger than the total
variation of this parameter over the whole concentration range^
Similarly does not exceed 0.02, and measurement of such small
losses is subject to greater error than losses above 0.Q2.
Table 1.4 measured and calculated and and percentage
errorfe in each parameter.
OO r“4»dl s<26.» a’meas.
22.06 X lO^O 0.3889
15.08 X 10
1.1939 X 10
10
10
0.4878
2.1635
2.8060
5.969 X 10' 3.3962
8.163 X 10'
9
a"meas. a’cettc. a"c©iLc,.
0.3085 0.2397 0.2546
0.3704 0.2671 0.3583
1.9930 2.1257 2.0014
2.000 2.8365 2.0043
1.8909 3.3781 1.8533
% Error a’
45.0
38.3
1.7
1.1
0.5
a"
3.2
17.0
0.4
0.2
2.0
2 X 10' 4.7872

24 -
In view of the satisfactory agreement between the various
parameters determined at individual concentrations, with one
another and the a -CL data, future measurements were made at a
single concentration.
Before making any measurements on any solutions the dielectric
constant of cyclohexane was measured in order to check that the
apparatus was working satisfactorily and to determine the short
circuit position. The latter could not be measured directly since
the vernier caliper was attached to the inner conductor at a
position which prevented the probe from being damaged by contact
with the shorting plate. Combined solvent and wall losses were
measured and subtracted from the apparent loss of the solution.
When there were sufficient minima^within a measured solution^the
position of the short circuit was calculated from the minima positions
and compared with that obtained from measuring cyclohexane. This
provided an additional check on the accuracy of the determination
of the minima positions. The loss factor was determined at each
minimxjm and the average value used in the construction of the
Cole - Cole arc.
25 -
F* Analysis of Results
(a) The mean, or most probable, relaxation time, .
The Cole - Cole plot (71) was used as the basis for the
interpretation of the dielectric data. Values of ^ and
were estimated from the plot whereas was estimated from one
of the linear plots. These estimates together with the measured
value of and at each frequency of measurement, and ,
were fed into an I.B.M. 360 computer programed to fit equations
14^ and l.j^'l to the experimetal data.
From the initial estimates of ^^and the computer
back calculates the values of and S ’ at each frequency and, by
an iterative procedure, the three parameters are suc^e^ively varied
until the square of the differences between measured and calculated
values is a minimum. At this stage the best fit of the experimental
data to the equations is obtained. The accuracy of the analysis was
then judged from a comparison of the calculated and measured values
when minimisation was complete.
(b) Graphical Methods of Analysis
'V© may be obtained by plotting the function log ^
against log ^ > where v is the distance between an experimental
point on the arc and , at a frequency , and ^ is the distance
from the point to .
If follows from the relation?,

26 -
that when log ix. zero the frequency intercept corresponds to
that at which ^ is a maximum, hence, is evaluated from this
frequency®
A number of other equations have been obtained by algebraic
manipulation of equations 1.6 and 1.7.
Elimination of from 1.6 and 1.7 gives;
«S'= O'uje" (1-35)
and
® ^ Xe" (1.36)
These equations are linear and can be obtained from the
slope by plotting against either€*u5or . Equation 1.35
has been employed by Purcell, Fish and Smyth (74) to give an
indication of a second relaxation process for systems showing a
non-zero distribution coefficient. For systems characterised by
behaviour the plot is a curve, the limiting slopes of which
in the low and high frequency regions give the approximate values
of two relaxation times, This procedure tends to yield a higher
relaxation time which is too short, and a lower relaxation time
which is too long.
The plots of equation (1.35) for the three types of behaviour
according to equations (1.5), (1.9) and(l.12) andCl.13)are given in
fig. 1.7. The corresponding £ ' log W plots are given in fig.1.8
and the Cole - Cole plots in fig.1.9.

27 -
P\Cr i 'icx P-Lonr Fc*«?
Se M A\/'toF.,
-12 '\'= aiibs. lo S«c.

28 -
F\GT vib. e’*cj Pi-oT ro«. Coc.c-Coc£
"Yi> s ii.tbH.io s-«c. 0 £S'
29
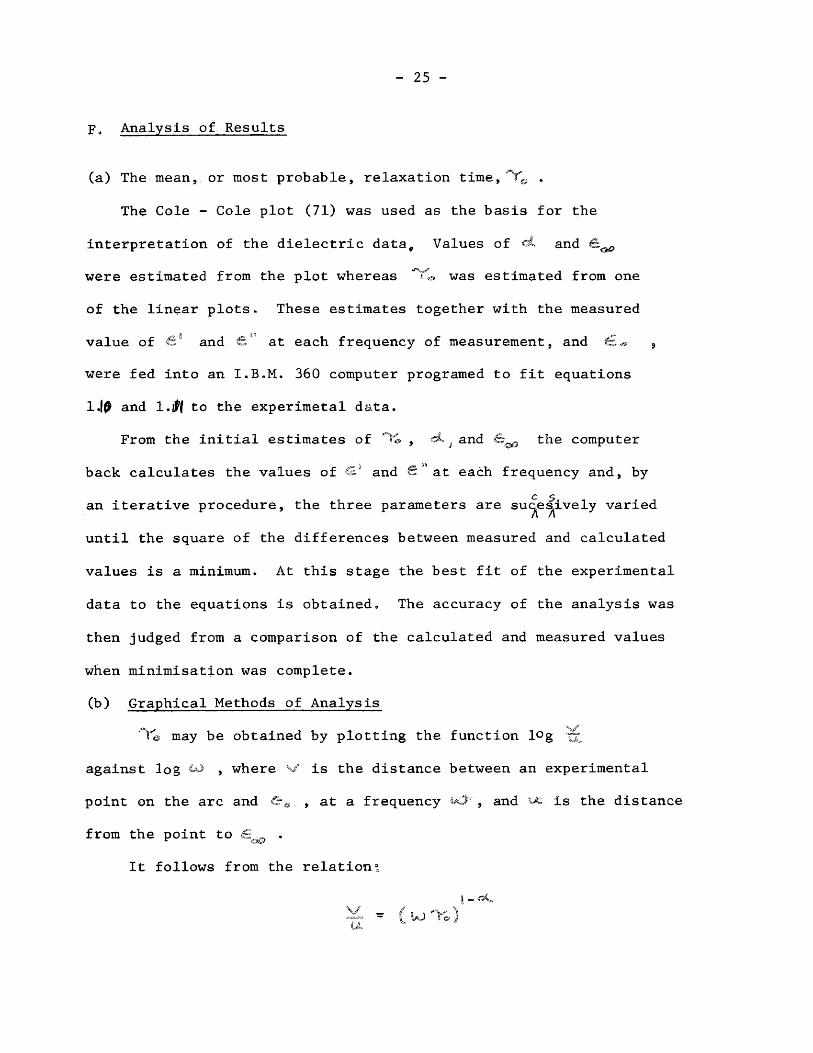
FlGr -“VS-C'*tO PLOT 3uOo
fee HAv/tofi.

30 -
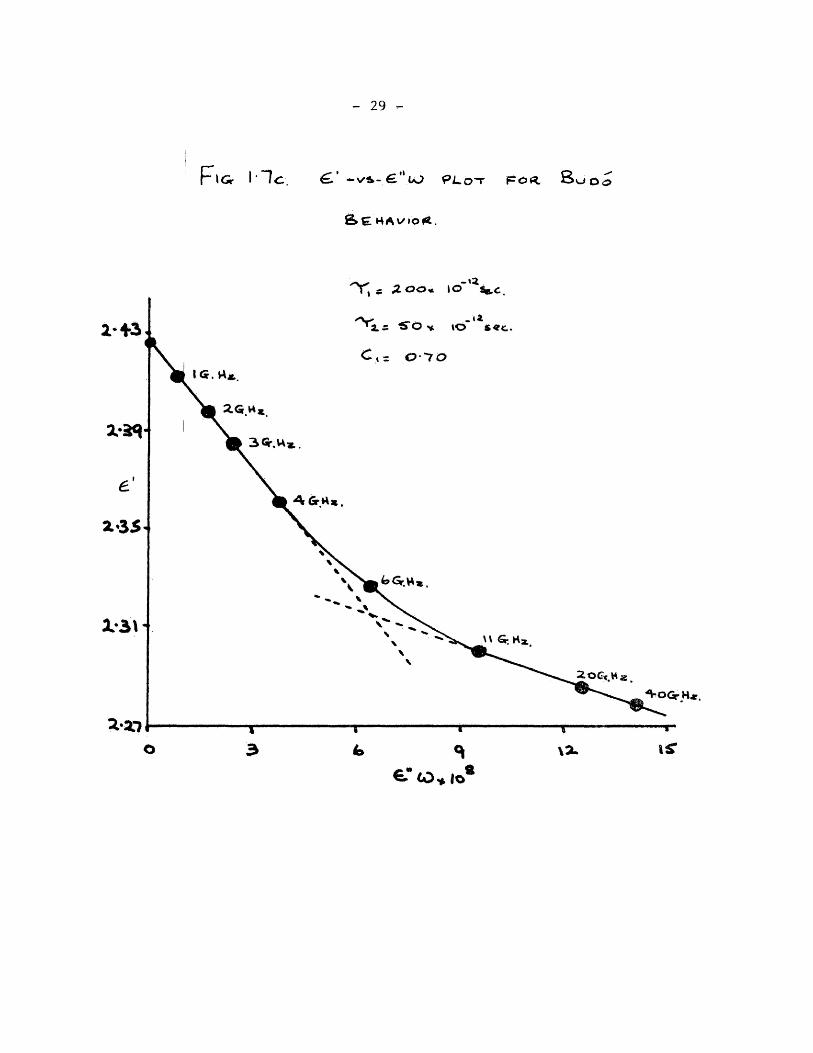
f”lGr ^LOTS
c - c OC.€
Desxe A H O
^ e HAVIofi
.(X OeB'^e O-ibH-to a*c.
coL.e.- c.oi_e 'y'tfC 1.H* «<ec. <^5 0>lS

31 -
F\&. \ PLOT 6006 S^HAV/OR
_.»2, -|3t.
aoos.10 srDs.io ^ c, =r o “70
32
FlCr I ^GL COLG-COC6 Deft'fe S€H<>.Vlo<?.
_ I*.
2.Ue>> lo
0'«S<
e"
ll|*o5-
F»<G- I'Qb C Oi.e -Coue C^CHAV/OR
-la. .
3.u>><. «c? »«c.<^-=o i5
33 -
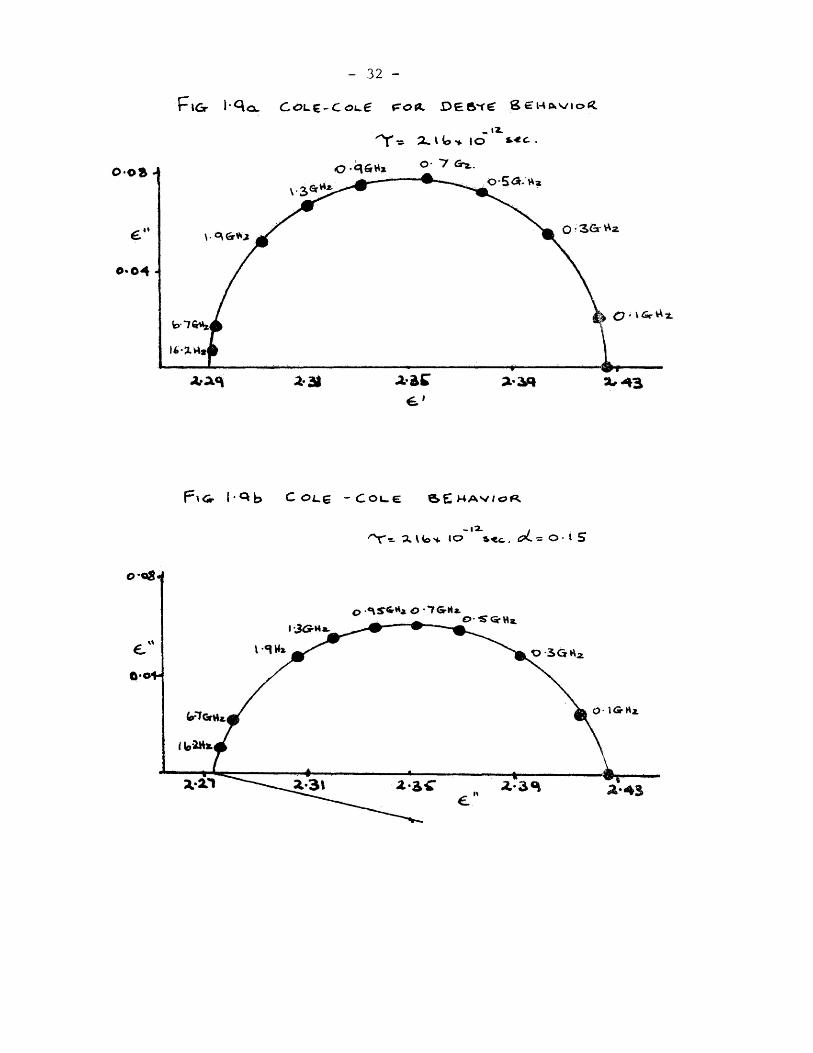
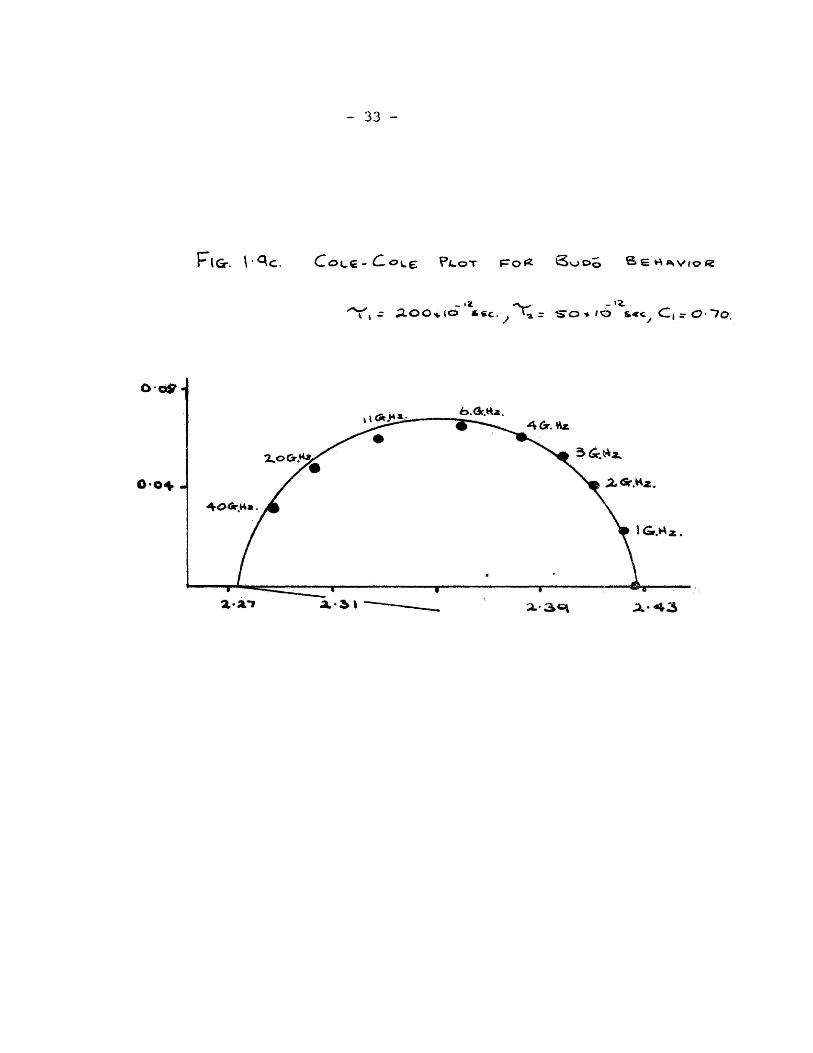
FIG-. \’^C. CoLC-Coug ?/L0T <Soo3 Sertl>*V»0«
c iLOOH.iO *«C.^ S’o**^ s«c^ Cj =• O-*70
34 -
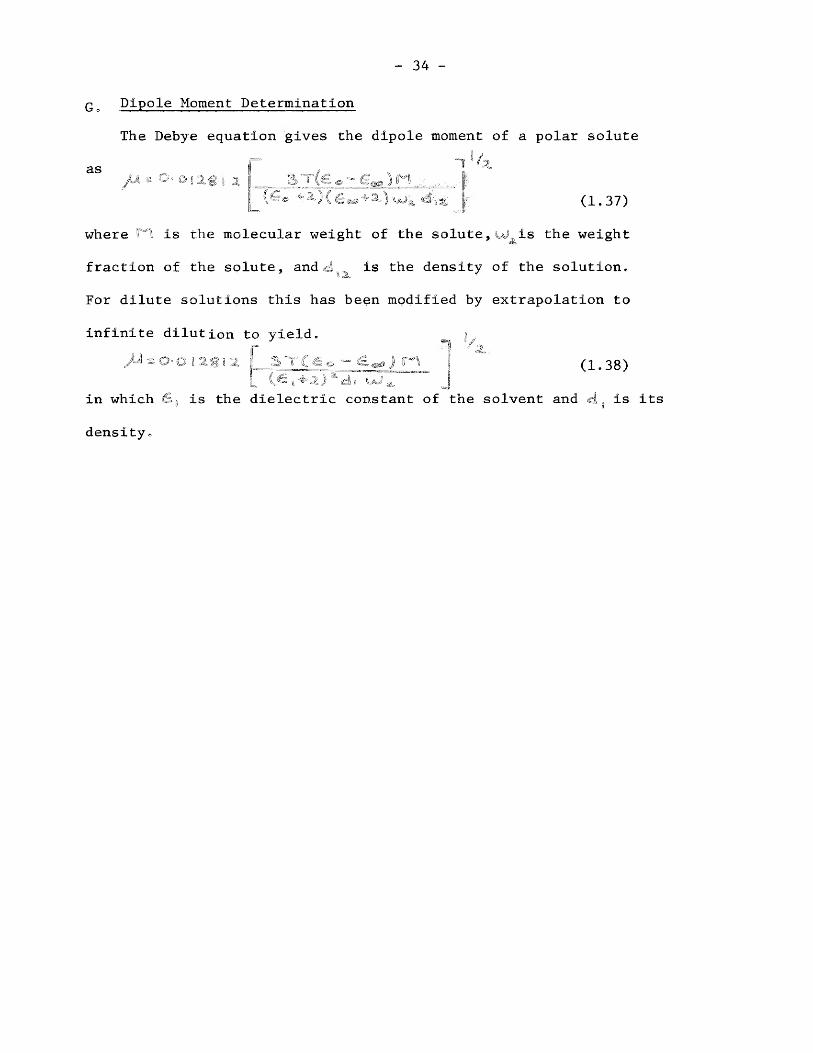
Go Dipole Moment Determination
The Debye equation gives the dipole moment of a polar solute
as
le®j: (1.37)
where is the molecular weight of the solute, u/^is the weight
fraction of the solute, andd^^ is the density of the solution.
For dilute solutions this has been modified by extrapolation to
infinite dilution to yield. ^
STf a® - a..
(1,38) <S ;
in which
density.
is the dielectric constant of the solvent and is its
35
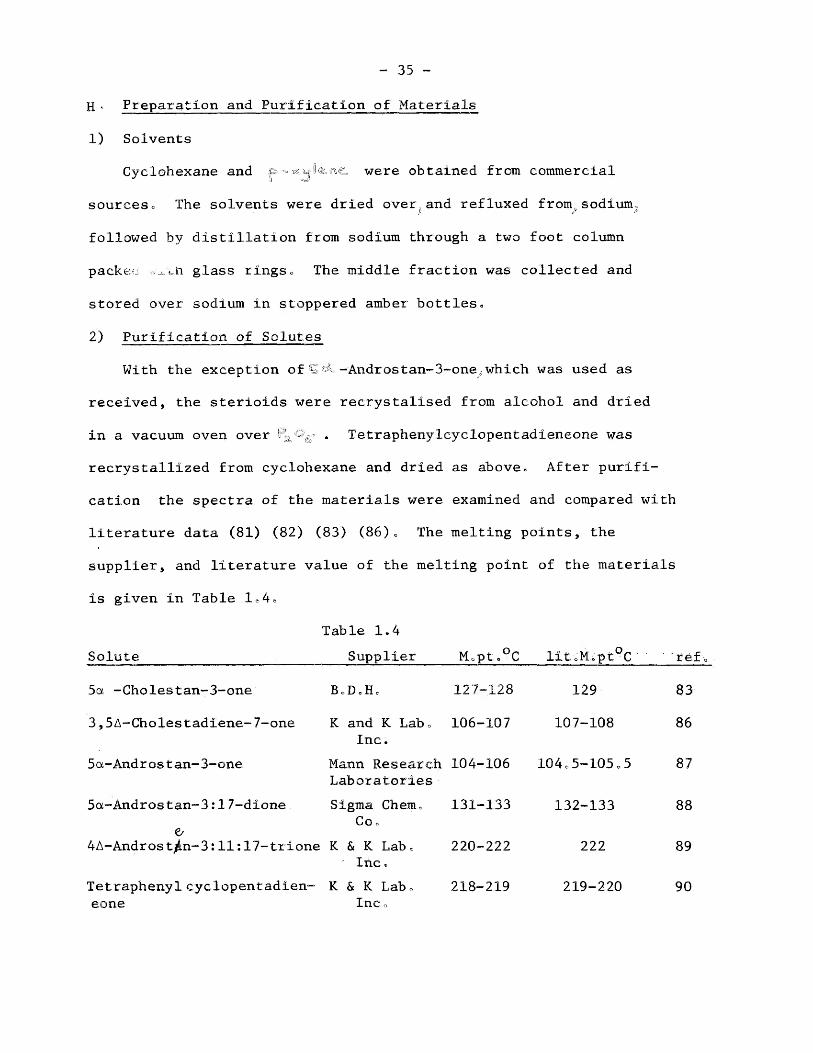
H’ Preparation and Purification of Materials
1) Solvents
Cyclohexane and were obtained from commercial
sources6 The solvents were dried overhand refluxed from^sodium^
followed by distillation from sodium through a two foot column
packeu glass rings o The middle fraction was collected and
stored over sodium in stoppered amber bottles.
2) Purification of Solutes
With the exception of S -Androstan-3-one,; which was used as
received, the sterioids were recrystalised from alcohol and dried
in a vacuum oven over . Tetraphenylcyclopentadieneone was
recrystallized from cyclohexane and dried as above. After purifi-
cation the spectra of the materials were examined and compared with
literature data (81) (82) (83) (86). The melting points, the
supplier, and literature value of the melting point of the materials
is given in Table 1.4.
Solute
Table 1.4
Supplier Mopto^C llt.M^pt^C ■ ■ ref,
5a -Gholestan-3-one B.D.H, 127-128
3,5A-Cholestadiene-7-one K and K Lab. 106-107 Inc.
5a-Androstan-3-one Mann Research 104-^ 106 Laboratories
5a-Androstan-3:17-dione Sigma Chem. 131-133 Co o
4A-Androst^n-3:ll;17-trione K & K Lab. 220-222 ' Ihc.
Tetraphenyl cyclopentadien- K & K Lab. 218-219 eone Inc.
129 83
107-108 86
104.5-105.5 87
132-133 88
222 89
219-220 90
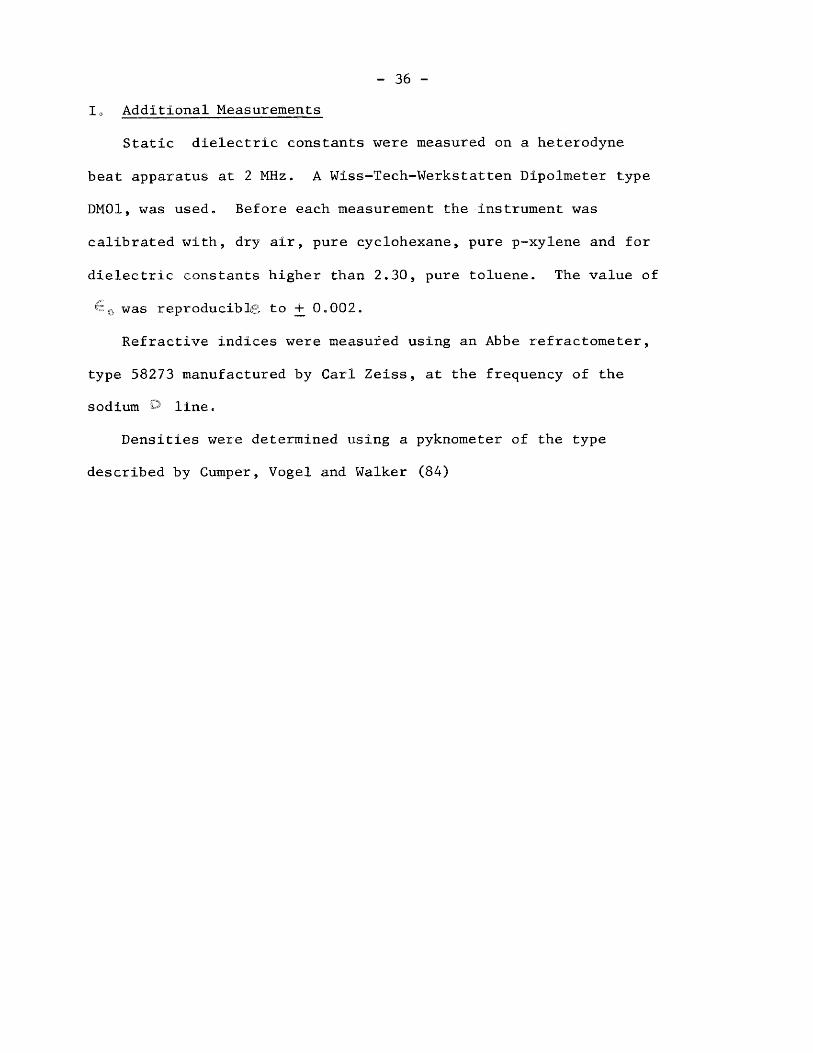
36
lo Additional Measurements
Static dielectric constants were measured on a heterodyne
beat apparatus at 2 MHz. A Wiss-Tech-Werkstatten Dipolmeter type
DM01, was used. Before each measurement the instrument was
calibrated with, dry air, pure cyclohexane, pure p-xylene and for
dielectric constants higher than 2.30, pure toluene. The value of
was reproducible, to + 0.002.
Refractive indices were measured using an Abbe refractometer,
type 58273 manufactured by Carl Zeiss, at the frequency of the
sodium D line.
Densities were determined using a pyknometer of the type
described by Cumper, Vogel and Walker (84)

J <r Experimental Results
- 37 -
(a) Corrections
The solvents used in this study have been found to have
small absorption in the microwave region (85)^(96)« Hence,
measured dielectric parameters have been corrected using the
equations ^ ^ e" “ e So
® (g«5 ! @ tt V <8. m !
a
the
J
Corrections of this nature were only found to be necessary for K
and Q band points«
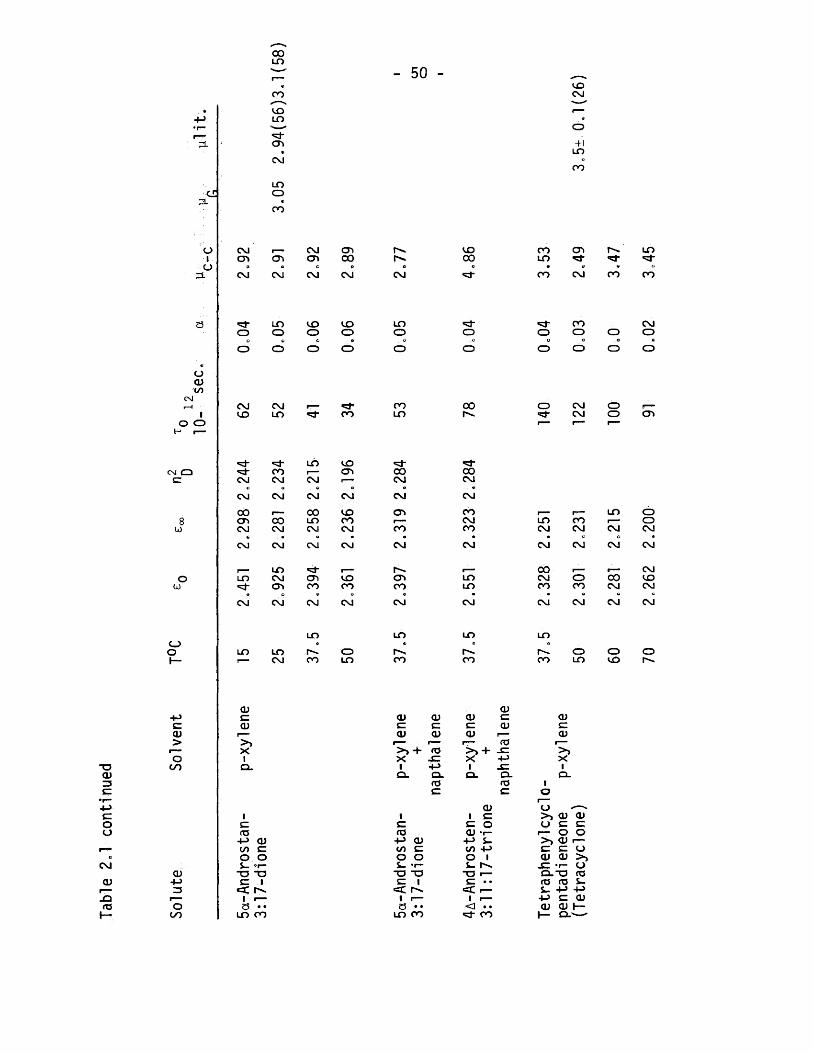
(b) Presentation of Results
The static dielectric constant, high frequency dielectric
constant, square of the refractive index, dipole moment, distri-
bution coefficient, and mean relaxation time are listed for each
compound measured in table 2,1 of chapter 2,
Measured and calculated dielectric constant and loss dat% and
parameters for determination of dipole moment by the Guggenheim
methodc^are listed in an appendix at the end of the thesis.
Although the data obtained could not be analysed into contri-
butions from two or more relaxation times the presence of more than
one absorption mechanism, corresponding to different molecular
reorientationspis inferred by comparing relaxation times of molecules
of similar size and shape.
The data listed in table 1.5 used to illustrate this point.
The datajw^ compiled by calculating and C’“at a number of
frequencfl^using the Budo equations for various ^and values
it was then fed into the Cole - Cole program to obtain the mean
relaxation time and the distribution coefficient. It is seen that
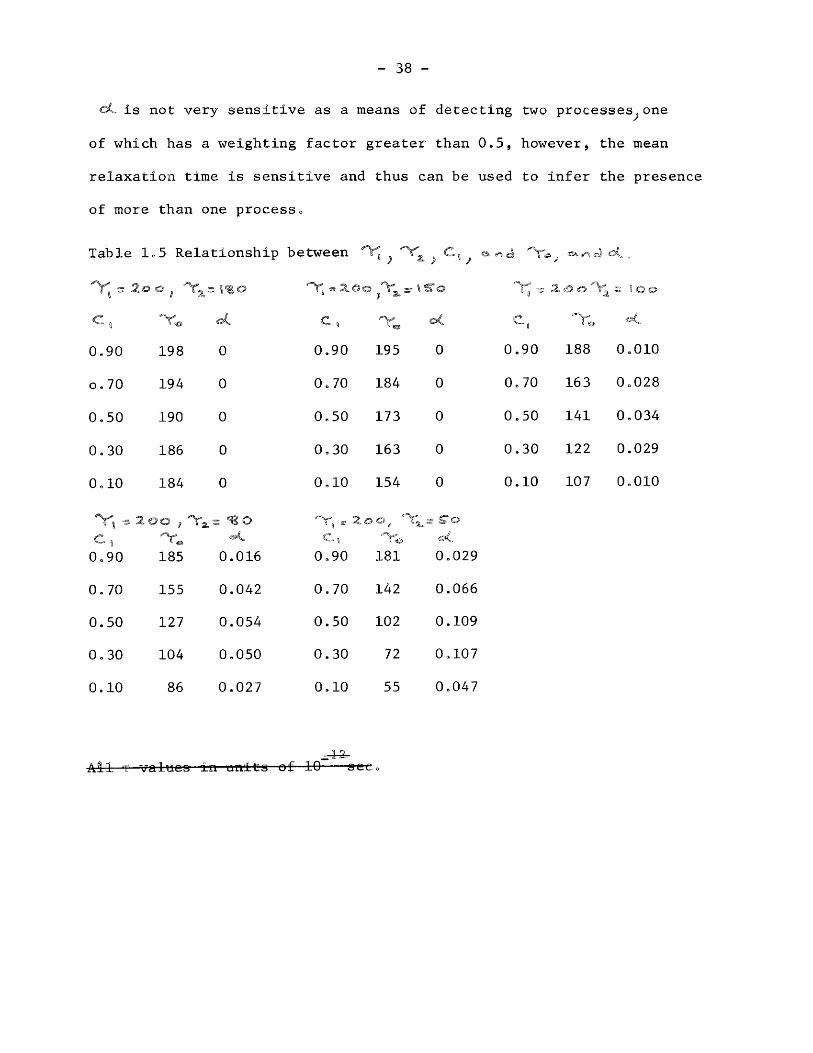
38 -
oC is not very sensitive as a means of detecting two processes^ one
of which has a weighting factor greater than 0.5, howeverj the mean
relaxation time is sensitive and thus can be used to infer the presence
of more than one processo
Table 1.5 Relationship
0,90 198 0
0,70 194 0
0,50 190 0
0.30 186 0
0,10 184 0
0,90 185 0.016
0.70 155 0.042
0.50 127 0.054
0.30 104 0,050
0.10 86 0,027
Ail T values-in unitg-
0.90 195 0
0,70 184 0
0.50 173 0
0,30 163 0
0,10 154 0
s S“0
0,90 181 0.029
0.70 142 0.066
0.50 102 0.109
0.30 72 0,107
0.10 55 0.047
■iG s-ee.
(A ^ ^ Oil sA d ,
»©o
C,
0.90 188 0,010
0.70 163 0,028
0.50 141 0,034
0,30 122 0.029
0.10 107 0,010

CHAPTER TWO
THE DEBYE MODEL AND ITS
MODIFICATIONS

39
Introduction
Many attempts have been made to determine the parameters which
govern the magnitude of the dielectric relaxation times of rigid polar
moleculeSo Among the effects investigated are the viscosity of the
medium, the size and shape of the polar molecule, and the direction of
the dipole within the molecule»
A series of molecules which had a wide range of sizes was ex-
amined by Meakins using two or three solventsc This author compared the
experimental relaxation times with those calculated from the equation:
T “ ■3vn FT
where v is the volume of the molecule,
n is the viscosity of the solution of the polar molecules,
k is the Boltzmanj^ constant,
T is the absolute temperatureo
The result of this study prompted Meakins to conclude "where the molecular
volume of the solute is about three times that of the sotvent^ the cal-
culated relaxation times are in reasonable agreement with the measured
values." One of the molecules for which Meakins found this agreement was if ^
the steroid A-cholest^n-3-onec Such molecules which have a double bond
at the 4-5 position, or steroids of the 5cx series which have four trans^fused
rings, have structures which are conformationally locked. As well as being
rigid, the molecules are roughly ellipsoidal in shape. It then becomes

- 40 -
possible to take members of a particular steroid series and alter the
position of the dipole with respect to the principal axes of the molecular
ellipsoide By choosing molecules with a rigid dipole, in this case the
carbonyl group, no intramolecular processes are possible, hence, the
measured relaxation times correspond to molecular motions.
In other systems of smaller molecules, alteration of the dipole
position usually affects the overall shape of the molecules and in doing
so varies two parameters. In the steroids, however, little change in
shape occurs on alteration of the position of the dipole within the molecule
Two basic steroid structures of differing ellipiicity were examined
in order that the effect of changing the axial ratios could be investigated,
and for domparison the relaxation time of the disc-like ketone, tetraphenyl-
cyclopentadieneone has been measured.
Discussion
Debye (41) proposed a model for the dielectric relaxation of rigid
spherical polar molecules in which ft was assumed that the molecule was of
radius^a, and moved in a continuous -^uid of viscosity^n- The fl^id was
considered to adhere to the surface of the sphere and the frictional coef-
f1c1ent,c, which it experienced during its rotation, was assumed to be
given by Stokes' law as: 3
C - 8Hr)a
The motion of the molecule was considered to be the rotational

- 41 -
analogue of Brownian translation motion, since changes in direction
of the molecule and fluctuations of its kinetic energy are frequent due to
collisions with the surrounding molecules of the liquid. In the presence
of an electric field the angular distribution of the dipoles is altered
very slightly such that there tends to be a small excess in the field
direction^and this is the origin of the dielectric polarisation. If the
induced moment in the field direction is then the rate of change of
with time is given by:
—L = ± 2 ^ FN at T ■" 3 c
where F is the field strength,
y is the moment of the dipole,
T is the relaxation time,
N is the number of dipolar molecules.
The above equation is valid if the following conditions are satisfied:
(i) there is no interaction between the dipoles,
(ii) in the short time interval, 6t, the angle which the
dipole makes with the field is altered only slightly.
This then leads to an exponential approach to an equilibrium distribution
of orientation of the dipoles, and hence to the Debye dispersion equation.
The relationship between the viscosity for solute rotation, the radius of
the sphere* and the relaxation time is given from this approach by the
- 42 -
equation: 3
4riTia s»ee»»«^»»»»eauiieoo9*ee(2el)
TT’
Frequent reference will be made to equation (2al) during this
chapter, so for the sake of clarity it will be referred to as the Debye-
Stokes' equatiorio
Over the years equation (2.1) has been the subject of many in-
vestigations on dielectric behaviour, and although it is only applicable
to molecules of spherical shape, it is often used to interpret the be-
haviour of molecules of lower symmetry.
One of the early investigations of the equation was made by
Curtis, McGeer, Rathmann^and Smyth (42). Although few spherical molecules
exist, these authors considered methyl chloroform and tertiary butyl
chloride to be of approximate spherical shape. They measured the dielectric
relaxation times of tfiese molecules in n-heptane, carbon tetrachloride and
nujol solutions and in all cases it was found that the measured relaxation
times were smaller than those P^^edicted by the Debye-Stokes' equation. In
fact, they found little parallelism between T and the viscosity of the
medium. For example, they found that the relaxation time of t-butyl chlo-
ride in nujol was only 2/3 greater than in heptane, although the viscosity
of the former is ^260 times that of the latter. Furthermore, the re-
laxation time for t--butyl chloride in the pure liquid state was found to
be greater than for the nujol solution, but its viscosity was only 1/200th
- 43 -
of that of the oi1c
Derivatives of benzene deviate somewhat from the ideal spherf
cal shape but equation (2.1) has been applied to them (43)c Pyridine
and fluorobenzene in the pure liquid state have nearly the same re- -f
laxation times, yet the measured viscosity of pyridine is 47% larger
than that of fluorobenzeneo Clearly^^the use of the measured vis-
cosity in equation (2.I) does not give satisfactory agreement between
measured and calculated values of relaxation time.
Because of the lack of dependence of relaxation time on
measured viscosity, the concept of inner friction or microscopic vis-
cosity was postulated (44). This quantity was calculated by using
the measured relaxation time and known molecular dimensions in equa-
tion (2.1), which was solved for n» The inner friction is a somewhat
vague parameter and it shows little parallelism with the macroscopic
viscosity (44). Indeed, the apparent microscopic viscosity of
pseudo-spherical molecules in the solid state may be less than that
for the pure liquid.
Fischer (45) found that the inner friction coefficient for
benzene solutions was of the order of one quarter of the solvent
vi'scosityo However, on changing the solvent, the apparent agreement
between theory and experiment was lost,in a comprehensive review of
dielectric relaxation, IIlinger (46) concluded that only in the
limiting condition that the solvent medium surrounding an absorbing

- 44 -
polar molecule represents a uniform fluid Is It possible to define
a viscosity coefficient which Is a property of the medium aloneo
H111 (47) attempted to account for the frictional coe-
fficient by a different approach. Based on the Andrade (48) model
of the liquid state* she assumed that the torque produced in the
loss of angular momentum* resulting from the collision of solute and
solvent molecules* was equal and opposite to the torque applied by
the field. The H111 equation includes a factor Involving the mo-
ment of inertia of the molecules and a mutual viscosity parameter
accounting for the Interaction between the solvent and solute mole-
culeSo
Meakins (49) compared the calculated relaxation times ob-
tained by the Hill and Debye-Stokeg'equations and concluded that
for small solute molecules* the former equation gave results closer
to those experimentally determinedc The agreement, however, with
the H111 equation becomes poorer with deviation from approximate
equality of size of solute and solvent (44)(50), In fact, Meakins
found that* as the solute size increased* the system tended towards
ttie hydrodynamic behaviour assumed as the basis for the Debye model.
The Investigation of the effect of the molecular dimensions
on the relaxation time of polar molecules has been more successful

- 45 -
than the viscosity approaches. It is observed that for molecules
of similar shape, which have the molecular dipole along the same
principal symmetry axis, that there is a regular increase of re-
laxation time with molecular size, Hassell (51) has observed such
a linear dependence of relaxation time on molecular volume for p-
xylene solutions of the halobenzenes, A more extensive investigation
was made by Eichhoff and Huffnagel(20), These workers found, for
a nUmfcer of solutes in a given solvent, a linear relationship^when
log T was plotted against an effective radius. The latter para-
meter was taken as the distance from the centre of mass to the
perifery of the molecule.
To account for deviations from spherical symmetry, Perrin(52)
modified the Debye-Stokes' equation for the general case of ellip-
soidal molecules. For a rigid molecule having a resultant moment y,
composed of components ya^ yZ?^and yc?, along each of the three prin-
cipal axes of inertia, there are three correst>6nding relaxation times
On the basis of the Perrin theory, the average moment Mp in
the field direction is given by :
iwtf FT, = Fe K|
F 3irr \\a + \ih +
G- l+iMhra l+ijtfxl? 1+itft^?
Where ya, y^ and yc3 are the moment components along the three
principal axes A,B, and G and xa ,xl?^and TG are the corresponding
- 46 -
relaxation timeso In terms of the frictional coefficients,', the
relaxation times are given by:
la ” tho 2kT
tb “ ^ae 2kT
TO - ^ab
2kT
Where 2-1+1
‘^ba
anologous expressions describe c . and c „ It Is thus seen that ab ae
the relaxation time for-rotation about a particular axis-depends on
the frictional coefficients associated with the other two axeso
When the molecular moment 1s directed along one of the principal
axes of the molecule, then the theory predicts a single relaxation
time, since two of the moment components are zero.
Fischer (45) expressed the Perrin theory 1n the form:
TZ - 4nfs nabc W
Where s - a, b, a and fs 1s a factor which gives the ratio of the
relaxation time about an ellipsoid axis to that of a sphere of
equal volume^ a,b^and c are the lengths of the semi-axes of the
molecular elllpsoldo The form factor f has been tabulated In
- 47 -
terms of the axial ratios ^ and £ by BudoT Fischer and Miyamoto (53)c ' a a ^
The mean relaxation time is then obtained from the Budo^(54) re-
lationship: T \ yi
Where yi is a moment component in the direction of a symmetry
axis and T'£ is its corresponding relaxation timOo
Although the Perrin theory predicts a single relaxation time
when the molecular dipole is parallel to a principal symmetry axis
it apparently neglects the fact that there are two axes perpendicular
to the dipole around which rotation is possible, Pitt and Smyth (37)
have drawn attention to this point. These authors measured the
dielectric relaxation times of two porphyrazine derivatives, the
structural formulae of which are shown in Fig. 2 2, which are disc- Q
like molecules and have a radius of approximately lOA, One molecule,
heptaphenyl chlorophenylporphyrazine, VI, has its dipole in the
plane of the ring, the other, ferric octaphenyl porphyrazine chloride,
VII, has its dipole perpendicular to the ring plane. Rotation about
the two axes perpendicular to the moment in VII involves similar out-
of-plane molecular motions, however, in the other molecule one motion
is in the plane of the ring whereas the other Is out of the plane.
It was observed that the relaxation time of VII was more than twice
that of VI but the Fischer formula predicted that the relaxation
time for the two molecules should be similar.

- 48 -
The observed Hrge differences between the relaxation times
was explained in terms of the volumes swept out by the molecules
during their rotations= In the case of VII rotation involves a
large displacement of the solvent molecules^it thus suffers consid-
erable frictional resistance to its motiono For VI, however, ro-
tation in the disc plane involves only a small displacement of
solvent molecules, it thus suffers less resistance to this motion
which results in a reduction of its mean relaxation timeo The same
authors also accounted for the behaviour of three, 3-ring, disc-
shaped molecules using the same argumento
The results of the measurements on the large ketones are
given in Table 2:1o Computer analysis of the data Into two or more
component relaxation times was not possible because of the sparcity
and distribution of the points on the Cole-Cole arCc For all the
systems measured e* against e"o3 plots were constructed and it was
found that generally two straight lines could be drawn through the
experimental pointSo One line passed through the coaxial cell
points, and C and X bsi nd bridge points when these could be measured;
the other was of somewhat uncertain slope and passed through the
high frequency bridge points of P, Q^and K bonds^ In this latter
region of the absorption of the molecules e varies little with
frequency, so that the error in this parameter is larger than the
change in its value observed when the frequency of measurement is

49
CD E o>
r— >> X I
CL
<v c 0
1 CO
ra 4-> CO O)
o o
c3i LO
<T> Lf)
o
CO
o
CO
o o
CO
CO
o
cr» cr»
CM
LO r~
o
o
CO
00
o
o o
CO
CO
o
CM LO CM
CO
CM 00
CO LO
•5i- CM
CM
o CO CM
CM
CM CM
CM
CT»
CM
00 CM
CM
CO
CM
CM
LO CO CM
CM
00 CO CM
CM
CM LO
CM
CM
CM
LO O
CM
CO
CM
LO LO CM CO
o LO
CTi o
"sd-
CM o
•sd-
<5d"
CD
CO o
CO CTi
CO
00 C3^
CO
LO CO
00 o
00 00
«!d-
o\ ■sd- CM
CM
CM
CM
CO r— CM
CM
CT>
CM
CO CT» CM
CM
CO "sd" CM
CM
LO LO CM
CM
CO CO CM
CM
*d" 00
CM
LO
CM
CM CM >!d"
CM
O <T» CO
CM
LO CM
LO
Cv. CO
O LO
<L) E CD
CL
I <u E (U
"r— X> ro
to (L) O)
I— E O O ^ I o
<] LO
ft CO
CM CM (T> CT» CT> 00
CM CM CM
o o o
CD CD O
CT> 00 00 LO LO
CP
O
*?!■
00 CO '=d" ^ CO B-— CM CM CM n-
CM CM CM CM
00 00 LO LO CT» 00 LO LO CM CM CM CM
CM CM CM CM
CT> I—■ LO *— CT» «5l- ^ CO CO CO
CM CM CM CM
LO
LO LO o 8-— CM CO LO
cu E <u
X I O-
CO I E to
+-> to 0 O) E E
XJ O E
1 3
LO
2.90
Tab
le
2A
contin
ued
+-> •r~
3-
;a.
0 1 o
;3-
o <u tA
o o H »—
CM Q £T
8 U)
o U)
o o
c O) > "o
cu 4-> 3
O oo
OJ cn CVJ
o
<N1 KO
OJ
04
00 <T> OJ
OJ
LO
OJ
tn
O) £= CU
r-~ >) X
00 U!>
CO
V£>
CT>
CM
m o
CO
CT>
OJ
ID o
- 50 -
CM ID
■!dh CO CM
CM
00 OJ
CM
LO CM cy»
CM
ID CM
fO +J CU (/) c o o S- »r- -o -O C I
<C
a LD CO
CM
CM
LD O
00
CM
LD O
LO
OJ
CM
00 ID CM
OJ
CT> CO
OJ
ID
CO
CO
LO CTi
CM
LO CO CM
CM
LO CO
CM
O LO
r^.
CM
ID o
CO ID
'sd' 00 CM
CM
CT> r-~ CO
CM
<T> CO
CM
LO
CO
(U c <U
^ X ^ I 4-> Q. C3L
fO C
I sz ro 4-S cu (/) c 0 O S» ‘r—
XJ TD C I
<C 1 r— a ••
LO CO
<u c cu
LO 00
o
00
00 OJ
CM
CO CM CO
CM
LO LO
CM
LO
CO
cu 0) c c cu cu r- r~ >i+ -c: X 4J I x:
OL CX. ITJ c
I cu £=
c o cu -r- +j s- co +-> 0 I s-
X3 •— E ••
<C f— 1 I—
<3 .* •!d- CO
CO LO
CO
o
o
LO CM
CM
00 CM CO
CM
CO
LO CM
+1 LO
CO
CT>
CM
CO o
CM CM
CO CM
CM
O CO
CM
O ID
(U E CU
X
I o
>o cu cu U E E
r— O O CU I—
E E U CU CU >) x: T- cj Q.-0 CO CO to S- E 4->
+-> E CU CU CU K—
I— Q.>—
CO
o
o
o o
ID
CM
CM
C30 CM
CM
O LO
O 2.
262
2.20
0 91
0.02
3.45

- 51
changed. Furthermore, since e" is small and changes only slightly
with a large change of frequency, an apparent slope is to be ex-
pected in this region. The value of the relaxation time obtained _12
from the slope is of the order of 15 to 20X10 sec. end for a rigid
molecule this would correspond to a reorienting unit of about the
size of p-bromotoluene, Since no intramolecular process is possible
in these molecules, because of their rigidity, the second apparent
relaxation time was considered to have no physical meaning.
As an example to illustrate the type of plots obtained from the data
the Cole-Cole diagram, an e' against and an e" log oo plot shou>n 4
in Fig. 2:1 for A-Androsten-3:11:17-trione in a naphthalene p-
xylene solvent mixture at 37,5°C.
A valuable check on the analysis of the data is to compare
the dipole moment calculated from the difference, obtained
from the Cole-Cole program, with that obtained by another method.
Agreement between the two metteds helps to verify the extrapolated
value of and gives support to the analysis of the Cole-Cole
parameters.
Dipole moments have been evaluated by the Guggenheim method (55)
for three of the compounds studied. For the remainder either in-
sufficient material or 1ow solubi1ity prevented determination of
the dipole moment, hence the microwave values have been compared
with literature data when available. In addition^the refractive
index, n^, has been measured at the frequency of the sodium D line.

52
P>a. COL6-COi-€ FLOT Fot^ - AHORoS-TCrs ■'‘S' U : O - "T « lOfNE
F.&, a-lb. ^'’vO Puonr F*©* A »^»«os*re»*4-B : lu i“r- “r^to-ME.

-53-
^ u) PLOT PO « A A-t«i£MKoS “re *• i U l*~7-*T fi i OKC
iO

- 54 -
2 The position of n .in relation to e .on the axis of reals
of the Argand diagram^provides additional suppol^t for the
valueo An agrement of +0,10 between the Guggenheim moment and
that determined from the Cole-Cole plot was considered to be
satisfactory.
Fig, 2:2 shows the position of the molecular dipole in the
ellipsoidal steroid mol ecu!es, the corresponding axes about which
rotation is possible, and the structural formulae of the molecules
The molecular axes are designated A, and C and have
lengths which decrease in the order A>B>C;the semi-axes of the el-
lipsoid are designated a, b,and c. The molecular dipoles lie in
the A^B plane and the component moments parallel to these axes are
designated and respectively, the relaxation times corres-
ponding to these moment components are termed and x. respectively, a b
5a-Cholestan-3-one, I, has been found to have a relaxation _12
time of 216 x 10 sec„ at 25®C in p-xylene, this compares satis- 12,
factorily with the value of 233 x TO’ sec. obtained by Meakins (49) 4
for the similar molecule ACholesten-3-one in benzene at 20'^C, The
dipole moment obtained for the molecule from the Cole-Cole arc
and by the Guggenheim method is in satisfactory agreement with the
literature value. As the dipole moment in the molecule is parallel
to the long axis. A, it should have a single relaxation time on

- 55 -
F\{k ^ .2<x op o^poiLe o\Rc-c-r ioi»4
Co«f^ g'-fePOMO A>LpS OP KO-TAttOH
B
B
ATAJD

56
Fic^ XXh, ST«.uc-rop.i«\z» oF moL.ecv/ues OiSCL/SSeo
331:

57 -
Car 2. .2. b, dOTsiT »r+ue o
C,M£
.C=r N Ni-^ C.
tvi
N-
N M ^ «>TA^HCNrovv LofiO PoRF»HY(?>t^lN€
C c c c
U > V Kl '-w-V )
<^c.wjr
r //^\
5 9 n Fe«.R\C OCTAPHEMYLPORPHYK^Z.'*^
I I C* I II ^ c~ w. 1 ^N :sziL
N N C HLORIOE
CM
C — N
I I c c
N
C ' » C C Mr- b *
C «> 6 C H*- u S
“TET*? APHENVLC'YCCOPE r^-TAOiCNE Oise VptIL
(^T c “T PC YC L. o M

- 58 -
the basis of the Perrin theory, however, a large distribution
coefficient has been observedc The e"iogw piot given by Meakins
for his analogous molecule is of non^-Debye form^which also in-
dicates a distribution of relaxation timesc As there are two
axes, B»and C, perpendicular to the direction of the resultant
moment, it would seem in principle that there are two axes about
which this molecule can rotate. Examination of Tat)lei,S in
Chapter 1 shows that a large a is pnly observed whe^ the two
component relaxation times differ considerably and have equal
weight in contributing to the dielectric absorpticno In this
case, however, rotation about either, or both, jof- the axes
and C would involve similar motions. The molecule displaces a
large amount of solvent during the course of these rotations and
suffers considerable frictional resistance. Hence, a large dif-
ference between the two possible relaxation times would not be ex-
pected and cannot account, for the large a.
A second possibility is that the flexible side chain is con-
tributing to the absorption. However^ the weight factor for this
absorption would be very small since the dipole moment of the side
chain would not be expected to exceed Q„4D and as: 2
pi 2
C ” T7T = QT4 0,02 any separate absorption by the u ‘z ~ ' ,
side chain would not be detectable. The large ketone, lupenone.

59
measured by Meakins 1s the same shape as 5a-Cholestan-3-one and
slightly longer, but instead of having a side chain it has an
additional six membered ring^ The molecule has its dipole along
the A axis of the ellipsoid and the molecular absorption is
characterised by a Debye-type e" against logo) curveo Further-
more, 5a-Androstan-3-one, III, measured in this study has a
similarly located dipole and no side chain and shows no distri-
bution of relaxation timeso It would thus appear that the dis-
tribution observed in the case of 5a-Cholestan-3-one, I, is in
some way associated with the flexible side chain, but the precise,
cause is not completely understood»
Hill (61) considered that a distribution of relaxation times is
to be expected for molecules which show deviations from spherical /
symmetry. She found that when the moments of ini^ertia of the (
molecule differ widely about different axes the distribution is
broadened. As the side chain in the Cholestanes is flexible, it
would seem possible that alteration of the conformation of this
unit could give rise to a variation of the moment of inertia
about the axes of rotation and contribute to the distribution of
relaxation times. The moments of inertia about the axes B and C
would show greater variation with side chain conformation than
would the moment about the axis A,and since these are the axes

- 60 -
which are perpendicular to the molecular dipole moment, the
effect would be expected to be greater than 1f the molecule ro-
tated about the axis Ac 3 5 »
For A-Chlpestadiene-7-one,II, there 1s a large componeht
of the molecular moment which gives rise to rotation aboyt the A
ax1So Hence, this molecule can rotate about all three of the per-
pendicular axes, yet^lt has a smaller distribution coefficient than
5a-Cho1estan-3-one,I, because its major component relaxation time
involves rotation ^bout the A axis and the moment of intertia about
this axis 1s the 1 past affected by changes in the conformation of
the side chaino These Initial effects can be used, tentatively, to
explain the distribution parameters observed for the two cholestane
derivatives. The other molecules measured which have the dipole
Inclined to a principal symmetry axis have small distributions of
the order of what might be expected for rotation about two or more
of the molecular axes.
The agreement between the microwave and Guggenheim moments 3,5 '5,
for A-Cholestad1ene-7-one,II, is satisfactory and supports the
computer assigned value. The precise angle which the dipole In
this molecule makes with the long axis is difficult to determine^
si pee the increase in the dipole moment, of ID, relative to satura-
ted mpnoketo steroids, indicates a flow of charge along the double

- 61 -
bonds conjugated to the carbonyl groupb However, there is no doubt
that there is an appreciable component of the molecular moment per-
pendicular to the long axis.
If it is assumed that the fesuTtant moment is in the direction
of the C=0 bond, therf this is inclined at an angle of ajDproximately
65° to the long axis. One of the two possible motions ^liich can be as-
sociated with the moment component parallel to the B axis is ro-
tation around the long axis of the molecule. This causes little
disturbance of the surrounding solvent molecules and the frictional
resistance offered to the rotation is small. Hence^a reduction in
the relaxation time would be expected, and is observed, for this
molecule in comparison to 5a-Ch6Testan-3-oneo
Similar effects are seen in the Androstane derivatives. The
molecule with the keto group in the 3 position has the highest re-
laxation time since it executes similar motions to 5a-Cholestan-3-
one,I. When the dipole is inclined to the A axis, rotation becomes
possible around this axis and is accompanied by a reduction of the
mean relaxation time.
Analogous behaviour has been observed for similar 41 pole u "
orientation effects in the biphenyls and anthraqjfjinones. For both
systems it is found that when the dipole is parallel to the long

- 62 -
axis of the molecule the relaxation time Is higher than
when the dipole Is Ihcltned to this axisThus, 2, 2 - d1- _12
chlorobiphenyl has a relaxation time of 38o5 X 10 (60) at
20®C 1n cyclohexane, whereas 4-bromobiphenyl has a value of _12
62 x 10 seCo under the same condltionSc Similarly, 2-
chloroanthraquinone has its dipole inclined to the long axis _12,
and has a relaxation time, in benzene at 23°C, of 40 x 10 _12
seCowhile 2,3 -dichloroanthraquinone has a value of 76 x 10
seCo For' both molecules which have the dipole parallel to the
long axis, some of the increase in their relaxation times, re-
lative to the molecule having the alternate dipole orientation,
must be attributed to the increased length of the molecule
caused by the position of the substituent.
When the steroid ring system is changed from the Choles-
tane series to the Androstanes the length of thp major axis pf o
the ellipsoid is reduced by 'v.bA, this is attended by a re-
duction of the size of the relaxation time of compounds having
analogous dipole orientations in the two series.
5a-Androstan-3-one, III, has the major component of the
molecular dipole parallel to the Tong axis and has a longer re-
laxation time than 5a-Androstan-3:17-dione ,IV. The molecular

- 63 -
dipole in this latter molecule 1s Inclined at approximately 60® 4
to the long axis, A-Androsten-3:ll:17-tr1one, V, was only soluble
in a naphthalene p-xylene solvent mixture, at a sufficient con-
centration for measurement^at a temperature of 37„5®Cc The dione
was measured under the same conditions in order that the relaxation
times of the two molecules might be compared. The trione 1s longer
1n both the A and B directions and vector diagrams Indicate that
the Inclination of the resultant moment to the long axis is approxi-
mately 50®0 Hence, in this compound the relaxation time corres-
poinding to the moment component along the A axis will have a higher
weighting than for the dione. Further, since the component relax-
ation times will be larger, because of the increased molecular
dimensions, the trione would be expected to have the larger relax-
ation time,
A number of equations which have been developed for the cal-
culation of relaxation times of rigid molecules will now be examined
to see how they predict the values for the molecules measured In
this study.
The first relation to be examined is that due to Debye,
When this equation is used to calculate the relaxation times of
molecules which are not spherical, it is usual to rewrite It in

- 64 -
the form:
T = 3vn kT
^/l^here V is the molecular volume^ thus the molecule is treated
as a sphere which has a volume equivalent to that of the non-spherical
molecule* In the literature there are two methods used to calculate
the molecular volume. One (51) assumes the molecule to be a regular
solid body, that is, it is spherical, ellipsoidal, or cylindrical^
etc., dimensions are then taken from molecular models and used in the
appropriate equation which describes the volume of the body. The
other approach is due to Edward (57) who calculated the van der
Waalt volumes of the elements in various valency states. The
molecular volume is then computed as a summation of the volume of
the atoms making up the molecule. Neither method can be considered
to be completely satisfactory. The first approach suffers from the
fact that few molecules have a perfectly regular shape and the
Edwards' method is limited in that it gives no difference in
volume for various possible conformations of a moTecuTe, or for
different isomeric forms.
Both methods have been used to calculate the molecule volume
in order that their effect on the calculated relaxation time can
be evaluated.
- 65 -
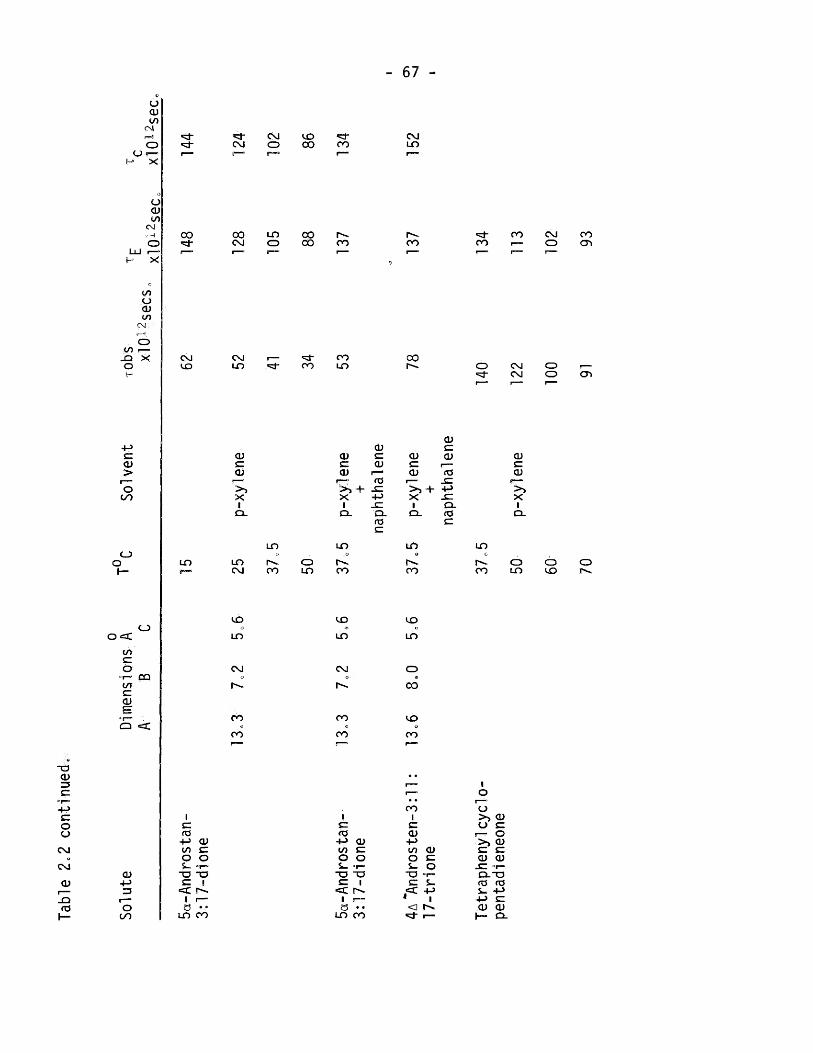
Table 2:2 gives the molecular dimensions of the compounds
studied and the relaxation times calculated using the Debye-
Stokes'equationc When the molecular volume has been calculated
by Edwards* method, the relaxation time is designated x^^and
when Courtauld model dimensions have been used the calculated T
is designated x^p In addition, the two large porphyrazine
molecules measured by Pitt and Smyth have been included^ Cal-
culation of the volume of tetfaphenylcyclopentadieneone from
Courtauld models was not considered to be possible for the
following reasons: the molecule is of a rather irregular shape,
there are large spaces between the phenyl groups, and the angle
between the cyclopentadienone ring and the phenyl groups is A
uncertain^ The viscosity used in these calculations was that of
the solvent given in Timmermans(62)o For the p-xylene naph-
thalene solvent, the viscosity was measured using ah Ubelohde 1
viscometer.
The only steroid which gives satisfactory agreement be-
tween measured and calculated relaxation times is 5a-Cholestan- 3,5
3-one, I, The molecule of A -Cholestadiene-7-one,II, has a
slightly larger molecular volume calculated from Courtauld
models, than by the additive method. However, the molecular

Tab
le
2o2
len
gth
s of
mol
ecu
lar
axes
A,
B an
d C
, ob
serv
ed
rela
xa
tio
n
tim
es
lObS
o an
d re
laxa
tton
- 66 -
fO
U <U
fO 4- > 5- . 3. o o
“b £= fO
to cu
o > to •o s- (tJ
■O
CO s=
°r- to
C a
“r—
ro 3 GT O)
d)
CU (p cu
o ^ +->
Co c: 01— XJ
o o u
-o cu fO
<T3 CJ
to CU
o cu to
CM <=3d
o
UJ
o (U to
CM
^ o O H X
+-> c: cu >
o 00
o o
o ca:
to c o
Op-
to fZ cu
CO
Q <c
cu •4-> =3 o
00
OsJ po” CM
00 CXD
O uo CM
CO
CM 00 LO CM
CM LO CM
to r—” CM
00 to LO
LO
<u
0-— >> X
LO CM
LO .0
LO
CM d
to CT%
LO
CO o LO
cu sz 0
1 00
I c: rtJ +J to CL)
"p JC u 3
LO
CO CO CM
O CM
LO CTl CO
LO O CM
r>. LO CM CM
LO CO
00 o LO
00
LO
<u c: <u
f—“ >0 X
LO CM
10
ir^ CO
to LO
CO
CT>
O LO
I CU C <u
•I— "O to
4-> to O)
p~~ 0
-C c_>
1 cu <1 sz lO O
« I CO
CM CT> CT» CO
to to CM
CO o
Cv, 00
<sd- co
LO LO lO
00 ^4!-
LO
CU c cu
X
LO CM
LO
CO
LO
LO
CM e
o CO
o LO
CU
CO I
.£= to
to o %-
8 LO
Ta
ble
2c2
co
nti
nu
ed
- 67 -
o <D to
CM
O U
M X
a cu to
CM
X
to o O) to
CM
to JI3 O H
X
c: <u >
o oo
o
o «=c
to c. o
to c CD
CL)
3
O 00
00
CQ
Q cX
CM to
LO
c CO
+-> to O s-
"O c
<C
3 •• LO CO
CD
X> I
CM
00 CM
CM lO
CD C 0)
r-“
S'
LO CM
to
LO
CM
1^
CO
CO
CM O
to 00
LO O
00 00
"d- co
LO
CO o LO
CO
CO
CO LO
CD CD C SZ CD CD IT-*
fO >i+ ^ X -M I -e
Q- Q- n3
LO
r'- CO
to
LO
CM
1"^
CO
CO
<o 4-i CD to c. a o ^ °r” -a TD c: I
<C
3 • •
LO CO
CM LO
CO «cl- co
CO CM o
CO cy>
00 I— o CM
CM O O <T>
CD c. CD
CD C CD
fO
>^+ 4J X “ I
Q.
LO
CO
to LO
o CO
to CO
CL fO c
LO
CO
CD c CD
f— >> X
o LO
o to
o
CO
c: CD
4-> (/? CD o c: s- o
XJ -r- c. s-
<1 I—
CJ >> CD o c
O >> CD sz sz CD CD
JC -t- 0.-0 fO rO
4-3 4r3 C CD CD H- Q-

Tab
le
2o2
con
tin
ued
. - 68 -
o 0> </>
CM
o O I
H X
u <D to
CM
X
a O) to
CM
o o to r-“
XI X o p
4-> sz <u >
o oo
o o
o«=a:
<o c a
"r~ to c O)
o
OQ
Q <C
CD +-> 3
O oo
C\J LO 00 ir- to 00 cr» to 'd-
cr> CM o
oo
CM O CO
o CM
LO CM
to
O
ch
o CM
I S-, o
JC o
CM CM
r“ CM
CT» LO
CD C CD N £ CD
OQ
O «?l*
O to
CD
CD I M (O
JZ r- ^ >> £ x:
“M CD ca. o.^ 0)10.0 0= o a.
CD
to CM «51-
tO o
CM CM CM in
CO
00 CM CM
O O LO
to CO
CD £ CD N £ CD
CQ
O O CM
LO
r«*.
CD
CD
£ CD sz . CL CD ftJ £ 4^ =1— O N O rb d)
S- “O CD >>»r-
»r- X: s- S- Q. O S- i. r— CD 0> x:
UL. a. o
o to

- 69 -
volume is greater than three times the solvent volume, yet the
relaxation time is not predicted by the Debye-Stokes* equationc
On the basis of the Meakins* criteron, this is an unexpected
result; It would, therefore, appear that the effect of dipole
orientation within a molecule must be taken into account, before
any statement can be made about the applicability of the simple
Debye-Stokes* equationc The dipole must be positioned in a
molecule so that the molecular rotation involves considerable
displacement of the surrounding solvent moleculesc
Although the simple Debye-Stokes' equation predicts, fairly
well, the observed relaxation time of 5a-Cholestan-3-one, it
gives too large a value for 5a-Androstan-3-one, III, the ratio^~|^
being A.K7:1c This latter molecule has its dipole oriented so that its
rotation will displace surrounding solvent molecules^ but the solute
solvent volume ratio is only 2*4:1 for the p-xylen^ solutiono
Because of the similar molecular volume of the three an-
drostanes, the Debye equation predicts that they will have
similar molecular relaxation times; again it is not able to pre-
dict the effect of the angle of inclination of the dipole in the
molecule* It is interesting to note, however, that the increase
in relaxation time of 5a-Androstan*^3:17-dione,IV, observed on
changing the solvent from p-xylene to the naphthalene p-xylene

70 -
mixture 1s proportional to the viscosity Increasec
It 1s seen that for the steroids the two methods used to
calculate the molecular volume are 1n reasonable agreemento In
fact, the volumes calculated from the Courtauld models seem more
sensitive to changes in the molecular shape than do the Edward's
volumes o
The relaxation time of tetracyclone 1s 1n good agreement
with the calculated valueso Nelson and Smyth (63) have previously
measured this molecule In four other solvents, at a single tern-
pterature, and obtained close correspondence between calculated and
measured values when the solute-solvent ratio was greater than 3:1c
The small distribution coefficient observed for this molecule 1s
zero within the limits of experimental measurementc Again, this
Is 1n accord with the data of Nelson and Smytho
The porphyrazine molecules have a solute solvent^ratio of
the order of 11:1 and would be expected to satisfy the Meaklns'^
relative volume criterionc However, on comparison of the
values. It 1s seen that neither compound shows very good agreement
between calculated and measured datac The metal-free structure
has a calculated t which Is too high by 40%, whereas the Iron
complex has a value which is too low by 66%» If Edward's volume
Is the correct function to be used for these molecules, then the
71
data indicate that the viscosity for solute rotation is greater
than the liquid viscosity for the metal compleXo Such a con-
clusion would seem improbable. When the volumes are calculated
from the dimensions of Courtauld models, the situation is not
improvede The metal-free complex has a calculaited relaxation
time which is three times the measured value; the iron complex
has a relaxation time which is 40% too large. When the maximum
lengths of the three axes measured from the models are used to
calculate the volume, this leads to an overestlmatibn of this
parameter. Since, in the iron complex a chlorine atom protrudes
above the plane of the great ring and in the metal-free complex
one of the phenyl rings has a chlorine substituent. |f the di-
mensions of the basic porphyrazine structure are taken for each _12
molecule;, then the calculated relaxation time will be 854x10
sec,^ at 20°C., for each molecule, v This is still larger than the
value observed for the metal complex.
It would seem that the only way in which agreement could
be obtained between measured and caleulated relaxation times for
these two molecules is by using different frictional coefficients
for each of the two types of molecular motion. ^ In order that
one of these coefficients is not larger than the solvent viscosity,
Courtauld volumes would have to be used.

- 72 -
Although the empirical equation of Eichhoff and Huffnagel
predicts the relaxcjtion time of 9”brdmophenanthrene5 which has
its dipole inclinec| to the principal symmetry axes of the mole-
cule, it would fail to predict the effects of dipole inclination
observed In the steroids. Calculation of the effective radius
of the steroids would be difficult because of the le^^ge number
of atoms and stereochemistry of the molecules. However, the
effect of altering the positioh of the carbonyl group within
the molecule would not be expected to have a large effect upon
the centre of mass, and hence the effective radius would be
similar for similar structures. If it can bo assumed that the-
centre of trmss-^is at the centre of sj^mmetry of-the-mofOcules^
the effective radius iSj^half the length of the long axis
of the molecules. Fpr p-xylene solutions the Eichhoff-Huffnagel
equation is:
5a-ChoTestan-3-one,
-13 8
T - 1.66 X 10 exp (1.20 x 10 reff.) 3 5
>
I, and A - Cholestadiene-7-one, jl* have
effective radiii of 9.8 A and 9.55 A respectively, which gives -8
corresponding calculated relaxation times of 2,1 x 10 sec.and -8
1.6 X 10 sec^for these two molecules, a result in error by;
two orders of magnitude. A similar situation is found with the
androstane steroids. The equation predicts a relaxation time of

- 73 -
,12 _12
405x10 seCofor 5a-Androstan-3-one,III, and 495 x 10 sec.
for 5a-Androstan-3:17^dlQne,IV. In this case the relaxation times
are closer to the observed values but in the wrong ordero For the
porphyrazine metal complex, which is completely symmetrical, the
centre of mass will be at the centre of symmetry of the molecule,
so there is no appir^ximation in determining its effective radius. _9
The equation predicts a relaxation time of 1,5x10 seCoV/hich is a
little over two times the observed value suggesting t|i^t the
equation is more suitable for predicting the relaxation times of
flat molecules; In the metal-free complex the presence pf a chlorine
substituent will cause a slight shift of the centre of mass toward
the penury of the ring. It will thus have the effect of increas-
ing the effective radius and increase the calculated relaxation time.
However, the measured value of T for this compound, as has been seen,
is only one half that of the metal complex, hence^the agreement in
the former case may be fortuitous.
Other empirical equations for thea'prtdri calculation of re-
laxatidn time have been developed by LeFevreet al, Le Feyre and
Sullivaii (64) noted an approximate correlation of T with the mean
polarisability and the shape of a solute which led them to write
the equationi i: 2 2
(Ei+2)kT

- 74 -
Where a 1s the mean polarizability of the solutej Aj^is the mean
depolarization factor of the solvent, is the dielectric constant
of the solvent^and is defined by the relation:
2 2 2 2
h = [(A-B) +(B-C) +(C-A) ]/(A+B+C) .
w3iere A,B, and G are the axial lengths characterising the ellipsoid 2 2
A^B Cc These authors found that (exph ) a was numerically mean
equivalent to (ABC )/8 and proposed the following simplified equation:
_i
^ ^ ABC(exp, A^) (e^+2)
2kT
Since, in this equation, the only properties of the solute are
the lengths of the axes it will not predict variations of relaxation
time resulting from a change in the position of the molecular dipoleo 9 ^
It wi11 predict a 1arger rel axation time for A-Cholestadiene-7-one,
11 ^ than for 5a-Chblestan-3-one, I, and simi 1 arly i t wi 11 gi ve a higtier
relaxation time for 5a-Andfostan-3:17-dione9 TV, than for 5d-
Ahdrostan-3-one, III.
Wirtz and his co-workers (66)(67) derived an equation for the
calculation of molecular relaxation times based on a systerp of
slDheri cal solute and sol vent molecul es> Because of the fini te size
of the solvent molecules they considered that the Stokes* law re-
lation was not applicable and developed amiGrofrictional coef-
ficient for rotation. This yielded the equation:
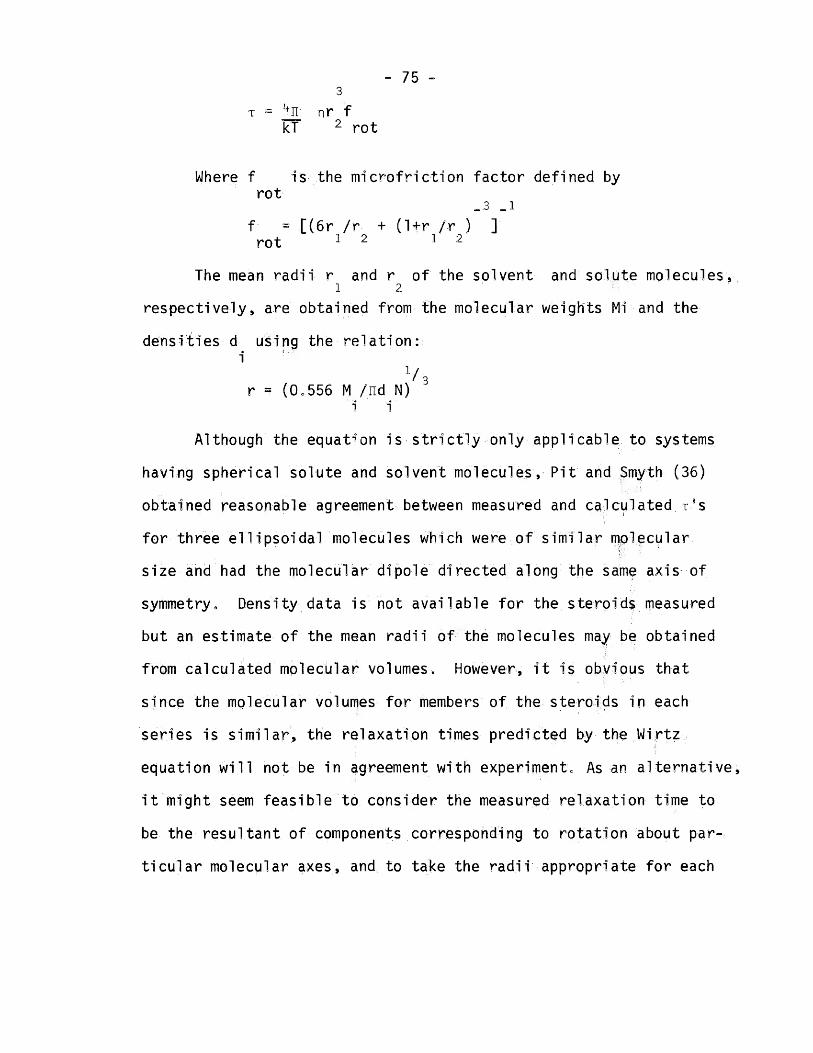
75 - 3
T = nr f kT ^ rot
Where f rot
1s the microfriction factor defined by
3 _ 1
f = [(6r /r + (1+r /r ) ] 12 12
The mean radii r and r of the solvent and solute molecules, 1 2
respectively, are obtained from the molecular weights Mi and the
dens i t i es d us 1 ng the re 1 ati on: i
1 j r = (0.556 M /nd N) ^
1 1
Although the equation is strictly only applicable to systems
having spherical solute and solvent molecules. Pit and Smyth (36)
obtained reasonable agreement between measured and calculated x*s
for three ellipsoidal molecules which were of similar nplfcular
size and had the molecular dipole directed along the samf axis of
symmetry. Density data is not available for the steroids measured
but an estimate of the mean radii of the molecules may be obtained
from calculated molecular volumes. However, it is obvious that
since the molecular volumes for members of the steroids in each
series is similar, the rqlaxatipn times predicted by the Wirtz
equation will not be in agreement with experimento As an alternative,
it might seem feasible to consider the measured relaxation time to
be the resultant of components corresponding to rotation about par-
ticular molecular axes, and to take the radii appropriate for each

- 76 -
motipnc Using this procedure the relaxation time corresponding
to the moment components in the direction of the long axis for
5a-Cholestan-3-one, I, and 5a-Androstan-3-one,III, at 25®G.,are _12 ■ _12
715X10 sec. and 152X10 seco In all the molecules^:where the
dipole is inclined at an angle to the long axis, the radius to
be associated with the moment component perpendicular to this
axis, is the same. Hence, this approach would predict similar
relaxation times for this type of motion in all the molecules=.
It is thus obvious that the Wirtz equation is not applicable to
such systems which deviate considerably from spherical form.
The Fischer formula, however, should be applicable to these
ellipsoidal steroid molecules, but^because the f factor is always
greater than unity it will predict higher relaxation times than
the Debye-Stokes' equationo Although the relaxation time of 5a-
CholeStan-3-one,I, is predicted by this 1 atter equation, the
Fischer formula will predict its value to be f times that ob-
served, In order to obtain agreement between measured-and, cal-
culated T'S for 5a-Cholestan-3-one,I, it then becomes necessary to
employ a frictional coefficient in the Fischer equation which is
1 ess than the so1 vent viscosity.
Two approaches have been used to make evaluations using the
Fischer equationo. In the first, the viscosity of the solvent was
tak^n and reTaxation times were calculated corresponding to moment
- 77 -
components along the directions of the principal axes^.with the
aid of the f factors^ The component relaxation times were used
to compute a mean value with the aid of the equation»
CJ
Magee and Walker (68) have shown that this simple equation
gives reasonable values for x when the ratio x /x 1s of the
order of Zo The Fischer f factors give the ratio of the com-
ponent relaxation times,^ and for the steroids the largest x /x a b
ratio is 2.5:1, hence,the above equation would be expected to
give fairly reasonable mean relaxation timesc
The form factors, obtained from the ellipsoid axial ratios,
are given in table 2o3, The relaxation times corresponding to
moment components along the principal axes are obtaineci by mul-
tiplying 'T^^g-fven in table 2o2^ by the appropriate fv factorc The
value of the mean relaxation tirpe computed from the component
values is given in column 8 of the table.
As was expected the mean relaxation times, calculated using
the solvent viscosity, given in column 8 of table 2,3 are con-
siderably higher than the experimentally observed valuesc However,
the relaxation times are predicted to be In the correct order; the
effect of altering the position of the molecular dipole within the

- 78 -
TABLE 2.3 FORM FACTORS f AND f , RELAXATION TIMES.x and T . AND MEAN a b ^ a b
RELAXATION TIMES x /CALCULATED USING THE FISCHER EQUATION. / Of
-12
SOLUTE SOLVENT
5a-Cholestan-
3-one p-xylene
3 5 3
A-Choles- p-xylene
tadiene-7-one
5a- Androstan-
3-one p-xylene
5a-Androstan-
p-xylene
T^C fa fb Tb '^0 Toxio sec. . microscopic
xlO sec„ xlO sec^ viscosity
xa •=12
15 522 - 522
25 2.46 - 450 - 450
37.5 369 - 369
50 312 - 312
16 533 280 326 169
25 2o29 lo20 460 241 280 135
37.5 376 197 229 116
50 318 167 194 98
15
25 1.57
37.5
50
221 -
190 -
155 -
132 -
221
190
155
132
15 230 158 176 67
25 1.60 1.10 198 136 152 59
37.5 163 112 125 45
3:17-dione

79 -
Table 2.3 continued
SOLUTE SOLVENT T®C fa fb xa xb TO “12 -12
xlO sec. xIO sec
5ct-Androstan-
3:17-dione p-xylene 50 138 95 106
5a-Androstan- p-xylene 37,5 lo6 IdO 214 147 164
3:17-dione + naph-
thalene 4
A-Androsten- p-xylene 37.5 1.56 1.20 237 182 214
3:11:17-trione + naph-
thalene
“12
ToxlO seCo
mi croscopic viscosity
38

- 80 »
molecule is at least qualitatively correcto The f factors show
that rotation around the long axis of the ellipsoid gives rise to
relaxation times which are only slightly larger than would be
expected for a sphere having the volume of the ellipsoldo This
is understandable since the lengths of the two axes perpendicular
to the moment component, which give rise to the shorter relax-
ation time, are similar. Hence, the molecule does not displace
much solvent when undergoing this type of barrel motion and its
behaviour approaches that of a sphereo It can also be deduced
from the f factors that as the ellip'ticity decreases the differ-
ence in size of the two component relaxation times becomes smaller„
In an attempt to improve the agreement between measured and
calculated relaxation times the microscopic viscosities were ev-
aluated for 5a-Cholestan-3-one, I, and 5a-Androstan-3-one, IIK
Since the Fischer equation predicts that these molecules should
have a single relaxation time their measured relaxation times
were equated v/1 th 4nabcf to obtain the macroscopic friction
coefficient. It was then assumed that this viscosity could be
used to calculate the component relaxation times of the molecules
in each of the two series. The result-Tng TVS are shown In
column 9 of table 2,3, Unfortunately,,insufficient 5a-Androstan-3-
one. III, was available to measure its relaxation time in the p-
xylene naphthalene solvent mixture and hence evaluate the micros-
copic viscosity for this solvento
- 81
I t is seen that jin this case^the correspondence between
measured and calculated values is considerably improvedo The 3 5
» agreement for A-Cholestadiene-7-one, II, is poorer than for
5a-Androstan-3:17-dione,IV, which may indicate that the vis-
cosity coefficient< for rotation around the long axis is smaller
than the microscopic viscosity evaluated for 5a-Cholestan-3-one,
I,
In conclusion, it would seem that the effect of dipole
orientation within large molecules^with rigid dipples^is to pro-
duce considerable changes in measured relaxation times. «./)
The Fischer equation is the onl-y satisfoetcr^expression
which can be used to evaluate the mean relaxation time of an
ellipsoidal molecule which has its dipole inclined to a principal
symmetry axis.
Some difficulties arise when attempts are made to consider
the conditions under which the simple Debye-Stokes' equation can be
applied to non-spherical molecular systems. In some cases it
appears to predict the measured relaxation time when the solute-
solvent molecular volume ratio is greater than ,3:1, and when
Edward's volume and the solvent viscosity are used. In the case
of the steroids the Debye-Stokes' equation is only satisfactory
when the dipole is so positioned in the molecule that rotation
occurs about an axis which involves considerable displacement of

82 -
solvent molecules.
When the solute molecule is disc-like in shape and the
moment is situated in the plane of the disc,agreement is ob-
tained between measured and calculated relaxation times. A
moment so positioned gives rise to two extreme types of mole-
cular motion. One involves a large displacement of solvent,
corresponding to rotation out of the plane of the disc, the
other, in-plane rotation, involves less solvent displacement.
These two motions of a disc-like molecule resemble the be-
haviour of a steroid which has the dipole inclined to the main
axis, but the Debye equation is unable to predict the relax-
ation time for the steroid.
If the disc-like molecule has a dipole perpendicular to
the ring plane,its motions resemble that of a steroid with the
dipole parallel to the Tong axis. It was seen for Ba-Cholestan-
3-one, I, the relaxation time was predicted by the Debye-Stokes'
equation. However, the two disc-like molecules ferric octa-
phenylporphyrazine chloride, and bis(diphenylmethyl) ether (63)^
both have the molecular cjipole perpendicular to the molecular
planSsyet the Debye-Stokes* equation predicts a relaxation time
which is too small for the former, but of the correct order for
the latter.

- 83 -
In order to obtain agreement of the experimental values
with those calculated from the Fischer formula it was ne-
cessary to employ a frictional coefficient less than the solvent
viscosity. Yet, for 5a-Gholestan-3-one, I, agreement was ob-
tained using the Debye-Stokes' equation in which the solvent vis-
cosity vyas used. Clearly the molecule can experience only one
frictional coefficient and as the Fischer equation, but not the
Debye-Stokes'equation, is appropriate for calculating the re-
laxation times of non-spherical molecules^it would appear that
agreement with the latter equation is fortuitous.

CHAPTER THREE
DIELECTRIC RELAXATION AS A
RATE PROCESS

- 84 -
Introduction
The relaxation rate of a dielectric is found to be strongly
dependent upon temperature. Such behaviour is significant in un-
derstanding the physical nature of the process involved, for by
analogy with chemical kinetics, this observation indicates that
the units undergoing change are forced to wait until they have
acquired energy in excess of the average tf^^rmal energy available.
Kauzmann(l) considered that the dipole, upon thermal acti-
vation, jumped from one equilibrium position of orientation to
another over an energy barrier, and the fact that the activation
energy for dielectric relaxation processes is of the order of 5 to
10 kT for liquid systems led him to conclude that the dipoles change
direction not continuously, but in a series of sudden jtimps.
Although the mechanism of the dielectric relaxation process
is understood, few attempts have been made at the quantitative in-
terpretation of the activation parameters for dilute solutions of
rigid molecules. It was thus thought that a closer examination of
these quantitites might provide additional, useful information on
the dielectric behaviour of polar molecules.
Discussion
In the literature there appear several rate expressions which
may be used for the interpretation of dielectric behaviour. The
most widely used of these is that due to Eyring (2). However, it is

- 85 -
often employed without due regard for its limitations and before
a deeper examination of the dielectric rate process is carried out,
the various rate equations available will be discussed^
Kauzmann showed that the transition probability for dipole
reorientation is proportional to the Boltzmann factor
expl(-AE/RT), Furthermore it is known that any system undergoing a
physical or chemical transformation, the rate of which depends on
a factor of the type exp(-a/T) can be treated in terms of
absolute rate theory, Thus,Eyring (2)(3) recognized the simi 1arity
between dielectric relaxation and the rates of chemical feactions
and suggested that dipole orientation could be treated by the sta-
tistical mechanical methods of absolute rate theory.
In the derivation pf the Eyring equation it is assumed that a
potential energy barrier of height AG'*' separates two equilibrium
positions of dipoll Orientation as shown in figure (Sd), The top
of the energy barriet is known as the activated state. It is sup-
posed that the initial state is in thermodynamic equilibrium With
the activated state^ the equilibrium corresponding to librational
oscillations which upon thermal activation undergo a libratipn-
rptation transition. The activated state undergoes a transition at
a definite rate the freqiiency of which is the reciprocal of the re-
laxation time T, Tho mean life time of the activated-s-ta^e ls T anO-
is equal to the length of the activated state divided by the averafe"
rate at which dipoles cross the barrier. This leads to the familiar

- 86 -
Fl<Sr. \ POTe^4-T^^^L OPPpSl>4CSr SoCOTe
a) NO pi EL O
b) IN PRESEt^CC OF FIE CO
RO1T*4T4 0M
RO’TATloriAl. A^f^OrL E

- 87 -
Eyring expression*
AGVRT T = 1 = ahe (3 c1)
K kT
S1
Where K
h
R
T
a
nee AG = AH
h T = - e
= the dipole jump rate,
= Planck's constant,
= Boltzmann's constant,
= barrier height, the free energy of activation.
= universal gas constant.
= absolute temperature.
= is a transmission coefficient normally taken
to be unityc It is the probability that, once
the dipole reaches the activated state, it
will continue to move in the same direction to
a new position of orientation^
- TAS, equation (1) can be rewritten in the form:
(AH*/RT-AS*/R) (3.2)
kT
Hence, from equation (2) AG^ can be obtained from the re-
lation:
AG^ = RT,2o3026[log T + log kT/h]^and AH^ can be
obtained from a study of the variation of relaxation time with
temperature from the slope of a log xTr-vs-l/T plotc
Because of its simplicity, the Eyring expression has been
used to evaluate the thermodynamic activation parameters for

- 88 -
many dielectric systems« However, the proof of its validity is
not established because of the difficulty of directly determining
the activation terms. The use and limitations of the expression
have, however, been discussed (4)(5).
It is observed (6) for dilute solutions of polar molecules . -1
in non-polar solvents that when AH is less than 3c6 kcaLmole
AS is negative, but for polymers AH is of the order of 50-100
Kcals.and As is positive to the extent of 100 - 300 e.u.
Levi (5) explained the polymer data on the basis that the
reorientation involves the motion of large molecular segments.
Extensive local disorganization of the polymer gives rise to the
large entropy: the energy expended in creating the disorganization
accounted for the enthalpy change. In liquid systems the system
is different. The lack of rigidity and weaker intermolecular in-
teractions reduce AH to a small value. Bauer (5) explained the
negative entnopy on the basis that it represents merely a higher
state of order in the activated state relative to the initial
state^ since-i-n-t-be activated state the--d4pole is forced -to -adopt.
a particular eonfi-gura-ti-Qn i^eT-ative to the field direction, re- ■
•^cing the -efHsropy- relati ve -to- the initial ■ state. ,The Eyring
equation thus allows its user considerable flexibility in the inter-
pretation of the experimental observations.

- 89 -
Davies and Clemett (4) have questioned the significance
of the entropy term given by equation (3*2)c When is
written in the form of an Arrhenius expression:
1= A exp (-AH*/RT) T'
and this is compared with equation (3,2), it is seen that the
pre-exponential function becomes:
A = kT exp(As*^/R)
^ h AG calculated from equation (3,2) is then an arbitrary parameter
± which may be adjusted to fit the experimental data. Since AS IS
calculated from the difference between AG^ and AH^, it must be
assumed that the universal frequency factor of the Eyring expression
is correct for AS to have any physical meaning,
Powles (9) has pointed out that the Eyring frequency factor
kT/h is no more than the uncertainty principle time for the energy
kT, Furthermore, it is the same for all molecules, whereas he
favours a characteristic frequency factor for each moleculeo Other
rate expressions have different pre-exponential factors.
As an alternative to the Eyring expression, Clemett and Davies
favour the equation of Bauer (7):
i = f ^ fi T J 2nl a a
1 1 ^
Le RT

- 90 -
The symbols as defined by Bauer (7) are:
I = moment of inertia of the particle
oi and 02 ~ configuration partition functions
corresponding to the two equilibrium positions.
L = effective length of the potential barrier
Unfortunately, in order to calculate all the prefexponential
terms of the Bauer expression, detailed knowledge of the form of
the potential energy surface is required* Hence, attempts to make
evaluations of the activation terms, by using this expression, are
hindered by its intractibillty in comparison to the arbitrary nature
of the Eyring expression.
For the systems which they studied Clemett and Davies found
that the differences in enthalpy evaluated by the Eyring and Bauer
expressions were no more than the experimental error. However, the
entropies of activation were considerably different; the Eyring ex-
pression gave negative entropies, whereas the Bauer equation gave
positive values.
Hoffman and Pfeiffer (8) treated theoretically the dielectric
behavioqr of a polar crystalline solid. The rate expression derived
by these workers was of the general Arrhenius form of the previous
expressions given above. However, they considered that the form of

- 91
the pre-exponential term was unGertaino In a later paper (9)
Hoffman states "there is some implication that the pre-
exponential factor is somewhat smaller than kT/h being nearer to
and a discussion of this approach would seem profitab!ec It Is con-
sidered that the particle has two equilibrium positions which have
the same potential energy in the absence of a fieldo An energy bar-
equilibrium each of the sites is equally occupied with particles and
tides in either site, which has sufficient energy to cross the
barrier, in either direction, is given by the Boltzmann factor:
When an electric field is applied to the system, the potential
energy of the particles in the two equilibrium positions will be
changede The potential energy of the particles in A is raised with
become favoured, since they are to positions of lower potential en-
ergy, and the number of particles in position B will thus tend tq
increase leading to a polarization of the medium in the field dir-
ection* For simplicity the particles are considered to have a charge,
e, and hence their interaction energy with the field will be
Frohlich has treated dielectric relaxation as a rate process.
rier separates the tv^o positions A and B (Figure 3d (a))* In
there is no net polarization* If AE > kT then the fraction of par-
e
respect to B (Figure lb)* Jumps in the direction of the field then

92 -
T_ eFb where F is the field strength and b is the distance of 2 separation of the equilibrium positions. A particle in site A is
then separated frorti site B by an energy barrier:
'■ +
AE = AE - X eFb (3.3) A 2
In site B the particle experiences an effective height:
AE^ = AE'*' + ^ eFb (3.4) ^ i
In the absence of a field it is assumed that the particles are
librating about a mean position with a frequency Wo, The probability,
P° , that a particle will cross from A to B or from B to A is given AB
-AE±/kT P° = Woe =P° (3.5)
AB BA
If a field is now applied, the particles in A facing a lower
potential energy barrier have an increased probability, P , of cros- AB
sing to B given by: + -AE /kT
P = Woe A AB .
-AEVkT £[b = Woe e 2kT
Hence, for eFb << kT ^ ^ I eFb I
= P° p + ^ I (3.6) AB ^
Similarly, the particles in B face a higher potential barrier
and have a decreased probability of crossing to A given by:

- 93 -
Woe -AE|/kT
BA -AE'*'/kT -eFb/kT
Woe e
AB 1 - eFb
L 2kTJ (3.7)
The net rate at which the number of particles In A is changing
Is determined by Boltzmann's equatlonc
Hence dN
A dt P N + P N
AB A BA B (3.8)
where N and N are the number of particles In sites A and B res- A B .
pectively. The number in site B is given by the analogous expressions
dN B - -P N + P N (3.9)
dt BA B AB A
Adding (3,8) and (3.9)
d (N + N ) = 0 "ITT A B
so that the total number of particles In both sites is constant with
time, as must be so.
The difference in population numbers between the two sites Is
proportional to the Induced polarization i.e.

- 94 -
__d (N -N ) ^ -2P N + 2P N dt B A BA B AB A
(3J0)
but from (3.6) and (3o7), (3.10) becomes
d (N - N ) = -2P° dt B A AB
= 2P‘ AB
1 - eFb N + 2P^" 1 + eFb 2kTj B AB L 2kT
-(N -N ) + eFb ( N + N )1 BA 2kT A B
NA
But N + N = total number of particles = constant A B
since M = eb (N - N ) (3.11) B A
where M is the total moment induced into the system by the
electric field, the equation for the variation,of induced moment
with time is:
m dt
2 2
2P^ M + e b FP° N AB AB
kT
(3.12)
A solution to this equation exists which has the form: -t/x
M(t)- a + 3G (3.13)
where and T are constantSo.
Differentating (3.13) with respect to t gives
^ [M(t)-a] dt T
= -1 M(t) + a

- 95 -
This is of the form of equation (3J2) provided
i = 2P° T AB
2 2
a = e b FP® N T AB
RT~
2 2
or a - e b FN 2kT
Thus, a solution of 10 satisfying the initial condition, that
M(o) = 0 at t=Oj i.e. that there is no net total moment at t=o, is:
2 2 r -t/ M(t)= e b m\ 1-e
The relaxation time is given in terms of the transition
probability of the particle jumping the barrier by:
1 T = 2P°
AB
Now as t M(t)^M(°°)=e^b^FN which is the equilibrium moment 2kT
induced into the medium* Hencq:
M(t)= MW 1-e
An exponential variation of the moment with time gives rise to
Debyo-type absorption for the dielectric* This mechanism is, then.

96 -
phenOmonologically indistinguishable from the Brownian rotation
diffusion model proposed by Debye, since the Debye dispersion
equations follow from both approaches.
Since T = 1 2po
AB
it follows that:
AEVkT T = 1 0
2Wd
This is the Frohlich equation. The action of the field on
the medium merely alters the relative energies of the two equilibrium
positions. It is unable to lift the particle over the energy barrier,
the energy required by the molecule to surmount the barrier being
acquired by exchange of energy in collision processes with other
molecules.
Frohlich considered that the pre-exponential frequency factor
could not be determined with accuracy but it may be considered to be 12 14
of the order of 10 to 10 sec .
It thus appears that, since the form of the pre-exponential
factor cannot be fully justified, the entropy of activation deter-
mined by the Eyring expression has no absolute significance. In
view of this it was decided to use the general equation:
= ^ exp (AE^/RT) ( T e
T

97 -
for the calculation of the experimental activation energy^
AE .opposing the reorientation of the dipolec A is-a-c^Tyfe=ant e '
and is considered to be a function of temperature and pressure (39)^
When the dipole is fixed, as in a rigid molecule, then AE^ repre-
sents the energy barrier to rotation of the molecule as a wholec
An attempt will now be made to gain insight into the nature
of the energy barrier opposing the rotation of rigid molecules«
Since the dipolar molecule is not rotating freely in solution,
the barrier to its rotation can be regarded as the resistance pro-
duced by the neighbouring molecules of its environmento In order
to reorient, then, the dipolar molecule displaces the molecules
surrounding it and does work against the attractive forces of the
liquid in going from an equilibrium position of orientation to the
activated state.
To evaluate the work done, it is necessary to have knowledge
of the forces acting between the molecules of a liquid, and for this
the thermodynamic property known as internal py^essure,taken
by Hildebrand (11) to be a general measure of the intermolecylar for-
ces within a liquid, will be used. Internal pressure. Pi, or cohesion
energy density, as it is also known, is defined by the relation
Pi = / au.] where 8u is the charge of internal energy of the liquicf l'3vAr
resulting from a charge in volume^9v^at constant temperature.
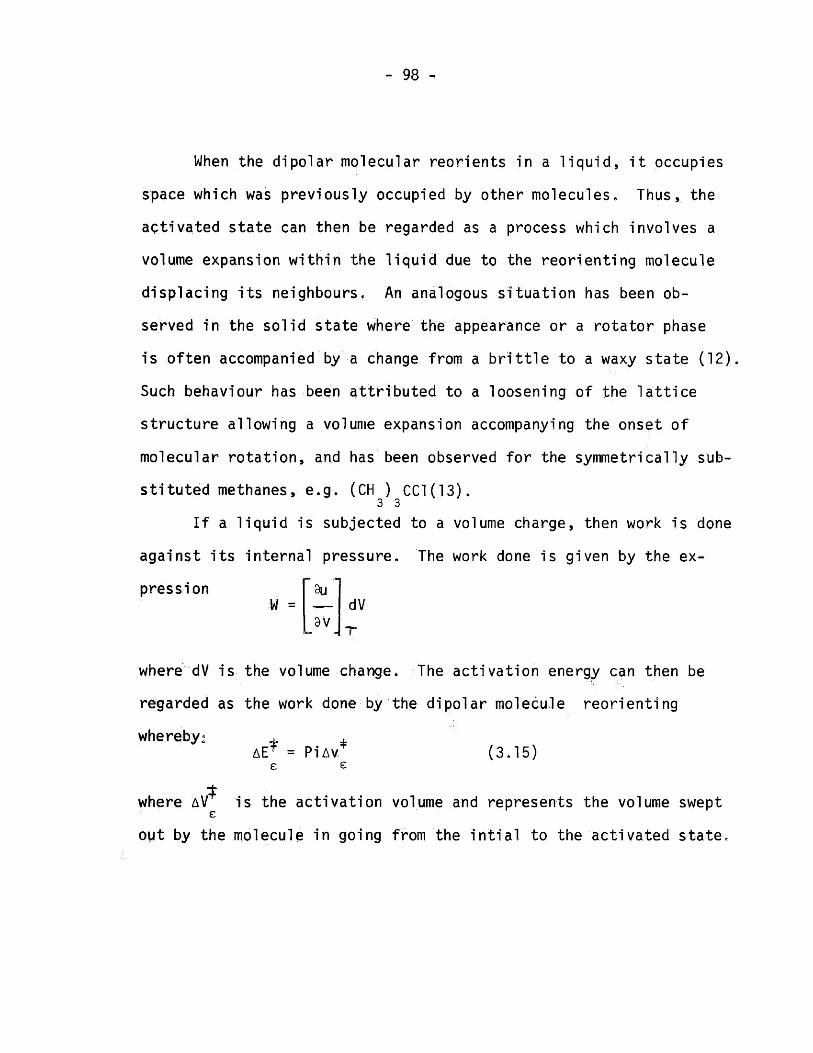
- 98 -
When the dipolar molecular reorients in a liquid, it occupies
space which was previously occupied by other molecules. Thus, the
activated state can then be regarded as a process which involves a
volume expansion within the liquid due to the reorienting molecule
displacing its neighbours, An analogous situation has been ob-
served in the solid state where the appearance or a rotator phase
is often accompanied by a change from a brittle to a waxy state (12)
Such behaviour has been attributed to a loosening of the lattice
structure allowing a volume expansion accompanying the onset of
molecular rotation, and has been observed for the symmetrically sub-
stituted methanes, e.g. (CH ) CC1(13). 3 3
If a liquid is subjected to a volume charge, then work is done
against its internal pressure. The work done is given by the ex-
pression W =
3U
9V dV T
where dV is the volume change. The activation energy can then be
regarded as the work done by the dipolar molecule reorienting
wherebyi ^ . AE^ == PiAv^ (3,15)
e e
■± where AV is the activation volume and represents the volume swept £ out by the molecule in going from the intial to the activated state.

- 99 -
The Internal pressure of a liquid may be estimated by the
following methods. If it is assumed that the internal molar
heat of vaporization, i, is a measure of the work done against the
internal pressure in vaporizing one mole of liquid occupying a
volume V, then
but
hence
iL V= L av jj
r 1 8U d%
L j
= Pi
Pi = L/V
Pi can also be obtained from the coefficients of cubic ex-
pansion oc and compressibility 6 in the following manner:
OL
and
= if aV
•K av W.
hence
n
=faP I ITrJ
Using the therodynamic equation of state:
Pi = 9u
W
1
=T “1
aP FT
-P
since the external pressure, P, is small in comparison to Pi^which

- 100 -
is of the order of 2000 - 8000 atmospheres* then:
Pi = T
from which it follows that
Pi = T 3
The assumption that the barrier to molecular reorientation * I
AE * is equal to work done in creating the volume charge within e
the liquid can now be tested. By inserting AE^ = PiAV^ipto equation e ^
(3.14), then:
T 4 exp PiAVe'*’ T RT
The relationship between T. Pi and AV can be studied by
measuring T for a particular solute in a number of solvents of
differing internal pressure. Of the solvents commonly used in
dielectriq measurements decal in and nujol are not suitable for in-
vestigation of the effect of internal pressure, because, from the
physical properties stated by various workers, decalin invariably
appears to be a mixture of the cis and trans isomers, furthermore,
nujol is also a mixture, and the internal pressures of these mix-
tures are not known.

101 -
Table (3.1) gives the internal pressures of a number of
suitable solvents. These have been calculated from heat of vapori-
zation data given in Hildebrand and Scott (14) or tables of physical
constants by Dreisback (15).
TABLE 3.1
INTERNAL PRESSURES OF SOLVENTS
Solvent
is0-Octane
n-Hexane
n-Heptane
Methylcyclohexane
Cyclohexane
Carbon tetrachloride
p-Xylene
Benzene
1:4 Dioxane
Internal Pressure calcc
46.9
51.8
55.2
61.0
67.2
74.3
76.9
83.9
96.0
A plot of log T against internal pressure will give the re- y
lationship between T. Pi and AE^ . Ajj^ can be obtained from the
slope, i.e.:
■- 102 -
» PiAV''' + e
T RT
and AV* =2.3026 RT x slope. £
Figs. 2 to 11 are constructed from the work of Chau, Tardif
and LeFevre (15), Masse (21), Chitoku and Higasi (16), Magee (17),
and Eichhoff and Hufnagel (20). It can be seen that, in general,
fairly good straight lines are obtained; It is conspicupus, how-
ever, that the relaxation times in carbon tetrachloride are higher
than would be expected if internal pressure alone governed the re-
laxation time.
Higasi (18) has commented on the apparently anomolously high
values of carbon tetrachloride solutions of polar molecules. He
compared relaxation times of a number of solutes in the two solvents,
cyclohexane and carbon tetrachloride, both of which have almost
identical viscosity, but relaxation times were observed to be some
70% higher in carbon tetrachloride. The observation was explained
by suggesting that molecules interacted with the carbon tetrachloride.
In fact, molecular compound formation has been detected in some
solutions in this solvent (19).
Table II gives the activation volumes obtained from the
log T-Pi plots in figures 2 to ^, They are compared with molar
volumes calculated from the molecular weight and density, and the +
ratio molar volume/AV is given. e

103 -
F\Cr 'h .Z Log^- Po PL.O-T ^OR. Cr-«-^-2«)
"I—
<»o nr" ■70
—r |Q0
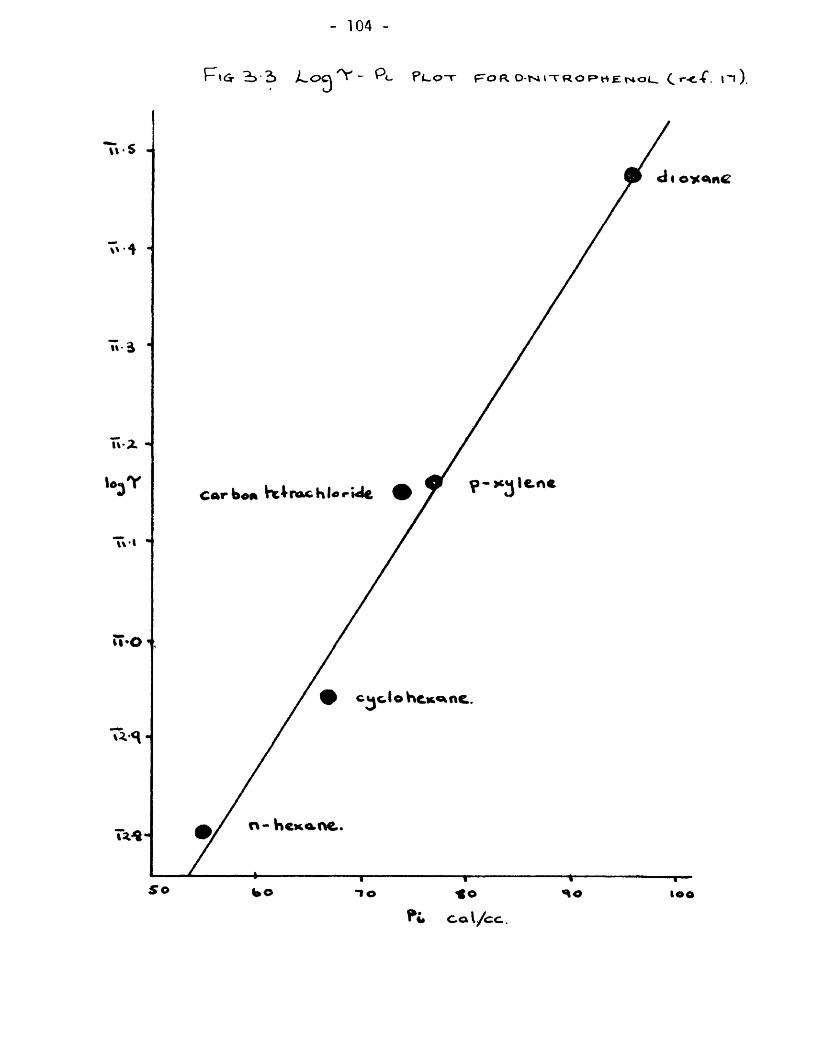
104 -
P»<3r ^ 2> /wOg ^ - Pc Pi-OT f=^OR O-|v^l-rROF*HEr40U C

105 -
JLO^ "V- P;^ PuoT sirr«.o€fceN»3E.£i^*e

106 -
i S" L oq 'Y - Pc PLOT FOR cMLoRo&FNZEiNe -2.1.)

107 -
P\Gr. 2»‘fo Log/V- PL PLOT ^=OR p- iv/rrROTioL.o>€.Ne i t»).

108 -
F^c. L og^-' Pc PLOT p(OA CVCL^oNexYLeHLbftXDe
Cre^. aO.

109 -
p\Ct. c^lsUTROhOAPHTHAl-eME
(^ r-e^. t S.)

no -
Lo(^'y'-^Pc PLOT POP diG.KIO'ropy'opcv/ic

- m -
F»(3r. 'b'lo Laa PL PLOT FOR pvRiDfMe. (r<^-P )

112 -
P»cx. 2>‘i« PjLoT tsii‘TRoe>£fs2:ttHH (Iz-eT 2o)
60

113 -
TABLE (3.2)
ACTIVATION VOLUMES AV OBTAINED FROM FIGURES 2 TO e
Solute Activation Volume Molar Volume M
cc/mole 1* ^
cc/mole 25°C AV e
Pyridine 14.5
o-Nitrophenol 22.9
Chlorobenzene 12.6
Nitrobenzene 13.8
2:2 Dichoropropane 8.5
p-Nitrotoluene 10.9
Cyclohexyl chloride 13.2
a-Nitrpnaphthalene 7,7
80.6 5.6
93.7 (14°C) 4.0
100.3
102.3,
103.4
118.6
130
8.0
7.4
12.1
105.5 (0°C) 9.7
9.0
16.9
The activation volume is seen to vary from 7.7 cc»mole
for a-nitronaphthalene to 22.9®mole for o-nitrophenol, and in all
cases it is considerably less than the molar volume of the solute.
It appears from table 3.2 that the larger molecule, a-nitronaphth|lene,
has a slightly smaller activation volume than the other solutes.
However, these volumes are subject to error, since the slopes of the
lines are of the order 0.G06-0.01, and 2,303 RT^the factor
by which they are multiplied to obtain the volume has a value 1364.1

- 114 -
at 25®C. Thus, only a small enror is needed in the slope to give
a large error in the activation volurtie. Further, the values of
relaxation time quoted by different authors (TSy 16)|2p)^(21) for
the same solute solvent system show variationo
A comparison is made in Table 3J3 of various values of the
relaxation time quoted for pyridine and nitrobenzene; the author
reference is shown in parenthesisv (See Table 3.3).
Although the val ues of Masse appear to be larger than the
more recently measured values (20)(22), they were used because they
had the largest variation of internal pressure of the solV!Bnts. The
data of Eichhoff and Hufnagel (20) for pyridine and nitrobenzene are
shown in FiguresTO and 11 respectively for comparison with the Masse
14.4 ccMole respectively, are In reasonable agreement with that
from the Masse data, suggesting that the relative relaxation times
obtained by Masse are correct.
The Tog "^-Pi plots are seen tq predict the effect of solvent
on relaxation time more accurately than the Debye equation in which
the solvent viscosity is used for n«
Based solely on the solvent viscosity, the relaxation times
for a particular solute in a variety of solvents would be expected
to increase in the order: n-hexane < n-heptane < p-xylene -benzene< t
methyl cyclohexane < cyclohexane ^ ca ' trachloride < dioxane.
data. The activation volumes obtained from these results, 15.4 and 1

115
a z <c
LU Z UJ
CO o 0£.
o c>o
CO os: _j
CO o o zc oo
ob <
C/O •ZD o »—• QZ «<
CO
LU OZ
O
<C QZ I— >- CQ O. O
O
</) LU ■ZD -J <c
o (U
CM (A 1—4
I o
X H
<u c <D N C O)
o s-
4-»
U CU CO
CM r—I
• CD
'x H
<u
s- >> a.
CU >
o CO
CM
UO
CO
to
CO
C71
CO
CO
CM
CO
CO
<u c fO X CU
o CM
1^
00
CM
CM CM
CT>
CM
O CM
CM
CM
CO
tn
CU sz 03 X CU
JC o
a
o CM
CO
CO
CM
CT»
CO
O
CM CM
CO
o CM
CM
CO
CO
CO
CM
CO
to
Vj"
CU
CU M
CU OQ
O CM
CM
cp
cr>
CO
CM CM
CO
o CM
CO
CM CM
o
to
CO
CM
to
CM
-4U $> CU c +J CU
^ -Q X tf
CX CJ>
o CM
lO
00
CM
CO
CM CM
CO
CO
o CM
CO
CM
CM
to
o
CU •a
o
CD <o i-
Qi SZ m X o
CU sz fO X
I OS r— x: >, o
-CZ I— +J o CU >> s: u

- 116 -
The linearity of the log '^Pi plots, then, provides strong
supporting evidence for the hypothesis that the barrier to rotation
of the molecules is the work done by the solute in displacing the
solvent molecules surrounding it.
The graph for 2:2-dichToropropane is not as good as fpr the
other solutes, since, the value of the relaxation time in p-xylene
in comparison to benzene appears to be anomolously high, A similar
case has been observed by Chi toku and Higasi (23) for dichloroethane in
these aromatic solvents which these authors attribute to the formation
of a hydrogen bond between the solute and the solvent.
For the cases where the plots are linear for a number of sol-
vents* as in figures 2,3,4,5,6,7and 8, it may be tentatively concluded
that solute-solvent interaction does not contribute detectably to the
activation energy.
To determine whether solute-solvent interaction energy is
likely to contribute to the energy barrier to rotation, these terms will
now be calculated for nitrobenzene and p^ridine in a number of sol vents,
Three general types of attractive interactions are known to
exist between molecules, Dipole-dipole interactions operate between
two molecules, each of which has a permanent dipoTe and come into being
when two dipoles approach one another.when a molecule with a permanent
dipole approaches a non-polar polarizable molecule* then a dipole is
induced in the latter, which gives rise to an attractive interaction

- 117 -
known as the dipole-induced-dipole term. The third type of interaction
arises from dispersion forces which were shown by London to act between
all molecules and are always attractive.
For dilute solutions of polar niolecules in non-polar solvents,,
provided hydrogen bonding or other specific interactions do not occur,
the only interactions possible are those depending on the polarizability
of the solute and solvent and the dipole moment of the solute.
Because of the low concentration of the polar molecules, inter-
actions between the permanent dipoles of the solute can be ignoredo Of
the three general types of interaction discussed, only those due to London
forces and dipole-induced-dipole forces need to be considered for dilute
solutions;
The expressions for Londcn dispersion energy, E and dipole-induced- L’
dipole interaction, E , are given bys D
F = -3a g? Il l2 L 6
2r Ij+I^
-1 (X y 1 D u y,
where ai is the mean molecular polarizability
li is the first ionization potential „
r is the distance of separation of molecular centres

- 118 -
and u 1s the molecular permanent dipole moment.
Precise calculation of the attractive energy terms is difficult
because of the nature of the liquid state, moreover^the distance of
separation of the niolecules is subject to variation with tirne and is
not known with certainty« Therefore, as an approximation, it will be
assumed that both solute and solvent molecules are spherical, the mean
radii being determined from the molar volumes. The distance of se-
paration of the molecules will be assumed to be thqsum of their mean
radii. For the calculation of E , only interactions between neigh- D
bouring pairs of molecules need to be considered. For dispersion
energies, however, the attraction is between all molecules surrounding
a central molecule and is the sum of all the pair interactions. It
then becomes necessary to know the coordination number for; the solute-
solvent system, This parameter is unknown. Furthermore, it will be
subject to variation with time. In view of this difficulty, the dis-
persion energy interaction is calculated only for neighbouring pair
interactions. Table (3.4) gives the dispersion and dipole-induced-
dipole energy interaction terms for pyridine and nitrobenze in a
number of solvents. The polarizability data were taken from LeFevre
(24)(15), the ionization potentials from Kiser (25), and dipole
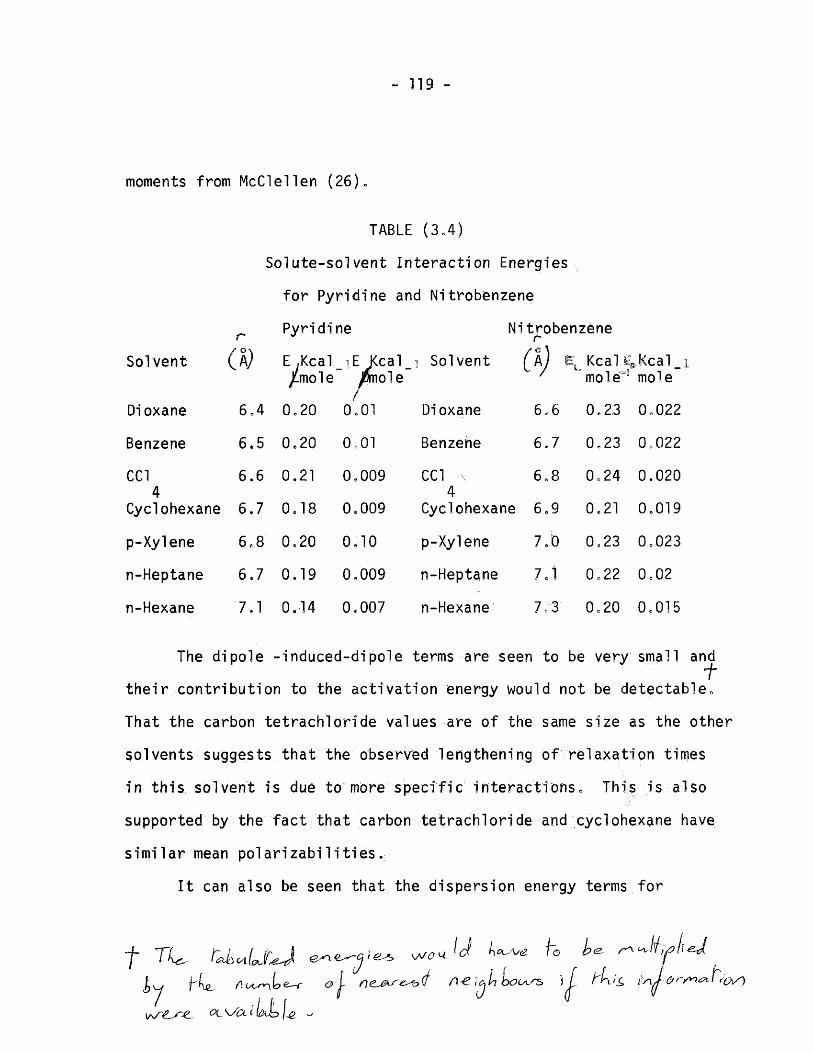
119 -
moments from McClellen (26).
TABLE (3.4)
Solute-solvent Interaction Energies
for Pyridine and Nitrobenzene
^ Pyridine
Solvent (^A} E.Kcal^^iE J<cal. jLmole”" Anole
Solvent
Dioxane 6,4 0,20
Benzene 6.5 0.20
CCl 6.6 0.21 4
Cyclohexane 6.7 0.18
p-Xylene 6.8 0.20
n-Heptane 6.7 0.19
n-Hexane 7.1 0.14
0.01 Dioxane
0,01 Benzehe
0,009 CCl N 4
0.009 Cyclohexane
0.10 p-Xylene
0,009 n-Hept^ne
0.007 n-Hexane
Nitrobenzene r G ^
M Kcal £E,Kcal_i ' mole'““ mole
6.6 0.23 0.022
6.7 0.23 0.022
6.8 0.24 0.020
6.9 0.21 0.019
7,b 0,23 0.023
7.1 0.22 0.02
7.3 0.20 Q.015
The dipole -induced-dipole terms are seen to be very small and f
their contribution to the activation energy would not be detectable.
That the carbon tetrachloride values are of the same size as the other
solvents suggests that the observed lengthening of relaxation times
in this sol vent is due to more specific interactions. This is a1 so
supported by the fact that carbon tetrachloride and cyclohexane have
simi 1 ar mean pol ari zabi 1 i ti es
It can also be seen that the dispersion energy terms for
iy
h y
LLU -

- 120 -
neighbouring pair interactions do not vary appreciably from one
solvent to another. Thus, provided the number of solvent molecules
surrounding each solute does not change too greatly from one solvent
to another, it may tentatively be concluded that the solute-solvent
dispersion interaction energy does not change appreciably from sol-
vent to solventc The apparent constancy of the.interaction energy
termsj on the basis of the somewhat crude model used to calculate
these terms, cannot account for the lengthening of the relaxation
time observed to follow an increase in internal pressure of the sol- '{■
vent, but gives additional support to the postulate that th^ barrier
to reorientation involves the displacement of solvent molecules by
the solutec
If a change in the solute-solvent interaction energy, in going
from the Initial to the activated state, was contributing to the
barrier to rotation, less regular log T-Pi plots might be anticipated.
Since 1t is unlikely that ciuring the course of reorientatiop the sol-
ute and Its immediate neighbour solvent molecules retain the same re-
lative: spacial oriehtatlohs^ Hence, Tf the general type of solute-
sol veht interactions calculated above were significant in^determining
the energy barrier, the solvents with greatest anisotropy of polari-
zability would produce changes in the Interaction energy upon alteration
of the relative positions of solute and solvent molecules. On this
basis, benzene and p-xylene would be expected to show deviations on

- 121
the log T-Pi plotSo In these molecules the polarizability differs
appreciably in the planes parallel and perpendicular to the carbon
ringo Similarly^ the aromatic solute^ have a variation of molecular
polarizability in the planes parallel and perpendicular to the ring,
and by the same argument might be expected to exhibit similar be-
haviour*
Since the molecules in the liquid state are in continuous
motion, owing to the Brownian movement,,the approximation of treating
them as spheres of mean polarizability may not be too seriousc
Effectively, each molecule experiences an averaged pblarizability of
its near neighbours owing to the flucutation of molecular positions
with time. Thus , to a first approximatibn, the mediurn surrpMnding
the polar molecule can be regarded as being of uniform polarizability
The log x^Pi plots would then seem to indicate cases of specific in-
teractions, i,e. hydrogen ii^onding or donor acceptor interactions and
may prove valuable in studying molecular interaction«
In terms of equation (3.15) one interpretation of the linearity
of the log x-Pi plots is that the activation volume for solute re-
orientation does not change on changing the solvent. This assumes
that the pre-exponential term,.A, remains constant on variation of
the solvent. Thus, if A can be assumed to remain constant for a

- 122 -
particular solute, then an explanation for the poor correlation be-
tween relaxation time and viscosity can be advancedc
Viscosity, like dielectric relaxation, has been treated as a
rate process. The associated activation energy can be determined
from a plot of log n against 1/T since Eyring (2) has shown that:
Be AE*.
VI S
where
f lOWc
is a constant and AE VIS
s the activation energy for viscous
Employing the concept of internal pressure Gee (27) has shown
that the activation energy for viscous flow AE IS related to the * vis
activation volume AV* for the process by the following equation: vi s
AE vi s
AV*
It has been generally observed (28)(29) that activation energies for
viscous flow are usually larger than the corresponding activation
energies for dielectric relaxation. This holds both for dilute
solutions of polar molecules in non-polar solvents and for pure
liquids. The effect of the larger activation energy for the vis-
cosity process is to increase the activation volume relative to that
for dielectric relaxation in support of the suggestion that viscosity
processes involve both translation and rotation of molecules, whereas

123 -
dielectric relaxation involves only rotational motionsc
Sinha, Roy and Kastha (30) have measured the dielectric re-
laxation times and the viscosity of solutions of some rigid polar
molecules in hexane* benzene, and carbon tetrachloride at a number
of temperatures. From the data obtained, they calculated the
activation energies for viscous flow'and dielectric relaxation.
The corresponding activation volumes have been evaluated from
these data are given in Table (3.5) (See Table 3.5).
It is seen that in all cases the activation volume for
viscous flow is greater than that for the dielectric relaxation
process. The latter is seen to be approximately the same for
solutions in benzene and carbon tetrachloride. For hexane solutions,
howevan, bromobenzene and m-dichlorobenzene have higher activation
volumes than in the other two solvents. Chlorobenzene, however, has
the same activation volume in all three solvents. Since hexane has
the smallest internal pressure of the three sol vents, any small error
in AE^ will produce a correspondingly larger increase in AV^ hence,
the hexane volumeswi11 be subject to larger errors which could
account for the discrepancy.
When the activation volumes for the three monohalobenzen^in
Cc^rbon tetrachloride solution in table 3.5 are compared, it is seen
that AE^ and AV* increase as the size of the molecule increases. £

ACTIVATION E
NERG
IES,
VOLU
MES
FOR
SOME R
IGID M
OLEC
ULES
. - 123«'-
4+ > <3
a o
o>
"o
o o
O)
o
-rt- > LLJ <]
rO O
to u
O)
(U
O) >
o CO
cr* CNJ ro
o
OJ
o
LO
m CO
C\J
o CO
cr>
CM CO
LO
LO CO
CM
O CO
cr>
CM CO
LO
LO CO
CM
o CO
<T>
CM CO
CM
CM
CO
CM
CO LO
CM
O O
VO
O
<U cz to X (U zc
CM
CT>
O
cr> CM
CO
00 cr>
LO
(U £=' cu N C O) CO
o o
<u c: to X (U
LO
CM
LO
O) -C 03 M e cu CO
CM
LO
CM CO
CO
o>
CO CM
LO
CM
LO
O CM
CM
C_> CJ)
CU c fO X 03
<p LO
CM I—
03 cr <u NI cr 03 CO
CO CO
03
o CO
03 £= 03 M C 03 JO O s- 3
03 C 03 M S= 03 JO O S- o
o
03
03 M
03 JO 0
1 S-. CO
cu c 03 N c 03 JO O S- O
O
o I e
«=t*

TABL
E 3.5
continued
124
CO
> o o (U o
-H- u o <D O E
to •r— >
I r— 0) ro I— O O
E
-tt- u> LU <3
<V >
CO O
<u
CVJ
o CO
Ch
CNJ CO
CM
o CO
CT>
CM CO
o CO
<u ■M O CO
CO
CM
LO CM
CO
<3J sz <u N c <u CQ
(U c. (U N c Qi JZi O S- o
0 •r— Q
1 o
CO 00 LO
CM
CT>
CM
CO OJ CM
<U sz Qi
^ M I—" C O <U C_3 DO
<U c <u
o
fO JE: 4-> O. fO c: o s- 0 x: c_>
1 &

- 125 -
indicating til at the volumes swept out by the molecules in their re-
orientation process increase a? the molecular size increases.
Davies and Edwards (21) have observed a similar linear relation-
ship between the activation energy for the reorientation process and
the volume swept out by the molecule for four polar molecules dispersed
in a polystyrene matrix. In viewof this correlation, it was decided a *'■
to examine the relation between these two pj|rameters for some dilute
solutions of rigid aromatic molecules in p-xylene measured by Hassell
(22)^and Mountain (32)^in this laboratory.
The volumes swept out by the dipole rotating through 180° about
the two axes perpendicular to the molecular moment, corresponding to
in-plane and out-of-plane rotations, were calculated. Since the ppint
about which the molecules rotate is unknown, volumes were calculated
for rotation about the centre of mass, the centre of symmetry, and the
centre of the aromatic ripg, of the molecules. The volumes of re-
volution were assumed to be cyTinderSci For rotation about points
otheif" than the centre of symmetry, the swept volume is composed of
two half-cylinders, the radii of which were taken to be the^aximum
lengths of the molecule in each direction from the potnt of rotation,
and the cylinder lengths to be the length of the molecule in the
direction parallel to the axis of rotation (fig. 3,12). All di-
mensions used in these calculations were taken either from Courtauld

- 126 -
F\G- 312. VoLvjt^e. OUT A f^O-TATnsGr
nOLE CUL^iS .
127 -
molecular models or scale drawings constructed from known bond
lengths and van der Waal’s (9i) radii. The volumes are not con-
sidered to be more accurate than ±10%. Graphs were plotted of
activation energy against rotational volume about the X axis V , X
the Y axis V and the mean volume, V = V +v /2 J for rotation Y mean x Y
about the three centres. Activation energies are considered no
more accurate than ±0.3 kcal. mole , Figs. I3, 14 and l5 show
V again AE^ for rotation about the three points considered, mean ^
In all cases it was found that p-chlorotoluene fell off the plots.
As this molecule is intermediate in size, between iodobenzene and
p-bromotoluene, both of which fall on the plots, it will be assumed
that its activation energy is subject to a larger error. In general^
the plots for rotation about the X axis were not as satisfactory as
those for the mean volume and Y axis volume. For rotation of the
X axis about the three points, it was found in all cases that 0-
diiobenzene and m-diiodobenzene fell off the plots in addition to
p-chlorotoluene. However, these ty^p compounds fell on the plots for
the mean volume and Y axis rotational volumeo
From the figures it can be seen that there iSj within the limits
of measurement, a linear relationship between volume swept out and the
activation energy. This supports the hypothesis that the energy barrier
has its origins in the work done by the solute in displacing its
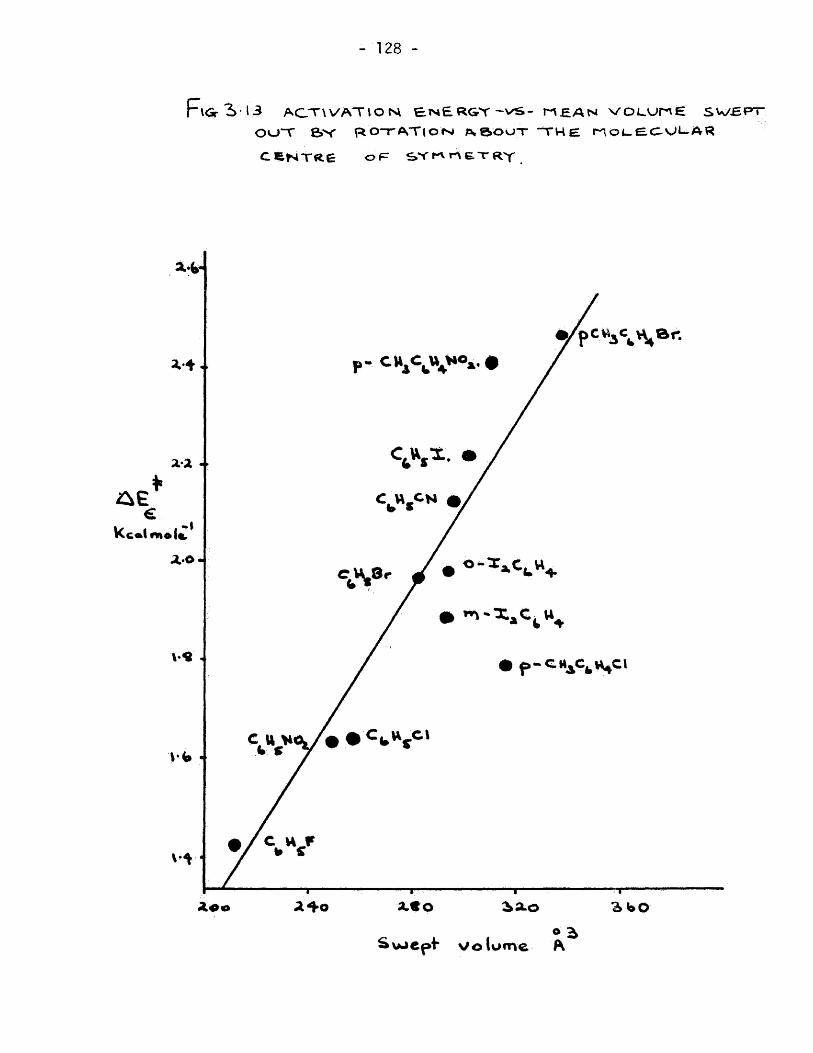
128 -
Ft<5r3> l3 ACT\VATlOrs\ l^HAN \^OLUn£ SWBPIT
OOT BV RO“rATlois» A.BOUT "THe rnOi-e.C-Ul-AR
C^MT«.6 OF^ SVI-vr^ETRY .
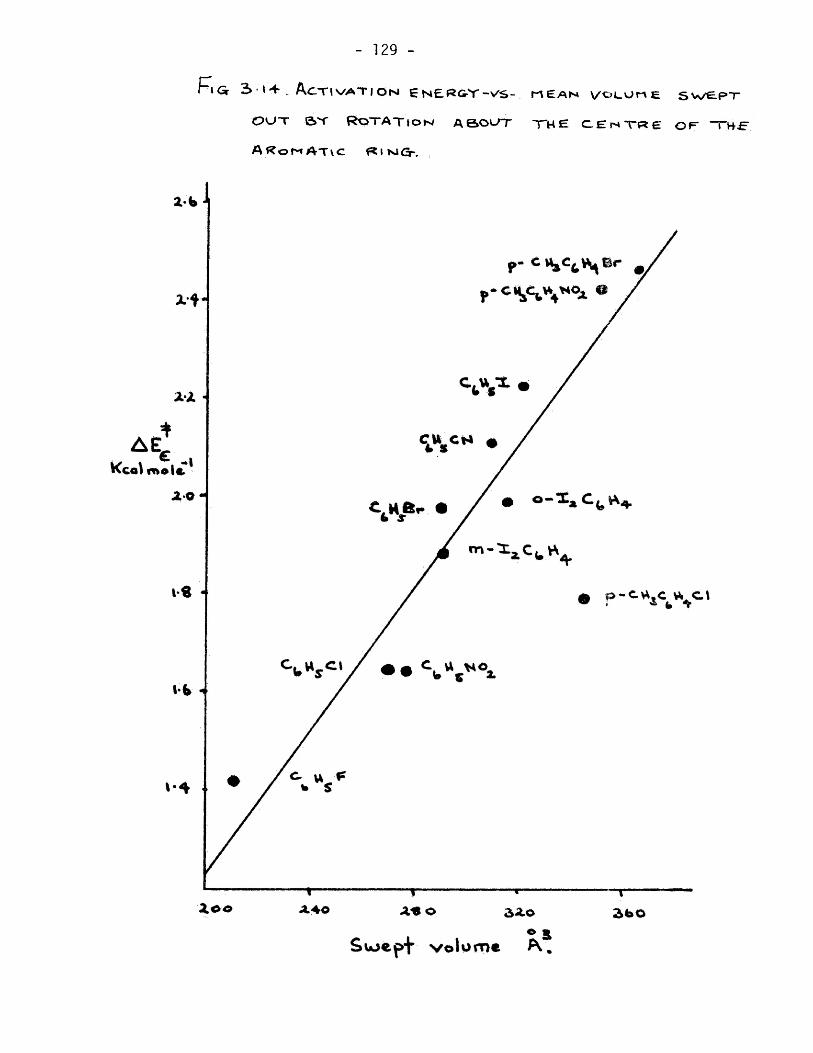
EN£f^&Y-vs- n£AH v/oLor\E swe.px Fi 3> •»-f . ACT
OUT BT t^QTATlOiNf ABOUT TH H C.Er>*T«e OE
Af?oMAT\C fSiKlO-.
rHf

- 130 -
P\Gr 5*15' Ac-rw/q-riors nHAN \/OUUr\£ S\A/£'PT
OUT SY ROTAT»OM A£5>OUT ~r»4^ r^oi^BC.uLAtZ
i-nA-SS.
>^clomc

- 131
solvent environment. Based on this data alone, however, it is
impossible to determine about which of the three centres the
molecule rotates in solution. It is useful, however, to compare
the activation volumes with the mean volumes swept out by the
molecules rotating about the three centres. These data are given
in table (3.6). (See Table (3.6)).
The activation volume is seen to be considerably smaller th^n
the calculated volumes swept out. In fact, the average ratio
V /V for rotation about three points considered is of the swept oiit ^
order 6.8±1. As the swept volumes were calculated for rotation of
the dipole through an angle of 180° , this ratio suggests' that the
molecules rotate through a relatively small angle during fheir re-
orientation. ■;It thus appears that when the molecule gpmps from one
equilibrium position of orientation to another, this involves a
small change in the position of the molecule relative to the in-
itial position.
^ Although table (3.6) shows the activation energy to increase
as the size of the molecule increases in a particular series, it
cannot be expected to increase beyond a certain limit, for, as the
activation volume for a mole of solute approaches the molar volume
of the sol vent, the activation energy for thf reprientation process
wil1 approach the heat of vaporizati on of the sol vent;
The solvents commonly used in dielectric relaxation studies

CO
MPA
RIS
ON
OF
AC
TIV
ATI
ON
VOLU
ME
WIT
H M
EAN
VOLU
MES
- 132 -
<u r— o
01 s~ c +3 .f^: E s- OJ o
Of o
<u
O >> OJ
0) col 5 4J E OT ^ C E >
^ O CO
a. O)
§
o CO UJ Ql h- z:. LU O
LU LU O'
CO
E <a <u
0> CO i~ (/}
-»-> CO E E O O o >
o o E
o o
o CO c
o
00
■E o
^ o; > E •r- 3 4-> r- U O C >
E I o<H> u 0) •I- LU r— 4-> O to >, E > o>
•f— E r— ■M 0> fO O E O
CC LU ^
OJ 4-> 3 p™ !0 CO
r> OJ
Lb
OJ Lb
CO
CO CJ>
CM
Lb Lb
Lb CXD
00 O OJ
o CM CM
<P CM
CM
CO
O OT
CO
LO
LO
Lb CM
00
LO
CO or
0> r— Lb 00
OJ
LO
CO
00
CO LO
O CO Lb LO OT o 00 f“ CM I—■
LO
Lb
LO
Lb OJ
00 Lb
LO
CO
OT
CO CJT
LO CO LO 00
I— 00 CM CJT O CM O CM CM CM
CJT
<!• CO
LO
00
CO
CM
Lb
LO CM
CJT
00 CM
CO.
CM OJ
CO
CO OJ
CO
OJ r— CO CO
00
LO CM
to
•Sj- CM
<u E: OJ N E 0) JO
g o
Lb o c t>
r— CM
01 E <U (U E N 0> E N 0) E JO 0) O JO S. O Q E
r-*- O J= S. O QQ
CM
CM
Lb
<U E <U IM E 0)
o tJ 0
0) E OJ N E
CM
0
00 LO • e
r— CM CM
CJT
.2 ■£ O s-
E O N E OJ
00
0) E OJ (U 0) E E 3 0> oT
r-i 3 3 q 1-^ I— +j q q o 4-> +3
o o o E
I— o ■«-> ^ S- Cb CO z
OJ E (U N E (U
o io
CO
o CM
©£ cr- 0 N E (U
JQ 0 tJ O
Q I
133 -
-1
have heats of vaporization of the order of 8 - 10 KcalsMnole
Activation energies for the molecular reorientation process, however*
rarely seem to exceed 3KcaL mole for dilute solutions. Again this
would suggest that the activation volume is small compared to the
volume of the solvent molecules. When the solvent is nujol, which is
composed of a mixture of large molecules, the activation energies are
often (33)(34) found to be much higher than those observed for the
solvents having smaller-sized molecules,
Powell, Roseveare,and Eyring (38) have found that the heats of
activation for viscous flow are of the order of 1/4 to 1/3 of the
heat of vaporization of the liquid. For non-polar unassociated liquids.
the molecules of which have approximate spherical symmetry, the ratio
is close to 1/3, but for polar molecules, and otners differing from
spherical symmetry, e,g,long chain hydrocarbons, the factor is closer
to 1/4, It then follows from this observation that the iictivation
volume for viscous flow is of the order of 1/3 to 1/4 of the molar
volume of the liquid.
No such simple relationship would seem to exist for dielectric
relaxation activation energies for dilute solutions. From the data
given in Table 3.6 it was seen that within the limited series ex-
amined the activation volume increased as the size of the solute
134 -
molecule increased. Consequently, the ratio of the heat of vapori-
zation of the solvent to the activation energy for dipole relaxation
decreases as the size of the solute increases.
A further comparison of dielectric activation parameters and
molecular volume functions is given in Table (3.7)., The molecular
volumes were calculated by the method of Edward for an Avagacjro number
of molecules; swept out volumes are mean values, as defined previously,
for rotation of the dipole about the mplecular centre of symmetry
through an angle of 180°. (See Table 3.7).
Although the size of ^11 these molecules is larger than the
benzene derivatives given in Table (3.6), it appears that the acti-
vation volumes and energies are similar. For the steroids the
androstane derivatives have Smaller molecular volumes and smaller
volumes swept out in comparison to the cholestane derivatives. The
two steroids which have their dipoles inclined to the long axis of the
ellipsoid have the smaller volumes swept out because of the symmetry of
the molecules about this axis. Rotation about an axis perpendicular to
the long axis sweeps out a much larger volume than rotation about the
long axis. Activation energies for these compounds are not considered -X-
to be more accurate than ±0,5 Kcal mole which gives an error of -1 '
±7cc mole in;the activation volume. For these compounds the acti-
vation energy is then approximately constant. Similarly, the activation
volume shows little variation from one molecule to anotherbut the
volume swept out increases in the order 5a-androstan-3:17-dione <
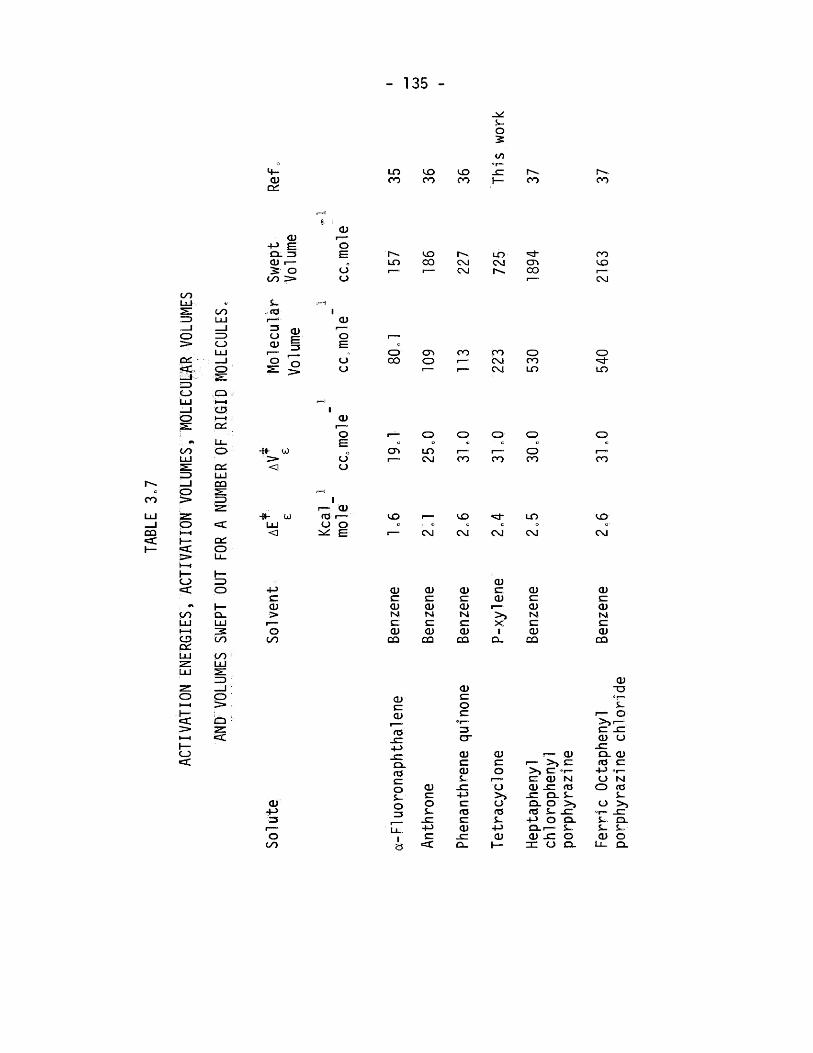
ACTI
VATI
ON
ENER
GIE
S, A
CTI
VATI
ON V
OLUM
ES .
HO
LEC
OpR
VOLU
MES
- 135 -
_v;
o 3.
<U LT> CO
LO CO
LO CO CO CO
O) •f-> e Q. 3 QJ «— 3 O
CO >
(U
o
o u cn
LO oo OJ
CM
LO CM
■d"
oo
CO CO
CM
CO
C_3
,«a
o Q)
(U (U
O
U o o oo o
CO CO CM CM
o CO
o LO
Q :i—I
t—t pc: u_ o QC UJ 03
-W- W '> <3
0) O
o o <T> LO
CM
O
CO CO O CO
o
CO
Qd O
-H- OJ UJ c
r-^ QJ ro r— u o VO
CM
VO
CM CM
LO
CM
VO
CM
O. LU
CO
CO UJ
4J c <u => P“ o
CO
CD c cu M c O)
OO
O) c (U IM c cu
CO
O)
(U IM
CU CO
(U c= (U
I Q-
CU cz CD M C CU
oo
cu c CD NJ c cu
oo
a
cu 4->
■3
o CO
cu c: CD
fO
Q. fO or o S-' o 3
<u c o S-.
-cr +j
cu c o c 3 cr
<u c CD S-
or fO
cu Q-
CU
CJ
S' s-
4-> CU
i~f“ flj I— >>-cr >> C -r- cr CU N cu jc: 03 ^ Q. OL O >> 03 S-. ^ -POO. Q-.— i. cu jr: o re o o.
(U jsr a. 03 -p o o CJ
H S-, cu p
orp
hyr
azin
e c
hlo
rid
e

AC
TIV
ATI
ON
EN
ER
GIE
S,
AC
TIV
AT
ION
VO
LUM
ES
; M
OLE
CU
LAR
VOLU
MES
4-
O) cm
- 136 -
s- o s.
<u 4J E Q- 3 0) r— s o
oo >
O)
"o
o o
Lf>
CM CO
o CM Ln
ir>
oo
o MJ
S-. «3
(— 3 CU
E <L> 3
I—
O O
<u o E ci o
o CO CO
LO
CM LO CM
Q I—I
CJ H—I cm
4f UJ > <i
<U
’o
u u CO
LO CO
CO CO
CO CM
cm LU CO ■ft- (jj
LiJ <1
I— CD (XS r— u o
E CO
CM CM
LO
CM
00
cm CD U-
h- CL,
CO
CO LU
Q 21' CC
<v >
o CO
<u ■4->
■3 r” o
oo
<u e O)
"S'
QJ C. 0
”r~ T3
1
CO i £=
4-> tn 0 u
TD c «a: 1 s
LO
(U c <D
g* I
Q-
O) c 0
1 CO
I c to
+J «/) 0 s-
TD c
<C 1 25
LO
<U C <u r~
g> I
o.
<u c: 0
<u sc <u -a ns
4-> (/) 01
o x: o
as sc <u
I—
g* I
a.
(U c: o
CO
sz ns
4-> Ui <U
o
o &
LO

137 -
3 5 5a-androstan-3-one < ’A cholestadiene-7-one < Sa-eholestan-S-oneo
These data indicate that the angle through which the dipole rotates
decreases in the same-order as the volume swept out increaseso
A similar situation is found for the first six molecules of the
table which are flat and disc-like in shape„ When the two ring naph-
thalene structure is compared to the three ring enthrone, both an
increase in activation energy and volume swept out is observed» A
similar increase is found for the two molecules^enthrone,and
phenanthrene quinoneo In this case, however, the molecular volume
increases slightly, whereas the increase in the volume swept out is
almost as large as going from a-fluoronaphthalene to enthrone. The
three remaining disc-like molecules have similar activation volumes
to phenanthrene quinone but considerably larger volume swept outc
Thus, for these molecules, the activation volume becomes a
decreasing fraction of the volume swept out and the size of the
angle through which the dipole jumps appears to decrease in the order
fluoronaphthalene - enthrone phenanthrene quinone > tetracyclone >
heptaphenylchlorophenyl porphyrazine > ferric octaphenylporphyrazine,
chloride.
The ratio of activation volume to volume swept out by the mole
cule in rotating through 180° should give the approximate angle
through which the molecule has jumped. This is shown in Table (3,8)

138 -
TABLE 3.8
APPARENT ROTATIONAL ANGLE OF VARIOUS MOLEOULESo
Solute Solvent Apparent rota-
tional Angle.
a-Fl L^onaphthalene
Anthrone
Phenanthrenequinone
'Tetracyclone
5a-Androstan-3:17-dione
5a-Androstan-3-one
A-Cholestad1ene-7-one
Benzene
Benzene
Benzene
P-xylene
P-xylene
P-xylene
P-xylene
P-xylene 5a®ChoTestan-3-one
Heptaphenylchiorophenyl porphyrazine Benzene
Ferric octaphenyl porphyrazine Benzene
chloride
22*^
24^
26®
IJ^
23®
18®
11.4®
5.3®
2o9®
2o6®

139 -
For the first molecules the apparent angle of rotation
is approximately constants However, when the molecular size in-
creases and the volume swept out increases, the angle becomes
very much less= For the last four molecules the angle is very
sfiaTl and simflar to what might be expected for Brownian rotation
diffusion. Hence, when the volume swept out becpmes sufficiently
large to make the apparent rotational angle small, the jump
mechanism approaches the Brownian rotational diffusion model
assumed by Debye,
In conclusion it would seem that dielectric relaxation pro-
cesses can be best explained in terms of a model in which the
dipole jumps over an energy barrier which separates two equilibrium
positions of orientation. The energy of activation of the molecules,
obtained by molecular collision, is expended in doing work against
the internal pressure of the molecules surrounding the relaxing
unit. Such a model is able to predict the effect of solvent on
the relaxation time of a molecule, except when the solvent is
carbon-tetrachloriide, A study of the variation of relaxation time
with the solvent and construction of a log x-Pi plot can give use-
ful information on the possible existence of specific solute-
solvent interactions.

-140 -
When the polar solute is sufficiently large and its dipole
is located such that it sweeps out a large volume pf solvent
during the course of its rotation, then the apparent angle
through which it jumps is small and its behaviour approaches
that of the Brownian rotational diffusion model assumed by Debye.
CHAPTER THREE
APPENDIX
Introduction - 141
In view of the good correlation found between internal pressure
and log Y for dilute solutions of polar molecules in non-polar solvents
it was decided to examine this relationship for some pure liquids*
Discussion
It was found that compounds which constituted an homologous
series all fell on the same line of the log'V -Pi plot. The plots are
shown in figures 3A, 3B, 3C^and 3D.
Fig. 3A shows the plots for the n-alkylhalideSoThe non-
linearity of these is not perhaps surprising in view of the complex
behaviour of these molecules. It is seen that when the halogen atom is
changed from chlorine to bromine to iodine different curves result.
From Fig„ 3B it is seen that the position of the halogen atom is changed
or a methyl group is substituted into the side chain then such molecules
deviate from the curve through the n-alkyl compounds. Hence, compounds
only appear to fall on a particular line when they are chemically and
structurally similar.
When the plot for the alkyl substituted aromatic compounds^
Fig„3C^is compared with that for the halogen derivatives^Fig.3D^it is
seen that the slope of the former is negative. Similarly, except in
the case of the n-alkyl chlorides^negative slopes are obtained for the
alkyl halides. The apparent negative activation volume may indicate
that in the activated state a decrease of the volume of the system
occurs^indicating that the molecules are more closely packed in this
state. However, the sign of the slope may be of no absolute significance
since it merely indicates the relative rate at which molar volume and
heat of vaporisation change within a series of compounds. Thus, if the
molar volume increases > ^ series, at a greater rate than the heat
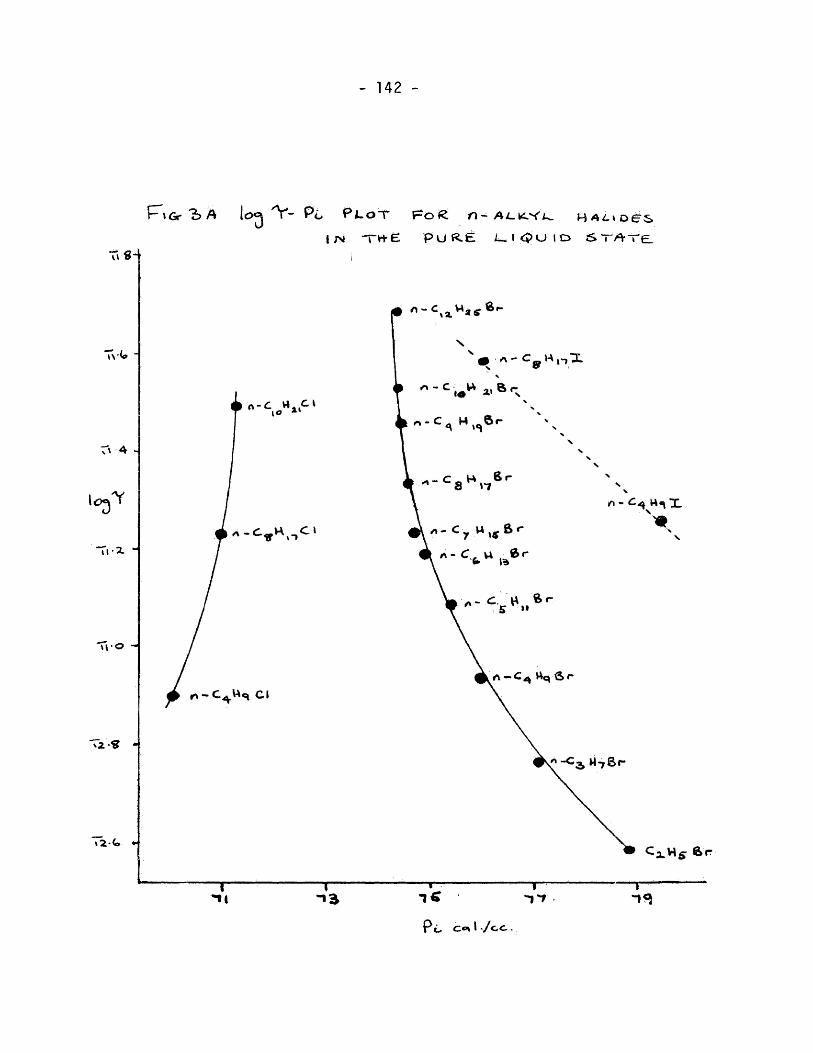
142
FiCr A
T»
Po ^LOT
ijs -TH-e
P^oiS n-A/*K‘<k. HAi,»oes
Put^E L*i4>uio ST*/v-re_
T\(»
4
lo^'Y
“TrX
Ti-o
“T — r ■"—r- r”— —p-^ 'll -na “1^
Pi. C*nt-/cc..

143 -

144 -
Fia "SiO ^LOT FOR sofAF swe>sT<-roTeD
RoMAtk^ MOi.ECULeS lA^ “Ttt£. L.«cpOtD
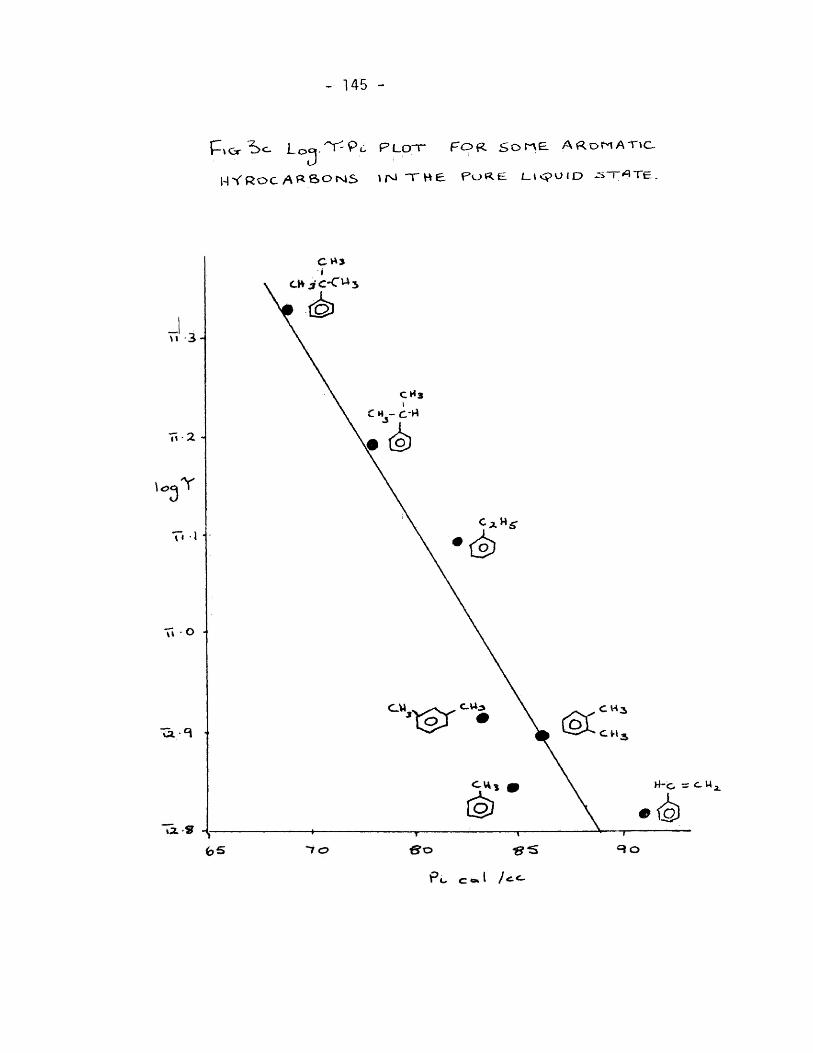
- 145 -
f-»Cr
H Y Roc A ^ SOTMS
PLOT” FOR sorve AROMATIC,
"THF Po«.e Lt<?OiO ^TATE,

- 146 -
of vaporisation then the internal pressure decreases as the molecular
size increases^and a negative slope is obtained.
That such regular plots are obtained, for the pure liquids
examined, again supports the hypothesis that the barrier to the
rotation of the molecules is due to the work done against the internal
pressure of the medium,
Bhanumathi (40) measured the activation energies for dielectric
relaxation of a number of pure liquids and accounted for the energy
barriers in terms of dipole - dipole interactions. She considered
only Keesom and Debye forces and neglected any contribution from
dispersion forces.
Equations 3A and 3B give the interaction energies for Keesom
and Debye, Ej), terms:
E = 2 3A ^ r'6kT
E„ = -2 3B
" —
the symbols have the same meaning as for the interaction terms
described previously, Bhanumathi determined the activation energy
from the slope of a log ^ T against 1/T plots. She found that such
plots were linear indicating A to be independent of temperature.
However, examination of the above equations for the interaction terms
shows that E^ is temperature dependent. Furthermore^r will be
expected to change with temperature hence, the agreement between the
measured and calculated values would seem to be somewhat fortuitous.
Both Keesom and Debye terms account for dipole - dipole
interactions , however, Frbhlich (10) has stated that if the dipolar
particles are interacting with one another that an exponential rate

147 -
of decay of polarisation will not be observed. This follows from equation
(3.8). If the particles are interacting with one another the transition
position Ni. Under such circumstances 3.8 is non-linear and cannot
be solved by exponential functions. A straight line relationship
betweenitf^T and 1/T would not be observed when dipole - dipole inter-
action was present. As Bhanumathi obtained linear plots this refutes the
postulate that the energy barrier is due to the interaction which she
considered.
it would seem that a more reasonable explanation for the energy barrier
could be formulated in terms of the work done, by the reorienting unit,
against the internal pressure of the liquid.
number of particles in the equilibrium
As the plots of log^Y against internal pressure are linear.

Appendix

148 -
Experimental Results.
Dipole moment data
Solutions in p-xylene at 25®C
Solute wt fraction e 0
3y5^4ChoTestadiene“7-one 0 2.263
0.02798 2.401
0.04071 2.461
0.05089 2.509
0.06200 2.566
0.06988 2.602
5a-Gholestan-3-one 0 2.263
0.01060 2.298
0.02180 2.319
0.03184 2,344
0.04580 2.379
0.06246 2.425
5a-Androstan-3:17-dione 0 2.263
0.01097 2.303
0.02142 2.337
0.03046 2.369
0.03726 2.393
0.04629 2,425
2.229
2.2320
2.2350
2.2356
2.2372
2.2383
2.2288
2.229
2.2293
2.2296
2.2302
2.2323
2.2290
2.2299
2.2310
2.2320
2.2344'
2.2344

Die
lect
ric
Con
stan
t >an
d Lo
ss D
ata
- 14 9 -
o
o
o
fO a
tn f6 0)
«/> (O CD E
>> o sz 0) N =3 3= crtD <U
■5- M-
O
C o
4-> 3
O CO
00 o o
o CM
CM
CO o o
CD
tr>
CM
CM
o
o
CD
CM
CM
"!d- LO o
LO CM LO LO o o
CD
CD
LO CM
CM
CM CM CO
CM
LO LO o
LO -5S- LO oo oo
CM CM
LO O LO LO o o
CT> CM CO
CM
LO I— LO
CO CO
CM CM
CM CM
LO Co
LO CM
CU SZ 0
1 !>>;■
■ ^ i 0>
■ sz
-a fO
i/) CD
CO <Ti
CO CM
O CT>
O CO
LO CT>
00 cr»-
CM <u o sz CL) O
0 XZ X O I
1 Q. <l
LO m
CO
CM
O O
LO CO CM
CM
CM
O
CD
CT>
CM
CM
o
CD
LO 00 CM
CM
LO
O'
CD
LO
CM
LO 00 o
00 o
o CO o
LO CO
CM
CO o
•St 00 CO
CM
o 00 0‘
cr> o
CM
LO
o
LO CO
CM
LO 00 CO
CM
LO o
CM
CM CM
LO CO
LO CM
CU sz 0
1 r>. i (U sz <D
T3 (SS 4-i to 0)
CD
<l LO
CO
00 CD
CO CM
o CD
o CO
LO CD
o
CU o sz CU o
>> II X
CL CM
CO r— o
CD
00
CM
CM
LO
O
CD
CO
CM
CM
D
o
CD
D r»v CM
CM
D
o
CD
LO 00 CM
CM
D D O
O O
CO D O
CO
CO
CM
CO o
00 o
CM
D D o
LO CO
CM
D O
LO
CO
CM CM
00 CO
CM
CM CM
LO CO
LO CM
0) SZ 0
1 - cs.
■I (U sz CU
°r~ •o «d
+-> to CD
O I
<l LO
A CO
00 D
CO CM
o D
O CO
LO D
D 00 O LO
<D O £= CD O
>> X
CM 5
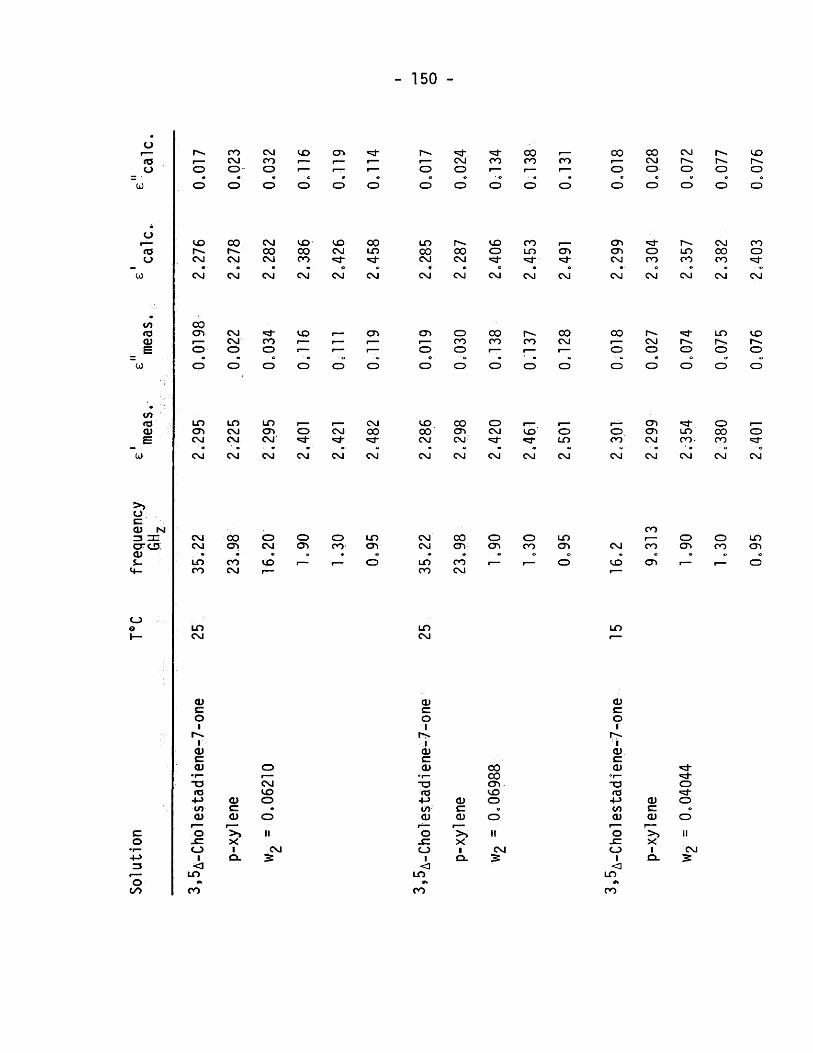
- 150 -
ro a
<o o
I/) ra QJ E
to to <u
>> o E, <U N 3 OC CTCD; <u
.5-
O 9
o •r“ •4->
O
o o
to CSJ
• - CVJ
00 <T»
O
O
LO <T»
CM
CM CM
LT> CO
LT5 CM
O E 0
1 <u E OJ *o to ■M to 01
O I
<1 LO
CO
CO CM o
00 r>. CM
CM
CM CM CD
LT) CM CM
CM
00 O
CM CO O
VO CTv
CM 00 CM
CM
CO CD
SO 00 CO
CM
VO
VO 00 CM LO
CM CM
<Ti
LO cy> CM
CM
O
CM
CM CM CO
CM CM
O CM
O as
o CO
LO cr>
CO so CM r—
r— O
CM VO a o E <u o
ii X I CM Q- S
I— CM o o
LO 00 00 CM CM
CM
CJ^
VO CO CM
CM
CM CM
LO CO
LO CM
(U E O
l>s 0) E CD
•o to
+-> to- <u
o JE CD
<3 LO
0%-
CO
CM
O I— CO O O
00 cr> CM
CM
00 cr> CO CM
O) E <U
r—
X I
CL
CO 00 CO
VO o
CM
00 CO
CO LO
CM
CO
CO
o
CD
CM
CO CM
o CM
CM
VO «!d-
CM
o LO
CM
O CD
O CO
LO CD
I— O
CO 00 CD- VO O
CM
00
o o
CD CD CM
CM
00
o o
o CO
CM
CM
VO
LO
d) E 0
I r>.
1 d) E O)
*o rd 4-> to <u
CD i <
LO A
CO
00 CM O
o CO
CM
CM o
CD CD CM
CM
CO
CO
CD
0) E CU
X
W2
= 0,
0404
4 1.
90
2.35
4 0.
074
2.35
7 0.
072
1.30
2.38
0 0.
075
2.38
2 0.
077

T*C
freq
uenc
y .'m
eas.
^"m
eas.
^'c
alc.
^"ca
lc
- 151 -
I
C\J CT> UD VO ^ CO ID Od CsJ CO CO CO
I— cy>
Od CM
00 o ^ I— ^ ID CO CO CO
CM CM CM CM CM CM CM CM CM CM
i— CM cr> CD CM CM
CM CM
O CM CO
CM
CO CO
CM
CD
CO
CM
CO CO o r<. I— CM CO p>. VO VO o o o o o
ID ID LD I— ^ CM CO VO VO LD O O O O O
CO ID VO o O r— LD VO O O O CD O
CM VO CM
CM
ID VO CM
CM
ID CO CO
CM
CM VO CO
CM
VO
CO
CM
CM
CM
OD
CM
CO CM CO
CM
O 'd- co
CM
LD ID CO
CM
CO 00 CM
CM
00 CD CM
CM
r< CM CO
CM
'!d- co
CM
LO CO
N
D
CO r- O O LD
CM CO CO
CO O r- O CM CO OS
VO OS r— I— VO
CO
C3S
o CO
ID OS
CM CM
LD CO
O CM
VO
O CJS
O CO
LD OS
LD
CO o LD
LD
O) ..c 0
1
■ -i <u c <u
Ofmm
t3 tKS
■M V> <U
'o
o '<]
LD
CO
"O
O
oy o c d) o
X I
Q.
II
CM
<U c Q
d) c <u
“r- *T3
4-> cn <u
*o o
<3 LO
•t CO
0) £ 0)
X I Q.
O 'd' O
CM
<u c 0
1 CO
ra 4-> </> (U
CD I
LD
VO
CM VO
<U O c <u o
I Q.
CM

152
o
o
fO o
w
(/> (O cu
{/) (O 0)
>> u sz O) N 3 DC GTCiJ OJ -s.
o 0
c o
o 00
o o
VO
CVJ
CM
00 o o
cn
CM
CM
CM CM
LO CO
on CM
0) c 0 1
CO
ta
to <u
<_5 I ej in
o
o
o
00
CM
VO
o
o
00 CM
o LO o
00 LO o
o o
00 o CO
CO CM ro
00 CO CO
LO CM
CM
O
CO
VO LO CM
cr> o
LO LO o
00 LO o
CM CT> CM
00 O CO
CO CM CO
CM
LO
O
CD
LO 00 CM
CM
CM
CT>
O
O
o 00 CM
•
CM
CM
VO
O
CM
LO LO O
CM
O VO O
CM
00 O O
CO
CO
CM
CT> CM CO
CM
CO
CO
CM
LO CM
• CM
CM
LO
O
CD
CO VO CM
CM
CM
LO O
CM
CO LO O
CM
cr> LO o
VO CT> CM
CM
o CO
CM
CM CO
CM
o CM
CO r” CO
o cr>
o CO
LO cr»
CM CM
O CM
O CT>
O CO
LO
VO cr» I— o LO CO
LO
I— CO
VO r-
vo
CM VO
(U O C <U O
>> X I Q.
II
CM
(U c o CO
c ro +-> v/> 0>
CD I & LO
CU c <u
r— >> X I Q.
VO
CM VO O
CD
II
CM
o o
CO CO CM
CM
O 0
o
o
CM
CM
OO O O
CT> CO CM
CM
CM CM
LO CO
O LO
(U a 0 1
CO I
sz ro •D to- (U
CD I 3 LO
CM
O
CD
LO «o- CM
CM
O CM
r>. 1—^ «st- LO o o
CM LO O
C>. r>. CM
CO cr> CM
CM CM
CO o •O' LO o o
o CO
CM
CO LO o
r». CM
CM
cr> CM
CM
o
CO
CM
o CT>
o CO
LO CTt
VO I—
VO «o- CM VO
cu o c: cu o
I Q.
II
CM

So
luti
on
T®C
freq
uen
cy
- 153 -
o
fO o
o
etS ■ u
to fO O) E
V) fO <u
00 c\j O r— o o
Nl ■in CD
1^ V£> CVJ
CM
hv. CO CM
CM
O
CD
-CT> CO CM
CM
CT>
o sd- o
oo oo o
o
CD
o
CM
CM
«=d- i— CM o o
CO CO
CM
CM LO o
CM LO CO
CM
CO
o
o CO CO
CM
CO CO O
CM
CM
CO CM
CM
00 CO CO
CM
LO CO
CM
CM VO CO
CM
CM CM
LO CO
LO
CO
00 cr> CO CM
o CM
CO
o o CO
LO
<u c 0
1 CO
I sz <T3
t/i 0 u
-O c.
<c 1 s
LO
cu c <u
X
o CO
CO o
CM
<T> o o
LO LO CM
CM
o
o
CD
00 '5d‘ CM
CM
CM
O
CD
CO LO CM
CM
O
CD
cr»
CM
CM
CO
O
CD
CT> LO CM
CM
O CM O
cr> CO o
CO o
CM o
CO CM CO
CM
CO
o
CO CO CO
CM
CO CO O
00 CO CO
CM
00 CM O
CO
CM
CM
O CM CO
CM
CM CO CO
CM
00 CO CO
CM
CM CM
LO CO
O LO
CO CT>
CO CM
O CM
CO
O cr>
o CO
LO cr»
OJ c 0 t
CO 1
c. (C 4- i tn 0 5-
“O sz
<3: 1 Q
LO
CO
CO <L» O c O) o
>i X I
Q. CM
CM
O
CD
CT> CT> CM
CM
CO
O
<D
CT> CM
CM
O
O
o CO
CM
CM CM O
LO CM O
O r>«. o
CO o CO
CM
CO CM o
CO cr> CO
CM
o
CM
CO
CM
CO
CM
CT» CO
CM CM
LO CO
00 <Ti
CO CM
O CM
CO
O cn
cu £= o
or- ~a
r~
CO
«T3 +-> to o
■o c:
a to
CT) CM CO
CU o c: cu o
>» X I Q.
CM 2

Sol
uti
on
T®C
freq
uen
cy
- 154 -
rO- O
O
O
U)
(/) rO (U
CO cb (U
N zc .■ CJ5
O VO O
cn
o
f—
CM
CD O
O CO
CSJ
o ID O
CM O CO
CM CM
O CO
ir> cr>
•5j-
o o
CO C30 CM
CM
CO
O •« o
00 CM
o CM O
00 CM O
CO O
O I— LO ccj- O O
LO 00 CM
CM
CM O
CT> CO CM
CM
00 CM O
CM 00 CO
CM
CM CO O
CJ> CTt CTk O CO ^
CM CM
CM CO LO •b' O O
00 <T» CM
CM O CO
CO 00 CO
CO o O I—
•b"
CM CM CM CM CM CM
CM CM
LO CO
LO CM
CO CT»
CO CM
O CM
CO
O o CO
LO
CD c 0
•■ifr ro
1
CO I c (C -M
0 S.
*o c
<c 1 £3
LO
d) £= O)
X I
Q.
<T» CM CD
O
CM
O
o
OJ
CM
o
CD
CM
CM
CO
CO
cr>
o CO
(U c- o o >> o (O s-
4-> CD
LO
O
CD
00
CM
CM
LO
O
O
CM CM
CM
00 cn CO
<u c cu
X I p.
CO CO o
CO CO o
CO o
o CM «b-
CM
CO CO o
CO LO CM
CM
CM CO o
o CO CM
CM
CO o
«5t- CM
CM
CO LO CM
CM
CO CO CM
CM
CD C7V
O CO
CO CO CM O
CM
0.95
2.26
5 0.
029
2.26
5 0.
028

- 155 -
(O u
fO o
v> (O Q} E’
OJ
VO to <v
Ui
>> O" B'' <U IS) -3 =C crco <u i-
o o
o CO
o
o
o
CO CO CSJ
CM
O
O
'sJ- CO CM
CO r— o CD
CO CO CM
CM
O
CD
co CM
CO O
CO CO o
CO CD
O O
Ln LO CM
CM
CO CD
CO CO CM
CM
CO CO O
CO
CM
CM
CM CO o
tr> CO CM
cr» CO CM
r>. CM
CM CM CM CM CM
CO
CO
ao
o CO
CO
CO
o Of>
o CO
to cy»
0)
o CO CO CM o O O)
r— B • o <u o >» U >> II to X i- I CM
4-> Q_ 5 tv
CO as CM
CM
CO o o
CM o CO
o
o
o
cn CM
CM
CD
O
CD
o CO
o CD
O O CO
' • CM
o
CD
CD
I— cr> CM
CT» LO o
CO LO o
CD
o
CO CO
CM
CO LO o
CO
CO
CM
CO LO CD
CM CD CO
CM
CD
O
LO CO
CO
CO
LO <D CO
CM CM CM CM CM CM
CM CM
LO CO
LO
CO Ch
CO CM
o CM
CO
O CD
O CO
LO CD
f— O
0) B O
CO
to 4- > CO 0 5-
■o B
«a: 1 £5
LO
(U B <V
1 o.
o CO "sd" CO o
CD
II
CM
o o
CD CO CM
CM
o r— o CD
o CD CM
CD
CD
CD CO CM
9 CM
LO
O
CD
I— CD CM
to
O
CD
O CD CM
CM
CM O
LO LO o
CO
o
CD CO
LO CO
CM
VO LO CD
CM
CO
CM
O LO O
CO CO CO
CM
LO
O
LO CO CM
CD
CO
CM CM CM CM
LO LO CO
CM
CD r>«. CO
CM
CM CM
LO CO
LO CM
CO CD
CO CM
O CM
LO
O CD
O CO
LO CD
CD B 0
1 CO
i B to +J in 0 s,-
“O B
<c 1 S3
LO
CU B CU
X I
OL
o VO
CO CD
CD
II
CM

156
(O u
p
w
(/>
OD
«o 01
(ji
s> c 0) N =i:ac cro 01 &.
M-
O 9
c d
44
00
o ♦
o
ro VO cvj
CM
o CM O
CM O
CM CO O
VO VO CM
CM
CO CM O
CM 1*^ CM
CM
CO O
CT» sJ-
O
VO CO
CM
O to O
o o
CO r>. CO
* CM
CO
o
CM CO O
O 00 CO
CM
CO o
CM
CM .-O '
CM
to r>. CM
CM
00 CM
CM
VO CO
CM
00
CO
CM
00 CO
o CM
00
P
o
CM
CM
00
O
o
CM « -
CM
VO CM O
CO O
CM
O
CO CO O
VO CM O
O O
CM
CM
rv. CM O
O VO CM
CM
to CO O
CO CO
CM
o
VO
CO
CM
CO o
VO CO
CM
1*^ CM O
O CM CO
CM
00 O O
Cp
O
CD
CM CO
CM
O VO CM
CM
on to CM
CM
CO CO
CM
lO CO CO
• ' CM
<!■
CO
CM
CO
CM
CD 'O CD
O CM CO
CM
LO
O
CD
CO CM CO
CM
r—“ O
CD
CO
CM
CO CO o
CO
CO
CM
CO CO o
CO
CO
CM
CM CM
lO CO
to
CO
Ov o CM
o o> o CO
lO o>
CM CM
00 o>
o CM
CD CT)
O CO
LO CT»
CM CM
00 CT»
O CM
O CT>
CO VO CM r—
r- O to CO
CD lO
CO VO CM I—
LO CO
LO
CO
CO LO CM 1—
O)
g I
rs,
CO I c to
4-> (/) O u •o
25 LO
cr> CM LO
0) o C <u o
s* I
II
CM
OJ c o •i- 10
• *. CO
c fO 44 cn O
«C I 25
LO
o> CM LO
o> o c 0) o
5- I
OL
II
CM
<u c 0
°r- m 1
r>K
CO I c to 4-» V) o s.. -a
& LO
<u c p
>i X I o. <u c:
<0 x: 44
LO CO O CM Vm ' ,C2)
OJ C-- <u
(O x: 44 x: Q. <o C £X
<0 c ^
LO CM
CM a
CM

Solu
tion
T®C
freq
uen
cy
- 157 -
<o u
w
(O u
(/>
O)
w
O) <o O)
N HI ■ o
00 CM O
CM CM O
CO 00 CO
00 00 CO
CM
CM o
CM
CO CM o
CM 00 CO
CM
CO 00 r> CM
O CO
IT) <T>
CO
O
CT> CM 00 00
• O
II
T5
Q.
cj
00 CO
• o II
cr
o o
o o CO
lO
o
CO
CO CO o
00 CM o
CM CM O'-
o CM CO
I— CO CM CM CO CO
CO r>. CO
CO 00 CO
00 00 CO
CM
00 O O
CM
P>>.
CO ♦
CM
O
CO
O CM CO
CM
C^l
•5f-
o
CO
r>
CO
CM
CM
CO CO o
CM CM
CO CM CM O O
00 1^ CO
CM
CM 00 CO
CM
CO 00 CO
CM
CM CM
00 cr»
o CM
o CT»
o CO
LO cr>
in CO
LO
CO
dj
■M I
IS.
CO I
c: <u
in 0 ss
■a c
1 <3
CO CM
CO I-™ r— O
0) id
FT^ >> X
I CL I
<D C d)
to JZ 4^ SZ CL <tJ C
LO CO O CM
■ O Q
II
<u c
"na SZ 4-> SZ 'CL to
CM rs CM o
CO
II
CM
CO
a
o> CM 00 CO
CO
II
T3
O-
C_)
00 CO
CO
II
er
CO o o
CM LO CM
CM
CO o o
LO LO CM
CM
O CM
CO
LO
CO
o o CO
CO LO CM
CM CO o
CO
CM
CM
CO
o
o
LO LO CM
CM
CM
CM CO O
r«. CM
CM
CO
CO
C3^
O a\
<D c o
r— o >» o to +J O)
cu c d)
p~ >> X
CL
o CO CO CM o o
II
6si
LO CO o
LO CO CM
CM
LO CO o
LO CO CM
CM
o CO
0o95
2.29
5 0.
036
2.29
7 0.
035

158
<& o
to
U)
</> to o
U)
ui to a> E
>>■ o c <D N 3 a: crca 2
o o
I 3
*0 CO
o CO O
O CO o
o CO o
CM o
LO CM o
00 CM CM
CM
O CO o
CO CM
CM
O CO O
CO CM
• CM
O CO O
^ 00 ^ «5|* CM CM
CM
00 CM O
CM
LO CM O
CTi CM CM
CM
CO CM
CM
cr> CO CM
CM
C»
CM CM
CM CM
O Ln rs.
o VJO
o o>
f— o
o
0)
(0 S-. •M 0)
<D C Q)
L
CO 00 CM O
CM 2

- 159 -
Suggestions for Further Work
The dependence of relaxation time on internal pressure for a
particular solute in a number of solvents was examined only for small
solvent molecules. It would seem that further examination of this
relationship for a wider range of solute and solvent sizes would be of
value. In particular it would be valuable to study the relaxation times
of solutes dissolved in the two decalin isomers. The number of large
solvent molecules which are liquid at reasonable temperatures is not
extensive but it may be practical to make measurements in liquid
naphthalene and biphenyl.
When a sufficiently large frequency range becomes available
it would be valuable to measure the steroids in other solvents.
Measurements on solutions of these molecules in n-hexane, cyclohexane,
methylcyclohexane, p-xylene, benzene and dioxane would give a reasonable
range of internal pressure variation.
Little work seems to have been done in the solvent carbon
disulfide, probably because of the objectionable nature of the compound^
but, it has an internal pressure of the order of 100 cal cc“^, and since
the molecule is small such measurements may yield useful information.
No use has been made in this thesis of the intercepts of
the Ipg vs. Pi plots or the log^Tvs. 1/T plots. The reasons for
this being this being that in the former case the absolute magnitudes
of the relaxation times were in doubt and in the latter case greater
coverage of the absorption range of the molecules would have been
necessary in order to obtain more accurate^ values. However, a
comparison of the A factors from both the pressure and temperature plots
would seem worthwhile and may provide valuable information on the

behaviour of molecules. 160 -
As several of the rate expressions discussed in Chapter 2
involve the moment of Inertia in the pre-exponential factor accurate
evaluation of the log plot intercepts, and attempts to correlate this
with moments of inertia would seem to be of value. In this laboratory
Mountain has found a correlation between the relaxation time and
which is suggestive.
If a relationship between A and the molecular moments of
inertia can be found then information may be obtained on the axis
about which the molecules rotate. Large molecules, with considerable
differences in moments of inertia about different axeSjWould be suit-
able for such a study. The biphenyls would seem useful^ systems,since
the position of the molecular moment can be varied>to cause rotation
about different axes, and the moments of inertia should be considerably
different for rotation about the long and short axes. All these factors,
which contribute towards understanding the nature of the pre-exponential
term of the rate" equationswould assist in the understanding of the
dielectric behaviour of polar molecules.

BIBLIOGRAPHY
161
lo W. Kauzmann, Revs, Mod. Physics JA, 12, 1942.
2. H.Eyring, J.Chem.Phys. 283, 1936.
3. S. Glasstone, K.J.Laidler, and H.Eyring, "The Theory of Rate
Processes", McGraw-Hill, New York 1941*
4. M.Davies, and C.Clemett, J.Phys. and Chem.Solids 1^, 80, 1961.
5. "Dielectrics" Transactions of the Faraday Society^XLllA, 1946.
6. D.H.Whiffen, and H.W. Thompson, Trans.Far.Soc., 42A, 114, 1946.
7. E. Bauer, Cahiers de Physics, 20, 1, 1944.
8. JfD. Hoffman, and H.G.Pfeiffer, J.Chem.Phys. 132, 1954.
9. "Molecular Relaxation Processes", Chemical Society Special
Publication, No.20, 1966.
10. H. Frohlich, "Theory of dielectrics", Oxford University Press.,1958.
11. J.H. Hildebrand, "Solubility of non-electrolytes". Reinhold
Publishing Company, 1936.
12. C.P. Smyth, J. Phys. Chem. Solids, 40, 1961.
13. R.C. Miller and C.P. Smyth, J. Amer.Chem.Soc. , 22.> 1961.
14. J.H. Hildebrand, and R.L. Scott, "The Solubility of Non-
electrolytes", Dover Publications Inc., New York, 1964.
15. J.Y.H. Chau, R.J.W, Le F?vre, and J. Tardif, J.Chem. Soc.
2293^1957.
16. K. Chitoku, and K. Higasi, Bull. Chem. Soc. Japan, 3^, 1066, 1963.
17. M.D. Magee, Ph.D. Thesis, University of Aston in Birmingham, England«
18. K. Higasi, "Dielectric Relaxation and Molecular Structure"^
Hokkaido University, Sappro, Japan, 1961.
W.F. Wyatt, Trans.Far.Soc., 2^, 429, 1928.
Ph. Tranyard, Bull. Soc. Chim., 1^, 981, 1945
19.

162 -
20. U. Eichhoff, and F.Hufnagel, Z, Naturforschg., 630, 1965.
21. H. Hase, Z.Naturforschg., 63, 695, 1953.
22. W.FT Hassell, Ph.D.Thesis, University of Aston in Birmingham,Eng.
23. K. Chitoku and K.Higasi, Bull. Chem. Soc. Japan, 773, 1967.
24. R.J.W. Le Fevre, and C.G. Le Fevre, Reviews of Pure and Applied
Chemistry^ 201, 1955.
25. R.W. Kiser, "Introduction to Mass Spectroscopy", Prentice-Hall
Inc., 1955.
26. A.L. McClellan, "Tables of Experimental Dipole Moments", W.H,
Freeman^1963.
27. G. Gee, Trans.Far.Soc., 42A, 160, 1946
28. G.S, Kastha, J. Bhattacharyya, and S.B. Roy, Indian J. Phys.
313, 1967.
29. A.J. Petro and C.P. Smyth, J. Amer. Chem. Soc. _79^, 6142, 1957.
30. B. Sinha, S.B. Roy, and G.S. Kastha, Indian J. of Physics,
j^, 101, 1966.
31. M. Davies, and A. Edwards, Trans. Far. Soc. 2163, 1967.
32. P.F. Mountain, Ph.D. Thesis, University of Aston in Birmingham,Eng.
33. O.F. Kalman^and C.P. Smyth, J. Amer. Chem.Soc., 783, 1960.
34. E.N. DiCarlo, and C.P. Smyth, J. Phys.Chem. 1105, 1962.
35. F.K. Fong and C.P. Smyth, J.Amer. Chem. Soc. 548, 1962.
36. D.A. Pitt, and C.P. Smyth, J. Amer.Chem.Soc., 80, 1061, 1958.
37. D.A. Pitt, and C.P. Smyth, J. Phys.Chem., 6^, 582, 1959.
38. P.C. Powell, I.J. Roseveare, and H. Eyring, Ind. Eng. Chem.
33, 430, 1941.
39. G. Williams, ref. 9,

40. - 163 -
A. Bhaniimathi , Indian J. of Pure and Appl.Phys. 1^, 79, 1963.
41. P. Debye, "Polar Molecules", Chemical Catalogue Co. New York,1929.
42. A.J. Curtis, P.L. McGeer, G.B. Bathmann, and C.P. Smyth, J.Amer.
Chem. Soc., ljk_y 644, 1952.
43. C.P. Smyth, Proc. N.A.S., 234, 1956.
44. C.P. Smyth, J. Phys.Chem., 580, 1954.
45. E. Fischer, Phys.Z, 645, 1939.
46. K. Illinger, Progress in Dielectrics 37, 1962.
47. N.E. Hill, Proc. Roy. Soc., A240, 101, 1957.
48. E. N. DaC^Andrade, Phil. Mag., IJ, 497, 1934.
49. R.J. Meakins, Proc. Phys. Soc. (London), _7^, 283, 1958.
50. N.E. Hill, Phys. Soc. (London), B67, 149, 1954,
51. W.F. Hassell, and S.Walker, Trans. Far. Soc., 2695, 1966.
52. F. Perrin, J. Phys.Radium, 497, 1939.
53. A.Budo, E.Fischer, S. Miyamoto, Phys.Z. 337, 1939.
54. A. Budo, Phys.Z., 706, 1938.
55. A.E. Guggenheim, Trans.Far.Soc. 45, 714, 1949.
56. N.L. Allinger, and M.A. DaR,ooge, Tetrahedron Letters, 676, 1961
57. J.T. Edward, Chem. Ind. (London), 774, 1956.
58. H.R. Nace, and R.B. Turner, J.Amer.Chem.Soc,, 75, 4063, 1953.
59. N.L. Allinger, H.M. Blatter, M.A. DaRooge, and L.A. Freiberg,
J, Organic Chemistry 2550, 1961.
60. F. Huffnagel and H.Klip, Z.Nat. 18a, 769, 1963.
61. N.E, Hill, Proc. Phys. Soc. (London), 67B, 149, 1954.
62. J.Timmermans, "Physico-Chemical Properties of Pure Organic
Compounds" Elseviere Publishing Co. Inc., 1950.

- 164 -
63. R.D, Nelsoiij and C.P. Smyth, J. Phys.Chem. ,68, 2704, 1964.
64. R.J.W. LeF^re^and E.P.A. Sullivan, J.Chem.Soc. ,2873, 1954.
65. H.G. Holland, and R.J.W. LeFevre, J.Chem.Soc. 2166, 1950^
66. A.Spernol^and K.Wirtz, Z. Naturfor3chg., 8A, 522, 1953.
67. A. Gierer, and K. Wirtz, ibid. 532, 1953.
68. M.D. Magee, and S. Walker, J. Chem. Phys. 2580, 1969.
69. C.J.F. Bottcher, "Theory of Dielectric Polarization", Elsevier
Publishing Co., 1952.
70. C.P.Smyth, "Dielectric behaviour and Structure", McGraw-Hill,
New York and London, 1955.
71. K.S. Cole^and R.H. Cole, J. Chem. Phys., 9_y 341, 1941.
72. A. Budo, Physik, Z., 39, 706, 1938.
73. W.F. Hassell, M.D. Magee, S.W. Tucker, and S. Walker,
Tetrahedron, 2137, 1964.
74. W.P. Purcell, K.Fish, and C.P. Smyth, J.Amer.Chem.Soc. , S2^y 6299, 1960.
75. T.J. Buchanan, and E.H. Grant, British J. App. Phys., _6, 64, 1955.
76. M.W. Aaron, and E.H. Grant , Trans .Far .Soc., 59^t 85, 1963.
77. S.E. Keefe,and E.H, Grant, Review of Scientific Instruments 39,
800, 1968.
78. "Microwave Theory and Measurementts" Editor I.L. Kosow, Engineering
Staff of the Microwave Division, Hewlett-Packard Company, Prentice-
Hall In., N.J., 1962.
79. A.R. Von Hippie, "Dielectrics and Waves", The M.I.T. Press, 1966.
80. C.P. Smyth, "Dielectric Behaviour and Structure", McGraw-Hill,
N.Y. and London, 1955.
81. K. Dobriner, E.R. Katzenellenbogen, R.N. Joties, G. Roberts^and
B.S. Gallagher, "Infra-red Absorption Spectra of Steroids, An Atlas"
Vol.I. Interscience N.Y.

- 165 -
82. ibid, volume IX
83. L.F. and M.Fieser, "Steroids", Reinhold Publishing Corporation,
N.Y., 1959.
84. C.W.N. Cumper, A.I.Vogel, and S.Walker, J.Chem.Soc., 3621, 1956,
85. J. Grossleyj and S.Walker, Can. J. Chem. 847, 1968.
86. A*G. Schering (Heinz Dannenberg and Adolf Butenandt^inventors)
Ger, 870, 407. (Chem.Abs.» 1958, 20262i)
87. Prelog et.al., Helv. Chim.Acta., 618, 1941.
88. Z. Ruzicka and R.Rosenberg, Helv. Chim. Acta., 336, 1936.
89. A.E. Serett, J. Amer,Chem.Soc., 68^, 2478, 1946.
90. F.J, Thaller, D.E. Trucker^and £,I. Becker, J.Amer.Chem.Soc.
23, 228, 1951.
91. Tables of Interatomic Distances and Configuration in Molecules
and Ions", Special Publication Number 11, The Chemical Society
of London, 1958.
Related Documents