HYPOTHESIS Open Access Some considerations for analyzing biodiversity using integrative metagenomics and gene networks Lucie Bittner 1† , Sébastien Halary 2† , Claude Payri 3 , Corinne Cruaud 4 , Bruno de Reviers 1 , Philippe Lopez 2 , Eric Bapteste 2* Abstract Background: Improving knowledge of biodiversity will benefit conservation biology, enhance bioremediation studies, and could lead to new medical treatments. However there is no standard approach to estimate and to compare the diversity of different environments, or to study its past, and possibly, future evolution. Presentation of the hypothesis: We argue that there are two conditions for significant progress in the identification and quantification of biodiversity. First, integrative metagenomic studies - aiming at the simultaneous examination (or even better at the integration) of observations about the elements, functions and evolutionary processes captured by the massive sequencing of multiple markers - should be preferred over DNA barcoding projects and over metagenomic projects based on a single marker. Second, such metagenomic data should be studied with novel inclusive network-based approaches, designed to draw inferences both on the many units and on the many processes present in the environments. Testing the hypothesis: We reached these conclusions through a comparison of the theoretical foundations of two molecular approaches seeking to assess biodiversity: metagenomics (mostly used on prokaryotes and protists) and DNA barcoding (mostly used on multicellular eukaryotes), and by pragmatic considerations of the issues caused by the ‘species problem’ in biodiversity studies. Implications of the hypothesis: Evolutionary gene networks reduce the risk of producing biodiversity estimates with limited explanatory power, biased either by unequal rates of LGT, or difficult to interpret due to (practical) problems caused by type I and type II grey zones. Moreover, these networks would easily accommodate additional (meta)transcriptomic and (meta)proteomic data. Reviewers: This article was reviewed by Pr. William Martin, Dr. David Williams (nominated by Pr. J Peter Gogarten) & Dr. James McInerney (nominated by Pr. John Logsdon). Background Studying biodiversity Improving knowledge of biodiversity will benefit conser- vation biology[1], enhance bioremediation studies[2], and could lead to new medical treatments[3]. However there is no standard approach to estimate and to com- pare the diversity of different environments, or to study its past, and possibly, future evolution. Part of the problem is that analyses of biodiversity require both a clear definition of the term biodiversity, e.g. what are the relevant units of biodiversity considered, and a con- sensus on the methods relevant to quantify these units. However, biodiversity is a complex notion, which raises multiple questions that can be addressed from distinct perspectives[4]. First, compositional[5] or element-based accounts of biodiversity[6] can inquire “What is there?”. Then, scientists describe the variety of life forms (or bio-specifics[6]) present in an ecosystem, such as the genes, organisms, species, clades, and communities. Sec- ond, functional[5] account of biodiversity[6] can * Correspondence: [email protected] † Contributed equally 2 UMR CNRS 7138 Systématique, Adaptation, Evolution, Université Pierre et Marie Curie, Paris, France Bittner et al. Biology Direct 2010, 5:47 http://www.biology-direct.com/content/5/1/47 © 2010 Bittner et al; licensee BioMed Central Ltd. This is an Open Access article distributed under the terms of the Creative Commons Attribution License (http://creativecommons.org/licenses/by/2.0), which permits unrestricted use, distribution, and reproduction in any medium, provided the original work is properly cited.

Welcome message from author
This document is posted to help you gain knowledge. Please leave a comment to let me know what you think about it! Share it to your friends and learn new things together.
Transcript
HYPOTHESIS Open Access
Some considerations for analyzing biodiversityusing integrative metagenomics and genenetworksLucie Bittner1†, Sébastien Halary2†, Claude Payri3, Corinne Cruaud4, Bruno de Reviers1, Philippe Lopez2,Eric Bapteste2*
Abstract
Background: Improving knowledge of biodiversity will benefit conservation biology, enhance bioremediationstudies, and could lead to new medical treatments. However there is no standard approach to estimate and tocompare the diversity of different environments, or to study its past, and possibly, future evolution.
Presentation of the hypothesis: We argue that there are two conditions for significant progress in theidentification and quantification of biodiversity. First, integrative metagenomic studies - aiming at the simultaneousexamination (or even better at the integration) of observations about the elements, functions and evolutionaryprocesses captured by the massive sequencing of multiple markers - should be preferred over DNA barcodingprojects and over metagenomic projects based on a single marker. Second, such metagenomic data should bestudied with novel inclusive network-based approaches, designed to draw inferences both on the many units andon the many processes present in the environments.
Testing the hypothesis: We reached these conclusions through a comparison of the theoretical foundations oftwo molecular approaches seeking to assess biodiversity: metagenomics (mostly used on prokaryotes and protists)and DNA barcoding (mostly used on multicellular eukaryotes), and by pragmatic considerations of the issuescaused by the ‘species problem’ in biodiversity studies.
Implications of the hypothesis: Evolutionary gene networks reduce the risk of producing biodiversity estimateswith limited explanatory power, biased either by unequal rates of LGT, or difficult to interpret due to (practical)problems caused by type I and type II grey zones. Moreover, these networks would easily accommodate additional(meta)transcriptomic and (meta)proteomic data.
Reviewers: This article was reviewed by Pr. William Martin, Dr. David Williams (nominated by Pr. J Peter Gogarten)& Dr. James McInerney (nominated by Pr. John Logsdon).
BackgroundStudying biodiversityImproving knowledge of biodiversity will benefit conser-vation biology[1], enhance bioremediation studies[2],and could lead to new medical treatments[3]. Howeverthere is no standard approach to estimate and to com-pare the diversity of different environments, or to studyits past, and possibly, future evolution. Part of the
problem is that analyses of biodiversity require both aclear definition of the term biodiversity, e.g. what arethe relevant units of biodiversity considered, and a con-sensus on the methods relevant to quantify these units.However, biodiversity is a complex notion, which raisesmultiple questions that can be addressed from distinctperspectives[4]. First, compositional[5] or element-basedaccounts of biodiversity[6] can inquire “What is there?”.Then, scientists describe the variety of life forms (orbio-specifics[6]) present in an ecosystem, such as thegenes, organisms, species, clades, and communities. Sec-ond, functional[5] account of biodiversity[6] can
* Correspondence: [email protected]† Contributed equally2UMR CNRS 7138 Systématique, Adaptation, Evolution, Université Pierre etMarie Curie, Paris, France
Bittner et al. Biology Direct 2010, 5:47http://www.biology-direct.com/content/5/1/47
© 2010 Bittner et al; licensee BioMed Central Ltd. This is an Open Access article distributed under the terms of the Creative CommonsAttribution License (http://creativecommons.org/licenses/by/2.0), which permits unrestricted use, distribution, and reproduction inany medium, provided the original work is properly cited.
examine what these elements are doing: “What is hap-pening out there?”. Here, the focus shifts towards themany functions fulfilled in the ecosystem. Third, a pro-cess-based perspective can address evolutionary ques-tions, such as: “How did these elements and functionsevolve?”. Studies thus concentrate on how diversity isgenerated and sustained by processes, such as mutation,recombination, lateral gene transfer, ecological pres-sures, and the like. These profoundly different view-points lead to distinct estimates of natural diversity,highlighting most important issues regarding the identi-fication and systematisation of biodiversity.The element-based perspective typically offers various
measures of biodiversity reflecting either the numberand/or the phylogenetic diversity of bio-specifics, ortheir complementarity in various environments[7,8]. Itresulted in multiple biodiversity indices serving differentpurposes[9]. In particular, Faith[6,10] suggested toaccount for the whole hierarchy of bio- specifics (fromlower-level genetic units to higher clades) and for withinspecies diversity. However, the inventory of species -and the inventory of elements in general - has been cri-ticized by philosophers for providing a static rather thana dynamic account of biodiversity, neglecting biologicalprocesses[11]. Element-based approaches cleave the eco-system into known static bits and pieces[12,13], whiledeeper analyses of natural variation require a more inte-grated and dynamic understanding of the processesaffecting the ecosystem as a whole[14]. Then, relevantestimates of biodiversity cannot only be based on indicesderived from lists of elements, they should also quantifythe likelihood that a given ecosystem, as a whole, willcontinue producing natural diversity[15]. Problemati-cally, details of the functional integration of the manyelements of an ecosystem, and of the evolutionary pro-cesses affecting their diversity, are almost always largelyunknown. Hence, practical (and quantitative) process-based studies of biodiversity have only recently gotunder way.Since no single perspective provides a satisfactory
account of biodiversity, confronting multiple approachescan suggest possible improvements in biodiversity stu-dies. Here we contrast two approaches that are amongthe many tools used for studying biodiversity: microbialmetagenomics[16] and DNA barcoding[17]. Based ontheir divergences, we propose an integrative approachaiming at the simultaneous examination (or even betterat the integration) of the elements-based, function-basedand process-based perspectives in biodiversity studies,thanks to massive sequencing of multiple environmentalmarkers. We argue that it should be preferred overDNA barcoding and metagenomic studies based on asingle marker for a variety of organisms for which thedefinition of species is ambiguous (prokaryotes and
eukaryotes alike). Finally, we discuss how network-basedanalyses of such molecular datasets could benefit biodi-versity studies.
The two diverging tracks of microbial metagenomics andDNA barcoding Species is not the relevant unit inmetagenomic studiesBoth studies of microbial metagenomics and DNA bar-coding initially adopted an element-based perspective ofbiodiversity[18]. They focused on the identification andthe quantification of compositional units rather than onthe processes sustaining the diversity (with, later, majorexceptions concerning metagenomics). Interestinglyhowever, microbial metagenomics and DNA barcodingdiffered in their units of interest.Microbial metagenomics is an assumed gene-centric
perspective, that consists of the direct sequencing ofenvironmental DNA[19]. It uses either one marker(sequenced at very high depth)[20] or many (generallyrandomly amplified)[21] to analyze phylotypes and/orfunctional categories[22]. Phylotypes are groups ofhomologous sequences (usually the 16 S rRNA) whosemembers share more than a given percentage of similar-ity (e.g. over 99% of sequence identity). They are definedto assign environmental sequences[23] to a taxon ofreference, by BLASTing[24] the phylotypes against data-bases of identified taxa[25,26]. This ‘taxonomic’ assigna-tion highly depends on the gene’s conservation acrosstaxa, the depth of the taxonomic sampling in the data-bases, the taxon richness and evenness in the environ-mental sample, the sequence read length and the impactof lateral gene transfer (LGT) in the environment and inthe reference database[27]. LGT is caused by processessuch as transposition, transduction, and conjugation.LGT results in significant variations in the gene contentof even closely related strains thriving in different envir-onments[28]. Consequently, a single gene, even the16 S, provides limited information about biodiversity[29-32], and does not necessarily allow reliable predic-tion of community metabolism, physiology, biochemistryand ecology[33]. Typically, different ecosystems thatcannot be distinguished by their phylotypes can be dis-tinguished by their functions[33].Importantly, microbial metagenomicists acknowledge
that phylotypes are defined ad hoc [27] in order toobtain discrete categories, usable in various calculationsof diversity (such as rarefaction curves or Chao1 esti-mates[8,9]). Likewise, environmental sequences arebinned into functional categories, based on BLASTsearches against reference databases[23,34] (KEGG[35],Pfam[36], SEED[36]). Such practical units aim at sam-pling the total genetic diversity to expand our knowl-edge of the gene content, functional significance andgenetic variability in natural communities[1,22,33]. A
Bittner et al. Biology Direct 2010, 5:47http://www.biology-direct.com/content/5/1/47
Page 2 of 17
key point here is that microbial metagenomics does notuse species as the standard unit to describe and toquantify biodiversity.There are good reasons for this choice: species pose
at least two major problems to microbial diversity stu-dies. First, species raise the problem of inter-approachpluralism[37]. Microbiologists studying prokaryotes donot adhere to a single (unified) species concept[37].Rather, they recognize different but equally legitimaterules (or ‘species concepts ’) to group individualmicrobes as members of a given species taxon[37].These rules rest on distinct criteria, many of which arebased on different evolutionary and ecological pro-cesses, capturing diverse important features of micro-bial diversity[38,39]. Consequently, there is noguarantee that individual microbes should always fallinto recognizable discrete groups, showing tight geno-typic and phenotypic similarity as well as genetic con-nectivity[40-43]. For a given set of individuals in agiven environment, this plurality of legitimate rulescan and does produce a plurality of valid incompatiblegroups[44-48] (Figure 1A). However, if different spe-cies concepts are used to assess the diversity in differ-ent environments, estimates of the number andcomposition of species are not directly comparable.Second, species raise the issue of intra-approach plur-
alism[37] in microbial biodiversity studies (Figure 1A).Even with a given species concept, one can sort thesame organisms into conflicting classifications, depend-ing on the empirical evidence at hand. In prokaryotes,this conflict in species definition is largely due to theprevalence of LGT. For instance, since recombination isusually limited to parts of a genome, the definition ofrecombining-species depends on which part of the gen-ome is selected[46,49]. Likewise, given the frequency ofLGT, and since genetic isolation occurs on a gene-by-gene basis in prokaryotes[49], different clusters of genesof an organism’s genome legitimately support different-uncoupled- evolutionary histories[37]. It affects theidentification of phylogenetic- species. Hence, in theabsence of a unified species concept, counting specieswill always be problematic, method-, marker-, and possi-bly sample-dependent. Instead, more precise operationalunits could be used to capture genetic biodiversity atmultiple levels, and ideally to reveal the evolutionaryprocesses taking place in an environment[38,39].
Species is the relevant unit in DNA barcoding studiesDNA barcoding contrasts with metagenomics. DNAbarcoding is currently mostly used on multicellulareukaryotes but with the ambition of studying the entirediversity of life. It is a minimalistic strategy, that hasaided taxonomic work and biodiversity studies, by sort-ing and clustering specimens collected in the field,
contributing to species discovery by flagging geneticallydistinct lineages. Barcoders sequence 400-600 base pairsof a single molecular marker (or barcode) with a strictuniparental inheritance[17,50], such as the mitochon-drial cytochrome c oxidase 1 gene[51], to divide life intosuch natural units. Comparative analyses of these bar-codes can serve to define species boundaries (althoughit is not their only use), and to study genetic diversitywithin these species. Pairwise distances (usually p-dis-tances) are inferred from the barcodes of all specimensunder study. Under the assumption that pairs ofsequences from a same species are more similar thanpairs of sequences from different species[50], the pre-sence of multiple species in a sample should produce acharacteristic barcode-gap[50,52], separating sequenceswith low p-distances from sequences with high p-dis-tances on an histogram of p-distances frequencies[52](Figure 1B). Such graphs are used to compute a minimalp-distance over which two sequences do not belong tothe same species. Alternative approaches use maximumlikelihood-based methods, models of coalescence andspeciation processes, to delineate groups of specimensbelonging to a same species from barcode sequences[53,54]. In both cases, these barcode-based species aretentatively assigned to a known species by comparisonwith sequences from previously recognized taxa[55] torefine estimates of intra-specific genetic variation. Inabsence of matches with reference species, each groupof specimens sharing very similar barcodes is identifiedand counted as a new species. Their monophyly on arepresentative gene tree is sometimes a further condi-tion[50,56]. Finally, in DNA barcoding, when suchgroups are proposed, no additional genes are generallyrequired to evaluate biodiversity. No functional analysisis achieved.In what follows, we won’t question DNA barcoding
first objective (i.e. to assign unknown specimens toalready recognized species, thanks to a DNA-library ofnamed specimens). This approach has the potential toproduce estimates of the genetic diversity withinaccepted species. Our claim will only concern DNA bar-coding second - exploratory- goal (i.e. enhancing thediscovery of new species, particularly in cryptic, micro-scopic and other organisms with complex or inaccessiblemorphology, considering that genetic-species could bedelineated based on the analysis of the genetic distancesbetween unassigned specimens, using the workinghypothesis that inter-specific genetic distances shouldhave greater values than intra-specific ones). More pre-cisely, the fact that DNA barcoding and microbial meta-genomics offer separate recipes to estimate biodiversityraises questions concerning which units and methodsprovide the most informative account of biodiversityusing molecules.
Bittner et al. Biology Direct 2010, 5:47http://www.biology-direct.com/content/5/1/47
Page 3 of 17
Presentation of the hypothesisThe pragmatical road to integrative metagenomicsDifferences in assessment of biodiversity by DNA bar-coding and microbial metagenomics may be reasoned bycontrasting their biological scope: microbial metage-nomics mostly studies prokaryotes[16] (affected byLGT) and DNA barcoding has yet mostly studied eukar-yotes[56] (resistant to LGT). Certainly, estimates of thediversity of elephants and the diversity of E. coli arepretty different questions. However, a deeper explana-tion of the differences between DNA barcoding and
microbial metagenomics probably lies in their distinctunderlying philosophies, with respect to the ‘speciesproblem’.
Identifying species problemsUnlike microbial metagenomics, DNA barcoding impli-citly endorses a unified species concept (USC). At firstlook, an USC offers a unique advantage: the possibilityof unambiguous definitions of species, and thus of infor-mative units that can be compared in biodiversity stu-dies. The most popular USC is the general lineage
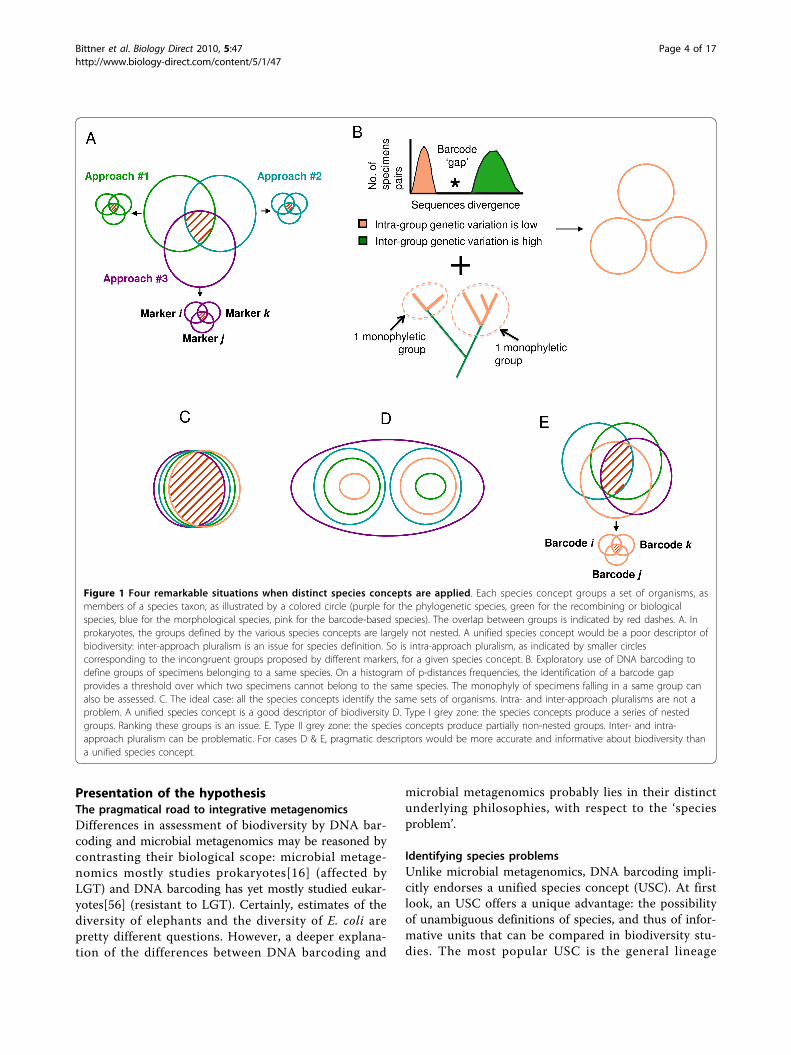
Figure 1 Four remarkable situations when distinct species concepts are applied. Each species concept groups a set of organisms, asmembers of a species taxon, as illustrated by a colored circle (purple for the phylogenetic species, green for the recombining or biologicalspecies, blue for the morphological species, pink for the barcode-based species). The overlap between groups is indicated by red dashes. A. Inprokaryotes, the groups defined by the various species concepts are largely not nested. A unified species concept would be a poor descriptor ofbiodiversity: inter-approach pluralism is an issue for species definition. So is intra-approach pluralism, as indicated by smaller circlescorresponding to the incongruent groups proposed by different markers, for a given species concept. B. Exploratory use of DNA barcoding todefine groups of specimens belonging to a same species. On a histogram of p-distances frequencies, the identification of a barcode gapprovides a threshold over which two specimens cannot belong to the same species. The monophyly of specimens falling in a same group canalso be assessed. C. The ideal case: all the species concepts identify the same sets of organisms. Intra- and inter-approach pluralisms are not aproblem. A unified species concept is a good descriptor of biodiversity D. Type I grey zone: the species concepts produce a series of nestedgroups. Ranking these groups is an issue. E. Type II grey zone: the species concepts produce partially non-nested groups. Inter- and intra-approach pluralism can be problematic. For cases D & E, pragmatic descriptors would be more accurate and informative about biodiversity thana unified species concept.
Bittner et al. Biology Direct 2010, 5:47http://www.biology-direct.com/content/5/1/47
Page 4 of 17
concept [57,58] of de Queiroz[59]. In that theory,species correspond to separately evolving lineages ofmetapopulations. The various rules defining diversespecies taxa (ecological, phylogenetic, biological, and soon) do not directly define the species boundaries. Theyonly capture distinct secondary properties of the species,providing operational criteria that emphasize differentprocesses responsible for some coherence betweenorganisms. The species boundaries can however bederived by analyzing how the groups defined by thesedistinct secondary operational criteria overlap. In parti-cular, if they all largely agree, the species is simplybounded by the intersection of the groups (Figure 1C).All the species members then share a common bio-chemistry, physiology, sexual behaviour, phylogeny, andecology. In that ideal case, a group of organisms identi-fied by DNA barcoding only provides a good proxy forthe species boundaries, and a valuable measure of biodi-versity. One might however wonder whether the differ-ent groups proposed by distinct secondary conceptsshould always largely intersect, and if not, whethercounting species, using DNA barcoding groups as aproxy, provides meaningful estimates of biodiversity.When different criteria support conflicting (or weakly
overlapping) groups of organisms, a ‘grey zone’ appears[58]. For us, two sorts of grey zones (Figure 1D&1E)strongly confuse species-based estimates of biodiversityattempted by DNA barcoding. First, when the varioussecondary properties defining the groups arose at differ-ent times in the process of speciation, the groups thatcan be proposed will be typically nested (Type I greyzone, Figure 1D). Such compatible albeit incongruentgroups have been very often reported in studies ofeukaryotic diversity[60-63]. Second, the different criteriacan define partly overlapping (e.g. not nested) sets oforganisms (Type II grey zone, Figure 1E). Many biologi-cal processes lead to this result, such as incomplete line-age sorting associated with very rapid or recentspeciations[61], introgression[51], hybridization andpolyploïdy[62]. Differences in organellar and/or nuclearevolution also produce legitimate disagreement betweengroups inferred using these two sources of characters,when nuclear and organellar genomes have distinct coa-lescence times [64], effective population sizes[65,66], orwhen biparental inheritance[67,68] and heteroplasmy[69] of the organelles is undetected. Moreover, in organ-isms and lineages with variable frequencies of sexualreproduction[63] and clonality[62], several combinationsof the migration rates[70], ranges and modes of disper-sal[63] equally generate non-nested genetic, morphologi-cal, ecological, and phylogenetic groups. Type II greyzones were notably reported in 17% of the 89 studiesconducted using phylogenetic and non- phylogeneticconcepts to analyze the diversity of multicellular
eukaryotes (e.g. grass, fungi, and metazoans)[60]. Impor-tantly, no such estimate has yet been compiled for uni-cellular eukaryotes: the level of incongruence betweengroups used to define the species boundaries may becomparable to that of multicellular eukaryotes, but thecorrespondence between DNA sequence clusters, eco-types and morphospecies is still largely unknown forprotists [61-63,70,71].
Dealing with species problemsType I grey zones confronts DNA barcoding studies ofbiodiversity to serious practical issues. Identifying bonafide species in such a continuum of groups withingroups poses the famous ranking problem, e.g. the needfor decision criteria to assign monophyletic lineages todistinct taxonomical ranks. Unfortunately, the USC, thatjustifies DNA barcoding approach, does not offer anyadditional operational criteria to decide where the spe-cies ends and starts[59]. A comparable conundrum wasfor thinstance met when biologists attempted to discri-minate species from varieties in the XIX century. Whenno real boundary but only arbitrary differences existedbetween the two, Darwin compared the ranking problemto defining the indefinable[59]. He concluded that we,not nature, draw divisions - and identify species - forpragmatic reasons.It is thus important to wonder whether DNA barcod-
ing operates pragmatic divisions, relevant for biodiver-sity analyses, and in particular defines species so theycan be compared between studies. Some considerationssuggest that it is unfortunately not the case. First, thereis no universal barcode[72-76]: different markers mustbe used for different organisms. Thus, biodiversity stu-dies cannot always compare like to like. Second, not alldatasets present a nice barcode gap, which affects thedelineation of groups. Moreover many artefacts producebarcode gaps, hindering the identification of bona fidespecies[76,77]. For instance, the threshold over whichtwo sequences are considered too distant to belong tothe same species is directly affected by the samplingeffort[61,78], and by the biology of the organisms understudy. In particular, issues of hidden paralogy, presenceof nuclear copies of mitochondrial genes[79], cases ofbiparental inheritance[67,68], variable coalescence times[80,81], unequal molecular evolutionary rates[82] andmigration rates[77] can bias groups definitions. Unlikephylotypes in microbial metagenomics analyses, units bywhich biodiversity is counted are not held constant inindependent DNA barcoding studies[83]. Typically, thepairwise distance corresponding to species membershipchanges with the sampling effort and between samples[50]. Thus direct quantitative and qualitative compari-sons of biodiversity estimates are not feasible, which ser-iously limits the evaluation of the extent and of the
Bittner et al. Biology Direct 2010, 5:47http://www.biology-direct.com/content/5/1/47
Page 5 of 17

evolution of biodiversity, across environments and overtime.Type II grey zones, which result from the genuine
identification of different types of lineages, caused bydistinct processes pose a different practical puzzle. Itextends the problem of inter-approach pluralism toDNA barcoding analyses. The USC leads to the identifi-cation of species that are actually heterogeneous interms of biological processes and structures. For thatreason, species have limited explanatory power[37]. Thegroups proposed by DNA barcoding approaches nolonger convey much information about the ecology,physiology, etc. of the species and about the processes(migration, interbreeding, adaptations, duplications,transpositions, etc.) sustaining these properties. Biodi-versity measures based on a single feature will unfortu-nately provide an unrepresentative estimate. The largerthe type II grey zone, the bigger the issue. Hence, itmight appear more pragmatic to devise additional unitswith explanatory and predictive utility, for instanceinterbreeding groups, ecological groups, smallest phylo-genetic groups worthy of recognition, to assess whatprocesses crucially maintain biodiversity[60,84,85]. Thissolution seems even more relevant if, for type II greyzone, the use of different barcodes produces differentgroups (Figure 1E). Such cases of intra- approach plural-ism may further distort biodiversity estimates in DNAbarcoding studies, since disagreement between barcodesis not unexpected[61,71,86].
Corallinales as a case-studyCorallinales are a worldwide distributed order of redalgae with calcite in their cell walls. They often repro-duce asexually via thallus fragmentation, direct asexualspores, produce unattached rhodoliths and grow onevery favourable substratum (i.e. shells, drifting woods,drifting algae). Delineating species within Corallinales isdifficult, because environmental conditions (such as thestrength of currents) impact their morphology and col-lected specimens are generally sterile. DNA barcodingapproaches were recently applied to small, geographi-cally restricted, datasets of Corallinales[87,88]. It wasreported that intra- specific genetic diversity was at leasttwice smaller than the inter-specific genetic diversitybetween already recognized morpho-species, suggestingthat DNA barcode studies could help discovering newspecies of Corallinales. However, analyses of additionalsequences from two markers (240 mitochondrial CO1genes and 495 plastidial psbA genes), mainly from SouthPacific Ocean (Additional file 1) unravelled both type Iand type II grey zone related issues for these taxa.For 206 specimens sharing these two markers, BCG
[78] and MYC[53] methods proposed inconsistentmethod-, locality- and gene-dependent estimates of the
number of Corallinales species present in the dataset.Methodological biases and artefacts (e.g. the use of anincorrect ultrametric tree in the MYC approach or of awrong model of evolution) can for sure explain some ofthe disagreement between methods (inter-approachpluralism). Yet, even for a given method the two mar-kers generally returned incompatible estimates (Table1). The closest assessments between CO1 and psbA pre-sented an average of 45% of groups with different speci-men contents. This intra-approach pluralism isproblematic because it was impossible to determinewhether and which of these incompatible groups maycorrespond to a unified ‘species’. Each group had alower degree of genetic diversity than that reported asbona fide intra-specific distance in previous studies[87-89]. All showed a comparable coherence in terms ofmonophyly and morphology, and a similar lack of geo-graphical coherence (data not shown). Partitioning thedataset by sampling sites also had a dramatic effect onbiodiversity analyses (Table 2). For both markers, histo-grams of p-distances comprising the entire datasetshowed no clear gap, while every site specific sub-sam-ple presented a gap, seemingly defining an unambiguouslimit for intra- and inter- genetic diversity (Figure 2).However, the genetic distances inferred from each siteto define a species were highly variable. Problematically,between localities, some inter-specific distances over-lapped with intra-specific distances (type I grey zone),and sometimes conflicted (type II grey zone)(Table 2).No standard threshold to define Corallinales specieswith CO1 or psbA could be proposed.Importantly, these inconsistent estimates can be
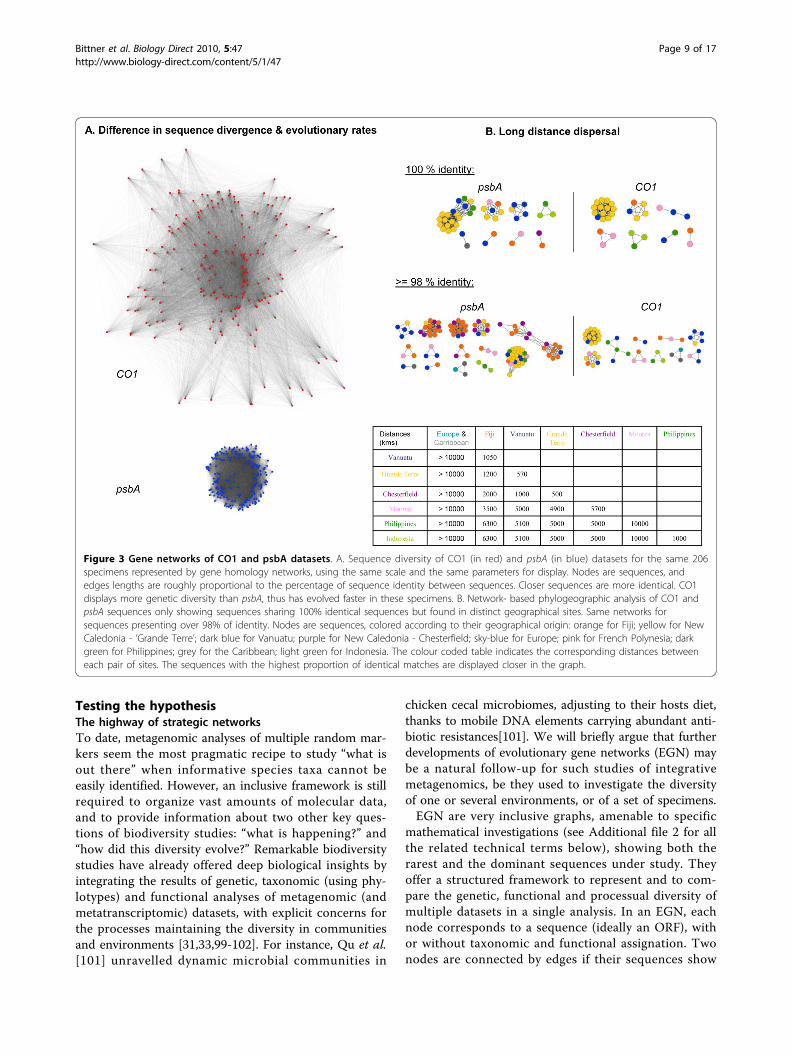
explained by different evolutionary processes, with oppo-site influences, that sustain Corallinales biodiversity. Onthe one hand asexual reproduction and somaclonalmutation tend to produce divergent lineages and shouldproduce congruent groups between markers; on theother hand, many other processes tend to mix genomesand should produce incongruent groups between mar-kers. First, CO1 and psbA had different rates of evolution(Figure 3A). The fact that more species were generallydetected with CO1 than with psbA, although these twomarkers had equally resolved phylogenies (41,6% ofnodes with a support >80% for CO1 and 37,7% of suchnodes for psbA), could be due to the faster evolutionaryrate of mitochondrial DNA compared to plastidial DNA.Second, the mutually incompatible groupings pro-
posed by these markers could reflect lineage sorting, asillustrated in previous studies on seaweeds[90]. SinceCO1 and psbA maximum likelihood trees (reconstructedwith a GTR+I+G4 model, 1000 bootstrap replicates byRaxML[91]) showed at least one strongly supportedphylogenetic conflict, we also suspect that organellarinheritance has not been strictly maternal in these
Bittner et al. Biology Direct 2010, 5:47http://www.biology-direct.com/content/5/1/47
Page 6 of 17
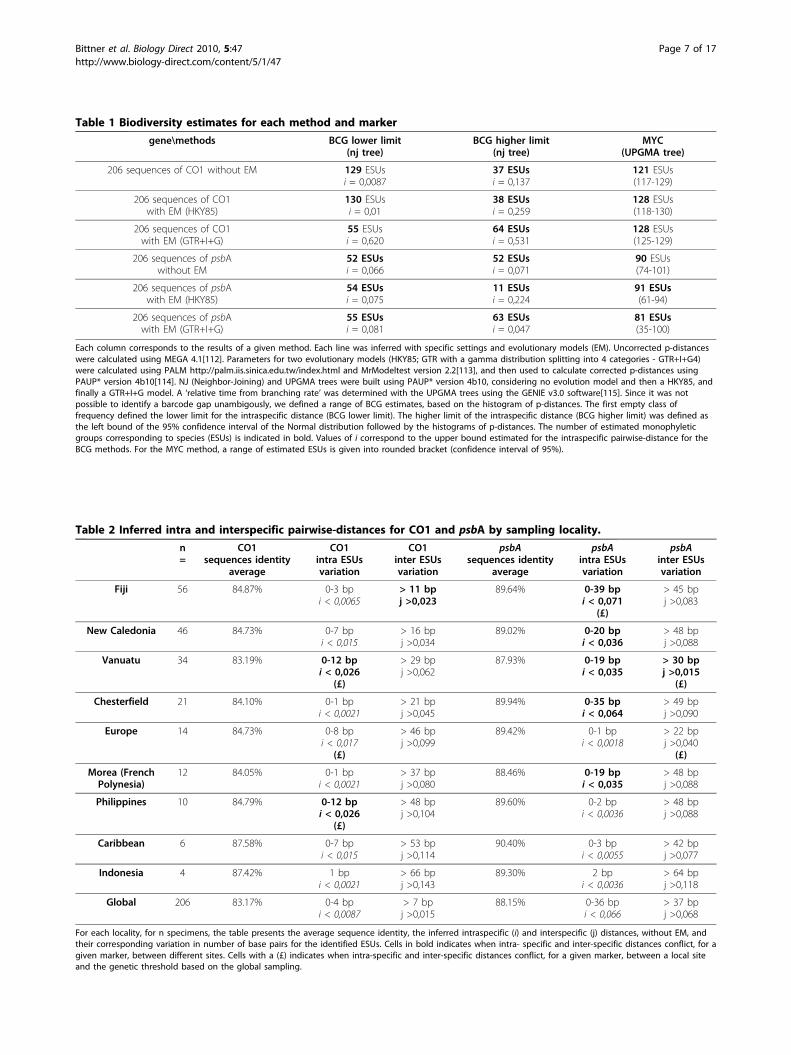
Table 1 Biodiversity estimates for each method and marker
gene\methods BCG lower limit(nj tree)
BCG higher limit(nj tree)
MYC(UPGMA tree)
206 sequences of CO1 without EM 129 ESUsi = 0,0087
37 ESUsi = 0,137
121 ESUs(117-129)
206 sequences of CO1with EM (HKY85)
130 ESUsi = 0,01
38 ESUsi = 0,259
128 ESUs(118-130)
206 sequences of CO1with EM (GTR+I+G)
55 ESUsi = 0,620
64 ESUsi = 0,531
128 ESUs(125-129)
206 sequences of psbAwithout EM
52 ESUsi = 0,066
52 ESUsi = 0,071
90 ESUs(74-101)
206 sequences of psbAwith EM (HKY85)
54 ESUsi = 0,075
11 ESUsi = 0,224
91 ESUs(61-94)
206 sequences of psbAwith EM (GTR+I+G)
55 ESUsi = 0,081
63 ESUsi = 0,047
81 ESUs(35-100)
Each column corresponds to the results of a given method. Each line was inferred with specific settings and evolutionary models (EM). Uncorrected p-distanceswere calculated using MEGA 4.1[112]. Parameters for two evolutionary models (HKY85; GTR with a gamma distribution splitting into 4 categories - GTR+I+G4)were calculated using PALM http://palm.iis.sinica.edu.tw/index.html and MrModeltest version 2.2[113], and then used to calculate corrected p-distances usingPAUP* version 4b10[114]. NJ (Neighbor-Joining) and UPGMA trees were built using PAUP* version 4b10, considering no evolution model and then a HKY85, andfinally a GTR+I+G model. A ‘relative time from branching rate’ was determined with the UPGMA trees using the GENIE v3.0 software[115]. Since it was notpossible to identify a barcode gap unambigously, we defined a range of BCG estimates, based on the histogram of p-distances. The first empty class offrequency defined the lower limit for the intraspecific distance (BCG lower limit). The higher limit of the intraspecific distance (BCG higher limit) was defined asthe left bound of the 95% confidence interval of the Normal distribution followed by the histograms of p-distances. The number of estimated monophyleticgroups corresponding to species (ESUs) is indicated in bold. Values of i correspond to the upper bound estimated for the intraspecific pairwise-distance for theBCG methods. For the MYC method, a range of estimated ESUs is given into rounded bracket (confidence interval of 95%).
Table 2 Inferred intra and interspecific pairwise-distances for CO1 and psbA by sampling locality.
n=
CO1sequences identity
average
CO1intra ESUsvariation
CO1inter ESUsvariation
psbAsequences identity
average
psbAintra ESUsvariation
psbAinter ESUsvariation
Fiji 56 84.87% 0-3 bpi < 0,0065
> 11 bpj >0,023
89.64% 0-39 bpi < 0,071
(£)
> 45 bpj >0,083
New Caledonia 46 84.73% 0-7 bpi < 0,015
> 16 bpj >0,034
89.02% 0-20 bpi < 0,036
> 48 bpj >0,088
Vanuatu 34 83.19% 0-12 bpi < 0,026
(£)
> 29 bpj >0,062
87.93% 0-19 bpi < 0,035
> 30 bpj >0,015
(£)
Chesterfield 21 84.10% 0-1 bpi < 0,0021
> 21 bpj >0,045
89.94% 0-35 bpi < 0,064
> 49 bpj >0,090
Europe 14 84.73% 0-8 bpi < 0,017
(£)
> 46 bpj >0,099
89.42% 0-1 bpi < 0,0018
> 22 bpj >0,040
(£)
Morea (FrenchPolynesia)
12 84.05% 0-1 bpi < 0,0021
> 37 bpj >0,080
88.46% 0-19 bpi < 0,035
> 48 bpj >0,088
Philippines 10 84.79% 0-12 bpi < 0,026
(£)
> 48 bpj >0,104
89.60% 0-2 bpi < 0,0036
> 48 bpj >0,088
Caribbean 6 87.58% 0-7 bpi < 0,015
> 53 bpj >0,114
90.40% 0-3 bpi < 0,0055
> 42 bpj >0,077
Indonesia 4 87.42% 1 bpi < 0,0021
> 66 bpj >0,143
89.30% 2 bpi < 0,0036
> 64 bpj >0,118
Global 206 83.17% 0-4 bpi < 0,0087
> 7 bpj >0,015
88.15% 0-36 bpi < 0,066
> 37 bpj >0,068
For each locality, for n specimens, the table presents the average sequence identity, the inferred intraspecific (i) and interspecific (j) distances, without EM, andtheir corresponding variation in number of base pairs for the identified ESUs. Cells in bold indicates when intra- specific and inter-specific distances conflict, for agiven marker, between different sites. Cells with a (£) indicates when intra-specific and inter-specific distances conflict, for a given marker, between a local siteand the genetic threshold based on the global sampling.
Bittner et al. Biology Direct 2010, 5:47http://www.biology-direct.com/content/5/1/47
Page 7 of 17

Corallinales. Two processes - the coalescence of sporel-ings and the fusion of crustose individuals- may haveproduced genetic mergers[92]. In addition, phylogeo-graphic analyses indicated that individual Corallinalesare good dispersers, as identical sequences of CO1 andpsbA were found over 1800 to 6300 kms of distance(Figure 3.B). Thallus fragmentation and reattachment ondrifting substrates[93], and a quick dispersal of haploidspores by strong currents can introduce individuals in alocality, which generates apparent “barcode gaps”, if theincoming individuals are genetically different from themajority of the local population. Yet, at a larger scale,this dispersal of Corallinales results in a continuum ofgenetic diversity (Figure 2).Both theories and case-studies indicate that grey-zone
related issues are common[51,60] rather than the excep-tion, which too often limits the efficacy of methodsbased on a single marker to enumerate “what is there”
in a pragmatic way. Consistently, the use of a largernumber of barcodes[8,27] and of more data is recom-mended to test when DNA barcoding proposes robustgroupings[51,64,94-96], as advocated by the tenants ofan integrative taxonomy combining DNA barcodingwith other lines of evidence[97,98]. Typically, corrobora-tive data (ecology, morphology, other genes) can help toassign species status to barcode groups. When groupsare robust, intra-approach pluralism is - at least - notan issue. Yet, as the sequencing of additional indepen-dent barcodes is increasingly recognized a requirementto design robust DNA barcoding analyses, the scope ofDNA barcoding will likely expand, and become somesort of multi-marker ... metagenomics. This transition ispossible because, although these approaches are rootedin distinct philosophies about species, for most organ-isms, they largely face similar practical issues as theylack a pragmatic way to define these units.
Figure 2 Histograms of the frequency of p-distances for CO1 and psbA in a Corallinales Dataset. A. Results for the CO1 dataset: thehorizontal axis represents the pairwise sequence divergence (p-distances) for the specimens of a given class of frequency; the vertical axiscorresponds to the number of pairs of specimens of each class. ‘n’ indicates the number of specimens sampled for a given locality. Barcodegaps are indicated by a star. Inferred interspecific distances are reported in green, inferred intraspecific distances are reported in red. B. Resultsfor the psbA dataset. Same legend. On the global sampling, no barcode gap can be defined. Several discontinuities exist in the distribution, asrepresented by the grey area. When more data are included (data not shown), the barcode gap disappears.
Bittner et al. Biology Direct 2010, 5:47http://www.biology-direct.com/content/5/1/47
Page 8 of 17
Testing the hypothesisThe highway of strategic networksTo date, metagenomic analyses of multiple random mar-kers seem the most pragmatic recipe to study “what isout there” when informative species taxa cannot beeasily identified. However, an inclusive framework is stillrequired to organize vast amounts of molecular data,and to provide information about two other key ques-tions of biodiversity studies: “what is happening?” and“how did this diversity evolve?” Remarkable biodiversitystudies have already offered deep biological insights byintegrating the results of genetic, taxonomic (using phy-lotypes) and functional analyses of metagenomic (andmetatranscriptomic) datasets, with explicit concerns forthe processes maintaining the diversity in communitiesand environments [31,33,99-102]. For instance, Qu et al.[101] unravelled dynamic microbial communities in
chicken cecal microbiomes, adjusting to their hosts diet,thanks to mobile DNA elements carrying abundant anti-biotic resistances[101]. We will briefly argue that furtherdevelopments of evolutionary gene networks (EGN) maybe a natural follow-up for such studies of integrativemetagenomics, be they used to investigate the diversityof one or several environments, or of a set of specimens.EGN are very inclusive graphs, amenable to specific
mathematical investigations (see Additional file 2 for allthe related technical terms below), showing both therarest and the dominant sequences under study. Theyoffer a structured framework to represent and to com-pare the genetic, functional and processual diversity ofmultiple datasets in a single analysis. In an EGN, eachnode corresponds to a sequence (ideally an ORF), withor without taxonomic and functional assignation. Twonodes are connected by edges if their sequences show
Figure 3 Gene networks of CO1 and psbA datasets. A. Sequence diversity of CO1 (in red) and psbA (in blue) datasets for the same 206specimens represented by gene homology networks, using the same scale and the same parameters for display. Nodes are sequences, andedges lengths are roughly proportional to the percentage of sequence identity between sequences. Closer sequences are more identical. CO1displays more genetic diversity than psbA, thus has evolved faster in these specimens. B. Network- based phylogeographic analysis of CO1 andpsbA sequences only showing sequences sharing 100% identical sequences but found in distinct geographical sites. Same networks forsequences presenting over 98% of identity. Nodes are sequences, colored according to their geographical origin: orange for Fiji; yellow for NewCaledonia - ‘Grande Terre’; dark blue for Vanuatu; purple for New Caledonia - Chesterfield; sky-blue for Europe; pink for French Polynesia; darkgreen for Philippines; grey for the Caribbean; light green for Indonesia. The colour coded table indicates the corresponding distances betweeneach pair of sites. The sequences with the highest proportion of identical matches are displayed closer in the graph.
Bittner et al. Biology Direct 2010, 5:47http://www.biology-direct.com/content/5/1/47
Page 9 of 17
significant similarity (Figure 4). Edges can be weighted,for instance using the best BLAST score of pairwisecomparisons of sequences, so that most similarsequences are closer on the graph. Since not all geneforms resemble one another however, discontinuousvariations will structure the graph.An EGN is not fully connected, but comprises multi-
ple subnetworks (connected components) of varioussizes and shapes, clustering some sequences together tothe exclusion of others. Such connected componentsdefine Operational Gene Families (OGF), which organisethe data in a molecular space (Figure 5). In practice,these EGNs are easy to reconstruct. Hundreds of thou-sands of DNA (or proteic) sequences are all BLASTedagainst each other. The results of these BLASTs (thebest BLAST scores between two sequences, their per-cent of identity, the length over which they align, etc.)are stored in databases. Groups of homologoussequences (the OGF) are then inferred using clusteringalgorithms (such as the simple linkage algorithm). TheBLAST score or the percentage of identity between eachpair of sequences is used to weight the correspondingedges. The same procedure can be applied by including
sequences of mobile genetic elements in the analyses tofigure what OGF are currently mobilized. New samplesand sequences can also be very easily added to theanalysis.Observing what and how many OGF are shared (or
not) between various samples may be a first step for abiodiversity study. OGF will vary with the thresholdretained to define significant similarities, and in thatregard OGF definition is just as arbitrary as the decisionon where to apply new species names. However, sinceEGN analysis is inclusive, OGF are defined simulta-neously for different samples and environments, and thediversity of different samples can then be compared inone study. The richness and evenness of OGF in a sam-ple, or the complementarity between samples, can bemeasured with usual diversity indices and methodsapplied to OGF (Shannon, Pielou, Chao1, ACE, rank-abundance or saturation curves)[7-9]. Furthermore,since EGNs are mathematical objects, their topologicalproperties[103,104] (Figure 4) can be exploited to thebenefit of biodiversity studies.For instance, let’s assume that sodium exporters are
strongly enriched in marine environments, while
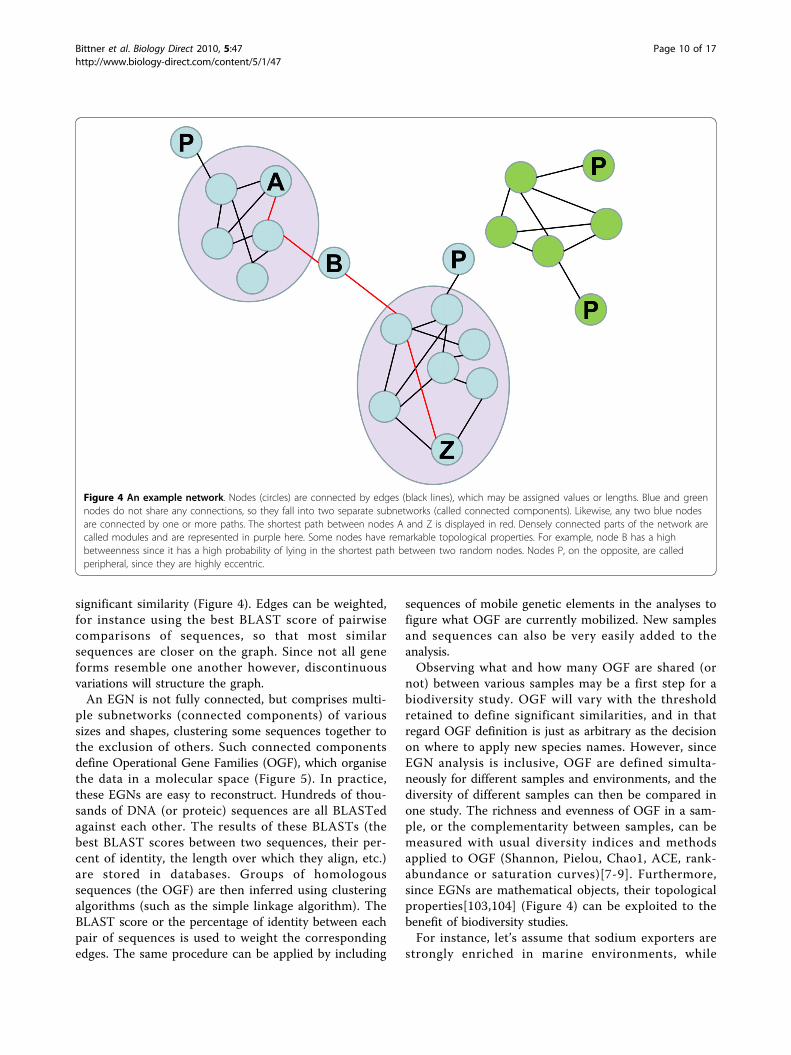
Figure 4 An example network. Nodes (circles) are connected by edges (black lines), which may be assigned values or lengths. Blue and greennodes do not share any connections, so they fall into two separate subnetworks (called connected components). Likewise, any two blue nodesare connected by one or more paths. The shortest path between nodes A and Z is displayed in red. Densely connected parts of the network arecalled modules and are represented in purple here. Some nodes have remarkable topological properties. For example, node B has a highbetweenness since it has a high probability of lying in the shortest path between two random nodes. Nodes P, on the opposite, are calledperipheral, since they are highly eccentric.
Bittner et al. Biology Direct 2010, 5:47http://www.biology-direct.com/content/5/1/47
Page 10 of 17
potassium exporters are strongly enriched in soils,reflecting the abundance of these ions in these environ-ments[19]. In an EGN comprising sequences from soiland marine samples, OGF with sequences of potassiumexporters, and OGF with sequences of sodium expor-ters, should have more representatives, thus comprisemore nodes than average OGF. If in addition novelforms of potassium exporters recently evolved in somesoils only (e.g. in farm soils), these new sequences willoccupy remarkable -peripheral- positions in OGF withpotassium exporters, affecting the very topology of theEGN. Centrality measures, useful for identifying nodeswith remarkable positions in a graph can be used to sin-gle out such peripheral sequences, since sequences onlyassociated with farm soils will loosely connect with theother potassium exporters sequences. Moreover, thegenetic diversity[105] introduced by these new forms ofpotassium exporters can be quantified by measuringtheir impact on the diameter of the OGF (the larger its
diameter, the more genetically diverse the OGF is). Ingeneral, EGNs may thus prove helpful to identify whatsequences and gene families play an important func-tional role, and had their evolution likely impacted bytheir milieu (Figure 5).Suppose now that the novel forms of potassium
exporters from a given farm soil are all strongly con-nected in one OGF. In terms of graph theory, theybelong to a module[106], which may typically serve toreveal the evolutionary and ecological processes sustain-ing the diversity in this environment. If the number oforganisms in the farm sample was large relatively to thenumber of sequences obtained, each sequence in themodule likely comes from a different organism[107].Thus, standard population genetics techniques appliedon these sequences could provide both refined estimateson the extent of recombination[16] and on the selectivepressures acting [108] on potassium exporters sequencesin that sample. Similar investigations could be extended
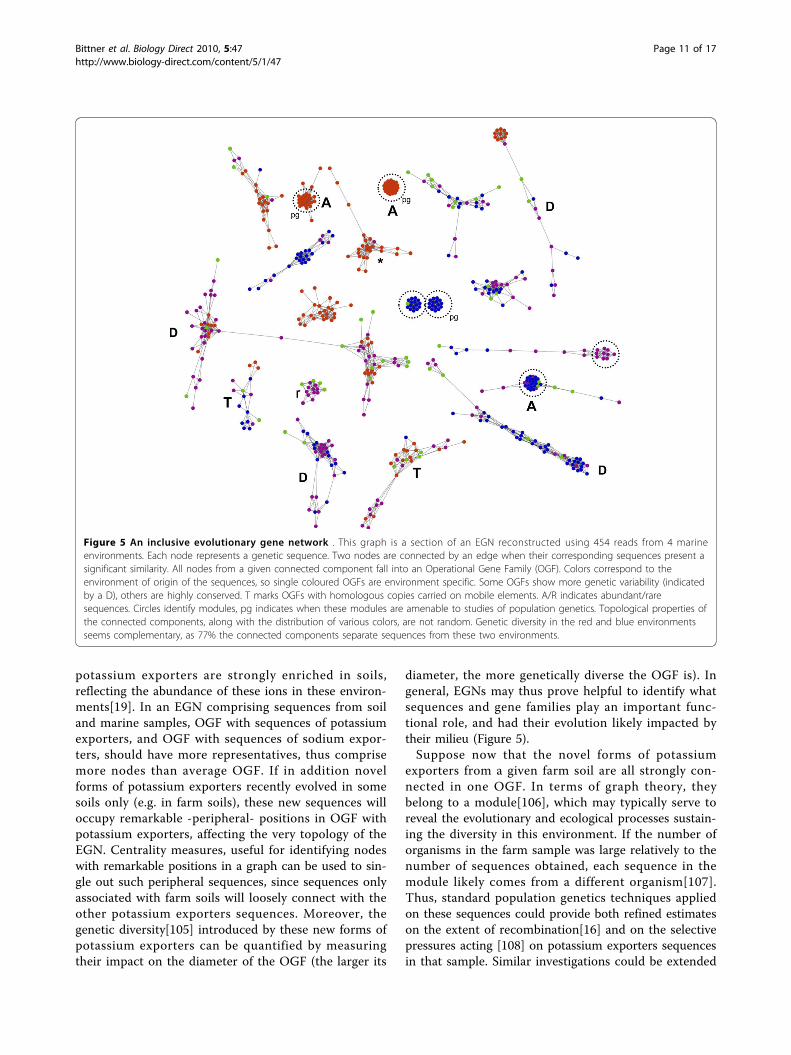
Figure 5 An inclusive evolutionary gene network . This graph is a section of an EGN reconstructed using 454 reads from 4 marineenvironments. Each node represents a genetic sequence. Two nodes are connected by an edge when their corresponding sequences present asignificant similarity. All nodes from a given connected component fall into an Operational Gene Family (OGF). Colors correspond to theenvironment of origin of the sequences, so single coloured OGFs are environment specific. Some OGFs show more genetic variability (indicatedby a D), others are highly conserved. T marks OGFs with homologous copies carried on mobile elements. A/R indicates abundant/raresequences. Circles identify modules, pg indicates when these modules are amenable to studies of population genetics. Topological properties ofthe connected components, along with the distribution of various colors, are not random. Genetic diversity in the red and blue environmentsseems complementary, as 77% the connected components separate sequences from these two environments.
Bittner et al. Biology Direct 2010, 5:47http://www.biology-direct.com/content/5/1/47
Page 11 of 17
to get global estimates, by considering all the sequencesfrom a given sample, falling in all the modules presentin the EGN. Finally, global estimates on the processesmaintaining the genetic and functional diversity in thesamples (e.g. transposition, transfer, molecular regula-tion and duplication) can also be obtained by countingthe relative proportions of OGF with duplicatedsequences, homology to transposons[101,109], phages[22,33] or plasmids[110], or harbouring toxin/antitoxinsystems[111]. Integration of these various lines ofknowledge on bioprocesses and biospecifics in a singleEGN might then suggest what evolutionary processaffect what OGF (and thus what functions), in whatenvironment (Figure 5).
Implications of the hypothesisBiodiversity is far too complex to be adequatelyaddressed by any single approach. For that reason, DNAbarcoding approaches and the massive sequencing ofmultiple markers are obviously not mutually exclusive.However, the latter can comprise the former (while theopposite is not true). Since integrative metagenomics ismore inclusive than DNA barcoding, we recommendscientists designing biodiversity studies to use either bothapproaches as complementary, or for pragmatic reasons -when species problems are observed or expected-, tocouple integrative metagenomics with EGNs methods.This latter protocol has the potential to improve theidentification and the quantification of biodiversity. Itreduces the risk of producing biodiversity estimates withlimited explanatory power, biased either by unequal ratesof LGT, or difficult to interpret due to (practical) pro-blems caused by type I and type II grey zones. Moreover,it would be easy to include (meta)transcriptomic and(meta)proteomic data in such EGNs, as it would onlyrequire the inclusion of such additional molecularsequences in the analyses. The resulting EGNs wouldthen provide a precious framework and useful mathema-tical tools for studying the almost instantaneous changesin biodiversity, and the immediate catalytic potential ofdifferent environments[100]. Relative variations in EGNs,for environmental samples obtained over time or acrosssites, would thus return relevant indications on the flex-ibility and resilience of the environment.
Reviewers’ commentsReview by William Martin (Institut fuer Botanik III,Heinrich-Heine Universitaet Duesseldorf Universitaetsstr.1, 40225 Duesseldorf, Germany)This is a fine paper underscoring the need to take meta-genomic data and network approaches into considera-tion in biodiversity issues. There is no need for majorrevision in my view, but I came away with threeimpressions.
Number one, a real life example comparing barcodeand “metanet” data for biodiversity investigation, headto head, would perhaps be instructive.We agree. We added a new section entitled ‘Coralli-
nales as a case-study’ to better illustrate the limit of bar-code approaches on real datasets, and how this limitcould be in part explained by highlighting two evolution-ary processes (unequal evolutionary rates in markers andhigh organismal dispersal range) using two very simplegene networks (Figure 3A and 3B). First, using identicalsettings for the display, a metanet showed that, for thesame 206 specimens, CO1 sequences present more diver-gence than psbA sequences, which means that CO1 hada higher rate of evolution than psbA in these organisms.Second, we used metanets to identify which identicalsequences (or nearly identical ones, depending on thethreshold selected) were found in geographically differentsites, thus testifying of the long distance dispersal of thesetaxa. We hope that this very simple case study willencourage future metanet analyses of Corallinales(through the sequencing of additional genes from suchspecimens), and then allow a much finer head to headcomparison. We also revised our example of a real envir-onmental metanet (Figure 5) to better illustrate modules,environmental specific gene families, abundant families,rare families, transferred families and what parts of thegraph singled out markers that are amenable to popula-tion genetics analyses.Second, in the network analyses, a threshold of
sequence similarity has to be introduced; in the paper,the sentence reads: “Two nodes are connected by edgesif their sequences show significant similarity”. Decidingwhere to draw that line is just as arbitrary as the deci-sion on where to apply new species names or where todelineate taxon × from taxon y using barcode data. Thatneeds to be said, I think, to be honest that there is noeasy way out of these problems and that networks posenew problems of similar nature as the old ones.We agree and edited the text to make this point clear.
An important difference however with separated DNAbarcode analyses and the metanet approach is thatmetanets are inclusive. Thus the diversity of variousdatasets can be directly compared, as a same thresholdis applied to quantify comparable ‘elements’ in all ofthese datasets simultaneously.Third, taxonomists often used, and still use, the trusty
concept of “discontinuous variation” when it comes todrawing lines. That concept would be useful here, asmuch of these biodiversity debates concern the questionof discontinuity in variation. (Darwin recognized that).Discontinuous variation is indeed of great importance,
and we now mention it in the revised version of the MS.In metanet analyses, discontinuous variations can beeasily identified at two levels. First there are
Bittner et al. Biology Direct 2010, 5:47http://www.biology-direct.com/content/5/1/47
Page 12 of 17

discontinuities between the different Operational GenesFamilies (OGFs). Second, certain type of discontinuousvariation can be unambiguously detected within a OGFusing centralities. Typically, OGFs comprising two clus-ters of sequences only bridged by one intermediatesequence but no other direct connections is an obviouscase of discontinuity. These remarkable patterns can bequantified, and their numbers between datasets com-pared in a single inclusive analysis.Some thought could be give to that, or not.These are definitely important questions. We thank the
referee very much for his helpful comments on thesethree essential points.
Review by Dr. David Williams (nominated by J PeterGogarten) (Department of Molecular and Cell Biology,University of Connecticut, Storrs, CT 06269-31258, USA)This article tackles two areas linked by the ‘species con-cept’ problem: the ideal of a universally applicable mea-sure of biodiversity across all Domains of life, and astandardised and inclusive way of dealing with the nebu-lous data from metagenomic surveys. The arguments areclearly presented and I agree with them. Ultimately,EGNs fulfill the authors’ billing as a useful addition tothe metagenomic toolkit with more potential for inte-grative analyses.Many metagenome studies group similar sequences
together (’binning’) to allow quantitative analyses. Evolu-tionary Gene Networks (EGNs) place clusteredsequences into operational gene families (OGFs) whichare analogous to bins but place an emphasis on thediversity and process information within and betweenthese units which I think is a good thing. However,OGFs and lower-level modules are ultimately deter-mined by arbitrary cutoffs in BLAST scores or a chosenclustering method respectively. The authors state thereare multiple ways of defining clusters and EGN sub-units. To what extent do biodiversity conclusions varywith different BLAST cutoff scores and module defini-tions/clustering approaches? Are potential variationsgreat enough for a recommendation towards specific,standardised clustering approaches or cutoff scores?Indeed, conclusions may vary with the different BLAST
cutoff scores selected: higher cutoff scores will define morestringent OGFs (e.g. OGFs with sequences showing moreidentity), lower cutoff scores will define looser OGFs (e.g.OGFs with more divergent sequences, such as fused orfissioned sequences, fast evolving sequences, and so on).Importantly, EGNs can then be different as the cutoffchanges, especially when the processes sustaining diver-sity changed over time. As such, EGNs provide a greatway to test whether such changes occurred (and forwhich gene families it occured). That’s why we wouldrecommend to explore a range of cutoff scores: from very
low ones (e.g. BLAST scores of 1e-5 to study the evolutionof biodiversity over the longest time period possible) tovery high ones (e.g. BLAST scores of 0 plus 100% of iden-tity between sequences). If the number of OGFs plateausas a function of these cutoff scores, then one can be confi-dent that the structure and the biodiversity observed inthe EGN is robust over time. What is essential howeveris that the EGNs are both inclusive and grounded in apragmatic perspective: the questions one wants toaddress determine what level of cut-off is required. Con-sequently, it is also important to keep in mind that bothhigh and low cutoff scores have their merits. Considertwo extreme cases. First, at low BLAST scores (e.g. of 1e-5), some families will show diverging sequences, but otherwon’t, suggesting that the later have a much more con-strained evolution than the former. Second, very highcutoff scores (e.g. BLAST scores of 0 plus 100% of iden-tity) will allow for instance to identify identicalsequences dispersed over long geographical distances.If rates of evolution across a metagenome vary, is a
common BLAST cutoff score across one or more data-sets appropriate for inferring the potentially heteroge-nous processes causing diversity? If inferences ofevolutionary processes are to be inferred from networktopology, do the authors consider it feasible or desirableto use models of sequence evolution to provide evolu-tionary distances for weighting edges instead of BLASTscores?For some studies, simple EGNs (with homology or
BLAST scores) will be very useful and sufficient toimprove our knowledge on biodiversity and its evolution.In other cases, it can certainly be desirable to use modelsof sequence evolution to provide evolutionary distancesto weight the edges of EGNs, instead of BLAST scores, inparticular when sequences fall in a tight cluster (whichmeans that all of them can be aligned). In generalthough, developing new evolutionary models (and dis-tances) to generate EGNs with weighted edges that takeinto account heterogenous evolutionary processes seems amost interesting prospect.
Review by Dr. James McInerney (nominated by JohnLogsdon) (Molecular Evolution and Bioinformatics Unit,Biology Department, NUI Maynooth, Ireland)I think this is a very interesting manuscript. The authorsstep back from any particular ecological dataset andconsider the approaches that are being taken, their likelyoutcomes and their potential shortfalls. My own perso-nal opinion is that we will really only begin to do mean-ingful microbial ecology when sequencing methods areinvented that provide us with very long sequences.Some of the results presented here give a glimpse of thekinds of analysis that should be carried out (specificallythe homology networks).
Bittner et al. Biology Direct 2010, 5:47http://www.biology-direct.com/content/5/1/47
Page 13 of 17

We agree with the referee and thank him very muchfor his interest in homology networks.I agree with the authors that barcoding cannot get us
very far in the prokaryotic world and there are seriouslimitations and serious questions about what is reallybeing addressed when a barcode is derived from anorganism.We feel that it is a very important point: there are
cases where the aims and scopes of DNA barcodingshould be critically assessed. Assuming that thisapproach can be used as an exploratory tool to identifynew species (which is the second aim of DNA barcoding,the first being to assign unknown specimens to alreadyrecognized species, thanks to a DNA-library of namedspecimens) will work in every case might lead to mislead-ing results, caused by sampling artefacts and an exces-sive confidence in the existence of discontinuousvariations (assumed rather than tested) in one’s dataset.This claim should not be seen as a negative one however,but as a positive incentive for further critical develop-ments in molecular based biodiversity studies (e.g. bypromoting critical barcoding analyses, as well as the useof other approaches, when needed).My points are relatively minor and relate to the text
and some clarifications I would like to see with certainsentences. I hope this manuscript encourages more dis-cussion of microbial ecology and in particular the meth-ods and what the experiments really mean.Specific points:In your abstract you say that you came to your con-
clusions by evaluating the” two molecular approachesfor assessing biodiversity. However, there are more thanthese two approaches, so perhaps it is best to drop theword ‘the’.We agree and corrected the sentence.on page 3, you write: “Based on their divergences, we
propose that an integrative approach aiming at thesimultaneous examination (or even better at the integra-tion) of the elements- based, function-based and pro-cess-based perspectives in biodiversity studies, thanks tomassive sequencing of multiple environmental markers.”This sentence does not read properly. Perhaps you didnot mean to include the word ‘that’?We agree and corrected the sentence.On page 4, when discussing LGT, you use the sen-
tence “It affects the identification of phylogenetic-spe-cies.” I presume it is LGT that affects the identificationof phylogenetic species (also, I am not sure the hyphenis necessary). Perhaps this sentence can be changed tobe more explicit?We changed the text accordingly.On page 4, you start a paragraph with “The contrast
with DNA barcoding [...]” I found this opener difficultto interpret. What is being contrasted with what?
We revised that part of the MS, including additionalsub-titles to clarify what was contrasted with what.On page 5, the sentence “First, when the various sec-
ondary properties defining the groups arose at differenttimes in the process of speciation, the proposed group-ings are nested (Type I grey zone, Figure 1D)” changestense and makes it difficult to read.We changed the text accordingly.
Additional material
Additional file 1: Corallinales dataset.
Additional file 2: Glossary.
AcknowledgementsWe thank Ford Doolittle, J. Leigh, F.J. Lapointe for critical reading of thismanuscript, and two anonymous referees on a former version of themanuscript, as well as all the collectors. LB was supported by an MENRTgrant from the French government.
Author details1UMR CNRS 7138 Systématique, Adaptation, Evolution, Muséum Nationald’Histoire Naturelle, Paris, France. 2UMR CNRS 7138 Systématique,Adaptation, Evolution, Université Pierre et Marie Curie, Paris, France. 3UR227,IRD-BPA5, Nouméa, Nouvelle-Calédonie, France. 4Genoscope, Centre Nationalde Séquençage, Evry, France.
Authors’ contributionsPC & BdR conceived of the study, and collected the specimens. LB & CCcarried out the molecular genetic studies. SH and LB conceived of andperformed the analyses, and drafted the manuscript, PL & EB conceived ofand performed the analyses, and wrote the manuscript. All authors read andapproved the final manuscript.
Competing interestsThe authors declare that they have no competing interests.
Received: 21 July 2010 Accepted: 30 July 2010 Published: 30 July 2010
References1. Morgan GJ: Evaluating Maclaurin and Sterelny’s Conception of
Biodiversity in Cases of Frequent, Promiscuous Lateral Gene Transfer.Biology and Philosophy 2010.
2. Brennerova MV, Josefiova J, Brenner V, Pieper DH, Junca H: Metagenomicsreveals diversity and abundance of meta-cleavage pathways inmicrobial communities from soil highly contaminated with jet fuelunder air-sparging bioremediation. Environ Microbiol 2009, 11:2216-2227.
3. Wolcott RD, Gontcharova V, Sun Y, Dowd SE: Evaluation of the bacterialdiversity among and within individual venous leg ulcers using bacterialtag-encoded FLX and titanium amplicon pyrosequencing andmetagenomic approaches. BMC Microbiol 2009, 9:226.
4. Doolittle WF, Zhaxybayeva O: Metagenomics and the Units of BiologicalOrganization. Bioscience 2010, 60:102-112.
5. Callicott JB, Crowder LB, Mumford K: Current normative concepts inconservation. Conservation Biology 1999, 13:22-35.
6. Faith DP: Biodiversity Stanford, CA 94305-4115 The Metaphysics ResearchLab, Center for the Study of Language and Information, Stanford University2007.
7. Lozupone CA, Knight R: Species divergence and the measurement ofmicrobial diversity. FEMS Microbiol Rev 2008, 32:557-578.
8. Hughes JB, Hellmann JJ, Ricketts TH, Bohannan BJ: Counting theuncountable: statistical approaches to estimating microbial diversity.Appl Environ Microbiol 2001, 67:4399-4406.
Bittner et al. Biology Direct 2010, 5:47http://www.biology-direct.com/content/5/1/47
Page 14 of 17

9. Hughes JB, Hellmann JJ: The application of rarefaction techniques tomolecular inventories of microbial diversity. Methods Enzymol 2005,397:292-308.
10. Faith DP: Phylogenetic pattern and the quantification of organismalbiodiversity. Philos Trans R Soc Lond B Biol Sci 1994, 345:45-58.
11. Norton BG: Conservation biology and environmental values: can therebe a universal earth ethic? Protecting biological diversity: roles andresponsibilities Montréal: McGill-Queen’s University Press 2001.
12. Potvin C: Biodiversity Washington, DC: National Academy of Sciences/Smithsonian InstitutionWilson EO 1988.
13. Ehrenfeld D: Why put a value on biodiversity? Biodiversity Washington, DC:National Academy Press/Smithsonian InstitutionWilson EO 1988.
14. Takacs D: The idea of biodiversity: philosophies of paradise Baltimore: TheJohn Hopkins University Press 1996.
15. Angermeier PL, Karr JR: Biological integrity vs. biological diversity aspolicy directives: Protecting biotic resources. Bioscience 1994, 44:690-697.
16. Hugenholtz P, Tyson GW: Microbiology: metagenomics. Nature 2008,455:481-483.
17. Hebert PD, Cywinska A, Ball SL, deWaard JR: Biological identificationsthrough DNA barcodes. Proc Biol Sci 2003, 270:313-321.
18. Huse SM, Welch DM, Morrison HG, Sogin ML: Ironing out the wrinkles inthe rare biosphere through improved OTU clustering. Environ Microbiol2010.
19. Tringe SG, von Mering C, Kobayashi A, Salamov AA, Chen K, Chang HW,Podar M, Short JM, Mathur EJ, Detter JC, Bork P, Hugenholtz P, Rubin EM:Comparative metagenomics of microbial communities. Science 2005,308:554-557.
20. Quince C, Curtis TP, Sloan WT: The rational exploration of microbialdiversity. ISME J 2008, 2:997-1006.
21. Eisen JA: Environmental shotgun sequencing: its potential andchallenges for studying the hidden world of microbes. PLoS Biol 2007, 5:e82.
22. Williamson SJ, Rusch DB, Yooseph S, Halpern AL, Heidelberg KB, Glass JI,Andrews-Pfannkoch C, Fadrosh D, Miller CS, Sutton G, Frazier M, Venter JC:The Sorcerer II Global Ocean Sampling Expedition: metagenomiccharacterization of viruses within aquatic microbial samples. PLoS One2008, 3:e1456.
23. Simon C, Daniel R: Achievements and new knowledge unraveled bymetagenomic approaches. Appl Microbiol Biotechnol 2009, 85:265-276.
24. Altschul SF, Gish W, Miller W, Myers EW, Lipman DJ: Basic local alignmentsearch tool. J Mol Biol 1990, 215:403-410.
25. Huson DH, Auch AF, Qi J, Schuster SC: MEGAN analysis of metagenomicdata. Genome Res 2007, 17:377-386.
26. Wu M, Eisen JA: A simple, fast, and accurate method of phylogenomicinference. Genome Biol 2008, 9:R151.
27. Bent SJ, Forney LJ: The tragedy of the uncommon: understandinglimitations in the analysis of microbial diversity. ISME J 2008, 2:689-695.
28. Legault BA, Lopez-Lopez A, Alba-Casado JC, Doolittle WF, Bolhuis H,Rodriguez- Valera F, Papke RT: Environmental genomics of“Haloquadratum walsbyi” in a saltern crystallizer indicates a large poolof accessory genes in an otherwise coherent species. BMC Genomics2006, 7:171.
29. Achenbach LA, Coates JD: Disparity between bacterial phylogeny andphysiology. ASM News 2000, 66:714-715.
30. Kim BK, Park YD, Oh HM, Chun J: Identification and characterization ofmetagenomic fragments from tidal flat sediment. J Microbiol 2009,47:402-410.
31. Debroas D, Humbert JF, Enault F, Bronner G, Faubladier M, Cornillot E:Metagenomic approach studying the taxonomic and functional diversityof the bacterial community in a mesotrophic lake (Lac du Bourget–France). Environ Microbiol 2009, 11:2412-2424.
32. Treusch AH, Kletzin A, Raddatz G, Ochsenreiter T, Quaiser A, Meurer G,Schuster SC, Schleper C: Characterization of large-insert DNA librariesfrom soil for environmental genomic studies of Archaea. EnvironMicrobiol 2004, 6:970-980.
33. Dinsdale EA, Edwards RA, Hall D, Angly F, Breitbart M, Brulc JM, Furlan M,Desnues C, Haynes M, Li L, McDaniel L, Moran MA, Nelson KE, Nilsson C,Olson R, Paul J, Brito BR, Ruan Y, Swan BK, Stevens R, Valentine DL,Thurber RV, Wegley L, White BA, Rohwer F: Functional metagenomicprofiling of nine biomes. Nature 2008, 452:629-632.
34. Meyer F, Paarmann D, D’Souza M, Olson R, Glass EM, Kubal M, Paczian T,Rodriguez A, Stevens R, Wilke A, Wilkening J, Edwards RA: Themetagenomics RAST server - a public resource for the automaticphylogenetic and functional analysis of metagenomes. BMCBioinformatics 2008, 9:386.
35. Kanehisa M, Goto S, Kawashima S, Okuno Y, Hattori M: The KEGG resourcefor deciphering the genome. Nucleic Acids Res 2004, 32:D277-280.
36. Overbeek R, Begley T, Butler RM, Choudhuri JV, Chuang HY, Cohoon M, deCrécy-Lagard V, Diaz N, Disz T, Edwards R, Fonstein M, Frank ED, Gerdes S,Glass EM, Goesmann A, Hanson A, Iwata-Reuyl D, Jensen R, Jamshidi N,Krause L, Kubal M, Larsen N, Linke B, McHardy AC, Meyer F, Neuweger H,Olsen G, Olson R, Osterman A, Portnoy V, Pusch GD, Rodionov DA,Rückert C, Steiner J, Stevens R, Thiele I, Vassieva O, Ye Y, Zagnitko O,Vonstein V: The subsystems approach to genome annotation and its usein the project to annotate 1000 genomes. Nucleic Acids Res 2005,33:5691-5702.
37. Ereshefsky M: Microbiology and the Species Problem. Biology andPhilosophy 2010.
38. Bapteste E, Boucher Y: Lateral gene transfer challenges principles ofmicrobial systematics. Trends Microbiol 2008, 16:200-207.
39. Bapteste E, Boucher Y: Epistemological impacts of horizontal genetransfer on classification in microbiology. Methods Mol Biol 2009,532:55-72.
40. Achtman M, Wagner M: Microbial diversity and the genetic nature ofmicrobial species. Nat Rev Microbiol 2008, 6:431-440.
41. Franklin LR: Bacteria, sex and systematics. Philos Sci 2007, 74:69-95.42. Gevers D, Cohan FM, Lawrence JG, Spratt BG, Coenye T, Feil EJ,
Stackebrandt E, Van de Peer Y, Vandamme P, Thompson FL, Swings J:Opinion: Re-evaluating prokaryotic species. Nat Rev Microbiol 2005,3:733-739.
43. Hanage WP, Fraser C, Spratt BG: Fuzzy species among recombinogenicbacteria. BMC Biol 2005, 3:6.
44. Touchon M, Hoede C, Tenaillon O, Barbe V, Baeriswyl S, Bidet P, Bingen E,Bonacorsi S, Bouchier C, Bouvet O, Calteau A, Chiapello H, Clermont O,Cruveiller S, Danchin A, Diard M, Dossat C, Karoui ME, Frapy E, Garry L,Ghigo JM, Gilles AM, Johnson J, Le Bouguénec C, Lescat M, Mangenot S,Martinez-Jéhanne V, Matic I, Nassif X, Oztas S, Petit MA, Pichon C, Rouy Z,Ruf CS, Schneider D, Tourret J, Vacherie B, Vallenet D, Médigue C, Rocha EP,Denamur E: Organised genome dynamics in the Escherichia coli speciesresults in highly diverse adaptive paths. PLoS Genet 2009, 5:e1000344.
45. Konstantinidis KT, Tiedje JM: Genomic insights that advance the speciesdefinition for prokaryotes. Proc Natl Acad Sci USA 2005, 102:2567-2572.
46. Nesbo CL, Dlutek M, Doolittle WF: Recombination in Thermotoga:implications for species concepts and biogeography. Genetics 2006,172:759-769.
47. Rossello-Mora R, Amann R: The species concept for prokaryotes. FEMSMicrobiol Rev 2001, 25:39-67.
48. Stackebrandt E: Defining Taxonomic Ranks. Prokaryotes: A handbook on theBiology of Bacteria New York: SpringerDworkin M , 1 2006, 29-57.
49. Lawrence J, Retchless A: The myth of bacterial species and speciation.Biology and Philosophy 2010.
50. Hebert PD, Stoeckle MY, Zemlak TS, Francis CM: Identification of Birdsthrough DNA Barcodes. PLoS Biol 2004, 2:e312.
51. Funk DJ, Omland KE: Species-level paraphyly and polyphyly: frequency,causes, and consequences, with insights from animal mitochondrialDNA. Annu Rev Ecol Evol Syst 2003, 34:397-423.
52. Robinson EA, Blagoev GA, Hebert PDN, Adamowicz SJ: Prospects for usingDNA barcoding to identify spiders in species-rich genera. ZooKeys 2009,27-46.
53. Pons J, Barraclough TG, Gomez-Zurita J, Cardoso A, Duran DP, Hazell S,Kamoun S, Sumlin WD, Vogler AP: Sequence-based species delimitationfor the DNA taxonomy of undescribed insects. Syst Biol 2006, 55:595-609.
54. Monaghan MT, Wild R, Elliot M, Fujisawa T, Balke M, DJG I, Lees DC,Ranaivosolo R, Eggleton P, Barraclough TG, Vogler AP: Accelerated SpeciesInventory on Madagascar Using Coalescent-Based Models of SpeciesDelineation. Systematic Biology 2009, 58:298-311.
55. Ratnasingham S, Hebert PD: bold: The Barcode of Life Data System. MolEcol Notes 2007, 7:355-364[http://www.barcodinglife.org].
56. Frezal L, Leblois R: Four years of DNA barcoding: current advances andprospects. Infect Genet Evol 2008, 8:727-736.
Bittner et al. Biology Direct 2010, 5:47http://www.biology-direct.com/content/5/1/47
Page 15 of 17

57. De Queiroz K: Different species problems and their resolution. BioEssays2005, 27:1263-1269.
58. De Queiroz K: Species concepts and species delimitation. SystematicBiology 2007, 56:879-886.
59. Ereshefsky M: Mystery of Mysteries: Darwin and the Species Problem.Cladistics 2010, 26:1-13.
60. Agapow PM, Bininda-Emonds OR, Crandall KA, Gittleman JL, Mace GM,Marshall JC, Purvis A: The impact of species concept on biodiversitystudies. Q Rev Biol 2004, 79:161-179.
61. Alverson AJ: Molecular systematics and the diatom species. Protist 2008,159:339-353.
62. Finlay BJ: Protist taxonomy: an ecological perspective. Philos Trans R SocLond B Biol Sci 2004, 359:599-610.
63. Weisse T: Distribution and diversity of aquatic protists: an evolutionaryand ecological perspective. Biodivers Conserv 2008, 17:243-259.
64. Hudson RR, Coyne JA: Mathematical consequences of the genealogicalspecies concept. Evolution 2002, 56:1557-1565.
65. Lynch M, Koskella B, Schaack S: Mutation pressure and the evolution oforganelle genomic architecture. Science 2006, 311:1727-1730.
66. Rynearson TA, Armbrust EV: Maintenance of clonal diversity during aspring bloom of the centric diatom Ditylum brightwellii. Mol Ecol 2005,14:1631-1640.
67. Barr CM, Neiman M, Taylor DR: Inheritance and recombination ofmitochondrial genomes in plants, fungi and animals. New Phytol 2005,168:39-50.
68. Weihe A, Apitz J, Pohlheim F, Salinas-Hartwig A, Borner T: Biparentalinheritance of plastidial and mitochondrial DNA and hybrid variegationin Pelargonium. Mol Genet Genomics 2009, 282:587-593.
69. Welch ME, Darnell MZ, McCauley DE: Variable populations within variablepopulations: quantifying mitochondrial heteroplasmy in naturalpopulations of the gynodioecious plant Silene vulgaris. Genetics 2006,174:829-837.
70. Foissner W: Protist diversity and distribution: some basic considerations.Biodiv Conserv 2008, 17:235-242.
71. Amato A, Kooistra WH, Ghiron JH, Mann DG, Proschold T, Montresor M:Reproductive isolation among sympatric cryptic species in marinediatoms. Protist 2007, 158:193-207.
72. Erpenbeck D, Hooper JNA, Worheide G: CO1 phylogenies in diploblastsand the ‘Barcoding of Life’–are we sequencing a suboptimal partition?Mol Ecol Notes 2005, 6:550-553.
73. CBOL Plant Working Group: A DNA barcode for land plants. Proc NatlAcad Sci USA 2009, 106:12794-12797.
74. Seberg O, Petersen G: How many loci does it take to DNA barcode acrocus? PLoS One 2009, 4:e4598.
75. Smith MA, Poyarkov N, Hebert PDN: CO1 DNA barcoding amphibians:take the chance, meet the challenge. Molecular Ecology Resources 2008,8:235-246.
76. Wiemers M, Fiedler K: Does the DNA barcoding gap exist? - a case studyin blue butterflies (Lepidoptera: Lycaenidae). Front Zool 2007, 4:8.
77. Papadopoulou A, Bergsten J, Fujisawa T, Monaghan MT, Barraclough TG,Vogler AP: Speciation and DNA barcodes: testing the effects of dispersalon the formation of discrete sequence clusters. Philos Trans R Soc Lond BBiol Sci 2008, 363:2987-2996.
78. Meyer CP, Paulay G: DNA barcoding: error rates based on comprehensivesampling. PLoS Biol 2005, 3:e422.
79. Lorenz JG, Jackson WE, Beck JC, Hanner R: The problems and promise ofDNA barcodes for species diagnosis of primate biomaterials. Philos TransR Soc Lond B Biol Sci 2005, 360:1869-1877.
80. Nichols R: Gene trees and species trees are not the same. Trends Ecol Evol2001, 16:358-364.
81. Degnan JH, Rosenberg NA: Gene tree discordance, phylogeneticinference and the multispecies coalescent. Trends Ecol Evol 2009,24:332-340.
82. Erpenbeck D, Breeuwer JA, Parra-Velandia FJ, van Soest RW: Speculationwith spiculation?–Three independent gene fragments and biochemicalcharacters versus morphology in demosponge higher classification. MolPhylogenet Evol 2006, 38:293-305.
83. Silva PC: Historical review of attempts to decrease subjectivity in speciesidentification, with particular regard to algae. Protist 2008, 159:153-161.
84. Hey J: Genes, Categories and Species New York: Oxford University Press 2001.
85. Mace GM, Gittleman JL, Purvis A: Preserving the tree of life. Science 2003,300:1707-1709.
86. Evans KM, Wortley AH, Mann DG: An assessment of potential diatom“barcode” genes (cox1, rbcL, 18 S and ITS rDNA) and their effectivenessin determining relationships in Sellaphora (Bacillariophyta). Protist 2007,158:349-364.
87. Robba L, Russell SJ, Barker GL, Brodie J: Assessing the use of themitochondrial cox1 marker for use in DNA barcoding of red algae(Rhodophyta). American Journal of Botany 2006, 93:1101-1108.
88. Walker RH, Brodie J, Russell S, Irvine LM, Orfanidis S: Biodiversity ofCoralline algae in the north-eastern Atlantic including Corallinacaespitose sp. Nov. (Corallinoideae, Rhodophyta). Journal of Phycology2009, 45:287-297.
89. Broom JES, Hart DR, Farr TJ, Nelson WA, Neill KF, Harvey AS,Woelkerling WJ: Utility of psbA and nSSU for phylogenetic reconstructionin the Corallinales based on New Zealand taxa. Molecular Phylogeneticsand Evolution 2008, 46:958-973.
90. Andreakis N, Procaccini G, Maggs C, Kooistra WHCF: Phylogeography ofthe invasive seaweed Asparagopsis (Bonnemaisoniales, Rhodophyta)reveals cryptic diversity. Molecular Ecology Resources 2007, 16:2285-2299.
91. Stamatakis A, Hoover P, Rougemont J: A Rapid Bootstrap Algorithm forthe RAxML. Web-Servers Systematic Biology 2008, 75:758-771.
92. Santelices B, Correa J, Aedo D, Flores V, Hormazábal M, Sánchez P:Convergent biological processes in coalescing Rhodophyta. Journal ofPhycology 1999, 35:1127-1149.
93. Walters LJ, Smith CM: Rapid rhizoid production in Halimeda discoideaDecaisne (Chlorophyta, Caulerpales) fragments: a mechanism for survivalafter separation from adult thalli. Journal of Experimental Marine Biologyand Ecology 1994, 175:105-120.
94. Fitzhugh K: DNA Barcoding: An instance of Technology-driven Science?BioScience 2006, 56:462-463.
95. Felsenstein J: Accuracy of coalescent likelihood estimates: do we needmore sites, more sequences, or more loci? Mol Biol Evol 2006, 23:691-700.
96. Knowles LL, Carstens BC: Delimiting species without monophyletic genetrees. Syst Biol 2007, 56:887-895.
97. Dayrat B: Towards integrative taxonomy. Biol J Linn Soc 2005, 85:407-415.98. Trewick SA: DNA Barcoding is not enough: mismatch of taxonomy and
genealogy in New Zealand grasshoppers (Orthoptera: Acrididae).Cladistics 2008, 24:240-254.
99. Brulc JM, Antonopoulos DA, Miller ME, Wilson MK, Yannarell AC,Dinsdale EA, Edwards RE, Frank ED, Emerson JB, Wacklin P, Coutinho PM,Henrissat B, Nelson KE, White BA: Gene-centric metagenomics of thefiber-adherent bovine rumen microbiome reveals forage specificglycoside hydrolases. Proc Natl Acad Sci USA 2009, 106:1948-1953.
100. Frias-Lopez J, Shi Y, Tyson GW, Coleman ML, Schuster SC, Chisholm SW,Delong EF: Microbial community gene expression in ocean surfacewaters. Proc Natl Acad Sci USA 2008, 105:3805-3810.
101. Qu A, Brulc JM, Wilson MK, Law BF, Theoret JR, Joens LA, Konkel ME,Angly F, Dinsdale EA, Edwards RA, Nelson KE, White BA: Comparativemetagenomics reveals host specific metavirulomes and horizontal genetransfer elements in the chicken cecum microbiome. PLoS One 2008, 3:e2945.
102. Warnecke F, Luginbühl P, Ivanova N, Ghassemian M, Richardson TH,Stege JT, Cayouette M, McHardy AC, Djordjevic G, Aboushadi N, Sorek R,Tringe SG, Podar M, Martin HG, Kunin V, Dalevi D, Madejska J, Kirton E,Platt D, Szeto E, Salamov A, Barry K, Mikhailova N, Kyrpides NC, Matson EG,Ottesen EA, Zhang X, Hernández M, Murillo C, Acosta LG, Rigoutsos I,Tamayo G, Green BD, Chang C, Rubin EM, Mathur EJ, Robertson DE,Hugenholtz P, Leadbetter JR: Metagenomic and functional analysis ofhindgut microbiota of a wood-feeding higher termite. Nature 2007,450:560-565.
103. Junker BH, Koschutzki D, Schreiber F: Exploration of biological networkcentralities with CentiBiN. BMC Bioinformatics 2006, 7:219.
104. Killcoyne S, Carter GW, Smith J, Boyle J: Cytoscape: a community-basedframework for network modeling. Methods Mol Biol 2009, 563:219-239.
105. Yuhong Z, Shi P, Liu W, Meng K, Bai Y, Wang G, Zhan Z, Yao B: Lipasediversity in glacier soil based on analysis of metagenomic DNAfragments and cell culture. J Microbiol Biotechnol 2009, 19:888-897.
106. Dagan T, Artzy-Randrup Y, Martin W: Modular networks and cumulativeimpact of lateral transfer in prokaryote genome evolution. Proc Natl AcadSci USA 2008, 105:10039-10044.
Bittner et al. Biology Direct 2010, 5:47http://www.biology-direct.com/content/5/1/47
Page 16 of 17
107. Johnson PL, Slatkin M: Inference of microbial recombination rates frommetagenomic data. PLoS Genet 2009, 5:e1000674.
108. Beja O, Spudich EN, Spudich JL, Leclerc M, DeLong EF: Proteorhodopsinphototrophy in the ocean. Nature 2001, 411:786-789.
109. Brazelton WJ, Baross JA: Abundant transposases encoded by themetagenome of a hydrothermal chimney biofilm. ISME J 2009,3:1420-1424.
110. Palenik B, Ren Q, Tai V, Paulsen IT: Coastal Synechococcus metagenomereveals major roles for horizontal gene transfer and plasmids inpopulation diversity. Environ Microbiol 2009, 11:349-359.
111. Walsh DA, Zaikova E, Howes CG, Song YC, Wright JJ, Tringe SG, Tortell PD,Hallam SJ: Metagenome of a versatile chemolithoautotroph fromexpanding oceanic dead zones. Science 2009, 326:578-582.
112. Tamura K, Dudley J, Nei M, Kumar S: MEGA4: Molecular EvolutionaryGenetics Analysis (MEGA) software version 4.0. Molecular Biology andEvolution 2007, 24:1596-1599.
113. Nylander JAA: MrModeltest v2 Evolutionary Biology Centre, UppsalaUniversity 2004.
114. Swofford DL: PAUP* Phylogenetic Analysis Using Parsimony* and othermethods Sinauer Associates 2002.
115. Pybus OG, Rambaut A: GENIE: estimating demographic history frommolecular phylogenies. Bioinformatics 2002, 18:1404-1405.
doi:10.1186/1745-6150-5-47Cite this article as: Bittner et al.: Some considerations for analyzingbiodiversity using integrative metagenomics and gene networks. BiologyDirect 2010 5:47.
Submit your next manuscript to BioMed Centraland take full advantage of:
• Convenient online submission
• Thorough peer review
• No space constraints or color figure charges
• Immediate publication on acceptance
• Inclusion in PubMed, CAS, Scopus and Google Scholar
• Research which is freely available for redistribution
Submit your manuscript at www.biomedcentral.com/submit
Bittner et al. Biology Direct 2010, 5:47http://www.biology-direct.com/content/5/1/47
Page 17 of 17
Related Documents