Some consequences of the partial crystallographic coherence between nanocrystalline domains in Ti–Al–N and Ti–Al–Si–N coatings D. Rafaja a, ⁎ , A. Poklad a , V. Klemm a , G. Schreiber a , D. Heger a , M. Šíma b , M. Dopita c a Institute of Materials Science, TU Bergakademie Freiberg, Gustav-Zeuner-Str. 5, D-09599 Freiberg, Germany b SHM Ltd., Průmyslová 3, CZ-787 01 Šumperk, Czech Republic c Department of Electronic Structures, Faculty of Mathematics and Physics, Charles University, Ke Karlovu 5, CZ-121 16 Prague, Czech Republic Received 4 October 2005; received in revised form 20 February 2006; accepted 20 February 2006 Available online 19 April 2006 Abstract Formation of partially coherent nanocrystalline domains, development of intrinsic residual stresses and the relationship between the partial coherence of crystallites and the hardness of vacuum-arc-deposited Ti–Al–N and Ti–Al–Si–N nanocomposites were investigated for different chemical compositions of the nanocomposites using a combination of the electron probe microanalysis, X-ray diffraction, transmission electron microscopy with high resolution and hardness measurement. Partial coherence of nanocrystalline domains was found to be a very important microstructural feature, which is strongly related to the correlated orientation of neighbouring crystallites and to the atomic ordering at the crystallite boundaries. Appropriate mutual orientation of neighbouring crystallites and suitable atomic ordering at the crystallite boundaries facilitate the development of intrinsic residual stresses, which influence directly the hardness of the nanocomposites. © 2006 Elsevier B.V. All rights reserved. Keywords: Transmission electron microscopy; Nanostructures; X-ray diffraction; Hardness; Nitrides 1. Introduction Nanocomposite coatings were proposed by Veprek et al. [1] about 10 years ago as novel promising super-hard materials. According to the Hall–Petch relationship [2,3], high density of grain boundaries was considered as the main reason for the extremely high hardness of this nanocomposites [4]. The optimum crystallite size was found to be approximately 3 nm [5–7], which is analogous to the optimum individual layer thickness observed in super-hard super-lattices [8,9]. The best performance of the nanocomposites shall be reached if the nanocrystallites are covered by one monolayer of an amorphous substance, e.g., a-Si 3 N 4 or a-BN [7,10,11]. For machining applications, high toughness and good chemical stability at temperatures exceeding 1000 °C are required besides the high hardness [12–14]. Thermal stability of the super-hard nano- composites was investigated comprehensively in the past [11,15–20]. These studies together with the considerations about the thermodynamics of the related systems yielded that the nanocomposites can be formed during a spinodal decom- position of immiscible or thermodynamically unstable sub- stances [19,21–24]. The properties of nanocomposites can be explained only with the aid of detailed microstructure analysis. Therefore, the analysis of the crystallite size is an obligatory procedure in the studies of super-hard nanocomposites. It is usually performed through the analysis of the X-ray diffraction (XRD) line broadening. However, standard procedures based on the classical kinematical diffraction theory can yield quite unreli- able results. This problem was discussed in [6], for instance. One source of this discrepancy is the decomposition process in immiscible or thermodynamically unstable or metastable systems [25], which, in nanocomposites, causes a partial coherence of neighbouring crystallites for X-ray diffraction [26]. This “crystallographic” coherence was described in [27] by a partial overlap of reciprocal lattice points for crystallites smaller than approximately 10nm that causes a “narrowing” of XRD lines in nanocrystalline materials. Recently, our results on the partial coherence of crystallites [27] were supported by Thin Solid Films 514 (2006) 240 – 249 www.elsevier.com/locate/tsf ⁎ Corresponding author. Tel.: +49 3731 39 2299. E-mail address: [email protected] (D. Rafaja). 0040-6090/$ - see front matter © 2006 Elsevier B.V. All rights reserved. doi:10.1016/j.tsf.2006.02.092

Welcome message from author
This document is posted to help you gain knowledge. Please leave a comment to let me know what you think about it! Share it to your friends and learn new things together.
Transcript
2006) 240–249www.elsevier.com/locate/tsf
Thin Solid Films 514 (
Some consequences of the partial crystallographic coherence betweennanocrystalline domains in Ti–Al–N and Ti–Al–Si–N coatings
D. Rafaja a,⁎, A. Poklad a, V. Klemm a, G. Schreiber a, D. Heger a, M. Šíma b, M. Dopita c
a Institute of Materials Science, TU Bergakademie Freiberg, Gustav-Zeuner-Str. 5, D-09599 Freiberg, Germanyb SHM Ltd., Průmyslová 3, CZ-787 01 Šumperk, Czech Republic
c Department of Electronic Structures, Faculty of Mathematics and Physics, Charles University, Ke Karlovu 5, CZ-121 16 Prague, Czech Republic
Received 4 October 2005; received in revised form 20 February 2006; accepted 20 February 2006Available online 19 April 2006
Abstract
Formation of partially coherent nanocrystalline domains, development of intrinsic residual stresses and the relationship between the partialcoherence of crystallites and the hardness of vacuum-arc-deposited Ti–Al–N and Ti–Al–Si–N nanocomposites were investigated for differentchemical compositions of the nanocomposites using a combination of the electron probe microanalysis, X-ray diffraction, transmission electronmicroscopy with high resolution and hardness measurement. Partial coherence of nanocrystalline domains was found to be a very importantmicrostructural feature, which is strongly related to the correlated orientation of neighbouring crystallites and to the atomic ordering at thecrystallite boundaries. Appropriate mutual orientation of neighbouring crystallites and suitable atomic ordering at the crystallite boundariesfacilitate the development of intrinsic residual stresses, which influence directly the hardness of the nanocomposites.© 2006 Elsevier B.V. All rights reserved.
Keywords: Transmission electron microscopy; Nanostructures; X-ray diffraction; Hardness; Nitrides
1. Introduction
Nanocomposite coatings were proposed by Veprek et al. [1]about 10years ago as novel promising super-hard materials.According to the Hall–Petch relationship [2,3], high density ofgrain boundaries was considered as the main reason for theextremely high hardness of this nanocomposites [4]. Theoptimum crystallite size was found to be approximately 3nm[5–7], which is analogous to the optimum individual layerthickness observed in super-hard super-lattices [8,9]. The bestperformance of the nanocomposites shall be reached if thenanocrystallites are covered by one monolayer of an amorphoussubstance, e.g., a-Si3N4 or a-BN [7,10,11]. For machiningapplications, high toughness and good chemical stability attemperatures exceeding 1000°C are required besides the highhardness [12–14]. Thermal stability of the super-hard nano-composites was investigated comprehensively in the past[11,15–20]. These studies together with the considerations
⁎ Corresponding author. Tel.: +49 3731 39 2299.E-mail address: [email protected] (D. Rafaja).
0040-6090/$ - see front matter © 2006 Elsevier B.V. All rights reserved.doi:10.1016/j.tsf.2006.02.092
about the thermodynamics of the related systems yielded thatthe nanocomposites can be formed during a spinodal decom-position of immiscible or thermodynamically unstable sub-stances [19,21–24].
The properties of nanocomposites can be explained onlywith the aid of detailed microstructure analysis. Therefore, theanalysis of the crystallite size is an obligatory procedure in thestudies of super-hard nanocomposites. It is usually performedthrough the analysis of the X-ray diffraction (XRD) linebroadening. However, standard procedures based on theclassical kinematical diffraction theory can yield quite unreli-able results. This problem was discussed in [6], for instance.One source of this discrepancy is the decomposition process inimmiscible or thermodynamically unstable or metastablesystems [25], which, in nanocomposites, causes a partialcoherence of neighbouring crystallites for X-ray diffraction[26]. This “crystallographic” coherence was described in [27]by a partial overlap of reciprocal lattice points for crystallitessmaller than approximately 10nm that causes a “narrowing” ofXRD lines in nanocrystalline materials. Recently, our results onthe partial coherence of crystallites [27] were supported by
000
111
200
002 202
311
004
113313
313
004
113
311
204204
202
115115
315
315
200
_111
_113
_113
_204_
204
_115
_115
_202
_202
_200
_200
_311
_311
_313
_313
_315
_315
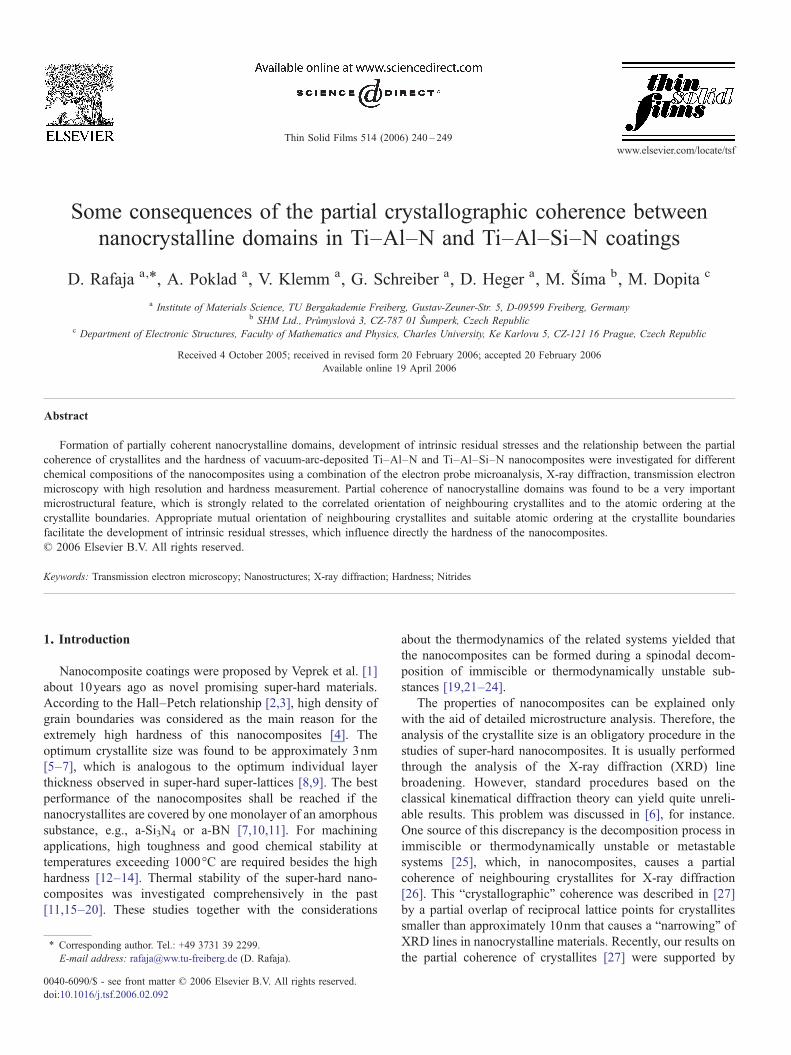
Fig. 1. Reciprocal lattice points of two mutually disoriented fcc crystallites (grayand black circles) projected into the x–y plane in the reciprocal space. Theoverlap of the reciprocal lattice points represents the degree of the partialcoherence of the crystallites [27]. Numbers inside the circles are the diffractionindices.
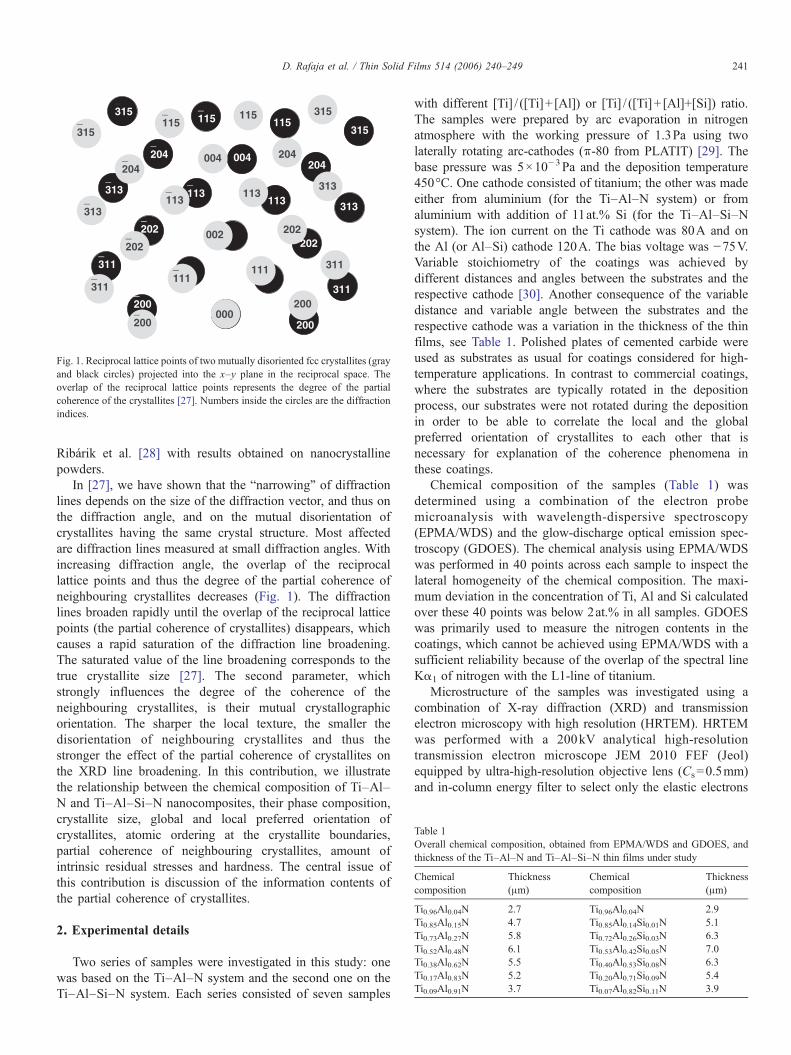
Table 1Overall chemical composition, obtained from EPMA/WDS and GDOES, andthickness of the Ti–Al–N and Ti–Al–Si–N thin films under study
Chemicalcomposition
Thickness(μm)
Chemicalcomposition
Thickness(μm)
Ti0.96Al0.04N 2.7 Ti0.96Al0.04N 2.9Ti0.85Al0.15N 4.7 Ti0.85Al0.14Si0.01N 5.1Ti0.73Al0.27N 5.8 Ti0.72Al0.26Si0.03N 6.3Ti0.52Al0.48N 6.1 Ti0.53Al0.42Si0.05N 7.0Ti0.38Al0.62N 5.5 Ti0.40Al0.53Si0.08N 6.3Ti0.17Al0.83N 5.2 Ti0.20Al0.71Si0.09N 5.4Ti0.09Al0.91N 3.7 Ti0.07Al0.82Si0.11N 3.9
241D. Rafaja et al. / Thin Solid Films 514 (2006) 240–249
Ribárik et al. [28] with results obtained on nanocrystallinepowders.
In [27], we have shown that the “narrowing” of diffractionlines depends on the size of the diffraction vector, and thus onthe diffraction angle, and on the mutual disorientation ofcrystallites having the same crystal structure. Most affectedare diffraction lines measured at small diffraction angles. Withincreasing diffraction angle, the overlap of the reciprocallattice points and thus the degree of the partial coherence ofneighbouring crystallites decreases (Fig. 1). The diffractionlines broaden rapidly until the overlap of the reciprocal latticepoints (the partial coherence of crystallites) disappears, whichcauses a rapid saturation of the diffraction line broadening.The saturated value of the line broadening corresponds to thetrue crystallite size [27]. The second parameter, whichstrongly influences the degree of the coherence of theneighbouring crystallites, is their mutual crystallographicorientation. The sharper the local texture, the smaller thedisorientation of neighbouring crystallites and thus thestronger the effect of the partial coherence of crystallites onthe XRD line broadening. In this contribution, we illustratethe relationship between the chemical composition of Ti–Al–N and Ti–Al–Si–N nanocomposites, their phase composition,crystallite size, global and local preferred orientation ofcrystallites, atomic ordering at the crystallite boundaries,partial coherence of neighbouring crystallites, amount ofintrinsic residual stresses and hardness. The central issue ofthis contribution is discussion of the information contents ofthe partial coherence of crystallites.
2. Experimental details
Two series of samples were investigated in this study: onewas based on the Ti–Al–N system and the second one on theTi–Al–Si–N system. Each series consisted of seven samples
with different [Ti] / ([Ti]+ [Al]) or [Ti] / ([Ti]+ [Al]+[Si]) ratio.The samples were prepared by arc evaporation in nitrogenatmosphere with the working pressure of 1.3Pa using twolaterally rotating arc-cathodes (π-80 from PLATIT) [29]. Thebase pressure was 5×10⁻³Pa and the deposition temperature450°C. One cathode consisted of titanium; the other was madeeither from aluminium (for the Ti–Al–N system) or fromaluminium with addition of 11at.% Si (for the Ti–Al–Si–Nsystem). The ion current on the Ti cathode was 80A and onthe Al (or Al–Si) cathode 120A. The bias voltage was −75V.Variable stoichiometry of the coatings was achieved bydifferent distances and angles between the substrates and therespective cathode [30]. Another consequence of the variabledistance and variable angle between the substrates and therespective cathode was a variation in the thickness of the thinfilms, see Table 1. Polished plates of cemented carbide wereused as substrates as usual for coatings considered for high-temperature applications. In contrast to commercial coatings,where the substrates are typically rotated in the depositionprocess, our substrates were not rotated during the depositionin order to be able to correlate the local and the globalpreferred orientation of crystallites to each other that isnecessary for explanation of the coherence phenomena inthese coatings.
Chemical composition of the samples (Table 1) wasdetermined using a combination of the electron probemicroanalysis with wavelength-dispersive spectroscopy(EPMA/WDS) and the glow-discharge optical emission spec-troscopy (GDOES). The chemical analysis using EPMA/WDSwas performed in 40 points across each sample to inspect thelateral homogeneity of the chemical composition. The maxi-mum deviation in the concentration of Ti, Al and Si calculatedover these 40 points was below 2at.% in all samples. GDOESwas primarily used to measure the nitrogen contents in thecoatings, which cannot be achieved using EPMA/WDS with asufficient reliability because of the overlap of the spectral lineKα1 of nitrogen with the L1-line of titanium.
Microstructure of the samples was investigated using acombination of X-ray diffraction (XRD) and transmissionelectron microscopy with high resolution (HRTEM). HRTEMwas performed with a 200kV analytical high-resolutiontransmission electron microscope JEM 2010 FEF (Jeol)equipped by ultra-high-resolution objective lens (Cs=0.5mm)and in-column energy filter to select only the elastic electrons
30 40 50 60 70 80
100
101
102
103
104
105
106
107
111
200
220
311
222
100
101
110
201
112
200
(f)
Inte
nsity
(arb
.uni
ts)
Diffraction angle (°2θ)
(a)
(b)
(c)
(d)
(e)
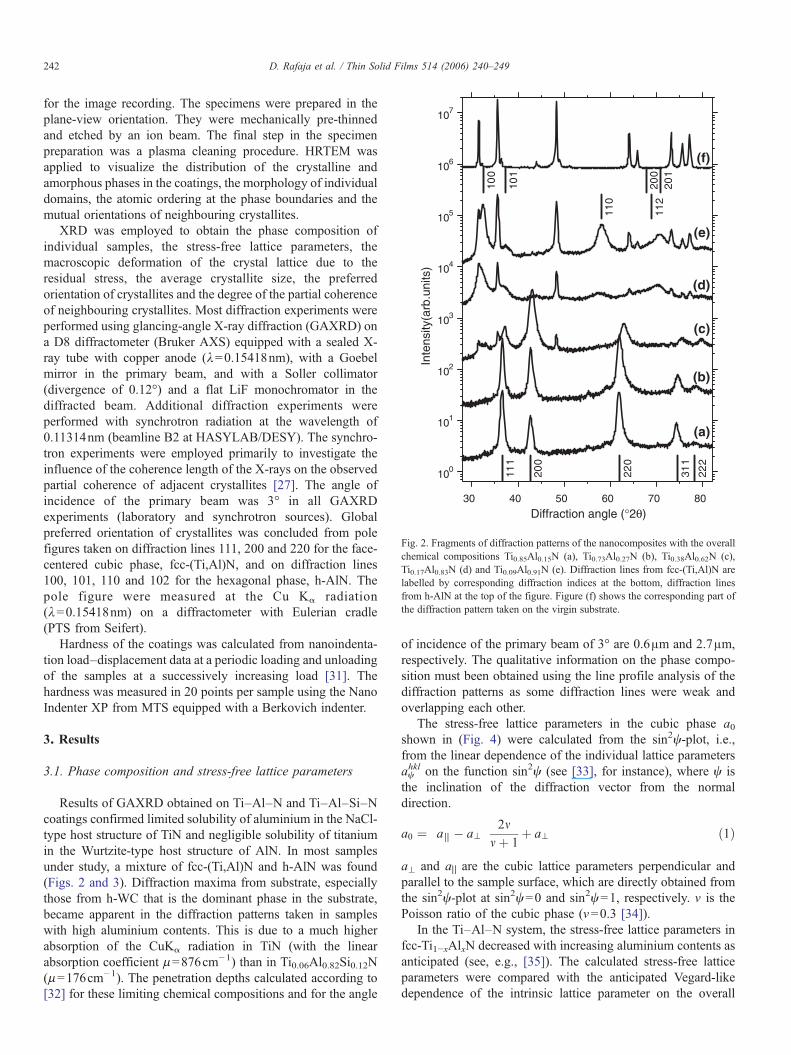
Fig. 2. Fragments of diffraction patterns of the nanocomposites with the overallchemical compositions Ti0.85Al0.15N (a), Ti0.73Al0.27N (b), Ti0.38Al0.62N (c),Ti0.17Al0.83N (d) and Ti0.09Al0.91N (e). Diffraction lines from fcc-(Ti,Al)N arelabelled by corresponding diffraction indices at the bottom, diffraction linesfrom h-AlN at the top of the figure. Figure (f) shows the corresponding part ofthe diffraction pattern taken on the virgin substrate.
242 D. Rafaja et al. / Thin Solid Films 514 (2006) 240–249
for the image recording. The specimens were prepared in theplane-view orientation. They were mechanically pre-thinnedand etched by an ion beam. The final step in the specimenpreparation was a plasma cleaning procedure. HRTEM wasapplied to visualize the distribution of the crystalline andamorphous phases in the coatings, the morphology of individualdomains, the atomic ordering at the phase boundaries and themutual orientations of neighbouring crystallites.
XRD was employed to obtain the phase composition ofindividual samples, the stress-free lattice parameters, themacroscopic deformation of the crystal lattice due to theresidual stress, the average crystallite size, the preferredorientation of crystallites and the degree of the partial coherenceof neighbouring crystallites. Most diffraction experiments wereperformed using glancing-angle X-ray diffraction (GAXRD) ona D8 diffractometer (Bruker AXS) equipped with a sealed X-ray tube with copper anode (λ=0.15418nm), with a Goebelmirror in the primary beam, and with a Soller collimator(divergence of 0.12°) and a flat LiF monochromator in thediffracted beam. Additional diffraction experiments wereperformed with synchrotron radiation at the wavelength of0.11314nm (beamline B2 at HASYLAB/DESY). The synchro-tron experiments were employed primarily to investigate theinfluence of the coherence length of the X-rays on the observedpartial coherence of adjacent crystallites [27]. The angle ofincidence of the primary beam was 3° in all GAXRDexperiments (laboratory and synchrotron sources). Globalpreferred orientation of crystallites was concluded from polefigures taken on diffraction lines 111, 200 and 220 for the face-centered cubic phase, fcc-(Ti,Al)N, and on diffraction lines100, 101, 110 and 102 for the hexagonal phase, h-AlN. Thepole figure were measured at the Cu Kα radiation(λ=0.15418nm) on a diffractometer with Eulerian cradle(PTS from Seifert).
Hardness of the coatings was calculated from nanoindenta-tion load–displacement data at a periodic loading and unloadingof the samples at a successively increasing load [31]. Thehardness was measured in 20 points per sample using the NanoIndenter XP from MTS equipped with a Berkovich indenter.
3. Results
3.1. Phase composition and stress-free lattice parameters
Results of GAXRD obtained on Ti–Al–N and Ti–Al–Si–Ncoatings confirmed limited solubility of aluminium in the NaCl-type host structure of TiN and negligible solubility of titaniumin the Wurtzite-type host structure of AlN. In most samplesunder study, a mixture of fcc-(Ti,Al)N and h-AlN was found(Figs. 2 and 3). Diffraction maxima from substrate, especiallythose from h-WC that is the dominant phase in the substrate,became apparent in the diffraction patterns taken in sampleswith high aluminium contents. This is due to a much higherabsorption of the CuKα radiation in TiN (with the linearabsorption coefficient μ=876cm−1) than in Ti0.06Al0.82Si0.12N(μ=176cm−1). The penetration depths calculated according to[32] for these limiting chemical compositions and for the angle
of incidence of the primary beam of 3° are 0.6μm and 2.7μm,respectively. The qualitative information on the phase compo-sition must been obtained using the line profile analysis of thediffraction patterns as some diffraction lines were weak andoverlapping each other.
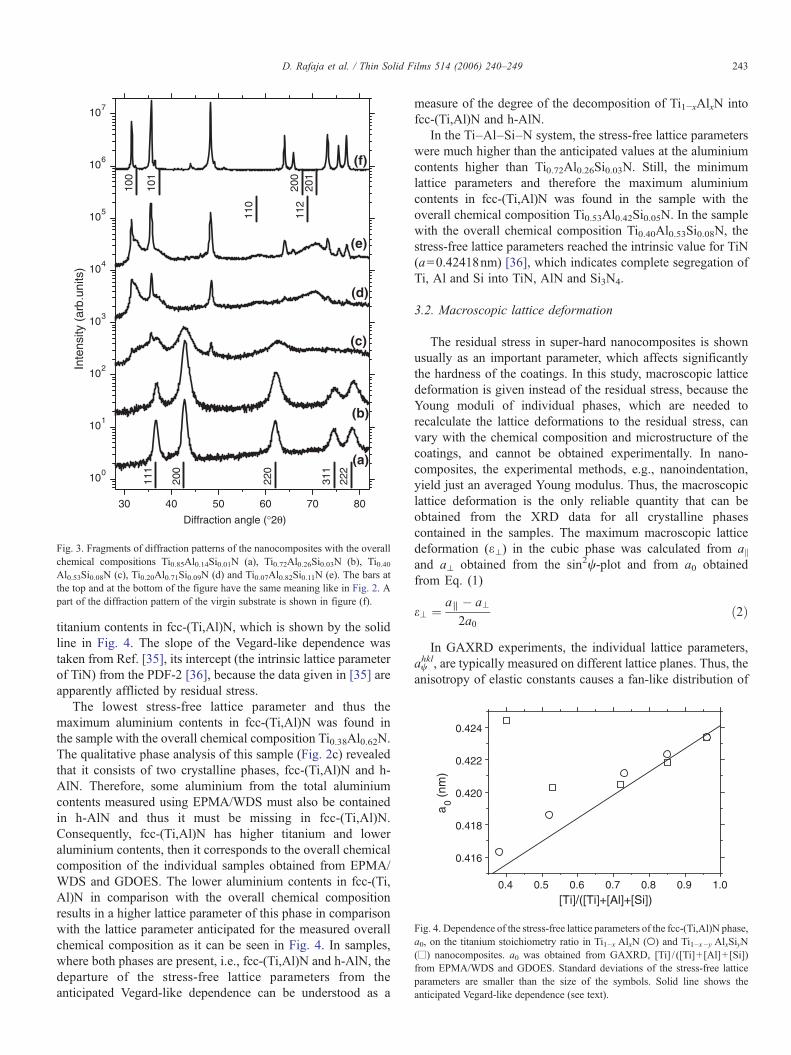
The stress-free lattice parameters in the cubic phase a0shown in (Fig. 4) were calculated from the sin2ψ-plot, i.e.,from the linear dependence of the individual lattice parametersaψhkl on the function sin2ψ (see [33], for instance), where ψ is
the inclination of the diffraction vector from the normaldirection.
a0 ¼ at � a8� � 2m
mþ 1þ a8 ð1Þ
a⊥ and a‖ are the cubic lattice parameters perpendicular andparallel to the sample surface, which are directly obtained fromthe sin2ψ-plot at sin2ψ=0 and sin2ψ=1, respectively. ν is thePoisson ratio of the cubic phase (ν=0.3 [34]).
In the Ti–Al–N system, the stress-free lattice parameters infcc-Ti1−xAlxN decreased with increasing aluminium contents asanticipated (see, e.g., [35]). The calculated stress-free latticeparameters were compared with the anticipated Vegard-likedependence of the intrinsic lattice parameter on the overall
0.4 0.5 0.6 0.7 0.8 0.9 1.0
0.416
0.418
0.420
0.422
0.424
a0
(nm
)
[Ti]/([Ti]+[Al]+[Si])
Fig. 4. Dependence of the stress-free lattice parameters of the fcc-(Ti,Al)N phase,a0, on the titanium stoichiometry ratio in Ti1−x AlxN (○) and Ti1−x−y AlxSiyN(□) nanocomposites. a0 was obtained from GAXRD, [Ti] / ([Ti]+ [Al]+ [Si])from EPMA/WDS and GDOES. Standard deviations of the stress-free latticeparameters are smaller than the size of the symbols. Solid line shows theanticipated Vegard-like dependence (see text).
30 40 50 60 70 80
100
101
102
103
104
105
106
107
111
200
220
311
222
100
101
110
201
112
200
(f)
(e)
(d)
(c)
(b)
Inte
nsity
(ar
b.un
its)
Diffraction angle (°2θ)
(a)
Fig. 3. Fragments of diffraction patterns of the nanocomposites with the overallchemical compositions Ti0.85Al0.14Si0.01N (a), Ti0.72Al0.26Si0.03N (b), Ti0.40Al0.53Si0.08N (c), Ti0.20Al0.71Si0.09N (d) and Ti0.07Al0.82Si0.11N (e). The bars atthe top and at the bottom of the figure have the same meaning like in Fig. 2. Apart of the diffraction pattern of the virgin substrate is shown in figure (f).
243D. Rafaja et al. / Thin Solid Films 514 (2006) 240–249
titanium contents in fcc-(Ti,Al)N, which is shown by the solidline in Fig. 4. The slope of the Vegard-like dependence wastaken from Ref. [35], its intercept (the intrinsic lattice parameterof TiN) from the PDF-2 [36], because the data given in [35] areapparently afflicted by residual stress.
The lowest stress-free lattice parameter and thus themaximum aluminium contents in fcc-(Ti,Al)N was found inthe sample with the overall chemical composition Ti0.38Al0.62N.The qualitative phase analysis of this sample (Fig. 2c) revealedthat it consists of two crystalline phases, fcc-(Ti,Al)N and h-AlN. Therefore, some aluminium from the total aluminiumcontents measured using EPMA/WDS must also be containedin h-AlN and thus it must be missing in fcc-(Ti,Al)N.Consequently, fcc-(Ti,Al)N has higher titanium and loweraluminium contents, then it corresponds to the overall chemicalcomposition of the individual samples obtained from EPMA/WDS and GDOES. The lower aluminium contents in fcc-(Ti,Al)N in comparison with the overall chemical compositionresults in a higher lattice parameter of this phase in comparisonwith the lattice parameter anticipated for the measured overallchemical composition as it can be seen in Fig. 4. In samples,where both phases are present, i.e., fcc-(Ti,Al)N and h-AlN, thedeparture of the stress-free lattice parameters from theanticipated Vegard-like dependence can be understood as a
measure of the degree of the decomposition of Ti1−xAlxN intofcc-(Ti,Al)N and h-AlN.
In the Ti–Al–Si–N system, the stress-free lattice parameterswere much higher than the anticipated values at the aluminiumcontents higher than Ti0.72Al0.26Si0.03N. Still, the minimumlattice parameters and therefore the maximum aluminiumcontents in fcc-(Ti,Al)N was found in the sample with theoverall chemical composition Ti0.53Al0.42Si0.05N. In the samplewith the overall chemical composition Ti0.40Al0.53Si0.08N, thestress-free lattice parameters reached the intrinsic value for TiN(a=0.42418nm) [36], which indicates complete segregation ofTi, Al and Si into TiN, AlN and Si3N4.
3.2. Macroscopic lattice deformation
The residual stress in super-hard nanocomposites is shownusually as an important parameter, which affects significantlythe hardness of the coatings. In this study, macroscopic latticedeformation is given instead of the residual stress, because theYoung moduli of individual phases, which are needed torecalculate the lattice deformations to the residual stress, canvary with the chemical composition and microstructure of thecoatings, and cannot be obtained experimentally. In nano-composites, the experimental methods, e.g., nanoindentation,yield just an averaged Young modulus. Thus, the macroscopiclattice deformation is the only reliable quantity that can beobtained from the XRD data for all crystalline phasescontained in the samples. The maximum macroscopic latticedeformation (ε⊥) in the cubic phase was calculated from a||and a⊥ obtained from the sin2ψ-plot and from a0 obtainedfrom Eq. (1)
e8 ¼ at � a82a0
ð2Þ
In GAXRD experiments, the individual lattice parameters,aψhkl, are typically measured on different lattice planes. Thus, the
anisotropy of elastic constants causes a fan-like distribution of

0.4 0.5 0.6 0.7 0.8 0.9 1.0-12
-10
-8
-6
-4
-2
0
ε (1
0-3 )
[Ti]/([Ti]+[Al]+[Si])
Fig. 5. Dependence of the macroscopic lattice deformation in the fcc-(Ti,Al)Nphase on the titanium stoichiometry ratio in Ti1−xAlxN (○) and Ti1−x−yAlxSiyN(□) nanocomposites. The standard deviations are comparable with the size ofthe symbols.
0.3
0.4
0.5
nm-1
)
244 D. Rafaja et al. / Thin Solid Films 514 (2006) 240–249
the individual lattice parameters [32]. To separate the influenceof the elastic anisotropy on the calculated lattice deformation,the scattering of the individual lattice parameters was correctedusing the routine described in [32].
The dependence of the macroscopic lattice deformation onthe overall titanium contents in individual samples is shownfor both series of samples in Fig. 5. The lattice deformation issubstantially larger in the silicon-free samples than in thesamples with silicon. In the Ti–Al–N system, the macroscopiclattice deformation is a monotonous function of the titaniumcontents up to Ti0.38Al0.62N. In the Ti–Al–Si–N system, themacroscopic lattice deformation has a similar functionaldependence on the overall titanium contents like thecorresponding stress-free lattice parameter (compare Figs. 4and 5). The decomposition of Ti–Al–Si–N into fcc-(Ti,Al)N,h-AlN and a-Si3N4, which was indicated by the largedeparture of the stress-free lattice parameter from theanticipated Vegard-like dependence (Fig. 4), is related to a
0.0 0.2 0.4 0.6 0.8 1.02
3
4
5
6
7
8
9
Cry
stal
lite
size
(nm
)
[Ti]/([Ti]+[Al]+[Si])
Fig. 6. Dependence of the crystallite size on the stoichiometry ratio of titaniumin Ti1−xAlxN (○) and Ti1−x−yAlxSiyN (□) nanocomposites. The crystallite sizerefers to the dominant phase in the samples, which is the fcc-(Ti,Al)N for [Ti] /([Ti]+ [Al]+[Si])>0.3 and h-AlN for [Ti] / ([Ti]+ [Al]+ [Si])<0.3. Lines areguides for eye.
relaxation of the macroscopic lattice deformation in the cubicphase (Fig. 5). In the sample Ti0.40Al0.53Si0.08N, in which Ti,Al and Si were completely separated into TiN, AlN and a-Si3N4, the macroscopic deformation of the cubic latticedisappeared.
Macroscopic lattice deformation in the hexagonal phase wasmeasured in the aluminium-richest samples, in which h-AlNwasthe dominant phase. The experimental values were −37×10−3
and −32×10−3 for the samples with the overall chemicalcomposition of Ti0.20Al0.71Si0.09N and Ti0.07 Al0.82Si0.11N,respectively. The higher macroscopic lattice deformation in thehexagonal phase, as compared to the fcc phase, is due to its lowerYoungmodulus. Themacroscopic lattice deformation (ε⊥) in thehexagonal phase was obtained from the linear dependence of thelattice deformation εψ
hkl on sin2ψ.
ehklw udhklw � dhkl0
dhkl0
¼ et � e8� �
sin2wþ e8 ð3Þ
dψhkl and d0
hkl are the measured and the stress-free interplanardistances, respectively. The intrinsic interplanar distances for h-AlN were taken from the PDF-2 [36]. Such a calculation of thelattice deformation is only possible for phases, in which thelattice parameters or the interplanar distances do not depend onthe composition. This is true for h-AlN, which is a phase withextremely narrow homogeneity range.
20 40 60 80 100
0.0
0.1
0.2
Line
bre
adth
(
q (nm-1)
Fig. 7. Dependence of the XRD line broadening in the fcc phase on the size ofthe diffraction vector (q=4π sin θ/λ) as observed in the samples Ti0.85Al0.14Si0.01N (□), Ti0.72Al0.26Si0.03N (○), Ti0.40Al0.53Si0.08N (△) and Ti0.38Al0.62N(▲). The last sample was measured using the synchrotron radiation. Solid linesshow the dependence of the line broadening on the diffraction vector calculatedaccording to Ref. [27]. Dashed lines show the maximum spread of the linebreadths, which causes the experimental error in the crystallite size of ±0.2nm.
245D. Rafaja et al. / Thin Solid Films 514 (2006) 240–249
3.3. Atomic model of the Ti–Al–N and Ti–Al–Si–Nnanocomposites
Average crystallite size and the degree of the partial coherenceof neighbouring crystallites were determined from the depen-dence of the XRD line broadening on the size of the diffractionvector using the approach [27], which takes the partial coherenceof crystallites into account. In all samples under study, thecrystallite size was below 8 nm and decreased with increasingaluminium contents up to [Ti] / ([Ti]+[Al]+[Si])≈0.4 (Fig. 6). Inthe samples with [Ti] / ([Ti]+[Al]+[Si])<0.4, in which h-AlNdominates, the crystallite size slightly increased with increasingaluminium contents. In the Ti–Al–N system, cubic crystalliteswere partially coherent in all samples. In the Ti–Al–Si–Nsystem, cubic crystallites were partially coherent only up to thesample composition of Ti0.53Al0.42Si0.05N. For higher silicon(and aluminium) contents, the crystallites are non-coherent asfollows from the constant XRD line broadening observed for thesample Ti0.40Al0.53Si0.08N (Fig. 7). The comparison of both seriesof samples (with and without silicon), and particularly thecomparison of the samples Ti0.38Al0.62N and Ti0.40Al0.53Si0.08N,clearly shows that high silicon content in the coatings hinders themutual coherence of crystallites.
A requirement for the partial coherence of crystallites is theirstrong local preferred orientation (see Ref. [27] and Fig. 1).
-1 -0.5 0 0.5 1-1
-0.5
0
0.5
1
-
-1
-0.5
0
0.5
1
-
-1 -0.5 0 0.5 1
-
111
111
111_
111_
(a)
(c)
sin
Χ s
in Φ
sin
Χ s
in Φ
sin Χ cos Φ
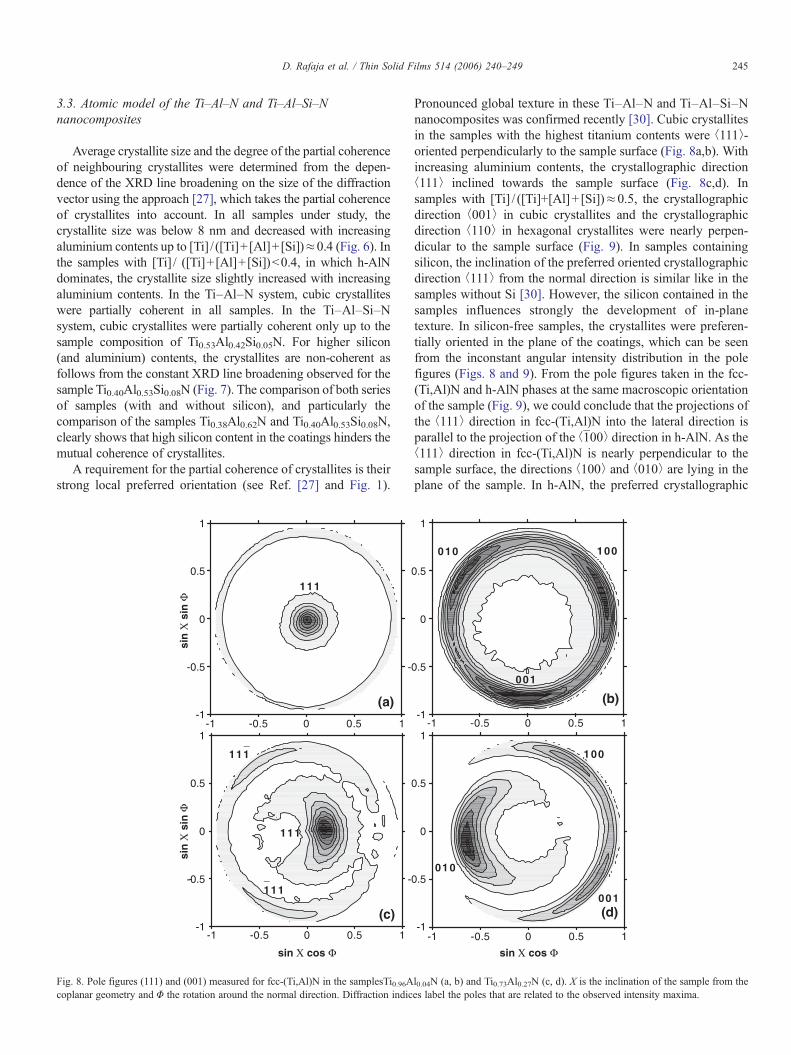
Fig. 8. Pole figures (111) and (001) measured for fcc-(Ti,Al)N in the samplesTi0.96Acoplanar geometry and Φ the rotation around the normal direction. Diffraction indic
Pronounced global texture in these Ti–Al–N and Ti–Al–Si–Nnanocomposites was confirmed recently [30]. Cubic crystallitesin the samples with the highest titanium contents were ⟨111⟩-oriented perpendicularly to the sample surface (Fig. 8a,b). Withincreasing aluminium contents, the crystallographic direction⟨111⟩ inclined towards the sample surface (Fig. 8c,d). Insamples with [Ti] / ([Ti]+[Al]+ [Si])≈0.5, the crystallographicdirection ⟨001⟩ in cubic crystallites and the crystallographicdirection ⟨110⟩ in hexagonal crystallites were nearly perpen-dicular to the sample surface (Fig. 9). In samples containingsilicon, the inclination of the preferred oriented crystallographicdirection ⟨111⟩ from the normal direction is similar like in thesamples without Si [30]. However, the silicon contained in thesamples influences strongly the development of in-planetexture. In silicon-free samples, the crystallites were preferen-tially oriented in the plane of the coatings, which can be seenfrom the inconstant angular intensity distribution in the polefigures (Figs. 8 and 9). From the pole figures taken in the fcc-(Ti,Al)N and h-AlN phases at the same macroscopic orientationof the sample (Fig. 9), we could conclude that the projections ofthe ⟨111⟩ direction in fcc-(Ti,Al)N into the lateral direction isparallel to the projection of the ⟨1̄00⟩ direction in h-AlN. As the⟨111⟩ direction in fcc-(Ti,Al)N is nearly perpendicular to thesample surface, the directions ⟨100⟩ and ⟨010⟩ are lying in theplane of the sample. In h-AlN, the preferred crystallographic
-1
0.5
0
0.5
1
-1
0.5
0
0.5
1-1 -0.5 0 0.5 1
-1 -0.5 0 0.5 1
010 100
001
010
100
001
(b)
(d)
sin Χ cos Φ
l0.04N (a, b) and Ti0.73Al0.27N (c, d). X is the inclination of the sample from thees label the poles that are related to the observed intensity maxima.
-1 -0.5 0 0.5 1-1
-0.5
0
0.5
1
-1
-0.5
0
0.5
1
-1
-0.5
0
0.5
1
-1
-0.5
0
0.5
1
-1 -0.5 0 0.5 1
-1 -0.5 0 0.5 1 -1 -0.5 0 0.5 1
(a) (b)
(c) (d)
110
001
111
111__ 010
_
100
_100
sin Χ cos Φ sin Χ cos Φ
sin
Χ s
in Φ
sin
Χ s
in Φ
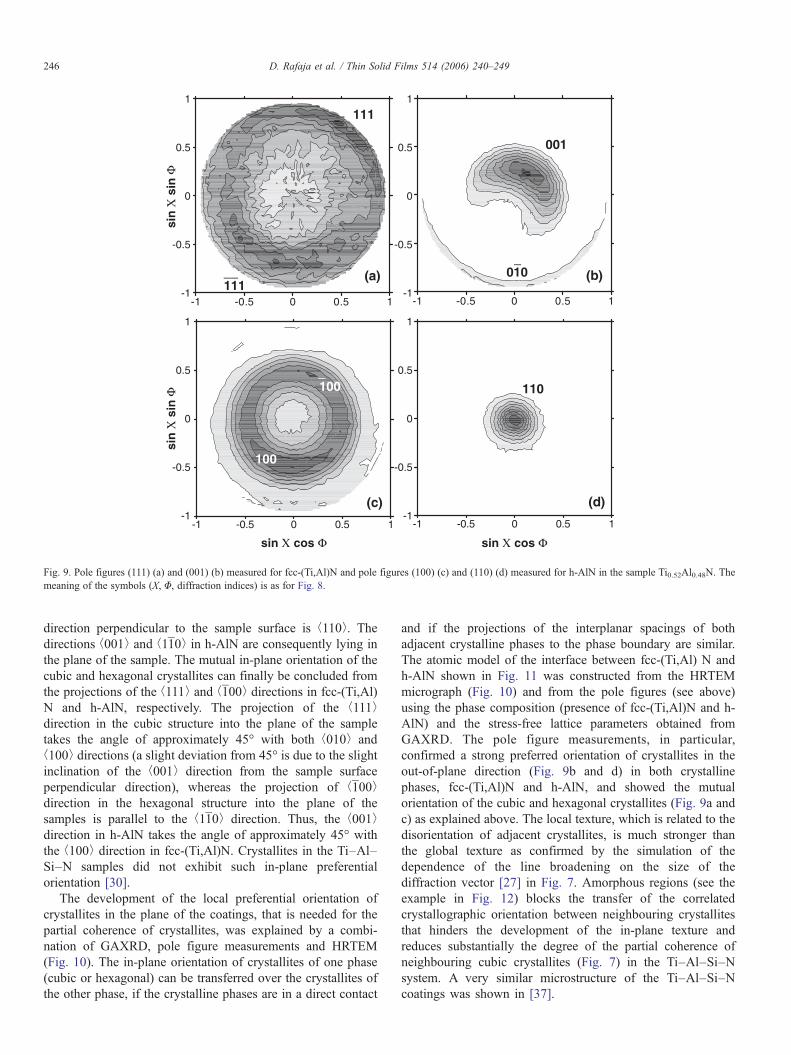
Fig. 9. Pole figures (111) (a) and (001) (b) measured for fcc-(Ti,Al)N and pole figures (100) (c) and (110) (d) measured for h-AlN in the sample Ti0.52Al0.48N. Themeaning of the symbols (X, Φ, diffraction indices) is as for Fig. 8.
246 D. Rafaja et al. / Thin Solid Films 514 (2006) 240–249
direction perpendicular to the sample surface is ⟨110⟩. Thedirections ⟨001⟩ and ⟨11̄0⟩ in h-AlN are consequently lying inthe plane of the sample. The mutual in-plane orientation of thecubic and hexagonal crystallites can finally be concluded fromthe projections of the ⟨111⟩ and ⟨1̄00⟩ directions in fcc-(Ti,Al)N and h-AlN, respectively. The projection of the ⟨111⟩direction in the cubic structure into the plane of the sampletakes the angle of approximately 45° with both ⟨010⟩ and⟨100⟩ directions (a slight deviation from 45° is due to the slightinclination of the ⟨001⟩ direction from the sample surfaceperpendicular direction), whereas the projection of ⟨1̄00⟩direction in the hexagonal structure into the plane of thesamples is parallel to the ⟨11̄0⟩ direction. Thus, the ⟨001⟩direction in h-AlN takes the angle of approximately 45° withthe ⟨100⟩ direction in fcc-(Ti,Al)N. Crystallites in the Ti–Al–Si–N samples did not exhibit such in-plane preferentialorientation [30].
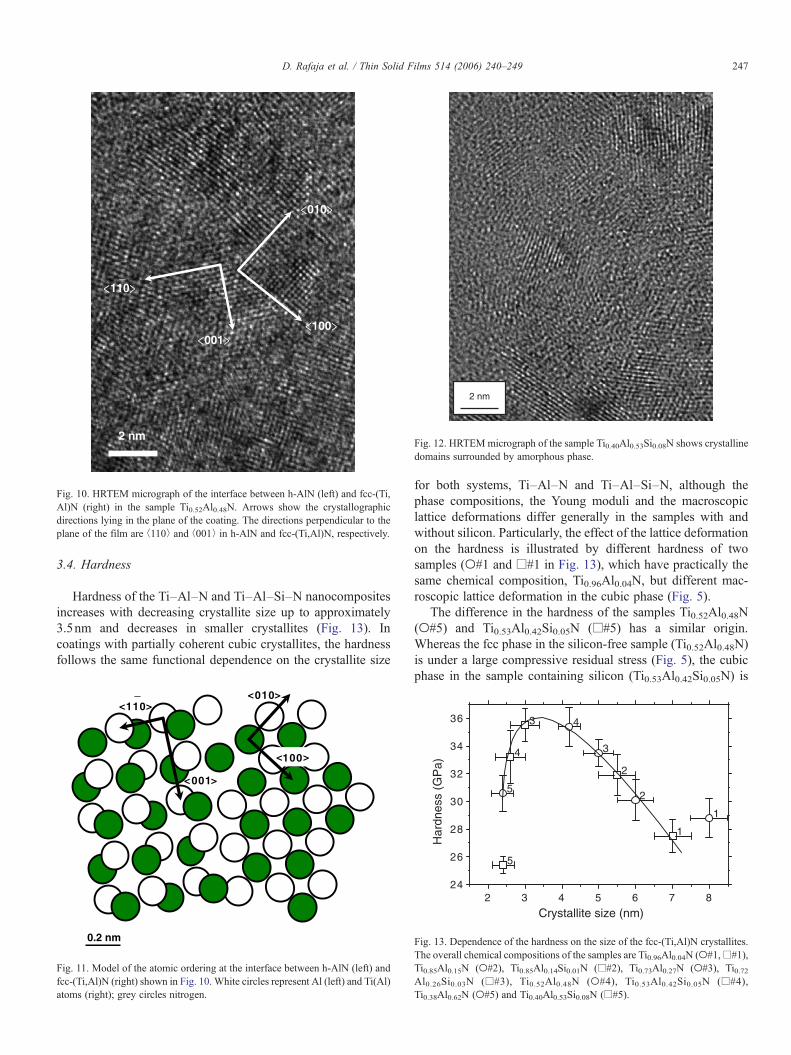
The development of the local preferential orientation ofcrystallites in the plane of the coatings, that is needed for thepartial coherence of crystallites, was explained by a combi-nation of GAXRD, pole figure measurements and HRTEM(Fig. 10). The in-plane orientation of crystallites of one phase(cubic or hexagonal) can be transferred over the crystallites ofthe other phase, if the crystalline phases are in a direct contact
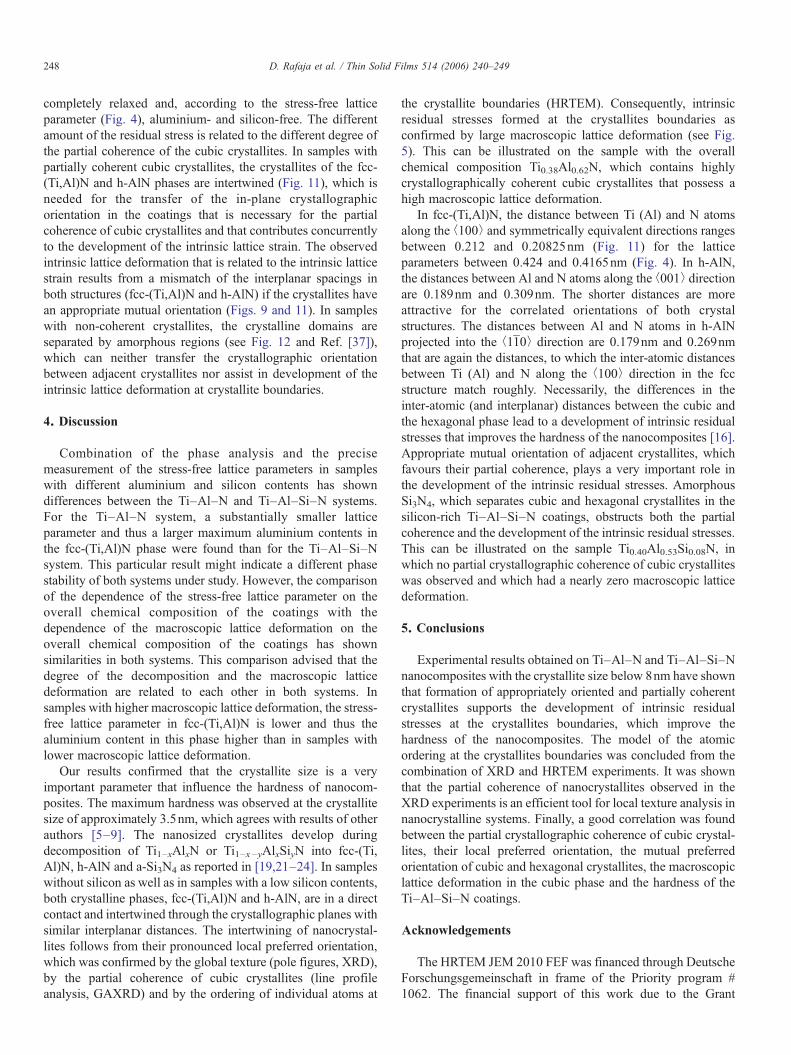
and if the projections of the interplanar spacings of bothadjacent crystalline phases to the phase boundary are similar.The atomic model of the interface between fcc-(Ti,Al) N andh-AlN shown in Fig. 11 was constructed from the HRTEMmicrograph (Fig. 10) and from the pole figures (see above)using the phase composition (presence of fcc-(Ti,Al)N and h-AlN) and the stress-free lattice parameters obtained fromGAXRD. The pole figure measurements, in particular,confirmed a strong preferred orientation of crystallites in theout-of-plane direction (Fig. 9b and d) in both crystallinephases, fcc-(Ti,Al)N and h-AlN, and showed the mutualorientation of the cubic and hexagonal crystallites (Fig. 9a andc) as explained above. The local texture, which is related to thedisorientation of adjacent crystallites, is much stronger thanthe global texture as confirmed by the simulation of thedependence of the line broadening on the size of thediffraction vector [27] in Fig. 7. Amorphous regions (see theexample in Fig. 12) blocks the transfer of the correlatedcrystallographic orientation between neighbouring crystallitesthat hinders the development of the in-plane texture andreduces substantially the degree of the partial coherence ofneighbouring cubic crystallites (Fig. 7) in the Ti–Al–Si–Nsystem. A very similar microstructure of the Ti–Al–Si–Ncoatings was shown in [37].
2 nm
Fig. 12. HRTEMmicrograph of the sample Ti0.40Al0.53Si0.08N shows crystallinedomains surrounded by amorphous phase.
_
<010 <
<100 <<001 <
<110 <
2 nm
Fig. 10. HRTEM micrograph of the interface between h-AlN (left) and fcc-(Ti,Al)N (right) in the sample Ti0.52Al0.48N. Arrows show the crystallographicdirections lying in the plane of the coating. The directions perpendicular to theplane of the film are ⟨110⟩ and ⟨001⟩ in h-AlN and fcc-(Ti,Al)N, respectively.
247D. Rafaja et al. / Thin Solid Films 514 (2006) 240–249
3.4. Hardness
Hardness of the Ti–Al–N and Ti–Al–Si–N nanocompositesincreases with decreasing crystallite size up to approximately3.5nm and decreases in smaller crystallites (Fig. 13). Incoatings with partially coherent cubic crystallites, the hardnessfollows the same functional dependence on the crystallite size
_ 110
001
01< >0
100
0.2 nm
< >
< >
< >
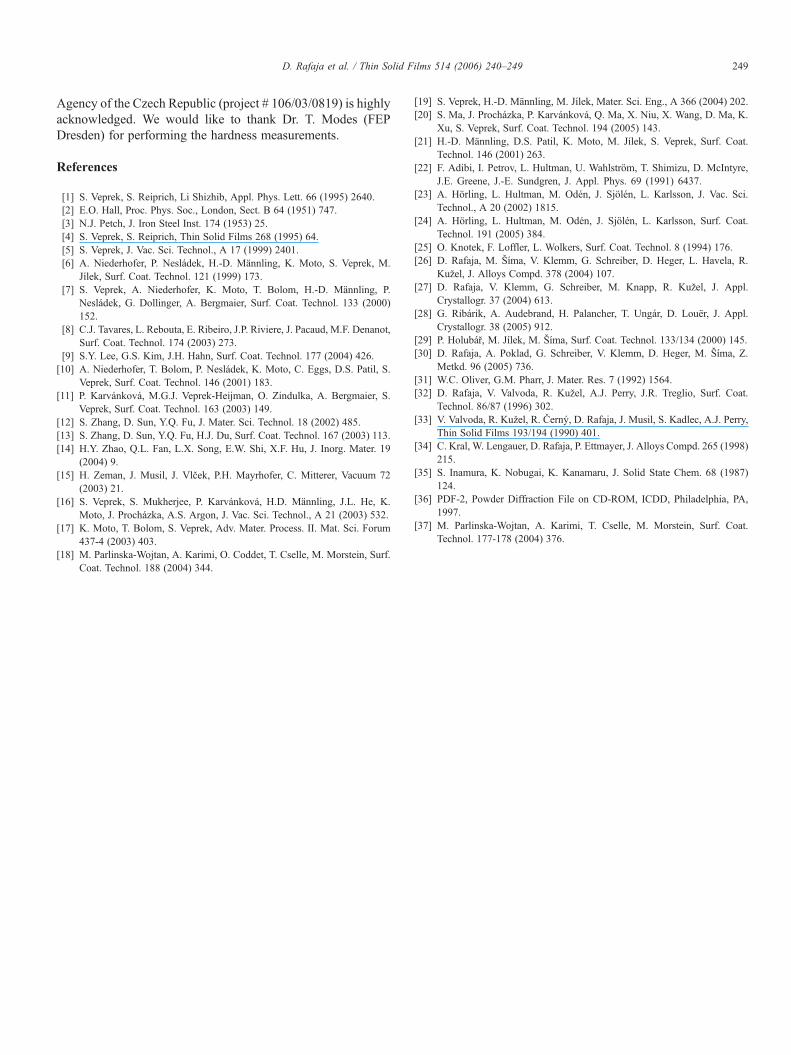
Fig. 11. Model of the atomic ordering at the interface between h-AlN (left) andfcc-(Ti,Al)N (right) shown in Fig. 10. White circles represent Al (left) and Ti(Al)atoms (right); grey circles nitrogen.
for both systems, Ti–Al–N and Ti–Al–Si–N, although thephase compositions, the Young moduli and the macroscopiclattice deformations differ generally in the samples with andwithout silicon. Particularly, the effect of the lattice deformationon the hardness is illustrated by different hardness of twosamples (○#1 and □#1 in Fig. 13), which have practically thesame chemical composition, Ti0.96Al0.04N, but different mac-roscopic lattice deformation in the cubic phase (Fig. 5).
The difference in the hardness of the samples Ti0.52Al0.48N(○#5) and Ti0.53Al0.42Si0.05N (□#5) has a similar origin.Whereas the fcc phase in the silicon-free sample (Ti0.52Al0.48N)is under a large compressive residual stress (Fig. 5), the cubicphase in the sample containing silicon (Ti0.53Al0.42Si0.05N) is
2 3 4 5 6 7 824
26
28
30
32
34
36
1
2
3
4
5
1
2
3
4
5
Har
dnes
s (G
Pa)
Crystallite size (nm)
Fig. 13. Dependence of the hardness on the size of the fcc-(Ti,Al)N crystallites.The overall chemical compositions of the samples are Ti0.96Al0.04N (○#1,□#1),Ti0.85Al0.15N (○#2), Ti0.85Al0.14Si0.01N (□#2), Ti0.73Al0.27N (○#3), Ti0.72Al0.26Si0.03N (□#3), Ti0.52Al0.48N (○#4), Ti0.53Al0.42Si0.05N (□#4),Ti0.38Al0.62N (○#5) and Ti0.40Al0.53Si0.08N (□#5).
248 D. Rafaja et al. / Thin Solid Films 514 (2006) 240–249
completely relaxed and, according to the stress-free latticeparameter (Fig. 4), aluminium- and silicon-free. The differentamount of the residual stress is related to the different degree ofthe partial coherence of the cubic crystallites. In samples withpartially coherent cubic crystallites, the crystallites of the fcc-(Ti,Al)N and h-AlN phases are intertwined (Fig. 11), which isneeded for the transfer of the in-plane crystallographicorientation in the coatings that is necessary for the partialcoherence of cubic crystallites and that contributes concurrentlyto the development of the intrinsic lattice strain. The observedintrinsic lattice deformation that is related to the intrinsic latticestrain results from a mismatch of the interplanar spacings inboth structures (fcc-(Ti,Al)N and h-AlN) if the crystallites havean appropriate mutual orientation (Figs. 9 and 11). In sampleswith non-coherent crystallites, the crystalline domains areseparated by amorphous regions (see Fig. 12 and Ref. [37]),which can neither transfer the crystallographic orientationbetween adjacent crystallites nor assist in development of theintrinsic lattice deformation at crystallite boundaries.
4. Discussion
Combination of the phase analysis and the precisemeasurement of the stress-free lattice parameters in sampleswith different aluminium and silicon contents has showndifferences between the Ti–Al–N and Ti–Al–Si–N systems.For the Ti–Al–N system, a substantially smaller latticeparameter and thus a larger maximum aluminium contents inthe fcc-(Ti,Al)N phase were found than for the Ti–Al–Si–Nsystem. This particular result might indicate a different phasestability of both systems under study. However, the comparisonof the dependence of the stress-free lattice parameter on theoverall chemical composition of the coatings with thedependence of the macroscopic lattice deformation on theoverall chemical composition of the coatings has shownsimilarities in both systems. This comparison advised that thedegree of the decomposition and the macroscopic latticedeformation are related to each other in both systems. Insamples with higher macroscopic lattice deformation, the stress-free lattice parameter in fcc-(Ti,Al)N is lower and thus thealuminium content in this phase higher than in samples withlower macroscopic lattice deformation.
Our results confirmed that the crystallite size is a veryimportant parameter that influence the hardness of nanocom-posites. The maximum hardness was observed at the crystallitesize of approximately 3.5nm, which agrees with results of otherauthors [5–9]. The nanosized crystallites develop duringdecomposition of Ti1−xAlxN or Ti1−x−yAlxSiyN into fcc-(Ti,Al)N, h-AlN and a-Si3N4 as reported in [19,21–24]. In sampleswithout silicon as well as in samples with a low silicon contents,both crystalline phases, fcc-(Ti,Al)N and h-AlN, are in a directcontact and intertwined through the crystallographic planes withsimilar interplanar distances. The intertwining of nanocrystal-lites follows from their pronounced local preferred orientation,which was confirmed by the global texture (pole figures, XRD),by the partial coherence of cubic crystallites (line profileanalysis, GAXRD) and by the ordering of individual atoms at
the crystallite boundaries (HRTEM). Consequently, intrinsicresidual stresses formed at the crystallites boundaries asconfirmed by large macroscopic lattice deformation (see Fig.5). This can be illustrated on the sample with the overallchemical composition Ti0.38Al0.62N, which contains highlycrystallographically coherent cubic crystallites that possess ahigh macroscopic lattice deformation.
In fcc-(Ti,Al)N, the distance between Ti (Al) and N atomsalong the ⟨100⟩ and symmetrically equivalent directions rangesbetween 0.212 and 0.20825nm (Fig. 11) for the latticeparameters between 0.424 and 0.4165nm (Fig. 4). In h-AlN,the distances between Al and N atoms along the ⟨001⟩ directionare 0.189nm and 0.309nm. The shorter distances are moreattractive for the correlated orientations of both crystalstructures. The distances between Al and N atoms in h-AlNprojected into the ⟨11̄0⟩ direction are 0.179nm and 0.269nmthat are again the distances, to which the inter-atomic distancesbetween Ti (Al) and N along the ⟨100⟩ direction in the fccstructure match roughly. Necessarily, the differences in theinter-atomic (and interplanar) distances between the cubic andthe hexagonal phase lead to a development of intrinsic residualstresses that improves the hardness of the nanocomposites [16].Appropriate mutual orientation of adjacent crystallites, whichfavours their partial coherence, plays a very important role inthe development of the intrinsic residual stresses. AmorphousSi3N4, which separates cubic and hexagonal crystallites in thesilicon-rich Ti–Al–Si–N coatings, obstructs both the partialcoherence and the development of the intrinsic residual stresses.This can be illustrated on the sample Ti0.40Al0.53Si0.08N, inwhich no partial crystallographic coherence of cubic crystalliteswas observed and which had a nearly zero macroscopic latticedeformation.
5. Conclusions
Experimental results obtained on Ti–Al–N and Ti–Al–Si–Nnanocomposites with the crystallite size below 8nm have shownthat formation of appropriately oriented and partially coherentcrystallites supports the development of intrinsic residualstresses at the crystallites boundaries, which improve thehardness of the nanocomposites. The model of the atomicordering at the crystallites boundaries was concluded from thecombination of XRD and HRTEM experiments. It was shownthat the partial coherence of nanocrystallites observed in theXRD experiments is an efficient tool for local texture analysis innanocrystalline systems. Finally, a good correlation was foundbetween the partial crystallographic coherence of cubic crystal-lites, their local preferred orientation, the mutual preferredorientation of cubic and hexagonal crystallites, the macroscopiclattice deformation in the cubic phase and the hardness of theTi–Al–Si–N coatings.
Acknowledgements
The HRTEM JEM 2010 FEF was financed through DeutscheForschungsgemeinschaft in frame of the Priority program #1062. The financial support of this work due to the Grant
249D. Rafaja et al. / Thin Solid Films 514 (2006) 240–249
Agency of the Czech Republic (project # 106/03/0819) is highlyacknowledged. We would like to thank Dr. T. Modes (FEPDresden) for performing the hardness measurements.
References
[1] S. Veprek, S. Reiprich, Li Shizhib, Appl. Phys. Lett. 66 (1995) 2640.[2] E.O. Hall, Proc. Phys. Soc., London, Sect. B 64 (1951) 747.[3] N.J. Petch, J. Iron Steel Inst. 174 (1953) 25.[4] S. Veprek, S. Reiprich, Thin Solid Films 268 (1995) 64.[5] S. Veprek, J. Vac. Sci. Technol., A 17 (1999) 2401.[6] A. Niederhofer, P. Nesládek, H.-D. Männling, K. Moto, S. Veprek, M.
Jílek, Surf. Coat. Technol. 121 (1999) 173.[7] S. Veprek, A. Niederhofer, K. Moto, T. Bolom, H.-D. Männling, P.
Nesládek, G. Dollinger, A. Bergmaier, Surf. Coat. Technol. 133 (2000)152.
[8] C.J. Tavares, L. Rebouta, E. Ribeiro, J.P. Riviere, J. Pacaud, M.F. Denanot,Surf. Coat. Technol. 174 (2003) 273.
[9] S.Y. Lee, G.S. Kim, J.H. Hahn, Surf. Coat. Technol. 177 (2004) 426.[10] A. Niederhofer, T. Bolom, P. Nesládek, K. Moto, C. Eggs, D.S. Patil, S.
Veprek, Surf. Coat. Technol. 146 (2001) 183.[11] P. Karvánková, M.G.J. Veprek-Heijman, O. Zindulka, A. Bergmaier, S.
Veprek, Surf. Coat. Technol. 163 (2003) 149.[12] S. Zhang, D. Sun, Y.Q. Fu, J. Mater. Sci. Technol. 18 (2002) 485.[13] S. Zhang, D. Sun, Y.Q. Fu, H.J. Du, Surf. Coat. Technol. 167 (2003) 113.[14] H.Y. Zhao, Q.L. Fan, L.X. Song, E.W. Shi, X.F. Hu, J. Inorg. Mater. 19
(2004) 9.[15] H. Zeman, J. Musil, J. Vlček, P.H. Mayrhofer, C. Mitterer, Vacuum 72
(2003) 21.[16] S. Veprek, S. Mukherjee, P. Karvánková, H.D. Männling, J.L. He, K.
Moto, J. Procházka, A.S. Argon, J. Vac. Sci. Technol., A 21 (2003) 532.[17] K. Moto, T. Bolom, S. Veprek, Adv. Mater. Process. II. Mat. Sci. Forum
437-4 (2003) 403.[18] M. Parlinska-Wojtan, A. Karimi, O. Coddet, T. Cselle, M. Morstein, Surf.
Coat. Technol. 188 (2004) 344.
[19] S. Veprek, H.-D. Männling, M. Jílek, Mater. Sci. Eng., A 366 (2004) 202.[20] S. Ma, J. Procházka, P. Karvánková, Q. Ma, X. Niu, X. Wang, D. Ma, K.
Xu, S. Veprek, Surf. Coat. Technol. 194 (2005) 143.[21] H.-D. Männling, D.S. Patil, K. Moto, M. Jílek, S. Veprek, Surf. Coat.
Technol. 146 (2001) 263.[22] F. Adibi, I. Petrov, L. Hultman, U. Wahlström, T. Shimizu, D. McIntyre,
J.E. Greene, J.-E. Sundgren, J. Appl. Phys. 69 (1991) 6437.[23] A. Hörling, L. Hultman, M. Odén, J. Sjölén, L. Karlsson, J. Vac. Sci.
Technol., A 20 (2002) 1815.[24] A. Hörling, L. Hultman, M. Odén, J. Sjölén, L. Karlsson, Surf. Coat.
Technol. 191 (2005) 384.[25] O. Knotek, F. Loffler, L. Wolkers, Surf. Coat. Technol. 8 (1994) 176.[26] D. Rafaja, M. Šíma, V. Klemm, G. Schreiber, D. Heger, L. Havela, R.
Kužel, J. Alloys Compd. 378 (2004) 107.[27] D. Rafaja, V. Klemm, G. Schreiber, M. Knapp, R. Kužel, J. Appl.
Crystallogr. 37 (2004) 613.[28] G. Ribárik, A. Audebrand, H. Palancher, T. Ungár, D. Louër, J. Appl.
Crystallogr. 38 (2005) 912.[29] P. Holubář, M. Jílek, M. Šíma, Surf. Coat. Technol. 133/134 (2000) 145.[30] D. Rafaja, A. Poklad, G. Schreiber, V. Klemm, D. Heger, M. Šíma, Z.
Metkd. 96 (2005) 736.[31] W.C. Oliver, G.M. Pharr, J. Mater. Res. 7 (1992) 1564.[32] D. Rafaja, V. Valvoda, R. Kužel, A.J. Perry, J.R. Treglio, Surf. Coat.
Technol. 86/87 (1996) 302.[33] V. Valvoda, R. Kužel, R. Černý, D. Rafaja, J. Musil, S. Kadlec, A.J. Perry,
Thin Solid Films 193/194 (1990) 401.[34] C. Kral, W. Lengauer, D. Rafaja, P. Ettmayer, J. Alloys Compd. 265 (1998)
215.[35] S. Inamura, K. Nobugai, K. Kanamaru, J. Solid State Chem. 68 (1987)
124.[36] PDF-2, Powder Diffraction File on CD-ROM, ICDD, Philadelphia, PA,
1997.[37] M. Parlinska-Wojtan, A. Karimi, T. Cselle, M. Morstein, Surf. Coat.
Technol. 177-178 (2004) 376.
Related Documents