WATER RESOURCES RESEARCH, VOL. 26, NO. 10, PAGES 2377-2391, OCTOBER 1990 Some Anomalous Features of Flow and Solute Transport Arising From Fracture Aperture Variability Luis MORENO Department of Chemical Engineering, Royal Institute of Technology, Stockholm, Sweden CHIN-Fu TSANG AND YVONNE TSANG Earth Sciences Division, Lawrence Berkeley Laboratory, University of California, Berkeley IVARS NERETNIEKS Department of Chemical Engineering, Royal Institute of Technology, Stockholm, Sweden Model fractures with variable apertures are generated by a statistical method, and water flow and tracer transport in these fractures are calculated. Tracer injection and collection are simulated for parallel and convergent flow fields. The impact of the use of different injection flow rates and the different locations of injection and collection points are studied. The results show that the transport time, dispersion, and the so-called mass balance fracture aperture are very sensitive to the location of the injection point and the injection flow rate. These anomalous effects appear to be consistent with observations in several recent field experiments. The implications of the calculated results on the analysis of tracer tests are discussed. It is concluded that because of the stochastic nature of variable fracture apertures (and their permeabilities) a point tracer test in a fracture is not sufficient to characterize the properties of the fracture. Dispersivitiesand apertures calculatedfrom different tracer tests in the samefracture may vary by orders of magnitudedependingon the flow rate and the location of the injection. However, a line injection of tracer, averaged over a series of adjacent points, may avoid some of these problems. INTRODUCTION In the analysis of tracer tests in fractured media, a discrete representation of the fractures has often been used. Each of these fractures is usually represented by a pair of parallel plates with a constant aperture. Based on theoretical and experimental studies on single fractures, however, the par- allel-plate representation of the singlefracture is found to be inadequate in the description of fluid and tracer movement through a fractured medium. The field experiments of solute migration in single frac- tures in the Stripa mine [Abelin et al., 1985; Neretnieks, 1985] showed that flow was very unevenly distributed along fracture planes and that large areas did not carry any water. The channels made up only 5-20% of the fracture plane. The nonsorbing tracers injected were unevenly transported in these fractures. In migration experiments carried out in granitic rockat Cornwall [Heath,1985], two Parallel bore- holes were drilled. it was found that flow connections between two boreholes,on a singlefracture, varied consid- erably depending on where the holes intersected the frac- ture. The field experiment carried out in a Single fracture at the same site [Bourke, 1987] demonstrated that flow in a single fracture also took place in a limited number of channels.These flow channelsoccupieda total area of about 10-20% of the fracture plane. Flow in a singlefracture has been modeled by considering the fracture to be represented by a number of independent Copyright 1990 by the American Geophysical Union. Paper number 90WR01100. 0043-1397/90/90WR-01100505.00 channels with different apertures [Neretnieks et al., 1982; Moreno et al., 1985]. Each of these individual channels was assumedto have constant aperture. Tsang and Tsang [1987] proposed an alternate approach to the description of the flow and transport in a tight fractured medium. In their approach a number of tortuous channels with variable aperture were used to describe flow through both a single fracture and a number of intersectingfractures. Properties of these variable aperture channels and implications to experimental studies were discussedin a subsequent paper [Tsang et al., 1988]. The basis of these channels in the context of a stochastic distribution of variable apertures in the two-dimensional fracture plane was presented in a recent paper by Tsang and Tsang [1989], who also discussedthe dependence of tracer transport in the channels on the two-dimensional Correlation lengths. This latter topic has been also studied for a hetero- geneous porous medium system [e.g., Dagan, 1984, 1987; Gelhar and Axness, 1983]. In anearlier paper [Moreno et al., 1988] wehave pre- sented a two-dimensional model of fracture with variable apertures. Calculations for the flow and solute transpø• through thefracture were made withthis model. ThereSUlts forflow in two dimensions showed that fluid flows Unevenly in a singlefracture and that it takes place in preferred paths. In this paper we modified the model developed in the earlier paper to allow for point tracer injection and with- drawal in the two-dimensionalfracture plane. Three types of cases are studied: (1) tracer injection and observation in a parallel flow field, (2) tracer injection and observation in a convergent flow field and (3) same as cases 1 and 2 but With the fracture compressed under normal stress as in a rock 2377

Welcome message from author
This document is posted to help you gain knowledge. Please leave a comment to let me know what you think about it! Share it to your friends and learn new things together.
Transcript
WATER RESOURCES RESEARCH, VOL. 26, NO. 10, PAGES 2377-2391, OCTOBER 1990
Some Anomalous Features of Flow and Solute Transport Arising From Fracture Aperture Variability
Luis MORENO
Department of Chemical Engineering, Royal Institute of Technology, Stockholm, Sweden
CHIN-Fu TSANG AND YVONNE TSANG
Earth Sciences Division, Lawrence Berkeley Laboratory, University of California, Berkeley
IVARS NERETNIEKS
Department of Chemical Engineering, Royal Institute of Technology, Stockholm, Sweden
Model fractures with variable apertures are generated by a statistical method, and water flow and tracer transport in these fractures are calculated. Tracer injection and collection are simulated for parallel and convergent flow fields. The impact of the use of different injection flow rates and the different locations of injection and collection points are studied. The results show that the transport time, dispersion, and the so-called mass balance fracture aperture are very sensitive to the location of the injection point and the injection flow rate. These anomalous effects appear to be consistent with observations in several recent field experiments. The implications of the calculated results on the analysis of tracer tests are discussed. It is concluded that because of the stochastic nature of variable fracture apertures (and their permeabilities) a point tracer test in a fracture is not sufficient to characterize the properties of the fracture. Dispersivities and apertures calculated from different tracer tests in the same fracture may vary by orders of magnitude depending on the flow rate and the location of the injection. However, a line injection of tracer, averaged over a series of adjacent points, may avoid some of these problems.
INTRODUCTION
In the analysis of tracer tests in fractured media, a discrete representation of the fractures has often been used. Each of these fractures is usually represented by a pair of parallel plates with a constant aperture. Based on theoretical and experimental studies on single fractures, however, the par- allel-plate representation of the single fracture is found to be inadequate in the description of fluid and tracer movement through a fractured medium.
The field experiments of solute migration in single frac- tures in the Stripa mine [Abelin et al., 1985; Neretnieks, 1985] showed that flow was very unevenly distributed along fracture planes and that large areas did not carry any water. The channels made up only 5-20% of the fracture plane. The nonsorbing tracers injected were unevenly transported in these fractures. In migration experiments carried out in granitic rock at Cornwall [Heath, 1985], two Parallel bore- holes were drilled. it was found that flow connections
between two boreholes, on a single fracture, varied consid- erably depending on where the holes intersected the frac- ture. The field experiment carried out in a Single fracture at the same site [Bourke, 1987] demonstrated that flow in a single fracture also took place in a limited number of channels. These flow channels occupied a total area of about 10-20% of the fracture plane.
Flow in a single fracture has been modeled by considering the fracture to be represented by a number of independent
Copyright 1990 by the American Geophysical Union.
Paper number 90WR01100. 0043-1397/90/90WR-01100505.00
channels with different apertures [Neretnieks et al., 1982; Moreno et al., 1985]. Each of these individual channels was assumed to have constant aperture. Tsang and Tsang [1987] proposed an alternate approach to the description of the flow and transport in a tight fractured medium. In their approach a number of tortuous channels with variable aperture were used to describe flow through both a single fracture and a number of intersecting fractures. Properties of these variable aperture channels and implications to experimental studies were discussed in a subsequent paper [Tsang et al., 1988]. The basis of these channels in the context of a stochastic
distribution of variable apertures in the two-dimensional fracture plane was presented in a recent paper by Tsang and Tsang [1989], who also discussed the dependence of tracer transport in the channels on the two-dimensional Correlation lengths. This latter topic has been also studied for a hetero- geneous porous medium system [e.g., Dagan, 1984, 1987; Gelhar and Axness, 1983].
In an earlier paper [Moreno et al., 1988] we have pre- sented a two-dimensional model of fracture with variable apertures. Calculations for the flow and solute transpø• through the fracture were made with this model. The reSUlts for flow in two dimensions showed that fluid flows Unevenly in a single fracture and that it takes place in preferred paths.
In this paper we modified the model developed in the earlier paper to allow for point tracer injection and with- drawal in the two-dimensional fracture plane. Three types of cases are studied: (1) tracer injection and observation in a parallel flow field, (2) tracer injection and observation in a convergent flow field and (3) same as cases 1 and 2 but With the fracture compressed under normal stress as in a rock
2377
2378 MORENO ET AL.' ANOMALOUS FLOW AND TRANSPORT FROM FRACTURES
/
• WATER FLOW RATE [ml/h]
I MAX TRACER 'RATE [g/h.10 e]
13 o o
/ FRACTU, RE 2
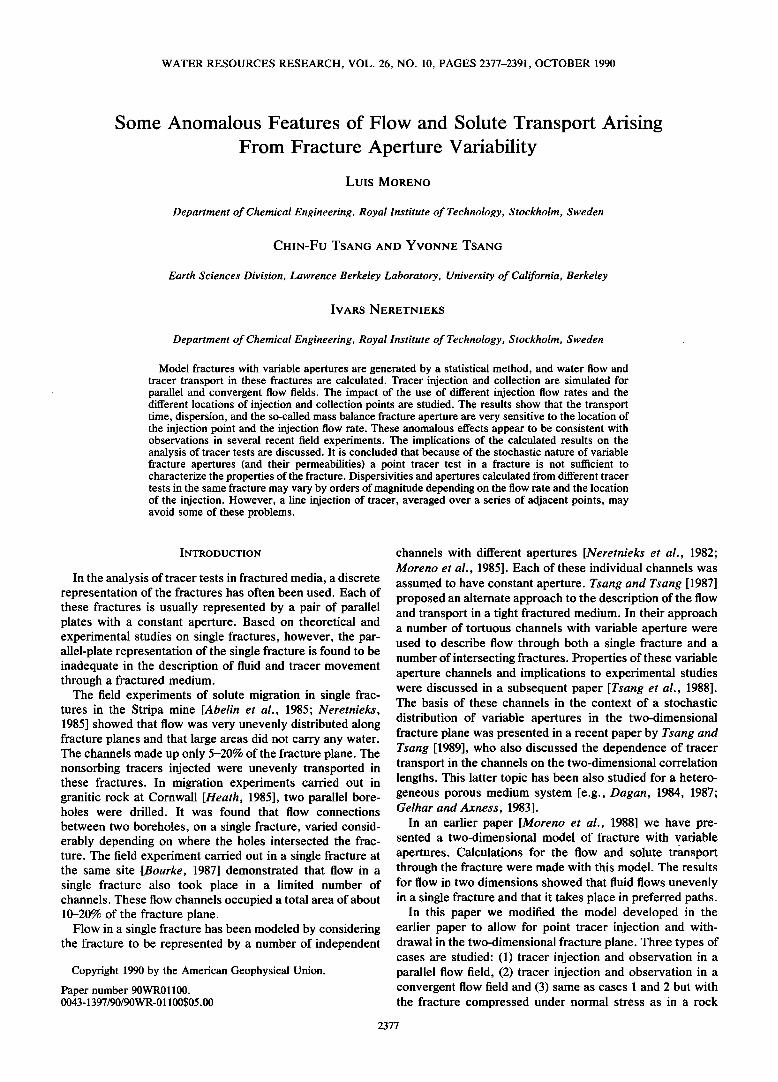
Fig. 1. Water and tracer flow rates into the drift in one of the two fractures in the Stripa experiment [Abelin eta!., 1985].
formation. The aim of this paper is to study the implications of this model in the design and analysis of tracer tests. A number of anomalous features of tracer transport are iden- tified and discussed. In particular, the sensitivity of tracer transport results due to different injection flow rates and different locations of injection and withdrawal points is investigated. Based on these studies, suggestions are made on experimental procedures that may avoid some of these problems.
A SUMMARY OF MOTIVATING EXPERIMENTAL
OBSERVATIONS
In the analysis of in situ tracer tests some anomalous features may be observed. For example, large differences are found between the fracture apertures calculated from residence time and flow rate and the apertures calculated from hydraulic measurements. In the analysis of some tracer tests carried out in fractures in crystalline rocks, extraordi- nary large aperture values seem to be required in order to fit the field data. These large values are not expected to be present in fractures in this type of rock. The dispersion in tracer breakthrough is found to be very high in these cases as well.
More specifically, tracer tests in a parallel flow system were performed in single fractures in crystalline rock in the Stripa mine [Abelin et al., 1985]. In these tests, two single fractures intersecting the drift were chosen. Tracers were injected, between packers, in boreholes which intersected the fractures. Water was collected in the intersection of the
fractures with the drift in 1-m sections. The injection dura- tion was of some hundreds of hours. Figure 1 shows the water flow rate and the tracer flow collected in the different
sections in one of the tracer tests. The injection was per- formed in the hole H2, distant 4.5 m from the drift, and the injection flow rate was about 10% of the total flow collected in the intersection of the fracture with the drift. Due to
experimental conditions the injection flow rate changed with time. The water flow rate measured in the collection sections
was constant in time but was very uneven along the fracture
le-5
le-5
8e-6
6e-6
4e-6
2e-6
ß ß ß ß ß ß ß ß 0e+0
0 1000 2000 3000 4( 00
Time, hrs
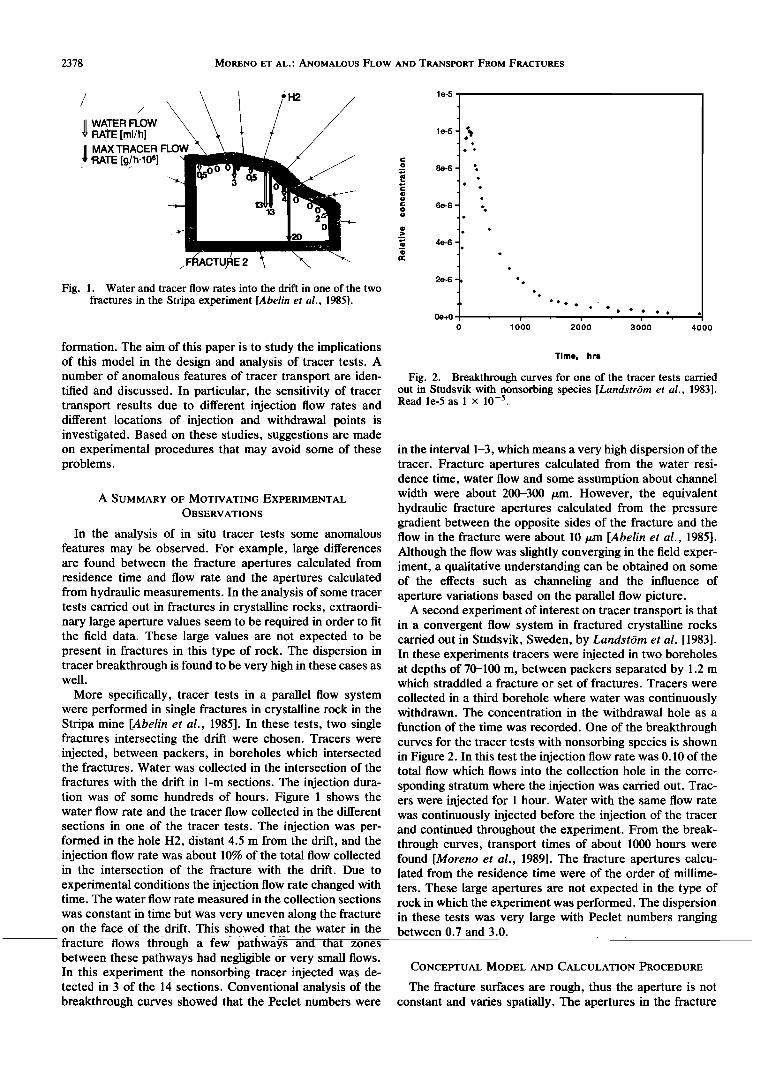
Fig. 2. Breakthrough curves for one of the tracer tests carried out in Studsvik with nonsorbing species [Landstr6m eta!., 1983]. Read le-5 as 1 x 10 -5
in the interval 1-3, which means a very high dispersion of the tracer. Fracture apertures calculated from the water resi- dence time, water flow and some assumption about channel width were about 200-300 tam. However, the equivalent hydraulic fracture apertures calculated from the pressure gradient between the opposite sides of the fracture and the flow in the fracture were about 10 tam [Abelin et al., 1985]. Although the flow was slightly converging in the field exper- iment, a qualitative understanding can be obtained on some of the effects such as channeling and the influence of aperture variations based on the parallel flow picture.
A second experiment of interest on tracer transport is that in a convergent flow system in fractured crystalline rocks carried out in Studsvik, Sweden, by Landst6m et al. [1983]. In these experiments tracers were injected in two boreholes at depths of 70-100 m, between packers separated by 1.2 m which straddled a fracture or set of fractures. Tracers were
collected in a third borehole where water was continuously withdrawn. The concentration in the withdrawal hole as a
function of the time was recorded. One of the breakthrough curves for the tracer tests with nonsorbing species is shown in Figure 2. In this test the injection flow rate was 0.10 of the total flow which flows into the collection hole in the corre-
sponding stratum where the injection was carried out. Trac- ers were injected for 1 hour. Water with the same flow rate was continuously injected before the injection of the tracer and continued throughout the experiment. From the break- through curves, transport times of about 1000 hours were found [Moreno et al., 1989]. The fracture apertures calcu- lated from the residence time were of the order of millime-
ters. These large apertures are not expected in the type of rock in which the experiment was performed. The dispersion in these tests was very large with Peclet numbers ranging
on the face of the drift. This showed that the water in the between 0.7 and 3.0. fracture flows thrOUgh a few pathways and that zones between these pathways had negligible or very small flows. In this experiment the nonsorbing tracer injected was de- CONCEPTUAI• MODEL AND CALCULATION PROCEDURE tected in 3 of the 14 sections. Conventional analysis of the The fracture surfaces are rough, thus the aperture is not breakthrough curves showed that the Peclet numbers were constant and varies spatially. The apertures in the fracture
MORENO ET AL..' ANOMALOUS FLOW AND TRANSPORT FROM FRACTURES 2379
may be defined by an aperture density distribution, n(b), and a spatial correlation length, A. The spatial variation of the fracture aperture is characterized by a spatial correlation length. This means that within a range smaller than the correlation length the aperture values are more likely to be similar, but at separation distances larger than the correla- tion length there is little or no correlation between aperture values. The fracture length in the direction of the main flow is denoted by Lx, and Ly is the fracture width in the direction perpendicular to the main flow.
Now let us assume there is a parallel regional flow in the plane of the fracture. By this we mean that the two opposite sides of the fracture have a constant hydraulic head differ- ence. Fluid flowing through the fracture seeks out the least resistive pathways. The main flow is expected to occur through a few channels in the fracture plane. In defining channels, we mean preferred flow paths in the fracture. If the direction of the pressure gradient is changed, then a new channel network would be obtained. Zones with small
apertures will usually have very little flow. However, zones with large apertures do not necessarily have large flow because they may be isolated from the main flows by nearby constrictions in the fracture [Tsang and Tsang, 1989].
Let us assume that we have a fracture with an overall flow
under a "regional" pressure gradient. A solution containing the tracer is injected with a given flow rate at a point in the fracture plane. The injection pressure modifies the previ- ously existing fluid flow pattern around the injection point. For a given configuration of the variable apertures, the injection flow rate feeds the tracer into paths that are available for transport. The larger the injection flow, the larger the number of paths which may be reached by the tracer. However, the pattern of the flow paths depends strongly on the variable apertures near the injection point.
Generation of Fracture Apertures
The fracture plane was partitioned by grids with a different aperture assigned to each node enclosed by grid lines. For the present study the grid was 40 x 40 nodes. A lognormal distribution for the variable apertures in the plane of the single fracture and exponential function for the spatial cova- riance of the apertures was chosen. The assignment of the apertures was by means of the numerical code COVAR [Williams and El-Kadi, 1986] which generates a two- dimensional field of a correlated parameter. This code was slightly modified to generate different aperture values in the fracture plane [Moreno et al., 1988]. COVAR uses the matrix decomposition method to generate lognormally dis- tributed values of fracture apertures.
Fluid Flow
For laminar conditions the volumetric flow through a channel of constant aperture may be written as [Bird et al., 1960]
b 3 AP Q=• W• (1)
12tz •
where b is the channel aperture,/x the dynamic viscosity, W the width of the channel, and AP/AL the pressure gradient. We assumed that the apertures are very much smaller than the flow distance in the nodes so that the influence on
pressure drop by the diverging or converging parts of the flow path is negligible. The flow between two adjacent nodes is determined by both apertures. The flow between nodes i and j may be expressed as
1 [•/• •J•l-' Ay Qij-- • + •x (Pi- Pj) (2) where A x is the node length in the direction of the flow and A y the length in the perpendicular direction. Mass balances at each node may be written as
E Qij q- Ii = 0 (3) J
where Qij is one of the flows coming into or going out from node i. I i is injection into or withdrawal from node i. We assumed that the injection and the withdrawal are carried out in the center of the respective nodes. In the previous work [Moreno et al., 1988], Ii is zero. Here the calculations are modified to allow for nonzero I i.
The solution of this system of equations yields the pres- sure at each node. Flow between adjacent nodes is then calculated using (2).
Solute Transport
There are two main quantities which are of interest for solute transport: the mean residence time and the variance of residence times. There are several mechanisms which may cause the spreading of a species transported by a fluid. In this context we consider only velocity variations between the different channels. Other effects such as molecular
diffusion, hydrodynamic dispersion, matrix diffusion, etc., will not be discussed here. Also in our calculations, it is assumed that local longitudinal dispersion within each chan- nel is negligible and that the overall dispersion in the fracture is caused only by the different residence times along different pathways.
The solute transport is simulated using a particle-tracking technique [Schwartz et al., 1983; Robinson, 1984; Moreno et al., 1988]. A given number of particles is introduced in the flow field at the injection node. Each particle is followed along its path from the injection to the collection point through the intersections [Hull et al., 1987; Philip, 1988]. There are different ways to carry out this particle tracking with respect to the dispersion of the particles.
First, we can assume that there is no mixing at all. In this case if a tracer is injected between two streamlines, it will arrive to the outlet between the same streamlines. This
situation is not observed in actual tracer tests due to the
diffusion of the tracer across streamlines.
Another alternative is to assume mixing in the intersec- tions. This method considers that the particles coming to an intersection may take all the possible outlet paths. In this case a particle injected between two streamlines may be found between other streamlines far away. We use this method in an earlier paper [Moreno et al., 1988].
We will use here a method which assumes full lateral
dispersion of the tracer in the paths (branches) between two intersections. Thus lateral diffusion between streamlines is
simulated, with the transverse dispersivity approximately equal to grid spacing. However, the method assumes no mixing in the intersections. Thus particles coming to an
2380 MORENO ET AL.' ANOMALOUS FLOW AND TRANSPORT FROM FRACTURES
0.0 0.! 0.2 0.3 0.4 0.5 0.6 0.7 0.8 0.9 1.0
x
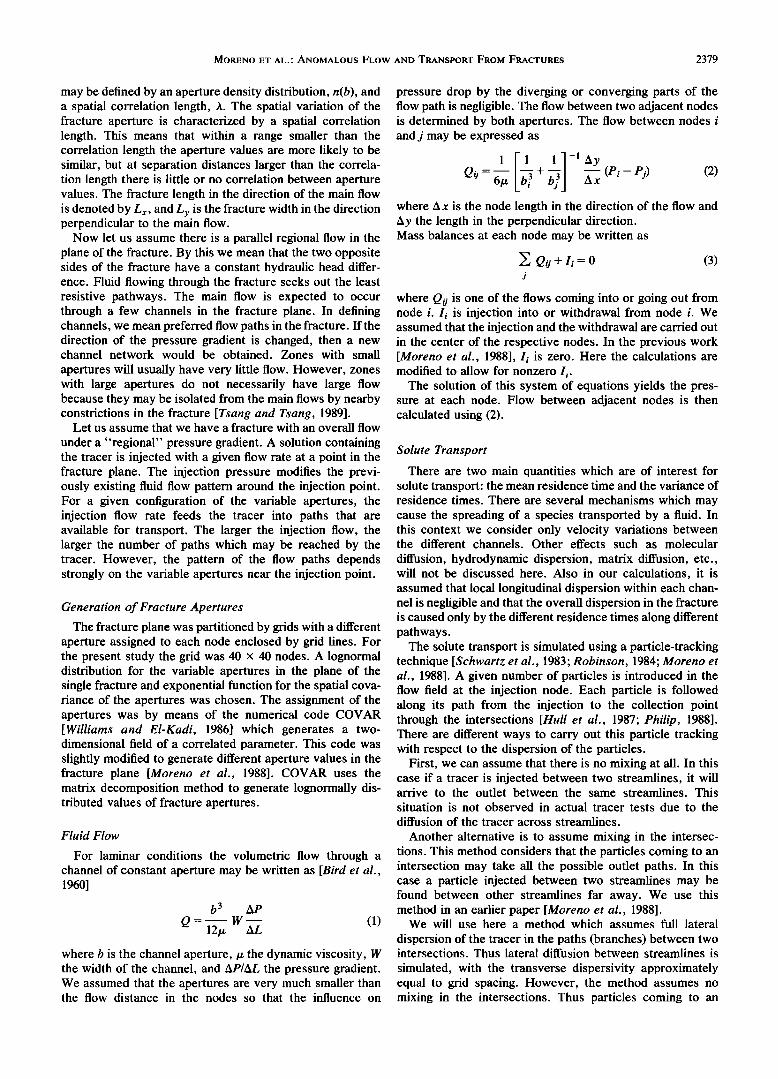
Fig. 3. Statistical fracture apertures generated with cr = 0.50, b o = 41.2, and AlL = 0.10. The black nodes represent the smallest apertures and the white nodes the largest apertures. This is one of 10 realizations generated and is referred to as fracture 1. The x axis from 0 to 1 is divided into 40 nodes, labeled nx from 1 to 40' the y axis is similarly divided.
intersection are distributed in the outlet channel(s) adjacent to the inlet channel according to the relative location of the channels and the flow rates in the inlet and outlet channels.
Among the possible outlet channels, particles are assigned according to a probability proportional to the respective flow rates. Each individual particle is then followed through the channel network. This method has the advantage of avoiding the nonphysical grid orientation effects.
The residence time in a given node or channel for non- sorbing tracers is determined by the total flow through the node and its volume
volume of node i twi = (4)
flow into node i
This represents the case of a plug flow where the residence time is calculated as the ratio between volume of the node
and the flow through it. In our simulations we assumed that the longitudinal dispersion of the tracer in each channel is negligible. The global dispersion of interest in our problem is due to the existence of channels with different velocities. For
this reason it is valid to use plug flow locally in calculating the residence time for the particles.
The residence time of an individual particle over the whole path is determined as the sum of residence times in every
residence time, tw, and variance o-t, may be used to deter- mine the Peclet number, which is a dimensionless measure of the dispersion of the tracer. Peclet number, Pe, is calcu- lated as [Levenspiel, 1972]
2 2 O' t
2 (5) Pe t w
CALCULATED CASES AND RESULTS
A series of fractures were generated statistically using a standard deviation of 0.5 in the log aperture distribution, a mean fracture aperture of 1.0 aperture unit, and a ratio of correlation length, A, to fracture length, L, of 0.1. The ratio of A to the tracer travel length was approximately 0.2, because in the simulations the transport length for the tracers was about half of the fracture length. After some sensitivity studies, a discretization of 4 nodes for a correla- tion length was used. Moreno et al. [1988] showed that similar results are obtained even when only 2 nodes are used in each correlation length for a ratio A/L of 0.2. The corre- lation of the generated apertures was checked by plotting the respective variograms.
The fracture aperture variation over one of the generated mc particle II•S LI-•V•I-b•H, 1 11• 1 •516•11•C as
distribution is then obtained from the residence times of a fracture 1. The fracture is assumed to have a length of 1.0 in multitude of individual particle runs. the x and y directions. We have defined our fractures using
From the distribution of the residence times, the mean dimensionless lengths and apertures. A real fracture could residence time and variance can be calculated. The mean have, for example, a length of 20 m in x and y direction and
MORENO ET AL.' ANOMALOUS FLOW AND TRANSPORT FROM FRACTURES 2381
ß .
ß . .
: . ...
: : ...
, ,.... ,...: ...... .;.. ;...;...:
.: :..: ' ' ß .
....
0.0 0.1 0.2 0.3 0.• 0.5 0.6 0.7 0.8 o.g 1.0
x
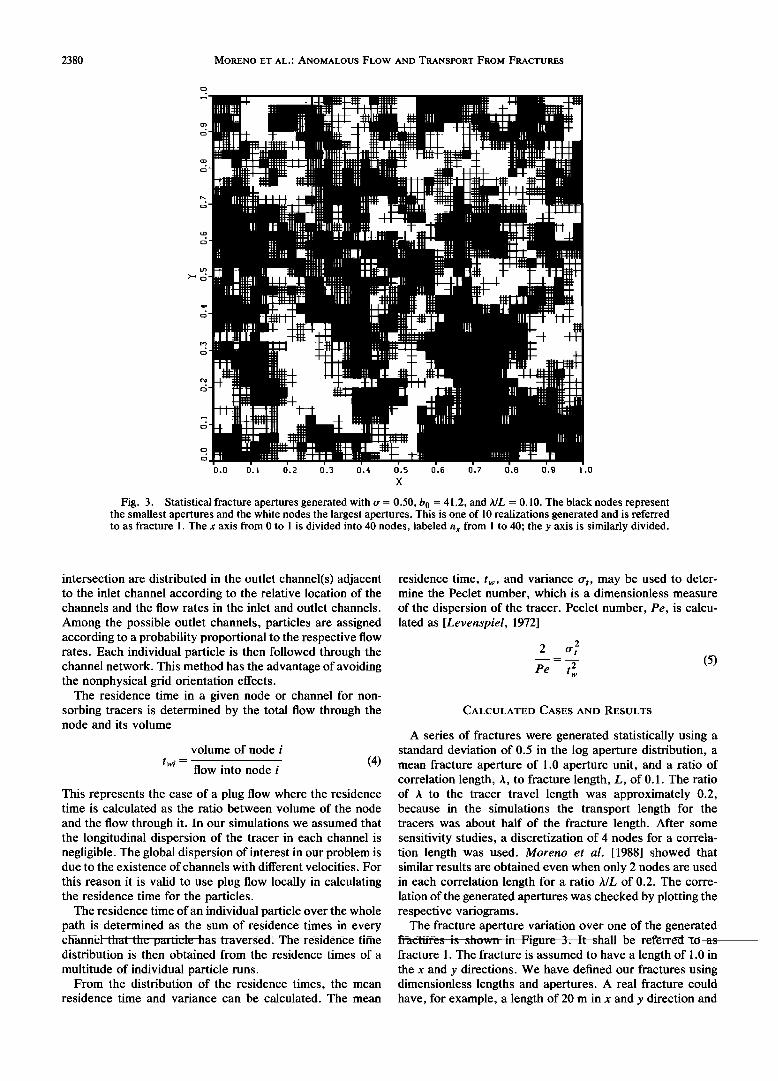
Fig. 4. Fluid flow in the fracture for parallel fluid flow from left to right. The line thickness is proportional to the square root of the flow. Flows less than 0.2% of the total flow are not drawn.
a mean aperture of 41.2/am. In the text the location of the nodes is defined using the node index (nx, ny) along the x and y axis, respectively, and their values range from 1 to 40.
Tracer tests are commonly performed to investigate trans- port properties (e.g., dispersion, flow porosity, etc.). For flow in a single fracture, an average fracture aperture and the dispersion (often expressed as the Peclet number), are the entities to determine. Also, in most of the tracer tests the flow field may be characterized by a parallel regional flow or by a radial convergent flow. For this reason we simulated the injection of tracers in a parallel regional water flow, and the injection of tracers in a convergent flow system. The results of these simulations to be studied are therefore water resi-
dence times, average fracture apertures, and Peclet num- bers.
Injection of Tracers in a Parallel Flow System
By a parallel flow system we mean that a constant pres- sure line is applied to one side of the fracture and a lower pressure is applied to a parallel line on the opposite side. The top and bottom sides are considered to be no-flow bound- aries. The tracer is then injected with a low but finite flow rate in the fracture near its center. The reason for this is to
reduce the influence of the injection on the boundary condi- tions. The tracers are collected in 10 different sections along the outlet lower-pressure side of the fracture. Residence time and dispersion are determined for each breakthrough curve.
First, sensitivity studies were made to determine the
minimum number of particles which should be introduced at the injection point in order to obtain reliable results. A number of simulations were performed using between 1000 and 10,000 particles, and we found that about 4000 particles were needed in this case, in which the particles were collected in 10 different sections.
Ten different fractures (realizations) were generated based on the same aperture density distribution and spatial corre- lation length. The flow in the different fractures was then calculated for a given gradient imposed from left to right. The flow for the fracture in Figure 3 is shown in Figure 4. It is seen that the fluid flows through a few major flow paths and flow rates are found to vary by several orders of magnitude. Similar patterns are found for the other frac- tures. The thickness of the lines is set arbitrarily to be proportional to the square root of the flow in a given connection.
Tracers were then injected with different water flow rates at various selected points in the fracture. This was done to explore the changes of flow pattern due to tracer fluid injection. In each fracture, 11 alternative injection points were chosen with a distance between them less than one
correlation length. Two sets of calculations were made using injection flow rates of 0.01 and 0.1 of the total flow rate through the fracture. Calculations were also performed to simulate a "no disturbance" case by using a negligible injection flow containing only tracers so that the "natural" flow conditions are studied.
Results on flow. One of the first questions one may ask concerning injections at the 11 alternative locations in each
2382 MoR•:•o ET AL.' ANOMALOUS FLOW AND TRANSPORT FROM FRACTURES
0.8
0.6
0.4
0.2
0.0
No stress
Stress
1 2 3 4 5 6 7 8 9 10
Sections
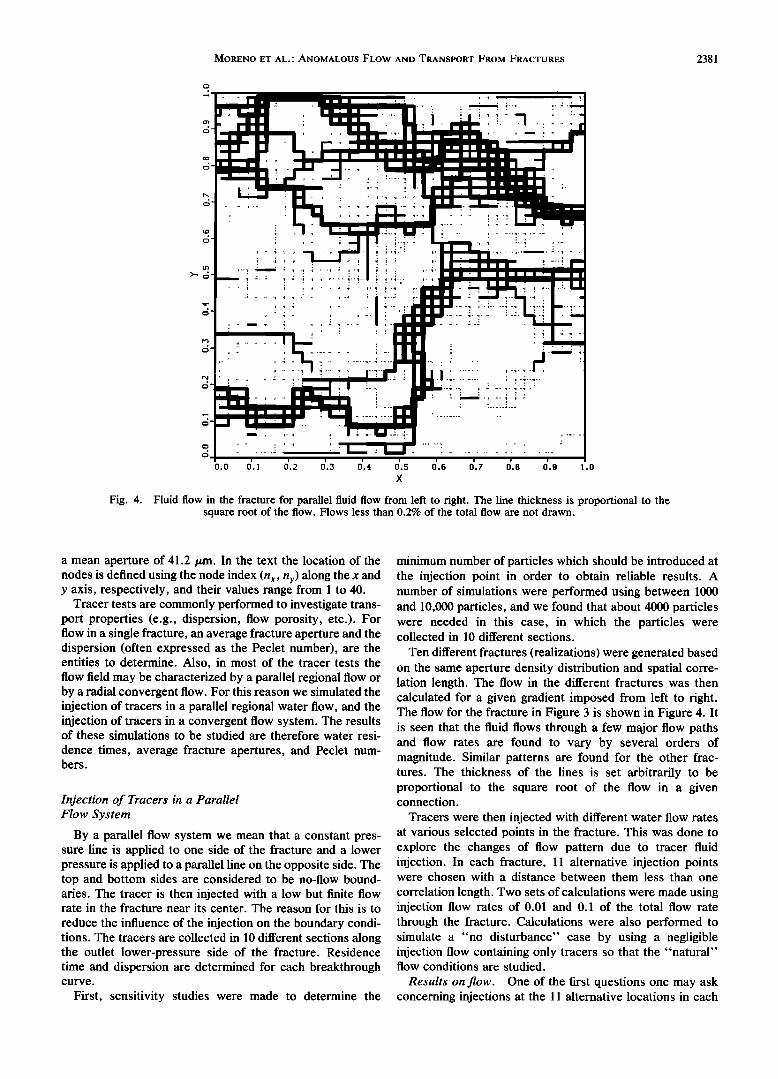
Fig. 5. Histogram of fluid flow at fracture outlet as a function of the collection section for fracture in Figure 3, for normal stress and no stress cases.
of the 10 fractures is the effective local hydraulic conductiv- ity at these injection locations. These are normally measured in the field injection tests, where the hydraulic conductivity at a prospective tracer injection point is estimated by a
pressure transient test, and the tracer injection test is made only at a location where hydraulic conductivity is large. We find for the random 11 injections locations in the 10 frac- tures, the local hydraulic conductivity, calculated by a simulated pressure test, varies over 4 orders of magnitude. Such large variations are noted in some field tests, pointing out that a few local hydraulic conductivity measurements in a heterogeneous system such as the variable aperture frac- ture are not meaningful.
The flow into each section at the outlet for fracture 1 is
shown in Figure 5 for the case of no disturbance due to tracer injection. About 55% of the fluid flowed into one section. Significant flow was observed in five other sections. Four sections had very small flows. This flow distribution in the outlet sections was approximately maintained when the tracer injection took place. The other nine simulated frac- tures also showed very uneven flow distribution in the collection sections. In some fractures more than 80% of the
water flowed into one section. The flow distribution for the
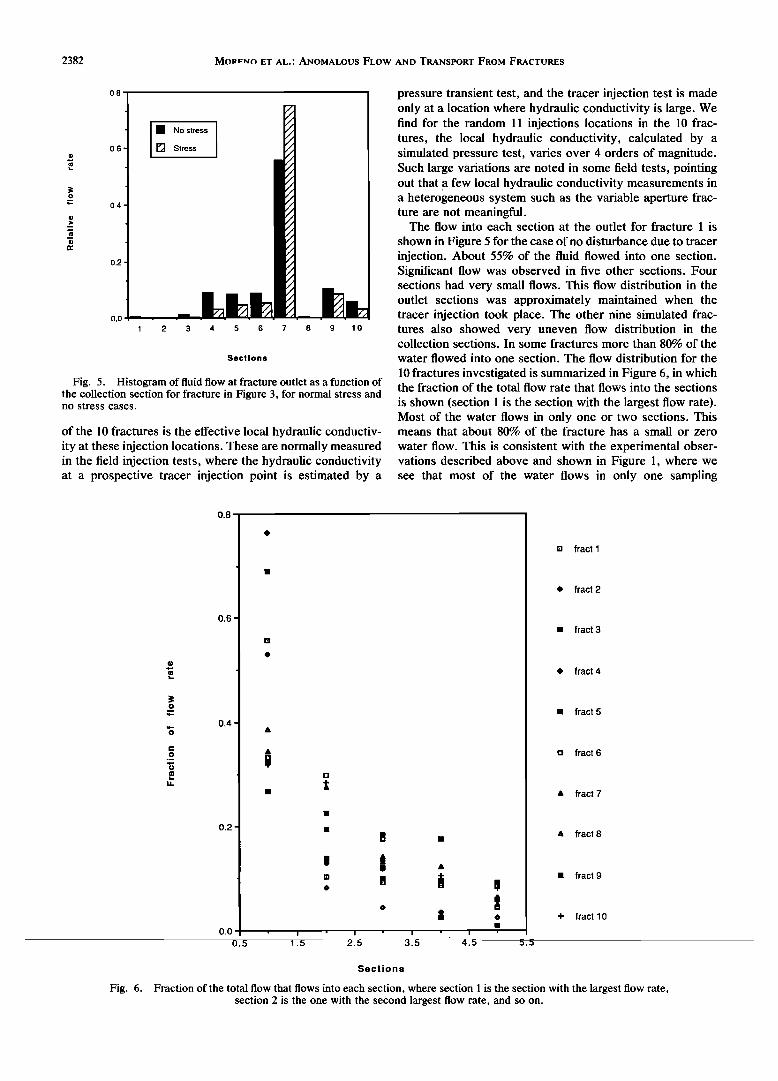
10 fractures investigated is summarized in Figure 6, in which the fraction of the total flow rate that flows into the sections
is shown (section 1 is the section with the largest flow rate). Most of the water flows in only one or two sections. This means that about 80% of the fracture has a small or zero
water flow. This is consistent with the experimental obser- vations described above and shown in Figure 1, where we see that most of the water flows in only one sampling
0.8
0.6
0.4
0.2
0.0 ' I ß i ß I ' I
0.5 1.5 2.5 3.5 z•. ,,• 5.5
[] fract 1
ß fract 2
,. fract 3
e fract 4
,. fract 5
[] fract 6
A fract 7
A fract 8
" fract g
4- fract 10
Sections
Fig. 6. Fraction of the total flow that flows into each section, where section I is the section with the largest flow rate, section 2 is the one with the second largest flow rate, and so on.
MORENO ET AL.: ANOMALOUS FLOW AND TRANSPORT FROM FRACTURES 2383
1.0
0.8
0.6
0.4
0.2
0.0
I Flow=0.72
[] Flow = 7.2
1 2 3 4 5 6 7 8 9 10
Sections
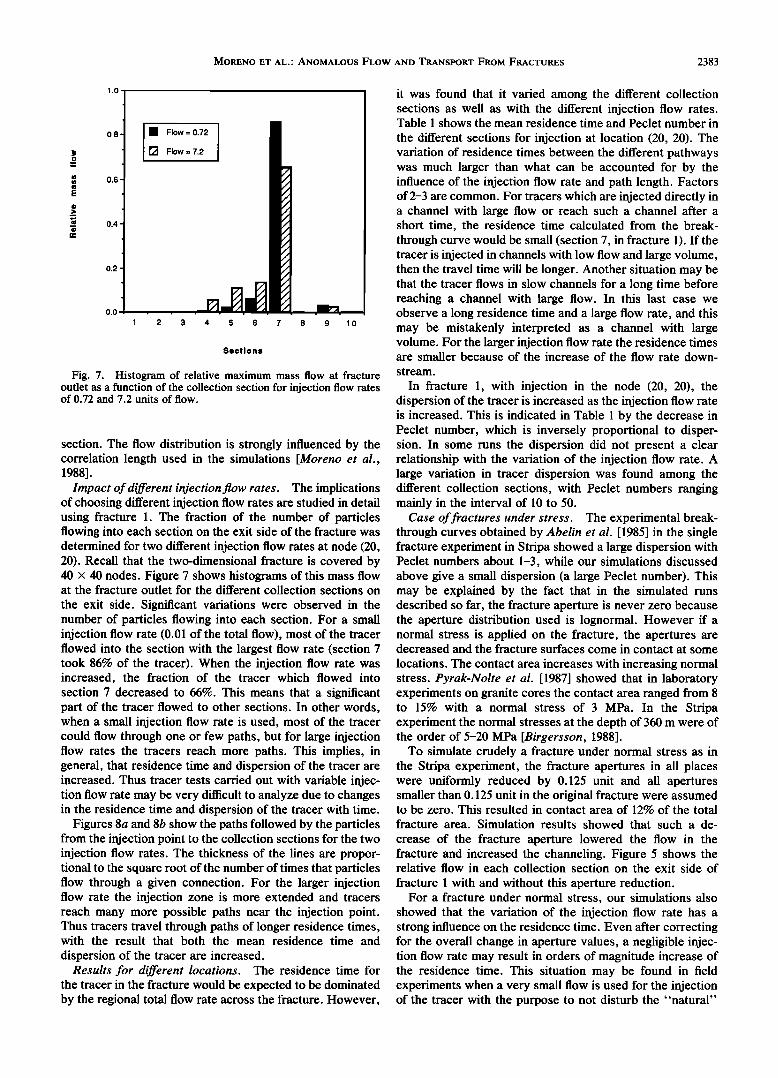
Fig. 7. Histogram of relative maximum mass flow at fracture outlet as a function of the collection section for injection flow rates of 0.72 and 7.2 units of flow.
section. The flow distribution is strongly influenced by the correlation length used in the simulations [Moreno et al., 19881.
Impact of different injection flow rates. The implications of choosing different injection flow rates are studied in detail using fracture 1. The fraction of the number of particles flowing into each section on the exit side of the fracture was determined for two different injection flow rates at node (20, 20). Recall that the two-dimensional fracture is covered by 40 x 40 nodes. Figure 7 shows histograms of this mass flow at the fracture outlet for the different collection sections on
the exit side. Significant variations were observed in the number of particles flowing into each section. For a small injection flow rate (0.01 of the total flow), most of the tracer flowed into the section with the largest flow rate (section 7 took 86% of the tracer). When the injection flow rate was increased, the fraction of the tracer which flowed into section 7 decreased to 66%. This means that a significant part of the tracer flowed to other sections. In other words, when a small injection flow rate is used, most of the tracer could flow through one or few paths, but for large injection flow rates the tracers reach more paths. This implies, in general, that residence time and dispersion of the tracer are increased. Thus tracer tests carded out with variable injec- tion flow rate may be very difficult to analyze due to changes in the residence time and dispersion of the tracer with time.
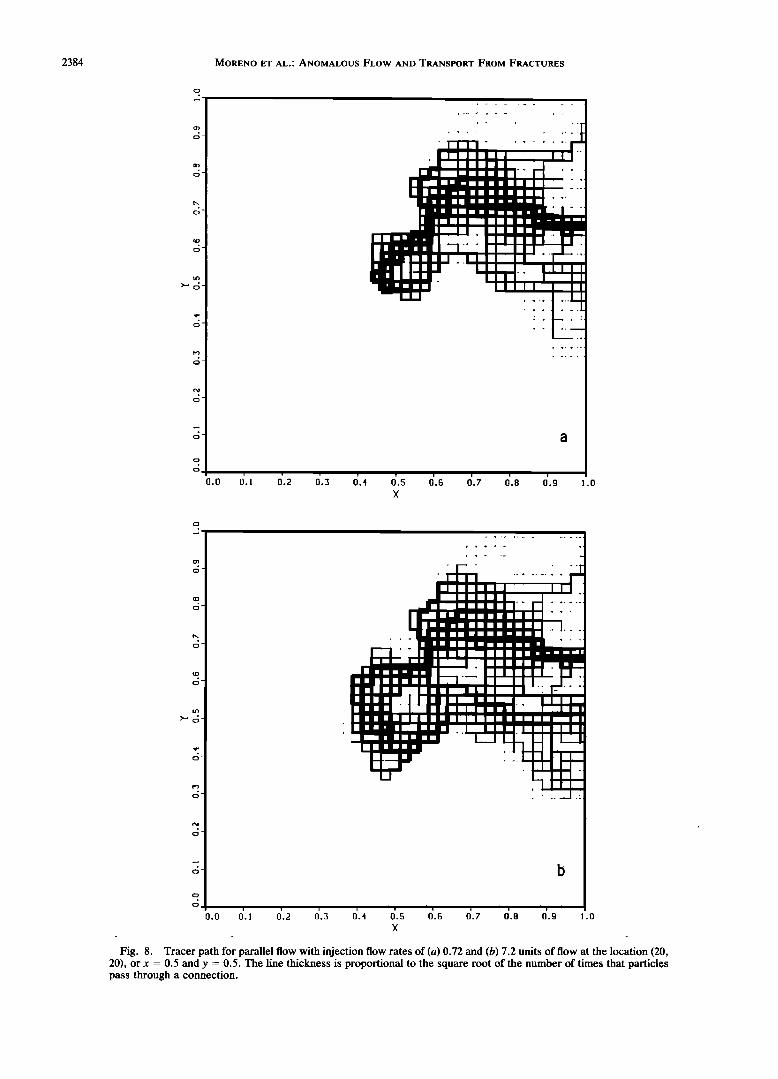
Figures 8a and 8b show the paths followed by the particles from the injection point to the collection sections for the two injection flow rates. The thickness of the lines are propor- tional to the square root of the number of times that particles flow through a given connection. For the larger injection flow rate the injection zone is more extended and tracers reach many more possible paths near the injection point. Thus tracers travel through paths of longer residence times, with the result that both the mean residence time and
dispersion of the tracer are increased. Results for different locations. The residence time for
the tracer in the fracture would be expected to be dominated by the regional total flow rate across the fracture. However,
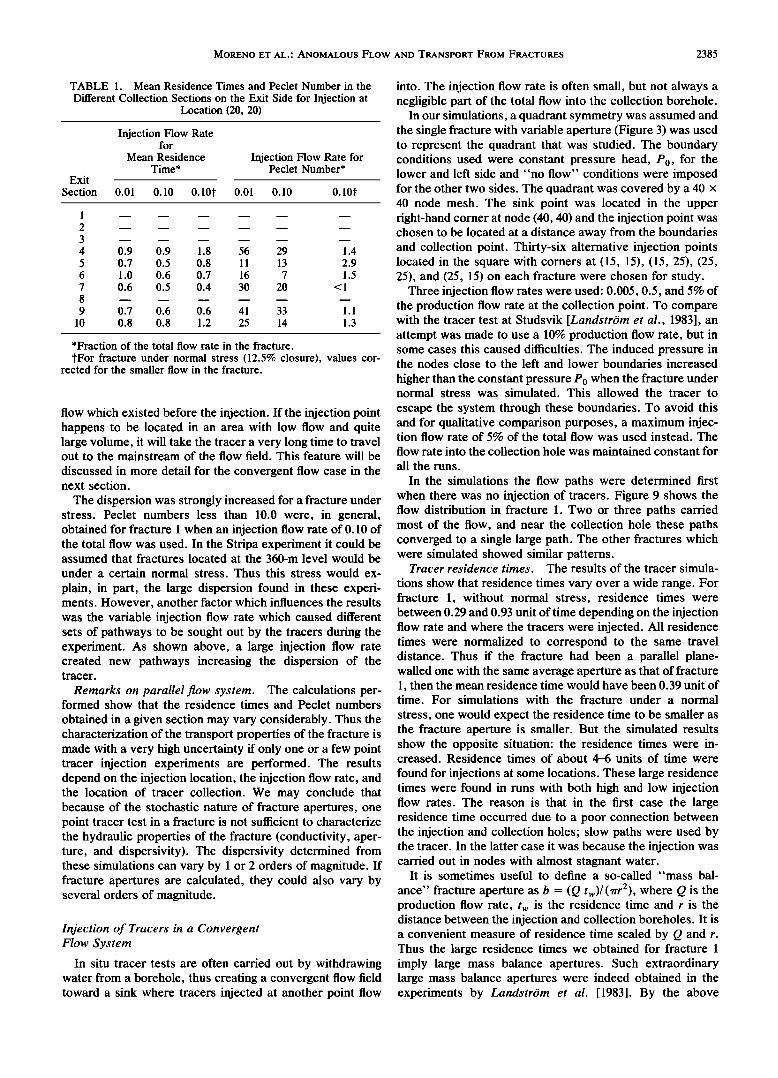
it was found that it varied among the different collection sections as well as with the different injection flow rates. Table 1 shows the mean residence time and Peclet number in
the different sections for injection at location (20, 20). The variation of residence times between the different pathways was much larger than what can be accounted for by the influence of the injection flow rate and path length. Factors of 2-3 are common. For tracers which are injected directly in a channel with large flow or reach such a channel after a short time, the residence time calculated from the break- through curve would be small (section 7, in fracture 1). If the tracer is injected in channels with low flow and large volume, then the travel time will be longer. Another situation may be that the tracer flows in slow channels for a long time before reaching a channel with large flow. In this last case we observe a long residence time and a large flow rate, and this may be mistakenly interpreted as a channel with large volume. For the larger injection flow rate the residence times are smaller because of the increase of the flow rate down- stream.
In fracture 1, with injection in the node (20, 20), the dispersion of the tracer is increased as the injection flow rate is increased. This is indicated in Table 1 by the decrease in Peclet number, which is inversely proportional to disper- sion. In some runs the dispersion did not present a clear relationship with the variation of the injection flow rate. A large variation in tracer dispersion was found among the different collection sections, with Peclet numbers ranging mainly in the interval of 10 to 50.
Case of fractures under stress. The experimental break- through curves obtained by Abelin et al. [1985] in the single fracture experiment in Stripa showed a large dispersion with Peclet numbers about 1-3, while our simulations discussed above give a small dispersion (a large Peclet numbeD. This may be explained by the fact that in the simulated runs described so far, the fracture aperture is never zero because the aperture distribution used is lognormal. However if a normal stress is applied on the fracture, the apertures are decreased and the fracture surfaces come in contact at some
locations. The contact area increases with increasing normal stress. Pyrak-Nolte et al. [1987] showed that in laboratory experiments on granite cores the contact area ranged from 8 to 15% with a normal stress of 3 MPa. In the Stripa experiment the normal stresses at the depth of 360 m were of the order of 5-20 MPa [Birgersson, 1988].
To simulate crudely a fracture under normal stress as in the Stripa experiment, the fracture apertures in all places were uniformly reduced by 0.125 unit and all apertures smaller than 0.125 unit in the original fracture were assumed to be zero. This resulted in contact area of 12% of the total fracture area. Simulation results showed that such a de-
crease of the fracture aperture lowered the flow in the fracture and increased the channeling. Figure 5 shows the relative flow in each collection section on the exit side of
fracture 1 with and without this aperture reduction. For a fracture under normal stress, our simulations also
showed that the variation of the injection flow rate has a strong influence on the residence time. Even after correcting for the overall change in aperture values, a negligible injec- tion flow rate may result in orders of magnitude increase of the residence time. This situation may be found in field experiments when a very small flow is used for the injection of the tracer with the purpose to not disturb the "natural"
2384 MORENO ET AL.' ANOMALOUS FI. OW AND TRANSPORT FROM FRACTURES
o.o o'.• o'.2 o'.• o'.• o'.s o'.6 x
I ' ! ! '
o.o o'.• o'.•. o.• o.• o.s o.• x
0.7 0.8 0.9
Fig. 8. Tracer path for parallel flow with injection flow rates of (a) 0.72 and (b) 7.2 units of flow at the location (20, 20), or x - 0.5 and y = 0.5. The line thickness is proportional to the square root of the number of times that particles pass through a connection.
MORENO ET AL.: ANOMALOUS FLOW AND TRANSPORT FROM FRACTURES 2385
TABLE 1. Mean Residence Times and Peclet Number in the
Different Collection Sections on the Exit Side for Injection at Location (20, 20)
Injection Flow Rate for
Mean Residence Time*
Injection Flow Rate for Peclet Number*
Exit
Section 0.01 0.10 0.107 0.01 0.10 0.107
4 0.9 0.9 1.8 56 29 1.4 5 0.7 0.5 0.8 11 13 2.9 6 1.0 0.6 0.7 16 7 1.5 7 0.6 0.5 0.4 30 20 <1
9 0.7 0.6 0.6 41 33 1.1 10 0.8 0.8 1.2 25 14 1.3
*Fraction of the total flow rate in the fracture.
?For fracture under normal stress (12.5% closure), values cor- rected for the smaller flow in the fracture.
flow which existed before the injection. If the injection point happens to be located in an area with low flow and quite large volume, it will take the tracer a very long time to travel out to the mainstream of the flow field. This feature will be
discussed in more detail for the convergent flow case in the next section.
The dispersion was strongly increased for a fracture under stress. Peclet numbers less than 10.0 were, in general, obtained for fracture 1 when an injection flow rate of 0.10 of the total flow was used. In the Stripa experiment it could be assumed that fractures located at the 360-m level would be
under a certain normal stress. Thus this stress would ex-
plain, in part, the large dispersion found in these experi- ments. However, another factor which influences the results was the variable injection flow rate which caused different sets of pathways to be sought out by the tracers during the experiment. As shown above, a large injection flow rate created new pathways increasing the dispersion of the tracer.
Remarks on parallel flow system. The calculations per- formed show that the residence times and Peclet numbers
obtained in a given section may vary considerably. Thus the characterization of the transport properties of the fracture is made with a very high uncertainty if only one or a few point tracer injection experiments are performed. The results depend on the injection location, the injection flow rate, and the location of tracer collection. We may conclude that because of the stochastic nature of fracture apertures, one point tracer test in a fracture is not sufficient to characterize the hydraulic properties of the fracture (conductivity, aper- ture, and dispersivity). The dispersivity determined from these simulations can vary by 1 or 2 orders of magnitude. If fracture apertures are calculated, they could also vary by several orders of magnitude.
Injection of Tracers in a Convergent Flow System
In situ tracer tests are often carried out by withdrawing water from a borehole, thus creating a convergent flow field toward a sink where tracers injected at another point flow
into. The injection flow rate is often small, but not always a negligible part of the total flow into the collection borehole.
In our simulations, a quadrant symmetry was assumed and the single fracture with variable aperture (Figure 3) was used to represent the quadrant that was studied. The boundary conditions used were constant pressure head, P0, for the lower and left side and "no flow" conditions were imposed for the other two sides. The quadrant was covered by a 40 x 40 node mesh. The sink point was located in the upper right-hand corner at node (40, 40) and the injection point was chosen to be located at a distance away from the boundaries and collection point. Thirty-six alternative injection points located in the square with corners at (15, 15), (15, 25), (25, 25), and (25, 15) on each fracture were chosen for study.
Three injection flow rates were used: 0.005, 0.5, and 5% of the production flow rate at the collection point. To compare with the tracer test at Studsvik [Landstr6m et ai., 1983], an attempt was made to use a 10% production flow rate, but in some cases this caused difficulties. The induced pressure in the nodes close to the left and lower boundaries increased
higher than the constant pressure P0 when the fracture under normal stress was simulated. This allowed the tracer to
escape the system through these boundaries. To avoid this and for qualitative comparison purposes, a maximum injec- tion flow rate of 5% of the total flow was used instead. The
flow rate into the collection hole was maintained constant for
all the runs.
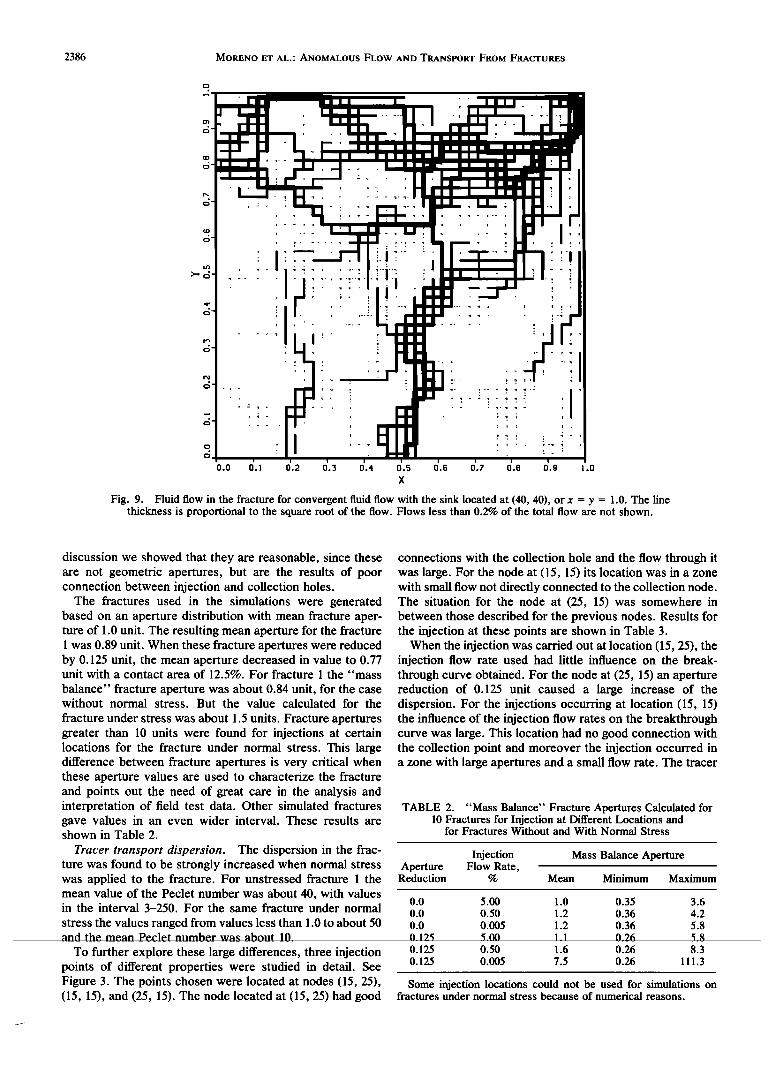
In the simulations the flow paths were determined first when there was no injection of tracers. Figure 9 shows the flow distribution in fracture 1. Two or three paths carried most of the flow, and near the collection hole these paths converged to a single large path. The other fractures which were simulated showed similar patterns.
Tracer residence times. The results of the tracer simula-
tions show that residence times vary over a wide range. For fracture 1, without normal stress, residence times were between 0.29 and 0.93 unit of time depending on the injection flow rate and where the tracers were injected. All residence times were normalized to correspond to the same travel distance. Thus if the fracture had been a parallel plane- walled one with the same average aperture as that of fracture 1, then the mean residence time would have been 0.39 unit of time. For simulations with the fracture under a normal
stress, one would expect the residence time to be smaller as the fracture aperture is smaller. But the simulated results show the opposite situation: the residence times were in- creased. Residence times of about 4-6 units of time were
found for injections at some locations. These large residence times were found in runs with both high and low injection flow rates. The reason is that in the first case the large residence time occurred due to a poor connection between the injection and collection holes; slow paths were used by the tracer. In the latter case it was because the injection was carried out in nodes with almost stagnant water.
It is sometimes useful to define a so-called "mass bal-
ance" fracture aperture as b = (Q tw)/(rrr2), where Q is the production flow rate, tw is the residence time and r is the distance between the injection and collection boreholes. It is a convenient measure of residence time scaled by Q and r. Thus the large residence times we obtained for fracture 1 imply large mass balance apertures. Such extraordinary large mass balance apertures were indeed obtained in the experiments by Landstr6m et al. [1983]. By the above
2386 MORENO ET AL ß ANOMALOUS FLOW AND TRANSPORT FROM FRACTURES
0.0 0.1 0.2 0.3 0.• O.S 0.6 0.? 0.8 0.9 1.0
Fig. 9. Fluid flow in the fracture for convergent fluid flow with the sink located at (40, 40), or x = y = 1.0. The line thickness is proportional to the square root of the flow. Flows less than 0.2% of the total flow are not shown.
discussion we showed that they are reasonable, since these are not geometric apertures, but are the results of poor connection between injection and collection holes.
The fractures used in the simulations were generated based on an aperture distribution with mean fracture aper- ture of 1.0 unit. The resulting mean aperture for the fracture 1 was 0.89 unit. When these fracture apertures were reduced by 0.125 unit, the mean aperture decreased in value to 0.77 unit with a contact area of 12.5%. For fracture 1 the "mass
balance" fracture aperture was about 0.84 unit, for the case without normal stress. But the value calculated for the
fracture under stress was about 1.5 units. Fracture apertures greater than 10 units were found for injections at certain locations for the fracture under normal stress. This large difference between fracture apertures is very critical when these aperture values are used to characterize the fracture and points out the need of great care in the analysis and interpretation of field test data. Other simulated fractures gave values in an even wider interval. These results are shown in Table 2.
Tracer transport dispersion. The dispersion in the frac- ture was found to be strongly increased when normal stress was applied to the fracture. For unstressed fracture 1 the mean value of the Peclet number was about 40, with values in the interval 3-250. For the same fracture under normal
stress the values ranged from values less than 1.0 to about 50
connections with the collection hole and the flow through it was large. For the node at (15, 15) its location was in a zone with small flow not directly connected to the collection node. The situation for the node at (25, 15) was somewhere in between those described for the previous nodes. Results for the injection at these points are shown in Table 3.
When the injection was carried out at location (15, 25), the injection flow rate used had little influence on the break- through curve obtained. For the node at (25, 15) an aperture reduction of 0.125 unit caused a large increase of the dispersion. For the injections occurring at location (15, 15) the influence of the injection flow rates on the breakthrough curve was large. This location had no good connection with the collection point and moreover the injection occurred in a zone with large apertures and a small flow rate. The tracer
TABLE 2. "Mass Balance" Fracture Apertures Calculated for 10 Fractures for Injection at Different Locations and
for Fractures Without and With Normal Stress
Injection Mass Balance Aperture Aperture Flow Rate,
Reduction % Mean Minimum Maximum
0.0 5.00 1.0 0.0 0.50 1.2 0.0 0.005 1.2
and tb• _m__ean Pe½!et number was abo•_•t !0: 0. t25 5:oo t: t
To further explore these large differences, three injection 0.125 0.50 1.6 points of different properties were studied in detail. See 0.125 0.005 7.5 Figure 3. The points chosen were located at nodes (15, 25), (15, 15), and (25, 15). The node located at (15, 25) had good
0.35 3.6 0.36 4.2
0.36 5.8 0•26 5.8
0.26 8.3 0.26 111.3
Some injection locations could not be used for simulations on fractures under normal stress because of numerical reasons.
MORENO ET AL.: ANOMALOUS FLOW AND TRANSPORT FROM FRACTURES 2387
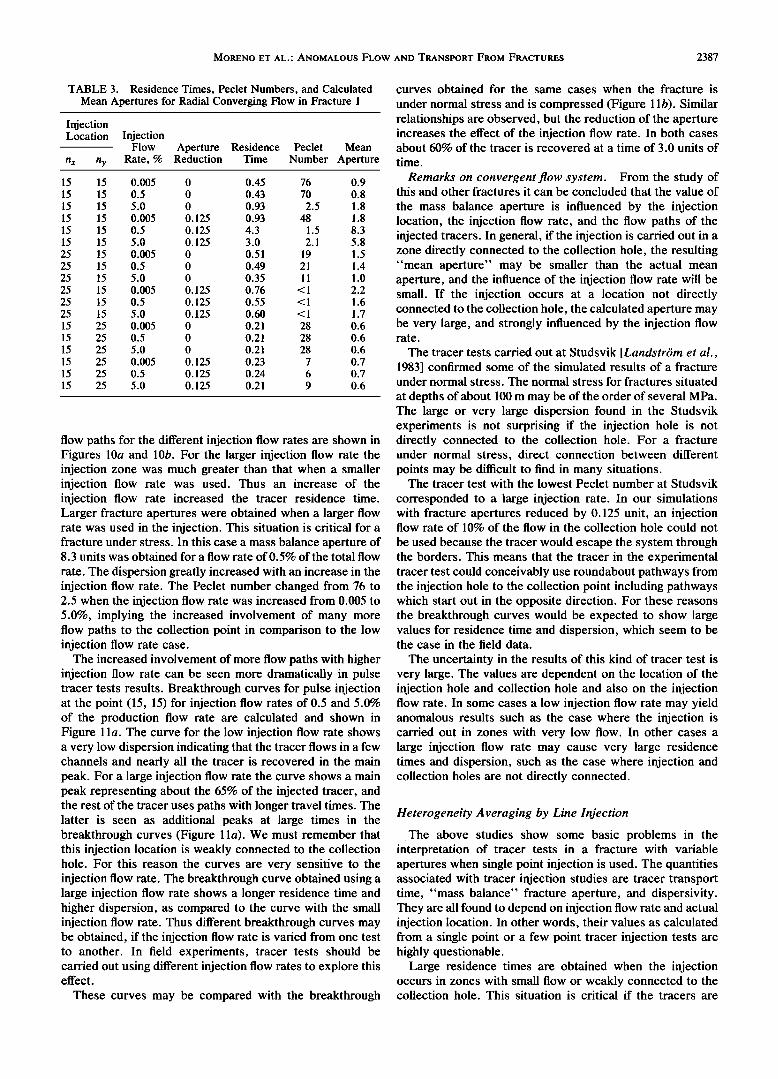
TABLE 3. Residence Times, Peclet Numbers, and Calculated Mean Apertures for Radial Converging Flow in Fracture 1
Injection Location Injection
Flow Aperture Residence Peclet Mean nx ny Rate, % Reduction Time Number Aperture
15 15 0.005 0 0.45 76 0.9 15 15 0.5 0 0.43 70 0.8 15 15 5.0 0 0.93 2.5 1.8 15 15 0.005 0.125 0.93 48 1.8 15 15 0.5 0.125 4.3 1.5 8.3 15 15 5.0 0.125 3.0 2.1 5.8 25 15 0.005 0 0.51 19 1.5 25 15 0.5 0 0.49 21 1.4 25 15 5.0 0 0.35 11 1.0 25 15 0.005 0.125 0.76 <1 2.2
25 15 0.5 0.125 0.55 <1 1.6 25 15 5.0 0.125 0.60 <1 1.7 15 25 0.005 0 0.21 28 0.6 15 25 0.5 0 0.21 28 0.6 15 25 5.0 0 0.21 28 0.6 15 25 0.005 0.125 0.23 7 0.7 15 25 0.5 0.125 0.24 6 0.7 15 25 5.0 0.125 0.21 9 0.6
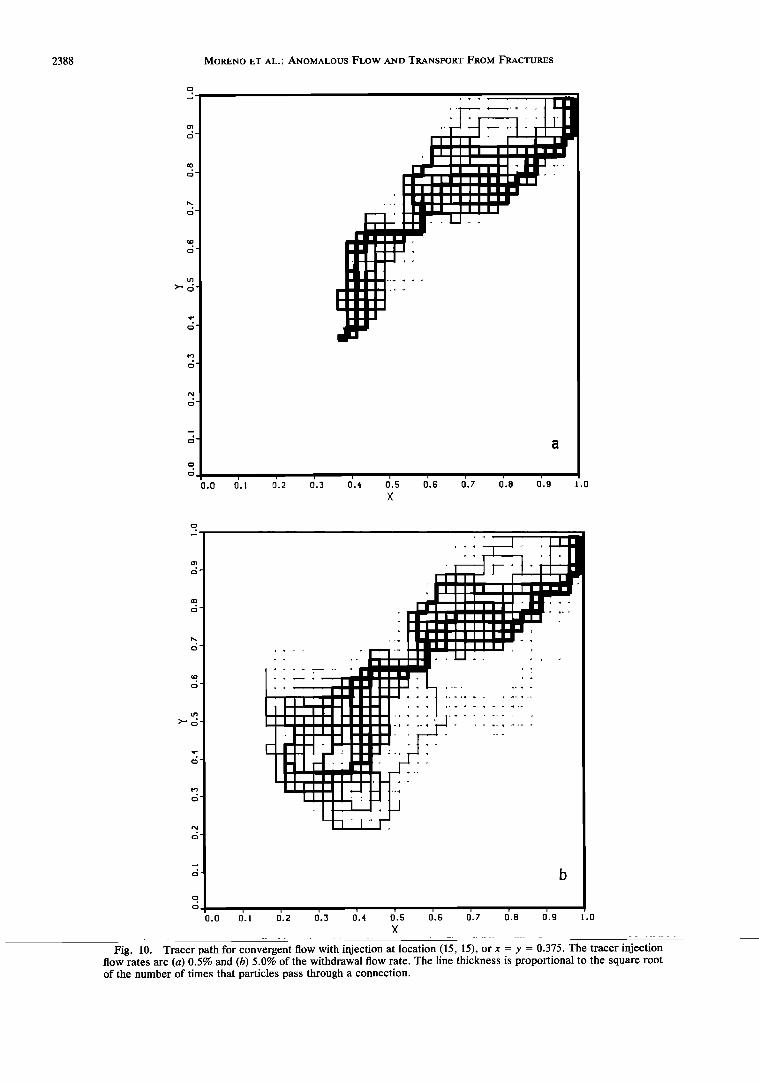
flow paths for the different injection flow rates are shown in Figures 10a and 10b. For the larger injection flow rate the injection zone was much greater than that when a smaller injection flow rate was used. Thus an increase of the injection flow rate increased the tracer residence time. Larger fracture apertures were obtained when a larger flow rate was used in the injection. This situation is critical for a fracture under stress. In this case a mass balance aperture of 8.3 units was obtained for a flow rate of 0.5% of the total flow
rate. The dispersion greatly increased with an increase in the injection flow rate. The Peclet number changed from 76 to 2.5 when the injection flow rate was increased from 0.005 to 5.0%, implying the increased involvement of many more flow paths to the collection point in comparison to the low injection flow rate case.
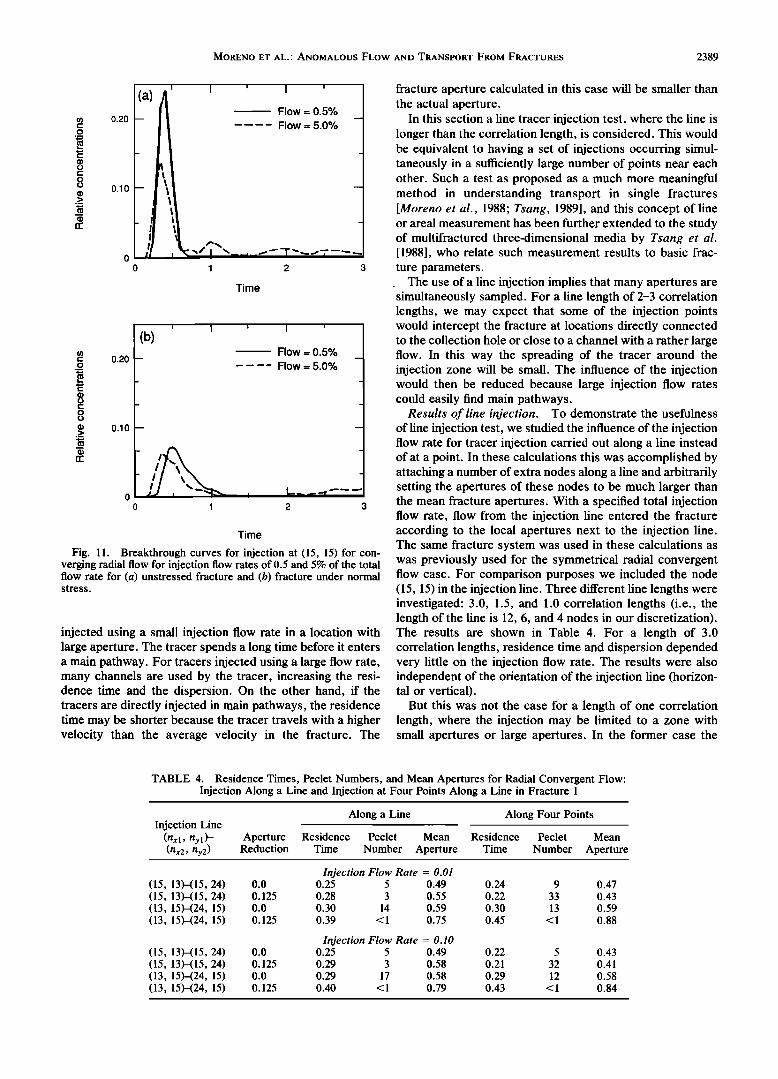
The increased involvement of more flow paths with higher injection flow rate can be seen more dramatically in pulse tracer tests results. Breakthrough curves for pulse injection at the point (15, 15) for injection flow rates of 0.5 and 5.0% of the production flow rate are calculated and shown in Figure 1 la. The curve for the low injection flow rate shows a very low dispersion indicating that the tracer flows in a few channels and nearly all the tracer is recovered in the main peak. For a large injection flow rate the curve shows a main peak representing about the 65% of the injected tracer, and the rest of the tracer uses paths with longer travel times. The latter is seen as additional peaks at large times in the breakthrough curves (Figure 1 la). We must remember that this injection location is weakly connected to the collection hole. For this reason the curves are very sensitive to the injection flow rate. The breakthrough curve obtained using a large injection flow rate shows a longer residence time and higher dispersion, as compared to the curve with the small injection flow rate. Thus different breakthrough curves may be obtained, if the injection flow rate is varied from one test to another. In field experiments, tracer tests should be carried out using different injection flow rates to explore this effect.
These curves may be compared with the breakthrough
curves obtained for the same cases when the fracture is
under normal stress and is compressed (Figure 1 lb). Similar relationships are observed, but the reduction of the aperture increases the effect of the injection flow rate. In both cases about 60% of the tracer is recovered at a time of 3.0 units of
time.
Remarks on convergent flow system. From the study of this and other fractures it can be concluded that the value of
the mass balance aperture is influenced by the injection location, the injection flow rate, and the flow paths of the injected tracers. In general, if the injection is carded out in a zone directly connected to the collection hole, the resulting "mean aperture" may be smaller than the actual mean aperture, and the influence of the injection flow rate will be small. If the injection occurs at a location not directly connected to the collection hole, the calculated aperture may be very large, and strongly influenced by the injection flow rate.
The tracer tests carried out at Studsvik [Landstr6m et al., 1983] confirmed some of the simulated results of a fracture under normal stress. The normal stress for fractures situated
at depths of about 100 m may be of the order of several MPa. The large or very large dispersion found in the Studsvik experiments is not surprising if the injection hole is not directly connected to the collection hole. For a fracture under normal stress, direct connection between different points may be difficult to find in many situations.
The tracer test with the lowest Peclet number at Studsvik
corresponded to a large injection rate. In our simulations with fracture apertures reduced by 0.125 unit, an injection flow rate of 10% of the flow in the collection hole could not
be used because the tracer would escape the system through the borders. This means that the tracer in the experimental tracer test could conceivably use roundabout pathways from the injection hole to the collection point including pathways which start out in the opposite direction. For these reasons the breakthrough curves would be expected to show large values for residence time and dispersion, which seem to be the case in the field data.
The uncertainty in the results of this kind of tracer test is very large. The values are dependent on the location of the injection hole and collection hole and also on the injection flow rate. In some cases a low injection flow rate may yield anomalous results such as the case where the injection is carried out in zones with very low flow. In other cases a large injection flow rate may cause very large residence times and dispersion, such as the case where injection and collection holes are not directly connected.
Heterogeneity Averaging by Line Injection
The above studies show some basic problems in the interpretation of tracer tests in a fracture with variable apertures when single point injection is used. The quantities associated with tracer injection studies are tracer transport time, "mass balance" fracture aperture, and dispersivity. They are all found to depend on injection flow rate and actual injection location. In other words, their values as calculated from a single point or a few point tracer injection tests are highly questionable.
Large residence times are obtained when the injection occurs in zones with small flow or weakly connected to the collection hole. This situation is critical if the tracers are
2388 MORENO ET AL ' ANOMALOUS FLOW AND TRANSPORT FROM FRACTURES
o.o o'.• o'.2 o'.3 o'.• o'.s o'.s o'.• o'.o o'.• x
1o
Fig. 10. Tracer path for convergent flow with injection at location (15, 15), or x = y = 0.375. The tracer injection flow rates are (a) 0.5% and (b) 5.0% of the withdrawal flow rate. The line thickness is proportional to the square root of the number of times that particles pass through a connection.
MORENO ET AL ß ANOMALOUS FLOW AND TRANSPORT FROM FRACTURES 2389
(D 0
0 0
(D .--
(a) A' I ' I 'o I• Flow = 0.5 Yo 0.20 Flow = 5.0% -
-
0.10
0 I•i • •:*" I •._,_• • •'7'--• 0 1 2 3
Time
0.20
0.10
(b) Flow = 0.5%
Flow -- 5.0%
0 1 2 3
Time
Fig. 11. Breakthrough curves for injection at (15, 15) for con- verging radial flow for injection flow rates of 0.5 and 5% of the total flow rate for (a) unstressed fracture and (b) fracture under normal stress.
injected using a small injection flow rate in a location with large aperture. The tracer spends a long time before it enters a main pathway. For tracers injected using a large flow rate, many channels are used by the tracer, increasing the resi- dence time and the dispersion. On the other hand, if the tracers are directly injected in main pathways, the residence time may be shorter because the tracer travels with a higher velocity than the average velocity in the fracture. The
fracture aperture calculated in this case will be smaller than the actual aperture.
In this section a line tracer injection test, where the line is longer than the correlation length, is considered. This would be equivalent to having a set of injections occurring simul- taneously in a sufficiently large number of points near each other. Such a test as proposed as a much more meaningful method in understanding transport in single fractures [Moreno et al., 1988; Tsang, 1989], and this concept of line or areal measurement has been further extended to the study of multifractured three-dimensional media by Tsang et al. [1988], who relate such measurement results to basic frac- ture parameters.
The use of a line injection implies that many apertures are ß
simultaneously sampled. For a line length of 2-3 correlation lengths, we may expect that some of the injection points would intercept the fracture at locations directly connected to the collection hole or close to a channel with a rather large flow. In this way the spreading of the tracer around the injection zone will be small. The influence of the injection would then be reduced because large injection flow rates could easily find main pathways.
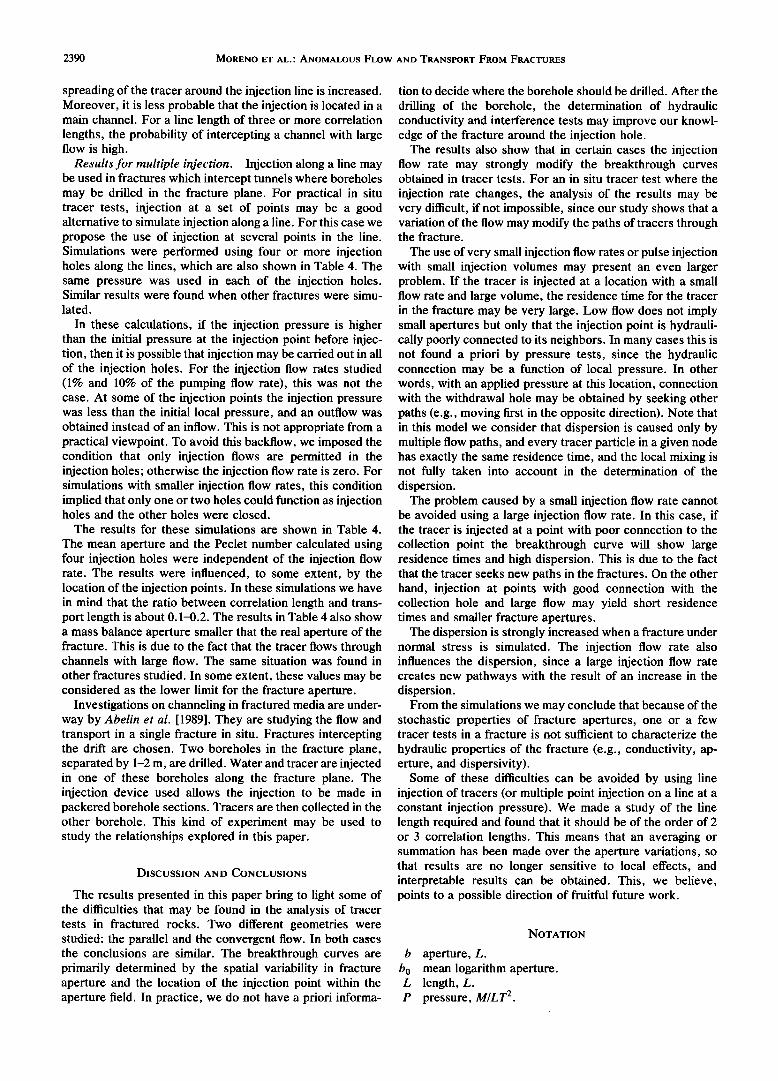
Results of line injection. To demonstrate the usefulness of line injection test, we studied the influence of the injection flow rate for tracer injection carried out along a line instead of at a point. In these calculations this was accomplished by attaching a number of extra nodes along a line and arbitrarily setting the apertures of these nodes to be much larger than the mean fracture apertures. With a specified total injection flow rate, flow from the injection line entered the fracture according to the local apertures next to the injection line. The same fracture system was used in these calculations as was previously used for the symmetrical radial convergent flow case. For comparison purposes we included the node (15, 15) in the injection line. Three different line lengths were investigated: 3.0, 1.5, and 1.0 correlation lengths (i.e., the length of the line is 12, 6, and 4 nodes in our discretization). The results are shown in Table 4. For a length of 3.0 correlation lengths, residence time and dispersion depended very little on the injection flow rate. The results were also independent of the orientation of the injection line (horizon- tal or vertical).
But this was not the case for a length of one correlation length, where the injection may be limited to a zone with small apertures or large apertures. In the former case the
TABLE 4. Residence Times, Peclet Numbers, and Mean Apertures for Radial Convergent Flow: Injection Along a Line and Injection at Four Points Along a Line in Fracture 1
Along a Line Along Four Points Injection Line
(nxl, nyl)- Aperture Residence Peclet Mean (nx2, ny2) Reduction Time Number Aperture
Residence Peclet Mean
Time Number Aperture
Injection Flow Rate = 0.01 (15, 13)-(15, 24) 0.0 0.25 5 0.49 (15, 13)-(15, 24) 0.125 0.28 3 0.55 (13, 15)-(24, 15) 0.0 0.30 14 0.59 (13, 15)-(24, 15) 0.125 0.39 <1 0.75
Injection Flow Rate = 0.10 (15, 13)-(15, 24) 0.0 0.25 5 0.49 (15, 13)-(15, 24) 0.125 0.29 3 0.58 (13, 15)-(24, 15) 0.0 0.29 17 0.58 (13, 15)-(24, 15) 0.125 0.40 <1 0.79
0.24 9 0.47 0.22 33 0.43 0.30 13 0.59
0.45 <1 0.88
0.22 5 0.43 0.21 32 0.41 0.29 12 0.58
0.43 <1 0.84
2390 MORENO ET AL ' ANOMALOUS FLOW AND TRANSPORT FROM FRACTURES
spreading of the tracer around the injection line is increased. Moreover, it is less probable that the injection is located in a main channel. For a line length of three or more correlation lengths, the probability of intercepting a channel with large flow is high.
Results for multiple injection. Injection along a line may be used in fractures which intercept tunnels where boreholes may be drilled in the fracture plane. For practical in situ tracer tests, injection at a set of points may be a good alternative to simulate injection along a line. For this case we propose the use of injection at several points in the line. Simulations were performed using four or more injection holes along the lines, which are also shown in Table 4. The same pressure was used in each of the injection holes. Similar results were found when other fractures were simu- lated.
In these calculations, if the injection pressure is higher than the initial pressure at the injection point before injec- tion, then it is possible that injection may be carried out in all of the injection holes. For the injection flow rates studied (1% and 10% of the pumping flow rate), this was not the case. At some of the injection points the injection pressure was less than the initial local pressure, and an outflow was obtained instead of an inflow. This is not appropriate from a practical viewpoint. To avoid this backflow, we imposed the condition that only injection flows are permitted in the injection holes; otherwise the injection flow rate is zero. For simulations with smaller injection flow rates, this condition implied that only one or two holes could function as injection holes and the other holes were closed.
The results for these simulations are shown in Table 4.
The mean aperture and the Peclet number calculated using four injection holes were independent of the injection flow rate. The results were influenced, to some extent, by the location of the injection points. In these simulations we have in mind that the ratio between correlation length and trans- port length is about 0.1-0.2. The results in Table 4 also show a mass balance aperture smaller that the real aperture of the fracture. This is due to the fact that the tracer flows through channels with large flow. The same situation was found in other fractures studied. In some extent, these values may be considered as the lower limit for the fracture aperture.
Investigations on channeling in fractured media are under- way by Abelin et al. [1989]. They are studying the flow and transport in a single fracture in situ. Fractures intercepting the drift are chosen. Two boreholes in the fracture plane, separated by 1-2 m, are drilled. Water and tracer are injected in one of these boreholes along the fracture plane. The injection device used allows the injection to be made in packered borehole sections. Tracers are then collected in the other borehole. This kind of experiment may be used to study the relationships explored in this paper.
DISCUSSION AND CONCLUSIONS
The results presented in this paper bring to light some of the difficulties that may be found in the analysis of tracer tests in fractured rocks. Two different geometries were •t•die•d' tho n•r•11ol and tho convergent the conclusions are similar. The breakthrough curves are primarily determined by the spatial variability in fracture aperture and the location of the injection point within the aperture field. In practice, we do not have a priori informa-
tion to decide where the borehole should be drilled. After the
drilling of the borehole, the determination of hydraulic conductivity and interference tests may improve our knowl- edge of the fracture around the injection hole.
The results also show that in certain cases the injection flow rate may strongly modify the breakthrough curves obtained in tracer tests. For an in situ tracer test where the
injection rate changes, the analysis of the results may be very difficult, if not impossible, since our study shows that a variation of the flow may modify the paths of tracers through the fracture.
The use of very small injection flow rates or pulse injection with small injection volumes may present an even larger problem. If the tracer is injected at a location with a small flow rate and large volume, the residence time for the tracer in the fracture may be very large. Low flow does not imply small apertures but only that the injection point is hydrauli- cally poorly connected to its neighbors. In many cases this is not found a priori by pressure tests, since the hydraulic connection may be a function of local pressure. In other words, with an applied pressure at this location, connection with the withdrawal hole may be obtained by seeking other paths (e.g., moving first in the opposite direction). Note that in this model we consider that dispersion is caused only by multiple flow paths, and every tracer particle in a given node has exactly the same residence time, and the local mixing is not fully taken into account in the determination of the dispersion.
The problem caused by a small injection flow rate cannot be avoided using a large injection flow rate. In this case, if the tracer is injected at a point with poor connection to the collection point the breakthrough curve will show large residence times and high dispersion. This is due to the fact that the tracer seeks new paths in the fractures. On the other hand, injection at points with good connection with the collection hole and large flow may yield short residence times and smaller fracture apertures.
The dispersion is strongly increased when a fracture under normal stress is simulated. The injection flow rate also influences the dispersion, since a large injection flow rate creates new pathways with the result of an increase in the dispersion.
From the simulations we may conclude that because of the stochastic properties of fracture apertures, one or a few tracer tests in a fracture is not sufficient to characterize the
hydraulic properties of the fracture (e.g., conductivity, ap- erture, and dispersivity).
Some of these difficulties can be avoided by using line injection of tracers (or multiple point injection on a line at a constant injection pressure). We made a study of the line length required and found that it should be of the order of 2 or 3 correlation lengths. This means that an averaging or summation has been made over the aperture variations, so that results are no longer sensitive to local effects, and interpretable results can be obtained. This, we believe, points to a possible direction of fruitful future work.
NOTATION
b aperture, L. b0 mean logarithm aperture. L length, L. P pressure, M/LT 2.
MORENO ET AL.: ANOMALOUS FLOW AND TRANSPORT FROM FRACTURES 2391
Pe Peclet number.
Q water flow rate, L3/T. W channel width, L.
r radial distance, L. R resistance, M/L4T. tw water residence time, T. A correlation length, L. Ix dynamic viscosity, M/LT. rr standard deviation in the lognormal distribution.
rr• standard deviation in the breakthrough curve, T.
Acknowledgments. Part of the work was done when the first author (L. Moreno) was visiting Lawrence Berkeley Laboratory as a staff scientist in the Earth Sciences Division. His permanent address is at the Royal Institute of Technology, Stockholm, Swe- den. This work was supported in part by the Swedish Nuclear Fuel Supply Company, and in part by the U.S. Department of Energy, Office of Civilian Radioactive Waste Management, Office of Geo- logic Repositories, through contract DE-AC03-76SF00098.
REFERENCES
Abelin, H., I. Neretnieks, S. Tunbrant, and L. Moreno, Migration in a single fracture: Experimental results and evaluation, final re- port, Stripa project, Tech. Rep. 85-03, Swed. Nucl. Fuel and Waste Manage. Co. (SKB), Stockholm, May 1985.
Abelin, H., L. Birgersson, and I. Neretnieks, A channeling exper- iment to study flow and transport in natural fractures, in Scientific Basis for Nuclear Waste Management, xii, pp. 661-668, Materials Research Society, Pittsburgh, Pa., 1989.
Bird, R. B., W. E. Stewart, and E. N. Lightfoot, Transport Phenomena, John Wiley, New York, 1960.
Birgersson, L., Diffusion in the matrix of granitic rock: Field test in the Stripa mine, Licentiate thesis, Dep. of Chem. Eng., R. Inst. of Technol., Stockholm, 1988.
Bourke, P. T., Channeling of flow through fractures in rock, Proceedings, GEOVAL87 Symposium, pp. 167-177, Swed. Nucl. Power Insp., Stockholm, 1987.
Dagan, G., Solute transport in heterogeneous porous formations, J. Fluid Mech., 145, 151-177, 1984.
Dagan, G., Theory of solute transport by groundwater, Ann. Rev. Fluid Mech., 19, 183-215, 1987.
Gelhar, L. W., and C. L. Axness, Three-dimensional stochastic analysis of macrodispersion in aquifers, Water Resour. Res., 19(1), 161-180, 1983.
Heath, M. J., Solute migration experiments in fractured granite, South West England, in Design and Instrumentation of in Situ Experiments in Underground Laboratories for Radioactive Waste Disposal, Proceedings of a Joint CEC-NEA Workshop, Brussels, 15-17 May 1984, pp. 191-200, Balkema, Netherlands, 1985.
Hull, L. C., J. D. Miller, and T. M. Clemo, Laboratory and simulation studies of solute transport in fracture networks, Water Resour. Res., 23(8), 1505-1513, 1987.
Landstr6m, O., C. Klockars, O. Persson, E. Tullborg, S. Larson, K. Andersson, B. Allard, and B. Torstenfelt, Migration experi- ments in Studsvik, Tech. Rep. 83-18, Swed. Nucl. Fuel and Waste Manage. Co., Stockholm, 1983.
Levenspiel, O., Chemical Reaction Engineering, 2nd ed., p. 275, John Wiley, New York, 1972.
Moreno, L., I. Neretnieks, and T. Eriksen, Analysis of some laboratory tracer runs in natural fissures, Water Resour. Res., 21(7), 951-958, 1985.
Moreno, L., Y. W. Tsang, C. F. Tsang, F. Hale, and I. Neretnieks, Flow and transport in a single fracture: A stochastic model and its relation with field observations, Water Resour. Res., 24(12), 2033-2048, 1988.
Moreno, L., I. Neretnieks, and O. Landstr6m, Evaluation of some tracer tests at Studsvik, Tech. Rep. 89-09, Swed. Nucl. Fuel and Waste Manage. Co., Stockholm, 1989.
Neretnieks, I., Transport in fractured rocks, Proceedings, Memo- ries of the 17th International Congress of lAH, Tucson, AZ, vol. XVII, pp. 301-318, University of Arizona, Tucson, 1985.
Neretnieks, I., T. Eriksen, and P. Tfihtinen, Tracer movement in a single fissure in granitic rock: Some experimental results and their interpretation, Water Resour. Res., 18, 849-858, 1982.
Philip, J. R., The fluid mechanics of fracture and other junctions, Water Resour. Res., 24(2), 239-246, 1988.
Pyrak-Nolte, L. J., L. R. Myer, N. G. W. Cook, and P. A. Witherspoon, Hydraulics and mechanical properties of natural fractures in low permeability rocks, in Proceedings of Sixth International Congress on Rock Mechanics, pp. 225-231, A. A. Balkema, Boston, Mass., 1987.
Robinson, P. C., Connectivity, flow and transport in network models of fractures media, Ph.D. thesis, Oxford University, Oxford, 1984.
Schwartz, F. W., L. Smith, and A. S. Crowe, A stochastic analysis of macroscopic dispersion in fractured media, Water Resour. Res., 19(5), 1253-1265, 1983.
Tsang, C. F., A new approach to tracer transport analysis: From fracture systems to strongly heterogeneous porous media, in Proceedings, International Workshop on Appropriate Methodol- ogies for Development and Management of Groundwater Re- sources in Developing Countries, Hyderabad, India, Feb. 28-March 4, vol. 3, pp. 199-222, Oxford & IBH Publishing, New Delhi, 1989.
Tsang, Y. W., and C. F. Tsang, Channel model of flow through fractured media, Water Resour. Res., 23(3), 467-479, 1987.
Tsang, Y. W., and C. F. Tsang, Flow channeling in a single fracture as a two-dimensional strongly heterogeneous permeable medium, Water Resour. Res., 25, 2076-2080, 1989.
Tsang, Y. W., C. F. Tsang, I. Neretnieks, and L. Moreno, Flow and transport through fractured media: A variable-aperture channel model and its properties, Water Resour. Res., 24(12), 2049-2060, 1988.
Williams, S. A., and A.I. E1-Kadi, COVAR - A computer program for generating two-dimensional fields of autocorrelated parame- ters by matrix decomposition, Int. Groundwater Modelling Cent., Holcomb Res. Inst., Butler Univ., Indianapolis, Ind., 1986.
L. Moreno and I. Neretnieks, Department of Chemical Engineer- ing, Royal Institute of Technology, S-100 44 Stockholm, Sweden.
C.-F. Tsang and Y. Tsang, Earth Sciences Division, Lawrence Berkeley Laboratory, 1 Cyclotron Road, Berkeley, CA 94720.
(Received January 30, 1989; revised September 6, 1989;
accepted May 9, 1990.)
Related Documents