Some Analysis of Coloring Experiments and Intro to Competitive Contagion Assignment Prof. Michael Kearns Networked Life NETS 112 Fall 2014

Some Analysis of Coloring Experiments and Intro to Competitive Contagion Assignment Prof. Michael Kearns Networked Life NETS 112 Fall 2014.
Dec 31, 2015
Welcome message from author
This document is posted to help you gain knowledge. Please leave a comment to let me know what you think about it! Share it to your friends and learn new things together.
Transcript

Some Analysis of Coloring Experimentsand
Intro to Competitive Contagion Assignment
Prof. Michael Kearns
Networked Life
NETS 112
Fall 2014

Coloring Assignment: Experimental Design
• 30 graphs total• 10 each from the following generative models
– Erdos-Renyi– Small Worlds (multi-hop cycle with rewirings)– Preferential Attachment
• Controlled to keep number of edges and vertices constant• Also designed graphs to elicit different running times for heuristics

Are Some Families Harder Than Others?
Ordering Small World > Erdos-Renyi > Preferential Attachmentholds with each pairwise comparison passing P < 0.05 significance.
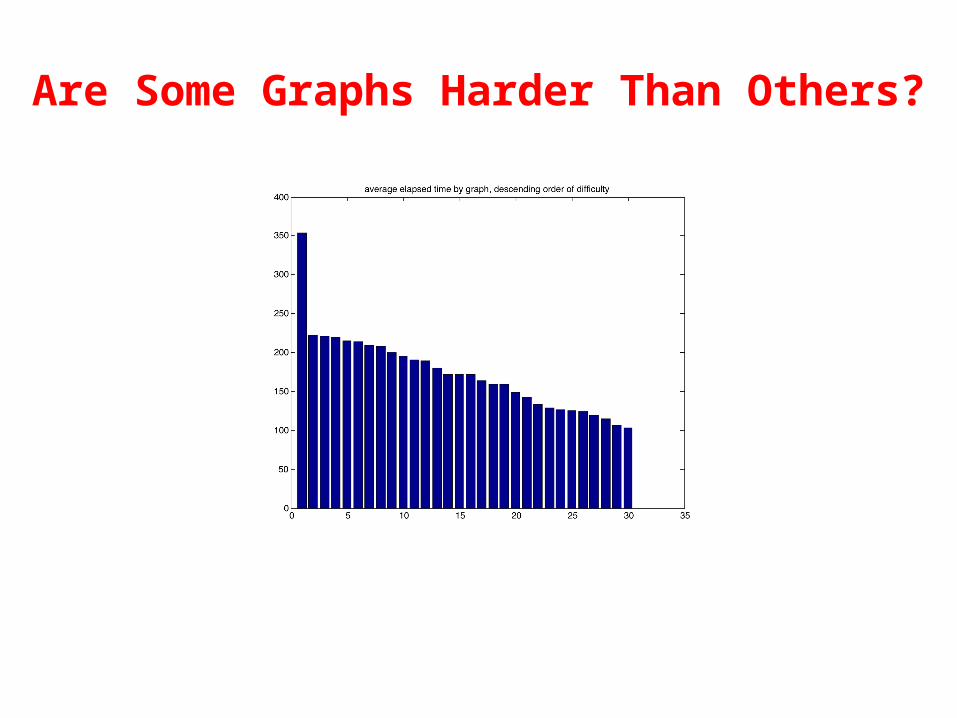
Are Some Graphs Harder Than Others?

Are Some Players Better Than Others?

What Correlates With Population Solution Time?
Methodology: Create vector of 30 population average solution times;Correlate with properties of graphs or other population properties.

Faster is Better: At the subject level, correlation between average solution time and average color changes/second = -0.53
How Do People Play?

How Do People Play?
Histogram of max degree – degree of first vertex colored

Penn vs. Coursera: Average Solution Times

Next Assignment:Experiments in Competitive Contagion

Scenario
• Your are the head of marketing for the Red Widget Company• You are tasked with creating the “viral spread” of Red Widgets on Facebook• Widgets are very compelling: once someone learns about them via their
friends, they simply must have one• Your budget permits you to give away two Red Widgets to seed their spread• Unfortunately, your counterpart at Blue Widget Co also has two seeds• Red and Blue Widgets are identical except for color, and have extreme
network/platform effects: you want to adopt the color your friends have• For a given network, your goal is to win more market share than your Blue
opponent(s)

Detailed Dynamics• Red and Blue each pick two seeds (duplicates chosen randomly)• At the first step, all neighbors of the seeds will adopt/buy a widget• At the next step, all their neighbors will buy a widget• In general, if step T is the first step at which some neighbor of v has adopted
a widget, then v will adopt on step T+1• To decide which color widget to adopt, v looks at the number of Red and
Blue widgets in their neighborhood, and adopts majority color (ties broken randomly)
• Any vertex in the connected component of any seed will eventually adopt• Two sources of randomization: duplicate seeds, ties in neighborhoods
Discussion• This is a (complex) game between Red and Blue• Pure strategies: all choose(N,2) choices of 2 seeds• Mixed strategies: all distributions over seed pairs• Payoffs: number of adoptions won• We will play a population opponent variant of this game• Let pay(s1,s2) denote the (expected) payoff to Red when Red chooses seed set s1 and Blue
chooses seed set s2• Let pay(s1,P) denote the (expected) payoff to Red when Red chooses seed set s1 and Blue chooses
a seed set randomly according to distribution P• Then payoff to Red is pay(s1,P), where P is the empirical distribution of seed choices of all your
classmates/opponents• In general, there is no right/best choice for s1: depends on P!• Let’s go to the app
Questions Worth Pondering• What does it mean for the population distribution P to be an equilibrium?• If P is an equilibrium what can we say about different players’ payoffs?• If P is an equilibrium and G is connected, what can we say about payoffs?• What if G is not connected?

How We Will Compute Scores• Let P be the population distribution of seed choices on graph G• For every seed set s that appears with non-zero probability in P, we will compute
its expected payoff with respect to P:– average of pay(s,s’) over many trials and many draws of s’ from P– enough draws/trials to distinguish/rank expected payoffs accurately
• We will then rank the s that appear in P by their expected payoffs• If you played s on G, you will receive a number of points equal to the number of
other players you strictly beat in expected payoff• Example: Suppose s1, s2 and s3 appear in P, and have expected payoffs and
population counts as follows:– s1: payoff 0.57, count 11; s2: payoff 0.48, count 71; s3: payoff 0.31, count 18– if you play s1, your score is 71+18=89; if s2, your score is 18; if s3, your score is 0
• If everyone plays the same thing, nobody receives any points• You must submit seeds for all graphs in order to receive any credit• Your overall score/grade for the assignment is the sum of your scores over all
graphs, which will then be curved• In general, there is no right/best choice for seeds: depends on P!
More Details• You can (and should) change seeds as often as you like• Important: Since P will change/evolve during the assignment, you should
revisit your seed choices in response• Deadline for assignment: 11:59PM on Monday November• URL for app: http://upenn-nwlife-contagion.herokuapp.com/• Active at noon today
Related Documents