Page 1 SOMALILAND IN-FIGURES EDITION 8

Welcome message from author
This document is posted to help you gain knowledge. Please leave a comment to let me know what you think about it! Share it to your friends and learn new things together.
Transcript
Page 1
SOMALILAND IN-FIGURES
EDITION 8
Page 2
Table of Contents Page
Preface 1
1. Introduction 2
2. Geography and Climate 2
2.1 Location 2
2.2 Area 2
2.3 Climate 2
2.4 Rainfall 3
2.5 Humidity 3
3. Administrative Sub-divisions 3
3.1 State 3
3.2 Regions and Districts 3
3.3 Capital 3
3.4 Other Principal Towns 3
3.5 Ports 4
4. Population 4
4.1 Vital Statistics 4
4.2 Population Density 4
4.3 Religion 4
4.4 Languages 4
4.5 Currency 4
5. Government Employees 5
6. Economic Sector 6
6.1. Banking 7
6.2 Livestock 7
6.3 Agriculture 9
6.3.1 Rain-fed Farming and Irrigation 9
6.3.2 Marketing of Agricultural Produce 9
6.3.3 Cereal Harvest in 2011 9
6.4 Light Industries 11
6.5 Fisheries 12
6.5.1 Artisan Fishing 12
6.5.2 Industrial Fishing 12
6.5.3 Fish Canneries 12
6.5.4Marketing 13
6.6 Revenue and Expenditure Central Government 15
6.7 Local Government Revenue and Expenditure 16
6.8 Import 20
6.9 Export 25
6.9.1 Livestock Export 25
6.10 Transport and Communication 30
I
7. Social Sector 34
Page 3
7.1 Education 34
7.1.2 Primary Education 35
7.1.3 Secondary Education 38
7.2 Higher Education 40
7.3 Health 63
7.3.1 Public Health 63
7.3.2 Private Health Service 70
7.4 Justice 75
7.4.1 Criminal Statistics 75
7.4.2 Prisoners 78
7.4.3 Vehicle Accident 78
7.5 Water 80
7.5.1 Available Water Facility 80
7.5.2 Status Boreholes 80
Page 4
PREFACE
The Ministry of National Planning and Development (MNP& D) has the honour of presenting the
2012 edition of Somaliland In-Figures. This booklet is the 8th publication in the series. It contains
official statistical data on various components of the economic and social activities in the Republic.
Its purpose is to provide information on different sectors to assist in the planning and development
of the nation.
Data contained in this booklet is based mainly on the administrative records of the ministries and
agencies of the state. The MNP&D is grateful for the assistance it received. Somaliland In-Figures will
be regularly updated. Therefore, we welcome the continued support of existing sources and
feedback from users of this data.
Comments and suggestions may be sent to the Department of Statistics and Research at the MNP&D
in Hargeisa.
Website: slministry of planning.org
“ XOG LA HEL YAABA TALO LA HEL.”
Page 5
1. INTRODUCTION The former British Somaliland Protectorate achieved full independence from the United Kingdom on
26 June, 1960. On 1 July, 1960, the state of Somaliland united with Somalia, a territory under a U.N.
mandated Italian Trusteeship until that same day, thereby creating the Somali Republic.
The Republic of Somaliland restored its independence after the total collapse of Somalia on 18 May
1991 as a result of the civil war of the late eighties and early nineties. The decision was made by the
Congress of Council of Clan Elders held in Burao from 27 April to 15 May, 1991. Constitutionally,
the Republic of Somaliland is a democratic country with a multi-party system.
2. GEOGRAPHY AND CLIMATE
2.1. LOCATION The Republic of Somaliland is situated in the Horn of Africa. Its boundaries are defined by the Gulf of Aden in the north, Somalia in the east, the Federal Republic of Ethiopia in the south-west, and the Republic of Djibouti in the north-west. It lies between Latitudes 8o and 11o27’ North and Longitudes 42o35’ and 49o East; it has mountain ranges rising up to six and seven thousand feet in the centre and in the east of the country respectively.
2.2. AREA
The total area of the Republic of Somaliland is 137, 600sqkms, and it has a coastline which is 850kms
long.
2.3. CLIMATE
Somaliland is located north of the Equator. It is semi-arid. The average daily temperatures range
from 25oC to 35oC. The sun passes vertically overhead twice a year, on 22 March and 23 September.
Somaliland consists of three main topographic zones:
The Coastal Plain (Guban)
The Coastal Range (Ogo)
The Plateau (Hawd)
The Coastal Plain (Guban) is a zone with high temperatures and low rainfall. Summer temperatures
in the region easily average over 100”F. However, temperatures come down during the winter, and
both human and livestock populations increase dramatically in the region.
The Coastal Range (Ogo) is a high plateau to the immediate south of Guban. Its elevation ranges from 6000ft at above the sea level in the north to 7000ft in the south. Rainfall is heavier than in Guban, although it varies considerably within the zone. The Plateau (Hawd) region lies to the south of Ogo. It is generally more heavily populated during the
wet season, when surface water is available. It is also an important area for grazing.
Page 6
2.4. RAINFALL
Somalilanders recognise four seasons in the year; GU and Hagaa comprise spring and summer in that
order, and Dayr and Jiilaal correspond to autumn and winter respectively.
The average annual rainfall is 14.5 inches in most parts of country, and most of it comes during Gu
and Dayr. GU, which is the first, or major, rainy season (late March, April, May, and early June),
experiences the heaviest rainfall in Ogo and Hawd. This constitutes the period of fresh grazing and
abundant surface water. It is also the breeding season for livestock. Hagaa (from late June through
August) is usually dry although there are often some scattered showers in Ogo; these are known as
Karan rains. Hagaa tends to be hot and windy in most parts of the country. Deyr (September,
October, and early November), which roughly corresponds to autumn, is the second, or minor, wet
season; as the word “minor” suggests, the amount of precipitation is generally less than that of Gu.
Jilaal, or winter, falls in the coolest and driest months of the year (from late November to early
March). It is a season of thirst. Ogo and Hawd receive virtually no rainfall in winter. The rainfall in the
Guban zone, known as “Hays”, comes between January and March or from December to January.
2.5. HUMIDITY
The humidity of the country varies from 63% in the dry season to 82% in the wet season.
3. ADMINISTRATIVE SUB-DIVISIONS
3.1. STATE
The administrative structure of the state consists of three branches: the judiciary, legislative (the
House of Elders and the House of Representatives), and the executive (the President and his chosen
Council of Ministers). The ministers may not be appointed from Members of Parliament.
3.2. REGIONS AND DISTRICTS
The country is divided into thirteen regions, namely, Awdal, Maroodi-jeeh, Saahil, Togdheer, Sanaag,
Sool, Gabilay, Salal, Oodweine, Saraar, Buhoodle, Hawd, and Badhan. These are sub-divided into 81
districts.
3.3. CAPITAL
The capital of the Republic of Somaliland is Hargeisa. The estimated population of the city is nearly
700,000.
3.4. OTHER PRINCIPAL TOWNS
Other towns are Borama, Berbera, Burao, Erigavo, and Las Anod.
Page 7
3.5. PORTS
The principal port town of Somaliland is Berbera.
4. POPULATION
The population of Somaliland was estimated at 3.9 million in 2010. The population consists of
nomads (55%) and urban and rural dwellers (45%).
a. VITA L STATISTICS
The annual population growth rate is 3.14%. This figure is calculated from the average crude birth
rate of 4.46% and crude death rate of 1.32%. Life expectancy at birth is 49.
b. POPULATION DENSITY
The population density in the Republic of Somaliland has been estimated at 28 persons per square
km in 2010
c. RELIGION
Somaliland is an Islamic State, and Somalilanders are Muslims. The influence of Islam throughout
Somaliland is profound, and faith plays a major role in everyday life.
d. LANGUAGES
The official language of the country is Somali. Arabic and English are also used widely, though mostly
in written form.
e. CURRENCY
The official currency of the Republic of Somaliland is the Somaliland Shilling. The shilling is divided
into 100 cents. Currency notes come in denominations of 500 100, 50, 20, 10, and 5 shillings.
Page 8
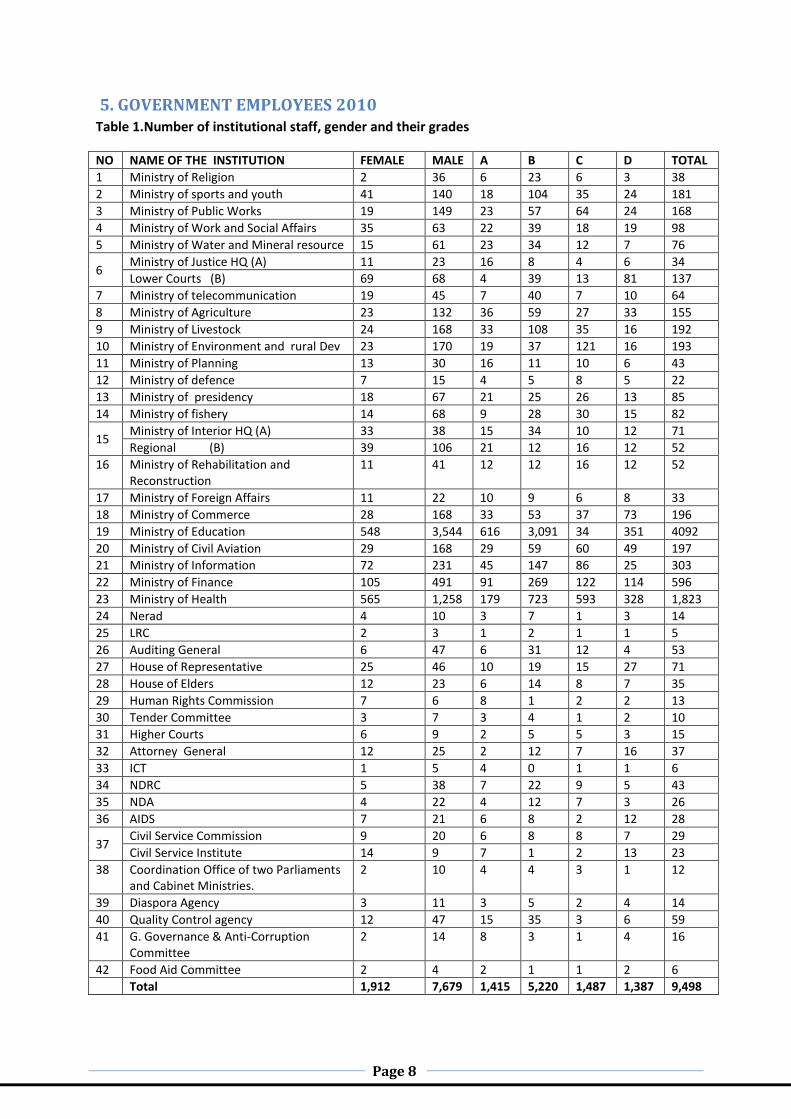
5. GOVERNMENT EMPLOYEES 2010 Table 1.Number of institutional staff, gender and their grades
NO NAME OF THE INSTITUTION FEMALE MALE A B C D TOTAL
1 Ministry of Religion 2 36 6 23 6 3 38
2 Ministry of sports and youth 41 140 18 104 35 24 181
3 Ministry of Public Works 19 149 23 57 64 24 168
4 Ministry of Work and Social Affairs 35 63 22 39 18 19 98
5 Ministry of Water and Mineral resource 15 61 23 34 12 7 76
6 Ministry of Justice HQ (A) 11 23 16 8 4 6 34
Lower Courts (B) 69 68 4 39 13 81 137
7 Ministry of telecommunication 19 45 7 40 7 10 64
8 Ministry of Agriculture 23 132 36 59 27 33 155
9 Ministry of Livestock 24 168 33 108 35 16 192
10 Ministry of Environment and rural Dev 23 170 19 37 121 16 193
11 Ministry of Planning 13 30 16 11 10 6 43
12 Ministry of defence 7 15 4 5 8 5 22
13 Ministry of presidency 18 67 21 25 26 13 85
14 Ministry of fishery 14 68 9 28 30 15 82
15 Ministry of Interior HQ (A) 33 38 15 34 10 12 71
Regional (B) 39 106 21 12 16 12 52
16 Ministry of Rehabilitation and Reconstruction
11 41 12 12 16 12 52
17 Ministry of Foreign Affairs 11 22 10 9 6 8 33
18 Ministry of Commerce 28 168 33 53 37 73 196
19 Ministry of Education 548 3,544 616 3,091 34 351 4092
20 Ministry of Civil Aviation 29 168 29 59 60 49 197
21 Ministry of Information 72 231 45 147 86 25 303
22 Ministry of Finance 105 491 91 269 122 114 596
23 Ministry of Health 565 1,258 179 723 593 328 1,823
24 Nerad 4 10 3 7 1 3 14
25 LRC 2 3 1 2 1 1 5
26 Auditing General 6 47 6 31 12 4 53
27 House of Representative 25 46 10 19 15 27 71
28 House of Elders 12 23 6 14 8 7 35
29 Human Rights Commission 7 6 8 1 2 2 13
30 Tender Committee 3 7 3 4 1 2 10
31 Higher Courts 6 9 2 5 5 3 15
32 Attorney General 12 25 2 12 7 16 37
33 ICT 1 5 4 0 1 1 6
34 NDRC 5 38 7 22 9 5 43
35 NDA 4 22 4 12 7 3 26
36 AIDS 7 21 6 8 2 12 28
37 Civil Service Commission 9 20 6 8 8 7 29
Civil Service Institute 14 9 7 1 2 13 23
38 Coordination Office of two Parliaments and Cabinet Ministries.
2 10 4 4 3 1 12
39 Diaspora Agency 3 11 3 5 2 4 14
40 Quality Control agency 12 47 15 35 3 6 59
41 G. Governance & Anti-Corruption Committee
2 14 8 3 1 4 16
42 Food Aid Committee 2 4 2 1 1 2 6
Total 1,912 7,679 1,415 5,220 1,487 1,387 9,498
Page 9
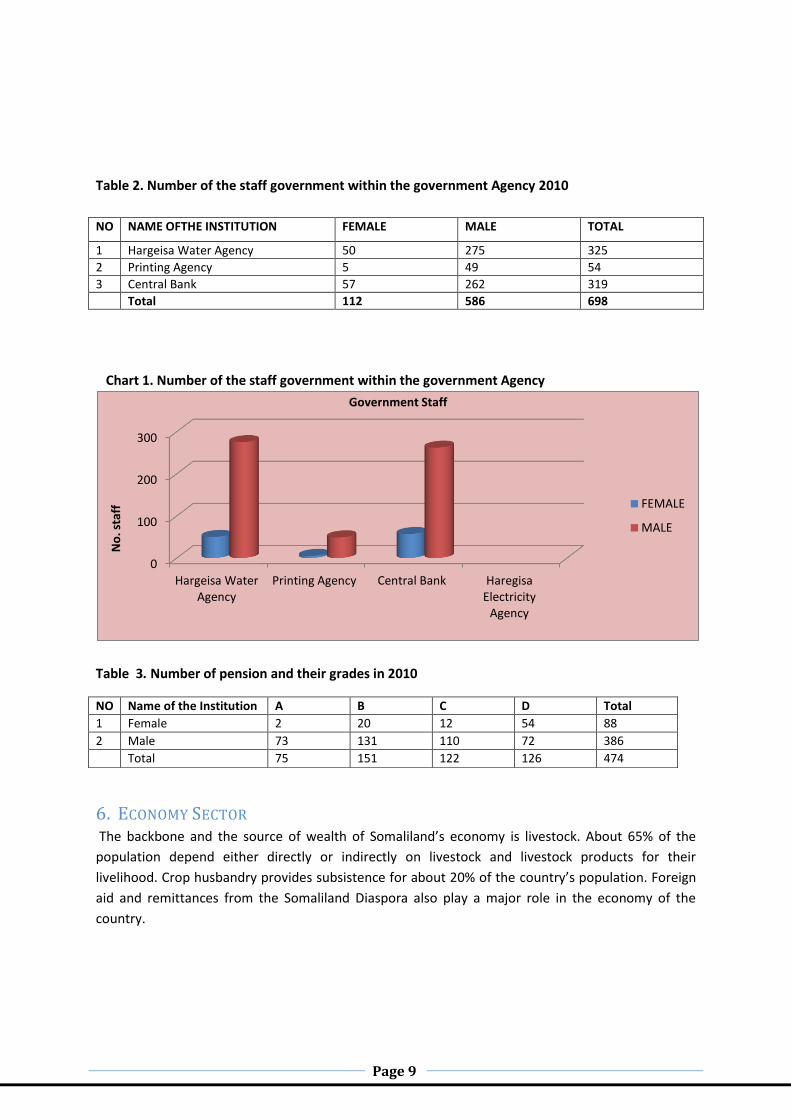
Table 2. Number of the staff government within the government Agency 2010
NO NAME OFTHE INSTITUTION FEMALE MALE TOTAL
1 Hargeisa Water Agency 50 275 325
2 Printing Agency 5 49 54
3 Central Bank 57 262 319
Total 112 586 698
Chart 1. Number of the staff government within the government Agency
Table 3. Number of pension and their grades in 2010
6. ECONOMY SECTOR The backbone and the source of wealth of Somaliland’s economy is livestock. About 65% of the
population depend either directly or indirectly on livestock and livestock products for their
livelihood. Crop husbandry provides subsistence for about 20% of the country’s population. Foreign
aid and remittances from the Somaliland Diaspora also play a major role in the economy of the
country.
0
100
200
300
Hargeisa Water Agency
Printing Agency Central Bank Haregisa Electricity
Agency
No
. sta
ff
Government Staff
FEMALE
MALE
NO Name of the Institution A B C D Total
1 Female 2 20 12 54 88
2 Male 73 131 110 72 386
Total 75 151 122 126 474
Page 10
6.1 BANKING One of the provisions of the National Constitution of the Republic Of Somaliland is the establishment
of a bank to carry out Central Bank functions. The Bank of Somaliland was inaugurated in 1994 with
appropriate bank laws to ensure that banking regulations are fully in place. The Bank of Somaliland
also operates as a commercial bank and has eight branches throughout the country.
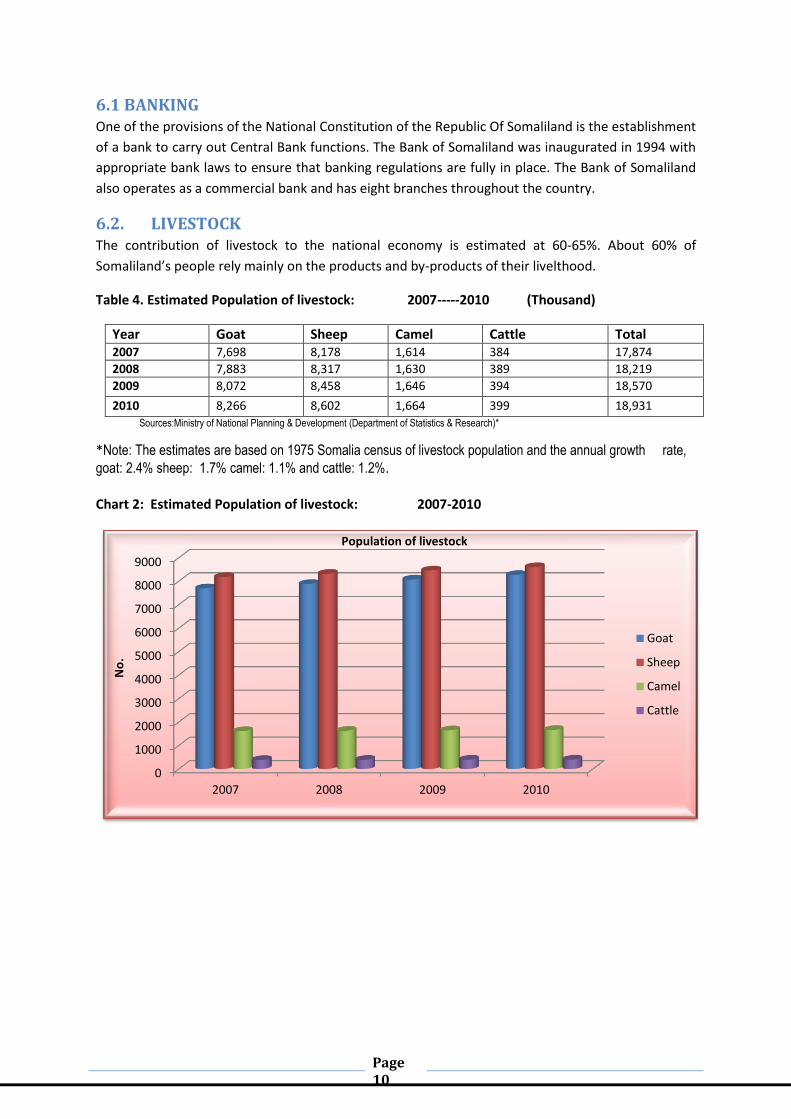
6.2. LIVESTOCK The contribution of livestock to the national economy is estimated at 60-65%. About 60% of
Somaliland’s people rely mainly on the products and by-products of their livelthood.
Table 4. Estimated Population of livestock: 2007-----2010 (Thousand)
Year Goat Sheep Camel Cattle Total 2007 7,698 8,178 1,614 384 17,874
2008 7,883 8,317 1,630 389 18,219
2009 8,072 8,458 1,646 394 18,570
2010 8,266 8,602 1,664 399 18,931
Sources:Ministry of National Planning & Development (Department of Statistics & Research)*
*Note: The estimates are based on 1975 Somalia census of livestock population and the annual growth rate,
goat: 2.4% sheep: 1.7% camel: 1.1% and cattle: 1.2%. Chart 2: Estimated Population of livestock: 2007-2010
0
1000
2000
3000
4000
5000
6000
7000
8000
9000
2007 2008 2009 2010
No
.
Population of livestock
Goat
Sheep
Camel
Cattle
Page 11
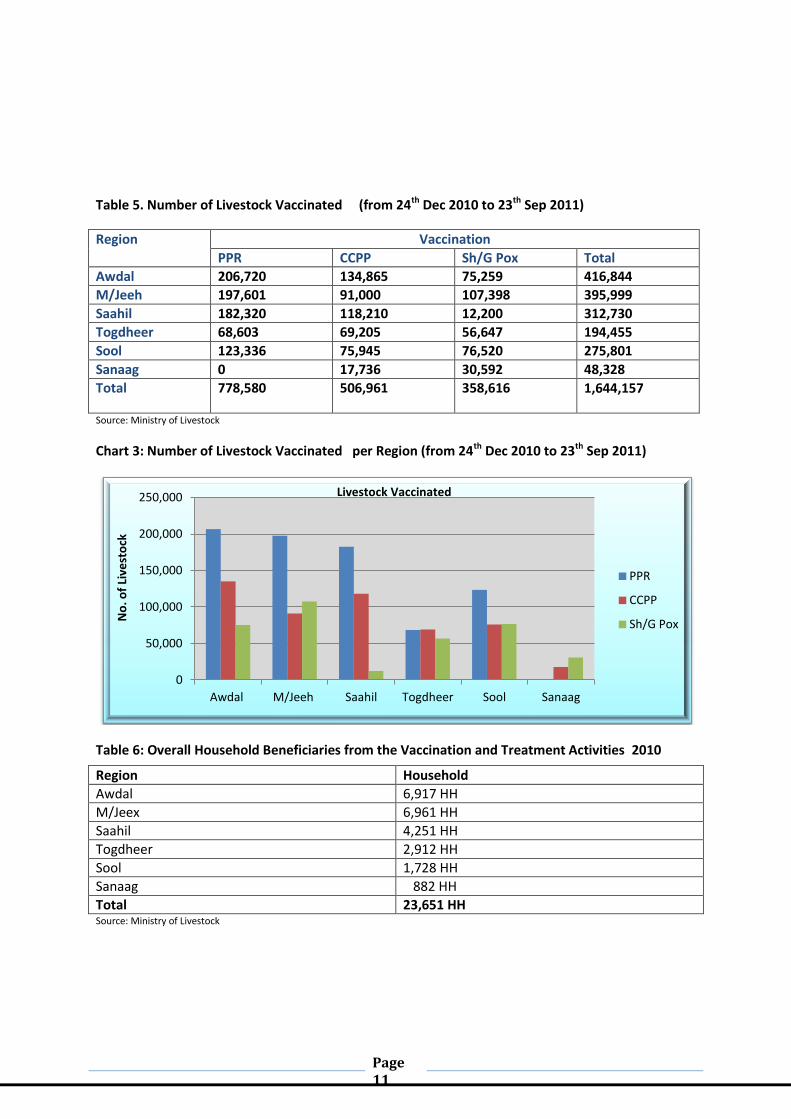
Table 5. Number of Livestock Vaccinated (from 24th Dec 2010 to 23th Sep 2011)
Region Vaccination
PPR CCPP Sh/G Pox Total
Awdal 206,720 134,865 75,259 416,844
M/Jeeh 197,601 91,000 107,398 395,999
Saahil 182,320 118,210 12,200 312,730
Togdheer 68,603 69,205 56,647 194,455
Sool 123,336 75,945 76,520 275,801
Sanaag 0 17,736 30,592 48,328
Total 778,580 506,961 358,616 1,644,157
Source: Ministry of Livestock
Chart 3: Number of Livestock Vaccinated per Region (from 24th Dec 2010 to 23th Sep 2011)
Table 6: Overall Household Beneficiaries from the Vaccination and Treatment Activities 2010
Region Household
Awdal 6,917 HH
M/Jeex 6,961 HH
Saahil 4,251 HH
Togdheer 2,912 HH
Sool 1,728 HH
Sanaag 882 HH
Total 23,651 HH Source: Ministry of Livestock
0
50,000
100,000
150,000
200,000
250,000
Awdal M/Jeeh Saahil Togdheer Sool Sanaag
No
. of
Live
sto
ck
Livestock Vaccinated
PPR
CCPP
Sh/G Pox
Page 12
6.3. AGRICULTURE Somaliland has a total area of about 137,600sqkms. Land under cultivation is currently estimated at
3% of the total geographical area. Another 7% has potential for agricultural development. The
rainfall, soil (fertility and depth), and topography are the main determinants of these estimates.
6.3.1. RAIN-FED FARMING AND IRRIGATION
Rain-fed farming is the main agricultural production system. The main crops grown are cereals.
Sorghum is the principal crop, utilizing approximately 70% of the rain-fed agricultural land. Another
25% of the land is used for maize. Other crops such as cowpeas, millet, groundnuts, beans, and
barley are also grown in scattered marginal lands.
Irrigation farms are mainly situated along the banks of streams (togs) and other water sources close
to the riverbanks. Channelling from the source to the farm is mainly done by diversion of perennial
water (springs) to the farm through rudimentary earth canals or floods. The cultivable area of these
farms is subject to floods and is, therefore, in danger of being washed away. Most of the irrigated
farms have in them areas set aside for the cultivation of vegetables and fruits for commercial
purposes.
6.3.2. MARKETING OF AGRICULTURAL PRODUCE
Farmers sell their products at the local market. Where possible, farm produce is transported to the
markets in the urban centres by way of light transport trucks or donkey carts. Small retailers who are
supplied directly by the producers or wholesalers sell the produce. There are also middlemen who
operate between wholesalers and retailers.
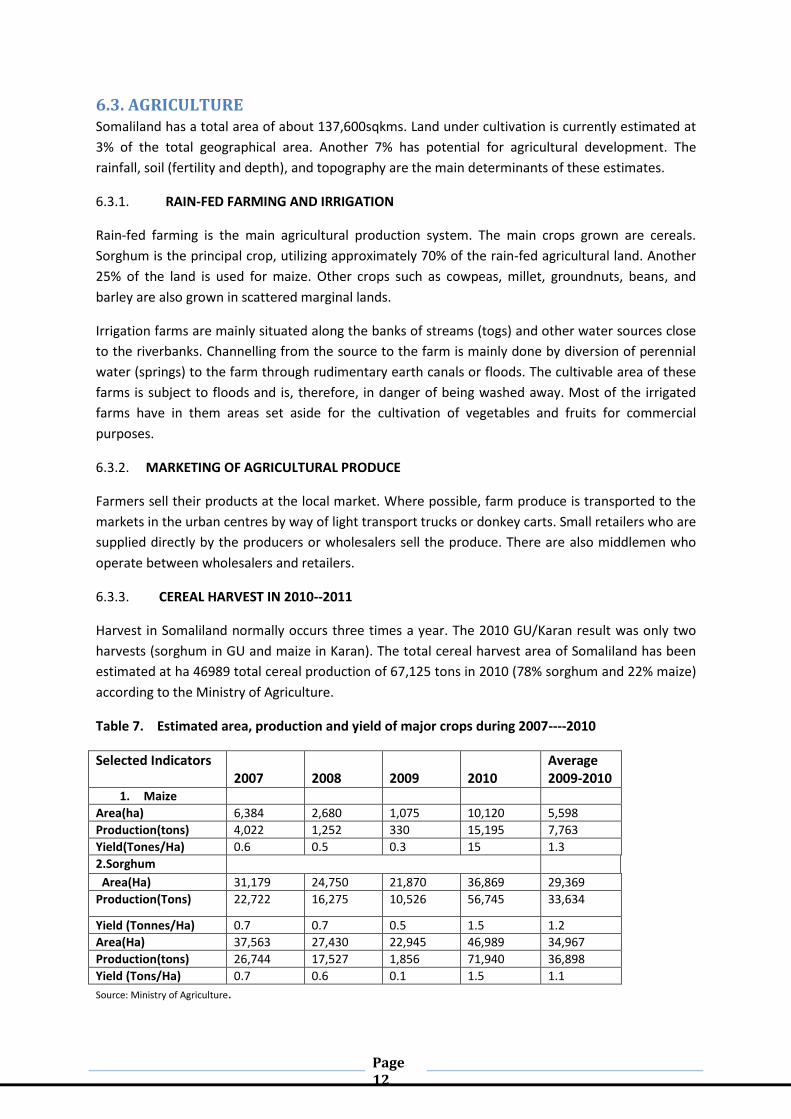
6.3.3. CEREAL HARVEST IN 2010--2011
Harvest in Somaliland normally occurs three times a year. The 2010 GU/Karan result was only two
harvests (sorghum in GU and maize in Karan). The total cereal harvest area of Somaliland has been
estimated at ha 46989 total cereal production of 67,125 tons in 2010 (78% sorghum and 22% maize)
according to the Ministry of Agriculture.
Table 7. Estimated area, production and yield of major crops during 2007----2010
Selected Indicators 2007
2008
2009
2010
Average 2009-2010
1. Maize
Area(ha) 6,384 2,680 1,075 10,120 5,598
Production(tons) 4,022 1,252 330 15,195 7,763
Yield(Tones/Ha) 0.6 0.5 0.3 15 1.3
2.Sorghum Area(Ha) 31,179 24,750 21,870 36,869 29,369
Production(Tons) 22,722 16,275 10,526 56,745 33,634
Yield (Tonnes/Ha) 0.7 0.7 0.5 1.5 1.2
Area(Ha) 37,563 27,430 22,945 46,989 34,967
Production(tons) 26,744 17,527 1,856 71,940 36,898
Yield (Tons/Ha) 0.7 0.6 0.1 1.5 1.1
Source: Ministry of Agriculture.

Page 13
Chart 4A. Estimated area, production and yield of major crops 2007---2010
Chart 4B: Estimated area, production (Maize & Sorghum) 2007---2010
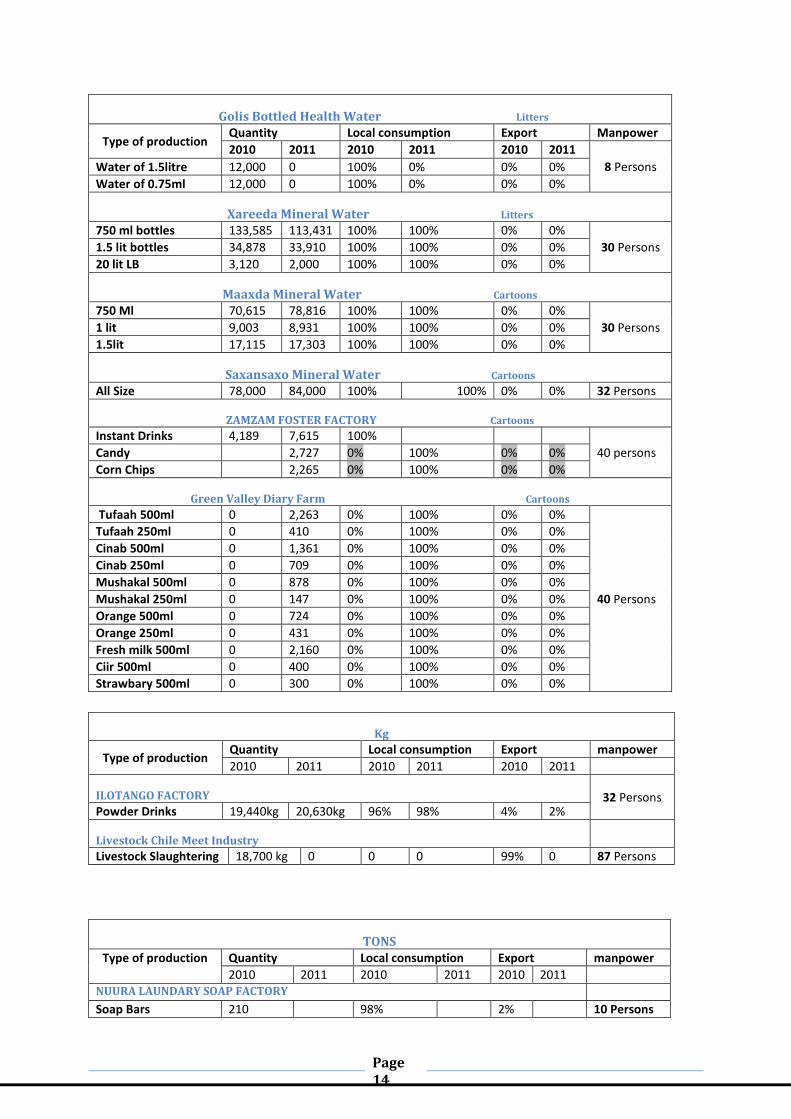
6.4. LIGHT INDUSTRIES Table 8: Light Industries Production and Manpower
0
0.2
0.4
0.6
0.8
1
1.2
1.4
1.6
2007 2008 2009 2010
Ton
ne
s/H
a
Estimated area, production and yield
Yield(Tones/Ha) Maize
Yield(Tones/Ha)Sorghum
0
10,000
20,000
30,000
40,000
50,000
60,000
2007 2008 2009 2010
Are
a/p
rod
uct
ion
in t
on
ne
s
Maize Area(ha)
Maize Production(tons)
Sorghum Area(Ha)
Sorghum Production(Tons)
Page 14
Golis Bottled Health Water Litters
Type of production Quantity Local consumption Export Manpower
2010 2011 2010 2011 2010 2011
8 Persons Water of 1.5litre 12,000 0 100% 0% 0% 0%
Water of 0.75ml 12,000 0 100% 0% 0% 0%
Xareeda Mineral Water Litters 750 ml bottles 133,585 113,431 100% 100% 0% 0%
30 Persons 1.5 lit bottles 34,878 33,910 100% 100% 0% 0%
20 lit LB 3,120 2,000 100% 100% 0% 0%
Maaxda Mineral Water Cartoons 750 Ml 70,615 78,816 100% 100% 0% 0%
30 Persons 1 lit 9,003 8,931 100% 100% 0% 0%
1.5lit 17,115 17,303 100% 100% 0% 0%
Saxansaxo Mineral Water Cartoons All Size 78,000 84,000 100% 100% 0% 0% 32 Persons
ZAMZAM FOSTER FACTORY Cartoons
Instant Drinks 4,189 7,615 100%
40 persons Candy 2,727 0% 100% 0% 0%
Corn Chips 2,265 0% 100% 0% 0%
Green Valley Diary Farm Cartoons
Tufaah 500ml 0 2,263 0% 100% 0% 0%
40 Persons
Tufaah 250ml 0 410 0% 100% 0% 0%
Cinab 500ml 0 1,361 0% 100% 0% 0%
Cinab 250ml 0 709 0% 100% 0% 0%
Mushakal 500ml 0 878 0% 100% 0% 0%
Mushakal 250ml 0 147 0% 100% 0% 0%
Orange 500ml 0 724 0% 100% 0% 0%
Orange 250ml 0 431 0% 100% 0% 0%
Fresh milk 500ml 0 2,160 0% 100% 0% 0%
Ciir 500ml 0 400 0% 100% 0% 0%
Strawbary 500ml 0 300 0% 100% 0% 0%
TONS Type of production Quantity Local consumption Export manpower
2010 2011 2010 2011 2010 2011 NUURA LAUNDARY SOAP FACTORY
Soap Bars 210 98% 2% 10 Persons
Kg
Type of production Quantity Local consumption Export manpower
2010 2011 2010 2011 2010 2011
ILOTANGO FACTORY 32 Persons Powder Drinks 19,440kg 20,630kg 96% 98% 4% 2%
Livestock Chile Meet Industry
Livestock Slaughtering 18,700 kg 0 0 0 99% 0 87 Persons
Page 15
Ileys Detergent Industry Corp.
Detergent Powder 360 390 100% 100% 0% 0% 20 Persons
6.5 FISHERIES
The warm water of the Gulf of Aden borders the country of Somaliland along a coastline spanning
850kms on its southern fringes. This coastline extends from Lowya-Addo in the west to Elayo in the
east and is characterized by sandy beaches broken at intervals by rocky cliffs that often penetrate
into the shallow waters.
The continental shelf is relatively narrow, rarely exceeding 15kms, except in the west near the Djibouti border, where it averages 100kms. Artisan fishermen harvest various tropical fish. They include tuna, snappers, groupers, grunts, trevally, emperors, barracudas, goatfish, parrotfish Spanish mackerels, sea breams, horse mackerels, and mulleys. Other marine organisms caught occasionally by local fishermen include sea cucumbers, shrimp, lobsters, and edible crabs. Production of fish in Somaliland is still very low (it’s less than 10% of the pre-war level and constitutes less than 2% of the Gross National Product [GNP]). According to various reports published by international organisations, fisheries in Somaliland remain
untapped. FAO estimates this abundance of fish in the national waters at 200,000 tons and
maintains that a maximum sustainable yield of 40,000 tons could be harvested without endangering
the stocks. At the present time, estimated fish production is quite low compared to the potential.
The shark fishing industry is the mainstay of the artisan fishing community in Somaliland, and more
than 90% of the fishing fleet hunts for sharks for their valuable fins. In addition to these, a sizeable
yield of sea cucumbers reaching several tons per year is harvested in the waters of Zeila and nearby
islands. Furthermore, edible crabs and shrimp are caught in the Zeila and Togoshi areas. Local
fishermen market around 30-50Kgs of live, edible crabs daily to Djibouti on foot.
6.5.1. ARTISANAL FISHING Artisanal fishermen conduct most fishing activity in Somaliland. There are around 15 fishing communities composed of active fishermen and their dependents. Berbera serves as a focal point for the fishing industry in Somaliland. Fish caught at Berbera range from 1000 to 2000kgs and are transported immediately to Hargeisa or to Burao for local consumption. The current fishing fleet consists of 425 motor boats and 109 canoes; four hundred twenty eight of these vessels are operational.
6.5.2. INDUSTRIAL FISHING
Presently, no industrial fishing is undertaken by foreign vessels. Somaliland does not have deep sea Fishing of vessels. 6.5.3. FISH CANNERY The country has one fish cannery at Las Qorey in Sanaag region; it was built in 2002 by a group of Local businessmen who installed a new canning machine. Production started in 2002 at a capacity of 1-2.5 tonnes per a day. But unfortunately, it was closed down March 2010.
6.5.4. MARKETING
Catches of fresh fish such as groupers, snappers, emperors, tuna, mackerels, and trevally are sold Locally in internal markets--such as Berbera, Hargeisa, Burao, Borama, and Erigavo--at a price of US $2.10 per Kilogramme. Local fishermen do not have access to an open external market for Exportation of their goods. Trucks transporting fish from the coast to the towns are in short
Page 16
supply, and the roads are narrow and inaccessible in most of the eastern and north-western parts of the coast. The most important item exported by fishermen is dried, salted shark fins. This marine product is exported to South-East Asian countries and usually serves as a good source of income for Fishermen (around US $ 1-1.5 million a year).
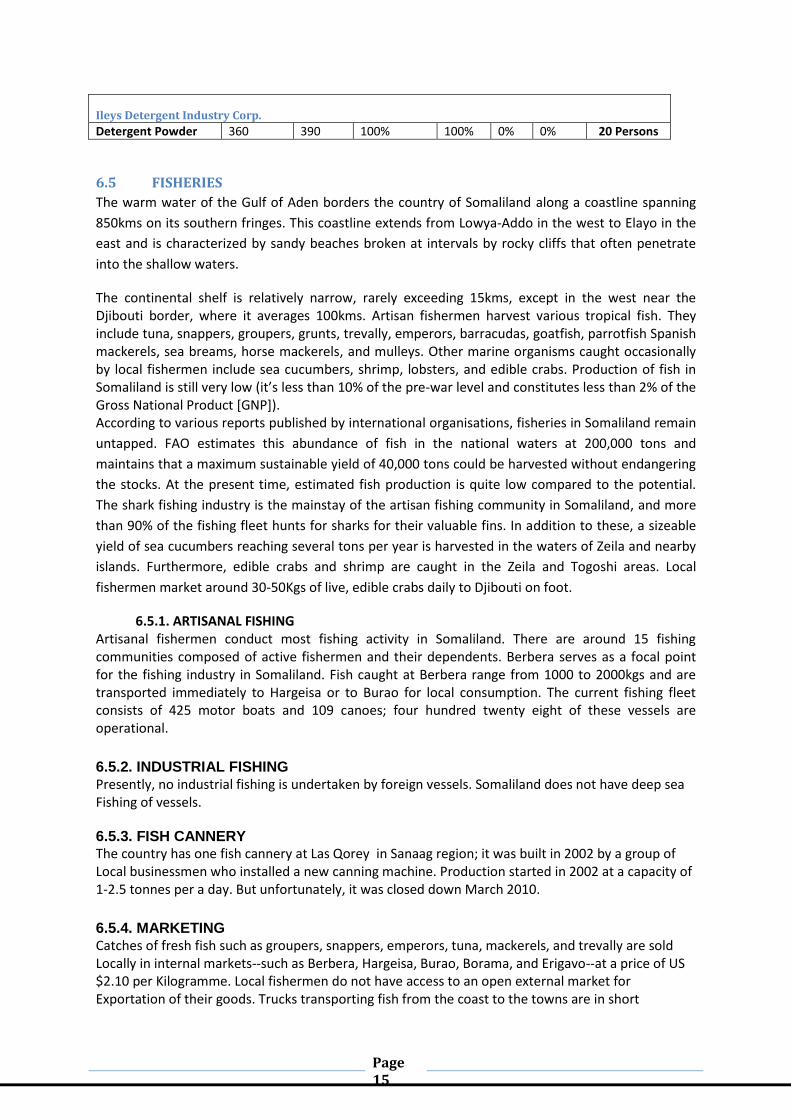
Table 9: Monthly Price Fish in Hargeisa 2007---2010 Price/kg (SL.Sh)
Month 2007 2008 2009 2010
January 12,531.25 12,528 21,188 14,125
February 12,562.50 13,828 21,594 14,000
March 12,234.34 12,438 21,188 17,218
April 11,875.00 12,875 14,906 16,500
May 12,000.00 13,234 14,000 14,750
June 12,000.00 14,234 13,688 14,500
July 12,562.50 18,094 23,063 16,500
August 13,000.00 17,469 13,500 15,000
September 12,162.50 15,547 13,625 16,500
October 12,656.25 16,016 14,250 16,000
November 11,912.50 17,503 14,000 17,375
December 12,437.50 17,503 13,969 17,750
Source: Ministry of Planning & Development (Department of Statistics).
Chart5: Monthly Price of Fish in Hargeisa 2007- 2010 (SL.Sh)
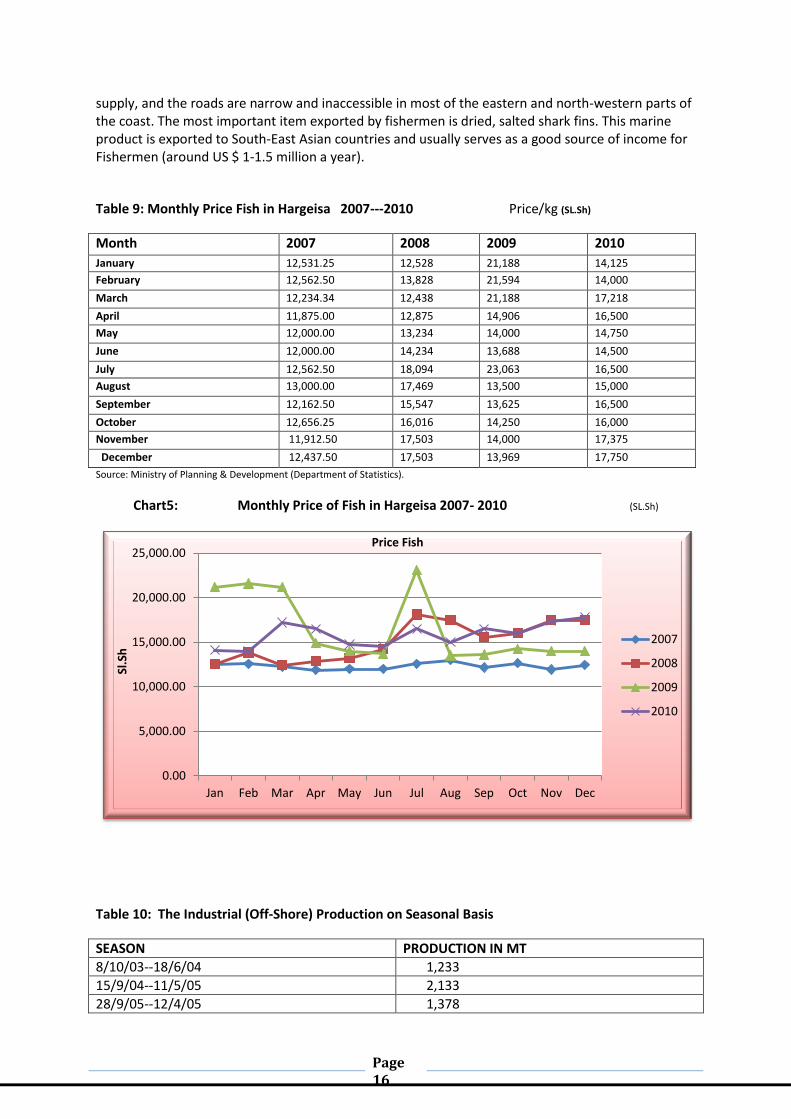
Table 10: The Industrial (Off-Shore) Production on Seasonal Basis
SEASON PRODUCTION IN MT
8/10/03--18/6/04 1,233
15/9/04--11/5/05 2,133
28/9/05--12/4/05 1,378
0.00
5,000.00
10,000.00
15,000.00
20,000.00
25,000.00
Jan Feb Mar Apr May Jun Jul Aug Sep Oct Nov Dec
Sl.S
h
Price Fish
2007
2008
2009
2010
Page 17
16/9/06--10/4/07 1,283
2008 N\A
2009 242,980
Season 2011 1,100 Source: Ministry of Fishing and Marine Resource
Chart 6: The Industrial (Off-Shore) Production on Seasonal Basis
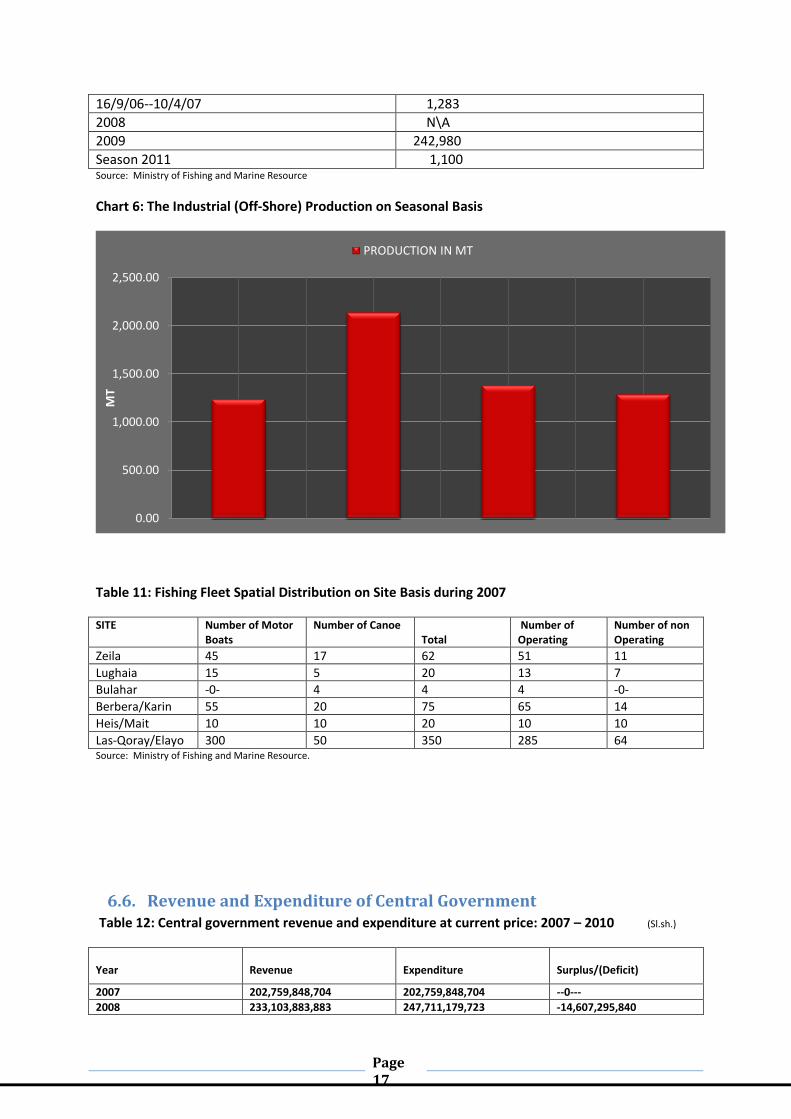
Table 11: Fishing Fleet Spatial Distribution on Site Basis during 2007
SITE Number of Motor Boats
Number of Canoe Total
Number of Operating
Number of non Operating
Zeila 45 17 62 51 11
Lughaia 15 5 20 13 7
Bulahar -0- 4 4 4 -0-
Berbera/Karin 55 20 75 65 14
Heis/Mait 10 10 20 10 10
Las-Qoray/Elayo 300 50 350 285 64 Source: Ministry of Fishing and Marine Resource.
6.6. Revenue and Expenditure of Central Government Table 12: Central government revenue and expenditure at current price: 2007 – 2010 (Sl.sh.)
Year
Revenue
Expenditure
Surplus/(Deficit)
2007 202,759,848,704 202,759,848,704 --0---
2008 233,103,883,883 247,711,179,723 -14,607,295,840
0.00
500.00
1,000.00
1,500.00
2,000.00
2,500.00
MT
PRODUCTION IN MT
Page 18
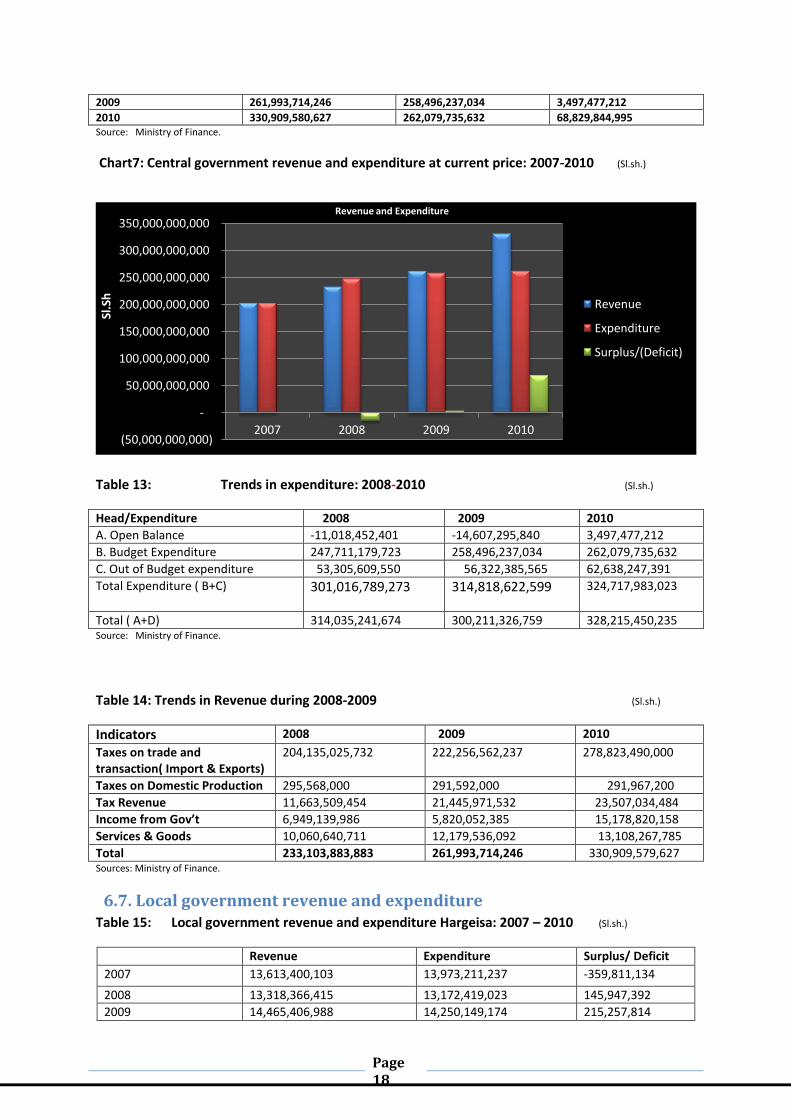
2009 261,993,714,246 258,496,237,034 3,497,477,212
2010 330,909,580,627 262,079,735,632 68,829,844,995 Source: Ministry of Finance.
Chart7: Central government revenue and expenditure at current price: 2007-2010 (Sl.sh.)
Table 13: Trends in expenditure: 2008-2010 (Sl.sh.)
Head/Expenditure 2008 2009 2010
A. Open Balance -11,018,452,401 -14,607,295,840 3,497,477,212
B. Budget Expenditure 247,711,179,723 258,496,237,034 262,079,735,632
C. Out of Budget expenditure 53,305,609,550 56,322,385,565 62,638,247,391
Total Expenditure ( B+C) 301,016,789,273 314,818,622,599 324,717,983,023
Total ( A+D) 314,035,241,674 300,211,326,759 328,215,450,235 Source: Ministry of Finance.
Table 14: Trends in Revenue during 2008-2009 (Sl.sh.)
Indicators 2008 2009 2010
Taxes on trade and transaction( Import & Exports)
204,135,025,732 222,256,562,237 278,823,490,000
Taxes on Domestic Production 295,568,000 291,592,000 291,967,200
Tax Revenue 11,663,509,454 21,445,971,532 23,507,034,484
Income from Gov’t 6,949,139,986 5,820,052,385 15,178,820,158
Services & Goods 10,060,640,711 12,179,536,092 13,108,267,785
Total 233,103,883,883 261,993,714,246 330,909,579,627 Sources: Ministry of Finance.
6.7. Local government revenue and expenditure
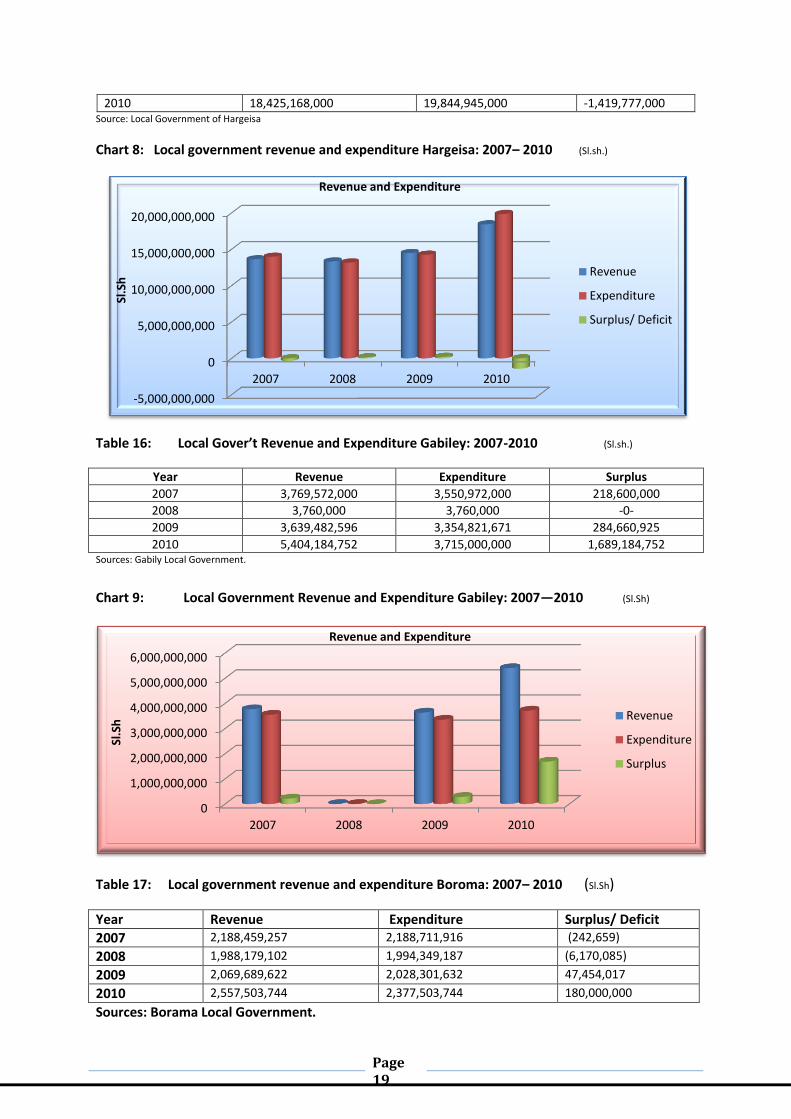
Table 15: Local government revenue and expenditure Hargeisa: 2007 – 2010 (Sl.sh.)
Revenue Expenditure Surplus/ Deficit
2007 13,613,400,103 13,973,211,237 -359,811,134
2008 13,318,366,415 13,172,419,023 145,947,392
2009 14,465,406,988 14,250,149,174 215,257,814
(50,000,000,000)
-
50,000,000,000
100,000,000,000
150,000,000,000
200,000,000,000
250,000,000,000
300,000,000,000
350,000,000,000
2007 2008 2009 2010
Sl.S
h
Revenue and Expenditure
Revenue
Expenditure
Surplus/(Deficit)
Page 19
2010 18,425,168,000 19,844,945,000 -1,419,777,000 Source: Local Government of Hargeisa
Chart 8: Local government revenue and expenditure Hargeisa: 2007– 2010 (Sl.sh.)
Table 16: Local Gover’t Revenue and Expenditure Gabiley: 2007-2010 (Sl.sh.)
Year Revenue Expenditure Surplus
2007 3,769,572,000 3,550,972,000 218,600,000
2008 3,760,000 3,760,000 -0-
2009 3,639,482,596 3,354,821,671 284,660,925
2010 5,404,184,752 3,715,000,000 1,689,184,752 Sources: Gabily Local Government.
Chart 9: Local Government Revenue and Expenditure Gabiley: 2007—2010 (Sl.Sh)
Table 17: Local government revenue and expenditure Boroma: 2007– 2010 (Sl.Sh)
Year Revenue Expenditure Surplus/ Deficit
2007 2,188,459,257 2,188,711,916 (242,659)
2008 1,988,179,102 1,994,349,187 (6,170,085)
2009 2,069,689,622 2,028,301,632 47,454,017
2010 2,557,503,744 2,377,503,744 180,000,000
Sources: Borama Local Government.
-5,000,000,000
0
5,000,000,000
10,000,000,000
15,000,000,000
20,000,000,000
2007 2008 2009 2010
Sl.S
h
Revenue and Expenditure
Revenue
Expenditure
Surplus/ Deficit
0
1,000,000,000
2,000,000,000
3,000,000,000
4,000,000,000
5,000,000,000
6,000,000,000
2007 2008 2009 2010
Sl.S
h
Revenue and Expenditure
Revenue
Expenditure
Surplus
Page 20
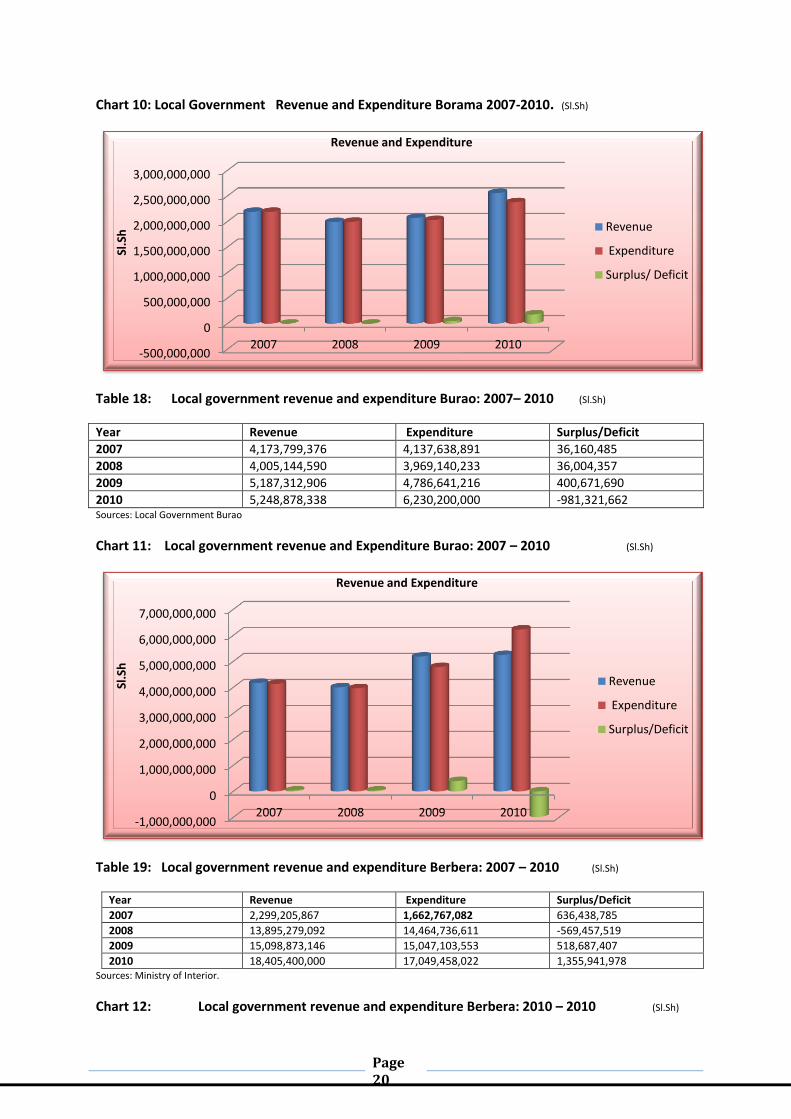
Chart 10: Local Government Revenue and Expenditure Borama 2007-2010. (Sl.Sh)
Table 18: Local government revenue and expenditure Burao: 2007– 2010 (Sl.Sh)
Year Revenue Expenditure Surplus/Deficit
2007 4,173,799,376 4,137,638,891 36,160,485
2008 4,005,144,590 3,969,140,233 36,004,357
2009 5,187,312,906 4,786,641,216 400,671,690
2010 5,248,878,338 6,230,200,000 -981,321,662 Sources: Local Government Burao
Chart 11: Local government revenue and Expenditure Burao: 2007 – 2010 (Sl.Sh)
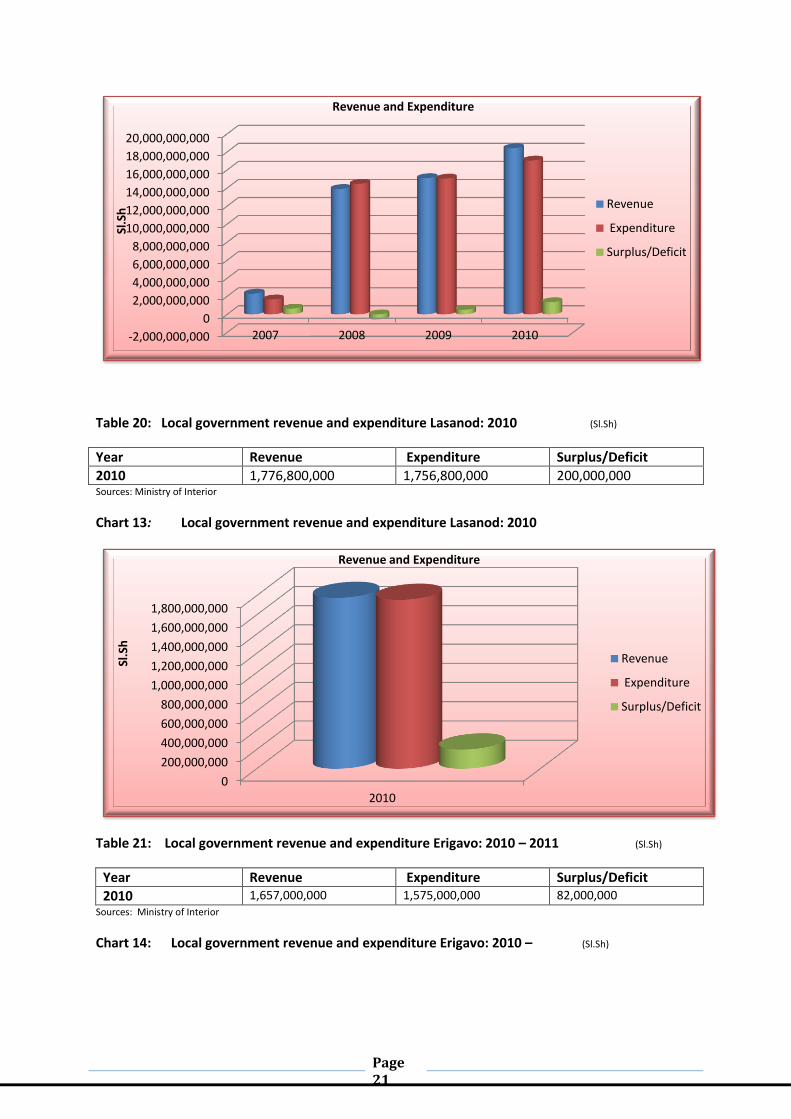
Table 19: Local government revenue and expenditure Berbera: 2007 – 2010 (Sl.Sh)
Year Revenue Expenditure Surplus/Deficit
2007 2,299,205,867 1,662,767,082 636,438,785
2008 13,895,279,092 14,464,736,611 -569,457,519
2009 15,098,873,146 15,047,103,553 518,687,407
2010 18,405,400,000 17,049,458,022 1,355,941,978 Sources: Ministry of Interior.
Chart 12: Local government revenue and expenditure Berbera: 2010 – 2010 (Sl.Sh)
-500,000,000
0
500,000,000
1,000,000,000
1,500,000,000
2,000,000,000
2,500,000,000
3,000,000,000
2007 2008 2009 2010
Sl.S
h
Revenue and Expenditure
Revenue
Expenditure
Surplus/ Deficit
-1,000,000,000
0
1,000,000,000
2,000,000,000
3,000,000,000
4,000,000,000
5,000,000,000
6,000,000,000
7,000,000,000
2007 2008 2009 2010
Sl.S
h
Revenue and Expenditure
Revenue
Expenditure
Surplus/Deficit
Page 21
Table 20: Local government revenue and expenditure Lasanod: 2010 (Sl.Sh)
Year Revenue Expenditure Surplus/Deficit
2010 1,776,800,000 1,756,800,000 200,000,000 Sources: Ministry of Interior
Chart 13: Local government revenue and expenditure Lasanod: 2010
Table 21: Local government revenue and expenditure Erigavo: 2010 – 2011 (Sl.Sh)
Year Revenue Expenditure Surplus/Deficit
2010 1,657,000,000 1,575,000,000 82,000,000 Sources: Ministry of Interior
Chart 14: Local government revenue and expenditure Erigavo: 2010 – (Sl.Sh)
-2,000,000,000
0
2,000,000,000
4,000,000,000
6,000,000,000
8,000,000,000
10,000,000,000
12,000,000,000
14,000,000,000
16,000,000,000
18,000,000,000
20,000,000,000
2007 2008 2009 2010
Sl.S
h
Revenue and Expenditure
Revenue
Expenditure
Surplus/Deficit
0
200,000,000
400,000,000
600,000,000
800,000,000
1,000,000,000
1,200,000,000
1,400,000,000
1,600,000,000
1,800,000,000
2010
Sl.S
h
Revenue and Expenditure
Revenue
Expenditure
Surplus/Deficit

Page 22
Table 22: Total Local government Revenue and Expenditure (Sl.Sh)
Year Revenue Expenditure Surplus/deficit
2006 19,264,259,721 22,890,294,275 -3,626,034,554
2007 18,101,065,227 23,850,534,044 -5,749,468,817
2008 33,210,729,199 33,604,405,054 -393,675,855
2009 40,460,765,258 39,467,017,246 993,748,012
2010 53,474,934,834 52,548,906,766 926,028,068
Source: Ministry of Interior
Chart 15: Total Local Government Expenditure and Revenue (Sl.Sh)
6.8. Import Table 23: Total of Food Items through Berbera Port 2007 (Tonnes)
Month Sugar Rice W/flour Wheat O/Beans Pasta Dates Biscuits
Jan 15,673 5 802 0 1,603 1,062 90 123
Feb 22,973 12,287 897 0 1,894 1,648 178 385
Mar 40,450 7,594 5,485 0 3,787 2,062 201 450
Apr 16,091 6,129 8,666 0 1,530 2,880 233 230
0
500,000,000
1,000,000,000
1,500,000,000
2,000,000,000
2010
Sl.S
h
Revenue and Expenditure
Revenue
Expenditure
Surplus/Deficit
-10,000,000,000
0
10,000,000,000
20,000,000,000
30,000,000,000
40,000,000,000
50,000,000,000
60,000,000,000
2006 2007 2008 2009 2010
Sl.S
h
Revenue and Expenditure
Revenue
Expenditure
Surplus/deficit
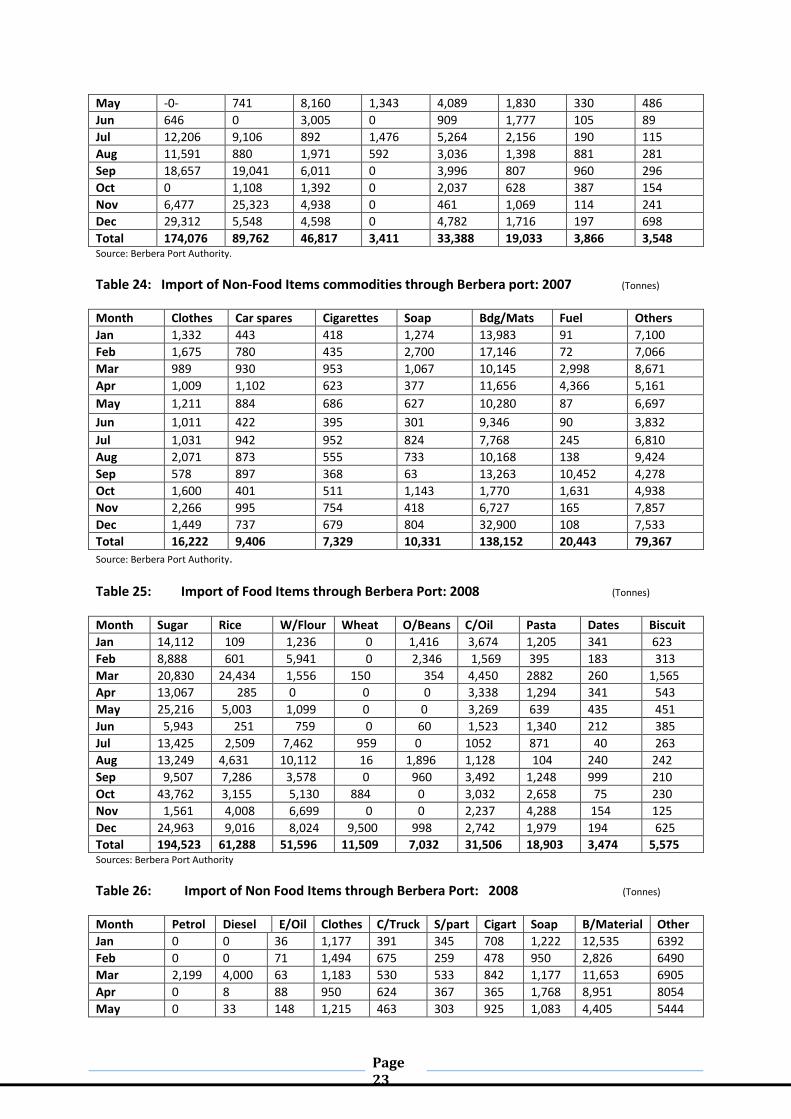
Page 23
May -0- 741 8,160 1,343 4,089 1,830 330 486
Jun 646 0 3,005 0 909 1,777 105 89
Jul 12,206 9,106 892 1,476 5,264 2,156 190 115
Aug 11,591 880 1,971 592 3,036 1,398 881 281
Sep 18,657 19,041 6,011 0 3,996 807 960 296
Oct 0 1,108 1,392 0 2,037 628 387 154
Nov 6,477 25,323 4,938 0 461 1,069 114 241
Dec 29,312 5,548 4,598 0 4,782 1,716 197 698
Total 174,076 89,762 46,817 3,411 33,388 19,033 3,866 3,548 Source: Berbera Port Authority.
Table 24: Import of Non-Food Items commodities through Berbera port: 2007 (Tonnes)
Month Clothes Car spares Cigarettes Soap Bdg/Mats Fuel Others
Jan 1,332 443 418 1,274 13,983 91 7,100
Feb 1,675 780 435 2,700 17,146 72 7,066
Mar 989 930 953 1,067 10,145 2,998 8,671
Apr 1,009 1,102 623 377 11,656 4,366 5,161
May 1,211 884 686 627 10,280 87 6,697
Jun 1,011 422 395 301 9,346 90 3,832
Jul 1,031 942 952 824 7,768 245 6,810
Aug 2,071 873 555 733 10,168 138 9,424
Sep 578 897 368 63 13,263 10,452 4,278
Oct 1,600 401 511 1,143 1,770 1,631 4,938
Nov 2,266 995 754 418 6,727 165 7,857
Dec 1,449 737 679 804 32,900 108 7,533
Total 16,222 9,406 7,329 10,331 138,152 20,443 79,367
Source: Berbera Port Authority.
Table 25: Import of Food Items through Berbera Port: 2008 (Tonnes)
Month Sugar Rice W/Flour Wheat O/Beans C/Oil Pasta Dates Biscuit
Jan 14,112 109 1,236 0 1,416 3,674 1,205 341 623
Feb 8,888 601 5,941 0 2,346 1,569 395 183 313
Mar 20,830 24,434 1,556 150 354 4,450 2882 260 1,565
Apr 13,067 285 0 0 0 3,338 1,294 341 543
May 25,216 5,003 1,099 0 0 3,269 639 435 451
Jun 5,943 251 759 0 60 1,523 1,340 212 385
Jul 13,425 2,509 7,462 959 0 1052 871 40 263
Aug 13,249 4,631 10,112 16 1,896 1,128 104 240 242
Sep 9,507 7,286 3,578 0 960 3,492 1,248 999 210
Oct 43,762 3,155 5,130 884 0 3,032 2,658 75 230
Nov 1,561 4,008 6,699 0 0 2,237 4,288 154 125
Dec 24,963 9,016 8,024 9,500 998 2,742 1,979 194 625
Total 194,523 61,288 51,596 11,509 7,032 31,506 18,903 3,474 5,575 Sources: Berbera Port Authority
Table 26: Import of Non Food Items through Berbera Port: 2008 (Tonnes)
Month Petrol Diesel E/Oil Clothes C/Truck S/part Cigart Soap B/Material Other
Jan 0 0 36 1,177 391 345 708 1,222 12,535 6392
Feb 0 0 71 1,494 675 259 478 950 2,826 6490
Mar 2,199 4,000 63 1,183 530 533 842 1,177 11,653 6905
Apr 0 8 88 950 624 367 365 1,768 8,951 8054
May 0 33 148 1,215 463 303 925 1,083 4,405 5444

Page 24
Jun 0 78 431 1,010 618 273 396 623 11,279 6212
Jul 0 294 33 2,015 76 236 542 631 4,711 6448
Aug 0 86 218 578 603 250 192 675 12,175 3839
Sep 1,969 3,894 72 1,653 283 232 646 919 1,367 8128
Oct 0 85 118 1,004 771 227 770 1,187 32,501 9163
Nov 0 2,811 2 2,806 1,011 239 646 701 17,145 10879
Dec 0 963 23 1,891 441 214 853 1,785 21,652 10791
Total 4,168 12,252 1,303 16,976 6,486 3,478 7,363 12,721 140,200 88745 Sources: Berbera Authority
Table 27: Import of Food Items through Berbera Port: 2009 (Tonnes)
Month Sugar Rice W/Flour Wheat O/Beans C/Oil Pasta Dates Biscuit
Jan 3075 8188 1195 0 0 2266 1300 241 700
Feb 12769 1878 4622 14025 1404 3184 2104 228 362
Mar 17493 3182 7285 0 941 1336 1176 166 384
Apr 21994 2646 1595 0 0 2670 1151 279 506
May 16027 12992 6567 24165 0 1272 962 95 262
Jun 3557 4552 4439 1800 913 2002 1611 43 218
Jul 7999 4764 4383 29369 3574 439 1197 662 245
Aug 13945 760 5899 0 699 446 1025 634 192
Sep 6012 4120 5131 997 0 526 3660 242 105
Oct 13359 3305 4498 0 0 364 660 89 284
Nov 39735 7158 3957 0 4800 1248 1731 271 602
Dec 0 6100 904 45356 607 1457 2199 119 372
Total 155,965 59,645 53,475 115,712 12,938 17,210 18,776 3,015 4,232 Sources: Berbera Authority
Table 28: Import of Non Food Items through Berbera Port: 2009 (Tonnes)
Month Petrol Diesel E/Oil Clothes C/Truck S/part Cigart Soap B/Material Other
Jan 0 953 35 1810 1173 209 1225 694 7,835 7,657
Feb 0 7176 36 1265 773 274 436 923 2,052 6,889
Mar 0 905 35 798 478 136 283 1068 12114 5,839
Apr 2661 2369 380 1550 886 372 290 674 16988 9,440
May 0 8193 215 1167 768 651 366 736 4075 10,367
Jun 658 2511 117 1103 617 343 496 864 16394 12,972
Jul 0 2812 206 1271 978 268 593 532 11536 12,128
Aug 990 2138 75 703 217 230 368 1002 12132 6,396
Sep 1064 4495 270 1831 1731 421 235 1214 16270 11,110
Oct 0 6644 158 1464 933 71 80 726 19870 6,145
Nov 1465 9140 138 1983 627 838 1833 1337 2623 15,333
Dec 798 1806 299 1345 1127 279 242 1116 11507 13,930
Total 7,636 49,142 1,964 16,290 10,308 4,192 6,447 10,886 133,396 118,206 Sources: Berbera Authority
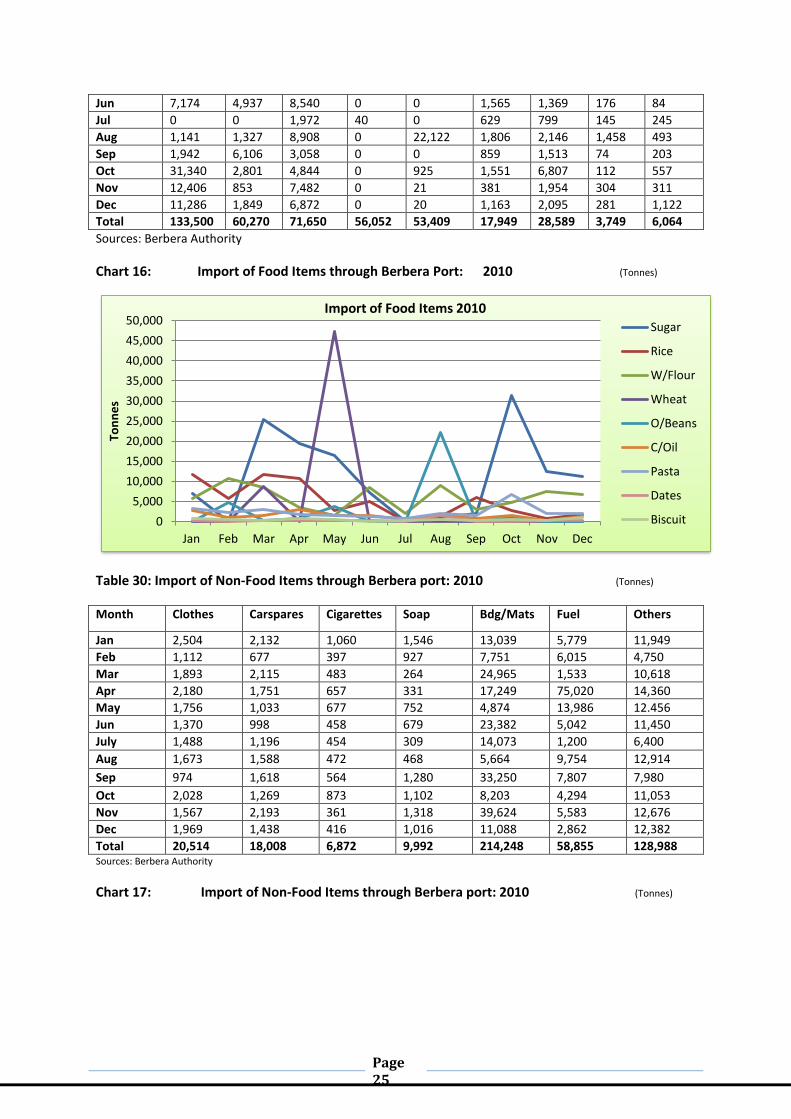
Table 29: Import of Food Items through Berbera Port: 2010 (Tonnes)
Month Sugar Rice W/Flour Wheat O/Beans C/Oil Pasta Dates Biscuit
Jan 6,934 11,652 5,747 0 6 2,740 3,387 215 691
Feb 0 5,780 10,680 0 4,850 1,058 2,249 147 579
Mar 25,326 11,668 8,489 8,686 370 1,591 2,920 248 262
Apr 19,449 10,613 3,437 0 811 3,108 1,855 330 910
May 16,502 2,684 1,621 47,326 3,804 1,498 1,495 259 607
Page 25
Jun 7,174 4,937 8,540 0 0 1,565 1,369 176 84
Jul 0 0 1,972 40 0 629 799 145 245
Aug 1,141 1,327 8,908 0 22,122 1,806 2,146 1,458 493
Sep 1,942 6,106 3,058 0 0 859 1,513 74 203
Oct 31,340 2,801 4,844 0 925 1,551 6,807 112 557
Nov 12,406 853 7,482 0 21 381 1,954 304 311
Dec 11,286 1,849 6,872 0 20 1,163 2,095 281 1,122
Total 133,500 60,270 71,650 56,052 53,409 17,949 28,589 3,749 6,064
Sources: Berbera Authority
Chart 16: Import of Food Items through Berbera Port: 2010 (Tonnes)
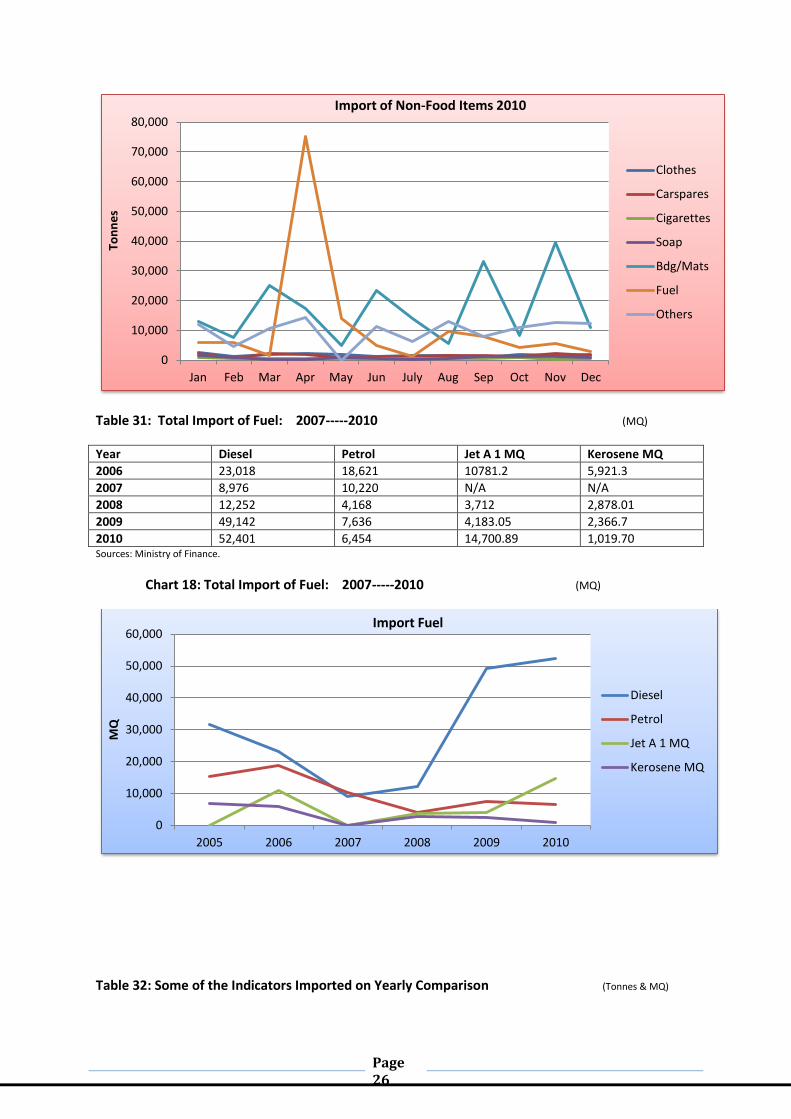
Table 30: Import of Non-Food Items through Berbera port: 2010 (Tonnes)
Month Clothes Carspares Cigarettes Soap Bdg/Mats Fuel Others
Jan 2,504 2,132 1,060 1,546 13,039 5,779 11,949
Feb 1,112 677 397 927 7,751 6,015 4,750
Mar 1,893 2,115 483 264 24,965 1,533 10,618
Apr 2,180 1,751 657 331 17,249 75,020 14,360
May 1,756 1,033 677 752 4,874 13,986 12.456
Jun 1,370 998 458 679 23,382 5,042 11,450
July 1,488 1,196 454 309 14,073 1,200 6,400
Aug 1,673 1,588 472 468 5,664 9,754 12,914
Sep 974 1,618 564 1,280 33,250 7,807 7,980
Oct 2,028 1,269 873 1,102 8,203 4,294 11,053
Nov 1,567 2,193 361 1,318 39,624 5,583 12,676
Dec 1,969 1,438 416 1,016 11,088 2,862 12,382
Total 20,514 18,008 6,872 9,992 214,248 58,855 128,988 Sources: Berbera Authority
Chart 17: Import of Non-Food Items through Berbera port: 2010 (Tonnes)
0
5,000
10,000
15,000
20,000
25,000
30,000
35,000
40,000
45,000
50,000
Jan Feb Mar Apr May Jun Jul Aug Sep Oct Nov Dec
Ton
ne
s
Import of Food Items 2010 Sugar
Rice
W/Flour
Wheat
O/Beans
C/Oil
Pasta
Dates
Biscuit
Page 26
Table 31: Total Import of Fuel: 2007-----2010 (MQ)
Year Diesel Petrol Jet A 1 MQ Kerosene MQ
2006 23,018 18,621 10781.2 5,921.3
2007 8,976 10,220 N/A N/A
2008 12,252 4,168 3,712 2,878.01
2009 49,142 7,636 4,183.05 2,366.7
2010 52,401 6,454 14,700.89 1,019.70 Sources: Ministry of Finance.
Chart 18: Total Import of Fuel: 2007-----2010 (MQ)
Table 32: Some of the Indicators Imported on Yearly Comparison (Tonnes & MQ)
0
10,000
20,000
30,000
40,000
50,000
60,000
70,000
80,000
Jan Feb Mar Apr May Jun July Aug Sep Oct Nov Dec
Ton
ne
s Import of Non-Food Items 2010
Clothes
Carspares
Cigarettes
Soap
Bdg/Mats
Fuel
Others
0
10,000
20,000
30,000
40,000
50,000
60,000
2005 2006 2007 2008 2009 2010
MQ
Import Fuel
Diesel
Petrol
Jet A 1 MQ
Kerosene MQ

Page 27
Year Sugar Rice W/ Flour Bdg/Mats Fuel 2007 174,076 89,762 46,817 138,152 20,443
2008 194,523 61,288 51,596 140,200 16,420
2009 155,965 59,645 53,475 133,396 56,778
2010 133,500 60,270 71,650 203,160 58,855 Sources: Berbera Port Authority.
Table 33: Percentage of Imported Indicators on Yearly Comparison Percent
Year Sugar Rice Wheat Flour Bdg/Mats
2007 39% 20% 10% 31%
2008 43% 14% 12% 31%
2009 39% 15% 13% 33%
2010 28% 13% 15% 43%
Chart 19: Percentage of Imported Indicators on Yearly Comparison Percent
Table 34: Import Containers through Berbera Port 2007—2010 (Size & Weight)
Year Size 20 Size 40 TEU Weight (Kg)
2005 3,499 1,153 5,805 88,060,113
2006 3,737 1,476 6,689 106,060734
2007 4,437 1,378 7,193 125,079,414
2008 6,807 1,991 10,789 190,928,909
2009 5,209 2,050 9,309 159,056,061
2010 6,176 2,663 11,502 192,590,848 Sources: Berbera Port Authority.
2007 2008 2009 2010
39% 43% 39% 28%
20% 14% 15% 13%
10% 12% 13% 15%
31% 31% 33% 43%
Pe
rce
nt
Import Comparison Sugar Rice Wheat Flour Bdg/Mats

Page 28
6.9. EXPORT
6.9.1. Livestock Export
The livestock sector makes a significant contribution to the national economy, and a majority of
Somalilanders rely on this sector and related activities. Camels, cattle, and sheep/goats are the
primary species in the pastoral and agro-pastoral livelihood areas. Most of the country’s hard
currency is generated through the export of livestock. A total of 2,810,482 livestock head were
exported from January to December 2010 of these, 91 % were sheep/ goats.
Table 35: Export of goats and sheep through Berbera Port 2007----2010 (HDS)
Month 2007 2008 2009 2010
Jan 42,618 15,321 114,134 189,662
Feb 73,699 55,508 50,153 51,994
Mar 38,927 33,823 58,910 37,923
Apr 15130 26,549 30,461 66,696
May 73,832 46,076 29,613 7,712
Jun 35315 44,512 45,879 92,936
Jul 76,879 69,409 112,942 174,909
Aug 110,689 122,051 139,723 160,313
Sep 106,531 100,164 135,702 255,456
Oct 113,348 102,477 65,424 515,137
Nov 315,867 339,885 780,171 938,228
Dec 347,219 268,758 2,410 51,988
Total 1,350,054 1,224,533 1,565,522 2,542,954 Source: Berbera Port Authority
Chart 20: Yearly Export of goats and sheep through Berbera Port 2007----2010 (HDS)
Table 36: Export of Cattle through Berbera Port: 2007---20010 (HDS)
0
500,000
1,000,000
1,500,000
2,000,000
2,500,000
3,000,000
2007 2008 2009 2010
1,350,054 1,224,533
1,565,522
2,542,954
HD
S
goats and sheep

Page 29
Month 2007 2008 2009 2010
Jan 5,295 4,930 3,448 11,990
Feb 6,323 7,691 12,322 8,623
Mar 3,244 5,671 5,049 4,320
Apr 1,151 4,115 3,806 7,487
May 4,728 3,864 3,510 49,568
Jun 9,593 4,097 5,162 8,576
Jul 10,103 8,480 7,658 9,535
Aug 8,605 4,907 7,857 10,264
Sep 9,119 3,582 6,481 13,387
Oct 7,841 9,989 11,666 24,842
Nov 10,788 17,027 20,471 17,067
Dec 11,353 6,828 2,256 9,218
Total 88,143 81,181 89,686 174,877 Source: Berbera Port Authority
Chart 21: Yearly Export of Cattle through Berbera Port 2007----2010 (HDS)
Table 37: Export of Camel through Berbera Port 2007---2010 (HDS)
Month 2007 2008 2009 2010
Jan 1,327 1,299 20 10,187
Feb 1,3499 3,248 880 10,049
Mar 1,787 2,590 15 4,323
Apr 1,232 2,140 1,085 9,194
May 430 1,241 667 3,340
Jun 1,620 1,475 1,925 1,912
Jul 1,391 4,114 3,963 6,157
Aug 997 3,072 3,406 8,657
Sep 1,439 2,611 2,414 6,281
Oct 927 2,311 3,266 12,600
Nov 911 2,245 1,244 11,397
Dec 835 17 1,317 8,554
Total 14,245 26,363 20,202 92,651 Source: Berbera Port Authority
0
50,000
100,000
150,000
200,000
2007 2008 2009 2010
HD
S
Cattle
Page 30
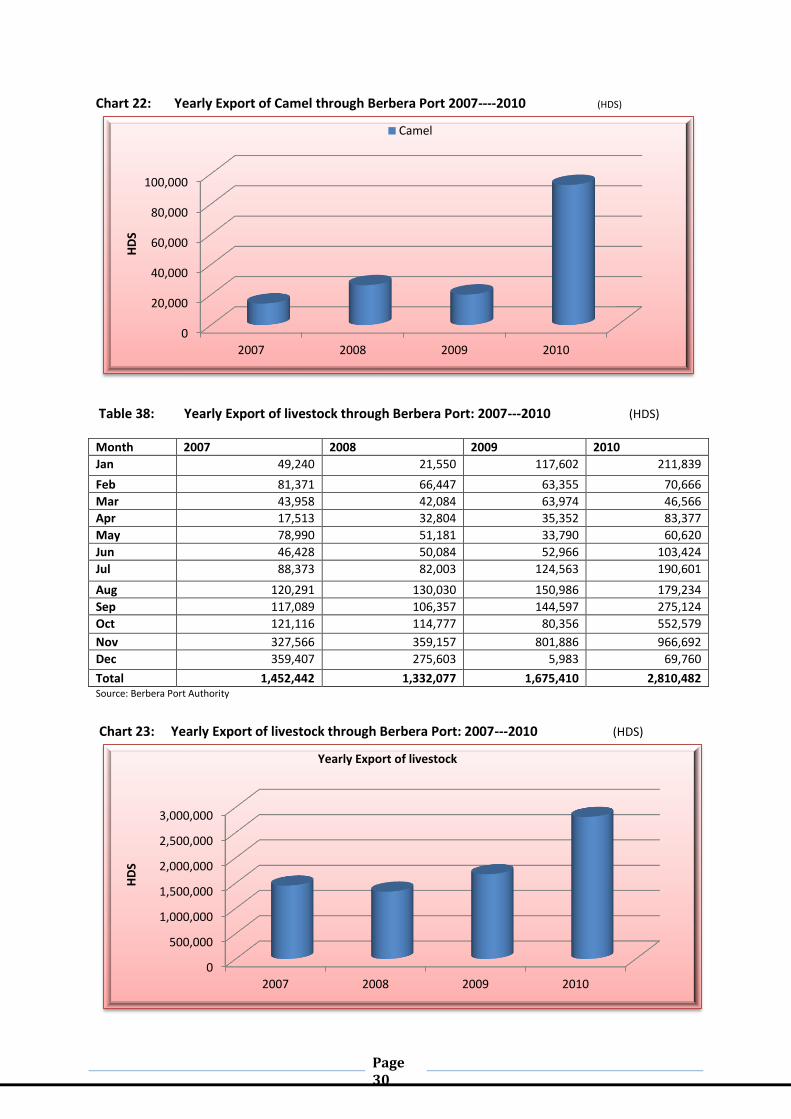
Chart 22: Yearly Export of Camel through Berbera Port 2007----2010 (HDS)
Table 38: Yearly Export of livestock through Berbera Port: 2007---2010 (HDS)
Month 2007 2008 2009 2010
Jan 49,240 21,550 117,602 211,839
Feb 81,371 66,447 63,355 70,666
Mar 43,958 42,084 63,974 46,566
Apr 17,513 32,804 35,352 83,377
May 78,990 51,181 33,790 60,620
Jun 46,428 50,084 52,966 103,424
Jul 88,373 82,003 124,563 190,601
Aug 120,291 130,030 150,986 179,234
Sep 117,089 106,357 144,597 275,124
Oct 121,116 114,777 80,356 552,579
Nov 327,566 359,157 801,886 966,692
Dec 359,407 275,603 5,983 69,760
Total 1,452,442 1,332,077 1,675,410 2,810,482 Source: Berbera Port Authority
Chart 23: Yearly Export of livestock through Berbera Port: 2007---2010 (HDS)
0
20,000
40,000
60,000
80,000
100,000
2007 2008 2009 2010
HD
S Camel
0
500,000
1,000,000
1,500,000
2,000,000
2,500,000
3,000,000
2007 2008 2009 2010
HD
S
Yearly Export of livestock

Page 31
Table 39: Export of hide and skin pieces through Berbera Port: 2007—2010 (Piece)
Month 2007 2008 2009 2010
Jan 35,600 296,184 500,030 505,347
Feb 140,126 231,052 181,509 257,850
Mar 206,949 459,002 144,300 432,847
Apr 107,625 357,773 150,812 306,555
May 203,220 651,028 25,787 492,864
Jun 62,000 511,650 244,770 151,222
Jul 192,027 257,846 222,584 196,950
Aug 328,069 210,051 908,850 575,235
Sep 362,650 308,835 102,760 124,664
Oct 232,352 305,020 77,000 563,738
Nov 287,356 343,880 251,197 1,005,800
Dec 451,401 108,800 712,966 2,290,974
Total 2,609,375 4,041,121 3,522,565 6,904,046 Source: Berbera Port Authority
Chart 24: Yearly Export of hide and skin pieces through Berbera Port: 2007—2010 (Piece)
Table 40: Export of Beeyo through Berbera Port: 2007----2010 (Kg)
Source: Berbera Port Authority.
0
1,000,000
2,000,000
3,000,000
4,000,000
5,000,000
6,000,000
7,000,000
2007 2008 2009 2010
Pie
ce
Hide & Skin
Month 2007 2008 2009 2010
Jan 0 55,900 37,780 300
Feb 67,482 177,520 64,300 6,500
Mar 33,900 42,193 0 34,100
Apr 157,500 160,640 4,974,650 168,650
May 66,500 147,420 1,520 23,800
Jun 3,500 0 49,917 6,300
Jul 129,920 50,000 56,000 0
Aug 52,460 3,200 0 3,116,700
Sep 1,940 210,005 41,115 0
Oct 19,400 209,180 48,000 24,570
Nov 32,104 153,024 148,011 199,810
Dec 50,000 61,155 125,000 303,287
Total 614,706 883,677 5,546,293 3,884,017

Page 32
Chart 25: Yearly Export of Beeyo through berbera Port: 2007----2010 (Kg)
Table 41: Berbera Port Traffic: 2007----2010 (NO)
Year Dhows Ships Total
2007 104 278 382
2008 153 316 469
2009 187 307 494
2010 285 378 663 Sources: Berbera Port Authority.
Chart 26: Berbera Port Traffic: 2007-2010 .No
0
1,000,000
2,000,000
3,000,000
4,000,000
5,000,000
6,000,000
2007 2008 2009 2010
Kg
Beeyo
0
50
100
150
200
250
300
350
400
2007 2008 2009 2010
No
.
Dhows Ships
Page 33
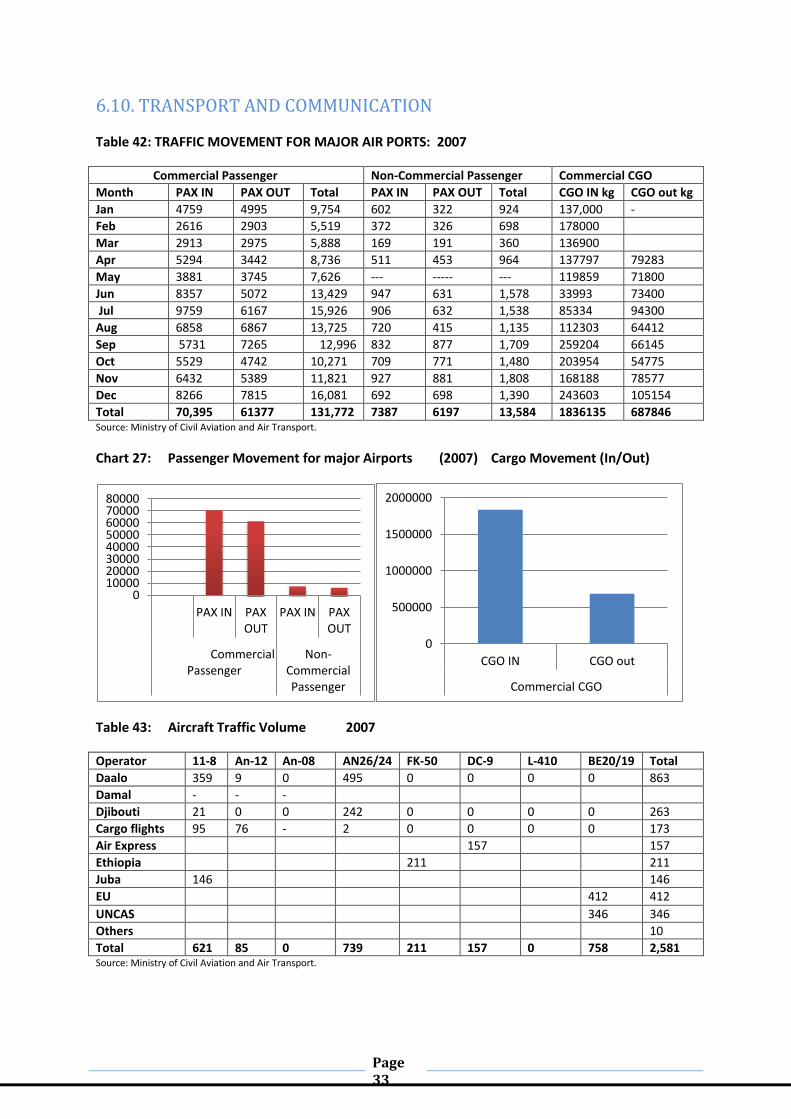
6.10. TRANSPORT AND COMMUNICATION
Table 42: TRAFFIC MOVEMENT FOR MAJOR AIR PORTS: 2007
Commercial Passenger Non-Commercial Passenger Commercial CGO
Month PAX IN PAX OUT Total PAX IN PAX OUT Total CGO IN kg CGO out kg
Jan 4759 4995 9,754 602 322 924 137,000 -
Feb 2616 2903 5,519 372 326 698 178000
Mar 2913 2975 5,888 169 191 360 136900
Apr 5294 3442 8,736 511 453 964 137797 79283
May 3881 3745 7,626 --- ----- --- 119859 71800
Jun 8357 5072 13,429 947 631 1,578 33993 73400
Jul 9759 6167 15,926 906 632 1,538 85334 94300
Aug 6858 6867 13,725 720 415 1,135 112303 64412
Sep 5731 7265 12,996 832 877 1,709 259204 66145
Oct 5529 4742 10,271 709 771 1,480 203954 54775
Nov 6432 5389 11,821 927 881 1,808 168188 78577
Dec 8266 7815 16,081 692 698 1,390 243603 105154
Total 70,395 61377 131,772 7387 6197 13,584 1836135 687846 Source: Ministry of Civil Aviation and Air Transport.
Chart 27: Passenger Movement for major Airports (2007) Cargo Movement (In/Out)
Table 43: Aircraft Traffic Volume 2007
Operator 11-8 An-12 An-08 AN26/24 FK-50 DC-9 L-410 BE20/19 Total
Daalo 359 9 0 495 0 0 0 0 863
Damal - - -
Djibouti 21 0 0 242 0 0 0 0 263
Cargo flights 95 76 - 2 0 0 0 0 173
Air Express 157 157
Ethiopia 211 211
Juba 146 146
EU 412 412
UNCAS 346 346
Others 10
Total 621 85 0 739 211 157 0 758 2,581 Source: Ministry of Civil Aviation and Air Transport.
0 10000 20000 30000 40000 50000 60000 70000 80000
PAX IN PAX OUT
PAX IN PAX OUT
Commercial Passenger
Non-Commercial Passenger
0
500000
1000000
1500000
2000000
CGO IN CGO out
Commercial CGO
Page 34
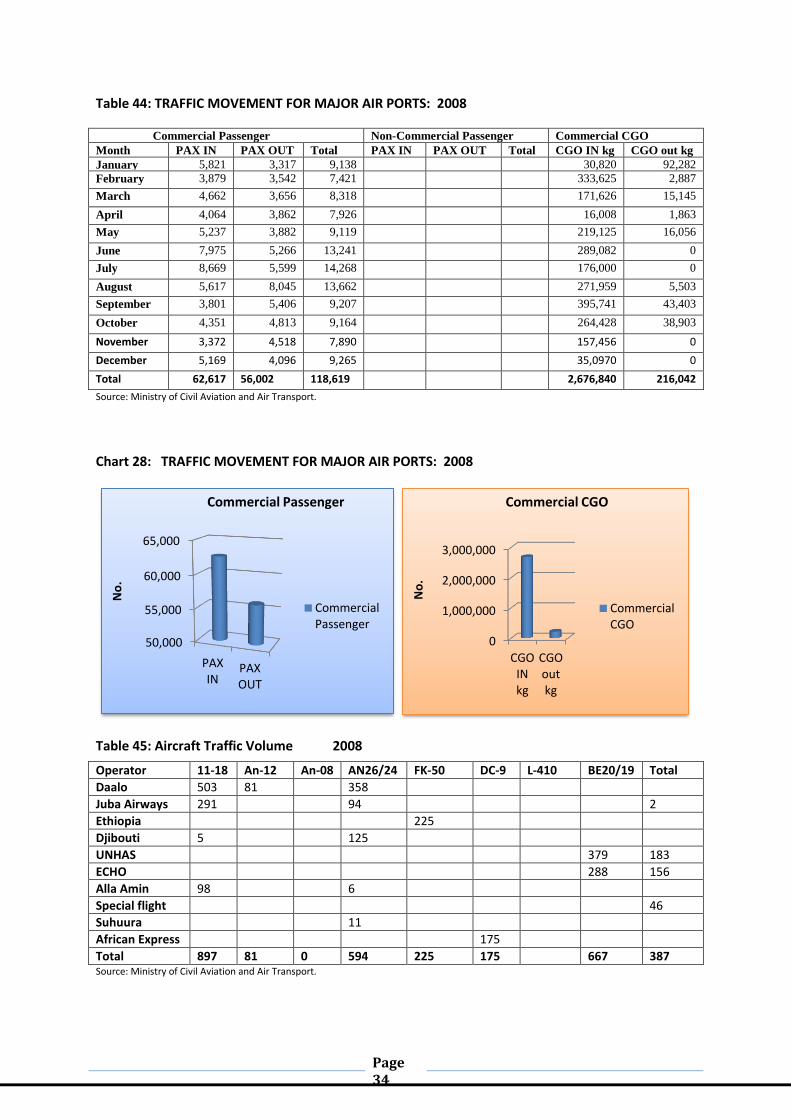
Table 44: TRAFFIC MOVEMENT FOR MAJOR AIR PORTS: 2008
Commercial Passenger Non-Commercial Passenger Commercial CGO
Month PAX IN PAX OUT Total PAX IN PAX OUT Total CGO IN kg CGO out kg
January 5,821 3,317 9,138 30,820 92,282
February 3,879 3,542 7,421 333,625 2,887
March 4,662 3,656 8,318 171,626 15,145
April 4,064 3,862 7,926 16,008 1,863
May 5,237 3,882 9,119 219,125 16,056
June 7,975 5,266 13,241 289,082 0
July 8,669 5,599 14,268 176,000 0
August 5,617 8,045 13,662 271,959 5,503
September 3,801 5,406 9,207 395,741 43,403
October 4,351 4,813 9,164 264,428 38,903
November 3,372 4,518 7,890 157,456 0
December 5,169 4,096 9,265 35,0970 0
Total 62,617 56,002 118,619 2,676,840 216,042
Source: Ministry of Civil Aviation and Air Transport.
Chart 28: TRAFFIC MOVEMENT FOR MAJOR AIR PORTS: 2008
Table 45: Aircraft Traffic Volume 2008
Operator 11-18 An-12 An-08 AN26/24 FK-50 DC-9 L-410 BE20/19 Total
Daalo 503 81 358
Juba Airways 291 94 2
Ethiopia 225
Djibouti 5 125
UNHAS 379 183
ECHO 288 156
Alla Amin 98 6
Special flight 46
Suhuura 11
African Express 175
Total 897 81 0 594 225 175 667 387 Source: Ministry of Civil Aviation and Air Transport.
50,000
55,000
60,000
65,000
PAX IN
PAX OUT
No
.
Commercial Passenger
Commercial Passenger
0
1,000,000
2,000,000
3,000,000
CGO IN kg
CGO out kg
No
.
Commercial CGO
Commercial CGO
Page 35
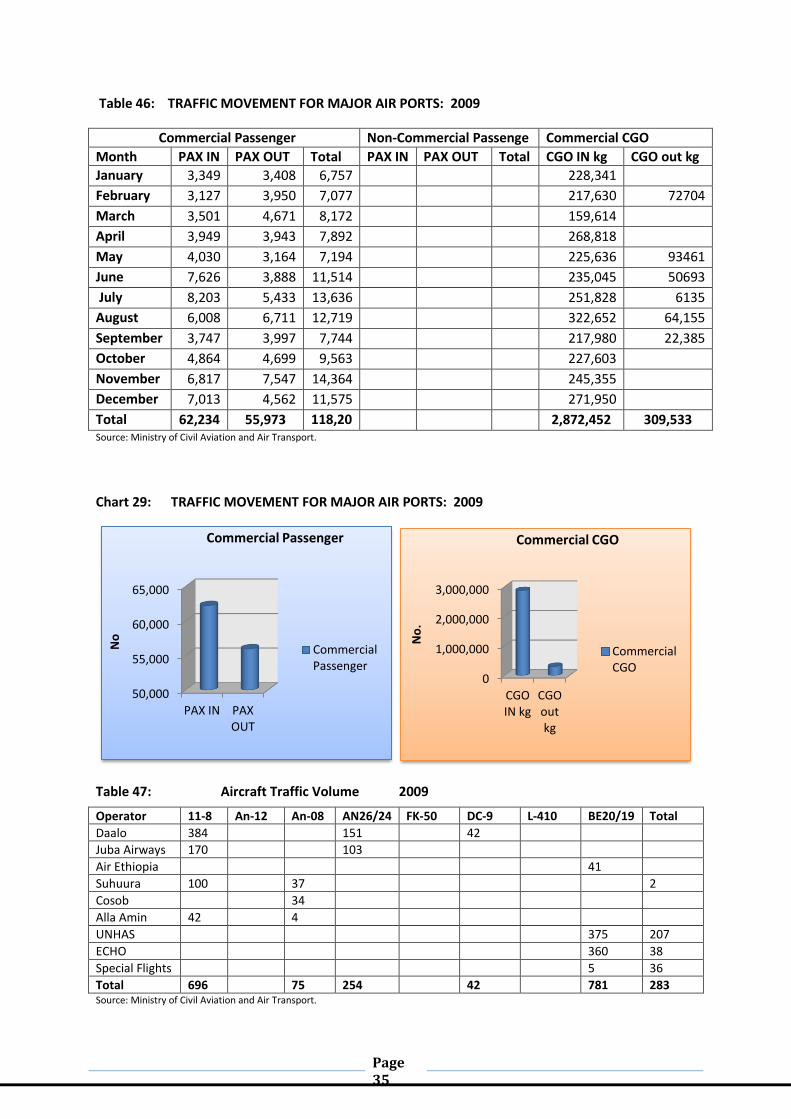
Table 46: TRAFFIC MOVEMENT FOR MAJOR AIR PORTS: 2009
Commercial Passenger Non-Commercial Passenge Commercial CGO
Month PAX IN PAX OUT Total PAX IN PAX OUT Total CGO IN kg CGO out kg
January 3,349 3,408 6,757 228,341
February 3,127 3,950 7,077 217,630 72704
March 3,501 4,671 8,172 159,614
April 3,949 3,943 7,892 268,818
May 4,030 3,164 7,194 225,636 93461
June 7,626 3,888 11,514 235,045 50693
July 8,203 5,433 13,636 251,828 6135
August 6,008 6,711 12,719 322,652 64,155
September 3,747 3,997 7,744 217,980 22,385
October 4,864 4,699 9,563 227,603
November 6,817 7,547 14,364 245,355
December 7,013 4,562 11,575 271,950
Total 62,234 55,973 118,20
7
2,872,452 309,533 Source: Ministry of Civil Aviation and Air Transport.
Chart 29: TRAFFIC MOVEMENT FOR MAJOR AIR PORTS: 2009
Table 47: Aircraft Traffic Volume 2009
Operator 11-8 An-12 An-08 AN26/24 FK-50 DC-9 L-410 BE20/19 Total
Daalo 384 151 42
Juba Airways 170 103
Air Ethiopia 41
Suhuura 100 37 2
Cosob 34
Alla Amin 42 4
UNHAS 375 207
ECHO 360 38
Special Flights 5 36
Total 696 75 254 42 781 283 Source: Ministry of Civil Aviation and Air Transport.
50,000
55,000
60,000
65,000
PAX IN PAX OUT
No
Commercial Passenger
Commercial Passenger
0
1,000,000
2,000,000
3,000,000
CGO IN kg
CGO out kg
No
.
Commercial CGO
Commercial CGO
Page 36
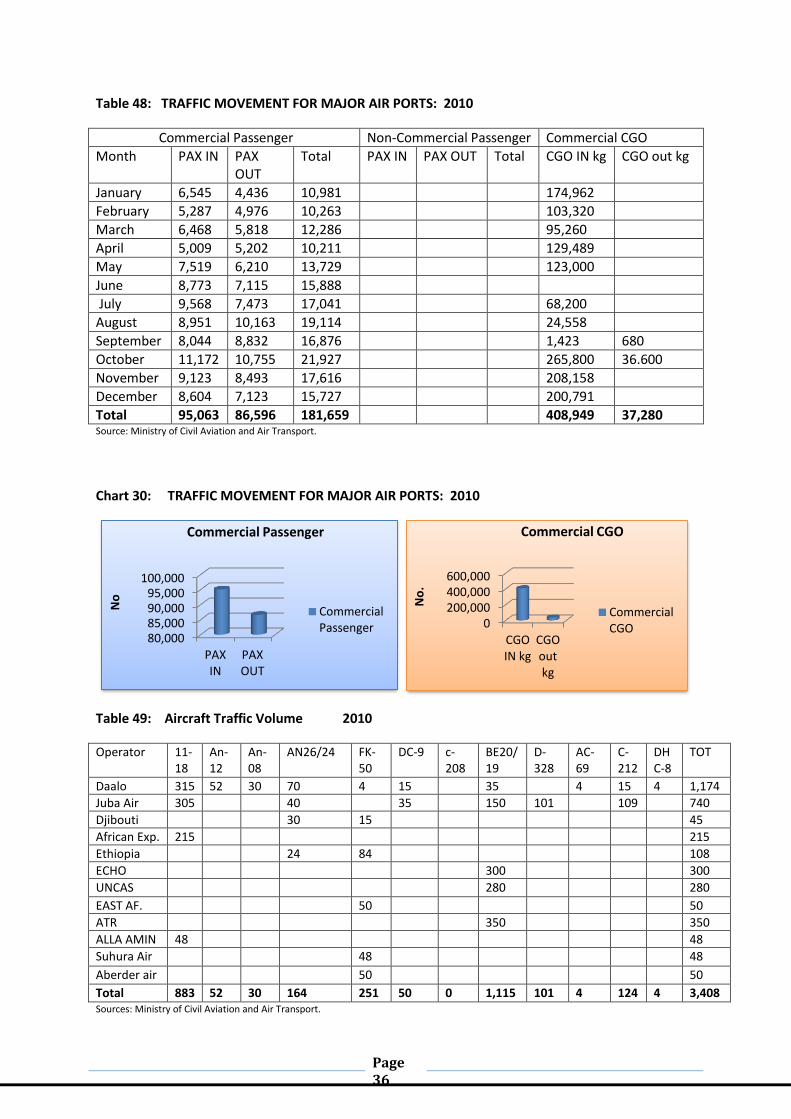
Table 48: TRAFFIC MOVEMENT FOR MAJOR AIR PORTS: 2010
Commercial Passenger Non-Commercial Passenger Commercial CGO
Month PAX IN PAX OUT
Total PAX IN PAX OUT Total CGO IN kg CGO out kg
January 6,545 4,436 10,981 174,962
February 5,287 4,976 10,263 103,320
March 6,468 5,818 12,286 95,260
April 5,009 5,202 10,211 129,489
May 7,519 6,210 13,729 123,000
June 8,773 7,115 15,888
July 9,568 7,473 17,041 68,200
August 8,951 10,163 19,114 24,558
September 8,044 8,832 16,876 1,423 680
October 11,172 10,755 21,927 265,800 36.600
November 9,123 8,493 17,616 208,158
December 8,604 7,123 15,727 200,791
Total 95,063 86,596 181,659 408,949 37,280 Source: Ministry of Civil Aviation and Air Transport.
Chart 30: TRAFFIC MOVEMENT FOR MAJOR AIR PORTS: 2010
Table 49: Aircraft Traffic Volume 2010
Operator 11-18
An-12
An-08
AN26/24 FK-50
DC-9 c-208
BE20/19
D-328
AC-69
C-212
DHC-8
TOT
Daalo 315 52 30 70 4 15 35 4 15 4 1,174
Juba Air 305 40 35 150 101 109 740
Djibouti 30 15 45
African Exp. 215 215
Ethiopia 24 84 108
ECHO 300 300
UNCAS 280 280
EAST AF. 50 50
ATR 350 350
ALLA AMIN 48 48
Suhura Air 48 48
Aberder air 50 50
Total 883 52 30 164 251 50 0 1,115 101 4 124 4 3,408 Sources: Ministry of Civil Aviation and Air Transport.
80,000 85,000 90,000 95,000
100,000
PAX IN
PAX OUT
No
Commercial Passenger
Commercial Passenger 0
200,000 400,000 600,000
CGO IN kg
CGO out kg
No
.
Commercial CGO
Commercial CGO

Page 37
7. Social Sector
7.1 EDUCATION
The current educational system consists of a primary level with eight grades, followed by a
secondary level with four grades. Overall, the number of students enrolled in primary schools,
secondary schools and universities in Somaliland continues to grow rapidly.
Table 50 : Growth of Public and Private Education during 1997/98-2008/2009
Year Pri. schools Sec.schools Family life Vocational Universities
1997/98 165 3 11 2 1
1998/99 144 5 13 3 2
1999/00 174 13 13 4 2
2000/01 294 15 13 4 2
2001/02 307 16 17 4 2
2002/03 353 20 24 4 2
2003/04 385 29 33 4 2
2004/05 412 35 33 2 3
2005/06 516 43 N/B 2 5
2006/07 N/A 44 N/A 2 6
2007/08 590 59
2008/09 627 68 30 N|A 10
2009/10 917 84 30 5 20 Source: Ministry of Education.
Chart 31: Growth of Public and Private Education during 1997/98-2009/2010
0
100
200
300
400
500
600
700
800
900
1000
No
.
Growth of Education
Pri. schools
Sec.schools
Family life
Vocational
Universities

Page 38
7.1.2 PRIMARY EDUCATION
Primary schools have increased students enrolment from 35,997 in 1998/99 t o 170,930. Likely
gender enrolment estimates in 2008/09 indicate that there is 1 girl for every 3 boys. Most of the
schools were constructed with the help of aid assistance from the international community.
Table 51: Growth of Primary Education (Public and Private) during 1998/99-2009/2010
Year Schools classes Male Female Total Teachers
1998/99 144 887 26,356 9,641 35,997 960
1999/00 174 1,106 32,720 12503 45,223 1,167
2000/01 222 1,893 38,106 14,819 52,925 1,921
2001/02 307 2,078 56,951 27,723 84,674 2,062
2002/03 354 2,386 63,912 32,294 96,206 2,346
2003/04 385 2,65 70,617 35,863 106,480 2,590
2004/05 412 2586 79,878 38,438 118,316 2,801
2005/06 516 3,037 85,665 51,091 136,756 3,941
2006/07 516 3,099 94,627 56,873 151,500 3,779
2007/08 590 3,746 75,985 42,730 159,042 3,937
2008/09 627 4,001 108,322 62,608 170,930 4,969
2009/10 917 4,043 138,137 94,862 232,999 4,969 Source: Ministry of Education.
Chart 32: Growth of Primary Education (Public and Private) 1998/99-2009/2010
0
1000
2000
3000
4000
5000
No
.
Growth of Primary Education
Schools
classes
Teachers
0
50,000
100,000
150,000
No
.
Growth of Primary Education
Male
Female

Page 39
Table 52: Distribution of Primary Education by Region during 2008/2009
Region Schools Student Enrolment
Male Female M/F Total
Awdal 84 14,010 9,508 23,518
M.Jeex 177 44,136 23,962 68,098
Sahil 41 5,131 3,611 8,742
Togdheer 130 18,434 9,569 28,003
Sanag 101 13,149 7,978 21,127
Sool 94 13,462 7,980 21,442
Total 627 108,322 62,608 170,930 Source: Ministry of Education.
Chart 33: Distribution of Primary Education by Region during 2008/09
Table 53: Primary Education—Distribution of Students by Gender and Region during 08/09
Region URBAN RURAL
Male Female Male Female
Awdal 10,395 7,305 4,097 1,721
Maroodi Jeeh 36,197 20,210 7,939 3,752
Sahil 3,421 2,865 1,510 946
Togdheer 12,993 7,527 5,441 2,042
Sanag 9,594 5,792 3,555 2,186
Sool 9,639 6,392 3,843 1,594
Total 82,239 50,091 26,385 12,241 Source: Ministry of Education
0
10,000
20,000
30,000
40,000
50,000
Awdal M.Jeex Sahil Togdheer Sanag Sool
No
. Stu
de
nt
Enro
led
Distribution of primary education 2008/2009
Male
Female

Page 40
Table 54: Distribution of Primary Education by Region during 2009/2010
Region Schools Student Enrolment
Male Female Total
Awdal 97 16,132 14,118 30,250
M.Jeex 217 48,673 27,290 75,963
Sahil 53 5,340 3,820 9,160
Togdheer 161 20,307 11,435 31,742
Sanag 125 14,713 9, 977 24,690
Sool 115 15,053 9,686 24,739
Total 768 120,218 76,326 196,544 Sources: Ministry of Education
Chart 34: Distribution of Primary Education by Region during 2009/2010
Table 53: Primary Education—Distribution of Students by Gender and Region during 09/010
Region URBAN RURAL
Male Female Male Female
Awdal 13,781 13,111 2,351 1,007
Maroodi Jeeh 43,672 24,303 5,001 2,987
Sahil 3,989 3,120 1,351 700
Togdheer 14,816 9,162 5,491 2,273
Sanag 9,780 7,964 4,933 2,013
Sool 9,940 7,369 5,113 2,317
Total 95,978 65,029 24,240 11,297
0
10,000
20,000
30,000
40,000
50,000
Awdal M.Jeex Sahil Togdheer Sanag Sool
No
. Stu
de
nt
Enro
led
Distribution of Primary Education
Male
Female
Page 41
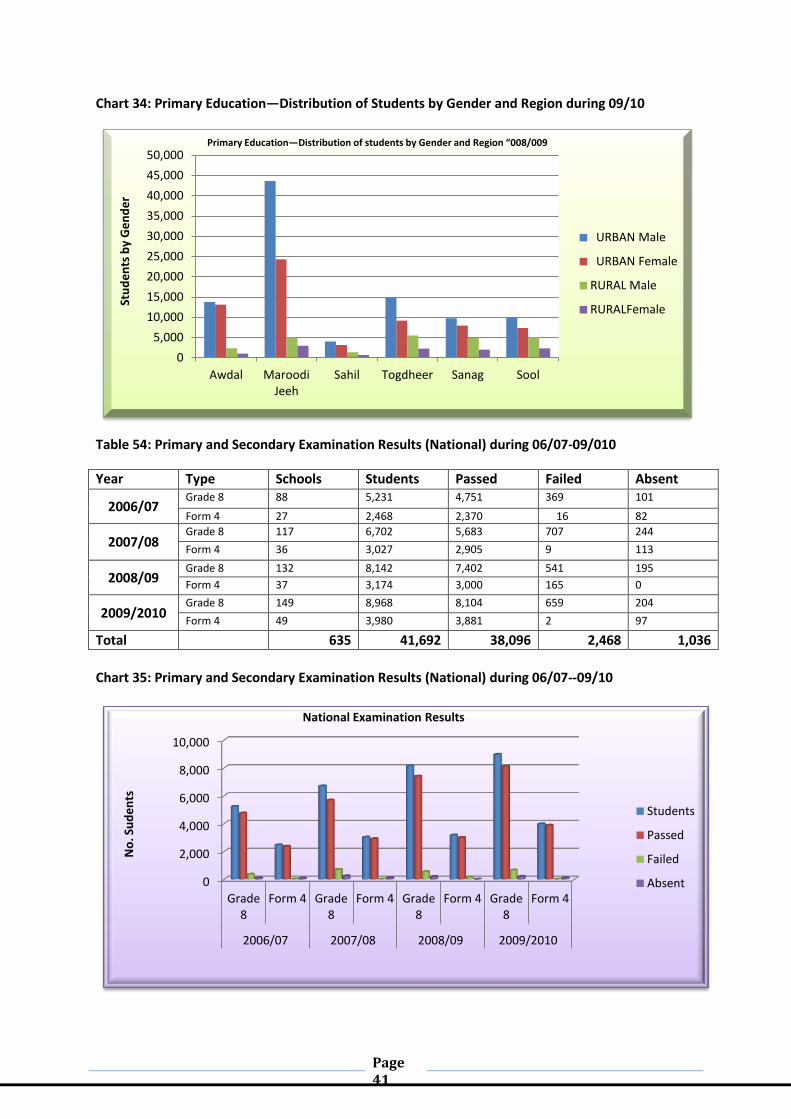
Chart 34: Primary Education—Distribution of Students by Gender and Region during 09/10
Table 54: Primary and Secondary Examination Results (National) during 06/07-09/010
Year Type Schools Students Passed Failed Absent
2006/07 Grade 8 88 5,231 4,751 369 101
Form 4 27 2,468 2,370 16 82
2007/08 Grade 8 117 6,702 5,683 707 244
Form 4 36 3,027 2,905 9 113
2008/09 Grade 8 132 8,142 7,402 541 195
Form 4 37 3,174 3,000 165 0
2009/2010 Grade 8 149 8,968 8,104 659 204
Form 4 49 3,980 3,881 2 97
Total 635 41,692 38,096 2,468 1,036
Chart 35: Primary and Secondary Examination Results (National) during 06/07--09/10
0
5,000
10,000
15,000
20,000
25,000
30,000
35,000
40,000
45,000
50,000
Awdal Maroodi Jeeh
Sahil Togdheer Sanag Sool
Stu
de
nts
by
Ge
nd
er
Primary Education—Distribution of students by Gender and Region “008/009
URBAN Male
URBAN Female
RURAL Male
RURALFemale
0
2,000
4,000
6,000
8,000
10,000
Grade 8
Form 4 Grade 8
Form 4 Grade 8
Form 4 Grade 8
Form 4
2006/07 2007/08 2008/09 2009/2010
No
. Su
de
nts
National Examination Results
Students
Passed
Failed
Absent
Page 42
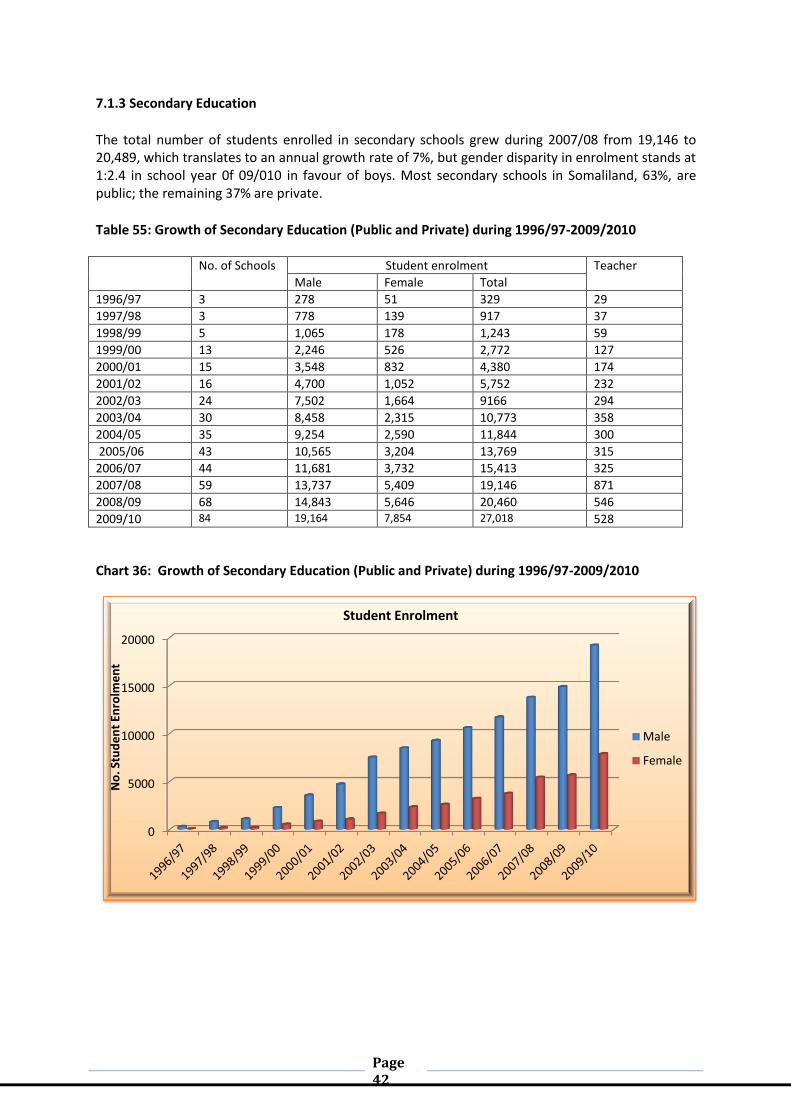
7.1.3 Secondary Education
The total number of students enrolled in secondary schools grew during 2007/08 from 19,146 to 20,489, which translates to an annual growth rate of 7%, but gender disparity in enrolment stands at 1:2.4 in school year 0f 09/010 in favour of boys. Most secondary schools in Somaliland, 63%, are public; the remaining 37% are private.
Table 55: Growth of Secondary Education (Public and Private) during 1996/97-2009/2010 No. of Schools Student enrolment Teacher
Male Female Total
1996/97 3 278 51 329 29
1997/98 3 778 139 917 37
1998/99 5 1,065 178 1,243 59
1999/00 13 2,246 526 2,772 127
2000/01 15 3,548 832 4,380 174
2001/02 16 4,700 1,052 5,752 232
2002/03 24 7,502 1,664 9166 294
2003/04 30 8,458 2,315 10,773 358
2004/05 35 9,254 2,590 11,844 300
2005/06 43 10,565 3,204 13,769 315
2006/07 44 11,681 3,732 15,413 325
2007/08 59 13,737 5,409 19,146 871
2008/09 68 14,843 5,646 20,460 546
2009/10 84 19,164 7,854 27,018 528
Chart 36: Growth of Secondary Education (Public and Private) during 1996/97-2009/2010
0
5000
10000
15000
20000
No
. Stu
de
nt
Enro
lme
nt
Student Enrolment
Male
Female
Page 43
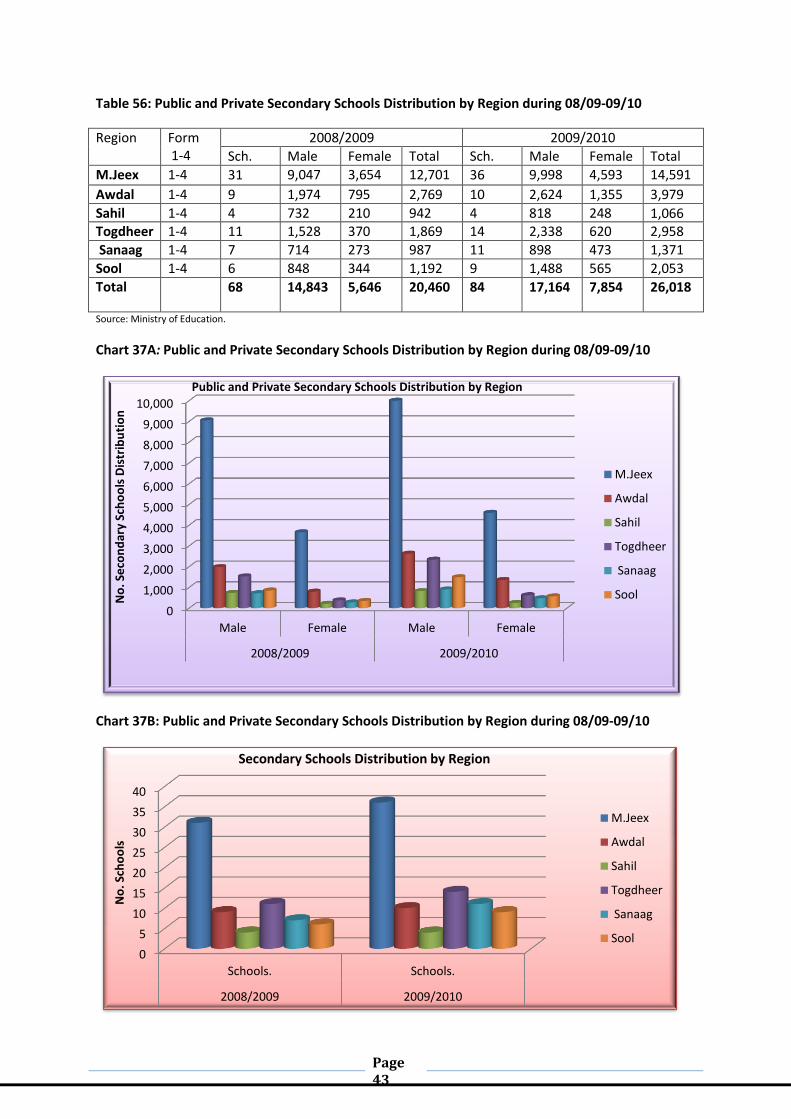
Table 56: Public and Private Secondary Schools Distribution by Region during 08/09-09/10
Region Form 1-4
2008/2009 2009/2010
Sch. Male Female Total Sch. Male Female Total
M.Jeex 1-4 31 9,047 3,654 12,701 36 9,998 4,593 14,591
Awdal 1-4 9 1,974 795 2,769 10 2,624 1,355 3,979
Sahil 1-4 4 732 210 942 4 818 248 1,066 Togdheer 1-4 11 1,528 370 1,869 14 2,338 620 2,958
Sanaag 1-4 7 714 273 987 11 898 473 1,371
Sool 1-4 6 848 344 1,192 9 1,488 565 2,053
Total 68 14,843 5,646 20,460 84 17,164 7,854 26,018
Source: Ministry of Education.
Chart 37A: Public and Private Secondary Schools Distribution by Region during 08/09-09/10
Chart 37B: Public and Private Secondary Schools Distribution by Region during 08/09-09/10
0
1,000
2,000
3,000
4,000
5,000
6,000
7,000
8,000
9,000
10,000
Male Female Male Female
2008/2009 2009/2010
No
. Se
con
dar
y Sc
ho
ols
Dis
trib
uti
on
Public and Private Secondary Schools Distribution by Region
M.Jeex
Awdal
Sahil
Togdheer
Sanaag
Sool
0
5
10
15
20
25
30
35
40
Schools. Schools.
2008/2009 2009/2010
No
. Sch
oo
ls
Secondary Schools Distribution by Region
M.Jeex
Awdal
Sahil
Togdheer
Sanaag
Sool
Page 44
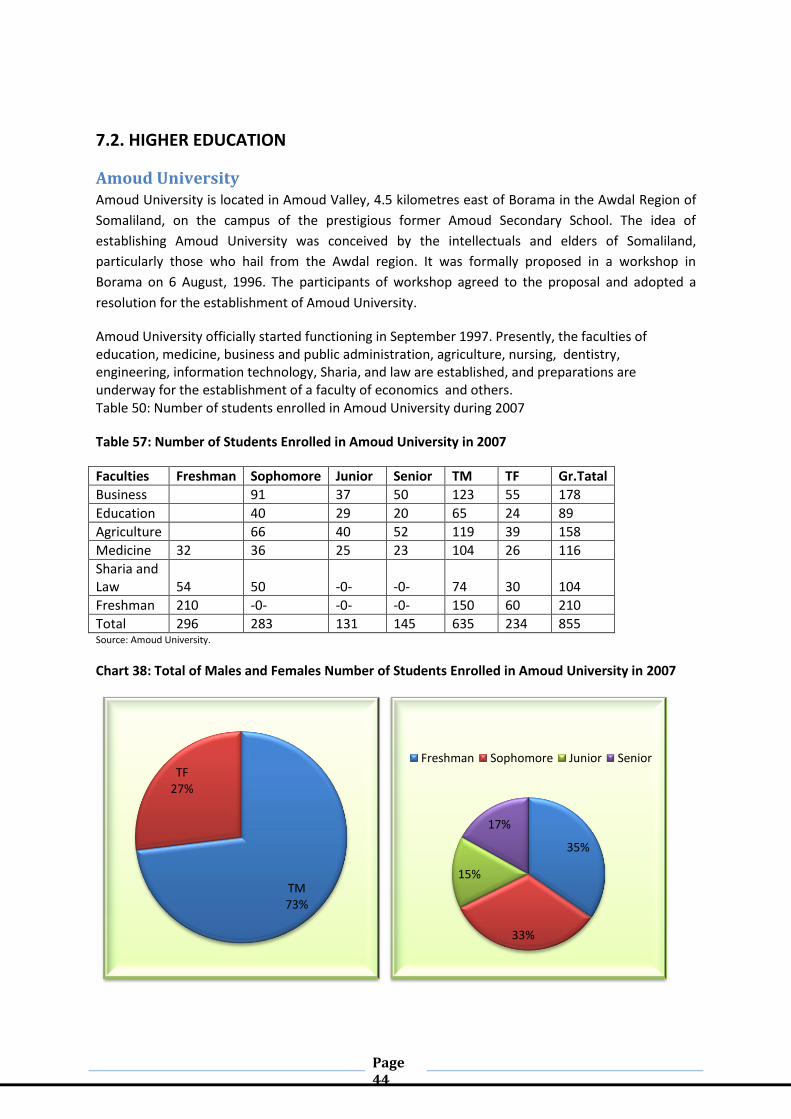
7.2. HIGHER EDUCATION
Amoud University Amoud University is located in Amoud Valley, 4.5 kilometres east of Borama in the Awdal Region of
Somaliland, on the campus of the prestigious former Amoud Secondary School. The idea of
establishing Amoud University was conceived by the intellectuals and elders of Somaliland,
particularly those who hail from the Awdal region. It was formally proposed in a workshop in
Borama on 6 August, 1996. The participants of workshop agreed to the proposal and adopted a
resolution for the establishment of Amoud University.
Amoud University officially started functioning in September 1997. Presently, the faculties of education, medicine, business and public administration, agriculture, nursing, dentistry, engineering, information technology, Sharia, and law are established, and preparations are underway for the establishment of a faculty of economics and others. Table 50: Number of students enrolled in Amoud University during 2007
Table 57: Number of Students Enrolled in Amoud University in 2007
Faculties Freshman Sophomore Junior Senior TM TF Gr.Tatal
Business 91 37 50 123 55 178
Education 40 29 20 65 24 89
Agriculture 66 40 52 119 39 158
Medicine 32 36 25 23 104 26 116
Sharia and Law
54
50
-0-
-0-
74
30
104
Freshman 210 -0- -0- -0- 150 60 210
Total 296 283 131 145 635 234 855 Source: Amoud University.
Chart 38: Total of Males and Females Number of Students Enrolled in Amoud University in 2007
TM 73%
TF 27%
35%
33%
15%
17%
Freshman Sophomore Junior Senior
Page 45
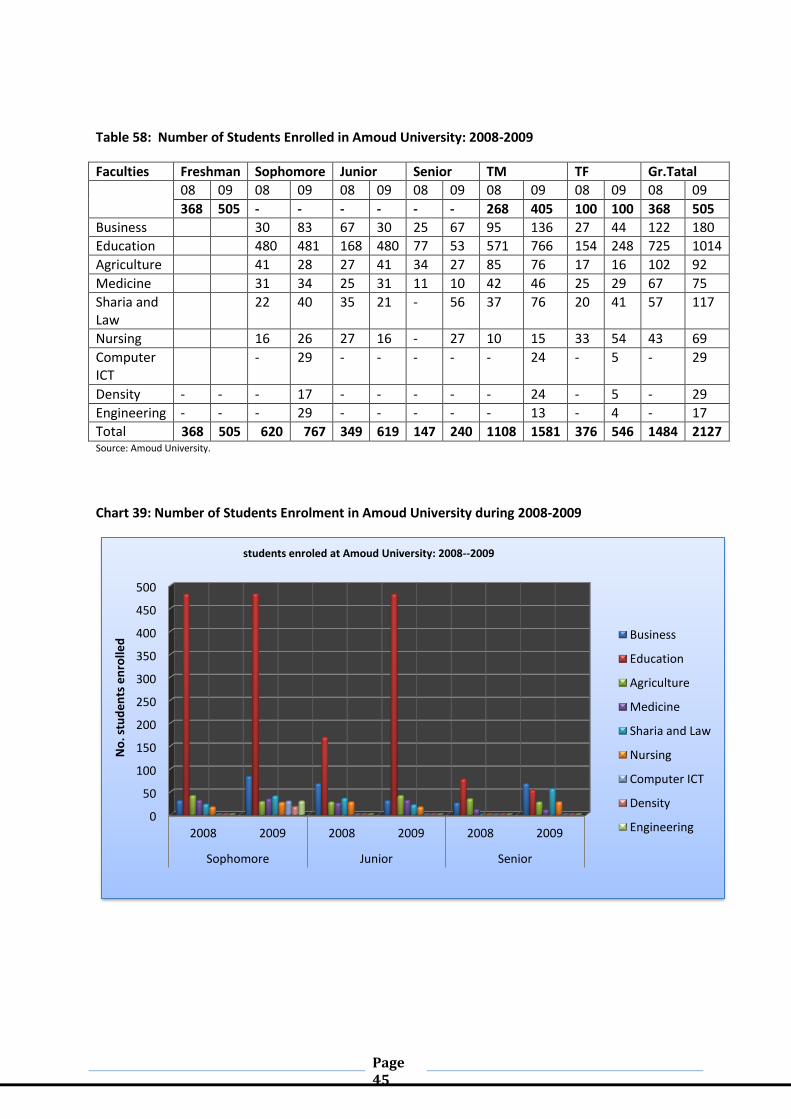
Table 58: Number of Students Enrolled in Amoud University: 2008-2009
Faculties Freshman Sophomore Junior Senior TM TF Gr.Tatal
08 09 08 09 08 09 08 09 08 09 08 09 08 09
368 505 - - - - - - 268 405 100 100 368 505
Business 30 83 67 30 25 67 95 136 27 44 122 180
Education 480 481 168 480 77 53 571 766 154 248 725 1014
Agriculture 41 28 27 41 34 27 85 76 17 16 102 92
Medicine 31 34 25 31 11 10 42 46 25 29 67 75
Sharia and Law
22 40 35 21 - 56 37 76 20 41 57 117
Nursing 16 26 27 16 - 27 10 15 33 54 43 69
Computer ICT
- 29 - - - - - 24 - 5 - 29
Density - - - 17 - - - - - 24 - 5 - 29
Engineering - - - 29 - - - - - 13 - 4 - 17
Total 368 505 620 767 349 619 147 240 1108 1581 376 546 1484 2127 Source: Amoud University.
Chart 39: Number of Students Enrolment in Amoud University during 2008-2009
0
50
100
150
200
250
300
350
400
450
500
2008 2009 2008 2009 2008 2009
Sophomore Junior Senior
No
. stu
de
nts
en
rolle
d
students enroled at Amoud University: 2008--2009
Business
Education
Agriculture
Medicine
Sharia and Law
Nursing
Computer ICT
Density
Engineering
Page 46
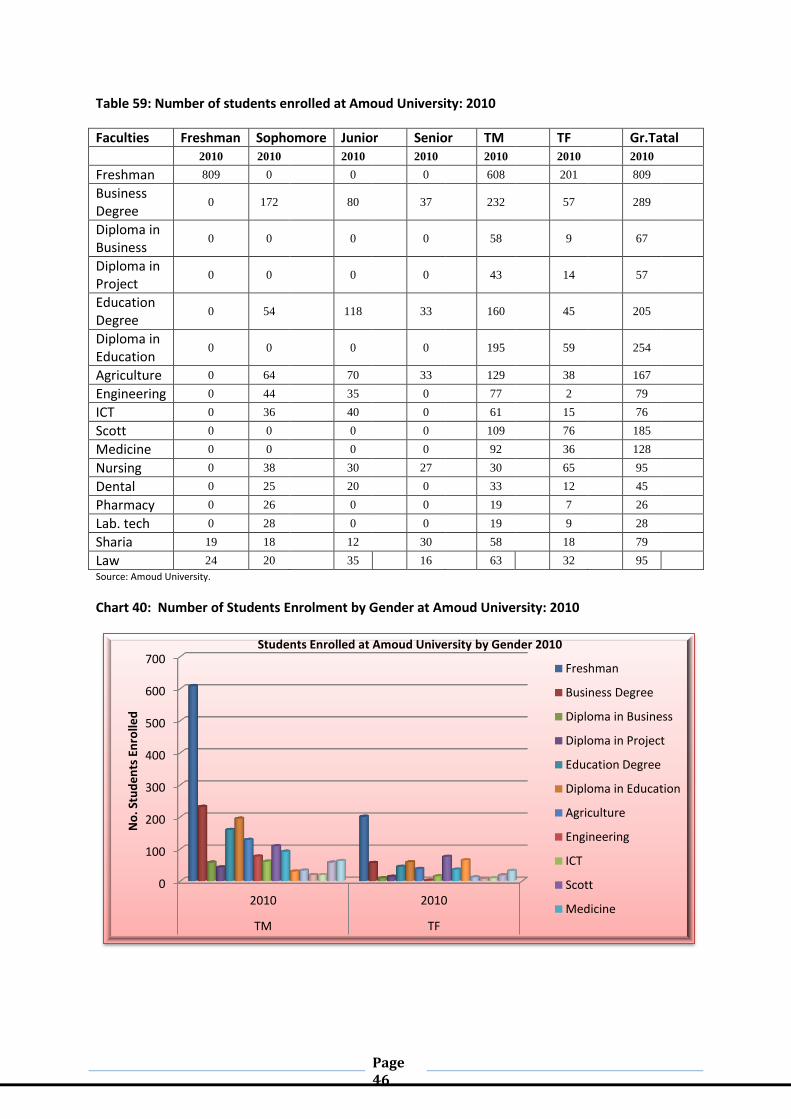
Table 59: Number of students enrolled at Amoud University: 2010
Faculties Freshman Sophomore Junior Senior TM TF Gr.Tatal
2010 2010 2010 2010 2010 2010 2010
Freshman 809 0 0 0 608 201 809
Business Degree
0 172 80 37 232 57 289
Diploma in Business
0 0 0 0 58 9 67
Diploma in Project
0 0 0 0 43 14 57
Education Degree
0 54 118 33 160 45 205
Diploma in Education
0 0 0 0 195 59 254
Agriculture 0 64 70 33 129 38 167
Engineering 0 44 35 0 77 2 79
ICT 0 36 40 0 61 15 76
Scott 0 0 0 0 109 76 185
Medicine 0 0 0 0 92 36 128
Nursing 0 38 30 27 30 65 95
Dental 0 25 20 0 33 12 45
Pharmacy 0 26 0 0 19 7 26
Lab. tech 0 28 0 0 19 9 28
Sharia 19 18 12 30 58 18 79
Law 24 20 35 16 63 32 95
Source: Amoud University.
Chart 40: Number of Students Enrolment by Gender at Amoud University: 2010
0
100
200
300
400
500
600
700
2010 2010
TM TF
No
. Stu
de
nts
En
rolle
d
Students Enrolled at Amoud University by Gender 2010
Freshman
Business Degree
Diploma in Business
Diploma in Project
Education Degree
Diploma in Education
Agriculture
Engineering
ICT
Scott
Medicine

Page 47
Table 60: Number of Students Graduated from Amoud University during 2007-2010
Year Faculties Male Female Total
2007
Business 72 24 96
Education 40 14 54
Medicine 4 1 5
2008
Business 14 13 27
Education 66 12 78
Agriculture 27 7 34
Medicine 4 2 6
2009
Business 17 6 23
Education 245 59 304
Agriculture 24 1 25
Medicine 6 3 9
Nursing 5 9 14
2010
Businss & P.Adm 64 16 80
Education 38 6 44
Diploma Education 40 7 47
Agriculture 30 9 39
Nursing 7 11 18
Total 900 239 1,139
Source: Amoud University.
Chart 41: Number of Students Graduated from Amoud University during 2007-2010
0
50
100
150
200
250
Bu
sin
ess
Edu
cati
on
Med
icin
e
Bu
sin
ess
Edu
cati
on
Agr
icu
ltu
re
Med
icin
e
Bu
sin
ess
Edu
cati
on
Agr
icu
ltu
re
Med
icin
e
Nu
rsin
g
Bu
sin
ss &
P.A
dm
Edu
cati
on
Dip
lom
a Ed
uca
tio
n
Agr
icu
ltu
re
Nu
rsin
g
2007 2008 2009 2010
No
. Stu
de
nts
Gra
du
ate
d
Students Graduated from Amoud University during 2007-2010
Male
Female
Page 48
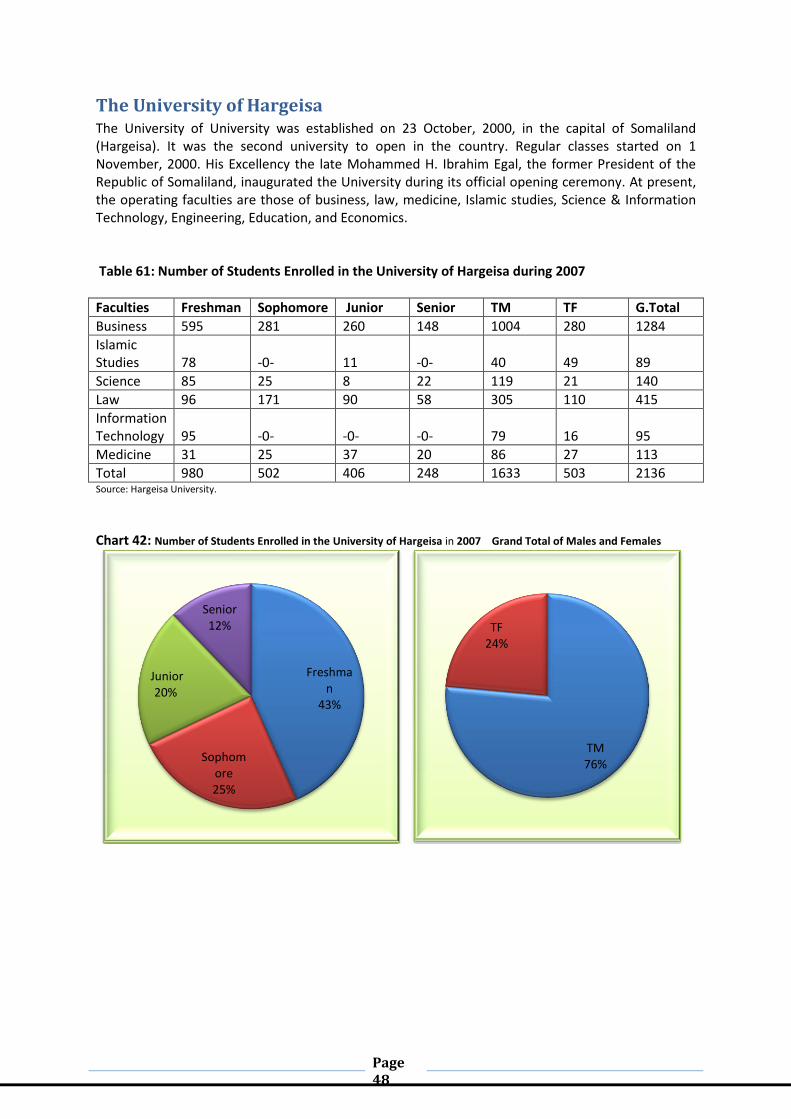
The University of Hargeisa The University of University was established on 23 October, 2000, in the capital of Somaliland (Hargeisa). It was the second university to open in the country. Regular classes started on 1 November, 2000. His Excellency the late Mohammed H. Ibrahim Egal, the former President of the Republic of Somaliland, inaugurated the University during its official opening ceremony. At present, the operating faculties are those of business, law, medicine, Islamic studies, Science & Information Technology, Engineering, Education, and Economics. Table 61: Number of Students Enrolled in the University of Hargeisa during 2007
Faculties Freshman Sophomore Junior Senior TM TF G.Total
Business 595 281 260 148 1004 280 1284
Islamic Studies
78
-0-
11
-0-
40
49
89
Science 85 25 8 22 119 21 140
Law 96 171 90 58 305 110 415
Information Technology
95
-0-
-0-
-0-
79
16
95
Medicine 31 25 37 20 86 27 113
Total 980 502 406 248 1633 503 2136 Source: Hargeisa University.
Chart 42: Number of Students Enrolled in the University of Hargeisa in 2007 Grand Total of Males and Females
Freshman
43%
Sophomore 25%
Junior 20%
Senior 12%
TM 76%
TF 24%
Page 49
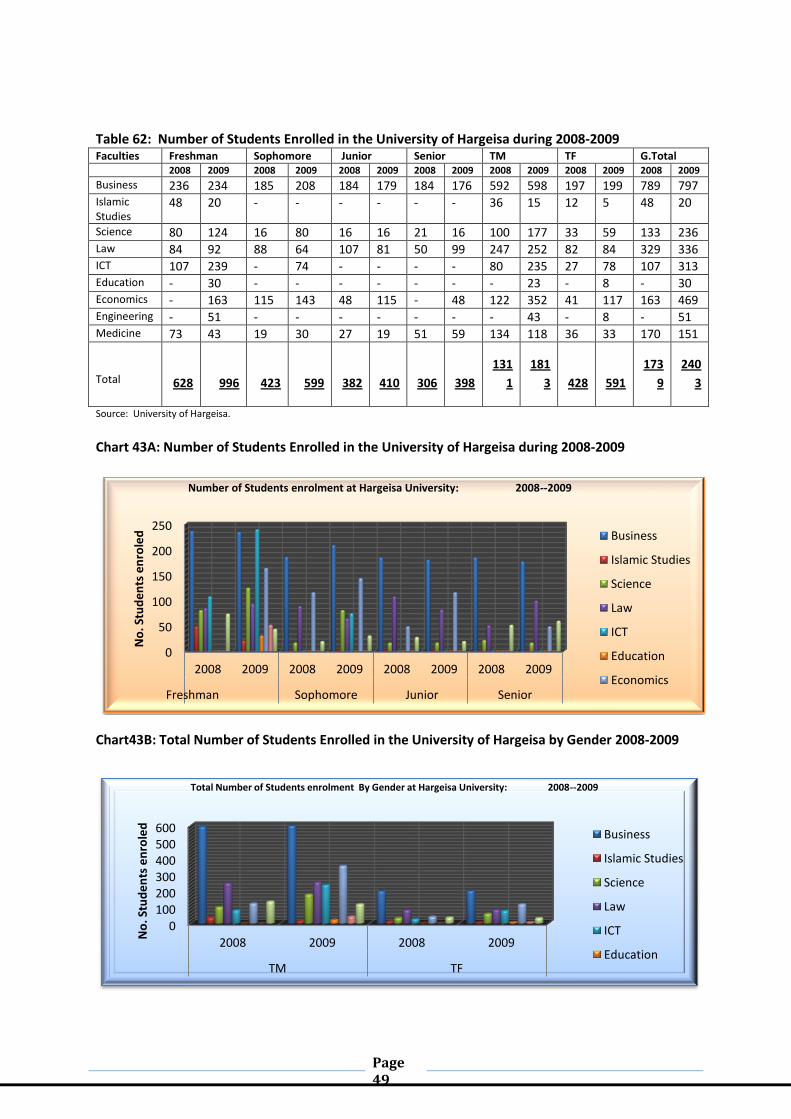
Table 62: Number of Students Enrolled in the University of Hargeisa during 2008-2009 Faculties Freshman Sophomore Junior Senior TM TF G.Total 2008 2009 2008 2009 2008 2009 2008 2009 2008 2009 2008 2009 2008 2009
Business 236 234 185 208 184 179 184 176 592 598 197 199 789 797 Islamic Studies
48 20 - - - - - - 36 15 12 5 48 20
Science 80 124 16 80 16 16 21 16 100 177 33 59 133 236 Law 84 92 88 64 107 81 50 99 247 252 82 84 329 336 ICT 107 239 - 74 - - - - 80 235 27 78 107 313 Education - 30 - - - - - - - 23 - 8 - 30 Economics - 163 115 143 48 115 - 48 122 352 41 117 163 469 Engineering - 51 - - - - - - - 43 - 8 - 51 Medicine 73 43 19 30 27 19 51 59 134 118 36 33 170 151 Total
628 996 423 599 382 410 306 398
131
1
181
3 428 591
173
9
240
3
Source: University of Hargeisa.
Chart 43A: Number of Students Enrolled in the University of Hargeisa during 2008-2009
Chart43B: Total Number of Students Enrolled in the University of Hargeisa by Gender 2008-2009
0
50
100
150
200
250
2008 2009 2008 2009 2008 2009 2008 2009
Freshman Sophomore Junior Senior
No
. Stu
de
nts
en
role
d
Number of Students enrolment at Hargeisa University: 2008--2009
Business
Islamic Studies
Science
Law
ICT
Education
Economics
0 100 200 300 400 500 600
2008 2009 2008 2009
TM TF
No
. Stu
de
nts
en
role
d
Total Number of Students enrolment By Gender at Hargeisa University: 2008--2009
Business
Islamic Studies
Science
Law
ICT
Education
Page 50
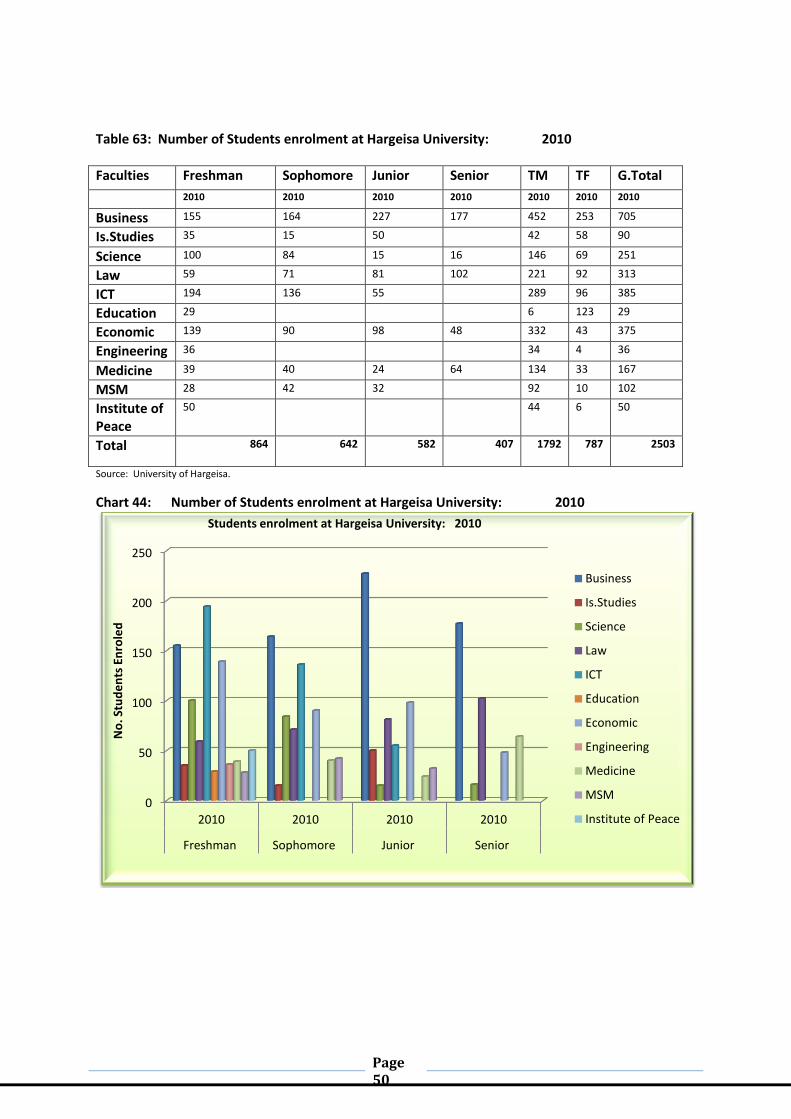
Table 63: Number of Students enrolment at Hargeisa University: 2010
Faculties Freshman Sophomore Junior Senior TM TF G.Total
2010 2010 2010 2010 2010 2010 2010
Business 155 164 227 177 452 253 705
Is.Studies 35 15 50 42 58 90
Science 100 84 15 16 146 69 251
Law 59 71 81 102 221 92 313
ICT 194 136 55 289 96 385
Education 29 6 123 29
Economic 139 90 98 48 332 43 375
Engineering 36 34 4 36
Medicine 39 40 24 64 134 33 167
MSM 28 42 32 92 10 102
Institute of Peace
50 44 6 50
Total 864 642 582 407 1792 787 2503
Source: University of Hargeisa.
Chart 44: Number of Students enrolment at Hargeisa University: 2010
0
50
100
150
200
250
2010 2010 2010 2010
Freshman Sophomore Junior Senior
No
. Stu
de
nts
En
role
d
Students enrolment at Hargeisa University: 2010
Business
Is.Studies
Science
Law
ICT
Education
Economic
Engineering
Medicine
MSM
Institute of Peace
Page 51
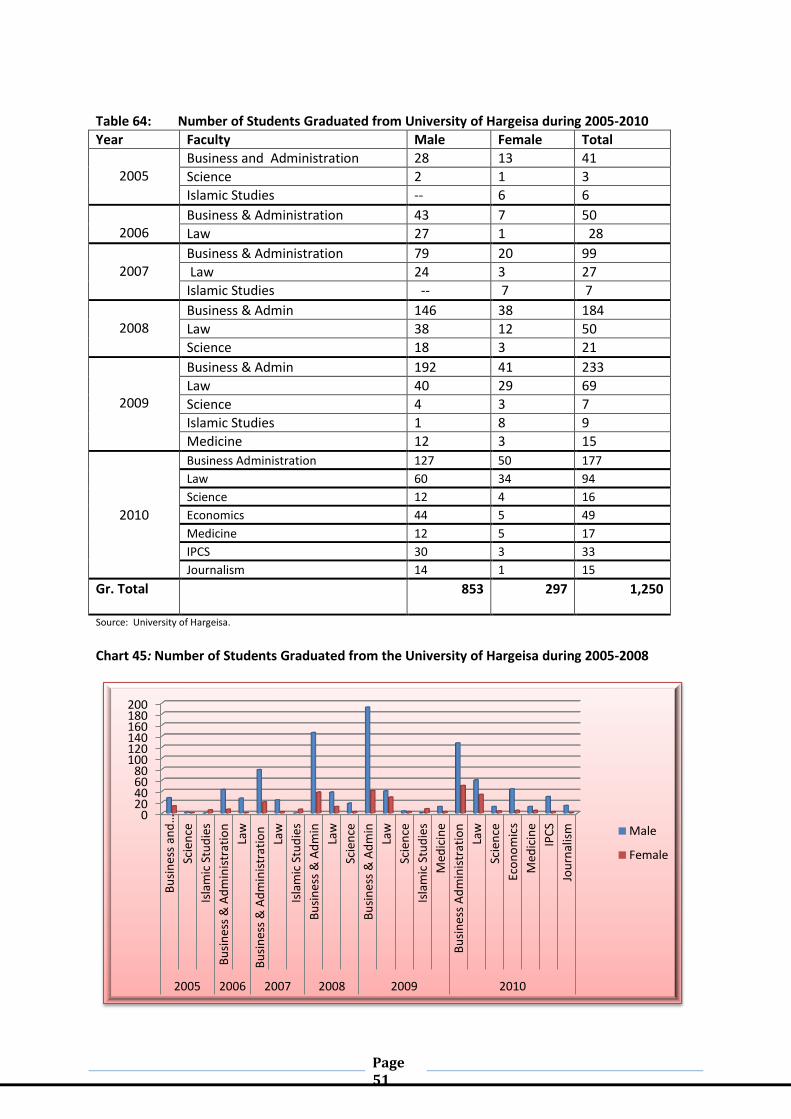
Table 64: Number of Students Graduated from University of Hargeisa during 2005-2010
Year Faculty Male Female Total
2005
Business and Administration 28 13 41
Science 2 1 3
Islamic Studies -- 6 6
2006
Business & Administration 43 7 50
Law 27 1 28
2007
Business & Administration 79 20 99
Law 24 3 27
Islamic Studies -- 7 7
2008
Business & Admin 146 38 184
Law 38 12 50
Science 18 3 21
2009
Business & Admin 192 41 233
Law 40 29 69
Science 4 3 7
Islamic Studies 1 8 9
Medicine 12 3 15
2010
Business Administration 127 50 177
Law 60 34 94
Science 12 4 16
Economics 44 5 49
Medicine 12 5 17
IPCS 30 3 33
Journalism 14 1 15
Gr. Total 853 297 1,250
Source: University of Hargeisa.
Chart 45: Number of Students Graduated from the University of Hargeisa during 2005-2008
0 20 40 60 80
100 120 140 160 180 200
Bu
sin
ess
and
…
Scie
nce
Isla
mic
Stu
die
s
Bu
sin
ess
& A
dm
inis
trat
ion
Law
Bu
sin
ess
& A
dm
inis
trat
ion
Law
Isla
mic
Stu
die
s
Bu
sin
ess
& A
dm
in
Law
Scie
nce
Bu
sin
ess
& A
dm
in
Law
Scie
nce
Isla
mic
Stu
die
s
Med
icin
e
Bu
sin
ess
Ad
min
istr
atio
n
Law
Scie
nce
Eco
no
mic
s
Med
icin
e
IPC
S
Jou
rnal
ism
2005 2006 2007 2008 2009 2010
Male
Female
Page 52
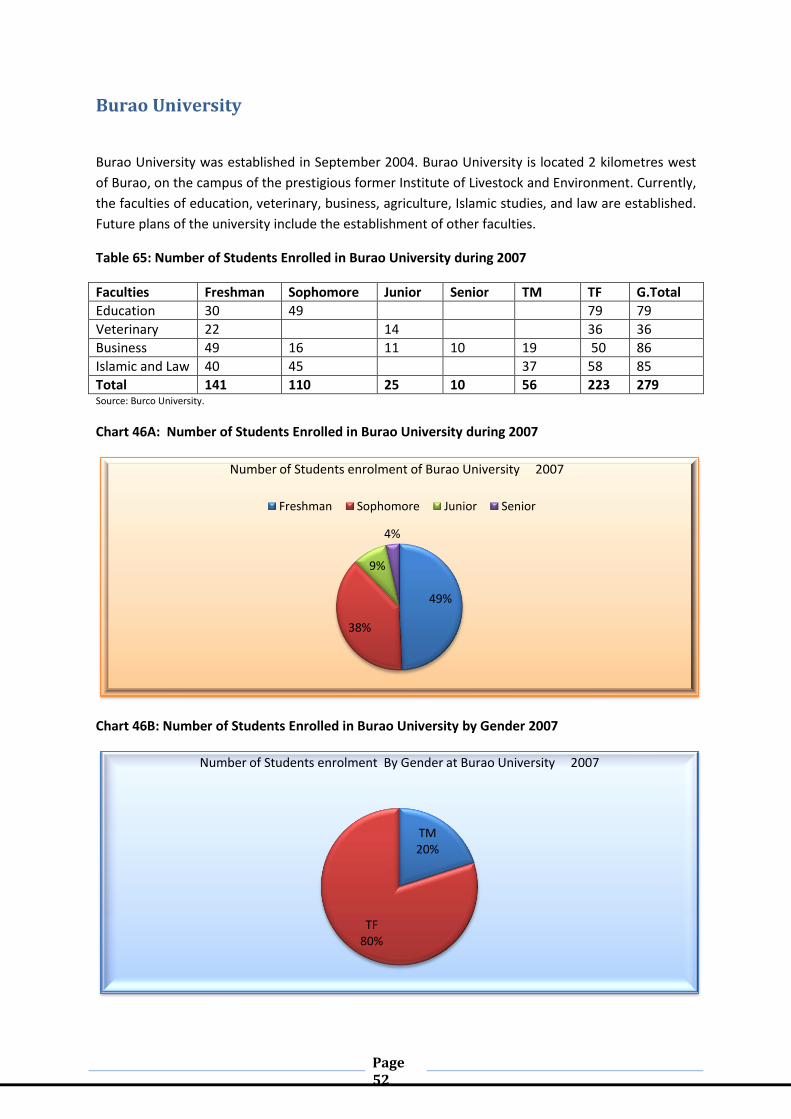
Burao University
Burao University was established in September 2004. Burao University is located 2 kilometres west
of Burao, on the campus of the prestigious former Institute of Livestock and Environment. Currently,
the faculties of education, veterinary, business, agriculture, Islamic studies, and law are established.
Future plans of the university include the establishment of other faculties.
Table 65: Number of Students Enrolled in Burao University during 2007
Faculties Freshman Sophomore Junior Senior TM TF G.Total
Education 30 49 79 79
Veterinary 22 14 36 36
Business 49 16 11 10 19 50 86
Islamic and Law 40 45 37 58 85
Total 141 110 25 10 56 223 279 Source: Burco University.
Chart 46A: Number of Students Enrolled in Burao University during 2007
Chart 46B: Number of Students Enrolled in Burao University by Gender 2007
49%
38%
9%
4%
Number of Students enrolment of Burao University 2007
Freshman Sophomore Junior Senior
TM 20%
TF 80%
Number of Students enrolment By Gender at Burao University 2007
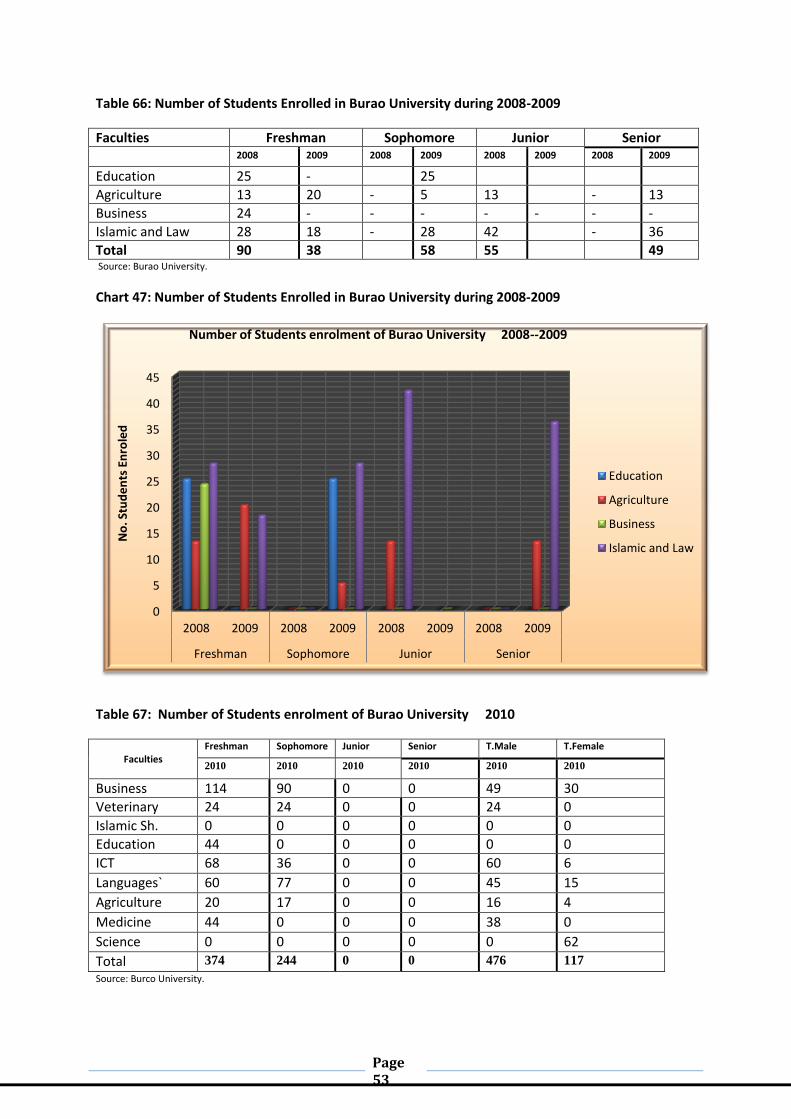
Page 53
Table 66: Number of Students Enrolled in Burao University during 2008-2009
Faculties Freshman Sophomore Junior Senior
2008 2009 2008 2009 2008 2009 2008 2009
Education 25 - 25
Agriculture 13 20 - 5 13 - 13
Business 24 - - - - - - -
Islamic and Law 28 18 - 28 42 - 36
Total 90 38 58 55 49 Source: Burao University.
Chart 47: Number of Students Enrolled in Burao University during 2008-2009
Table 67: Number of Students enrolment of Burao University 2010
Faculties Freshman Sophomore Junior Senior T.Male T.Female
2010 2010 2010 2010 2010 2010
Business 114 90 0 0 49 30
Veterinary 24 24 0 0 24 0
Islamic Sh. 0 0 0 0 0 0
Education 44 0 0 0 0 0
ICT 68 36 0 0 60 6
Languages` 60 77 0 0 45 15
Agriculture 20 17 0 0 16 4
Medicine 44 0 0 0 38 0
Science 0 0 0 0 0 62
Total 374 244 0 0 476 117
Source: Burco University.
0
5
10
15
20
25
30
35
40
45
2008 2009 2008 2009 2008 2009 2008 2009
Freshman Sophomore Junior Senior
No
. Stu
de
nts
En
role
d
Number of Students enrolment of Burao University 2008--2009
Education
Agriculture
Business
Islamic and Law

Page 54
Chart 48: Number of Students enrolment of Burao University 2010
Table 68: Number of Graduated students From Burao University: 2010 Year Faculty Male Female Total
2010
Veterinay 11 2 13
Business Administration 22 4 26
Education 0 26 26
Islmic Sharia 18 18 36
Source: Burco University.
Chart 49: Number of Graduated students From Burao University: 2010
0
20
40
60
80
100
120
2010 2010 2010 2010
Freshman Sophomore Junior Senior
No
. stu
de
nts
en
role
d
Students enrolment of Burao University 2010
Business
Veterinary
Islamic Sh.
Education
ICT
Languages`
Agriculture
Medicine
0
5
10
15
20
25
30
Veterinay Business Administration
Education Islmic Sharia
2010
No
. Stu
de
nt
Gra
tuat
ed
Number of Graduated students From Burao University: 2010
Male
Female
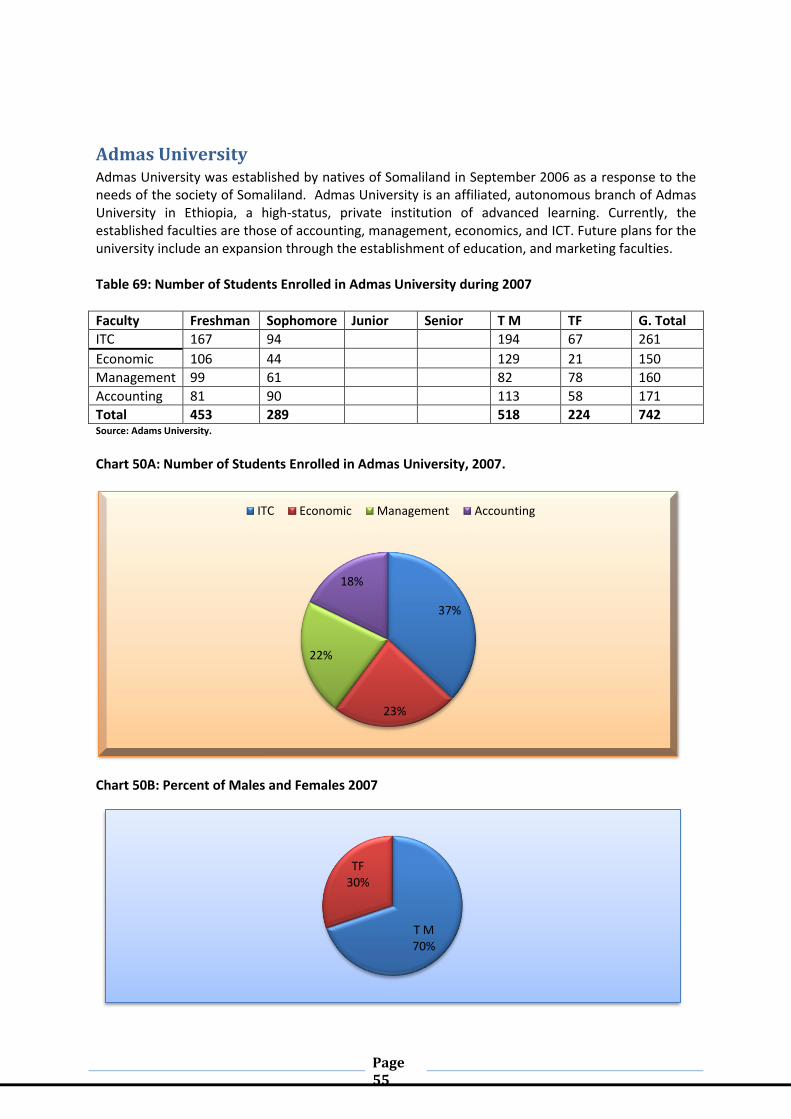
Page 55
Admas University Admas University was established by natives of Somaliland in September 2006 as a response to the needs of the society of Somaliland. Admas University is an affiliated, autonomous branch of Admas University in Ethiopia, a high-status, private institution of advanced learning. Currently, the established faculties are those of accounting, management, economics, and ICT. Future plans for the university include an expansion through the establishment of education, and marketing faculties. Table 69: Number of Students Enrolled in Admas University during 2007
Faculty Freshman Sophomore Junior Senior T M TF G. Total
ITC 167 94 194 67 261
Economic 106 44 129 21 150
Management 99 61 82 78 160
Accounting 81 90 113 58 171
Total 453 289 518 224 742 Source: Adams University.
Chart 50A: Number of Students Enrolled in Admas University, 2007.
Chart 50B: Percent of Males and Females 2007
37%
23%
22%
18%
ITC Economic Management Accounting
T M 70%
TF 30%
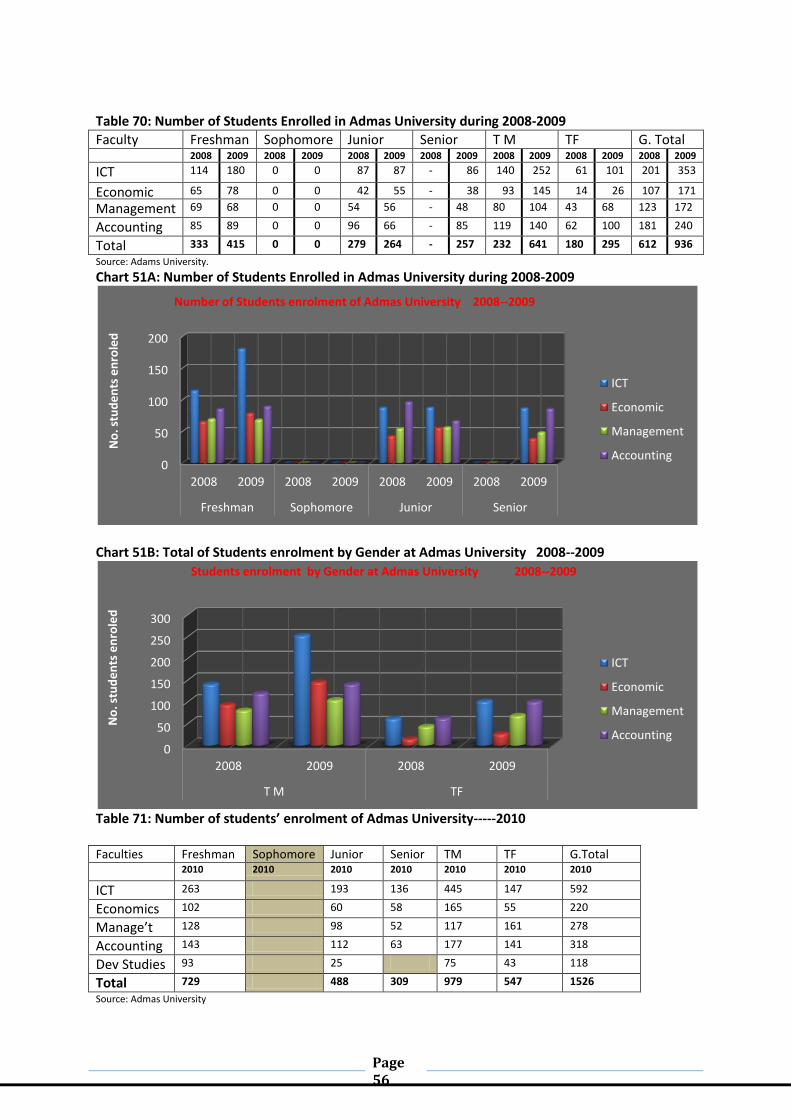
Page 56
Table 70: Number of Students Enrolled in Admas University during 2008-2009
Faculty Freshman Sophomore Junior Senior T M TF G. Total 2008 2009 2008 2009 2008 2009 2008 2009 2008 2009 2008 2009 2008 2009
ICT 114 180 0 0 87 87 - 86 140 252 61 101 201 353
Economic 65 78 0 0 42 55 - 38 93 145 14 26 107 171
Management 69 68 0 0 54 56 - 48 80 104 43 68 123 172
Accounting 85 89 0 0 96 66 - 85 119 140 62 100 181 240
Total 333 415 0 0 279 264 - 257 232 641 180 295 612 936
Source: Adams University.
Chart 51A: Number of Students Enrolled in Admas University during 2008-2009
Chart 51B: Total of Students enrolment by Gender at Admas University 2008--2009
Table 71: Number of students’ enrolment of Admas University-----2010 Faculties Freshman Sophomore Junior Senior TM TF G.Total
2010 2010 2010 2010 2010 2010 2010
ICT 263 193 136 445 147 592
Economics 102 60 58 165 55 220
Manage’t 128 98 52 117 161 278
Accounting 143 112 63 177 141 318
Dev Studies 93 25 75 43 118
Total 729 488 309 979 547 1526
Source: Admas University
0
50
100
150
200
2008 2009 2008 2009 2008 2009 2008 2009
Freshman Sophomore Junior Senior
No
. stu
de
nts
en
role
d
Number of Students enrolment of Admas University 2008--2009
ICT
Economic
Management
Accounting
0
50
100
150
200
250
300
2008 2009 2008 2009
T M TF
No
. stu
de
nts
en
role
d
Students enrolment by Gender at Admas University 2008--2009
ICT
Economic
Management
Accounting
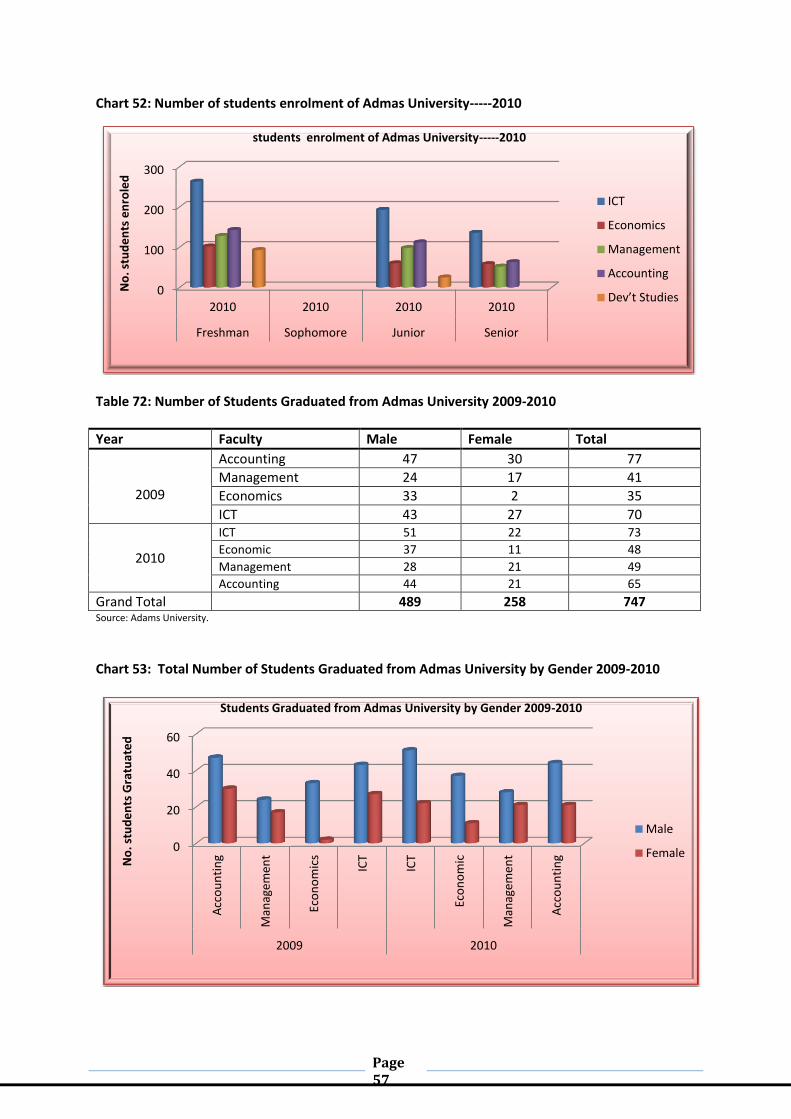
Page 57
Chart 52: Number of students enrolment of Admas University-----2010
Table 72: Number of Students Graduated from Admas University 2009-2010
Year Faculty Male Female Total
2009
Accounting 47 30 77
Management 24 17 41
Economics 33 2 35
ICT 43 27 70
2010
ICT 51 22 73
Economic 37 11 48
Management 28 21 49
Accounting 44 21 65
Grand Total 489 258 747 Source: Adams University.
Chart 53: Total Number of Students Graduated from Admas University by Gender 2009-2010
0
100
200
300
2010 2010 2010 2010
Freshman Sophomore Junior Senior
No
. stu
de
nts
en
role
d
students enrolment of Admas University-----2010
ICT
Economics
Management
Accounting
Dev’t Studies
0
20
40
60
Acc
ou
nti
ng
Man
agem
ent
Eco
no
mic
s
ICT
ICT
Eco
no
mic
Man
agem
ent
Acc
ou
nti
ng
2009 2010
No
. stu
de
nts
Gra
tuat
ed
Students Graduated from Admas University by Gender 2009-2010
Male
Female

Page 58
Eelo American University Eelo American University is situated in Borama, in Mahfuud`s Building. The Idea of establishing Eelo
American University was conceived by intellectuals from the Hashi family. Eelo American University
officially started functioning on 17September, 2007. At present, the faculties of engineering,
computer science, and management science are established. Future plans for the university include
the creation of faculties for economics, medicine, law, and agriculture.
Table 73: Number of Students Enrolled in Eelo American University during 2007
Faculty Freshman Sophomore Junior Senior TM TF Total
Engineering 79 76 3 79
Computer Science 137 98 39 137
Management Science 38 21 17 38
Total 254 196 59 255 Source: Eelo American University.
Chart 54A: Number of students Enrolled in Eelo American University during 2007
Chart 54B: Total of Males and Females
Engineering 31%
Computer Science
54%
Management Science
15%
TM 77%
TF 23%
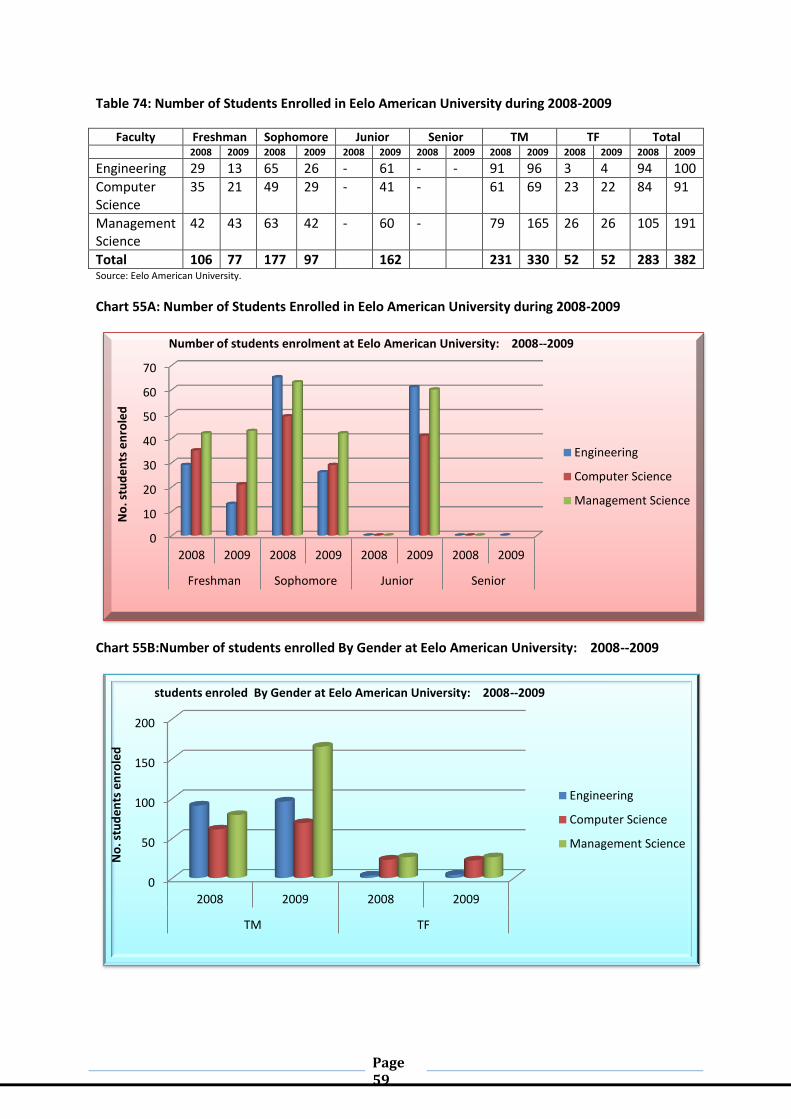
Page 59
Table 74: Number of Students Enrolled in Eelo American University during 2008-2009
Faculty Freshman Sophomore Junior Senior TM TF Total 2008 2009 2008 2009 2008 2009 2008 2009 2008 2009 2008 2009 2008 2009
Engineering 29 13 65 26 - 61 - - 91 96 3 4 94 100
Computer Science
35 21 49 29 - 41 - 61 69 23 22 84 91
Management Science
42 43 63 42 - 60 - 79 165 26 26 105 191
Total 106 77 177 97 162 231 330 52 52 283 382 Source: Eelo American University.
Chart 55A: Number of Students Enrolled in Eelo American University during 2008-2009
Chart 55B:Number of students enrolled By Gender at Eelo American University: 2008--2009
0
10
20
30
40
50
60
70
2008 2009 2008 2009 2008 2009 2008 2009
Freshman Sophomore Junior Senior
No
. stu
de
nts
en
role
d
Number of students enrolment at Eelo American University: 2008--2009
Engineering
Computer Science
Management Science
0
50
100
150
200
2008 2009 2008 2009
TM TF
No
. stu
de
nts
en
role
d
students enroled By Gender at Eelo American University: 2008--2009
Engineering
Computer Science
Management Science
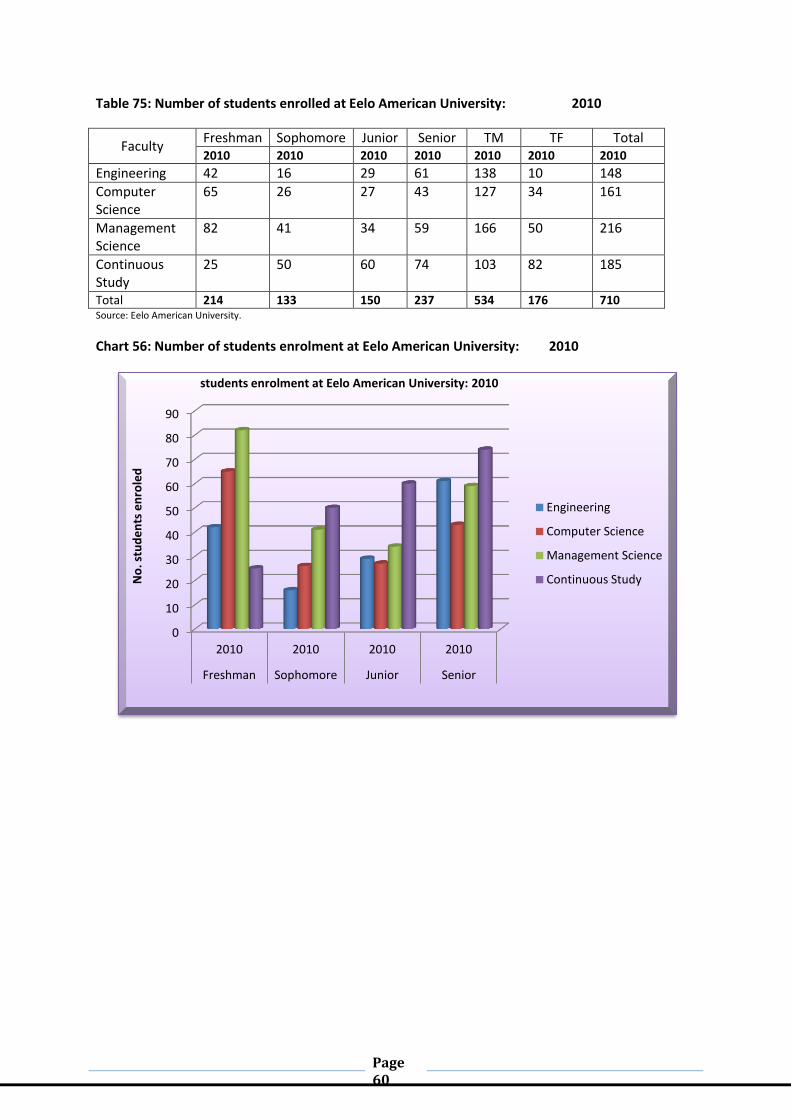
Page 60
Table 75: Number of students enrolled at Eelo American University: 2010
Faculty Freshman Sophomore Junior Senior TM TF Total 2010 2010 2010 2010 2010 2010 2010
Engineering 42 16 29 61 138 10 148
Computer Science
65 26 27 43 127 34 161
Management Science
82 41 34 59 166 50 216
Continuous Study
25 50 60 74 103 82 185
Total 214 133 150 237 534 176 710 Source: Eelo American University.
Chart 56: Number of students enrolment at Eelo American University: 2010
0
10
20
30
40
50
60
70
80
90
2010 2010 2010 2010
Freshman Sophomore Junior Senior
No
. stu
de
nts
en
role
d
students enrolment at Eelo American University: 2010
Engineering
Computer Science
Management Science
Continuous Study

Page 61
Golis University Golis University is located in the west of Hargeisa City, the capital of Somaliland. Golis University was established in 2004 as a non-profit making institution. Officially, it was started in 2005 and was upgraded to the status of a university within 10 months of its opening. Currently, the faculties of education, civil engineering, telecommunications engineering, ICT, law, agriculture, and criminal justice and police science are established. Table 76: Number of Students Enrolled in Golis University during 2007
Faculties Freshman Sophomore Junior Senior TM TF Total
Education 452 341 111 452
Engineering 38 52 29 117 2 119
ITC 45 11 41 15 56
Shari& Law 15 15 15
CJ& Police 43 33 10 43
Total 98 515 29 43 547 138 685 Source: Golis University.
Chart 57A: Number of students Enrolled in Golis University during 2007
Chart 57B: Number of students enrolled by Gender at Golis University 2007
0
100
200
300
400
500
Freshman Sophomore Junior Senior
No
. Stu
de
nt
Enro
led
Students enrolment at Gollis University: 2007
Education
Engineering
ITC
Shari& Law
CJ& Police
0
50
100
150
200
250
300
350
Education Engineering ITC Shari& Law CJ& Police
No
. Stu
de
nt
Enro
led
Students enrolment by Gender at Gollis University: 2007
TM
TF
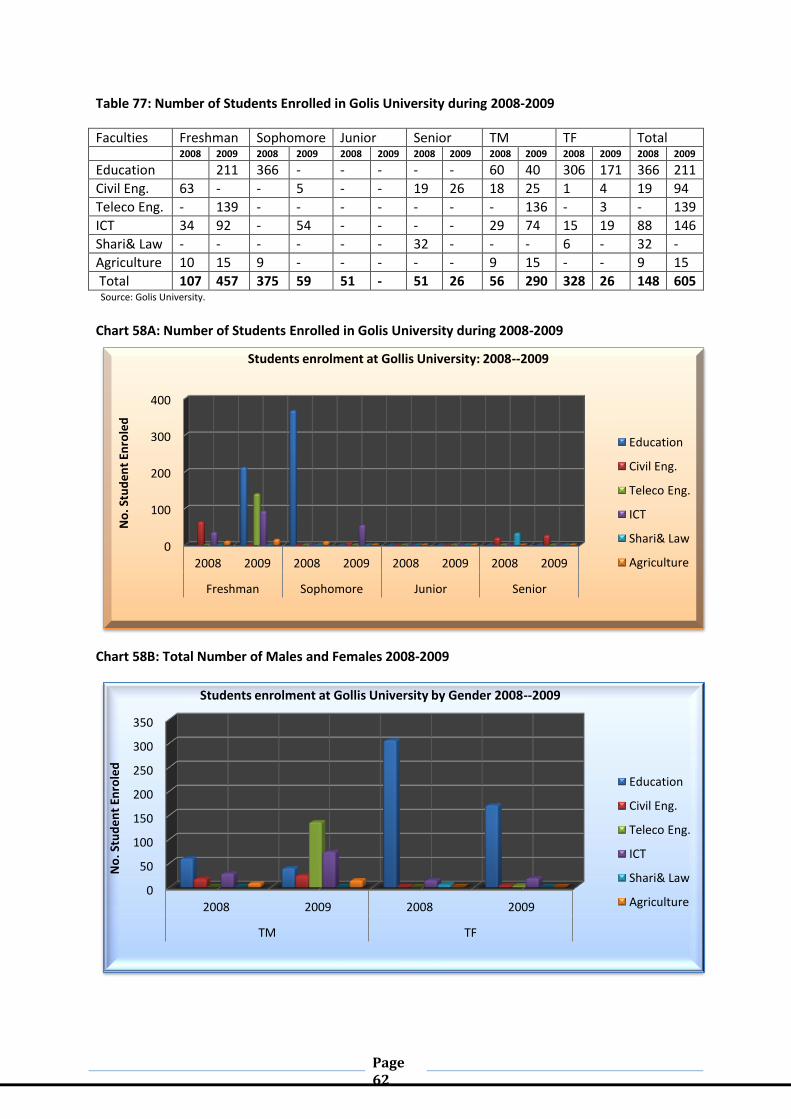
Page 62
Table 77: Number of Students Enrolled in Golis University during 2008-2009
Faculties Freshman Sophomore Junior Senior TM TF Total 2008 2009 2008 2009 2008 2009 2008 2009 2008 2009 2008 2009 2008 2009
Education 211 366 - - - - - 60 40 306 171 366 211
Civil Eng. 63 - - 5 - - 19 26 18 25 1 4 19 94
Teleco Eng. - 139 - - - - - - - 136 - 3 - 139
ICT 34 92 - 54 - - - - 29 74 15 19 88 146
Shari& Law - - - - - - 32 - - - 6 - 32 -
Agriculture 10 15 9 - - - - - 9 15 - - 9 15
Total 107 457 375 59 51 - 51 26 56 290 328 26 148 605 Source: Golis University.
Chart 58A: Number of Students Enrolled in Golis University during 2008-2009
Chart 58B: Total Number of Males and Females 2008-2009
0
100
200
300
400
2008 2009 2008 2009 2008 2009 2008 2009
Freshman Sophomore Junior Senior
No
. Stu
de
nt
Enro
led
Students enrolment at Gollis University: 2008--2009
Education
Civil Eng.
Teleco Eng.
ICT
Shari& Law
Agriculture
0
50
100
150
200
250
300
350
2008 2009 2008 2009
TM TF
No
. Stu
de
nt
Enro
led
Students enrolment at Gollis University by Gender 2008--2009
Education
Civil Eng.
Teleco Eng.
ICT
Shari& Law
Agriculture
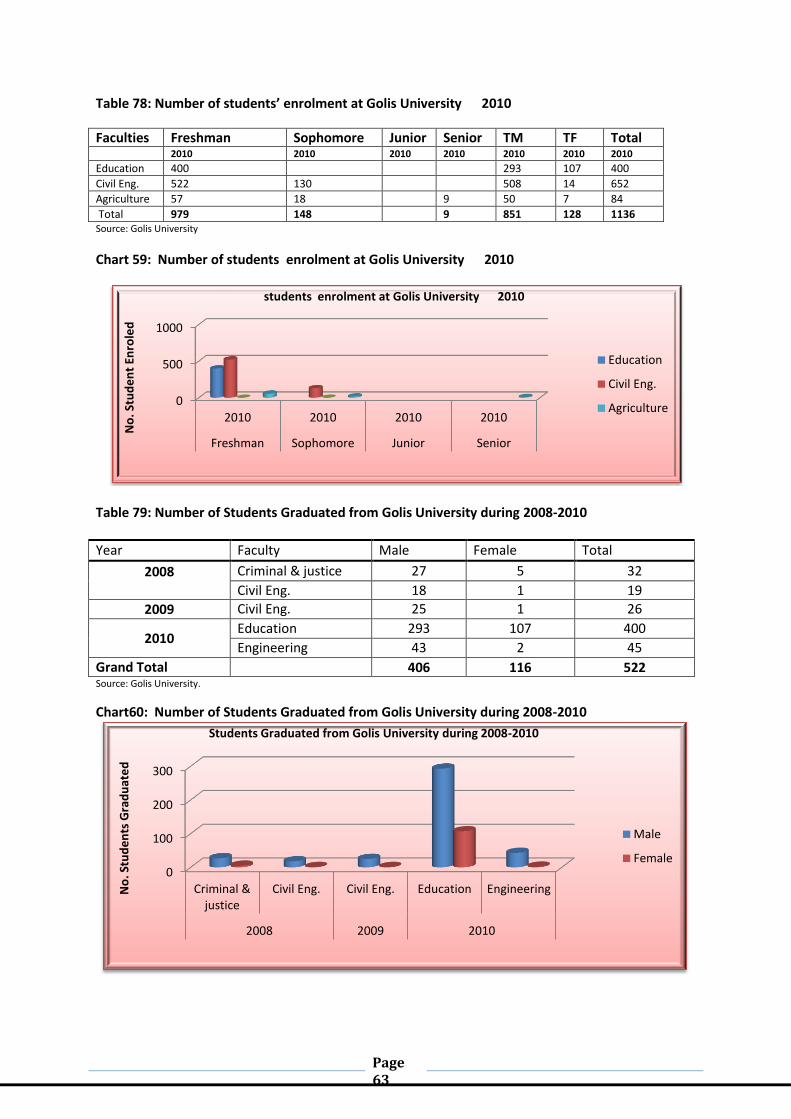
Page 63
Table 78: Number of students’ enrolment at Golis University 2010
Faculties Freshman Sophomore Junior Senior TM TF Total 2010 2010 2010 2010 2010 2010 2010
Education 400 293 107 400
Civil Eng. 522 130 508 14 652
Agriculture 57 18 9 50 7 84
Total 979 148 9 851 128 1136 Source: Golis University
Chart 59: Number of students enrolment at Golis University 2010
Table 79: Number of Students Graduated from Golis University during 2008-2010
Year Faculty Male Female Total
2008
Criminal & justice 27 5 32
Civil Eng. 18 1 19
2009 Civil Eng. 25 1 26
2010 Education 293 107 400
Engineering 43 2 45
Grand Total 406 116 522 Source: Golis University.
Chart60: Number of Students Graduated from Golis University during 2008-2010
0
500
1000
2010 2010 2010 2010
Freshman Sophomore Junior Senior
No
. Stu
de
nt
Enro
led
students enrolment at Golis University 2010
Education
Civil Eng.
Agriculture
0
100
200
300
Criminal & justice
Civil Eng. Civil Eng. Education Engineering
2008 2009 2010
No
. Stu
de
nts
Gra
du
ate
d
Students Graduated from Golis University during 2008-2010
Male
Female
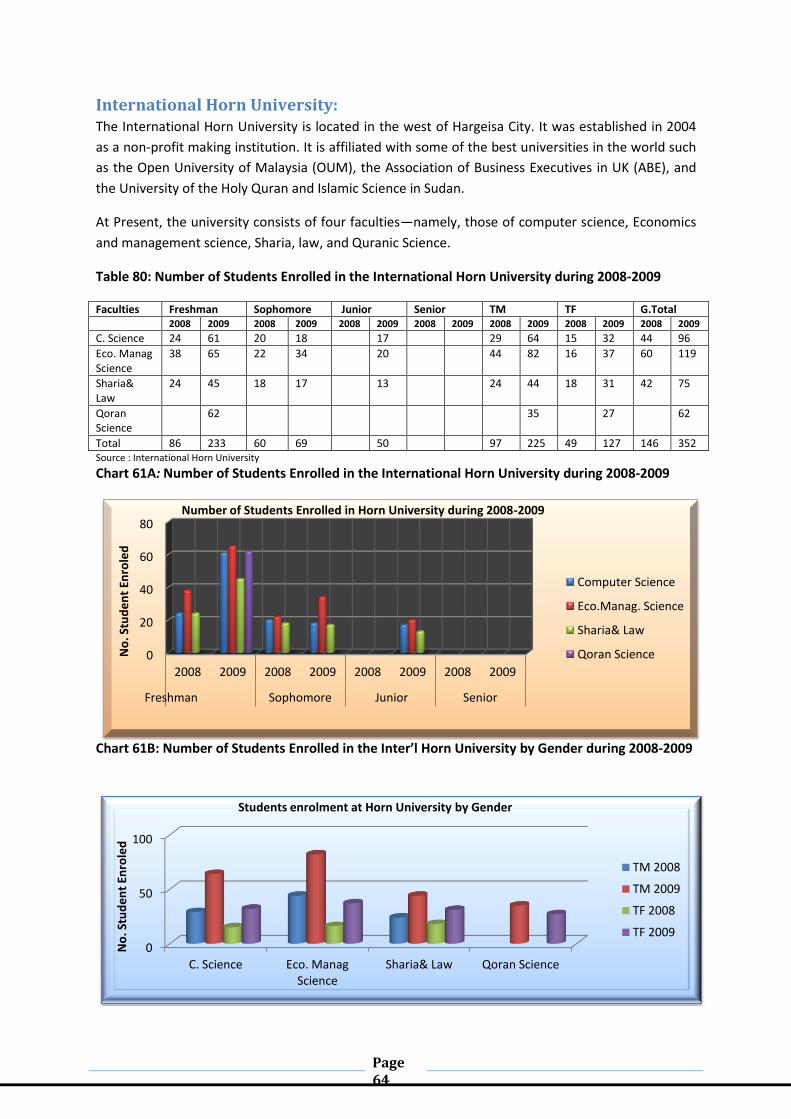
Page 64
International Horn University: The International Horn University is located in the west of Hargeisa City. It was established in 2004
as a non-profit making institution. It is affiliated with some of the best universities in the world such
as the Open University of Malaysia (OUM), the Association of Business Executives in UK (ABE), and
the University of the Holy Quran and Islamic Science in Sudan.
At Present, the university consists of four faculties—namely, those of computer science, Economics
and management science, Sharia, law, and Quranic Science.
Table 80: Number of Students Enrolled in the International Horn University during 2008-2009
Faculties Freshman Sophomore Junior Senior TM TF G.Total 2008 2009 2008 2009 2008 2009 2008 2009 2008 2009 2008 2009 2008 2009
C. Science 24 61 20 18 17 29 64 15 32 44 96
Eco. Manag Science
38 65 22 34 20 44 82 16 37 60 119
Sharia& Law
24 45 18 17 13 24 44 18 31 42 75
Qoran Science
62 35 27 62
Total 86 233 60 69 50 97 225 49 127 146 352 Source : International Horn University
Chart 61A: Number of Students Enrolled in the International Horn University during 2008-2009
Chart 61B: Number of Students Enrolled in the Inter’l Horn University by Gender during 2008-2009
0
20
40
60
80
2008 2009 2008 2009 2008 2009 2008 2009
Freshman Sophomore Junior Senior
No
. Stu
de
nt
Enro
led
Number of Students Enrolled in Horn University during 2008-2009
Computer Science
Eco.Manag. Science
Sharia& Law
Qoran Science
0
50
100
C. Science Eco. Manag Science
Sharia& Law Qoran Science
No
. Stu
de
nt
Enro
led
Students enrolment at Horn University by Gender
TM 2008
TM 2009
TF 2008
TF 2009

Page 65
Table 81: Number of Students enrolment at IHU 2010
Faculties Freshman Sophomore Junior Senior TM TF G.Total 2010 2010 2010 2010 2010 2010 2010
C. Science 30 16 30 10 55 31 86
Eco. Manag Science 16 12 32 28 55 33 88
Business A. 36 9 0 0 22 23 45
Sharia& Law 12 7 16 8 25 19 44
Qoran Science 45 36 49 0 79 50 129
MBA 33 27 6 33
Total 139 80 127 46 263 162 425 Source: International Horn University
Chart 62: Number of Students enrolment at IHU 2010
Table 82: Number of students Graduated from IHU 2010
Years Faculty Male Female Total
2010 Computer science 9 4 13
Economics 9 4 13
Shari law 3 1 4
Total 21 9 30 Source: International Horn University
Chart 63: Number of students Graduated from IHU 2010
0
20
40
60
2010 2010 2010 2010
Freshman Sophomore Junior Senior
No
. Stu
de
nts
C. Science
Eco. Manag Science
Business A.
Sharia& Law
Qoran Science
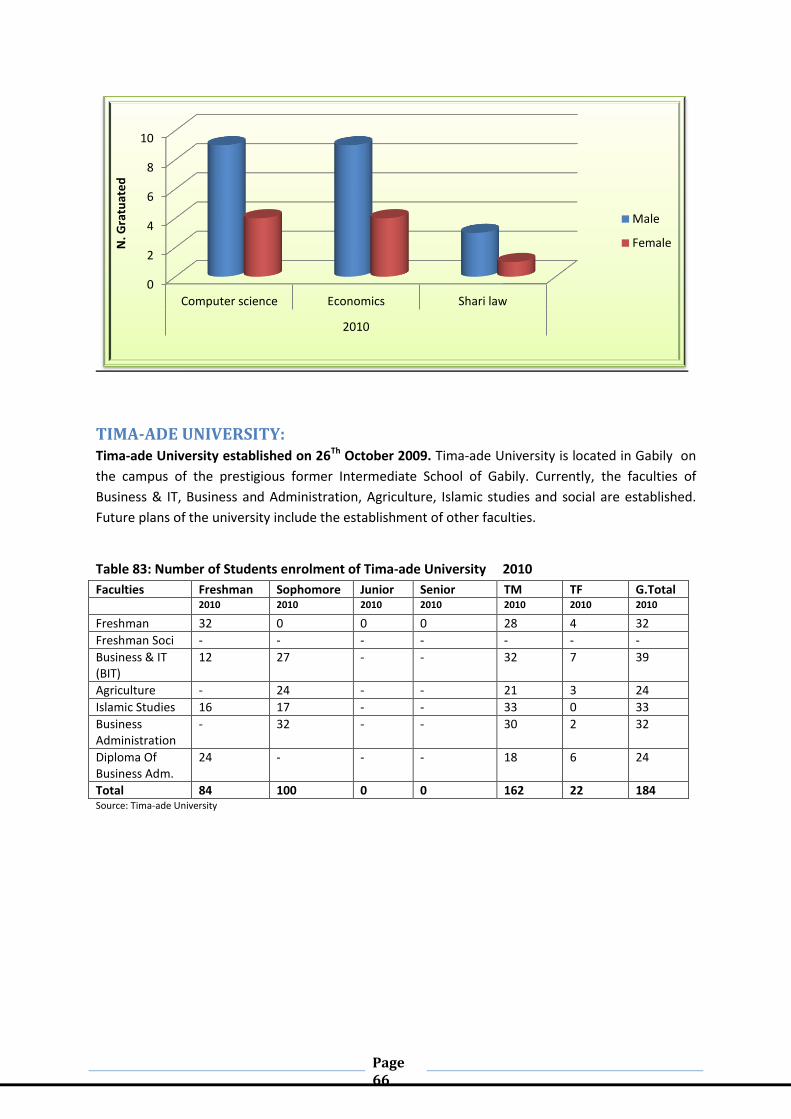
Page 66
TIMA-ADE UNIVERSITY: Tima-ade University established on 26Th October 2009. Tima-ade University is located in Gabily on
the campus of the prestigious former Intermediate School of Gabily. Currently, the faculties of
Business & IT, Business and Administration, Agriculture, Islamic studies and social are established.
Future plans of the university include the establishment of other faculties.
Table 83: Number of Students enrolment of Tima-ade University 2010
Faculties Freshman Sophomore Junior Senior TM TF G.Total
2010 2010 2010 2010 2010 2010 2010
Freshman 32 0 0 0 28 4 32
Freshman Soci - - - - - - -
Business & IT (BIT)
12 27 - - 32 7 39
Agriculture - 24 - - 21 3 24
Islamic Studies 16 17 - - 33 0 33
Business Administration
- 32 - - 30 2 32
Diploma Of Business Adm.
24 - - - 18 6 24
Total 84 100 0 0 162 22 184 Source: Tima-ade University
0
2
4
6
8
10
Computer science Economics Shari law
2010
N. G
ratu
ate
d
Male
Female

Page 67
7.3. Health The approximately 3. 9 million population of Somaliland is served by 26 hospitals, 87 health centres,
and 165 health posts. The health sector receives large amounts of assistance from international
organizations.
7.3.1Public Health Table 84: Available Health Service facilities during 2008-2009
Selected Region
Doctors Nurses Midvies X-Ray Technicians
Beds Laboratory Technologists
2008 2009 2008 2009 2008 2009 2008 2009 2008 2009 2008 2009
M.jeex 41 47 172 216 36 39 2 2 550 559 5 16
Sahil 3 3 10 10 5 9 0 0 250 255 1 1
Awdal 11 11 37 37 9 13 1 1 380 384 2 2
T/Dheer 12 15 47 78 10 14 1 1 270 276 3 3
Sanaag 4 4 24 24 5 9 0 0 130 133 1 1
Sool 2 6 4 4 1 5 0 0 140 142 1 1
Total 73 86 294 369 65 89 4 4 1720 1749 13 24 Sources: Ministry of Health.
Chart 64A: Available Health Staff Distribution by Region during 2008-2009
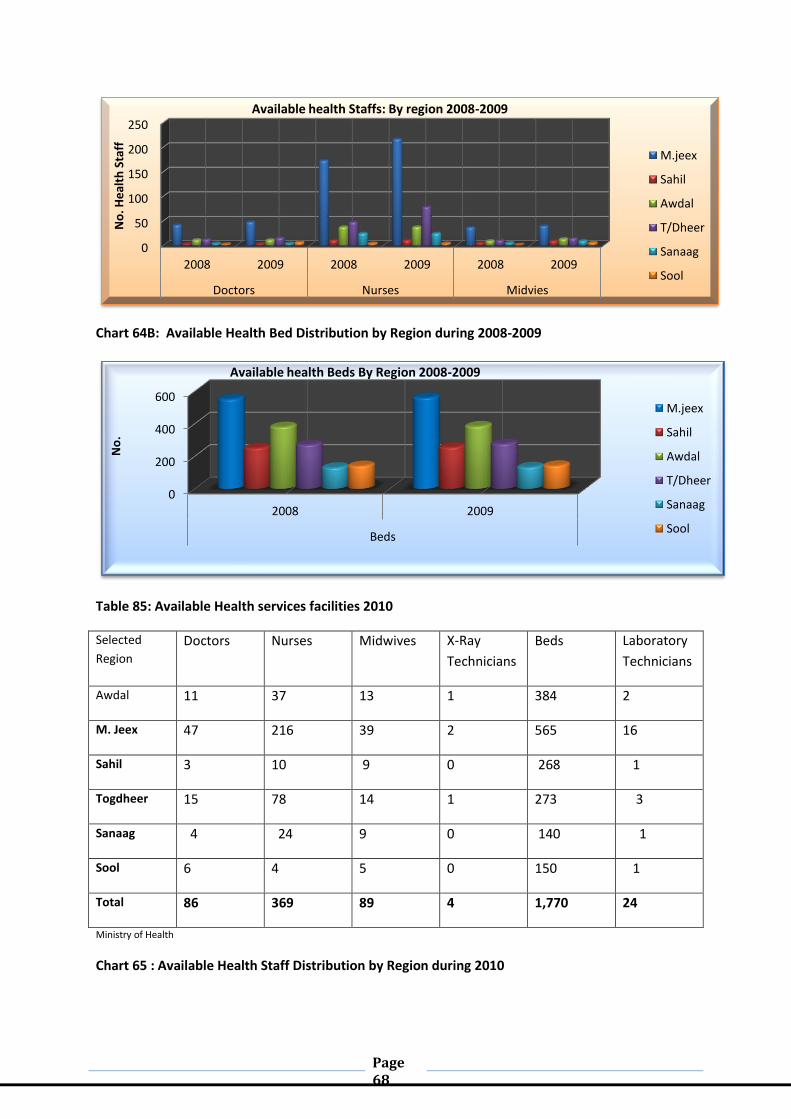
Page 68
Chart 64B: Available Health Bed Distribution by Region during 2008-2009
Table 85: Available Health services facilities 2010
Selected
Region
Doctors Nurses Midwives X-Ray
Technicians
Beds Laboratory
Technicians
Awdal 11 37 13 1 384 2
M. Jeex 47 216 39 2 565 16
Sahil 3 10 9 0 268 1
Togdheer 15 78 14 1 273 3
Sanaag 4 24 9 0 140 1
Sool 6 4 5 0 150 1
Total 86 369 89 4 1,770 24
Ministry of Health
Chart 65 : Available Health Staff Distribution by Region during 2010
0
50
100
150
200
250
2008 2009 2008 2009 2008 2009
Doctors Nurses Midvies
No
. He
alth
Sta
ff
Available health Staffs: By region 2008-2009
M.jeex
Sahil
Awdal
T/Dheer
Sanaag
Sool
0
200
400
600
2008 2009
Beds
No
.
Available health Beds By Region 2008-2009
M.jeex
Sahil
Awdal
T/Dheer
Sanaag
Sool

Page 69
-
Table 86: Number of health facilities (public and private) by region 2010
Health facility M/jeeh Awdal Saahil Togdheer Sool Sanaag Total
Public hospitals 4 3 2 2 2 2 15
MCH 24 20 8 14 9 12 87
Health Posts 30 30 15 30 35 35 165
Public mental health 1 0 1 1 0 0 3
Private hospitals 6 2 0 0 0 0 8 Sources: Ministry of Health.
Chart 66A: Health facilities (public and private) by region 2010
0
50
100
150
200
250
Awdal M. Jeex Sahil Togdheer Sanaag Sool
No
. He
alth
Sta
ff
Available Health services 2010
Doctors
Nurses
Midwives
X-Ray Technicians
Laboratory Technicians

Page 70
Chart 66B: Health facilities (public and private) by region 2010
Table 87: Regional Immunization Routing Data in 2008-2009
BCG DPT1-2-3 OPV1-2-3 Measles TT for pregnant woman*
TT for non pregnant woman*
2008 2009 2008 2009 2008 2009 2008 2009 2008 2009 2008 2009
M.jeex 10,361 12,401 28,179 33,526 28,226 33,625 9,244 10,598 9,964 14,561 4,998 4,716
Sahil 4,236 3,106 11,173 13,303 11,079 13,492 3,695 4,461 2,258 3,529 2,455 2,910
Awdal 11,901 10,070 36,542 29,760 36,720 29,900 8,968 8,286 9,592 9,783 6,412 6,053
T/Dheer 7,601 4,229 21,188 14,856 20,753 14,294 8,141 4,858 6,222 5,429 4,573 2,139
Sanaag 3,069 4,454 8,290 13,980 8,294 13,942 2,660 4,992 1,932 5,457 1,389 6,482
Sool 1,101 2,360 4,478 12,813 4,388 13,463 1,377 5,008 1,431 4,678 1,265 3,827
0
0.5
1
1.5
2
2.5
3
3.5
4
M/jeeh Awdal Saahil T/dheer Sool Sanaag
He
alth
y Fa
cilit
y Public & Private Hosp. and Mental Health
Public hospitals
Public mental health
Private hospitals
0
5
10
15
20
25
30
35
M/jeeh Awdal Saahil T/dheer Sool Sanaag
No
. MC
H &
HP
MCH & Health Posts in Six Regions
MCH
Health Posts
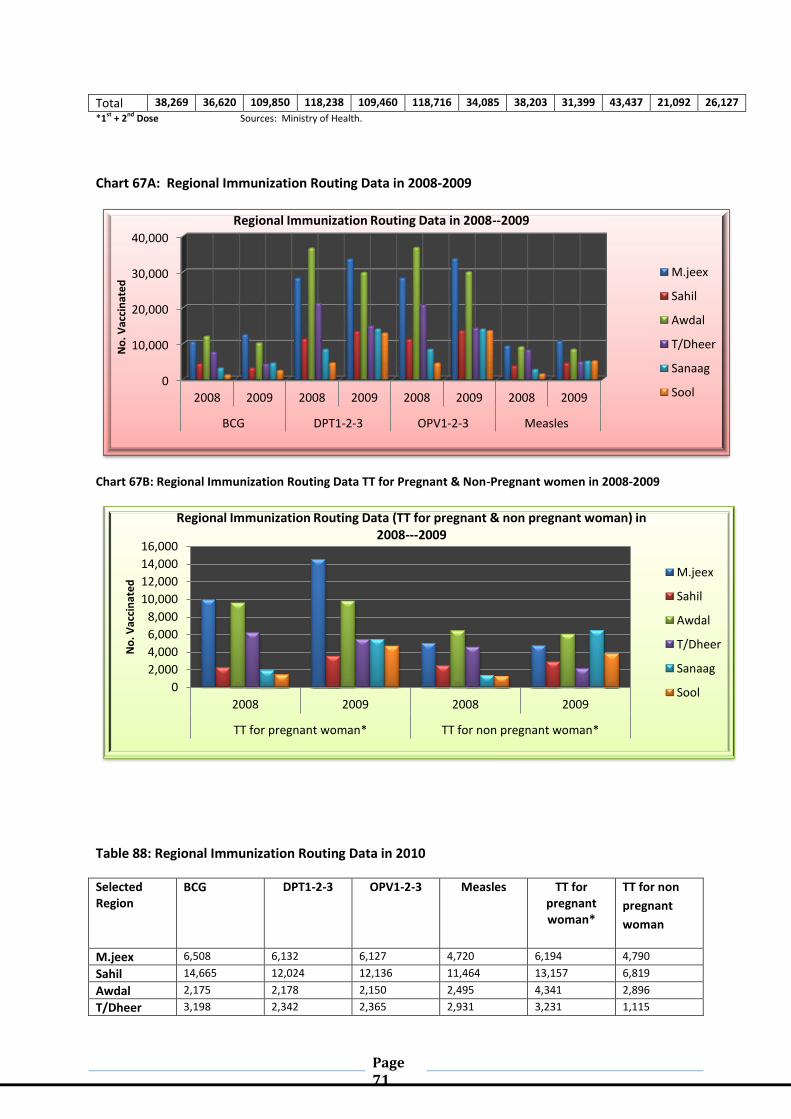
Page 71
Total 38,269 36,620 109,850 118,238 109,460 118,716 34,085 38,203 31,399 43,437 21,092 26,127
*1st + 2nd Dose Sources: Ministry of Health.
Chart 67A: Regional Immunization Routing Data in 2008-2009
Chart 67B: Regional Immunization Routing Data TT for Pregnant & Non-Pregnant women in 2008-2009
Table 88: Regional Immunization Routing Data in 2010
Selected Region
BCG DPT1-2-3 OPV1-2-3 Measles TT for pregnant woman*
TT for non
pregnant
woman
M.jeex 6,508 6,132 6,127 4,720 6,194 4,790
Sahil 14,665 12,024 12,136 11,464 13,157 6,819
Awdal 2,175 2,178 2,150 2,495 4,341 2,896
T/Dheer 3,198 2,342 2,365 2,931 3,231 1,115
0
10,000
20,000
30,000
40,000
2008 2009 2008 2009 2008 2009 2008 2009
BCG DPT1-2-3 OPV1-2-3 Measles
No
. Vac
cin
ate
d
Regional Immunization Routing Data in 2008--2009
M.jeex
Sahil
Awdal
T/Dheer
Sanaag
Sool
0
2,000
4,000
6,000
8,000
10,000
12,000
14,000
16,000
2008 2009 2008 2009
TT for pregnant woman* TT for non pregnant woman*
No
. Vac
cin
ate
d
Regional Immunization Routing Data (TT for pregnant & non pregnant woman) in 2008---2009
M.jeex
Sahil
Awdal
T/Dheer
Sanaag
Sool
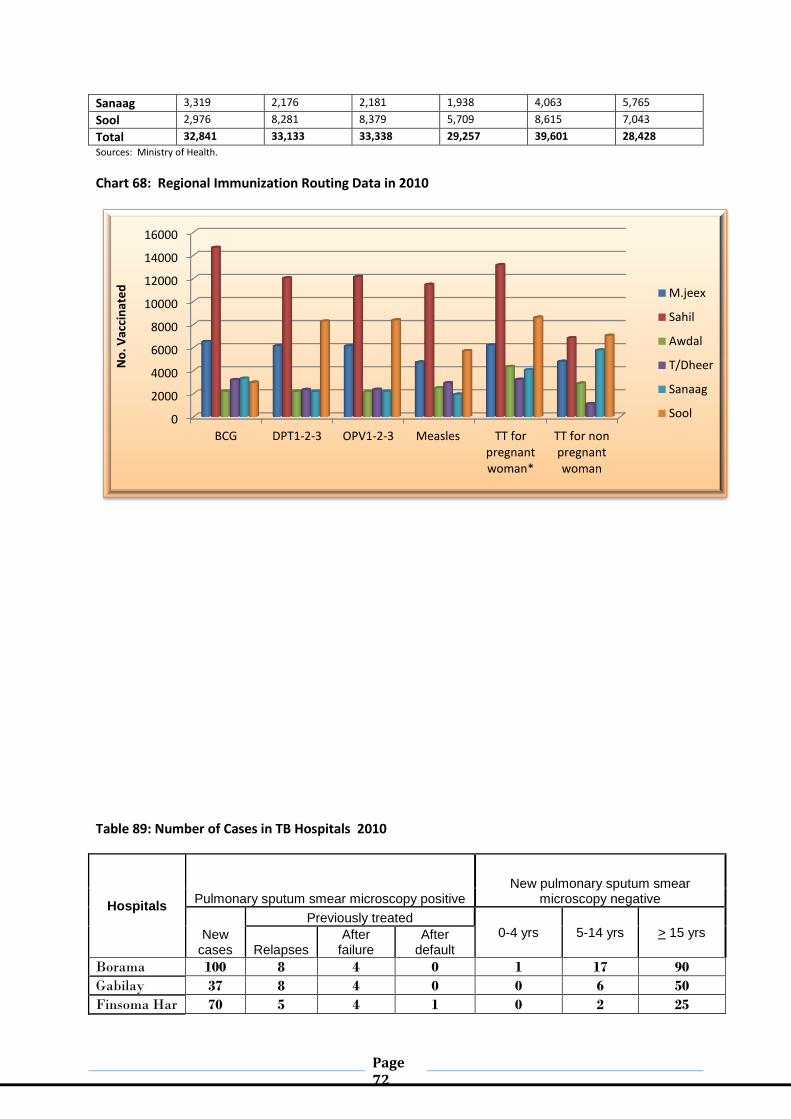
Page 72
Sanaag 3,319 2,176 2,181 1,938 4,063 5,765
Sool 2,976 8,281 8,379 5,709 8,615 7,043
Total 32,841 33,133 33,338 29,257 39,601 28,428
Sources: Ministry of Health.
Chart 68: Regional Immunization Routing Data in 2010
Table 89: Number of Cases in TB Hospitals 2010
Hospitals Pulmonary sputum smear microscopy positive
New pulmonary sputum smear microscopy negative
New cases
Previously treated 0-4 yrs 5-14 yrs > 15 yrs
Relapses After
failure After
default
Borama 100 8 4 0 1 17 90
Gabilay 37 8 4 0 0 6 50
Finsoma Har 70 5 4 1 0 2 25
0
2000
4000
6000
8000
10000
12000
14000
16000
BCG DPT1-2-3 OPV1-2-3 Measles TT for pregnant woman*
TT for non pregnant woman
No
. Vac
cin
ate
d
M.jeex
Sahil
Awdal
T/Dheer
Sanaag
Sool
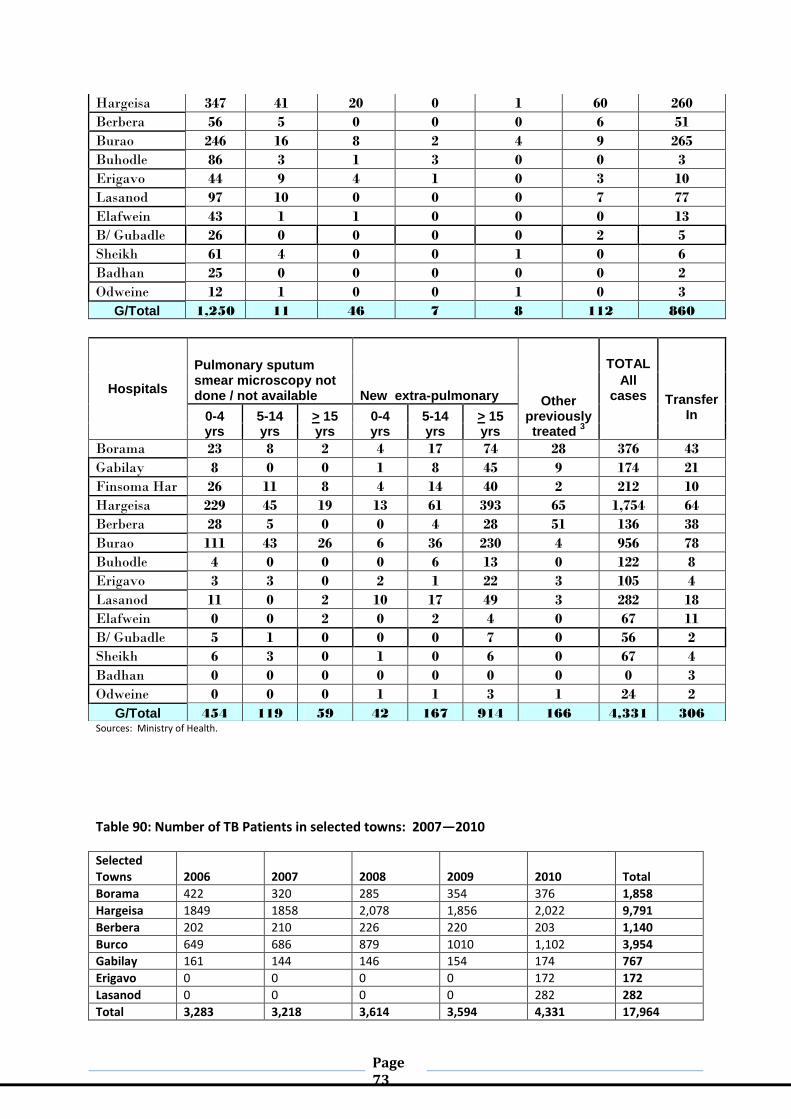
Page 73
Hargeisa 347 41 20 0 1 60 260
Berbera 56 5 0 0 0 6 51
Burao 246 16 8 2 4 9 265
Buhodle 86 3 1 3 0 0 3
Erigavo 44 9 4 1 0 3 10
Lasanod 97 10 0 0 0 7 77
Elafwein 43 1 1 0 0 0 13
B/ Gubadle 26 0 0 0 0 2 5
Sheikh 61 4 0 0 1 0 6
Badhan 25 0 0 0 0 0 2
Odweine 12 1 0 0 1 0 3
G/Total 1,250 11 46 7 8 112 860
Sources: Ministry of Health.
Table 90: Number of TB Patients in selected towns: 2007—2010
Selected Towns
2006
2007
2008
2009
2010
Total
Borama 422 320 285 354 376 1,858
Hargeisa 1849 1858 2,078 1,856 2,022 9,791
Berbera 202 210 226 220 203 1,140
Burco 649 686 879 1010 1,102 3,954
Gabilay 161 144 146 154 174 767
Erigavo 0 0 0 0 172 172
Lasanod 0 0 0 0 282 282
Total 3,283 3,218 3,614 3,594 4,331 17,964
Hospitals
Pulmonary sputum smear microscopy not done / not available New extra-pulmonary Other
previously treated
3
TOTAL
Transfer In
All cases
0-4 yrs
5-14 yrs
> 15 yrs
0-4 yrs
5-14 yrs
> 15 yrs
Borama 23 8 2 4 17 74 28 376 43
Gabilay 8 0 0 1 8 45 9 174 21
Finsoma Har 26 11 8 4 14 40 2 212 10
Hargeisa 229 45 19 13 61 393 65 1,754 64
Berbera 28 5 0 0 4 28 51 136 38
Burao 111 43 26 6 36 230 4 956 78
Buhodle 4 0 0 0 6 13 0 122 8
Erigavo 3 3 0 2 1 22 3 105 4
Lasanod 11 0 2 10 17 49 3 282 18
Elafwein 0 0 2 0 2 4 0 67 11
B/ Gubadle 5 1 0 0 0 7 0 56 2
Sheikh 6 3 0 1 0 6 0 67 4
Badhan 0 0 0 0 0 0 0 0 3
Odweine 0 0 0 1 1 3 1 24 2
G/Total 454 119 59 42 167 914 166 4,331 306
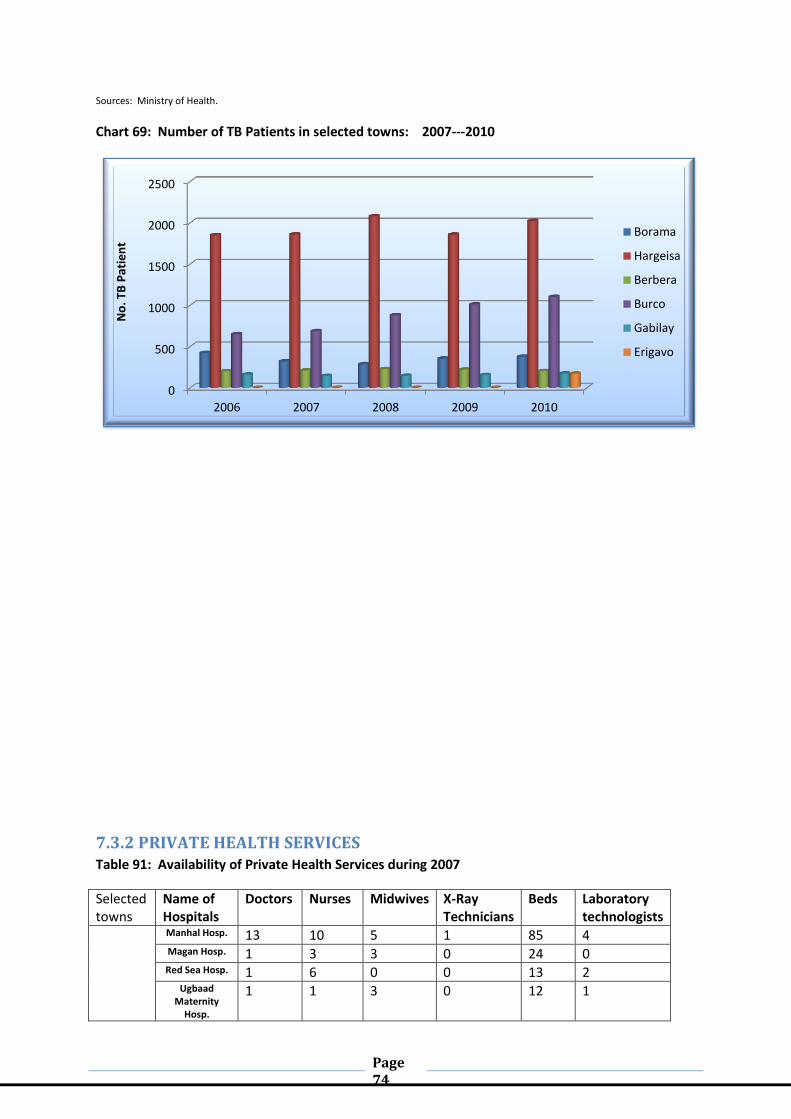
Page 74
Sources: Ministry of Health.
Chart 69: Number of TB Patients in selected towns: 2007---2010
7.3.2 PRIVATE HEALTH SERVICES Table 91: Availability of Private Health Services during 2007
Selected towns
Name of Hospitals
Doctors Nurses Midwives X-Ray Technicians
Beds Laboratory technologists
Manhal Hosp. 13 10 5 1 85 4 Magan Hosp. 1 3 3 0 24 0 Red Sea Hosp. 1 6 0 0 13 2
Ugbaad Maternity
Hosp.
1 1 3 0 12 1
0
500
1000
1500
2000
2500
2006 2007 2008 2009 2010
No
. TB
Pat
ien
t
Borama
Hargeisa
Berbera
Burco
Gabilay
Erigavo
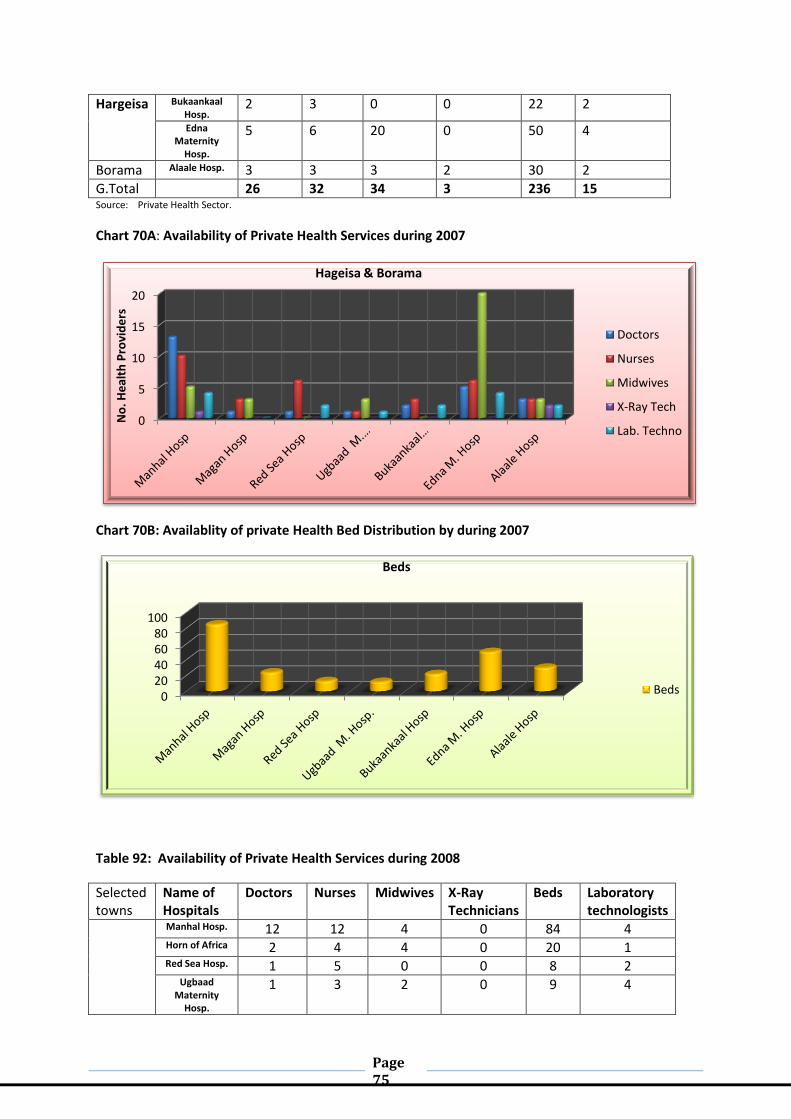
Page 75
Hargeisa Bukaankaal Hosp.
2 3 0 0 22 2
Edna Maternity
Hosp.
5 6 20 0 50 4
Borama Alaale Hosp. 3 3 3 2 30 2
G.Total 26 32 34 3 236 15 Source: Private Health Sector.
Chart 70A: Availability of Private Health Services during 2007
Chart 70B: Availablity of private Health Bed Distribution by during 2007
Table 92: Availability of Private Health Services during 2008
Selected towns
Name of Hospitals
Doctors Nurses Midwives X-Ray Technicians
Beds Laboratory technologists
Manhal Hosp. 12 12 4 0 84 4 Horn of Africa 2 4 4 0 20 1 Red Sea Hosp. 1 5 0 0 8 2
Ugbaad Maternity
Hosp.
1 3 2 0 9 4
0
5
10
15
20
No
. He
alth
Pro
vid
ers
Hageisa & Borama
Doctors
Nurses
Midwives
X-Ray Tech
Lab. Techno
0 20 40 60 80
100
Beds
Beds
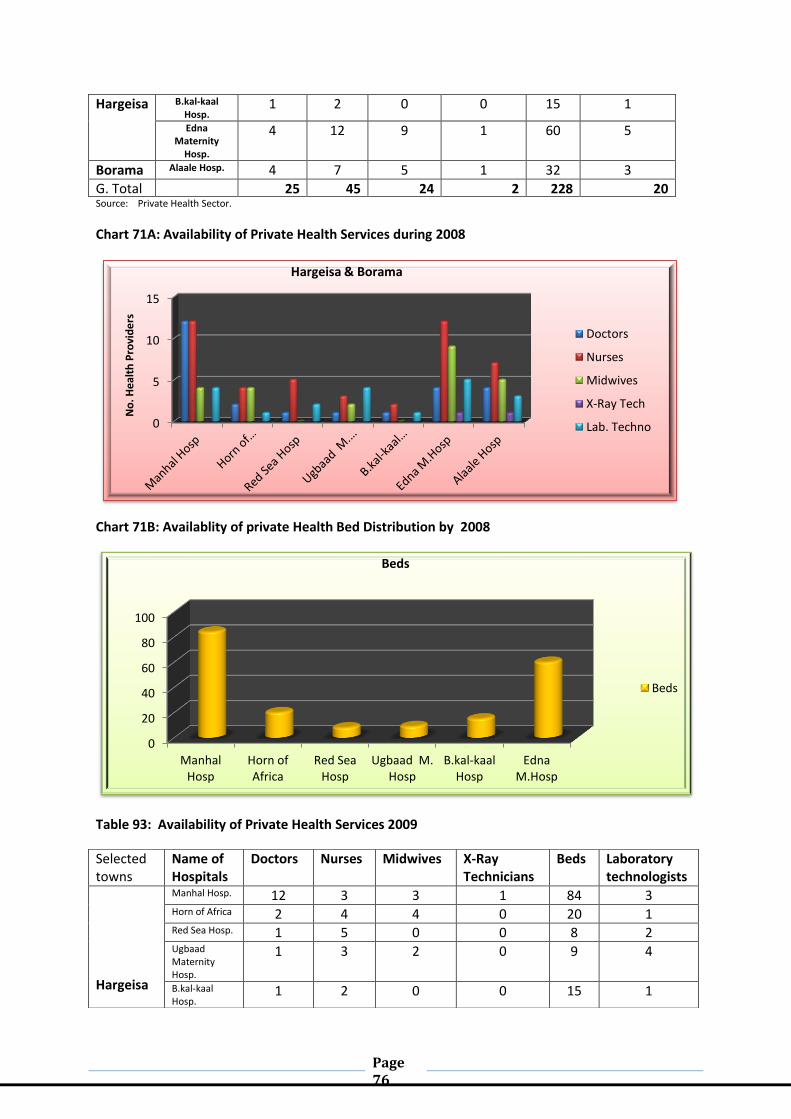
Page 76
Hargeisa B.kal-kaal Hosp.
1 2 0 0 15 1
Edna Maternity
Hosp.
4 12 9 1 60 5
Borama Alaale Hosp. 4 7 5 1 32 3
G. Total 25 45 24 2 228 20 Source: Private Health Sector.
Chart 71A: Availability of Private Health Services during 2008
Chart 71B: Availablity of private Health Bed Distribution by 2008
Table 93: Availability of Private Health Services 2009
0
5
10
15
No
. He
alth
Pro
vid
ers
Hargeisa & Borama
Doctors
Nurses
Midwives
X-Ray Tech
Lab. Techno
0
20
40
60
80
100
Manhal Hosp
Horn of Africa
Red Sea Hosp
Ugbaad M. Hosp
B.kal-kaal Hosp
Edna M.Hosp
Beds
Beds
Selected towns
Name of Hospitals
Doctors Nurses Midwives X-Ray Technicians
Beds Laboratory technologists
Hargeisa
Manhal Hosp. 12 3 3 1 84 3 Horn of Africa 2 4 4 0 20 1 Red Sea Hosp. 1 5 0 0 8 2 Ugbaad Maternity Hosp.
1 3 2 0 9 4
B.kal-kaal Hosp.
1 2 0 0 15 1
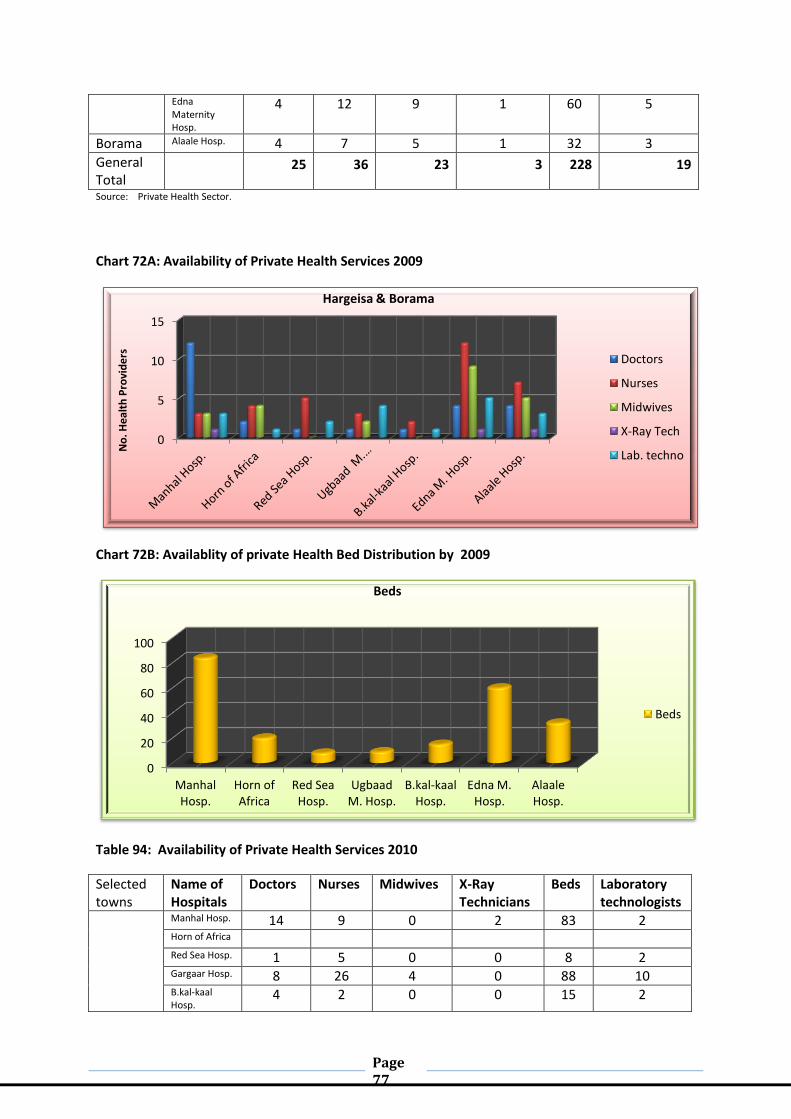
Page 77
Source: Private Health Sector.
Chart 72A: Availability of Private Health Services 2009
Chart 72B: Availablity of private Health Bed Distribution by 2009
Table 94: Availability of Private Health Services 2010
0
5
10
15
No
. He
alth
Pro
vid
ers
Hargeisa & Borama
Doctors
Nurses
Midwives
X-Ray Tech
Lab. techno
0
20
40
60
80
100
Manhal Hosp.
Horn of Africa
Red Sea Hosp.
Ugbaad M. Hosp.
B.kal-kaal Hosp.
Edna M. Hosp.
Alaale Hosp.
Beds
Beds
Edna Maternity Hosp.
4 12 9 1 60 5
Borama Alaale Hosp. 4 7 5 1 32 3
General Total
25 36 23 3 228 19
Selected towns
Name of Hospitals
Doctors Nurses Midwives X-Ray Technicians
Beds Laboratory technologists
Manhal Hosp. 14 9 0 2 83 2 Horn of Africa Red Sea Hosp. 1 5 0 0 8 2 Gargaar Hosp. 8 26 4 0 88 10 B.kal-kaal Hosp.
4 2 0 0 15 2

Page 78
Source: Private Health Sector.
Chart 73A: Availability of Private Health Services 2010
Chart 73B: Availablity of private Health Bed Distribution by 2010
0
10
20
30
No
. He
alth
Pro
vid
ers
Hargeisa & Borama
Doctors
Nurses
Midwives
X-Ray Tech.
Lab. Tech.
0
10
20
30
40
50
60
70
80
90
100
Manhal Hosp. Red Sea Hosp. Gargaar Hosp. B.kal-kaal Hosp. Edna M. Hosp. Allale Hosp. Amoud F. Hosp
Beds
Beds
Hargeisa
Edna M. Hosp. 5
12
8
0
69
6 Borama Allale Hospital
5 3 2 1 75 4
Amoud F. Hospital
11 21 3 2 100 2
General Total
48 78 17 5 448 28

Page 79
Table 95: Voluntary counselling and Test Data in six regions from 2006-2010
Health Facility M/jeeh Awdal Sahil Togdheer Sool Sanaag G.Total
2006
VCT Male 346 346 Female 337 337
Total 683 683
positive
Male 97 97
Female 145 145
Total 242 242
2007
VCT
VCT
Male 921 69 26 65 1081
Female 176 82 19 46 623
Total 1397 151 45 111 1704
positive
Male 101 24 13 30 168
Female 138 35 7 30 210
Total 239 59 20 60 378
2008
VCT
Male 653 179 271 128 1231
Female 486 146 228 136 996
Total 1139 325 499 264 2227
Positive
Male 112 22 65 34 233
Female 138 28 36 33 235
Total 250 50 101 67 468
2009
VCT
Male 796 149 252 165 150 1521
Female 651 155 298 171 114 1389
Total 1447 304 550 336 264 2901
Positive
Male 147 20 21 36 6 230
Female 175 17 30 34 2 258
Total 322 37 51 70 8 488
2010
VCT
Male 507 292 141 97 92 1146
Female 484 298 286 157 57 1314
Total 1271 590 427 254 149 2460
positive
Male 74 21 15 24 4 140
Female 126 26 18 39 1 210
Total 200 47 33 63 5 3521
G.Total
VCT
Male 3223 689 690 455 242 5316
Female 2434 681 831 510 171 4659
Total 5657 1370 1521 965 413 9975
positive
Male 531 87 114 124 10 868
Female 722 108 91 136 3 1062
Total 1253 193 205 260 13 1930
Source: AIDS Commission
Remarks:
Total number of VCT centers in the country in 2010 was 23.
Total number of health facilities capable of providing medical treatment for HIV infected persons
(ART centers) are 4 in the country which are Hargeisa, Borama, Berbera and Burao general Hospitals.
Total numbers of HIV patients receiving ART drugs in 2010 in Somaliland were 775 persons.
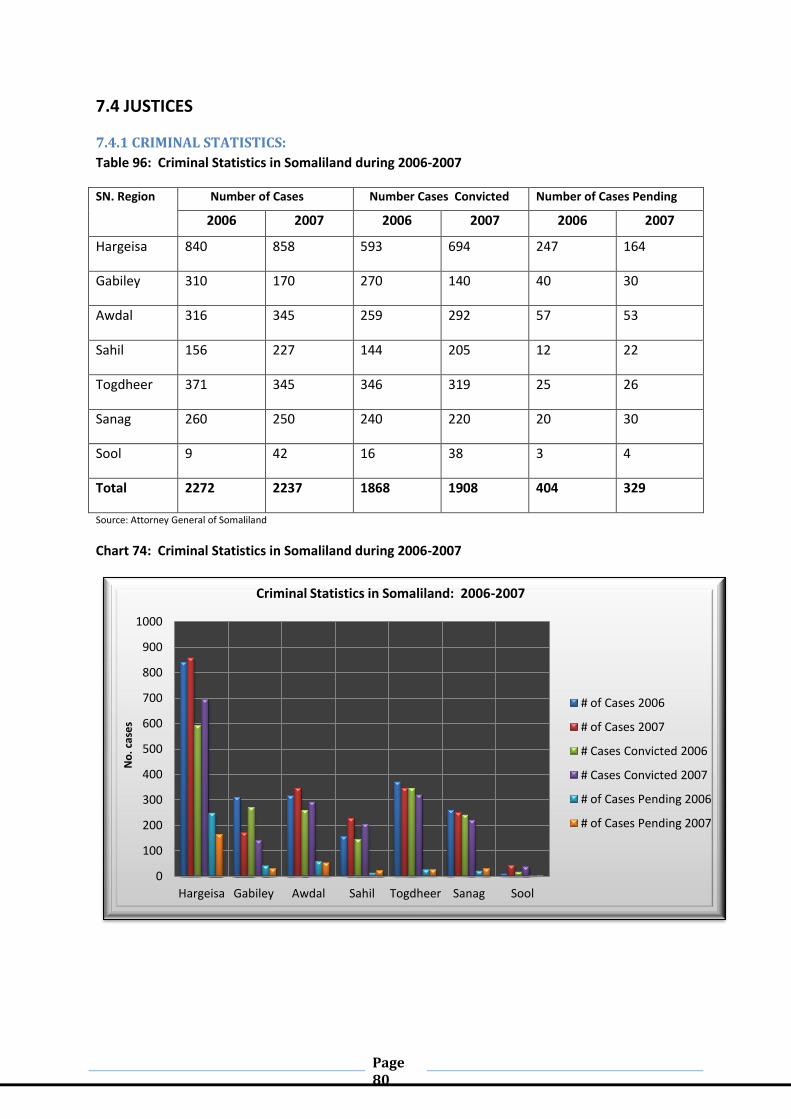
Page 80
7.4 JUSTICES
7.4.1 CRIMINAL STATISTICS:
Table 96: Criminal Statistics in Somaliland during 2006-2007
SN. Region Number of Cases Number Cases Convicted Number of Cases Pending
2006 2007 2006 2007 2006 2007
Hargeisa 840 858 593 694 247 164
Gabiley 310 170 270 140 40 30
Awdal 316 345 259 292 57 53
Sahil 156 227 144 205 12 22
Togdheer 371 345 346 319 25 26
Sanag 260 250 240 220 20 30
Sool 9 42 16 38 3 4
Total 2272 2237 1868 1908 404 329
Source: Attorney General of Somaliland
Chart 74: Criminal Statistics in Somaliland during 2006-2007
0
100
200
300
400
500
600
700
800
900
1000
Hargeisa Gabiley Awdal Sahil Togdheer Sanag Sool
No
. cas
es
Criminal Statistics in Somaliland: 2006-2007
# of Cases 2006
# of Cases 2007
# Cases Convicted 2006
# Cases Convicted 2007
# of Cases Pending 2006
# of Cases Pending 2007
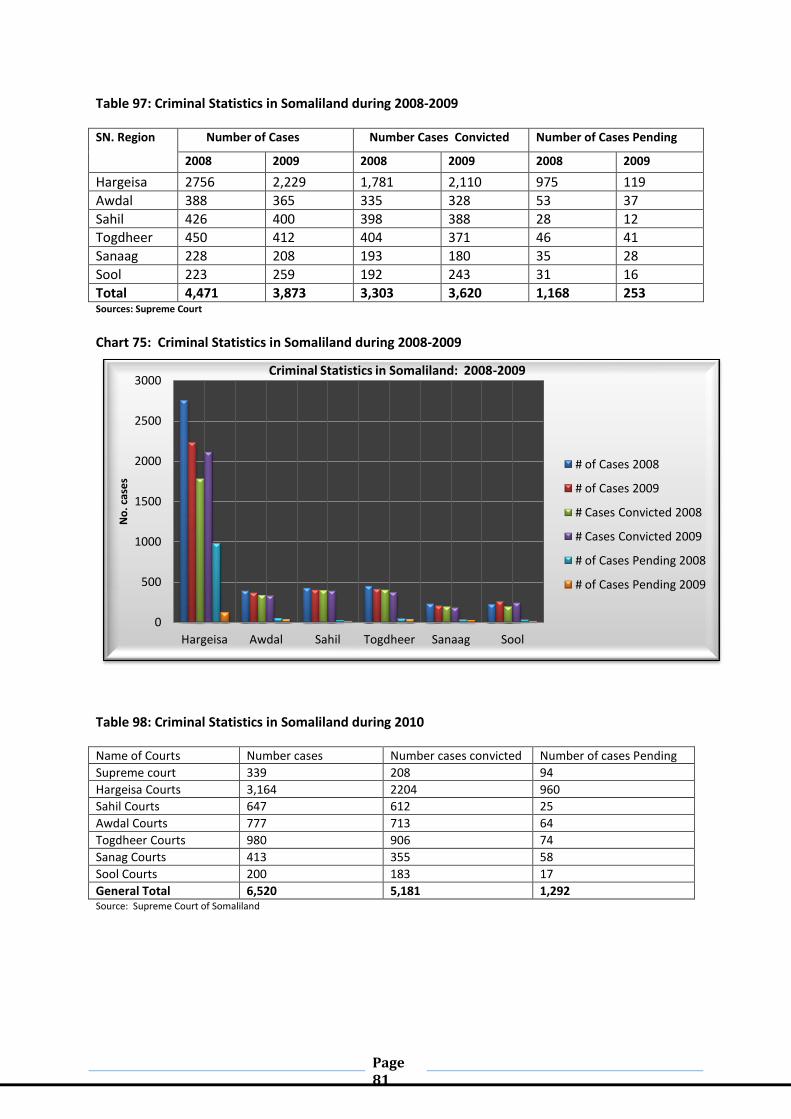
Page 81
Table 97: Criminal Statistics in Somaliland during 2008-2009
SN. Region Number of Cases Number Cases Convicted Number of Cases Pending
2008 2009 2008 2009 2008 2009
Hargeisa 2756 2,229 1,781 2,110 975 119
Awdal 388 365 335 328 53 37
Sahil 426 400 398 388 28 12
Togdheer 450 412 404 371 46 41
Sanaag 228 208 193 180 35 28
Sool 223 259 192 243 31 16
Total 4,471 3,873 3,303 3,620 1,168 253 Sources: Supreme Court
Chart 75: Criminal Statistics in Somaliland during 2008-2009
Table 98: Criminal Statistics in Somaliland during 2010
Name of Courts Number cases Number cases convicted Number of cases Pending
Supreme court 339 208 94
Hargeisa Courts 3,164 2204 960
Sahil Courts 647 612 25
Awdal Courts 777 713 64
Togdheer Courts 980 906 74
Sanag Courts 413 355 58
Sool Courts 200 183 17
General Total 6,520 5,181 1,292 Source: Supreme Court of Somaliland
0
500
1000
1500
2000
2500
3000
Hargeisa Awdal Sahil Togdheer Sanaag Sool
No
. cas
es
Criminal Statistics in Somaliland: 2008-2009
# of Cases 2008
# of Cases 2009
# Cases Convicted 2008
# Cases Convicted 2009
# of Cases Pending 2008
# of Cases Pending 2009
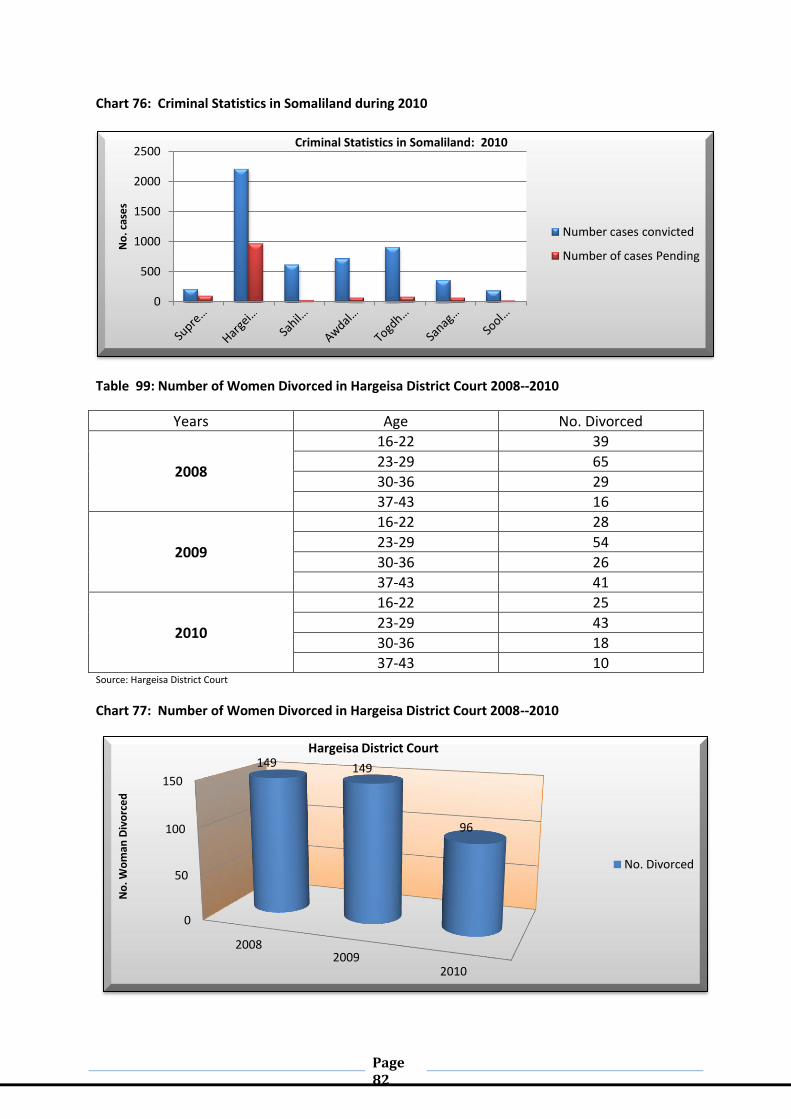
Page 82
Chart 76: Criminal Statistics in Somaliland during 2010
Table 99: Number of Women Divorced in Hargeisa District Court 2008--2010
Years Age No. Divorced
2008
16-22 39
23-29 65
30-36 29
37-43 16
2009
16-22 28
23-29 54
30-36 26
37-43 41
2010
16-22 25
23-29 43
30-36 18
37-43 10 Source: Hargeisa District Court
Chart 77: Number of Women Divorced in Hargeisa District Court 2008--2010
0
500
1000
1500
2000
2500
No
. cas
es
Criminal Statistics in Somaliland: 2010
Number cases convicted
Number of cases Pending
0
50
100
150
2008 2009
2010
149 149
96
No
. Wo
man
Div
orc
ed
Hargeisa District Court
No. Divorced
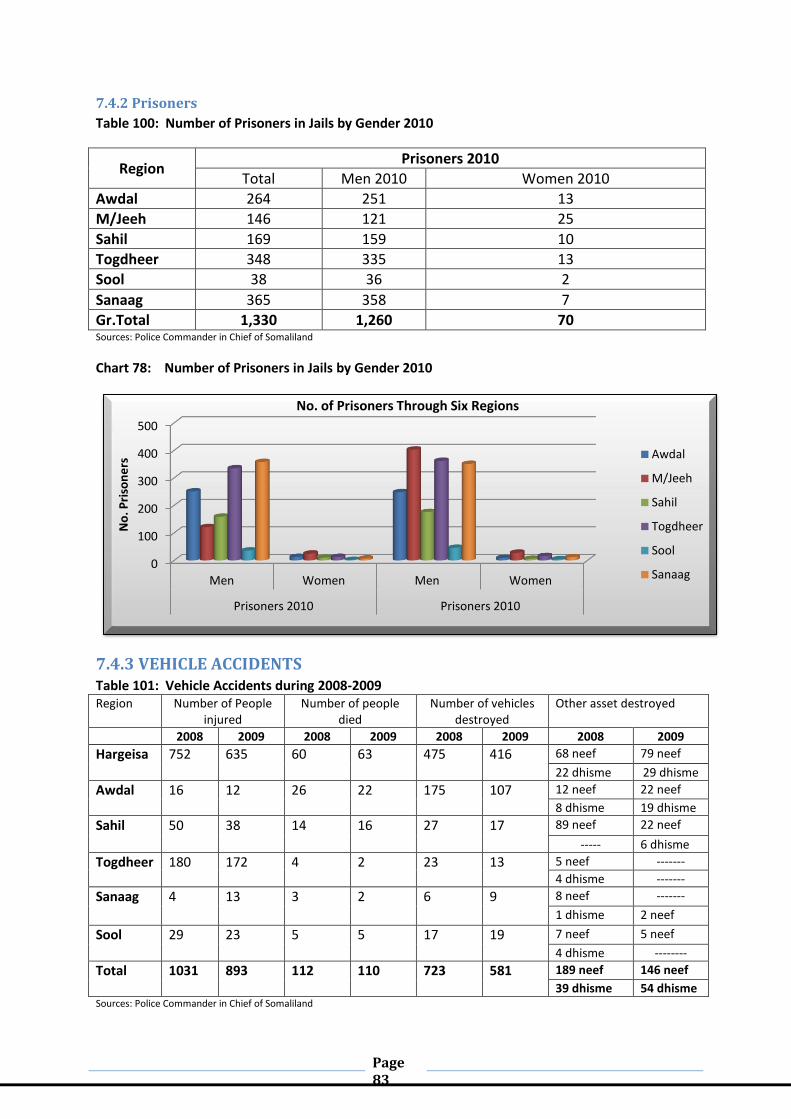
Page 83
7.4.2 Prisoners
Table 100: Number of Prisoners in Jails by Gender 2010
Region Prisoners 2010
Total Men 2010 Women 2010
Awdal 264 251 13
M/Jeeh 146 121 25
Sahil 169 159 10
Togdheer 348 335 13
Sool 38 36 2
Sanaag 365 358 7
Gr.Total 1,330 1,260 70 Sources: Police Commander in Chief of Somaliland
Chart 78: Number of Prisoners in Jails by Gender 2010
7.4.3 VEHICLE ACCIDENTS Table 101: Vehicle Accidents during 2008-2009 Region Number of People
injured Number of people
died Number of vehicles
destroyed Other asset destroyed
2008 2009 2008 2009 2008 2009 2008 2009
Hargeisa 752 635 60 63 475 416 68 neef 79 neef
22 dhisme 29 dhisme
Awdal 16 12 26 22 175 107 12 neef 22 neef
8 dhisme 19 dhisme
Sahil 50 38 14 16 27 17 89 neef 22 neef
----- 6 dhisme
Togdheer 180 172 4 2 23 13 5 neef -------
4 dhisme -------
Sanaag 4 13 3 2 6 9 8 neef -------
1 dhisme 2 neef
Sool 29 23 5 5 17 19 7 neef 5 neef
4 dhisme --------
Total 1031 893 112 110 723 581 189 neef 146 neef
39 dhisme 54 dhisme Sources: Police Commander in Chief of Somaliland
0
100
200
300
400
500
Men Women Men Women
Prisoners 2010 Prisoners 2010
No
. Pri
son
ers
No. of Prisoners Through Six Regions
Awdal
M/Jeeh
Sahil
Togdheer
Sool
Sanaag
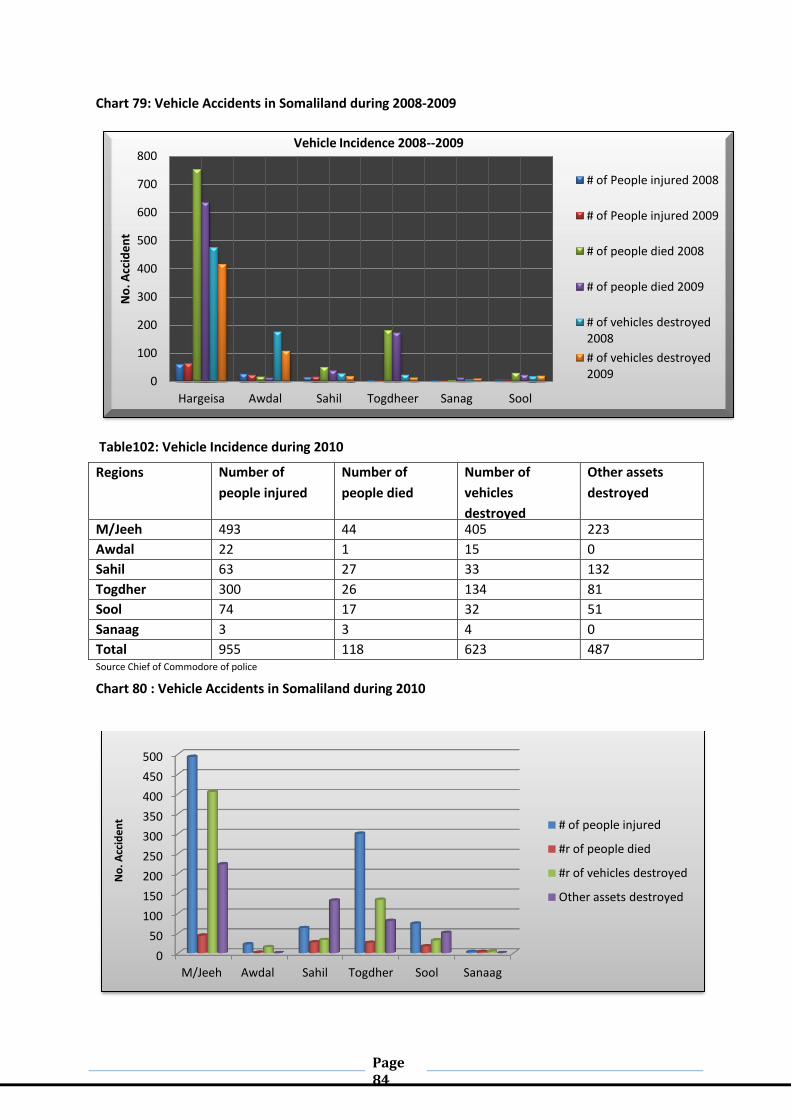
Page 84
Chart 79: Vehicle Accidents in Somaliland during 2008-2009
Table102: Vehicle Incidence during 2010
Regions Number of
people injured
Number of
people died
Number of
vehicles
destroyed
Other assets
destroyed
M/Jeeh 493 44 405 223
Awdal 22 1 15 0
Sahil 63 27 33 132
Togdher 300 26 134 81
Sool 74 17 32 51
Sanaag 3 3 4 0
Total 955 118 623 487 Source Chief of Commodore of police
Chart 80 : Vehicle Accidents in Somaliland during 2010
0
100
200
300
400
500
600
700
800
Hargeisa Awdal Sahil Togdheer Sanag Sool
No
. Acc
ide
nt
Vehicle Incidence 2008--2009
# of People injured 2008
# of People injured 2009
# of people died 2008
# of people died 2009
# of vehicles destroyed 2008
# of vehicles destroyed 2009
0
50
100
150
200
250
300
350
400
450
500
M/Jeeh Awdal Sahil Togdher Sool Sanaag
No
. Acc
ide
nt # of people injured
#r of people died
#r of vehicles destroyed
Other assets destroyed
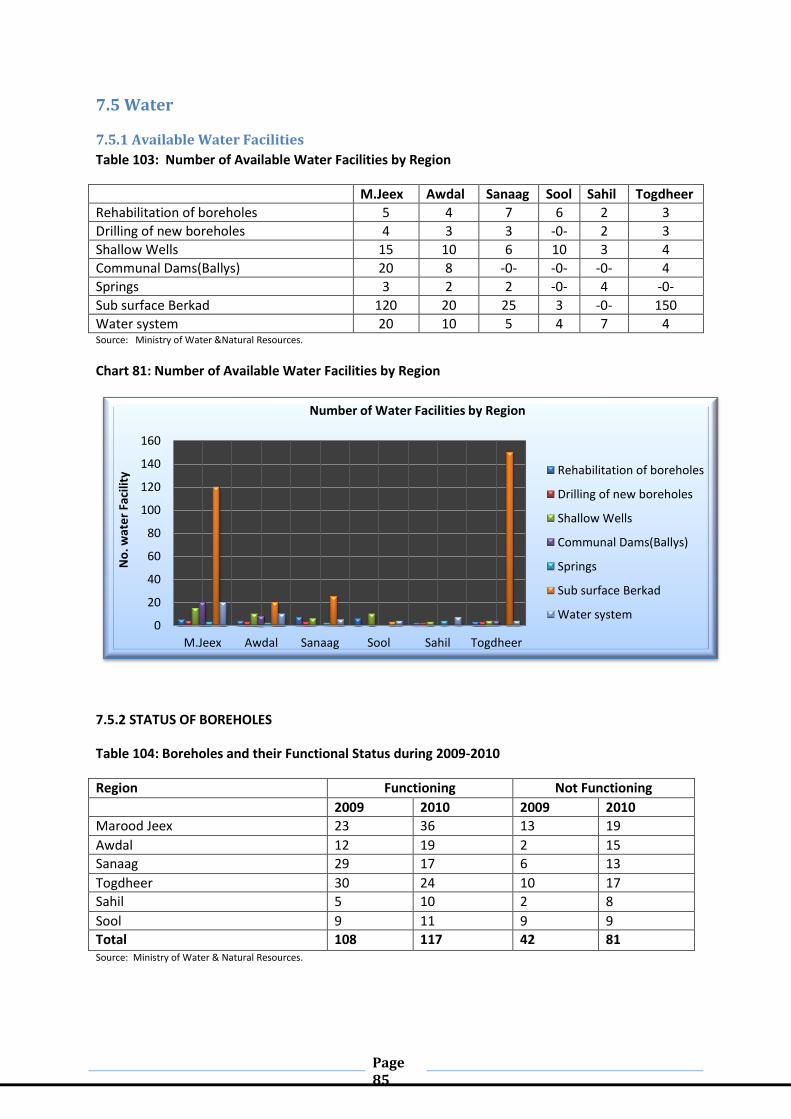
Page 85
7.5 Water
7.5.1 Available Water Facilities
Table 103: Number of Available Water Facilities by Region
M.Jeex Awdal Sanaag Sool Sahil Togdheer
Rehabilitation of boreholes 5 4 7 6 2 3
Drilling of new boreholes 4 3 3 -0- 2 3
Shallow Wells 15 10 6 10 3 4
Communal Dams(Ballys) 20 8 -0- -0- -0- 4
Springs 3 2 2 -0- 4 -0-
Sub surface Berkad 120 20 25 3 -0- 150
Water system 20 10 5 4 7 4 Source: Ministry of Water &Natural Resources.
Chart 81: Number of Available Water Facilities by Region
7.5.2 STATUS OF BOREHOLES
Table 104: Boreholes and their Functional Status during 2009-2010
Region Functioning Not Functioning
2009 2010 2009 2010
Marood Jeex 23 36 13 19
Awdal 12 19 2 15
Sanaag 29 17 6 13
Togdheer 30 24 10 17
Sahil 5 10 2 8
Sool 9 11 9 9
Total 108 117 42 81 Source: Ministry of Water & Natural Resources.
0
20
40
60
80
100
120
140
160
M.Jeex Awdal Sanaag Sool Sahil Togdheer
No
. wat
er
Faci
lity
Number of Water Facilities by Region
Rehabilitation of boreholes
Drilling of new boreholes
Shallow Wells
Communal Dams(Ballys)
Springs
Sub surface Berkad
Water system

Page 86
Chart 82: Functioning and Not Functioning Boreholes in Somaliland during 2009-2010
Table 105: Exchange Rate of $1 into Somaliland Shillings SH. (Sh.Sl)
Year Selling Buying
2007 6286 6151
2008 6168 6094
2009 6749 6692
2010 6422 6356
Chart 83: Exchange rate of $1 into Somaliland shillings SH.
0
10
20
30
40
2009 2010 2009 2010
Functioning Not Functioning
No
. bo
reh
ole
s
Marood Jeex
Awdal
Sanaag
Togdheer
5600
5800
6000
6200
6400
6600
6800
2007 2008 2009 2010
Buying
Selling
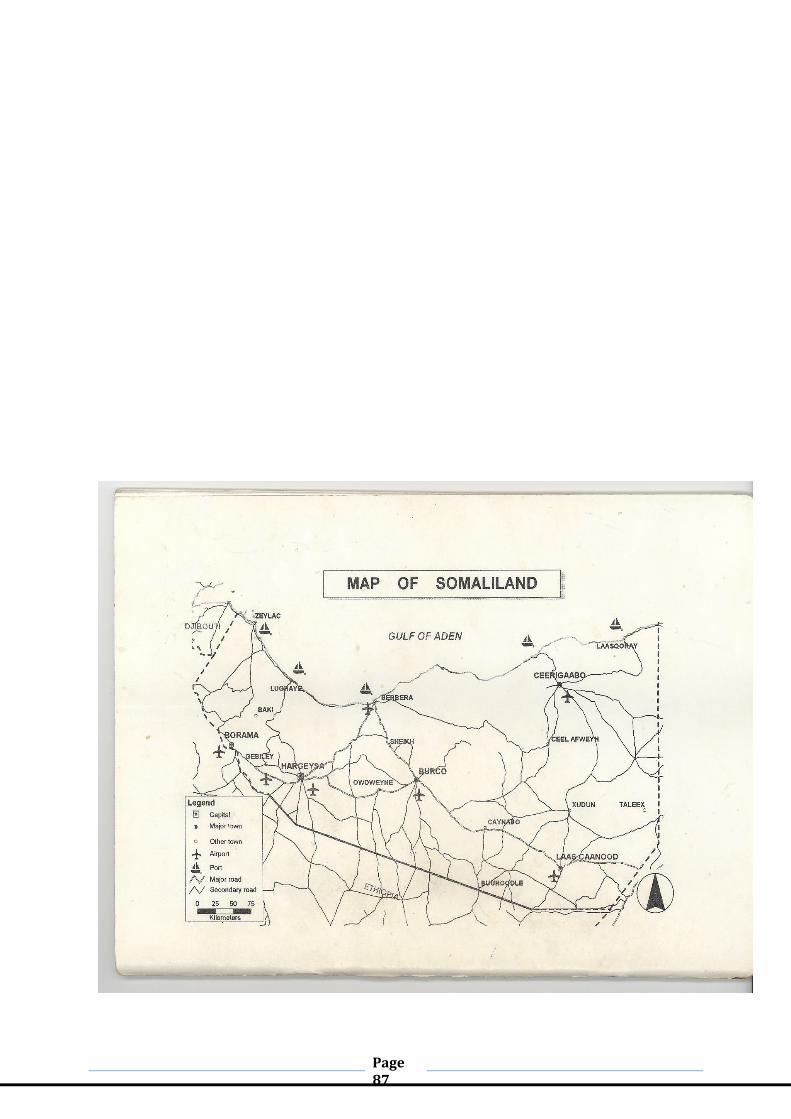
Page 87
Related Documents


![m a t o l o g y & Weat li her Journal of f o re l a n r u ......Somaliland unproductive and is spreading at an alarming rate [6]. Land Use In Somaliland, land is mainly used for livestock](https://static.cupdf.com/doc/110x72/5e6b916fe3184c3ae26ee416/m-a-t-o-l-o-g-y-weat-li-her-journal-of-f-o-re-l-a-n-r-u-somaliland.jpg)


