I I I I I I SOLVING SLUDGE BULKING PROBLEMS THROUGH FILAMENTOUS ORGANISM IDENTIFICATIONi CASE STUDIES IN MASSACHUSETTS t* 89- ° I I I I I A Master's Project • Presented by • THOMAS RICHARD PLANTB i i i I Submitted to the Department of Civil Engineering of the University of Massachusetts in partial fulfillment • of the requirements forthe degree of " MASTER OF SCIENCE in Environmental Engineering May 1990 Department of Civil Engineering

Welcome message from author
This document is posted to help you gain knowledge. Please leave a comment to let me know what you think about it! Share it to your friends and learn new things together.
Transcript

II
IIII
SOLVING SLUDGE BULKING PROBLEMS THROUGH FILAMENTOUS ORGANISMIDENTIFICATIONi CASE STUDIES IN MASSACHUSETTS
t* 89- °IIIII
A Master's Project
• Presented by
• THOMAS RICHARD PLANTB
iiiI Submitted to the Department of Civil Engineering of the
University of Massachusetts in partial fulfillment• of the requirements for the degree of
" MASTER OF SCIENCEin
Environmental Engineering
May 1990
Department of Civil Engineering
IIIIIIIIIIIIIIIIIII
SOLVING SLUDGE BULKING PROBLEMS THROUGH FILAMENTOUS ORGANISMIDENTIFICATION: CASE STUDIES IN MASSACHUSETTS
A Master's Project
Presented by
THOMAS RICHARD PLANTE
Approved as to style and content by
Dr. Michael S. Switzenbaura,Chairperson
aDr. David A. Reckhow, Member
John E. Tobiason, Member
.Dr. UiTliam H. HighterDepartment HeadDepartment of Civil Engineering
II" ACKNOWLEDGEMENTS
iI This research was supported by the Research and Demonstration
_ Program of the Massachusetts Division of Water Pollution Control
• (Project Number 88-08). The assistance of the TATS group of the DEP
• Training Center in Milbury is also acknowledged.
I wish to thank Dr. Michael S. Switzenbaum, my research and
• academic advisor, for his endless support and guidance, as well as Dr.
John Tobiason and Dr. David Reckhow for serving on my committee. I also
iiiiiiiiii
extend my appreciation to the plant personnel who provided assistance
and plant operating data for the case studies.
111

IIII
ABSTRACT
In the past decade, a significant amount of research effort has
been directed towards understanding the nature and causes of activated•
sludge filamentous bulking and its control. In particular, the
• relationships between filament types and causative conditions have been
established for a number of organisms. Filamentous organism
• identification and bulking control manuals have been developed and are
available for use by treatment plant staff .
I The goals of this research include further substantiation of the
• filament type-cause relationship through case studies and an evaluation
of the applicability of the identification methods for use by treatment
• plant staff for bulking control. Six activated sludge plants in
Massachusetts experiencing filamentous bulking problems were studied.
| The dominant filamentous organisms were identified to determine probable
_ causative conditions. Plant operating data were also analyzed to
• substantiate the organism- cause relationship. Remedial actions were
• suggested and most of those plants which implemented the suggested
control measures were successful in eliminating the bulking problem.
• It wa* found that although long term monitoring of the activated
sludge filamentous organisms and floe structure is beneficial to process
| control, most plants do not have the resources available to implement
• the procedures. For a plant to obtain the necessary equipment, supplies
and training, it will cost approximately 94135. Through the case
ii IV
III studies, it has been shown that in most situations, one sample of the
• activated sludge analyzed during a bulking episode can yield the
necessary information to determine the probable cause of bulking and
| evaluate remedial alternatives.
mm Mail in services for filament identification exist and are
relatively inexpensive, but the turnaround time for results is 1-2
I weeks. It is suggested that regional or statewide technical assistance
groups such as TATS in Massachusetts incorporate filamentous organism
• identification and bulking control expertise in their services to
provide local, cost effective assistance to individual plants.
iiiiiiiiii

III
TABLE OP CONTENTS
iiiiiiiii
ACKNOWLEDGEMENTS iii
ABSTRACT iv
LIST OF TABLES vii
LIST OF FIGURES viii
ChapterI. INTRODUCTION 1
II. LITERATURE REVIEW 8
III. MATERIALS AND METHODS 18
3.1 Wastewater Treatment Facility Survey 183.2 Sampling 183.3 Organism Identification Procedure 19
IV. RESULTS AND DISCUSSION 25
V. CASE STUDIES 395.1 Plant A - Low F/M 395.2 Plant B - Phosphorous Deficiency 515.3 Plant C - Low F/M, Low DO 635.4 Plant D - Low F/M, Nutrient Deficiency 72
1 5.5 Plant E - Phosphorous Deficiency 855.8 Plant F - Nutrient Deficiency 91
VI. CONCLUSIONS AND RECOMMENDATIONS 99
I REFERENCES 102
iiiii
APPENDICES 109I. LIST OF SYMBOLS 109II. STAINING PROCEDURES 110
VI

LIST OF TABLES
IIIII Table Page
I I. The Magnitude of the Bulking Problem in PlantsTreating Domestic Waste water 2
2. Suggested Causes of Filamentous Bulking 10
• 3. Proposed Mechanisms of Filamentous OrganismPredominance 11
• 4. Dominant Filamentous Types as Indicators ofConditions Causing Sludge Bulking 12
I 5. Selective Control Strategies 17
6. Subjective Scoring of Filament Abundance 20
| 7. Summary of Typical Morphological and StainingCharacteristics 23
I 8. Evaluation of Identification Techniques 26
9. Organic Loading of Activated Sludge and• Predominant Higher Life Forms Observed 34
10. Cost Estimate to Implement Filamentous Organism• Identification Program 35
m 11. Massachusetts Filamentous Bulking Case Studies . 38
• 12. Plant B Monthly Average Discharge Concentrations 53
II-l. Graa Stain Procedure 110
• II-2. Neiaaer Stain Procedure Ill
II-3. Sulfur Oxidation Test Procedure 112
I II-4. India Ink Reverse Stain Procedure 113
• II-5. Polyhydroxybutyrate (PHB) Stain Procedure 114
II-6. Crystal Violet Sheath Stain Procedure 115
iVll

IIII
II
LIST OF FIGURES
I Figure Page
_ 1. Filament Effect on Floe Structure 8
™ 2. Dichotomous Key for Filamentous Organism"Identification" in Activated Sludge 22
3. Page 1 Modified Identification Procedure 28
4. Page 2 Modified Identification Procedure 29
5. Page 3 Modified Identification Procedure 30
I 6. Page 4 Modified Identification Procedure 31
7. Relative Abundance of Protozoan Groups and• Activated Sludge Process Conditions 33
8. Plant A Flow Configuration 40
I 9. Plant A Influent Flow Variations 41
10. Plant A Abundance of Nocardia sp 44
| 11. Plant A Abundance of Micothrix parvicella .44
_ 12. Plant A Operating Data 45
' 13. Plant A Selector Configuration 50
• 14. Plant B Flow Configuration 52
15. Plant B Interfloe Bridging by Nostocoida limicola II 56
I 18. Plant B Filament Abundance and Floe Structure 58
17. Plant B Operating Data 58
| 18. Plant B Filament Abundance and Floe StructureAfter Remedial Action 61
I 19. Plant C Flow Configuration 64
20. Plant C Foaming on Aeration Basin 68
i Vlll
II
LIST OF FIGURES (continued)
iI 21. Plant C Abundance of Micothrix parvicella and
Type 0041 ................................................... 69
I 22. Plant C Floe Morphology ....................................... 69
23. Plant C Operating Data ........................................ 70
24. Plant D Flow Configuration .................................... 73
25. Plant D Filament Abundance and Floe Structure1 . an a- Sample 1
iiiii
75
26. Plant D Filament Abundance and Floe Structure• - Sample 2 75
27. Plant D Operating Data 77
| 28. Plant D Plug Flow Configuration 79
29. Plant D SVI Data 81
• 30. Plant D Selector Configuration 83
• 31. Plant E Flow Conf iguratioa 88
32. Plant E Operating Data 88
I 33. Plant F Flow Configuration 92
34. Plant F Operating Data 93
35. Plant P Abundance of Sphaerotilus natana andThlothrix sp 96
IX

ii
CHAPTER I
INTRODUCTION
IIIII• The activated sludge process is the most commonly used process for
the secondary treatment of domestic wastewater (Me tea If ft Eddy, 1979).
• It is flexible, due to the ease of process modifications, reliable, and
over 75 years of design and operation experience exists worldwide. The
| process consists of two unit operations: aeration and clarification.
_ Aeration provides an aerobic environment for the oxidation and
™ assimilation of organic matter. The function of clarification is to
• provide for the gravity separation of flocculated solids and
microorganisms from the effluent and thickening of the solids for return
• to the aeration tank to maintain sufficient bacterial mass and sludge
age.
• Solids separation is the primary factor controlling the performance
• of the activated sludge process. Insufficient compaction and settling
of the sludge is generally considered a "bulking1 problem. It can be
I induced by an abundance of filamentous organisms, lack of filamentous
organio* mod a dispersed floe structure, the metabolic state of the
J organisms and the hydraulics of the secondary clarifier due to either
design or operational problems.
B As shown in Table 1, the bulking problem is quite common among
• plants treating domestic wastewater. Activated sludge plants treating
industrial wastes such as food processing or paper mill wastes will

IIIIIIIIIIIIIIIIIII
Table 1: The Magnitude of the Bulking Problem in Plants TreatingDomestic Wastewater
Location % A-S Plants Bulking Source
West Germany
United Kingdom
South Africa
Netherlands
United States
—Masaachusetts
45
63
56
40-50
50
60
Wagner, 1982
Tomlinson, 1982
Blackboard et al., 1986
Eikelboom, 1982
Eikelboom, 1982
Woodworth, 1989
II
3
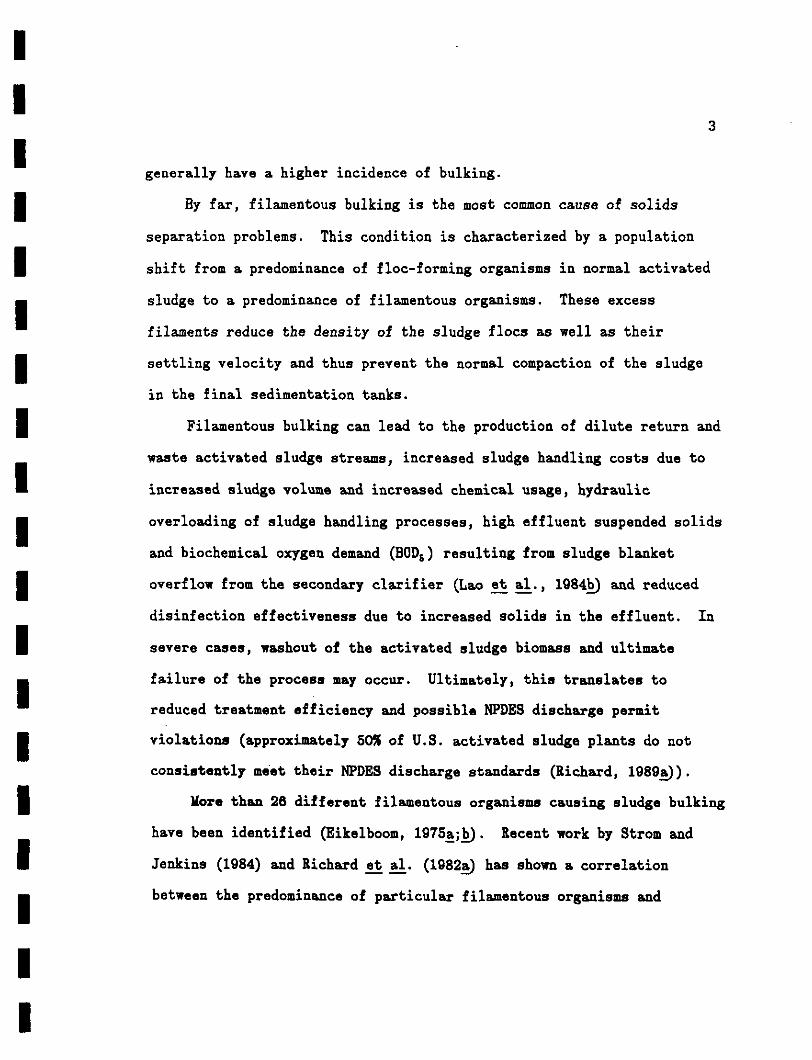
generally have a higher incidence of bulking.
• By far, filamentous bulking is the most common cause of solids
separation problems. This condition is characterized by a population
I shift from a predominance of floe-forming organisms in normal activated
• sludge to a predominance of filamentous organisms. These excess
filaments reduce the density of the sludge floes as well as their
• settling velocity and thus prevent the normal compaction of the sludge
in the final sedimentation tanks.
I Filamentous bulking can lead to the production of dilute return and
waste activated sludge streams, increased sludge handling costs due to
I increased sludge volume and increased chemical usage, hydraulic
• overloading of sludge handling processes, high effluent suspended solids
and biochemical oxygen demand (BODS) resulting from sludge blanket
• overflow from the secondary clarifier (Lao et al., 1984b) and reduced
disinfection effectiveness due to increased solids in the effluent. In
| severe cases, washout of the activated sludge biomass and ultimate
M failure of the process may occur. Ultimately, this translates to
m reduced treatment efficiency and possible NPDES discharge permit
• violations (approximately 50% of U.S. activated sludge plants do not
consistently meet their NPDES discharge standards (Richard, 1989a)).
• Uore than 26 different filamentous organisms causing sludge bulking
have been identified (Eikelboom, 1975a;b). Recent work by Strom and
iiI
Jenkins (1984) and Richard et al. (1982a) has shown a correlation
between the predominance of particular filamentous organisms and

II
4
specific operational conditions (low DO, low F/M, etc.) causing the
• bulking situation.
Although the associations of waste treatment parameters with
| filamentous organisms are not 100% accurate, identification of the
M dominant filamentous organisms in a bulking sludge aids the plant
operator in determining which operational parameters to look at first so
I that proper corrective strategies can be implemented to eliminate the
cause of the filamentous organism predominance and control their growth.
• Microscopic investigation of activated sludge is a simple analysis
which gives information about the form and structure of floes, the
• presence of filamentous microorganisms, the numbers and types of
• protozoa, etc. Regular microscopic investigation of the sludge
contributes to a better insight into the composition and structure of
• the sludge floe and through this into the functioning of the activated
sludge process.
| This research was undertaken with the following objectives:
• 1. To determine the cause(s) of filamentous bulking at
several activated sludge plants in Massachusetts
• through filamentous organism identification.
2. To determine if plant operating data support what the
• organism identification suggests is the cause(s) of
the problem.
I ' 3. To determine possible remedial actions based on organ-
m ism identification and data analysis.
4. To evaluate the ease of implementation of the identi-
ii
II
5
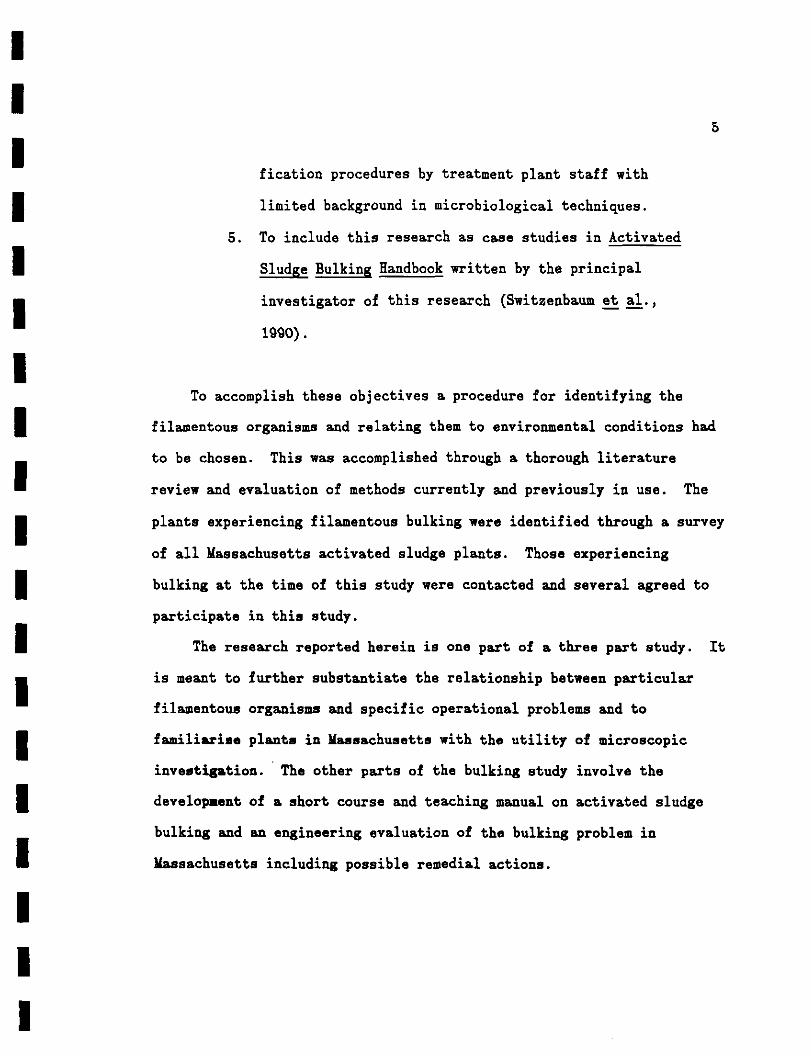
fication procedures by treatment plant staff with
• limited background in microbiological techniques.
5. To include this research as case studies in Activated
• Sludge Bulking Handbook written by the principal
• investigator of this research (Switzenbaum et al.,
1990).
iTo accomplish these objectives a procedure for identifying the
| filamentous organisms and relating them to environmental conditions had
_ to be chosen. This was accomplished through a thorough literature
' review and evaluation of methods currently and previously in use. The
• plants experiencing filamentous bulking were identified through a survey
of all Massachusetts activated sludge plants. Those experiencing
• bulking at the time of this study were contacted and several agreed to
participate in this study.
| The research reported herein is one part of a three part study. It
mm is meant to further substantiate the relationship between particular
filamentous organisms and specific operational problems and to
I familiarise plants in Massachusetts with the utility of microscopic
investigation. The other parts of the bulking study involve the
• development of a short course and teaching manual on activated sludge
bulking and an engineering evaluation of the bulking problem in
• Massachusetts including possible remedial actions.
iii
I6
• CHAPTER II
• LITERATURE REVIEW
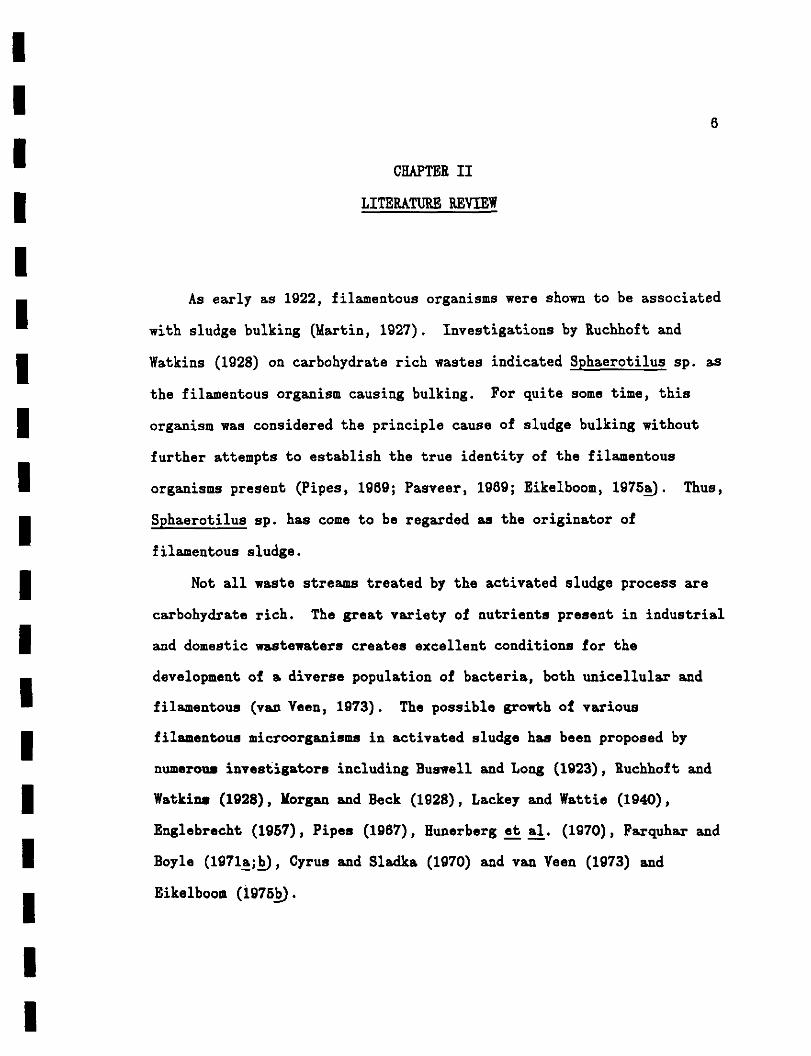
i_ As early as 1922, filamentous organisms were shown to be associated
with sludge bulking (Martin, 1927). Investigations by Ruchhoft and
• Watkins (1928) on carbohydrate rich wastes indicated Sphaerotilus sp. as
the filamentous organism causing bulking. For quite some time, this
I organism was considered the principle cause of sludge bulking without
further attempts to establish the true identity of the filamentous
• organisms present (Pipes, 1969; Pasveer, 1969; Eikelboom, 1975a). Thus,
• Sphaerotilus sp. has come to be regarded as the originator of
filamentous sludge.
I Not all waste streams treated by the activated sludge process are
carbohydrate rich. The great variety of nutrients present in industrial
| and domestic wastewatera creates excellent conditions for the
_ development of a diverse population of bacteria, both unicellular and
' filamentous (van Veen, 1973). The possible growth of various
• filamentous microorganisms in activated sludge has been proposed by
numerous investigators including Buswell and Long (1923), Ruchhoft and
I Watkins (1928), Morgan and Beck (1928), Lackey and Wattie (1940),
Englebrecht (1957), Pipes (1967), Hunerberg et al. (1970), Parquhar and
I Boyle (1971a;b), Cyrus and Sladka (1970) and van Veen (1973) and
• Eikelboom (1975b).
ii

I7
The filamentous bacteria are characterized by their thread-like
• appearance caused by repeated divisions of their component cells in one
plane. Filamentous bacteria are necessary as a backbone providing
| structure to the floes (See Figure la). However, an abundance of
« filamentous bacteria is characterized by filaments extending from the
™ floes (Figure Ib) and free floating in the mixed liquor. Depending on
• the type of filament involved, two forms of interference in settling and
compaction exist:
I (1) interfloc bridging, where filaments extend from the floe
surface and hold the floes apart, and
• (2) open floe structure, where the filaments grow mostly within
• the floe and the floe grows attached to the filaments. Here
the floe becomes large, irregularly shaped and contains
• substantial internal voids.
With the growing interest in sludge settlability problems, an
| operational parameter, the sludge volume index (SYI), was developed to
_ describe the settling characteristics of sludge (Mohlman, 1934). It is
' calculated by dividing the 30-minute settled volume of activated
• sludge in a one liter cylinder by the mixed liquor suspended solids
concentration (ULSS) (Pipes, 1967) and ia reported as ml/g. Various
• researchers define what the SVI of a "normal" sludge should be and what
the SVI of a bulking sludge is. Every wastewater as well as every
| treatment facility is different and the SVI cannot be used to
_ quantitatively predict the performance of settling basins. It is,
• however, a useful operational tool and provides a convenient test for
ii

IIIIIIIIIIIIIIIIIII
a) 1. FIAMENTOUS ORGANISMS AND FLOC
FORMWa ORGANISMS M BALANCE
2. STRONG, LARGE FLOC
a. FIAMENTS DO NOT INTERFERE
4. CLEAR SUPERNATANT
5. LOW 8VI
FILAMENT BACKBONE
b) 1. FILAMENTOUS ORGANISMS PREDOMINANT
2. STRONG . LARGE FLOC
RE WITH SETTLING/rAWiKjn
EXTENDED FILAMENT
3. FILAMENTS WTICOMPACTION
4. CLEAR SUPERNATANT
FILAMENT BACKBONE
Figure V: Filament Effect on Floe Structure (Jenkins et a]_., 1986)
II
9
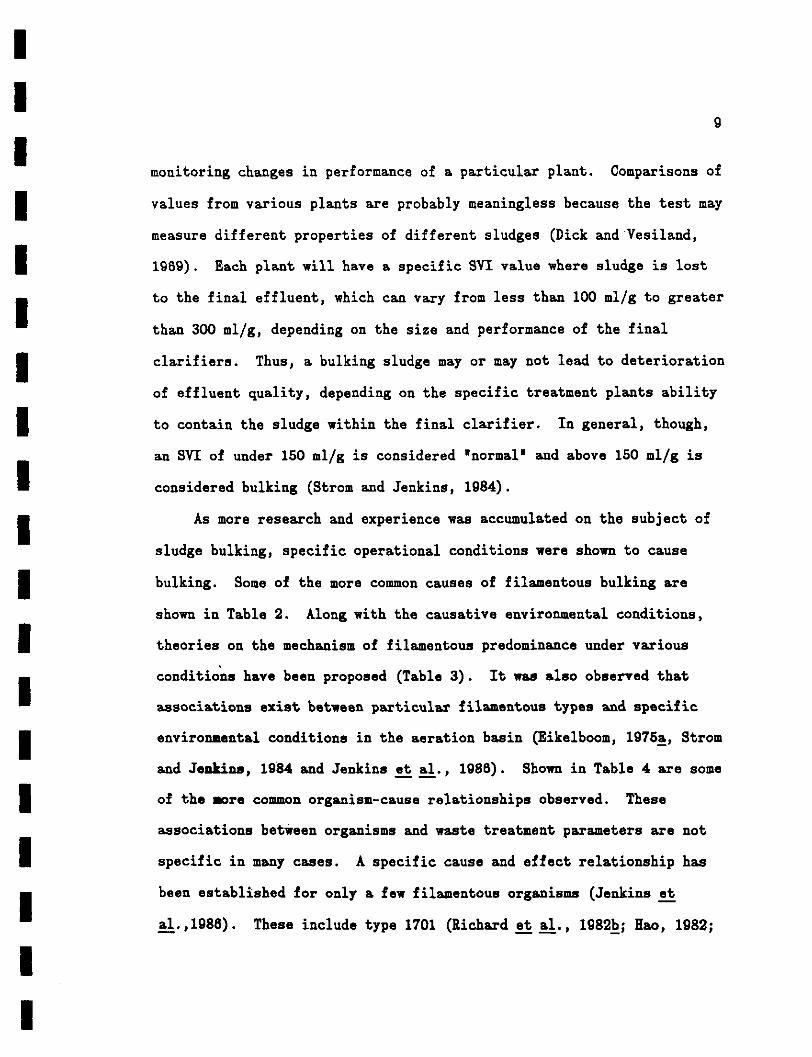
monitoring changes in performance of a particular plant* Comparisons of
• values from various plants are probably meaningless because the test may
measure different properties of different sludges (Dick and Vesiland,
| 1989). Each plant will have a specific SVI value where sludge is lost
_ to the final effluent, which can vary from less than 100 ml/g to greater
than 300 ml/g, depending on the size and performance of the final
I clarifiers. Thus, a bulking sludge may or may not lead to deterioration
of effluent quality, depending on the specific treatment plants ability
I to contain the sludge within the final clarifier. In general, though,
an SVI of under 150 ml/g is considered "normal" and above 150 ml/g is
• considered bulking (Strom and Jenkins, 1984).
• As more research and experience was accumulated on the subject of
sludge bulking, specific operational conditions were shown to cause
• bulking. Some of the more common causes of filamentous bulking are
shown in Table 2. Along with the causative environmental conditions,
| theories on the mechanism of filamentous predominance under various
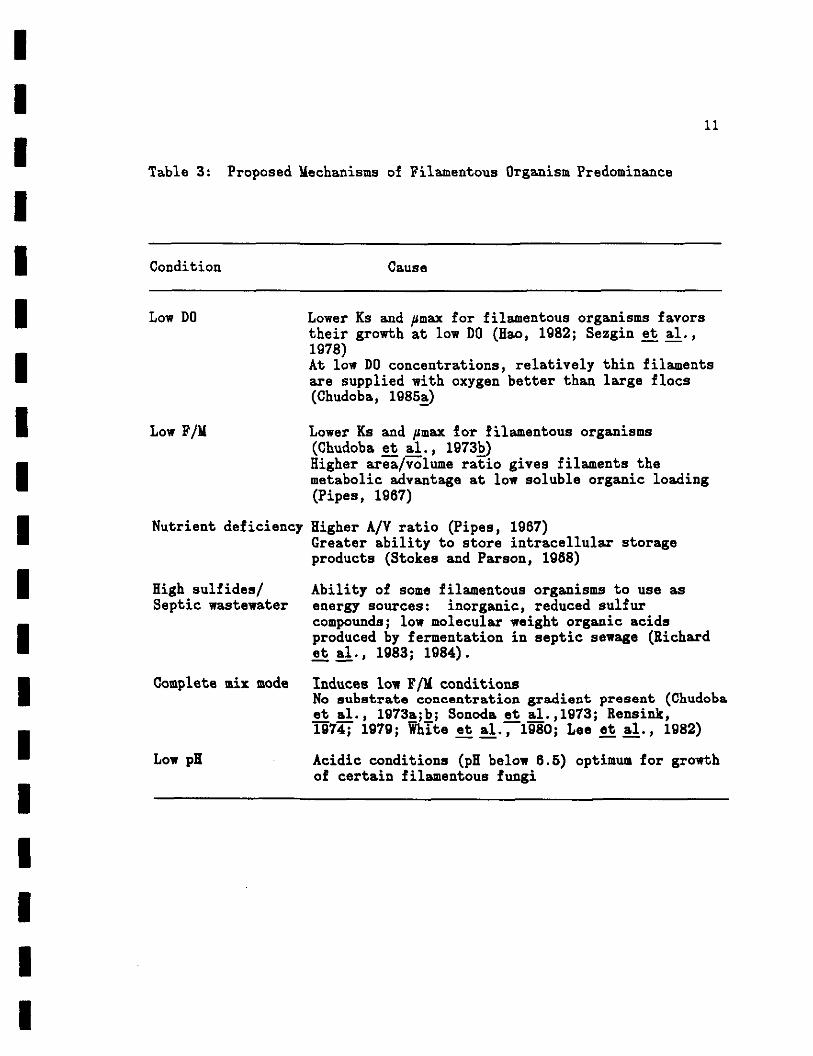
_ conditions have been proposed (Table 3). It was also observed that
• associations exist between particular filamentous types and specific
• environmental conditions in the aeration basin (Eikelboom, 1975a, Strom
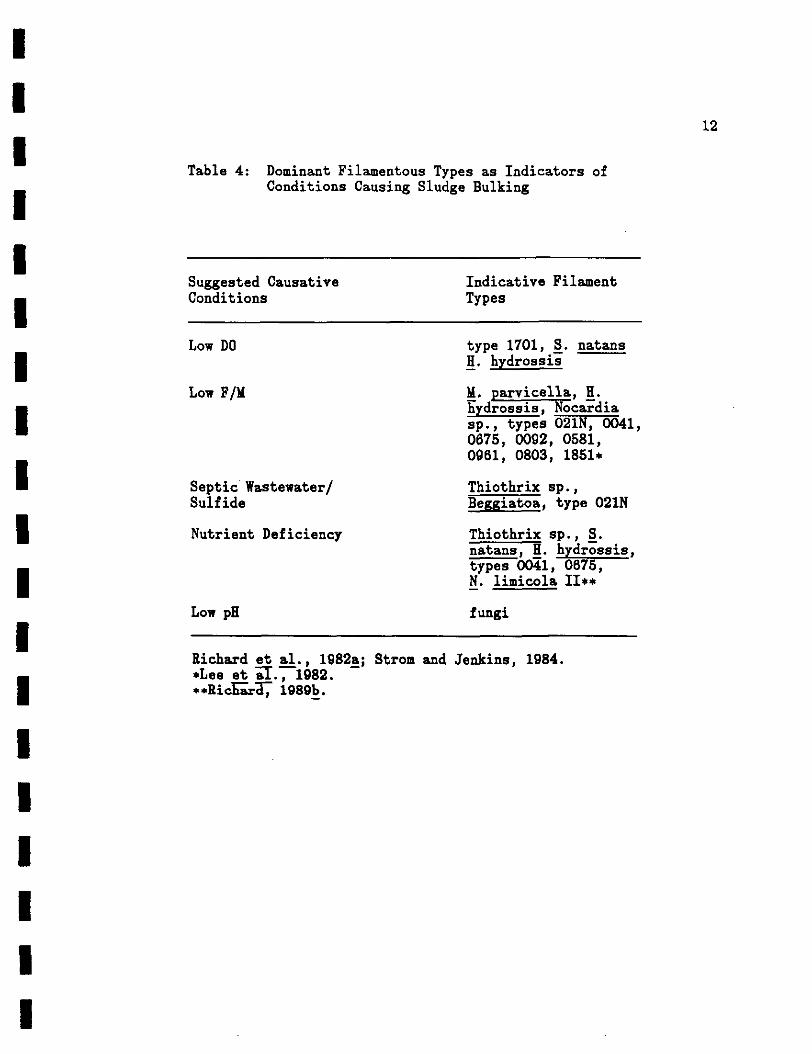
and Jenkins, 1984 and Jenkins et al., 1986). Shown in Table 4 are some
• of the More common organism-cause relationships observed. These
associations between organisms and waste treatment parameters are not
I specific in many cases. A specific cause and effect relationship has
• been established for only a few filamentous organisms (Jenkins et
al.,1988). These include type 1701 (Richard et al., 1982bj flao, 1982;
ii

IIIIIIIIIIIIIIIIIII
Table 2: Suggested Causes of Filamentous Bulking
Condition Sources
Low aerationbasin dissolvedoxygen (DO)
Heukelekian and Ingols, 1940;Adamse, 1968; Sezgin et al.,1978; Palm et al., 1980
Low food-to-micro- Logan and Budd, 1956; Fordorganism ratio (F/M) and Eckenfelder, 1967; Pipes,
1979
Nutrient deficiency
High sulfides
Low pH
Complete mix mode
Carter and McKinney, 1973;Wood and Tchobanoglous, 1975;Greenberg et al., 1955;Jones, 1965; Dias et al.,1968
Farquhar and Boyle, 1972;Voelkel et al., 1974;Merkel, 1975
Jones, 1964
Chudoba et al., 1673a;Rensink, 1974; Houtmeyers,1978; Tomlinson and Chambers,1979; White et al., 1980
Chiesa and Irvine, 1985.
10
IIIIIIIIIIIIIIIIIII
11
Table 3: Proposed Mechanisms oi Filamentous Organism Predominance
Condition Cause
Low DO Lower Ks and /max for filamentous organisms favorstheir growth at low DO (Hao, 1982; Sezgin et al.,1978)At low DO concentrations, relatively thin filamentsare supplied with oxygen better than large floes(Chudoba, 1985a)
Low F/M Lower Ks and /tmax for filamentous organisms(Chudoba et al., 1973b)Higher area/volume ratio gives filaments themetabolic advantage at low soluble organic loading(Pipes, 1967)
Nutrient deficiency Higher A/V ratio (Pipes, 1967)Greater ability to store intracellular storageproducts (Stokes and Parson, 1968)
High sulfides/Septic wastewater
Complete mix mode
Low pH
Ability of some filamentous organisms to use asenergy sources: inorganic, reduced sulfurcompounds; low molecular weight organic acidsproduced by fermentation in septic sewage (Richardet al., 1983; 1984).
Induces Ion F/M conditionsNo substrate concentration gradient present (Chudobaet al., 1973a;b; Sonoda et al.,1973; Ronsink,1974; 1979; White et al., 1980; Lee at al., 1982)
Acidic conditions (pH below 6.5) optimum for growthof certain filamentous fungi
IIIIIIIIIIIIIIIIIII
Table 4: Dominant Filamentous Types as Indicators ofConditions Causing Sludge Bulking
Suggested Causative Indicative FilamentConditions Types
Low DO type 1701, S. natansH. bydrossis
Low F/M M. parvicella, H.hydrossis, Nocardiasp., types 021N, 0041,0675, 0092, 0581,0961, 0803, 1851*
Septic Wastewater/ Thiothrix sp.,Sulfide Beggiatoa, type 021N
Nutrient Deficiency Thiothrix sp., S.natans, fl. hydrossis,types 0041, 0675,N. limicola II**
Low pH fungi
Richard et al., 1982a; Strom and Jenkins, 1984.*Lee et al., 1982.
1989b.
12
II
13
Hao et al., 1983), Sphaerotilus natans (Richard et al., 1982b; Lao et
• al., 1984a;b), Micothrix parvicella (Slijkhuis and Deinema, 1982;
Slijkhuis 1983a;b), and type 021N (Richard et al., 1984). Part of the
| problem is due to the fact that organism characteristics (morphological
_ and staining) can greatly differ outside the domestic wastewater
activated sludge environment. This occurs in pure culture studies and
• especially when significant quantities of industrial wastes are present.
The standard investigative procedure most often used for checking
• the performance of the treatment process involves mainly chemical and
physical analysis of influent and effluent. The results of these tests
I give little direct information to plant operators about the quality of
• the sludge floe in the aeration tank. As a result, it is often not
possible to indicate the cause of a disturbance in the treatment process
• and initiate proper corrective action. Corrective strategies are often
implemented on a trial and error basis. Currently, when a plant
I experiences filamentous bulking, the operator is often unclear as to the
_ cause of the filamentous predominance or where to begin to look for
• operational problems. A common solution, though not always successful,
• is to chlorinate the return activated sludge (RAS). This may
selectively kill off much of the filamentous population and temporarily
• alleviate the bulking condition. It haa been known, however, to kill
the floe-forming organisms as well. This solution is short term and
| costly for a recurring problem. Once the chlorination of the RAS is
_ discontinued, the filaments will return if the operating and
m environmental conditions remain unchanged. Although not currently
ii

II
14
regulated in domestic wastewater treatment, the production of total
I organic halides such as trihalomethanes resulting from free chlorine
reactions with organic matter may be of concern in the near future. The
| use of filament control strategies other than RAS chlorination should be
• considered.
Identification of the dominant filamentous organisms in a bulking
I sludge aids the plant operator in determining if filamentous organisms
are actually a problem and if so, which operational parameters to look
• at first so that proper corrective strategies can be implemented to
eliminate the cause of the filamentous organism predominance and control
• their growth.
• In order to facilitate consistent filamentous organism
identification, several researchers have developed identification
I procedures for filamentous organisms (Farquhar and Boyle, 1971a; van
Veen, 1973; Eikelboom, 1975a; Jenkins et al., 1986). Some filamentous
| organisms have been taxonomically classified, however, the taxonomic
_ position of most of the types is uncertain. The taxonomic positioning
m into genus, species, subspecies and strains is complicated, time
• consuming and inappropriate for isolating filamentous microorganisms
from activated sludge for the following reasons:
• 1. At least 30 stable features are needed for a formal
recognition of a taxonomic group.
I 2. There is a severe lack of pure cultures of filamentous
• microorganisms originating from activated sludges to
which isolates can be compared.
ii

II
15
3. It is probable that many morphological, physiological
• and genetic changes may occur in the filamentous
microorganisms when isolated in pure culture.
| 5. The low growth rates of most filamentous micro-
• organisms cause the isolation and identification to
take weeks or months. Thus, results obtained do not
I correspond to the actual state of the activated sludge
environment (Wanner and Grau, 1989).
| There are several advantages to identification of types rather than
_ species. It is rapid, often requiring an hour or less to complete, it
• integrates all factors affecting the treatment system over a period of
• time, it is not subject to sampling, calculation or other errors
providing the identification is correct, it serves as an independent
• observation for comparison with the more complex operating data and
waste characteristic measurements, and it can be performed by personnel
I with little background in microbiology. The only major disadvantage is
• that it takes time and skill to learn the procedure and a good phase
contrast microscope is required (Emtiazi et al., 1980).
I Identification to types was first proposed by Eikelboom (1975a,b;
Eikelboom and van Buijsen, 1981). The methods were immediately accepted
• by most of the researchers and practitioners in this field throughout
the world. Eikclboom's method was further modified by Jenkins et al.
• (1986). The techniques are based on phase contrast microscopic
• observations of morphology, relationship to other organisms present and
ii
IIIIIIIIIIIIIIIIIII
16
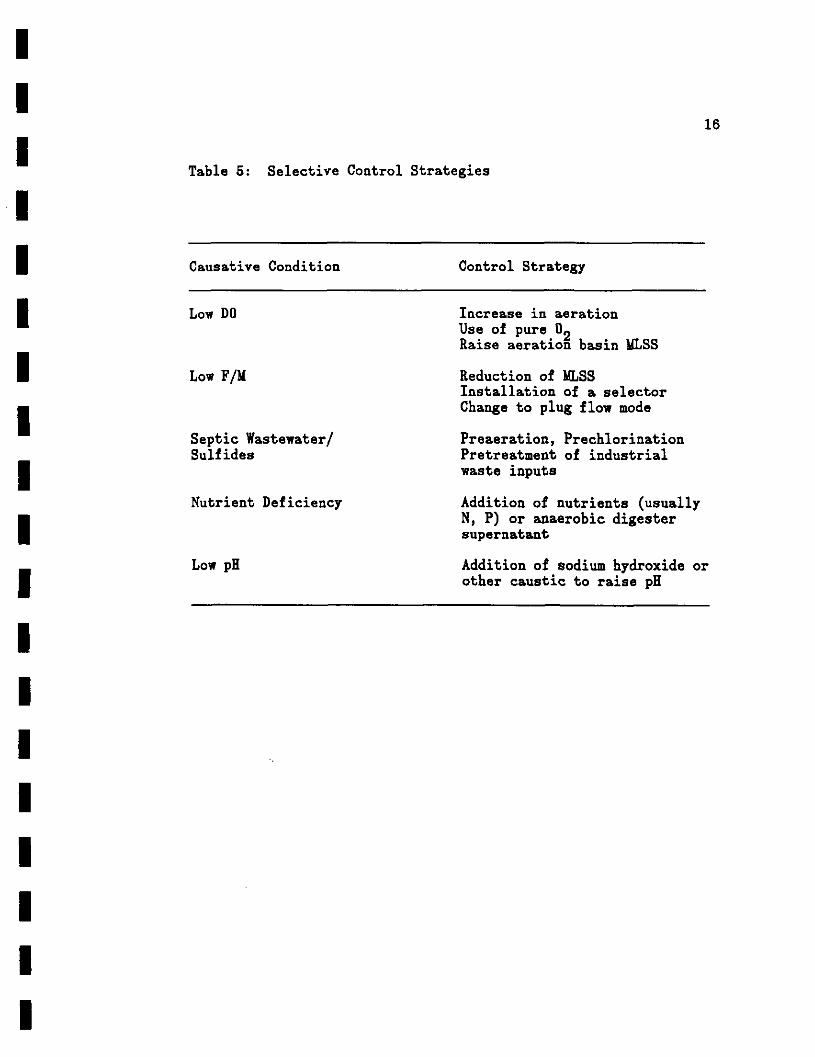
Table 5: Selective Control Strategies
Causative Condition
Low DO
Low F/M
Septic Wastewater/Sulfides
Nutrient Deficiency
Low pH
Control Strategy
Increase in aerationUse of pure OnRaise aeration basin MLSS
Reduction of HLSSInstallation of a selectorChange to plug flow mode
Preaeration, PrechlorinationPretreatment of industrialwaste inputs
Addition of nutrients (usuallyN, P) or anaerobic digestersupernatant
Addition of sodium hydroxide orother caustic to raise pH

II
17istaining characteristics (Gram, Neisser, observation of sulfur and PHB
• granules).
Stemming from the identification procedures, diagnostic manuals
I were developed by EPA (1977), Eikelboom and van Buijsen (1981), Jenkins
• et al. (1988), EPA (1987) and Hobson (1987) to aid in solving sludge
bulking problems through chemical addition or process modifications,
• Shown in Table 5 are the most common selective strategies to eliminate
a bulking problem. These manuals contain identification keys, organism
| descriptions, photographs of organisms in activated sludge, descriptions
_ of types of bulking sludge, descriptions of environmental conditions
• favoring filamentous growth and descriptions of successful case studies.
• Currently, research is being directed towards taxonomic
identification and further defining the growth and nutritional
• requirements of filamentous microorganisms to develop further the
correlation between their occurrence and bulking causes.
iiiiiii

II
18
CHAPTER III
• MATERIALS AND METHODS
i• 3.1 Wastewater Treatment Facility Survey
Before sampling of plants could be commenced, the Massachusetts
I activated sludge treatment plants experiencing bulking problems had to
be identified. This was accomplished through a survey conducted in a
• related project (Woodworth, 1990). Of the plants indicating that they
were experiencing bulking at the time of this study, several were chosen
• for case study based on the severity of the bulking problem,
• availability of plant design and operating data and willingness to
participate in the study. A total of & plants participated in this
• study.
I 3.2 Sampling
_ Sampling of the activated sludge mixed liquor was accomplished
H according to the procedures prescribed by Jenkins et al. (1986).
• Samples were taken at the effluent end of the aeration basin, below the
surface, to exclude any foam or other floating material. Samples were
• collected in 1L, screw-top Nalgene containers. Containers were filled
no more than half full to maintain adequate oxygenation and avoid
• septicity. Samples were transported to the Environmental Engineering
« Laboratory at the University of Massachusetts by car at ambient
temperature.
ii

II
19
Upon arrival at the lab, several air-dried smears were prepared to
• be used for the Gram and Neisser stains. It was especially important to
prepare these immediately since prolonged storage of the mixed liquor
| can alter the Gram and Neisser staining reactions. If the samples could
_ not be examined immediately, they were refrigerated at 4 degrees
B Centigrade. All samples were analyzed within 4 days of sampling.
i3.3 Organism Identification Procedure
• Eikelboom's method, as modified by Jenkins et al. (1988) was used
to characterize (identify to type, rather than species) the filamentous
• microorganisms in activated sludge. The floes and filaments were
• observed with an Olympus BBS research grade, phase contrast microscope
capable of 100X to 1000X magnification. A photographic record was
• maintained of the samples with a Polaroid Time-Zero SX-70 Autofocus Land
Camera with microscope adaptor.
| Sample analysis began with low power (100X) phase contrast scanning
_ of one or more wet mounts. Preparation of wet mounts was conducted as
• described by Jenkins et al. (1986). Observations at this magnification
• included an approximate determination of floe sizes and structural
characteristics, relative amounts of protozoa and metazoa and a rating
• of the amount of filamentous growth present according to a previously
established filament abundance ranking system as shown in Table 6.
| Photographs of the various abundance categories are presented in Jenkins
• et al. (1986).
Next, wet mounts were examined at 4001 phase contrast to determine
ii

111H
IlIIIIII
IIIIII
20
Table 6: Subjective Scoring of Filament Abundance (Jenkins et al.,1986)
Numerical Value Abundance Explanation
0 none
1 few filaments present, but onlyobserved in an occasional floe
2 some filaments commonly observed, butnot present in all floes
3 common. filaments observed in all floes,but at low density (e.g. 1-5filaments per floe)
4 very common filaments observed in all floesat medium density (e.g. 5-20 perfloe)
5 abundant filaments observed in all floesat high density (e.g. 20 perfloe)
6 excessive filaments present in all floes -appears more filaments thanfloe and/or filaments growing inhigh abundance in bulk solution
II
21
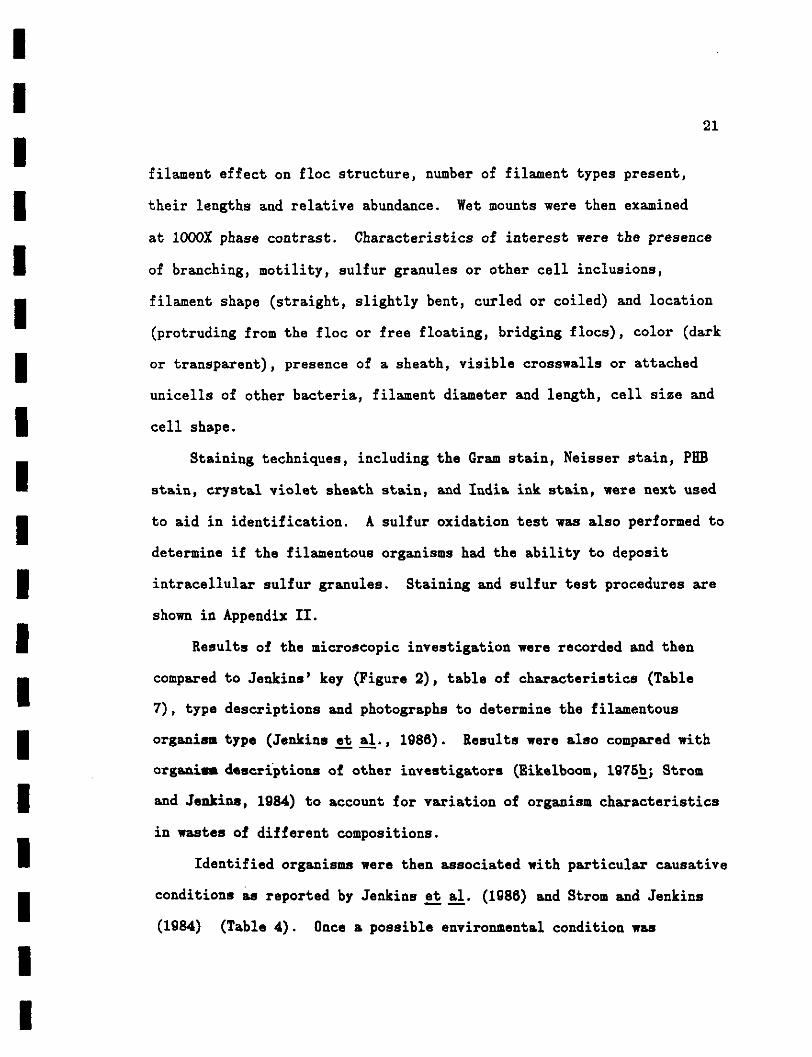
filament effect on floe structure, number of filament types present,
I their lengths and relative abundance. Wet mounts were then examined
at 1000X phase contrast. Characteristics of interest were the presence
• of branching, motility, sulfur granules or other cell inclusions,
• filament shape (straight, slightly bent, curled or coiled) and location
(protruding from the floe or free floating, bridging floes), color (dark
I or transparent), presence of a sheath, visible crosswalls or attached
unicells of other bacteria, filament diameter and length, cell size and
I cell shape.
_ Staining techniques, including the Gram stain, Neisser stain, PHB
• stain, crystal violet sheath stain, and India ink stain, were next used
• to aid in identification. A sulfur oxidation test was also performed to
determine if the filamentous organisms had the ability to deposit
• intracellular sulfur granules. Staining and sulfur test procedures are
shown in Appendix II.
| Results of the microscopic investigation were recorded and then
mm compared to Jenkins' key (Figure 2), table of characteristics (Table
7)t type descriptions and photographs to determine the filamentous
• organism type (Jenkins et al., 1986). Results were also compared with
organism descriptions of other investigators (Eikelboom, 1975b; Strom
| and Jenkins, 1984) to account for variation of organism characteristics
in wastes of different compositions.
I Identified organisms were then associated with particular causative
• conditions as reported by Jenkins et al. (1986) and Strom and Jenkins
(1984) (Table 4). Once a possible environmental condition was
ii

. __i not containtulfur grwMUi
Sulfur gr«Mll«» •l«uW*' [
-Call ala. > 1.5 m>
-C*ll ait. i 1.3 iim
pfc-Mot Mil I*
Ct It alMd L itoti,,
r lrva brw.c>>l«v [*tot*ral* iw-1 ' r*»-Ckll cU. 0.8 - t.l
r««—*J | * Cal I &apt« pfata^t •• 4^-- te br^M^—J Uc,M .U. I.) - ,,2
1™_-
. 0.8 - t.I H* |N. llalcol* H|
**" I"' "*'I'i" "'
.Neither n*(«ii*« triinc
fell ait. l,« - 1.6 «• | l>p« 0041
cronifcI I»P« 0613 II . i iJ
I Little or no attach**) I
ll«J N.-Call ait. |,C - I.; (M 1
c«ll MPI* pr*Mnt I
U;
Lv-Caii at.. < i.fl h> ,
-Sh**th*d. <•!» branching I S.
tf I t>p« OKI I
ltMT «Uti.« I - : - - ---- J
C*ll» iqu*r* Cctli b«rr*l, r*<1,ngaltfCall ait. l.O - i.Ii« of dlicoidi c*n ait,no l«d*nUtfonI *l Hp1* t.l - 1.0 v*>; I»0«nt»tlon»
•t tapla
) l,p« 0»1« J «,p*
Call Mpt* pr«M«t1
C«llv out C»llt flcilyitca rodi». a • i.i - i.s *- o.i . I - < M*I I 'f(H> 0»l I
flcilyitca rodi ' '.i . I - < M*
gro,*!,
HOI j | *«>• 0601 ]
Figure 2: Dichotomous Key for Filamentous Organism "Identification" in ActivatedSludge (Jenkins et al., 1986)
roro

23BftGHT PSD OBSStVATION
FILAMENTTYPC
S. naur*
tVP* 1701
(VIM 0041
iyo«0679
t¥P«021N
TtvoOvul
TrloOvu •
(¥0*0914
B«ggi«t<MWP-
nnw 1851
CVW0603
ryix.0092
tvw0961
M MfvmU
MocwM M>-
N. Wwccttl
N Uncoil 1
H. UneotaM
H. hvdnMM
MMOS81
ryp. 19«3
WPt0411
ZG
RA
MS
_
+ .V
+ .V
-
— . *
_
•-, +
-,*
»wt«k
—
-
-
+
* .
*
- . *
+
-
-
-
-
I(AS
1
-U
_
_
_
-
_
_
_
-
_
+
-
-^
*
+ ,-
*
-
--
—
&
_
-.+
-. *•
-. *
-. +
-. *
-.+
-,+
-_
-
-
*
*
-
-
-
-
--.+
~
i2
j
ii-S
_
_
_
— , +
+ .-
+ ,-
-,+
+ .-
-_
-
-
-_
-
-
-
-
--
—
iin
^
_
_
*.
+
*
,
*
-
_
-
-
-
^
--
-
-
-
-
*
PHASE CONTRAST OBSERVATION 1000X
=1
OTH
ER
'IN
CLU
S
PHI
PHB
_
_
PHB
PHB
PHB
PHI
PMfl
-
-.
*
-
PHI
PHI
-
PHB
PHB
-
-
-
-
KIU
!
TfV
CH
OM
EC
1.0-1.4
0.6-0.8
1.4- 1.6
0.8-1.0
1.0-2.0
1.4-2.5
0.1-1.4
1.0
.2-3.0
O.I
O.I
0.8-1-0
0.8-1.2
O.I
1.D
O.I
.2-1.4
2.0
0.5
0.8 • 0.8
O.I
O.I
ziu
TMC
HO
ME
5OO
20-80
100-500
50- ISO
50-500
100-500
90-200
50-200
100-500
100-300
50-190
20-80
40-80
100-400
10-20
100
tOO- 200
200-300
20-100
100-200
20-50
SO -ISO
i
i
Si
StJ
St
St
StSC
St.SC
St.SC
Si
St
St.!
St
St.8
Si
c
1
c
c
c
St.!
C
1.1
1.1
9
THC
HO
ME I
c
I.E
(.E
I
e
E
e
f.F
F
I
E.F
1
e
i
i
I.EI.E
1.K
E.F
1
i.F
E
>
cat
SEPT
AO
BS
ER
VE
D
+
+
+
*
+
*
+
+
-,+
*.-
+
*.-
+
-
*,-
-
+
+
-
-
»
*
*53
INO
EN
TATI
CE
LLS
EP
1
*
+
_
_
+
_
_
_
-
-
_
-
-
-_
-
*
*
-
-
+
+
Z
1
*
+
*
*
-
+
*
_
-
+
_
-
-
-
_
-
-
-
*
-
-
™
S
i3
ATT
AC
HE
D
+ *•
* *.-
* *.-
-
_
_
_
-
-. *
_
-
-
-_
-
-
-
-,+
-
-
~
S
in-JUI
d1^UM
r^dij vvMd rods1.4x2.0
rewd-mMd rods0.8 x 1.2
tguwM1.4x1.5-2.0
MUWHI.Ox 1.0
txvrMi. >«cun-#M. dHCOMi
1-2x1.5-2.0
rKtMM2.0x3-5
mcunqM1.0x1.5
HUSfM1.0x1.0
rmamOm2.0x6.0
rvcun^M0.8x1.5
tSCtV^M0.8x1.5
r«ct«ngM>O.Bxl.5
rvcunglM1.0x2.0
-
vmbto1.0x1 -2
-
OlK&OVM1.2x1.0
te.ovM2.0x1.5
-
-
ovrt rah0.8x1-1.9
^onof tt fOdioTx2-4
NOTES
F*«t tftreT^Q
oiMpurwdto dncwn
MMM> potmv*rtactnn occur*
N«SM> OOM>v«r»«cnqn occura
'OMtMt. gonuM
roMRM. goradw
raMRM. gendi*
mtutgrsnuw•••qu»f»"
'nocte'. flvwiQ vvtr -i'n n
tf""*
tnchonw bundtas
"trmsMtant"
Hrg» "Htcfm"
mMbnKftng
tnc>fcrHtf txOTChv^Gram and N«M«v«vUh
"THJX"V fUM^M"
"ChWI Of <MM"
"ctwn of csta"
,: St» _ « vnooV* «vrt C « ooitd; I • l
fram floe MfKK I«*au^ mo«(v ««iin tfw floe: F • FIM in kMd b««Mvi «• (tat.
Table 7: Summary of Typical Morphological and Staining Characteristics(Jenkins et al_., 1986)
iiiiiiiiii
24
II
identified, the operational data from the plant were analyzed to see if
I it supported the problem which the filamentous identification suggested.
Once this correlation could be established (if sufficient data were
| available), results were discussed with the plant operator and remedial
• actions were suggested based on previous case studies and observations
(Broderick and Sherrard, 1985; Jenkins et al., 1986) and ease of
• implementation at the plant. Typical effective remedial actions were
presented in Table 5.
• When time permitted and plants were willing to try various process
_ modifications, the effects of the modifications on the process
performance and filamentous organism populations were observed and
recorded.

IIIII
25
CHAPTER IV
RESULTS AND DISCUSSION
In this chapter, the choice of the identification technique, an
evaluation of tne usefulness of the techniques to treatment plant staff,
• a cost estimate for performing filamentous organism identification at a
treatment plant will be presented. A brief summary table of the case
| study results will also be included. Detailed descriptions of each case
M study are presented in Chapter V.
The first task of this research was to conduct an intensive
I literature search in order to identify the techniques available for
filamentous organism identification and evaluate their usefulness. Six
• identification techniques relating to filamentous organisms in activated
sludge were found and evaluated with respect to their usefulness to
• treatment plant staff. Shown in Table 8 are the criteria upon which the
• techniques were evaluated and the results of the review. It can be seen
that, compared to other techniques evaluated, the manual by Jenkins et
I al. (1986), Manual on the Causes and Control of Activated Sludge Bulking
and Fomaing, by far provides the most complete and up-to-date coverage
I of the filamentous organisms, their causes, case studies and bulking and
_ foaming control measures. It should also be noted that of the plants in
• Massachusetts investigating filamentous bulking through organism
• identification, the majority use this manual. Therefore, Jenkins*
manual was adopted for this study.
ii
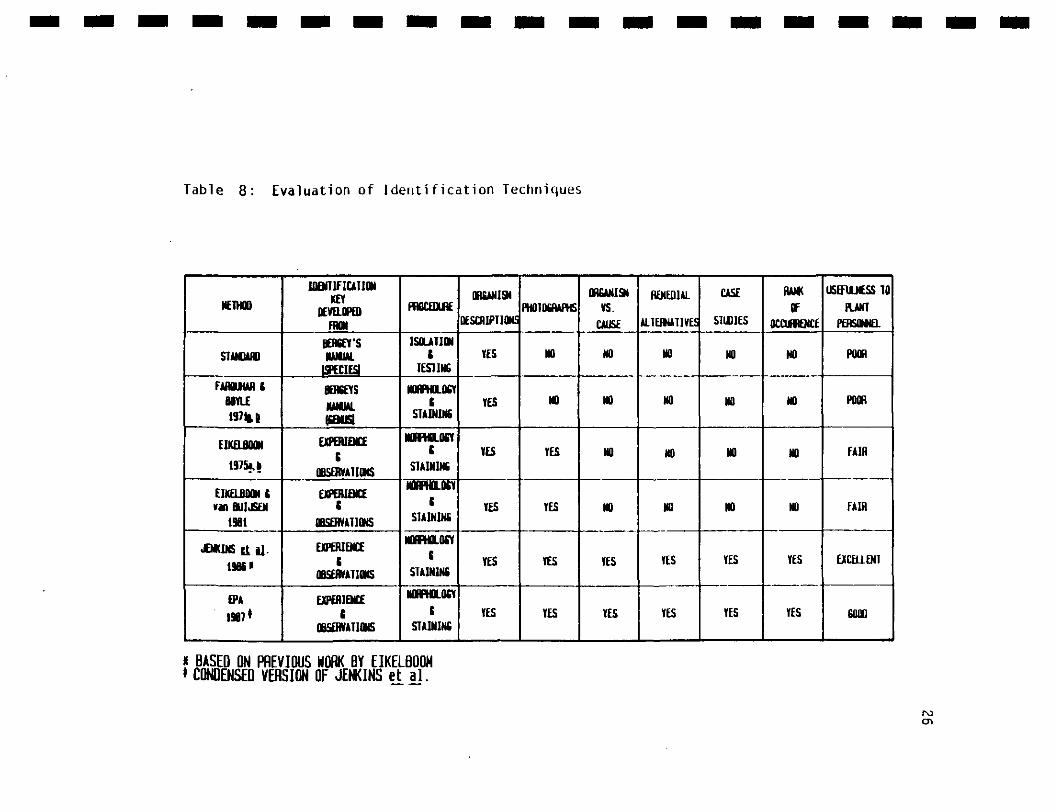
Table 8: Evaluation of Identification Techniques
NEMO
STANDARD
FAHUURCBOYLE197% fc
EIKELBOON
1975«. »
eiKELBOONfivanBUIJSEN
1381
JENKINS till-19B6"
EPA1987*
IDENTIFICATIONKEY
DEVELOPEDFRON
BERGEY'SMANUAL
ISHCIESI
8EHGEYSMANUAL(fiENUSl
EXPERIENCES
OBSERVATIONS
EXPERIENCEC
OBSERVATIONS
EXPERIENCEC
OBSERVATIONS
EXPERIENCEC
OBSERVATIONS
PRQCEDIK
ISOLATIONt
TESTING
NOHPHQLQCY(
STAINING
NORPHOLOGYC
STAINING
NORPHOLOtYI
STAINING
NOHPHOLOGY
STAINING
NOHPHOLOCYK
STAINING
QRGANISN
QESCHIPTIONS
YES
YES
YES
YES
YES
YES
PHOTOGRAPHS
NO
HO
YES
YES
YES
YES
OHGANISNVS.
CAUSE
NO
HO
NO
HO
YES
YES
REMEDIAL
ALTERNATIVES
NO
NO
NO
NO
YES
YES
CASE
STUDIES
NO
NO
HO
NO
YES
YES
HANKOF
OCOfflENCf
NO
NO
NO
NO
YES
YES
USEFULNESS TOHJUfT
PERSONNEL
POOH
POOH
FAIR
FAIR
FJCELLENT
GOOD
X BASED ON PREVIOUS HORK BY EIKELBOOH* CONDENSED VERSION OF JENKINS et al.
roen

II
27
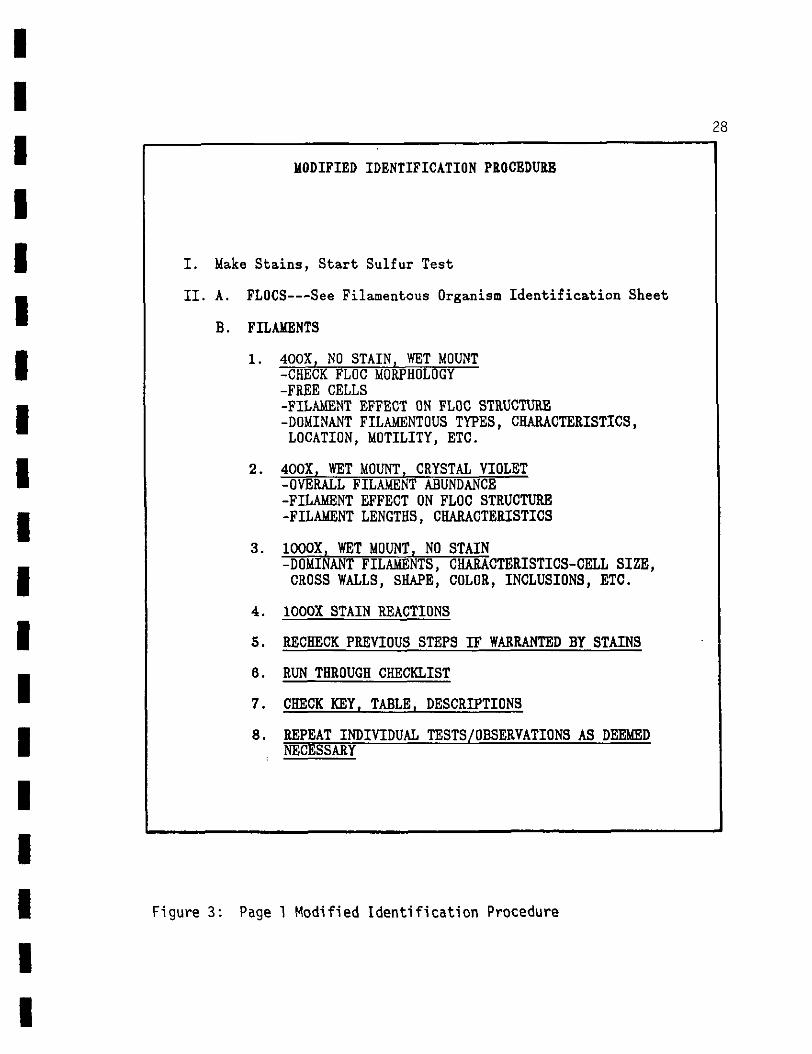
Worksheets for filamentous organism identification are provided in
• the manual. Through use of the techniques, these worksheets were found
to be somewhat cumbersome and the order of tasks involved in organism
| identification does not follow the order of the worksheets. As a
• result, a modified identification procedure was developed. It is based
on the instructions provided by Jenkins, but the worksheets are
I organized to follow the order of observations and also to provide space
for sketches and other observations and a brief description of the
• treatment process and suspected problems. These worksheets are shown in
Figures 3-8. Another objective of this research was to evaluate the
• applicability of filamentous organism identification techniques for use
• by treatment plant personnel. The first question which must be answered
is what information can be gained through microscopic investigation of
• activated sludge?
It can be useful to:
| (1) Establish that a settling or foam problem is indeed
• due to filament growth and not some other solids separation
problem.
I (2) Compare the causative filament(s) observed in separate
bulking episodes at one plant; are the same or
• different filaments responsible at different times?
(3) Relate the types of filaments observed to suggested
I causative conditions to evaluate remedial actions.
• (4) Evaluate the effect of proposed operational changes
on the types and abundance of filaments present and floe
ii
IIIIIIIIIIIIIIIIIII
28
MODIFIED IDENTIFICATION PROCEDURE
I. Make Stains, Start Sulfur Test
II. A. FLOCS See Filamentous Organism Identification Sheet
B. FILAMENTS
1. 400X, NO STAIN. WET MOUNT-CHECK FLOG MORPHOLOGY-FREE CELLS-FILAMENT EFFECT ON FLOC STRUCTURE-DOMINANT FILAMENTOUS TYPES, CHARACTERISTICS,LOCATION, MOTILITY, ETC.
2. 400X, WET MOUNT, CRYSTAL VIOLET-OVERALL FILAMENT ABUNDANCE-FILAMENT EFFECT ON FLOC STRUCTURE-FILAMENT LENGTHS, CHARACTERISTICS
3. IQOOX, WET MOUNT, NO STAIN-DOMINANT FILAMENTS, CHARACTERISTICS-CELL SIZE,CROSS WALLS, SHAPE, COLOR, INCLUSIONS, ETC.
4. 1000X STAIN REACTIONS
5. RECHECK PREVIOUS STEPS IF WARRANTED BY STAINS
8. RUN THROUGH CHECKLIST
7. CHECK KEY. TABLE. DESCRIPTIONS
8. REPEAT INDIVIDUAL TESTS/OBSERVATIONS A3 DEEMEDNECESSARY
Figure 3: Page 1 Modified Identification Procedure

IIIIIIIIIIIIIIIIIII
29
FILAMENTOUS ORGANISM IDENTIFICATION SHEETWTP
PROCESS DESCRIPTION/SVI
REMARKS/PROBLEM
SAMPLE DATE STORAGE***************************************1— 1001 NO STAINPROTOZOA, ETC.INQRG/ORG PARTICLESAMORPHOUS {INDIA INK STAIN)
FLOG MORPHOLOGY (FIG 6, 12)ROUND, COMPACTIRREG, DIFFUSEFIRM WEAK
2--100I CV DRYFILAMENT EFFECT ON FLOG STRUCTURE (FIGETTBRFLOC BRIDGING (8A,B)DIFFUSE FLOG STRUCTURE (6D)FREE FILAMENTSFILAMENT BACKBfiflE~(6C)COMMENTS/COMPARES TO
FILAMENT ABUNDANCE— OVERALL (FIG 13)NONEFEW (FIL. IN OCCASIONAL FLOG)SOUS (NOT IN ALL FLOGS)COMMON (1-5 PER FLOG)VERY COMMON (5-20 PER FLOG)ABUNDANT (20+ PER FLOG)EXCESSIVE (MORE FIL. THAN FLOGS)
(JQHDENTS/COMPABES TO4— 4001 NO STAIN *FEES CELLS * <150#a
** SMALL"
**************************************DESCRIPTION OF DOMINANT FILAMENTS
OBSERVATION DATE*********************************
3--100X CY WET
FLOC DIAMETERSCALE /im
123
0) 4567.891011121314151617181920
150-500/fB >500/ta
MEDIUM LAftfifi**********************************
Figure 4: Page 2 Modified Identification ProcedureCV= crystal violet
IIIIIIIIIIIIIIIIIII
30
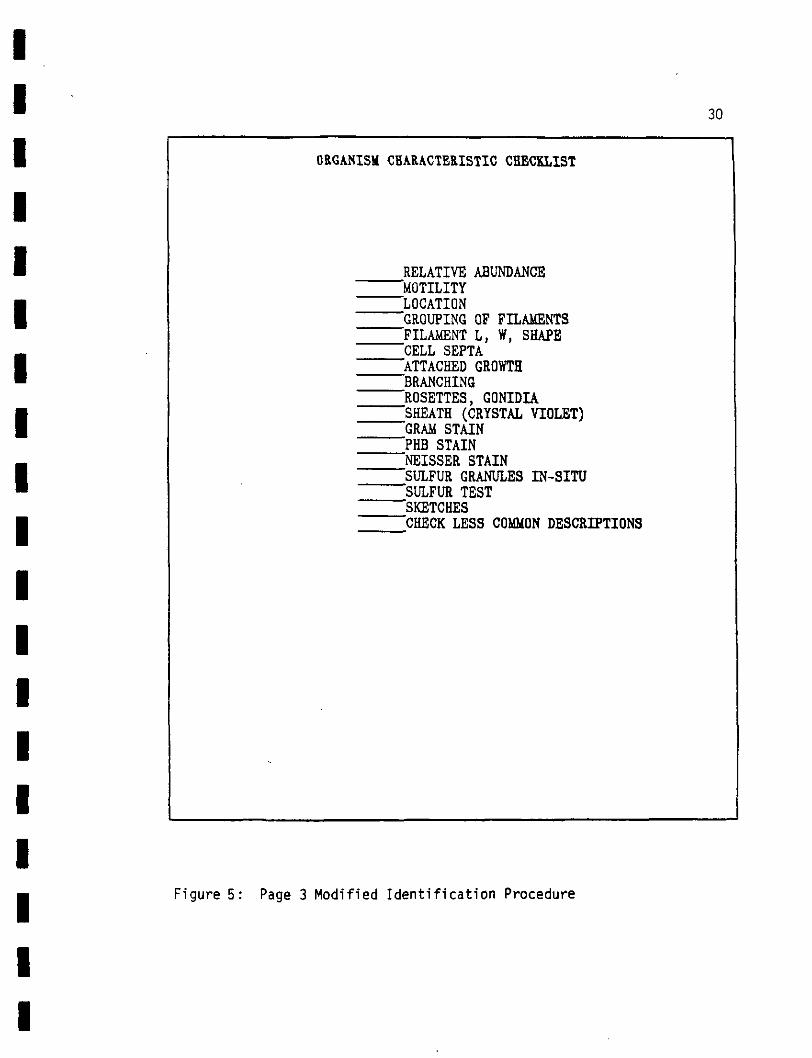
ORGANISM CHARACTERISTIC CHECKLIST
RELATIVE ABUNDANCE"MOTILITY"LOCATION"GROUPING OF FILAMENTS"FILAMENT L, W, SHAPE"CELL SEPTA"ATTACHED GROWTH"BRANCHING"ROSETTES, GONIDIA"SHEATH (CRYSTAL VIOLET)"GRAM STAIN"PHB STAIN"NEISSER STAIN"SULFUR GRANULES IN-SITU"SULFUR TEST"SKETCHES"CHECK LESS COMMON DESCRIPTIONS
Figure 5: Page 3 Modified Identification Procedure

11
31iiiiiiiiiiiiii
OBSERVATIONS AND SKETCHES
FILAMENT NUMBER DOMINANT SECONDARY
FILAMENT NUMBER DOMINANT SECONDARY
-
1 Figure 6: Page 4 Modified Identification Procedure
ii
II
32
size and structure; has the appropriate remedial action been
• taken?
(5) Provide operators and laboratory personnel with training
| in activated sludge microbiology.
• (6) Regular monitoring of filaments can lead to "heading off" a
bulking episode before it becomes too serious.
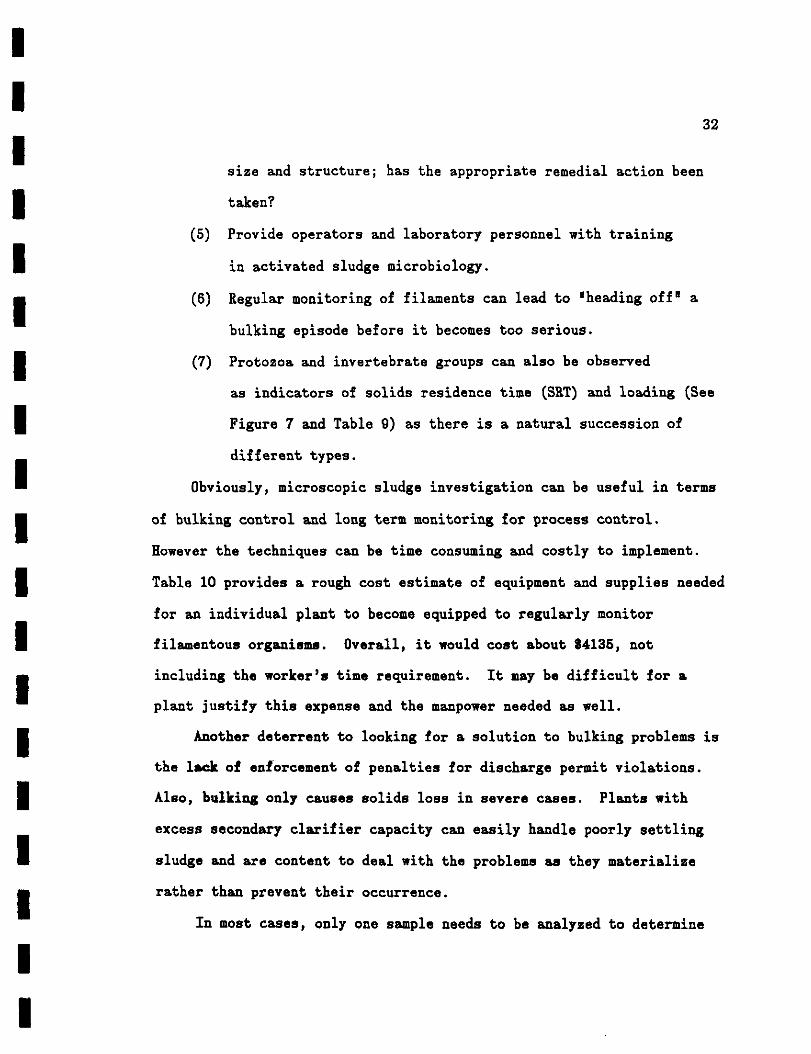
• (7) Protozoa and invertebrate groups can also be observed
as indicators of solids residence time (SRT) and loading (See
| Figure 7 and Table 9) as there is a natural succession of
_ different types.
™ Obviously, microscopic sludge investigation can be useful in terms
• of bulking control and long term monitoring for process control.
However the techniques can be time consuming and costly to implement.
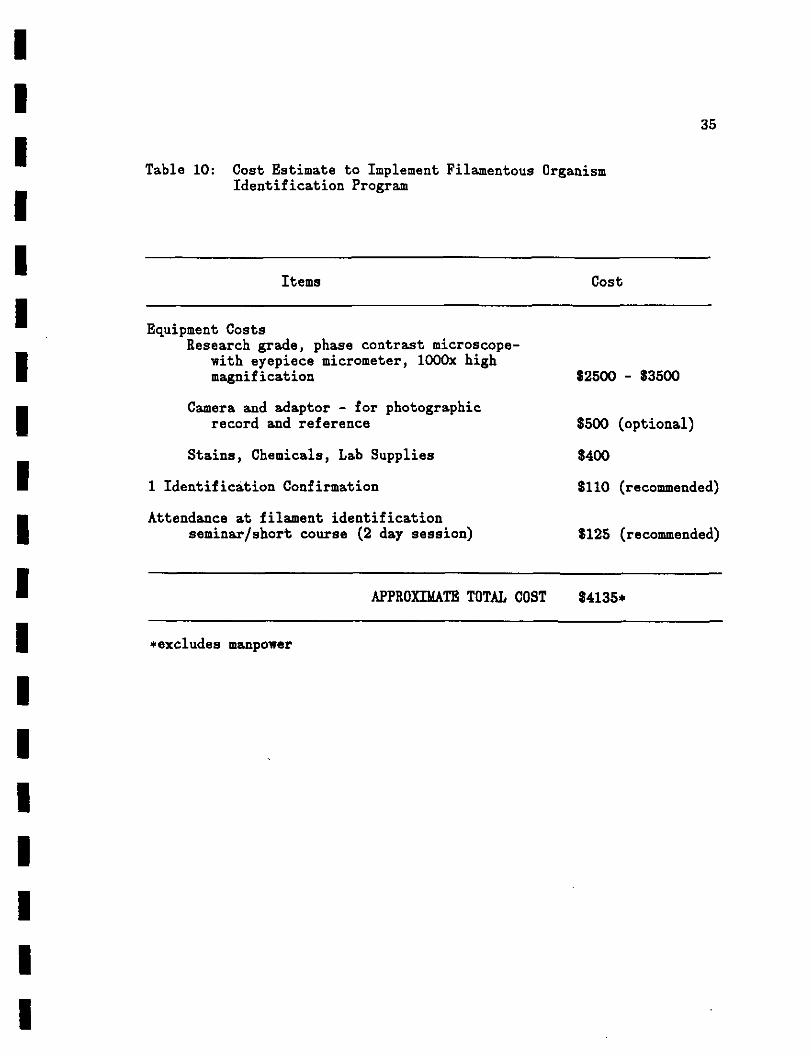
• Table 10 provides a rough cost estimate of equipment and supplies needed
for an individual plant to become equipped to regularly monitor
• filamentous organisms. Overall, it would cost about $4135, not
« including the worker's time requirement. It may be difficult for a
plant justify this expense and the manpower needed as well.
I Another deterrent to looking for a solution to bulking problems is
the lack of enforcement of penalties for discharge permit violations.
• Also, bulking only causes solids loss in severe cases. Plants with
excess secondary clarifier capacity can easily handle poorly settling
• sludge and arc content to deal with the problems as they materialize
• rather than prevent their occurrence.
In most cases, only one sample needs to be analyzed to determine
ii

I
Tun*-
Figure 7: Relative Abundance of Protozoan Groups and ActivatedSludge Process Conditions (Metcalf & Eddy, 1979)
OJCO

IIIIIIIIIIIIIIIIIII
34
Table 9: Organic Loading of Activated Sludge and PredominantHigher Life Forms Observed (Richard, 1989a)
Conditions
Low Organic Loading
Optimum Organic Loading
High Organic Loading
Predominant Groups
stalked ciliates, rotifershigher invertebrates, es-pecially nematodes
good diversity of organisms,dominated by free-swimmingand stalked ciliates
flagellates, amoebae, andsmall, free-swimming ciliates
•
35
II
Table 10: Cost Estimate to Implement Filamentous OrganismIdentification Program
Items Cost
Equipment CostsResearch grade, phase contrast microscope-
I with eyepiece micrometer, lOOOx highmagnification $2500 - $3500
( Camera and adaptor - for photographicrecord and reference $500 (optional)
Stains, Chemicals, Lab Supplies $400
I 1 Identification Confirmation $110 (recommended)
( Attendance at filament identificationseminar/short course (2 day session) $125 (recommended)
APPROXIMATE TOTAL COST $4135*
| ^excludes manpower
iiiiiii

II
36ithe probable cause of a particular bulking episode (if taken during the
I bulking episode) and evaluate control measures. A number of researchers
with extensive experience in filamentous organism identification and
m bulking control provide a mail in identification service with about 1-2
• weeks required for results. The cost is $110 per sample. The only
drawbacks of this service are the turnaround time for results and the
• suggested cause for bulking is based solely on organism identification.
While these services are an excellent independent check on organism
I identification, they consider only the organisms and not the
_ environmental and operating conditions at the treatment plant. Ideally,
™ before remedial measures can be evaluated, plant operating conditions
• and data should be closely studied to determine if the organism
identification correctly elucidated the problem.
• Some of the larger plants in Massachusetts are currently
implementing these techniques and are finding them useful, however, each
I of these plants has full time lab personnel devoted to process
• monitoring. Smaller plants do not have this luxury. What seems to be
warranted is the establishment of regional or statewide assistance
• groups, much like the technical assistance training service (TATS) of
the DBF training center in Uilbury, MA. The aim of this group is to
| provide training to treatment plant staff and aid in operational
problems. An individual trained in filamentous organism identification
• and activated sludge plant operation could be incorporated into this
• group. Not only could filamentous organism identification be done
locally and quickly, but plant evaluation visits, data analysis and
ii

II
37
operator education could also be provided as part of this service.
I Also, by keeping abreast of recent developments in research in this
area, the TATS group (or other) could serve to keep its plant personnel
| informed of the aid available, where to find it, its usefulness and area
• plants which have benefitted.
What also needs to be studied and stressed is the long term
• benefits of filamentous bulking control and eradication. Host plants
only consider the short term expense of money and effort in solving the
H problem and this in and of itself is a deterrent to action.
NPDES discharge permits and compliance enforcement can only be
• expected to become more stringent in the future. Long term benefits
• include better process control through increased understanding of the
activated sludge process and microbiota, decreased operator effort, more
• consistent effluent quality, and in some cases, increased process
capacity leading to longer plant life.
I The results of the six case studies are presented in Table 11. In
• the choice of plants, a variety of wastewater types, flow
configurations and plant capacities were included in an attempt to study
• plants with different bulking causes. Plants with low pH and septic
wastew&tar problems wera not encountered, however, other problems
• including low DO, low F/M and nutrient deficiency were studied with
varying degrees of success in correcting the problem.
iii

Table 11 : Massachusetts Filamentous Bulking Case Studies
TREATMENT PLANT
HASTE TREATED
1. Plant A
Domestic Haatewater
2. Plant B
Domestic Waate waterFood Processing Hastes
3. Plant C
Domestic Waotewater
4. Plant D
Domestic Waate waterPaper Mill Wastes
5. Plant E
Domestic WastewaterPaper Mill Wastes
6. Plant F
Domestic HaatewaterPaper Mill Was tea
PROCESSTYPE
CompleteMix
CompleteMix
ExtendedAeration
Step Feed
Step Feed
CompleteMix
DOM IN ANTFILAMENTOUSORGANISM (S)
Nocardia sp.Type 0041M. parvicellaS . natans
N. limicola II
M . parvicellaType 0041
M. parvicellaType 0041Type 1651
Thiothrix IIS. natans
Thiothrix IIS. natans
PROBABLECAUSE OFBULKING
Low F/M>
PhosphorousDeficiency
Low F/MLow DO
Low F/MNutrientDeficiency
PhosphorousDeficiency
NutrientDeficiency
CHANGE INOPERATION
None
Increased SRTAddition ofSept ageIncreased Aeration
None
Change to PlugFlowShort termAddition ofPhosphorous
PhosphorousAddition
Addition ofurea and phos-phoric acid
RESULTS
Adequate plant capacityto control bulkingand foaming
RAS chlorination ceasedReturn to nonbulkingconditionReduction in filamentabundance
None
Initial success in reduc-ing the SVIN. limicola II becamepredominant and SVIincreased
RAS chlorination ceasedNonbulking conditionachievedReduction in filamentabundance
Reduction in RAS chlor-inationReduction in bulkingfrequency and severity
COCO
I39
™ CHAPTER V
• CASE STUDIES
I 5.1 PLANT A - Low F/U
iI Plant A receives an average daily waste flow of 0.20 m*/s (4.5
mgd), 63ft of its average daily design flow. The plant utilizes a
| complete mix activated sludge system with surface aeration as shown in
• Figure 8. Average influent BODS and total suspended solids (TSS) are
220 mg/L and 179 mg/L, respectively. Approximately 95% of the incoming
• wastewater is domestic, the remainder being of industrial origin. Of
the total flow, 30% comes from a university campus, causing rapid flow
• increases in early September, late January and raid-March (after spring
break), corresponding with the return of students to campus (See Figure
I fl).
• This plant has chronic settleability problems (the SYI is usually
greater than 150 ml/g). The plant operator feels this is due to rapid
• flow variations when students leave or return to the campus and seasonal
temperature fluctuations in the wastewater. Besides settleability
| problems due to filamentous organisms, the plant also experiences
_ frequent foaming problems which can cause excess solids in the final
• effluent due to persistent scum and foam floating over the weirs of the
• secondary clarifiers.
ii

+>EFF
Figure 8: Plant A Flow Configuration
o

50 100 150 400 450
Figure 9 : Plant A Influent Flow Variations

II
42
FILAMENTOUS ORGANISM IDENTIFICATION
iMicroscopic investigations of the activated sludge revealed "very
| common11 filament abundance and diffuse floe structure. The dominant
• filamentous organisms were Nocardia sp., Type 0041, Micothrix parvicella
and Sphaerotilus natans. Abundance of Nocardia and tf. parvicella,
• causing foaming problems, are shown in Figures 10 and 11.
From Table 4, it can be seen that abundant growth of Nocardia sp.,
• Type 0041 and M. parvicella are indicative of a low food-to-micro-
organism ratio in the aeration basin. S. natans abundance is generally
• caused by a low dissolved oxygen or low nutrient condition. S. natans
• was abundant in some of the samples examined, but never excessive. At
the time it was found to be dominant (day 220), the F/M had steadily
I increased from .18 to .32 in the few weeks prior (See Figure 12a). This
may have induced low DO conditions for the applied F/M. Lab experiments
| conducted by Palm et al. (1980) showed that the higher the F/M, the
M greater the DO concentration required to prevent the growth of S.
natana, a low DO filamentous organism.
iPLANT MIA. ANALYSISi
Fourteen months of plant operating data were obtained for this
m study to support the cause of bulking as determined by the filament
• identification. From Figure 12a, it can be seen that the F/U is usually
low compared to the typical design "operating window* for the
ii

IIIIII
Figure 10: Plant A Abundance of Nocardia sp.I (1000X Gram stain, transmitted light; bar=10 /fm)
Figure 11: Plant A Abundance of H. parvicellaI (1000X Gram stain, transmitted light; bar=10 /im)
iiiiiiiiiii
43


IIIIIIIIIIIIIIIIIII
45
1M 1100
UJCeL ss
BOO
"b)
3M
Mt
IN
IN
DAYS
NOTE: MISSING DATA ARE INTERPOLATED FOR CLARITY
Figurel2 : Plant A Operating Data
111H
1conventional activated sludge process (Metcalf ft Eddy, 1979).
What appears to be the major cause of the low F/M conditions is
46
the
flow variations caused by the university. When the students return from
Ii•••1
II
Iii
II
I
a break (summer or winter) , the flow suddenly increases from about 0.
m*/s (3.5 mgd) to 0.20 m3 /s (4.5 mgd) . To handle the increased flow,
more aeration tanks are brought on line. This makes it difficult to
15
t
maintain a particular F/M or mixed liquor suspended solids (MLSS) until
the system is equilibrated since the F/M is a function of hydraulic
residence time, MLSS and BODS as shown in equation 1.
(1) F/M = S0/0X
where S0 = BODS applied to the aeration basin, mg/L
9 = hydraulic residence time, days
X = MLSS, mg/L
i
CONTROL STRATEGIES
During the time of this study, the plant's discharge permit was not
violated. From Figure 12b it can be seen that the effluent consistently
achieved greater than 85X removal of BOD and TSS, even at times of
elevated SYI (Figure 12c) . Decreases in removal efficiency did not
consistently correlate with increased SVI, which would be caused by
increases in populations of the filamentous organisms. Decreased
removal usually occurred at times of peak flows. Washout of solids may
Iii
47
II
have been due to hydraulic overloading at these times as well as
• Nocardia foam and scum overflowing the weirs of the secondary
clarifiers.
| To alleviate the filamentous problem, one or both of two strategies
— are employed at the plant: chlorination of the return sludge and
™ reduction of the solids residence time (SET). HAS chlorination is used
flj to selectively kill filamentous organisms, reducing their abundance.
This strategy is rarely used at Plant A; only when severe bulking and
• foaming are experienced and the effluent quality is compromised. The
rationale behind lowering the SB.T is twofold. First, filamentous
• organisms have a slower maximum growth rate (/imax) than the floe
• formers, so lowering the SRT may selectively inhibit the growth of the
filaments. Secondly, by lowering the SRT through increased wasting of
• sludge (WAS), the MLSS concentration is decreased, raising the F/M (See
Equation 1). This strategy is evident in Figure 12d. In late spring,
• days 230 to 270, the MLSS was lowered from 3500 to 1500. Within about
• 15 days, the SVI began to decrease steadily for a period of time. This
lag time of response to process modifications has been observed by other
I investigators. Jenkins et al. (1986) reported that once changes have
been made to discourage filamentous growth, settleability may improve
I only slowly since the microbial population changes at a rate
proportional to the culture washout rate, SRT. Thus, greater than one
SRT may be required for improvements in settleability to become
apparent.

II
48
SUGGESTIONS FDR REMEDIAL ACTION
iA seemingly obvious course of action would be to maintain a higher
I F/M ratio by lowering the SRT. Although this would probably lower the
• frequency of bulking and foaming problems, it would mean a consistently
higher sludge wasting rate. More sludge would therefore need to be
• dewatered. Sludge dewatering is accomplished at the plant with
dissolved air flotation (DAF) and vacuum filtration with the addition of
I lime, polymer and ferric chloride. Increased sludge processing means
greater energy use, chemical use, increased labor and maintenance as
• well as more dried sludge being landfilled, and with increasing concern
• over landfill space limitations this is not a desirable consequence.
There has been some success in laboratory studies (Chudoba et al.,
I 1973b; Wheeler et al., 1984; Daigger et al., 1985; Chudoba et al.,
1985b; Linne and Chiesa, 1987) in the use of a selector to rectify
| complete-mix, low F/M bulking conditions. Ideally, & selector is a
— small mixing tank or series of tanks in which RAS and primary affluent
• are mixed prior to entering the aeration basin. This ensures a high
• carbonaceous substrate concentration when mixed with the RAS to select
for noft-filamentous organisms. The option of placing the RAS in with
• the primary effluent in the influent channnel (See Figure 8) is
available at Plant A, but this probably does not provide enough
iii
detention time prior to the aeration basin for effective selector
operation. Use of the basin area of the first aerator could be used as

II
49
a selector since sluice gates are already present. This flow
• configuration is shown in Figure 13.
The bulking and foaming problems at Plant A are only periodic and
| usually do not seriously inhibit treatment efficiency. RAS chlorination
• and/or temporary reduction of MLSS concentration have proven economical
and effective. At this time the plant has chosen not to experiment with
• selector operation or maintain a consistently lower MLSS concentration
because of this. The plant recognizes the cause of the settlability
| problems and has expressed interest in selector operation if the
problems become worse or more frequent.
iiiiiiiiii

RAS
INF4J
+>EFF
NSt TT I
+>EFF
f
Figure 13 : Plant A Selector Configuration
o

51
II
5.2 PLANT B - Phosphorous Deficiency
i• A complete mix activated sludge process with surface aeration as
_ shown in Figure 14 is utilized at Plant B. Currently, an average daily
Iflow of 0.053 m*/s (1.2 mgd) is treated, $7% of its average daily design
I flow of 0.078 m*/s (1.79 mgd). Approximately 40% of the wastewater is
of industrial origin including food processing and soft drink bottling.
| Based on design values for flow and aeration basin volume, the plant is
• designed to treat an average wastewater strength of 215 mg/L BODS,
however, the current BODS is 300-500 mg/L. The average influent TSS is
I 240 mg/L.
This plant has a history of bulking related problems including poor
• settling, clarifier overloading, blanket rising and overall
mm deterioration of effluent quality during bulking episodes. The major
control mechanism utilized by this plant has been chlorination of the
I return sludge for 2-4 days at a time. This will usually bring the
bulking under control for a week or so, but filaments soon become
I dominant again. Excessive amounts of chlorine have also been necessary,
up to 68 kg/d (145 Ibs/d).
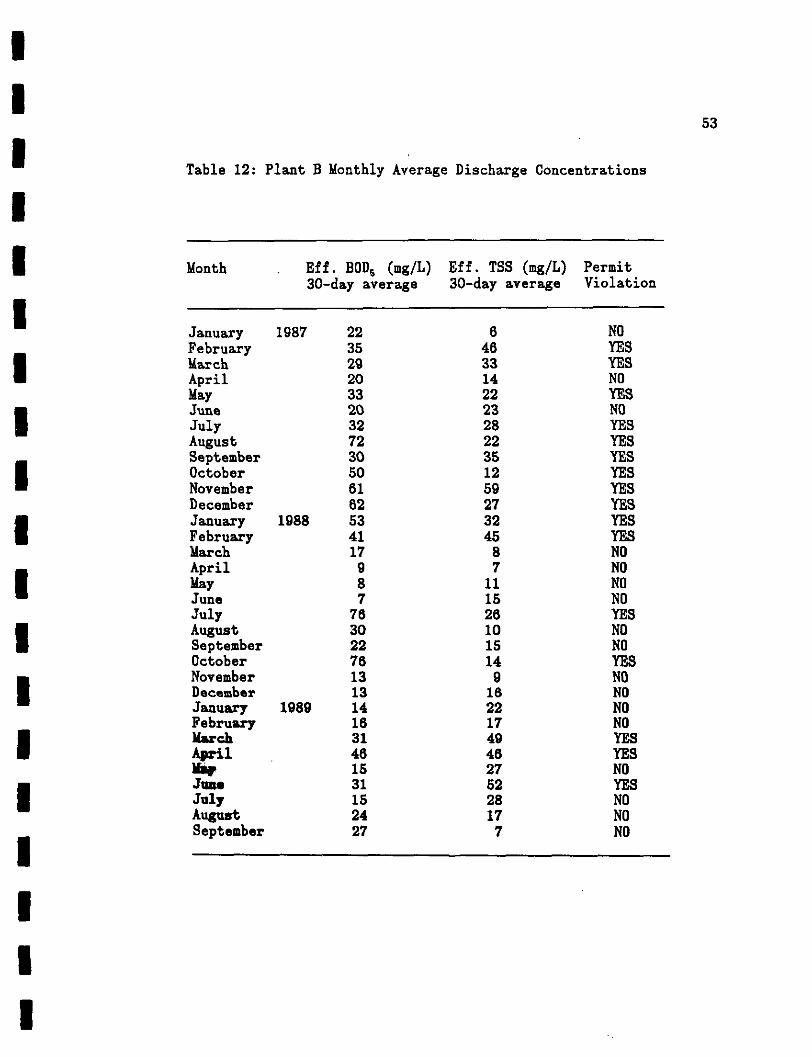
• Although RAS chlorination has been able to bring bulking episodes
• under control, effluent quality has suffered. Shown in Table 12 are the
monthly average effluent concentrations of BOD5 and TSS for about two
• and one half years of operation. The plant's NPDES discharge permit
specifies effluent limits of 30 mg/L for both TSS and BOD6 on a 30-day
i

RAS
EFF
INF
EFF
Figure 14 : Plant B Flow Configuration
enro
IIIIIIIIIIIIIIIIIII
53
Table 12: Plant B Monthly Average Discharge Concentrations
Month . Eff. BOD5 (mg/L) Eff. TSS (mg/L) Permit30-day average 30-day average Violation
January 1987FebruaryMarchAprilMayJuneJulyAugustSeptemberOctoberNovemberDecemberJanuary 1988FebruaryMarchAprilMayJuneJulyAugustSeptemberOctoberNovemberDecemberJanuary 1989FebruaryMarchApril«*JmwJulyAugustSeptember
223529203320327230506162534117987763022761313141631461531152427
6463314222328223512592732458711152610151491622174946275228177
NOYESYESNOYESNOYESYESYESYESYESYESYESYESNONONONOYESNONOYESNONONONOYESYESNOYESNONONO

54
average. Obviously, the plant has been out of compliance on many
occasions.
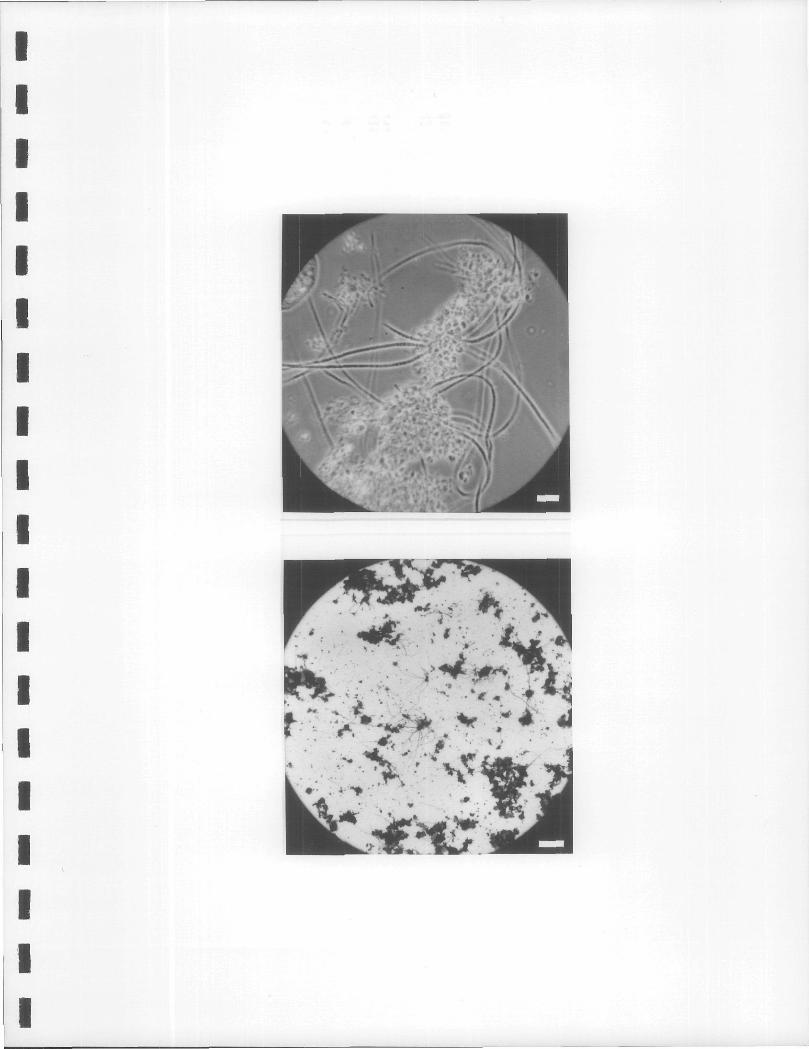
FILAMENTOUS ORGANISM IDENTIFICATION
Samples obtained in May and June of 1989 (days 251 and 285) were
analyzed for filamentous organisms. "Very common" growth of the
filamentous organism Nostocoida limicola II was observed in both
samples. This was the only filamentous organism observed. The
dominance of this organism resulted in substantial bridging of floes. A
significant amount of small dispersed floe were also present (See
Figures 15 and 16).
No definitive cause-effect relationship has been established for N,
limicola II in activated sludge environments, although it has been
observed to be associated with low F/U operation with certain organic
| wastes (starches), low dissolved oxygen (due to its fermentative
mm capabilities) (Richard, 1989a) and also phosphorous deficiency,
• especially in industrial waste systems (Richard, 1989K). A sample of
• this activated sludge was sent to Dr. Michael Richard at Colorado State
University for confirmation of organism identification. His analysis
• indicated predominance of N. limicola II exhibiting atypical staining
and morphological characteristics, a common consequence of industrial
• waste systems. From his experience with this organism in industrial
mm waste plants, he concluded that the probable cause of its predominance
was a phosphorous deficiency (Richard, 1989b).
ii

IIIIII
Figure 15: Plant B Interfloc Bridging by N. limicola II• (1000X phase contrast; bar=10 /*m)
I Figure 16: Plant B Filament Abundance and Floe Structure(100X phase contrast, crystal violet, dried;bar=100 fim)
iiiiiiiiiii
55
IIIIIIIIIIIIIIIIIII
>*\ * V.1Jn • H

i
57
DATA ANALYSIS & CONTROL MEASURES
IIII
Thirteen months of plant operating data were obtained for this
| study. As can be seen from Figure 17a, this plant experiences frequent
m bulking episodes as indicated by elevated SYI values. Virtually all
these episodes were brought under control by dosing the return sludge
8 with chlorine,
A phosphorous deficiency was suggested to the plant operator as the
• probable cause of the bulking problems. This is fairly common with
plants treating food processing wastes. The plant staff has not
• actually analyzed its wastewater for nutrients, but has taken several
m measures to control the problem and has had some success.
(1) In July (days 304+), a change was made from vacuum filtration
• to dissolved air flotation for dewatering of secondary
sludge. About one fourth the amount of lime and ferric
| chloride is now used. Therefore the pH of the filtrate
. returned to the head of the plant is lower and there will be
• less precipitation of phosphorous before the aeration basin.
• (2) Beginning in September of 1080 (days 386+), the plant began
receiving approximately 11.4 m>/d (3000 gal/day) of septage
J from home septic tanks. The reasoning behind this was to take
advantage of any nutrients available from this.
H (3) A fraction of the chlorinated plant effluent is now recycled
to take advantage of residual chlorine available to control
filaments.
ii

IIIIIIIIIIIIIIIIIII
58
500
50 100 150 200 250 300 350
14000
50 100 150 200 250 300 350
Figure 17: Plant B Operating Data
59
(4) The effluent weirs in the aeration basins were raised to
increase 0, transfer efficiency of the surface aerators to
ensure adequate Qs is available now that septage is being
taken in.
' (5) Perhaps the most significant change, however, is the increase
in MLSS (See Figure I7b), which also means an increase in
solids residence time. It has been demonstrated that as
the SRT increases, a higher proportion of the substrate
utilized by the microorganisms is used for energy and cell
maintenance and less for cell reproduction (Sherrard and
Shroeder, 1976). Considering a widely used elemental analysis
of cells, CjoH^Qj^NuP (McCarty, 1970), it is obvious that
the less new cells produced, the lower the nutrient
I requirements.
_ A sludge sample was analyzed at the end of this study. Dominant
• organisms present were N. limicola II and Thiothrix sp. The abundance
• was categorized as "common11, a drop of one abundance category since
implementation of control measures. Larger, more compact floes were
• observed and very few dispersed floes (See Figure 18). Since the end of
this study, the plant has experienced further reduction in filament
iiii
abundance (although some minor bulking episodes have occurred) and
consistent attainment of < 10 mg/L BOD5 and TSS in the effluent.

IIIIII
Figure 18: Plant B Filament Abundance and Floe Structure• After Remedial Action (100X phase contrast,• crystal violet, dried; bar=100
iiiiiiiiiiii
60

II
62
• SUGGESTIONS FOR REMEDIAL ACTION
iSince the implementation of the control measures previously
| mentioned, the SVI has been consistently lower (See Figure 17a, days
_ 300+). Also there has been no need for HAS chlorination. Operating at
' a higher SRT may have so far alleviated the bulking problem, however,
• the average F/M has dropped from 0.30 to 0.14. Low F/M bulking may
develop as a result. In this case the F/U should be increased and
• nutrient addition considered. The addition of nutrients to the aeration
basin based on residual effluent concentrations of 1 mg/L inorganic
• nitrogen (NH, and NQ,-N) and 0.2 mg/L soluble P04-P (Richard, 1989a)
• will ensure adequate nutrient availability, even with the widely varying
BOD5 loading. These minimum residual concentrations in the aeration
• basin effluent are based solely on the concept that if there is a
nutrient residual leaving the aeration basin, it is assumed that
• adequate nutrients were available in the aeration basin.
iiiiiii
63
II" 5.3 PLANT C - Low F/M, Low DO
i| Plant C is a small extended aeration plant (See Figure 19)
_ utilizing intermittent surface aeration (1.5 hours on, 15 min. off) and
™ without primary sedimentation. Its average daily design flow is 0.0079
• m*/s (0.18 mgd) and it is currently treating an average daily flow of
0.0048 m*/s (0.11 mgd). The aeration basin is completely mixed and the
• wastewater is 100% domestic. Average influent BODS and TSS are 220 mg/L
• and 135 mg/L, respectively.
Plant C is operated with an. average mixed liquor DO of 0.2 mg/L,
• although the DO measurements may be artificially low. Samples are
transported to the plant lab in open containers to be measured. With
| the high ULSS present, the DO may be depleted during transport to the
— lab. The intermittent aeration would also contribute to low DO
™ conditions.
• This plant haa experienced high sludge blankets in the secondary
clarifiers and at times severe foaming problems (See Figure 20). The
• foam 017 rise a foot or more when aerators are turned off. The plant
operator feels that this is correlated to increased SET'a (> 30 days)
• due to inability to waste sludge to the aerobic digestor during wet
• weather, since digested sludge is dewatered on outdoor sludge drying
beds. The higher SET is a directly related to higher ULSS concentration
• and therefore a lower F/M ratio.
ii

INF 4 1 j 4,MS
EFF
r
Figure 19 : Plant C Flow Configuration
CTl

IIIIII
Figure 20: Plant C Foaming on Aeration Basin
iiiiiiiiiiiii
65

I

111•111
111
11
11111
67
FILAMENTOUS ORGANISM IDENTIFICATION
Foam and mixed liquor samples were examined microscopically.
Micothrix parvicella and Type 0041 were found to be the dominant
organisms in "abundant" to "excessive" quantities (See Figure 21). Floe
formation was very weak and dispersed. Individual floes were difficult
to discern (See Figure 22) .
The dominant organisms present generally indicate low F/U
conditions. The cause of the presence of U. parvicella foam is unclear,
although it has been associated with excess grease and fats.
DATA ANALYSIS
Plant C operating data is presented in Figure 23. From Figure 23a,
it can be seen that the F/U is generally on the lower end of the typical
design F/U range. It also can be seen that the aeration basin DO is
quite low (See Figure 23b) . Although these values may be artificially
low due to poor sampling technique! it is not uncommon for an extended
aeration plant to have low DO problems. Throughout the study, the SVT
was continually rising (See Figure 23c) . Severe foaming problems were
also experienced on days 22-25. The usual control measure is to add
chlorine to the return sludge and hose down the foam.

IIIIII
Figure 21: Plant C M. parvicella and Type 0041 Abundance• (1000X Gram stain, transmitted light; bar=10 /*m)
( Figure 22: Plant C Floe Morphology (100X phase contrast,crystal violet, dried; bar=100 pm)
iiiiiiiiiii
68
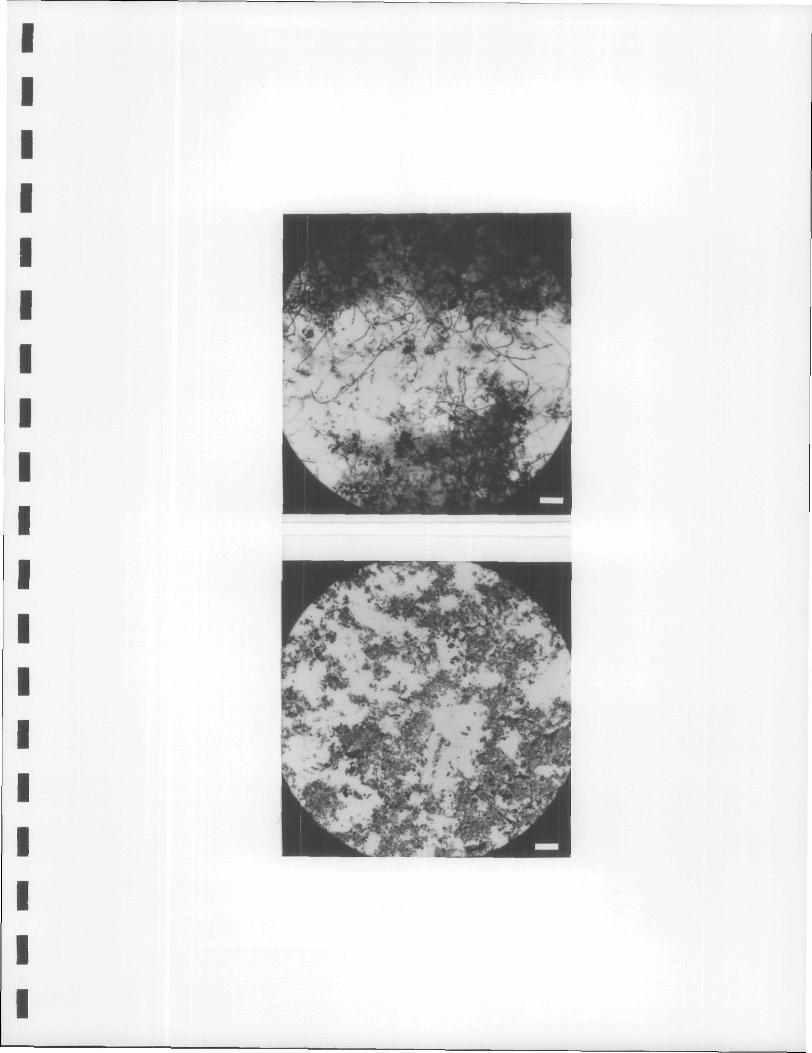
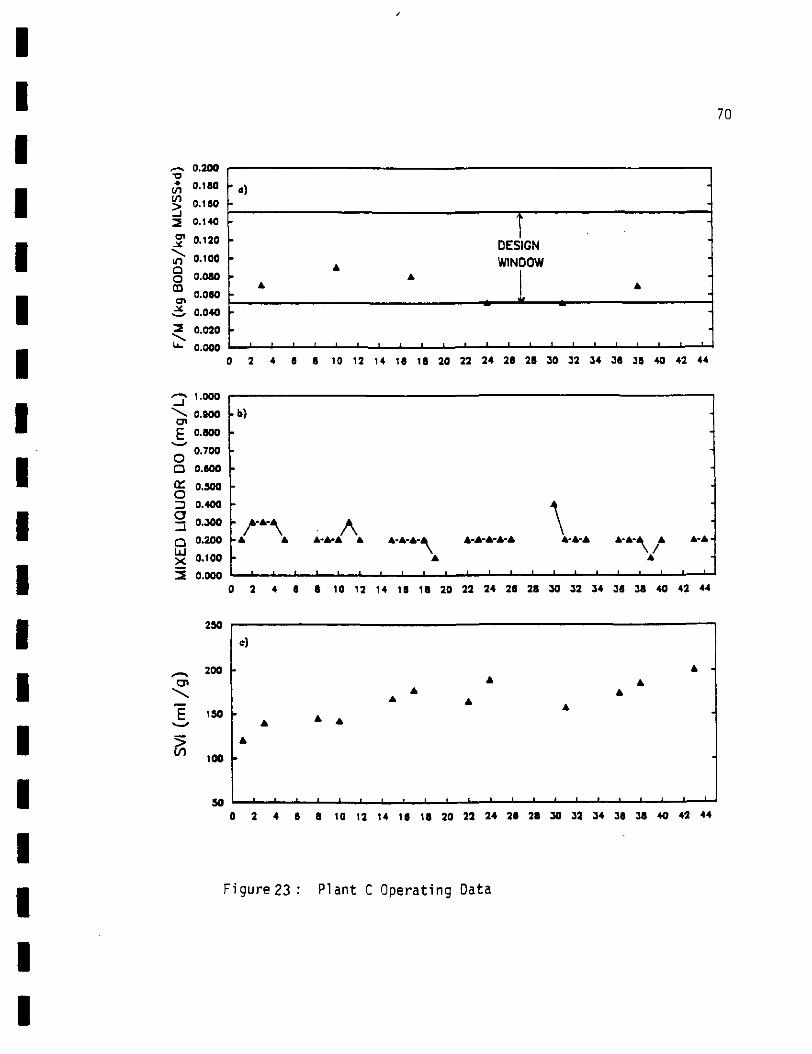
1111111111111111111
•oJ) °-iao
> 0.180
2 0.140
5* 0.120
In o.ioo§ 0.080
'ot 0lOM
£, 0.040
3 Q.020
^ 0.000c
\ 0.800
£ 0.800
*Q 0.700
Q 0.800
9£ 0,500OID 0.400
5 0.300
Q 0.200LU
3 o.ooo
/-s 20°o>
E iso
>OT 100
so
F
• 4
1DESIGN
4 WINDOWA |
A A
2 4 8 8 10 12 14 18 18 20 22 24 20 28 30 32 34 38 38 40 42 44
• b)
• A A A-A-A A A-A-A-A A-A-A-A-A A'A-A A-A-A A A-A-
A A
3 2 4 6 8 10 12 14 18 18 20 22 24 28 28 30 32 34 38 38 40 42 44
c)
A -
* AA A
* A
A A *
A
0 2 4 8 8 10 12 14 10 10 20 22 24 20 28 30 32 34 38 38 40 42 44
igure23 : Plant C Operating Data
70
71
SUGGESTIONS FOR REMEDIAL ACTION
II
iThis plant seems to be suffering from of a number of design and
I operational problems, most notably low DO, low F/M and inability to
• regularly waste sludge. With a low F/M activated sludge, the logical
control measure would be to lower the MLSS by decreasing the SRT. This
• would affect other processes as well. Since the limited sludge storage
capacity is in the aerobic digester and its waste rate is controlled by
| the availability of sludge drying beds, extra sludge storage capacity
_ would be required. This could be accomplished at the present time by
™ using one of the aeration basins to hold digested sludge prior to
• drying, since only one aeration basin is presently being used. Pumps
would also have to be obtained to transport digested sludge from the
• holding basin to the drying beds.
With an increase in F/M, the DO requirement per unit of biomass in
• the aeration basin would be increased. To supply additional oxygen,
• hydrogen peroxide (H O,) could be used instead of sodium hypochlorite to
destroy filaments in the HAS. This would selectively kill filamentous
• organisms and add oxygen to the sludge. Another alternative would be to
replace the present mechanical aerators, which have inadequate oxygen
| transfer capacity, with more efficient and more powerful mechanical
M aerators or a diffused aeration system.
iii
72
5.4 PLANT D - Low F/M, Nutrient Deficiency
IIII^ Plant D is designed for an average daily flow of 0.63 m*/s (14.3
• mgd) and is currently operating at 80!? of this, 0.50 m* /s (11.4 mgd) .
A step feed activated sludge process with surface aeration, as shown in
I Figure 24 is utilized. About 88% of the flow is domestic wastewater,
and the remainder is industrial, mostly from a paper industry. Other
• minor industrial contributors include a leather tannery and several
• circuit board manufacturers. Influent BODS and TSS are 220 (range 150-
700) mg/L and 220 (range 100-1800) mg/L, respectively.
I In the past, Plant D has occasionally experienced bulking and
foaming problems associated with No card i a sp. proliferation. Beginning
• in June of 1989 (day 152+) , however, the plant experienced a steady
increase in filamentous organism abundance and settleability problems.•
• FILAMENTOUS ORGANISM IDENTIFICATION
| The first sample was obtained on day 213 and the SVI at this time
_ was 271 ml/g- It was found to contain "excessive" growth of Micothrix
' parvicella, Type 0041 and Type 1851 (See Figure 25). Nocardia sp. and
• Nostocoida limicola II were also present, but in lesser amounts. From
Table 4, it can be seen that M. parvicella, Type 1851 and Nocardia sp.
I are generally associated with low F/M conditions. Type 0041 and N.
limicola II have been associated with low F/U wastewaters aa well asii

•EFF
INFIT t
HAS
•EFF
Figure 24 : Plant D Flow Configuration

IIIIIIfl Sample 1 (100X phase contrast, crystal violet,
74
Figure 25: Plant D Filament Abundance and Floe Structure-Sample 1 (100X pha:dried; bar=100 fim)
| Figure 20: Plant D Filament Abundance and Floe Structure-Sample 2 (100X phase contrast, crystal violet,
m dried; bar=100 /tin)
iiiiiiiiii
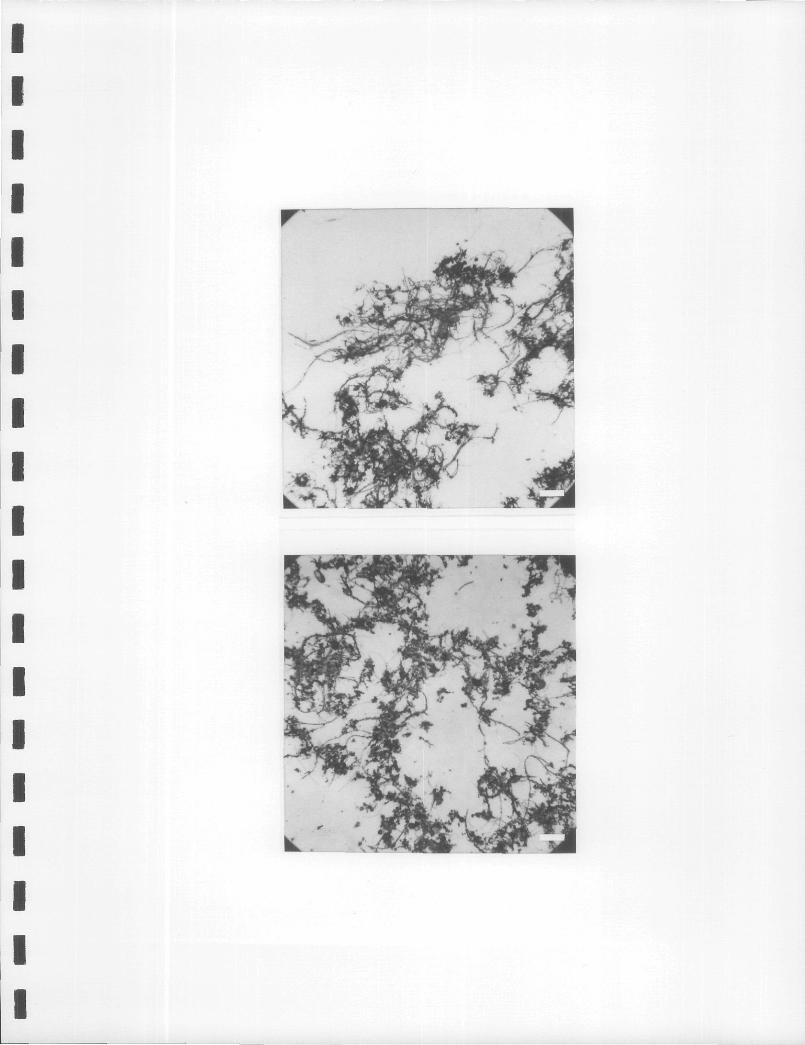
IIIIIIIIIIIIIIIIIII
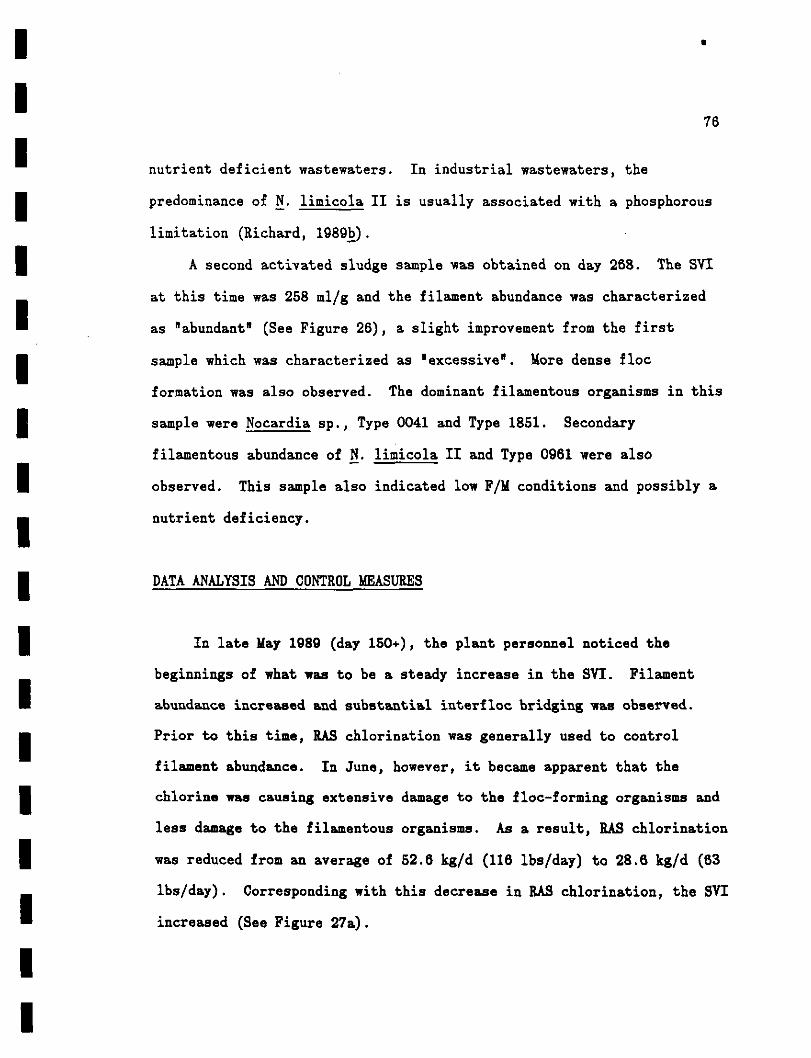
II
76
nutrient deficient wastewaters. In industrial wastewaters, the
I predominance of N. limicola II is usually associated with a phosphorous
limitation (Richard, 1989b).
J A second activated sludge sample was obtained on day 268. The SVI
_ at this time was 258 ml/g and the filament abundance was characterized
• as "abundant" (See Figure 26), a slight improvement from the first
• sample which was characterized as "excessive". More dense floe
formation was also observed. The dominant filamentous organisms in this
I sample were Nocardia sp., Type 0041 and Type 1851. Secondary
filamentous abundance of N. limicola II and Type 0961 were also
ii
observed. This sample also indicated low F/M conditions and possibly a
nutrient deficiency.
DATA ANALYSIS AND CONTROL MEASURES
I In late May 1989 (day 150+), the plant personnel noticed the
beginnings of what was to be a steady increase in the SVI. Filament
• abundance increased and substantial interfloe bridging *as observed.
• Prior to this time, RAS chlorination was generally used to control
filament abundance. In June, however, it became apparent that the
• chlorine was causing extensive damage to the floe-forming organisms and
less damage to the filamentous organisms. As a result, RAS chlorination
| was reduced from an average of 52.6 kg/d (116 Ibs/day) to 28.6 kg/d (63
Ibs/day). Corresponding with this decrease in RAS chlorination, the SVI
• increased (See Figure 27a).
ii
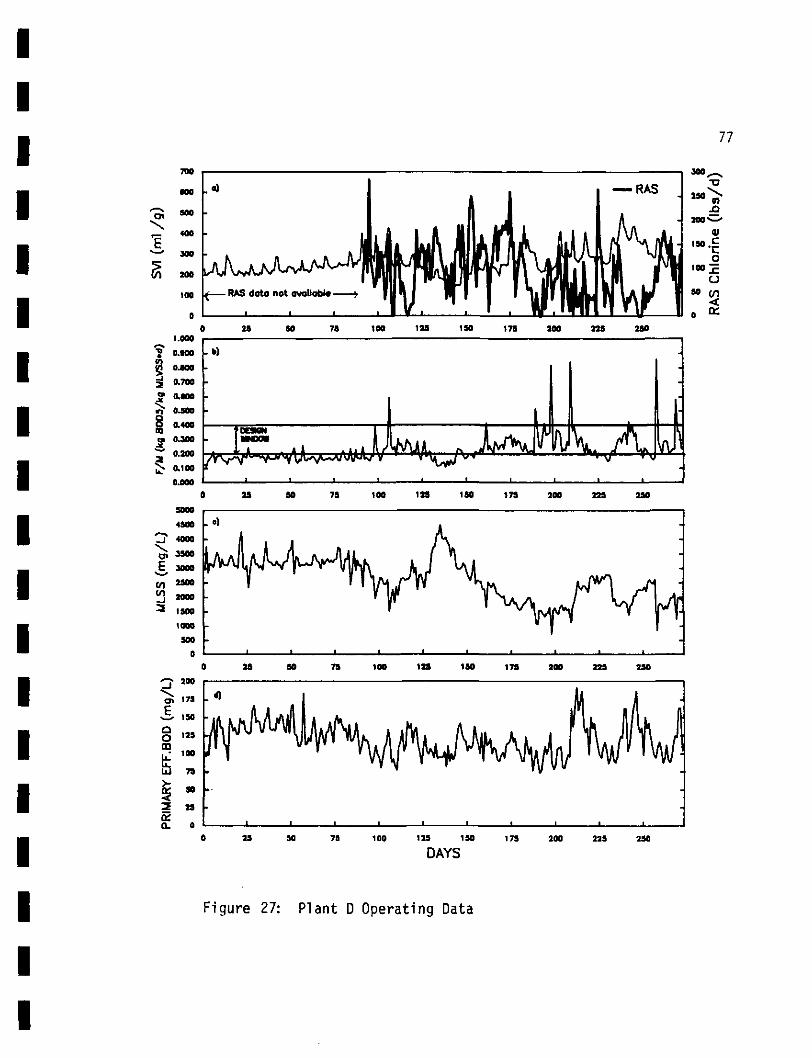
IIIIIIIIIIIIIIIIIII
77
300
0 29 90 75 tOO 129 190 179 200 239 290
OS SO 100 IIS ISO ITS 300 229 390
5000
4500
C? woo"w 3500
E 5000
CO ""3 »»3 1900
1008
500
0
a *•» ITS
§ '»
UJ 79
^ *2 29Ka. o
SO 100 ISO ITS 200 229 250
25 50 T9 100 125 190 179 200 229 250
DAYS
Figure 27: Plant D Operating Data

II•
78
From Figure 27b, it can be seen that the F/M is generally low
• compared to the typical design parameter of 0.2 - 0.4 d"1 (Metcalf &
Eddy, 1979), From Figure 27c, it can be seen that the MLSS
I concentration varied widely during the study. This was due to a
_ ruptured seal in one of the secondary clarifiers which consequently
• caused the production of a very dilute return sludge. This caused the
• HLSS and subsequently the F/M to be difficult to control. Early 1989
data (days 0-90) indicates that although the F/M was low, RAS
• chlorination seemed to keep the SVI fairly stable. Considering the
generally low F/M and the correlation with low F/M filaments being
I dominant, it was concluded that low F/M was the major cause of bulking
• along with the reduction in RAS chlorination.
It was suggested to the plant to change to a plug flow
• configuration (Figure 28) to produce a substrate gradient in the
aeration tank which would select for non-filamentous organisms by
| maintaining a high F/M at the head end of the tank. It was also
suggested that the plant check nutrient levels in the effluent (prior to
™ chlorination) to determine if a nutrient deficiency was indeed present.
• Several years ago the plant had changed to a plug flow
configuration with little success. They found that the system was very
• vulnerable to hydraulic surges and toxic shock loads. They did not feel
trying this again would benefit them. Towards the end of August (" day
I 236), they analyzed their secondary effluent (prior to chlorination)
• and found NH.-N = 0.83 mg/L, NO,-N = 1.0 mg/L and total P04-P = 0.0025
mg/L. Generally, to avoid nutrient deficiency, a residual of about 1
ii

INF
'EFF
HAS
'EFF
Figure 28: Plant D Plufj Flow Configuration
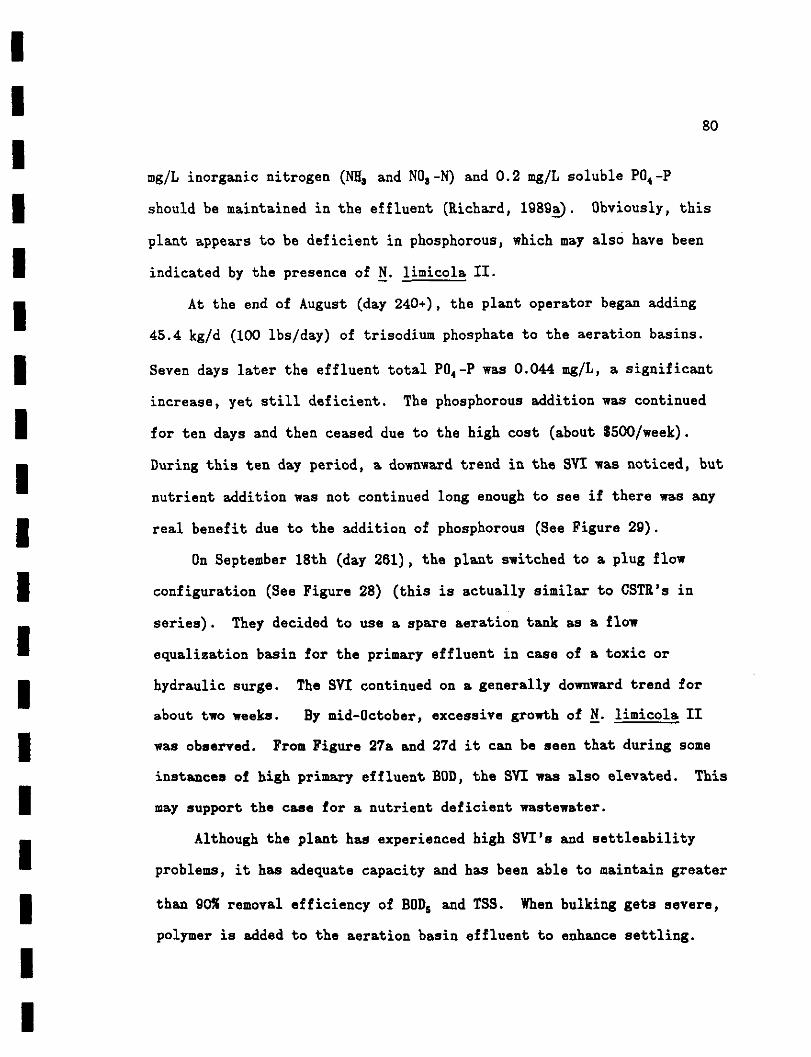
II
80
mg/L inorganic nitrogen (NH, and NOg-N) and 0.2 mg/L soluble P04-P
• should be maintained in the effluent (Richard, 1989a) . Obviously, this
plant appears to be deficient in phosphorous, which may also have been
• indicated by the presence of N. limicola II.
• At the end of August (day 240+), the plant operator began adding
45.4 kg/d (100 Ibs/day) of trisodium phosphate to the aeration basins.
I Seven days later the effluent total P04-P was 0.044 mg/L, a significant
increase, yet still deficient. The phosphorous addition was continued
I for ten days and then ceased due to the high cost (about $500/week).
• During this ten day period, a downward trend in the SYI was noticed, but
nutrient addition was not continued long enough to see if there was any
I real benefit due to the addition of phosphorous (See Figure 29).
On September 18th (day 261)> the plant switched to a plug flow
I configuration (See Figure 28) (this is actually similar to CSTR's in
_ series). They decided to use a spare aeration tank as a flow
™ equalization basin for the primary effluent in case of a toxic or
• hydraulic surge. The SYI continued on a generally downward trend for
about two weeks. By mid-October, excessive growth of N. limicola II
• was observed. From Figure 27a and 27d it can be seen that during some
instances of high primary effluent BOD, the SYI was also elevated. This
| may support the case for a nutrient deficient wastewater.
_ Although the plant has experienced high SVI's and settleability
B problems, it has adequate capacity and has been able to maintain greater
• than 9055 removal efficiency of BOD5 and TSS. When bulking gets severe,
polymer is added to the aeration basin effluent to enhance settling.
ii
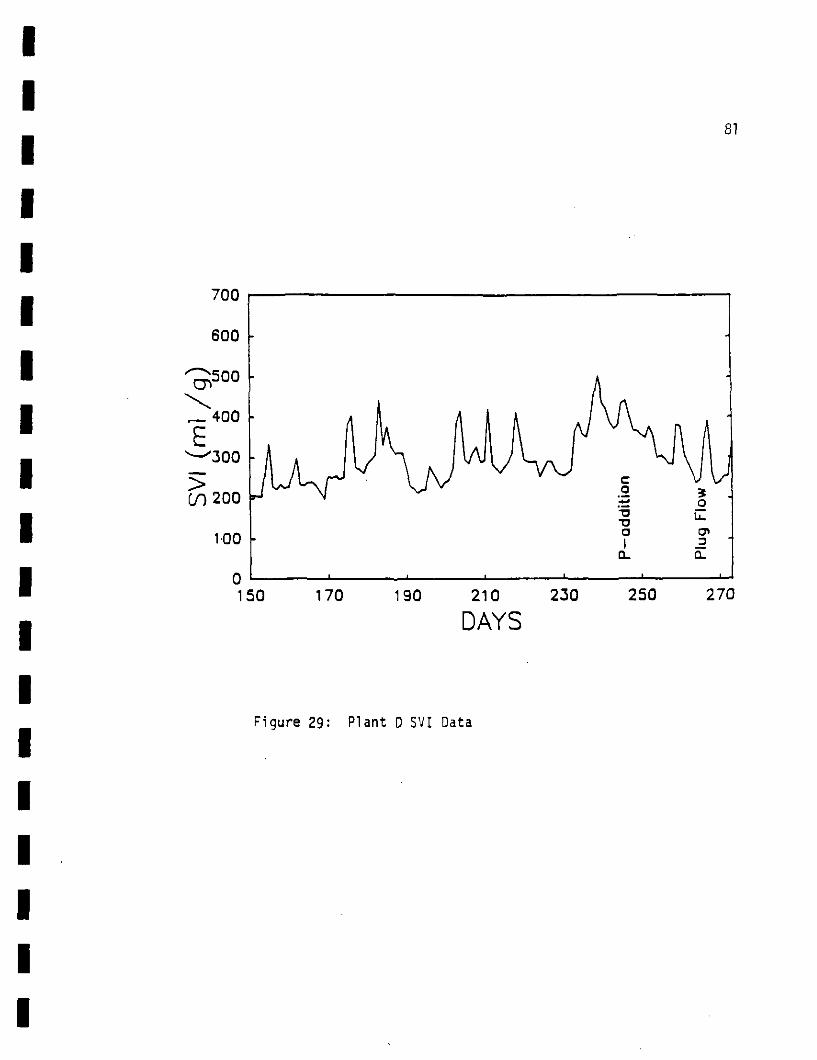
700
CO 200
81
150 170 190 210 230
DAYS250 270
Figure 29: P lant D SVI Data

II
82
SUGGESTIONS FOR REMEDIAL ACTION
iIt appears that Plant D is suffering from a combination of low F/U
| and phosphorous limited conditions. A similar case study was reported
. by Jenkins et al. (1988). A plant with a mixture of domestic and pulp
and paper wastwaters (among other industry) was experiencing bulking
• caused by Type 1851, N. limicola II, Type 0875 and Type 0041. The plant
installed a selector, filament abundance subsequently decreased and a
I nonbulking condition was achieved. In that case, a selector provided a
high F/U ratio in the mixture of HAS and primary effluent prior to
• aeration. A selector, in providing a higher initial F/M, may also
• provide a higher initial nutrient loading and so select for
nonfilamentous organisms.
• In the case of Plant D, a selector would be the best alternative
from an operational perspective, although costs for pipe and channel
| rerouting and basin construction may be prohibitively expensive. The
_ proposed selector flow configuration is shown in Figure 30. Before
™ considering installation of a selector, nutrient addition should be
• evaluated once again for a longer period of time. A minimum residual
F04-F concentration of about 0.2 mg/L in the aeration basin effluent
• should be maintained to ensure the availability of nutrients in the
aeration basin. If nutrient addition is not shown to be beneficial, its
• use can be ruled out and a selector should be considered. If it is
• successful, either phosphorous addition alone or a combination of
selector and nutrient addition may be necessary.
ii
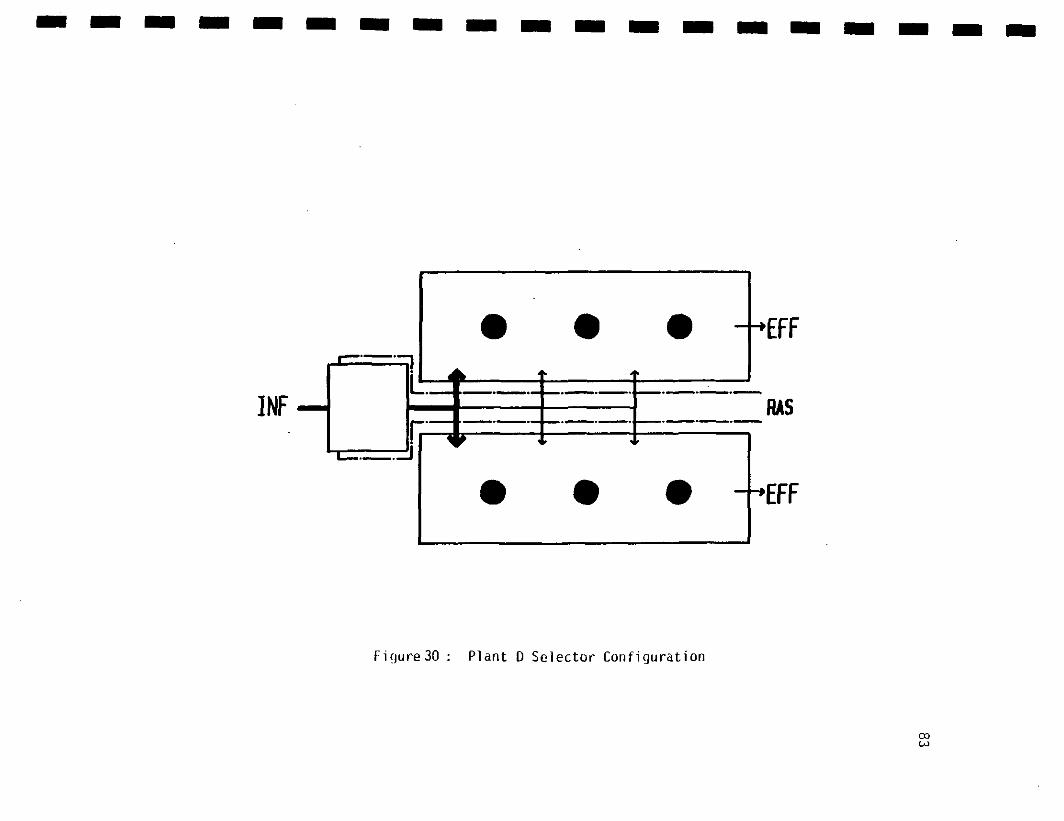
n
INF —LL
Fr
•EFF
HAS
•EFF
Figure 30 : Plant D Selector Configuration
COCO
II— In the meantime, RAS chlorination could be increased for short
I periods of time. The plant has found that continouus addition
ofchlorine can be maintained for about 7 days before significantly
• affecting the floe structure.
iiiiiiiiiiiiii
84
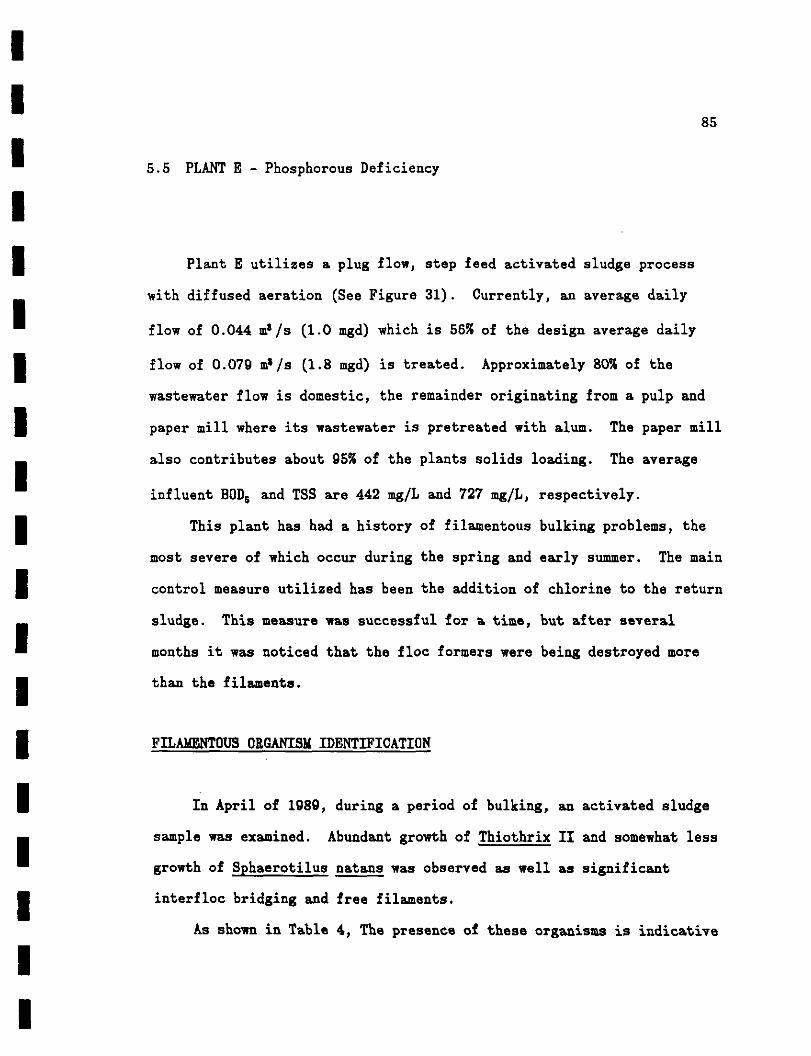
I85
• 5.5 PLANT E - Phosphorous Deficiency
i• Plant E utilizes a plug flow, step feed activated sludge process
with diffused aeration (See Figure 31). Currently, an average daily
B flow of 0.044 m3/s (1.0 mgd) which is 5656 of the design average daily
• flow of 0.079 m*/s (1,8 mgd) is treated. Approximately 80% of the
wastewater flow is domestic, the remainder originating from a pulp and
| paper mill where its wastewater is pretreated with alum. The paper mill
— also contributes about 95?? of the plants solids loading. The average
influent BOD5 and TSS are 442 mg/L and 727 mg/L, respectively.
• This plant has had a history of filamentous bulking problems, the
most severe of which occur during the spring and early summer. The main
| control measure utilized has been the addition of chlorine to the return
_ sludge. This measure was successful for a time, but after several
• months it was noticed that the floe formers were being destroyed more
• than the filaments.
I FILAMENTOUS ORGANISM IDENTIFICATION
| In April of 1080, during a period of bulking, an activated sludge
_ sample was examined. Abundant growth of Thiothrix II and somewhat less
m growth of Sphaerotilus natans was observed as well as significant
• interfloc bridging and free filaments.
As shown in Table 4, The presence of these organisms is indicative
ii
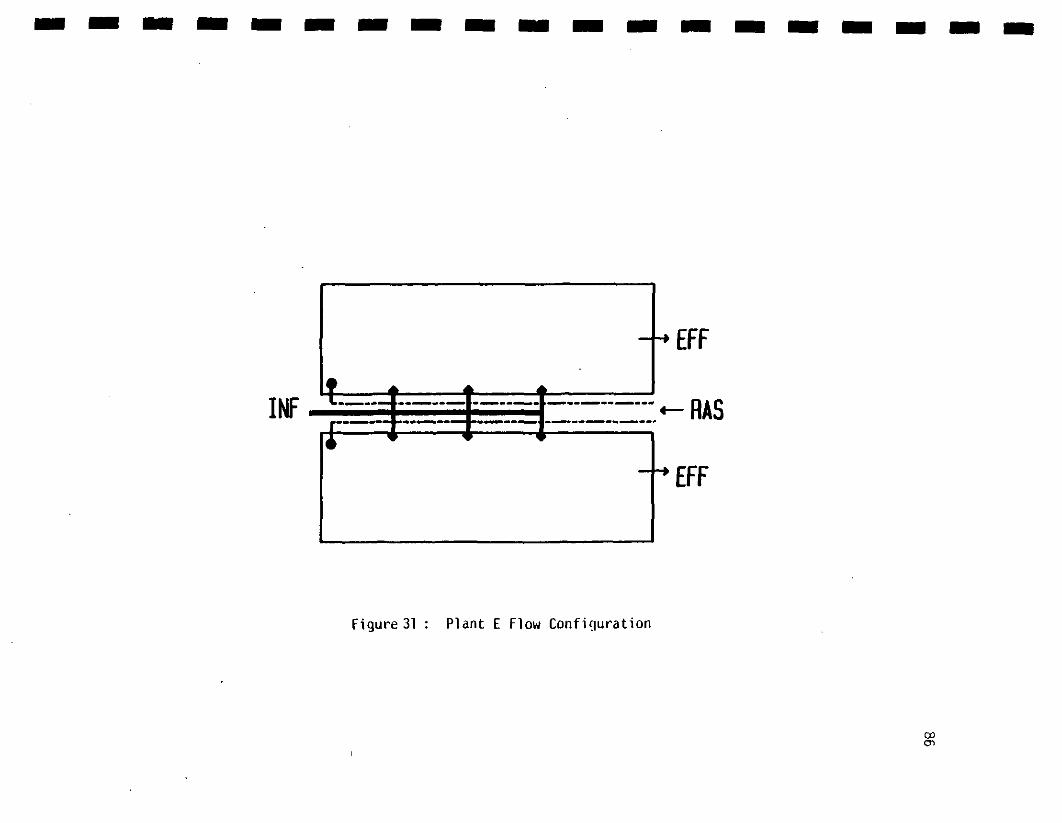
EFF
INF 'IT ~Ji 'Ij.j. -... . RAS
EFF
Figure 31 : Plant E Flow Configuration
CDcn
II
87
I of a nutrient deficient wastewater, a common problem with mixed domestic
• and paper wastes.
| DATA ANALYSIS AND CONTROL MEASURES
In late March of 1989, total phosphorous and nitrogen of the
I primary effluent was analyzed and found to be deficient in phosphorous.
A sample of secondary effluent prior to chlorination was also analyzed
I and was found to contain 0.2 mg/L total phosphorous. In general, a
_ minimum of 0.2 mg/L soluble P04-P should be maintained in the aeration
• basin effluent to ensure adequate nutrients have been available in the
• aeration basin. Thus it was determined that the plant was suffering
from a phosphorous deficiency.
I The SVT was initially reduced by RAS chlorination, then addition of
phosphorous commenced. RAS chlorination was also discontinued at this
I time (Figure 32a). Primary effluent is pumped by screw pumps to the
• aeration basins. The phosphorous mixture (40-509 available P*0S» 20.49
calcium, 11.99 sulfur) was obtained in powdered form from a lawn care
I company. An average of 18.1-36.3 kg/d (40-80 Ibs/day) (See Figure 32b)
of the phosphorous mixture is added to the screw pump wet wells.
I Dosages are based on maintaining an aeration basin effluent
_ orthophosphate residual of 1-2 mg/L in the secondary effluent to ensure
• adequate nutrients were available in the aeration basin.
• Since the inception of phosphorous addition, RAS chlorination at
the plant has ceased except in severe bulking cases (Figure 32a).
ii

IIIIIIIIIIIIIIIIIII
TD\tn
INuc/icr
n-O
UJIAOOl/l=3Oo:oa.(/ioX0_
80
70
BO
30
40
JO
20
10
0
200
1M
IM
140
130
100
M
n40
aoo
- a )
100 130 300 ISO 300 350
»46X available P205
30 100 200 290 300 350
ozou
LU
100 1S0 200 290 300 390500
490
400
390
MO
d)
100 1 90 200 290 300 390
DAYS
NOTE: MISSING DATA ARE INTERPOLATED FOR CLARITY
Figure 32 : Plant E Operating Data
II
89IBulking frequency has decreased and the duration of bulking episodes has
• so far been drastically reduced. Plant performance has also been
— enhanced. As shown in Figure 32c, effluent BOD5 and TSS are generally
• lower and more consistent. A second sample was analyzed after several
I months of phosphorous addition. Filament abundance had decreased. The
dominant organisms present were Thiothrix sp., S. natans and Type 0041.
iSUGGESTIONS FDR REMEDIAL ACTION
• The addition of phosphorous was demonstrated to be effective for
bulking control at this plant, drastically reducing HAS chlorine demand.
• It currently costs the plant about three times as much to add
phosphorous as it does to add chlorine. The addition of phosphorous is
I a means of preventing bulking, whereas RAS chlorination alleviates the
symptoms of the problem, although not always successfully.
™ In order to reduce costs for phosphorous addition, a form with more
• available phosphorous should be used. With the phosphorous mixture,
only 46% by weight is actually available phosphorous. Liquid phosphoric
• acid could be used instead and dosed continuously instead of once a day
which may provide better control of bulking. This would reduce the
| chemical volume needed as well as the labor involved. The dosing rate
M could be adjusted as necessary. There would be an initial capital
outlay required for dosing and storage equipment, however. The plant is
I currently considering this type of phosphorous addition. Prior to
implementing this approach, the plant operator wants to obtain a full
ii

90
II
year of data with phosphorous addition to evaluate the advantages over
• chlorination in terms of overall plant performance and long term costs.
iIiiiiiiiiiiiii

IIII
91
5.6 PLANT F - Nutrient Deficiency
| Plant F is currently treating an average wastewater flow of 0.10
• m*/s (2.3 mgd), about 72% of its design capacity for average daily flow.
The wastewater is 45% industrial (from a paper manufacturer) and 55!?
I domestic. A complete mix activated sludge system is utilized with
surface aeration (See Figure 33). Average influent BOD5 and TSS are 195
I mg/L and 330 mg/L, respectively.
• Approximately two years prior to this study, the design engineer of
the plant determined that the cause of the frequent bulking episodes was
• nutrient deficiency, as evidenced by the presence of the filamentous
organisms Sphaerotilus natans and Thiothrix sp. Control measures
| implemented were the addition of nutrients: 45.4 kg/d (100 Ibs/day)
urea as a nitrogen source and 7.6 L/d (2 gal/day) 85% phosphoric acid.
• This controlled the bulking adequately, with bulking occurring less
• frequently.
In early September 1989, the feed pump for the urea failed and
• replacement parts were unavailable for about four weeks. During this
time, th« SVI rose to a peak of 539 ml/g (See Figure 34a) and then
| decreased. The decline in SVI is attributable to an increased HAS
_ chlorination rate.
iii

iINF
I
\
MS
•EFF
€FF
F1gure33 : Plant F Flow Configuration
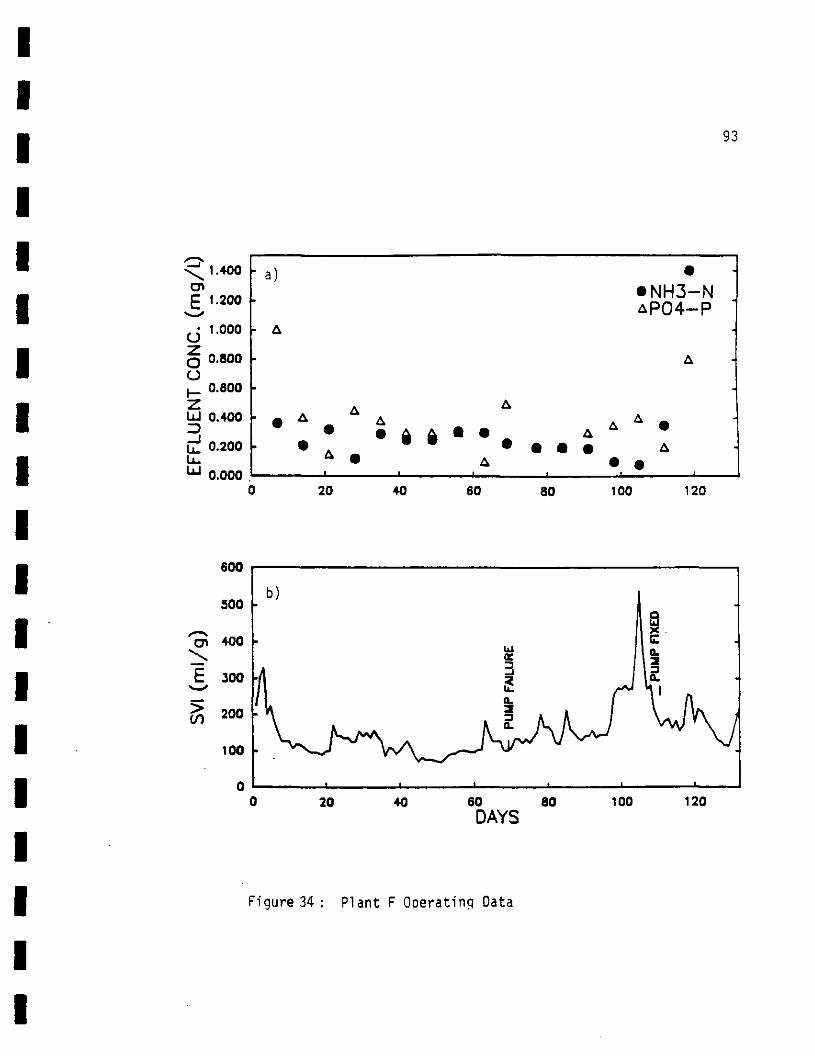
IIIIIIIIIIIIIIIIIII
93
\ 1.400
£ 1.200
• t.OOO(J
Q 0.800o,_ 0.800
UJ 0.400^^*
— \CZ 0-200u.^ o.ooo
'a) • -•NH3-NAR04-P
r A
A
•
• • * * ^ ^ A * .* • A A ft • A
• A ^ • • • A. * ,A . '. •
20 40 60 80 100 120
60 80DAYS
100 120
Figure 34: Plant F Ooerating Data
94
FILAMENTOUS ORGANISM IDENTIFICATION
IIII
An activated sludge sample was obtained 5 days after the peak SVI
I occurred. Microscopic examination revealed dominant growth of
M Sphaerotilus natans and Thiothrix sp. (See Figure 35). At the time of
sampling, the SVI had decreased to 193 ml/g, so the overall abundance
I was not too serious. A slime coating as well as incidental attached
growth was observed associated with S. natans, indicating a nutrient
I deficient wastewater. Trichomes of S. natans were unhealthy, observed
to be broken, bent and with numerous gaps where the individual cells had
• lysed. This is a typical consequence of heavy HAS chlorination. The
• presence of Thiothrix sp. also can be indicative of nutrient deficiency,
usually nitrogen. Thiothrix sp. also exhibited damage from
I chlorination. Very few rosette formations (Trichomes radiating from a
common origin) were present and mostly single and broken filaments were
| observed.
• DATA ANALYSIS
iPlant operating data were obtained for three months prior to the
• bulking episode and are shown in Figure 34. A nutrient deficient waste
is also suggested by the data. In Figure 34b, it can be seen that the
| SVI began to steadily increase around the second week of September,
tm corresponding to the failure of the urea pump. At this same time, the
effluent nitrogen (NH,-N) concentration steadily decreased due to the
ii

IIIIII
Figure 35: Plant F Abundance of £J. natans and Thiothrix sp.
|
(100X phase contrast, crystal violet, dried;bar=100
IlIIliiillll
95


II
97
lack of nutrient addition (Figure 34a).
• About October 13th, the SVT reached a peak and HAS chlorination was
increased, leading to a rapid drop in filament abundance and SVI. On
| October 18th, the urea pump was placed back on line and RAS chlorination
_ was gradually decreased over the next several days. The SVI declinedI™ for several days then increased, probably due to inadequate RAS
• chlorination.
I SUGGESTIONS FOR REMEDIAL ACTION
• A common method to avoid nutrient deficiency is to add a source of
• nitrogen (ammonia, (NH4)SS04, NH4C1, NH4NO,) and/or phosphorous (H,P04,
NajP04, (NH4)2P04) in such amounts to ensure that a residual of about
| 1.0 mg/L inorganic nitrogen (NH, and NO,-N) and 0.2 mg/L soluble P04-P
_ remains in the aeration basin effluent (Richard, 198Qa). An adequate
• residual of phosphorous is maintained at Plant F, generally above 0.2
I mg/L soluble P04-P. With the addition of urea at 45.4 kg/d (100
Ibs/day), they are able to maintain a NH,-N residual of about 0.25 mg/L.
I In conjunction with RAS chlorination, this controls the bulking fairly
mm well, Although the SVI will rise above 200 occasionally, probably when
the influent BOD is high. It would be to the plant's benefit to
• maintain a higher residual NH,-N (up to 1 mg/L) at all times or try to
match the urea dosing to the strength of the wastewater. This would
| ensure adequate nutrients at times of high BOD and could reduce the need
_ for RAS chlorination.
i

IIII
IIIIIIIIIIIIII
98
The problem encountered during the most recent bulking episode was
due to the failure of a pump. To prevent a repeat of this situation, a
backup pump should be kept on hand to be used when repair or maintenance
I is required on the main pump.

99
CHAPTER VI
CONCLUSIONS AND RECOMENDATIONS
IIIII
Filamentous bulking is a significant problem affecting more than
I 50% of all activated sludge plants. Filamentous organism identification
• is a valuable aid in determining the probable cause(s) of bulking
episodes and can be performed easily by a trained individual in 1-2
• hours. Through this research and much previous work, case studies have
established effective remedial alternatives for various bulking
| situations and substantiated the relationship between organism type and
_ cause of bulking.
™ Several conclusions and recommendations have been reached as a
• result of this research. They are as follows:
(1) The probable cause(s) of filamentous bulking was deter-
• mined through filamentous organism identification at the
plants studied.
| (2) Analysis of the operating data of the plants studied
_ supported the cause(s) of bulking indicated by the filamentous
organisms present.
B (3) Remedial actions were suggested based on filamentous organism
identification and plant data analysis. Of the plants which
• implemented remedial actions, most were successful in
eliminating the bulking problem.
ii

I™ 100
B (4) Of the procedures evaluated, the Manual on the Causes and
I Control of Activated Sludge Bulking and Foaming by Jenkins et~
al. (1986) was found to be the most useful for filamentous
• organism identification and bulking control. It provides the
most complete and up-to-date coverage of filamentous organisms
I in activated sludge, their causes, case studies and bulking
tm and foaming control measures. It is also easily utilized by
treatment plant staff.
I (5) Currently in Massachusetts, it is not economically feasible
for most plants to implement filamentous organism monitoring
I programs. Most of the plants are small and thus do not have
the manpower and financial resources available.
• (6) Statewide or regional assistance and training programs
• on activated sludge filamentous bulking should be established.
These could provide cost effective and timely evaluations of
• local bulking problems and assistance in implementing
appropriate remedial actions.i« Further research should be directed towards:
(1) determining the causes of predominance of less common
• filamentous organisms,
(2) further defining the growth requirements of filamentous
I organism types,
(3) determining the characteristics of filamentous organisms in
• industrial waste systems, and
ii

IIIIIIIIIIIIIIIIIII
101
(4) ensuring that operator training includes information on the
role of filamentous organisms in normal and bulking sludges.

IIIIIIIIIIIIIIIIIII
102
REFERENCES
Adamse, A. D., "Bulking of Dairy Waste Activated Sludge," WaterResources, vol. 2, p715, 1968.
Blackboard, J. R., Ekama, G. A. and Marais, G. v. R., "A Survey ofFilamentous Bulking and Foaming in Activated-Sludge Plants in SouthAfrica," Water Pollution Control, vol. 1, p90, 1986.
Broderick, T. A. and Sherrard, J. H,, "Treatment of Nutrient DeficientWastewaters," Journal Water Pollution Control Federation, vol. 57,P1178, 1985.
Buswell A. M. and Long, H. L., "Microbiology and Theory of ActivatedSludge," Journal American Water Works Association, vol. 10, p308,1923.
Carter, J. L. and McKinney, R. G., "Effects of Iron on Activated SludgeTreatment," Journal Environmental Engineering Division, Proceedingsof the American Society of Civil Engineers, vol. 99, p!35, 1973.
Chiesa, 3. C. and Irvine, R. L., "Growth and Control of FilamentousMicrobes in Activated Sludge: An Integrated Hypothesis," WaterResearch, vol. 19, p471, 1985.
Chudoba, J., "Control of Activated Sludge Filamentous Bulking-VI:Formulation of Basic Principles," Water Resources, vol. 19, p!017,1985a.
Chudoba, J., Cech, J. S., Farkac, J. and Grau, P., "Control of ActivatedSludge Filamentous Bulking: Experimental Verification of a KineticSelection Theory," Water Research, vol. 19, p!91, 1985b.
Chudoba, J., Grau, P. and Ottova, V., "Control of Activated SludgeFilaaentous Bulking-I: Effect of the Hydraulic Regime or Degree ofMixing in an Aeration Tank," Water Resources, vol. 7, pl!63, 1973 .
Chudoba, J.S., Grau, P. and Ottova, V., "Control of Activated SludgeFilamentous Bulking-II: Selection of Microorganisms by Means of aSelector," Water Resources, vol. 7, p!389, 1973b.
Cyrus, Z. and Sladka, A., "Several Interesting Organisms Present inActivated Sludge," Hydrobiologia, vol. 35, p383, 1970.
Daigger, G. T., Robbins Jr., H. H., and Marshall, B. R., "The Design ofa Selector to Control Low F/M Filamentous Bulking,* Journal WaterPollution Control Federation, vol. 57, p220, 1985.
IIIIIIIIIIIIIIIIIII
103
Dias, F. P., Dondero, N. C. and Finstein, M. S., "Attached Growth ofSphaerotilus and Mixed Populations in a Continuous Flow Apparatus'1,Applied Microbiology, vol. 16, pl!91, 1968.
Dick, R. I. and Vesilind, P. A., "The Sludge Volume Index-What Is It?/Journal Water Pollution Control Federation, vol. 41, p!285, 1969.
Eikelboom, D. H., "Filamentous Organisms Observed in Activated Sludge,"Water Research, vol. 9, p365, 1975b.
Eikelboom, D., "Identification of Filamentous Organisms in BulkingActivated Sludge," Proceedings of the IAWPR Workshop on Design andOperation Interactions at Large Wastewater Treatment Plants, Vienna,Austria, Sept. 8-12,1975a.
Eikelboom, D. H., "Microscopic Sludge Investigation in Relation toTreatment Plant Operation," Chapter 3 in Bulking of ActivatedSludge; Preventative and Remedial Methods, B. Chambers and E. J.Tomlinson, Eds., Ellis Horwood Ltd., Chichester, England, 1982.
Eikelboom, D. and van Buijsen, H., Microscopic Sludge InvestigationManual, TNO Research Institute, Netherlands, 1981.
Emtiazi, G., Habibi, M. H. and Setareh, M., "Novel Filamentous Spore-Forming Iron Bacteria Causes Bulking in Activated Sludge," Journalof Applied Bacteriology, vol. 67, p99, 1989.
Engelbrecht, R. S. and UcKinney, R. E., "Activated Sludge CulturesDeveloped on Pure Organic Compounds," Sewage and Industrial Wastes,vol. 29, p!350, 1957.
Farquhar, G. J. and Boyle, W. C., "Control of Thiothrix in ActivatedSludge,1 Journal Water Pollution Control Federation, vol. 44, p!4,1972.
Farquhar, G. J. and Boyle, W. C., "Identification of Filamentous Micro-organisms in Activated Sludge," Journal Water Pollution ControlFederation, vol. 43, p604, 1971a.
Farquhar, G. J. and Boyle, W. C., "Occurrence of Filamentous Micro-organisms in Activated Sludge,1 Journal Water Pollution ControlFederation, vol. 43, p779, 1971b.
Ford, D. L. and Eckenfelder, W. W., "Effect of Process Variables onSludge Floe Formation and Settling Characteristics,1 Journal WaterPollution Control Federation, vol. 39, p!850, 1967.
Greenberg, A. E., Klein, G. and Kaufman, W. J., "Effect of Phosphorouson the Activated Sludge Process," Sewage and Industrial Wastes,vol. 27, p277, 1955.

IIIIIIIIIIIIIIIIIII
104
Hao, 0. J., "Isolation, Characterization and Continuous Culture Kineticsof a New Sphaerotilus Species Involved in Low Oxygen Activated SludgeBulking," Ph.D. Dissertation, Dept. of Civil Engineering, Univ. ofCalifornia, Berkeley, CA, 1982.
Hao, 0. J., Richard, M. G., Jenkins, D. and Blanch, H., "The HalfSaturation Coefficient for Dissolved Oxygen: A Dynamic Method forits Determination and its Effect on Dual Species Competition,9
Biotechnology and Bioengineering, vol. 35, p403, 1983.
Heukelekian, H. and Ingols, R. S., "Studies on Activated Sludge Bulking11. Bulking Induced by Domestic Sewage," Sewage Works Journal, vol.12, p693, 1940.
Hobson, T., Evaluating and Controlling Your Activated Sludge Process,Hobson's Choice Press, Saling, KS, 1987.
Houtmeyers, J., "Relations Between Substrate Feeding Pattern andDevelopment of Filamentous Bacteria in Activated Sludge Processes,"Agricultura. vol. 26, pi, 1978.
Hunerberg, K., Sarfert, F. and Frenzel, H. J., "Bin Beitrag zum Problem'Blahschlamm1," Gas Wasserfach, vol. Ill, p7, 1970.
Jenkins, D., Richard, U. G. and Daigger, T., Manual on the Causes andControl of Activated Sludge Bulking and Foaming, Ridgeline Press,Lafayette, CA, 1986.
Jones, P. H., "Studies on the Ecology of the Filamentous Sewage Fungus,Geotrichum candidum,1 Ph.D. Thesis, Northwestern University,Evanston, IL, USA, 1964.
Jones, P. H., "The Effect of Nitrogen and Phosphorous Compounds on Oneof the Microorganisms Responsible For Sludge Bulking," Presented atthe 20th Industrial Waste Conference, Purdue University, WestLafayette, IN, USA, 1965.
Lackey, J. B. and Wattie, E., "The Biology of Sphaerotilus natans(Kutfting) in Relation to Bulking Activated Sludge,B Sewage andIndustrial Wastes, vol. 12, p669, 1940.
Lao, A. 0., Strom, P. F. and Jenkins, D., "Growth Kinetics ofSphaerotilus natans and a Floe Former in Pure and Dual ContinuousCulture," Journal Water Pollution Control Federation, vol. 58, p41,1984a.
Lao, A. 0., Strom, P. F. and Jenkins, D., "The Competitive Growth ofFloe-forming and Filamentous Bacteria: A Model for ActivatedSludge Bulking," Journal Water Pollution Control Federation, vol. 58,p52, 1984b.

IIIIIIIIIIIIIIIIIII
105
Lee, S-B., Koopman, B. L., Jenkins, D. and Lewis, R. F., "The Effect ofAeration Basin Configuration on Activated Sludge Bulking at LowOrganic Loading,1 Water Science and Technology, vol. 14, p407, 1982.
Linne, S. R. and Chiesa, S. C., "Operational Variables Affecting Per-formance of the Selector-Complete Mix Activated Sludge Process,"Journal Water Pollution Control Federation, vol. 59, p716, 1987.
Logan, R. P. and Budd, W. E., "Effect of BOD Loading on Activated SludgePlant Operation in Biological Treatment of Sewage and IndustrialWastes," Aerobic Oxidation, vol. 1, p271, 1956.
Martin, A. J., The Activated Sludge Process, XIV, MacDonald and Evans,London, p415, 1927.
McCarty, P. L., "Phosphorous and Nitrogen Removal by BiologicalSystems," Proc. Wastewater Reclamation and Reuse Workshop, LakeTahoe, CA, June 25-27, 1970.
Merkel, G. J.( "Observations on the Attachment of Thiothrix toBiological Surfaces in Activated Sludge," Water Research, vol. 9,p881, 1975.
Metcalf ft Eddy, Inc., Wastewater Engineering: Treatment, Disposal,Reuse, McGraw-Hill, New York, 1979.
Mohlman, F. W., "The Sludge Index," Sewage Works Journal, vol. 8, pl!9,1934.
Morgan, E. H. and Beck, A. J., "Carbohydrate Wastes Stimulate Growthof Undesirable Filamentous Organisms in Activated Sludge," SewageWorks Journal, vol. 1, p46, 1928.
Palm, J. C., Jenkins, D. and Parker, D. S., nRelationship BetweenOrganic Loading, Dissolved Oxygen Concentration and SludgeSettlability in the Completely-Mixed Activated Sludge Process,"Journal Water Pollution Control Federation, vol. 52, p2484, 1980.
Pasveer, A., "A Caae of Filamentous Activated Sludge," Journal WaterPollution Control Federation, vol. 41, p!340, 1969.
Pipes, W. 0., "Bulking of Activated Sludge," Advances in AppliedMicrobiology, vol. 9, p!85, 1967.
Pipes, W. 0., "Bulking, Deflocculation and Pinpoint Floe," JournalWater Pollution Control Federation, vol. 51, p62, 1979.
Pipes, W., "Types of Activated Sludge Which Settle Poorly," JournalWater Pollution Control Federation, vol. 41, p714, 1969.
Process Control Manual For Aerobic Biological Wastewater Treatment
IIIIIIIIIIIIII
IIII
106
Facilities, EPA 430/9-77-006, 1977.
Rensink, J. H., "New Approaches to Preventing Sludge Bulking," JournalWater Pollution Control Federation, vol. 46, p!888, 1974.
Rensink, J. H., "Cure and Prevention of Bulking Sludge in Practice,"Tribune du Cebedeau, No. 432, p445, 1979.
Richard, M. G., "Activated Sludge Microbiology," Water Pollution ControlFederation, Alexandria, VA, 1989a,
Richard, M. G., Personal Communication, 1989b.
Richard, M. G., Hao, 0. and Jenkins, D., "Growth Kinetics ofSphaerotilus Species and their Significance in Activated SludgeBulking," Presented at the 55th Annual Conference of the WaterPollution Control Federation, St. Louis, MO, 1982b.
Richard, M. G., Jenkins, D., Hao, Q. and Shimizu, G., The Isolation andCharacterization of Filamentous Micro-organisms from ActivatedSludge Bulking, Report No. 81-2, Sanitary Engineering andEnvironmental Health Research Laboratory, Univ. of California,Berkeley, CA, 1982a.
Richard, M. G., Shimizu, G, P. and Jenkins, D., "The Growth Physiologyof the Filamentous Organism type 021N and its Significance toActivated Sludge Bulking," Presented at .the 57th Annual Conference,Water Pollution Control Federation, New Orleans, LA, 1984.
Richard, M. G., Shimizu, G., Jenkins, D., Williams, T. and Una, R. F.,"Isolation and Characterization of Thiothrix and Thiothrix-tikeFilamentous Organisms from Bulking Activated Sludge," Presented atthe Annual Meeting of the American Society for Microbiology,New Orleans, LA (Abs. Ann. Meet.. Q60, p270.), 1983.
Ruchhoft, C. C. and Watkins, J. H., "Bacteriological Isolation and Studyof the Filamentous Organisms in the Activated Sludge of the DesPlaines River Sewage Treatment Works," Sewage Works Journal, vol. 1,p52, 1928.
• Sezgin, H., Jenkins, D. and Parker, D., "A Unified Theory of Filamentous* Activated Sludge Bulking," Journal Water Pollution Control
Federation, vol. 50, p362, 1978.
Sherrard, J. H. and Schroeder, E. D., "Stoichiometry of IndustrialBiological Wastewater Treatment," Journal Water Pollution ControlFederation, vol. 48, p742, 1976.
Slijkhuia, H., "Micpthrix parvicella. a Filamentous Bacterium Isolatedfrom Activated Sludge: Cultivation in a Chemically Defined Medium,"Applied and Environmental Microbiology, vol. 46, p832, 1983]).

IIIIIIIIIIIIIIIIIII
107
Slijkhuis, H., "The Physiology of the Filamentous Bacterium Micothrixparvicella," Ph.D. Thesis, Wageningen, Holland, 1983a.
Slijkhuis, H. and Deinema, M. H., "The Physiology of Micothrixparvicella, a Filamentous Bacterium Isolated from ActivatedSludge," Chapter 5 in Bulking of Activated Sludge: Preventative andRemedial Methods, B. Chambers and E. J. Tomlinson, Eds., EllisHorwoodLtd., Chichester, England, 1982.
Sonoda, Y., Tanaka, S. and Ishida Y., "Activated Sludge Treatment Usinga Bubble Column," Journal of Fermentation Technology, vol. 51, p813,1973.
Stokes, J. I*, and Parson, W. L., "Role of Poly-^-hydroxybutyratein the survival of Sphaerotilus discophorus During Starvation",Canadian Journal of Microbiology, vol. 14, p785, 1968.
Strom, P. and Jenkins, D., "Identification and Significance ofFilamentous Microorganisms in Activated Sludge,1 Journal WaterPollution Control Federation, vol. 58, p449, 1984.
Switzenbaum, U. S., Plante, T. R. and Woodworth, B. K., ActivatedSludge Bulking Handbook, University of Massachusetts/Ainherst, USAt1990.
The Causes and Control of Activated Sludge Bulking and Foaming,EPA 625/8-87/012, 1987.
Tomlinson, E. 0. and Chambers, B., "Methods for Prevention of Bulkingin Activated Sludge," Water Pollution Control, vol. 78, p524, 1979.
Tomlinson, E. J., "The Emergence of the Bulking Problem and the CurrentSituation in the U.K.," Chapter 1 in Bulking of Activated Sludge:Preventativc and Remedial Methods, B. Chambers and E. J. Tomlinson,Eds., Ellis Horwood Ltd., Chichester, England, 1982.
van Veen, W., "Bacteriology of Activated Sludge, in Particular theFilamentous Bacteria," Antonio van Leeuwenhoek, vol. 39, p!89, 1973.
Voelkel, K. G., Martin, D. W. and Bearing, R. W., "Joint Treatment ofMunicipal and Pulp Mill Effluents," Journal Water Pollution ControlFederation, vol. 46, p634, 1974.
Wagner, F., "Study of the Causes and Prevention of Sludge Bulking inGermany," Chapter 2 in Bulking of Activated Sludge: Preventative andRemedial Methods, B. Chambers and E. J. Tomlinson, Eds., EllisHorwoodLtd., Chichester, England, 1982.
Wanner, J. and Grau, P., "Identification of Filamentous Microorganismsfrom Activated Sludge: A Compromise Between Wishes, Needs, andPossibilities,11 Water Research, vol. 23, p883, 1989.

IIIIIIIIIIIIIIIIIII
108
Wheeler, M. L., Jenkins, D. and Richard, M. G., "The Use of a Selectorfor Bulking Control at the Hamilton, Ohio, U.S.A., Water PollutionControl Facility," Water Science & Technology, vol. 18, p35, 1984.
White, M. J, D., Tomlinson, E. J. and Chambers, B., "The Effect ofPlant Configuration on Sludge Bulking," Progress in Water Technology,vol. 12, p!83, 1980.
Wood, D. K. and Tchobanoglous, G., "Trace Elements in Biological WasteTreatment," Journal Water Pollution Control Federation, vol. 47,p!933, 1975.
Wood-worth, B, K. (In Progress), "Activated Sludge Bulking inMassachusetts: The Magnitude of the Problem and an EngineeringEvaluation of Remedial Control Measures," MS Project, University ofMassachusetts/Amherst, USA, 1990.

I™ 109
I APPENDIX ILIST OF SYMBOLS
iBOD5 5-day Biochemical Oxygen Demand (mg/L)
I DO Dissolved Oxygen (mg/L)
F/M Food-to-Microorganism Ratio (kg BODS applied/kg MLVSS*d)
| MLSS Mixed Liquor Suspended Solids (mg/L)
mm MLVSS Mixed Liqour Volatile Suspended Solids (mg/L)
• RAS Return Activated Sludge
• S0 BODB Applied to Aeration Basin (mg/L)
SRT Solids Residence Time (days)
I SVI Sludge Volume Index (ml/g)
• 6 Hydraulic Residence Time (days)
TSS Total Suspended Solids (mg/L)
• X MLSS (mg/L)
iiiiiii

IIIIIIIIIIIIIIIIIII
110
APPENDIX IISTAINING PROCEDURES
Table II-l: Gram Stain Procedure
REAGENTS:
FISHER Diagnostics Gram Stain Kit SG100
Gentian Violet SolutionCrystal Violet Stain 0.5S w/vMethanol 20% w/vAmmonium Oxalate 0.8% w/v
Gram's Iodine SolutionIodine 0.33K w/vPotassium Iodide 0.66X w/v
DecolorizerAcetone 25% v/vIsopropyl Alcohol 75% v/v
Safranin SolutionSaf ranin 0 1% w/v
PROCEDURE:
1. Prepare thin smears on microscope slides and thoroughly air dry(do not heat fix).
2. Stain 1 minute with Gentian Violet Solution; rinse 1 secondwith water.
3. Stain 1 minute with Gram's Iodine Solution; rinse well withwater.
4. Hold slide at an angle and decolorize with Decolorizer addeddrop by drop to the smear for 25 seconds. Do not overdecolorize. Blot dry.
5. Stain with Safranin Solution for 1 minute; rinse well withwater and blot dry.
6. Examine under oil immersion at 1000X magnification with directillumination (not phase contrast): Blue-violet is positive;pink to red is negative.
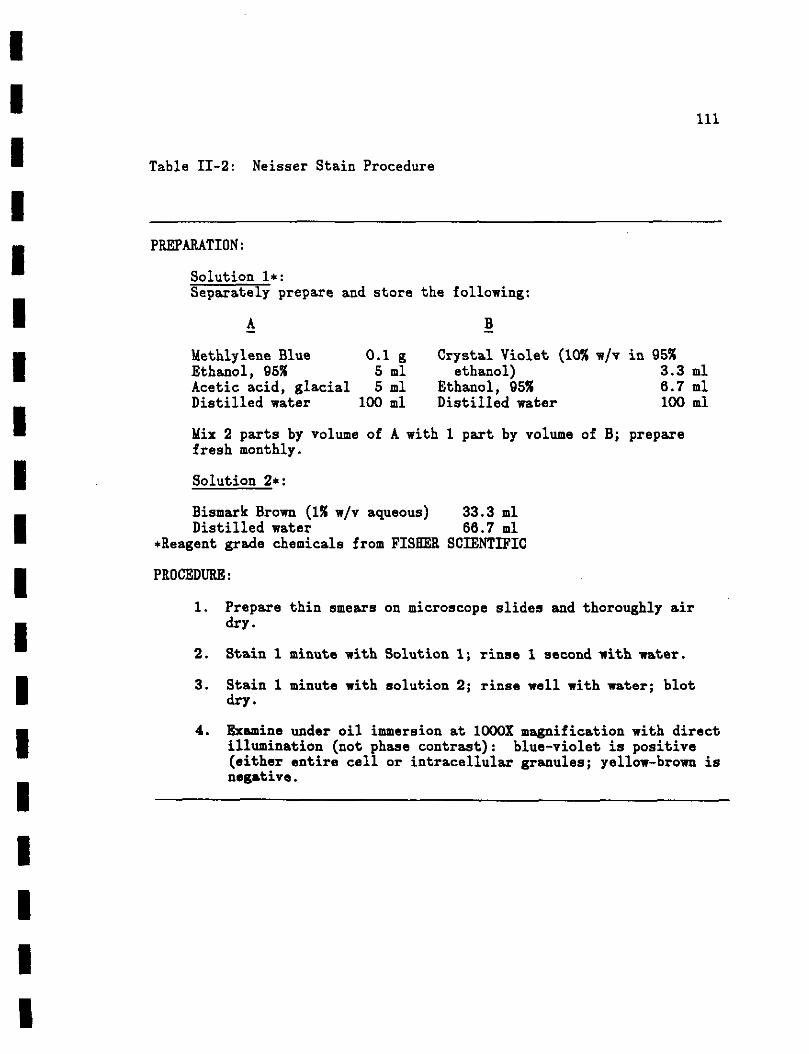
IIIIIIIIIIIIIIIIIII
111
Table II-2: Neisser Stain Procedure
PREPARATION:
Solution 1*:Separately prepare and store the following;
A B
Methlylene Blue 0.1 g Crystal Violet (10% w/v in 95%Ethanol, 9551 5 ml etbanol) 3.3 mlAcetic acid, glacial 5 ml Ethanol, 95% 6.7 mlDistilled water 100 ml Distilled water 100 ml
Mix 2 parts by volume of A witb 1 part by volume of B; preparefresh monthly.
Solution 2*:
Bismark Brown (1% w/v aqueous) 33.3 mlDistilled water 66.7 ml
*Reagent grade chemicals from FISHER SCIENTIFIC
PROCEDURE:
1. Prepare thin smears on microscope slides and thoroughly airdry.
2. Stain 1 minute with Solution 1; rinse 1 second with water.
3. Stain 1 minute with solution 2; rinse well with water; blotdry.
4. Examine under oil immersion at 1000X magnification with directillumination (not phase contrast): blue-violet is positive(either entire cell or intracellular granules; yellow-brown isnegative.
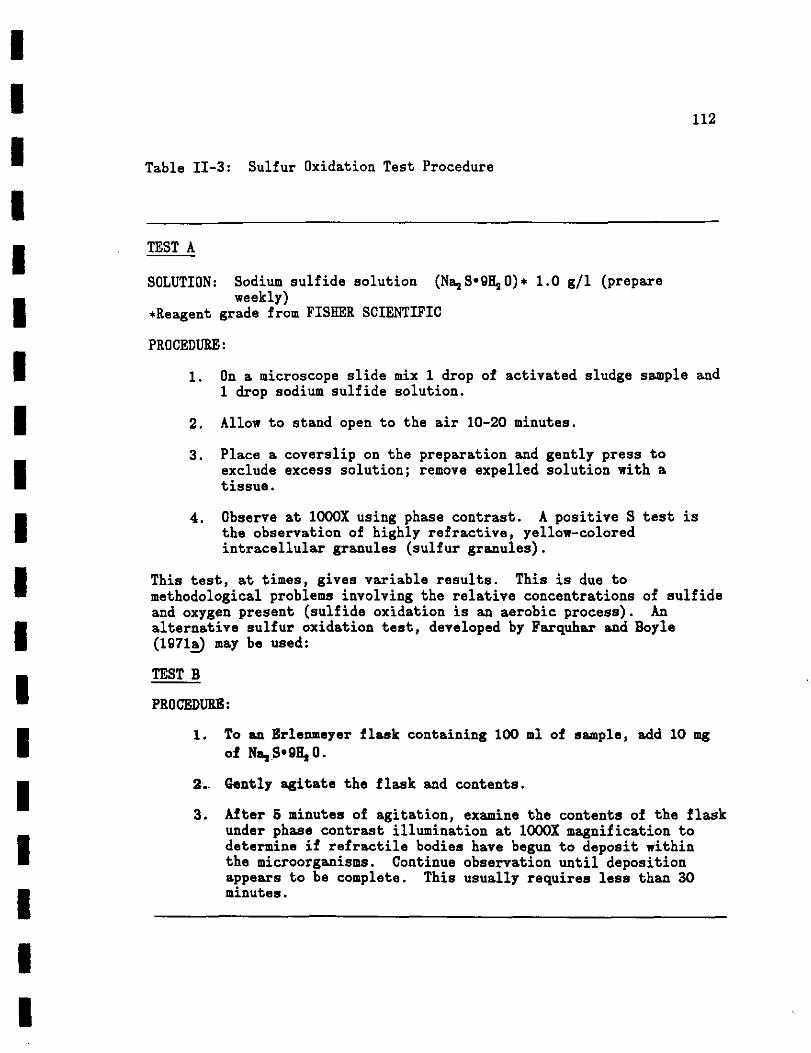
IIIIIIIIIIIIIIIIIII
112
Table II-3: Sulfur Oxidation Test Procedure
TEST A
SOLUTION: Sodium sulfide solution (NaaS'QHjO)* 1.0 g/1 (prepareweekly)
*Reagent grade from FISHER SCIENTIFIC
PROCEDURE:
1. On a microscope slide mix 1 drop of activated sludge sample and1 drop sodium sulfide solution.
2. Allow to stand open to the air 10-20 minutes.
3. Place a coverslip on the preparation and gently press toexclude excess solution; remove expelled solution with atissue.
4. Observe at 1000X using phase contrast. A positive S test isthe observation of highly refractive, yellow-coloredintracellular granules (sulfur granules).
This test, at times, gives variable results. This is due tomethodological problems involving the relative concentrations of sulfideand oxygen present (sulfide oxidation is an aerobic process). Analternative sulfur oxidation test, developed by Farquhar and Boyle(1971a) may be used:
TEST B
PROCEDURE:
1. To an Erlenmeyer flask containing 100 ml of sample, add 10 mgof Na, S-flHjO.
2. Gently agitate the flask and contents.
3. After 5 minutes of agitation, examine the contents of the flaskunder phase contrast illumination at 1000X magnification todetermine if refractile bodies have begun to deposit withinthe microorganisms. Continue observation until depositionappears to be complete. This usually requires less than 30minutes.
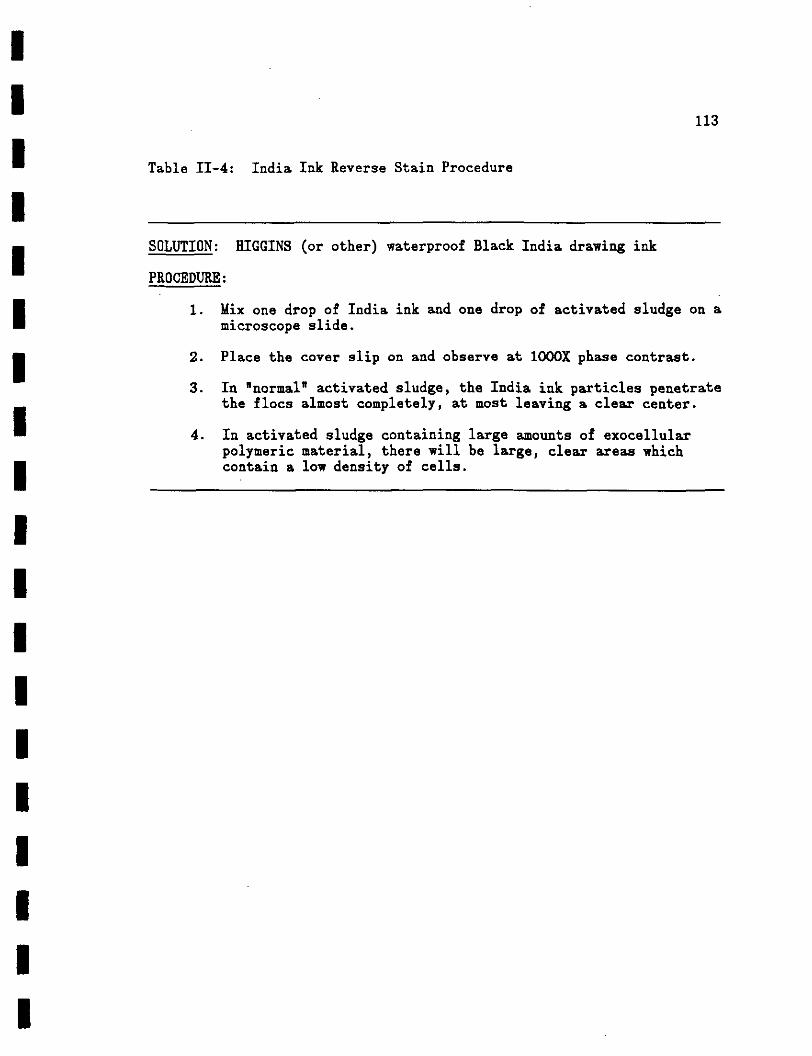
II™ Table II-4: India Ink Reverse Stain Procedure
i• SOLUTION: HIGGINS (or other) waterproof Black India drawing ink
™ PROCEDURE:
I I. Mix one drop of India ink and one drop of activated sludge on amicroscope slide.
• 2. Place the cover slip on and observe at 1000X phase contrast.
3. In "normal" activated sludge, the India ink particles penetrate_ the floes almost completely, at most leaving a clear center.
' 4. In activated sludge containing large amounts of exocellularpolymeric material, there will be large, clear areas which
• contain a low density of cells.
iiiiiiiiii

1111
11•w
1
111111111
114
Table II-5: Polyhydroxybutyrate (PHB) Stain Procedure
PREPARATION:
SOLUTION 1+: Sudan Black B, 0.3?E w/v in 60K ethanol.
SOLUTION 2*: Safranin 0, 0.5% w/v aqueous.*Reagent grade chemicals from FISHER SCIENTIFIC
PROCEDURE:
1. Prepare a thin smear on a microscope slide and thoroughly airdry.
2. Stain 10 minutes with Solution 1; add more stain if the slidestarts to dry out.
3. Rinse 1 second with water.
4. Stain 10 seconds with Solution 2; rinse well with water;/ *
blot dry.
5. Examine under oil immersion at 1000X magnification withtransmitted light: PHB granules will appear as intracellular,blue-black granules while cytoplasm will be pink or clear.
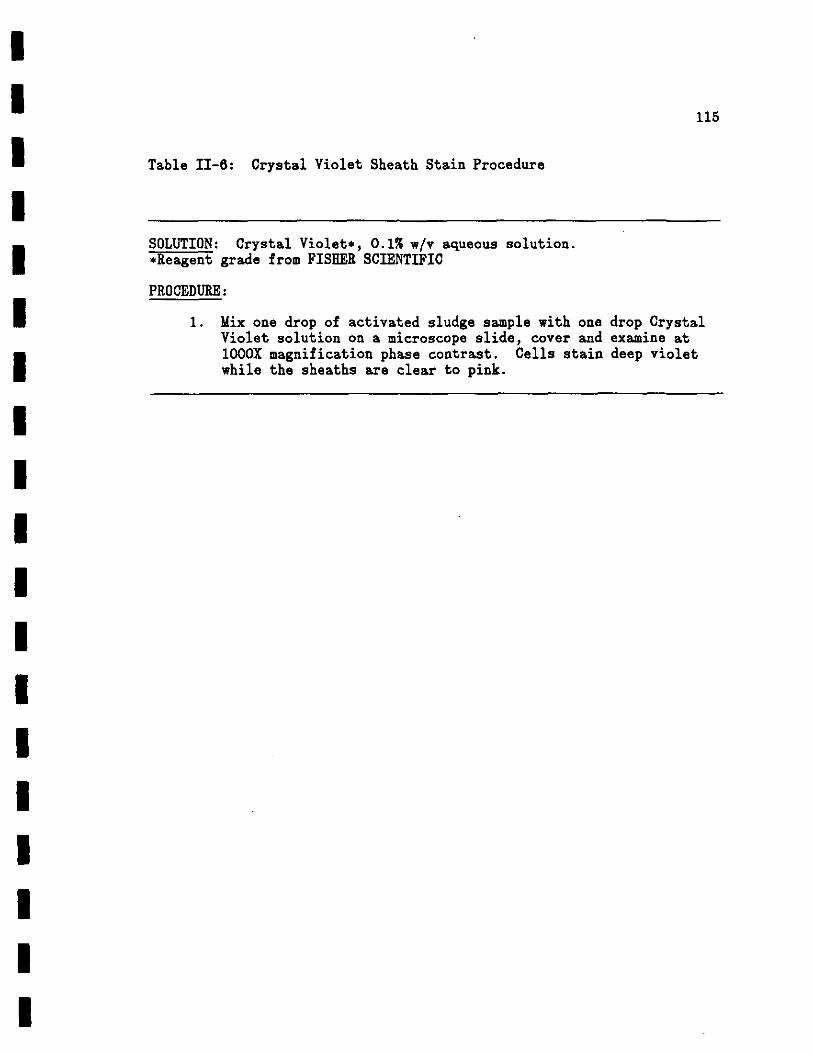
11M
11111111111111111
115
Table II-6: Crystal Violet Sheath Stain Procedure
SOLUTION: Crystal Violet*, 0.1% w/v aqueous solution.*Reagent grade from FISHER SCIENTIFIC
PROCEDURE:
1. Mix one drop of activated sludge sample with one drop CrystalViolet solution on a microscope slide, cover and examine at1000X magnification phase contrast. Cells stain deep violetwhile the sheaths are clear to pink.
Related Documents