1 Solvent-modulation of the structure and dimensionality in lanthanoid- anilato coordination polymers Samia Benmansour*, Irene Pérez Herráez, Christian Cerezo Navarrete, Gustavo López Martínez, Cristian Martínez-Hernández and Carlos J. Gómez García* Supporting Information Powder X-ray Diffraction analysis (PXRD) The phase purity of all compounds except 2 was confirmed by comparing their experimental powder X- ray diffraction patterns with the simulated ones from the single crystal X-ray structure determination. For compound 2 we only obtained a few single crystals and could not perform a powder X-ray diffractogram. These diffratograms are displayed in figures S1-S5 for compounds 1, 3-6, respectively. Figure S1. Experimental and simulated X-ray powder diffractograms for compound [Er 2 (C 6 O 4 Cl 2 ) 3 (H 2 O) 6 ]·10H 2 O (1). Electronic Supplementary Material (ESI) for Dalton Transactions. This journal is © The Royal Society of Chemistry 2018

Welcome message from author
This document is posted to help you gain knowledge. Please leave a comment to let me know what you think about it! Share it to your friends and learn new things together.
Transcript
1
Solvent-modulation of the structure and dimensionality in lanthanoid-
anilato coordination polymers Samia Benmansour*, Irene Pérez Herráez, Christian Cerezo Navarrete, Gustavo López Martínez,
Cristian Martínez-Hernández and Carlos J. Gómez García*
Supporting Information
Powder X-ray Diffraction analysis (PXRD)
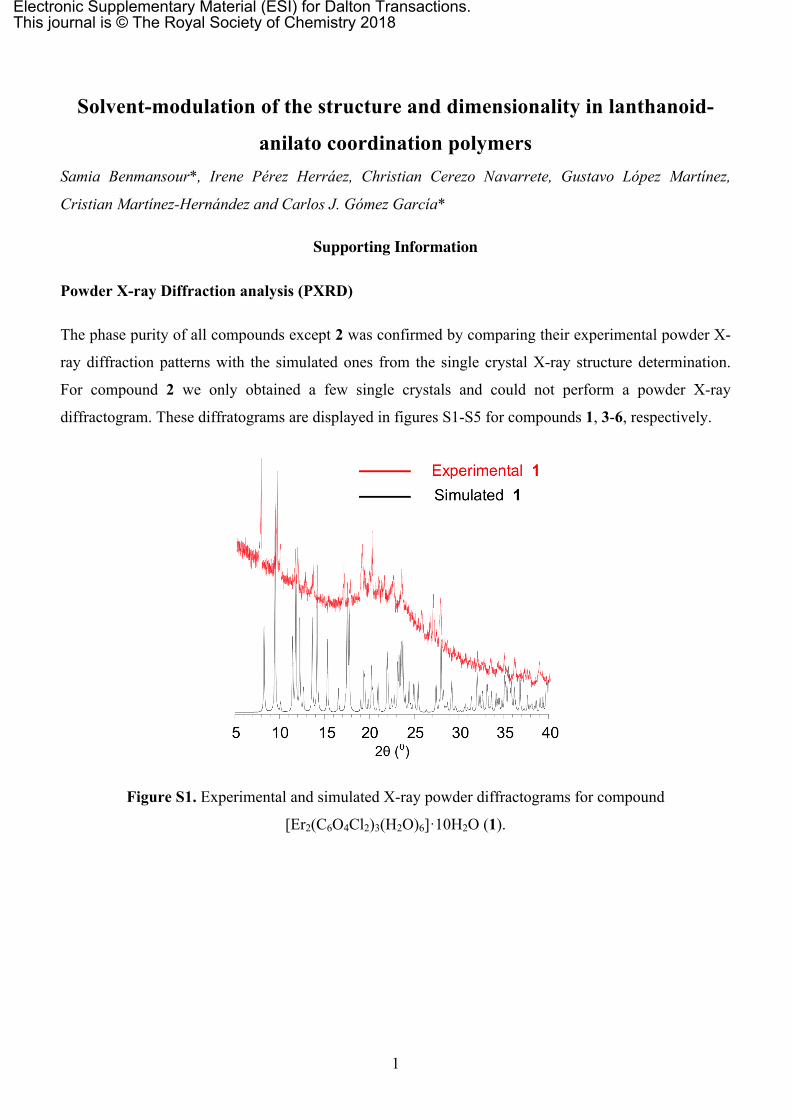
The phase purity of all compounds except 2 was confirmed by comparing their experimental powder X-
ray diffraction patterns with the simulated ones from the single crystal X-ray structure determination.
For compound 2 we only obtained a few single crystals and could not perform a powder X-ray
diffractogram. These diffratograms are displayed in figures S1-S5 for compounds 1, 3-6, respectively.
Figure S1. Experimental and simulated X-ray powder diffractograms for compound
[Er2(C6O4Cl2)3(H2O)6]·10H2O (1).
Electronic Supplementary Material (ESI) for Dalton Transactions.This journal is © The Royal Society of Chemistry 2018
2
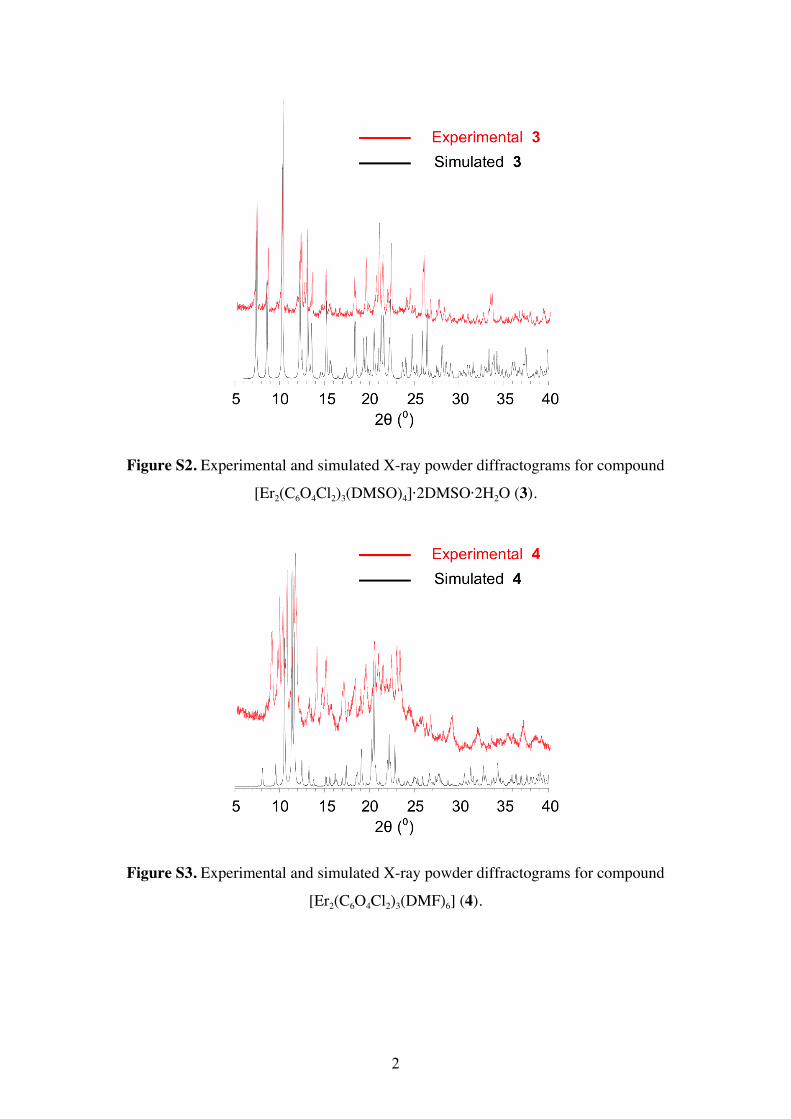
Figure S2. Experimental and simulated X-ray powder diffractograms for compound
[Er2(C6O4Cl2)3(DMSO)4]·2DMSO·2H2O (3).
Figure S3. Experimental and simulated X-ray powder diffractograms for compound
[Er2(C6O4Cl2)3(DMF)6] (4).
3
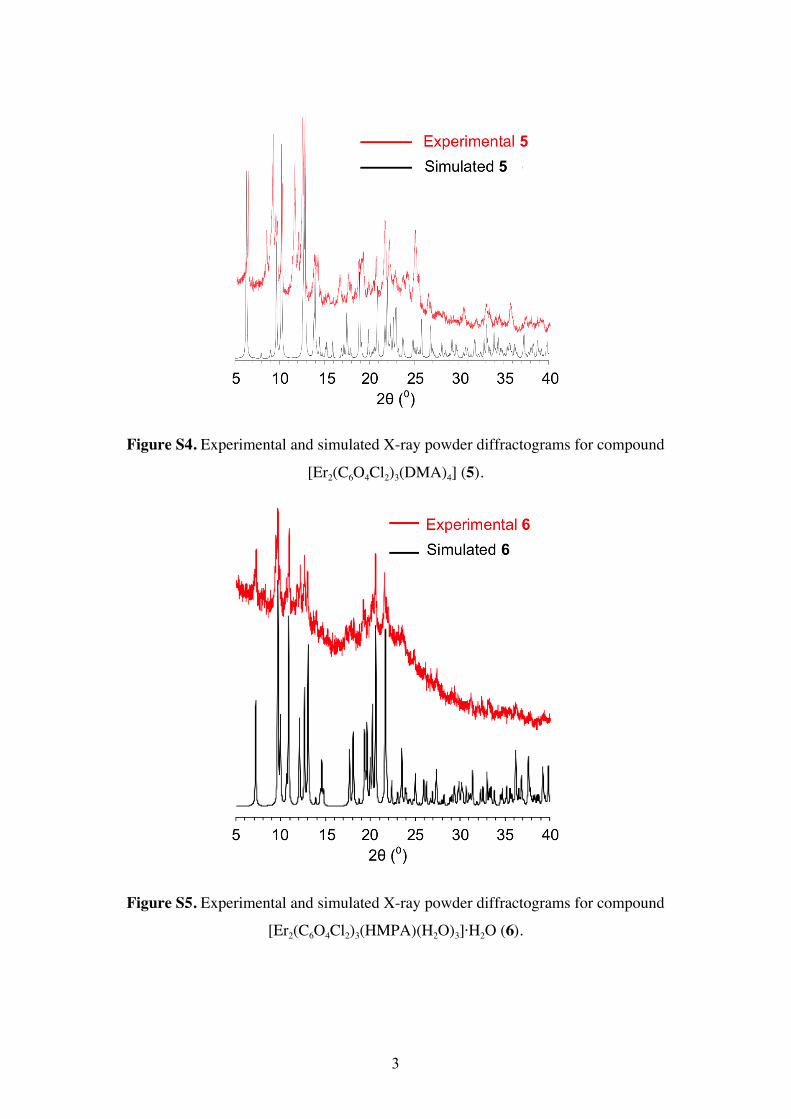
Figure S4. Experimental and simulated X-ray powder diffractograms for compound
[Er2(C6O4Cl2)3(DMA)4] (5).
Figure S5. Experimental and simulated X-ray powder diffractograms for compound
[Er2(C6O4Cl2)3(HMPA)(H2O)3]·H2O (6).

4
Table S1. Er-O bond distances (Å) for compounds [Er2(C6O4Cl2)3(H2O)6]·10H2O (1),
[Er2(C6O4Cl2)3(FMA)6]·4FMA·2H2O (2), [Er2(C6O4Cl2)3(DMSO)4]·2DMSO·2H2O (3),
[Er2(C6O4Cl2)3(DMF)6] (4), [Er2(C6O4Cl2)3(DMA)4] (5) and
[Er2(C6O4Cl2)3(HMPA)(H2O)3]·H2O (6).
Compound 1 Compound 2 Compound 3
Atoms dist. (Å) Atoms dist. (Å) Atoms dist. (Å)
Er1-O2 2.356(5) Er1-O2 2.360(3) Er1-O2 2.364(4)
Er1-O6#3 2.440(6) Er1-O3 2.416(3) Er1-O6#4 2.349(4)
Er1-O12 2.374(6) Er1-O12 2.335(3) Er1-O12 2.354(4)
Er1-O16#1 2.394(6) Er1-O13 2.381(3) Er1-O16#6 2.375(4)
Er1-O22 2.363(6) Er1-O22 2.446(3) Er1-O22 2.343(4)
Er1-O26#2 2.422(5) Er1-O23 2.368(3) Er1-O26#5 2.371(4)
Er1-O1W 2.319(6) Er1-O1F 2.369(3) Er1-O1D 2.294(5)
Er1-O2W 2.433(6) Er1-O11F 2.327(3) Er1-O11D 2.260(5)
Er1-O3W 2.441(6) Er1-O21F 2.450(4)
Ln-Oana 2.392 Ln-Oan
a 2.384 Ln-Oana 2.359
Ln-Osolb 2.398 Ln-Osol
b 2.382 Ln-Osolb 2.277
Compound 4 Compound 5 Compound 5
Atoms dist. (Å) Atoms dist. (Å) Atoms dist. (Å)
Er1-O2 2.439(4) Er1-O2 2.336(13) Er2-O5 2.361(12)
Er1-O3 2.362(4) Er1-O3 2.387(14) Er2-O6 2.388(13)
Er1-O12 2.381(4) Er1-O12 2.407(14) Er2-O15#7 2.396(14)
Er1-O13 2.423(4) Er1-O13 2.336(12) Er2-O16#7 2.331(12)
Er1-O22 2.407(5) Er1-O22 2.396(13) Er2-O25#8 2.357(13)
Er1-O23 2.412(4) Er1-O23 2.331(14) Er2-O26#8 2.318(14)
Er1-O1D 2.337(4) Er1-O1D 2.326(17) Er2-O22D 2.232(16)
Er1-O11D 2.395(5) Er1-O11D 2.220(15) Er2-O32D 2.311(16)
Er1-O21D 2.401(4) Ln-Oana 2.366 Ln-Oan
a 2.359
Ln-Oana 2.404 Ln-Osol
b 2.273 Ln-Osolb 2.272
5
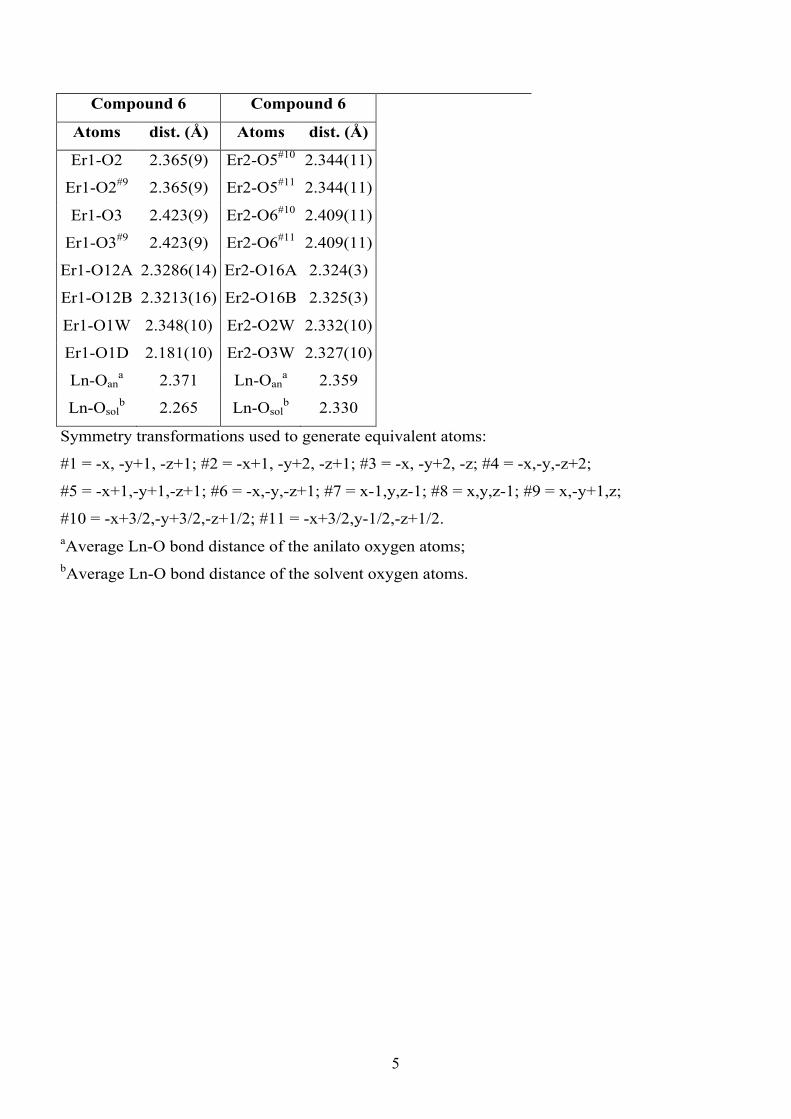
Compound 6 Compound 6
Atoms dist. (Å) Atoms dist. (Å)
Er1-O2 2.365(9) Er2-O5#10 2.344(11)
Er1-O2#9 2.365(9) Er2-O5#11 2.344(11)
Er1-O3 2.423(9) Er2-O6#10 2.409(11)
Er1-O3#9 2.423(9) Er2-O6#11 2.409(11)
Er1-O12A 2.3286(14) Er2-O16A 2.324(3)
Er1-O12B 2.3213(16) Er2-O16B 2.325(3)
Er1-O1W 2.348(10) Er2-O2W 2.332(10)
Er1-O1D 2.181(10) Er2-O3W 2.327(10)
Ln-Oana 2.371 Ln-Oan
a 2.359
Ln-Osolb 2.265 Ln-Osol
b 2.330
Symmetry transformations used to generate equivalent atoms:
#1 = -x, -y+1, -z+1; #2 = -x+1, -y+2, -z+1; #3 = -x, -y+2, -z; #4 = -x,-y,-z+2;
#5 = -x+1,-y+1,-z+1; #6 = -x,-y,-z+1; #7 = x-1,y,z-1; #8 = x,y,z-1; #9 = x,-y+1,z;
#10 = -x+3/2,-y+3/2,-z+1/2; #11 = -x+3/2,y-1/2,-z+1/2. aAverage Ln-O bond distance of the anilato oxygen atoms; bAverage Ln-O bond distance of the solvent oxygen atoms.

6
Table S2. Intermolecular interactions (in Å) shorter than the sum of the Van der Waals radii in
compound [Er2(C6O4Cl2)3(H2O)6]·10H2O (1).
Atom 1 Atom 2 Sym. At. 1 Sym. At. 2 distance Atom 1 Atom 2 Sym. At. 1 Sym. At. 2 distance
O1W O11W -x,1-y,1-z -1+x,-1+y,1+z 2.667 O6 O22 -x,2-y,-z -x,2-y,-z 2.874
O26 O2W 1-x,2-y,1-z 1-x,2-y,1-z 2.702 O2 O12 -x,2-y,-z -x,2-y,-z 2.907
O2 O16 -x,2-y,-z -x,2-y,-z 2.712 O14W O15W x,y,z x,y,1+z 2.911
O6 O3W -x,2-y,-z -x,2-y,-z 2.742 O6 O11W x,y,z x,y,z 2.940
O26 O3W 1-x,2-y,1-z 1+x,y,z 2.769 Cl11 O16 x,y,z -x,1-y,1-z 2.968
O26 O12 1-x,2-y,1-z 1-x,2-y,1-z 2.769 O2 Cl1 -x,1-y,1-z -x,1-y,1-z 2.973
O13W O14W x,y,z x,y,z 2.784 O26 Cl21 -x,1-y,1-z -1+x,-1+y,z 2.975
O6 O1W -x,2-y,-z -x,2-y,-z 2.813 O12W O13W x,y,z x,y,z 2.995
O1W O14W -x,1-y,1-z -1+x,y,z 2.819 O2 O3W -x,2-y,-z -x,2-y,-z 3.019
O12 O3W -x,1-y,1-z x,-1+y,z 2.823 O14W O14W x,y,z 1-x,1-y,2-z 3.024
O22 O11W x,y,z x,y,z 2.825 O22 Cl21 -x,1-y,1-z -x,1-y,1-z 3.028
O22 O2W 1-x,2-y,1-z 1-x,2-y,1-z 2.858 O6 Cl1 -x,1-y,1-z x,-1+y,1+z 3.032
O2W O13W -x,1-y,1-z -1+x,y,z 2.867 O12 Cl11 x,y,z x,y,z 3.037
O12W O15W x,y,z x,y,1+z 2.872 Cl11 O22 -x,1-y,1-z x,-1+y,z 3.176
Table S3. Intermolecular interactions (in Å) shorter than the sum of the Van der Waals radii in
compound [Er2(C6O4Cl2)3(FMA)6]·4FMA·2H2O (2).
Atom 1 Atom 2 Sym. At. 1 Sym. At. 2 distance Atom 1 Atom 2 Sym. At. 1 Sym. At. 2 distance
O22 O21F 1-x,1-y,1-z 1-x,1-y,1-z 2.660 Cl11 O100 x,y,z -1+x,y,z 2.954
O2 O13 1-x,1-y,-z 1-x,1-y,-z 2.682 O13 Cl11 x,y,z -x,1-y,-z 2.957
O3 O23 1-x,1-y,-z 1-x,1-y,-z 2.726 O22 Cl21 x,y,z x,y,z 2.978
O22 O11F 1-x,1-y,1-z 1-x,1-y,1-z 2.727 N11F O23 x,y,z 1-x,-1/2+y,1/2-z 2.982
O3 O1F 1-x,1-y,-z 1-x,1-y,-z 2.747 O200 N200 x,y,z -x,1-y,1-z 2.991
O22 O12 1-x,1-y,1-z 1-x,1-y,1-z 2.800 N21F O1W -x,1-y,-z -x,-1/2+y,1/2-z 2.992
O2 O21F 1-x,1-y,-z 1-x,1-y,-z 2.805 O2 Cl1 x,y,z x,y,z 3.006
O3 N11F x,y,z x,y,z 2.817 O3 Cl1 x,y,z 1-x,1-y,-z 3.021
O200 O1W x,y,z x,y,z 2.850 O12 Cl11 x,y,z x,y,z 3.031
O2 O23 1-x,1-y,-z 1-x,1-y,-z 2.932 N1F O100 -x,1-y,-z 1-x,1/2+y,1/2-z 3.043
O100 N200 x,y,z 1+x,y,z 2.944 O23 Cl21 x,y,z 1-x,1-y,1-z 3.055
7
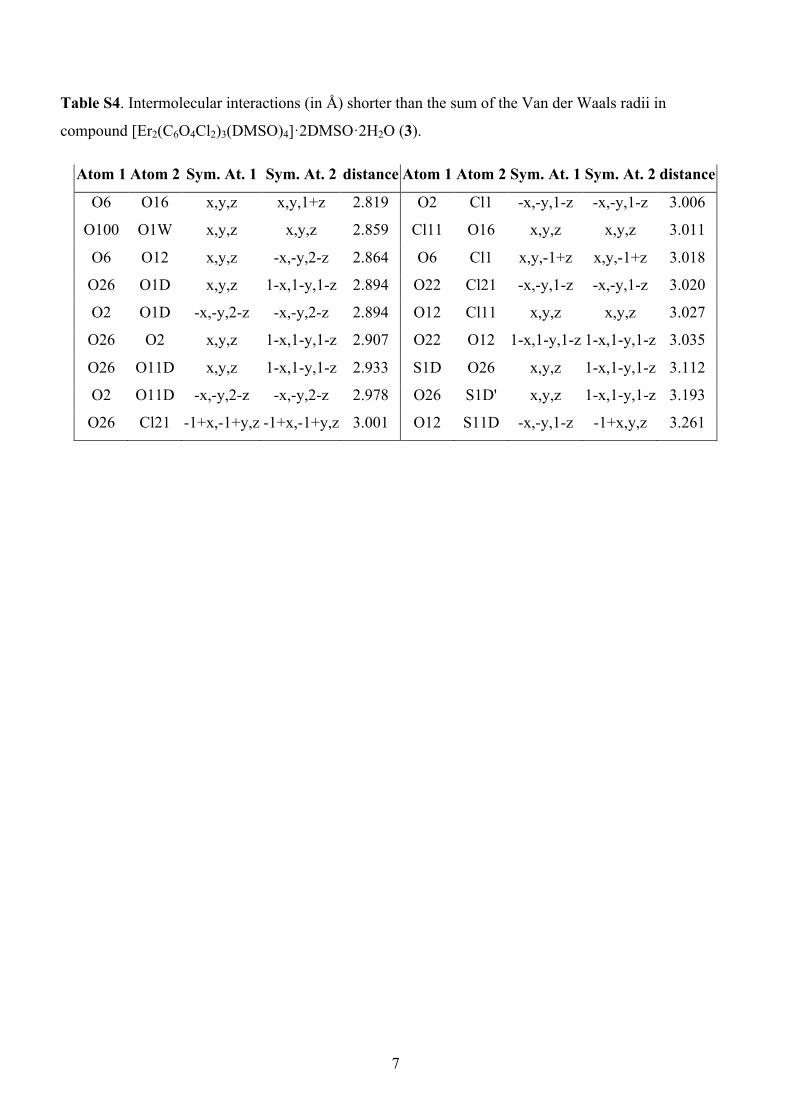
Table S4. Intermolecular interactions (in Å) shorter than the sum of the Van der Waals radii in
compound [Er2(C6O4Cl2)3(DMSO)4]·2DMSO·2H2O (3).
Atom 1 Atom 2 Sym. At. 1 Sym. At. 2 distance Atom 1 Atom 2 Sym. At. 1 Sym. At. 2 distance
O6 O16 x,y,z x,y,1+z 2.819 O2 Cl1 -x,-y,1-z -x,-y,1-z 3.006
O100 O1W x,y,z x,y,z 2.859 Cl11 O16 x,y,z x,y,z 3.011
O6 O12 x,y,z -x,-y,2-z 2.864 O6 Cl1 x,y,-1+z x,y,-1+z 3.018
O26 O1D x,y,z 1-x,1-y,1-z 2.894 O22 Cl21 -x,-y,1-z -x,-y,1-z 3.020
O2 O1D -x,-y,2-z -x,-y,2-z 2.894 O12 Cl11 x,y,z x,y,z 3.027
O26 O2 x,y,z 1-x,1-y,1-z 2.907 O22 O12 1-x,1-y,1-z 1-x,1-y,1-z 3.035
O26 O11D x,y,z 1-x,1-y,1-z 2.933 S1D O26 x,y,z 1-x,1-y,1-z 3.112
O2 O11D -x,-y,2-z -x,-y,2-z 2.978 O26 S1D' x,y,z 1-x,1-y,1-z 3.193
O26 Cl21 -1+x,-1+y,z -1+x,-1+y,z 3.001 O12 S11D -x,-y,1-z -1+x,y,z 3.261

8
AC susceptibility measurements
The AC susceptibility measurements do not show any out of phase signal in compounds 1 and 3-6
(Figures S6-S10).
Figure S6. Thermal variation of the in phase (χm’) and out of phase (χm”) susceptibilities of compound
[Er2(C6O4Cl2)3(H2O)6]·10H2O (1) in the low temperature region.
Figure S7. Thermal variation of the in phase (χm’) and out of phase (χm”) susceptibilities of compound
[Er2(C6O4Cl2)3(DMSO)4]·2DMSO·2H2O (3) in the low temperature region.
012345678
2 3 4 5 6 7 8 9 10
χ'mχ"m
χ m (c
m3 m
ol-1
)
T (K)
01234567
2 3 4 5 6 7 8 9 10
χ'mχ"m
χ m (c
m3 m
ol-1
)
T (K)
0
1
2
3
4
5
6
2 3 4 5 6 7 8 9 10
χm
χ"m
χ m (c
m3 m
ol-1
)
T (K)

9
Figure S8. Thermal variation of the in phase (χm’) and out of phase (χm”) susceptibilities of compound
[Er2(C6O4Cl2)3(DMF)6] (4) in the low temperature region.
Figure S9. Thermal variation of the in phase (χm’) and out of phase (χm”) susceptibilities of compound
[Er2(C6O4Cl2)3(DMA)4] (5) in the low temperature region.
Figure S10. Thermal variation of the in phase (χm’) and out of phase (χm”) susceptibilities of compound
[Er2(C6O4Cl2)3(HMPA)(H2O)3]·H2O (6) in the low temperature region.
IR spectra
a
b
0
1
2
3
4
5
2 3 4 5 6 7 8 9 10
χ'mχ"m
χ m (c
m3 m
ol-1
)
T (K)
0
1
2
3
4
5
6
2 3 4 5 6 7 8 9 10
χ'mχ"m
χ m (c
m3 m
ol-1
)
T (K)
6065707580859095
100
5001000150020002500300035004000
Tran
smita
nce
(%)
wavenumber (cm-1)
6065707580859095
100
400600800100012001400160018002000
Tran
smita
nce
(%)
wavenumber (cm-1)

10
Figure S11. IR spectrum of compound [Er2(C6O4Cl2)3(H2O)6]·10H2O (1) in (a) the 4000-400 cm-1 and
(b) 2000-400 cm-1 ranges.
a
b
Figure S12. IR spectrum of compound [Er2(C6O4Cl2)3(DMSO)4]·2DMSO·2H2O (3) in (a) the
4000-400 cm-1 and (b) 2000-400 cm-1 ranges.
a
b
Figure S13. IR spectrum of compound [Er2(C6O4Cl2)3(DMF)6] (4) in (a) the 4000-400 cm-1 and (b)
2000-400 cm-1 ranges.
a
b
75
80
85
90
95
100
5001000150020002500300035004000
Tran
smita
nce
(%)
wavenumber (cm-1)
80
85
90
95
100
400600800100012001400160018002000
Tran
smita
nce
(%)
wavenumber (cm-1)
70
75
80
85
90
95
100
5001000150020002500300035004000
Tran
smita
nce
(%)
wavenumber (cm-1)
70
75
80
85
90
95
100
400600800100012001400160018002000
Tran
smita
nce
(%)
wavenumber (cm-1)
8486889092949698
100
5001000150020002500300035004000
Tran
smita
nce
(%)
wavenumber (cm-1)
88
90
92
94
96
98
100
400600800100012001400160018002000
Tran
smita
nce
(%)
wavenumber (cm-1)

11
Figure S14. IR spectrum of compound [Er2(C6O4Cl2)3(DMA)4] (5) in (a) the 4000-400 cm-1 and (b)
2000-400 cm-1 ranges.
a
b
Figure S15. IR spectrum of compound [Er2(C6O4Cl2)3(HMPA)(H2O)3]·H2O (6) in (a) the
4000-400 cm-1 and (b) 2000-400 cm-1 ranges.
Table S5. Main IR bands and their assignment in compounds [Er2(C6O4Cl2)3(H2O)6]·10H2O (1),
[Er2(C6O4Cl2)3(DMSO)4]·2DMSO·2H2O (3), [Er2(C6O4Cl2)3(DMF)6] (4), [Er2(C6O4Cl2)3(DMA)4] (5)
and [Er2(C6O4Cl2)3(HMPA)(H2O)3]·H2O (6).
1 (H2O) 3 (DMSO) 4 (DMF) 5 (DMA) 6 (HMPA)
ν(C=O) 1617 1617 1617 1617 1617
ν(C=C) + ν(C-O) 1515 1491 1506 1521 1521
ν(C-C) + ν(C-O) 1385 1384 1385 1384 1384
δ(C-X) 851 852 853 851 854
ρ(C-X) 581 578 580 581 580
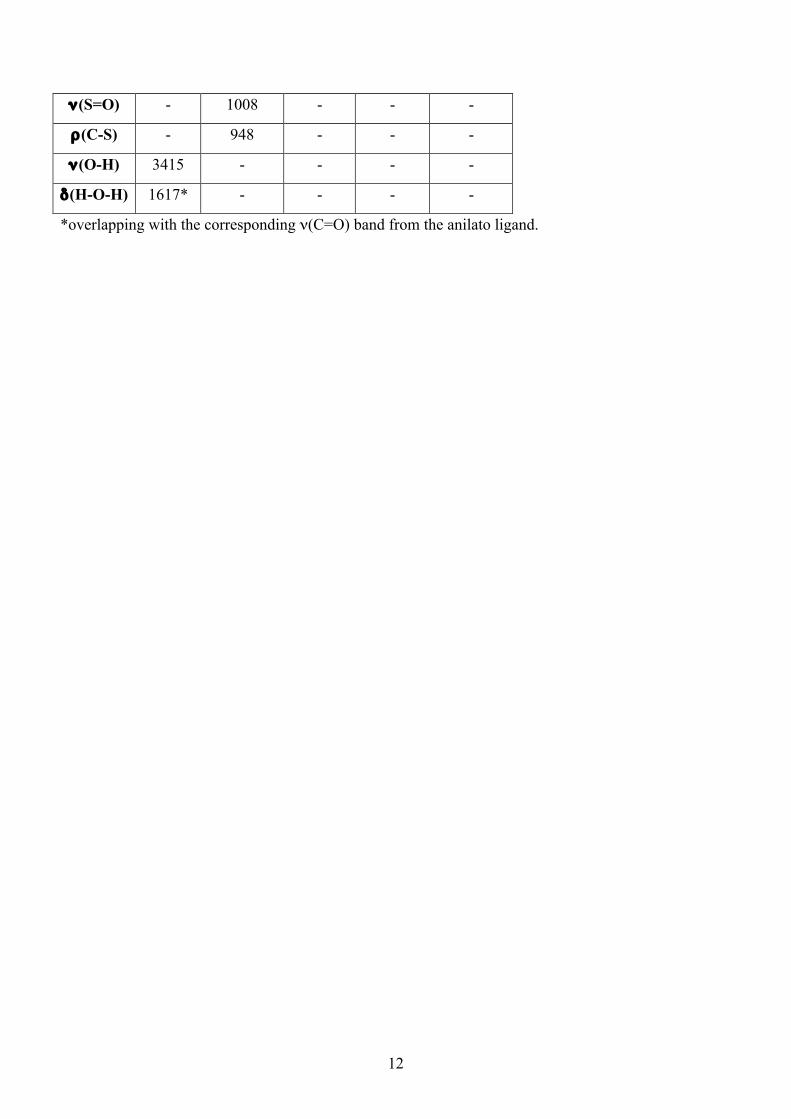
Table S6. IR bands corresponding to the different solvents present in compounds
[Er2(C6O4Cl2)3(H2O)6]·10H2O (1), [Er2(C6O4Cl2)3(DMSO)4]·2DMSO·2H2O (3), [Er2(C6O4Cl2)3(DMF)6]
(4), [Er2(C6O4Cl2)3(DMA)4] (5) and [Er2(C6O4Cl2)3(HMPA)(H2O)3]·H2O (6).
1 (H2O) 3 (DMSO) 4 (DMF) 5 (DMA) 6 (HMPA)
ν(C-H) - 2916
2858
2922
2857
2918
2850
2923
2857
ν(C=O) - - 1617* 1617* -
86889092949698
100
5001000150020002500300035004000
Tran
smita
nce
(%)
wavenumber (cm-1)
86889092949698
100
400600800100012001400160018002000
Tran
smita
nce
(%)
wavenumber (cm-1)
12
ν(S=O) - 1008 - - -
ρ(C-S) - 948 - - -
ν(O-H) 3415 - - - -
δ(H-O-H) 1617* - - - -
*overlapping with the corresponding ν(C=O) band from the anilato ligand.

13
Shape analysis of the coordination geometries
The analysis with the program SHAPE1 of the coordination geometries of the Er ions in the six
compounds is summarized in tables S7 and S8.
Table S7. SHAPE values for the 13 possible coordination geometries found for coordination number
nine2 in compounds [Er2(C6O4Cl2)3(H2O)6]·10H2O (1), [Er2(C6O4Cl2)3(FMA)6]·4FMA·2H2O (2) and
[Er2(C6O4Cl2)3(DMF)6] (4).
Geometry symmetry 1 2 4
EP-9 D9h 35.635 37.024 37.487
OPY-9 C8v 21.818 22.831 22.093
HBPY-9 D7h 20.383 19.548 20.018
JTC-9 C3v 15.990 15.298 16.510
JCCU-9 C4v 11.196 9.427 9.788
CCU-9 C4v 9.987 8.267 8.544
JCSAPR-9 C4v 1.590 1.389 1.303
CSAPR-9 C4v 0.558 0.442 0.282
JTCTPR-9 D3h 1.930 2.200 2.634
TCTPR-9 D3h 0.551 0.718 0.718
JTDIC-9 C3v 13.149 12.02 11.910
HH-9 C2v 12.272 12.039 12.513
MFF-9 Cs 1.146 0.822 0.866 EP-9 = Enneagon; OPY-9 = Octagonal pyramid; HBPY-9 =
Heptagonal bipyramid; JTC-9 = Triangular cupola (J3) = trivacant
cuboctahedron; JCCU-9 = Capped cube (Elongated square pyramid,
J8); CCU-9 = Capped cube; JCSAPR-9 = Capped square antiprism
(Gyroelongated square pyramid J10); CSAPR-9 = Capped square
antiprism; JTCTPR-9 = Tricapped trigonal prism (J51); TCTPR-9 =
Tricapped trigonal prism; JTDIC-9 = Tridiminished icosahedron
(J63); HH-9 = Hula-hoop; MFF-9 = Muffin. The minima values are
indicated in bold.

14
Table S8. SHAPE values for the 13 possible coordination geometries found for coordination numbers
eight3 in compounds [Er2(C6O4Cl2)3(DMSO)4]·2DMSO·2H2O (3), [Er2(C6O4Cl2)3(DMA)4]·5H2O (5)
and [Er2(C6O4Cl2)3(HMPA)(H2O)3]·H2O (6).
Geometry symmetry 3 5-Er1 5-Er2 6-Er1 6-Er2
OP-8 D8h 30.394 31.089 30.975 29.996 31.318
HPY-8 C7v 23.430 21.448 21.964 23.182 22.549
HBPY-8 D6h 15.038 14.435 14.703 16.170 15.653
CU-8 Oh 11.285 8.942 9.474 12.723 13.637
SAPR-8 D4d 1.603 1.325 1.531 2.504 3.666
TDD-8 D2d 1.126 1.139 1.153 2.071 2.698
JGBF-8 D2d 12.921 14.639 14.188 13.613 12.634
JETBPY-8 D3h 28.808 28.371 28.131 26.962 26.046
JBTP-8 C2v 2.246 1.942 1.981 1.643 2.027
BTPR-8 C2v 1.813 1.611 1.557 1.351 1.472
JSD-8 D2d 2.929 3.543 3.578 3.778 4.317
TT-8 Td 12.034 9.610 10.204 13.407 14.298
ETBPY-8 D3h 24.079 24.18 24.189 24.401 22.974 OP-8 = Octagon; HPY-8 = Heptagonal pyramid; HBPY-8 = Hexagonal bipyramid; CU-8
= Cube; SAPR-8 = Square antiprism; TDD-8 = Triangular dodecahedron; JGBF-8 =
Johnson-Gyrobifastigium (J26); JETBPY-8 = Johnson-Elongated triangular bipyramid
(J14); JBTP-8 = Johnson-Biaugmented trigonal prism (J50); BTPR-8 = Biaugmented
trigonal prism, JSD-8 = Snub disphenoid (J84); TT-8 = Triakis tetrahedron; ETBPY-8 =
Elongated trigonal bipyramid. The minima values are indicated in bold.
15
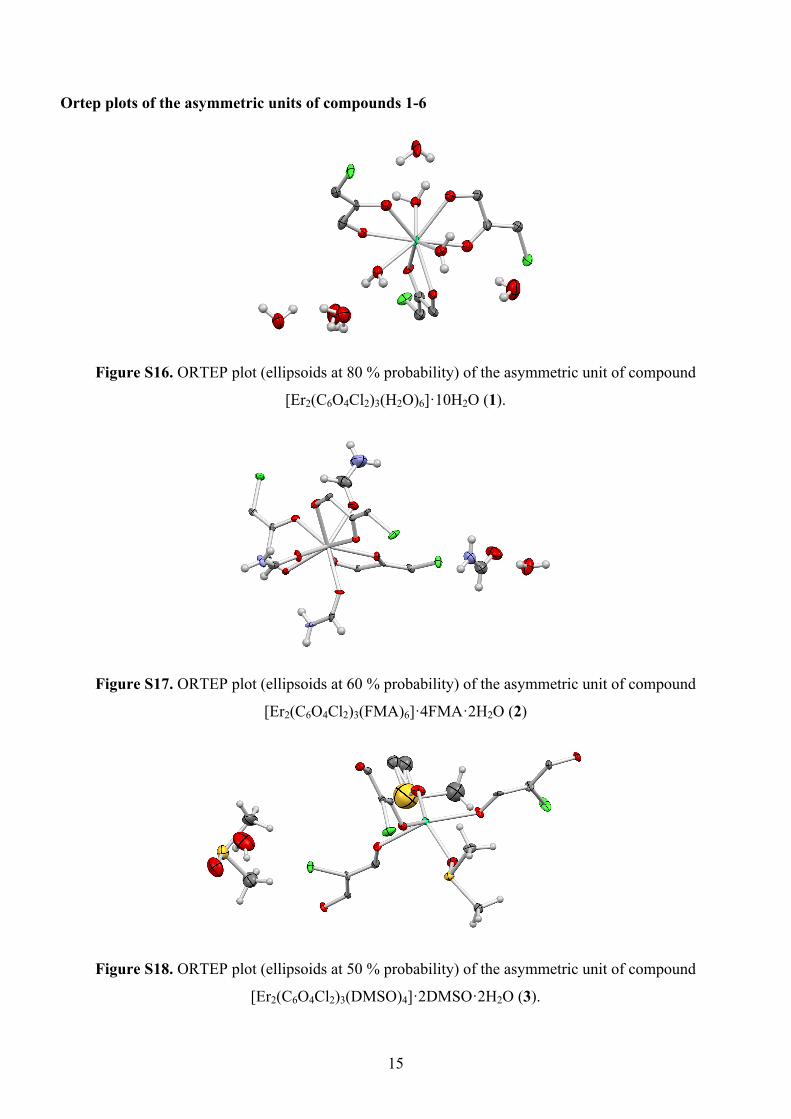
Ortep plots of the asymmetric units of compounds 1-6
Figure S16. ORTEP plot (ellipsoids at 80 % probability) of the asymmetric unit of compound
[Er2(C6O4Cl2)3(H2O)6]·10H2O (1).
Figure S17. ORTEP plot (ellipsoids at 60 % probability) of the asymmetric unit of compound
[Er2(C6O4Cl2)3(FMA)6]·4FMA·2H2O (2)
Figure S18. ORTEP plot (ellipsoids at 50 % probability) of the asymmetric unit of compound
[Er2(C6O4Cl2)3(DMSO)4]·2DMSO·2H2O (3).
16
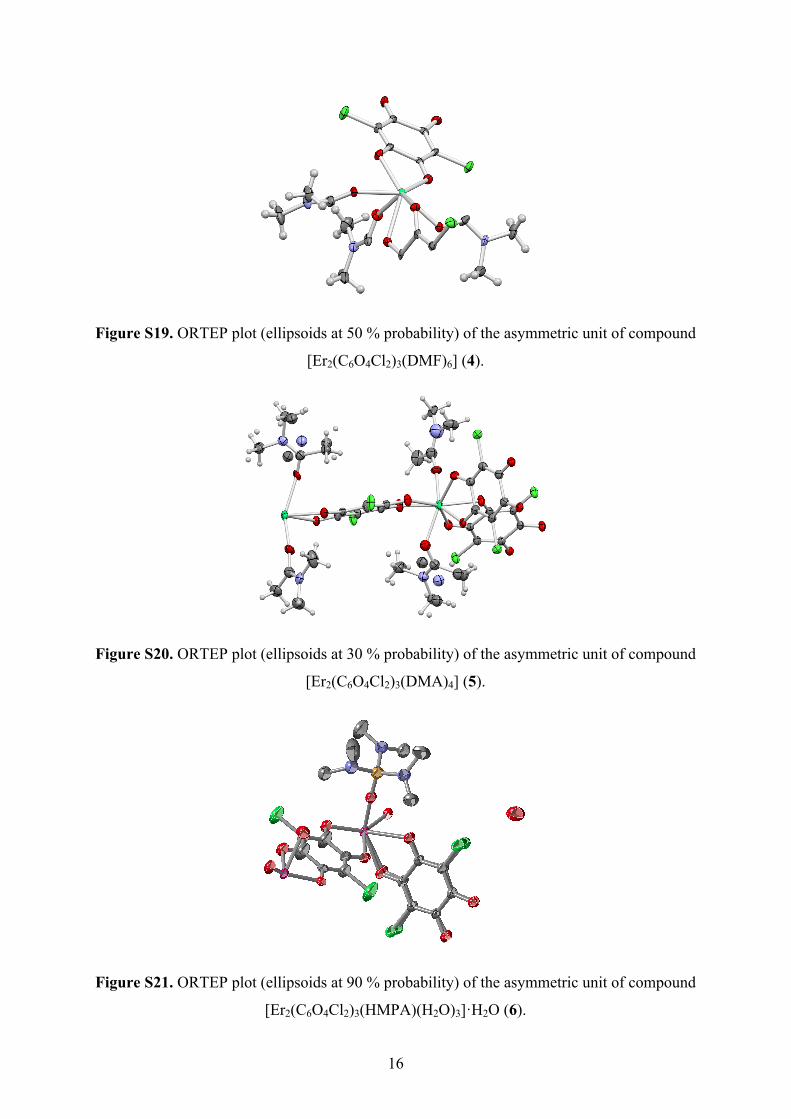
Figure S19. ORTEP plot (ellipsoids at 50 % probability) of the asymmetric unit of compound
[Er2(C6O4Cl2)3(DMF)6] (4).
Figure S20. ORTEP plot (ellipsoids at 30 % probability) of the asymmetric unit of compound
[Er2(C6O4Cl2)3(DMA)4] (5).
Figure S21. ORTEP plot (ellipsoids at 90 % probability) of the asymmetric unit of compound
[Er2(C6O4Cl2)3(HMPA)(H2O)3]·H2O (6).
17
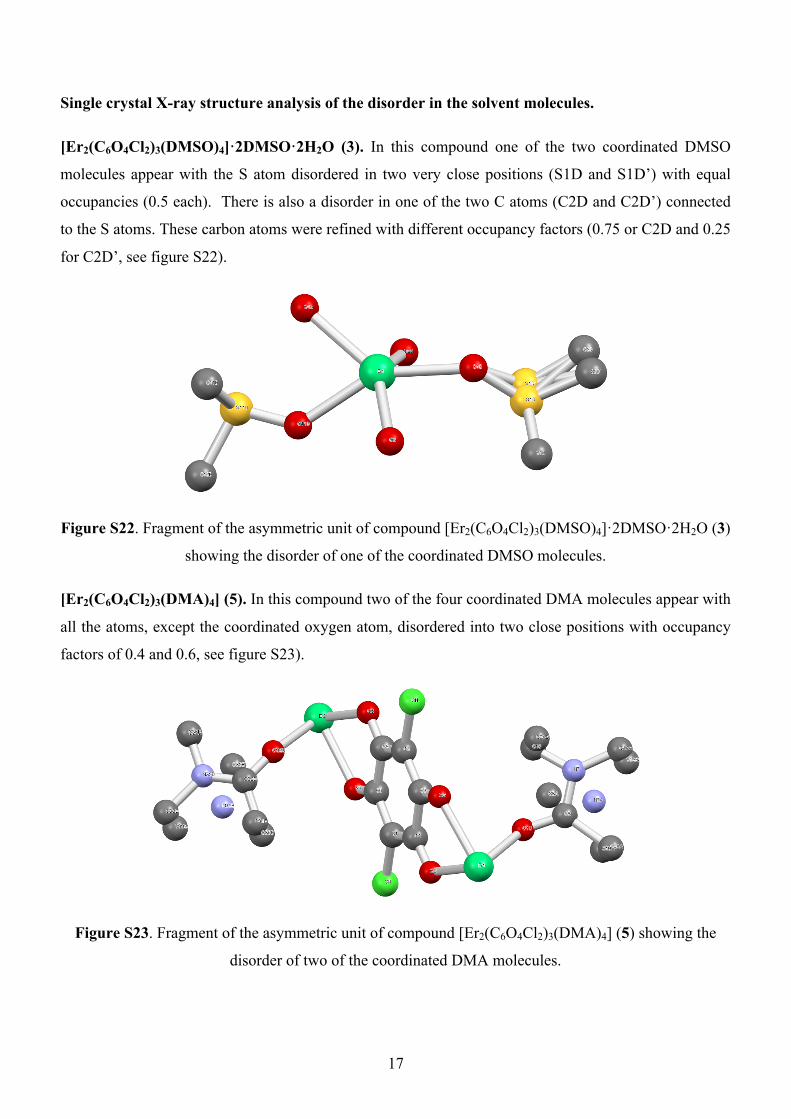
Single crystal X-ray structure analysis of the disorder in the solvent molecules.
[Er2(C6O4Cl2)3(DMSO)4]·2DMSO·2H2O (3). In this compound one of the two coordinated DMSO
molecules appear with the S atom disordered in two very close positions (S1D and S1D’) with equal
occupancies (0.5 each). There is also a disorder in one of the two C atoms (C2D and C2D’) connected
to the S atoms. These carbon atoms were refined with different occupancy factors (0.75 or C2D and 0.25
for C2D’, see figure S22).
Figure S22. Fragment of the asymmetric unit of compound [Er2(C6O4Cl2)3(DMSO)4]·2DMSO·2H2O (3)
showing the disorder of one of the coordinated DMSO molecules.
[Er2(C6O4Cl2)3(DMA)4] (5). In this compound two of the four coordinated DMA molecules appear with
all the atoms, except the coordinated oxygen atom, disordered into two close positions with occupancy
factors of 0.4 and 0.6, see figure S23).
Figure S23. Fragment of the asymmetric unit of compound [Er2(C6O4Cl2)3(DMA)4] (5) showing the
disorder of two of the coordinated DMA molecules.

18
[Er2(C6O4Cl2)3(HMPA)(H2O)3]·H2O (6). In this compound the coordinated hexamethylphosphoramide
molecule appears with a disorder of the three -N(CH3)2 groups delocalized over two positions related
through a mirror plane that passes through the P, O atoms of the molecule. These two positions present,
therefore, occupancy factors of 0.5 each, see figure S24).
Figure S24. Fragment of the asymmetric unit of compound [Er2(C6O4Cl2)3(HMPA)(H2O)3]·H2O (6)
showing the disorder of the coordinated hexamethylphosphoramide molecule.
References
1-Llunell, M.; Casanova, D.; Cirera, J.; Bofill, J. M.; Alemany, P.; Alvarez, S.; Pinsky, M.; Avnir, D.
SHAPE, version 2.3, University of Barcelona, Barcelona, Spain, and Hebrew University of Jerusalem,
Jerusalem, Israel, 2013.
2- Ruiz-Martínez, A.; Casanova, D.; Alvarez, S. Polyhedral Structures with an Odd Number of Vertices:
Nine-Coordinate Metal Compounds. Chem. Eur. J. 2008, 14, 1291-1303.
3- Casanova, D.; Llunell, M.; Alemany, P.; Alvarez, S. The Rich Stereochemistry of Eight-Vertex
Polyhedra: A Continuous Shape Measures Study. Chem. Eur. J. 2005, 11, 1479-1494.
Related Documents