Solvent extraction behavior of Kelex 100 with some representative metal ions Item Type text; Thesis-Reproduction (electronic) Authors Bullard, John Eric, 1950- Publisher The University of Arizona. Rights Copyright © is held by the author. Digital access to this material is made possible by the University Libraries, University of Arizona. Further transmission, reproduction or presentation (such as public display or performance) of protected items is prohibited except with permission of the author. Download date 30/04/2018 21:33:52 Link to Item http://hdl.handle.net/10150/554738

Welcome message from author
This document is posted to help you gain knowledge. Please leave a comment to let me know what you think about it! Share it to your friends and learn new things together.
Transcript

Solvent extraction behavior of Kelex 100with some representative metal ions
Item Type text; Thesis-Reproduction (electronic)
Authors Bullard, John Eric, 1950-
Publisher The University of Arizona.
Rights Copyright © is held by the author. Digital access to this materialis made possible by the University Libraries, University of Arizona.Further transmission, reproduction or presentation (such aspublic display or performance) of protected items is prohibitedexcept with permission of the author.
Download date 30/04/2018 21:33:52
Link to Item http://hdl.handle.net/10150/554738

SOLVENT EXTRACTION BEHAVIOR OF KELEX 100 WITH SOME REPRESENTATIVE METAL IONS
byJohn Eric Bullard
A Thesis Submitted to the Faculty of theDEPARTMENT OF CHEMISTRY
In Partial Fulfillment of the Requirements For the Degree of
MASTER OF SCIENCEIn the Graduate CollegeTHE UNIVERSITY OF ARIZONA
19 7 4
STATEMENT BY AUTHOR
This thesis has been submitted, in partial fulfillment of requirements for an advanced degree at The University of Arizona and is deposited in the University Library to be made available to borrowers under rules of the Library.
Brief quotations from this thesis are allowable without special permission, provided that accurate acknowledgment of source is made. Requests for peimission for extended quotation from or reproduction of this manuscript in whole or in part may be granted by the head of the major department or the Dean of the Graduate College when in his judgment the proposed use of the material is in the interests of scholarship. In all other instances, however, permission must be obtained from the author.
SIGNED
APPROVAL BY THESIS DIRECTORThis thesis has been approved on the date shown below:
Professor of Chemistry
ACKNOWLEDGMENTS
The author wishes to thank Dr. Henry Preiser for his assistance the preparation of this thesis.

TABLE OF CONTENTS
PageLIST OF TABLES .............. . vLIST OF ILLUSTRATIONS. .......... viiABSTRACT................................... viiiINTRODUCTION . . . . ......................................... 1STATEMENT OF PROBLEM ................. 5
EXPERIMENTAL ............................................... 6Materials .......... 6Apparatus. ........ 6Reagent Characterization . . . . . . . . . . . 7Distribution Measurements.......... . . . . . . . ... . 8
DISCUSSION OF RESULTS. . ............... 10Reagent Characterization . . . . ,......................... 10Distribution Measurements............ 19
SUMMARY. . . . . . . . ..................... . . . . . 24
APPENDIX A. DATA TABULATION................................. . 26APPENDIX B. FIGURES ............ . 39REFERENCES ........ 46
iv
LIST OF TABLES
Table Page1. Mass spectrum of Kelex 100.................................112. Assignment of selected peaks from the
mass spectrum of Kelex 100. ................. . 123. NMR spectra of oxine and Kelex 100
in CC14 .............................. 144. Electronic spectral properties of Kelex 100
and oxine in selected solvents........................... 165. ,Vapor pressure osmometer calibration and
molecular weight determination................. 186. pHi/2 values and rates of extraction for
Kelex 100 and oxine with selectedmetals; chloroform -water system.......... 20
A-l. Typical atomic absorption calibrationfor zinc. . . 27
A-2. Typical atomic absorption calibrationfor cobalt. ................. 28
A-3. Typical atomic absorption calibrationfor nickel ........................................... 29
A-4. Typical atomic absorption calibrationfor manganese . . . . . . . . . ................. 30
A-5. Effect of pH on the extraction ofzinc by Kelex 100 * 31
A-6. Effect of pH on the extraction ofcobalt by Kelex 100 . . ....................... 32
A-7. Effect of pH on the extraction ofnickel by Kelex 100 . ................. 33
A-8. Effect of pH on the extraction ofmanganese by Kelex 100 34
v

viLIST OF TABLES--Continued
Table PageA-9. Calibration data for iron (III) via
the 1,10-phenanthrolin'e method............................35A-10. Time dependence of the extraction of iron
with Kelex 100 at various pH values ........... 36A-11. Pseudo first order rate constants for the
reaction of iron with Kelex 100 atvarious pH values ....................... 37
A-12. Effect of reagent concentration on therate of extraction of iron by Kelex100; pH = 2.03....................... 38

LIST OF ILLUSTRATIONS
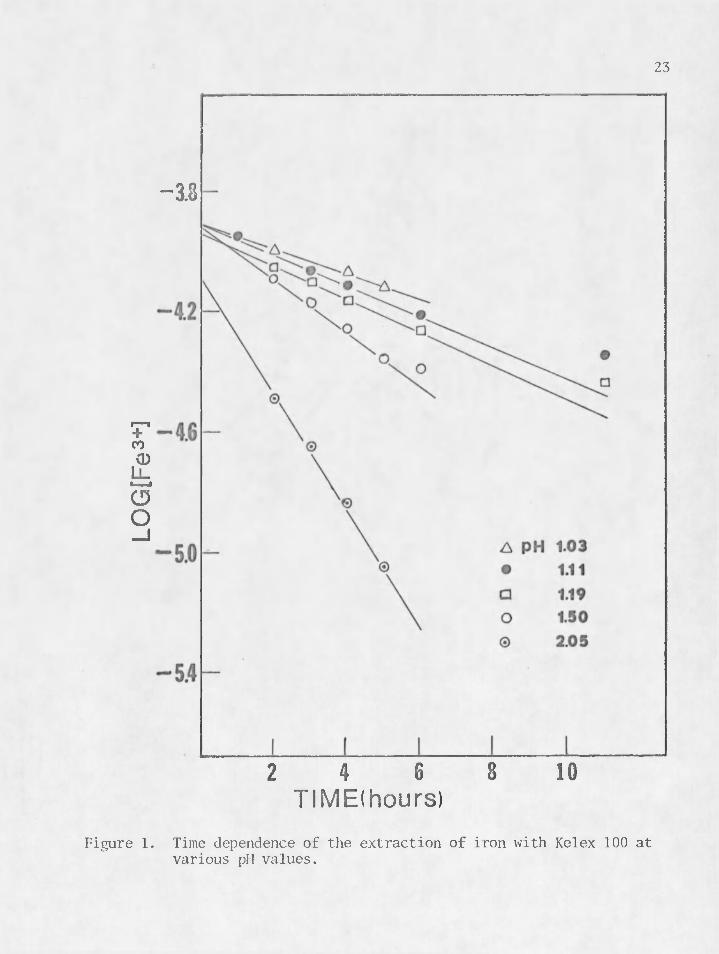
Figure Page1, Time dependence of the extraction of iron
with Kelex 100 at various pH values..................... 23
B-l. Vapor pressure osmometer calibration andmolecular weight determination.............. 40
B-2. Effect of pH on the extraction of cobaltand zinc by Kelex 100.......... 41
B-3. Effect of pH on the extraction of nickeland manganese by Kelex 100.............................. .42
B-4. Effect of pH on the rate of extraction ofiron by Kelex 100 ............. 43
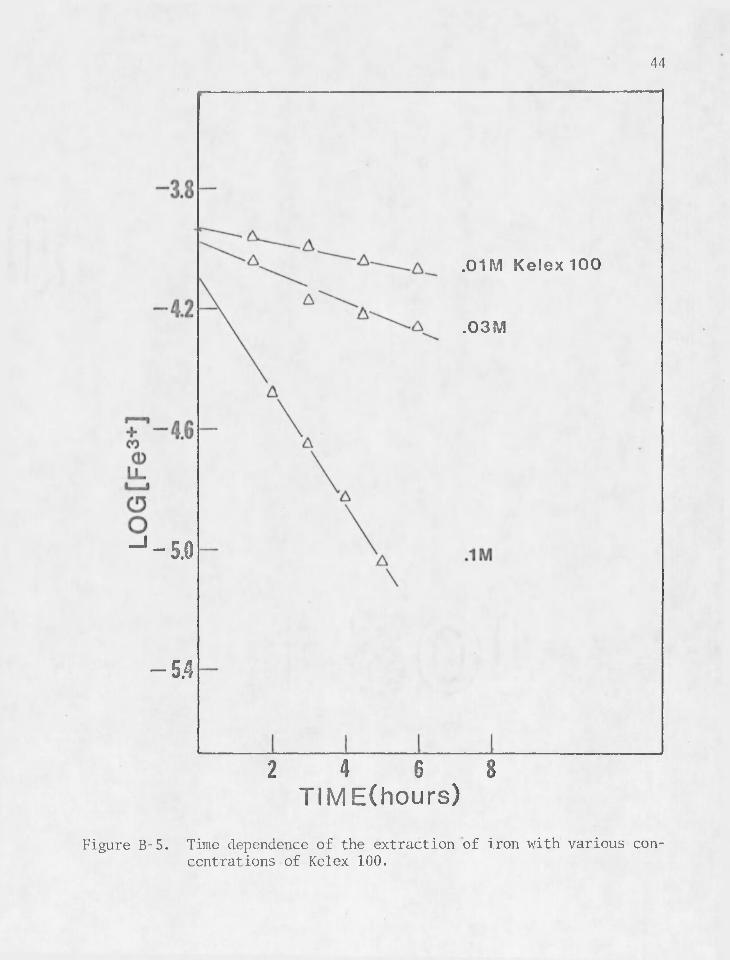
B-5. Time dependence of the extraction of ironwith various concentrations of Kelex 100 .............44
B-6. Effect of reagent concentration on therate of extraction of iron with Kelex 100................ 45
vii

ABSTRACT
Kelex 100, a commercial chelating agent,, was shown to contain as its major component, 7-[3-(5,5,7,7-tetramethyl-l-octenyl)]-8-hydroxy- quinoline. The commercial reagent was found to contain a small amount of an amphoteric impurity, a major portion of which was 8-hydroxyquino- line.
The equilibrium solvent extraction behavior of Kelex 100 in chloroform with zinc, cobalt, nickel, manganese, and iron was investigated. For the iron-Kelex 100 extraction system the dependence of the rate on metal ion concentration, reagent concentration, and pH was de
termined.Under comparable conditions with oxine, the extraction of metals
with Kelex 100 required more basic media and was generally shown to occur more slowly.

INTRODUCTION
8-Hydroxyquinoline (oxine) has found widespread use as a chelating agent. The reagent has both an acidic and basic functional.group and is therefore amphoteric. At 18°C, the distribution of molecular oxine between chloroform and water is 720 (1). This value is reached only in the pH range 5 to 9 and outside these limits the distribution ratio decreases rather rapidly (1).
Oxine is unselective in its action and reacts with a large number of metals. Chelation results in the formation of five-membered rings. The metal complexes are very soluble in organic solvents such as chloroform, and are readily extracted.
Neglecting formation of intermediate complexes, metal hydrolysis products, and formation of complexes with auxiliary complexing agents in
The extraction reaction may be written simply as
wP'+ + nHOx ? MOx + nH+ (1)n
solution, the ratio[MOx]n > [Mn+]
is equal to the distribution ratio
(D) and it can be shown that
(2)
1
where Kn and Kn are the distribution constants of the reagent and met- R c
al complex respectively between the two phases and is the overall stability constant of the metal complex.
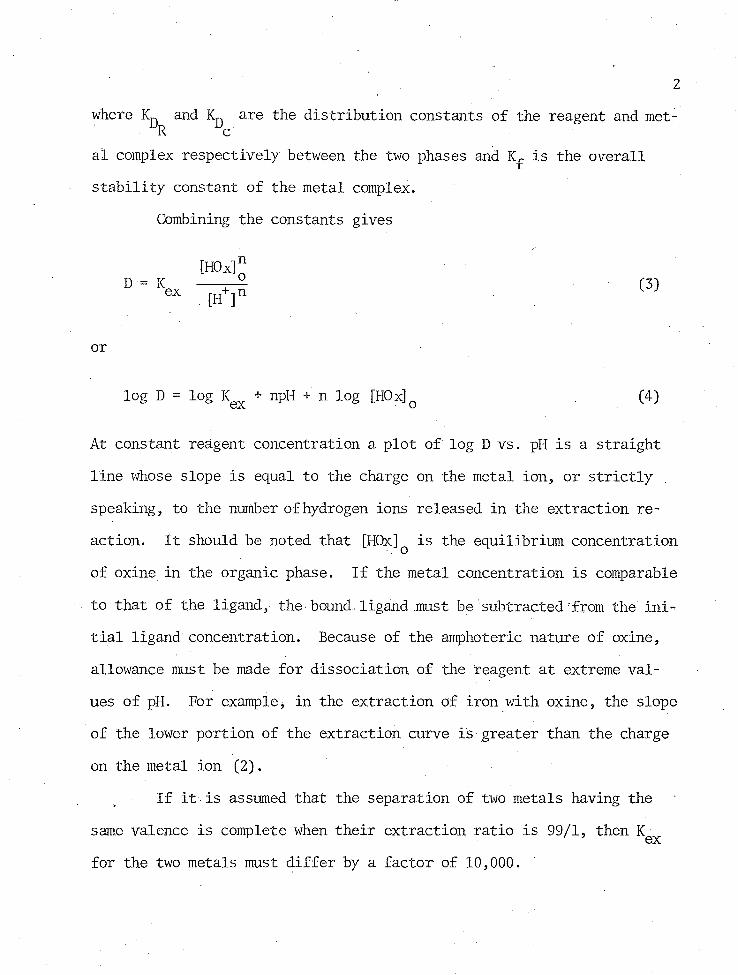
Combining the constants gives
[HOxfD = (3)
or
log D = log Kex + npH + n log [H0x]o (4)
At constant reagent concentration a plot of log D vs. pH is a straight line whose slope is equal to the charge on the metal ion, or strictly speaking, to the number of hydrogen ions released in the extraction reaction. It should be noted that [HGx]o is the equilibrium concentration of oxine in the organic phase. If the metal concentration is comparable
to that of the ligand, the bound ligand must'be subtracted from the ini- tial ligand concentration. Because of the amphoteric nature of oxine, allowance must be made for dissociation of the reagent at extreme values of pH. For example> in the extraction of iron with oxine, the slope of the lower portion of the extraction curve is greater than the charge on the metal ion (2).
If it is assumed that the separation of two metals having the same valence is complete when their extraction ratio is 99/1, then Kgx for the two metals must differ by a factor of 10,000.
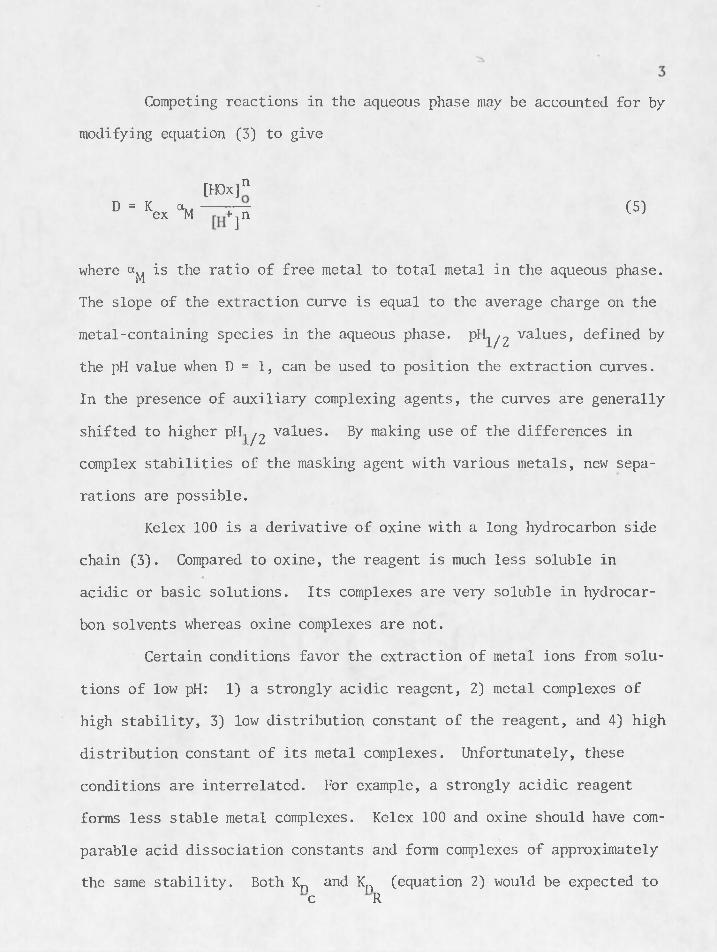
Competing reactions in the aqueous phase may be accounted for by modifying equation (3) to give
[HOx]"D = Kex “M — q H (5)
where cc is the ratio of free metal to total metal in the aqueous phase. The slope of the extraction curve is equal to the average charge on the
metal-containing species in the aqueous phase, pll^^ values, defined by the pH value when D = 1, can be used to position the extraction curves. In the presence of auxiliary complexing agents, the curves are generally
shifted to higher pll^ values. By making use of the differences in complex stabilities of the masking agent with various metals, new sepa
rations are possible.Kelex 100 is a derivative of oxine with a long hydrocarbon side
chain (3). Compared to oxine, the reagent is much less soluble inacidic or basic solutions. Its complexes are very soluble in hydrocar
bon solvents whereas oxine complexes are not.Certain conditions favor the extraction of metal ions from solu
tions of low pH: 1) a strongly acidic reagent, 2) metal complexes ofhigh stability, 3) low distribution constant of the reagent, and 4) high distribution constant of its metal complexes. Unfortunately, these conditions are interrelated. For example, a strongly acidic reagent forms less stable metal complexes. Kelex 100 and oxine should have comparable acid dissociation constants and form complexes of approximatelythe same stability. Both Kn and Kn (equation 2) would be expected to
c R

4be greater for Kolex 100. However Kn is raised to the nth power where-
dras Kp is not. Consequently Kelex 100 extraction curves may be shifted
to higher pRjy2 values..Various applications of Kelex 100 are possible because of its
low solubility in aqueous media. The reagent may find use as a liquid coating in reverse phase partition chromatography. The pH of the mobile phase may be altered to effect separation of metal ions without changingthe liquid loading. Kelex 100 should also prove useful for large scalesolvent extraction. The metal complexes are very soluble in cheap hy
drocarbon solvents. After the metal of interest is separated from interfering substances in the aqueous phase, acid stripping of the metal from the organic phase can be employed with little loss of reagent.
This study is devoted to the examination of fundamental extraction behavior of Kelex 100 with some representative metal ions.
STATEMENT OF PROBLEM
A systematic study of Kelex 100, a long chain hydrocarbon substituted 8-quinolinol, will be undertaken to evaluate the role of side chain on chelation and extraction properties in comparison to those of oxine itself.
5

EXPERIMENTAL
MaterialsOxine (Mai1inckrodt) was sublimed in a coldfinger sublimation
apparatus (m. p. 730-74°C). Kelex 100 (Ashland Oil) was dissolved in chloroform, shaken twice with 0.1 M sulfuric acid and twice with water. The chloroform layer was filtered into a volumetric flask and diluted to the mark. The Kelex 100/chloroform solution gradually darkened and it was necessary to deaerate the solution and store it at 40°C in a cold room in the dark. This solution was stable for several days. All other reagents were ACS or AR grade. All water used was distilled and then
(r)deionized in a Crystalab Deeminizer'^ (Crystal Research Laboratories, Inc., Hartford, Conn.).
ApparatusAtomic absorption analysis was done with a Heath Model 703
Atomic Absorption Spectrophotometer (Benton Harbor, Mich.) equipped with a Jarrell Ash slot burner. The photomultiplier output was amplified in a Heath electrometer Model EU-703-31 and the signal recorded on a Leeds and Northrup Speedomax H recorder (Philadelphia, Penn.). Absorbance measurements were made in matched cells with a Gilford Model 2400 UV-VIS Spectrophotometer (Oberlin, Ohio). A Cary 14 recording spectrophotome
ter (Applied Physics Corp., Monrovia, Calif.) was used for the spectra. Measurements of pH were made on either a Coming Digital 110 Expanded Scale pH meter (Medfield, Mass.) using a Fisher microprobe combination
6

electrode or on the Beckman Research pH Meter Model 1019 (Fullerton, Calif.) using a glass, saturated calomel electrode pair. The pH meters were calibrated with pHydrion standard buffer solutions (MicroessentialLaboratory, Inc., Brooklyn, N. Y.). The mass spectrum was recorded on
1
a Hewlett-Packard Model 5730 Mass Spectrometer (Palo Alto,. Calif.).NMR spectra were obtained on either Varian T-60 or HA 100 NMR Spectrometers (Walnut Creek, Calif.). A Mechrolab Model 301A Vapor Pressure Osmometer (Mountain View, Calif.) was used for the molecular weight determination.
Reagent Characterization , •In the molecular weight determination, data for the benzil in
benzene standard were obtained from Mr. E. Kabbas (Department of Chemistry, University of Arizona). Several concentrations of Kelex 100 in benzene were prepared.
To isolate the acid soluble impurity about 10 mis of isooctane
was saturated with Kelex 100 and shaken with 5 mis of 0.1 M sulfuric acid. After phase separation a portion of the aqueous was removed, neu
tralized with 1 M NaOH, and shaken with a small volume, of fresh chloroform. The chloroform phase was evaporated to yield solid particles and some brown oil. White crystalline needles were formed by sublimation
from the solid residue.The solid, a major portion of the impurity, appeared to be oxine
and based on this assumption its concentration was derived as follows: a known weight of Kelex was dissolved in exactly 25 mis of chloroform.10.0 mis of the Kelex solution was shaken with 10.0 mis of 0.1 M
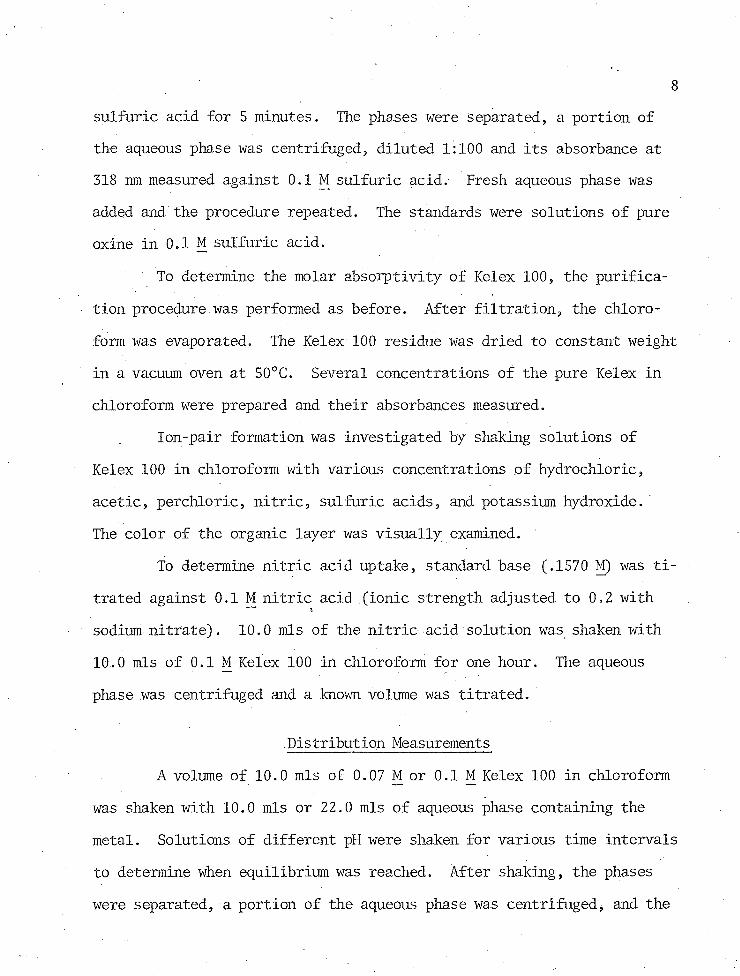
sulfuric acid for 5 minutes. The phases were Separated, a portion of the aqueous phase was centrifuged, diluted 1:100 and its absorbance at 318 run measured against 0.1 M sulfuric acid. Fresh aqueous phase was added and the procedure repeated. The standards were solutions of pure oxine in 0.1 M sulfuric acid..
To determine the molar absorptivity of Kelex 100, the purification procedure was performed as before. After filtration, the chloroform was evaporated. The Kelex 100 residue was dried to constant weight in a vacuum oven at 50°C. Several concentrations of the pure Kelex in chloroform were prepared and their absorbances measured.
lon-pair formation was investigated by shaking solutions of Kelex 100 in chloroform with various concentrations of hydrochloric, acetic, perchloric, nitric, sulfuric acids, and potassium hydroxide.The color of the organic layer was visually examined.
To determine nitric acid uptake, standard base (.1570 M) was titrated against 0.1 M nitric acid (ionic strength adjusted to 0.2 with sodium nitrate). 10.0 mis of the nitric acid solution was shaken with10.0 mis of 0.1 M Kelex 100 in chloroform for one hour. The aqueous
phase was centrifuged and a known volume was titrated.
Distribution Measurements A volume of 10.0 mis of 0.07 M or 0.1 M Kelex 100 in chloroform
was shaken with 10.0 mis or 22.0 mis of aqueous phase containing the metal. Solutions of different pH were shaken for various time intervals to determine when equilibrium was reached. After shaking, the phases were separated, a portion of the aqueous phase was centrifuged, and the
pH was measured. Zinc, cobalt, and manganese were determined in an acetate-acetic acid medium with ionic strengths of 0.005 M, 0.01 M, and 0.001 M respectively. With manganese, the high pH and low buffer concentration necessitated shaking the extractant 3 times with dilute acetate. A nitric acid-sodium nitrate medium was used for nickel and iron The ionic strength was 0.01 M for nickel and 0.2 M for iron.
Atomic absorption analysis was done in the absorbance mode witho
an air-acetylene flame. The elemental lines used were zinc, 2139 A;o o o
cobalt, 2407 A; nickel, 2320 A; and manganese, 2795 A. For each determination, a set of standards containing the appropriate metal was made up in the same aqueous matrix used in the extraction. The small variation in salt content of the matrix had no effect on the atomic absorption signal. For manganese, the pH of standards and samples was adjusted to about 2 with concentrated nitric acid prior to atomic ab
sorption analysis.Aqueous iron was determined colorimetrically via the 1,10-
phenanthroline method (4).
DISCUSSION OF RESULTS
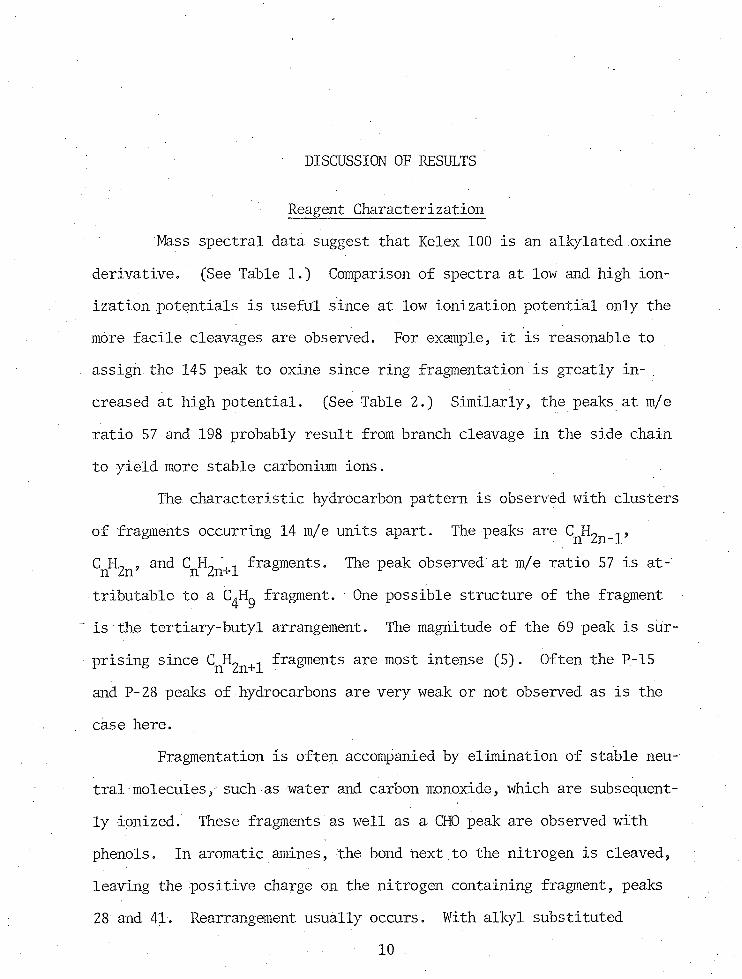
Reagent CharacterizationMass spectral data suggest that Kelex 100 is an alkylated oxine
derivative, (See Table 1.) Comparison of spectra at low and high ionization potentials is useful since at low ionization potential only the more facile cleavages are observed. For example, it is reasonable to assign the 145 peak to oxine since ring fragmentation is greatly increased at high potential. (See Table 2.) Similarly, the peaks at m/e ratio 57 and 198 probably result from branch cleavage in the side chain to yield more stable carbonium ions.
The characteristic hydrocarbon pattern is observed with clusters of fragments occurring 14 m/e units apart. The peaks are ^,
^n%n' anc* Sftn+l ^raginents• The peak observed at m/e ratio 57 is attributable to a C^Hg fragment. One possible structure of the fragment is the tertiary-butyl arrangement. The magnitude of the 69 peak is surprising since fragments are most intense (5). Often the P-15and P-28 peaks of hydrocarbons are very weak or not observed as is the
case here.Fragmentation is often accompanied by elimination of stable neu
tral molecules, such as water and carbon monoxide, which are subsequent
ly ionized. These fragments as well as a CHO peak are observed with phenols. In aromatic amines, the bond next to the nitrogen is cleaved, leaving the positive charge on the nitrogen containing fragment, peaks 28 and 41. Rearrangement usually occurs. With alkyl substituted
10
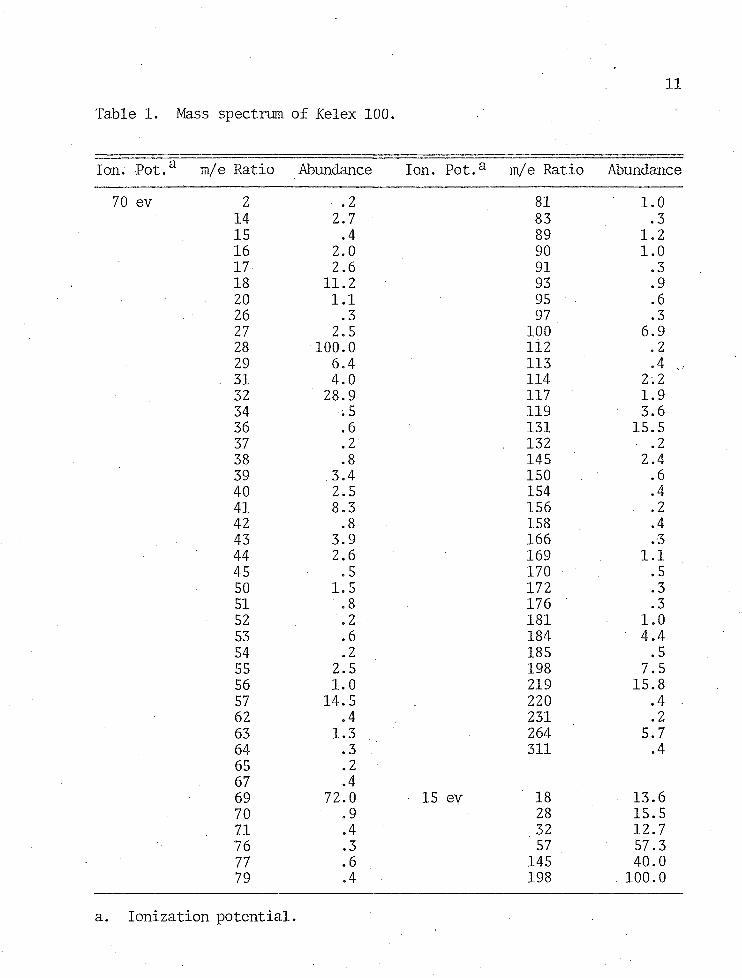
11Table 1. Mass spectrum of Kelex 100.
Ion. Pot.a m/e Ratio Abundance Ion. Pot.a m/e Ratio Abundance70 ev 2 .2 81 1.0
14 2.7 83 .315 .4 89 1.216 2.0 90 1.017 2.6 91 .318 11.2 93 .920 1.1 95 . 626 .3 97 .327 2.5 100 6.928 100.0 112 .229 6.4 113 .4 ^
. 31 4.0 114 2.232 28.9 117 1.934 .5 119 3.636 . 6 131 15.537 .2 132 • .238 .8 145 2.439 .3.4 150 .640 2.5 154 .441 8.3 156 .242 .8 158 .443 3.9 166 .344 2.6 169 1.145 .5 170 .550 1.5 172 .351 .8 176 ’ .352 .2 181 1.053 .6 184 4.454 .2 185 .555 2.5 198 7.556 1.0 219 15.857 14.5 220 .462 .4 231 .263 1.3 . 264 5.764 .3 311 .465 .267 .469 72.0 15 ev 18 13.670 .9 28 15.571 .4 32 12.776 .3 57 57.377 . 6 145 40.079 .4 198 100.0
a. Ionization potential.

12Table 2. Assignment of selected peaks from the mass spectrum of Kelex
100.
m/e Ratio Positive lon(s)
18 H2028 CO, CHNH, C2H429 CHO32 0.
41 C2H2NH, C3H5
57 C4H969 CsHg145 CgH70N184 C3H4-CgH7ON198 C4H6-CgH7ON

13benzenes, the C-C bond next to the ring is usually cleaved, which may account for the 184 or 198 peak. The largest m/e ratio was 311, the proposed molecular weight of Kelex 100 (3).
The NMR spectrum of oxine obtained in this work was in good agreement with that of Baker and Sawyer (6). The coupling constants for the heteroatom ring protons of oxine and Kelex 100 were identical, having the values 4,4 Hz; 1.7 Hz; and 8.4 Hz. As expected the patterns attributable to the protons of the hydroxy ring are noticeably different for oxine compared to Kelex 100. (See Table 3.) Considerable simplification is observed for Kelex 100 since.there is one less ring proton. Because of resonance donation to the ring by the hydroxyl group, the ortho and para protons should be farthest upfield.The upfield resonance attributable to the seven proton of oxine is ab- • sent in the Kelex 100 spectrum.
In the alkyl portion of the Kelex 100 spectrum, the signals at 6.00y and 5.00y are attributable to vinyl protons. The complex pattern is the result of splitting by several different protons, for example a vinyl proton between a methyl or methylene group and one or more vinyl protons. The distorted triplet is fairly common in compounds containing a terminal vinyl group. Although not observed here, usually each peak is a doublet (J = 2 cps) because of coupling between the two protons.The quartet at 4.23y is shifted considerably downfield. A methylene group between a ring and a double bond gives a signal at 3.4y (5). Relative to methylene, methine protons are farther downfield. The doublet at 1.92y is a methylene group adjacent to a methine hydrogen, its downfield position resulting from proximity to various deshielding

14Table 3. NMR spectra of oxine and Kelex 100 in CCl^.
Pattern R=H R=C12H23
ppmR=H
(Y)aR=C12H23
Assignment R=H R=C12H23
two doublets two doublets 8.73 8.67 2 2two doublets two doublets 8.00 7.92 4 4two doublets . doublet 7.32 7.29 6 6two doublets two doublets 7.25 7.17 3 3two doublets doublet 7.14 7.13 5 5two doublets 7.07 7
complex 6.00 ch-ch=ch2distorted 5.00 -ch=ch9triplet L
quartet 4.23 -C=C-CH-0
doublet 1.92 R„C-CH0-CH3 2singlet 1.37 r3c-ch2-r3c
singlet 0.98
a. Chemical shift relative to TMS.
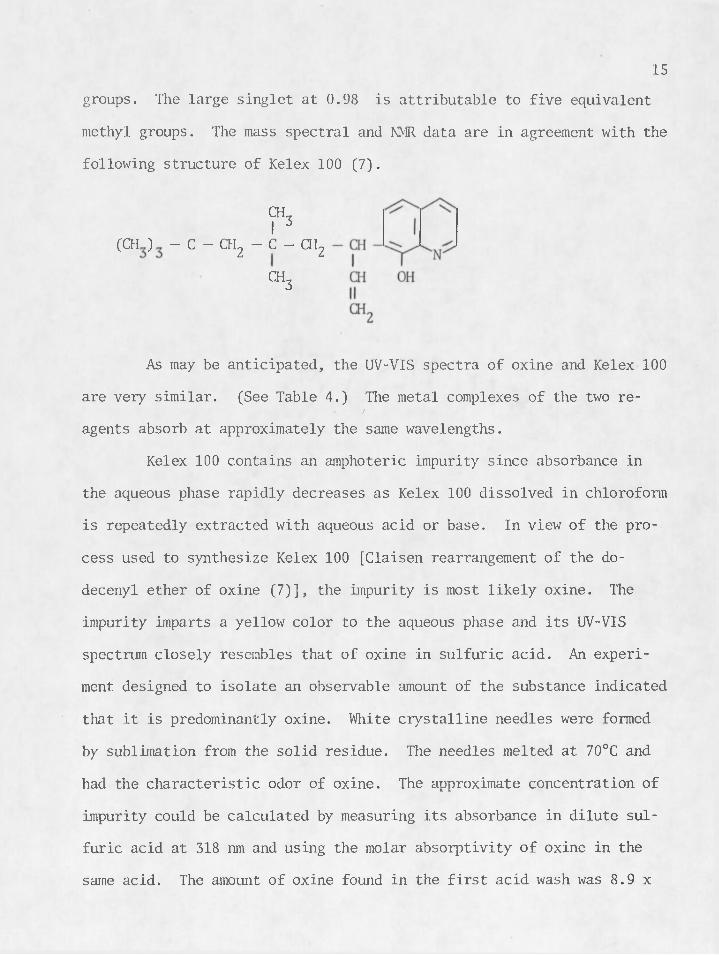
15groups. The large singlet at 0.98 is attributable to five equivalent
methyl groups. The mass spectral and NMR data are in agreement with the following structure of Kelex 100 (7).
CH_I 3
(CH ) - C - CH2 - C - CH2
%
As may be anticipated, the UV-VIS spectra of oxine and Kelex 100are very similar. (See Table 4.) The metal complexes of the two re-
/
agents absorb at approximately the same wavelengths.Kelex 100 contains an amphoteric impurity since absorbance in
the aqueous phase rapidly decreases as Kelex 100 dissolved in chloroform is repeatedly extracted with aqueous acid or base. In view of the pro
cess used to synthesize Kelex 100 [Claisen rearrangement of the do- decenyl ether of oxine (7)], the impurity is most likely oxine. The impurity imparts a yellow color to the aqueous phase and its UV-VIS spectrum closely resembles that of oxine in sulfuric acid. An experiment designed to isolate an observable amount of the substance indicated
that it is predominantly oxine. White crystalline needles were formed by sublimation from the solid residue. The needles melted at 70°C and
had the characteristic odor of oxine. The approximate concentration of impurity could be calculated by measuring its absorbance in dilute sulfuric acid at 318 run and using the molar absorptivity of oxine in the same acid. The amount of oxine found in the first acid wash was 8.9 x
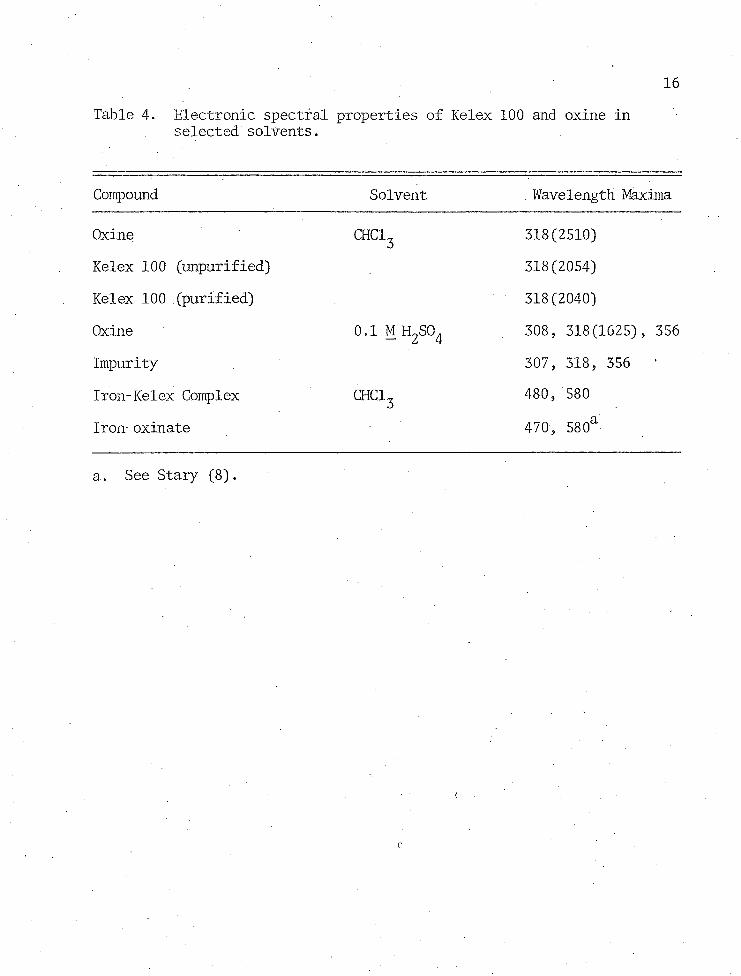
16Table 4. Electronic spectral properties of Kelex 100 and oxine in
selected solvents.
Compound Solvent . Wavelength Maxima
Oxine chci3 318(2510)Kelex 100 (unpurified) 318(2054)Kelex 100 (purified) 318(2040)Oxine 0.1 M H2S04 308, 318(1625), 356
Impurity 307, 318, 356 1
Iron-Kelex Complex chci3 480, 580
Iron oxinate 470, 580a
a. See Stary (8).
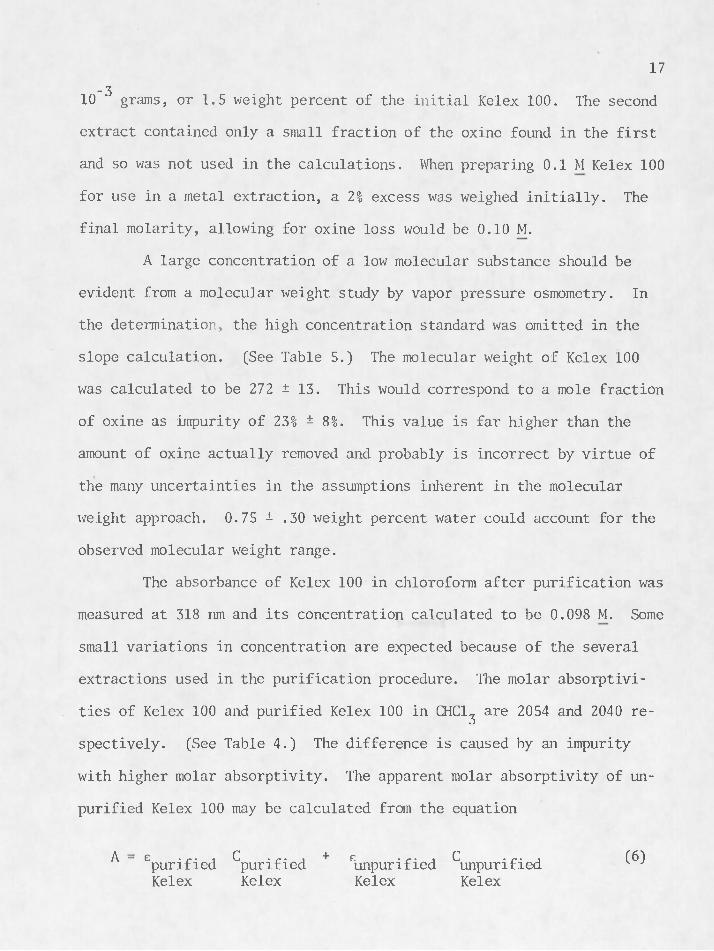
17-310 grams, or 1.5 weight percent of the initial Kelex 100. The second
extract contained only a small fraction of the oxine found in the first and so was not used in the calculations. When preparing 0.1 M Kelex 100 for use in a metal extraction, a 2% excess was weighed initially. The final molarity, allowing for oxine loss would be 0.10 M.
A large concentration of a low molecular substance should beevident from a molecular weight study by vapor pressure osmometry. In the determination, the high concentration standard was omitted in the slope calculation. (See Table 5.) The molecular weight of Kelex 100 was calculated to be 272 ± 13. This would correspond to a mole fraction of oxine as impurity of 23% ± 8%. This value is far higher than theamount of oxine actually removed and probably is incorrect by virtue ofthe many uncertainties in the assumptions inherent in the molecular weight approach. 0.75 ± .30 weight percent water could account for the observed molecular weight range.
The absorbance of Kelex 100 in chloroform after purification was measured at 318 nm and its concentration calculated to be 0.098 M. Some small variations in concentration are expected because of the several extractions used in the purification procedure. The molar absorptivi-
ties of Kelex 100 and purified Kelex 100 in CHCl are 2054 and 2040 respectively. (See Table 4.) The difference is caused by an impurity with higher molar absorptivity. The apparent molar absorptivity of unpurified Kelex 100 may be calculated from the equation
^ ~ ^purified ^purified + Eunpurified ^unpurified ^Kelex Kelex Kelex Kelex

18Table 5. Vapor pressure osmometer calibration and molecular weight
determination.a
C (g/kg) V (mv)
Benzil 1.19 2.396.87 11.31
12.55 18.5118.16 25.00slope = 1.42 ± .09 intercept = 0.99 ± .72
Kelex 100 1.77 1.61
3.53 3.68
8.84 9.22
17.67 19.14
slope = 1.10 ± .01b intercept = -0.32 ± .12
a. See Figure B-l, p. 40.b. Range given corresponds to I'.O standard deviation.

19Using the oxine concentration determined spectrophotometrically„ substitution gives 2054.
Unlike oxine, the protonated Kelex 100 forms extractable ion pairs in chloroform as evidenced by formation of a yellow color in the chloroform layer. Of the acids tested, the smallest extraction was found for sulfuric acid. The size to charge ratio of sulfate is lower than that of the other anions. A stronger color was observed when the acid concentrations were increased. When 0.1 M nitric acid was shaken with 0.1 M Kelex 100 in chloroform, the concentration of nitric acid extracted was 0.003 M. Extraction of potassium ion by Kelex 100 anion was
not observed.
Distribution Measurements In chloroform, both oxine and Kelex 100 have wavelength maxima
at 318 ran, but the Kelex 100 band is much broader and trails into the visible. The reagent absorbs strongly in the absorbance range of most of its metal chelates. Consequently, aqueous phase analysis of the metal values in the distribution measurements was desirable. For the several metals examined in this work, the slope of the extraction curves was equal to the charge on the metal ion within experimental error. Un
der comparable conditions (8), pH^y^ values are increased for Kelex 100 relative to oxine (see Table 6). From equation (2), D is dependent onthe Kn /K^ ratio. According to Dyrssen (9), Kn increases by a factor
c R Rof four from the addition of each CH^ group in a homologous series. Fresco and Freiser (10) found that relative to oxine, the quantity
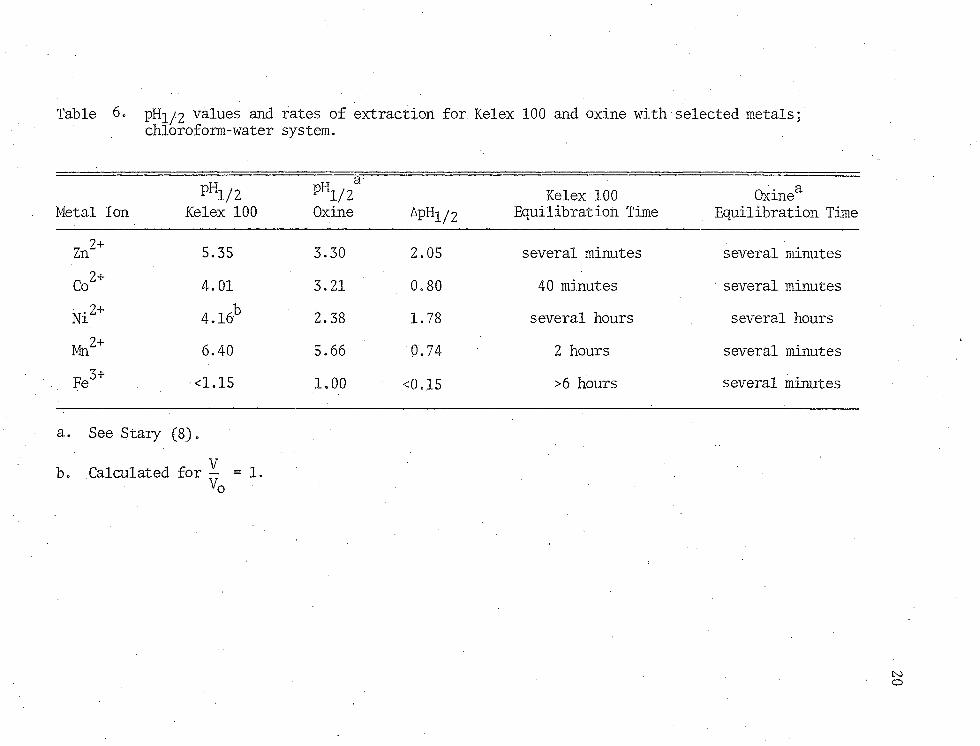
Table 6. p%/2 values and rates of extraction for. Kelex 100 and oxine with selected metals;chloroform-water system.
Metal IonPh1/2
Kelex 100PHl/2aOxine ApHi/2
Kelex 100 Equilibration Time
Qxinea Equilibration Time
Zn2t 5.35 3.30 2.05 several minutes several minutes
Co2* 4.01 3.21 0.80 40 minutes several minutes
Ni2* 4.16b 2.38 1.78 several hours several hours
Mil2* 6.40 5.66 0.74 2 hours several minutesFe3* <1.15 1.00 <0.15 >6 hours several minutes
a. See Stary (8).Vb. Calculated for — = 1.V0

21Kn /IC decreased somewhat for the Cu (II) oxinates of the 2 and 4 c R
methyl analogs. AP%/2 values should be approximately the same for eachmetal. In this study except for iron, the values varied from .7 to 1.8pH units. Zinc would fall in this range if 0.10 M Kelex 100 had beenused in the extraction.
A metal extraction curve has a horizontal portion of maximum logD where D = . Although not carried out in this work, the maximum D
cvalue of Kelex 100 metal complexes should be greater than that of oxine complexes.
A change in K ' may also affect the extraction rate. The rate R
determining step of a number of chelate extraction processes has been identified as the reaction between the metal and the ligand in the aqueous phase (11). Hence, as the Kn of the extract increases the result-
Ring drop in its aqueous phase concentration results in a drop in the rate of extraction observed. The plausibility of this same mechanism operating here is supported by the finding that the rate of Kelex 100 extraction for most of the metals studied was considerably slower than oxine extraction under similar conditions (see Table 6) .
The rate of extraction is pH dependent and has been observed to increase with increasing pH (11). Stary (8) found the same dependence in the extraction of a number of 8-hydroxyquinoline complexes. The rate
of Kelex 100 extraction was generally observed to increase with increas
ing pH. Nickel appeared to extract more slowly at higher. pH but more data are needed to reach a definite conclusion. When nickel was
22extracted from various nitric acid solutions, the equilibrium pH was somewhat greater than the initial pH because of nitric acid extraction.
The observed rate order was Zn>Co>Mn>Ni>Fe. The theoretical significance of this order -is somewhat compromised by not measuring the rates at the same pH of extraction for all metals. The order is similar to that for rates of water substitution. The rate of the manganese- Kelex 100 extraction is surprisingly slow. The possibility of oxidation state change [Mn(IT) Mn(III)] was explored spectrophotometrically but no evidence was found that this had occurred.
The dependence of the rate on metal ion concentration, reagent
concentration and pH was determined for the iron-Kelex 100 system. Straight line plots of log [Fe +] vs. time demonstrated that the reaction is first order in iron (see Figure 1). From the pseudo first order rate constants, the hydrogen ion exponent was calculated to be 0.63 ± .02. In a similar manner a value of 0.88 ± .16 was obtained for the exponent of the reagent concentration. Since these two values have approximately the same order of magnitude, the rate may depend on the Kelex 100 anion concentration. (Appendices A and B).
LOG
[Fe3
+]
23
- 3.8
2 4 6 8 10TIME(hours)
Figure 1. Time dependence of the extraction of iron with Kelex 100 at various pH values.

SUMMARY
The most probable structure of Kelex 100 was determined. The name of the compound based on this structure is 7-[3-(5,5,7,7-tetra- methyl-l-octenyl) ]-8-hydroxyquinoline.
The commercial reagent contained an amphoteric impurity, most of which was oxine. The majority of experiments performed suggest that the amount of oxine dissolved in Kelex 100 is small, on the order of 1-2%, Before use in the distribution studies, the oxine was removed by acid washing. The electronic spectral properties of Kelex 100, oxine, and their metal complexes are very similar, except that Kelex 100 absorbs fairly far into the visible region. Unlike oxine, Kelex 100 forms ex- tractable ion pairs in chloroform when shaken with various acid solu
tions. The extraction was least for sulfuric acid.The solvent extraction of zinc, cobalt, nickel, manganese, and
iron was studied for Kelex 100 in the chloroform-water system. Generally, the rate was observed to increase with increasing pH. The nickel extraction seemed to proceed more slowly at higher pH, but more data would be needed to verify this. Under comparable conditions with oxine
the extraction rate was generally slower for Kelex 100 and pH^yg values were observed to increase. A pE^ relative to oxine was observed tovary from about 0.7 to 1.8 pH units.
The iron-Kelex 100 reaction was determined to be first order iniron and approximately the same order in hydrogen ion and reagent. The
24

25closeness of the latter two values suggest some rate dependence on the Kelex 100 anion concentration.

APPENDIX A
DATA TABULATION
26

27Table A-l. Typical atomic absorption calibration for zinc.
Concentration M x 10-6
A.A. Response3- Arbitrary Units
1.54 6.63.85 18.47.70 37.415.4 73.4
Slope = 4.77 ± .04Intercept = 0.21 ± .34
a. All A.A. values are the average of at least two aspirations.

Table A-2. Typical atomic absorption calibration for cobalt.28
Concentrati on M x 10"5
A.A. Response Arbitrary Units
0.85 5.31.70 10.84.26 26.5
8.51 52.5
Slope =. 6.15 ±..03Intercept = 0.20 ± .15
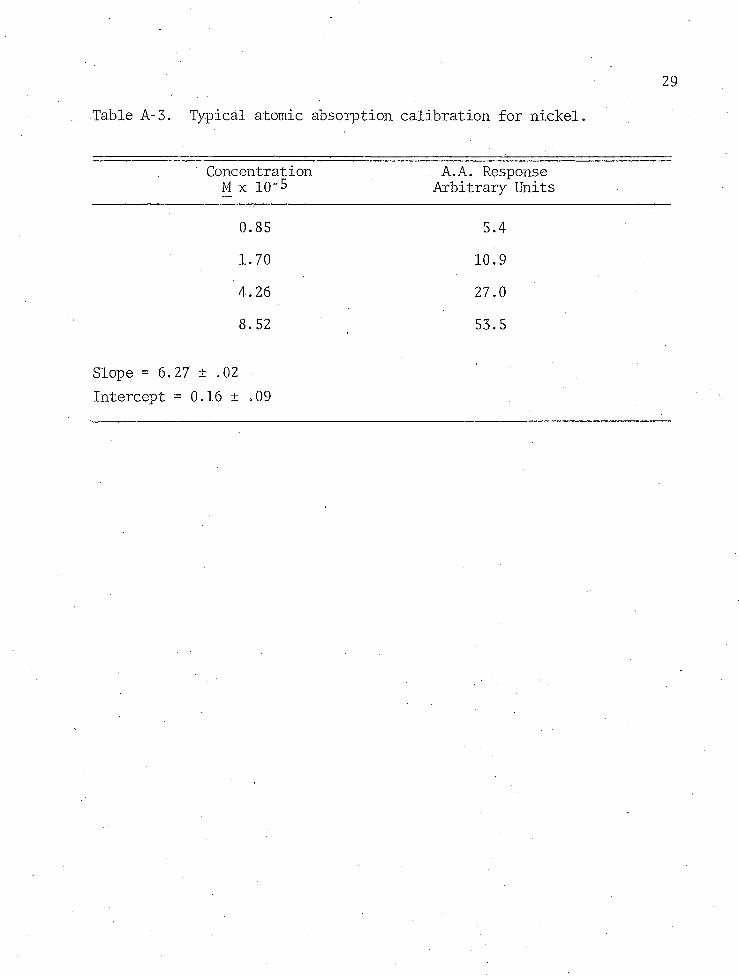
Table A-3. Typical atomic absorption calibration for nickel.
29
Concentration M x 10"5
. A.A. Response Arbitrary Units
0.85 5.41.70 10.94.26 27.08.52 53.5
Slope = 6.27 ± .02Intercept = 0.16 ± .09

30Table A-4. Typical atomic absorption calibration for manganese.
Concentration M x 10-5
A.A. Response Arbitrary Units
0.46 6.00.91 . 11.72.27 29.6
3.64 48.14.55 61.4
Slope = 1.35 ± .02 Intercept = -0.06 ± .05

31Table A-5. Effect of pH on the extraction of zinc by Kelex 100.a0.07 M Kelex 100 in CHC13 [Zn2+] = 1.54 x 10⁻⁵ m ionic strength = 0.005 M aqueous phase volume = 10 mis
pH[Zn^lM x 10"6 D
5.99 0.93 15.65.89 1.32 10.75.76 2.22 5.94
2.21 5.97
5.52 5.34 1.884.91 2.14
5.25 8.60 0.7915.01 12.7 .261
12.5 .235
Slope = 1.87 ± .04 Intercept = -9.98 ± .20
a. See Figure B-2, p. 41.
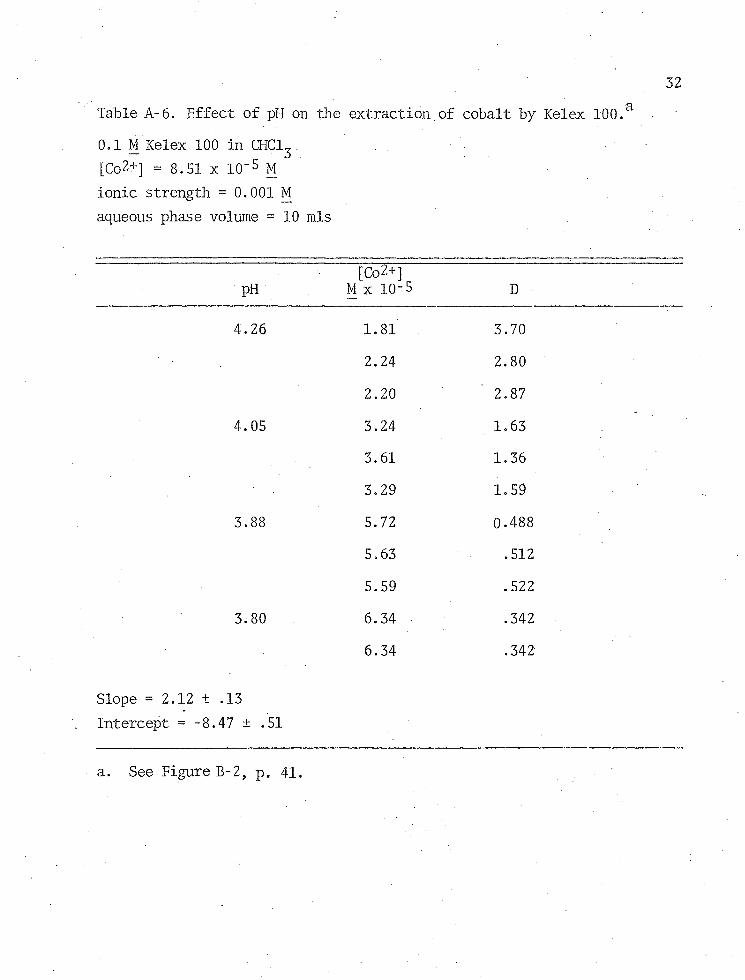
32Table A-6. Effect of pH on the extraction of cobalt by Kelex 100.a0.1 M Kelex 100 in CHCl^.[Co2+] = 8.51 x 10⁻⁵ % ionic strength = 0.001 M aqueous phase volume = 10 mis
pH[Co2+]
M x 10-5 D
4.26 1.81 3.702.24 2.802.20 2.87
4.05 3.24 1.633.61 1.363.29 1.59
3.88 5.72 0.4885.63 . 5125.59 .522
3.80 6.34 .342
6.34 .342
Slope = 2.12 ± .13Intercept = -8.47 ± .51
a. See Figure B-2, p. 41.

33Table A-7. Effect of pH on the extraction of nickel by Kelex 100,a0.1 M Kelex 100 in CHCl^[Ni2+] = 8.52 x 10"5 M ionic strength - 0.01 M aqueous, phase volume = 22 mis
pH[Ni2+]
M x 10-5 D
3.93 7.30 0.1673.97 7.00 .2174.03 6.76 .2604.04 6.67 .2774.12 6.26 .3614.13 6.33 .346
6.26 .3614.17 5.83 .4624.26 5.16 .651
4.31 4.76 .7904.32 4.70 .8134.36 3.95 1.164.42 3.01 1.83
Slope = 1.94 ± .09 Intercept = -8.40 ± .38
a. See Figure B-3., p. 42.

34Table A-8. Effect of pH on the extraction of manganese by Kelex 100.a0.1 M Kelex 100 in CHCl^[Mn2+] = 4.55 x 10"5 M ionic strength = 0.005 Maqueous phase volume =10 mis
pH[Mn2+]
M x 10"5 D
6.63 1.02 3.466.53 ’ 1.42 2.216.43 2.06 1.216.40 2.24 1.036.26 3.04 0.4976.16 3.49 .2966.13 3.51 .3046.08 3.77 .207
Slope = 2.20 ± .05Intercept = -14.07 ± .31
a. See Figure B-3, p. 42.

35Table A-9. Calibration data for iron (III) via the 1,10-phenanthroline
method.
Concentration M x 10~5 Absorbance
0.70 0.0761.25 .1402.51 .276
3.13 .3493.51 ,3915.01 . .5606.27 .698
Slope = 0.112 ± .000 Intercept = -0.002 ± .001
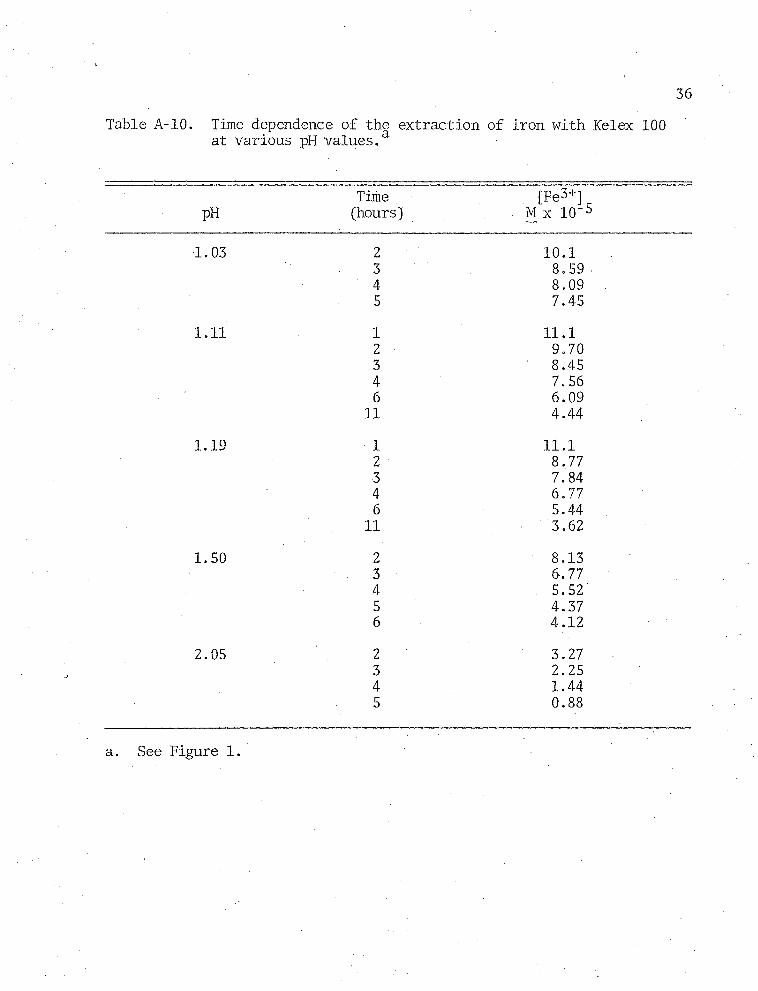
36Table A-10. time dependence of the extraction of iron with Kelex 100
at various pH values.a
pHTMe(hours)
[Fe3+]M x 10"5
1.03 2 10.13 8.594 8.095 7.45
1.11 1 11.12 9.703 8.454 7.566 6.0911 4.44
1.19 1 11.12 8.773 7.844 6.776 5.4411 3,62
1.50 2 8.133 6.774 5.525 4.376 4.12
2.05 2 3.273 2.254 1.445 0.88
a. See Figure 1.

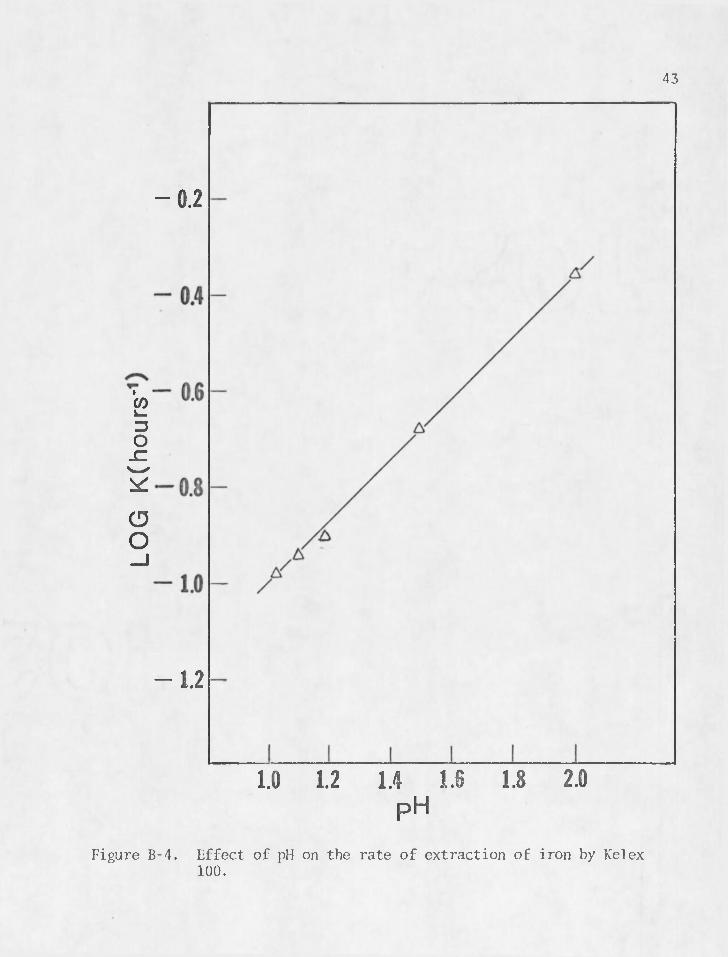
37Table A-11. Pseudo first order rate constants for the reaction of iron
with Kelex 100 at various pH values.a
pH Log K (hours
1.03 -0.98 ± .071.11 -0.94 ± .041.19 -0.92 ± ,051.50 -0.68 ± .022.05 -0.36 ± .02
a. See Figure B-4, p. 43.b. Several values of the iron concentration obtained at long shaking
times were not used in the calculation of log K since the rate of the reverse reaction was appreciable.

38Table A-12. Effect of reagent concentration on the rate of extraction
of iron■by Kelex 100; pH 2.03.a:
Kelex 100 in CHCljTime(hours)
[Fe3+]M x 10'5
0.01 M 1.5 10.93.0 9.884.5 8.906.0 8.37
0.03 M 1.5 8.993.0 6.684.5 5.856.0 5.28
a. See Figure B-5, p. 44.

APPENDIX B
. FIGURES

(aoi)A
40
30
25
20
15
10
5
U0 5 10 15 20C(g/kg)
Figure B-l. Vapor pressure osmometer calibration and molecular weight determination.
Benzi
Kelex 100

LOG
41
1.0
ZnCo
— 2.0
7.0pH
Figure B-2. Effect of pH on the extraction of cobalt and zinc by Kelex 100.

42
LO
Mn
3.9 4.0 5.0 6.0 7.0pH
Figure B-3. Effect of pH on the extraction of nickel and manganese by Kelex 100.
LOG
K(h
ours
'
43
— 0.2
— 1.2
1.0 1.2 1.4 1.6 1.8 2.0 pH
Figure B-4. Effect of pH on the rate of extraction of iron by Kelex 100.
44
.01M Ke!ex 100
.03M
~J -5 .0
- 5.4
4 862TIME(hours)
Figure B-5. Time dependence of the extraction of iron with various concentrations of Kelcx 100.

LOG
KCho
urs*1
45
0.0
1.6
- 2.0
2.0- 1.0LOGLKELEX]
Figure B-6. Effect of reagent concentration on the rate of extraction of iron with Kelex 100.

REFERENCES
1. Lacroix, S., Anal. Chim. Acta, 1, 260 (1947).2. Zolotov, Yu. A. and N. M. Kuzmin, Zh. A. Kh., 20, 467 (1965).3. Spink, D. R. and D. N. Okuhara, Transactions of the International
Symposium on Hydrometallurgy, Chicago, 111., 1973.4. Sandell, E. B., Colorimetric Determination of Traces of Metals,
B. L. Clarke, P. J. Elving, and I. M. Kolthoff, eds., Interscience Publishers, Inc., New York, 1959, p. 537-542.
5. Silverstein, R. M. and G. C. Bassler, Spectrometric Identificationof Organic Compounds, 2nd Ed., John Wiley and Sons, Inc., New York, 1967.
6. Baker, B. C. and D. T. Sawyer, Anal. Chem., 40, 1945 (1962).7. U. S. Pat. 3,637,711, Jan. 25, 1972.8. Stary, J., Anal. Chim. Acta., 28, 132 (1963).9. Dyrssen, D., Division of Analytical Chemistry, ACS, Summer Sympo
sium, Tucson, Az., 1963.10. Fresco, J. and H. Freiser, Anal. Chem., 36, 631 (1964).11. Honaker, C. B. and H. Freiser, J. Phys. Chem., 66, 127 (1962).
46

0078
Related Documents


