Solve the equations: 1.) 2.) 3.) Entry Task 02/08/2011 24 8 3 7 x x 8 6 3 1 x 21 ) 2 ( 3 4 x x

Solve the equations: 1.) 2.) 3.). Solve absolute value equations.
Dec 15, 2015
Welcome message from author
This document is posted to help you gain knowledge. Please leave a comment to let me know what you think about it! Share it to your friends and learn new things together.
Transcript
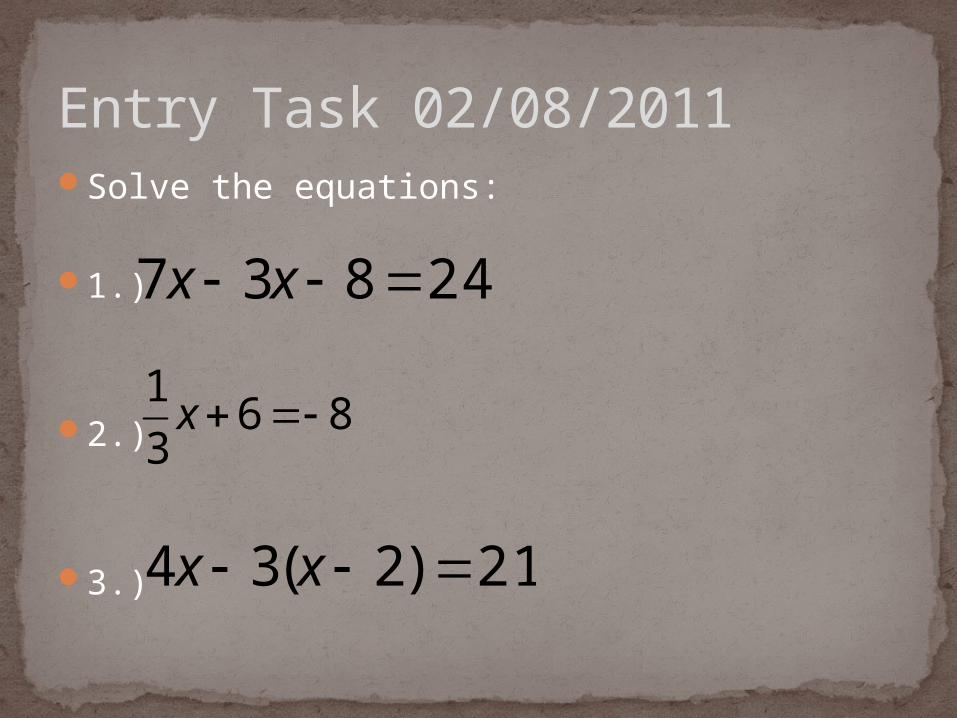
Solve the equations:
1.)
2.)
3.)
Entry Task 02/08/2011
24837 xx
863
1x
21)2(34 xx
Solve absolute value equations
Objective
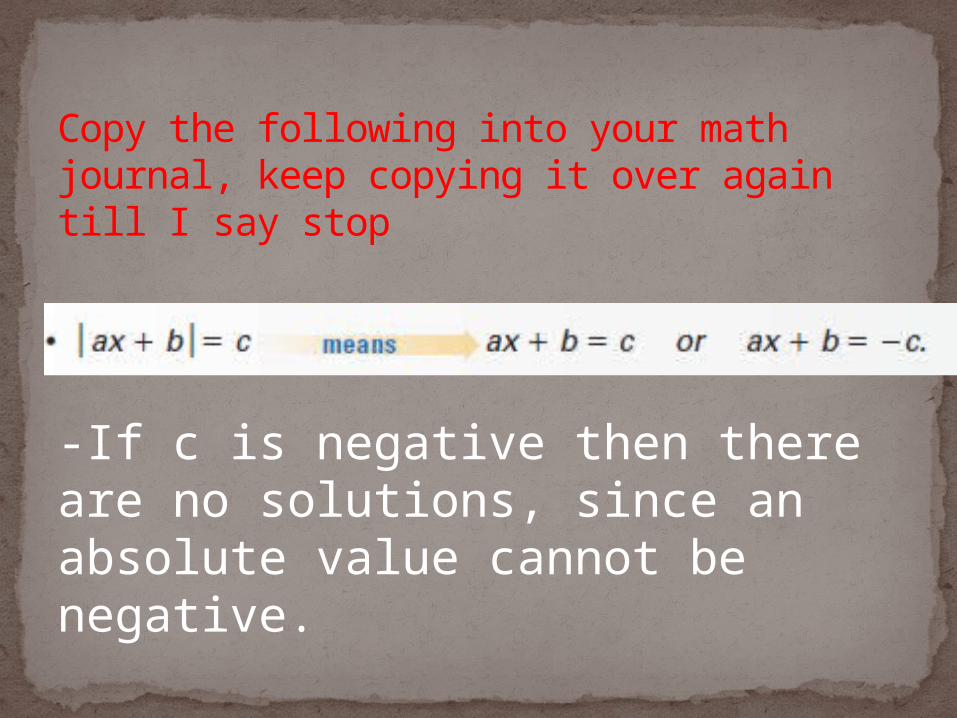
Copy the following into your math journal, keep copying it over again till I say stop
-If c is negative then there are no solutions, since an absolute value cannot be negative.
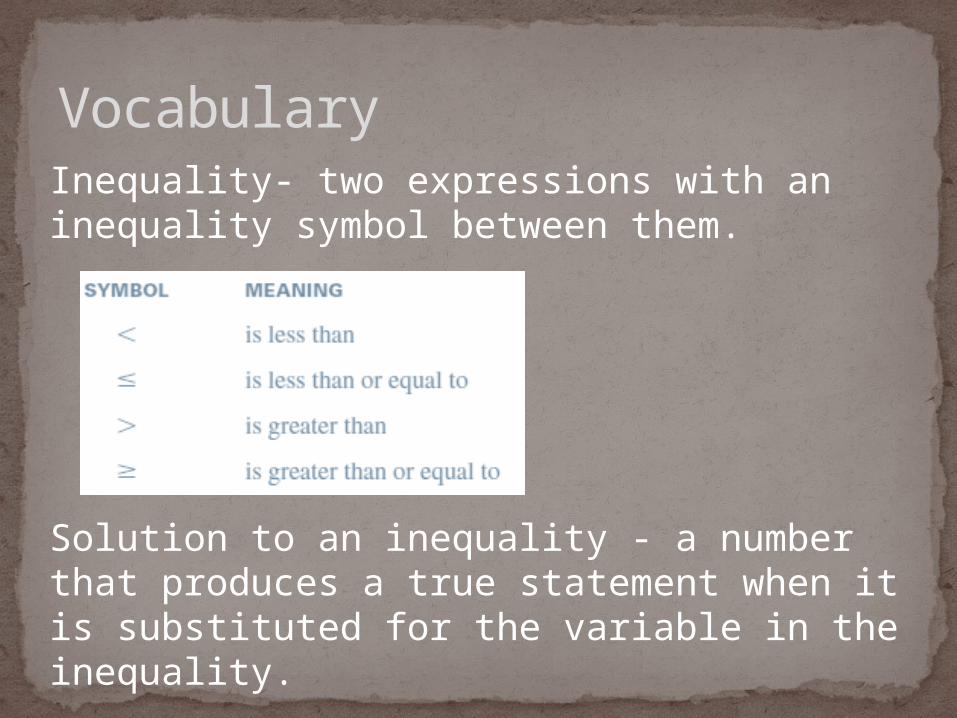
VocabularyInequality- two expressions with an inequality symbol between them.
Solution to an inequality - a number that produces a true statement when it is substituted for the variable in the inequality.
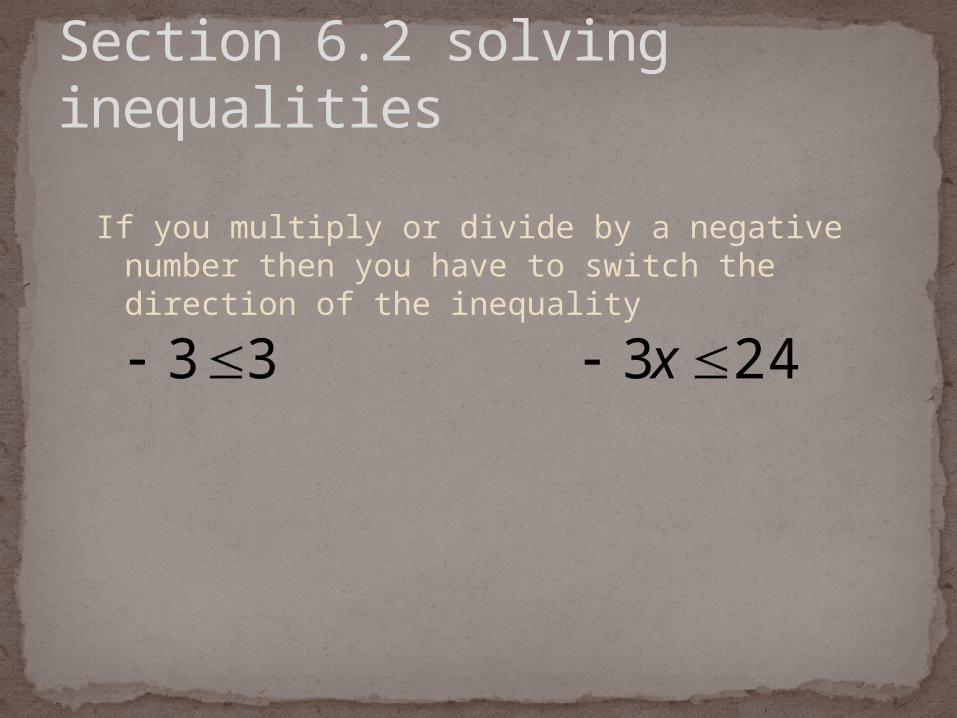
If you multiply or divide by a negative number then you have to switch the direction of the inequality
Section 6.2 solving inequalities
243 x33
Solving linear inequalities worksheet, due on Monday, front and back.
Home Fun
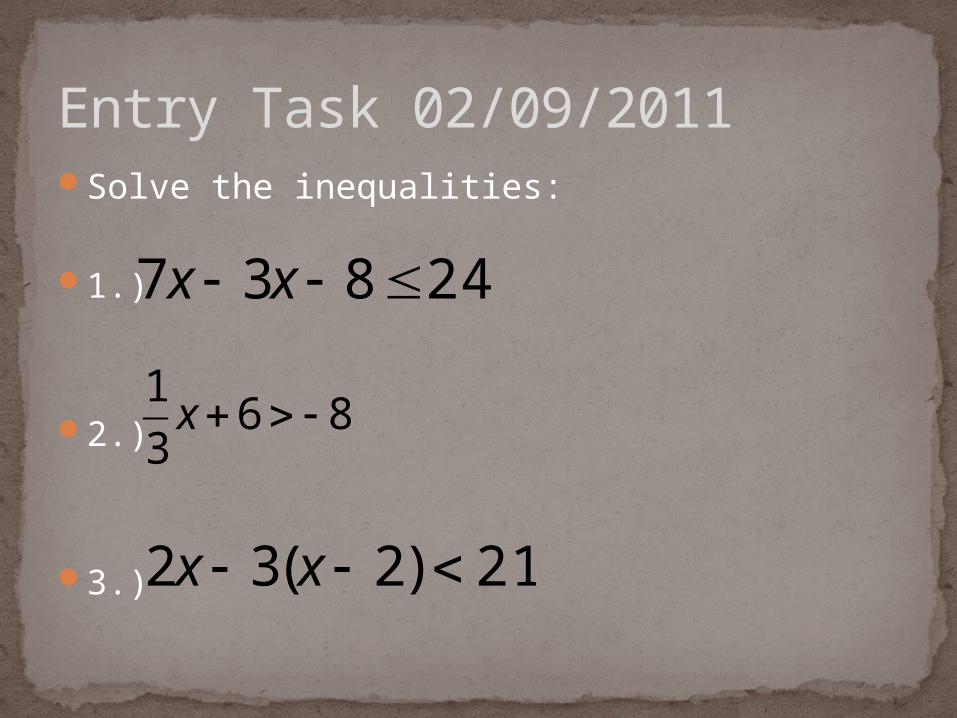
Solve the inequalities:
1.)
2.)
3.)
Entry Task 02/09/2011
24837 xx
863
1x
21)2(32 xx

Complete problems 1-6 on 6.2 standardized test practice. You have 12 minutes.
If you finish early work on 6.2 B
Entry Task 02/10/2011

You want to go to the state fair and try your luck playing the games on the midway. The entrance fee is $5 and the games are each $1.50.
Write an inequality that represents the possible number of games you can play if you have $25.
Solve the inequality.
What is the maximum number of games you can play?
Entry Task 02/11/2011

Objective: Write, solve, and graph compound inequalities.
Section 6.3

A Compound inequality consists of two inequalities connected by a and or an or.
Examples:a.) All real numbers that are greater than
zero and less than or equal to 4.
Or and
Solving Compound inequalities
40 x x0 4x
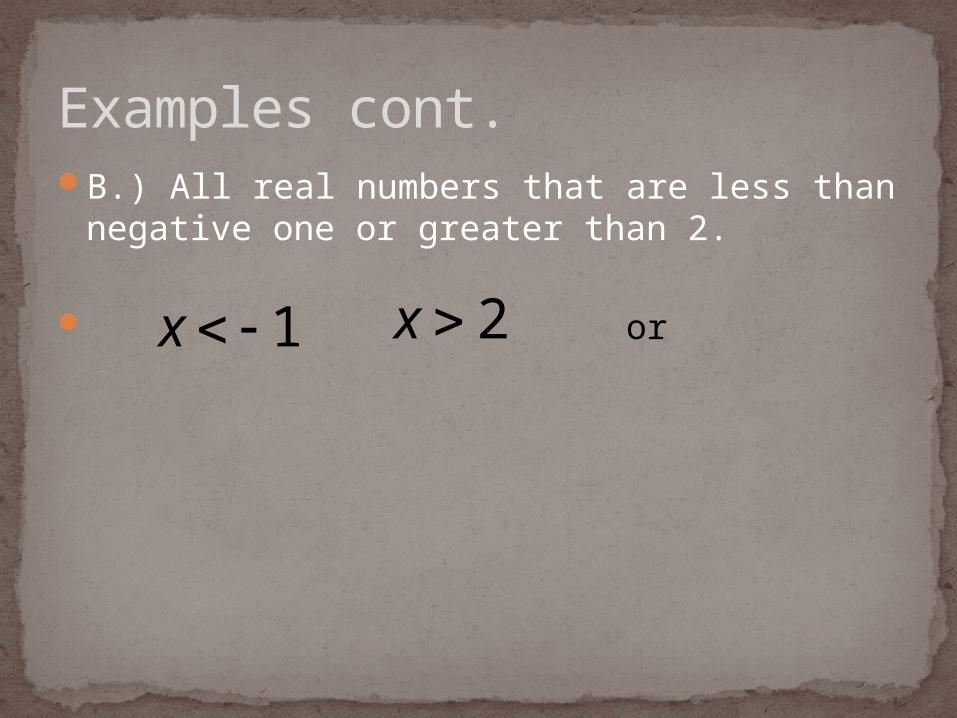
B.) All real numbers that are less than negative one or greater than 2.
or
Examples cont.
1x 2x

Entry Task 02/14/2011Which values of x make the following true?
1.) 2.)
Solve.
3.)
4.)
5x 9 x
27 x
104210 x
or 77 x
Objective: Solve absolute value equations. Solve absolute value inequalities.
Section 6.4

Entry Task 02/15/2011Which values of x make the following true?
1.) 2.)
Solve.
3.)
4.)
53 x 94 x
33 x
1792 x
and 53x
or 10105 x

Entry Task, write this down
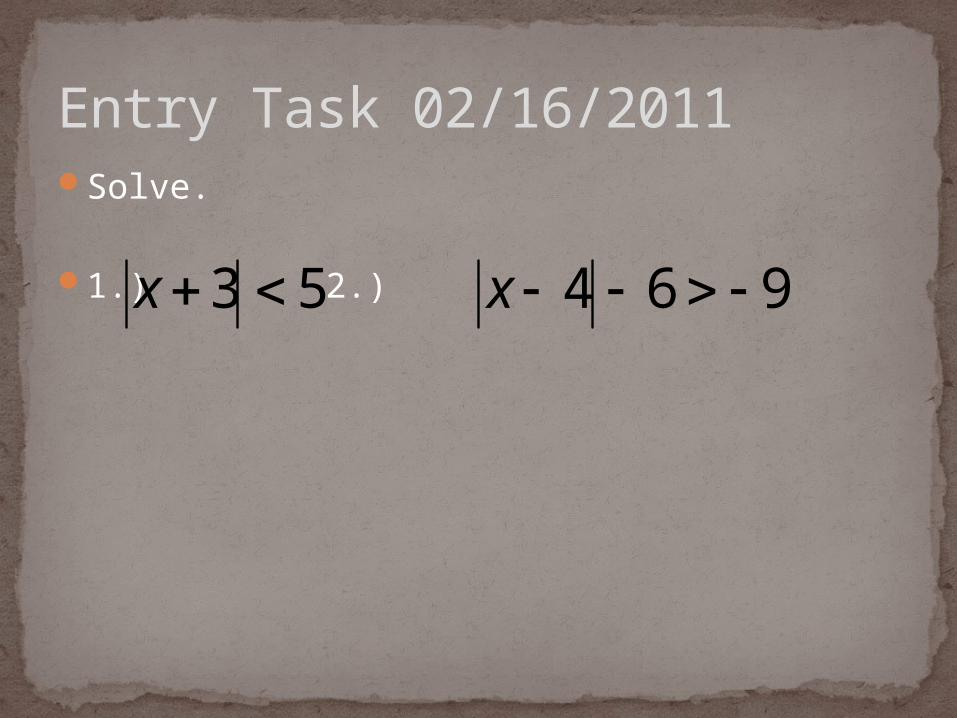
Entry Task 02/16/2011Solve.
1.) 2.)53 x 964 x
Get out 6.4 so I can check it for group points.
Complete problems 1-6 on the 6.4 Standardized test practice. You have 12 minutes
Entry Task 02/17/2011

Find the mean, median and mode of the following set of data,
0 69 68 60 23 0 0 76 0 0 73 0 81 0 48 18 0 89 0 0 75 75
Now get rid of the zeros and do the same thing.
What has changed? If I told you these were your test scores, why
might I leave out the zeroes when I calculate the mean median and mode?
Entry Task 11/07/2011

Distribute and then combine like terms.
1.) 3(2x-1) 2.) 2a-3(4-a)
3.) 4y(2y+3)-8y2 +1 4.) 4v3 – 3v2(2v+1)+ 2v2
Find the area of a rectangle whose length is 2x and whose width is 3x-1
Entry Task 11/07/2011
Chapter 6PLEs for 6.6 and 6.7
A1.2.D: Determine whether approximations or exact values of real numbers are appropriate, depending on the context, and justify the selection
A1.6.A: Use and evaluate the accuracy of summary statistics to describe and compare data sets.
A1.6.B: make valid inferences and draw conclusions based on data.
Algebra 1

Objective: Make and use a stem-and-leaf plot to put data in order. Find the mean, median and mode of data.
Section 6.6

A stem and leaf plot organizes data based on digits.
Make a stem and leaf plot for the following set of data.
45 1 52 42 10 40 50 40 7 46 19 35 3 11 31 6 41 12 43 37 8 41 48 42 55 30 58
Stem and leaf plot
Work problem 11 on homework
Mean, median and mode are all measures of central tendency, they are numbers that tell us something about a set of data
The mean of n numbers is the sum of the numbers divided by n
The median of n numbers is the middle number when they are arranged in order, if n is even, the median is the mean of the two middle numbers
The mode of n numbers is the number that occurs most frequently, there may be more than one or no mode.
Measures of central tendency

Make and stem and leaf pot and then find the mean, median and mode of the following data set. Which measure of central tendency is most representative of the data?
45 1 52 42 10 40 50 40 7 46 19 35 3 11 31 6 41 12 43 37 8 41 48 42 55 30 58
Measures of central tendency

If I add the number 100 to the previous data set, what would happen to my mean?
The mode?
The median?
What if…?
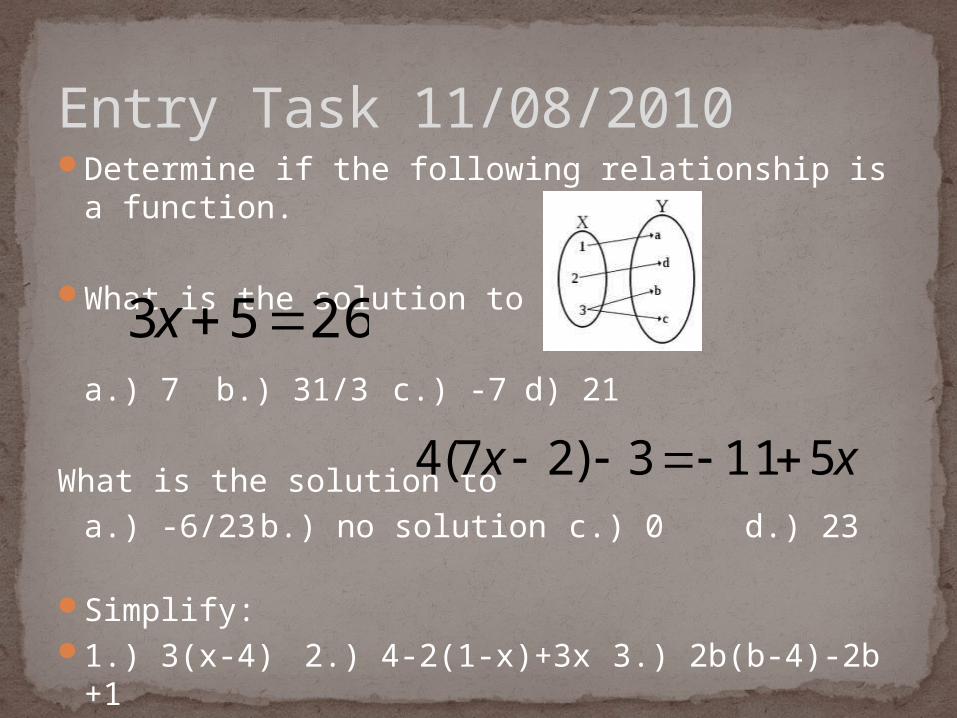
Determine if the following relationship is a function.
What is the solution to
a.) 7 b.) 31/3 c.) -7 d) 21
What is the solution to a.) -6/23 b.) no solution c.) 0 d.) 23
Simplify:1.) 3(x-4) 2.) 4-2(1-x)+3x 3.) 2b(b-4)-2b
+1
Entry Task 11/08/2010
2653 x
xx 5113)27(4
Objective: Draw a box-and-whisker plot to organize real-life data. Read and interpret a box-and-whisker plot.
Section 6.7
A Box-and-Whisker plot divides data into four parts.
The data is first divided in half by the median, which is also called the second quartile.
Then you take the median of the lower half of the data, this is called the first quartile.
Next you take the median of the upper part of the data, this is called the third quartile.
Make a box and whisker plot of the following numbers11 19 5 34 9 25 16 17 11 12 7
Box-and-Whisker Plots
11 19 5 34 9 25 16 17 11 12 7
Example
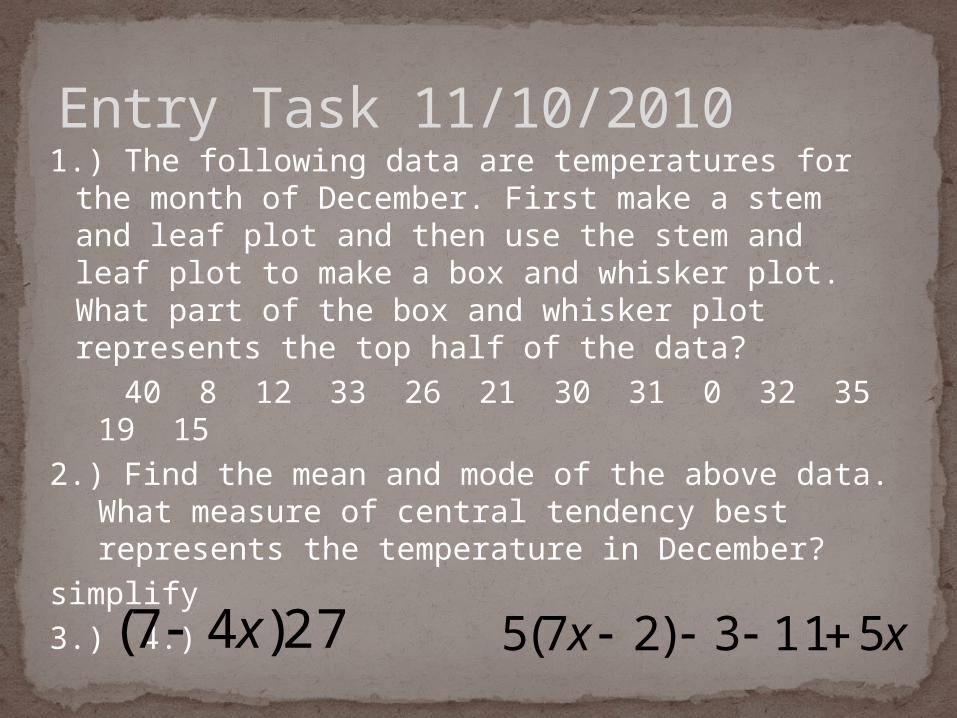
1.) The following data are temperatures for the month of December. First make a stem and leaf plot and then use the stem and leaf plot to make a box and whisker plot. What part of the box and whisker plot represents the top half of the data?
40 8 12 33 26 21 30 31 0 32 35 19 15 2.) Find the mean and mode of the above data.
What measure of central tendency best represents the temperature in December?
simplify3.) 4.)
Entry Task 11/10/2010
27)47( x xx 5113)27(5
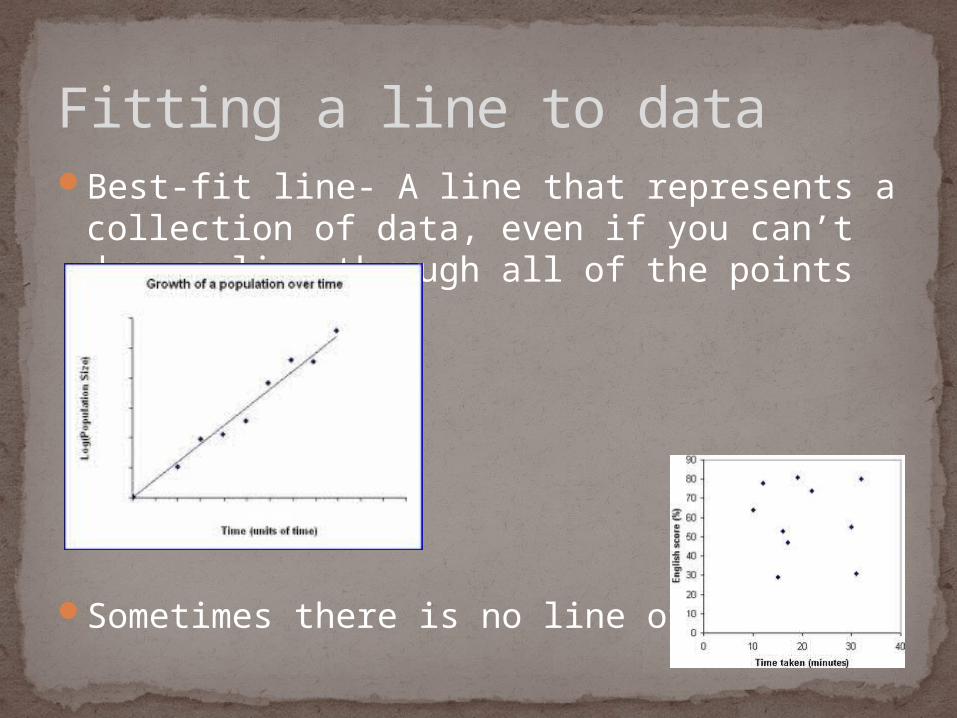
Fitting a line to dataBest-fit line- A line that represents a
collection of data, even if you can’t draw a line through all of the points
Sometimes there is no line of best fit
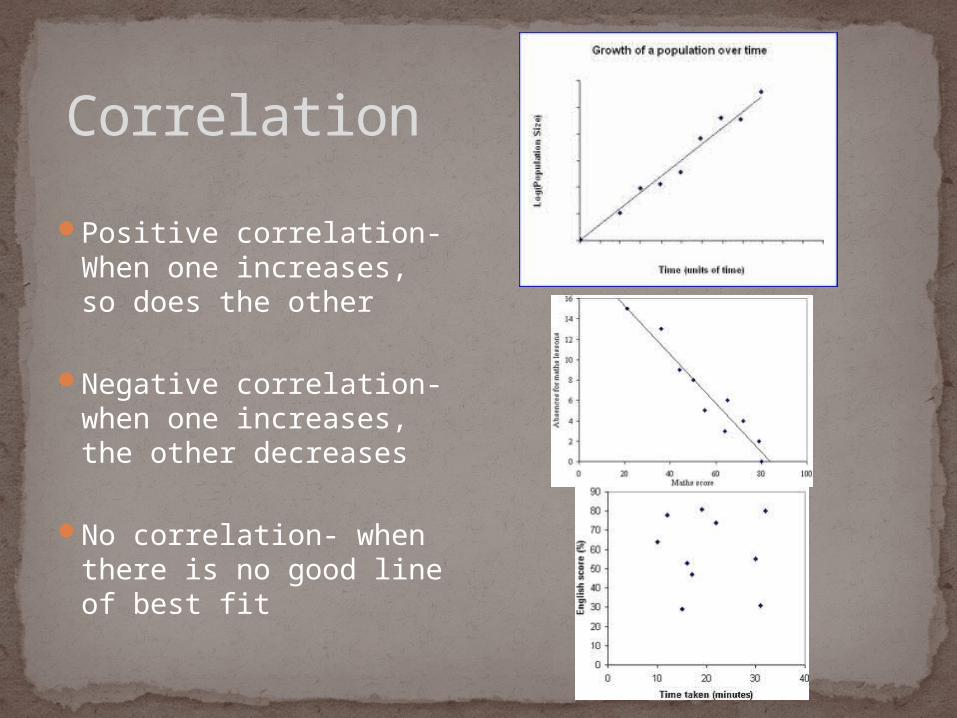
Correlation
Positive correlation- When one increases, so does the other
Negative correlation- when one increases, the other decreases
No correlation- when there is no good line of best fit

Mr. Shapiro found that the amount of time his students spent doing mathematics homework is positively correlated with test grades in his class. He concluded that doing homework makes students’ test scores higher. Is this conclusion justified? Explain any flaws in Mr. Shapiro’s reasoning.
Does the data have a positive or negative correlation?
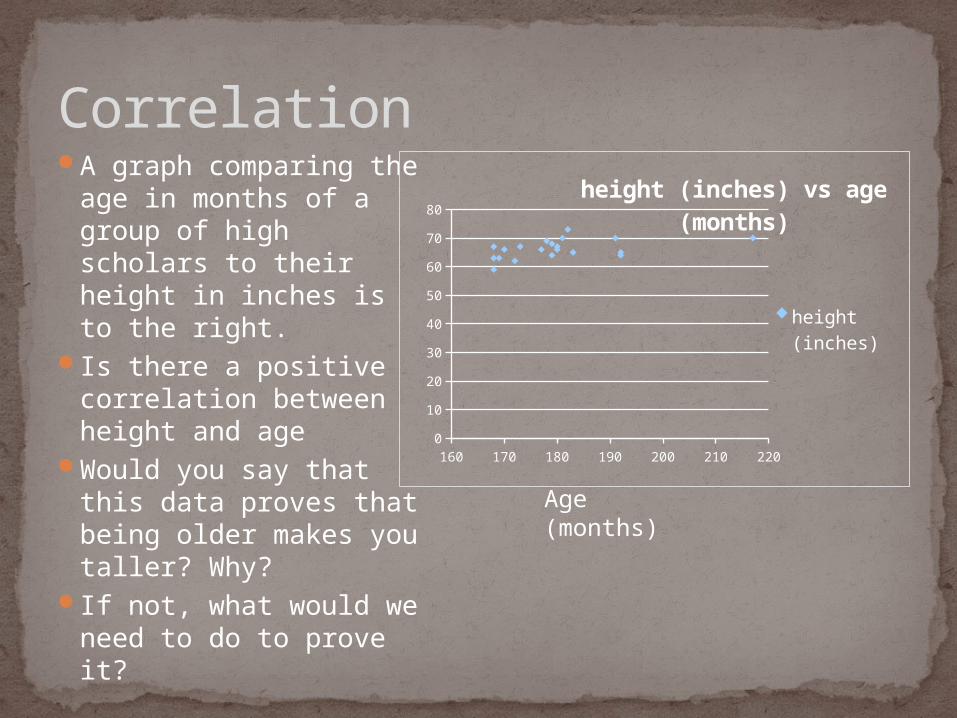
A graph comparing the age in months of a group of high scholars to their height in inches is to the right.
Is there a positive correlation between height and age
Would you say that this data proves that being older makes you taller? Why?
If not, what would we need to do to prove it?
Correlation
160 170 180 190 200 210 2200
10
20
30
40
50
60
70
80
height (inches) vs age (months)
height (inches)
Age (months)

Pg. 378 #1-10Homework
For the following data first make a stem and leaf plot and then use the stem and leaf plot to make a box and whisker plot. What part of the box and whisker plot represents the top half of the data?
40 8 12 33 26 21
Solve:
Entry Task 11/10/2010
2747 x xx 5113)27(5
Entry Task 11/15/2010For the following data first make a stem and
leaf plot and then use the stem and leaf plot to make a box and whisker plot. What part of the box and whisker plot represents the top half of the data?
10 8 9 2 3 2 1 4 5
Solve: 1765 x )511(7327 xxx

Pg. 381 quiz 3 #1-9
Due at end of period
Review Assignment
Related Documents