Introduction ©Curriculum Associates, LLC Copying is not permitted. 258 Use What You Know Lesson 25 Solve Problems Using Scaled Graphs Lesson 25 Solve Problems Using Scaled Graphs a. The sentence at the bottom of the graph tells you that each stands for points. b. There is 1 next to Alan’s name. That means that Alan scored 2 points. There are 3 next to Cate’s name. How many points did Cate score? points c. How many are next to Gary’s name? d. How many points did Gary score? points e. Explain how you could find the number of points Mae scored. Ron kept track of the points scored by his teammates during a basketball game. He recorded his data in the picture graph shown below. How many points did each teammate score? Points Scored During the Game Alan Cate Gary Mae Key: Each stands for 2 points. You have had practice modeling and solving word problems. In this lesson, you will use information from graphs to solve word problems. Take a look at this problem. NY-3.MD.3

Welcome message from author
This document is posted to help you gain knowledge. Please leave a comment to let me know what you think about it! Share it to your friends and learn new things together.
Transcript

Introduction
©Curriculum Associates, LLC Copying is not permitted.258
Use What You Know
Lesson 25 Solve Problems Using Scaled Graphs
Lesson 25Solve Problems Using Scaled Graphs
a. The sentence at the bottom of the graph tells you that each stands for points.
b. There is 1 next to Alan’s name. That means that Alan scored 2 points.
There are 3 next to Cate’s name.
How many points did Cate score? points
c. How many are next to Gary’s name?
d. How many points did Gary score? points
e. Explain how you could find the number of points Mae scored.
Ron kept track of the points scored by his teammates during a basketball game. He recorded his data in the picture graph shown below. How many points did each teammate score?
Points Scored During the Game
Alan
Cate
Gary
Mae
Key: Each stands for 2 points.
You have had practice modeling and solving word problems. In this lesson, you will use information from graphs to solve word problems. Take a look at this problem.
NY-3.MD.3

©Curriculum Associates, LLC Copying is not permitted. 259
Find Out More
Lesson 25 Solve Problems Using Scaled Graphs
Look at Ron’s picture graph on the previous page. The key tells you that each stands for 2 points. You can multiply the number of by 2 to find the total number of points each student scored.
Student Number of 3Points for
each basket5
Total Number of Points
Alan 1 3 2 5 2
Cate 3 3 2 5 6
Gary 5 3 2 5 10
Mae 4 3 2 5 8
The same basketball data can be shown on a bar graph. The bars on the bar graph below show how many points each student scored.
0 2 4 6 8 10 12
Points Scored During the Game
Number of Points Scored
Alan
Cate
Gary
Mae
Stu
den
ts
The numbers along the bottom of the bar graph are called the scale. The scale marks off equal sections. On this graph each number on the scale is 2 more than the number before it. The scale counts by 2s.
Reflect1 What would it mean if the symbol for Alan was ? Then how many points would
Alan have scored? Explain.

Modeled and Guided Instruction
Learn About
©Curriculum Associates, LLC Copying is not permitted.260
Lesson 25
Lesson 25 Solve Problems Using Scaled Graphs
Reading and Interpreting Picture Graphs
Read the problem below. Then explore different ways to answer questions about picture graphs.
Jaime asked students in his school to choose their favorite season. The picture graph shows how students answered. How many more students chose summer than chose winter as their favorite season?
Picture It You can use pictures to understand the problem.
Remember that each stands for 5 students.
Winter
Summer
Model It You can also use number lines to help understand the problem.
Remember that each stands for 5 students.
0 5 10 15 20 25 30 35Winter
15 15 15 15
0 5 10 15 20 25 30 35Summer
15 15 15 15 15 15
Favorite Season
Winter
Spring
Summer
Fall
Key: Each stands for 5 students.

©Curriculum Associates, LLC Copying is not permitted. 261Lesson 25 Solve Problems Using Scaled Graphs
Connect It Now you will solve the problem from the previous page using equations.
2 What does the problem ask you to find?
3 Complete the key. Each stands for students.
4 Complete the table. Find the number of students who chose winter and the number who chose summer.
Favorite Season
Number of 3
Students for each 5
Number of Students
Winter 4 3 5 5
Summer 3 5 5
5 Complete the equation to find how many more students chose summer than chose winter.
30 2 20 5
So, more students chose summer than chose winter.
6 Explain why the key is important when you are solving a problem that has a picture graph.
Try It Use the picture graph on the previous page and what you just learned to solve these problems. Show your work on a separate sheet of paper.
7 How many students did NOT choose spring or summer?
8 How many more students chose spring or fall than chose summer?

Modeled and Guided Instruction
Learn About
©Curriculum Associates, LLC Copying is not permitted.262
Lesson 25
Lesson 25 Solve Problems Using Scaled Graphs
Reading and Interpreting Bar Graphs
Read the problem below. Then explore different ways to answer questions about a bar graph.
The Hart School wants to build a new playground. The graph shows the number of dollars each grade has raised to build the playground. Grade 3 and Grade 4 together want to raise $300. How much more money must they raise?
10090
7060
80
5040302010
02 3 4 5 6
Money Raised for the Playground
Am
ou
nt R
aise
d (i
n d
olla
rs)
Grade
Explain It You can use words to explain how to use the graph to find the number of dollars raised by each grade.
Third Grade
Point to the Grade 3 bar. Find the top of the bar. Follow the line at the top of the bar to the left. Stop at the number on the left side of the graph. This is the number of dollars Grade 3 raised.
Fourth Grade
Point to the Grade 4 bar. Find the top of the bar. Follow the line at the top of the bar to the left. Stop at the number on the left side of the graph. This is the number of dollars Grade 4 raised.

©Curriculum Associates, LLC Copying is not permitted. 263Lesson 25 Solve Problems Using Scaled Graphs
Connect It Now you will solve the problem from the previous page using equations. Use the bar graph on the previous page to answer the questions.
9 What does each bar on the bar graph show?
10 What do the numbers in the scale along the left side of the bar graph stand for?
11 What is the difference between one number on the scale and the next number?
12 Look at the Grade 3 bar. How much money did Grade 3 raise?
Look at the Grade 4 bar. How much money Grade 4 raise?
13 What operation do you use to find out how much money was raised by
Grade 3 and Grade 4 altogether?
How much money did Grade 3 and Grade 4 raise altogether?
14 What operation do you use to find out how much more money must be raised in
order for Grade 3 and Grade 4 to together raise $300?
How much more money must the two classes raise to raise a total of $300?
15 Explain how the numbers in the scale of a bar graph help you to understand what
the bar shows.
Try It Use the bar graph on the previous page and what you just learned to solve these problems. Show your work on a separate sheet of paper.
16 How much money in all have all the grades raised?
17 How much more money have Grade 4 and Grade 5 raised altogether than Grade 2 and Grade 3 altogether?

Guided Practice
Practice
©Curriculum Associates, LLC Copying is not permitted.264
Lesson 25
Solving Problems Using Scaled Graphs
Lesson 25 Solve Problems Using Scaled Graphs
Example
Pair/ShareHow many more markers does Ms. Santos buy for Grade 4 than Grade 3?
The student multiplied the number of marker symbols by the number shown in the key. He did this to find the number of markers Ms. Santos bought for each class.
Study the example below. Then solve problems 18–20.
Ms. Santos buys markers for each class. Find how many more markers Ms. Santos buys for Grade 3 than for Grade 2.
Look at how you could show your work in a table.
GradeNumber of
3 Each
stands for5
Number of Markers
Grade 3 7 3 10 5 70
Grade 2 4 3 10 5 40
70 2 40 5 30
Solution 30 more markers
Markers for Each Class
Grade 2
Grade 3
Grade 4
Grade 5
Key: Each stands for 10 markers.
18 Use the picture graph above. How many markers did Ms. Santos buy in all?
Show your work.
Solution
Pair/ShareHow else could yousolve this problem?
What steps will you use to solve this problem?

©Curriculum Associates, LLC Copying is not permitted. 265Lesson 25 Solve Problems Using Scaled Graphs
Pair/ShareHow did you and your partner decide whether to add or subtract?
Pair/ShareWhat data on the bar graph do you need to solve the problem?
I think there are at least two different steps to this problem.
Use the bar graph below to solve problems 19 and 20.
2220
1412
1618
1086420
Nov Dec Jan Feb Mar
Snowfall
Sno
wfa
ll (i
n in
ches
)
Month
19 How much more snow fell in February and March combined than fell in November and December combined?
Show your work.
Solution
20 Which 2 months have the same amount of snowfall combined as January? Circle the letter of the correct answer.
A February and March
B December and March
C November and December
D November and February
Lara chose D as the correct answer. How did she get that answer?
I think the first step is to find the snowfall for January.
Independent Practice
Practice
©Curriculum Associates, LLC Copying is not permitted.266
Lesson 25
Solving Problems Using Scaled Graphs
Lesson 25 Solve Problems Using Scaled Graphs
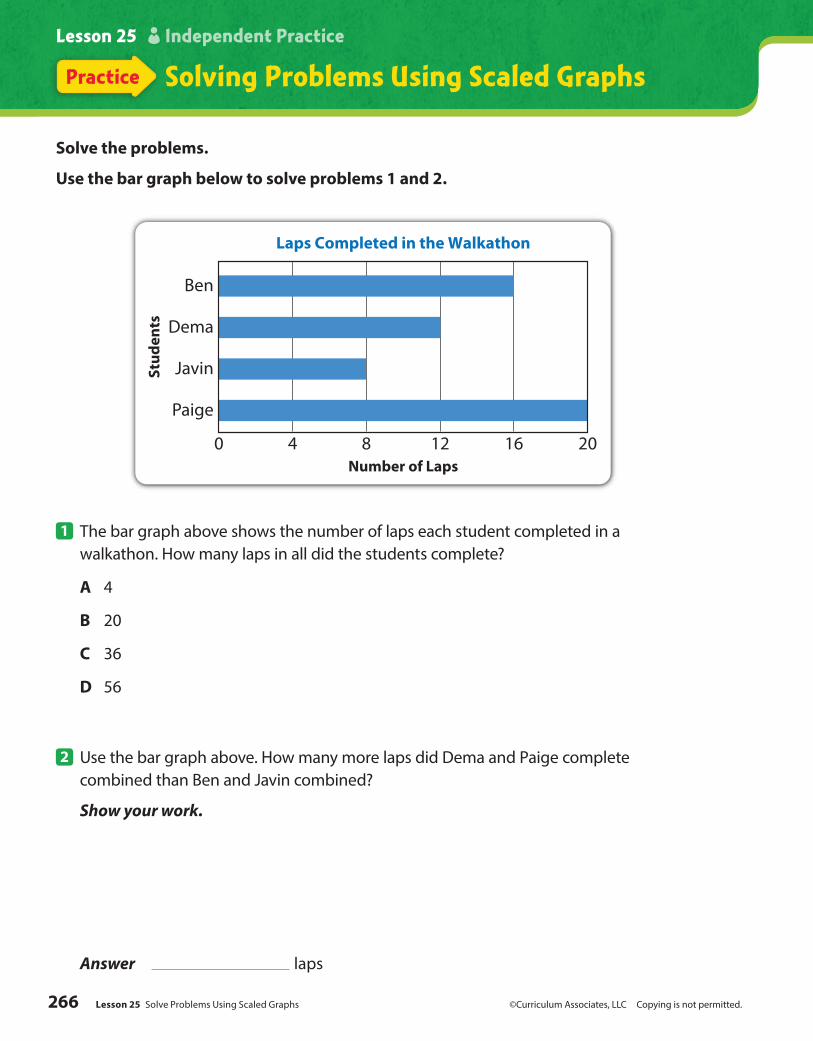
Solve the problems.
Use the bar graph below to solve problems 1 and 2.
0 4 8 12 16 20
Laps Completed in the Walkathon
Number of Laps
Ben
Dema
Javin
Paige
Stu
den
ts
1 The bar graph above shows the number of laps each student completed in a walkathon. How many laps in all did the students complete?
A 4
B 20
C 36
D 56
2 Use the bar graph above. How many more laps did Dema and Paige complete combined than Ben and Javin combined?
Show your work.
Answer laps
Self Check
©Curriculum Associates, LLC Copying is not permitted. 267Lesson 25 Solve Problems Using Scaled Graphs
Go back and see what you can check off on the Self Check on page 219.
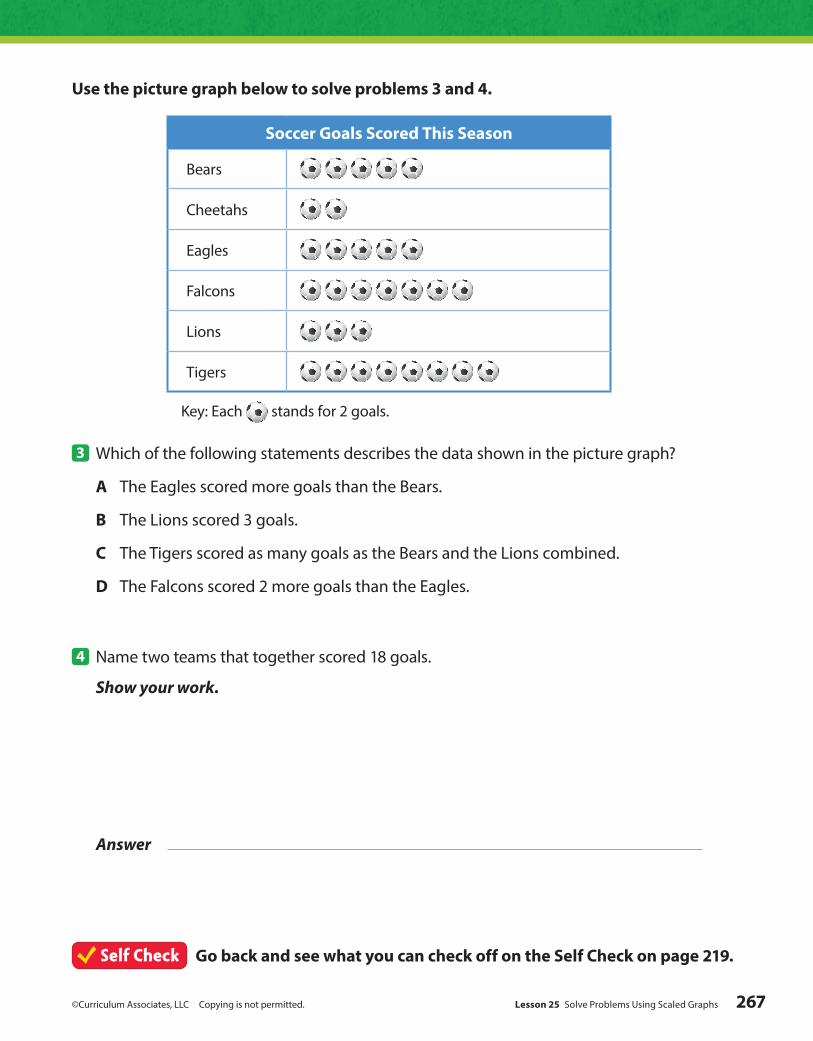
Use the picture graph below to solve problems 3 and 4.
Soccer Goals Scored This Season
Bears
Cheetahs
Eagles
Falcons
Lions
Tigers
Key: Each stands for 2 goals.
3 Which of the following statements describes the data shown in the picture graph?
A The Eagles scored more goals than the Bears.
B The Lions scored 3 goals.
C The Tigers scored as many goals as the Bears and the Lions combined.
D The Falcons scored 2 more goals than the Eagles.
4 Name two teams that together scored 18 goals.
Show your work.
Answer
Related Documents