835 Appendix B Solutions to Self-Test Problems CHAPTER 1 ST 1-1 a. Recommend project 1 since the total impact of project 1 on EPS (in today’s dollars) is greater than project 2: $1.32 versus $1.19. b. Recommend project 1 since if it were implemented, Doyle’s common share price will increase to $28.00 which is greater than the $26.50 for project 2. While both projects are acceptable since both result in the share price increasing, the increase with project 1 is greater. If only one project can be implemented, it should be project 1 if share price maximization were Doyle’s goal. c. The current value of common shareholders’ interest in Doyle is $195,000,000 (10,000,000 common shares $19.50). If project 1 were implemented, shareholder value will increase to $308,000,000 (11,000,000 common shares $28.00). For project 2, shareholder value will increase to $312,700,000 (11,800,000 common shares $26.50). Project 2 should be recommended. d. Liam should recommend project 2 as it results in the firm achieving its goal: maxi- mization of shareholder wealth. The goal is to maximize the value of the common shareholders’ total interest in the company. This is measured by multiplying the total number of common shares outstanding by the common share price. e. Project 2 might be the better project because it maximizes cash flows, leading to higher share prices. CHAPTER 2 ST 2-1 a. Current liabilities. The amount is $365,000. b. Both of these changes will result in total common equity increasing. Recall, common equity consists of both common shares and retained earnings. The sale of common shares generates $40,000 (5,000 shares $8.00) in cash and reinvested profits are $82,500 ($105,000 $22,500). Therefore, the total increase in common equity (shareholders’ equity) for the 2003 fiscal year would be $122,500. This means that either total assets must increase by $122,500, liabilities decrease by $122,500, or some combination of the two. c. The long-term debt account would decline by $25,000, so assets must either deline by $25,000, shareholders’ equity increase by $25,000, or some combination of the two.

Welcome message from author
This document is posted to help you gain knowledge. Please leave a comment to let me know what you think about it! Share it to your friends and learn new things together.
Transcript

835
A p p e n d i x B
S o l u t i o n s t o S e l f - Te s tP r o b l e m s
C H A P T E R 1ST 1-1 a. Recommend project 1 since the total impact of project 1 on EPS (in today’s dollars) is
greater than project 2: $1.32 versus $1.19.b. Recommend project 1 since if it were implemented, Doyle’s common share price will
increase to $28.00 which is greater than the $26.50 for project 2. While both projectsare acceptable since both result in the share price increasing, the increase with project1 is greater. If only one project can be implemented, it should be project 1 if shareprice maximization were Doyle’s goal.
c. The current value of common shareholders’ interest in Doyle is $195,000,000(10,000,000 common shares � $19.50). If project 1 were implemented, shareholdervalue will increase to $308,000,000 (11,000,000 common shares � $28.00). For project 2, shareholder value will increase to $312,700,000 (11,800,000 commonshares � $26.50). Project 2 should be recommended.
d. Liam should recommend project 2 as it results in the firm achieving its goal: maxi-mization of shareholder wealth. The goal is to maximize the value of the commonshareholders’ total interest in the company. This is measured by multiplying the totalnumber of common shares outstanding by the common share price.
e. Project 2 might be the better project because it maximizes cash flows, leading tohigher share prices.
C H A P T E R 2ST 2-1 a. Current liabilities. The amount is $365,000.
b. Both of these changes will result in total common equity increasing. Recall, commonequity consists of both common shares and retained earnings. The sale of commonshares generates $40,000 (5,000 shares � $8.00) in cash and reinvested profits are$82,500 ($105,000 � $22,500). Therefore, the total increase in common equity(shareholders’ equity) for the 2003 fiscal year would be $122,500. This means thateither total assets must increase by $122,500, liabilities decrease by $122,500, orsome combination of the two.
c. The long-term debt account would decline by $25,000, so assets must either deline by$25,000, shareholders’ equity increase by $25,000, or some combination of the two.
25ApB_GITM.qxd 02/10/2003 10:42 AM Page 835

d. The next impact of parts b and c is to increase total liabilities and shareholders’ equityby $97,500 ($122,500 � $25,000). This implies that total assets would increase bythis amount, liabilities decrease by $97,500, or some combination of the two.
ST 2-2 a. Yes. Montgomery sold an asset for more than its cost. The capital gain was $141,300($260,000 � $112,500 � $6,200). 50% of this capital gain is taxable which is$70,650.
b. Taxable income is:
EBIT $180,000less: Interest expense 42,400EBT and capital gain $137,600plus: Taxable capital gain 70,650Taxable income $208,250
c. Taxes on first $200,000 @22.16% $ 44,320Taxes on remaining $8,250 @31.16% 2,571Total taxes $ 46,891NIAT $161,359
d. Montgomery Enterprises is a manufacturer, therefore the company qualifies for themanufacturing and processing deduction. In Quebec, the tax rate was 31.16% for amanufacturer. Therefore, total taxes would be $64,891 ($208,250 � 31.16%) andNIAT would be $143,359.
e. The tax system “subsidizes” tax deductible expenses for corporations. Therefore, theactual, after-tax cost of the interest expenses was:42,400 � (1 � 0.3116) � $29,188The “subsidy” was $13,212 ($42,400 � 31.16%)
C H A P T E R 3ST 3-1
836 APPENDIX B
Ratio Too high Too low
Current ratio �current assets/current liabilities
Average age of inventory �inventory/average daily COGS
Times interest earned � earnings beforeinterest and taxes/interest
Gross margin � gross margin/sales
Return on total assets � net income aftertaxes/total assets
May indicate poor management of cur-rent assets and that the firm is holdingexcessive cash, accounts receivable, orinventory.
May indicate poor inventory manage-ment, excessive inventory, or obsoleteinventory.
Implies very high profits, which is never a problem, but could also im;ply thatthe firm is not using leverage to increase returns to shareholders
Indicates the low cost of merchandisesold relative to the sales price; mayindicate extremely good control ofdirect costs (COGS) or noncompetitivepricing and potential lost sales.
May indicate poor ability to satisfy short-term obligations, that the firm’s creditpolicy is too tight, and/or that inventoryis too low and that the firm is missingsales.
May indicate lower level of inventory,which may cause stockouts and lostsales.
May indicate poor ability to pay contrac-tual interest payments and a very highdebt level. Ratios less than 1 suggestthe possibility of bankruptcy.
Indicates the high cost of the merchandisesold relative to the sales price; mayindicate either a low sales price or ahigh cost of goods sold.
Indicates ineffective management in generating profits with the availableassets. Firm may have recentlyexpanded and the assets are not yetgenerating sales and profits.
25ApB_GITM.qxd 02/10/2003 10:42 AM Page 836

ST 3-2
C H A P T E R 4ST 4-1 a.
Balance SheetO’Keefe IndustriesDecember 31, 2002
Cash $1,030,000 Accounts payable $1,120,000
Marketable securities 25,000 Notes payable 160,000e
Accounts receivable 200,000a Accruals 20,000 _ _ _ _ _ _ _ _ _ _ _ _ _ _ _ _ _ _
Inventories 225,000b Total current liabilities $300,000d_______________________ _ _ _ _ _ _ _ _ _ _ _ _ _ _ _ _ _ _
Total current assets $1,480,000 Long-term debt $1,576,000f _ _ _ _ _ _ _ _ _ _ _ _ _ _ _ _ _ _
Net fixed assets $ 980,000c Shockholders’ equity $1,584,000g_______________________ _ _ _ _ _ _ _ _ _ _ _ _ _ _ _ _ _ _
Total assets $1,460,000 Total liabilities and $1,460,000_______________________ _ _ _ _ _ _ _ _ _ _ _ _ _ _ _ _ _ ________________________ _ _ _ _ _ _ _ _ _ _ _ _ _ _ _ _ _ _ _ _ _ _ _ _
aAverage collection period (ACP) � 40 daysACP � accounts receivable (A/R)/average sales per dayA/R = ACP � average sales per dayA/R = $1,825,000/365 � 40 daysA/R = $200,000bAverage age of inventory (AAI) = 60 daysAAI = inventory/average COGS per dayInventory = AAI � average COGS per dayCOGS = Sales � (1 – gross margin)COGS = $1,825,000 � (1 – 0.25)COGS = $1,368,750Inventory = 60 days � $1,368,750/365Inventory = $225,000cTotal asset turnover � 1.25Total asset turnover � sales/total assetsTotal assets = sales/total asset turnoverTotal assets = $1,825,000/1.25Total assets = $1,460,000Net fixed assets = total assets – total current assetsNet fixed assets = $1,460,000 – $480,000 = $980,000
Solutions to Self-Test Problems 837
dCurrent ratio � 1.60Current ratio � current assets/current liabilities1.60 � $480,000/current liabilities$300,000 � current liabilitieseNotes payable � total current liabilities �
accounts payable � accruals� $300,000 � $120,000 � $20,000� $160,000
fDebt ratio � .60Debt ratio � total liabilities/total assets.60 � total liabilities/$1,460,000$876,000 � total liabilitiesTotal liabilities � current liabilities + long-term debt$876,000 � $300,000 + long-term debt$576,000 � long-term debtgShareholders’ equity � total assets – total liabilityShareholders’ equity � $1,460,000 – $876,000Shareholders’ equity � $584,000
Cash Budget AccountsCarroll Company receivable at
April–June end of June
February March April May June July August
Forecast sales $500 $600 $400 $ 200 $200
Cash sales (30%) $150 $180 $120 $ 60 $ 60
Collections of A/R
Lagged 1 month [(.7 � .7) � 49%] 245 294 196 98 $198
Lagged 2 months [(.3 � .7) � 21%] 105 126 84 42 $42____________ _____________ _____________ ___________
$140 � $42 � $182
Total cash receipts $519 $ 382 $242
Less: Total cash disbursements 600 500 200____________ _____________ _____________
Net cash flow $ (81) $(118) $ 42
Add: Beginning cash 115 34 (84)____________ _____________ _____________
Ending cash $134 $ (84) $ (42)
Less: Minimum cash balance 25 25 25____________ _____________ _____________
Required total financing (line of credit) — $109 $ 67
Excess cash balance (marketable securities) $119 — —
25ApB_GITM.qxd 02/10/2003 10:42 AM Page 837
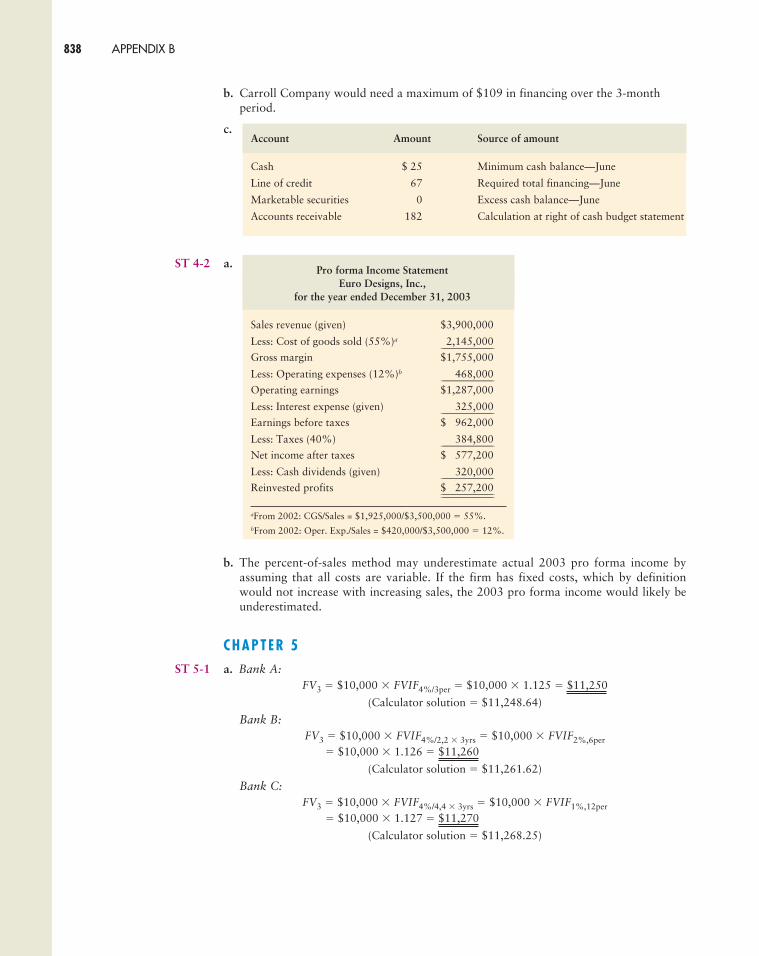
b. Carroll Company would need a maximum of $109 in financing over the 3-monthperiod.
c.
ST 4-2 a.
b. The percent-of-sales method may underestimate actual 2003 pro forma income byassuming that all costs are variable. If the firm has fixed costs, which by definitionwould not increase with increasing sales, the 2003 pro forma income would likely beunderestimated.
C H A P T E R 5ST 5-1 a. Bank A:
FV3 � $10,000 � FVIF4%/3per � $10,000 � 1.125 � $11,250
(Calculator solution � $11,248.64)
Bank B:FV3 � $10,000 � FVIF4%/2,2 � 3yrs � $10,000 � FVIF2%,6per
� $10,000 � 1.126 � $11,260
(Calculator solution � $11,261.62)
Bank C:FV3 � $10,000 � FVIF4%/4,4 � 3yrs � $10,000 � FVIF1%,12per
� $10,000 � 1.127 � $11,270
(Calculator solution � $11,268.25)
Pro forma Income StatementEuro Designs, Inc.,
for the year ended December 31, 2003
Sales revenue (given) $3,900,000
Less: Cost of goods sold (55%)a 2,145,000__________________________
Gross margin $1,755,000
Less: Operating expenses (12%)b 468,000__________________________
Operating earnings $1,287,000
Less: Interest expense (given) 325,000__________________________
Earnings before taxes $1,962,000
Less: Taxes (40%) 384,800__________________________
Net income after taxes $1,577,200
Less: Cash dividends (given) 320,000__________________________
Reinvested profits $1,257,200____________________________________________________
aFrom 2002: CGS/Sales = $1,925,000/$3,500,000 � 55%.bFrom 2002: Oper. Exp./Sales = $420,000/$3,500,000 � 12%.
Account Amount Source of amount
Cash $ 25 Minimum cash balance—June
Line of credit 67 Required total financing—June
Marketable securities 0 Excess cash balance—June
Accounts receivable 182 Calculation at right of cash budget statement
838 APPENDIX B
25ApB_GITM.qxd 02/10/2003 10:42 AM Page 838

Solutions to Self-Test Problems 839
b. Bank A: kEAR � (1 � 4%/1)1 � 1 � (1 � .04)1 � 1 � 1.04 � 1 � .04 � 4%Bank B: kEAR � (1 � 4%/2)2 � 1 � (1 � .02)2 � 1 � 1.0404 � 1 � .0404 � 4.04%Bank C: kEAR � (1 � 4%/4)4 � 1 � (1 � .01)4 � 1 � 1.040604 � 1 � .040604 � 4.0604%
c. Ms. Martin should deal with Bank C: The quarterly compounding of interest at thegiven 4% rate results in the highest future value as a result of the corresponding highesteffective annual rate.
d. Bank D:
The EAR for Bank D is:e04 � 1 � 1.0408108 � 1
� 0.0408108 � 4.08108%
At the end of 3 years, Ms. Martin would have:FV3 � $10,000 � FVIF4%,3yrs (continuous compounding)
� $10,000 � e.04�3 � $10,000 � e.12
� $10,000 � 1.127497� $11,274.97
This alternative is better than Bank C, because it results in a higher future valuebecause of the use of continuous compounding, which with otherwise identical cashflows always results in the highest future value of any compounding period.
ST 5-2 a. On a purely subjective basis, a rational argument could be made for both annuities.The fact that annuity Y’s cash flows occur at the end of the year (an ordinary annuity)while annuity X’s cash flows occur at the beginning of the year (an annuity due)favours annuity X, because its beginning-of-year cash flows will have more time tocompound than the end-of-year cash flows of annuity Y. On the other hand, it wouldseem that the extra $1,000 per year in cash flow from annuity Y ($10,000 for annuityY and $9,000 for annuity X) would outweigh the benefit of annuity X’s longer com-pounding period. As noted in what follows, only after making necessary computationscan the more attractive annuity be determined.
b. Annuity X (annuity due):
FVA6 � $9,000 � FVIFA15%,6yrs � (1 � .15)� $9,000 � 8.754 � 1.15 � $90,603.90
(Calculator solution � $90,601.19)
Annuity Y (ordinary annuity):
FVA6 � $10,000 � FVIFA15%,6yrs
� $10,000 � 8.754 � $87,540.00
(Calculator solution � $87,537.38)
c. Annuity X is more attractive, because its future value at the end of year 6, FVA6, of$90,601.19 is greater than annuity Y’s end-of-year-6 future value, FVA6, of $87,537.38.The first subjective assessment in a was correct. The benefit of receiving annuity X’scash flows at the beginning of the year more than offset the fact that its cash flows are$1,000 less than those of annuity Y, which has end-of-year cash flows. The high interestrate of 15% added to the attractiveness of annuity X (the annuity due), because each ofits cash flows earns at this rate for an extra year, thereby enhancing its future value.
ST 5-3 Alternative A:
Cash flow stream:PVA5 � $700 � PVIFA9%,5yrs
� $700 � 3.890 � $2,723
(Calculator solution � $2,722.76)
Lump sum: $2,825
25ApB_GITM.qxd 02/10/2003 10:42 AM Page 839

Alternative B:
Cash flow stream:
(Calculator solution � $2,935.90)
Lump-sum: $2,800
Conclusion: Alternative B in the form of a cash flow stream is preferred because its present value of $2,935.90 is greater than the other three values.
ST 5-4 FVA5 � $8,000; FVIFA7%,5yrs � 4.1; PMT � ?FVAn � PMT � (FVIFAk,n) [Equation 5.15 or 5.29]$8,000 � PMT � 4.1PMT � $8,000/5.751 � $1,951.13
(Calculator solution � $1,951.13)Judi should deposit $1,951.13 at the end of each of the 5 years to meet her goal of accumulating $8,000 at the end of the fifth year.
C H A P T E R 6
ST 6-1 $1,000 � $985.84�1 � �
$1,000 � $985.84 �� �$1,000 � $985.84 � $340.31737i
i �
i � 4.16%
ST 6-2 $75,000,000 � P �1 � �P � $74,873,351.21
The interest made is the difference between the amount Ferris will pay and the par value;in this case, $126,648.79.
0.0294 � 21���
365
$14.16���$340.31737
$985.84 � 126 *i������
365
i(126)��
365
Present valueCash flow FVIF9%,n [(1) � (2)]
Year (n) (1) (2) (3)
1 $1,100 .917 $1,088.70
2 900 .842 757.80
3 700 .772 540.40
4 500 .708 354.00
5 300 .650 195.00 _ _ _ _ _ _ _ _ _ _ _ _ _ _ _ _
Present value $2,935.90 _ _ _ _ _ _ _ _ _ _ _ _ _ _ _ _ _ _ _ _ _ _ _ _ _ _ _ _ _ _ _ _
840 APPENDIX B
25ApB_GITM.qxd 02/10/2003 10:42 AM Page 840

Solutions to Self-Test Problems 841
C H A P T E R 7
ST 7-1 a. Expected return, k� � (Equation 7.2a in footnote 9)
k�A � � � 14%
k�B � � � 14%
k�C � � � 14%
b. Standard deviation, (Equation 7.3a in footnote 10)
�kA� ����� �� � �� � 2%
�kB� ����� �� � �� � 2%
�kC� ����� �� � �� � 2%
c.
Over the 3-year period:
k�AB � � �14%
k�AC � � �14%
d. AB is perfectly negatively correlated.AC is perfectly positively correlated.
42%�
3
12%�14%�16%���
3
42%�
3
14%�14%�14%���
3
Annual expected returns
Year Portfolio AB Portfolio AC
2003 (.50 � 12%) � (.50 � 16%) � 14% (.50 � 12%) � (.50 � 12%) � 12%
2004 (.50 � 14%) � (.50 � 14%) � 14% (.50 � 14%) � (.50 � 14%) � 14%
2005 (.50 � 16%) � (.50 � 12%) � 14% (.50 � 16%) � (.50 � 16%) � 16%
8%�
24% � 0% � 4%��
2
(12% � 14%)2 � (14% � 14%)2 � (16% � 14%)2
������3 � 1
8%�
24%�0%�4%��
2
(16% � 14%)2 � (14% � 14%)2 � (12% � 14%)2
������3 � 1
8%�
2
4% � 0% � 4%��
2
(12% � 14%)2 � (14% � 14%)2 � (16% � 14%)2
������3 � 1
�k =n
i=1(ki � k)2
n � 1
�
42%�
312% � 14% � 16%���
3
42%�
316% � 14% � 12%���
3
42%�
312% � 14% � 16%���
3
�Returns��
3
25ApB_GITM.qxd 02/10/2003 10:42 AM Page 841
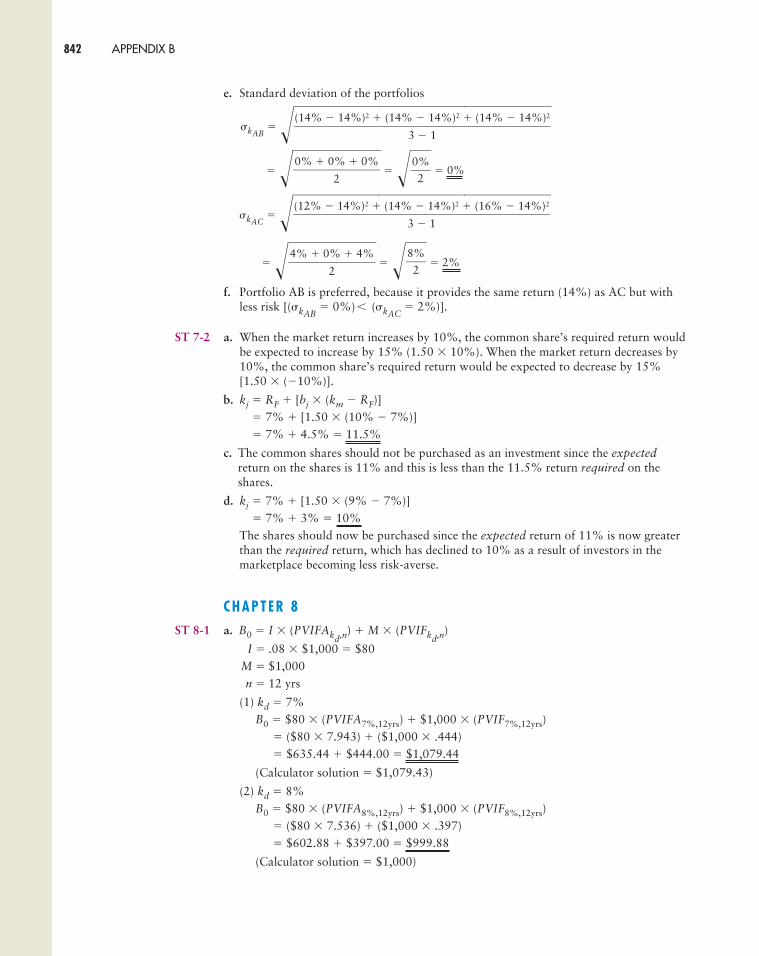
e. Standard deviation of the portfolios
�kAB� ����� �� � �� � 0%
�kAC� ����
� �� � �� � 2%
f. Portfolio AB is preferred, because it provides the same return (14%) as AC but withless risk [(�kAB
� 0%) (�kAC� 2%)].
ST 7-2 a. When the market return increases by 10%, the common share’s required return wouldbe expected to increase by 15% (1.50 � 10%). When the market return decreases by10%, the common share’s required return would be expected to decrease by 15%[1.50 � (�10%)].
b. kj � RF � [bj � (km � RF)]� 7% � [1.50 � (10% � 7%)]� 7% � 4.5% � 11.5%
c. The common shares should not be purchased as an investment since the expectedreturn on the shares is 11% and this is less than the 11.5% return required on theshares.
d. kj � 7% � [1.50 � (9% � 7%)]� 7% � 3% � 10%
The shares should now be purchased since the expected return of 11% is now greaterthan the required return, which has declined to 10% as a result of investors in themarketplace becoming less risk-averse.
C H A P T E R 8ST 8-1 a. B0 � I � (PVIFAkd,n) � M � (PVIFkd,n)
I � .08 � $1,000 � $80M � $1,000n � 12 yrs
(1) kd � 7%B0 � $80 � (PVIFA7%,12yrs) � $1,000 � (PVIF7%,12yrs)
� ($80 � 7.943) � ($1,000 � .444)� $635.44 � $444.00 � $1,079.44
(Calculator solution � $1,079.43)
(2) kd � 8%B0 � $80 � (PVIFA8%,12yrs) � $1,000 � (PVIF8%,12yrs)
� ($80 � 7.536) � ($1,000 � .397)� $602.88 � $397.00 � $999.88
(Calculator solution � $1,000)
8%�
24% � 0% � 4%��
2
(12% � 14%)2 � (14% � 14%)2 � (16% � 14%)2
������3 � 1
0%�
2
0% � 0% � 0%��
2
(14% � 14%)2 � (14% � 14%)2 � (14% � 14%)2
������3 � 1
842 APPENDIX B
25ApB_GITM.qxd 02/10/2003 10:42 AM Page 842

Solutions to Self-Test Problems 843
(3) kd � 10%B0 � $80 � (PVIFA10%,12yrs) � $1,000 � (PVIF10%,12yrs)
� ($80 � 6.814) � ($1,000 � .319)� $545.12 � $319.00 � $864.12
(Calculator solution � $863.73)
b. (1) kd � 7%, B0 � $1,079.44; sells at a premium
(2) kd � 8%, B0 � $999.88 � $1,000.00; sells at its par value
(3) kd � 10%, B0 � $864.12; sells at a discount
c. B0 � � (PVIFAkd/2,2n) � M � (PVIFkd/2,2n)
(1) kd � 7%
� � (PVIFA7%/2,2�12periods) � $1,000 � (PVIF7%/2,2�12periods)
� $40 � (PVIFA3.5%,24periods) � $1,000 � (PVIF3.5%,24periods)
� $642.33 � $437.96 � $1,080.29
(2) kd � 8%B0 � $40 � (PVIFA4%,24periods) � $1,000 � (PVIF4%,24periods)
� $609.88 � $390.12 � $1,000.00
(Calculator solution � $1,000)
(3) kd � 10%B0 � $40 � (PVIFA5%,24periods) � $1,000 � (PVIF5%,24periods)
� $551.95 � $310.07 � $862.02
ST 8-2 a. B0 � $1,150I � .11 � $1,000 � $110
M � $1,000n � 18 yrs
$1,150 � $110 � (PVIFAkd,18yrs) � $1,000 � (PVIFkd,18yrs)
Because if kd � 11%, B0 � $1,000 � M, try kd � 10%.B0 � $110 � (PVIFA10%,18yrs) � $1,000 � (PVIF10%,18yrs)
� ($110 � 8.201) � ($1,000 � .180)� $902.11 � $180.00 � $1,082.11
Because $1,082.11 < $1,150, try kd � 9%.B0 � $110 � (PVIFA9%,18yrs) � $1,000 � (PVIF9%,18yrs)
� ($110 � 8.756) � ($1,000 � .212)� $963.16 � $212.00 � $1,175.16
Because the $1,175.16 value at 9% is higher than $1,150, and the $1,082.11 value at10% rate is lower than $1,150, the bond’s yield to maturity must be between 9 and10%. Because the $1,175.16 value is closer to $1,150, rounding to the nearest wholepercent, the YTM is 9%. (By using interpolation, the more precise YTM value is9.27%.)Use a calculator to solve it in one easy step. The answer is 9.26%.
$80�
2
I�2
25ApB_GITM.qxd 02/10/2003 10:42 AM Page 843
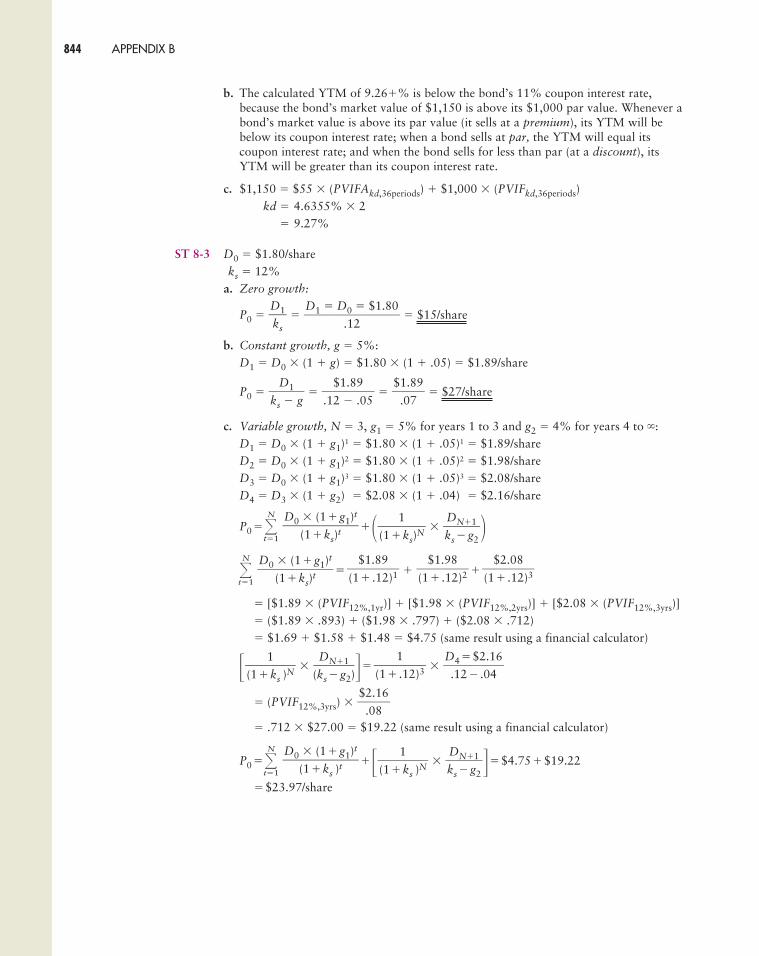
b. The calculated YTM of 9.26�% is below the bond’s 11% coupon interest rate,because the bond’s market value of $1,150 is above its $1,000 par value. Whenever abond’s market value is above its par value (it sells at a premium), its YTM will bebelow its coupon interest rate; when a bond sells at par, the YTM will equal itscoupon interest rate; and when the bond sells for less than par (at a discount), itsYTM will be greater than its coupon interest rate.
c. $1,150 � $55 � (PVIFAkd,36periods) � $1,000 � (PVIFkd,36periods)kd � 4.6355% � 2
� 9.27%
ST 8-3 D0 � $1.80/shareks � 12%
a. Zero growth:
P0 � � � $15/share
b. Constant growth, g � 5%:D1 � D0 � (1 � g) � $1.80 � (1 � .05) � $1.89/share
P0 � � � � $27/share
c. Variable growth, N � 3, g1 � 5% for years 1 to 3 and g2 � 4% for years 4 to :D1 � D0 � (1 � g1)1 � $1.80 � (1 � .05)1 � $1.89/shareD2 � D0 � (1 � g1)2 � $1.80 � (1 � .05)2 � $1.98/shareD3 � D0 � (1 � g1)3 � $1.80 � (1 � .05)3 � $2.08/shareD4 � D3 � (1 � g2)1 � $2.08 � (1 � .04)1 � $2.16/share
P0 ��N
t�1�� �
�N
t�1� � �
� [$1.89 � (PVIF12%,1yr)] � [$1.98 � (PVIF12%,2yrs)] � [$2.08 � (PVIF12%,3yrs)]� ($1.89 � .893) � ($1.98 � .797) � ($2.08 � .712)� $1.69 � $1.58 � $1.48 � $4.75 (same result using a financial calculator)
� � �� �
� (PVIF12%,3yrs) �
� .712 � $27.00 � $19.22 (same result using a financial calculator)
P0 ��N
t�1�� � ��$4.75�$19.22
�$23.97/share
DN�1�ks �g2
1��(1�ks )N
D0 � (1�g1)t��
(1�ks )t
$2.16�
.08
D4 �$2.16��
.12� .04
1��(1� .12)3
DN�1�(ks �g2)
1��(1�ks )N
$2.08��(1� .12)3
$1.98��(1� .12)2
$1.89��(1� .12)1
D0 � (1�g1)t��
(1�ks)t
DN�1�ks �g2
1��(1�ks)
N
D0 � (1�g1)t��
(1�ks)t
$1.89�
.07
$1.89��.12 � .05
D1�ks � g
D1 � D0 � $1.80���
.12
D1�ks
844 APPENDIX B
25ApB_GITM.qxd 02/10/2003 10:42 AM Page 844

Solutions to Self-Test Problems 845
C H A P T E R 9ST 9-1 a. Cost of debt, ki (using approximation formula)
I�
KD � _________________________________________
I � .10 � $1,000 � $100Nd � $1,000 � $30 discount � $20 flotation cost � $950
n � 10 years
$100�
kd � ______________________________________________________
(using a financial calculator)
$50 � (PVIFAkd,20periods) � $1,000 � (PVIFkd,20periods)
kd � 5.415 � 2 � 10.83% (rounded to 10.8%)ki � kd � (1 � T)T � .40ki � 10.8% � (1 � .40) � 6.5%
Cost of preferred stock, kp
kp �
Dp � .11 � $100 � $11Np � $100 � $4 flotation cost � $96
kp � � 11.46% (rounded to 11.5%)
Cost of retained earnings, kr
D1 � D0 (1 � g)� $5.66(1.06)� $6.00
kr � ks � � g
� � 6.0% � 7.5% � 6.0% � 13.5%
Cost of new common stock, kn
kn � � g
D1 � $6Nn � $80 � $2.50 underpricing � $5.50 flotation cost � $72
g � 6.0%
kn � � 6.0% � 8.3% � 6.0% � 14.3%$6�$72
D1�Nn
$6�$80
D1�P0
$11�$96
Dp�Np
$950�$1,000��
2
$1,000�$950��
10
Nd �$1,000��
2
$1,000�Nd��n
25ApB_GITM.qxd 02/10/2003 10:42 AM Page 845
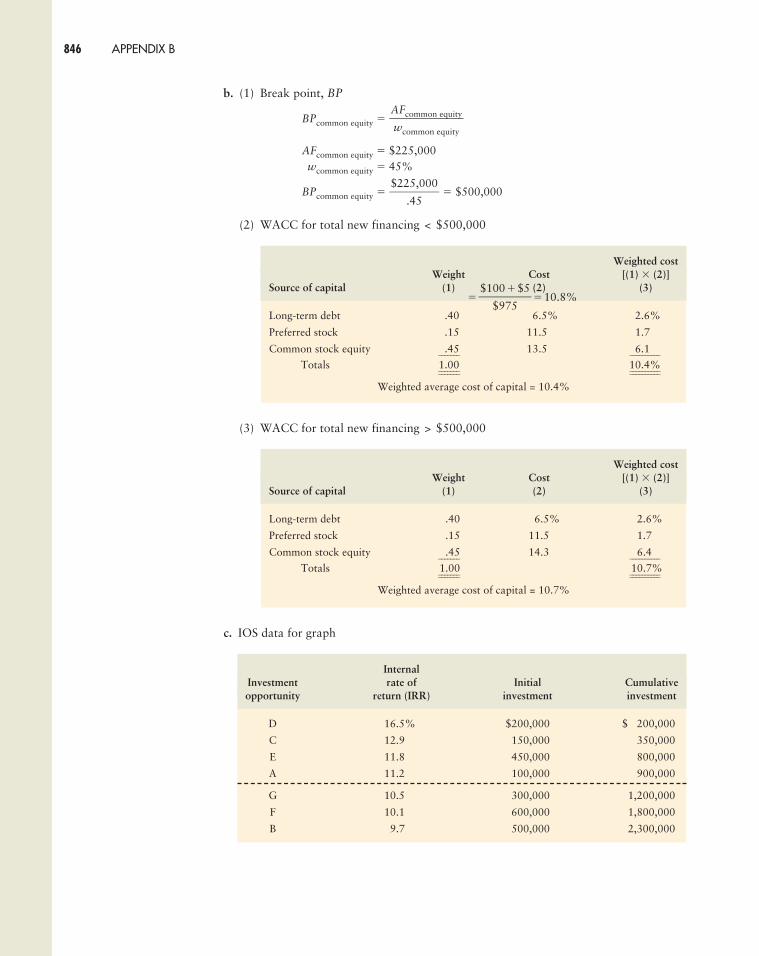
b. (1) Break point, BP
BPcommon equity �
AFcommon equity � $225,000wcommon equity � 45%
BPcommon equity � � $500,000
(2) WACC for total new financing < $500,000
(3) WACC for total new financing > $500,000
c. IOS data for graph
InternalInvestment rate of Initial Cumulativeopportunity return (IRR) investment investment
D 16.5% $200,000 $1,200,000
C 12.9 150,000 350,000
E 11.8 450,000 800,000
A 11.2 100,000 900,000
G 10.5 300,000 1,200,000
F 10.1 600,000 1,800,000
B 9.7 500,000 2,300,000
Weighted costWeight Cost [(1) � (2)]
Source of capital (1) (2) (3)
Long-term debt .40 6.5% 2.6%
Preferred stock .15 11.5 1.7
Common stock equity .45 14.3 6.4 _ _ _ _ _ _ _ _ _ _ _ _ _ _ _ _ _
Totals 1.00 10.7% _ _ _ _ _ _ _ _ _ _ _ _ _ _ _ _ _ _ _ _ _ _ _ _ _ _ _ _ _ _ _ _ _ _
Weighted average cost of capital = 10.7%
Weighted costWeight Cost [(1) � (2)]
Source of capital (1) (2) (3)
Long-term debt .40 6.5% 2.6%
Preferred stock .15 11.5 1.7
Common stock equity .45 13.5 6.1 _ _ _ _ _ _ _ _ _ _ _ _ _ _ _ _ _
Totals 1.00 10.4% _ _ _ _ _ _ _ _ _ _ _ _ _ _ _ _ _ _ _ _ _ _ _ _ _ _ _ _ _ _ _ _ _ _
Weighted average cost of capital = 10.4%
$225,000��
.45
AFcommon equity��wcommon equity
846 APPENDIX B
� �10.8%$100�$5��
$975
25ApB_GITM.qxd 02/10/2003 10:42 AM Page 846
Solutions to Self-Test Problems 847
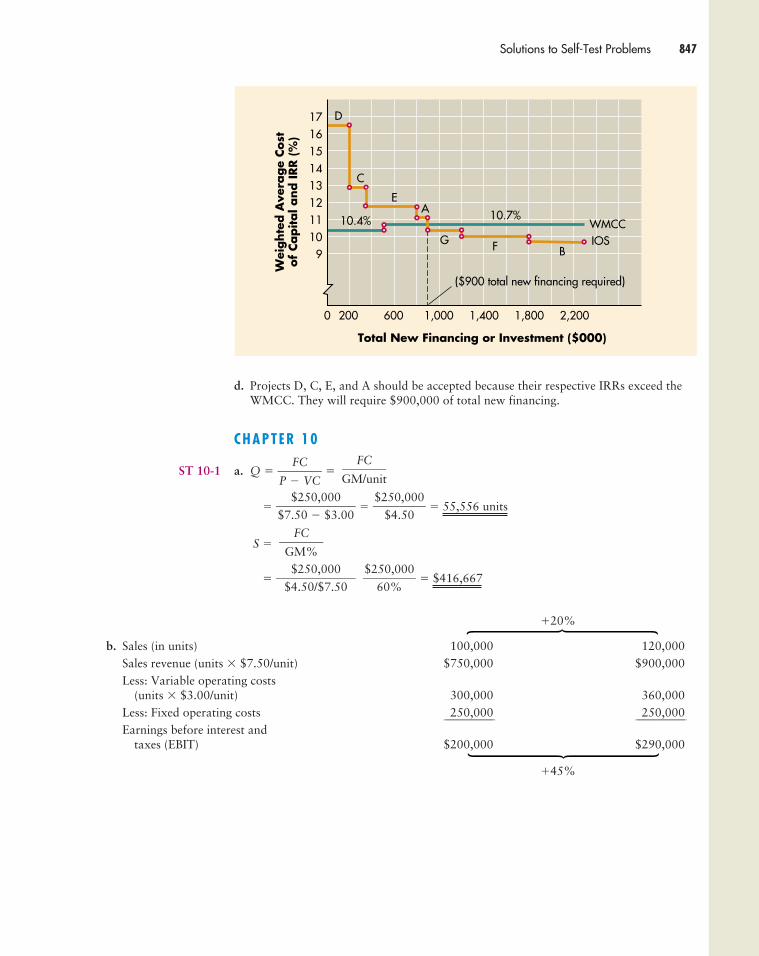
d. Projects D, C, E, and A should be accepted because their respective IRRs exceed theWMCC. They will require $900,000 of total new financing.
C H A P T E R 1 0
ST 10-1 a. Q � �
� � � 55,556 units
S �
� � $416,667
�20%
b. Sales (in units) 100,000 120,000Sales revenue (units � $7.50/unit) $750,000 $900,000Less: Variable operating costs
(units � $3.00/unit) 300,000 360,000Less: Fixed operating costs 250,000 250,000_________________________ _________________________
Earnings before interest and taxes (EBIT) $200,000 $290,000
�45%
$250,000��
60%
$250,000��
$4.50/$7.50
FC�GM%
$250,000��
$4.50
$250,000��$7.50 � $3.00
FC�GM/unit
FC�P � VC
Total New Financing or Investment ($000)
Wei
ghte
d A
vera
ge
Cost
of
Capital a
nd IRR (
%)
17161514131211109
0 200 600 1,000 1,400 1,800 2,200
($900 total new financing required)
10.7%10.4%
D
C
EA
F B
WMCCIOSG
25ApB_GITM.qxd 02/10/2003 10:42 AM Page 847
Less: Interest 80,000 80,000_________________________ _________________________
Earnings before taxes $120,000 $210,000Less: Taxes (T � .40) 48,000 84,000_________________________ _________________________
Net income after taxes $172,000 $126,000Less: Preferred dividends
(8,000 shares � $5.00/share) 40,000 40,000_________________________ _________________________
Earnings available for common $132,000 $186,000
Earnings per share (EPS) $32,000/20,000 � $1.60/share $86,000/20,000 � $4.30/share______________________________ ____________________________________________________________ ______________________________
�168.75%
c. DOL (100,000 units) � � � 2.25
d. DFL (100,000 units) �
�
� � 3.75
e. DTL � DOL � DFL� 2.25 � 3.75 � 8.4375
Using the other DTL formula:
DTL � � � 8.4375
If sales increased by 50%, EPS would be expected to increase by 421.875% (8.4375 � 50%).
ST 10-2Data summary for alternative plans
Source of capital Plan A (bond) Plan B (common shares)
Long-term debt $60,000 at 12% annual interest $50,000 at 12% annual interest
Annual interest = .12 � $60,000 � $7,200 .12 � $50,000 � $6,000
Common shares 10,000 shares 11,000 shares
$450,000�����
$120,000 �$40,0001 � 40
GM$���
EBT �PD
1 � T
200,000��53,333.33
$200,000��������
$200,000 � $80,000 �$40,0001 � 0.40
EBIT
EBIT � � � PD
I � T
$450,000��$200,000
GM$�EBIT
848 APPENDIX B
25ApB_GITM.qxd 02/10/2003 10:42 AM Page 848

Solutions to Self-Test Problems 849
a.
b.
EBIT ($000)
10 20 30 40 50 60
Plan B (Stock)
Plan A (Bond)2.00
1.00
0
–0.75
A
B
EPS
($)
Coordinates
EBIT
$30,000 $40,000
Financing plan Earnings per share (EPS)
A (Bond) $1.37 $1.97
B (Stock) 1.31 1.85
Plan A (bond) Plan B (shares)
EBITa $30,000 $40,000 $30,000 $40,000
Less: Interest 7,200 7,200 6,000 6,000 _ _ _ _ _ _ _ _ _ _ _ _ _ _ _ _ _ _ _ _ _ _ _ _ _ _ _ _ _ _ _ _ _ _ _ _ _ _ _ _ _ _ _ _ _ _ _ _ _ _ _ _ _ _ _ _ _ _ _ _ _ _ _ _ _ _ _ _ _
Net profits before taxes $22,800 $32,800 $24,000 $34,000
Less: Taxes (T = .40) 9,120 13,120 9,600 13,600 _ _ _ _ _ _ _ _ _ _ _ _ _ _ _ _ _ _ _ _ _ _ _ _ _ _ _ _ _ _ _ _ _ _ _ _ _ _ _ _ _ _ _ _ _ _ _ _ _ _ _ _ _ _ _ _ _ _ _ _ _ _ _ _ _ _ _ _ _
Net profits after taxes $13,680 $19,680 $14,400 $20,400
EPS (10,000 shares) $1.37 $1.97
(11,000 shares) $1.31 $1.85
aValues were arbitrarily selected; other values could have been utilized.
25ApB_GITM.qxd 02/10/2003 10:42 AM Page 849

c. The bond plan (Plan A) becomes superior to the stock plan (Plan B) at around$20,000 of EBIT, as represented by the dashed vertical line in the figure in b. (Note:The actual point is $19,200, which was determined algebraically by using the tech-nique described in footnote 13 on page 490.)
ST 10-3 a.
b Using the table in a:(1) Maximization of EPS: 40% debt ratio, EPS = $5.51/share (see column 1).(2) Maximization of share value: 30% debt ratio, share value = $32.00 (see column 3).
c. Recommend 30% debt ratio, because it results in the maximum share value and istherefore consistent with the firm’s goal of owner wealth maximization.
C H A P T E R 1 1
ST 11-1 a. Earnings per share (EPS) �
� $4.00/share
Price/earnings (P/E) ratio � � 15
b. Proposed dividends � 500,000 shares � $2 per share � $1,000,000
Shares that can be repurchased � � 16,129 shares
c. After proposed repurchase:Shares outstanding � 500,000 � 16,129 � 483,871
EPS � � $4.13/share
d. Market price � $4.13/share � 15 � $61.95/sharee. The earnings per share (EPS) are higher after the repurchase, because there are fewer
common shares outstanding (483,871 shares versus 500,000 shares) to divide up thefirm’s $2,000,000 of available earnings.
f. In both cases, the shareholders would receive $2 per share—a $2 cash dividend inthe dividend case or an approximately $2 increase in share price ($60.00 per shareto $61.95 per share) in the repurchase case. (Note: The $.05 per share ($2.00 �$1.95) difference is due to rounding.) In reality, it never works this cleanly. Therepurchase price may not be $62.00 and the P/E ratio may change. The benefitsreceived by the two groups of shareholders may be very different.
$2,000,000��
483,871
$1,000,000��
$62
$60 market price��
$4.00 EPS
$2,000,000 earnings available�����500,000 shares of common outstanding
Estimated shareExpected Required value
Capital structure EPS return, ks [(1) ÷ (2)]debt ratio (1) (2) (3)
10% $3.12 .13 $24.00
10 3.90 .15 26.00
20 4.80 .16 30.00
30 5.44 .17 32.00
40 5.51 .19 29.00
50 5.00 .20 25.00
60 4.40 .22 20.00
850 APPENDIX B
25ApB_GITM.qxd 02/10/2003 10:43 AM Page 850

Solutions to Self-Test Problems 851
C H A P T E R 1 2
ST 12-1 a. Calculate Cash InflowsCalculate Tax Shield
Calculate Cash Inflows
b. Yes, the analysis would differ. Since there are problems with calculating cash inflowseach year, especially the tax shield from CCA, the cash inflows are split into theirindividual components and each analyzed separately. Following this process allowsthe NPV to be calculated. Note, that the above analysis ignores the benefit associatedwith the tax shield on almost $45,000 of UCC.
c. The NPV of the project for Laidlaw follows:NPV of Project:
� Incremental Co: �$300,000 � $50,000 � �$250,000� PV of ITC*
$300,000 (10%) � $30,000 � PVIF(1 per, 18%) � �$ 25,424� Additional working capital � �$ 25,000� PV of incremental after-tax margin
Yr 1: $100,000(1 � 0.40) � PVIF(1 per, 18%) � $50,847Yr 2: $110,000(1 � 0.40) � PVIF(2 per, 18%) � $47,400Yr 3: $100,000(1 � 0.40) � PVIF(3 per, 18%) � $36,518Yr 4: $ 70,000(1 � 0.40) � PVIF(4 per, 18%) � $21,663Yr 5: $ 60,000(1 � 0.40) � PVIF(5 per, 18%) � $15,736
Total PV of incremental after-tax margin � $172,164
YEAR
1 2 3 4 5
Incremental sales $85,000 $105,000 $100,000 $70,000 $60,000
Less: incr operating costs –$15,000 –$ 5,000 $ 0 $ 0 $ 0 _ _ _ _ _ _ _ _ _ _ _ _ _ _ _ _ _ _ _ _ _ _ _ _ _ _ _ _ _ _ _ _ _ _ _ _ _ _ _ _ _ _ _ _ _ _ _ _ _ _ _ _ _ _ _ _ _ _ _ _ _ _ _ _ _ _ _ _ _ _ _ _ _ _ _ _ _ _ _ _ _ _ _ _ _ _ _ _ _ _ _ _ _
Incremental operating income 100,000 110,000 100,000 70,000 60,000
Less: taxes 40,000 44,000 40,000 28,000 24,000 _ _ _ _ _ _ _ _ _ _ _ _ _ _ _ _ _ _ _ _ _ _ _ _ _ _ _ _ _ _ _ _ _ _ _ _ _ _ _ _ _ _ _ _ _ _ _ _ _ _ _ _ _ _ _ _ _ _ _ _ _ _ _ _ _ _ _ _ _ _ _ _ _ _ _ _ _ _ _ _ _ _ _ _ _ _ _ _ _ _ _ _ _
Increm A/T oper income 60,000 66,000 60,000 42,000 36,000
Plus: tax shield from CCA 13,200 22,440 15,708 10,996 7,697
Other – ITC 30,000
– working capital –25,000 25,000 _ _ _ _ _ _ _ _ _ _ _ _ _ _ _ _ _ _ _
– salvage 35,000 _ _ _ _ _ _ _ _ _ _ _ _ _ _ _ _ _
Net After-tax Incremental CFs $78,200 $88,440 $75,708 $52,996 $103,697
Year UCC CCA UCC Tax Shield
1 $220,000 $33,000 $187,000 $13,200
2 $187,000 $56,100 $130,900 $22,440
3 $130,900 $39,270 $91,630 $15,708
4 $91,630 $27,489 $64,141 $10,996
5 $64,141 $19,242 $44,899 $7,697
25ApB_GITM.qxd 02/10/2003 10:43 AM Page 851

� PV of tax shield from incremental CCA
$220,000 � � $50,805
� PV of Salvage
$35,000 � PVIF(5 per, 18%) � $15,299� PV of tax shield lost due to salvage
$15,299 � 0.30 � 0.40 � –$ 1,836� Recapture of working capital
$25,000 � PVIF(5 per, 18%) � $10,928NPV � –$ 2,206
Laidlaw should not purchase the new piece of equipment since the NPV of the project isnegative. This means that the value of the project to the company is less than the project’sincremental cost; the expected return on the equipment will not cover the cost of thefunds invested in the equipment. Note, though that at a slightly lower discount rate, apositive NPV would result for the project.Note The benefit of the ITC is a reduction in federal taxes payable. Since the companyreceives the benefit when they file their taxes, it is assumed the company must wait, onaverage, one year to receive the benefit.
ST 12-2 a. Payback period:
Project M: � 2.85 years
Project N:
2 � years
2 � years � 2.67 years
b. Net present value (NPV):Project M: NPV � ($10,000 � PVIFA14%,4yrs) � $28,500
� ($10,000 � 2.914) � $28,500� $29,140 � $28,500 � $640
(Calculator solution � $637)
$6,000�$9,000
$27,000 � $21,000���
$9,000
Year (t) Cash inflows (CFt) Cumulative cash inflows
1 $11,000 $11,000
2 10,000 21,000
3 9,000 30,000
4 8,000 38,000
$28,500�$10,000
0.30 � 0.40 1.09�� � ��0.30 � 0.18 1.18
852 APPENDIX B
25ApB_GITM.qxd 02/10/2003 10:43 AM Page 852

Solutions to Self-Test Problems 853
Project N:
(Calculator solution � $1,155.18)
c. Internal rate of return (IRR) Calculate using NPV profiles:
For project M, the IRR is between 15% and 16% but much closer to 15%. Using afinancial calculator, the exact answer is $15.086%, or 15.1% rounded to nearest deci-mal. For project N, the IRR is slightly greater than 16%, say 16.2%. Using a financialcalculator, the exact answer is 16.1935%, or 16.2% rounded to the nearest decimal.
d.
Project N is recommended, because it has the higher NPV. The project also has theshorter payback period, and the higher IRR, which is greater than the 14% cost ofcapital., but these are incidental reasons to select project N. NPV is the main criterionto use to rank capital budgeting projects.
e. Net present value profiles:From the NPV profile that follows, it can be seen that the crossover rate is 5.75%. Atthis discount rate, both projects have a NPV of $6.351. If Fitch Industries’ cost of cap-ital was less than 5.75%), project M would be preferred. At rates above 5.75%, pro-
NPV Profile
Discount rate (%) NPV Project M NPV Project N
0 $11,500 $11,000
5 6,960 6,903
10 3,199 3,490
15 50 618
16 –518 99
Present valueat 14%
Cash inflows (CFt) PVIF14%,t [(1) � (2)]Year (t) (1) (2) (3)
1 $11,000 .877 $19,647
2 10,000 .769 7,690
3 9,000 .675 6,075
4 8,000 .592 4,736 _ _ _ _ _ _ _ _ _ _ _ _ _
Present value of cash inflows $28,148
� Initial investment 27,000 _ _ _ _ _ _ _ _ _ _ _ _ _
Net present value (NPV) $11,148 _ _ _ _ _ _ _ _ _ _ _ _ _ _ _ _ _ _ _ _ _ _ _ _ _ _
←
Project
M N
Payback period 2.85 years 2.67 yearsa
NPV $637 $1,155a
IRR 15.1% 16.2%a
aPreferred project.
25ApB_GITM.qxd 02/10/2003 10:43 AM Page 853

ject N is preferred. Because the firm’s cost of capital is 14%, it can be seen from partd that project N should be selected.
C H A P T E R 1 3
ST 13-1 a. NPVA � ($7,000 � PVIFa(10%,3yrs)) � $15,000� $17,408 � $15,000 � $2,408
NPVB � ($10,000 � PVIFa(10%,3yrs)) � $20,000� $24,869 � $20,000 � $4,869*
*Preferred project, because higher NPV.b. Project A:
Certainty Certain Present valueCash equivalent CFt at 7%
inflows (CFt) factors (�t) [(1) � (2)] PVIF7%,ta [(3) � (4)]
Year (t) (1) (2) (3) (4) (5)
1 $7,000 .95 $6,650 .935 $16,215
2 7,000 .90 6,300 .873 5,503
3 7,000 .90 6,300 .816 5,143 _ _ _ _ _ _ _ _ _ _ _ _ _ _ _
Present value of cash inflows $16,861
� Initial investment 15,000 _ _ _ _ _ _ _ _ _ _ _ _ _ _ _
NPV $11,861* _ _ _ _ _ _ _ _ _ _ _ _ _ _ _ _ _ _ _ _ _ _ _ _ _ _ _ _ _ _
854 APPENDIX B
Total New Financing or Investment ($000)
Wei
ghte
d A
vera
ge
Cost
of
Capital a
nd IRR (
%)
17161514131211109
0 200 600 1,000 1,400 1,800 2,200
($900 total new financing required)
10.7%10.4%
D
C
EA
F B
WMCCIOSG
25ApB_GITM.qxd 02/10/2003 10:43 AM Page 854
Solutions to Self-Test Problems 855
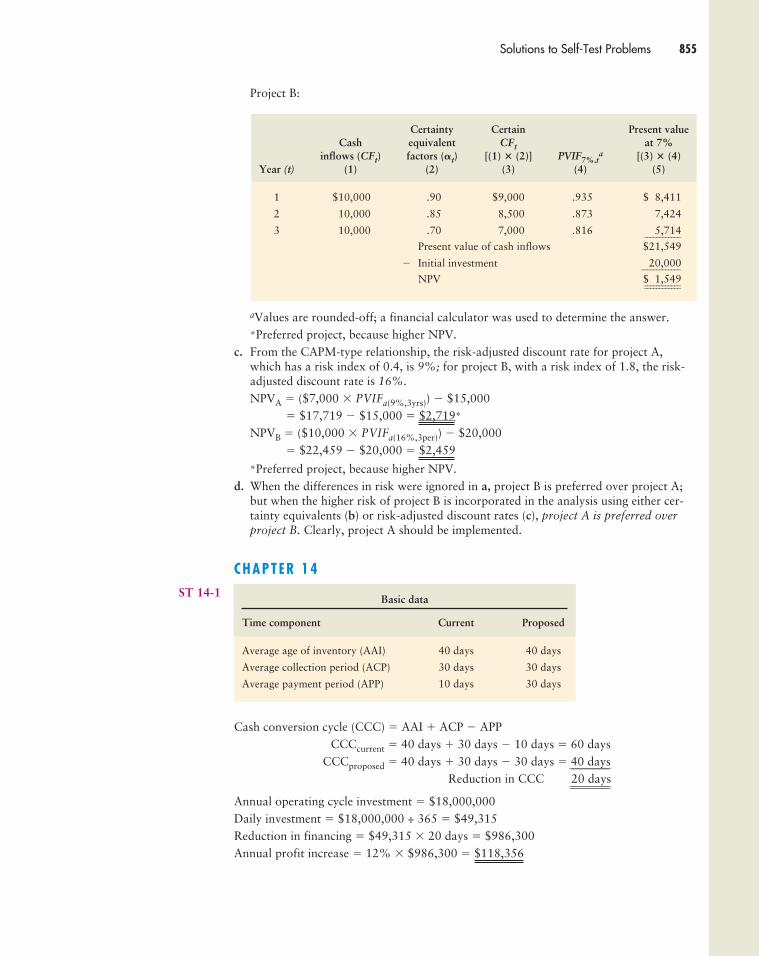
Project B:
aValues are rounded-off; a financial calculator was used to determine the answer.*Preferred project, because higher NPV.
c. From the CAPM-type relationship, the risk-adjusted discount rate for project A,which has a risk index of 0.4, is 9%; for project B, with a risk index of 1.8, the risk-adjusted discount rate is 16%.
NPVA � ($7,000 � PVIFa(9%,3yrs)) � $15,000� $17,719 � $15,000 � $2,719*
NPVB � ($10,000 � PVIFa(16%,3per)) � $20,000� $22,459 � $20,000 � $2,459
*Preferred project, because higher NPV.d. When the differences in risk were ignored in a, project B is preferred over project A;
but when the higher risk of project B is incorporated in the analysis using either cer-tainty equivalents (b) or risk-adjusted discount rates (c), project A is preferred overproject B. Clearly, project A should be implemented.
C H A P T E R 1 4ST 14-1
Cash conversion cycle (CCC) � AAI � ACP � APPCCCcurrent � 40 days � 30 days � 10 days � 60 days
CCCproposed � 40 days � 30 days � 30 days � 40 days____________________
Reduction in CCC 20 days________________________________________
Annual operating cycle investment � $18,000,000Daily investment � $18,000,000 ÷ 365 � $49,315Reduction in financing � $49,315 � 20 days � $986,300Annual profit increase � 12% � $986,300 � $118,356
Basic data
Time component Current Proposed
Average age of inventory (AAI) 40 days 40 days
Average collection period (ACP) 30 days 30 days
Average payment period (APP) 10 days 30 days
Certainty Certain Present valueCash equivalent CFt at 7%
inflows (CFt) factors (�t) [(1) � (2)] PVIF7%,ta [(3) � (4)
Year (t) (1) (2) (3) (4) (5)
1 $10,000 .90 $9,000 .935 $18,411
2 10,000 .85 8,500 .873 7,424
3 10,000 .70 7,000 .816 5,714 _ _ _ _ _ _ _ _ _ _ _ _
Present value of cash inflows $21,549
� Initial investment 20,000 _ _ _ _ _ _ _ _ _ _ _ _ _
NPV $11,549 _ _ _ _ _ _ _ _ _ _ _ _ _ _ _ _ _ _ _ _ _ _ _ _
25ApB_GITM.qxd 02/10/2003 10:43 AM Page 855
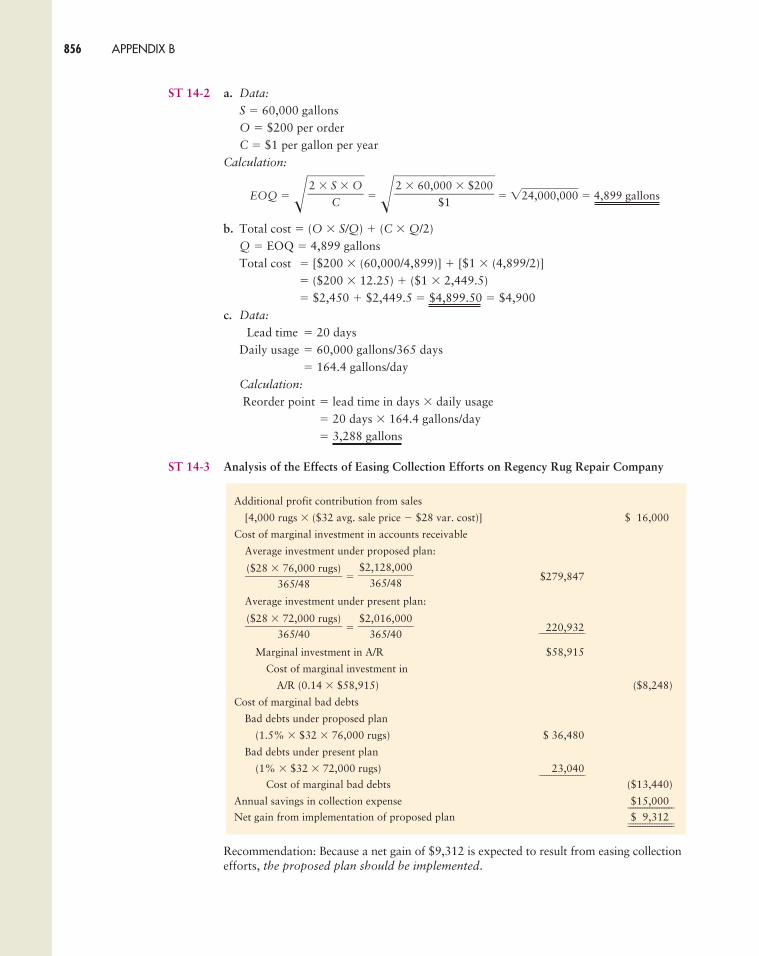
ST 14-2 a. Data:
S � 60,000 gallonsO � $200 per orderC � $1 per gallon per year
Calculation:
EOQ � �� � ��� � 2�4�,0�0�0�,0�0�0� � 4,899 gallons
b. Total cost � (O � S/Q) � (C � Q/2)Q � EOQ � 4,899 gallonsTotal cost � [$200 � (60,000/4,899)] � [$1 � (4,899/2)]
� ($200 � 12.25) � ($1 � 2,449.5)� $2,450 � $2,449.5 � $4,899.50 � $4,900
c. Data:
Lead time � 20 daysDaily usage � 60,000 gallons/365 days
� 164.4 gallons/dayCalculation:
Reorder point � lead time in days � daily usage� 20 days � 164.4 gallons/day� 3,288 gallons
ST 14-3 Analysis of the Effects of Easing Collection Efforts on Regency Rug Repair Company
Recommendation: Because a net gain of $9,312 is expected to result from easing collectionefforts, the proposed plan should be implemented.
2 � 60,000 � $200���
$1
2 � S � O��
C
856 APPENDIX B
Additional profit contribution from sales
[4,000 rugs � ($32 avg. sale price � $28 var. cost)] $116,000
Cost of marginal investment in accounts receivable
Average investment under proposed plan:
� $279,847
Average investment under present plan:
� 220,932
Marginal investment in A/R $58,915
Cost of marginal investment in
A/R (0.14 � $58,915) ($8,248)
Cost of marginal bad debts
Bad debts under proposed plan
(1.5% � $32 � 76,000 rugs) $ 36,480
Bad debts under present plan
(1% � $32 � 72,000 rugs) 23,040___________________
Cost of marginal bad debts ($13,440)
Annual savings in collection expense $15,000___________________
Net gain from implementation of proposed plan $19,312______________________________________
$2,016,000��
365/40
($28 � 72,000 rugs)���
365/40
$2,128,000��
365/48($28 � 76,000 rugs)���
365/48
___________________
25ApB_GITM.qxd 02/10/2003 10:43 AM Page 856
Solutions to Self-Test Problems 857
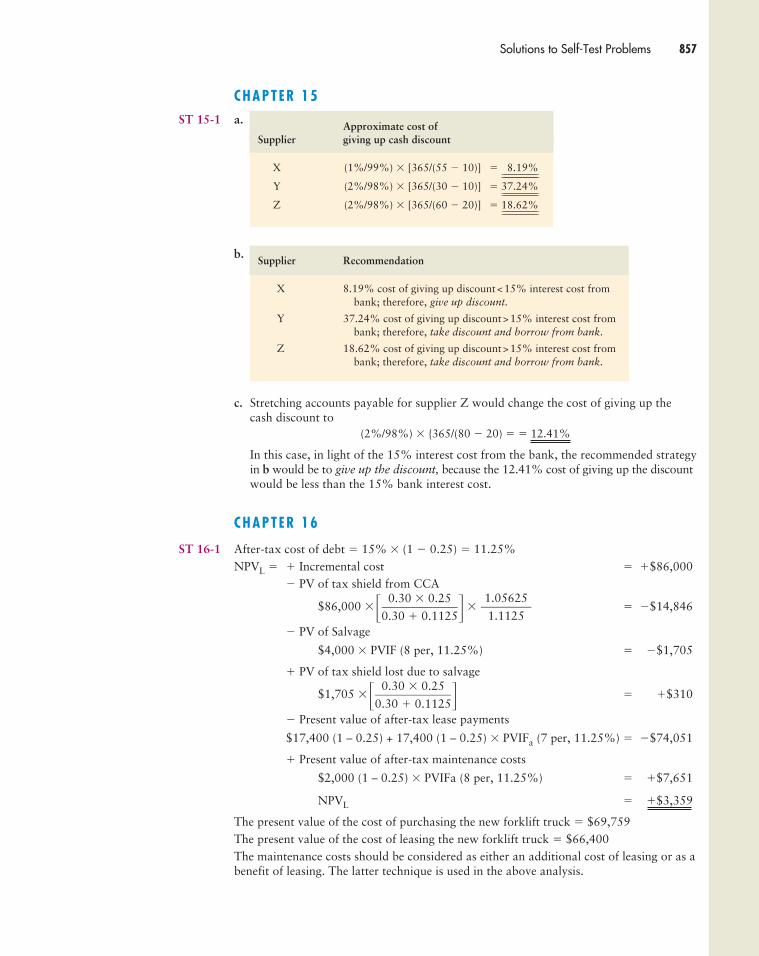
C H A P T E R 1 5ST 15-1 a.
b.
c. Stretching accounts payable for supplier Z would change the cost of giving up thecash discount to
(2%/98%) � {365/(80 � 20) � � 12.41%
In this case, in light of the 15% interest cost from the bank, the recommended strategyin b would be to give up the discount, because the 12.41% cost of giving up the discountwould be less than the 15% bank interest cost.
C H A P T E R 1 6
ST 16-1 After-tax cost of debt � 15% � (1 � 0.25) � 11.25%NPVL � � Incremental cost � �$86,000
� PV of tax shield from CCA
$86,000 �� � � � �$14,846
� PV of Salvage
$4,000 � PVIF (8 per, 11.25%) � �$1,705
� PV of tax shield lost due to salvage
$1,705 �� � � �$310
� Present value of after-tax lease payments
$17,400 (1 – 0.25) + 17,400 (1 – 0.25) � PVIFa (7 per, 11.25%) � �$74,051
� Present value of after-tax maintenance costs
$2,000 (1 – 0.25) � PVIFa (8 per, 11.25%) � �$7,651
NPVL � �$3,359
The present value of the cost of purchasing the new forklift truck � $69,759The present value of the cost of leasing the new forklift truck � $66,400The maintenance costs should be considered as either an additional cost of leasing or as abenefit of leasing. The latter technique is used in the above analysis.
0.30 � 0.25����0.30 � 0.1125
1.05625��
1.1125
0.30 � 0.25����0.30 � 0.1125
Supplier Recommendation
X 8.19% cost of giving up discount<15% interest cost from bank; therefore, give up discount.
Y 37.24% cost of giving up discount>15% interest cost frombank; therefore, take discount and borrow from bank.
Z 18.62% cost of giving up discount>15% interest cost frombank; therefore, take discount and borrow from bank.
Approximate cost ofSupplier giving up cash discount
X (1%/99%) � [365/(55 � 10)] � 18.19%____________________________________
Y (2%/98%) � [365/(30 � 10)] � 37.24%____________________________________
Z (2%/98%) � [365/(60 � 20)] � 18.62%____________________________________
25ApB_GITM.qxd 02/10/2003 10:43 AM Page 857
The NPV of the lease is $3,359, therefore, Nelson Company should lease the forklift.b. The lessor’s required rate of return on the lease must be less than Nelson’s after-taxcost of debt financing. This could be due to a different level of taxation.
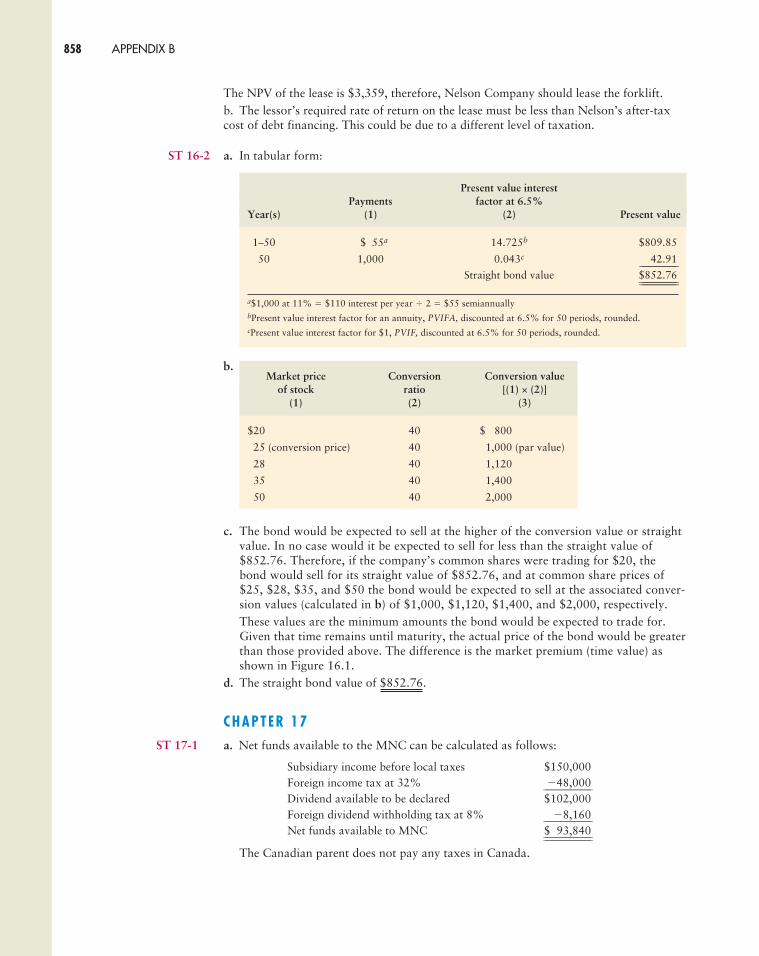
ST 16-2 a. In tabular form:
b.
c. The bond would be expected to sell at the higher of the conversion value or straightvalue. In no case would it be expected to sell for less than the straight value of$852.76. Therefore, if the company’s common shares were trading for $20, thebond would sell for its straight value of $852.76, and at common share prices of$25, $28, $35, and $50 the bond would be expected to sell at the associated conver-sion values (calculated in b) of $1,000, $1,120, $1,400, and $2,000, respectively.These values are the minimum amounts the bond would be expected to trade for.Given that time remains until maturity, the actual price of the bond would be greaterthan those provided above. The difference is the market premium (time value) asshown in Figure 16.1.
d. The straight bond value of $852.76.
C H A P T E R 1 7ST 17-1 a. Net funds available to the MNC can be calculated as follows:
Subsidiary income before local taxes $150,000Foreign income tax at 32% �48,000________________________
Dividend available to be declared $102,000Foreign dividend withholding tax at 8% �8,160________________________
Net funds available to MNC $193,840________________________________________________
The Canadian parent does not pay any taxes in Canada.
Market price Conversion Conversion valueof stock ratio [(1) × (2)]
(1) (2) (3)
$20 40 $1,800
$25 (conversion price) 40 1,000 (par value)
$28 40 1,120
$35 40 1,400
$50 40 2,000
Present value interestPayments factor at 6.5%
Year(s) (1) (2) Present value
1–50 $ 55a 14.725b $809.85
50 1,000 0.043c 42.91______________Straight bond value $852.76____________________________
a$1,000 at 11% � $110 interest per year � 2 � $55 semiannuallybPresent value interest factor for an annuity, PVIFA, discounted at 6.5% for 50 periods, rounded.cPresent value interest factor for $1, PVIF, discounted at 6.5% for 50 periods, rounded.
858 APPENDIX B
25ApB_GITM.qxd 02/10/2003 10:43 AM Page 858
Solutions to Self-Test Problems 859
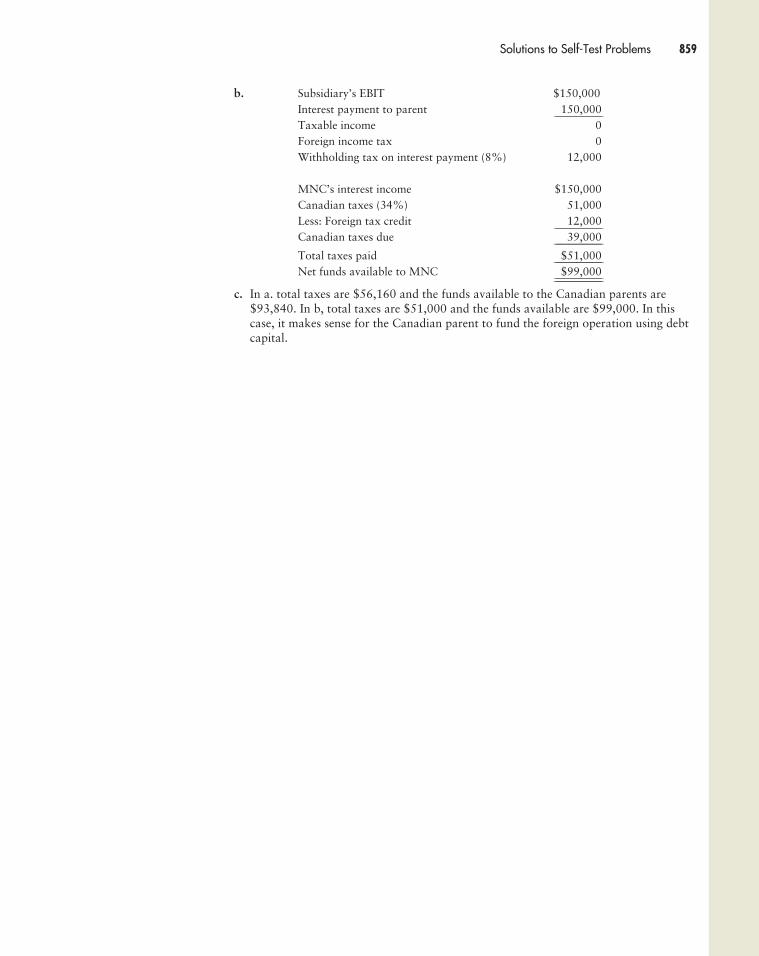
b. Subsidiary’s EBIT $150,000Interest payment to parent 150,000________________________
Taxable income 0Foreign income tax 0Withholding tax on interest payment (8%) 12,000
MNC’s interest income $150,000Canadian taxes (34%) 51,000Less: Foreign tax credit 12,000________________________
Canadian taxes due 39,000________________________
Total taxes paid $51,000________________________
Net funds available to MNC $99,000________________________________________________
c. In a. total taxes are $56,160 and the funds available to the Canadian parents are$93,840. In b, total taxes are $51,000 and the funds available are $99,000. In thiscase, it makes sense for the Canadian parent to fund the foreign operation using debtcapital.
25ApB_GITM.qxd 02/10/2003 10:43 AM Page 859

25ApB_GITM.qxd 02/10/2003 10:43 AM Page 860
Related Documents