1 Solution equilibria of cytosine- and guanine-rich sequences near the promoter region of the n-myc gene that contain stable hairpins within lateral loops Sanae Benabou 1 , Rubén Ferreira 2 , Anna Aviñó 2 , Carlos González 3 , Sébastien Lyonnais 4 , Maria Solà 4 , Ramon Eritja 2 , Joaquim Jaumot 1 , Raimundo Gargallo 1* 1. Solution Equilibria and Chemometrics Group, Department of Analytical Chemistry, University of Barcelona, Diagonal 645, E-08028 Barcelona, Spain 2. Institute for Advanced Chemistry of Catalonia (IQAC-CSIC), CIBER-BBN Networking Centre on Bioengineering, Biomaterials and Nanomedicine, Jordi Girona 18-26, E-08034 Barcelona, Spain 3. Institute of Physical Chemistry “Rocasolano”, CSIC, Serrano 119, E-28006 Madrid, Spain 4. Department of Structural Biology, Molecular Biology Institute of Barcelona (IBMB-CSIC), Baldiri Reixac 4-8, 08028 Barcelona, Spain * Corresponding author Tel: (34)-934039274 Fax: (34)-934021233 e-mail address: [email protected] *REVISED Manuscript (text UNmarked) Click here to view linked References

Welcome message from author
This document is posted to help you gain knowledge. Please leave a comment to let me know what you think about it! Share it to your friends and learn new things together.
Transcript
1
Solution equilibria of cytosine- and guanine-rich sequences near the promoter region of the
n-myc gene that contain stable hairpins within lateral loops
Sanae Benabou1, Rubén Ferreira2, Anna Aviñó2, Carlos González3, Sébastien Lyonnais4, Maria Solà4, Ramon Eritja2,
Joaquim Jaumot1, Raimundo Gargallo1*
1. Solution Equilibria and Chemometrics Group, Department of Analytical Chemistry, University of Barcelona,
Diagonal 645, E-08028 Barcelona, Spain
2. Institute for Advanced Chemistry of Catalonia (IQAC-CSIC), CIBER-BBN Networking Centre on Bioengineering,
Biomaterials and Nanomedicine, Jordi Girona 18-26, E-08034 Barcelona, Spain
3. Institute of Physical Chemistry “Rocasolano”, CSIC, Serrano 119, E-28006 Madrid, Spain
4. Department of Structural Biology, Molecular Biology Institute of Barcelona (IBMB-CSIC), Baldiri Reixac 4-8, 08028
Barcelona, Spain
* Corresponding author
Tel: (34)-934039274
Fax: (34)-934021233
e-mail address: [email protected]
*REVISED Manuscript (text UNmarked)Click here to view linked References
2
Abstract
BACKGROUND
Cytosine- and guanine-rich regions of DNA are capable of forming complex structures named i-motifs and G-
quadruplexes, respectively. In the present study the solution equilibria at nearly physiological conditions of a 34-
bases long cytosine-rich sequence and its complementary guanine-rich strand corresponding to the first intron of the
n-myc gene were studied. Both sequences, not yet studied, contain a 12-base tract capable of forming stable
hairpins inside the i-motif and G-quadruplex structures, respectively.
METHODS
Spectroscopic, mass spectrometry and separation techniques, as well as multivariate data analysis methods, were
used to unravel the species and conformations present.
RESULTS
The cytosine-rich sequence forms two i-motifs that differ in the protonation of bases located in the loops. A stable
Watson-Crick hairpin is formed by the bases in the first loop, stabilizing the i-motif structure. The guanine-rich
sequence adopts a parallel G-quadruplex structure that is stable throughout the pH range 3 - 7, despite the
protonation of cytosine and adenine bases at lower pH values. The presence of G-quadruplex aggregates was
confirmed using separation techniques. When mixed, G-quadruplex and i-motif coexist with the Watson-Crick duplex
across a pH range from approximately 3.0 to 6.5.
CONCLUSIONS
Two cytosine- and guanine-rich sequences in n-myc gene may form stable i-motif and G-quadruplex structures even
in the presence of long loops. pH modulates the equilibria involving the intramolecular structures and the
intermolecular Watson-Crick duplex.
GENERAL SIGNIFICANCE
Watson-Crick hairpins located in intramolecular G-quadruplexes and i-motifs in the promoter regions of oncogenes
could play a role in stabilizing these structures.
Keywords: G-quadruplex, i-motif, quadruplex / duplex competition, n-myc, chromatography, multivariate analysis
3
Introduction
Cytosine-rich regions of DNA are capable of forming a characteristic structure known as an i-motif. The core of this
structure is formed by the binding of two cytosine bases via three hydrogen bonds. The key characteristic is that one
of the cytosines involved in the base pair must be protonated at N3. Given this requirement, i-motif structures can
only be formed at a pH lower than 7, their maximal stability being found at pH values around 4.5, i.e., near the pKa of
free cytosine. The formation of i-motif structures in vitro has been proposed in sequences corresponding to the
cytosine-rich strand of telomeric DNA [1, 2], the human centromeric satellite III [3], and genes such as VEGF [4], bcl-2
[5], k-ras [6], RET [7], c-myc [8], c-jun [9], and Rb [10]. Despite the requirement of an acidic medium for high stability,
the potential role of i-motif structures in the control of gene expression is being investigated [8]. Furthermore, the
structural properties of the i-motif have attracted interest due to their potential applications in nanotechnology [11,
12].
Cytosine-rich regions are accompanied by the corresponding complementary guanine-rich regions, which may form
a special structure known as the G-quadruplex. The core of this structure is formed by two or more tetrads, an
ensemble of four guanine bases linked by hydrogen bonds in almost the same spatial plane. The in vitro formation of
such structures in DNA sequences corresponding to the end of telomeres [13] and to the promoter regions of several
oncogenes [14, 15] has previously been reported, and recently, the existence of G-quadruplexes in vivo has also
been shown [16]. Efforts are being made to develop drugs that could selectively bind to G-quadruplex structures, in
turn modulating the expression of certain genes [17].
In vivo, the coexistence of both guanine-rich and cytosine-rich strands suggests the formation of the Watson-Crick
duplex as the major species, the proportion of the intramolecular structures (i-motif and G-quadruplex) being
residual, if any. Nevertheless, efforts are being made to quantify the formation of the duplex structure in mixtures of
guanine- and cytosine-rich regions in order to determine the potential role of these minority structures in gene
expression [18, 19].
In this context, we focused our attention on two cytosine- and guanine-rich sequences located near the promoter
region of the n-myc gene which have not been studied to date. This gene is a member of the myc family of
transcription factors and encodes a protein with a basic helix-loop-helix domain. Amplification of this gene is
associated with a variety of tumors, most notably neuroblastoma [20]. The cytosine-rich sequence studied (nmyc01,
4
Table 1) herein is located at -349 to -315 bases upstream of the first position of the coding region (CDS), being the
guanine-rich sequence complementary to nmyc01 (nmyc02, Table 1). These sequences are unique because they
show an unusual 12-bases long loop containing two complementary TGAC sequences which, in principle, could
hinder the formation of stable intramolecular structures [21]. To our knowledge, no previous work has been done on
these sequences. Recently, it was proposed that another guanine-rich sequence, located in the first intron of the n-
myc sequence, forms both monomeric and dimeric G-quadruplex structures [22]. A G-quadruplex-duplex structure
has also been hypothesized in a thrombin-binding aptamer, although in this case the sequence is an artificial
sequence obtained from SELEX [23].
Circular Dichroism (CD), molecular fluorescence based on molecular beacons, Nuclear Magnetic Resonance (NMR),
polyacrylamide gel electrophoresis (PAGE) and molecular absorption spectroscopy were used to monitor the
experiments carried out. Multivariate data analysis methods were used to recover qualitative and quantitative
information about the species and conformations present in all experiments. Finally, Electrospray Ionization-Mass
Spectrometry (ESI-MS) and Size-Exclusion Chromatography (SEC) were used to complement the results obtained
from spectroscopy and PAGE [24].
Materials and methods
Reagents
The DNA sequences (Table 1) were synthesized on an Applied Biosystems 3400 DNA synthesizer using the 200 nmols
scale synthesis cycle. Standard phosphoramidites were used. Ammonia deprotection was performed overnight at
55oC. The resulting products were purified using Glen-Pak Purification Cartridge (Glen Research). The length and
homogeneity of the oligonucleotides was checked by denaturing polyacrylamide gel electrophoresis (PAGE) and
reversed-phase HPLC using X-Terra® columns. The quencher Q was introduced at the 3’-end of the sequence
Fnmyc02Q using a dabsyl-CPG solid support (Glen Research) and the fluorophore F at the 5’-end using the
fluorescein phosphoramidite Fluoroprime (Amersham Biosciences). DNA strand concentration was determined by
absorbance measurements (260 nm) at 90oC using the extinction coefficients calculated using the nearest-neighbor
method as implemented on the OligoCalc webpage [25]. Before any experiment, DNA solutions were first heated to
5
90oC for 10 minutes and then allowed to reach room temperature. KCl, KH2PO4, K2HPO4, NaCH3COO, HCl and NaOH
(a.r.) were purchased from Panreac (Spain). MilliQ ® water was used in all experiments.
Procedures
Absorbance spectra were recorded on an Agilent 8453 diode array spectrophotometer. The temperature was
controlled by means of an 89090A Agilent Peltier device. Hellma quartz cells (1 or 10 mm path length, and 350, 1500
or 3000 l volume) were used. CD spectra were recorded on a Jasco J-810 spectropolarimeter equipped with a
Julabo F-25/HD temperature control unit. Hellma quartz cells (10 mm path length, 3000 l volume) were used. pH
was measured using an Orion SA 720 pH/ISE meter and a micro-combination pH electrode (Thermo). Fluorescence
emission spectra were recorded on an Aminco Bowman AB-2 fluorimeter, equipped with a cell holder, the
temperature of which was controlled using a JP Selecta Frigiterm bath. Emission spectra were recorded between 500
and 620 nm and fluorescence intensities were recorded every 1 nm. The excitation wavelength was set to 492 nm,
the photomultiplier voltage to 600 V and the excitation and emission band pass to 4 nm. A 10 mm pathlength and
400 L volume quartz cell was used.
Acid-base titrations were monitored either in-line (taking advantage of the stirrer incorporated in the Agilent cell
holder) or at-line (in the case of the CD instrument). Experimental conditions were as follows: 25oC and 150 mM KCl.
Titrations were carried out by adjusting the pH of solutions containing the oligonucleotides. CD and/or absorbance
spectra were recorded in a pH stepwise fashion.
Melting experiments were monitored using the Agilent-8453 spectrophotometer equipped with a Peltier unit. The
DNA solution was transferred to a covered 10-mm-path-length cell and absorption spectra were recorded at 1oC
intervals with a hold time of 3 min at each temperature, which yielded an average heating rate of approximately
0.3oC min-1. Buffer solutions were 20 mM phosphate or acetate, and 150 mM KCl. Each sample was allowed to
equilibrate at the initial temperature for 30 minutes before the melting experiment began.
NMR spectra were acquired in a Bruker Advance spectrometer operating at 600 MHz and equipped with a
cryoprobe. Water suppression was achieved by the inclusion of a WATERGATE [26] module in the pulse sequence
prior to acquisition.
6
ESI-MS spectra were acquired in a Synapt HDMS (Waters, Manchester, UK) under the following instrumental
conditions: flow (15 L·min-1), capillary potential (2.4 kV), temperature source (100oC), desolvation temperature
(100oC), cone voltage (45 V) and extraction cone (5 V).
The chromatographic system consisted of an Agilent 1100 Series HPLC instrument equipped with a G1311A
quaternary pump, a G1379A degasser, a G1392A autosampler, a G1315B photodiode-array detector furnished with a
13-μL flow cell, and an Agilent Chemstation for data acquisition and analysis (Rev. A 10.02), all from Agilent
Technologies (Waldbronn, Germany). A BioSep-SEC-S 2000 column (300x7.8 mm, particle size 5 µm and pore size
145 Å) from Phenomenex (Torrance, CA, USA) was used for the chromatographic separation. The mobile phase was
75mM potassium phosphate adjusted to pH 7.1. The flow rate was set to 1.0 mL/min. A volume of 15 L of the
sample was injected and the temperature was set to 25ºC [27]. Absorbance spectra were recorded between 200 and
500 nm.
Polyacrylamide gel electrophoresis was performed at room temperature on 12% non-denaturing gels (19:1
acrylamide:bisacrylamide, Sigma) of 10x10.5cm with a miniVE apparatus (Hoeffer) at 10V/cm for 2 hours. Gels and
buffers contained 40mM Tris Acetate pH 5.2 or 40mM Tris Acetate pH 8.0. 100 pg of each oligonucleotide were
loaded per lane after addition of 10% (w/v) of a loading dye containing 30% Glycerol and 0.1% Bromophenol Blue.
After migration, the gels were stained with SYBr Gold (Molecular Probes) according to manufacturer's instructions
and digitalized with a Typhoon 8600 system (Molecular Dynamics).
Data analysis
Spectra recorded during acid-base or melting experiments were arranged in a table or data matrix D, with m rows
(spectra recorded) and n columns (wavelengths measured). The goal of data analysis was the calculation of
distribution diagrams and pure (individual) spectra for all nc spectroscopically-active species considered throughout
an experiment. The distribution diagram provides information about the stoichiometry and stability of the species
considered (in the case of acid-base and mole-ratio experiments), as well as the thermodynamics of the melting
processes. In addition, the shape and intensity of the pure spectra may provide qualitative information about the
structure of the species. With this goal in mind, data matrix D was decomposed according to Beer-Lambert-Bouer’s
law in matrix form:
D = C ST + E (1)
7
where C is the matrix (m x nc) containing the distribution diagram, ST is the matrix (nc x n) containing the pure
spectra, and E is the matrix of data (m x n) not explained by the proposed decomposition.
The mathematical decomposition of D into matrices C, ST, and E may be conducted in two different ways, depending
on whether a physico-chemical model is initially proposed (hard-modeling approach) or not (soft-modeling
approach) [28]. For hard-modeling approaches, the proposed model depends on the nature of the process under
study. Hence, for acid-base experiments the model will include a set of chemical equations describing the formation
of the different acid-base species from the neutral species, together with approximate values for the stability
constants, such as the following:
DNA + pH+ ↔ DNA·Hp Beta1p= [DNA·Hp] / [DNA] [H+]p (2)
In this equation, the parameter p is related to the Hill coefficient and describes qualitatively the cooperativity of the
equilibrium. Values of p greater than 1 indicate the existence of a cooperative process.
For melting experiments, the physico-chemical model is related to the thermodynamics of DNA unfolding. Hence, for
the unfolding of intramolecular structures such as those studied here, the chemical equation and the corresponding
equilibrium constant may be written as:
DNA folded + heat ↔ DNA unfolded Kunfolding = [DNA unfolded] / [DNA folded] (3)
For melting experiments, the concentration of the folded and unfolded forms is temperature-dependent.
Accordingly, the equilibrium constant depends on temperature according to the van’t Hoff equation:
ln K unfolding = - HvH / RT + SvH / R (4)
In this case it is assumed that HvH and SvH will not change throughout the range of temperatures studied here.
Whenever a physico-chemical model is applied, the distribution diagram in C complies with the proposed model.
Accordingly, the proposed values for the equilibrium constants and the shape of the pure spectra in ST are refined to
explain satisfactorily data in D, whereas residuals in E are minimized.
In this study, hard-modeling analysis of acid-base and mole-ratio experiments used the EQUISPEC program [29].
Hard-modeling of melting experiments was conducted using a modified version of the Multivariate Curve Resolution-
Alternating Least Squares (MCR-ALS) procedure, which includes the model proposed in equation (4) for the unfolding
of intramolecular structures [30].
8
Results
The solution equilibria of the cytosine-rich region were studied first. Those of the guanine-rich region were then
considered. Finally, the potential formation of the Watson-Crick duplex structure from the isolated structures was
examined.
Solution equilibria of the cytosine-rich region
To study the influence of pH on the conformational equilibria of nmyc01, acid-base titrations and melting
experiments were carried out. An acid-base titration of an nmyc01 sample in the pH range 2.0–7.3 was
simultaneously monitored using CD and molecular absorption spectroscopy. A selected set of the measured CD and
absorption spectra is shown in Figure 1a-b and the whole set of experimental spectra is presented in Figure S1
(Supplementary Material). At pH values around 6, the strongly positive band around 286 nm is indicative of the
formation of an i-motif structure [31]. To obtain quantitative information the whole set of experimental CD and
molecular absorption spectra were analyzed using a multivariate data analysis method, which enabled calculation of
the distribution diagram and pure spectra for each of the acid-base species considered. The results obtained depend
strongly on the number of acid-base species considered to be present during the titration. In this case, the analysis
was performed on the assumption of the presence of three or four acid-base species. After a careful study of fitted
curves and of the resulting residuals, the presence of four acid-base species was proposed, i.e., three transitions
throughout the pH range considered. The obtained fits for the acid-base models considering three or four species
are shown in the Supplementary Material (Figure S1).
The calculated distribution diagram and pure spectra are shown in Figure 1c-e. The information contained in both
plots helps us to explain each of the four proposed acid-base species. The first species, present at a pH higher than 6,
would correspond to the neutral form where all bases are deprotonated (i.e., in their neutral form). Its spatial
structure is probably a partially stacked single strand. The two major species at pH 5.8 and 3.0 would correspond to
two i-motif structures (named i-motif 1 and i-motif 2, respectively) stabilized by cytosine+·cytosine base pairs. The
calculated pure CD spectra for these two species are characteristic of this structure, showing a strong positive band
around 285 nm and a weaker negative band around 264 nm. Finally, the major species at pH values lower than 2.0
would correspond to species in which all (or almost all) cytosines and adenine bases are protonated.
9
As expected, the formation of the i-motif 1 structure from the neutral form takes place within a narrow pH range
(Figure 1c). In this case, the value for parameter p (equation 2) is 3, in concordance with the observed cooperativity.
Similarly, the disruption of the i-motif 2 to yield the fully protonated DNA occurs within a very narrow pH range, with
a p value equal to 4, and only in a strongly acidic medium. This can be explained by the resistance of the bases
involved in the i-motif core to their protonation, which destroys their structure. On the contrary, the transition
between both i-motifs is smooth (p value equal to 1) with an apparent pKa around 4.1. Overall, the existence of two
i-motifs can be attributed to the protonation of cytosine (pKa around 4.3) and/or adenine (pKa around 3.5, [32])
bases present in the loops. The pure absorption spectrum for i-motif 2 is slightly shifted to longer wavelengths
(Figure 1e), as a result of protonation. Concomitantly, the pure CD spectra of both i-motifs are similar because the
core structure is well maintained, despite protonation (Figure 1d). As these bases are not involved in the formation
of the C+·C core and probably do not form any base pairs, their protonation does not have any cooperative effect.
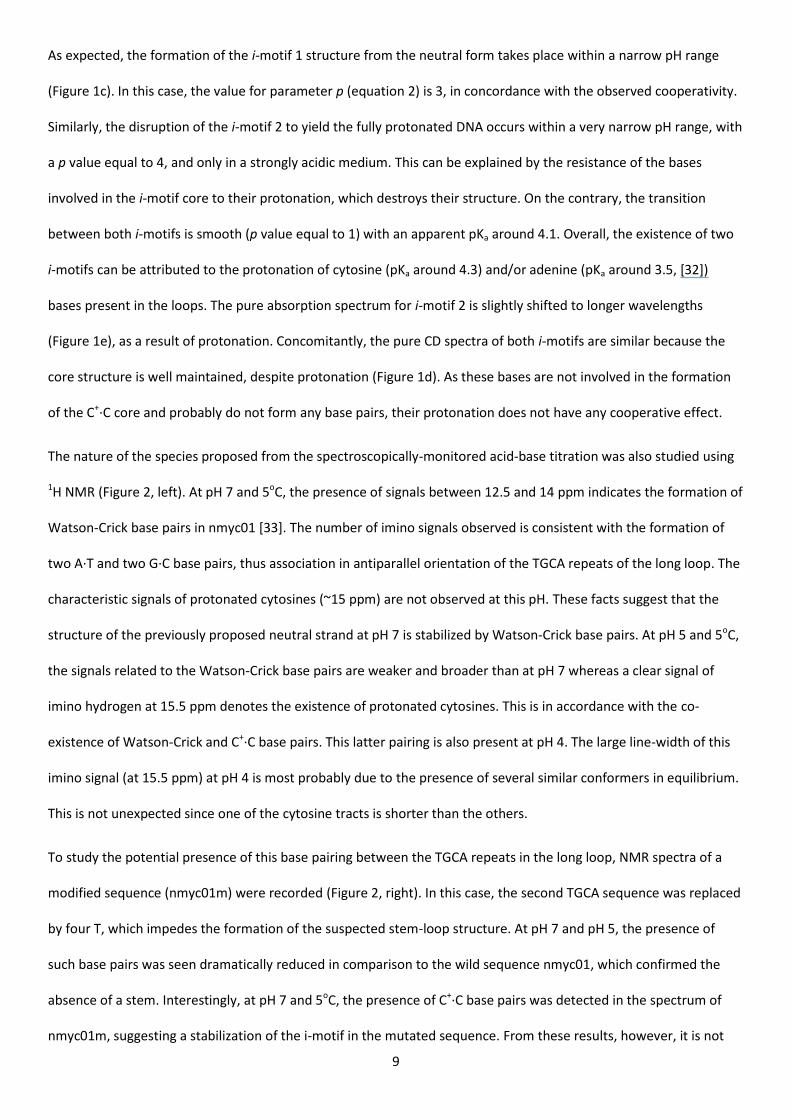
The nature of the species proposed from the spectroscopically-monitored acid-base titration was also studied using
1H NMR (Figure 2, left). At pH 7 and 5oC, the presence of signals between 12.5 and 14 ppm indicates the formation of
Watson-Crick base pairs in nmyc01 [33]. The number of imino signals observed is consistent with the formation of
two A·T and two G·C base pairs, thus association in antiparallel orientation of the TGCA repeats of the long loop. The
characteristic signals of protonated cytosines (~15 ppm) are not observed at this pH. These facts suggest that the
structure of the previously proposed neutral strand at pH 7 is stabilized by Watson-Crick base pairs. At pH 5 and 5oC,
the signals related to the Watson-Crick base pairs are weaker and broader than at pH 7 whereas a clear signal of
imino hydrogen at 15.5 ppm denotes the existence of protonated cytosines. This is in accordance with the co-
existence of Watson-Crick and C+·C base pairs. This latter pairing is also present at pH 4. The large line-width of this
imino signal (at 15.5 ppm) at pH 4 is most probably due to the presence of several similar conformers in equilibrium.
This is not unexpected since one of the cytosine tracts is shorter than the others.
To study the potential presence of this base pairing between the TGCA repeats in the long loop, NMR spectra of a
modified sequence (nmyc01m) were recorded (Figure 2, right). In this case, the second TGCA sequence was replaced
by four T, which impedes the formation of the suspected stem-loop structure. At pH 7 and pH 5, the presence of
such base pairs was seen dramatically reduced in comparison to the wild sequence nmyc01, which confirmed the
absence of a stem. Interestingly, at pH 7 and 5oC, the presence of C+·C base pairs was detected in the spectrum of
nmyc01m, suggesting a stabilization of the i-motif in the mutated sequence. From these results, however, it is not

10
clear whether the Watson-Crick and C+·C base pairs in nmyc01 are present in a unique structure (an i-motif including
a stem-loop stabilized by Watson-Crick base pairing in the long loop) or in a mixture of several species (an i-motif
and the neutral strand stabilized by Watson-Crick base pairing). Melting experiments, as well as separation of the
DNA species by polyacrilamide gel electrophoresis, have been carried out to determine the most plausible situation.
The i-motif structure may be formed by the unfolding of a unique DNA strand or by the association of individual
strands. Given the high number of cytosine bases present in the nmyc01 sequence, both intramolecular folding and
intermolecular arrangements can be envisaged. Melting experiments were first conducted to assess the existence of
an intramolecular transition and to determine the influence of pH on the stability of the i-motif structure. A
mathematical procedure was used to analyze the whole set of experimental spectra to obtain information about the
number of conformations involved, as well as thermodynamic information related to each individual transition. This
procedure is based on the proposal of thermodynamic equations to which spectroscopic data are fitted [30]. As
example, the analysis of spectra recorded during a melting experiment at pH 6.1 is included as Supplementary
Material (Figure S2). At pH 6.1, the melting temperature (Tm) was invariant throughout the concentration range 0.5-
92 M, which suggested intramolecular folding in the experimental conditions used in this study.
These results suggest that the proposed distribution diagram (Figure 1c) may also be valid for the higher DNA
concentrations used in NMR measurements (0.17 and 0.58 mM). Therefore, at pH 5, the Watson-Crick and C+·C base
pairs observed are present in a single species (an i-motif including a hairpin stabilized by Watson-Crick base pairing in
the long loop), rather than in a mixture of i-motif and the neutral strand stabilized by Watson-Crick base pairing.
Table 2 summarizes the thermodynamic parameters calculated over the pH range 3.7 – 6.4. As expected for a
structure in which the core is formed by protonated bases, the melting of the i-motif structure formed by the
nmyc01 sequence was strongly pH-dependent (Figure S3). In the pH range 6.4 to 4.5, Tm values were almost a linear
function of pH. Previous studies also found these relationships and showed that Tm was highest at a pH around the
pKa of free cytosine, depending on experimental conditions such as ionic strength [31]. The values for the change in
enthalpy were maximal around the pKa of free cytosine. Assuming that the disruption of a C+·C base pair needs
around 11 ± 1 kcal·mol-1 [31], it can be deduced that the number of C+·C base pairs disrupted throughout the pH
range 5.8–6.4 is around 5. An increment of the H0 value was observed at lower pH values, with a maximal value
around the pKa of cytosine.
11
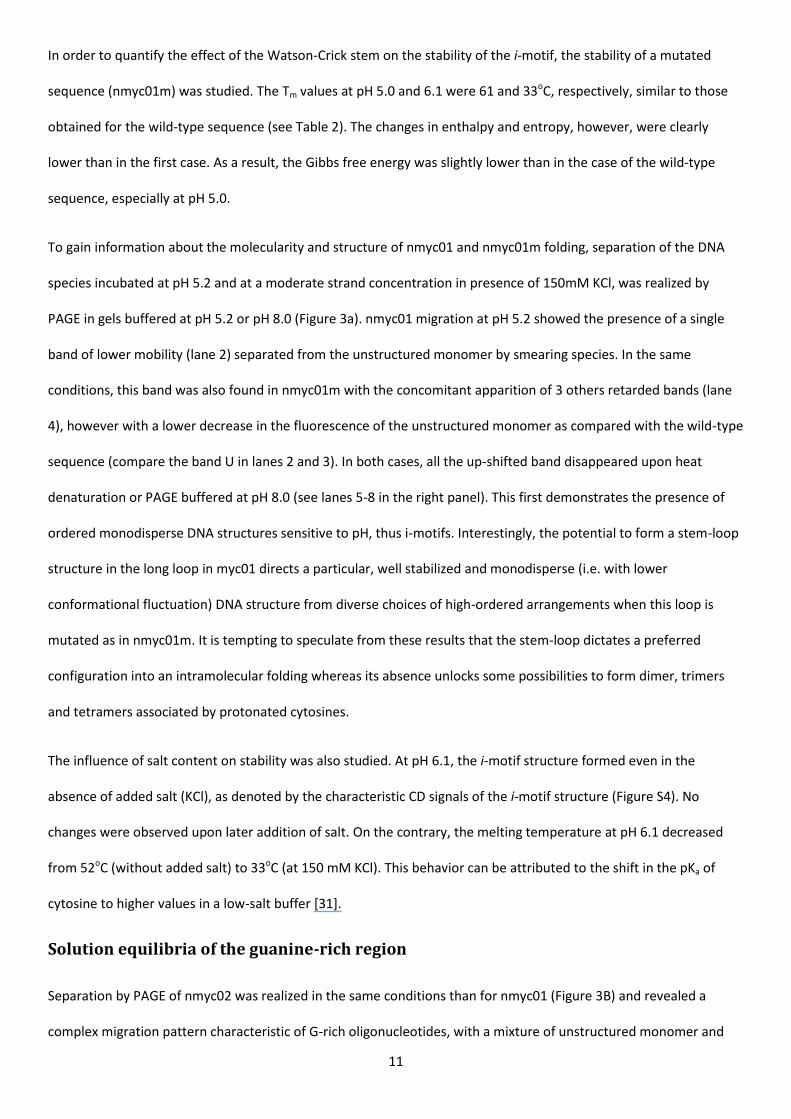
In order to quantify the effect of the Watson-Crick stem on the stability of the i-motif, the stability of a mutated
sequence (nmyc01m) was studied. The Tm values at pH 5.0 and 6.1 were 61 and 33oC, respectively, similar to those
obtained for the wild-type sequence (see Table 2). The changes in enthalpy and entropy, however, were clearly
lower than in the first case. As a result, the Gibbs free energy was slightly lower than in the case of the wild-type
sequence, especially at pH 5.0.
To gain information about the molecularity and structure of nmyc01 and nmyc01m folding, separation of the DNA
species incubated at pH 5.2 and at a moderate strand concentration in presence of 150mM KCl, was realized by
PAGE in gels buffered at pH 5.2 or pH 8.0 (Figure 3a). nmyc01 migration at pH 5.2 showed the presence of a single
band of lower mobility (lane 2) separated from the unstructured monomer by smearing species. In the same
conditions, this band was also found in nmyc01m with the concomitant apparition of 3 others retarded bands (lane
4), however with a lower decrease in the fluorescence of the unstructured monomer as compared with the wild-type
sequence (compare the band U in lanes 2 and 3). In both cases, all the up-shifted band disappeared upon heat
denaturation or PAGE buffered at pH 8.0 (see lanes 5-8 in the right panel). This first demonstrates the presence of
ordered monodisperse DNA structures sensitive to pH, thus i-motifs. Interestingly, the potential to form a stem-loop
structure in the long loop in myc01 directs a particular, well stabilized and monodisperse (i.e. with lower
conformational fluctuation) DNA structure from diverse choices of high-ordered arrangements when this loop is
mutated as in nmyc01m. It is tempting to speculate from these results that the stem-loop dictates a preferred
configuration into an intramolecular folding whereas its absence unlocks some possibilities to form dimer, trimers
and tetramers associated by protonated cytosines.
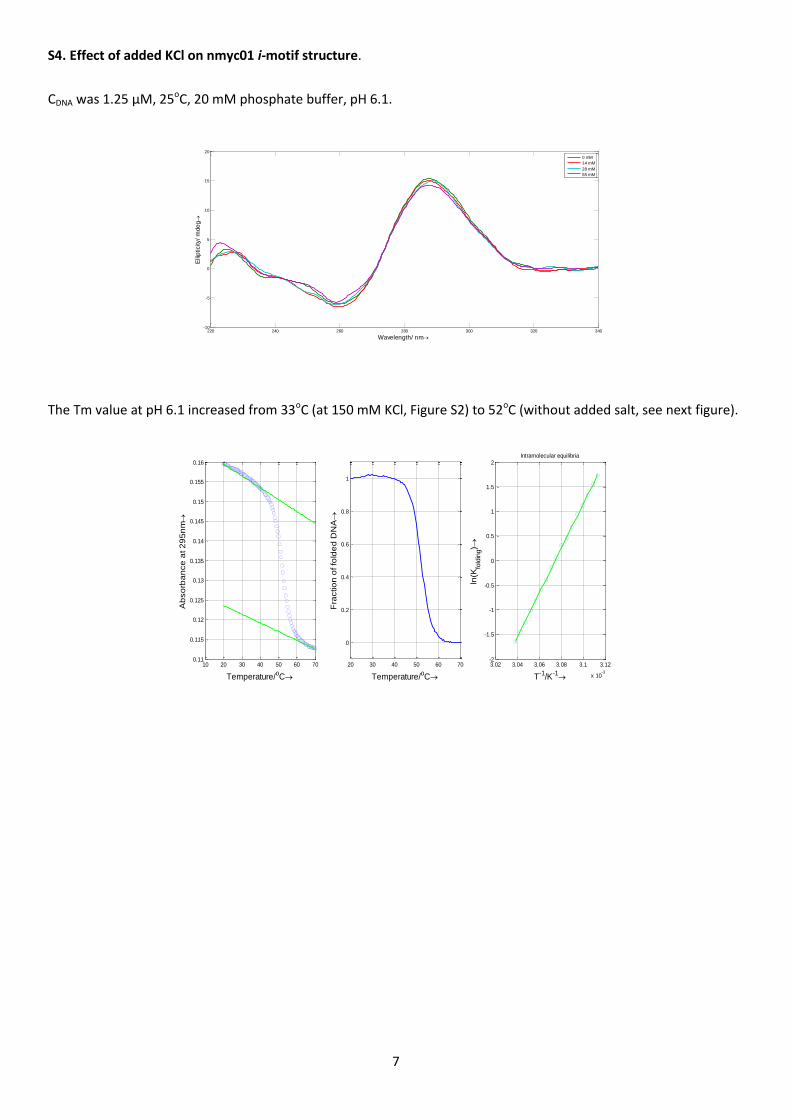
The influence of salt content on stability was also studied. At pH 6.1, the i-motif structure formed even in the
absence of added salt (KCl), as denoted by the characteristic CD signals of the i-motif structure (Figure S4). No
changes were observed upon later addition of salt. On the contrary, the melting temperature at pH 6.1 decreased
from 52oC (without added salt) to 33oC (at 150 mM KCl). This behavior can be attributed to the shift in the pKa of
cytosine to higher values in a low-salt buffer [31].
Solution equilibria of the guanine-rich region
Separation by PAGE of nmyc02 was realized in the same conditions than for nmyc01 (Figure 3B) and revealed a
complex migration pattern characteristic of G-rich oligonucleotides, with a mixture of unstructured monomer and
12
smearing DNA species of high molecular mass, with some diffuse bands and including material blocked in the gel
well. Both patterns were identical at pH 5.2 and pH 8. A small up-shift slightly migrating upon the unstructured
monomer was however observed (lane 2 and 6) indicating a preferential folded, compact structure, probably
intramolecular. The high molecular species were seen resistant to harsh denaturation conditions, such as 15 minutes
at 99°C in their incubation buffer containing KCl. The monodisperse band appeared also relatively resistant to these
conditions, a signature of G-quadruplex species involving repetitions of 4-5 consecutive guanines. As with nmyc01,
nmyc02 presents two TGCA repeats in the long loop, thus suggesting the possible formation of a stem-loop. We thus
synthesized an nmyc02m modified in the second TGCA repeat, as in nmyc01m. PAGE separation of this
oligonucleotide incubated in the same conditions than nmyc02 indicated the absence of the up-shifted species
observed in nmyc02 in the benefit of very diffuse band around and upon the position of the unstructured monomer,
associated with high molecular weight smearing species and 3 very diffuse bands, also present with nmyc02,
probably indicative of DNA multimers (Figure 3B, lanes 4 and 8). As with nmyc02, these structures were resistant to
severe heat denaturation conditions (lanes 4, 8). Such a result strongly supports the idea that the retarded band for
nmyc02 could be in this case a stabilized and compact structure folded into an intra-molecular G-quadruplex
associated with a stem-loop involving Watson-Crick base-pairs. As with the i-motif, formation of this stem-loop may
direct the formation pathway towards the intramolecular species rather than multimers.
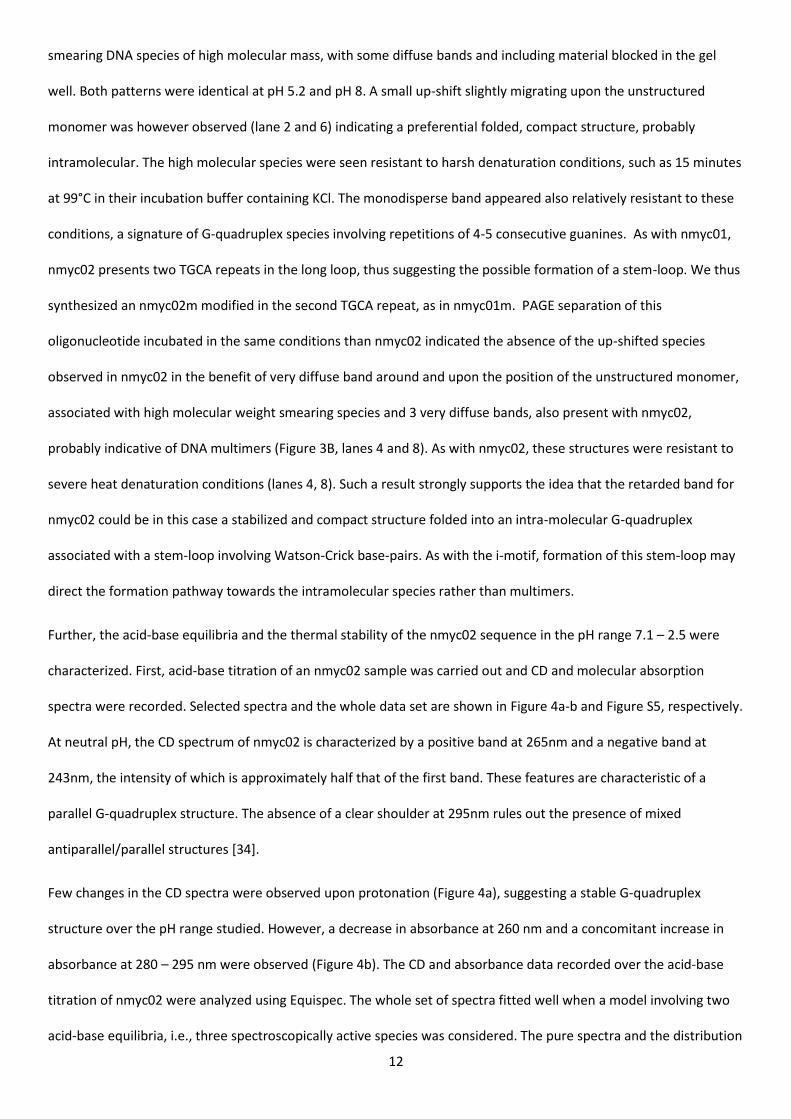
Further, the acid-base equilibria and the thermal stability of the nmyc02 sequence in the pH range 7.1 – 2.5 were
characterized. First, acid-base titration of an nmyc02 sample was carried out and CD and molecular absorption
spectra were recorded. Selected spectra and the whole data set are shown in Figure 4a-b and Figure S5, respectively.
At neutral pH, the CD spectrum of nmyc02 is characterized by a positive band at 265nm and a negative band at
243nm, the intensity of which is approximately half that of the first band. These features are characteristic of a
parallel G-quadruplex structure. The absence of a clear shoulder at 295nm rules out the presence of mixed
antiparallel/parallel structures [34].
Few changes in the CD spectra were observed upon protonation (Figure 4a), suggesting a stable G-quadruplex
structure over the pH range studied. However, a decrease in absorbance at 260 nm and a concomitant increase in
absorbance at 280 – 295 nm were observed (Figure 4b). The CD and absorbance data recorded over the acid-base
titration of nmyc02 were analyzed using Equispec. The whole set of spectra fitted well when a model involving two
acid-base equilibria, i.e., three spectroscopically active species was considered. The pure spectra and the distribution
13
diagram were thus calculated for this number of species (Figure 4c-e). The pH transition mid-point values were 5.0 ±
0.1 and 3.1 ± 0.2, similar to the pKa values of free cytosine and adenine, respectively. Accordingly, the acid-base
species predominant at pH 7 was related to the G-quadruplex, in which cytosine and adenine bases remained
deprotonated. The major species around pH 4.1 was related to the G-quadruplex, in which most of the cytosine
bases were protonated whereas most of the adenine bases remained deprotonated. Finally, the structure
predominant at pH 2 was related to the G-quadruplex structure, in which all, cytosine and adenine bases, were
protonated. Both transitions lack any cooperativity (p equal to 1 in Equation 2), a fact that again could be related to
the protonation of bases in the loops (i.e., not involved in any base pairing).
As in the case of nmyc01, the nature of the species proposed from the spectroscopically-monitored acid-base
titration was also studied using 1H NMR (Supplementary Material, Figure S6, left). At pH 7 and 5oC, the signals at ~11
ppm were related to imino hydrogens in G-quadruplex structures. The broad and unresolved band indicated the
existence of multiple conformers in equilibrium, in agreement with the distribution of DNA species observed by
PAGE. Confirming the PAGE analysis, the small peaks at 12.8 and 13.5 ppm indicate the existence of Watson-Crick
base pairs. At pH 5 and 5oC, all signals were still visible, which indicated the stability of this structure at this pH value.
Watson-Crick base pairing in the loop was further evidenced by NMR analysis of the nmyc02 oligonucleotide (Figure
S6, right). Indeed, this oligonucleotide did not present at pH 5 or 7 the signal at 13.6 ppm observed with the wild-
type sequence, thus showing its inability to stably base-pair the TGCA repeats. The preserved signal around 11 ppm
indicated however the conservation of G-quartets, as seen with PAGE.
Further, several melting experiments of nmyc02 samples were performed within the pH range 3.9 – 7.1. Data
analysis was similar to that previously described for nmyc01. Figure S7 shows the experimental spectra recorded
during a melting at pH 6.1. The trace at 295 nm (inset) was characterized by the low hypochromicity characteristic of
G-quadruplex unfolding. As for the unfolding of the i-motif structure, the best fits were achieved when two
transitions, i.e. three components or conformations, were considered. The first transition was explained initially in
terms of a partial unfolding of the nmyc02 G-quadruplex initially present at 20oC and pH 6.1, as the existence of the
G-quadruplex structure at 70oC was confirmed by means of CD spectroscopy (data not shown). However, the fact
that the magnitude of the first transition, as well as its midpoint, depends on the concentration of DNA
(Supplementary Material, Figure S7) points out to the presence of DNA aggregates. The second transition
corresponded to the complete unfolding of the G-quadruplex to yield the unordered nmyc02 strand. Table 3
14
summarizes the thermodynamic values calculated in this way for both transitions. The changes in enthalpy, entropy
and Gibbs free energy for the first transition were clearly lower than for the second transition, being related to the
differences in abruptness for both transitions. At pH 6.1, the melting temperature (Tm) for the complete unfolding of
the G-quadruplex structure was 79 ± 1oC. At this pH, Tm of the second transition was invariant throughout the
concentration range 0.8-30 M, which suggested intramolecular folding in the experimental conditions used in this
study. Tm increased concomitantly with a decrease in pH (Table 3 and Figure S3). The increase in Tm value, although
not as dramatic as in the case of the nmyc01 sequence, could be due to the effect of pH on the backbone-repulsive
interactions that destabilize folded DNA structures, and / or to the formation of additional bonds due to the
protonation of cytosine and / or adenine bases in the loops.
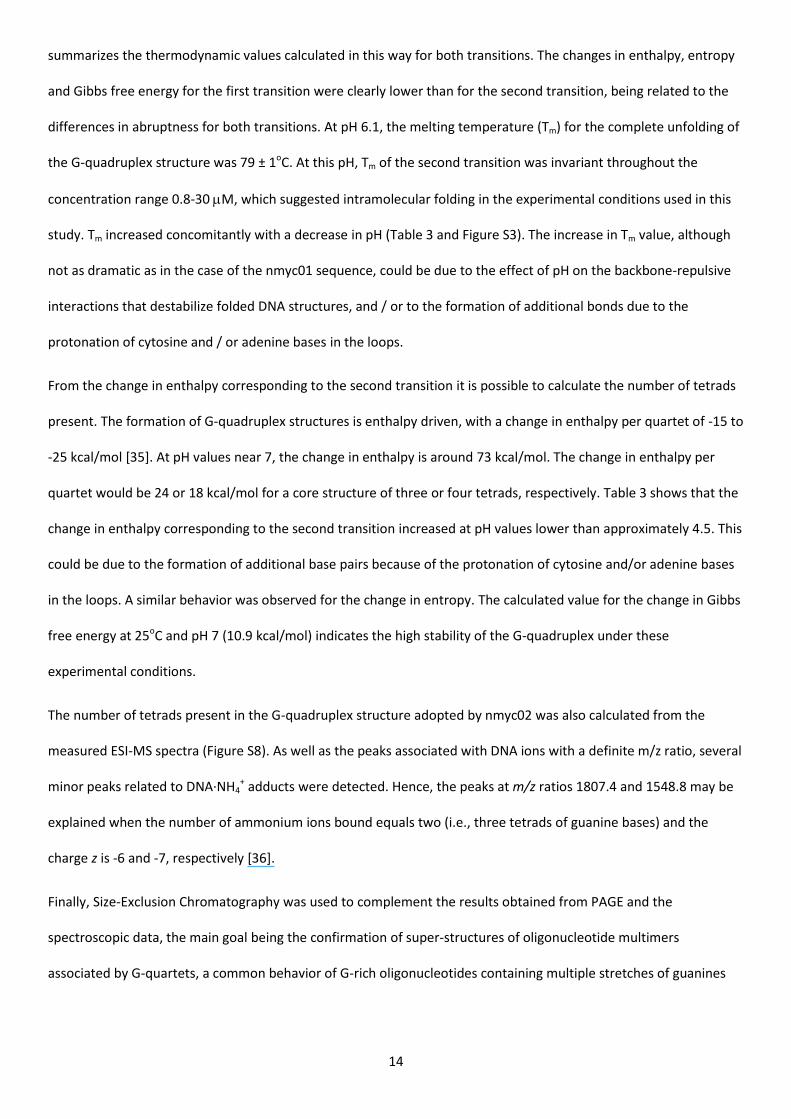
From the change in enthalpy corresponding to the second transition it is possible to calculate the number of tetrads
present. The formation of G-quadruplex structures is enthalpy driven, with a change in enthalpy per quartet of -15 to
-25 kcal/mol [35]. At pH values near 7, the change in enthalpy is around 73 kcal/mol. The change in enthalpy per
quartet would be 24 or 18 kcal/mol for a core structure of three or four tetrads, respectively. Table 3 shows that the
change in enthalpy corresponding to the second transition increased at pH values lower than approximately 4.5. This
could be due to the formation of additional base pairs because of the protonation of cytosine and/or adenine bases
in the loops. A similar behavior was observed for the change in entropy. The calculated value for the change in Gibbs
free energy at 25oC and pH 7 (10.9 kcal/mol) indicates the high stability of the G-quadruplex under these
experimental conditions.
The number of tetrads present in the G-quadruplex structure adopted by nmyc02 was also calculated from the
measured ESI-MS spectra (Figure S8). As well as the peaks associated with DNA ions with a definite m/z ratio, several
minor peaks related to DNA·NH4+ adducts were detected. Hence, the peaks at m/z ratios 1807.4 and 1548.8 may be
explained when the number of ammonium ions bound equals two (i.e., three tetrads of guanine bases) and the
charge z is -6 and -7, respectively [36].
Finally, Size-Exclusion Chromatography was used to complement the results obtained from PAGE and the
spectroscopic data, the main goal being the confirmation of super-structures of oligonucleotide multimers
associated by G-quartets, a common behavior of G-rich oligonucleotides containing multiple stretches of guanines

15
[27]. Figure 5 shows the chromatograms recorded for a series of samples with increasing concentration. At 1 M,
the chromatogram showed a main peak around 7.4 minutes and a shoulder around 6 minutes. The chromatographic
system was calibrated (log MW vs. retention time) with a set of DNA sequences that form linear structures.
According to these, the completely linear nmyc02 should elute at 7.1 minutes. The shift from 7.1 to 7.4 minutes can
be explained in terms of the formation of a G-quadruplex structure, which has a smaller hydrodynamic volume than
the linear structure. When the concentration increased, the Gaussian peak at 7.4 minutes increased accordingly. In
addition, the shoulder at 6 minutes increased concomitantly. This was attributed to aggregates that elute earlier
than the G-quadruplex due to their larger hydrodynamic volumes. When a sample was incubated for a month at 4oC,
the ratio of aggregate increased dramatically (Figure 5b).
Competitive equilibria of Watson-Crick duplex versus intramolecular structures
To plot quantitatively the potential competition between the Watson-Crick duplex and the quadruplex structures
formed by nmyc01 and nmyc02, kinetics, acid-base and melting experiments, as well as SEC and ESI-MS
measurements involving mixtures of both sequences were carried out.
The kinetics of the formation of the duplex was checked by means of molecular beacons technology using a 5’-
fluorescein and 3’-dabsyl-labelled nmyc02 sequence. The maintenance of the G-quadruplex structure in this labeled
sequence was checked by means of melting measurements. The determined Tm was 79±1oC, similar to the value for
the unlabeled sequence, which confirmed that the structure was not affected by the addition of fluorescein and
dabsyl. Upon addition of the stoichiometric amount of the complementary nmyc01 sequence an increase in the
fluorescence intensity was observed at 37oC (Figure S9). This was related to the progressive unfolding of the G-
quadruplex to yield the Watson-Crick duplex, and subsequent distancing of the fluorophore / quencher pair which
enhanced fluorescence. The data fitted a biexponential function with rate constants equal to 0.005±0.002 s-1 and
0.0004±0.0001 s-1. This model suggests the existence of two parallel, rather than two consecutive, reactions. The
proposed mechanism and the calculated values for the rate constants are in the same order of magnitude as those
calculated for the unfolding of a 22-nt human telomere quadruplex in 25mM KCl, 10mM phosphate, pH 7.2 and 20oC
[21]. Finally, the formation of the Watson-Crick duplex was completed after incubation at 37oC overnight.
In order to study the formation of the duplex structure throughout a wide pH range, spectroscopically monitored
acid-base titrations of nmyc01: nmyc02 mixtures were carried out. As an example, the results obtained after analysis
16
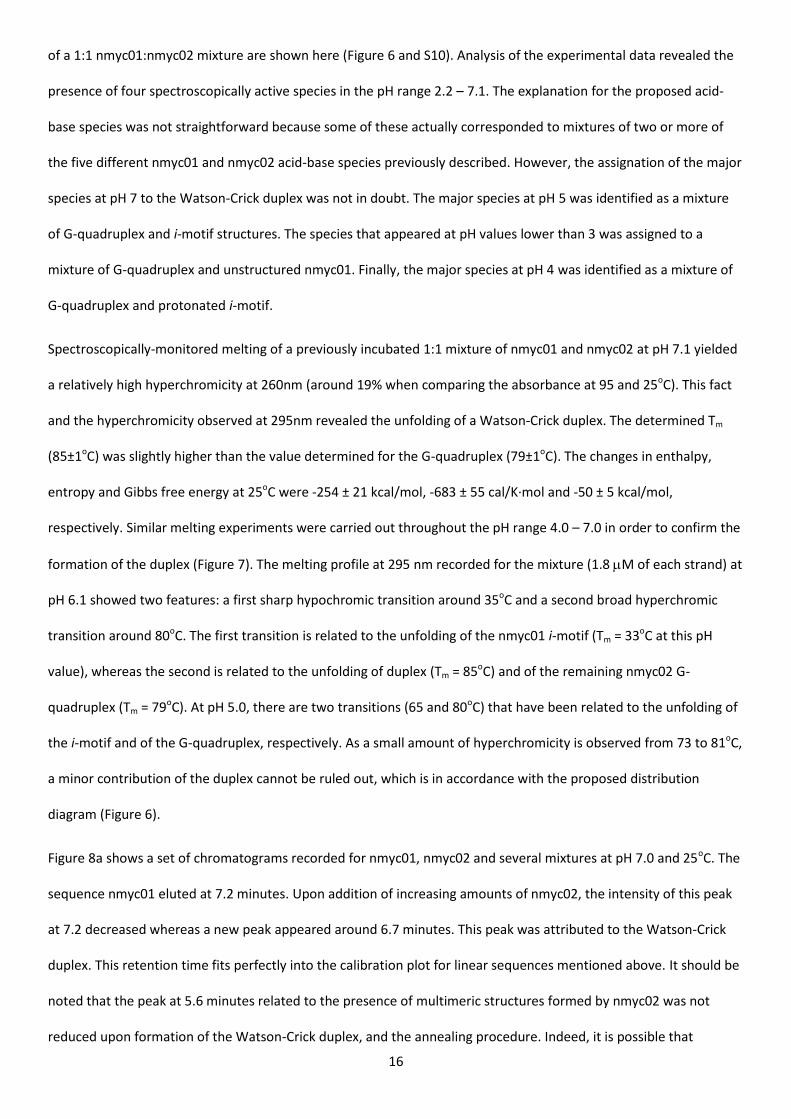
of a 1:1 nmyc01:nmyc02 mixture are shown here (Figure 6 and S10). Analysis of the experimental data revealed the
presence of four spectroscopically active species in the pH range 2.2 – 7.1. The explanation for the proposed acid-
base species was not straightforward because some of these actually corresponded to mixtures of two or more of
the five different nmyc01 and nmyc02 acid-base species previously described. However, the assignation of the major
species at pH 7 to the Watson-Crick duplex was not in doubt. The major species at pH 5 was identified as a mixture
of G-quadruplex and i-motif structures. The species that appeared at pH values lower than 3 was assigned to a
mixture of G-quadruplex and unstructured nmyc01. Finally, the major species at pH 4 was identified as a mixture of
G-quadruplex and protonated i-motif.
Spectroscopically-monitored melting of a previously incubated 1:1 mixture of nmyc01 and nmyc02 at pH 7.1 yielded
a relatively high hyperchromicity at 260nm (around 19% when comparing the absorbance at 95 and 25oC). This fact
and the hyperchromicity observed at 295nm revealed the unfolding of a Watson-Crick duplex. The determined Tm
(85±1oC) was slightly higher than the value determined for the G-quadruplex (79±1oC). The changes in enthalpy,
entropy and Gibbs free energy at 25oC were -254 ± 21 kcal/mol, -683 ± 55 cal/K·mol and -50 ± 5 kcal/mol,
respectively. Similar melting experiments were carried out throughout the pH range 4.0 – 7.0 in order to confirm the
formation of the duplex (Figure 7). The melting profile at 295 nm recorded for the mixture (1.8 M of each strand) at
pH 6.1 showed two features: a first sharp hypochromic transition around 35oC and a second broad hyperchromic
transition around 80oC. The first transition is related to the unfolding of the nmyc01 i-motif (Tm = 33oC at this pH
value), whereas the second is related to the unfolding of duplex (Tm = 85oC) and of the remaining nmyc02 G-
quadruplex (Tm = 79oC). At pH 5.0, there are two transitions (65 and 80oC) that have been related to the unfolding of
the i-motif and of the G-quadruplex, respectively. As a small amount of hyperchromicity is observed from 73 to 81oC,
a minor contribution of the duplex cannot be ruled out, which is in accordance with the proposed distribution
diagram (Figure 6).
Figure 8a shows a set of chromatograms recorded for nmyc01, nmyc02 and several mixtures at pH 7.0 and 25oC. The
sequence nmyc01 eluted at 7.2 minutes. Upon addition of increasing amounts of nmyc02, the intensity of this peak
at 7.2 decreased whereas a new peak appeared around 6.7 minutes. This peak was attributed to the Watson-Crick
duplex. This retention time fits perfectly into the calibration plot for linear sequences mentioned above. It should be
noted that the peak at 5.6 minutes related to the presence of multimeric structures formed by nmyc02 was not
reduced upon formation of the Watson-Crick duplex, and the annealing procedure. Indeed, it is possible that
17
particularly heat-resistant G-quadruplex structures were not denaturated properly, as suggested by their presence
detected even a prolonged incubation at 99oC in presence of KCl (see lane 1 and 5 in Figure 3B). At pH 6.1, however,
the addition of nmyc02 to nmyc01 did not produce a high yield of Watson-Crick duplex. Two months later, the peak
associated with the duplex (at 6.7 minutes) had clearly increased whereas that associated with the multimers (at 5.8
minutes) had decreased.
Discussion
The study of non-canonical DNA structures is of great interest because of their potential role in some diseases and
aging. Concomitantly, the number of G-quadruplex-forming regions observed in the eumetazoa for which complete
genomic sequences are available has increased rapidly [37]. Recently, after decades of research in vitro, the in vivo
presence of G-quadruplexes has been proven [16]. On the other hand, the requirement of low pH values for the
formation of stable i-motif structures seems to be an obstacle for their formation in vivo. However, the existence of
proteins that specifically bind to cytosine-rich sequences has already been demonstrated [38]. In addition, it has
been proposed that the i-motifs could form in the presence of crowding agents [39], proteins [4, 40] or even at
slightly basic conditions at low temperature and absence of added salt [41]. Under negative supercoiling, the i-motif
forms under physiological conditions, and in this case it is more likely that stabilizing capping interactions may drive
the formation of a favored i-motif [8].
In this work, the solution equilibria of two particular cytosine- (nmyc01) and guanine-rich (nmyc02) regions found in
the promoter region of the n-myc gene were studied. Both sequences, which have not been studied before, contain
a duplicate of the TGCA sequence separated by two nucleotides, thus capable of forming a hairpin stabilized by
Watson-Crick base pairs. The cytosine-rich sequence forms two intramolecular i-motifs that are stable throughout
the pH range 2 - 7, with maximal stability at pH 4.5. Under physiological conditions of pH and temperature, the
relative concentration of the i-motif structure is small. The difference between the two i-motifs depends on the
protonation of additional bases in the loops. Our results also show that the guanine-rich region forms an
intramolecular parallel G-quadruplex that is stable throughout the studied pH range (2 - 7). Finally, the competition
between the intramolecular structures (G-quadruplex and i-motif) and the intermolecular Watson-Crick duplex
formed was studied, revealing that the Watson-Crick duplex is the predominant form at pH values above 6. Figure 9
18
depicts a schematic view of the two proposed intramolecular structures. The precise determination of the three-
dimensional solution structure of all sequences studied here is beyond the scope of this manuscript.
The sequences studied here actually correspond to the wild-type sequences, and contain cytosine and guanine tracts
of unequal length. They are thus expected to form potentially multiple conformers that could interconvert at
temperatures below Tm, as has been observed for i-motif structures formed within the HIF-1 proximal promoter
[42]. This could explain the broad NMR signals observed for the i-motif and G-quadruplex. Accurate determination of
the solution structures will require the systematic mutation of bases located in these tracts in order to reduce the
conformational space sampled by the wild-type sequences.
The existence of two different i-motif structures, which mainly differ according to the protonation of bases in the
loops, was previously proposed for a cytosine-rich sequence in the promoter region of the bcl-2 gene [5]. As in this
previous work, the current study demonstrated the utility of a multivariate approach to extract quantitative
information (distribution diagram) from the measured CD and molecular absorption spectra. Monitoring a process
such as acid-base titration at just one wavelength clearly leads to the loss of valuable information.
The most striking characteristic of both quadruplex structures is the existence of a long loop that incorporates a
short stretch of Watson-Crick base pairs. To our knowledge, no previous report has been published describing any i-
motif structure with such a long hairpin loop. In a recent article, Brazier et al. reported the extraordinary stability of
a cytosine-rich region in the PDGF-A gene which contains six tracts of cytosine numbering from 2 to 13 bases long
[42]. This stability, however, was explained there in terms of long cytosine-rich loop regions, rather than by the
formation of intramolecular hairpins. In our case, the existence of this loop stabilizes the structure in terms of H0,
S0 and G0. However, this stabilization is not directly related to an increase in the melting temperature. The
argument that an increase in Tm can be directly related to an increase in stability at a given temperature has
previously been debated [43, 44]. Obviously, at 25°C and pH 5.0, both structures are folded. However, the unfolding
of the wild-type sequence (nmyc01) is completed over a narrower temperature range than that of the mutated
sequence (nmyc01m). As a consequence, the structure involving the Watson-Crick stem inside the long loop has a
higher stability at 25°C and pH 5.0 than the structure without that stem. This suggests the contribution of the hairpin
to the stability of the overall structure, and our PAGE analysis suggest that this hairpin stabilizes one particular motif
to favor the intramolecular folding of n-myc01 and/or n-myc02, and consequentially decreases intermolecular
19
interactions giving rise to DNA multimers of high molecular weight, widely reported in the field of G-quadruplex
forming structures. This behavior is particularly interesting in a biological context where formation of this stem-loop,
repeated on both strand, could greatly contribute to the folding of both i- and G tetraplexes upon local unwinding of
the nmyc promoter.
The data on the thermal stability of i-motifs has led to the proposal of two classes (I and II) into which currently
known i-motifs can be grouped. Class I structures consist of short loop regions between cytosine tracts, whereas
class II structures contain longer loop regions between cytosine tracts [18]. The classification of the i-motif formed
by nmyc01 points to an intermediate situation between these two classes. The transitional pH from the single strand
is 6.5, which classifies it as a class II i-motif. However, the thermal stability at pH 7 and the proposed short loops 2
and 3 indicate that it is a class I i-motif.
The reported data on the stability of G-quadruplexes show that, in general, the most stable in terms of Tm values are
those containing single-nucleotide lateral loops between the G-quartets [45]. The G-quadruplex structure that could
be formed by the n-myc02 sequence contains at least one such loop. In addition, the presence of two single-
nucleotide loops within a quadruplex-forming sequence constrains the structure to a parallel fold, which is
independent of the length of the remaining loop (up to three nucleotides) [45]. In the case of nmyc02, the presence
of a longer loop does not prevent the formation of a parallel G-quadruplex, as shown by CD spectroscopy. As the
opposite, the formation of a short stem-loop greatly stabilizes a single, monodisperse structure as seen with gel
electrophoresis. Other wild-type guanine-rich sequences, like those corresponding to the hypoxia inducible factor 1
promoter [46] and c-myc [47], also show parallel folding despite containing relatively long loops. Concerning the
formation of a hairpin, to our knowledge only one parallel G-quadruplex structure containing a hairpin in a loop has
been described previously, being that found at the hTERT core promoter [48]. As in the case of nmyc02, the long
loop likely forms a stable hairpin structure, which would explain the unexpected stability of both G-quadruplex
structures.
The first transition observed in the melting of nmyc02 was explained initially in terms of partial unfolding of the
nmyc02 G-quadruplex initially present at 20oC and pH 6.1. This transition would involve some unstacking of bases
located in the loops or at the 5’ or 3’ ends of the nmyc02 sequence. However, in view of the SEC results, the first
transition could be related to the breaking of the aggregates at temperatures lower than the melting temperature.
20
The formation of multimers has been proposed for other sequences [49], including a sequence lacking of a long loop
in the n-myc gene (5’-TAG3CG3AG3AG3A2-3’), [22]. In this last work, the melting of the dimeric form was not reflected
in temperature-dependent UV absorbance profiles. Again, the application of a multivariate approach allowed the
resolution of a complete distribution diagram for the unfolding of a complex mixture. Finally, the presence of
multimers for the nmyc02 sequence is consistent with the observation that two parallel processes occur during the
formation of the Watson-Crick duplex from the folded G-quadruplex, as indicated by the fluorescence and SEC
measurements.
This work has also shown that the Watson-Crick duplex is the predominant species in the mixture at pH 7 and 25oC.
However, low numbers of intramolecular structures are present at this pH, their contribution being higher than that
of the duplex at pH values lower than approximately 6.1. The pH value is, as a consequence, a key variable
modulating the equilibrium between the intra- and intermolecular species. Dysregulated pH is known to be an
adaptive feature of most cancers, regardless of their tissue origin or genetic background. In normal differentiated
adult cells, intracellular pH is generally lower (around 7.2) than the extracellular pH (around 7.4). However, cancer
cells have a higher intracellular (around 7.4) and a lower extracellular pH (6.7–7.1) [50]. In these conditions,
cytosine-rich sequences may adopt i-motif structures and modulate the formation of the other nucleic acid
structures.
Acknowledgements
Thanks are due to Robert Hänsel (Goethe University Frankfurt) for helpful discussions about the stability of i-motifs.
We acknowledge funding from the Spanish government (CTQ2012-38616-C02-02 and CTQ2010-20541-C03-01).
21
Bibliography
[1] S. Ahmed, A. Kintanar, E. Henderson, Human Telomeric C-Strand Tetraplexes, Nature Structural Biology, 1 (1994) 83-88. [2] J.L. Leroy, M. Gueron, J.L. Mergny, C. Helene, Intramolecular Folding of a Fragment of the Cytosine-Rich Strand of Telomeric DNA into an I-Motif, Nucleic Acids Research, 22 (1994) 1600-1606. [3] S. Nonin-Lecomte, J.L. Leroy, Structure of a C-rich strand fragment of the human centromeric satellite III: A pH-dependent intercalation topology, Journal of Molecular Biology, 309 (2001) 491-506. [4] D.J. Uribe, K. Guo, Y.-J. Shin, D. Sun, Heterogeneous Nuclear Ribonucleoprotein K and Nucleolin as Transcriptional Activators of the Vascular Endothelial Growth Factor Promoter through Interaction with Secondary DNA Structures, Biochemistry, 50 (2011) 3796-3806. [5] N. Khan, A. Avino, R. Tauler, C. Gonzalez, R. Eritja, R. Gargallo, Solution equilibria of the i-motif-forming region upstream of the B-cell lymphoma-2 P1 promoter, Biochimie, 89 (2007) 1562-1572. [6] G. Manzini, N. Yathindra, L.E. Xodo, Evidence for Intramolecularly Folded I-DNA Structures in Biologically Relevant Ccc-Repeat Sequences, Nucleic Acids Research, 22 (1994) 4634-4640. [7] K. Guo, A. Pourpak, K. Beetz-Rogers, V. Gokhale, D. Sun, L.H. Hurley, Formation of Pseudosymmetrical G-Quadruplex and i-Motif Structures in the Proximal Promoter Region of the RET Oncogene, J. Am. Chem. Soc., 129 (2007) 10220-10228. [8] D. Sun, L.H. Hurley, The Importance of Negative Superhelicity in Inducing the Formation of G-Quadruplex and i-Motif Structures in the c-Myc Promoter: Implications for Drug Targeting and Control of Gene Expression, Journal of Medicinal Chemistry, 52 (2009) 2863-2874. [9] S. Saxena, A. Bansal, S. Kukreti, Structural polymorphism exhibited by a homopurine·homopyrimidine sequence found at the right end of human c-jun protooncogene, Archives of Biochemistry and Biophysics, 471 (2008) 95-108. [10] Y. Xu, H. Sugiyama, Formation of the G-quadruplex and i-motif structures in retinoblastoma susceptibility genes (Rb), Nucleic Acids Research, 34 (2006) 949-954. [11] Y. Peng, X. Wang, Y. Xiao, L. Feng, C. Zhao, J. Ren, X. Qu, i-Motif Quadruplex DNA-Based Biosensor for Distinguishing Single- and Multiwalled Carbon Nanotubes, Journal of the American Chemical Society, 131 (2009) 13813-13818. [12] P. Alberti, A. Bourdoncle, B. Sacca, L. Lacroix, J.L. Mergny, DNA nanomachines and nanostructures involving quadruplexes, Organic & Biomolecular Chemistry, 4 (2006) 3383-3391. [13] S. Neidle, Human telomeric G-quadruplex: The current status of telomeric G-quadruplexes as therapeutic targets in human cancer, FEBS Journal, 277 (2010) 1118-1125. [14] J.L. Huppert, Quadruplexes in the Genome, in: S. Neidle, S. Balasubramanian (Eds.) Quadruplex Nucleic Acids, The Royal Society of Chemistry, Cambridge, 2006, pp. 208-223. [15] J.L. Huppert, Structure, location and interactions of G-quadruplexes, FEBS Journal, 277 (2010) 3452-3458. [16] G. Biffi, D. Tannahill, J. McCafferty, S. Balasubramanian, Quantitative visualization of DNA G-quadruplex structures in human cells, Nat Chem, advance online publication (2013). [17] S. Balasubramanian, S. Neidle, G-quadruplex nucleic acids as therapeutic targets, Current Opinion in Chemical Biology, 13 (2009) 345-353. [18] T.A. Brooks, S. Kendrick, L. Hurley, Making sense of G-quadruplex and i-motif functions in oncogene promoters, FEBS Journal, 277 (2010) 3459-3469. [19] P. Bucek, J. Jaumot, A. Avino, R. Eritja, R. Gargallo, PH-modulated Watson-Crick duplex-quadruplex equilibria of guanine-rich and cytosine-rich DNA sequences 140 base pairs upstream of the c-kit transcription initiation site, Chemistry - A European Journal, 15 (2009) 12663-12671. [20] E. Bell, L. Chen, T. Liu, G.M. Marshall, J. Lunec, D.A. Tweddle, MYCN oncoprotein targets and their therapeutic potential, Cancer Letters, 293 (2010) 144-157. [21] A.N. Lane, The stability of intramolecular DNA G-quadruplexes compared with other macromolecules, Biochimie, 94 (2012) 277-286. [22] M. Trajkovski, M. Webba da Silva, J. Plavec, Unique Structural Features of Interconverting Monomeric and Dimeric G-Quadruplexes Adopted by a Sequence from the Intron of the N-myc Gene, Journal of the American Chemical Society, 134 (2012) 4132-4141. [23] D.M. Tasset, M.F. Kubik, W. Steiner, Oligonucleotide inhibitors of human thrombin that bind distinct epitopes, Journal of Molecular Biology, 272 (1997) 688-698.
22
[24] J. Jaumot, R. Gargallo, Experimental methods for studying the interactions between G-quadruplex structures and ligands, Current Pharmaceutical Design, 18 (2012) 1900-1916. [25] W.A. Kibbe, OligoCalc: An online oligonucleotide properties calculator, Nucleic Acids Research, 35 (2007) W43-W46. [26] M. Piotto, V. Saudek, V. Sklenár, Gradient-tailored excitation for single-quantum NMR spectroscopy of aqueous solutions, Journal of Biomolecular NMR, 2 (1992) 661-665. [27] S. Ruiz-Castelar, A. Checa, R. Gargallo, J. Jaumot, Combination of chromatographic and chemometric methods to study the interactions between DNA strands, Analytica Chimica Acta, 722 (2012) 34-42. [28] J. Jaumot, R. Eritja, R. Gargallo, Chemical equilibria studies using multivariate analysis methods, Analytical and Bioanalytical Chemistry, 399 (2011) 1983-1997. [29] R. Dyson, S. Kaderli, G.A. Lawrence, M. Maeder, A.D. Zuberbühler, Second order global analysis: the evaluation of series of spectrophotometric titrations for improved determination of equilibrium constants, Analytica Chimica Acta, 353 (1997) 381-393. [30] S. Fernandez, R. Eritja, A. Aviñó, J. Jaumot, R. Gargallo, Influence of pH, temperature and the cationic porphyrin TMPyP4 on the stability of the i-motif formed by the 5'-(C3TA2)4-3' sequence of the human telomere, International Journal of Biological Macromolecules, 49 (2011) 729-736. [31] J.L. Mergny, L. Lacroix, X.G. Han, J.L. Leroy, C. Helene, Intramolecular Folding of Pyrimidine Oligodeoxynucleotides into an I-DNA Motif, Journal of the American Chemical Society, 117 (1995) 8887-8898. [32] T. Vojtylová, D. Dospivová, O. Trisková, I. Pilarová, P. Lubal, M. Farková, L. Trnková, P. Táborský, Spectroscopic study of protonation of oligonucleotides containing adenine and cytosine, Chemical Papers, 63 (2009) 731-737. [33] M. Adrian, B. Heddi, A.T. Phan, NMR spectroscopy of G-quadruplexes, Methods, 57 (2012) 11-24. [34] G.N. Parkinson, Fundamentals of Quadruplex Structures, in: S. Neidle, S. Balasubramanian (Eds.) Quadruplex Nucleic Acids, The Royal Society of Chemistry, Cambridge, 2006, pp. 1-30. [35] J.-L. Mergny, J. Gros, A.D. Cian, A. Bourdoncle, F. Rosu, B. Saccà, L. Guittat, S. Amrane, M. Mills, P. Alberti, M. Takasugi, L. Lacrois, Energetics, Kinetics and Dynamics of Quadruplex Folding, in: S. Neidle, S. Balasubramanian (Eds.) Quadruplex Nucleic Acids, The Royal Society of Chemistry, Cambridge, 2006, pp. 31-72. [36] F. Rosu, V. Gabelica, C. Houssier, P. Colson, E. De Pauw, Triplex and quadruplex DNA structures studied by electrospray mass spectrometry, Rapid Communications in Mass Spectrometry, 16 (2002) 1729-1736. [37] S.S. Smith, Evolutionary Expansion of Structurally Complex DNA Sequences, Cancer Genomics - Proteomics, 7 (2010) 207-215. [38] Y.M.K. Yoga, D.A.K. Traore, M. Sidiqi, C. Szeto, N.R. Pendini, A. Barker, P.J. Leedman, J.A. Wilce, M.C.J. Wilce, Contribution of the first K-homology domain of poly(C)-binding protein 1 to its affinity and specificity for C-rich oligonucleotides, Nucleic Acids Research, 40 (2012) 5101-5114. [39] D. Miyoshi, S. Matsumura, S.I. Nakano, N. Sugimoto, Duplex Dissociation of Telomere DNAs Induced by Molecular Crowding, Journal of the American Chemical Society, 126 (2004) 165-169. [40] A. Bandiera, G. Tell, E. Marsich, A. Scaloni, G. Pocsfalvi, A. Akindahunsi, L. Cesaratto, G. Manzini, Cytosine-block telomeric type DNA-binding activity of hnRNP proteins from human cell lines, Archives of Biochemistry and Biophysics, 409 (2003) 305-314. [41] J. Zhou, C. Wei, G. Jia, X. Wang, Z. Feng, C. Li, Formation of i-motif structure at neutral and slightly alkaline pH, Molecular BioSystems, 6 (2010) 580-586. [42] J.A. Brazier, A. Shah, G.D. Brown, I-Motif formation in gene promoters: unusually stable formation in sequences complementary to known G-quadruplexes, Chemical Communications, 48 (2012) 10739-10741. [43] L.A. Marky, K.J. Breslauer, Calculating thermodynamic data for transitions of any molecularity from equilibrium melting curves, Biopolymers - Peptide Science Section, 26 (1987) 1601-1620. [44] J.L. Mergny, L. Lacroix, Analysis of Thermal Melting Curves, Oligonucleotides, 13 (2003) 515-537. [45] A. Bugaut, S. Balasubramanian, A Sequence-Independent Study of the Influence of Short Loop Lengths on the Stability and Topology of Intramolecular DNA G-Quadruplexes Biochemistry, 47 (2008) 689-697. [46] R. De Armond, S. Wood, D. Sun, L.H. Hurley, S.W. Ebbinghaus, Evidence for the presence of a guanine quadruplex forming region within a polypurine tract of the hypoxia inducible factor 1-alfa promoter, Biochemistry, 44 (2005) 16341-16350. [47] A.T. Phan, Y.S. Modi, D.J. Patel, Propeller-type parallel-stranded G-quadruplexes in the human c-myc promoter, Journal of the American Chemical Society, 126 (2004) 8710-8716. [48] S.L. Palumbo, S.W. Ebbinghaus, L.H. Hurley, Formation of a Unique End-to-End Stacked Pair of G-Quadruplexes in the hTERT Core Promoter with Implications for Inhibition of Telomerase by G-Quadruplex-Interactive Ligands, Journal of the American Chemical Society, 131 (2009) 10878-10891.

23
[49] N. Smargiasso, F. Rosu, W. Hsia, P. Colson, E.S. Baker, M.T. Bowers, E. De Pauw, V. Gabelica, G-quadruplex DNA assemblies: Loop length, cation identity, and multimer formation, Journal of the American Chemical Society, 130 (2008) 10208-10216. [50] B.A. Webb, M. Chimenti, M.P. Jacobson, D.L. Barber, Dysregulated pH: a perfect storm for cancer progression, Nat Rev Cancer, 11 (2011) 671-677.
24
Tables and figures
Table 1. Sequences studied in this work. Underlined bases are those that could be involved in the formation of C+•C
base pairs or guanine tetrads. F and Q denote fluorophore and quencher, respectively.
Table 2. Thermodynamic parameters for the unfolding of nmyc01 and nmyc01m calculated from melting
experiments. The experiments were carried out in 20 mM phosphate or acetate buffer, 150 mM KCl, 1.3 M nmyc01
or nmyc01m.
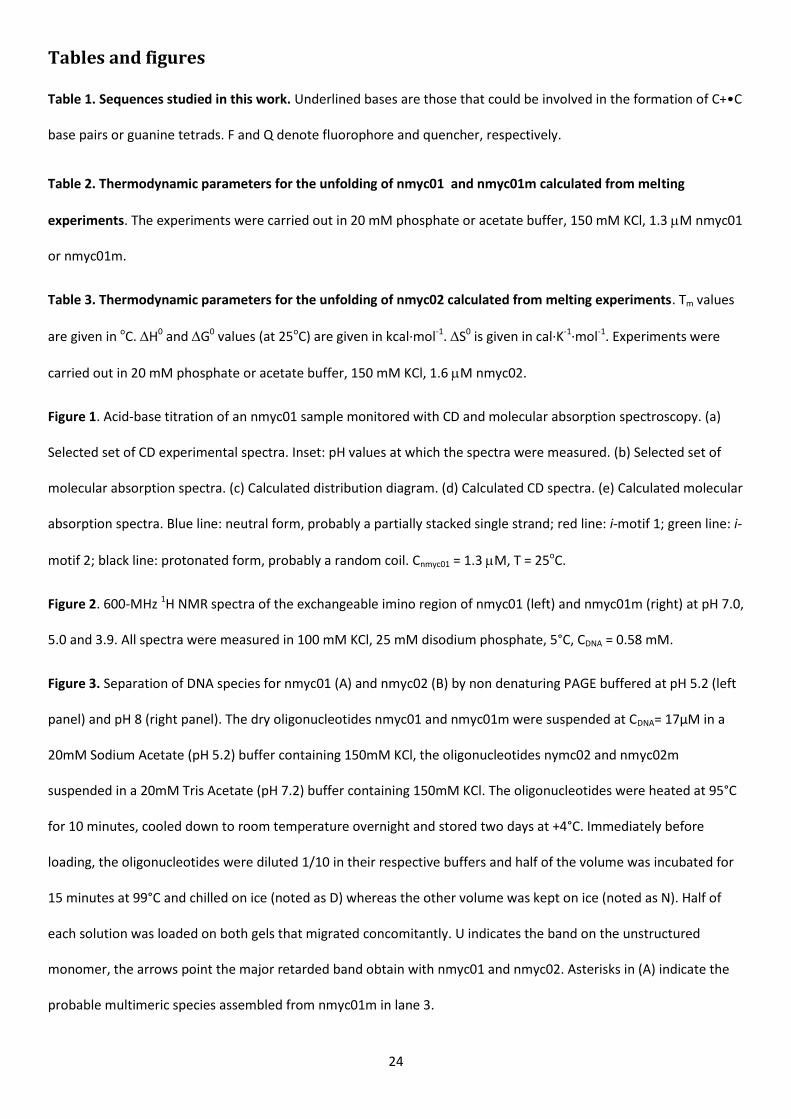
Table 3. Thermodynamic parameters for the unfolding of nmyc02 calculated from melting experiments. Tm values
are given in oC. H0 and G0 values (at 25oC) are given in kcal·mol-1. S0 is given in cal·K-1·mol-1. Experiments were
carried out in 20 mM phosphate or acetate buffer, 150 mM KCl, 1.6 M nmyc02.
Figure 1. Acid-base titration of an nmyc01 sample monitored with CD and molecular absorption spectroscopy. (a)
Selected set of CD experimental spectra. Inset: pH values at which the spectra were measured. (b) Selected set of
molecular absorption spectra. (c) Calculated distribution diagram. (d) Calculated CD spectra. (e) Calculated molecular
absorption spectra. Blue line: neutral form, probably a partially stacked single strand; red line: i-motif 1; green line: i-
motif 2; black line: protonated form, probably a random coil. Cnmyc01 = 1.3 M, T = 25oC.
Figure 2. 600-MHz 1H NMR spectra of the exchangeable imino region of nmyc01 (left) and nmyc01m (right) at pH 7.0,
5.0 and 3.9. All spectra were measured in 100 mM KCl, 25 mM disodium phosphate, 5°C, CDNA = 0.58 mM.
Figure 3. Separation of DNA species for nmyc01 (A) and nmyc02 (B) by non denaturing PAGE buffered at pH 5.2 (left
panel) and pH 8 (right panel). The dry oligonucleotides nmyc01 and nmyc01m were suspended at CDNA= 17µM in a
20mM Sodium Acetate (pH 5.2) buffer containing 150mM KCl, the oligonucleotides nymc02 and nmyc02m
suspended in a 20mM Tris Acetate (pH 7.2) buffer containing 150mM KCl. The oligonucleotides were heated at 95°C
for 10 minutes, cooled down to room temperature overnight and stored two days at +4°C. Immediately before
loading, the oligonucleotides were diluted 1/10 in their respective buffers and half of the volume was incubated for
15 minutes at 99°C and chilled on ice (noted as D) whereas the other volume was kept on ice (noted as N). Half of
each solution was loaded on both gels that migrated concomitantly. U indicates the band on the unstructured
monomer, the arrows point the major retarded band obtain with nmyc01 and nmyc02. Asterisks in (A) indicate the
probable multimeric species assembled from nmyc01m in lane 3.

25
Figure 4. Acid-base titration of an nmyc02 sample monitored with CD and molecular absorption spectroscopy. (a)
Selected set of CD experimental spectra. Inset: pH values at which the spectra were measured. (b) Selected set of
molecular absorption spectra. (c) Calculated distribution diagram. (d) Calculated CD spectra. (e) Calculated molecular
absorption spectra. Blue line: G-quadruplex containing all bases in their neutral forms. Red line: G-quadruplex
containing protonated cytosine bases. Green line: G-quadruplex containing protonated cytosine and adenine bases.
Cnmyc02 = 0.9 M, T = 25oC. Other conditions are as detailed in the text.
Figure 5. SEC of nmyc02 sequence. Chromatograms at 260nm recorded for different concentrations of nmyc02 (a)
and chromatogram measured for a 1 M sample kept at 4oC for one month after preparation. The mobile phase was
75mM potassium phosphate adjusted to pH 7.2, and the temperature was 25oC.
Figure 6. Titration of a 1:1 nmyc01:nmyc02 sample monitored with CD and molecular absorption spectroscopy. The
results were obtained after analysis of experimental spectra with Equispec. (a) Calculated distribution diagram; (b)
Calculated CD spectra; (c) Calculated molecular absorption spectra. Blue line: Watson-Crick duplex, red line: G-
quadruplex + i-motif 1, green line: G-quadruplex + i-motif 2, black line: G-quadruplex + unfolded nmyc01. Cnmyc01 =
Cnmyc02 = 2.0 M, T = 25oC. Other experimental conditions are as described in the text.
Figure 7. Melting of equimolar mixtures at pH 7.1 (solid line), pH 6.1 (dashed line) and 5.0 (dotted line). The
concentration of each strand was 1.8 M. Other experimental conditions are as described in the text.
Figure 8. Recorded SEC chromatograms for equimolar mixtures of nmyc01 and nmyc02 at pH 7.0 (a) and at pH 6.0 (b
and c). The chromatograms shown in c) were recorded two months after the preparation of the mixtures. The
mobile phase was 75mM potassium phosphate adjusted to the considered pH value. T= 25oC. The legend shows the
nmyc01:nmyc02 ratio of concentrations in each chromatogram.
Figure 9. Proposed schematic structures for the i-motif and G-quadruplex structures formed by the nmyc01 and
nmyc02 sequences, respectively, under the experimental conditions used in this work.

Table 1. Sequences studied in this work. Underlined bases are those that could be involved
in the formation of C+·C base pairs or guanine tetrads. Bold bases are those mutated to
prevent the formation of Watson-Crick base pairing. F and Q denote fluorophore and
quencher, respectively.
Sequence
nmyc01 5’-ACC CCC TGC ATC TGC ATG CCC CCT CCC ACC CCC T-3’
nmyc01m 5’-ACC CCC TGC ATC TTT TTG CCC CCT CCC ACC CCC T-3’
nmyc02 5’-AGG GGG TGG GAG GGG GCA TGC AGA TGC AGG GGG T-3’
nmyc02m 5' AGG GGG TGG GAG GGG GCT TTT TGA TGC AGG GGG T 3'
Fnmyc02Q 5’-F- AGG GGG TGG GAG GGG GCA TGC AGA TGC AGG GGG T-Q-3’
Table 1

Table 2. Thermodynamic parameters for the unfolding of nmyc01 and nmyc01m calculated
from melting experiments. The experiments were carried out in 20 mM phosphate or acetate
buffer, 150 mM KCl, 1.3 M nmyc01 or nmyc01m.
pH DNA Tm (oC) ∆H0
(kcal/mol)
∆S0
(cal/K·mol)
ΔG025oC
(kcal/mol)
3.7 nmyc01 62 60 179 6.6
4.5 nmyc01 70 78 228 10.0
5.0 nmyc01 63 83 248 9.1
5.5 nmyc01 50 73 225 5.9
5.8 nmyc01 41 57 179 3.6
6.1 nmyc01 33 52 170 1.2
6.4 nmyc01 25 59 197 0.3
7.0 nmyc01 <15 Not
calculated
Not
calculated
Not
calculated
5.0 nmyc01m 61 69 206 7.6
6.1 nmyc01m 33 43 141 1.0
a Tm values are given with an uncertainty value of ± 1oC.
b Estimated uncertainty values for thermodynamic data are 10% (G0) and 5% (H0 and S0).
Table 2
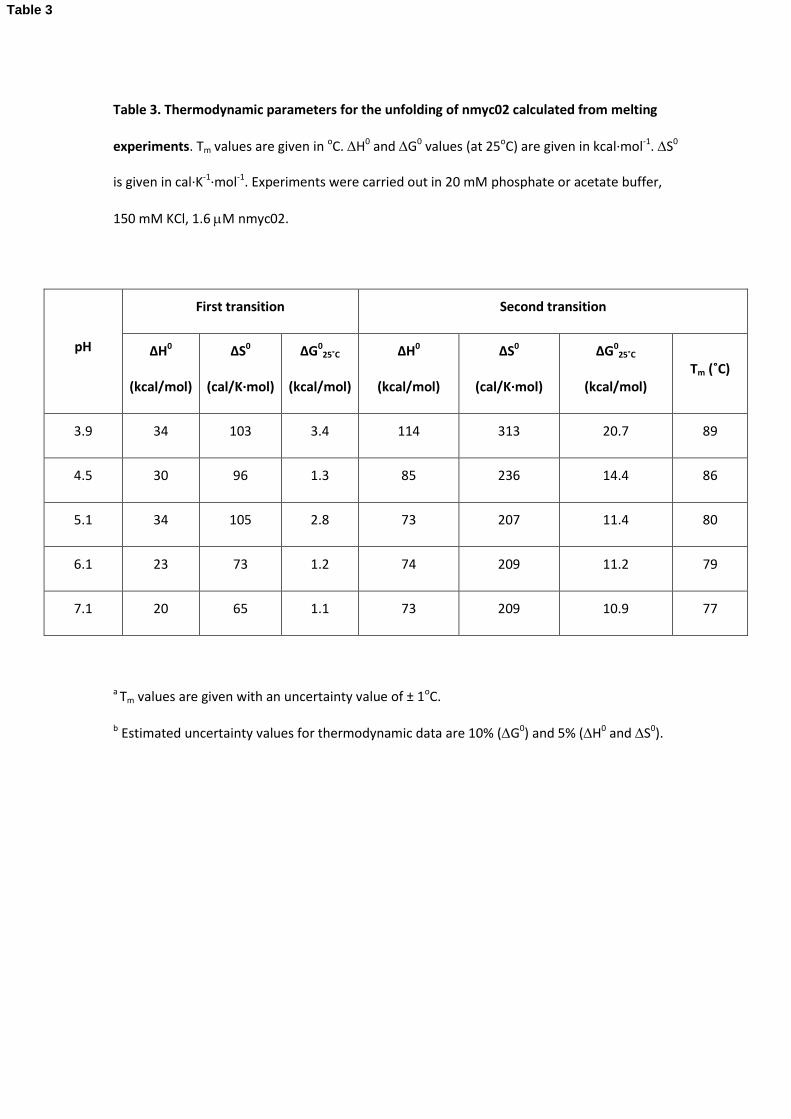
Table 3. Thermodynamic parameters for the unfolding of nmyc02 calculated from melting
experiments. Tm values are given in oC. H0 and G0 values (at 25oC) are given in kcal·mol-1. S0
is given in cal·K-1·mol-1. Experiments were carried out in 20 mM phosphate or acetate buffer,
150 mM KCl, 1.6 M nmyc02.
pH
First transition Second transition
∆H0
(kcal/mol)
∆S0
(cal/K·mol)
ΔG025˚C
(kcal/mol)
∆H0
(kcal/mol)
∆S0
(cal/K·mol)
ΔG025˚C
(kcal/mol) Tm (˚C)
3.9 34 103 3.4 114 313 20.7 89
4.5 30 96 1.3 85 236 14.4 86
5.1 34 105 2.8 73 207 11.4 80
6.1 23 73 1.2 74 209 11.2 79
7.1 20 65 1.1 73 209 10.9 77
a Tm values are given with an uncertainty value of ± 1oC.
b Estimated uncertainty values for thermodynamic data are 10% (G0) and 5% (H0 and S0).
Table 3
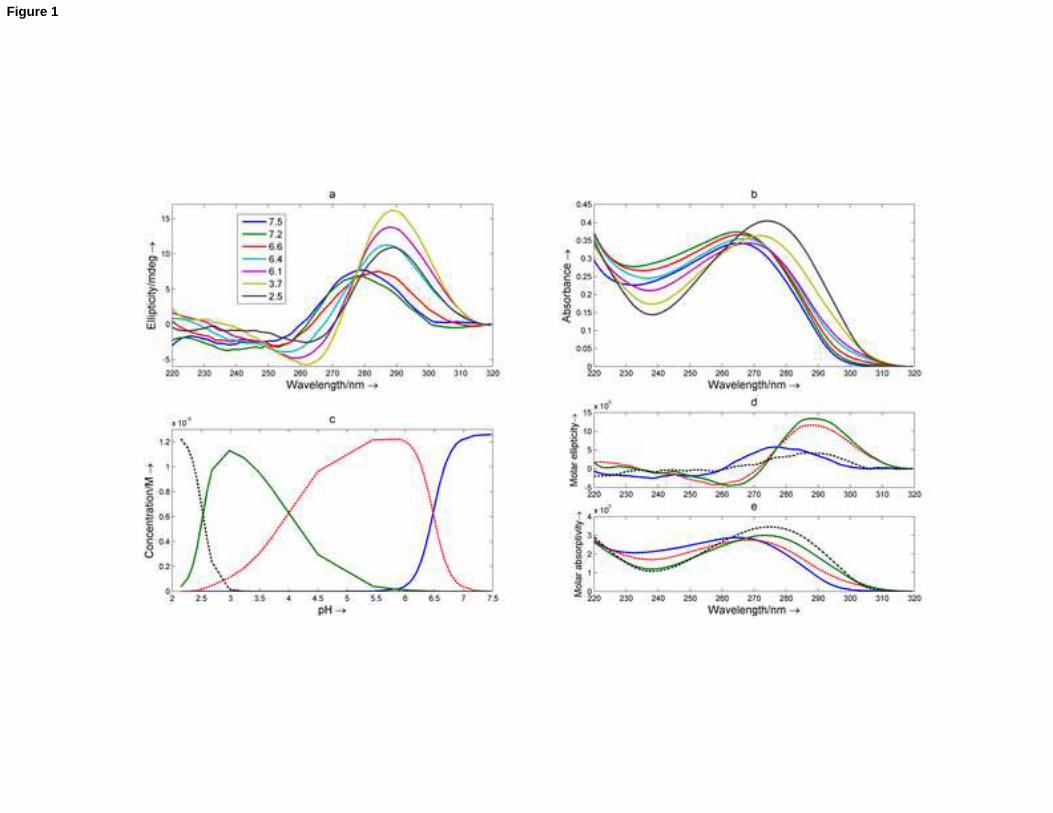
Figure 1
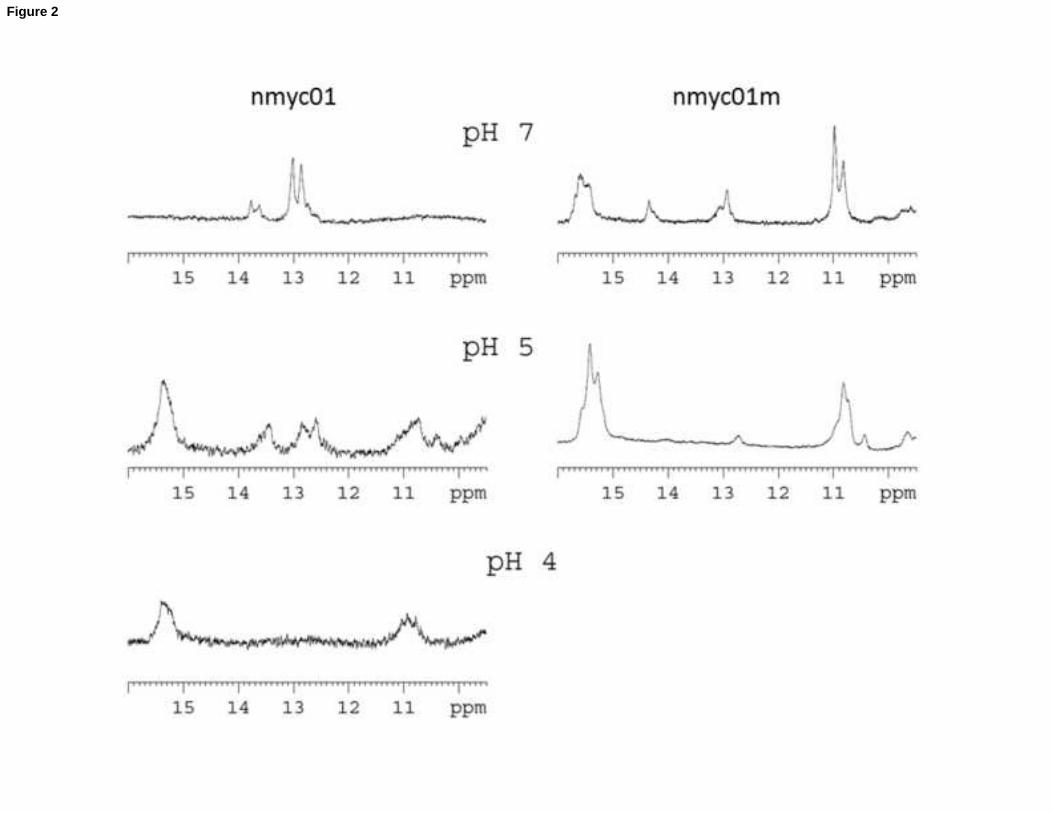
Figure 2
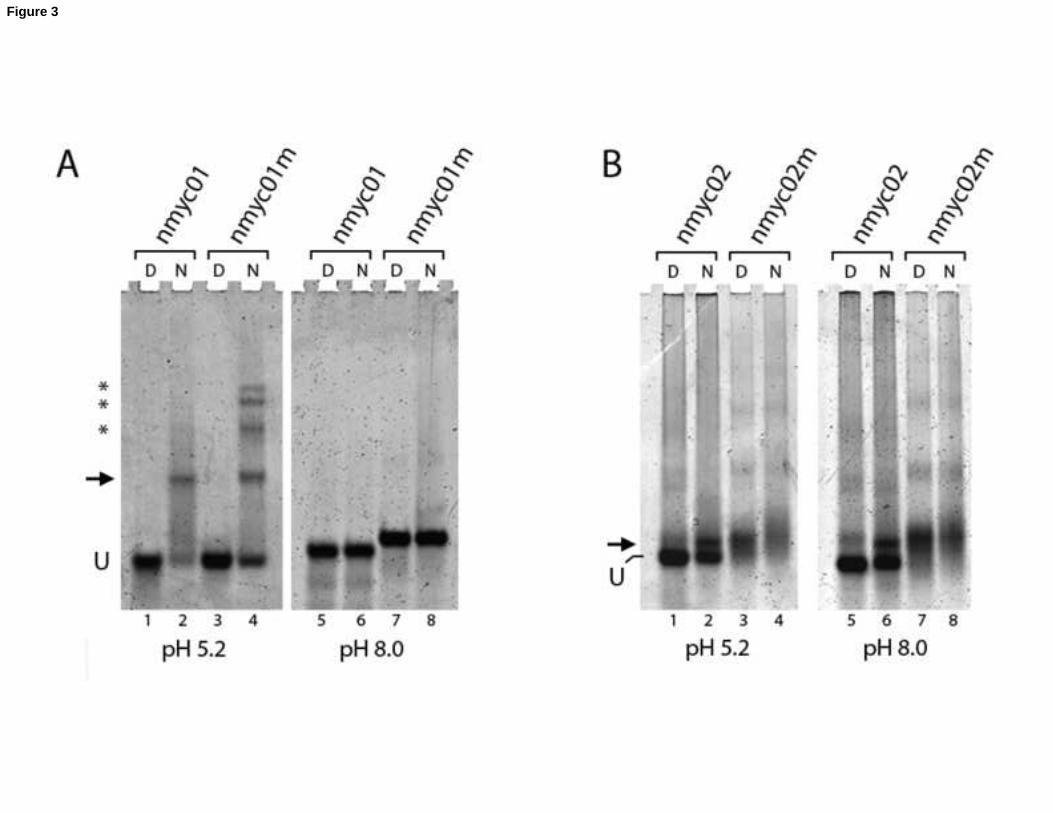
Figure 3
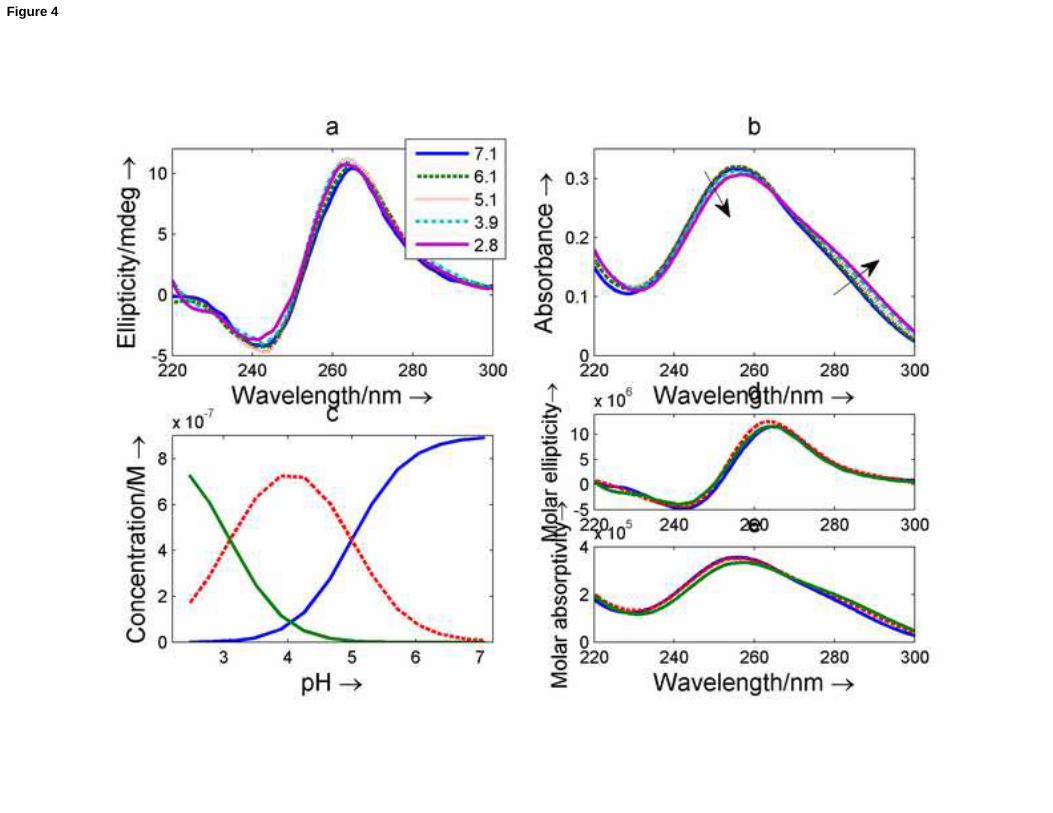
Figure 4
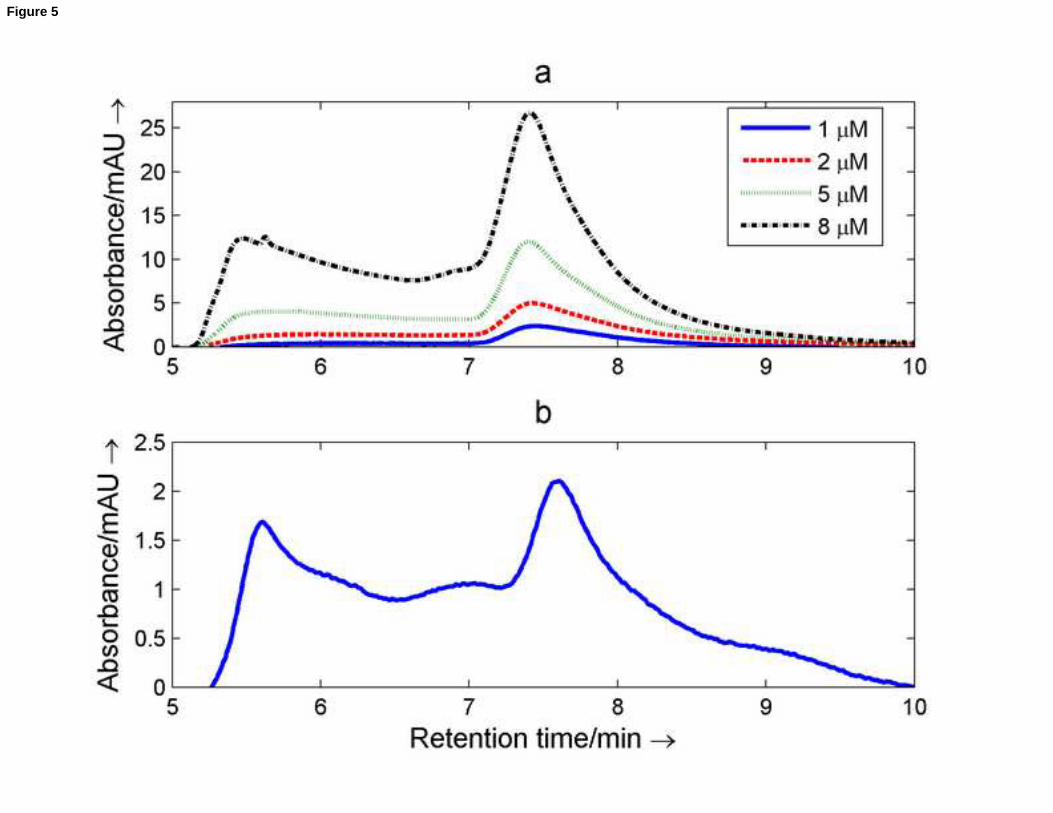
Figure 5
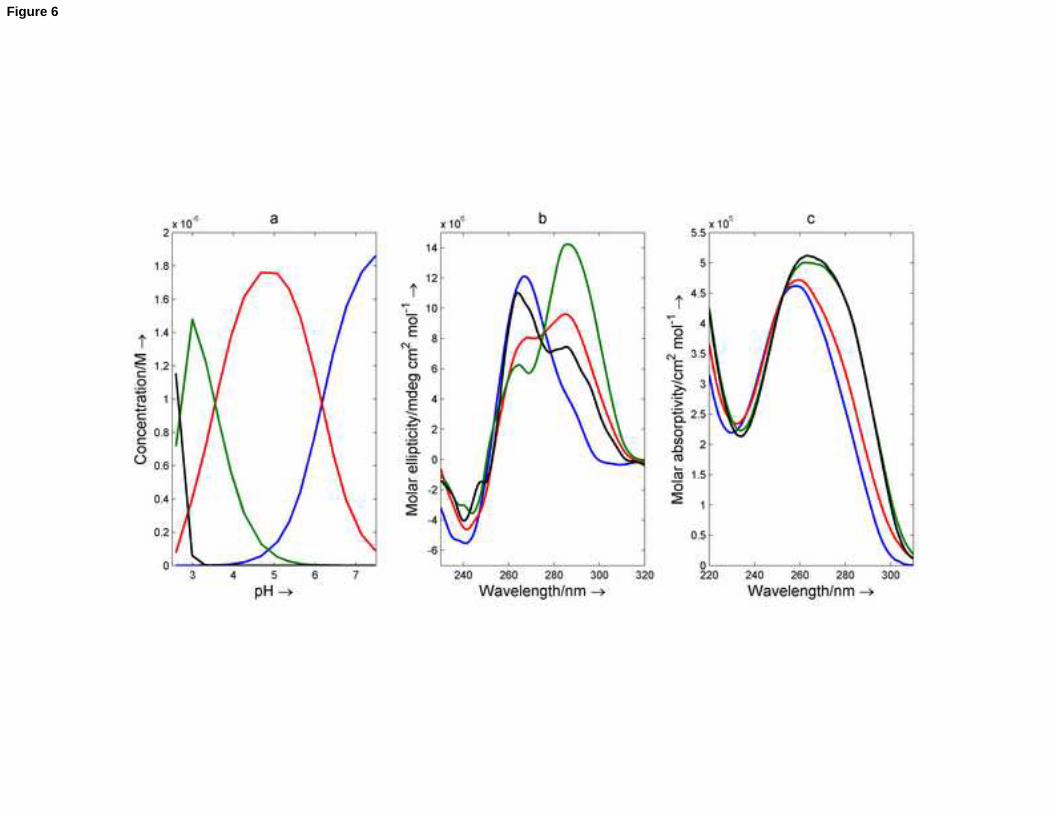
Figure 6
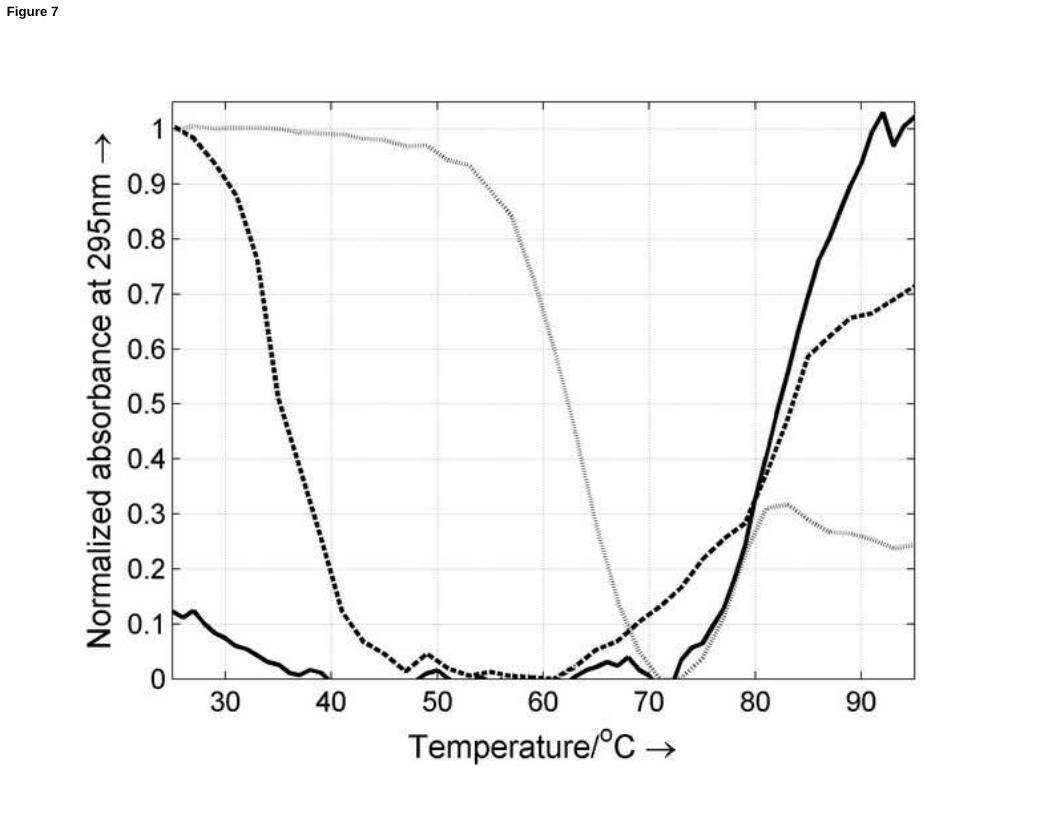
Figure 7
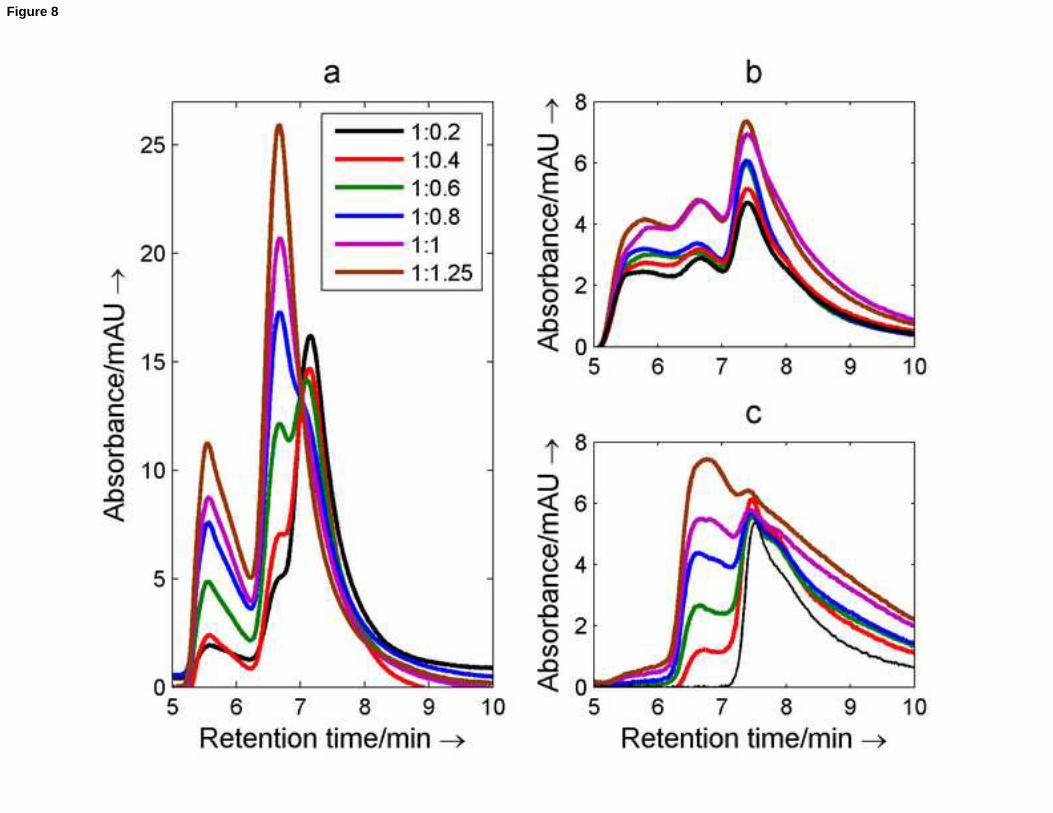
Figure 8
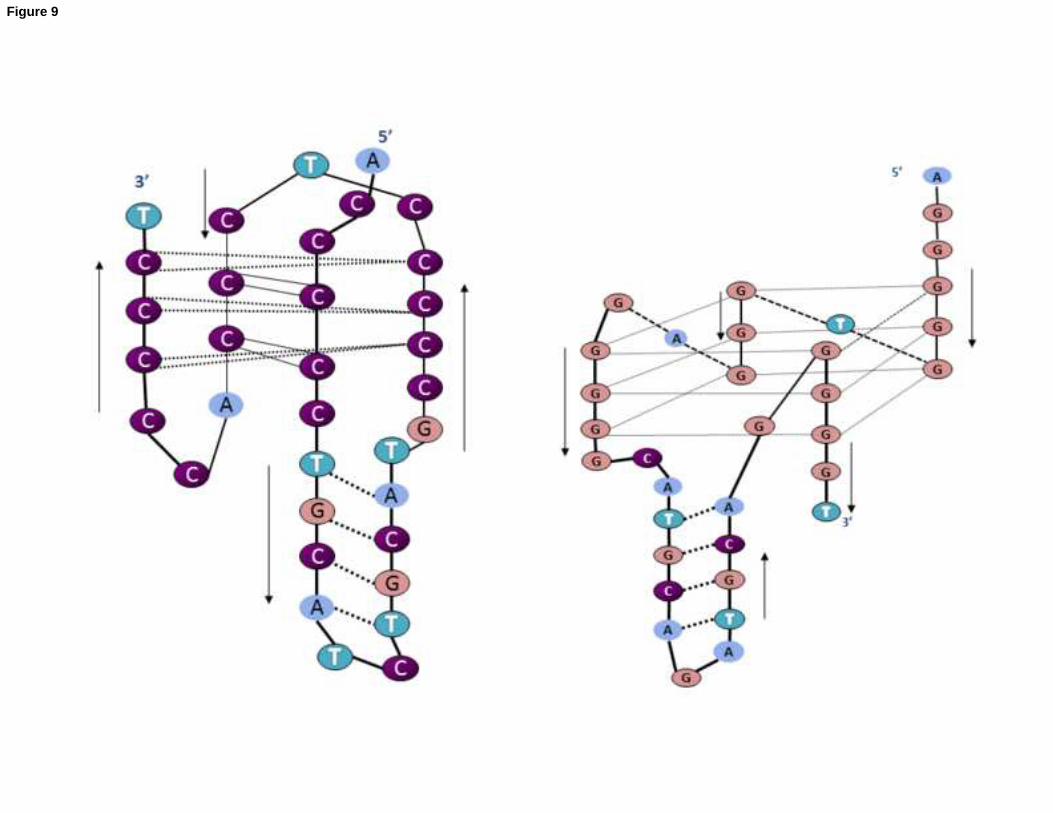
Figure 9
1
Supplementary Material
Solution equilibria of cytosine- and guanine-rich sequences near the promoter region of the n-myc gene
which contain stable hairpins within lateral loops
Sanae Benabou1, Rubén Ferreira2, Anna Aviñó2, Carlos González3, Sébastien Lyonnais4, Maria Solà4, Ramon Eritja2,
Joaquim Jaumot1, Raimundo Gargallo1*
1. Solution Equilibria and Chemometrics Group, Department of Analytical Chemistry, University of Barcelona, Diagonal 645, E-
08028 Barcelona, Spain
2. Institute for Advanced Chemistry of Catalonia (IQAC-CSIC), CIBER-BBN Networking Centre on Bioengineering, Biomaterials and
Nanomedicine, Jordi Girona 18-26, E-08034 Barcelona, Spain
3. Institute of Physical Chemistry “Rocasolano”, CSIC, Serrano 119, E-28006 Madrid, Spain
4. Molecular Biology Institute of Barcelona (IBMB-CSIC), Baldiri Reixac 4-8, 08028 Barcelona, Spain
Contents:
S1. Acid-base titration of nmyc01 sequence.
S2. Melting experiment of nmyc01 at pH 6.1.
S3. Tm values determined against pH. Black diamond: myc01; black square: nmyc02.
S4. Effect of added KCl on nmyc01 i-motif structure.
S5. Acid-base titration of nmyc02 sequence.
S6. NMR spectra of nmyc02 and nmyc02m sequences.
S7. Melting experiment of nmyc02 sequence at pH 6.1.
S8. ESI-MS spectrum of the nmyc02 sequence.
S9. Kinetics of the formation of Watson-Crick duplex.
S10. Acid-base titration of an equimolar mixture of nmyc02 and nmyc01 sequences.
Supplementary Material (for online publication)Click here to download Supplementary Material (for online publication): Supplementary Material_v4.docx
2
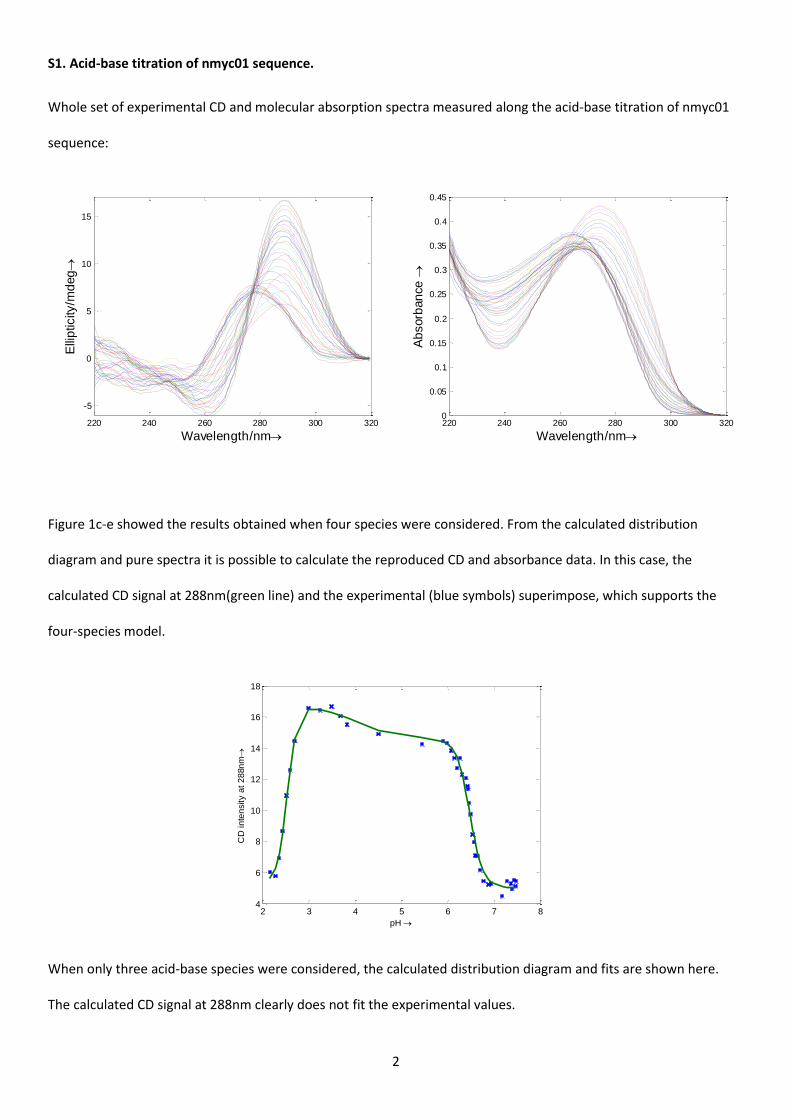
S1. Acid-base titration of nmyc01 sequence.
Whole set of experimental CD and molecular absorption spectra measured along the acid-base titration of nmyc01
sequence:
Figure 1c-e showed the results obtained when four species were considered. From the calculated distribution
diagram and pure spectra it is possible to calculate the reproduced CD and absorbance data. In this case, the
calculated CD signal at 288nm(green line) and the experimental (blue symbols) superimpose, which supports the
four-species model.
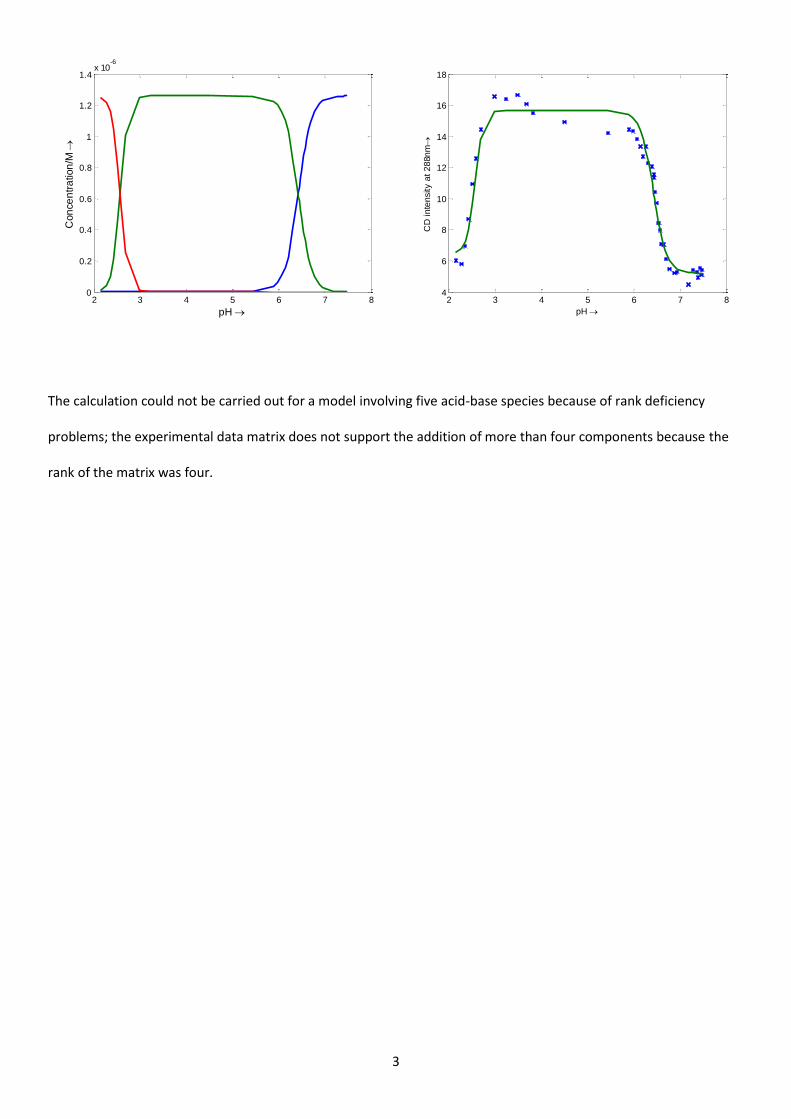
When only three acid-base species were considered, the calculated distribution diagram and fits are shown here.
The calculated CD signal at 288nm clearly does not fit the experimental values.
220 240 260 280 300 320
-5
0
5
10
15
Wavelength/nm
Elli
pticity/m
deg
220 240 260 280 300 3200
0.05
0.1
0.15
0.2
0.25
0.3
0.35
0.4
0.45
Wavelength/nm
Ab
sorb
an
ce
2 3 4 5 6 7 84
6
8
10
12
14
16
18
pH
CD
in
ten
sity a
t 2
88n
m
3
The calculation could not be carried out for a model involving five acid-base species because of rank deficiency
problems; the experimental data matrix does not support the addition of more than four components because the
rank of the matrix was four.
2 3 4 5 6 7 80
0.2
0.4
0.6
0.8
1
1.2
1.4x 10
-6
pH
Con
ce
ntr
ation
/M
2 3 4 5 6 7 84
6
8
10
12
14
16
18
pH
CD
in
ten
sity a
t 2
88n
m
4
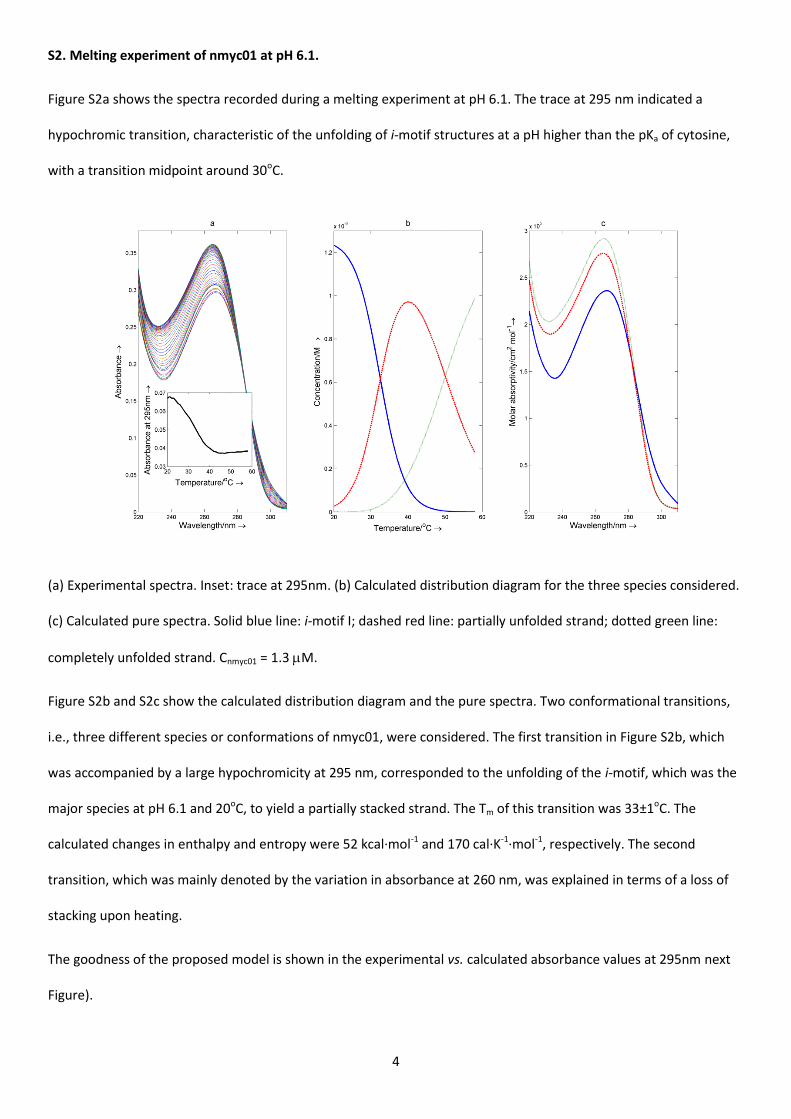
S2. Melting experiment of nmyc01 at pH 6.1.
Figure S2a shows the spectra recorded during a melting experiment at pH 6.1. The trace at 295 nm indicated a
hypochromic transition, characteristic of the unfolding of i-motif structures at a pH higher than the pKa of cytosine,
with a transition midpoint around 30oC.
(a) Experimental spectra. Inset: trace at 295nm. (b) Calculated distribution diagram for the three species considered.
(c) Calculated pure spectra. Solid blue line: i-motif I; dashed red line: partially unfolded strand; dotted green line:
completely unfolded strand. Cnmyc01 = 1.3 M.
Figure S2b and S2c show the calculated distribution diagram and the pure spectra. Two conformational transitions,
i.e., three different species or conformations of nmyc01, were considered. The first transition in Figure S2b, which
was accompanied by a large hypochromicity at 295 nm, corresponded to the unfolding of the i-motif, which was the
major species at pH 6.1 and 20oC, to yield a partially stacked strand. The Tm of this transition was 33±1oC. The
calculated changes in enthalpy and entropy were 52 kcal·mol-1 and 170 cal·K-1·mol-1, respectively. The second
transition, which was mainly denoted by the variation in absorbance at 260 nm, was explained in terms of a loss of
stacking upon heating.
The goodness of the proposed model is shown in the experimental vs. calculated absorbance values at 295nm next
Figure).

5
From the calculated distribution diagram and pure spectra it is possible to calculate the reproduced absorbance
data. In this case, the experimental trace at 295nm (blue symbols) is superimposed with the calculated traces at
295nm when three (red line) or two (green line) conformations were considered. The model which best fits the
experimental data is that considering three conformations.
20 25 30 35 40 45 50 55 60
0.04
0.045
0.05
0.055
0.06
0.065
0.07
Temperature/oC
Abso
rba
nce a
t 29
5nm
6
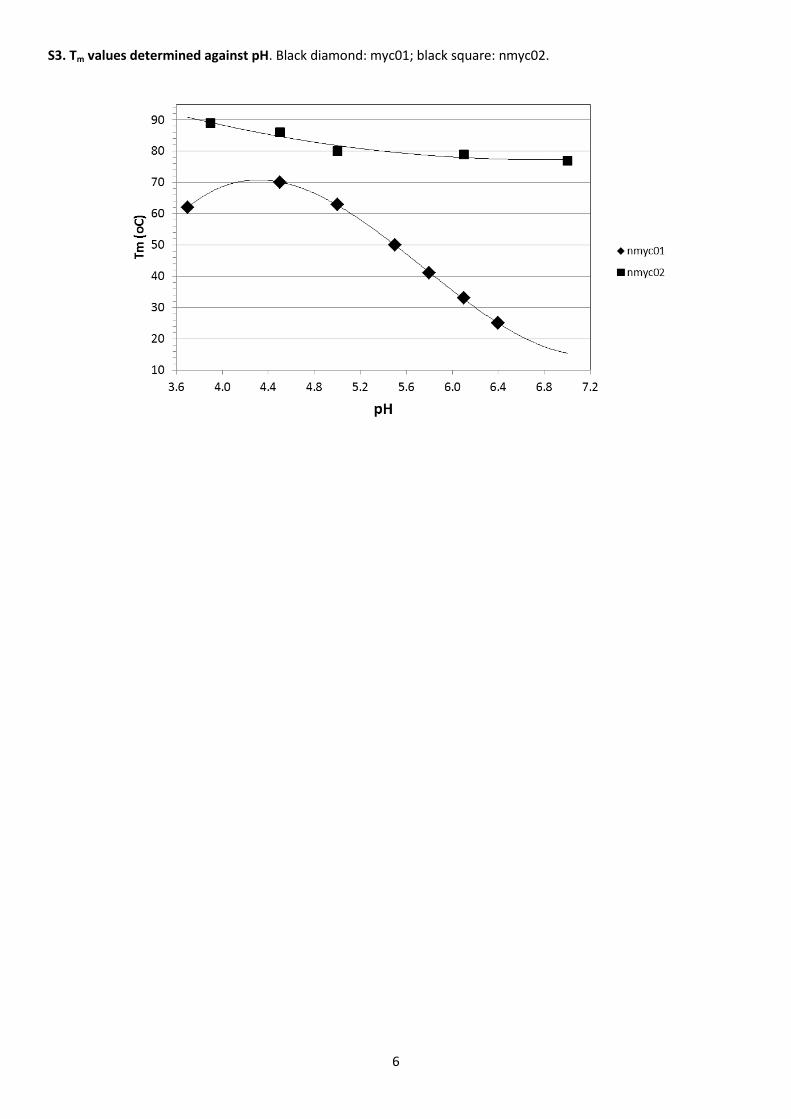
S3. Tm values determined against pH. Black diamond: myc01; black square: nmyc02.
7
S4. Effect of added KCl on nmyc01 i-motif structure.
CDNA was 1.25 µM, 25oC, 20 mM phosphate buffer, pH 6.1.
The Tm value at pH 6.1 increased from 33oC (at 150 mM KCl, Figure S2) to 52oC (without added salt, see next figure).
220 240 260 280 300 320 340-10
-5
0
5
10
15
20
Wavelength/ nm
Elli
pticity/
mde
g
0 mM
14 mM
28 mM
55 mM
10 20 30 40 50 60 700.11
0.115
0.12
0.125
0.13
0.135
0.14
0.145
0.15
0.155
0.16
Temperature/oC
Ab
so
rba
nce
at 2
95
nm
20 30 40 50 60 70
0
0.2
0.4
0.6
0.8
1
Temperature/oC
Fra
ctio
n o
f fo
lde
d D
NA
3.02 3.04 3.06 3.08 3.1 3.12
x 10-3
-2
-1.5
-1
-0.5
0
0.5
1
1.5
2
T-1
/K-1
ln(K
fold
ing)
Intramolecular equilibria
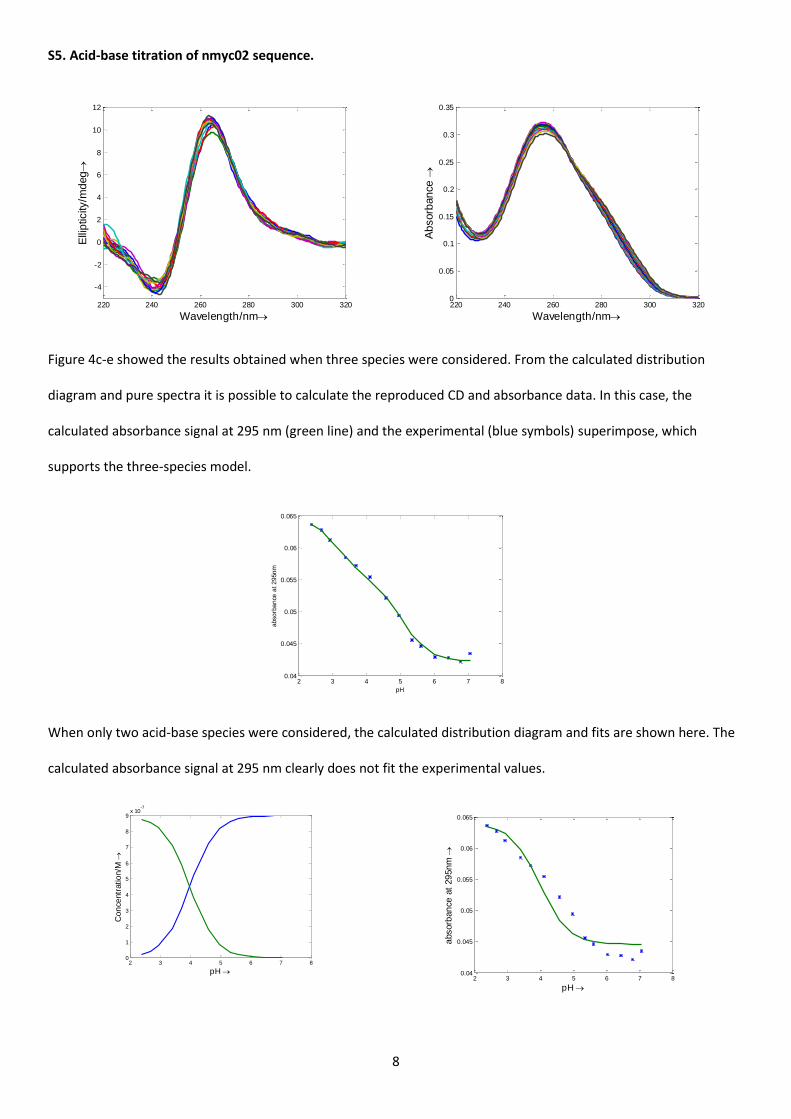
8
S5. Acid-base titration of nmyc02 sequence.
Figure 4c-e showed the results obtained when three species were considered. From the calculated distribution
diagram and pure spectra it is possible to calculate the reproduced CD and absorbance data. In this case, the
calculated absorbance signal at 295 nm (green line) and the experimental (blue symbols) superimpose, which
supports the three-species model.
When only two acid-base species were considered, the calculated distribution diagram and fits are shown here. The
calculated absorbance signal at 295 nm clearly does not fit the experimental values.
220 240 260 280 300 320
-4
-2
0
2
4
6
8
10
12
Wavelength/nm
Elli
pticity/m
deg
220 240 260 280 300 3200
0.05
0.1
0.15
0.2
0.25
0.3
0.35
Wavelength/nm
Ab
sorb
an
ce
2 3 4 5 6 7 80.04
0.045
0.05
0.055
0.06
0.065
pH
abso
rba
nce
at
29
5n
m
2 3 4 5 6 7 80
1
2
3
4
5
6
7
8
9x 10
-7
pH
Co
nce
ntr
atio
n/M
2 3 4 5 6 7 80.04
0.045
0.05
0.055
0.06
0.065
pH
absorb
an
ce
at
29
5n
m
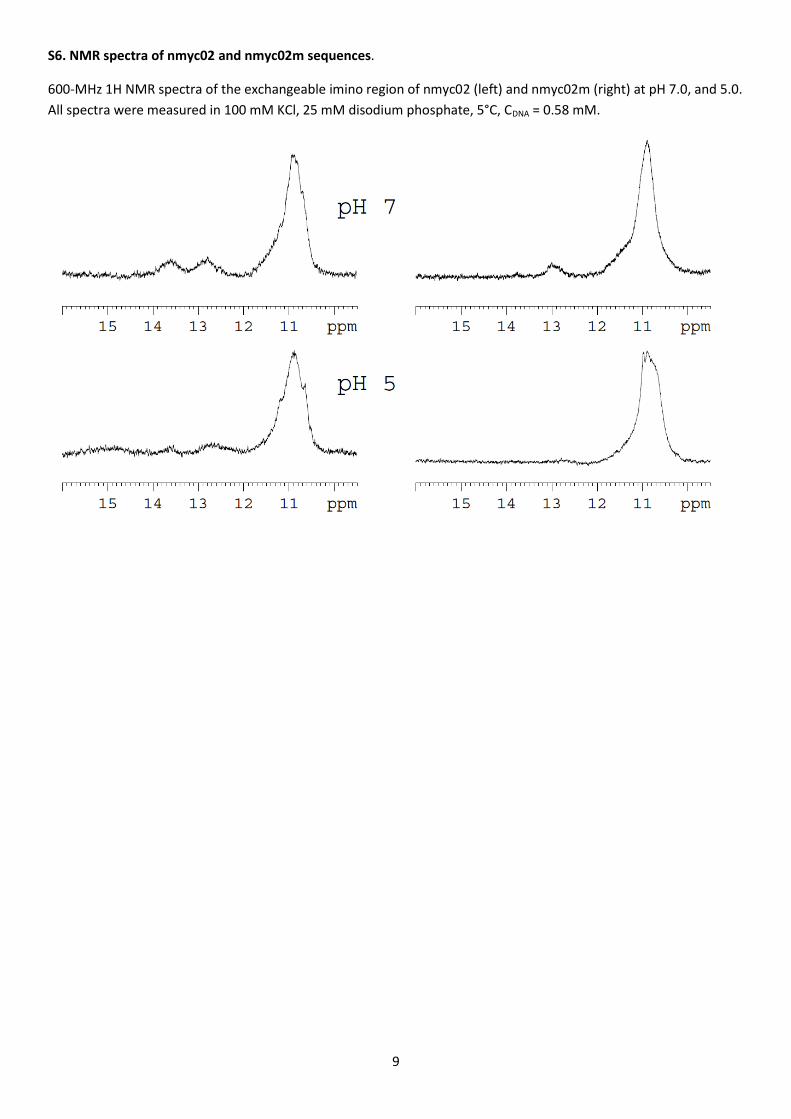
9
S6. NMR spectra of nmyc02 and nmyc02m sequences.
600-MHz 1H NMR spectra of the exchangeable imino region of nmyc02 (left) and nmyc02m (right) at pH 7.0, and 5.0.
All spectra were measured in 100 mM KCl, 25 mM disodium phosphate, 5°C, CDNA = 0.58 mM.
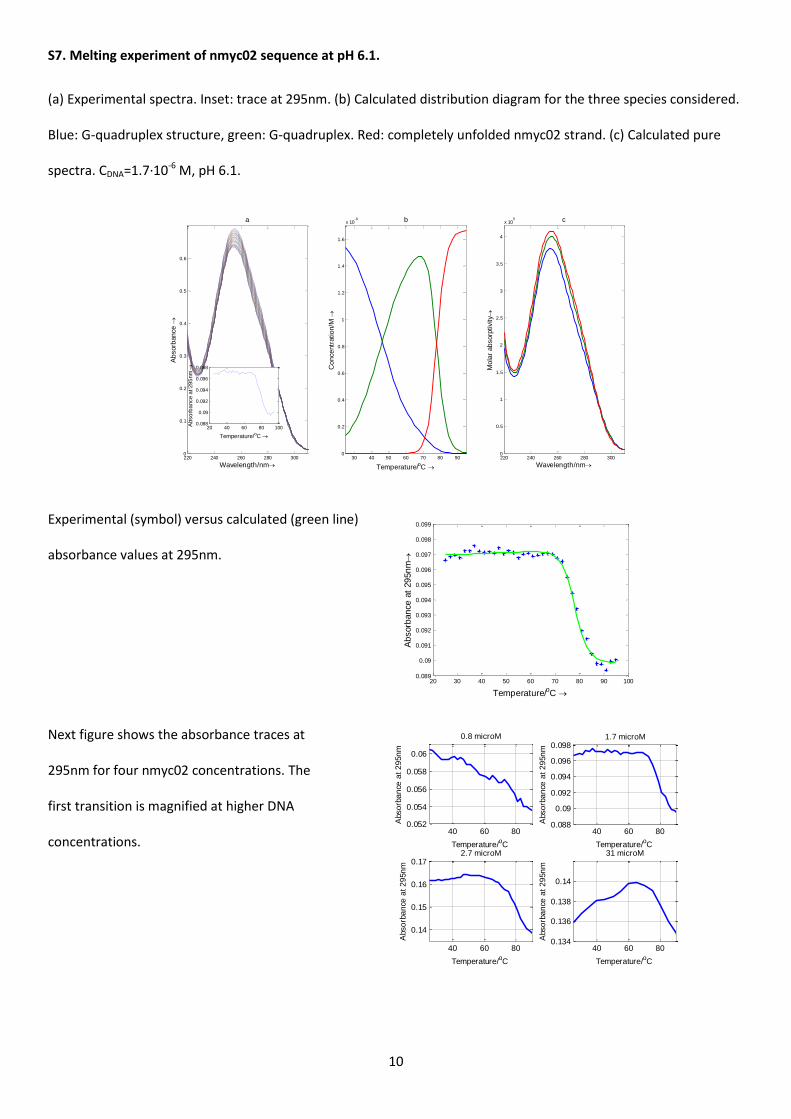
10
S7. Melting experiment of nmyc02 sequence at pH 6.1.
(a) Experimental spectra. Inset: trace at 295nm. (b) Calculated distribution diagram for the three species considered.
Blue: G-quadruplex structure, green: G-quadruplex. Red: completely unfolded nmyc02 strand. (c) Calculated pure
spectra. CDNA=1.7·10-6 M, pH 6.1.
Experimental (symbol) versus calculated (green line)
absorbance values at 295nm.
Next figure shows the absorbance traces at
295nm for four nmyc02 concentrations. The
first transition is magnified at higher DNA
concentrations.
220 240 260 280 3000
0.1
0.2
0.3
0.4
0.5
0.6
Wavelength/nm
Ab
sorb
an
ce
a
20 40 60 80 1000.088
0.09
0.092
0.094
0.096
0.098
Temperature/oC
Abso
rba
nce a
t 29
5nm
30 40 50 60 70 80 900
0.2
0.4
0.6
0.8
1
1.2
1.4
1.6
x 10-6
Temperature/oC
Co
nce
ntr
atio
n/M
b
220 240 260 280 3000
0.5
1
1.5
2
2.5
3
3.5
4
x 105 c
Wavelength/nm
Mo
lar
ab
sorp
tivity
20 30 40 50 60 70 80 90 1000.089
0.09
0.091
0.092
0.093
0.094
0.095
0.096
0.097
0.098
0.099
Temperature/oC
Ab
sorb
an
ce
at
29
5n
m
40 60 800.052
0.054
0.056
0.058
0.06
0.8 microM
Temperature/oC
Abso
rba
nce
at
29
5n
m
40 60 800.088
0.09
0.092
0.094
0.096
0.098
Temperature/oC
Abso
rba
nce
at
29
5n
m
1.7 microM
40 60 80
0.14
0.15
0.16
0.17
Temperature/oC
Abso
rba
nce
at
29
5n
m
2.7 microM
40 60 800.134
0.136
0.138
0.14
31 microM
Abso
rba
nce
at
29
5n
m
Temperature/oC
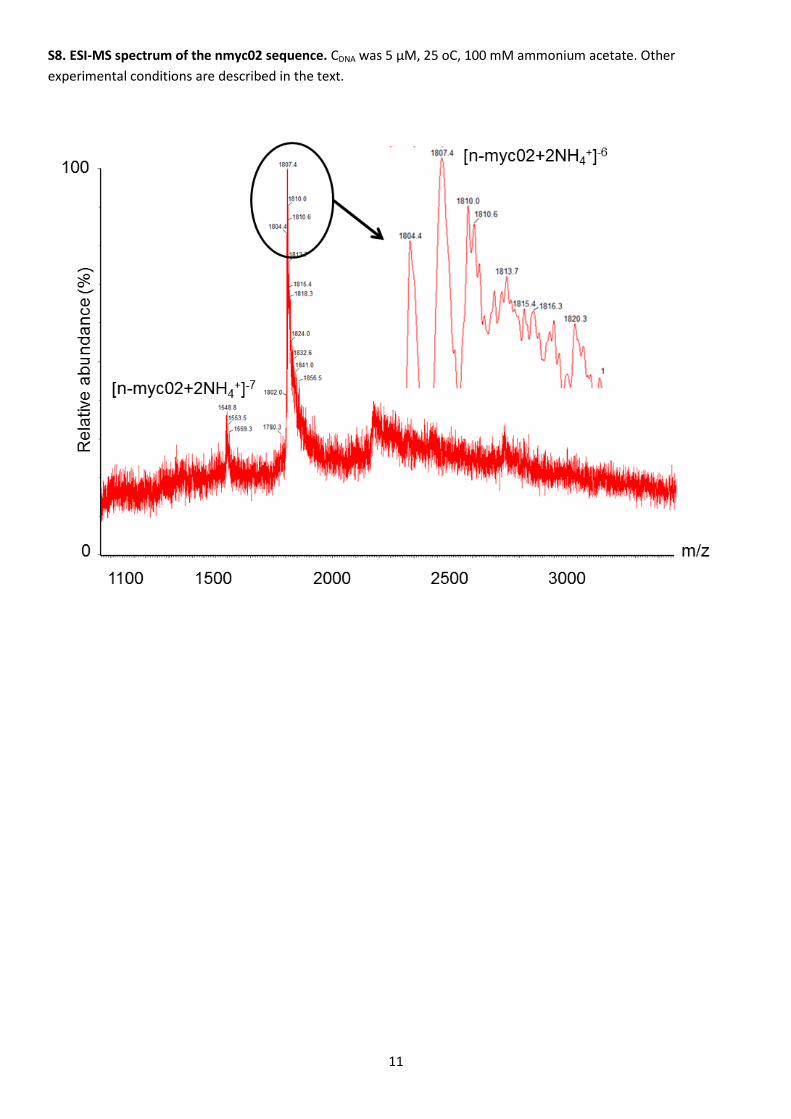
11
S8. ESI-MS spectrum of the nmyc02 sequence. CDNA was 5 µM, 25 oC, 100 mM ammonium acetate. Other
experimental conditions are described in the text.
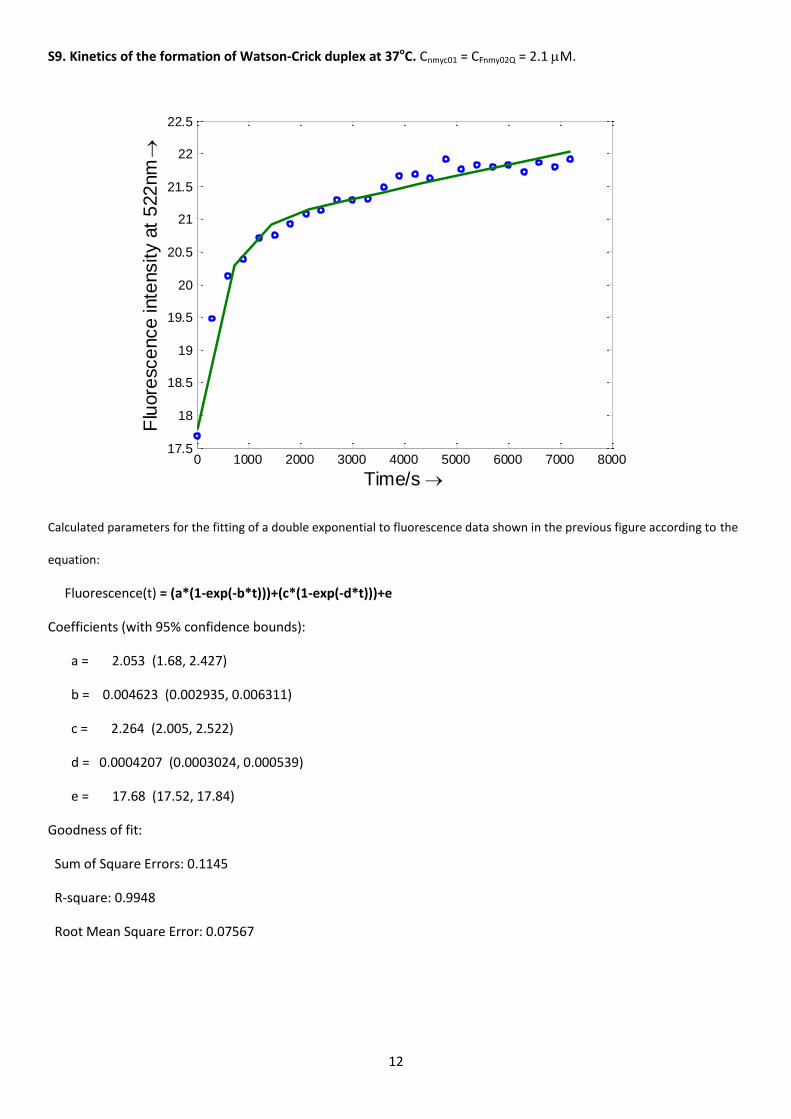
12
S9. Kinetics of the formation of Watson-Crick duplex at 37oC. Cnmyc01 = CFnmy02Q = 2.1 M.
Calculated parameters for the fitting of a double exponential to fluorescence data shown in the previous figure according to the
equation:
Fluorescence(t) = (a*(1-exp(-b*t)))+(c*(1-exp(-d*t)))+e
Coefficients (with 95% confidence bounds):
a = 2.053 (1.68, 2.427)
b = 0.004623 (0.002935, 0.006311)
c = 2.264 (2.005, 2.522)
d = 0.0004207 (0.0003024, 0.000539)
e = 17.68 (17.52, 17.84)
Goodness of fit:
Sum of Square Errors: 0.1145
R-square: 0.9948
Root Mean Square Error: 0.07567
0 1000 2000 3000 4000 5000 6000 7000 800017.5
18
18.5
19
19.5
20
20.5
21
21.5
22
22.5
Time/s
Flu
ore
sce
nce inte
nsity a
t 5
22
nm

13
S10. Acid-base titration of an equimolar mixture of nmyc02 and nmyc01 sequences.
(a) Selected set of CD spectra. (b) Molecular absorption spectra. (c) Fit for CD signal at 288 nm. (d) Fit for absorbance
data at 280 nm. Blue: experimental symbols. Green line: fitted data according to the proposed model.
a
b
c
d
220 240 260 280 300 320
-10
-5
0
5
10
15
20
25
Wavelength/nm
Elli
pticity/m
deg
7.5
6.8
6.0
5.4
4.7
3.9
3.3
2.6
220 240 260 280 300 3200
0.1
0.2
0.3
0.4
0.5
0.6
0.7
0.8
0.9
1
Wavelength/nm
Ab
sorb
an
ce
2 3 4 5 6 7 86
8
10
12
14
16
18
20
22
24
26
pH
CD
at
28
8n
m /
md
eg
2 3 4 5 6 7 80.5
0.55
0.6
0.65
0.7
0.75
0.8
0.85
0.9
pH
Ab
sorb
an
ce
at
28
0n
m
Related Documents


