Page | S1 Supporting Information of Solute Coupled Diffusion in Osmotically Driven Membrane Processes Nathan T. Hancock and Tzahi Y. Cath* Environmental Science and Engineering Division, Colorado School of Mines, Golden, Colorado 80401, USA. *Corresponding author. [email protected] , phone 303-273-3402, fax 303-273-3413 Submission: April 14, 2009 Revision: June 11, 2009 Submitted to Environmental Science and Technology Contents: S1. Solvent Transport in FO (pages S1 & S2) S2. FO Membrane Structure and Performance Comparison (pages S2 & S3) S3. Description of FO Bench-Scale Apparatus Used in the Current Study (pages S3 & S5) S4. Solution Chemistries and Properties (pages S5 to S6) S5. Calculation of Mass Transport (pages S6 to S7) S6. Supplemental Description of Experimental Procedures (pages S7 to S10) S7. Bi-directional Hydrogen and Hydroxide Diffusion (pages S10 to S11) Figures: S1. Solute concentration profile across an asymmetric membrane in FO. S2. SEM micrographs of a cross section of CTA-1 CTA-2 FO membranes. S3. Schematic drawing of the FO bench scale system used in the current study. S4. Physicochemical properties of three draw solution solutes. S5. Influence of background NaCl concentration on measurement accuracy during ICP- AES analysis of metal ions of interest. S6. Ammonia concentration measured as function of ammonium dose for various background concentrations of NaCl. S7. Apparent average flux of hydrogen ions.

Welcome message from author
This document is posted to help you gain knowledge. Please leave a comment to let me know what you think about it! Share it to your friends and learn new things together.
Transcript
Page | S1
Supporting Information
of
Solute Coupled Diffusion in Osmotically Driven Membrane Processes
Nathan T. Hancock and Tzahi Y. Cath*
Environmental Science and Engineering Division, Colorado School of Mines, Golden, Colorado 80401, USA.
*Corresponding author. [email protected], phone 303-273-3402, fax 303-273-3413
Submission: April 14, 2009
Revision: June 11, 2009
Submitted to Environmental Science and Technology
Contents: S1. Solvent Transport in FO (pages S1 & S2) S2. FO Membrane Structure and Performance Comparison (pages S2 & S3) S3. Description of FO Bench-Scale Apparatus Used in the Current Study (pages S3 & S5) S4. Solution Chemistries and Properties (pages S5 to S6) S5. Calculation of Mass Transport (pages S6 to S7) S6. Supplemental Description of Experimental Procedures (pages S7 to S10) S7. Bi-directional Hydrogen and Hydroxide Diffusion (pages S10 to S11)
Figures: S1. Solute concentration profile across an asymmetric membrane in FO. S2. SEM micrographs of a cross section of CTA-1 CTA-2 FO membranes. S3. Schematic drawing of the FO bench scale system used in the current study. S4. Physicochemical properties of three draw solution solutes. S5. Influence of background NaCl concentration on measurement accuracy during ICP-
AES analysis of metal ions of interest. S6. Ammonia concentration measured as function of ammonium dose for various
background concentrations of NaCl. S7. Apparent average flux of hydrogen ions.

Page | S2
S1. Solvent Transport in FO
Water (solvent) flux in FO is driven by the chemical potential difference between two
solutions, which is manifested in the osmotic pressure differential (Δπ) across a thin, semi-
permeable membrane between a hypertonic draw solution and a feed solution. The osmotic
pressure of a solution is defined as:
€
π =RTVA
ln aA( ) (S1-1)
where R is the ideal gas constant, T is the absolute temperature, VA is the molar volume of the
solution, and aA is the activity of the solution (1). Water flux (Jw) in FO, RO, and pressure-
retarded osmosis (PRO) is commonly expressed as:
€
Jw = A(ΔP −σΔπ ) (S1-2)
where A is the water permeability coefficient of the membrane, σ is the reflection coefficient, and
ΔP is the trans-membrane hydraulic pressure. ΔP in FO is negligible, and it must be greater than
σΔπ in RO in order to produce purified water.
Yet, water flux in osmotically driven membrane processes is not a linear function of the
osmotic pressure difference between the bulk solutions. The non-linearity of osmotic flow in FO,
and the relatively low water flux obtained with high driving forces, has been the focus of
intensive research (2-6). These studies represent the current understanding of solvent mass
transport in osmotically driven membrane processes, and their main conclusion is that the
diminishing permeate flow with increasing osmotic driving force is the result of concentration
polarization (CP) effects; both concentrative external CP, but primarily dilutive internal CP. The
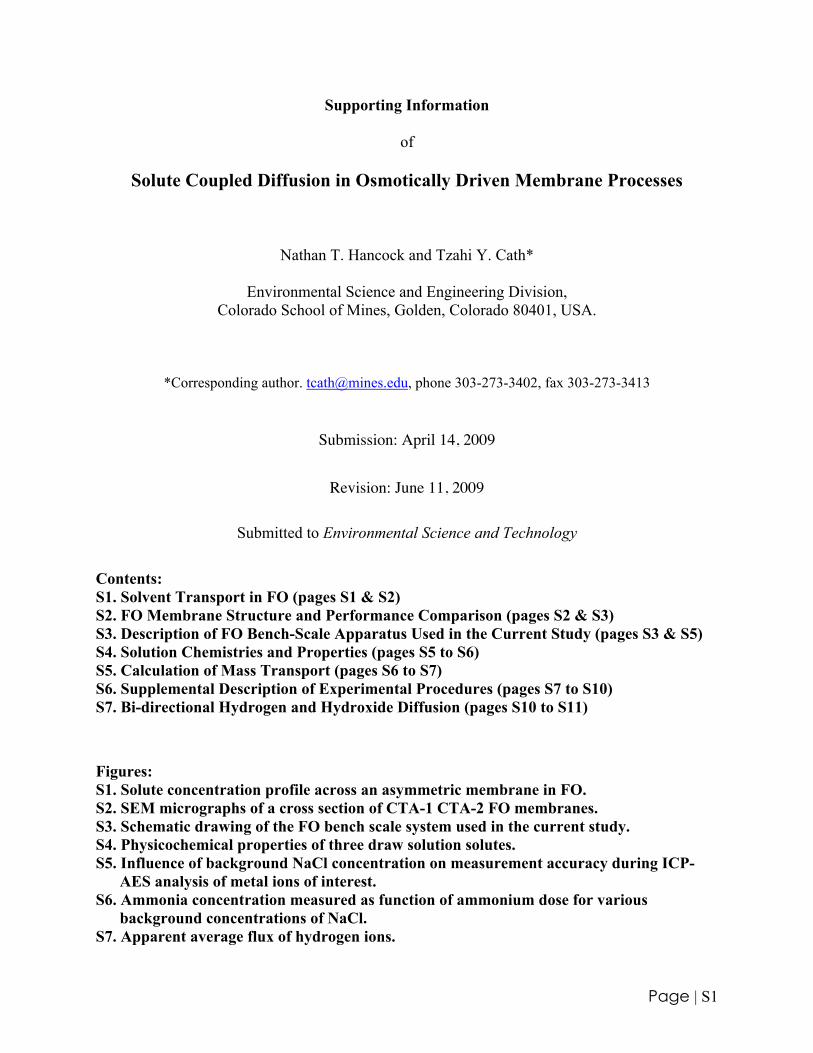
concentration profile across an asymmetric FO membrane is illustrated in Figure S1. C1 and C5
are the concentrations of the bulk feed and draw solutions, respectively; C2 and C4 are the
concentrations at the feed-membrane and draw solution-membrane interfaces (resulting from
external CP), respectively; and C3 is the concentration at the active layer-support layer interface
(7). Few studies have also considered the influence of osmotic deswelling on the non-linearity of
osmotic flow (5, 8); however, CP effects are generally considered to be the dominant process
that reduces water flux at higher driving forces (9).
Page | S3
Figure S1. Solute concentration profile across an asymmetric membrane in FO (7).
Past studies (5, 10, 11) provided important insight into the influence of both dilutive
internal and concentrative external CP on water flux. Eq. S1-3 correlates water flux with
hydrodynamic and diffusive mass transfer coefficients to account for dilutive internal and
concentrative external CP.
€
Jw = A πD,b exp −JwK( ) −π F ,b expJwk
(S1-3)
where πD,b is the osmotic pressure of the bulk draw solution, πF,b is the osmotic pressure of the
bulk feed, and both K and k are mass transfer coefficients associated with the diffusive and the
hydrodynamic conditions within the membrane support and at the membrane active layer,
respectively. Solute diffusion is explicitly considered negligible in the development of Eq. S1-3;
furthermore, the connection between reverse solute diffusion and the effects of external
concentrative and dilutive CP were not discussed in previous studies.
S2. FO Membrane Structure and Performance Comparison
SEM micrographs of the CTA-1 and CTA-2 membranes are shown in Figure S2. These
images illustrate that CTA-1 has a typical thin film composite structure while CTA-2 has a
unique structure with cellulose triacetate polymer cast directly onto a woven polymeric support
mesh (9). A recent study by Achilli et al. (12) reported baseline water flux and reverse NaCl
diffusion for CTA-1 and CTA-2 membranes (denoted as Membrane C and Membrane B,
respectively) with a deionized water feed solution and NaCl draw solution under slightly
C1
Draw Solution
active layer
Jw
Δπbulk
support layer
Feed
Js
Δπm
Δπeff
C4
C2
C3
C5

Page | S4
elevated temperature (23˚C). The lower selectivity observed for the CTA-2 membrane may be
attributed to its thinner cross section and its ability to moderate internal boundary layer effects,
thereby maximizing permeability and mitigating dilutive internal CP. Pure water permeability
(deionized water feed) through the CTA-2 membrane as a function of hydraulic pressure was
reported in two previous studies (6, 9). In another study, salt rejection by the CTA-2 membrane
was tested under hydraulic pressure and NaCl rejection of 95% was achieved (13).
Surface charge (zeta potential) of the FO membranes was measured with an electrokinetic
analyzer (SurPass, Anton Paar, Graz, Austria). The surface of both membranes is negatively
charged in solution pHs greater than 4.
Figure S2. SEM micrographs of a cross section of (a) CTA-1 (6) and (b) CTA-2 (9) FO membranes.
S3. Description of FO Bench-Scale Apparatus Used in the Current Study
Two FO flow cells were constructed with symmetric flow chambers on both sides of the
membrane that facilitated parallel, co-current or countercurrent flow along the membrane. The
membrane surface area in cell #1 and cell #2 were 509 and 632 cm2, respectively. Each FO cell
contains four narrow channels to minimize fluctuations in hydraulic pressure that could
adversely affect the operation and performance of the process. Turbulence-enhancement spacers
were not installed in the flow channels in order to simplifying hydrodynamic conditions and
facilitate model validation with the experimental results. Cell #1 was utilized in most
experiments conducted with the CTA-2 membrane, while both cells were operated in series
during experiments that employed the CTA-1 membrane.
(a) (b)
Page | S5
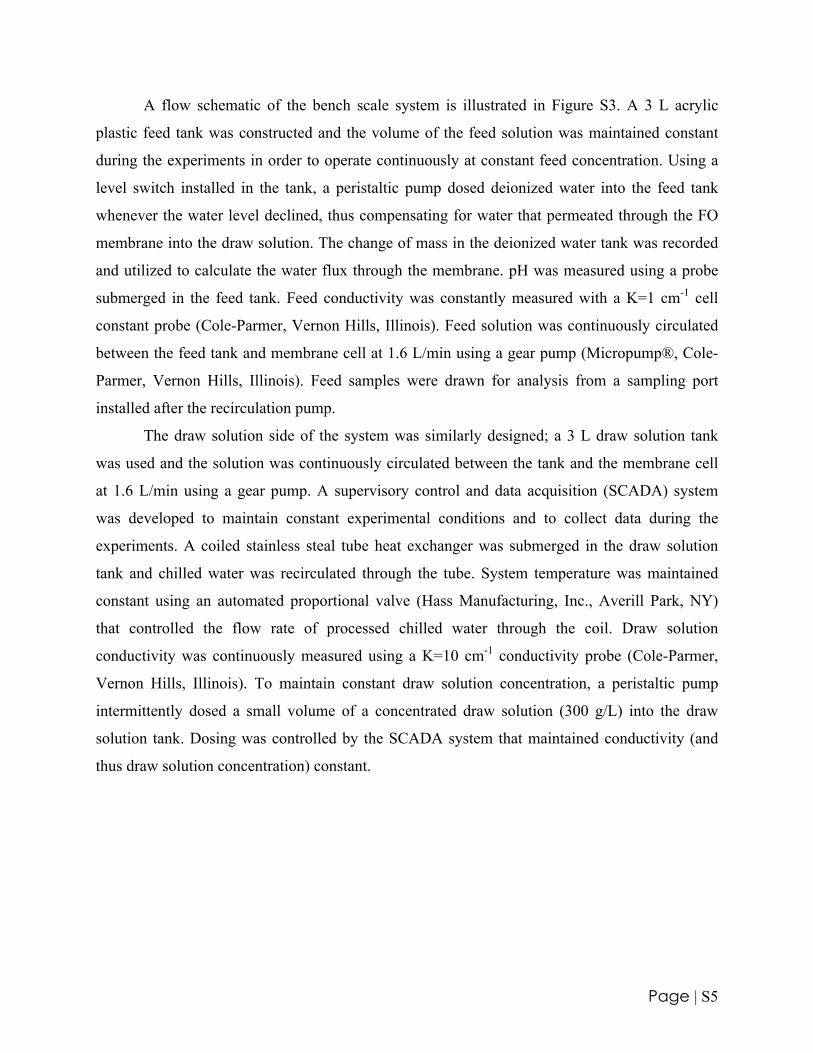
A flow schematic of the bench scale system is illustrated in Figure S3. A 3 L acrylic
plastic feed tank was constructed and the volume of the feed solution was maintained constant
during the experiments in order to operate continuously at constant feed concentration. Using a
level switch installed in the tank, a peristaltic pump dosed deionized water into the feed tank
whenever the water level declined, thus compensating for water that permeated through the FO
membrane into the draw solution. The change of mass in the deionized water tank was recorded
and utilized to calculate the water flux through the membrane. pH was measured using a probe
submerged in the feed tank. Feed conductivity was constantly measured with a K=1 cm-1 cell
constant probe (Cole-Parmer, Vernon Hills, Illinois). Feed solution was continuously circulated
between the feed tank and membrane cell at 1.6 L/min using a gear pump (Micropump®, Cole-
Parmer, Vernon Hills, Illinois). Feed samples were drawn for analysis from a sampling port
installed after the recirculation pump.
The draw solution side of the system was similarly designed; a 3 L draw solution tank
was used and the solution was continuously circulated between the tank and the membrane cell
at 1.6 L/min using a gear pump. A supervisory control and data acquisition (SCADA) system
was developed to maintain constant experimental conditions and to collect data during the
experiments. A coiled stainless steal tube heat exchanger was submerged in the draw solution
tank and chilled water was recirculated through the tube. System temperature was maintained
constant using an automated proportional valve (Hass Manufacturing, Inc., Averill Park, NY)
that controlled the flow rate of processed chilled water through the coil. Draw solution
conductivity was continuously measured using a K=10 cm-1 conductivity probe (Cole-Parmer,
Vernon Hills, Illinois). To maintain constant draw solution concentration, a peristaltic pump
intermittently dosed a small volume of a concentrated draw solution (300 g/L) into the draw
solution tank. Dosing was controlled by the SCADA system that maintained conductivity (and
thus draw solution concentration) constant.

Page | S6
Figure S3. Schematic drawing of the FO bench scale system used in the current study.
S4. Solution Chemistries and Properties
Salts were primarily acquired from Mallinckrodt Baker (Phillipsburg, NJ). These include
HCl, H3BO3, NH4OH, MgSO4⋅7H2O, MgCl2⋅6H2O, CaCl2⋅2H2O, and CaSO4⋅½H2O. K2SO4 and
Na2SiO3 were acquired from J.T. Baker, Inc. (Phillipsburg, NJ); Ba(NO3)2 and Na2SO4 was
acquired from Fisher Scientific (El Monte, CA); and NH4HCO3 was acquired from Sigma-
Aldrich (St. Louis, MO). NaCl was used in most experiments as solute for the draw solution. It
was acquired from Sigma-Aldrich/Fluka (Buchs, Switzerland) and was chosen because of its
exceptional chemical purity.
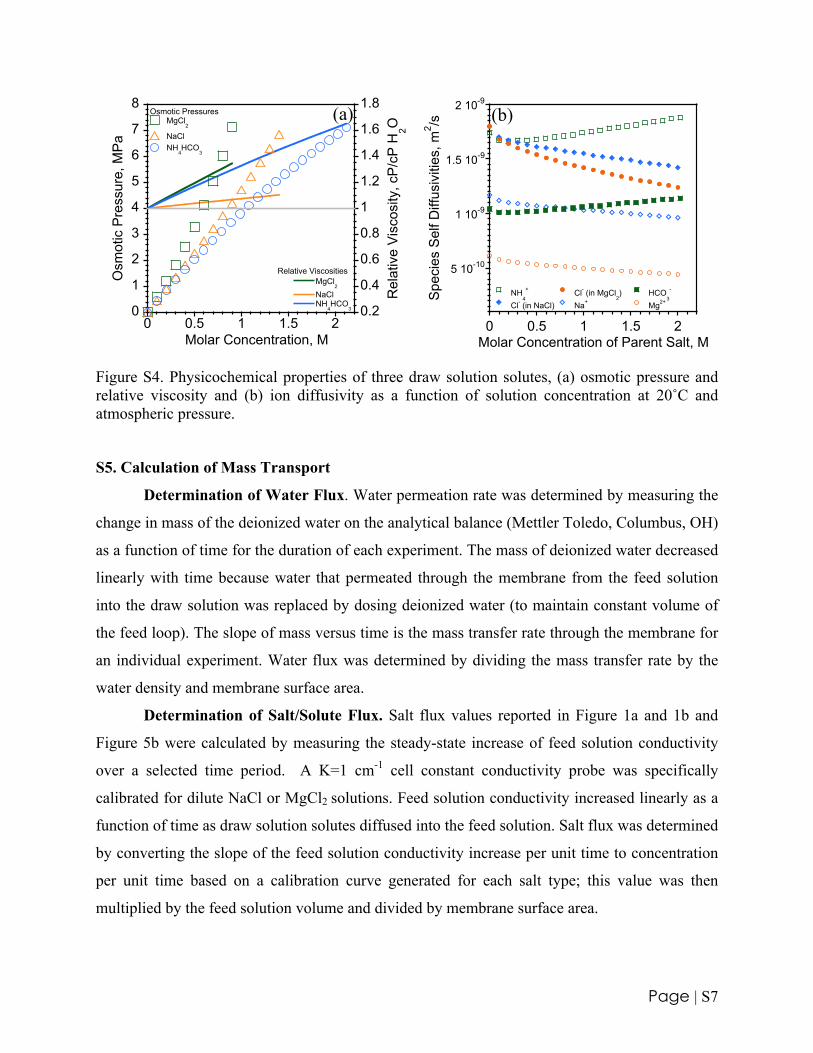
NaCl, MgCl2, or NH4HCO3 were used in preparation of draw solutions. These chemicals
were chosen for their relatively low molecular weight, low viscosity, high solubility, and
previous interest or utilization in FO research (7). OLI Stream Analyzer 2.0 (OLI Systems, Inc.,
Morris Plains, NJ) was employed to calculate osmotic pressures, relative viscosities, and self-
diffusivities as a function of molar concentration for these three compounds. The results of these
calculations are summarized in Figure S4a and b. MgCl2 has the highest osmotic pressure on a
molar basis but also the highest relative viscosity.
Page | S7
0
1
2
3
4
5
6
7
8
0.2
0.4
0.6
0.8
1
1.2
1.4
1.6
1.8
0 0.5 1 1.5 2
MgCl2
NaClNH
4HCO
3
MgCl2
NaClNH
4HCO
3
Osm
otic
Pre
ssur
e, M
Pa
Rel
ativ
e V
isco
sity
, cP
/cP
H2O
Molar Concentration, M
Osmotic Pressures
Relative Viscosities 5 10-10
1 10-9
1.5 10-9
2 10-9
0 0.5 1 1.5 2
NH4
+
Cl- (in NaCl)Cl- (in MgCl
2)
Na+HCO
3
-
Mg2+Spe
cies
Sel
f Diff
usiv
ities
, m2 /s
Molar Concentration of Parent Salt, M
Figure S4. Physicochemical properties of three draw solution solutes, (a) osmotic pressure and relative viscosity and (b) ion diffusivity as a function of solution concentration at 20˚C and atmospheric pressure.
S5. Calculation of Mass Transport
Determination of Water Flux. Water permeation rate was determined by measuring the
change in mass of the deionized water on the analytical balance (Mettler Toledo, Columbus, OH)
as a function of time for the duration of each experiment. The mass of deionized water decreased
linearly with time because water that permeated through the membrane from the feed solution
into the draw solution was replaced by dosing deionized water (to maintain constant volume of
the feed loop). The slope of mass versus time is the mass transfer rate through the membrane for
an individual experiment. Water flux was determined by dividing the mass transfer rate by the
water density and membrane surface area.
Determination of Salt/Solute Flux. Salt flux values reported in Figure 1a and 1b and
Figure 5b were calculated by measuring the steady-state increase of feed solution conductivity
over a selected time period. A K=1 cm-1 cell constant conductivity probe was specifically
calibrated for dilute NaCl or MgCl2 solutions. Feed solution conductivity increased linearly as a
function of time as draw solution solutes diffused into the feed solution. Salt flux was determined
by converting the slope of the feed solution conductivity increase per unit time to concentration
per unit time based on a calibration curve generated for each salt type; this value was then
multiplied by the feed solution volume and divided by membrane surface area.
(a) (b)

Page | S8
Solute flux values reported in Figure 1c and Figures 2 through 4 were calculated from
direct analytical measurements of solute concentration in the feed and draw solutions. Solute
concentrations recorded from samples drawn at the beginning and end of each experiment were
converted to mass of solute by correcting for system volume and compensating for mass
removed during the sampling process. Mass flux was determined by subtracting the solute’s
initial mass from its final mass and dividing by the time interval between sampling and
membrane surface area. Solute molar flux was determined by dividing the mass flux by the
solute’s molecular weight.
S6. Supplemental Description of Experimental Procedures
NaCl, MgCl2, and NH4HCO3 Specific Reverse Salt Flux Experiments. Due to the
relatively low saturation concentration of NH4HCO3 at standard temperature and pressure
(approximately 2.5 M), it was infeasible to maintain the draw solution at constant concentration
through chemical dosing; therefore, the NH4HCO3 draw solution was allowed to dilute over time.
To compensate for dilution, the initial NH4HCO3 draw solution concentration was higher, and as
a result, the arithmetic average osmotic pressure of the bulk draw solution during the experiment
was equivalent to NaCl and MgCl2 experiments.
All experiments started with 1 L draw solutions and were terminated after 2 L of water
diffused through the membrane into the draw solution. Samples of both feed and draw solution
were drawn for chemical analysis at the beginning, middle (after 1 L of water permeated through
the membrane), and at the end of each experiment.
Coupled, Multi-component Diffusion Experiments. All feed solutions were prepared
in 4 L volumetric flasks. Draw solutions were prepared in 1 L volumetric flasks for each
experiment and concentrated dosing draw solutions of 300 g/L NaCl or MgCl2 were prepared in
2 L volumetric flasks. All experiments were terminated after 2 L of water diffused through the
membrane into the draw solution. Samples of both feed and draw solutions were collected with
133 mL plastic sampling bottles at the beginning, middle (after 1 L of water permeated through
the membrane), and at the end of each experiment. pH was recorded at the time of sampling. pH
was not adjusted at any time during experiments that tested MgSO4, CaSO4, K2SO4, Ba(NO3)2,
and H3BO3 salts nor during the deionized water or brackish water feed experiments. The pH of
Page | S9
feed solutions containing alkaline salts NH4HCO3 and Na2SiO3 was adjusted to 7.5 and 6.5,
respectively, to protect the membrane’s integrity. Both feed and draw solution required constant
pH adjustment during experiments with NH4HCO3 feed solution to protect the membrane from
elevated pH (above pH 8). Between experiments, the system was thoroughly rinsed with
deionized water and subsequently drained of all fluids.
Analytical Procedures. Analyzing samples taken during FO experiments requires the
measurement of trace concentrations of certain ions in the presence of overwhelmingly higher
concentrations of other ions, such as sodium and chloride in the draw solution. In the case of
draw solution samples, the primary ions of interest are the ions from the feed solution that
diffused through the membrane. However, due to the intolerance of many analytical instruments
to high concentrations of sodium or chloride, the draw solution samples must be diluted 20 to 30
times, thereby further limiting the detection of co-diffused feed solutes/ions in the diluted
samples.
A test was conducted to determine the influence of high sodium concentration on the
detection of other ions at trace concentrations during ICP-AES analysis. 20 mg/L of various ions
of interest were dosed into separate solutions of increasingly concentrated NaCl solutions.
Results indicate that NaCl background concentration of up to 10 g/L does not lead to significant
analytical error (Figure S5). The largest deviation was found in samples with 1 g/L NaCl, which
is likely the result of over dilution of the stock solution. Based on these results, accurate values
may be obtained for samples diluted to 10 g/L NaCl. While this dilution improves the detection
of ions present in trace concentrations, a second series of dilutions is necessary to determine
sodium concentration, because the maximum allowable limit for the ICP-AES is 500 ppm.

Page | S10
16
17
18
19
20
21
22
0 2 4 6 8 10 12
Si4+
Ca2+
Mg2+
K+
Mea
sure
d Io
n C
once
ntra
iton,
mg/
L
Background Concentration, g/L NaCl
Figure S5. Influence of background NaCl concentration on measurement accuracy during ICP-AES analysis of metal ions of interest.
Feed solution samples were also diluted below their prescribed maximum concentration
for accurate measurement of their dominant cation concentrations (typically below 500 ppm). All
ICP-AES samples were analyzed in duplicates.
Feed and draw solution samples were analyzed for anion concentrations (i.e., chloride,
sulfate, and nitrate) using IC. Similar to ICP-AES, these samples required dilution to ensure that
anion species were below their maximum allowable concentration (300 ppm for chloride and
SO4- and 60 ppm for nitrate). All IC samples were analyzed in triplicates.
Samples containing ammonium were analyzed with a DR 5000 Spectrophotometer (Hach
Company, Loveland, CO) using the Hach Salicylate Method (Method #10031, Hach Company,
Loveland, CO). This method was chosen because the manufacturer reports low interference of
relatively high chloride concentrations. A test was conducted to verify that NaCl did not interfere
with ammonium measurements. Standard solutions of 3.4, 6.8, 10.3, 30, and 45 mg/L NH4HCO3-
NH4+ were mixed in four different water matrixes, including deionized water, 25 g/L NaCl, 50
g/L NaCl, and the synthetic brackish water solution. Results in Figure S6 reveal that the presence
of sodium, chloride, sulfate, and other ions present in the synthetic brackish water did not

Page | S11
interfere with ammonium measurements when using this method. These results also indicate that
at higher ammonium concentrations, the Hach method underestimates the true concentration;
thus, a linear regression was utilized to correct for ammonium concentrations near the upper
limit of the detection range.
0
10
20
30
40
0 10 20 30 40 50
Deionized Water25 g/L NaCl50 g/L NaClBrackish Water
Mea
sure
d C
once
ntra
tion,
mg/
L N
H4+
Actual Concentration, mg/L NH4
+
Figure S6. Ammonia concentration measured as function of ammonium dose for various background concentrations of NaCl. Hach method #10031 was use for sample analyses.
Contamination from borosilicate glassware was found to be significant for samples
containing boron and silica and required polyethylene volumetric flasks for dilutions. When
relevant, ammonium analysis was also performed in duplicate. Acid titrations for bicarbonate
analysis required 100 mL of sample, which prohibited repeat measurements for all samples with
low bicarbonate concentration. Samples of the deionized water used for dilution were also
analyzed and their influence was subtracted from the measured concentration.
S7. Bi-directional Hydrogen and Hydroxide Diffusion
The concept of electroneutrality in aqueous solutions suggests that other charged ions
must diffuse through the membrane to maintain charge balance. The only other ions available for
transport during these experiments are hydrogen and/or hydroxide. pH in the feed solution was
monitored during the experiments, and was observed to change at different rates during the

Page | S12
course of each experiment. pH variation, expressed through molar fluxes of hydrogen ion into or
out of the feed solution is illustrated in Figure S7 for select experiments. It is important to note
that there is ambiguity regarding either the enrichment of protons in the feed solution or
depletion of hydroxide; thus, for the purpose of this discussion, molar fluxes were calculated
based on hydrogen ion fluxes.
Results in Figure S7 suggest that hydrogen ions are likely diffusing faster through the
membrane than hydroxide, or visa versa. In the case of the common anion salts (MgSO4, CaSO4,
and K2SO4), the pH of the feed solution decreased during the experiment. This implies that
hydrogen ions might have diffused from the DS into the feed solution to offset the greater loss of
feed solution cations.
In contrast, feed solution pH increased during experiments with boric acid or sodium
silicate feed solutions. In experiments conducted with barium nitrate feed solution, a unique
phenomenon was observed whereby chloride ions appear to preferentially diffuse into the feed
solution to correct for charge imbalance rather than the solution shifting its pH.
-0.04 -0.02 0 0.02 0.04
MgSO4
CaSO4
K2SO
4
Ba(NO3)2
H3BO
3
Na2SiO
3 H+ Ions Entering FeedH+ Ions Leaving Feed
Apparent H+ Ion Flux, mmol/m2-hr
Sal
t in
Feed
Sol
utio
n
Figure S7. Apparent average flux of hydrogen ions either leaving the feed solution () or entering the feed solution () for selected sets of experiments. Error bars represent the range of apparent hydrogen ion flux through the four experiments in each set.
Page | S13
Literature Cited (1) Robinson, R. A.; Stokes, R. H., Electrolyte Solutions: the measurement and interpretation of
conductance, chemical potential, and diffusion in solutions of simple electrolytes. 2nd ed. (revised) ed.; Buttersworths Scientific Publications: London, 1959.
(2) Gray, G.; McCutcheon, J. R.; Elimelech, M., Internal concentration polarization in forward osmosis: Role of membrane orientation. Desalination 2006, 197, 1-8.
(3) Seppälä, A.; Lampinen, M. J., On the non-linearity of osmotic flow. Experimental Thermal and Fluid Science 2004, 28, (4), 283-296.
(4) Elimelech, M.; Bhattacharjee, S., A novel approach for modeling concentration polarization in crossflow membrane filtration based on the equivalence of osmotic pressure model and filtration theory. Journal of Membrane Science 1998, 145, 223-241.
(5) McCutcheon, J. R.; Elimelech, M., Influence of concentrative and dilutive internal concentration polarization on flux behavior in forward osmosis. Journal of Membrane Science 2006, 284, (1-2), 237-247.
(6) Tan, C. H.; Ng, H. Y., Modified models to predict flux behavior in forward osmosis in consideration of external and internal concentration polarization. Journal of Membrane Science 2008, 324, (209-219).
(7) Cath, T. Y.; Childress, A. E.; Elimelech, M., Forward osmosis: principles, applications, and recent developments. Journal of Membrane Science 2006, 281, (1-2), 70-87.
(8) Mehta, G. D.; Loeb, S., Performance of Permasep B-9 and B-10 membranes in various osmotic regions and at high osmotic pressures. Journal of Membrane Science 1979, 4, 335-349.
(9) McCutcheon, J. R.; McGinnis, R. L.; Elimelech, M., Desalination by ammonia-carbon dioxide forward osmosis: influence of draw and feed solution concentration on process performance. Journal of Membrane Science 2006, 278, (1-2), 114-123.
(10) Loeb, S.; Titelman, L.; Korngold, E.; Freiman, J., Effect of porous support fabric on osmosis through a Loeb-Sourirajan type asymmetric membrane. Journal of Membrane Science 1997, 129, 243-249.
(11) Lee, K. L.; Baker, R. W.; Lonsdale, H. K., Membranes for power generation by pressure-retarded osmosis. Journal of Membrane Science 1981, 8, 141-171.
(12) Achilli, A.; Cath, T. Y.; Marchand, E. A.; Childress, A. E., The forward osmosis membrane bioreactor: A low fouling alternative to MBR processes. Desalination 2009, 239, 10-21.
(13) Martinetti, C. R.; Cath, T. Y.; Childress, A. E., High recovery of concentrated RO brines using forward osmosis and membrane distillation. Journal of Membrane Science 2009, 331, 31-39.
Related Documents