www.wjpr.net Vol 6, Issue 1, 2017. 1005 SOLUBILITY ENHANCEMENT STUDIES ON THE POORLY SOLUBLE DRUG FEBUXOSTAT Soumya Reddy* and P. Tripura Sundari a Department of Pharmaceutics, RBVRR Women’s College of Pharmacy, Osmania University, Barkatpura, Hyderabad, Telangana, India, 500027. ABSTRACT Aim: Febuxostat (FBX) is a non purine selective inhibitor of xanthine oxidase/xanthine reductase. It belongs to BCS class II with low solubility and high permeability. Because of low solubility the bioavailability of the drug is hampered, food also interferes with the absorption of drug and decreases the Cmax by 38-49%. The bioavailability of a drug is a function of dissolution rate of the drug which is controlled by the surface area of the drug. In the category of poorly soluble drugs the change in surface area of the drug will show considerable changes in the solubility and dissolution of the drug. Materials and methods: In the present study, the attempts were made to improve the bioavailability of FBX by solid dispersions technique by employing Soluplus as carrier molecule. Different ratios on weight basis viz 1:1, 1:2, 1:3, 2:1 coded as (FBXS1, FBXS2, FBXS3, FBXS4) with Soluplus were prepared. Results and Discussion: The drug release studies were characterized in liquid state by phase solubility studies and in solid state by Fourier transform infrared spectroscopy (FTIR), Differential scanning calorimetry (DSC), Powdered X ray diffraction studies (PXRD) and Scanning electron microscopy (SEM). The aqueous solubility of FBX was favored by the presence of carriers. Solid state characterization indicated that FBX was present as fine amorphous form in the carrier polymeric molecules. Conclusion: In contrast to the solution rate of pure FBX the drug in carriers considerably improved the dissolution rate, this can be attributed to the increased wettability and dispersibility as well as decreased crystallinity and increased amorphous fraction of drug. KEYWORDS: Febuxostat, solid dispersions, Soluplus, Phase solubility, drug release World Journal of Pharmaceutical Research SJIF Impact Factor 6.805 Volume 6, Issue 1, 1005-1021. Research Article ISSN 2277– 7105 *Corresponding Author Soumya Reddy Department of Pharmaceutics, RBVRR women’s College of Pharmacy, Osmania University, Barkatpura, Hyderabad, Telangana, India, 500027. Article Received on 09 Nov. 2016, Revised on 29 Nov. 2016, Accepted on 19 Dec. 2016 DOI: 10.20959/wjpr20171-7631

Welcome message from author
This document is posted to help you gain knowledge. Please leave a comment to let me know what you think about it! Share it to your friends and learn new things together.
Transcript
www.wjpr.net Vol 6, Issue 1, 2017.
1005
Reddy et al. World Journal of Pharmaceutical Research
SOLUBILITY ENHANCEMENT STUDIES ON THE POORLY
SOLUBLE DRUG FEBUXOSTAT
Soumya Reddy* and P. Tripura Sundari
aDepartment of Pharmaceutics, RBVRR Women’s College of Pharmacy, Osmania
University, Barkatpura, Hyderabad, Telangana, India, 500027.
ABSTRACT
Aim: Febuxostat (FBX) is a non purine selective inhibitor of xanthine
oxidase/xanthine reductase. It belongs to BCS class II with low
solubility and high permeability. Because of low solubility the
bioavailability of the drug is hampered, food also interferes with the
absorption of drug and decreases the Cmax by 38-49%. The
bioavailability of a drug is a function of dissolution rate of the drug
which is controlled by the surface area of the drug. In the category of
poorly soluble drugs the change in surface area of the drug will show
considerable changes in the solubility and dissolution of the drug.
Materials and methods: In the present study, the attempts were made
to improve the bioavailability of FBX by solid dispersions technique
by employing Soluplus as carrier molecule. Different ratios on weight
basis viz 1:1, 1:2, 1:3, 2:1 coded as (FBXS1, FBXS2, FBXS3, FBXS4)
with Soluplus were prepared. Results and Discussion: The drug release studies were
characterized in liquid state by phase solubility studies and in solid state by Fourier transform
infrared spectroscopy (FTIR), Differential scanning calorimetry (DSC), Powdered X ray
diffraction studies (PXRD) and Scanning electron microscopy (SEM). The aqueous solubility
of FBX was favored by the presence of carriers. Solid state characterization indicated that
FBX was present as fine amorphous form in the carrier polymeric molecules. Conclusion: In
contrast to the solution rate of pure FBX the drug in carriers considerably improved the
dissolution rate, this can be attributed to the increased wettability and dispersibility as well as
decreased crystallinity and increased amorphous fraction of drug.
KEYWORDS: Febuxostat, solid dispersions, Soluplus, Phase solubility, drug release
World Journal of Pharmaceutical Research SJIF Impact Factor 6.805
Volume 6, Issue 1, 1005-1021. Research Article ISSN 2277– 7105
*Corresponding Author
Soumya Reddy
Department of
Pharmaceutics, RBVRR
women’s College of
Pharmacy, Osmania
University, Barkatpura,
Hyderabad, Telangana,
India, 500027.
Article Received on
09 Nov. 2016,
Revised on 29 Nov. 2016,
Accepted on 19 Dec. 2016
DOI: 10.20959/wjpr20171-7631
www.wjpr.net Vol 6, Issue 1, 2017.
1006
Reddy et al. World Journal of Pharmaceutical Research
studies.
INTRODUCTION
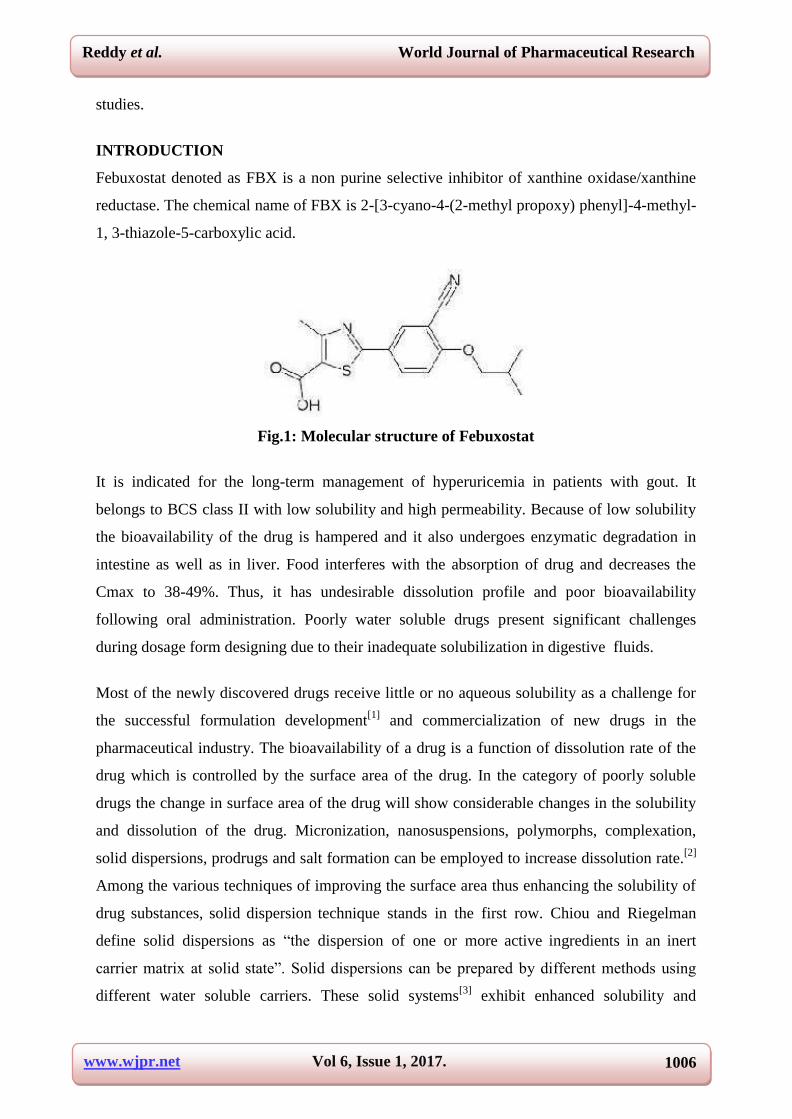
Febuxostat denoted as FBX is a non purine selective inhibitor of xanthine oxidase/xanthine
reductase. The chemical name of FBX is 2-[3-cyano-4-(2-methyl propoxy) phenyl]-4-methyl-
1, 3-thiazole-5-carboxylic acid.
Fig.1: Molecular structure of Febuxostat
It is indicated for the long-term management of hyperuricemia in patients with gout. It
belongs to BCS class II with low solubility and high permeability. Because of low solubility
the bioavailability of the drug is hampered and it also undergoes enzymatic degradation in
intestine as well as in liver. Food interferes with the absorption of drug and decreases the
Cmax to 38-49%. Thus, it has undesirable dissolution profile and poor bioavailability
following oral administration. Poorly water soluble drugs present significant challenges
during dosage form designing due to their inadequate solubilization in digestive fluids.
Most of the newly discovered drugs receive little or no aqueous solubility as a challenge for
the successful formulation development[1]
and commercialization of new drugs in the
pharmaceutical industry. The bioavailability of a drug is a function of dissolution rate of the
drug which is controlled by the surface area of the drug. In the category of poorly soluble
drugs the change in surface area of the drug will show considerable changes in the solubility
and dissolution of the drug. Micronization, nanosuspensions, polymorphs, complexation,
solid dispersions, prodrugs and salt formation can be employed to increase dissolution rate.[2]
Among the various techniques of improving the surface area thus enhancing the solubility of
drug substances, solid dispersion technique stands in the first row. Chiou and Riegelman
define solid dispersions as “the dispersion of one or more active ingredients in an inert
carrier matrix at solid state”. Solid dispersions can be prepared by different methods using
different water soluble carriers. These solid systems[3]
exhibit enhanced solubility and

www.wjpr.net Vol 6, Issue 1, 2017.
1007
Reddy et al. World Journal of Pharmaceutical Research
dissolution rate compared to the plain drug that may be attributed to the molecular/colloidal
dispersion of drug in mixture, absence of aggregation of drug particles, particle size
reduction, improved wettability and dispersibility and polymeric transformation of drug
crystals. Enhancement of solubility[4]
may contribute directly to the improved bioavailability
of poorly water soluble drugs.
In the current research investigation[5]
trials were made to improve the dissolution rate of
FBX by employing the solid dispersion technique. An attempt was made to improve the
dissolution properties of Febuxostat by preparing free flowing solid dispersions[6]
using
Soluplus as carrier system. The prepared solid dispersions were characterized by Fourier
transform infra red spectroscopy (FTIR), differential scanning calorimetry (DSC), X-ray
diffraction study (XRD).
MATERIALS AND METHODS
The solid dispersions preparation required the following chemicals, FBX was generously
donated by Sun Pharma Mumbai, Soluplus was by were procured from Sigma Aldrich,
Mumbai and all other chemicals used in the study are of pharmacopeial grade.
PHASE SOLUBILITY STUDIES
The phase solubility studies were conducted by using a simple technique, which involves the
addition of excess amount of FBX i.e. 100 mg in 25 ml of water containing different weights
of solubilizing agents i.e. Soluplus. The solutions were[7]
sonicated for 1 hr at room
temperature and maintained at 250C for 48 hrs on an orbital shaker Orchid, Mumbai. The
dispersions were filtered[8]
through a 0.22 µm nylon membrane filter. The filtrates were
suitably diluted and analyzed, spectrophotometrically (UV/Vis spectrophotometer, Elico), for
the dissolved drug at 318 nm. All trials were performed in triplicate.
PREPARATION OF SOLID DISPERSIONS
The solid dispersions of FBX employing Soluplus were prepared[9]
by using a simple method
of solvent evaporation technique. The prepared solid dispersions were compared with pure
FBX and the physical mixtures of drug and polymer.
SOLVENT EVAPORATION METHOD
Solid dispersions of the drug FBX in Soluplus in different weight ratios (1:1,1:2,1:3,2:1 of
Soluplus coded as FBXS1, FBXS2, FBXS3, FBXS4) were prepared by employing solvent

www.wjpr.net Vol 6, Issue 1, 2017.
1008
Reddy et al. World Journal of Pharmaceutical Research
evaporation method[10-13]
The required amount of polymer Soluplus were weighed and mixed
with sufficient quantity[14-16]
of the solvent acetone to obtain a clear solution. In this solution
the weighed quantity of drug was dispersed and the solution was triturated continuously till
the entire solvent was evaporated. Then the mixture was further air dried for 24 hr to
completely remove the solvent and pulverized and sifted through sieve no 40 to obtain the
solid dispersions. Thus prepared solid dispersions were stored in a dessicator until further
evaluation.
CHARACTERIZATION OF SOLID DISPERSIONS
FTIR Spectroscopy
A Schimadzu P/N 206-73500-38 FTIR spectrometer was used for infrared analysis. Samples
were prepared by KBr disc method (2 mg sample in 100 mg KBr) and examined in the
transmission mode. A resolution of 4 cm−1 was used and 64 scans were co-added for each
spectrum over a frequency range of 4000–450 cm−1. The software used for the data analysis
was Perkin-Elmer spectra MAX.
DSC Analysis
Thermal analyses of prepared solid dispersions were performed in a DSC-60, SHIMADZU,
differential scanning calorimeter with a thermal analysis controller. Samples were accurately
weighed (5–8 mg) into aluminum pans and thermograms obtained at a heating rate of
100C/min over a temperature range of 25–220
0C.
X-RAY POWDER DIFFRACTION
Diffraction patterns were obtained on a XRD-7000 X-RAY DIFFRACTIOMETER,
SHIMADZU Powder samples of solid dispersions were top loaded in a Philips PW 1066
(15/20 mm) flat sample holder. The patterns were collected with a voltage of 45 kV and a
current of 32 mA in the angular range of 48B/2uB/758 in a step scan mode (step width 0.028,
counting time 2 s/step) using the Philips PW 1710 microprocessor based control and
measuring system.
SCANNING ELECTRON MICROSCOPY (SEM)
The SEM analysis was carried out using a scanning electron microscope (HITACHI
S3700N). Prior to examination, samples were mounted on an aluminium stub using a double
sided adhesive tape and then making it electrically conductive by coating with a thin layer of
gold (approximately 20nm) in vacuum. The scanning electron microscope operated at an
www.wjpr.net Vol 6, Issue 1, 2017.
1009
Reddy et al. World Journal of Pharmaceutical Research
acceleration voltage of 15kV.
ASSAY OF SOLID DISPERSIONS
The content of FBX in the prepared solid dispersions was determined using UV-VIS
spectrophotometer. Solid dispersions equivalent to 10 mg drug were dissolved in acetone.
1ml of the stock solution was diluted to 10 ml with pH 6.0 Phosphate buffer which was
further diluted to give a final concentration of 10 µ g/ml (10 ppm) solution. Percent drug
content was calculated spectrophotometrically from the absorbance obtained at 318 nm.
IN VITRO DISSOLUTION STUDIES
In vitro dissolution studies were carried out for pure drug, physical mixture and all the
different solid dispersions prepared in USP type II dissolution test apparatus (Electrolab
TDT-14L) at 75 RPM in 900 ml of pH 6.0 Phosphate buffer. Forty milligrams of pure drug
and an equivalent amount of solid dispersions and physical mixture were used for the
dissolution studies. 10 mL of the aliquot was withdrawn at predetermined intervals and
filtered using 0.45 mm nylon membrane (Pall Life Sciences, India). The required dilutions
were made with pH 6.0 Phosphate buffer and the solution was analyzed for the drug content
UV spectrophotometrically (Elico 191 SW) at 318 nm against pH 6.0 Phosphate buffer. An
equal volume of the dissolution medium was replaced in the vessel after each withdrawal to
maintain the sink condition. Three determinations were carried out for each formulation.
From this, cumulative % of drug dissolved was calculated and plotted against function of
time to study the pattern of drug release. Each test was performed in triplicate (n= 3) and
calculated mean values of cumulative drug release were used while plotting the release
curves.
TABLET DOSAGE FORM PREPARATION
Based on the results obtained from the drug release studies, the solid dispersions with better
release profile were selected and prepared in the form of tablet dosage forms employing
direct compression technique using compression machine MINI Press.
Table No.1: Formulation of tablets using Soluplus
Ingredients mg per tablet
Solid dispersions equivalent to
40mg of Febuxostat 120mg (FBXS2)
Crosspovidone 24mg
Magnesium stearate 3mg
www.wjpr.net Vol 6, Issue 1, 2017.
1010
Reddy et al. World Journal of Pharmaceutical Research
Talc 3mg
Total tablet weight 150 mg
EVALUATION OF TABLETS: UNIFORMITY OF WEIGHT
Uniformity of weight was performed by randomly weighing 10 tablets individually and
collectively on digital balance. Individual weight of tablets was determined from average
weight of tablets.
TABLET HARDNESS
Hardness of tablet is defined as the force applied across the diameter of the tablet in order to
break the tablet. Hardness of tablets was determined by using hardness tester. The harness of
tablet was measured in terms of kg/cm2.
TABLET THICKNESS
Thickness of tablets was performed using digital Vernier caliper. Thickness of tablet was
determined by placing the tablet between two arms of Vernier caliper. Thickness of each
tablet was measured in terms of mm.
TABLET DISINTEGRATION TIME
Tablet disintegration time was carried in triplicate (n=3) using tablet disintegration tester.
Disintegration time for tablets was carried out in water maintained at 37+/- 0.50C. The time
required for the tablet to disintegrate completely was reported in seconds.
ASSAY OF TABLETS
The content of Febuxostat in tablets was determined using UV-Visible spectrophotometer. 1
Tablet was crushed in a mortar pestle and powder equivalent to 10mg Febuxostat was
dissolved in 10ml Acetone. 1mg of the stock solution was diluted to 10ml with Phosphate
buffer (PH 6.0). It was further diluted to give a final concentration of 10 µg/ml (10 ppm)
solution. Percent drug content was calculated spectrophotometrically from the absorbance
obtained at 318nm.
IN VITRO DRUG RELEASE STUDIES
The dissolution rate of Febuxostat from tablets was measured in a dissolution test system
using phosphate buffer PH 6.0 and USP apparatus II (paddle) method as specified in the
OGD guidelines. The dissolution test tablets was carries out in triplicate (n=3). Bath
temperature and paddle rotation speed were set at 370C and 75 rpm, respectively. Aliquots of

www.wjpr.net Vol 6, Issue 1, 2017.
1011
Reddy et al. World Journal of Pharmaceutical Research
10 ml were withdrawn at 5, 10, 15, 20, 25, 30 and 45 minutes.1 ml from this was diluted to
10 ml with buffer solution. The amount of drug dissolved was assayed
spectrophotometrically at 318 nm.
STABILITY STUDIES
Stability study was performed according to ICH guidelines for three months. Dissolution
studies were carried out at the end of three months to check inhibition of reversal of FBX to
crystalline form.
RESULTS AND DISCUSSION: PHASE SOLUBILITY STUDIES
Fig. 2 shows the phase solubility diagram representing the effect of increasing the
concentrations of Soluplus on the apparent solubility of FBX in water at 250C. The aqueous
solutions of Soluplus increased the solubility of FBX more when compared to pure drug. The
polymer was selected for formulation of solid dispersions because of its higher molecular
weight and better solubility of FBX in its aqueous solution.
Fig 2: Phase solubility studies of drug in Polymers
FTIR STUDIES
FTIR spectra of solid dispersions of FBX with Soluplus is shown in Fig 3 to 6. The spectra of
Pure FBX presented characteristic peaks at 3535.52, 3460.3, 3068.75 cm-1
(O- H stretching of
free hydroxyl group), 2957.68 cm-1
(C-H stretching of alkanes), 1703.14, 1681, 1670 cm-1
(C-O stretching of carboxylic acid) 1510, 1577.7, 1425 cm-1
(C-C stretching of aromatic
ring), 1469.71, 1498.44, 1298.09, 1282.66 cm-1
(C–H stretching of alkanes) respectively.
The spectrum of Soluplus showed, among others important bands at 2927.9 cm-1
(C–H
stretch) and 1629.85, 1701.22 cm-1
(C=O) a very broad band was also visible at 1240.23,
2858.51 cm-1
that was attributed to the presence of water, confirming the broad endotherm

www.wjpr.net Vol 6, Issue 1, 2017.
1012
Reddy et al. World Journal of Pharmaceutical Research
detected in the DSC. The characteristic peaks of FBX at 2960.73, 3460.3, 3535.52, 3068 cm-1
(O- H stretching of acid), 2957.68 cm-1
(C- H stretching of alkanes), 1703.14, 1681, 1670 cm-
1 (C- O stretching of carboxylic acid). 1510, 1577.7, 1425 cm
-1 (C-C stretching of aromatic
ring) are disappeared in spectra of solid dispersions with Soluplus (FBXS2) ratio which
indicates the trapping of Febuxostat inside the matrix of Soluplus.
Fig 3: FTIR Spectra of Febuxostat
Fig 4: FTIR Spectra of Soluplus
Fig 5: FTIR Spectra of PM (FBXSP2)

www.wjpr.net Vol 6, Issue 1, 2017.
1013
Reddy et al. World Journal of Pharmaceutical Research
Fig 6: FTIR Spectra of SD (FBXS2)
PXRD STUDIES
The pure FBX, Soluplus, physical mixture and selected solid dispersions of carriers were
studied by XRD as shown in figure 7. The powder diffraction patterns of pure FBX showed
characteristic high-intensity diffraction peaks at 2θ values of 4.788, 6.857, 8.363, 11.79,
15.98, 16.78, 17.58, 20.001, 25.16 and 25.77 where as the Soluplus do not show any
characteristic diffraction peak. The high intensity diffraction peaks are very prominently
preserved in case of physical mixtures, where as these characteristic peak intensities were
drastically reduced in FBXS2 ratios of drug and polymers owing to the complete
encapsulation and amorphisation of drug. The findings of XRD are in line with that of DSC
findings.
Fig 7: Overlaying of Powder X-ray diffraction Patternsof various compounds of
soluplus.
(A) FBX, (B) Soluplus, (C) Solid dispersion (D) Physical mixture.
DSC Analysis
The DSC thermograms for pure FBX, Polymer, Physical mixture and selected solid
dispersion were shown in fig 8. The DSC thermogram of pure FBX shows the sharp
endothermic peak at around 200-2200C, confirming the crystallinity of the drug. During

www.wjpr.net Vol 6, Issue 1, 2017.
1014
Reddy et al. World Journal of Pharmaceutical Research
scanning of Soluplus, a broad endotherm ranging from 70 to 1200C was observed. The DSC
thermogram of the solid dispersion in FBXS2 ratio showed the presence of broaden peaks
with no characteristic peaks of drug. Which means the drug is in the form of amorphous
nature or in solid solution.
Fig 8: Overlaying of DSC thermograms of (A) FBX, (B) Soluplus, (C) Physical mixture,
(D) solid dispersion
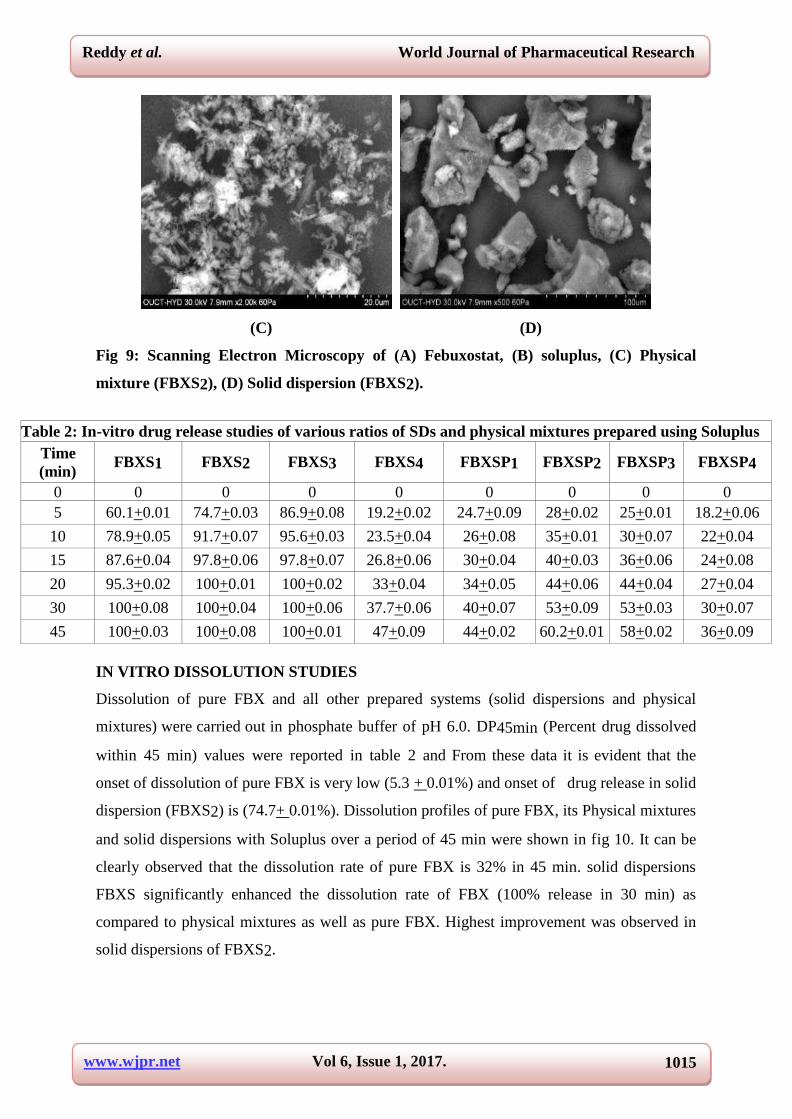
SCANNING ELECTRON MICROSCOPY (SEM)
SEM photomicrographs obtained for pure FBX, Soluplus, their physical mixtures and solid
dispersions are shown in fig 9 in selected magnifications. From the photomicrograph of pure
drug FBX, it is clear that the drug is present as needle shaped crystals. In the solid dispersion,
drug particles were entrapped in the carrier matrix and the crystalline appearance of the drug
was reduced and became more amorphous confirming the FTIR, XRD and DSC data
analyses.
(A) (B)
www.wjpr.net Vol 6, Issue 1, 2017.
1015
Reddy et al. World Journal of Pharmaceutical Research
(C) (D)
Fig 9: Scanning Electron Microscopy of (A) Febuxostat, (B) soluplus, (C) Physical
mixture (FBXS2), (D) Solid dispersion (FBXS2).
Table 2: In-vitro drug release studies of various ratios of SDs and physical mixtures prepared using Soluplus
Time
(min) FBXS1 FBXS2 FBXS3 FBXS4 FBXSP1 FBXSP2 FBXSP3 FBXSP4
0 0 0 0 0 0 0 0 0
5 60.1+0.01 74.7+0.03 86.9+0.08 19.2+0.02 24.7+0.09 28+0.02 25+0.01 18.2+0.06
10 78.9+0.05 91.7+0.07 95.6+0.03 23.5+0.04 26+0.08 35+0.01 30+0.07 22+0.04
15 87.6+0.04 97.8+0.06 97.8+0.07 26.8+0.06 30+0.04 40+0.03 36+0.06 24+0.08
20 95.3+0.02 100+0.01 100+0.02 33+0.04 34+0.05 44+0.06 44+0.04 27+0.04
30 100+0.08 100+0.04 100+0.06 37.7+0.06 40+0.07 53+0.09 53+0.03 30+0.07
45 100+0.03 100+0.08 100+0.01 47+0.09 44+0.02 60.2+0.01 58+0.02 36+0.09
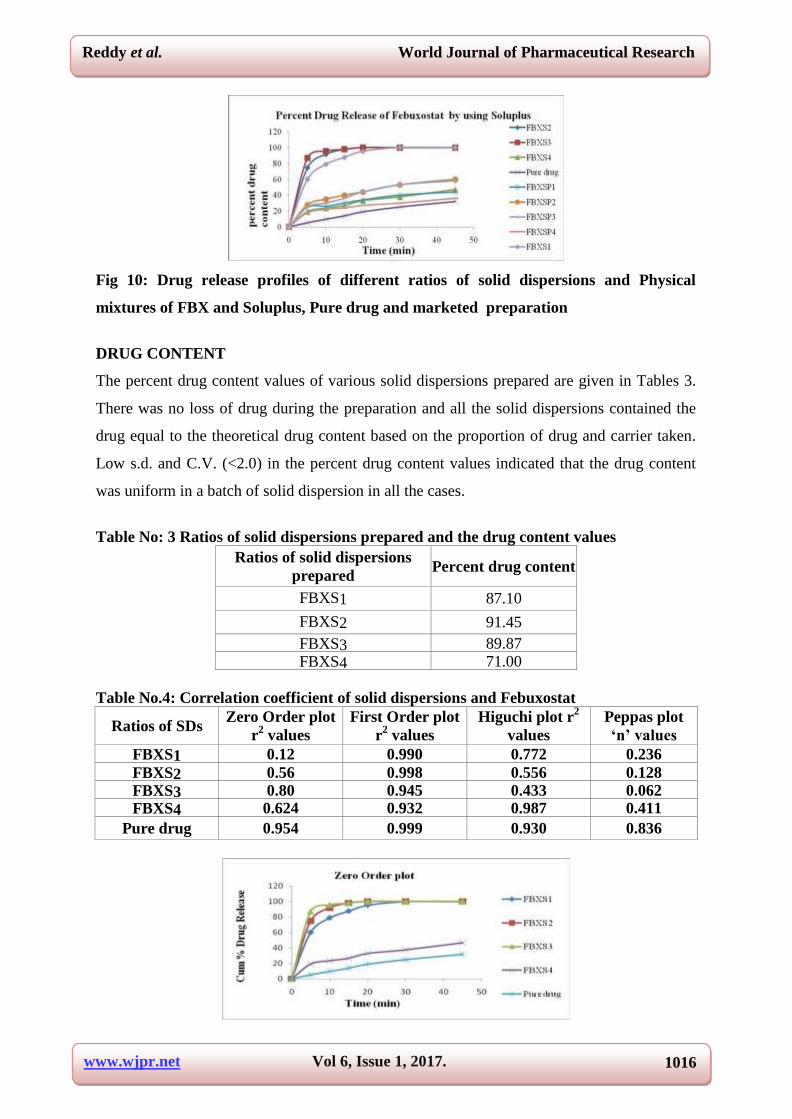
IN VITRO DISSOLUTION STUDIES
Dissolution of pure FBX and all other prepared systems (solid dispersions and physical
mixtures) were carried out in phosphate buffer of pH 6.0. DP45min (Percent drug dissolved
within 45 min) values were reported in table 2 and From these data it is evident that the
onset of dissolution of pure FBX is very low (5.3 + 0.01%) and onset of drug release in solid
dispersion (FBXS2) is (74.7+ 0.01%). Dissolution profiles of pure FBX, its Physical mixtures
and solid dispersions with Soluplus over a period of 45 min were shown in fig 10. It can be
clearly observed that the dissolution rate of pure FBX is 32% in 45 min. solid dispersions
FBXS significantly enhanced the dissolution rate of FBX (100% release in 30 min) as
compared to physical mixtures as well as pure FBX. Highest improvement was observed in
solid dispersions of FBXS2.
11
www.wjpr.net Vol 6, Issue 1, 2017.
1016
Reddy et al. World Journal of Pharmaceutical Research
Fig 10: Drug release profiles of different ratios of solid dispersions and Physical
mixtures of FBX and Soluplus, Pure drug and marketed preparation
DRUG CONTENT
The percent drug content values of various solid dispersions prepared are given in Tables 3.
There was no loss of drug during the preparation and all the solid dispersions contained the
drug equal to the theoretical drug content based on the proportion of drug and carrier taken.
Low s.d. and C.V. (<2.0) in the percent drug content values indicated that the drug content
was uniform in a batch of solid dispersion in all the cases.
Table No: 3 Ratios of solid dispersions prepared and the drug content values
Ratios of solid dispersions
prepared Percent drug content
FBXS1 87.10
FBXS2 91.45
FBXS3 89.87 FBXS4 71.00
Table No.4: Correlation coefficient of solid dispersions and Febuxostat
Ratios of SDs Zero Order plot
r2
values
First Order plot
r2
values
Higuchi plot r2
values
Peppas plot
‘n’ values
FBXS1 0.12 0.990 0.772 0.236
FBXS2 0.56 0.998 0.556 0.128
FBXS3 0.80 0.945 0.433 0.062
FBXS4 0.624 0.932 0.987 0.411
Pure drug 0.954 0.999 0.930 0.836

www.wjpr.net Vol 6, Issue 1, 2017.
1017
Reddy et al. World Journal of Pharmaceutical Research
Fig 11: Kinetic representation of prepared solid dispersions and Febuxostat pure drug
Table No.5 Evaluation parameters for tablets
Parameters Direct compression (Soluplus) Weight variation 1.5mg
Hardness 3 kg/cm2
Disintegration time 72 secs
In-vitro dissolution studies 100 + 0.01%
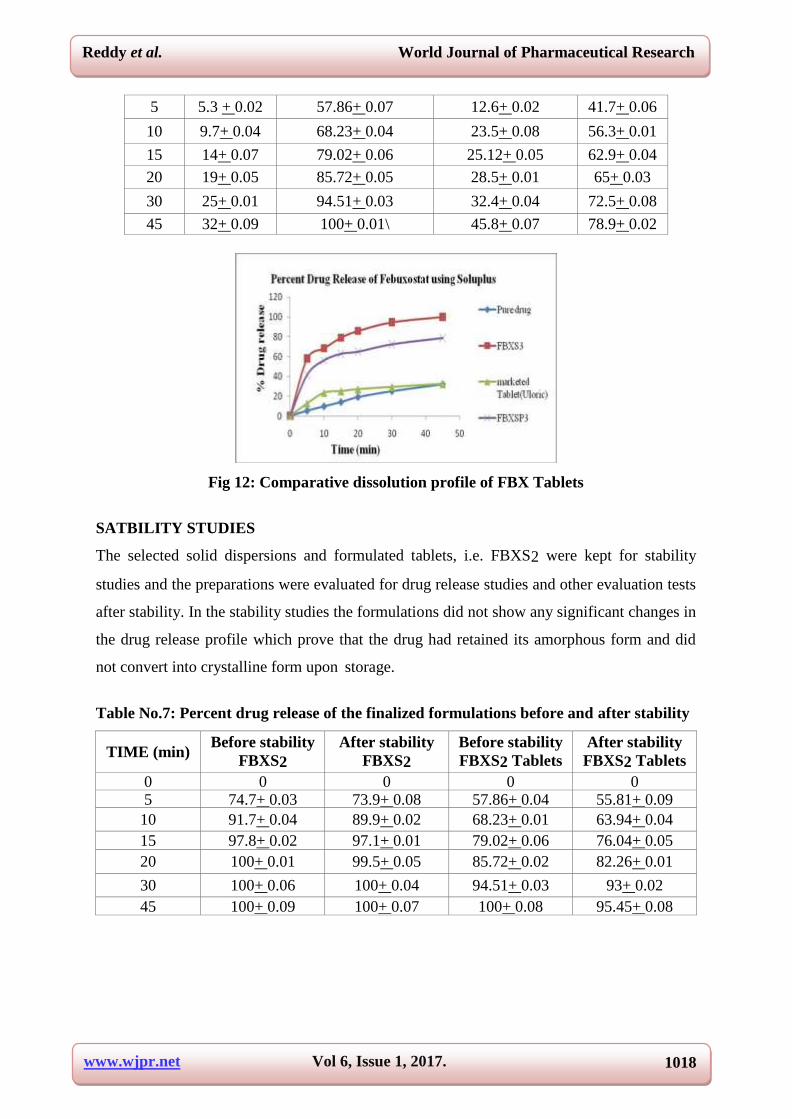
Table No.6: Tablet dissolution data of Febuxostat tablets prepared by employing SDs
Time
(mins.)
Percent Febuxostat dissolved (X+ SD, n=3)
Pure drug Direct compression Marketed
preparation
Physical
mixture
0 0 0 0 0
www.wjpr.net Vol 6, Issue 1, 2017.
1018
Reddy et al. World Journal of Pharmaceutical Research
5 5.3 + 0.02 57.86+ 0.07 12.6+ 0.02 41.7+ 0.06
10 9.7+ 0.04 68.23+ 0.04 23.5+ 0.08 56.3+ 0.01
15 14+ 0.07 79.02+ 0.06 25.12+ 0.05 62.9+ 0.04
20 19+ 0.05 85.72+ 0.05 28.5+ 0.01 65+ 0.03
30 25+ 0.01 94.51+ 0.03 32.4+ 0.04 72.5+ 0.08
45 32+ 0.09 100+ 0.01\ 45.8+ 0.07 78.9+ 0.02
Fig 12: Comparative dissolution profile of FBX Tablets
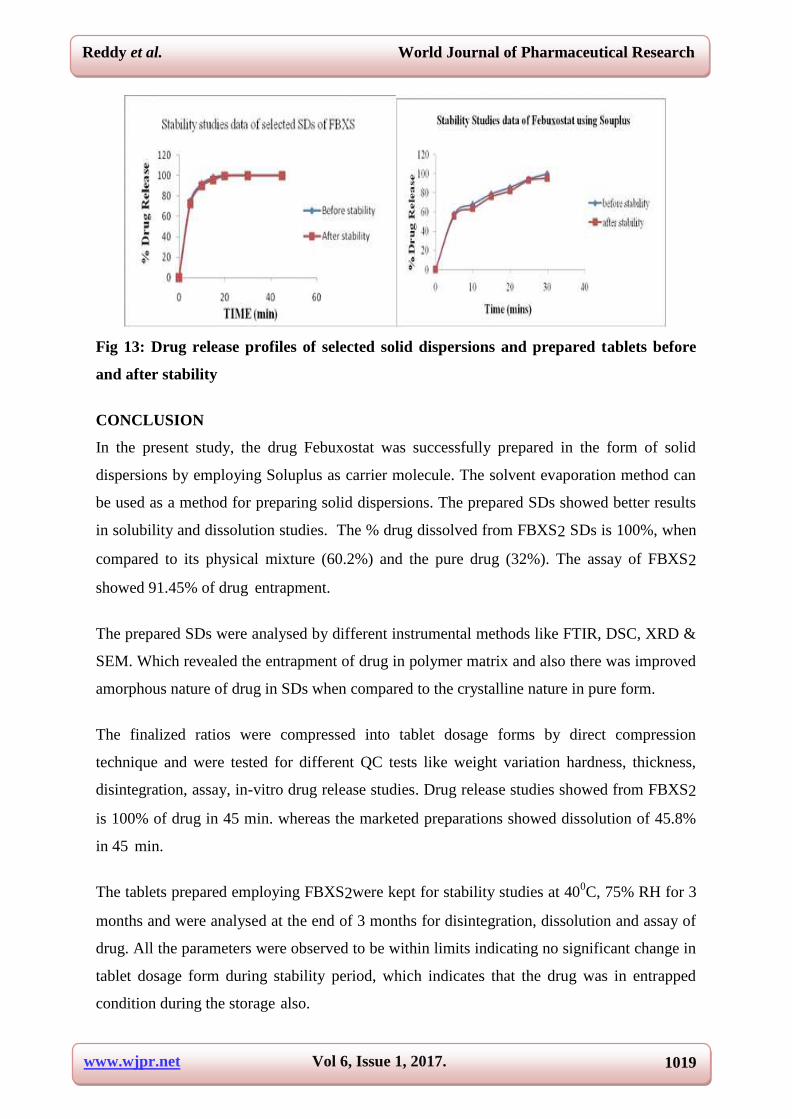
SATBILITY STUDIES
The selected solid dispersions and formulated tablets, i.e. FBXS2 were kept for stability
studies and the preparations were evaluated for drug release studies and other evaluation tests
after stability. In the stability studies the formulations did not show any significant changes in
the drug release profile which prove that the drug had retained its amorphous form and did
not convert into crystalline form upon storage.
Table No.7: Percent drug release of the finalized formulations before and after stability
TIME (min) Before stability
FBXS2
After stability
FBXS2
Before stability
FBXS2 Tablets
After stability
FBXS2 Tablets
0 0 0 0 0 5 74.7+ 0.03 73.9+ 0.08 57.86+ 0.04 55.81+ 0.09
10 91.7+ 0.04 89.9+ 0.02 68.23+ 0.01 63.94+ 0.04
15 97.8+ 0.02 97.1+ 0.01 79.02+ 0.06 76.04+ 0.05
20 100+ 0.01 99.5+ 0.05 85.72+ 0.02 82.26+ 0.01
30 100+ 0.06 100+ 0.04 94.51+ 0.03 93+ 0.02
45 100+ 0.09 100+ 0.07 100+ 0.08 95.45+ 0.08
www.wjpr.net Vol 6, Issue 1, 2017.
1019
Reddy et al. World Journal of Pharmaceutical Research
Fig 13: Drug release profiles of selected solid dispersions and prepared tablets before
and after stability
CONCLUSION
In the present study, the drug Febuxostat was successfully prepared in the form of solid
dispersions by employing Soluplus as carrier molecule. The solvent evaporation method can
be used as a method for preparing solid dispersions. The prepared SDs showed better results
in solubility and dissolution studies. The % drug dissolved from FBXS2 SDs is 100%, when
compared to its physical mixture (60.2%) and the pure drug (32%). The assay of FBXS2
showed 91.45% of drug entrapment.
The prepared SDs were analysed by different instrumental methods like FTIR, DSC, XRD &
SEM. Which revealed the entrapment of drug in polymer matrix and also there was improved
amorphous nature of drug in SDs when compared to the crystalline nature in pure form.
The finalized ratios were compressed into tablet dosage forms by direct compression
technique and were tested for different QC tests like weight variation hardness, thickness,
disintegration, assay, in-vitro drug release studies. Drug release studies showed from FBXS2
is 100% of drug in 45 min. whereas the marketed preparations showed dissolution of 45.8%
in 45 min.
The tablets prepared employing FBXS2were kept for stability studies at 400C, 75% RH for 3
months and were analysed at the end of 3 months for disintegration, dissolution and assay of
drug. All the parameters were observed to be within limits indicating no significant change in
tablet dosage form during stability period, which indicates that the drug was in entrapped
condition during the storage also.
www.wjpr.net Vol 6, Issue 1, 2017.
1020
Reddy et al. World Journal of Pharmaceutical Research
So the technique solvent evaporation can be employed to prepare Febuxostat solid
dispersions and Soluplus can be successfully used as carrier molecule for this method. The
SDs thus prepared showed increased solubility and dissolution parameters of the API.
REFERENCES
1. Mayuko Ishikawa, Daisuke Nagata, Nobuyuki Nakano, Nao Kawabata, Tetsu Akimoto
and Toshihiko Ishinitsu; Therapeutic potency of Febuxostat for Hyperuricemia in patients
with chronic kidney disease; Journal of pharmacology and clinical toxicology. 2014;
2(3): 1034.
2. K. Kranthi kumar, Dr. L. Srinivas, Dr. V. Saikishore and S. Naseeb basha; formulation
and evaluation of poorly soluble Febuxostat orodispersable tablet. American journal of
Advanced drug delivery. 2014; 2(2): 191-202.
3. Anuj kumar, Sangram keshri sahoo, Kumud padhee, Prithi pal singh kochar, Ajit
satapathy and Naveenpathak; Review on solubility enhancement techniques for
hydrophobic drugs; Pharmacie globale international journal of comprehensive pharmacy.
2011; 2(3).
4. Sameer singh, Raviraj singh baghel and Lalit yadav; A review on solid dispersion;
international journal of pharmacy and life sciences. 2011; 2(9): 1078-1095.
2. S.V. Kadam, D.M. Shinkar, R.B. Saudagar; A review on solubility enhancement
techniques; International journal of pharmacy and biological sciences. 2013; 3(3):
462-475.
3. Varun raj vemula, Venkateshwarlu lagishetty, Srikanth lingala; Solubility enhancement
techniques; International journal of pharmaceutical sciences review and research. 2010;
5(1): 41-51.
4. Mogal S.A, Gurjar P.N, Yamgar D.S and Kamod A.C; Solid dispersion technique for
improving solubility of some poorly soluble drugs; Scholars research library. 2012; 4(5):
1574-1586.
5. Mukesh Sharma, Kirti parmar, Atul Baria, Tushar M. Patel, Rohan lalani, Rajesh K.
Parikh; Gastro retentive tablet of Febuxostat: Formulation, drug release dynamics and
factorial design; world journal of pharmaceutical research. 2015; 4(1): 1063-1082.
6. Vikas A Saharan, Vipin Kukkar, Mahesh kataria, Manoj Gera, Pratim K choudhury;
Dissolution enhancement of drugs, international journal of health research. 2009; 2(2):
107-124.
7. Komal R. Parmar, Sunny R. Shah and Navin R. Sheth; studies on dissolution

www.wjpr.net Vol 6, Issue 1, 2017.
1021
Reddy et al. World Journal of Pharmaceutical Research
enhancement Ezetimible by solid dispersions in combination with a surface adsorbent,
dissolution technologies. 2011; 55-61.
8. Ketan T. Savjani, Anuradha K. Gajjar and Jignasa K. Savjani; Drug solubility:
importance and enhancement techniques, International scholarly research network. 2012.
9. Ladan Akbarpour nikghalb, Gurinder sngh, Gaurav singh and kimia fazaeli kahkeshan;
solid dispersion: Methods and polymers to increase the solubility of poorly soluble drugs;
Journal of applied pharmaceutical sciences. 2012; 2(10): 170-175.
10. Yogesh S. Thorat, Indrajeet D. Gonjari and Avinash H. Hosmani; A review on
conventional and novel approaches; International journal pharmaceutical sciences and
research. 2011; 2(10): 2501-2013.
11. Zsombor K. Nagy, Attila Balogh, Balazs vajnas, Attilas Farkas, Gergo patyi, Aron
kramarics, Gyorgy marosi; Comparision of electrospun and extruded soluplus-based solid
dosage forms of improved dissolution, Journal of pharmaceutical sciences. 2012; 101:
322-332.
12. Madhuri Newa, Krishna Hari Bhandari, Dong Xun Li, Tae-Hyub Kwon, Jung Ae Kim,
Bong Kyu Yoo, Jong Soo Woo, Won Seok Lyoo, Chul Soon Yong,, Han Gon Choi;
Preparation, characterization and in vivo evaluation of ibuprofen binary solid dispersions
with poloxamer 188; International Journal of Pharmaceutics. 2007; 343: 228–237.
13. Bhanudas S. Kuchekar, Varsha B. Divekar, Swati C. Jagdale, I.D. Gonjari; Solubility
enhancement and formulation of rapid disintegrating tablet of Febuxostat cyclodextrin
complex, biomed Rx. 2013; 1(2): 168-175.
14. Paresh K. Patel, Dr. M. R. Patel, Dr. K. R. Patel; Design and development of self-
microemulsifying drug delivery system of Febuxostat; International journal of universal
pharmacy and Bio sciences. 2014; 3(2): 285-299.
15. R.B. Pandya, T.A. Mehta and M.C. Gohel; Solid dispersion adsorbate, A novel technique
for dissolution enhancement of Febuxostat, International journal of pharmaceutical
sciences and research, 2015; 6(10): 4236-4242.
16. Dina Mahmoud Abd-Alaziz, Omaima Ahmed Sammour, Abd-Elhameed Abd–Allah
Eishamy, Demiana Ibrahim Nesseem; Enhancement of solubility and dissolution rate of
poorly water-soluble Domperidone by the formulation of multicomponent solid
dispersions using solvent evaporaation method. 2013; 20(2): 10-19.
Related Documents


![Solubility Enhancement and Formulation of Chronologically ...poorly soluble drugs. [2] Improved dissolution and its speed of solid dispersions can be explained in general, one of the](https://static.cupdf.com/doc/110x72/5fabbc9a7cb1eb2f85372a25/solubility-enhancement-and-formulation-of-chronologically-poorly-soluble-drugs.jpg)


