Solid Waste Management Chapter 14 1

Solid Waste Management Chapter 14 1. Generation (Section 14.2) What is the average per capita MSW generation in the U.S.? A. 1.3 lb/d B. 2.4 lb/d C. 4.6.
Dec 31, 2015
Welcome message from author
This document is posted to help you gain knowledge. Please leave a comment to let me know what you think about it! Share it to your friends and learn new things together.
Transcript

Solid Waste Management
Chapter 14
1

Generation (Section 14.2)
What is the average per capita MSW generation in the U.S.?
A. 1.3 lb/d
B. 2.4 lb/d
C. 4.6 lb/d
D. 5.1 lb/d
2

3

MSW Composition
Metals13%
Other10%
Paper30%Glass
8%
Yard24%
Food15%
1960
4

Metals13%
Other10%
Paper30%Glass
8%
Yard24%
Food15%
Metals8%
Other17%
Plastics10%
Paper31%
Glass7%
Yard19%Food
8%
1960 1990
5

Activity Q1
Why are local generation and composition data important to have?
A. To estimate landfill life
B. To provide work for engineers
C. To determine tipping fees
D. To determine incinerator capacity
E. To estimate future impacts of recycling or composting
F. To determine the best mix of management methods
G. They aren’t; national averages are adequate 6

Collection (Section 14.1)
7

Collection Vehicles
8

Activity Q2
How can you optimize routing for collection services?
A. Avoid rush-hour traffic
B. Maximize left turns
C. Minimize left turns
D. Travel downhill
E. Begin routes near garage
F. Avoid backtracking
G. End routes near transfer station or landfill9
Example
A typical side-loaded compactor truck has a capacity of 30 yd3. Estimate the maximum number of residences it can serve per week. It can make 3 trips per day, 4 days per week. (The fifth day is reserved for special collections, holidays, etc.) Assume each residence contains 3.5 people.
10

Management
What can be done with it all?
11

Raw Materials
Materials Processing
Product Manufacture
Packaging, Distribution
Product Use
Disposal
Reuse
Remanufacture
RecycleDefinitions
12

Activity Q3What is the preferred waste management hierarchy?
A. Recycling, Landfilling, Incineration
B. Landfilling, Recycling, Incineration, Reuse
C. Recycling, Incineration with energy recovery, Incineration w/o energy recovery, Landfilling
D. Reuse, Composting, Incineration, Landfilling
E. Recycling, Reuse, Remanufacturing, Landfilling
F. None of the above13

Management Hierarchy & Integrated Solid Waste Management (Section 14.7)
14

Historical Management (tons)
15

Management By Region
16

Activity Q4What will impact the choice for a community’s integrated solid waste management system?
A. Bans
B. Diversion mandates
C. Current disposal capacity
D. Future disposal capacity
E. Political climate
F. Federal/state money available
G. Citizen complacency17

Source Reduction (Section 14.6)
Durable Goods
Nondurable Goods
Containers and Packaging
Other MSW
18

Recycling (Section 14.3)
19
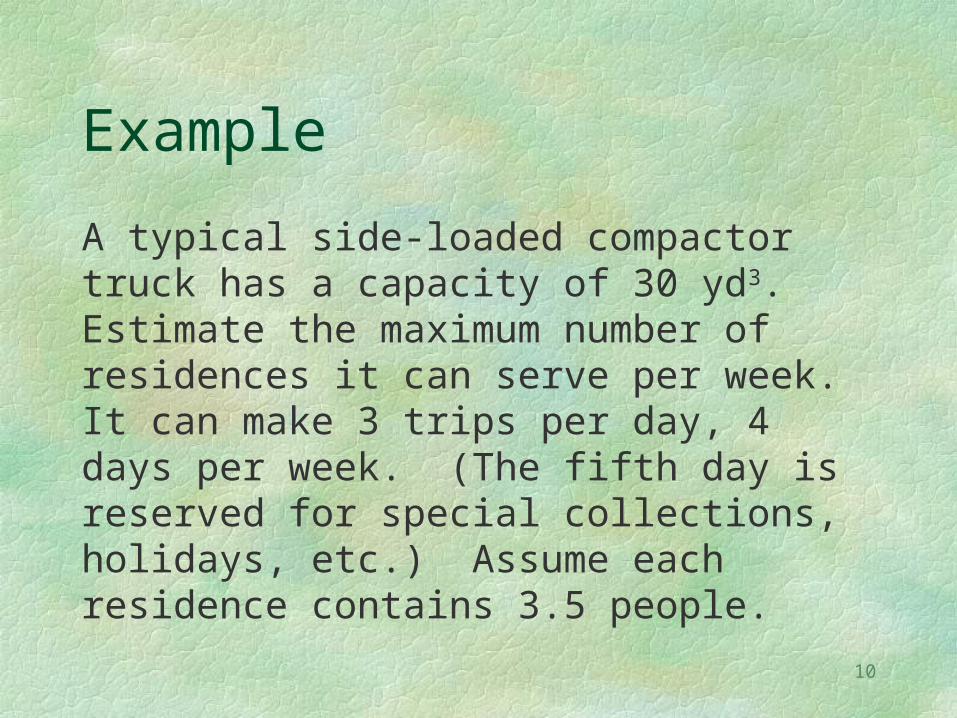
Recycling Costs, Recycling Benefits
What are they?
20

Marketing
21

Activity Q5
What makes material recyclable?
A. Has the chasing arrows symbol on it
B. Collectable and marketable
C. Fairly abundant in the waste stream, processable, and marketable
D. Some in the waste stream and processable
22

The Chasing Arrows
23

24

O 2 Nutrients H 2O
H2O Heat CO2
Microorganisms
Compost or humus
Special Recycling: CompostingControlled aerobic partial degradation of organic wastes
25

CompostingMethod
Level Windrow Geometry
(h x l)
Mixing Rate
Time (y)
Minimal 12' x 24' Annually 3 Low 6' x 12' 3x per year 1.5 Intermediate 5-7' x 10-14' Weekly 0.5 High 10' x 200' Periodically 0.25 -1
26

Combustion (Section 14.4)
27
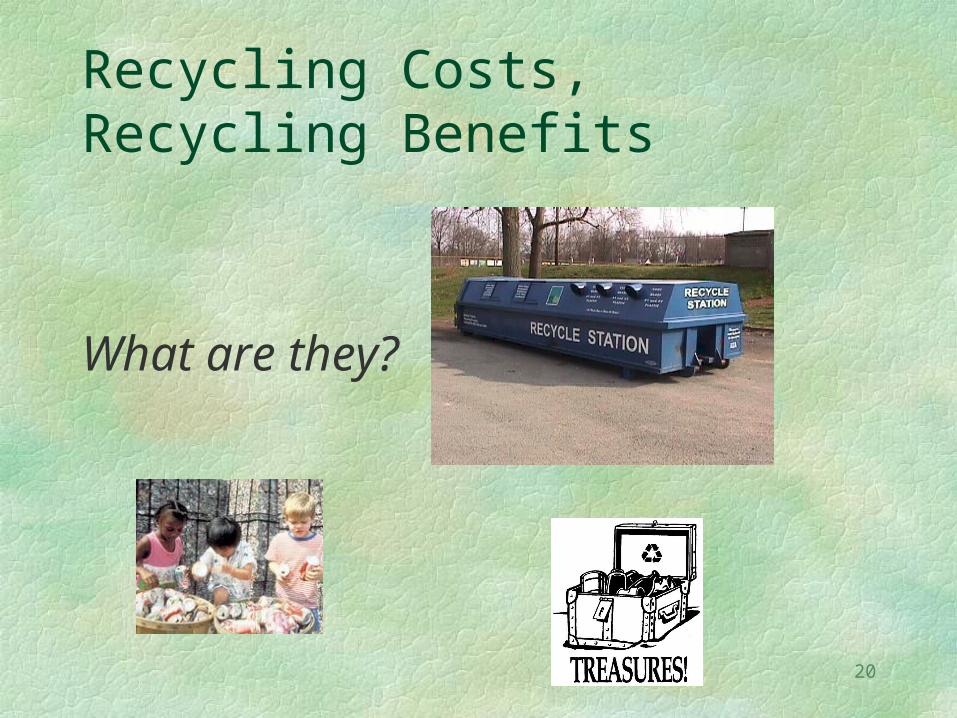
Current Use
28

Activity Q6What are the advantages of incineration?
A. There are none. Landfilling and recycling are better.
B. It destroys toxic organics.
C. It reduces long-term liability.
D. It’s cheaper.
E. It can produce energy.
F. It reduces the volume needing landfilling.
G. It produces air pollution instead of water pollution.
H. It can improve the recycling rate.
I. It has a smaller footprint. 29

Pollution Control
30

Costs
Net Total Cost(Study published 2/07)
Net Total Life Cycle Criteria Emissions(Study published 2/07)
31

Historic “Landfills” (aka dumps) (Section 14.5)
32

Activity Q7
What are the types of landfills?
A. Good, bad, and awful
B. Secure, sanitary, and monofill
C. Hazardous waste, municipal solid waste, and construction and demolition
D. Bioreactor and industrial waste
33

Modern Sanitary Landfill Design
34

Sanitary Landfill Design
Clay
Waste
Gas
collection
Leachate
collection
Sand
Liner
Cap
Beware: critical angles, permeabilities35
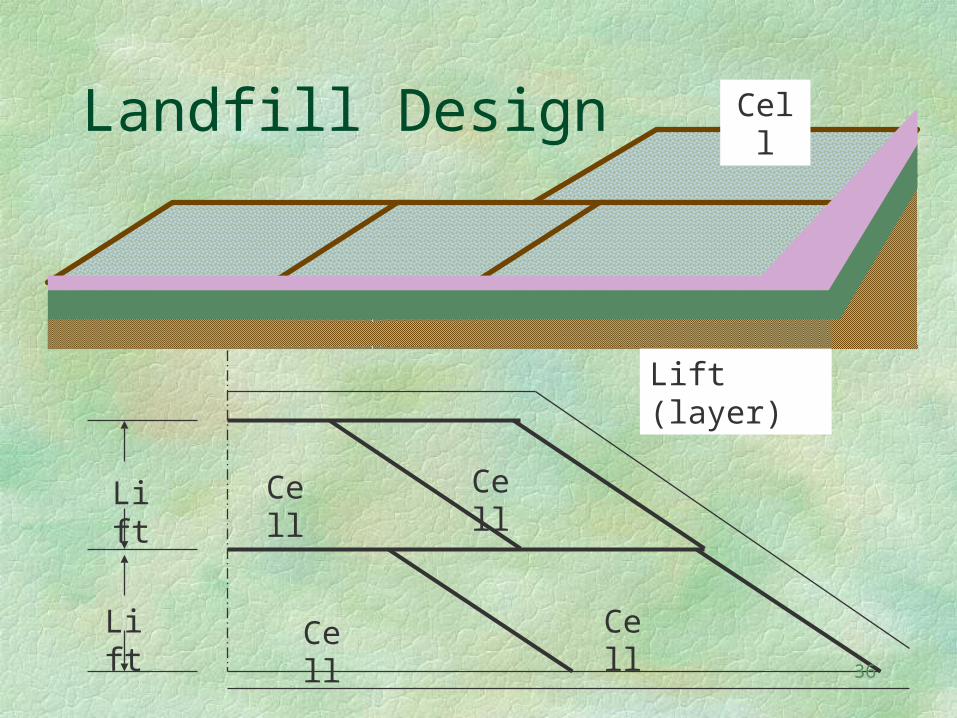
Landfill Design
Lift (layer)
Cell
Cell
Cell
Cell
CellLift
Lift
36
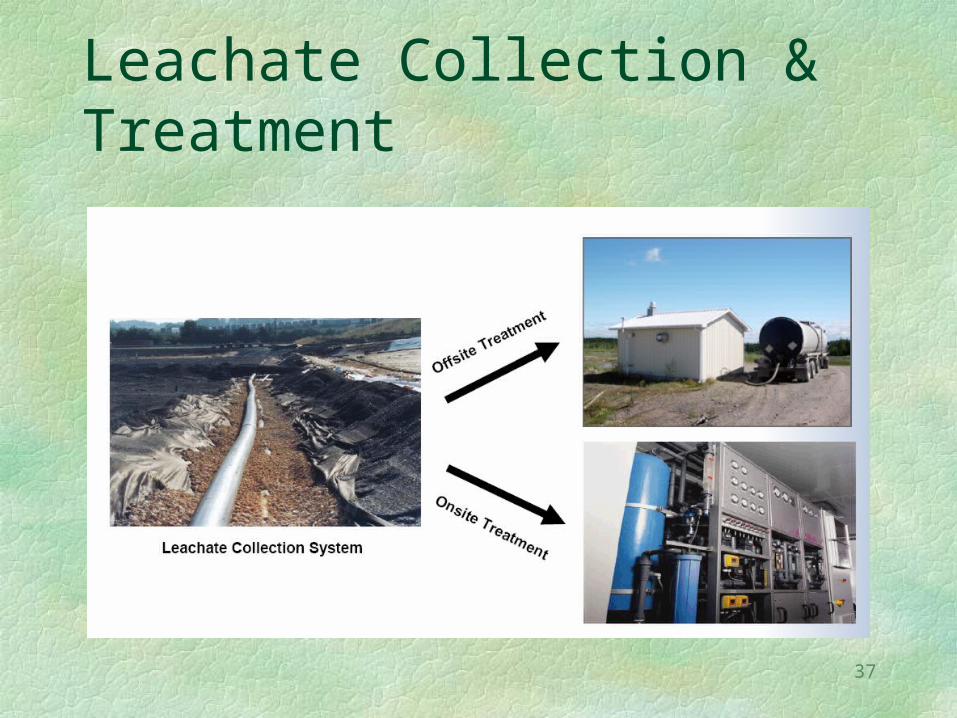
Leachate Collection & Treatment
37

LFG Collection & Management
38

Landfill Number and Capacity
Illinois
39

Activity Q8
Regulatory requirements for landfill siting include:
A. Keep a minimum distance from airports
B. Keep away from communities
C. Cover the waste daily
D. Keep out of floodplains, wetlands, and unstable soils
E. Prevent hazardous waste from being deposited
F. Monitor groundwater and gas generation
G. Install liner plus leachate and gas collection systems
40

Other Siting Issues
NIMBY
Not In My Back YardNIMET
Not In My Elected TermBANANA
Build Absolutely Nothing Anytime Near Anyone
41
Related Documents