Solid Freeform Fabrication Proceedings September, 1993 ADA 4q 7779/f The breadth of Solid Freeform Fabrication as an important and totally integrated approach to design, materials processing and manufacturing is contained in this proceedings of the SFF Symposium held in Austin, Texas on August 9-11, 1993 SFF Topics covered in the Symposium include: Accesion For Computer Sectioning NTIS CRA&I •Machine Design TIoc rAa• Materials Processing: Unan,•ounced [] Metals "By Ceramics Di~s~iu •Polymers Waxes • ,.odes Composites Dist Applications A4 Harris L. Marcus, Joseph J. Beaman, ( Joel W. Barlow, David L. Bourell, and Richard H. Crawford, Editors o © 1993 The University of Texas at Austin All rights of reproduction in any form are protected by U.S. Copyright Laws. Permission to copy all or portions of the proceedings contents must be obtained from the authors and The University of Texas at Austin. Library of Congress ISSN 1053-2153 DTC QtUALTry INSpECTMD 3

Welcome message from author
This document is posted to help you gain knowledge. Please leave a comment to let me know what you think about it! Share it to your friends and learn new things together.
Transcript
Solid Freeform FabricationProceedings
September, 1993
ADA 4q 7779/fThe breadth of Solid Freeform Fabrication as an important and totally integrated
approach to design, materials processing and manufacturing is contained in thisproceedings of the SFF Symposium held in Austin, Texas on August 9-11, 1993
SFF Topics covered in the Symposium include:
Accesion For Computer SectioningNTIS CRA&I •Machine Design
TIoc rAa• Materials Processing:Unan,•ounced []
Metals"By Ceramics
Di~s~iu •Polymers
Waxes• ,.odes
CompositesDist Applications
A4Harris L. Marcus, Joseph J. Beaman, (Joel W. Barlow, David L. Bourell,
and Richard H. Crawford, Editors o
© 1993 The University of Texas at Austin
All rights of reproduction in any form are protected by U.S. Copyright Laws.
Permission to copy all or portions of the proceedings contents must be obtained
from the authors and The University of Texas at Austin.
Library of Congress ISSN 1053-2153
DTC QtUALTry INSpECTMD 3

BestAvailable
Copy
BUREAU OF ENGINEERING RESEARCH
S-THE UNIVERSITY OF TEXAS AT AUSTIN
Centerfor Materials Science and Engineering -ETC 9.104 Austin, Texas 78 712-1063
(512)471-1504 -FAX (512)471-7681 Telex 405 705 UT GRAD AUSUD
March 31, 1994
Scientific Office Code: 113INSteven G. FishmanOffice of Naval Research 04- o- 7 g800 North Quincy StreetArlington VA 22217-5000
REF: Grant no.: N00014-93-1-0371
Dear Steve:
Enclosed are three copies of the Solid Freef, m Fabrication Symposium Proceedings1993 submitted to fulfill the final report requirement of the referenced grant. Copies of theProceedings were originally distributed in fall of 1993. A full list of attendees is included in theProceedings. Please call me at 512-471-3188 if you have any questions.
Sincerely,
T or Higher Education
a wed Professorship in Engineering #1
HLM/vl
cc: Office of Sponsored Projects, UT
Table of Contents
P r e fa c e .......................................................................................................................................... v
M aterial Issues in Layered Form ing ...................................................................................... 1Christina Amon, Jack Beuth, Helmut Kirchner, Robert Merz,Fritz Prinz, Kevin Schmaltz and Lee Weiss; Carnegie Mellon University
StereoLithography Epoxy Resin Development: Accuracy andD im ensional Stability .................................................................................................................. 11
Thomas H. Pang; 3D Systems, Inc.
Vibratory Finishing of StereoLithography Parts ................................................................ 27John D. Spencer, Richard C. Cobb, and Phillip M. Dickens;The University of Nottingham
Structural Ceramic Components by 3D Printing ............................................................... 40J. Yoo, Michael J. Cima, S. Khanuja, and E. M. Sachs;Massachusetts Institute of Technology
D irect Laser Sintering of M etals ........................................................................................... 51William T. Carter, Jr., and Marshall G. Jones;GE Corporate Research & Development
Solid Freebody Forming of Ceramics From Polymerizable Slurry ................................... 60K. Stuffle, and A. Mulligan; Advanced Ceramics Research CompanyPaul Calvert, and John Lombardi; Arizona Materials Laboratories
Development of Nanocomposites for Solid Freeform Fabrication ..................................... 64Arumugam Manthiram, F. Chi, L. F. Johnson, B. R. Birmingham,and H. L. Marcus; The University of Texas at Austin
Part Fabrication Using Laser Machining and Welding ..................................................... 74M. S. Pridham, and G. Thomson; University of Dundee
Picoliter Solder Droplet Dispensing ...................................................................................... 81Ronald E. Marusak; MicroFab Technologies, Inc.
Control Parameters and Material Selection Criteria for RapidP rototyping System s .................................................................................................................... 86
James W. Comb, and William R. Priedeman; Stratasys, Inc.
Reducing or Eliminating Curl on Wax Parts Produced in theSinterstationTm 2000 System ................................................................................................... 94
Paul Forderhase, and Richard Corden; DTM Corporation
Computer Aspects of Solid Freeform Fabrication: Geometry,Process C ontrol, and D esign ..................................................................................................... 102
Richard H. Crawford; The University of Texas at Austin
Virtual Reality and Rapid Prototyping: Conflicting or Complementary? .......................... 113Ian Gibson, D. Brown, S. Cobb and R. Eastgate;The University of Nottingham
Optimization of 2D CT Data Sets for Three-Dimensional CraniofacialIm aging and M odeling .............................................................................................................. 121
Richard A. Levy; The University of Michigan Hospitals
Some Efficient Procedures for Correcting Triangulated Models ......................................... 126Ismo Mdikeli, and A. Dolenc; Helsinki University of Technology
R obust P rototyp ing ................................................................................................................... 135Jana K. Chari, and J. L. Hall; Iowa State University
Sim ulation of Solid Freeform Fabrication .............................................................................. 143Stuart B. Brown; Massachusetts Institute of Technology
Automated 4 Axis Adaptive Scanning With the Digibotics Laser Digitizer ........................ 150Stephen Koch; Digibotics, Inc.
StereoLithography 1993: QuickCas tTM .............................................. . . . . . . . . . . . . . . . . . . . . . . . . . . .. .. . . . . . . . 158Thomas H. Pang, and Paul F. Jacobs; 3D Systems, Inc.
FFF at Ford M otor C om pany .................................................................................................. 168Sean O'Reilly; Ford Motor Company
An Experimental Study of the Parameters Affecting Curl in Parts CreatedU sing Stereolithography ........................................................................................................... 178
Leslie Horton, and Michael Keefe; University of Delaware;E. P. Gargiulo; E. L duPont de Nemours & Co., Inc.
Homogenization Design and Layered Manufacturing of a Lower Control Armin Project M A X W E L L ............................................................................................................. 186
Roy Johanson, N. Kikuchi, and P. Papalambros; University of Michigan;Fritz Prinz, and Lee Weiss; Carnegie Mellon University
An Evaluation of the Mechanical Behavior of Bronze-NI CompositesProduced by Selective Laser Sintering .................................................................................... 193
Mukesh Agarwala, D. L. Bourell, B. Wu, and J. J. Beaman;The University of Texas at Austin
Silicon Carbide Preforms for Metal Infiltration by Selective Laser Sintering TM
of Pol, iner Encapsulated Powders .......................................................................................... 204N. K. Vail, J. W. Barlow,and H. L. Marcus;The University of Texas at Austin
Fabrication of Ceramic and Metal Matrix Composites From Selective LaserSintered C eram ic Preform s ...................................................................................................... 215
Lucy Deckard, and T. Dennis Claar; Lanxide Corporation
Powder Layer Position Accuracy in Powder-Based Rapid Prototyping .............................. 223Sang-Joon John Lee, E. Sachs, and M. Cima;Massachusetts Institute of Technology
The Physics of Digital Microfabrication with Molten Microdrops ...................................... 237Fuquan Gao, and A. A. Sonin;Massachusetts Institute of Technology
Material and Process Parameters That Affect Accuracy in Stereolithography .................. 245Richard P. Chartoff, Lawrence Flach and Peter Weissman;University of Dayton
Thermal Analysis and Modeling of Steady-State Rod Growth DuringG as-Phase Solid Freeform Fabrication ................................................................................... 253
James L. Maxwell, Joseph Pegna, and Alexander Ostrogorsky;Rensselae r Polytechnic Institute
Potential Application of Solid Freeform Fabrication (SFF) Process inC eracon P/M Forging ............................................................................................................... 271
Ramas V. Raman, S. V. Rele, and R. L. Anderson; Ceracon, Inc.
M achine Vision for Rapid Geometric M odeling .................................................................... 275Visa Koivunen, and R. Bajcsy;University of Pennsylvania
Strategy for Composite Development in Rapid Prototyping ................................................ 283R. Charan, A. Bagchi, T. Renault, and A. A. Ogale;Clemson University
Direct Generation of Contour Files from Constructive SolidG eom etry R epresentations ....................................................................................................... 291
Sashidhar Guduri, R. H. Crawford, and J. J. Beaman;The University of Texas at Austin
Indirect Metal Composite Part Manufacture Using the SLS Process .................................. 303James R. Tobin, B. Badrinarayan, J. W. Barlow, J. J. Beaman, andD. L. Bourell; The University of Texas at Austin
Solid Freeform Fabrication of Silicon Carbide Shapes by SelectiveLaser R eaction Sintering (SLRS) ............................................................................................. 308
Britton R. Birmingham, and H. L. Marcus;The University of Texas at Austin
Supersolidus Liquid Phase Selective Laser Sintering of PrealloyedB ronze P ow der ........................................................................................................................... 3 17
Gopalakrishna Prabhu, and D. L. Bourell;The University of Texas at Austin
Selective Area Laser Deposition of Silicon Carbide ............................................................... 325James V. Tompkins, and H. L. Marcus;The University of Texas at Austin
Drying of Colloidal Binder Infiltrated Ceramic Green Parts Producedby Selective Laser Sintering TM ...................................................... .. .. .. .. . . .. .. .. .. .. .. .. .. . . . . . . . . . . . . . . . . . 333
M. Glazer, N. K. Vail, and J. W. Barlow;The University of Texas at Austin
Synthesis, Selective Laser Sintering and Infiltration of High Tc Dual PhaseAg-YBa 2Cu 3O7.x Superconductor Composites .................................................................... 339
Mukesh Agarwala, D. L. Bourell, A. Manthiram, B. R. Birmingham, andH. L. Marcus; The University of Texas at Austin
iii

Selective Laser Sintering of A120 3 ................................................... .. .. .. .. .. .. .. .. .. .. .. . . . . . . . . . . . . . . . . . . 350P. K. Subramanian, G. Zong, N. Vail, J W. Barlow, andH. L. Marcus; The University of Texas at Austin
Laser Sintering Model for Composite Materials .................................................................... 360James C. Nelson, N. K. Vail, and J. W. Barlow;The University of Texas at Austin
Measurement of the Thermal Conductivity of Powders by TwoD iff erent M ethods ..................................................................................................................... 370
Samuel Sumin Sih, and J. W. Barlow;The University of Texas at Austin
Selective Laser Sintering of Bioceramic Materials for Implants .......................................... 376Goonhee Lee, and J. W. Barlow;The University of Texas at Austin
K ey W ord In d ex ................................................................................................................... 381
A u th or/A ttend ee L ist .......................................................................................................... 383
iv
PREFACE
This Proceedings of the Fourth Solid Freeform Fabrication Symposium, held at TheUniversity of Texas in Austin on August 9-11, 1993, reaffirms the dynamic nature of theresearch area. The interest shown by researchers over the wide range of disciplines and sub-disciplines that make up Solid Freeform Fabrication (SFF) highlights this technical Symposium.The speakers addressed problems in computer software, in machine design, materials synthesisand processing, and SFF in integrated manufacturing. The exponential growth in the research,application and development of SFF approaches was readily apparent from the attendees fromindustrial users, SFF machine manufacturers, universities, and government. This Symposium isthe first where real progress toward structurally sound samples and parts was demonstrated asSFF moves from "feelie" to "non-structural" to "structural" real parts over a range of materials.This advancement in the state-of-the-art of SFF will continue to drive the exponential growth ofthe area. The excitement amongst the Symposium participants will continue to serve as thecatalyst for the continued growth and the availability of Solid Freeform Fabrication. TheSymposium organizers look forward to its being a continued source of technical exchange amongthe growing body of researchers involved in SFF.
The Symposium was organized in a manner to allow the multi-disciplinary nature of theSFF research to be presented coherently, with various sessions emphasizing computer aspects,machine topics, and the variety of materials aspects of SFF. Application-related efforts werescattered throughout the Symposium. To avoid parallel sessions a poster session was organized,aud the panel session on SFF was held in the evening, after a visit with Texas barbecue. Thedynamic panel discussion on Future Directions in SFF was led by Marshall Burns, Michael J.Cima, Tom Latham, Greg Sanders and Joel W. Barlow. The written versions of the presentedpapers are incorporated into these Proceedings. The editors would like to thank the speakers fortheir timely delivery of the manuscripts that expedited the publication of these Proceedings. Theconstantly changing state of the SFF art as represented by these Proceedings will serve both thepeople presently involved in this fruitful area as well as new researchers and users coming intoSolid Freeform Fabrication.
The editors would also like to extend a warm thank you to Renee Loyless-May for herextensive efforts in the detailed handling of the logistics of the meeting and the Proceedings. Wewould also like to thank the organizing committee, the speakers, the session chairmen, panelmembers, and the attendees for their enthusiastic contributions. We look forward to thecontinued close cooperation of the SFF community in organizing the Symposium. We also wantto thank ONR through Grant No. N00014-93-1-0371, ARPA, and The Minerals, Metals andMaterials Society for co-sponsoring the Symposium as well as DTM Corporation for hosting thereception.
The editorsOrganizing Committee:
Dick Aubin, United TechnologiesJoel W. Barlow, The University of Texas at AustinJoseph J. Beaman, The University of Texas at AustinDavid L. Bourell, The University of Texas at AustinRobert L. Brown, The Gillette CompanyWilliam Coblenz, ARPARichard Crawford, The University of Texas at AustinSamuel Drake, University of UtahSteven Fishman, Office of Naval ResearchHarris L. Marcus, The University of Texas at AustinFritz Prinz, Carnegie Mellon UniversityEmanuel Sachs, Massachusetts Institute of TechnologyGreg Sanders, General Motors CorporationSean O'Reilly, Ford Motor CompanyRalph Wachter, Office of Naval ResearchMichael Wozny, Rennselaer Polytechnic Institute
V
Material Issues in Layered Forming
Christina Amon, Jack Beuth, Helmut Kirchner,Robert Merz, Fritz Prinz, Kevin Schmaltz, Lee Weiss
Carnegie Mellon UniversityPittsburgh, PA
Abstract
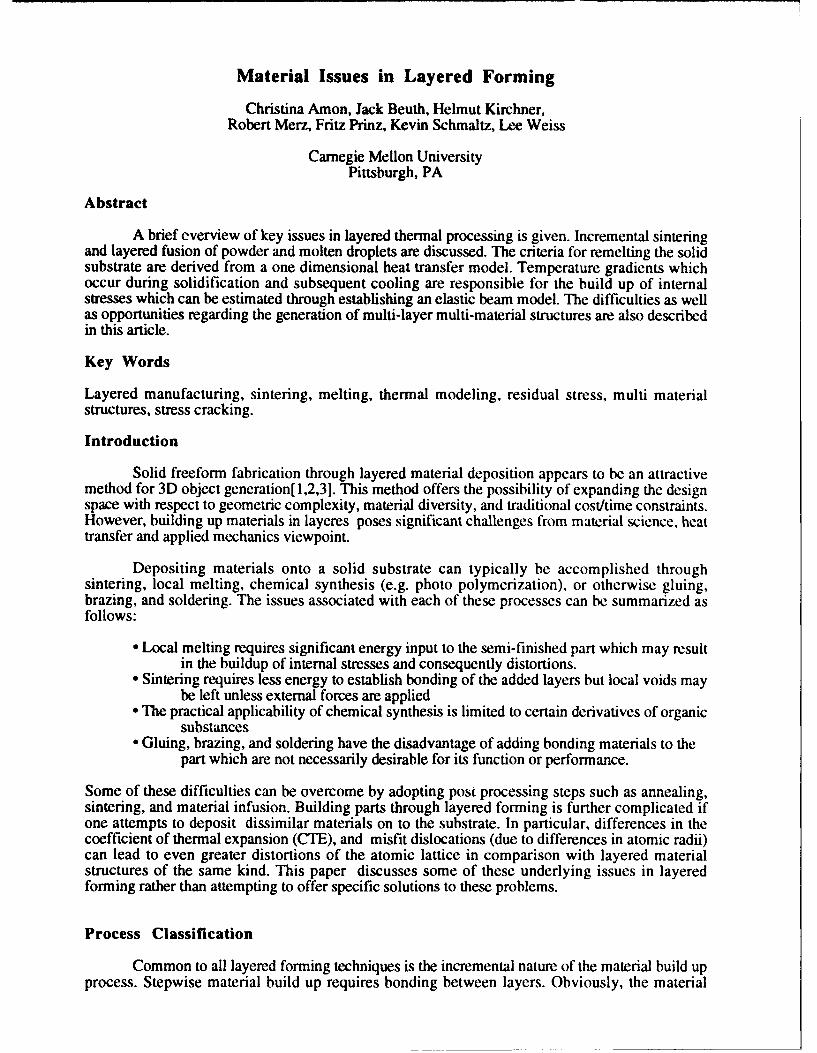
A brief everview of key issues in layered thermal processing is given. Incremental sinteringand layered fusion of powder and molten droplets are discussed. The criteria for remelting the solidsubstrate are derived from a one dimensional heat transfer model. Temperature gradients whichoccur during solidification and subsequent cooling are responsible for the build up of internalstresses which can be estimated through establishing an elastic beam model. The difficulties as wellas opportunities regarding the generation of multi-layer multi-material structures are also describedin this article.
Key Words
Layered manufacturing, sintering, melting, thermal modeling, residual stress, multi materialstructures, stress cracking.
Introduction
Solid freeform fabrication through layered material deposition appears to be an attractivemethod for 3D object generation[ 1,2,3]. This method offers the possibility of expanding the designspace with respect to geometric complexity, material diversity, and traditional cost/time constraints.However, building up materials in layeres poses significant challenges from material science, heattransfer and applied mechanics viewpoint.
Depositing materials onto a solid substrate can typically be accomplished throughsintering, local melting, chemical synthesis (e.g. photo polymerization), or otherwise gluing,brazing, and soldering. The issues associated with each of these processes can be summarized asfollows:
"* Local melting requires significant energy input to the semi-finished part which may resultin the buildup of internal stresses and consequently distortions.
"* Sintering requires less energy to establish bonding of the added layers but local voids maybe left unless external forces are applied
"* The practical applicability of chemical synthesis is limited to certain derivatives of organicsubstances
"* Gluing, brazing, and soldering have the disadvantage of adding bonding materials to thepart which are not necessarily desirable for its function or performance.
Some of these difficulties can be overcome by adopting post processing steps such as annealing,sintering, and material infusion. Building parts through layered forming is further complicated ifone attempts to deposit dissimilar materials on to the substrate. In particular, differences in thecoefficient of thermal expansion (CTE), and misfit dislocations (due to differences in atomic radii)can lead to even greater distortions of the atomic lattice in comparison with layered materialstructures of the same kind. This paper discusses some of these underlying issues in layeredforming rather than attempting to offer specific solutions to these problems.
Process Classification
Common to all layered forming techniques is the incremental nature of the material build upprocess. Stepwise material build up requires bonding between layers. Obviously, the material
quality of a part is determined by the quality of each deposited layer as well as the quality of thebond between the layers. The following classification for material deposition processing in layeredmanufacturing is chosen. Processes are listed with respect to the temperature regimes in which theyoperate at and issues of concern regarding the resulting articles. This list is by no means exhaustivewith important problems like speed, surface quality and accuracy not being addressed.
Process aTnqtatC IssuesSintering T<TM Density
Postprocessing
Melt On T>TM Residual StressWarpageDebonding
Postprocessing
Glueing T-TR StrengthPowder PostprocessingSheet
Photocuring T-TR Limited MaterialRangeResidual Stress
In the following, we limit our discussion mostly to thermal processing issues (e.g.sintering,melting) some of which are also relevant for processes occurring at room temperature.
Sintering
Layered powder deposition followed by laser sintering has become an establishedprototyping process; for more details see [1]. The physics of any sintering process is based onparticle fusion at temperatures below the material melting point. During sintering necks formbetween adjacent powder particles thus reducing the surface area and increasing the density of thepowder aggregate. The driving force for this process is the reduction of the particle surface freeenergy. The densification rate is proportional to that reduction.
In order to change the shape of the powder particles, matter or vacancies need to flow.(Vacancy flow can be considered as the counterflow of matter, both concepts are equivalent). Thedensification rate depends further on the combination of the transport path of the matter as well asthe source of the matter. Ashby [4] distinguishes six different path/source combinations e.g.:surface diffusion from surface, boundary diffusion from boundary, or volume diffusion fromboundary. At different temperatures different path/source combinations dominate the flow ofmatter.
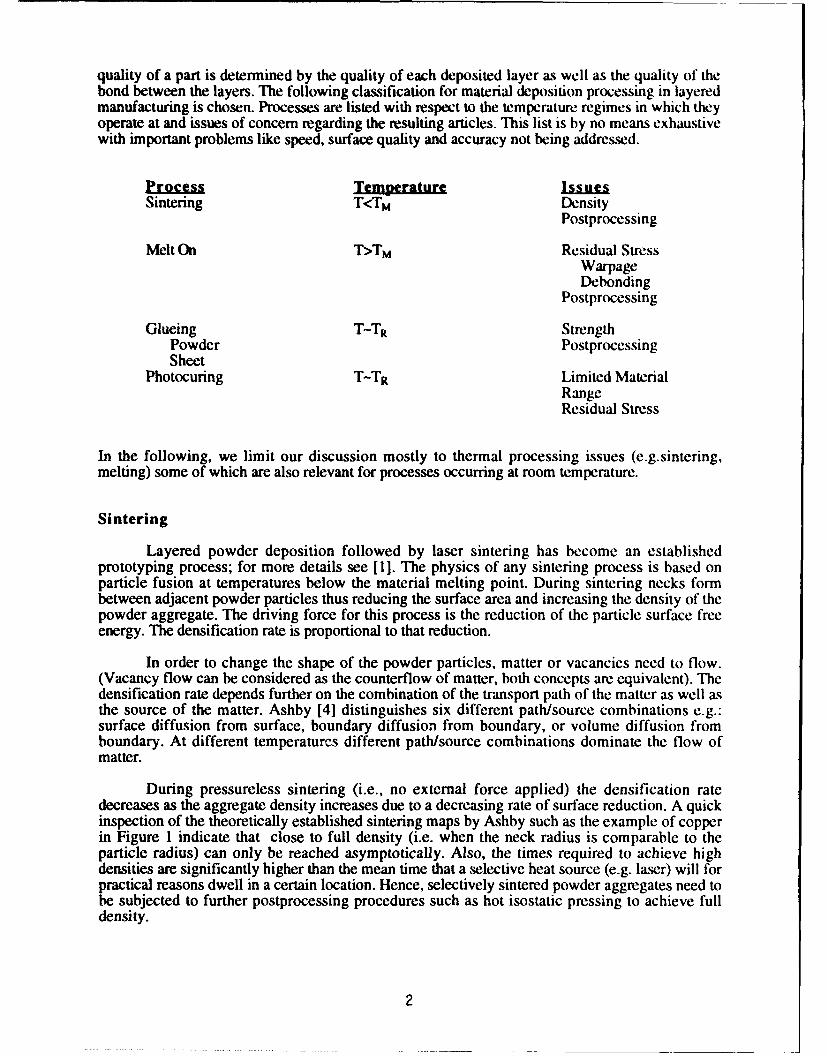
During pressureless sintering (i.e., no external force applied) the densification ratedecreases as the aggregate density increases due to a decreasing rate of surface reduction. A quickinspection of the theoretically established sintering maps by Ashby such as the example of copperin Figure 1 indicate that close to full density (i.e. when the neck radius is comparable to theparticle radius) can only be reached asymptotically. Also, the times required to achieve highdensities are significantly higher than the mean time that a selective heat source (e.g. laser) will forpractical reasons dwell in a certain location. Hence, selectively sintered powder aggregates need tobe subjected to further postprocessing procedures such as hot isostatic pressing to achieve fulldensity.
2
TEMPERATURE C
7W M "a mBO0UNDARY D4F1FUIUI1N IOM4UDAIRy / 3zill")
-SP
- 0 1
*1.0
000 SURFACE DIFFUSIOFROM SURFACE
-0 -'-PURE COPPER 10-'
ADHESION
0.. 0.70 6S.1O 0.90 1.00
HOMOLOGOUS TEMPERATURE TfiT
Figure 1: Sintering map of copper particles [4].
Melting On
To further enhance and accelerate the bonding of a layer to the substrate one can locallymelt already deposited powder particles or deposit molten droplets as done for example in thermalspraying [21. Two scenarios can be envisioned: In the first one the molten droplet adapts to theshape of the underlying substrate. In the second the particle has sufficient energy to remelt thesubstrate and form a solid bond. In the first case two possibilities for bonding exist. The moltendroplets simply form a mechanical interlock as commonly observed in thermal spraying [4].Alternatively, the droplets may also bond to the substrate through a sinter mechanism in whichnecking occurs by shape adaptation of the molten droplet and diffusion within or on the surface ofthe substrate. The rate of bond formation will obviously be higher compared to the pure sinter caseas described earlier.
In addition to the structure of the bond, the microstructure resulting from the solidificationof the droplets is key to the strength of the layered article. Therefore an understanding of the entiretemperature history is important for planing layered manufacturing processes. Also, highertemperature gradients involved in melting compared to pure sintering tends to lead to the formationof higher residual stresses.
In the following sections we address the issue of predicting the thermal history of themelting process as well as the build up of residual stresses after solidification.
Thermal Modelhng
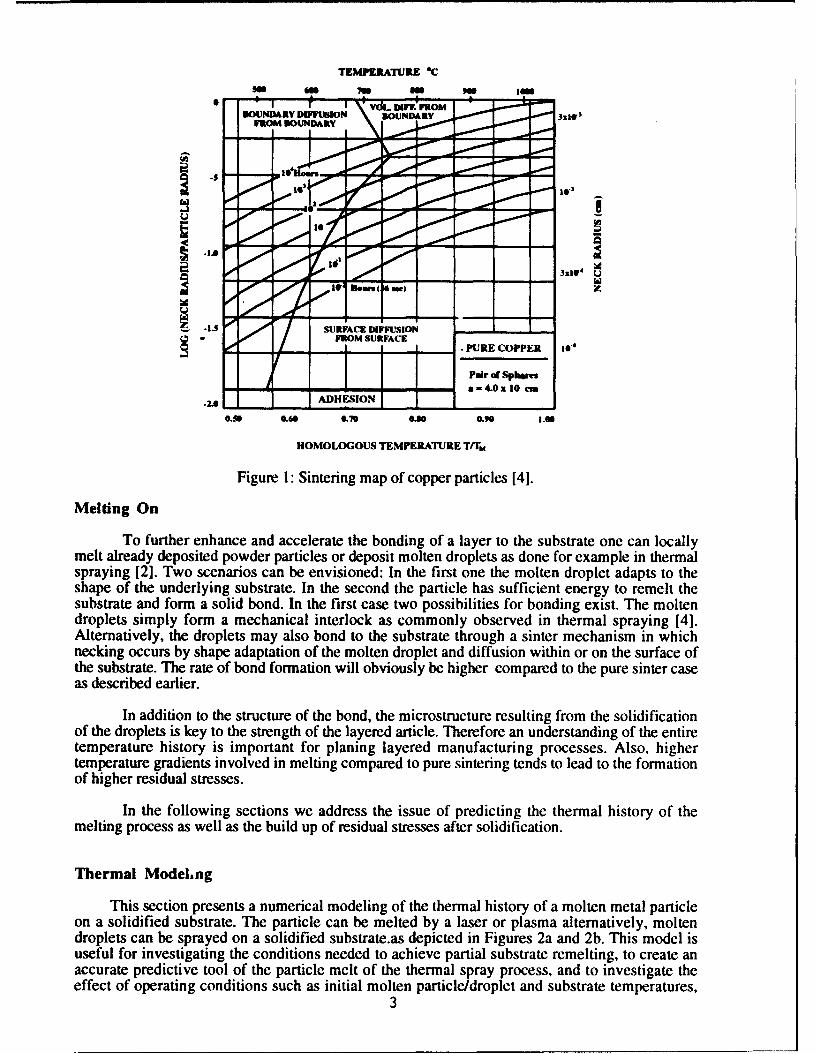
This section presents a numerical modeling of the thermal history of a molten metal particleon a solidified substrate. The particle can be melted by a laser or plasma alternatively, moltendroplets can be sprayed on a solidified substrate.as depicted in Figures 2a and 2b. This model isuseful for investigating the conditions needed to achieve partial substrate remelting, to create anaccurate predictive tool of the particle melt of the thermal spray process, and to investigate theeffect of operating conditions such as initial molten particle/droplet and substrate temperatures,
3
size, surface heat transfer and sprayed material properties on the resulting melting front migrationrate and thickness, temperature distribution, and overall cooling rates.
ILaser,Plasma
moltendroplet
Solid Substrate Solid Substraie
(a) (b)
Figure 2 (a) molten powder particle (b) molten droplet deposition.
In the following we refer to molten particles as well as droplets from sprayin- just asdroplets. Application parameters such as laser energy or spray gun power input, and depositionrates may then be modified to optimize the deposited material microstructure.
The numerical model for determining process temperatures and remelting conditions issimplified to a one-dimensional, heat transfer problem by assuming that the impacted droplet widthis sufficiently greater than height, and that the droplet flattening time scale is much shorter than thedroplet solidification time scale.This phenomena is modeled by the governing equation of the form:
oaT M [o•2 T] ok(T) aoT 2
P Cp = k+ (
for temperature T, density r, specific heat cp, and thermal conductivity k. The ak/lT term isomitted since the thermal conductivity variation is slight for the materials and temperature rangesconsidered, although temperature dependent thermal properties are used [61. This equation is validfor both the liquid region as well as the solid region. Above the top liquid surface, combinedconvective and radiative boundary conditions exist, while the energy balance:
p L a = ksol T - kliq -a (2)at a)t at
is applied at the interface between the liquid and solid regions, balancing the energy flux into andout of the interface with the release of latent heat (L) For the lower boundary of the solid region aconstant substrate temperature is assumed at a remote distance from the surface.
The energy equation is discretized using an Eulerian explicit formulation. To track thelocation of the melting front during the solidification process, a three-point Lagrange interpolationformula is used to approximate the temperature function [71 at the nodes preceding and followingthe melting point. This assumes a torm that can be readily incorporated into the finite differenceformulation used, but permits the location of a varying "node" point corresponding to the meltingfront. The new front location is calculated after each iteration using the discretized interface energybalance equation. To approximate the initial interface temperature when the known liquid dropletfirst strikes the known solid substrate the analytical Stefan interface solution is used:
Tinter. = [RATIO*Tliq + Tsol]/[l+ RATIO] (3)
4
RATIO = /(k cp p)liq / (k cp p),so (4)
For the complete duration of the thermal system modeling, the Stefan solution is not an accuraterepresentation of the actual boundary conditions. However, for the initial interface condition thesolution above can be used because boundary conditions corresponding to two semi-infinite bodiesin contact remain valid until the temperature fluctuation propagates to the liquid surface.
For the first droplet, the initial conditions assumed are uniform droplet and ambientsubstrate temperatures. When prior molten droplets heat the substrate, the model is then modifiedto incorporate the two-dimensional effects of substrate preheating arising from the diffusion ofenergy from previously molten droplets:
p Cp = k(T) [ 2 +aT] (5)at Lx
This model reflects the process where the laser source or spray gun is moving across the substrate.As with the one-dimensional solidification model, an Eulerian explicit algorithm is used to solvethe two-dimensional energy equation. Because remelting does not occur with this lateral case thereis no Lagrangian approximation terms required. The substrate temperature profile resulting fromthis two-dimensional model is then used as the substrate initial condition for the solidificationmodel.
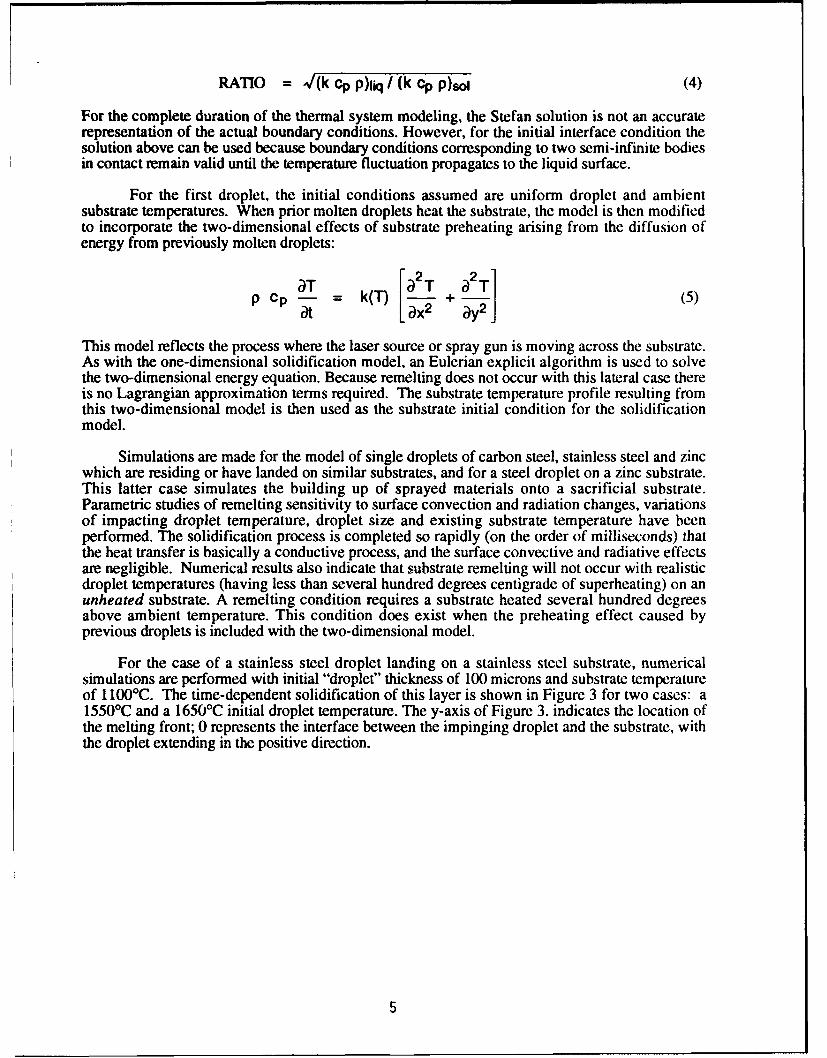
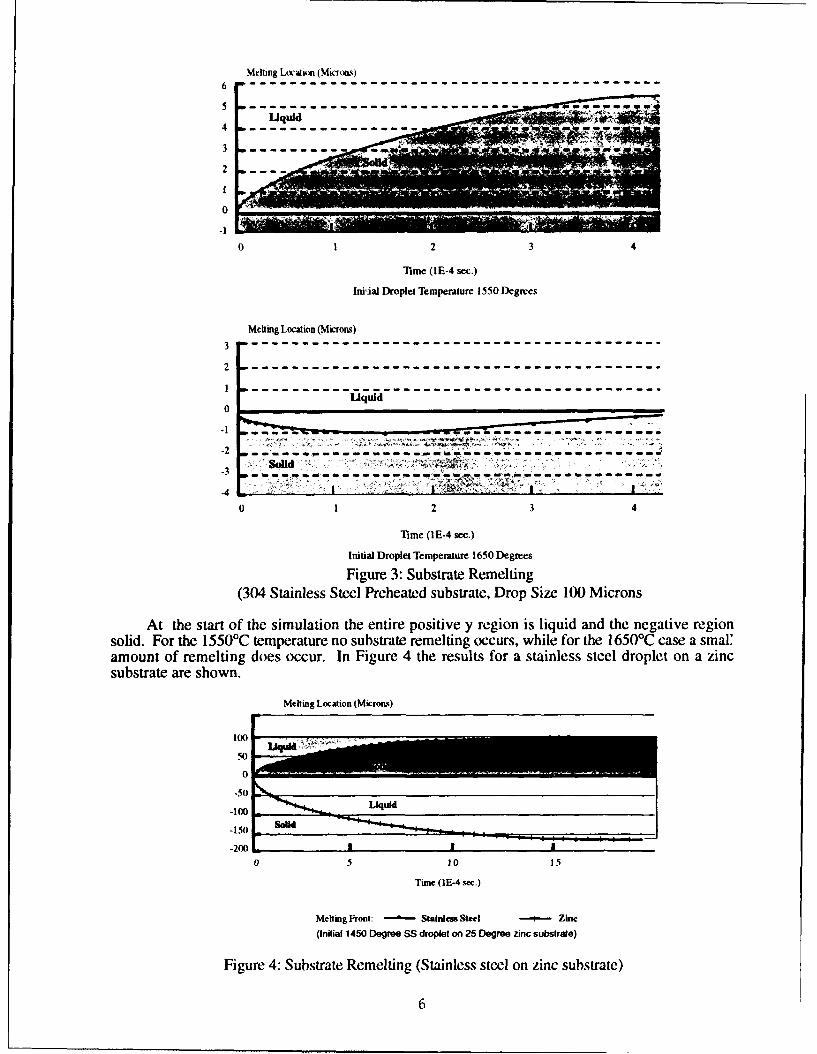
Simulations are made for the model of single droplets of carbon steel, stainless steel and zincwhich are residing or have landed on similar substrates, and for a steel droplet on a zinc substrate.This latter case simulates the building up of sprayed materials onto a sacrificial substrate.Parametric studies of remelting sensitivity to surface convection and radiation changes, variationsof impacting droplet temperature, droplet size and existing substrate temperature have beenperformed. The solidification process is completed so rapidly (on the order of milliseconds) thatthe heat transfer is basically a conductive process, and the surface convective and radiative effectsare negligible. Numerical results also indicate that substrate remelting will not occur with realisticdroplet temperatures (having less than several hundred degrees centigrade of superheating) on anunheated substrate. A remelting condition requires a substrate heated several hundred degreesabove ambient temperature. This condition does exist when the preheating effect caused byprevious droplets is included with the two-dimensional model.
For the case of a stainless steel droplet landing on a stainless steel substrate, numericalsimulations are performed with initial "droplet" thickness of 100 microns and substrate temperatureof 1 100TC. The time-dependent solidification of this layer is shown in Figure 3 for two cases: a1550'C and a 1650*C initial droplet temperature. The y-axis of Figure 3. indicates the location ofthe melting front; 0 represents the interface between the impinging droplet and the substrate, withthe droplet extending in the positive direction.
5
Melting Location (Microns)6 - - - - - - - - - - - - - - - - - - - - -
0
0 1 2 3 4
Time (IE-4 sec.)
nlid-al Droplet Temperature 1550 Degrees
Melting Location (Microns)
---------------.------------------------------
2 -- - -- - -- 2-- - -- -3- - -- - - 4- -
I ~ ~ ~ ~ ~ ~ ~ Tm -- - -- - -- - - --- ---sec.)-- -- --
ILiquildroltTmeaue15 ere
substrat are3 shown.
Mel4taingeLocation (Mirohaen ubtae ro ie1) irn
Attestr f h imltonteeniepoiie eio sliud1n0h0ngtvergo
solid. For the 150T eprtr osbtaermligocrwiefrte15Tcs m
*50
-00
-150
-200 I0 5 10 15
Tume (IE-4 see.)
Melting Front: - Stainless Steel -F Zinc
(initial 1450 Degree SS droplet on 25 Degree zintc substrate)
Figure 4: Substrate Remelting (Stainless steel on zinc substrate)
6
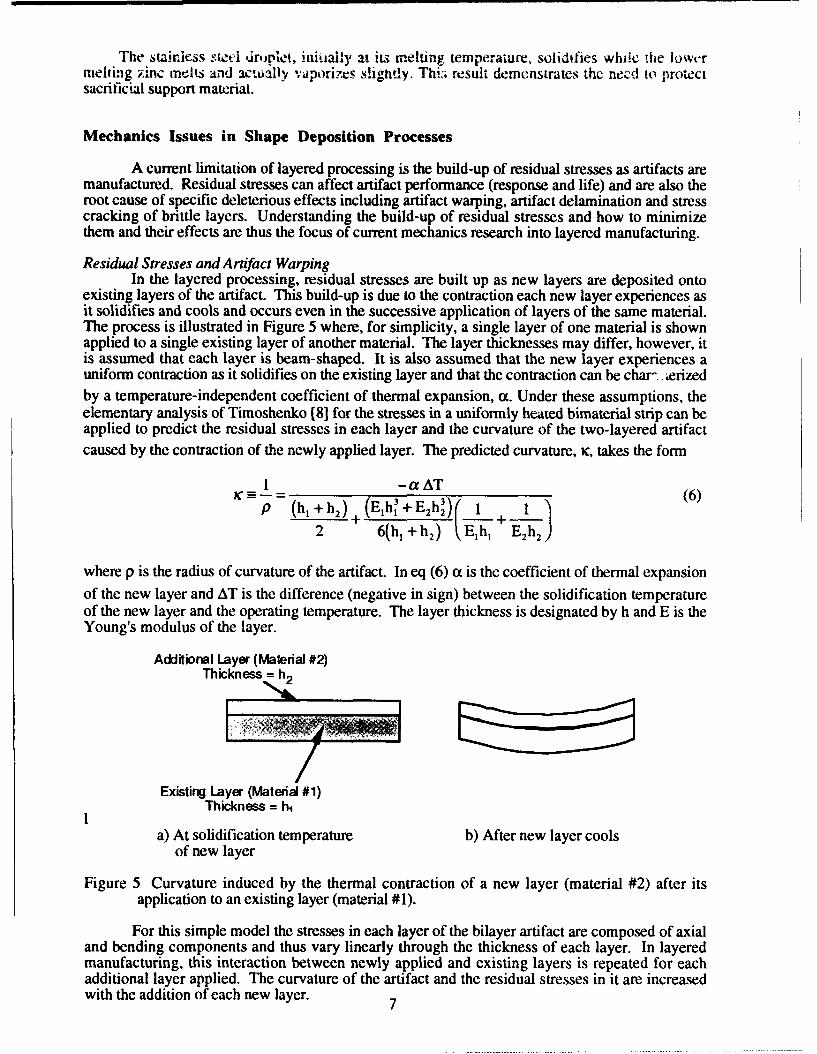
The stainiess Steel druplet, initial.y at its melting temperature, solidifies whilc the lowermelting zinc melts and actwally vwporizes slightly. Thb: result demenstrates the need to protectsacrificial support material.
Mechanics Issues in Shape Deposition Processes
A current limitation of layered processing is the build-up of residual stresses as artifacts aremanufactured. Residual stresses can affect artifact performance (response and life) and are also theroot cause of specific deleterious effects including artifact warping, artifact delamination and stresscracking of brittle layers. Understanding the build-up of residual stresses and how to minimizethem and their effects are thus the focus of current mechanics research into layered manufacturing.
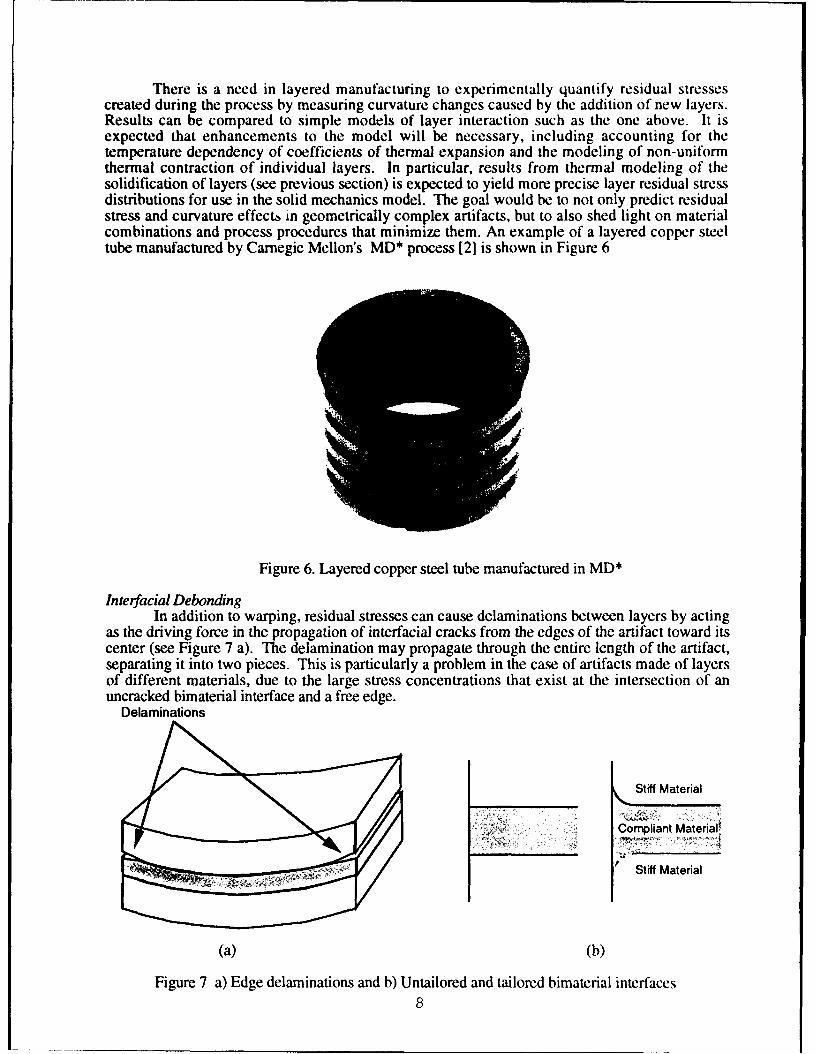
Residual Stresses and Artifact WarpingIn the layered processing, residual stresses are built up as new layers are deposited onto
existing layers of the artifact. This build-up is due to the contraction each new layer experiences asit solidifies and cools and occurs even in the successive application of layers of the same material.The process is illustrated in Figure 5 where, for simplicity, a single layer of one material is shownapplied to a single existing layer of another material. The layer thicknesses may differ, however, itis assumed that each layer is beam-shaped. It is also assumed that the new layer experiences auniform contraction as it solidifies on the existing layer and that the contraction can be char. erizedby a temperature-independent coefficient of thermal expansion, ax. Under these assumptions, theelementary analysis of Timoshenko [81 for the stresses in a uniformly heated bimaterial strip can beapplied to predict the residual stresses in each layer and the curvature of the two-layered artifactcaused by the contraction of the newly applied layer. The predicted curvature, Kc, takes the form
1 -aATK ( lh3 E It (6)p (h, +h 2 )E2h> 2h)" 1
2 6(h,+h 2 ) (,Elhi E~h2 )
where p is the radius of curvature of the artifact. In eq (6) a is the coefficient of thermal expansionof the new layer and AT is the difference (negative in sign) between the solidification temperatureof the new layer and the operating temperature. The layer thickness is designated by h and E is theYoung's modulus of the layer.
Additional Layer (Material #2)Thicknes -h
Existing Layer (Material #1)Thickness = h,
a) At solidification temperature b) After new layer coolsof new layer
Figure 5 Curvature induced by the thermal contraction of a new layer (material #2) after itsapplication to an existing layer (material #1).
For this simple model the stresses in each layer of the bilayer artifact are composed of axialand bending components and thus vary linearly through the thickness of each layer. In layeredmanufacturing, this interaction between newly applied and existing layers is repeated for eachadditional layer applied. The curvature of the artifact and the residual stresses in it are increasedwith the addition of each new layer. 7
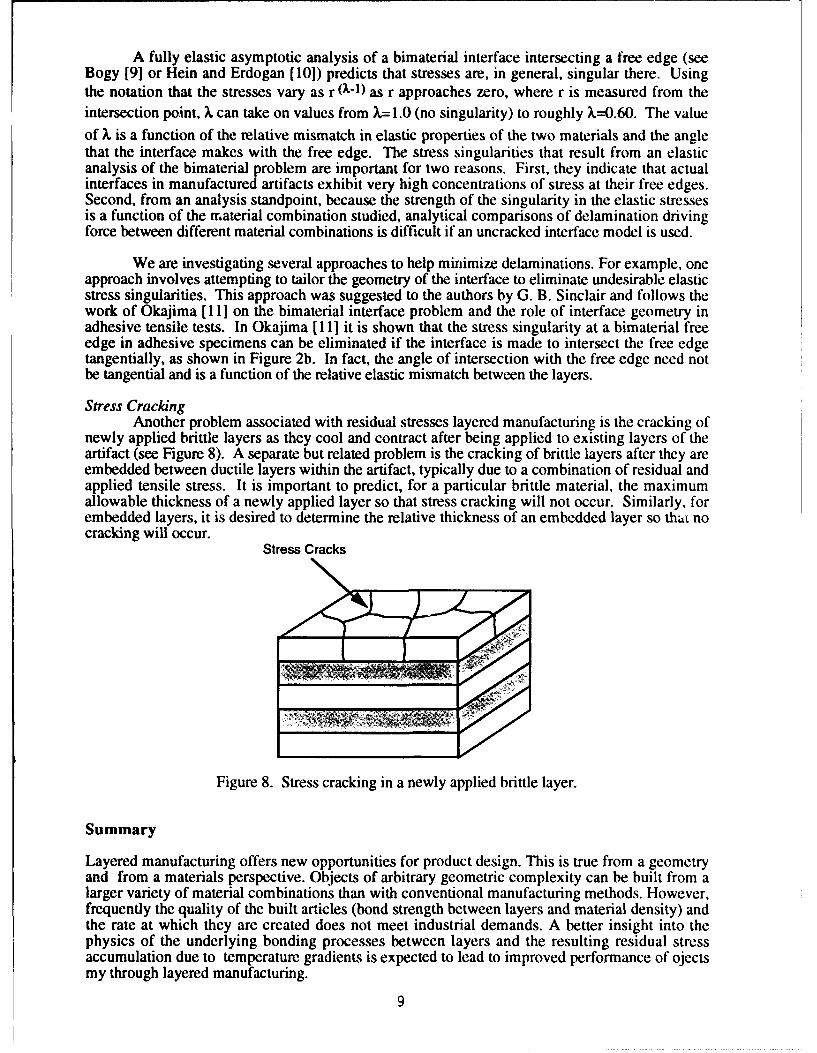
There is a need in layered manufacturing to experimentally quantify residual stressescreated during the process by measuring curvature changes caused by the addition of new layers.Results can be compared to simple models of layer interaction such as the one above. It isexpected that enhancements to the model will be necessary, including accounting for thetemperature dependency of coefficients of thermal expansion and the modeling of non-uniformthermal contraction of individual layers. In particular, results from thermal modeling of thesolidification of layers (see previous section) is expected to yield more precise layer residual stressdistributions for use in the solid mechanics model. The goal would be to not only predict residualstress and curvature effects in geometrically complex artifacts, but to also shed light on materialcombinations and process procedures that minimize them. An example of a layered copper steeltube manufactured by Carnegie Mellon's MD* process [21 is shown in Figure 6
Figure 6. Layered copper steel tube manufactured in MD*
Interfacial DebondingIn addition to warping, residual stresses can cause delaminations between layers by acting
as the driving force in the propagation of interfacial cracks from the edges of the artifact toward itscenter (see Figure 7 a). The delamination may propagate through the entire length of the artifact,separating it into two pieces. This is particularly a problem in the case of artifacts made of layersof different materials, due to the large stress concentrations that exist at the intersection of anuncracked bimaterial interface and a free edge.
Delaminations
Stiff Material
Compliant Material!
Stiff Material
(a) (b)
Figure 7 a) Edge delaminations and b) Untailored and tailored bimaterial interfaces8
A fully elastic asymptotic analysis of a bimaterial interface intersecting a free edge (seeBogy [91 or Hein and Erdogan [101) predicts that stresses are, in general, singular there. Usingthe notation that the stresses vary as r (1-1) as r approaches zero, where r is measured from theintersection point, X can take on values from X= 1.0 (no singularity) to roughly X=0.60. The valueof X is a function of the relative mismatch in elastic properties of the two materials and the anglethat the interface makes with the free edge. The stress singularities that result from an elasticanalysis of the bimaterial problem are important for two reasons. First, they indicate that actualinterfaces in manufactured artifacts exhibit very high concentrations of stress at their free edges.Second, from an analysis standpoint, because the strength of the singularity in the elastic stressesis a function of the material combination studied, analytical comparisons of delamination drivingforce between different material combinations is difficult if an uncracked interface model is used.
We are investigating several approaches to help minimize delaminations. For example, oneapproach involves attempting to tailor the geometry of the interface to eliminate undesirable elasticstress singularities. This approach was suggested to the authors by G. B. Sinclair and follows thework of Okajima [ 11 on the bimaterial interface problem and the role of interface geometry inadhesive tensile tests. In Okajima [1 1] it is shown that the stress singularity at a bimaterial freeedge in adhesive specimens can be eliminated if the interface is made to intersect the free edgetangentially, as shown in Figure 2b. In fact, the angle of intersection with the free edge need notbe tangential and is a function of the relative elastic mismatch between the layers.
Stress CrackingAnother problem associated with residual stresses layered manufacturing is the cracking of
newly applied brittle layers as they cool and contract after being applied to existing layers of theartifact (see Figure 8). A separate but related problem is the cracking of brittle layers after they areembedded between ductile layers within the artifact, typically due to a combination of residual andapplied tensile stress. It is important to predict, for a particular brittle material, the maximumallowable thickness of a newly applied layer so that stress cracking will not occur. Similarly, forembedded layers, it is desired to determine the relative thickness of an embedded layer so that nocracking will occur.
Stress Cracks
Figure 8. Stress cracking in a newly applied brittle layer.
Summary
Layered manufacturing offers new opportunities for product design. This is true from a geometryand from a materials perspective. Objects of arbitrary geometric complexity can be built from alarger variety of material combinations than with conventional manufacturing methods. However,frequently the quality of the built articles (bond strength between layers and material density) andthe rate at which they are created does not meet industrial demands. A better insight into thephysics of the underlying bonding processes between layers and the resulting residual stressaccumulation due to temperature gradients is expected to lead to improved performance of ojectsmy through layered manufacturing.
9
Acknoledgements
Financial support of this work by the Advanced Research Project Agency (ARPA/ ESTO) isgratefully acknowledged.
References
I. Bourell, D.L. ,Beaman, J.J., Marcus, H.L., and Barlow, J. W., (1990) "Solid FreeformFabrication: An Advanced manufacturing Approach," Proc. Solid Freeform FabricationSymposium, The University of Texas at Austin, Aug. 6-8, 1-7 (1990).
2. Weiss, L. E., Prinz, F. B., Adams, D. A., and Siewiorek, D. P., (1992)"Thermal Spray ShapeDeposition", Journal of Thermal Spray Technology, Vol. 1, pp. 231-237.
3. Sachs E., Cima, M., Cornie J., (1990) "Three Dimensional Printing: Rapid Tooling andPrototypes Directly from CAD Representation," Proc. Solid Freeform FabricationSymposium, The University of Texas at Austin, Aug. 6-8, 27-33.
4. Ashby M. F., (1974) "A first Report on Sintering Diagrams," Acta MetVol. 22, pp. 275-286.5. Herman, H., "Plasma-sprayed Coatings," (1988) Scientific American, Sept. 1988, pp. 112-
117.6. Amon, C.H., Prinz, F.B., and Schmaltz, K.S.," (1993) Numerical Modeling of Thermal Spray
Systems," Tecnical Report EDRC 24-10693, Carnegie Mellon University, Pittsburgh, PA7. Y.S. Touloukian, Y.S. (1967) "Thermophysical Properties of High Temperature Solid
Materials," Vol. 3, 1967, Macmillan, New York.8. Timoshenko, S. (1925), "Bending and Buckling of Bimetal Strips," J. Optical Soc. Am., Vol.
11, p. 233-255.9. Bogy, D.B. (1971), "Two Edge-Bonded Elastic Wedges of Different Materials and Wedge
Angles Under Surface Tractions," J. Appl. Mech., Vol. 38, pp. 377-386.10. Hein, V.L. and Erdogan, F. (1971), "Stress Singularities in a Two-Material Wedge," Int. J.
Fract. Mech., Vol. 7, pp. 317-330.11. Okajima, M. (1985), "Analysis of Tensile Testing Configurations for Assessing the Strength
of Butt Joints," Ph.D. thesis, Department of Mechanical Engineering, Carnegie MellonUniversity.
10
StereoLithography Epoxy Resin Development:Accuracy and Dimensional Stability
Dr. Thomas IL PangResearch & Development Department
3D Systems, Inc.26081 Avenue Hall
Valencia, California 91355
Abstract
Recently, a new class of StereoLithography (SL) resins was developed that providesignificantly improved overall part accuracy and dimensional stability relative to earlier SL resins.The new resin formulation, XB 5170, is based on epoxy chemistry and has many substantialadvantages over conventional acrylate SL resins. In addition to excellent mechanical properties,the epoxy resin has very low shrinkage, resulting in extremely low curl and distortion. A standardUserPart built in XB 5170 achieved the highest level of dimensional accuracy to date from astatistically significant number of measurements taken in the x, y, and z directions. SL parts builtin XB 5170 also exhibit superb dimensional stability in the laser-cured state as demonstrated by anew creep test. Dimensional stability in the laser-cured state is critical, especially for parts built inthe new QuickCastm build style. In addition to the epoxy resin, QuickCast is the key tosuccessfully utilizing SL parts for direct shell investment casting applications.
Background
The StereoLithography (SL) process involves building 3-dimensional objects bysequentially generating thin layers of selectively cured liquid resin on top of each other. Thecurrent StereoLithography Apparatus (SLA) uses a focused UV laser beam directed by acomputer-controlled X-Y scanning mirror system that has an extremely high pointing accuracy.High laser pointing accuracy is undoubtedly a prerequisite to generating an accurate part.However, high pointing accuracy alone does not automatically translate into building accurateparts. Many variables such as resin type, laser spot size and symmetry, and the process used tobuild a part also affect part accuracy. Therefore, the accuracy of final SLA parts, in addition toinherent machine accuracy, is very important to SL users.
The process parameters required to build accurate SL parts are quite complex in nature.However, insights obtained from fundamental research at 3D Systems in 19901 led to a substantialimprovement in SL part accuracy. WEAVE TH and STAR-WEAVE ,, laser drawing stylesdeveloped in 1990 and 1991, respectively, increased the accuracy of acrylate resin by more than40% based on a statistically significant number of measurements taken on a standard accuracy partcalled the UserPart.
The SL UserPart was designed, not by 3D Systems, but by the SLA user group in 1990 todetermine the overall dimensional accuracy of SL parts.2 From a significant number of UserPartmeasurements accumulated since then, SL has achieved a relatively high level of accuracy even in
11
the conventional acrylate resins.3 However, it appeared as if the accuracy of SL parts made inacrylate resins and the process optimization techniques were approaching a plateau.
Substantial improvements in part accuracy and resin properties were necessary to apply SLto new markets beyond conventional form, fit, and function prototypes. For instance, a higherlevel of accuracy is necessary to expand the applications of SLA into the manufacturing arena.
Dimensional stability is also essential for a rapid prototyping part for almost anyapplication. Without sufficient dimensional stability even a part initially built accurately becomesinaccurate over time. A rapid prototyping part would have limited use without high accuracysustained for a period of time characteristic of the application. For form, fit, and functionapplications, dimensionally unstable parts may not fit properly. Holes and other intricate featuresmay become misaligned with time.
A high level of dimensional stability becomes especially crucial in an application such asdirect shell investment casting. This process requires an efficient conversion of prototype partsfrom plastic to metal with maximum preservation of accuracy. In shell investment casting, a rapidprototyping part is normally subjected to periods of days up to even weeks before it is shelled.Only rapid prototyping sites with an in-house foundry are capable of initial face-coat shellingwithin hours after the parts are built. Otherwise, a nontrivial amount of time, typically on theorder of days, is required for shipping the part to an appropriate foundry and for the foundry toactually shell the part. Any dimensional instability within this period leads to an inaccurate shellinvestment casting pattern, rendering the resulting metal cast prototype unacceptable. Clearly, anew type of resin with high accuracy and excellent dimensional stability was needed.
New Epoxy Resin XB 5170
Ciba-Geigy (Switzerland) and the Research and Development Department at 3D Systemshave been involved in a program of joint SL photopolymer research and development since 1988.Ciba-Geigy, one of the leading chemical companies in the area of epoxy chemistry, had beenlooking at SL epoxy resins for sometime.
In July, 1993, Ciba-Geigy released a new resin for the SLA-250 based on epoxy chemistry.The characteristics of this epoxy formulation, XB 5170, are given in table 1. The properties oftwo conventional SL acrylate resins are also listed for comparison. StereoLithographic propertiesof the epoxy resin, XB 5170, compare well with those of acrylate resins except that the photospeedis a little slower. The epoxy resin has an excellent set of physical properties that exceed those ofacrylate resins in almost every single category. Namely, XB 5170 has:
1) very low viscosity2) high laser-cured (green) modulus3) high postcured modulus4) good elongation at break5) good impact strength
However, the high achievements in accuracy and dimensional stability are what makes thisnew epoxy resin so special. According to the diagnostic accuracy measurements performed, XB5170 shows:
12
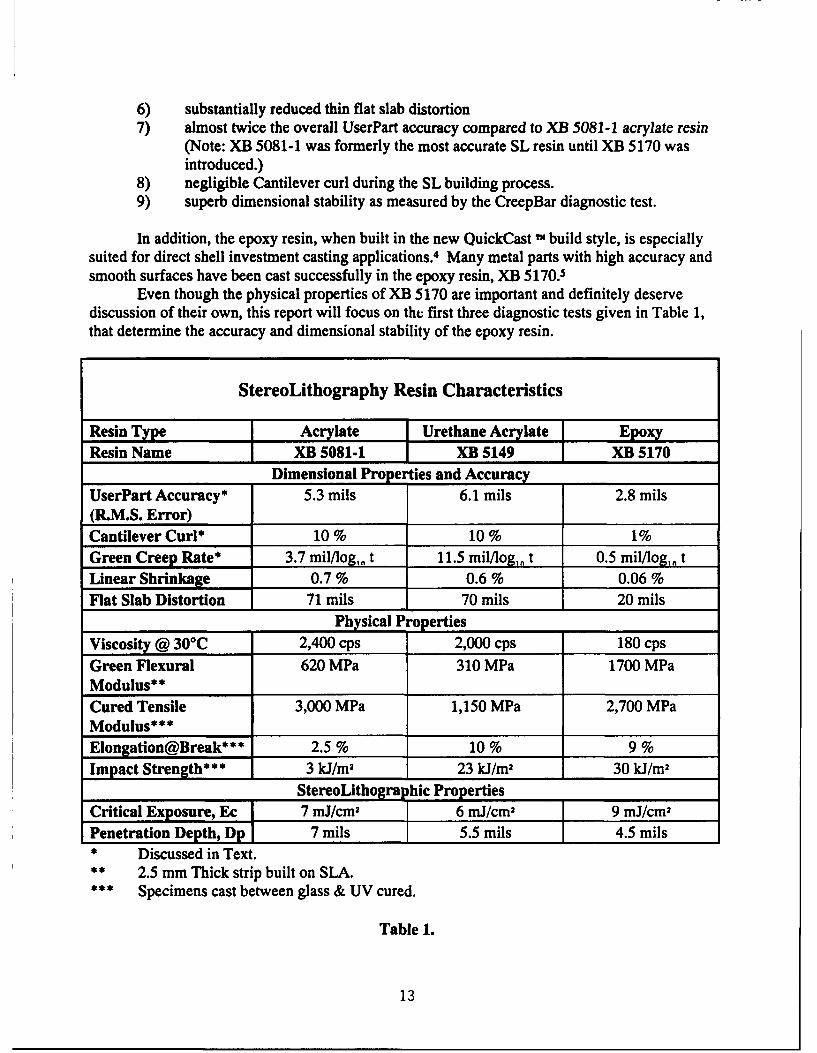
6) substantially reduced thin flat slab distortion7) almost twice the overall UserPart accuracy compared to XB 5081-1 acrylate resin
(Note: XB 5081-1 was formerly the most accurate SL resin until XB 5170 wasintroduced.)
8) negligible Cantilever curl during the SL building process.9) superb dimensional stability as measured by the CreepBar diagnostic test.
In addition, the epoxy resin, when built in the new QuickCast IN build style, is especiallysuited for direct shell investment casting applications. 4 Many metal parts with high accuracy andsmooth surfaces have been cast successfully in the epoxy resin, XB 5170.5
Even though the physical properties of XB 5170 are important and definitely deservediscussion of their own, this report will focus on the first three diagnostic tests given in Table 1,that determine the accuracy and dimensional stability of the epoxy resin.
StereoLithography Resin Characteristics
Resin Type Acrylate Urethane Acrylate EpoxyResin Name XB 5081-1 XB 5149 XB 5170
Dimensional Properties and Accuracy
UserPart Accuracy* 5.3 mils 6.1 mils 2.8 mils(R.M.S. Error)Cantilever Curl* 10 % 10 % 1%Green Creep Rate* 3.7 mil/log,n, t 11.5 mil/log,n t 0.5 mil/log,1 tLinear Shrinkage 0.7 % 0.6 % 0.06 %Flat Slab Distortion 71 mils 70 mils 20 mils
Physical Properties
Viscosity @ 30°C 2,400 cps 2,000 cps 180 cps
Green Flexural 620 MPa 310 MPa 1700 MPaModulus**Cured Tensile 3,000 MPa 1,150 MPa 2,700 MPaModulus***Elongation@Break*** 2.5 % 10 % 9 %Impact Strength*** 3 kJ/m2 23 kJ/m2 30 kJ/m2
StereoLithographic Properties
Critical Exposure, Ec 7 mJ/cm2 6 mJ/cm2 9 mJ/cm2
Penetration Depth, Dp 7 mils 5.5 mils 4.5 mils* Discussed in Text.* * 2.5 mm Thick strip built on SLA.** * Specimens cast between glass & UV cured.
Table 1.
13
UserPart, Cantilever, and CreepBar Accuracy Diagnostic Parts
Diagnostic tests are essential tools used to compare the achievable level of performance fornew resin systems or new process techniques. Diagnostic tests allow one to compare new resin orprocess systems with earlier ones in a quantitative manner. The dimensional properties of theepoxy SL resin, XB 5170, were determined by the following diagnostic tests.
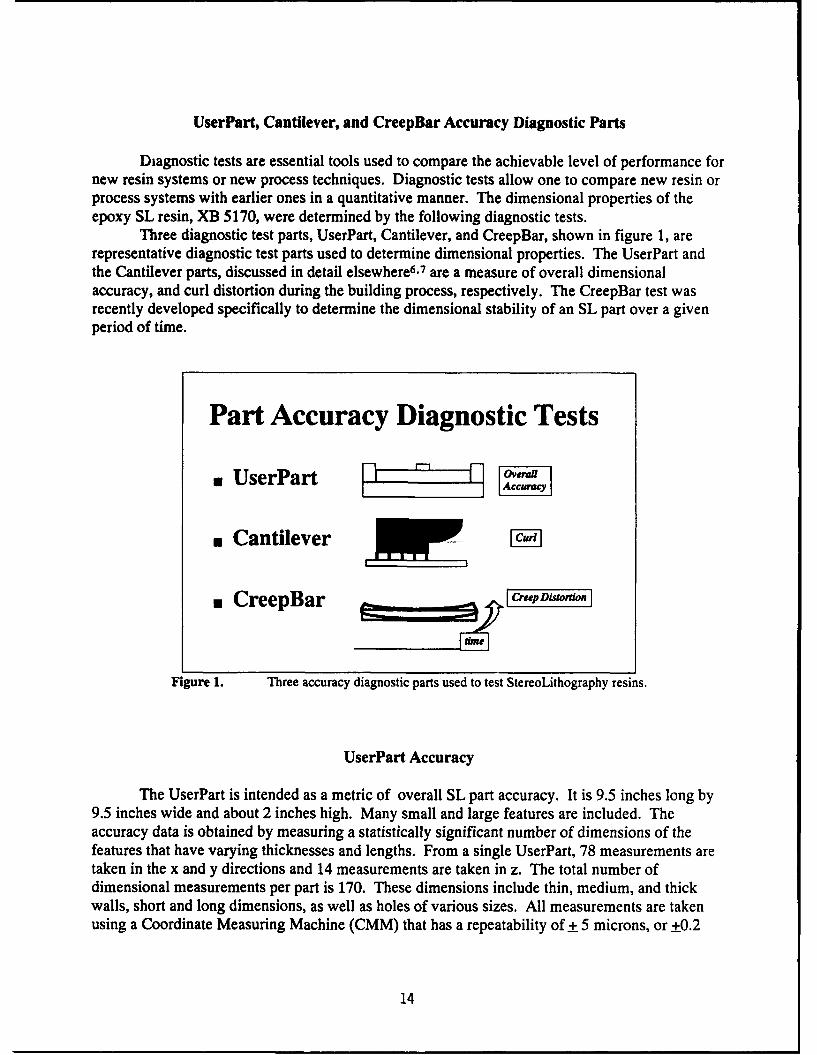
Three diagnostic test parts, UserPart, Cantilever, and CreepBar, shown in figure 1, arerepresentative diagnostic test parts used to determine dimensional properties. The UserPart andthe Cantilever parts, discussed in detail elsewhere6.7 are a measure of overall dimensionalaccuracy, and curl distortion during the building process, respectively. The CreepBar test wasrecently developed specifically to determine the dimensional stability of an SL part over a givenperiod of time.
Part Accuracy Diagnostic Tests
n UserPart a [-1Am]
*Cantilever Cur-
* CreepBar Creep Distonon]
Figure 1. Three accuracy diagnostic parts used to test StereoLithography resins.
UserPart Accuracy
The UserPart is intended as a metric of overall SL part accuracy. It is 9.5 inches long by9.5 inches wide and about 2 inches high. Many small and large features are included. Theaccuracy data is obtained by measuring a statistically significant number of dimensions of thefeatures that have varying thicknesses and lengths. From a single UserPart, 78 measurements aretaken in the x and y directions and 14 measurements are taken in z. The total number ofdimensional measurements per part is 170. These dimensions include thin, medium, and thickwalls, short and long dimensions, as well as holes of various sizes. All measurements are takenusing a Coordinate Measuring Machine (CMM) that has a repeatability of_+ 5 microns, or +0.2
14
mils. The accuracy data obtained from the UserPart includes the normal shrinkage of the resinthat takes place in the vat during the SL building process. It also takes into account thedimensional changes that occur during the postcuring process. In other words, the UserPart issubjected to all of those processes incurred when building real SL parts.
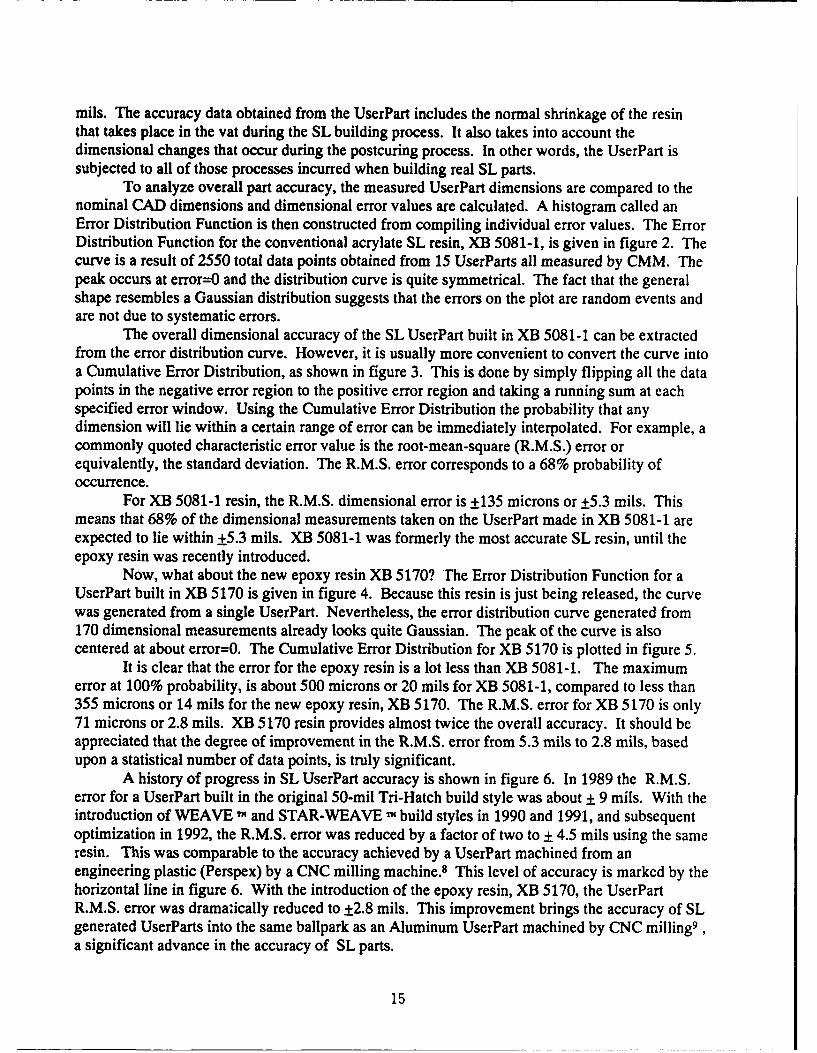
To analyze overall part accuracy, the measured UserPart dimensions are compared to thenominal CAD dimensions and dimensional error values are calculated. A histogram called anError Distribution Function is then constructed from compiling individual error values. The ErrorDistribution Function for the conventional acrylate SL resin, XB 5081-1, is given in figure 2. Thecurve is a result of 2550 total data points obtained from 15 UserParts all measured by CMM. Thepeak occurs at error=0 and the distribution curve is quite symmetrical. The fact that the generalshape resembles a Gaussian distribution suggests that the errors on the plot are random events andare not due to systematic errors.
The overall dimensional accuracy of the SL UserPart built in XB 5081-1 can be extractedfrom the error distribution curve. However, it is usually more convenient to convert the curve intoa Cumulative Error Distribution, as shown in figure 3. This is done by simply flipping all the datapoints in the negative error region to the positive error region and taking a running sum at eachspecified error window. Using the Cumulative Error Distribution the probability that anydimension will lie within a certain range of error can be immediately interpolated. For example, acommonly quoted characteristic error value is the root-mean-square (R.M.S.) error orequivalently, the standard deviation. The R.M.S. error corresponds to a 68% probability ofoccurrence.
For XB 5081-1 resin, the R.M.S. dimensional error is +135 microns or +5.3 mils. Thismeans that 68% of the dimensional measurements taken on the UserPart made in XB 5081-1 areexpected to lie within +5.3 mils. XB 5081-1 was formerly the most accurate SL resin, until theepoxy resin was recently introduced.
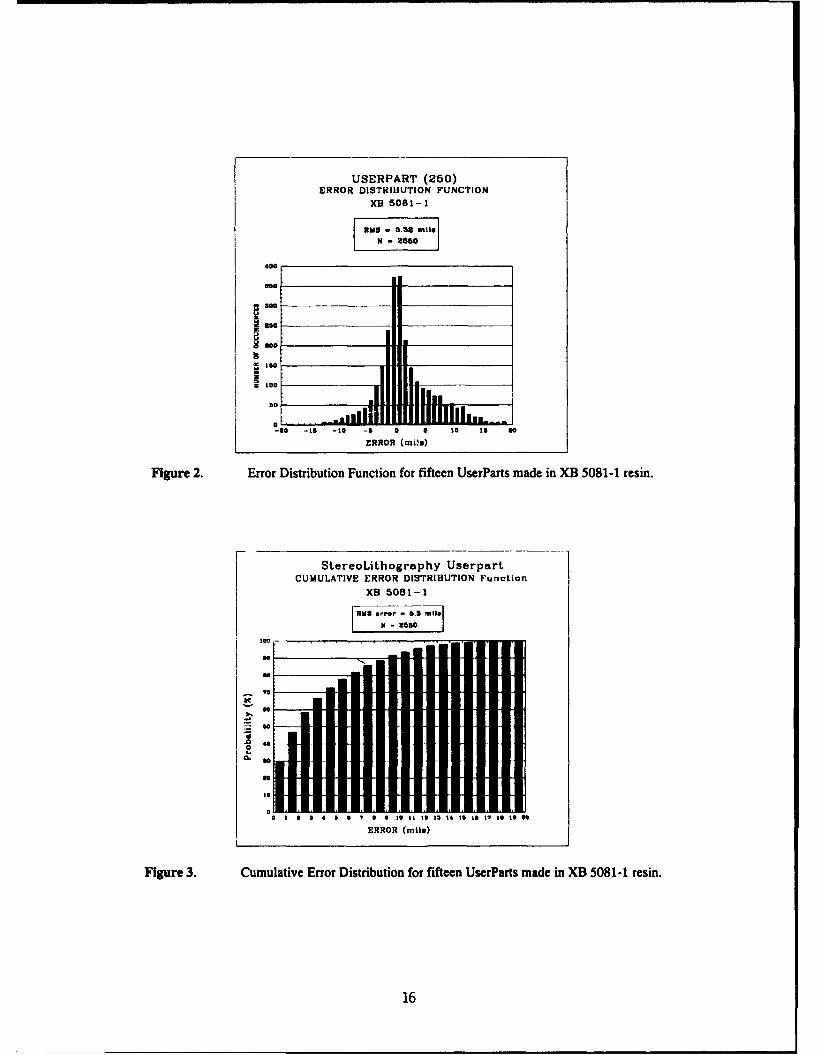
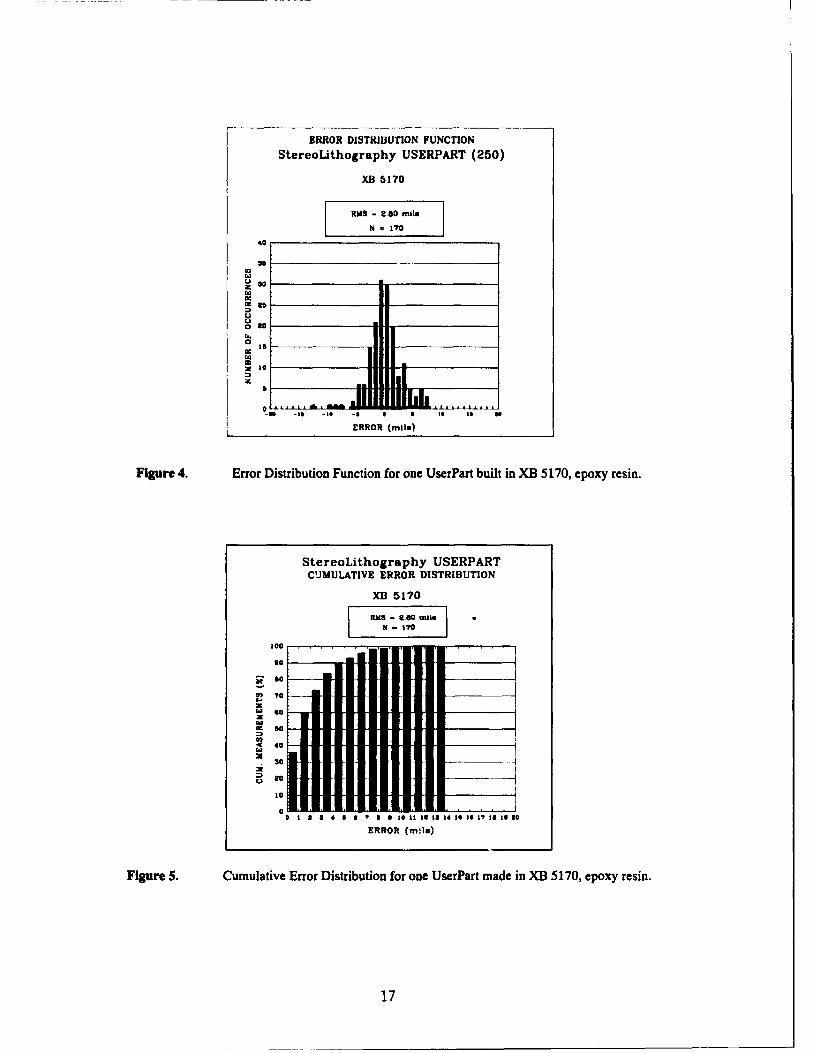
Now, what about the new epoxy resin XB 5170? The Error Distribution Function for aUserPart built in XB 5170 is given in figure 4. Because this resin is just being released, the curvewas generated from a single UserPart. Nevertheless, the error distribution curve generated from170 dimensional measurements already looks quite Gaussian. The peak of the curve is alsocentered at about error=0. The Cumulative Error Distribution for XB 5170 is plotted in figure 5.
It is clear that the error for the epoxy resin is a lot less than XB 5081-1. The maximumerror at 100% probability, is about 500 microns or 20 mils for XB 5081-1, compared to less than355 microns or 14 mils for the new epoxy resin, XB 5170. The R.M.S. error for XB 5170 is only71 microns or 2.8 mils. XB 5170 resin provides almost twice the overall accuracy. It should beappreciated that the degree of improvement in the R.M.S. error from 5.3 mils to 2.8 mils, basedupon a statistical number of data points, is truly significant.
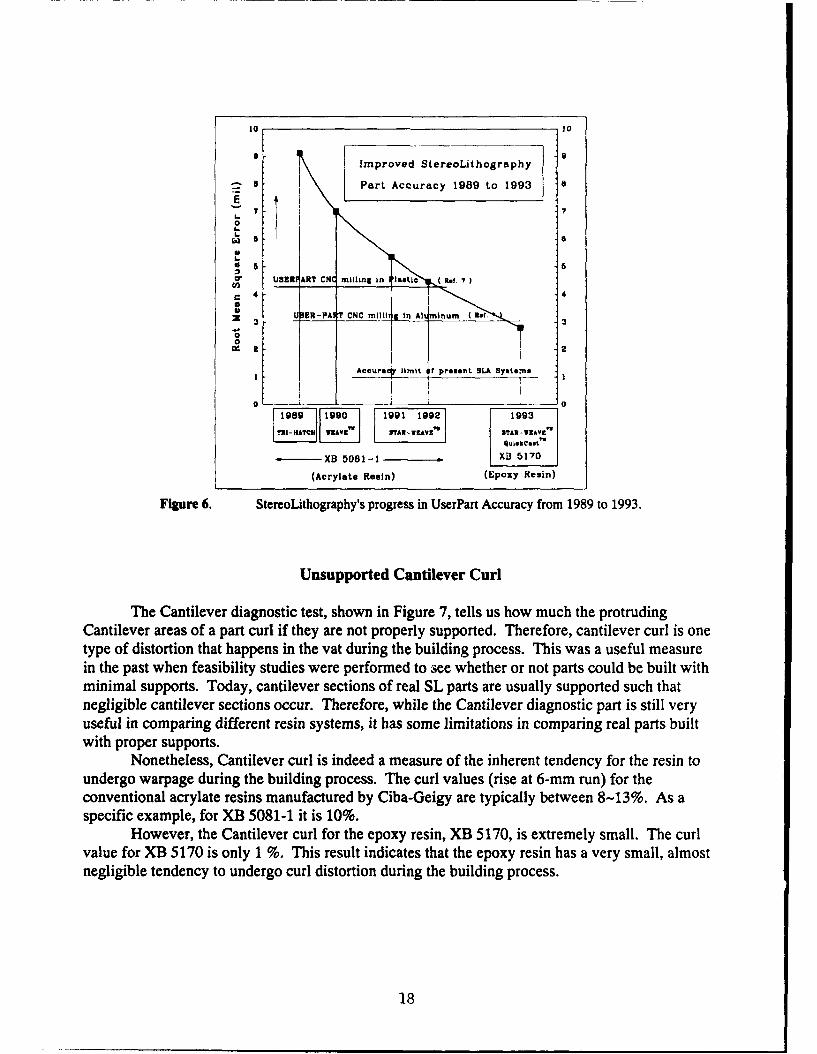
A history of progress in SL UserPart accuracy is shown in figure 6. In 1989 the R.M.S.error for a UserPart built in the original 50-mil Tri-Hatch build style was about + 9 mils. With theintroduction of WEAVE - and STAR-WEAVE " build styles in 1990 and 1991, and subsequentoptimization in 1992, the R.M.S. error was reduced by a factor of two to + 4.5 mils using the sameresin. This was comparable to the accuracy achieved by a UserPart machined from anengineering plastic (Perspex) by a CNC milling machine.8 This level of accuracy is marked by thehorizontal line in figure 6. With the introduction of the epoxy resin, XB 5170, the UserPartR.M.S. error was dramatically reduced to ±2.8 mils. This improvement brings the accuracy of SLgenerated UserParts into the same ballpark as an Aluminum UserPart machined by CNC milling 9 ,a significant advance in the accuracy of SL parts.
15
USERPART (250)ERROR DISTRIBUTION FUNCTION
XB 5081-1
N =2650
400
Sao
300noo
160
100
ID
0
-0o -15 -10 -I 0 a o0 to 3O
ERROR (mils)
Figure 2. Error Distribution Function for fifteen UserParts made in XB 5081-1 resin.
FStereoLithography Userpart
CUMULATIVE ERROR DISTRIBUTION Function
XB 5081-1
100
--. 14
INS6"D30
I.
o 1 3 5 4 6 & 8 S 10 i1 It 13 14 10 I T I0 1S I 0
ERROR (mile)
Figure 3. Cumulative Error Distribution for fifteen UserParts made in XB 5081-1 resin.
16
ERROR DISTRIBUTION FUNCTIONStereoLithography USERPART (250)
XB 5170
RMS ý 2.80 Milon
[~mI~]
40cc UIII125
1.2
to 30
... ||
ERROR (mils)
Figure 4. Error Distribution Function for one UserPart built in XB 5170, epoxy resin.
StereoLithography USERPARTCUJMULATIVE ERROR DISTRIBUTION
XB 5170
RuaI - 8.00 mile
InI
N - l'/
100
s o
Sso
ERROR Cmil.)
Figure 4. Cmltv Error DistributinFntion for one UserPart built in XB 5170, epoxy resin.
2 517.00
W1
S40
30
0 1 a 8 4 6 B 8 S 0 10 13tI 13 4 If 1B 17? 10 19 0
ERROR (mile)
Figure 5. Cumulative Error Distribution for one UserPart made in XB 5170, epoxy resin.
17
10 10
Improved StereoLithography
Part Accuracy 1989 to 1993 6
770 I. a
* 5 6
C' USZI ART CN milling in Istic 7
4 4
SER-PAR CNC mllii Al umnum (f
00° a
CA 2 2
Accuracy llinit I present SLA Syste .
0 10
[.9 ] [,90 1991 1992 1993
TRIjATC V9V 7TN-We~vi3 3?An-VKAVE"Qluickcant"•
"- XB 5081-1 X3 5170
(Acrylate Resin) (Epoxy Resin)
Figure 6. StereoLithography's progress in UserPart Accuracy from 1989 to 1993.
Unsupported Cantilever Curl
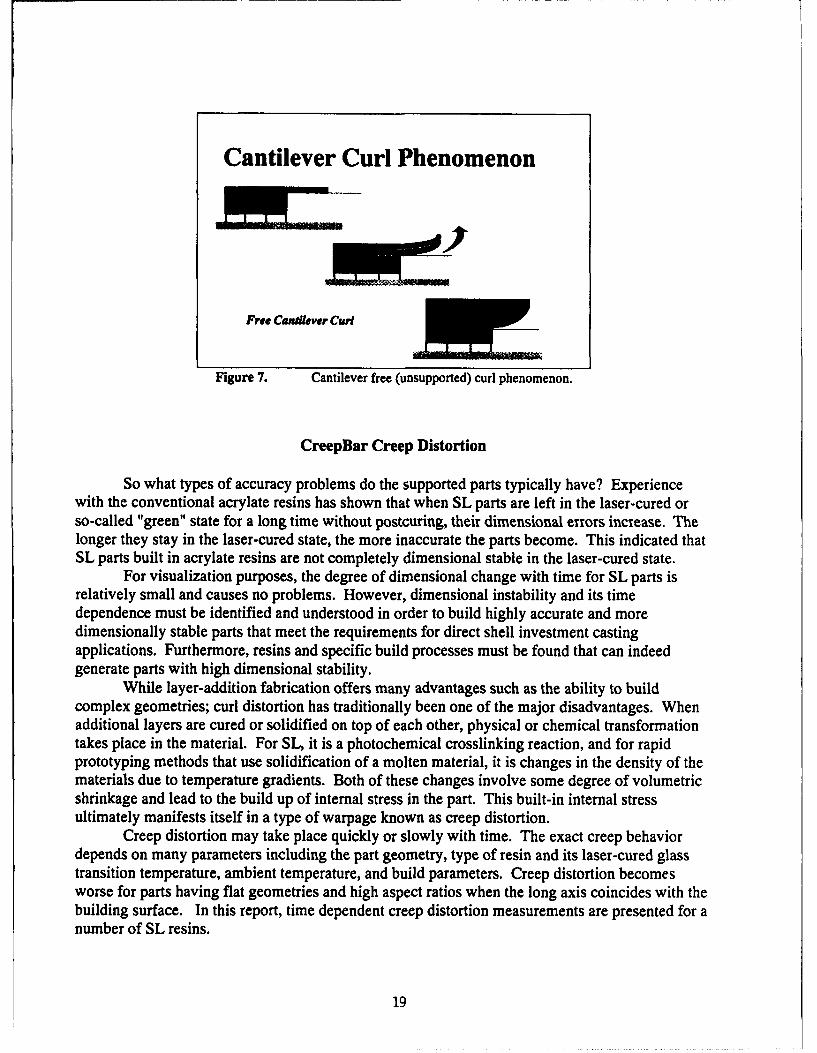
The Cantilever diagnostic test, shown in Figure 7, tells us how much the protrudingCantilever areas of a part curl if they are not properly supported. Therefore, cantilever curl is onetype of distortion that happens in the vat during the building process. This was a useful measurein the past when feasibility studies were performed to see whether or not parts could be built withminimal supports. Today, cantilever sections of real SL parts are usually supported such thatnegligible cantilever sections occur. Therefore, while the Cantilever diagnostic part is still veryuseful in comparing different resin systems, it has some limitations in comparing real parts builtwith proper supports.
Nonetheless, Cantilever curl is indeed a measure of the inherent tendency for the resin toundergo warpage during the building process. The curl values (rise at 6-mm run) for theconventional acrylate resins manufactured by Ciba-Geigy are typically between 8-13%. As aspecific example, for XB 5081-1 it is 10%.
However, the Cantilever curl for the epoxy resin, XB 5170, is extremely small. The curlvalue for XB 5170 is only 1 %. This result indicates that the epoxy resin has a very small, almostnegligible tendency to undergo curl distortion during the building process.
18
Cantilever Curl Phenomenon
Free Can&lever COWi
Figure 7. Cantilever free (unsupported) curl phenomenon.
CreepBar Creep Distortion
So what types of accuracy problems do the supported parts typically have? Experiencewith the conventional acrylate resins has shown that when SL parts are left in the laser-cured orso-called "green" state for a long time without postcuring, their dimensional errors increase. Thelonger they stay in the laser-cured state, the more inaccurate the parts become. This indicated thatSL parts built in acrylate resins are not completely dimensional stable in the laser-cured state.
For visualization purposes, the degree of dimensional change with time for SL parts isrelatively small and causes no problems. However, dimensional instability and its timedependence must be identified and understood in order to build highly accurate and moredimensionally stable parts that meet the requirements for direct shell investment castingapplications. Furthermore, resins and specific build processes must be found that can indeedgenerate parts with high dimensional stability.
While layer-addition fabrication offers many advantages such as the ability to buildcomplex geometries; curl distortion has traditionally been one of the major disadvantages. Whenadditional layers are cured or solidified on top of each other, physical or chemical transformationtakes place in the material. For SL, it is a photochemical crosslinking reaction, and for rapidprototyping methods that use solidification of a molten material, it is changes in the density of thematerials due to temperature gradients. Both of these changes involve some degree of volumetricshrinkage and lead to the build up of internal stress in the part. This built-in internal stressultimately manifests itself in a type of warpage known as creep distortion.
Creep distortion may take place quickly or slowly with time. The exact creep behaviordepends on many parameters including the part geometry, type of resin and its laser-cured glasstransition temperature, ambient temperature, and build parameters. Creep distortion becomesworse for parts having flat geometries and high aspect ratios when the long axis coincides with thebuilding surface. In this report, time dependent creep distortion measurements are presented for anumber of SL resins.
19
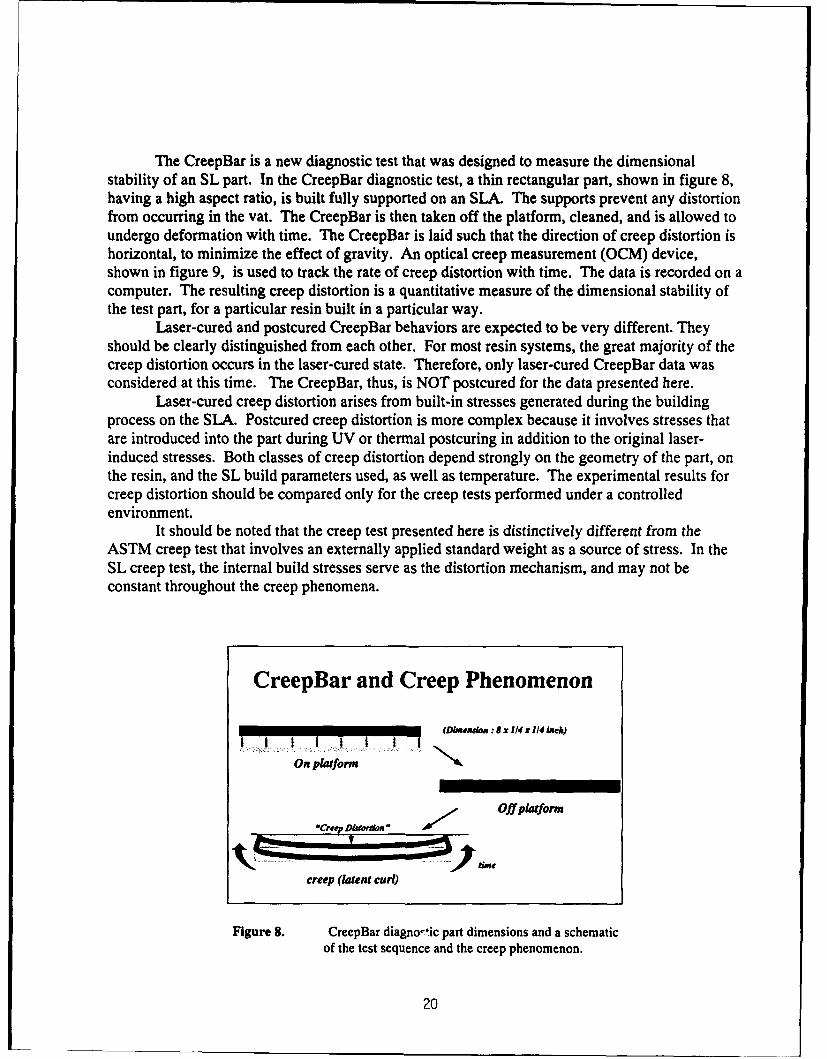
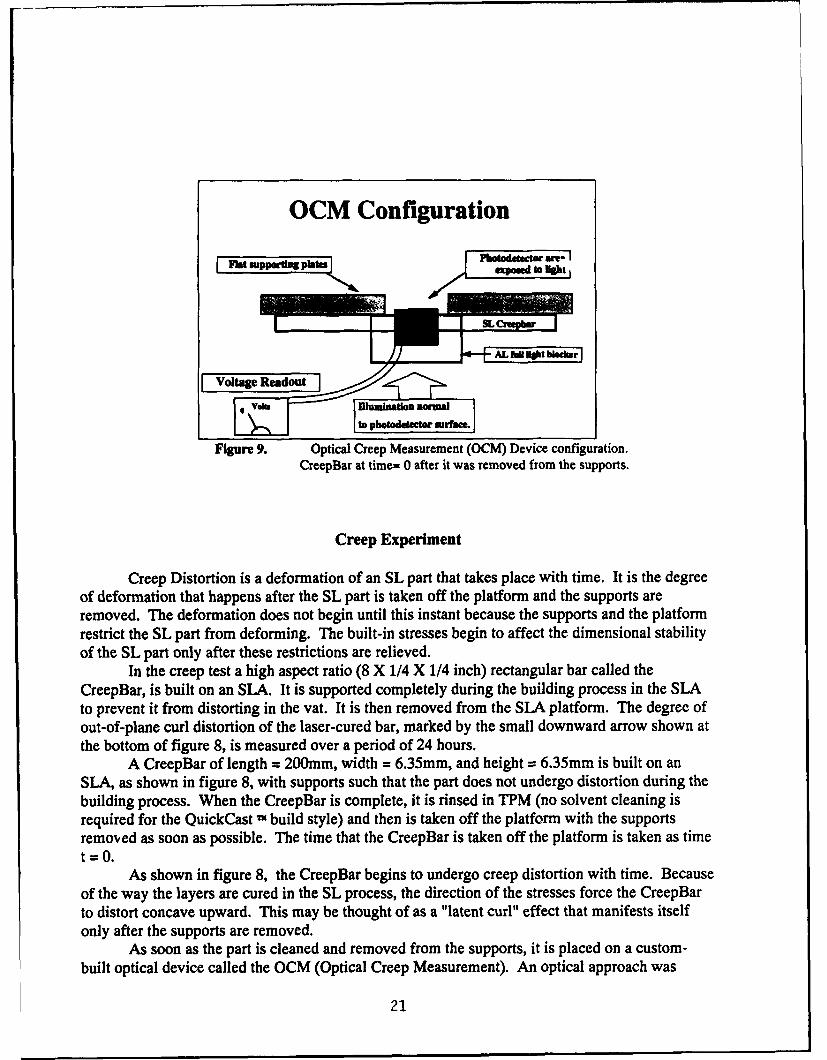
The CreepBar is a new diagnostic test that was designed to measure the dimensionalstability of an SL part. In the CreepBar diagnostic test, a thin rectangular part, shown in figure 8,having a high aspect ratio, is built fully supported on an SLA. The supports prevent any distortionfrom occurring in the vat. The CreepBar is then taken off the platform, cleaned, and is allowed toundergo deformation with time. The CreepBar is laid such that the direction of creep distortion ishorizontal, to minimize the effect of gravity. An optical creep measurement (OCM) device,shown in figure 9, is used to track the rate of creep distortion with time. The data is recorded on acomputer. The resulting creep distortion is a quantitative measure of the dimensional stability ofthe test part, for a particular resin built in a particular way.
Laser-cured and postcured CreepBar behaviors are expected to be very different. Theyshould be clearly distinguished from each other. For most resin systems, the great majority of thecreep distortion occurs in the laser-cured state. Therefore, only laser-cured CreepBar data wasconsidered at this time. The CreepBar, thus, is NOT postcured for the data presented here.
Laser-cured creep distortion arises from built-in stresses generated during the buildingprocess on the SLA. Postcured creep distortion is more complex because it involves stresses thatare introduced into the part during UV or thermal postcuring in addition to the original laser-induced stresses. Both classes of creep distortion depend strongly on the geometry of the part, onthe resin, and the SL build parameters used, as well as temperature. The experimental results forcreep distortion should be compared only for the creep tests performed under a controlledenvironment.
It should be noted that the creep test presented here is distinctively different from theASTM creep test that involves an externally applied standard weight as a source of stress. In theSL creep test, the internal build stresses serve as the distortion mechanism, and may not beconstant throughout the creep phenomena.
CreepBar and Creep Phenomenon
(Dimensio : a x 114 x 114 inck)I I I I i I I I
On platform
"-Creep Dbii ovi Off platform
creep (latent curl)
Figure 8. CreepBar diagnortic part dimensions and a schematicof the test sequence and the creep phenomenon.
20
OCM Configuration
Fhacudelsteo amt-tppd to klht
Volt=age Radout
Figure 9. Optical Creep Measurement (OCM) Device configuration.CreepBar at time= 0 after it was removed from the supports.
Creep Experiment
Creep Distortion is a deformation of an SL part that takes place with time. It is the degreeof deformation that happens after the SL part is taken off the platform and the supports areremoved. The deformation does not begin until this instant because the supports and the platformrestrict the SL part from deforming. The built-in stresses begin to affect the dimensional stabilityof the SL part only after these restrictions are relieved.
In the creep test a high aspect ratio (8 X 1/4 X 1/4 inch) rectangular bar called theCreepBar, is built on an SIA. It is supported completely during the building process in the SLAto prevent it from distorting in the vat. It is then removed from the SLA platform. The degree ofout-of-plane curl distortion of the laser-cured bar, marked by the small downward arrow shown atthe bottom of figure 8, is measured over a period of 24 hours.
A CreepBar of length = 200mm, width = 6.35mm, and height = 6.35mm is built on anSLA, as shown in figure 8, with supports such that the part does not undergo distortion during thebuilding process. When the CreepBar is complete, it is rinsed in TPM (no solvent cleaning isrequired for the QuickCast " build style) and then is taken off the platform with the supportsremoved as soon as possible. The time that the CreepBar is taken off the platform is taken as timet=0.
As shown in figure 8, the CreepBar begins to undergo creep distortion with time. Becauseof the way the layers are cured in the SL process, the direction of the stresses force the CreepBarto distort concave upward. This may be thought of as a "latent curl" effect that manifests itselfonly after the supports are removed.
As soon as the part is cleaned and removed from the supports, it is placed on a custom-built optical device called the OCM (Optical Creep Measurement). An optical approach was
21
elected because mechanical means of measurement for small displacement distances are bothtedious and unreliable. Even a small mechanical force applied to the CreepBar could distort it. Aschematic drawing of the OCM device is given in figure 9. The OCM consists of flat supportingplates that are co-linear, a photo detector, a small section of Aluminum foil attached to theCreepBar, and an IR photodiode light source shining down on the photodetector. (The lightsource is not shown in the schematic drawing.) The IR photodiode does not initiate furtherphotopolymerization.
The principle of OCM operation depends on the variation in total optical power receivedby the photodetector as the result of displacement by the CreepBar. The voltage reading from thephotodetector depends on the total amount of incident light. At time=0, when the CreepBar hasnot undergone any distortion, the voltage reading is low because most of the IR light is blocked bythe CreepBar and the Aluminum foil.
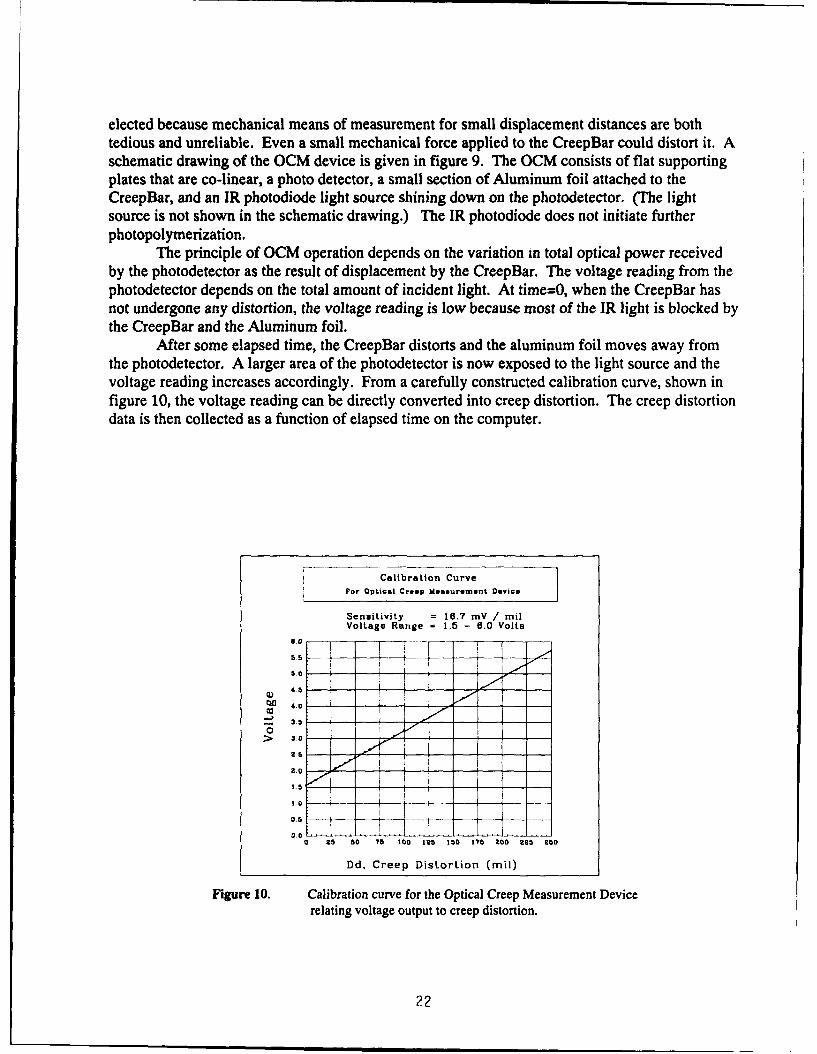
After some elapsed time, the CreepBar distorts and the aluminum foil moves away fromthe photodetector. A larger area of the photodetector is now exposed to the light source and thevoltage reading increases accordingly. From a carefully constructed calibration curve, shown infigure 10, the voltage reading can be directly converted into creep distortion. The creep distortiondata is then collected as a function of elapsed time on the computer.
Calibration Curve
Por Optical Creep Ideasurement Device
Sensitivity = 16.7 mV / milVoltage Range = 1.5 - 6.0 Voltssoi -- ---- I
o5o i-- i J-,.0
I'
- 3.5 40> 3° ýO
0.0 -- _
0 25 50 75 100 125 10 17 200 Z25 250
Dd. Creep Distortion (mil)
Figure 10. Calibration curve for the Optical Creep Measurement Devicerelating voltage output to creep distortion.
22
Creep Distortion of 8-inch CreepBar Diagnostic Part
45
40
o •
35
10
1 5 fl-i70
02 .. Epoxy Resin5i to lb 20 25
Time (hour)
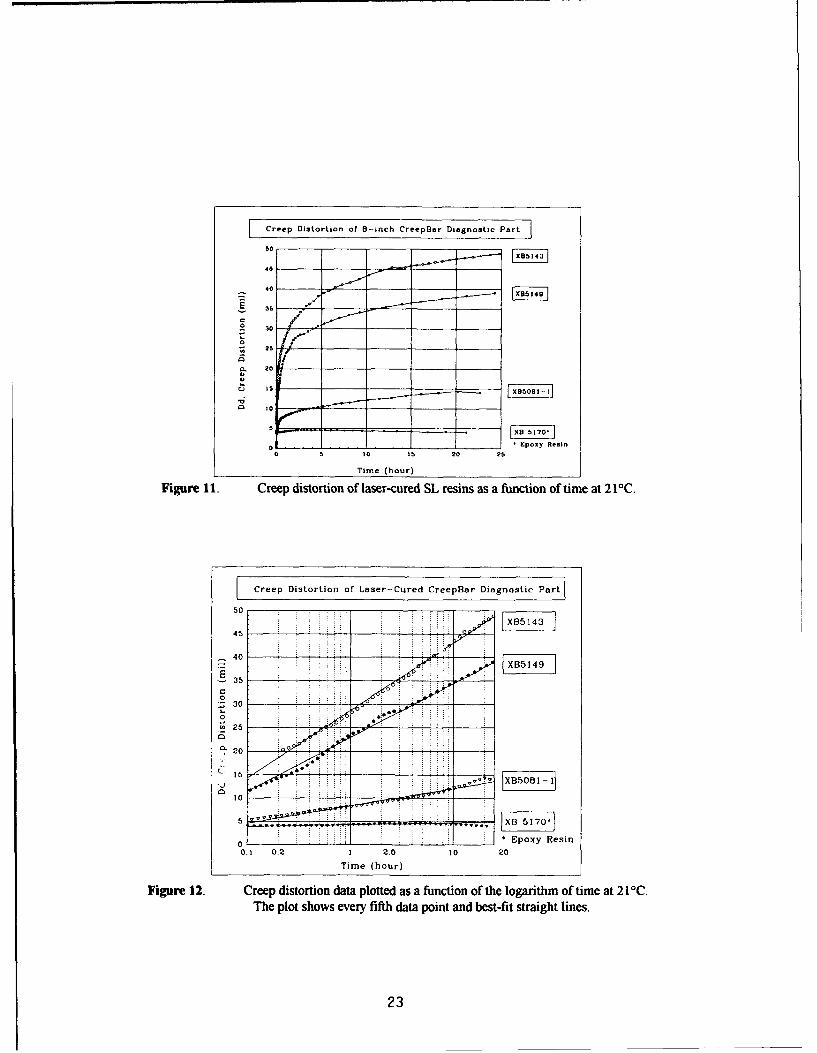
Figure 11. Creep distortion of laser-cured SL resins as a function of time at 2 1 0C.
Creep Distortion of Laser-Cured CreepBar Diagnostic Partl
50 .
0
203
Creep Data
Green Creep Data for acrylate resins, XB 5143, XB 5149, XB 5081-1, and the new epoxyresin XB 5170 were collected on the OCM. All creep measurements were taken at room
temperature ranging from 20 to 22°C, typically at 21TC. The results are presented on figure 11.All creep data show a rapid increase in creep distortion at short times. The creep data appear toreach a plateau at long times. For most of the resins presented here, more than 60% of the 24-hourcreep distortion is virtually complete within an initial period of 2 hours.
With respect to absolute magnitude, CreepBars made in XB 5143 have the largest creepdistortion. They distort to about 50 mils/ 8-inch length in 24 hours. This suggests that laser-curedparts should be postcured as soon as possible in order to preserve accuracy. This precaution isusually taken by most SL users. XB 5143 is then followed by XB 5149, XB 5081-1 and XB 5170.XB 5081-1 shows a dimensional instability of about 15 mils/ 8 inches over 24 hours.
However, the new epoxy resin, XB 5170, has the least creep distortion at every point intime. This creep data shows that the epoxy resin is, by far, the most dimensionally stable resin inthe laser-cured state. At every point in time, the creep distortion for XB 5170 is less than 5 mils/8-inch length over a period of 24 hours.
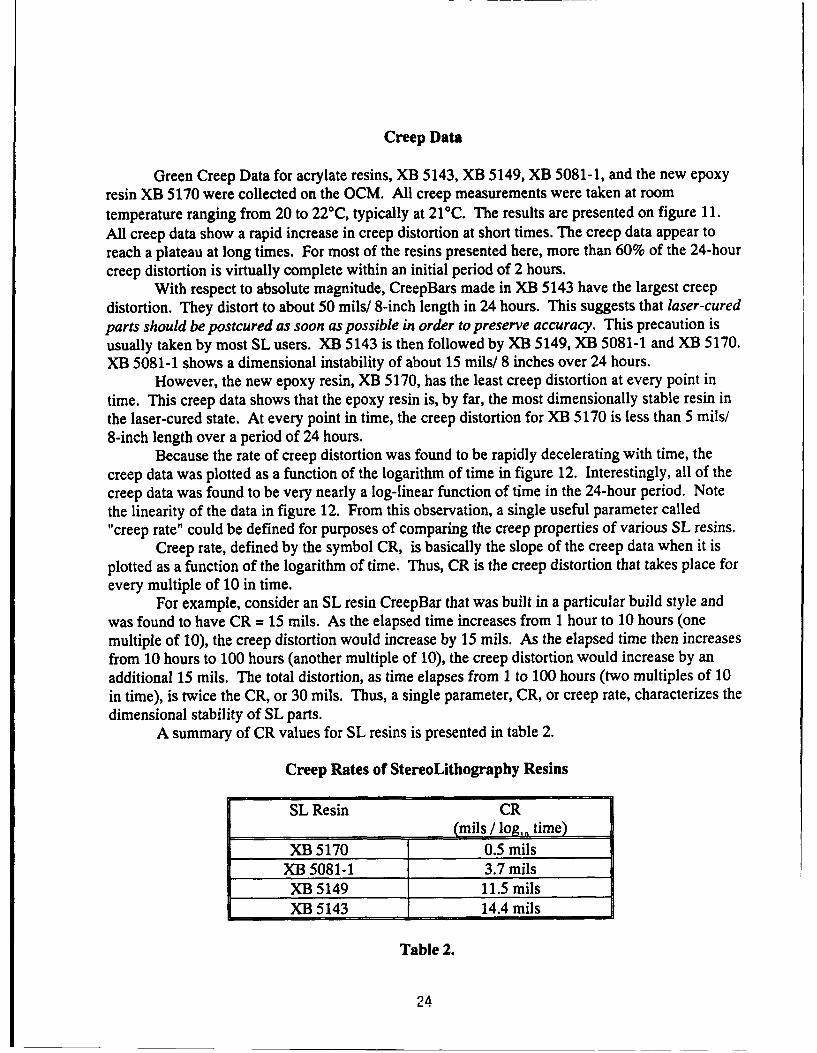
Because the rate of creep distortion was found to be rapidly decelerating with time, thecreep data was plotted as a function of the logarithm of time in figure 12. Interestingly, all of thecreep data was found to be very nearly a log-linear function of time in the 24-hour period. Notethe linearity of the data in figure 12. From this observation, a single useful parameter called"creep rate" could be defined for purposes of comparing the creep properties of various SL resins.
Creep rate, defined by the symbol CR, is basically the slope of the creep data when it isplotted as a function of the logarithm of time. Thus, CR is the creep distortion that takes place forevery multiple of 10 in time.
For example, consider an SL resin CreepBar that was built in a particular build style andwas found to have CR = 15 mils. As the elapsed time increases from 1 hour to 10 hours (onemultiple of 10), the creep distortion would increase by 15 mils. As the elapsed time then increasesfrom 10 hours to 100 hours (another multiple of 10), the creep distortion would increase by anadditional 15 mils. The total distortion, as time elapses from 1 to 100 hours (two multiples of 10in time), is twice the CR, or 30 mils. Thus, a single parameter, CR, or creep rate, characterizes thedimensional stability of SL parts.
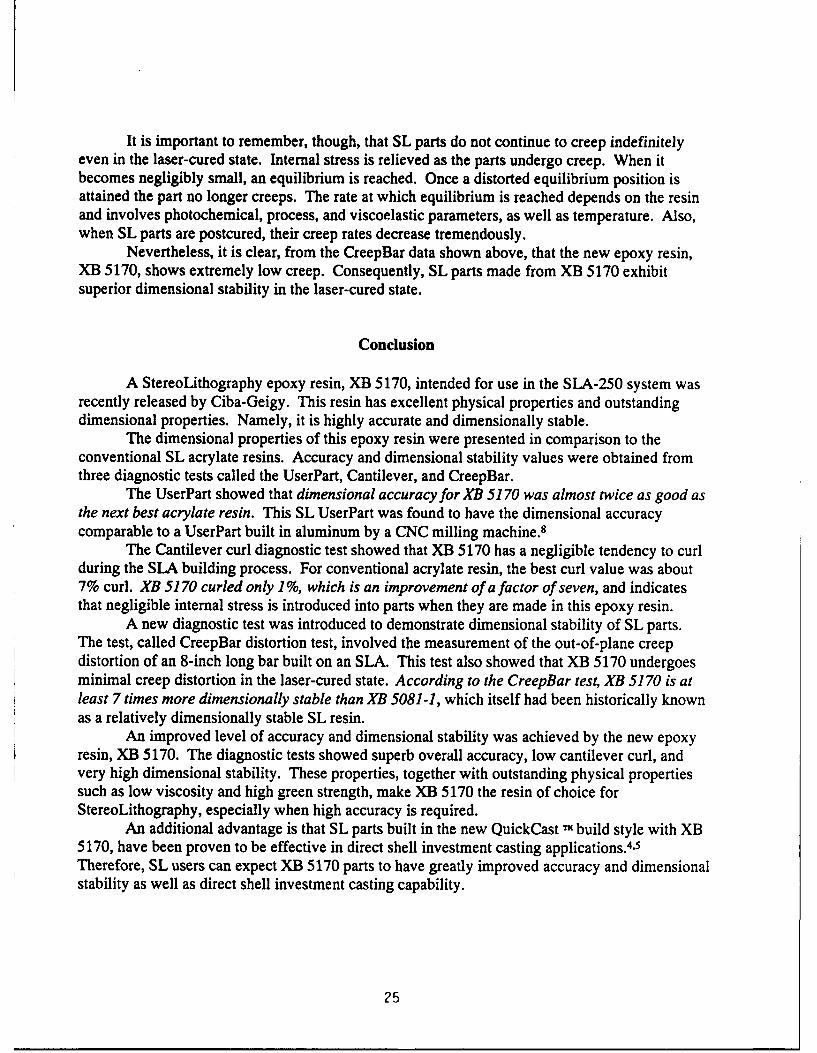
A summary of CR values for SL resins is presented in table 2.
Creep Rates of StereoLithography Resins
SL Resin CR(mils / log,,, time)
XB 5170 0.5 milsXB 5081-1 3.7 mils
XB 5149 11.5 milsXB 5143 14.4 mils
Table 2.
24
It is important to remember, though, that SL parts do not continue to creep indefinitelyeven in the laser-cured state. Internal stress is relieved as the parts undergo creep. When itbecomes negligibly small, an equilibrium is reached. Once a distorted equilibrium position isattained the part no longer creeps. The rate at which equilibrium is reached depends on the resinand involves photochemical, process, and viscoelastic parameters, as well as temperature. Also,when SL parts are postcured, their creep rates decrease tremendously.
Nevertheless, it is clear, from the CreepBar data shown above, that the new epoxy resin,XB 5170, shows extremely low creep. Consequently, SL parts made from XB 5170 exhibitsuperior dimensional stability in the laser-cured state.
Conclusion
A StereoLithography epoxy resin, XB 5170, intended for use in the SLA-250 system wasrecently released by Ciba-Geigy. This resin has excellent physical properties and outstandingdimensional properties. Namely, it is highly accurate and dimensionally stable.
The dimensional properties of this epoxy resin were presented in comparison to theconventional SL acrylate resins. Accuracy and dimensional stability values were obtained fromthree diagnostic tests called the UserPart, Cantilever, and CreepBar.
The UserPart showed that dimensional accuracy for XB 5170 was almost twice as good asthe next best acrylate resin. This SL UserPart was found to have the dimensional accuracycomparable to a UserPart built in aluminum by a CNC milling machine.8
The Cantilever curl diagnostic test showed that XB 5170 has a negligible tendency to curlduring the SLA building process. For conventional acrylate resin, the best curl value was about7% curl. XB 5170 curled only 1%, which is an improvement of a factor of seven, and indicatesthat negligible internal stress is introduced into parts when they are made in this epoxy resin.
A new diagnostic test was introduced to demonstrate dimensional stability of SL parts.The test, called CreepBar distortion test, involved the measurement of the out-of-plane creepdistortion of an 8-inch long bar built on an SLA. This test also showed that XB 5170 undergoesminimal creep distortion in the laser-cured state. According to the CreepBar test, XB 5170 is atleast 7 times more dimensionally stable than XB 5081-1, which itself had been historically knownas a relatively dimensionally stable SL resin.
An improved level of accuracy and dimensional stability was achieved by the new epoxyresin, XB 5170. The diagnostic tests showed superb overall accuracy, low cantilever curl, andvery high dimensional stability. These properties, together with outstanding physical propertiessuch as low viscosity and high green strength, make XB 5170 the resin of choice forStereoLithography, especially when high accuracy is required.
An additional advantage is that SL parts built in the new QuickCast TN build style with XB5170, have been proven to be effective in direct shell investment casting applications. 4,5Therefore, SL users can expect XB 5170 parts to have greatly improved accuracy and dimensionalstability as well as direct shell investment casting capability.
25
References
I Jacobs, P. F., Chapter 4 & 8, "Rapid Prototyping & Manufacturing: Fundamentals ofStereoLithography", Society of Manufacturing Engineers, Dearborn, Michigan, July 1992.
2 Gargiulo, E. P., "StereoLithography Process Accuracy: User Experience", Proceedings of theSecond International Conference on Rapid Prototyping, Dayton, Ohio, June 23-26, 1991,pp.311-326.
3 Gargiulo, E. P., "StereoLithography Process Accuracy: Further User Experience", Proceedingsof the Third International Conference on Rapid Prototyping, Dayton, Ohio. June 1992.
4 Pang, T. H., Jacobs, P. F., "StereoLithography 1993: QuickCast 7m",, Proceedings of the SolidFreeform Fabrications Symposium, University of Texas, Austin, August 9-11, 1993.
5 Jacobs, P. F., Kennerknecht, S., Smith, J., Hanslits, M., Andre, L. ,"QuickCast " FoundryReports", 3D Systems R & D report, April 1993.
6 Jacobs, P. F., Chapter 11, "Rapid Prototyping & Manufacturing: Fundamentals ofStereoLithography", Society of Manufacturing Engineers, Dearborn, Michigan, July 1992, p.306.
7 ibid., Chapter 10, p.256.8 Gargiulo, E. P., "StereoLithography Process Accuracy: User Experience", Proceedings of the
First European Conference on Rapid Prototyping, University of Nottingham, England, July 6-7,1992, pp. 187-201.
9 ibid.
26
VIBRATORY FINISHING OF STEREOLITHOGRAPHY PARTS
John D Spencer, Richard C Cobb and Philip M Dickens
Department of Manufacturing Engineering and Operations Management,
University of Nottingham, UK.
SUMMARY
Rapid Prototype polymer resin models produced by Stereolithography have, by thenature of the process, a relatively poor surface roughness, particularly on concave andconvex surfaces. In many cases this is unacceptable, and slow and tedious manual finishingtechniques are often used to improve the surface.
An investigation has been conducted into a range of automated finishing techniqueswith the aim of producing an acceptable surface roughness. This paper presents the resultsfrom two techniques, Vibratory Bowl Abrasion and Ultrasonic Abrasion using componentsmade from Ciba-Geigy XB5081-1 and XB 5143 resins.
Initial results from Scanning Electron Microscopy and surface topography analysessuggest that both techniques are capable of improving the model surfaces.
INTRODUCTION
Since its introduction Stereolithography has become established as the leadingcommercial Rapid Prototyping (RP) system (Jacobs 1992). A 3D CAD model of the desiredcomponent is mathematically 'sliced' into layers which are typically 150lm thick. The slicedata is then used to control a UV laser which is guided over a vat of liquid photopolymer andis selectively cured as the laser tracks over it. In this way the part is built up layer by layerwith the laser curing the required regions of each subsequent photopolymer layer. A postcuring operation is then used to fully solidify the part.
Prototype models produced from the process exhibit a relatively poor surface finish,particularly on concave and convex surfaces. For many applications the usual practice is tosandpaper and polish the models by hand which is a tedious and time consuming operationand also presents a potential health hazard from the resin dust. Although prototypes can berapidly manufactured, parts can end up after finishing with poorly defined features, and themore complex the model the more difficult it becomes to finish.
Where parts are intended for testing, finishing becomes a critical factor. For example,parts tested in say, fluid or gas chambers may not be representative of the final componentas the layer steps could disrupt gas flows. Furthermore, in the production of tooling a poorsurface on the model will be reproduced on the tool and removal of the model may bedifficult if the tool material keys into the surface roughness.
When manufacturing stereolithography parts layers are produced that can form acurved (or angled) surface and it may be either the internal or the external corners that definethe required profile. If the external corners define the profile their removal will cause theprofile to become undersize. However if the profile is defined by the internal corners thenit will be oversize until the steps are removed, see Figure 1. Where material removal takes
27
place, it is important that the internal corners of the layers are specified as defining thesurface, (this is the default setting with 3D Systems machines).
Vertical faces also exhibit a step effect due to the manner in which the laser solidifiesthe resin. Although the power of the laser spot has a gaussian distribution the resin curesin a parabolic form, thus at the edge of a vertical face it is found that a stack of parabolacurves occur, these cause steps on the surface, as seen in Figure 2, (Jacobs, 1992). Even ifthe model is supplied with a draft angle it is still likely to 'key' into a mating surface as aseries of small undercuts will remain.
One of the problems with curved surfaces on SL models is that the size of the stepschange as the angle of the curve changes, that is the closer the angle is to the vertical thenthe smaller the step in the horizontal ('X/Y') plane, as shown in Figure 3. Also, the closerthe angle becomes to horizontal, the larger the step in the horizontal 'X/Y' plane. Thiseffect causes problems when using material removal methods as the larger steps, becausethey require more work to remove them, will still be evident after the smaller ones have beenremoved, thus effecting the form of the curve.
An experimental programme was therefore constructed with the aim of investigatinga range of automated finishing techniques and their potential for smoothing Stereolithographyparts without causing any detrimental effect to the 'form' of the part. Although a wide rangeof options are available to treat the resin surfaces including chemical dissolution and the useof coatings it was decided to concentrate upon the mechanical removal processes and hencetest samples were sent to specialist finishing companies.
The first stage of the work detailed three techniques, Abrasive blasting, Barreltumbling and Centrifugal tumbling (Spencer et al 1993). It was found that abrasive blastingseverely eroded models made from two different types of polymer resin, but that centrifugaltumbling was able to smooth the surfaces with improvements in Ra values of up to 81 %.However, the process does generate significant damage and the time to process is excessive.
This paper presents the findings from a further two finishing techniques, VibratoryBowl Abrasion and Ultrasonic Abrasion both of which were applied to the same type ofmodels as in the previous study.
TRIAL COMPONENTS
A standard Stereolithography demonstration component, approximately 50mmdiameter, was supplied by Texas Instruments, see Figure 4 and was provided in two differentmaterial types :-
Material type 1 Ciba Geigy XB5143 (durable resin)Material type 2 Ciba Geigy XB5081-1 (general purpose resin)
As indicated below the component provided a range of different design features thatany potential finishing technique may have to cope with.
Vertical and horizontal facesExternal corner (area 1)Internal corner (area 2)Restricted corners (areas 3 & 4)The steps on the peripheral radius (radius)
28
To assess the ability and limitations of each of the finishing processes, specific areasof the component test piece were identified (areas 1 - 4). Following the surface treatment,each area could be compared with as-cured reference samples of each material.
EXPERLMENTAL PROCEDURE
Experimental Techniques
In order to investigate the effect of each finishing process upon the component, twoexperimental techniques were adopted. Specific features of the finished models and as-curedreference samples were examined and photographed on a JEOL JSM 6400 WINSEMScanning Electron Microscope (SEM).
Measurements of the surface roughness (Ra) of all of the samples were made andrecorded in the X, Y & Z axis using a Rank Taylor Hobson Taly Surf 4. In all cases thesame region of the component photographed on the SEM was measured for surfaceroughness. The Ra value of the irregularities on a surface is defined as the average value ofthe departures, both above and below it's centre line, for a prescribed sampling length. Inthe case of both the X and Y plane measurements the section was accurately mounted on amicro X/Y adjustable table.
The surface topography was traced before indexing the sample across 0.07mm andanother reading and trace of the surface taken; this was repeated for 5 passes on each sectionin the X,Y and Z planes. The average of the values measured in each axis was calculated andrecorded as was the average of all the readings.
RESULTS
Reference Samples
As-cured reference samples of materials type 1 (XB5143) and 2 (XB5081-1) weremounted and examined on the SEM (see Figures 5-8). By viewing the component in this waythe individual slices can be clearly seen, and the surface finish in the W' (vertical height)plane consists of a series of small steps. The size of these steps will depend on the thicknessof each layer which can vary between 64-760zm. This stepping effect is most noticeable onfaces that make an angle to the normal (vertical/horizontal) plane (eg 450 slope).
On further examination it can be seen that in addition to the step formations, thecomponent exhibits a texture on the horizontal surfaces. The surface consists of lines ofsolidified resin, each - 200Am in width, running parallel to one another in the 'X' plane,10Oj•m apart with an identical layer, in the 'Y' plane beneath it. The micrograph indicatesthat approximately 50-75,um of the surface material would need to be removed for thehorizontal surface to become smoother, Figures 5 & 6.
Comparison of the photographs for each of the materials, Figures 5 - 8, shows that,although the test piece is the same geometry and dimensions, and the layer thicknesses arethe same, the two parts are quite different. In contrast to reference material 1 , material 2has much 'smoother' vertical faces with steps of width 13014m for the former and 50/im forthe latter.
Another feature of the component made from material type 1, again on the verticalface, is the two pitch cyclic pattern of 'bumps' which step across a one half pitch each layer,Figure 5. These two pitch cyclic bumps are thought to be a fault of the machine control in
29
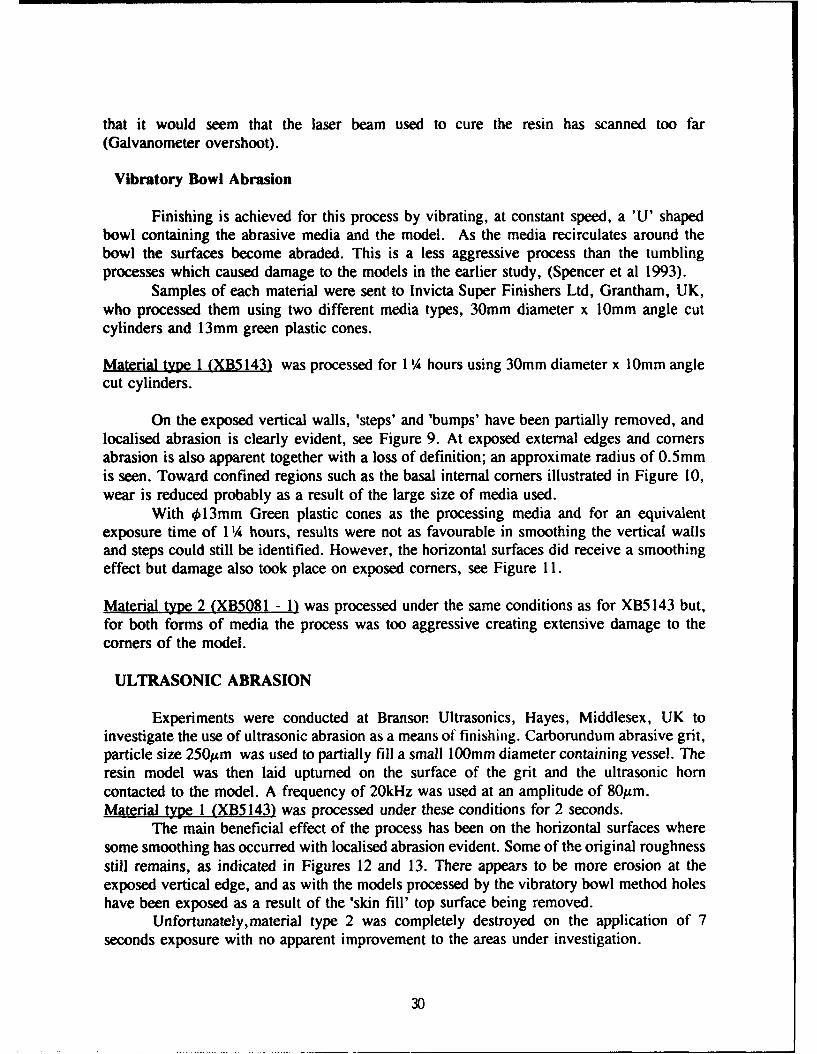
that it would seem that the laser beam used to cure the resin has scanned too far
(Galvanometer overshoot).
Vibratory Bowl Abrasion
Finishing is achieved for this process by vibrating, at constant speed, a 'U' shapedbowl containing the abrasive media and the model. As the media recirculates around thebowl the surfaces become abraded. This is a less aggressive process than the tumblingprocesses which caused damage to the models in the earlier study, (Spencer et al 1993).
Samples of each material were sent to Invicta Super Finishers Ltd, Grantham, UK,who processed them using two different media types, 30mm diameter x 10mm angle cutcylinders and 13mm green plastic cones.
Material type 1 (XB5143) was processed for 1 /4 hours using 30mm diameter x 10mm anglecut cylinders.
On the exposed vertical walls, 'steps' and 'bumps' have been partially removed, andlocalised abrasion is clearly evident, see Figure 9. At exposed external edges and cornersabrasion is also apparent together with a loss of definition; an approximate radius of 0.5mmis seen. Toward confined regions such as the basal internal corners illustrated in Figure 10,wear is reduced probably as a result of the large size of media used.
With •413mm Green plastic cones as the processing media and for an equivalentexposure time of 1 '/ hours, results were not as favourable in smoothing the vertical wallsand steps could still be identified. However, the horizontal surfaces did receive a smoothingeffect but damage also took place on exposed corners, see Figure 11.
Material type 2 (XB5081 - 1) was processed under the same conditions as for XB5143 but,for both forms of media the process was too aggressive creating extensive damage to thecorners of the model.
ULTRASONIC ABRASION
Experiments were conducted at Branson Ultrasonics, Hayes, Middlesex, UK toinvestigate the use of ultrasonic abrasion as a means of finishing. Carborundum abrasive grit,particle size 25014m was used to partially fill a small 100mm diameter containing vessel. Theresin model was then laid upturned on the surface of the grit and the ultrasonic horncontacted to the model. A frequency of 20kHz was used at an amplitude of 80%m.Material type 1 (XB5143) was processed under these conditions for 2 seconds.
The main beneficial effect of the process has been on the horizontal surfaces wheresome smoothing has occurred with localised abrasion evident. Some of the original roughnessstill remains, as indicated in Figures 12 and 13. There appears to be more erosion at theexposed vertical edge, and as with the models processed by the vibratory bowl method holeshave been exposed as a result of the 'skin fill' top surface being removed.
Unfortunately,material type 2 was completely destroyed on the application of 7seconds exposure with no apparent improvement to the areas under investigation.
30
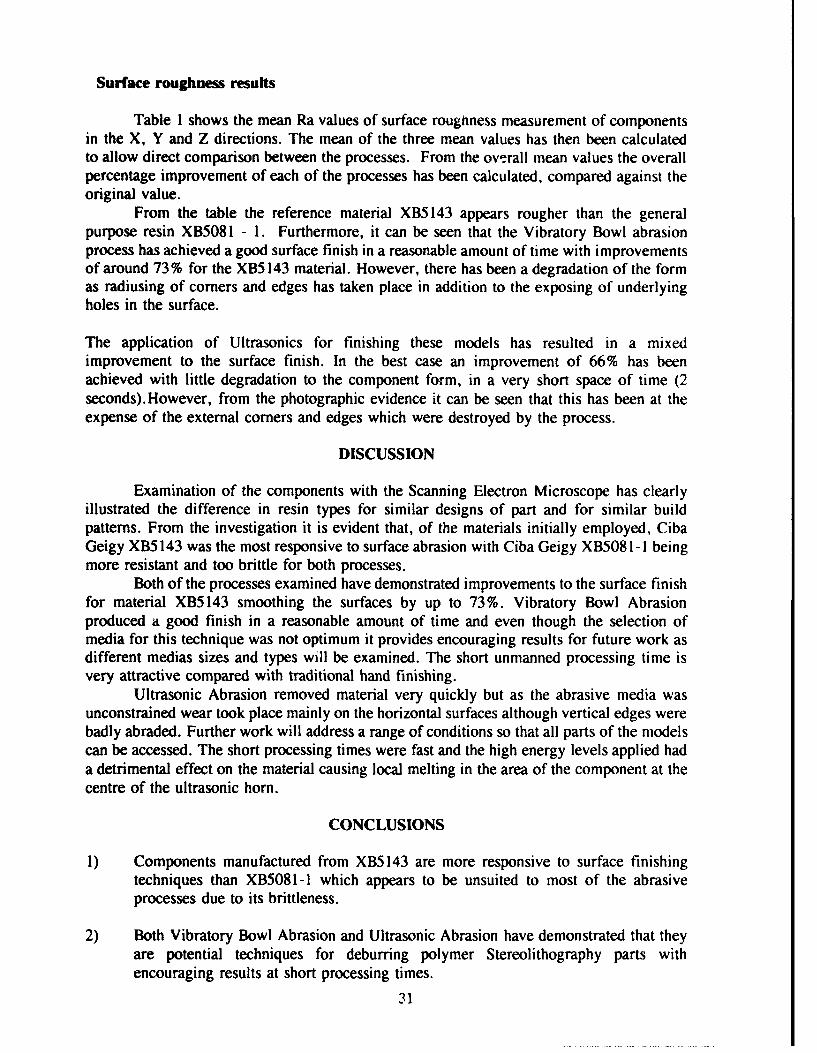
Surface roughness results
Table 1 shows the mean Ra values of surface roughness measurement of componentsin the X, Y and Z directions. The mean of the three mean values has then been calculatedto allow direct comparison between the processes. From the overall mean values the overallpercentage improvement of each of the processes has been calculated, compared against theoriginal value.
From the table the reference material XB5143 appears rougher than the generalpurpose resin XB5081 - 1. Furthermore, it can be seen that the Vibratory Bowl abrasionprocess has achieved a good surface finish in a reasonable amount of time with improvementsof around 73% for the XB5143 material. However, there has been a degradation of the formas radiusing of corners and edges has taken place in addition to the exposing of underlyingholes in the surface.
The application of Ultrasonics for finishing these models has resulted in a mixedimprovement to the surface finish. In the best case an improvement of 66% has beenachieved with little degradation to the component form, in a very short space of time (2seconds). However, from the photographic evidence it can be seen that this has been at theexpense of the external corners and edges which were destroyed by the process.
DISCUSSION
Examination of the components with the Scanning Electron Microscope has clearlyillustrated the difference in resin types for similar designs of part and for similar buildpatterns. From the investigation it is evident that, of the materials initially employed, CibaGeigy XB5143 was the most responsive to surface abrasion with Ciba Geigy XB508 1-1 beingmore resistant and too brittle for both processes.
Both of the processes examined have demonstrated improvements to the surface finishfor material XB5143 smoothing the surfaces by up to 73%. Vibratory Bowl Abrasionproduced a good finish in a reasonable amount of time and even though the selection ofmedia for this technique was not optimum it provides encouraging results for future work asdifferent medias sizes and types will be examined. The short unmanned processing time isvery attractive compared with traditional hand finishing.
Ultrasonic Abrasion removed material very quickly but as the abrasive media wasunconstrained wear took place mainly on the horizontal surfaces although vertical edges werebadly abraded. Further work will address a range of conditions so that all parts of the modelscan be accessed. The short processing times were fast and the high energy levels applied hada detrimental effect on the material causing local melting in the area of the component at thecentre of the ultrasonic horn.
CONCLUSIONS
1) Components manufactured from XB5143 are more responsive to surface finishingtechniques than XB5081-1 which appears to be unsuited to most of the abrasiveprocesses due to its brittleness.
2) Both Vibratory Bowl Abrasion and Ultrasonic Abrasion have demonstrated that theyare potential techniques for deburring polymer Stereolithography parts withencouraging results at short processing times.
31
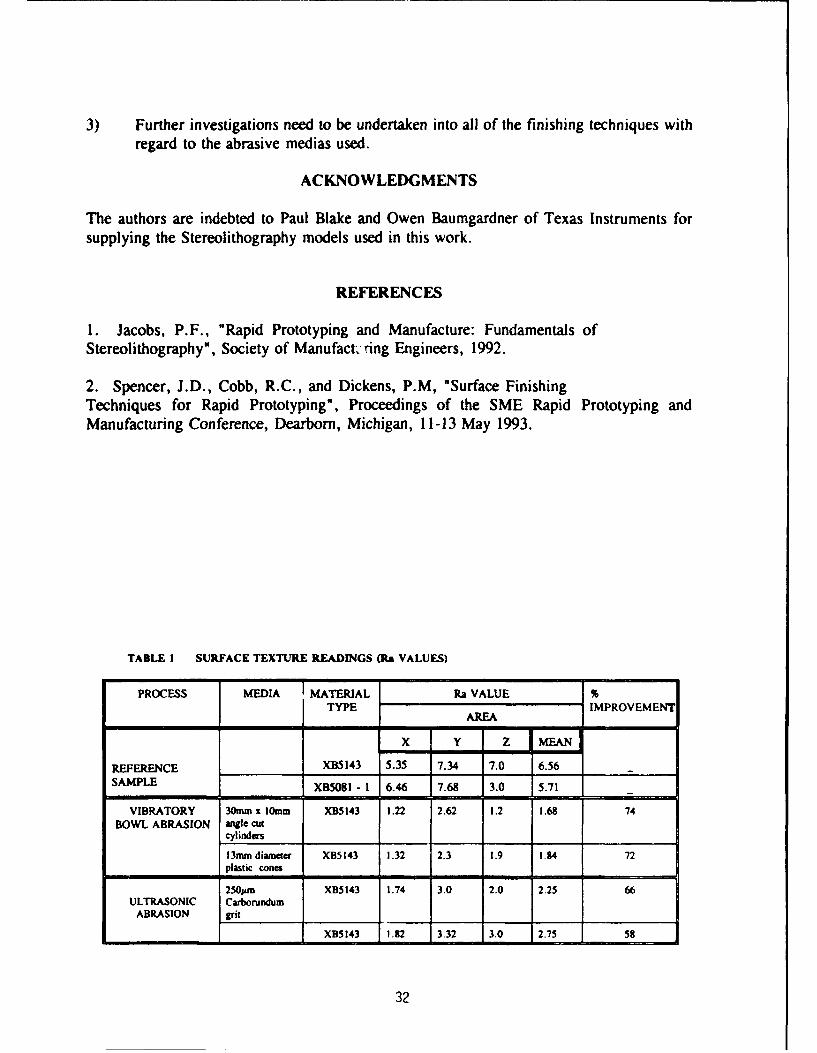
3) Further investigations need to be undertaken into all of the finishing techniques with
regard to the abrasive medias used.
ACKNOWLEDGMENTS
The authors are indebted to Paul Blake and Owen Baumgardner of Texas Instruments forsupplying the Stereolithography models used in this work.
REFERENCES
1. Jacobs, P.F., "Rapid Prototyping and Manufacture: Fundamentals ofStereolithography", Society of Manufactr ring Engineers, 1992.
2. Spencer, J.D., Cobb, R.C., and Dickens, P.M, "Surface FinishingTechniques for Rapid Prototyping", Proceedings of the SME Rapid Prototyping andManufacturing Conference, Dearborn, Michigan, 11-13 May 1993.
TABLE I SURFACE TEXTURE READINGS (Ra VALUES)
PROCESS MEDIA I MATERIAL Ra VALUE %TYPE IMPROVEMENTAREA
- -
REFERENCE ______ XB5 143 5.35 7.34 7.0 6.56
SAPEXB5081 - 1 6.46 7.68 3.0 5.771
VIBRATORY 30m xl omm XB5143 1.22 2.62 1.2 1.68 74BOWL ABRASION angle cut
cylinders
l3mm diameter XB5143 1.32 2.3 1.9 1.84 72plastic cones
2 50Am XB5143 1.74 3.0 2.0 2.25 66ULTRASONIC Carborundum
ABRASION grit _
XB5143 132 3.32 3.0 2.75 58
32
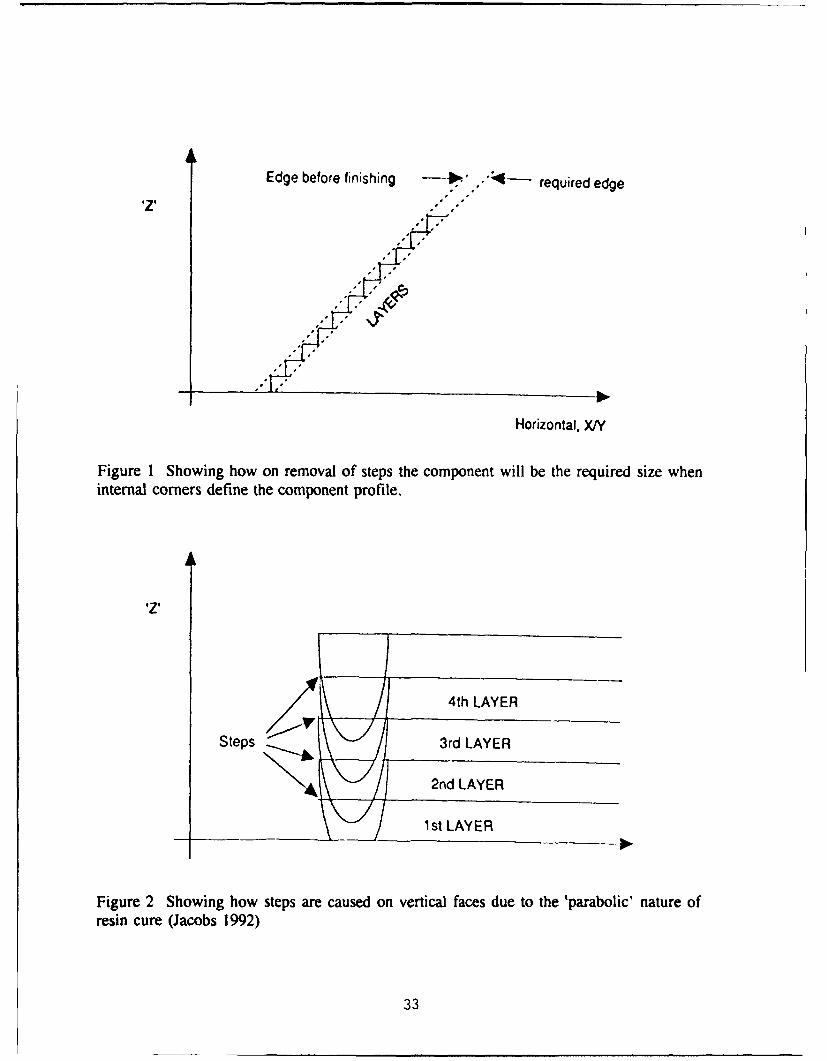
Edge before finishing ,I. required edge
Horizontal, X/Y
Figure I Showing how on removal of steps the component will be the required size wheninternal corners define the component profile.
.Z.
4th LAYER
Steps 3rd LAYER
•__ 1 1 st LAYER
Figure 2 Showing how steps are caused on vertical faces due to the 'parabolic' nature ofresin cure (Jacobs 1992)
33
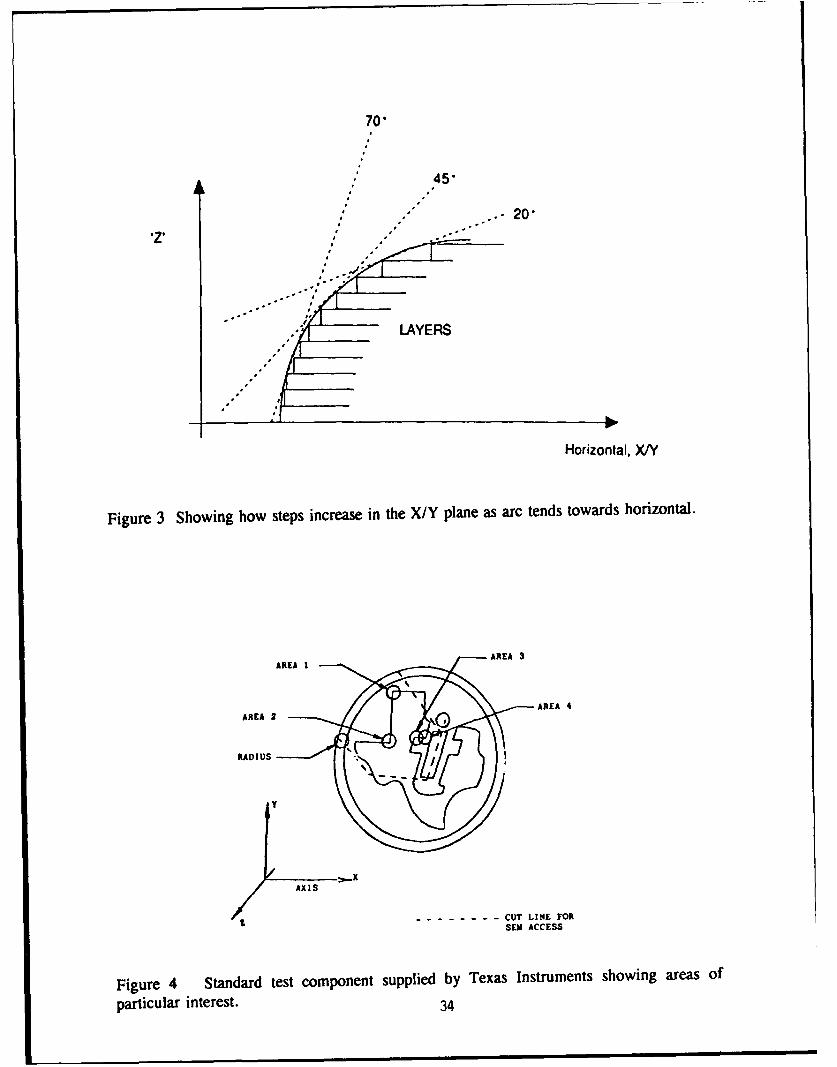
70'
0' 45"
, . - " 20
" ,i/|, /LAYERS
Horizontal, X/Y
Figure 3 Showing how steps increase in the X/Y plane as arc tends towards horizontal.
AREA I AREA 3
E AREA 4
AXIS
Z.-.- - - ------- CUT LINE FOR
SEW ACCESS
Figure 4 Standard test component supplied by Texas Instruments showing areas of
particular interest. 34
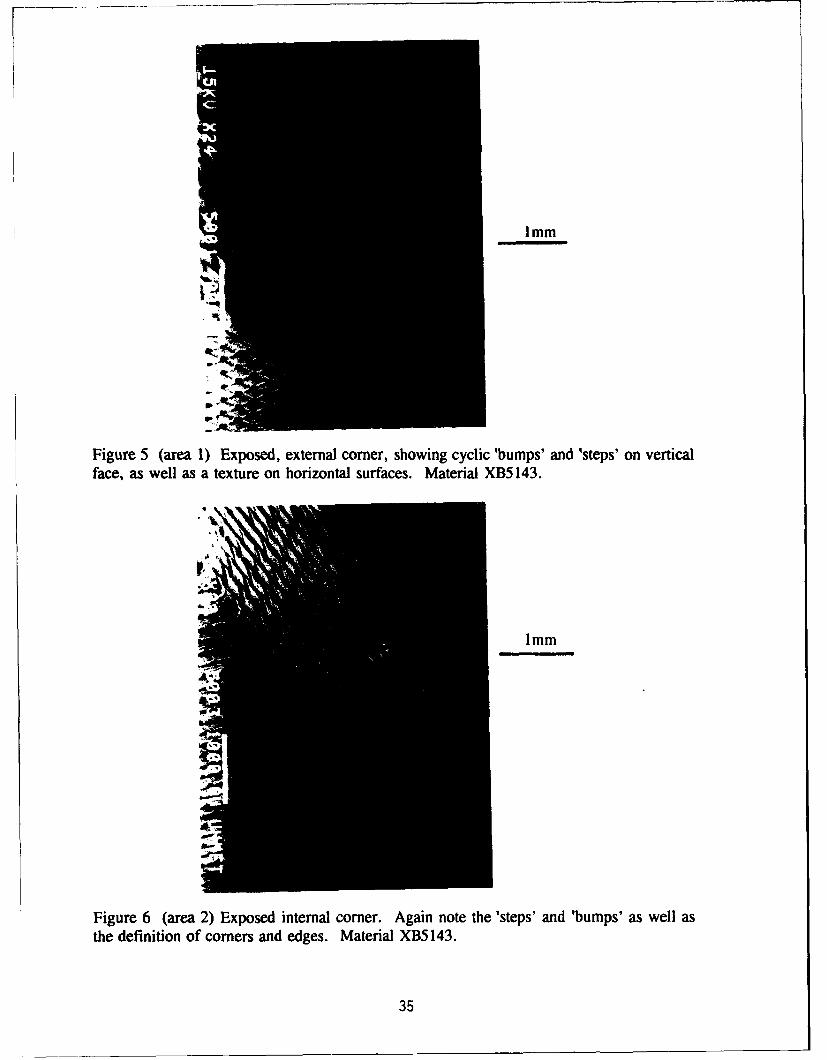
Imm
Figure 5 (area 1) Exposed, external corner, showing cyclic 'bumps' and 'steps' on verticalface, as well as a texture on horizontal surfaces. Material XB5143.
1mm
Figure 6 (area 2) Exposed internal corner. Again note the 'steps' and 'bumps' as well asthe definition of corners and edges. Material XB5143.
35
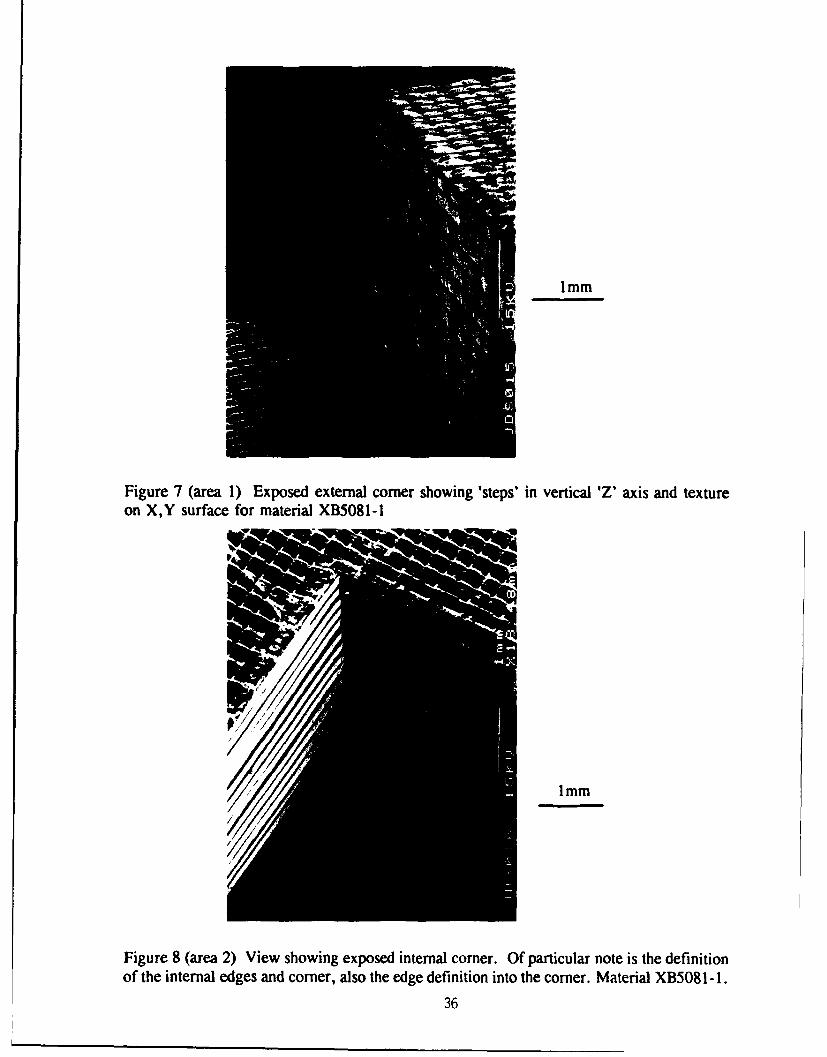
1mm
Figure 7 (area 1) Exposed external corner showing 'steps' in vertical 'Z' axis and textureon X,Y surface for material XB5081-1
1mm
Figure 8 (area 2) View showing exposed internal corner. Of particular note is the definitionof the internal edges and corner, also the edge definition into the corner. Material XB508 1-1.
36
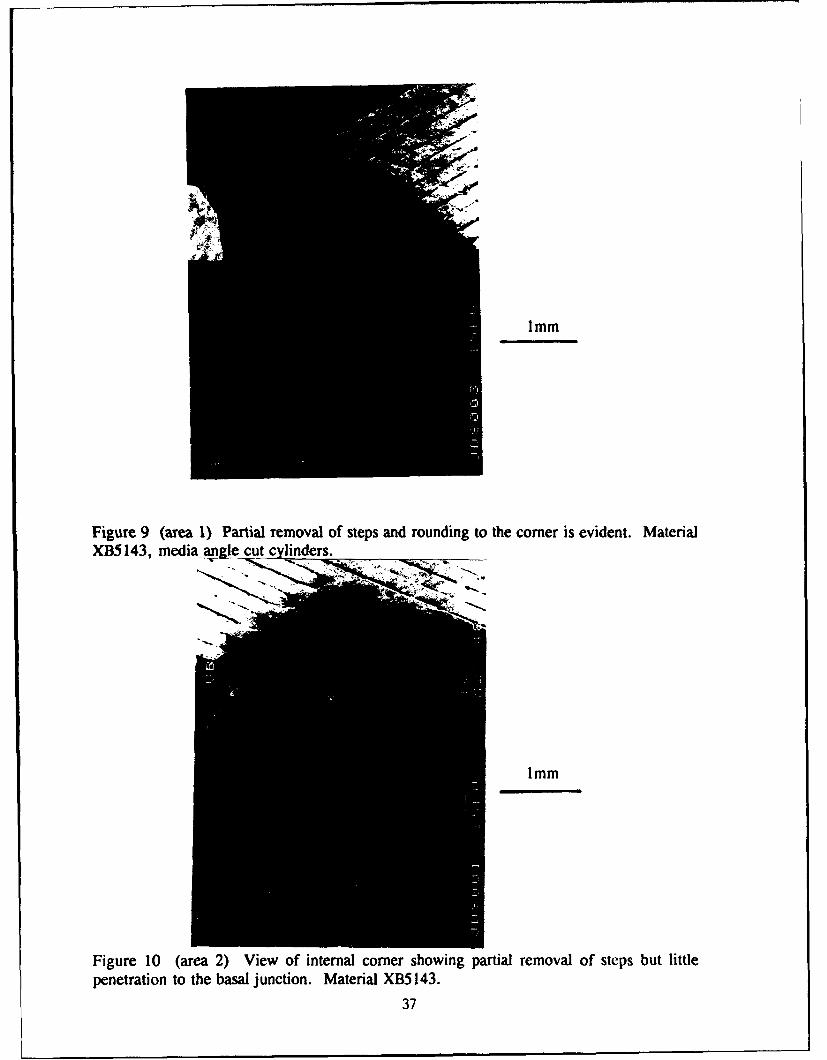
lmm
Figure 9 (area 1) Partial removal of steps and rounding to the corner is evident. MaterialXB5143, media__angle cutc linders.
1mm
Figure 10 (area 2) View of internal corner showing partial removal of steps but littlepenetration to the basal junction. Material XB5143.
37
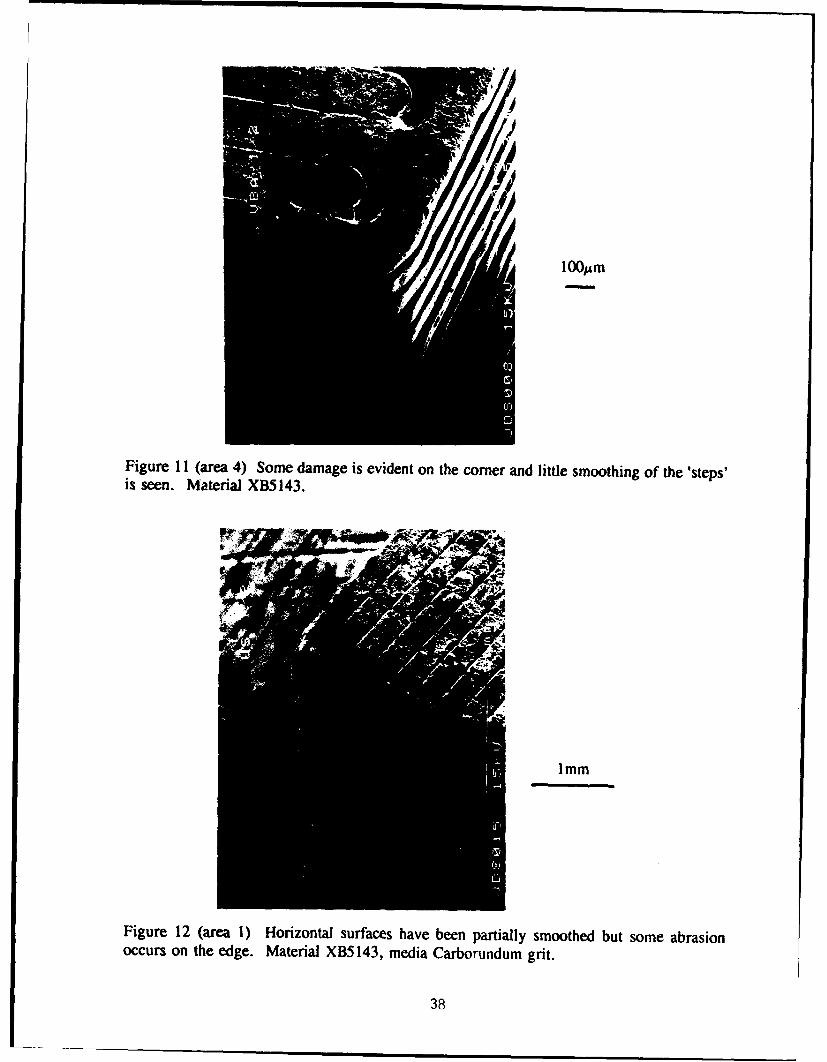
100pm
Figure 11 (area 4) Some damage is evident on the corner and little smoothing of the 'steps'is seen. Material XB5143.
-mm
Figure 12 (area 1) Horizontal surfaces have been partially smoothed but some abrasionoccurs on the edge. Material XB5143, media Carborundum grit.
38
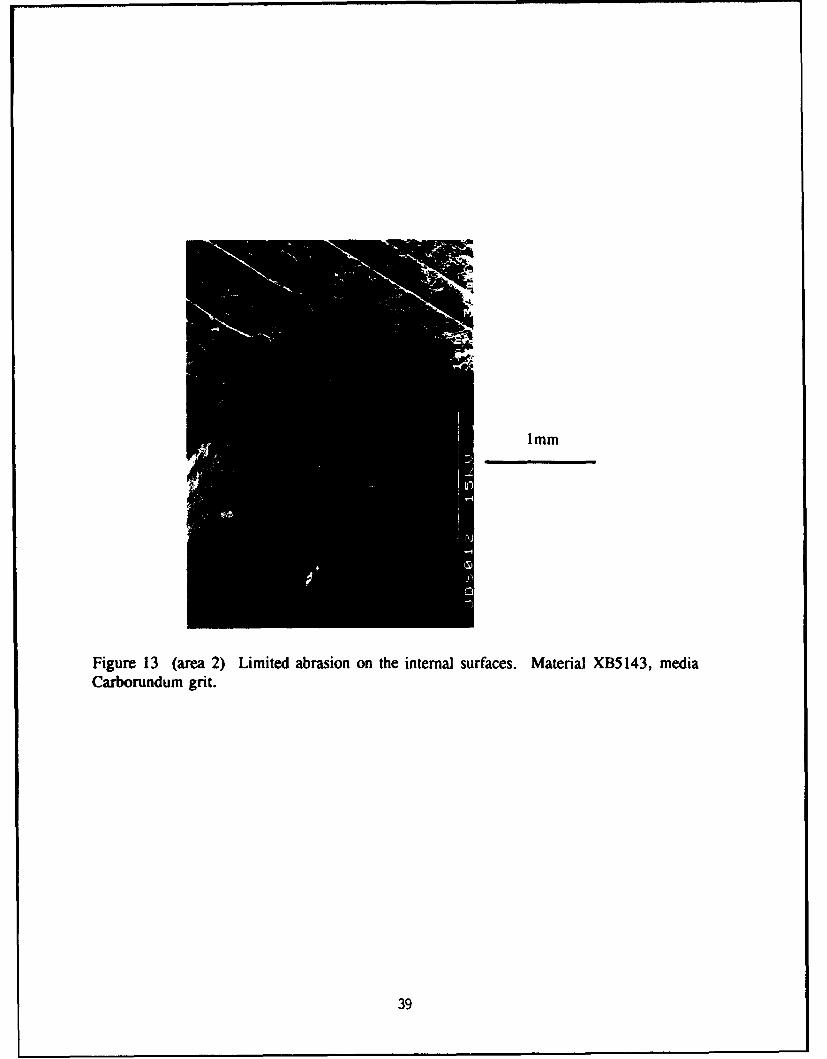
1mm
Figure 13 (area 2) Limited abrasion on the internal surfaces. Material XB5143, mediaCarborundum grit.
39
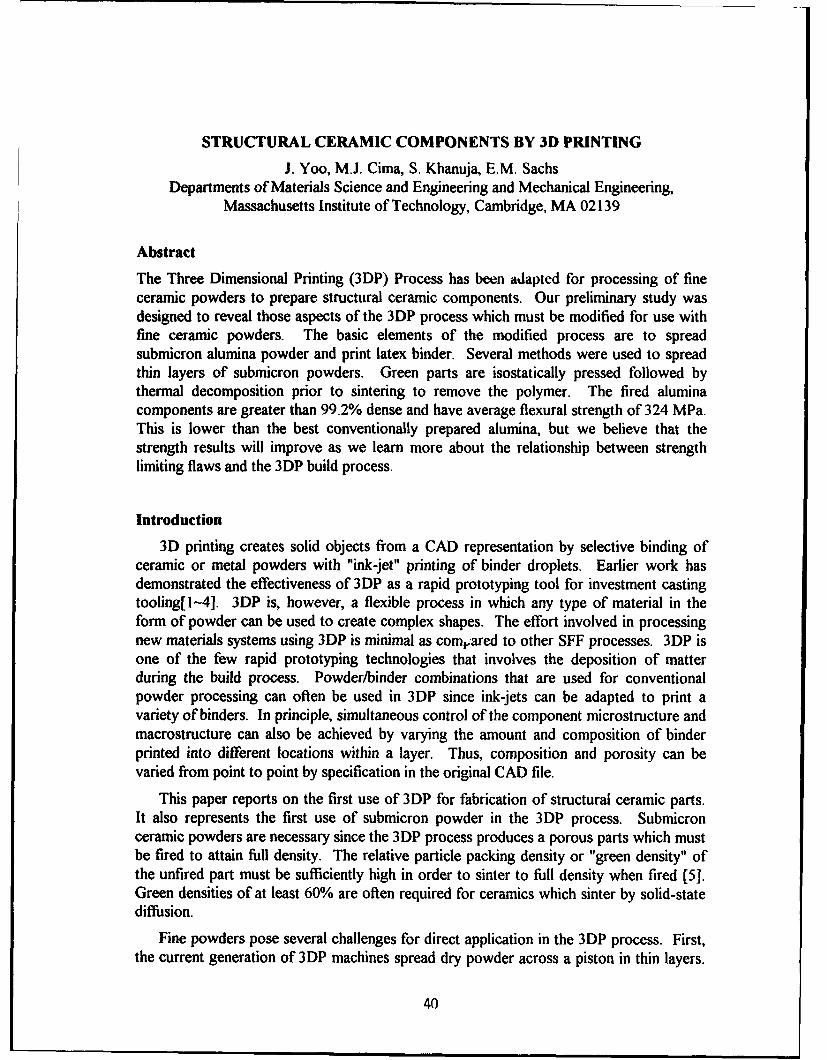
STRUCTURAL CERAMIC COMPONENTS BY 3D PRINTING
J. Yoo, M.J. Cima, S. Khanuja, E.M. SachsDepartments of Materials Science and Engineering and Mechanical Engineering,
Massachusetts Institute of Technology, Cambridge, MA 02139
Abstract
The Three Dimensional Printing (3DP) Process has been adapted for processing of fineceramic powders to prepare structural ceramic components. Our preliminary study wasdesigned to reveal those aspects of the 3DP process which must be modified for use withfine ceramic powders. The basic elements of the modified process are to spreadsubmicron alumina powder and print latex binder. Several methods were used to spreadthin layers of submicron powders. Green parts are isostatically pressed followed bythermal decomposition prior to sintering to remove the polymer. The fired aluminacomponents are greater than 99.2% dense and have average flexural strength of 324 MPa.This is lower than the best conventionally prepared alumina, but we believe that thestrength results will improve as we learn more about the relationship between strengthlimiting flaws and the 3DP build process.
Introduction
3D printing creates solid objects from a CAD representation by selective binding ofceramic or metal powders with "ink-jet" printing of binder droplets. Earlier work hasdemonstrated the effectiveness of 3DP as a rapid prototyping tool for investment castingtooling[l-4]. 3DP is, however, a flexible process in which any type of material in theform of powder can be used to create complex shapes. The effort involved in processingnew materials systems using 3DP is minimal as compared to other SFF processes. 3DP isone of the few rapid prototyping technologies that involves the deposition of matterduring the build process. Powder/binder combinations that are used for conventionalpowder processing can often be used in 3DP since ink-jets can be adapted to print avariety of binders. In principle, simultaneous control of the component microstructure andmacrostructure can also be achieved by varying the amount and composition of binderprinted into different locations within a layer. Thus, composition and porosity can bevaried from point to point by specification in the original CAD file.
This paper reports on the first use of 3DP for fabrication of structural ceramic parts.It also represents the first use of submicron powder in the 3DP process. Submicronceramic powders are necessary since the 3DP process produces a porous parts which mustbe fired to attain full density. The relative particle packing density or "green density" ofthe unfired part must be sufficiently high in order to sinter to full density when fired [5].Green densities of at least 60% are often required for ceramics which sinter by solid-statediffusion.
Fine powders pose several challenges for direct application in the 3DP process. First,the current generation of 3DP machines spread dry powder across a piston in thin layers.
40
Fine powders do not generally flow well enough to spread into defect-free layers. Theirhigh surface area causes increased cohesive strength of the unpacked powder and adecreased flowability. Simple modifications were made to the conventional spreadingmethod to overcome the difficulties of fine powder. A press-rolling technique was devisedfor this purpose and using the initial low packing of the fine agglomerates and the loadapplied to the powder bed by stream rolling the spreader rod, we were able to spreaduniform thin layers of fine powder. Uniformity in the microstructure of green samples isnecessary to ensure the elimination of defects upon sintering. Isostatic pressing techniqueswere used to enhance the density before firing. The effects of this post treatment will bediscussed.
Laminated building processes have the potential for producing structural parts that aresuperior to those prepared by other fabrication methods. Powder molding processesinvolve deformation of powder masses into dies to form complex shapes. The masstypically includes rather large amounts of organic binder to increase plastic flow into themold, as is done in powder injection molding. The shear history of each volume elementof the component is different beacuse of the complex shape of the mold. This results innonuniform powder packing in the green part and uncontrolled shrinkage and distortionduring sintering. Each volume element of a laminated object is, however, prepared in thesame way, regardless of shape or dimension. Secondly, binder removal is oftenaccompanied by the formation of defects and adds considerably to the cycle time forcomponent production [6]. Much less binder is required in the 3DP process, since thebinder is used only to hold the green part together rather than plasticize the powder mass.
A process to make complex structural ceramic parts without the need for complextooling will have a great impact on many applications of ceramics. One of the countlesspossible applications of this technology is the implementation of an accurate testingmethod for brittle materials. The theta specimen, first proposed by Durelli, Morse andParks in 1962 is one such example (Figure 1). The special shape of the specimen allowsone to test the tensile strength of brittle materials by diametrical compression. The load istransferred to the central bridge due to the outward motion of the ring on the horizontalaxis. The test method eliminates the need for complex gripping schemes often requiredwhen testing brittle materials. It is a common practice to use 3 or 4 point bending tests forbrittle materials for this reason. Theta specimen testing is not often used, however,because of the difficulty in fabricating the complex shape required. The development of3DP process for fully dense ceramic parts makes the fabrication of theta specimens atrivial matter and a new standard for mechanical testing of brittle materials can beimplemented with the help of 3DP technology.
Experimental Procedure
The powder used for this study was Reynolds RC I 72-DBM alumina, both undopedand MgO doped, with the mean primary particle size of 0.8ptm. Through sieving of as-received powder, agglomerates of sizes between 75 and 150 ptm were screened to be usedin the experiments. The apparent density and the tap density of the selected agglomerateswere measured by using the apparatus and the techniques described by J. Lee [7].
41
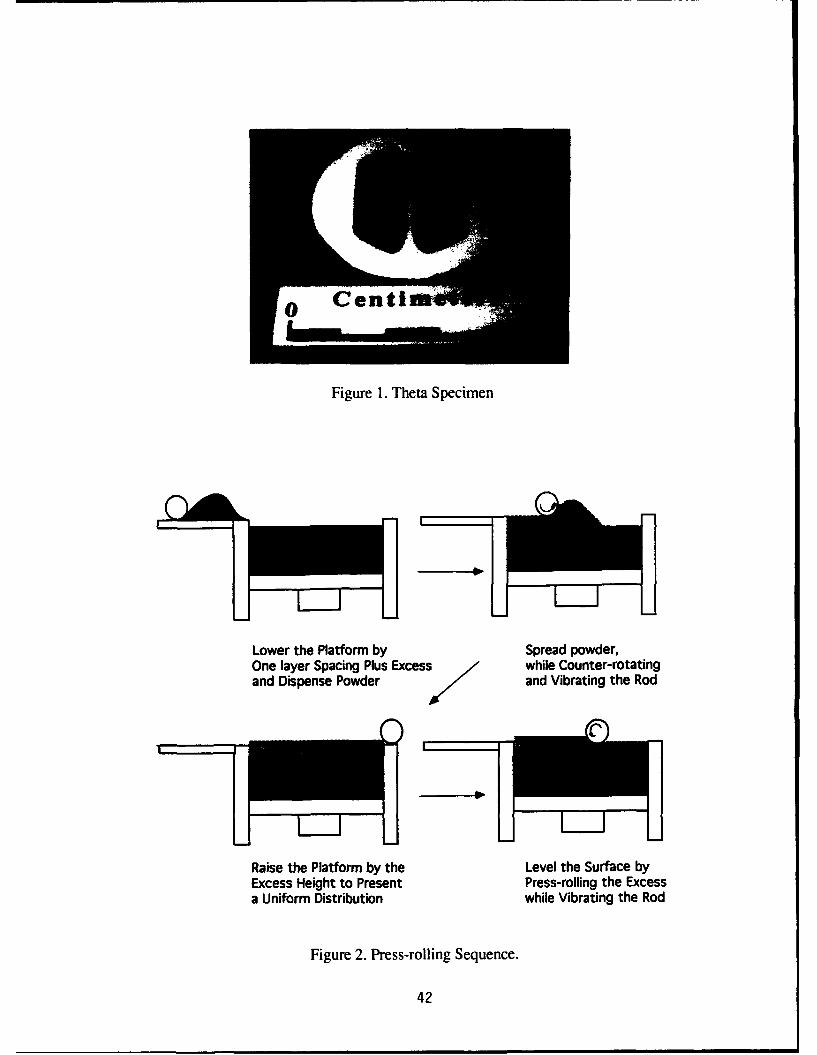
C Centi
Figure 1. Theta Specimen
Lower the Platform by Spread powder,One layer Spacing Plus Excess while Counter-rotatingand Dispense Powder and Vibrating the Rod
•7Raise the Platform by the Level the Surface byExcess Height to Present Press-rolling the Excessa Uniform Distribution while Vibrating the Rod
Figure 2. Press-rolling Sequence.
42
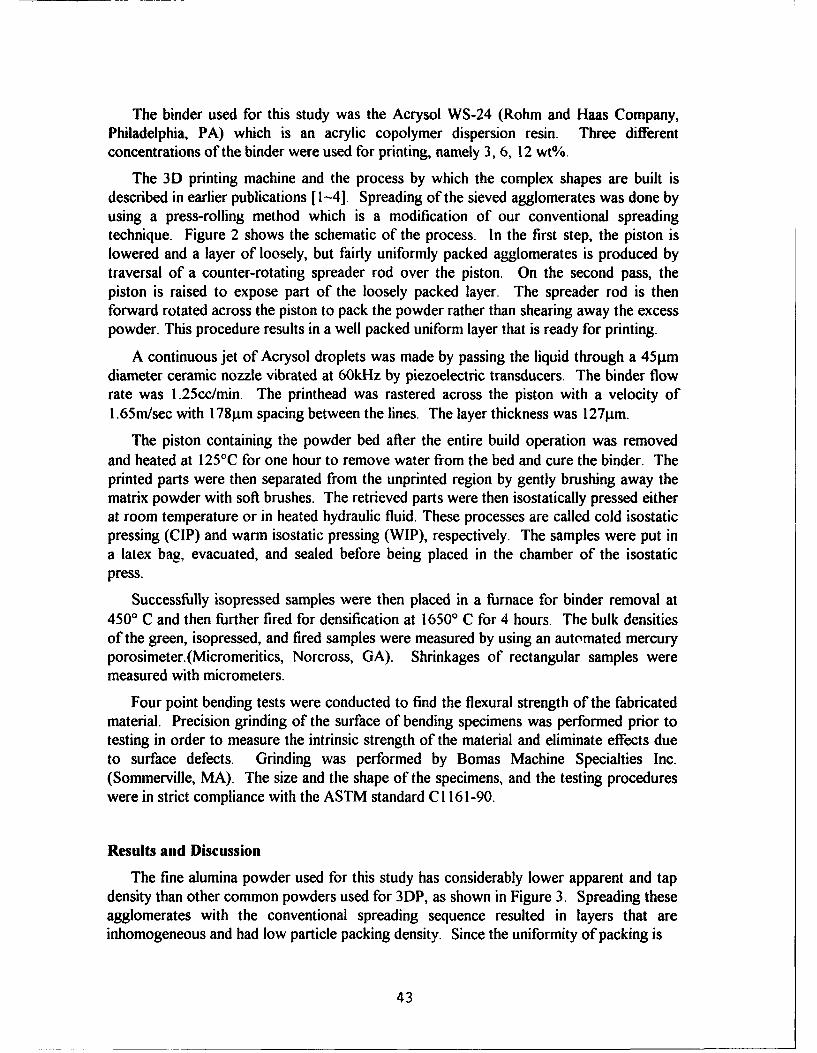
The binder used for this study was the Acrysol WS-24 (Rohm and Haas Company,Philadelphia, PA) which is an acrylic copolymer dispersion resin. Three differentconcentrations of the binder were used for printing, namely 3, 6, 12 wt%.
The 3D printing machine and the process by which the complex shapes are built isdescribed in earlier publications [!-4]. Spreading of the sieved agglomerates was done byusing a press-rolling method which is a modification of our conventional spreadingtechnique. Figure 2 shows the schematic of the process. In the first step, the piston islowered and a layer of loosely, but fairly uniformly packed agglomerates is produced bytraversal of a counter-rotating spreader rod over the piston. On the second pass, thepiston is raised to expose part of the loosely packed layer. The spreader rod is thenforward rotated across the piston to pack the powder rather than shearing away the excesspowder. This procedure results in a well packed uniform layer that is ready for printing.
A continuous jet of Acrysol droplets was made by passing the liquid through a 45gmdiameter ceramic nozzle vibrated at 60kHz by piezoelectric transducers. The binder flowrate was 1.25cc/min. The printhead was rastered across the piston with a velocity of1.65m/sec with 178gm spacing between the lines. The layer thickness was 127gm.
The piston containing the powder bed after the entire build operation was removedand heated at 125°C for one hour to remove water from the bed and cure the binder. Theprinted parts were then separated from the unprinted region by gently brushing away thematrix powder with soft brushes. The retrieved parts were then isostatically pressed eitherat room temperature or in heated hydraulic fluid. These processes are called cold isostaticpressing (CIP) and warm isostatic pressing (WIP), respectively. The samples were put ina latex bag, evacuated, and sealed before being placed in the chamber of the isostaticpress.
Successfully isopressed samples were then placed in a furnace for binder removal at4500 C and then further fired for densification at 16500 C for 4 hours. The bulk densitiesof the green, isopressed, and fired samples were measured by using an automated mercuryporosimeter.(Micromeritics, Norcross, GA). Shrinkages of rectangular samples weremeasured with micrometers.
Four point bending tests were conducted to find the flexural strength of the fabricatedmaterial. Precision grinding of the surface of bending specimens was performed prior totesting in order to measure the intrinsic strength of the material and eliminate effects dueto surface defects. Grinding was performed by Bomas Machine Specialties Inc.(Sommerville, MA). The size and the shape of the specimens, and the testing procedureswere in strict compliance with the ASTM standard C 1161-90.
Results and Discussion
The fine alumina powder used for this study has considerably lower apparent and tapdensity than other common powders used for 3DP, as shown in Figure 3. Spreading theseagglomerates with the conventional spreading sequence resulted in layers that areinhomogeneous and had low particle packing density. Since the uniformity of packing is
43
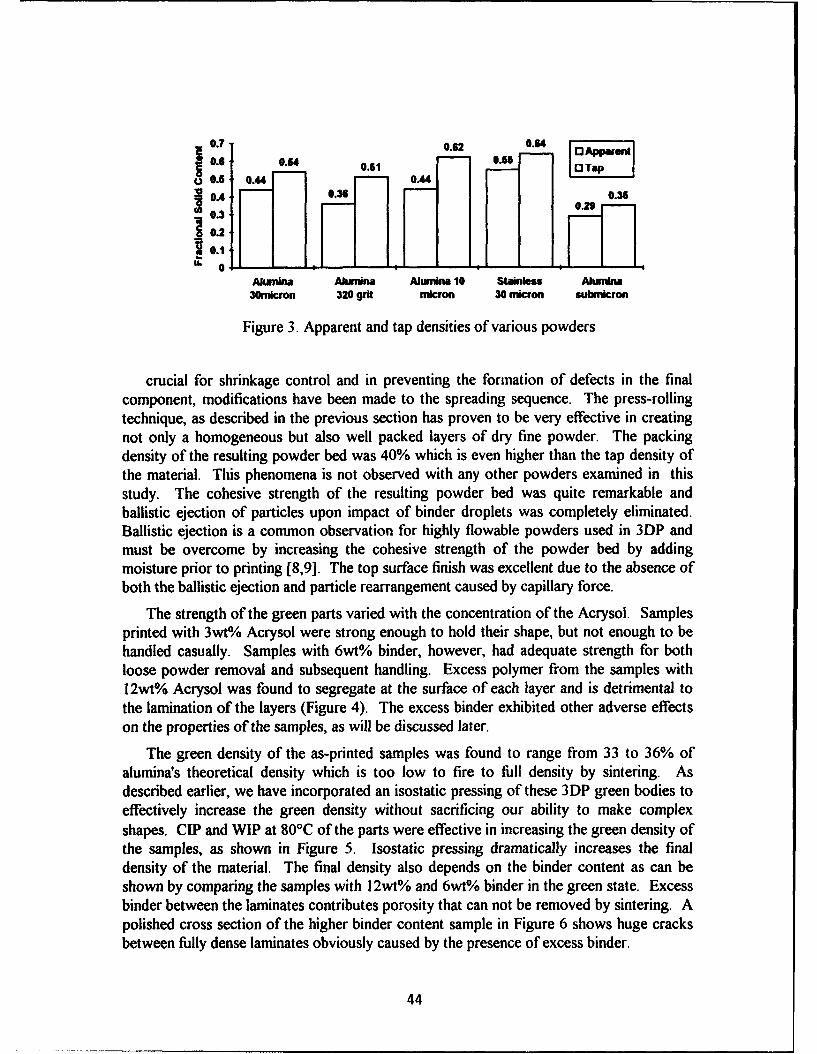
0. o10.62 0.64 A
0.6 . 64 0.61
OA 0.36
_ 0.3 0
0.2
0.1
Alumina Alumina Nunu 10 Stainles Almina30micron 320 grit micron 30 micron sutuntcron
Figure 3. Apparent and tap densities of various powders
crucial for shrinkage control and in preventing the formation of defects in the finalcomponent, modifications have been made to the spreading sequence. The press-rollingtechnique, as described in the previous section has proven to be very effective in creatingnot only a homogeneous but also well packed layers of dry fine powder. The packingdensity of the resulting powder bed was 40% which is even higher than the tap density ofthe material. This phenomena is not observed with any other powders examined in thisstudy. The cohesive strength of the resulting powder bed was quite remarkable andballistic ejection of particles upon impact of binder droplets was completely eliminated.Ballistic ejection is a common observation for highly flowable powders used in 3DP andmust be overcome by increasing the cohesive strength of the powder bed by addingmoisture prior to printing [8,9]. The top surface finish was excellent due to the absence ofboth the ballistic ejection and particle rearrangement caused by capillary force.
The strength of the green parts varied with the concentration of the Acrysol. Samplesprinted with 3wt% Acrysol were strong enough to hold their shape, but not enough to behandled casually. Samples with 6wt% binder, however, had adequate strength for bothloose powder removal and subsequent handling. Excess polymer from the samples with12wt% Acrysol was found to segregate at the surface of each layer and is detrimental tothe lamination of the layers (Figure 4). The excess binder exhibited other adverse effectson the properties of the samples, as will be discussed later.
The green density of the as-printed samples was found to range from 33 to 36% ofalumina's theoretical density which is too low to fire to full density by sintering. Asdescribed earlier, we have incorporated an isostatic pressing of these 3DP green bodies toeffectively increase the green density without sacrificing our ability to make complexshapes. CIP and WIP at 80°C of the parts were effective in increasing the green density ofthe samples, as shown in Figure 5. Isostatic pressing dramatically increases the finaldensity of the material. The final density also depends on the binder content as can beshown by comparing the samples with I2wt% and 6wt% binder in the green state. Excessbinder between the laminates contributes porosity that can not be removed by sintering. Apolished cross section of the higher binder content sample in Figure 6 shows huge cracksbetween fully dense laminates obviously caused by the presence of excess binder.
44
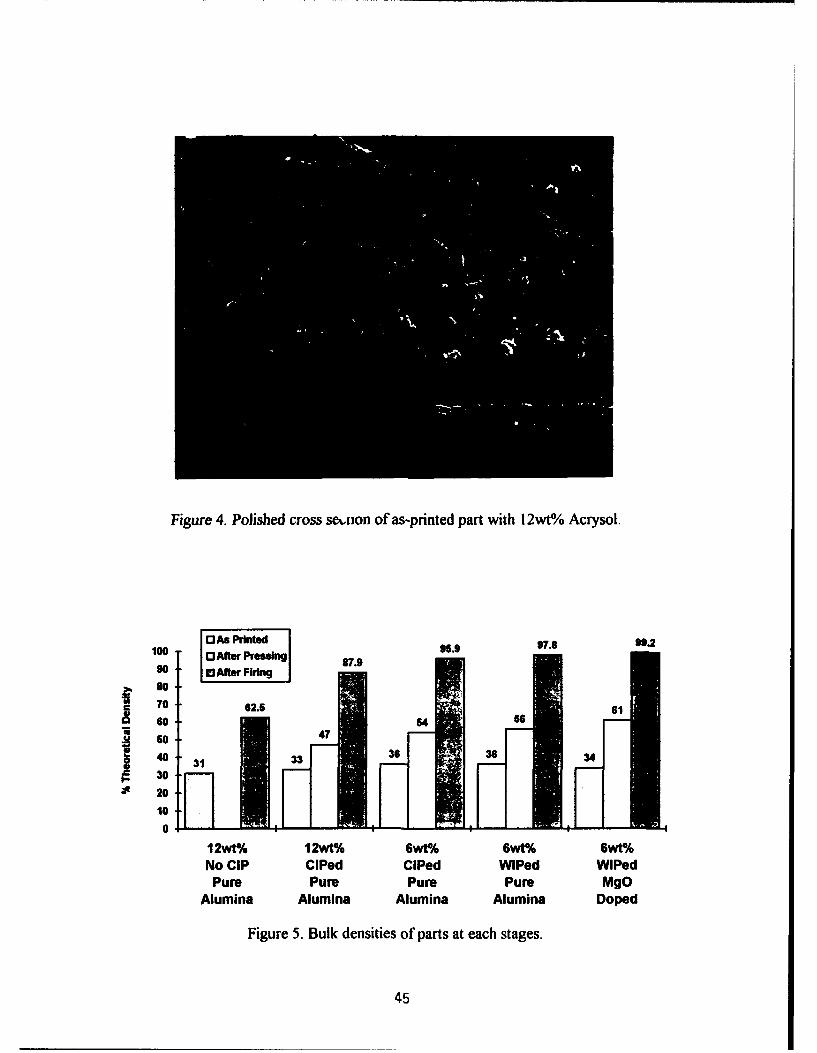
Fig'ure 4. Polished cross se,,tuon of as-printed part with l2wt% Acrysol.
100 rite 95.9 97. 92100 0Afte Presing37.9
90 M After Firingso3
70 62.5 61so 45
S 60 4
30
Jt 20
10
Il2wtO/. l2wt% 6wt% 6Wt% 6wt%No CIP CiPed CiPed WiPed WipedPure Pure Pure Pure MgO
Alumina Alumina Alumina Alumina Doped
Figure 5. Bulk densities of parts at each stages.
45
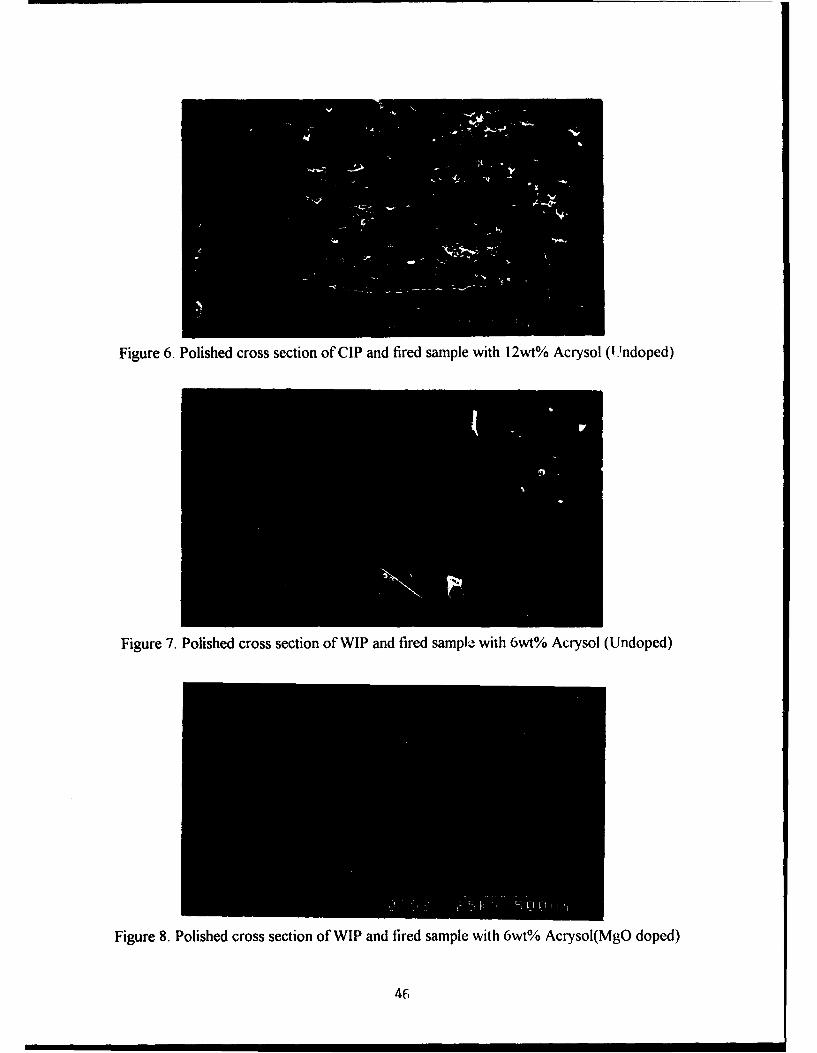
Figure 6. Polished cross section of CIP and fired sample with 12wt% Acrysol (I Indoped)
Figure 7. Polished cross section of WIP and fired sample with 6wt% Acrysol (Undoped)
Figure 8. Polished cross section of WIP and fired sample with 6wt% Acrysol(MgO doped)
46
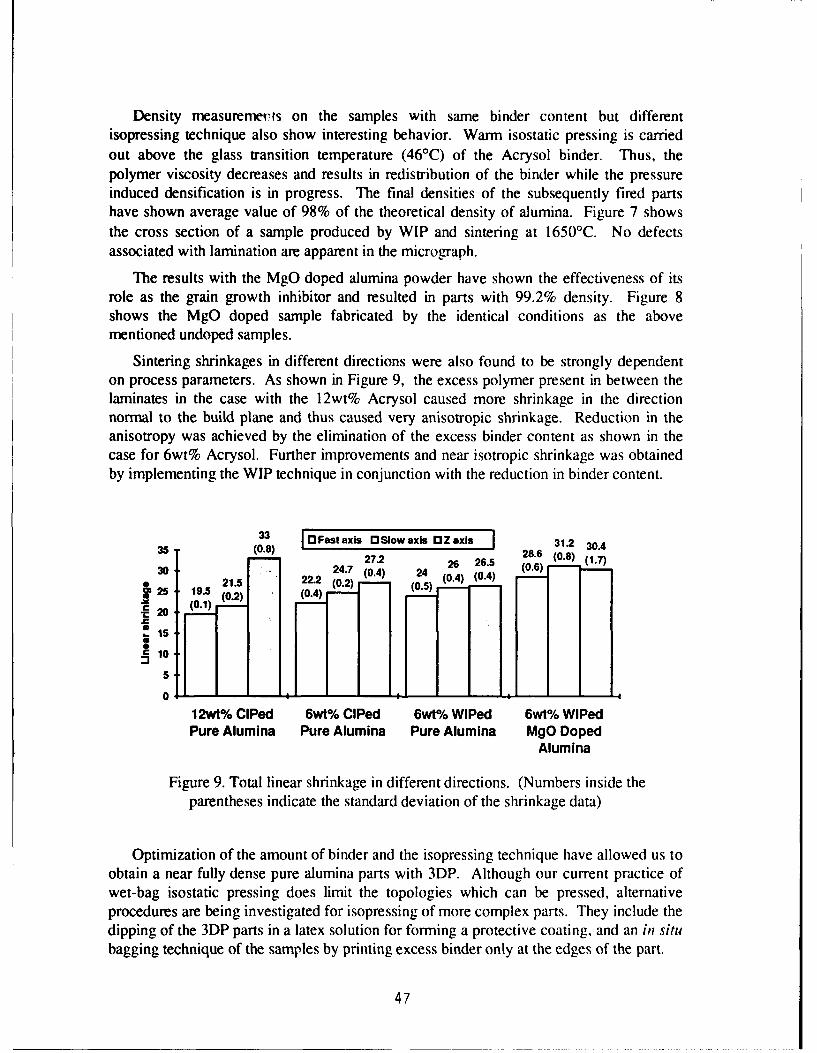
Density measuremenKs on the samples with same binder content but differentisopressing technique also show interesting behavior. Warm isostatic pressing is carriedout above the glass transition temperature (46'C) of the Acrysol binder. Thus, thepolymer viscosity decreases and results in redistribution of the binder while the pressureinduced densification is in progress. The final densities of the subsequently fired partshave shown average value of 98% of the theoretical density of alumina. Figure 7 showsthe cross section of a sample produced by WIP and sintering at 1650'C. No defectsassociated with lamination are apparent in the micrograph.
The results with the MgO doped alumina powder have shown the effectiveness of itsrole as the grain growth inhibitor and resulted in parts with 99.2% density. Figure 8shows the MgO doped sample fabricated by the identical conditions as the abovementioned undoped samples.
Sintering shrinkages in different directions were also found to be strongly dependenton process parameters. As shown in Figure 9, the excess polymer present in between thelaminates in the case with the 12wt% Acrysol caused more shrinkage in the directionnormal to the build plane and thus caused very anisotropic shrinkage. Reduction in theanisotropy was achieved by the elimination of the excess binder content as shown in thecase for 6wt% Acrysol. Further improvements and near isotropic shrinkage was obtainedby implementing the WIP technique in conjunction with the reduction in binder content.
33 FOFastaxis r Slowaxis 1Zaxis 31.2 30.435 (0.8) 27.2 2 26.5 28.6 (0.8) (1.7)
S 24 7(.4) 246. (0.6)30 • 24.7 (0.4) 24 (0.4) (0.4)
19.5 21.5 (0.2) (0.5)(0.1) (0.2) (0.4)
15
U!
" 10
5
0 --. 1|--- I--- 4---
12wt% CIPed 6wt% CIPed 6wt% WIPed 6wt% WiPedPure Alumina Pure Alumina Pure Alumina MgO Doped
Alumina
Figure 9. Total linear shrinkage in different directions. (Numbers inside theparentheses indicate the standard deviation of the shrinkage data)
Optimization of the amount of binder and the isopressing technique have allowed us toobtain a near fully dense pure alumina parts with 3DP. Although our current practice ofwet-bag isostatic pressing does limit the topologies which can be pressed, alternativeprocedures are being investigated for isopressing of more complex parts. They include thedipping of the 3DP parts in a latex solution for forming a protective coating, and an in situbagging technique of the samples by printing excess binder only at the edges of the part.
47
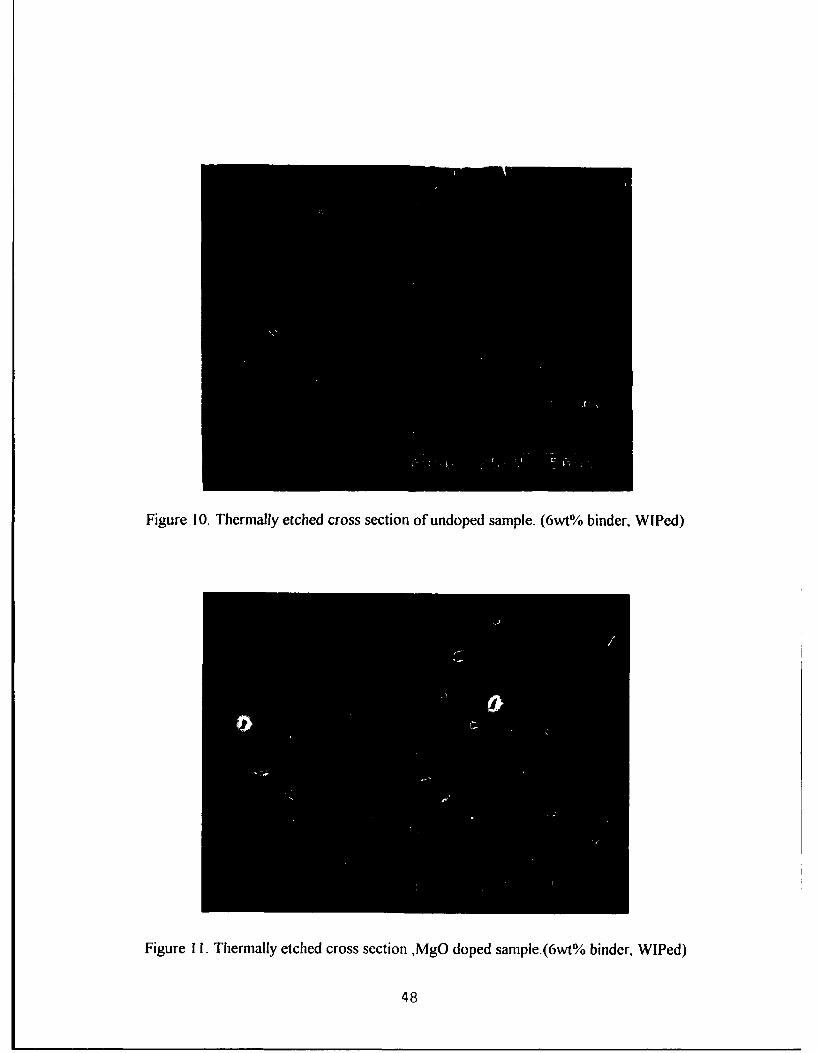
Figure 10. Thermally etched cross section of undoped sample. (6wt% binder, WIPed)
Figure i i. Thermally etched cross section ,MgO doped sample.(6wt% binder, WIPed)
48
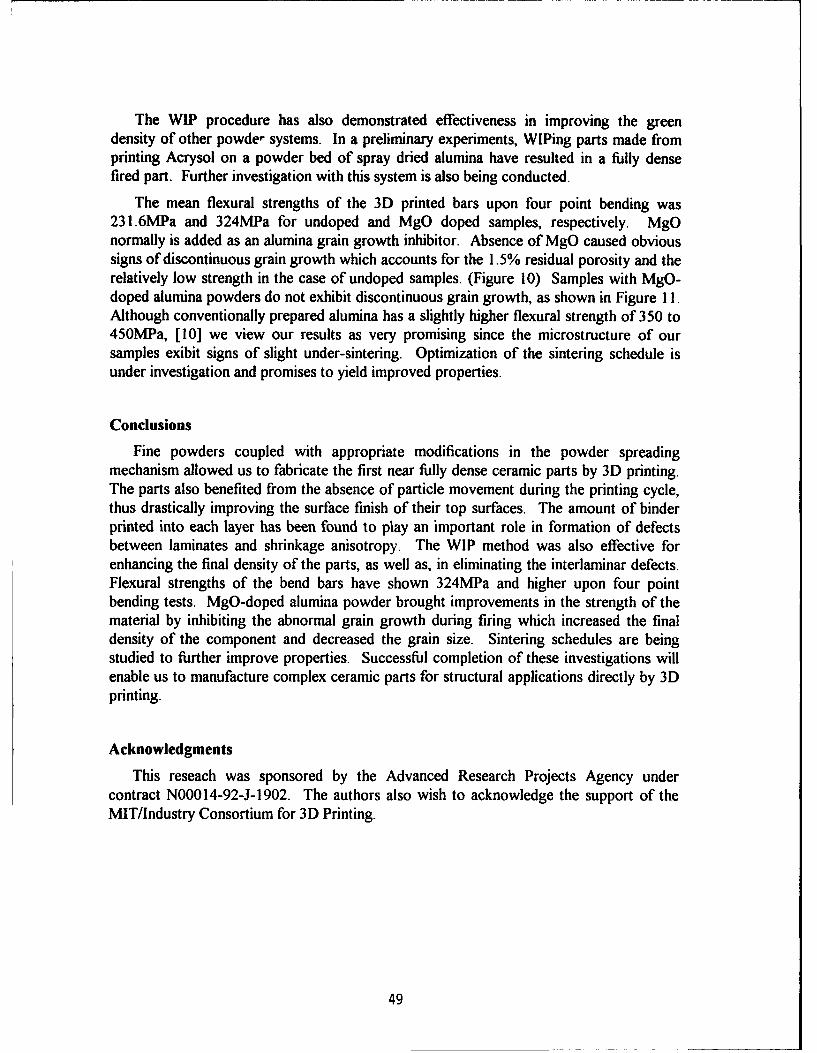
The WIP procedure has also demonstrated effectiveness in improving the greendensity of other powde- systems. In a preliminary experiments, WIPing parts made fromprinting Acrysol on a powder bed of spray dried alumina have resulted in a fully densefired part. Further investigation with this system is also being conducted.
The mean flexural strengths of the 3D printed bars upon four point bending was231.6MPa and 324MPa for undoped and MgO doped samples, respectively. MgOnormally is added as an alumina grain growth inhibitor. Absence of MgO caused obvioussigns of discontinuous grain growth which accounts for the 1.5% residual porosity and therelatively low strength in the case of undoped samples. (Figure 10) Samples with MgO-doped alumina powders do not exhibit discontinuous grain growth, as shown in Figure 11.Although conventionally prepared alumina has a slightly higher flexural strength of 350 to450MPa, [10] we view our results as very promising since the microstructure of oursamples exibit signs of slight under-sintering. Optimization of the sintering schedule isunder investigation and promises to yield improved properties.
Conclusions
Fine powders coupled with appropriate modifications in the powder spreadingmechanism allowed us to fabricate the first near fully dense ceramic parts by 3D printing.The parts also benefited from the absence of particle movement during the printing cycle,thus drastically improving the surface finish of their top surfaces. The amount of binderprinted into each layer has been found to play an important role in formation of defectsbetween laminates and shrinkage anisotropy. The WIP method was also effective forenhancing the final density of the parts, as well as, in eliminating the interlaminar defects.Flexural strengths of the bend bars have shown 324MPa and higher upon four pointbending tests. MgO-doped alumina powder brought improvements in the strength of thematerial by inhibiting the abnormal grain growth during firing which increased the finaldensity of the component and decreased the grain size. Sintering schedules are beingstudied to further improve properties. Successful completion of these investigations willenable us to manufacture complex ceramic parts for structural applications directly by 3Dprinting.
Acknowledgments
This reseach was sponsored by the Advanced Research Projects Agency undercontract N00014-92-J-1902. The authors also wish to acknowledge the support of theMIT/Industry Consortium for 3D Printing.
49
References
1. Sachs E., M. J. Cima, J. Cornie, "Three Dimensional Printing: Rapid Tooling andPrototypes Directly from a CAD Model.", CIRP Annals, vol. 39/1, p.210-204, 1990
2. Sachs E., et al, "Three Dimensional Printing: Ceramic Tooling and Parts Directly Froma CAD Model.", Nat. Conf. on Rapid Prototyping, p. 35-37, 1990
3. Sachs E. et al, "Three Dimensional Printing: Ceramic Shells and Cores for Casting andOther Applications.", 2nd Int. Conf. on Rapid Prototyping, p.39-53, 1991
4. Ashley S., "Rapid Mold-Making For Investment Casting.", Mechanical Engineering,1992, vol. 114, no.11, p.4 9 -5 1
5. Brunch C. A.,Am. Ceram. Soc. Bull., vol. 41, no. 12, p.799, 1962
6. Lewis J. A., M. J. Cima, J. of Am. Ceram. Soc.,vol. 73, no.9, p.2702-2707, 1990
7. Lee J., "Powder Layer Generation for Three Dimensional Printing" S.M. Thesis, Dept.of Mechanical Engineering, Massachusetts Institute of Technology, June 1992
8. Lauder A. M. J. Cima, E. Sachs, and T. Fan, "Three Dimensional Printing: SurfaceFinish and Microstructure of Rapid Prototyped Components"; in Proceedings, Synthesisand Processing of Ceramics: Scientific Issues, Boston, MA, 1991
9. Fan T., A. Lauder, E. Sachs, M. J. Cima, "The Surface Finish in Three DimensionalPrinting," presented at the 3rd Int. Conf. on Rapid Prototyping, 1992
10. Schwartz M., Ed., "Handbook of Structural Ceramics", McGraw-Hill, 1992
50
Direct Laser Sintering of Metals
William T. Carter, Jr. and Marshall G. JonesGeneral Electric
Corporate Research & Development Center
Abstract
The use of a directed laser beam source to selectively sinter multiple layers ofbinderless metal powder for the purposes of rapid prototyping is descri bed. Thework in this paper is restricted to -325 mesh iron powder, which was sinteredusing a CW 50 W Nd:YAG laser to approximately 35% density. A subsequentpost-treatment was performed to achieve a fully dense sample. It is envisionedthat such a system call be used to manufacture functional metallic prototypesdirectly from CAD without part-specific tooling.
1 Background
1.1 Rapid Prototyping
The use of rapid proto yoing in a. concurrent engineering environment results in re-duced product development cycle time-a natural consequence of the quick availabilityof working testable hardware. A functional prototype allows the identification of de-sign deficiencies or areas for design improvement; it allows experimental stress analy-sis, vibrations testing, and other design performance tests with a very low lead-time.In some cases, experimental analysis of prototypes has proven to be less expensivethan computer-based analysis techniques such as finite element analysis [1]. A com-mon characteristic of rapid prototyping methods is that no part-specific tooling, suchas a mold or die, is required to make the part. Several reviews of rapid prototypingare available in the literature [2][3][4].
Use of rapid prototyping technology is expected to grow as more materials can beprocessed using the techniques. Many systems are commercially available; the mostpopular technique to date is stereolithography, which generates a. part from a bathof laser-cured photopolymer resin. Selective laser sintering, the topic of this paper, isgaining popularity; it generates a part from multiple layers of powder. Commercialsystems for SLS are currently limited to ABS plastic, wax, nylon and polycarbonatematerials.
51
To date, no commercial freeform fabrication system is available for metallic ma-terials. The preliminary results of an effort to address this issue are described in thispaper.
1.2 Selective Laser Sintering (SLS)
SLS generates a part by selectively bonding multiple layers of powder to build a three-dimensional part in a layer-by-layer manner. The process has been commerciallyapplied to ABS plastic, nylon, polycarbonate, and wax[5][61[71. The process is veryappealing for applications involving metals and ceramics. It is anticipated that SLS ofmetals will be less expensive and less time-consuming than conventioral productionmethods for metals, such as sand casting or investment casting, when the number ofparts required is reasonably small. Therefore, the system will be used by designersand engineers during the prototyping stages of product development. A completeSLS apparatus will allow designers to quickly generate three-dimensional functionalprototypes of various parts. The process is also attractive to builders of customtooling, dies and molds since these industries represent one-of-a-kind applications.
Though there are no commercial systems for applying this technique to metals,research is under way at the University of Texas at Austin.' One of their techniquesis to coat the metal particles with a binder; the binder is selectively cured with alaser, and the part is later fired to buru out the binder and densify the part. Partsof final densities of 48% [81 and higher have been reported. Other work is ongoingto directly sinter metals by using a liquid-phase metallic material to fill the voidsin a solid-phase powder, such as copper in nickel. Higher densities (82%) have beenreported using this technique [9].
The approach reported here differs in that the metal powder is sintered directly,without the introduction of a binder or a low-melting-temperature liquid phase. Atwo-step process is proposed: The laser will not be used to generate a fully-densefinal part; instead, the laser apparatus will be used to generate a "green" part thatrequires subsequent processing such as Hot Isostatic P'essing(HIPing), oven firing, orinfiltration. The goal of this effort is to assess the process by laser sintering a simplecubic sample of iron, performing a HIP densification treatment, and evaluating thedensity of the resulting material.
2 Experimental Apparatus
A laboratory scale system was constructed for evaluation of the SLS process. Thesystem is capable of making parts up to I in. by I in. by 3 in. using lase" ',eating.
'The SLS process is patented by the University of Texas in Austin and has been reduced topractice by DTM, a subsidiary of B.F. Goodrich.
52
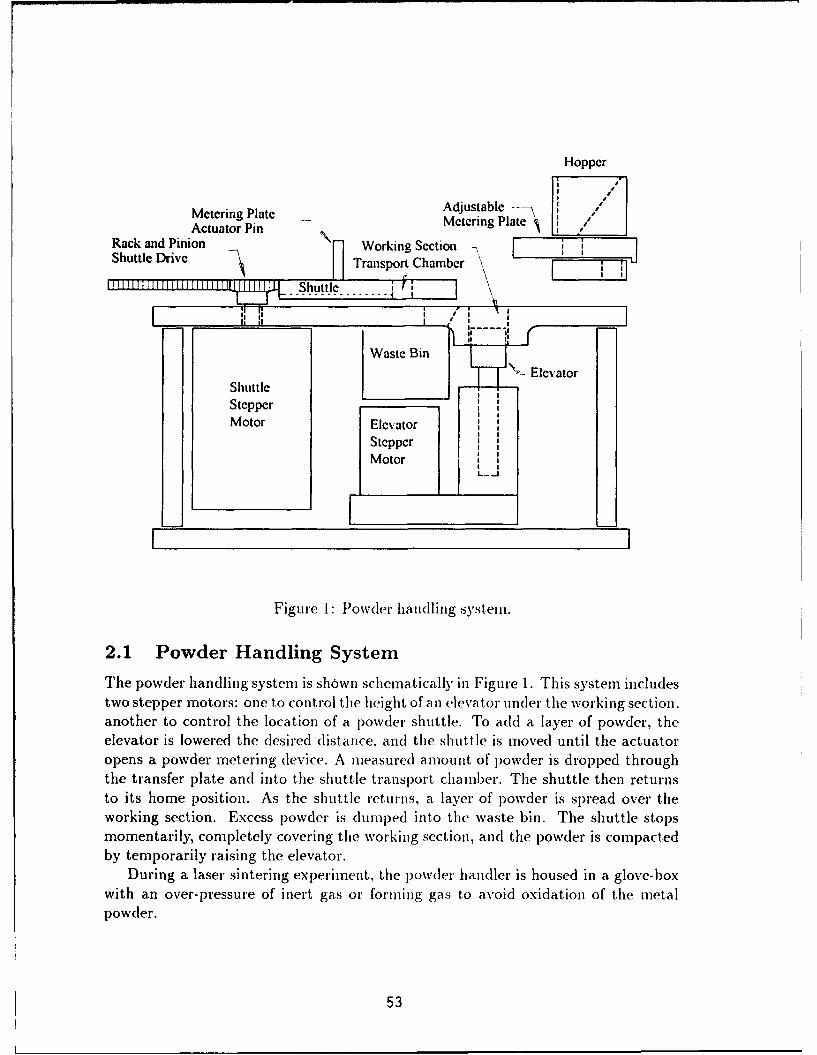
Hopper
Metering Plate McAdjustable --eActuator PinMetering Plate,
Actuator PinRack and Pinion - Working Section -Sh tteDrv Transport Chamber
Waste Bin
Shuttle Elevator
Stepper!Motor Elevator
Stepper
Motor
F _
Figure 1: Powder handling system.
2.1 Powder Handling System
The powder handling system is shown schematically in Figure 1. This system includestwo stepper motors: one to control the height of an elevator under the working section,another to control the location of a powder shuttle. To add a layer of powder, theelevator is lowered the desired distance, and the shuttle is moved until the actuatoropens a powder metering device. A measured amount of powder is dropped throughthe transfer plate and into the shuttle transport chamber. The shuttle then returnsto its home position. As the shuttle returns, a layer of powder is spread over theworking section. Excess powder is dumped into the waste bin. The shuttle stopsmomentarily, completely covering the working section, and the powder is compactedby temporarily raising the elevator.
During a laser sintering experiment, the p)owder handler is housed in a glove-boxwith an over-pressure of inert gas or forming gas to avoid oxidation of the metalpowder.
53
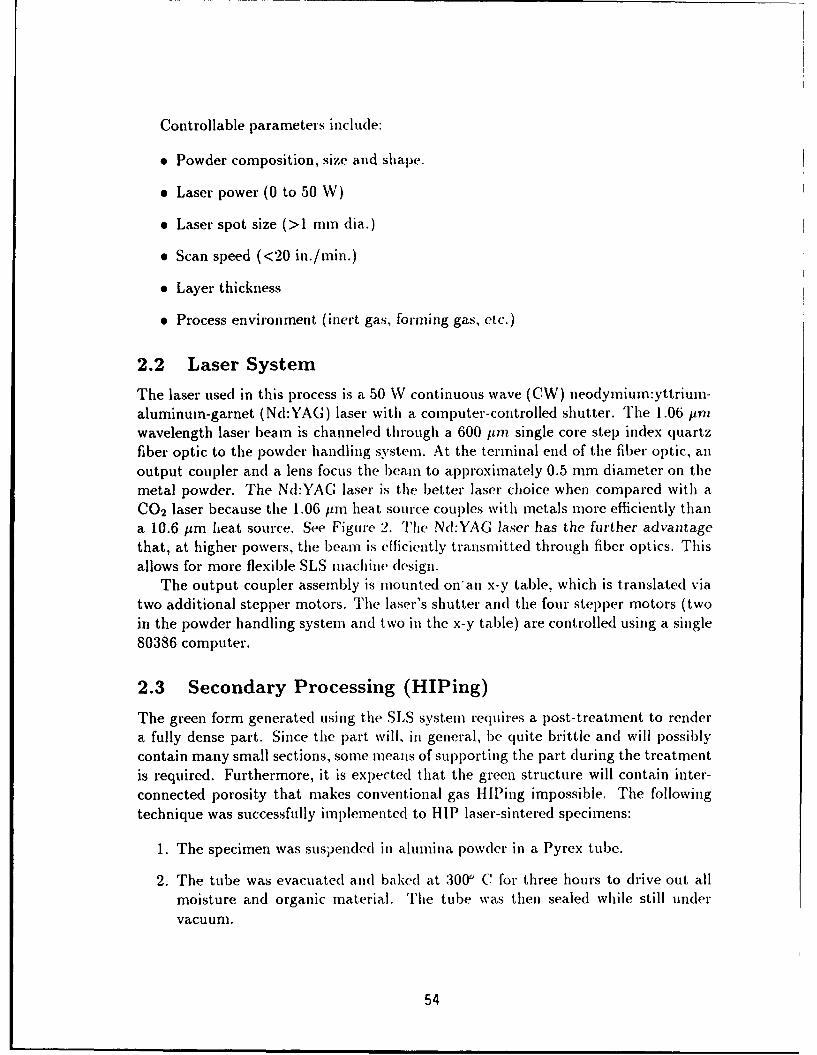
Controllable parameters include:
"* Powder composition, size and shape.
"* Laser power (0 to 50 W)
"* Laser spot size (>1 nmn dia.)
"* Scan speed (<20 in./inin.)
"* Layer thickness
"* Process environment (inert gas, forming gas, etc.)
2.2 Laser System
The laser used in this process is a 50 W continuous wave (CW) neodymium:yttrium-aluminum-garnet (Nd:YAG) laser with a computer-controlled shutter. The 1.06 pmwavelength laser beam is channeled through a 600 pam single core step index quartzfiber optic to the powder handling system. At the terminal end of the fiber optic, anoutput coupler and a lens focus the beam to approximately 0.5 mm diameter on themetal powder. The Nd:YAG laser is the better laser choice when compared with aC0 2 laser because the 1.06 pim heat source couples with metals more efficiently thana 10.6 ym heat source. See Figure 2. The Nd:YAG laser has the further advantagethat, at higher powers, the beam is efficiently transmitted through fiber optics. Thisallows for more flexible SLS machine design.
The output coupler assembly is mounted on'an x-y table, which is translated viatwo additional stepper motors. The laser's shutter and the four stepper motors (twoin the powder handling system and two in the x-y table) are controlled using a single80386 computer.
2.3 Secondary Processing (HIPing)
The green form generated using the SLS system requires a post-treatment to rendera fully dense part. Since the part will, in general, be quite brittle and will possiblycontain many small sections, some means of supporting the part during the treatmentis required. Furthermore, it is expected that the green structure will contain inter-connected porosity that makes conventional gas HIPing impossible. The followingtechnique was successfully implemented to HIP laser-sintered specimens:
1. The specimen was suspended in alumina powder in a Pyrex tube.
2. The tube was evacuated and baked at 3000 C for three hours to drive out allmoisture and organic material. The tube was then sealed while still undervacuum.
54
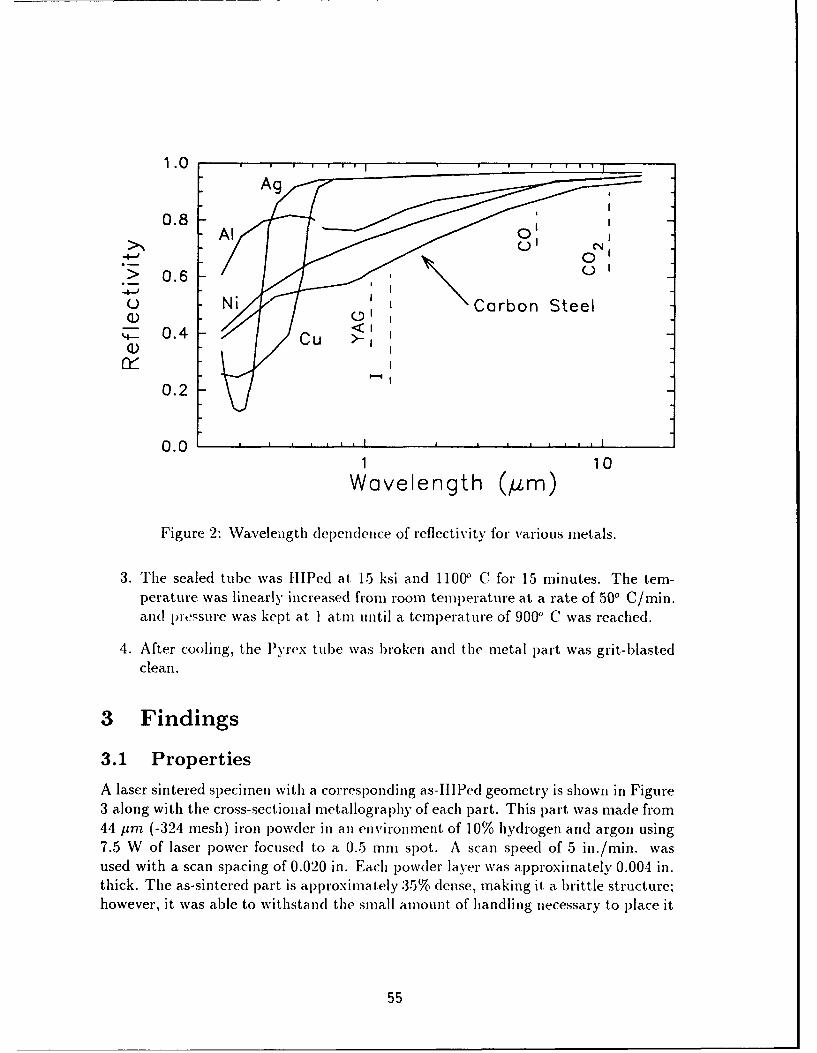
1.0 TTrTAg
0.8Al 0
>t 0.
Ni Carbon Steel
z~0.4<
0.2
0.0 , , , , I , , ,,, I1 10
Wavelength (Arm)
Figure 2: Wavelength dependence of reflectivity for various metals.
3. The sealed tube was HIPed at 15 ksi and 11000 C for 15 minutes. The tem-perature was linearly increased from room temperature at a rate of 50' C/min.and pressure was kept at I atm until a temperature of 9000 C was reached.
4. After cooling, the Pyrex tube was broken and the metal part was grit-blastedclean.
3 Findings
3.1 Properties
A laser sintered specimen with a corresponding as-HlPed geometry is shown in Figure3 along with the cross-sectional metallography of each part. This part was made from44 tim (-324 mesh) iron powder in an environment of 10% hydrogen and argon using7.5 W of laser power focused to a 0.5 mm spot. A scan speed of 5 in./min. wasused with a scan spacing of 0.020 in. Each powder layer was approximately 0.004 in.thick. The as-sintered part is approximately 35% dense, making it a brittle structure;however, it was able to withstand the small amount of handling necessary to place it
55
(a)
4b)
Figure 3: Selective laser-sintered iron sample (a) before and after HIP; (b) and (c)microstructure.
in a HIP vessel. The as-tlPed structure is very dense (> .99.9'X) as shown in Figure3c, with only a small number of remaining voids.
3.2 Environment
The most significant problem associa.led with SLS of iron encountered in this rc,, ,'cheffort is the control of the sintering environment and the formation of oxide. 1,. hisreason, the powder handling system was placed inside a glovebox and an overpressureof inert or forming gas was applied inside the box. Additionally, the powder was "pre-cleaned" by placing it in a fluidized bed charged with the same inert or forming gas.
56
3.2.1 Inert Environment
When using -325 mesh iron powder, it was founld that a good single layer could begenerated in all inert environment of argon. Untfort unately, the bond bwctwn tihelayers was generally inadequat( for the following reasons:
"* The free energy of formation for oxide increases with decreasing temperature[10]. Thus, in cooling to room temperature from a high homologous tempera-ture, a period of high oxidation growth can be e'xpected. This oxide is partic-ularly undesirable in the SLS process because it prevents effective sintering orwetting.
" During the sintering of each layer, the temperature of the powder was broughtto a value above the melting temperature of the metal. Each laser scan wasperformed relatively quickly. This. adjacent scans occurred before the materialcooled and simultaneously oxidized. For this reason, the bonds within the layers(between scans) were acceptable.
" Between layers, the material was allowed to return to room temperature. Thus,each layer ran through a temperature cycle that is very conducive to oxideformation as discussed above. (Oxide was observed in SEN! EDAX probing.)Though the atmosphere was free of oxide, enough residual oxygen was presentin the powder to form aln oxide layer on the upper surface and prevent goodbonds between the layers.
3.2.2 Reducing Atmosphere
A common reducing atmosphere for ferrous materials is an mixture of hydrogen andnitrogen; this mixture is often called "forming gas." Laser sintering in this atmosphereproved to be unsatisfactory because of the for'mation of nitrides between each layer,preventing inter-layer bonds. (Nitriding is a common surface hardening technique forsteels.)
When the same iron material was sintered in a reducing atmosphere of 10% hydro-gen and argon, excellent bonds between the la' vers were achieved. It should be notedthat all other process p)arameters (laser power density. scan spacing, layer thickness,etc.) were kept constant between the tests iin argon, nitrogen and hydrogen, and thosein argon and hydrogen.
3.3 Post-Treatments
From the materials standpoint,, HIPing proved to be satisfactory for these preliminarytests-it achieved a dense sample with a predicted reduction in the (limnensions of thespecimen. From the standpoint of FIF, IllPing is not attractive without a modelthat gives a "process compensated" geometry for the sintering op)eration. A model of
57
the HIPing process is required to defiine anl -as-sintered' l)art ge-Omletr\. ThI's mnodel inot straighit-forward because(, for exampille. holes and cavilties whuich are templorarilyfilled with alumina powder will deinsify at a (hilferenti rate during II IPing than thleadjacent mnetal.
3.4 Warping
Because thle heat is applied at the to1) surface, the to)) densities to a greater extentthan does the bottomn surface of each layer. Additionally, the upper surface cools froma higher temperature thani material b~elow, causing More thermial contraction onl theupper surface. for these reasons, each layer of sintered p)ow~der tend~s to warp up)ward,which is undesirable troin a jpowdler-hand~ling sta~iilpoint, because the thickness of eachlayer is not uiniformi. The Solution adopted for this work was to build anl 'anchior" ofthin sinteredl layers onto whli' h! the actual striict tire was couust ructedl. This thin framlegives somne stiffness to the overall structure and~ avoilds warping Ilinmanly situations.
Various other tech nicJ1ueS aMe possi ble:
"* Heating the powder bed. This method has been imp~lemnented [11] for lasersintering of mnetals with good success; it reduces the thermial strain by) reducingthe teinperatutre excursion. This method has the add~edl benefit that it helpsprevent oxide b~uild-1up betw~~eenu layers.
"* "Knitting" thle structure inl such a way that thle loose powder is allowedi to flowto fill the gaps left, by the (lensi tied mnaterial.
"* Bonding the prototype to a rigidl sampuIle of thle samne mat erial during the firststages of the sintering p~roce~ss, effVctively building anl anchor. This may beacceptable for somec applications where the anichor canl becomne anl integral partof the laser-sinterecl structure.
4 Conclusions
The proof-of-concept. goal that, stimulated this work effort was successfully achieved.Binclerless iron p~owd'er wvas sintered iiit~o at cub~ic shape of 35(X dlensity in a r'educingatmosphere using a. directedl laser b~eamI. The cube was later I-Ill~ed to full dentsity witha predicted reductioni in overall chinuensions. It was dhenmonstratedh that the control ofthe sintering environment is crit~ica~l for successful laser sintering. In this p~articularcase, anl environmnent, of 10%, hydrogeni andI argon vieldech the best inter-layer bonds.
5 Acknowledgments
The work and advice of several p~eop~le is acknowledged: Leon Behla., Jerry H-arrison.Jim Resue, Steve Rut kowski. Pauil Sicumers. Cosinio Montanaro, and Mark Brun.
58
References
[1] G.W. Royal, " Application of Stereolithography to Gas Turbine Design," Pro-ceedings of the National (Conferenct on Rapid Prototyping, June, 1990.
[2] S. Ashley, "Rapid Prototyping Systems." hcehanical Engincering, April 1991.pp. 36-43.
[3] B.A. Beckert, "Cutti., it iii Rapid Prototyping," C'omputer-Aided Engine ring,Sept. 1991, pp. 28-40.
[4] J.P. Kruth, "Material Incress Mauflacturillg by Rapid Prototyping Techniques,"Annals of the CIRP, 40-2, 1991, pp. 603-614.
[5] H.L. Marcus, et al., "Solid Freeform Fabrication: Powder Processing," CeramicsBulletin, 69-6, 1990, pp. 1030-1031.
[6] 1I.L. Marcus, et al., "From Computer to (Comlponent in 15 Minutes: The In-tegrated Manufacture of Three-Dimensional Objects," Journal of Metals, April1990. pp. 8-10.
[7] K. Nutt, "The Selective Laser Sintering Process," Photonics Spectra, Sept. 1991,pp. 102-104.
[8] B. Badrinarayan and ,J.W. Barlow, "Metal Parts from Selective Laser Sintering ofMetal-Polymer Powders." Solid 1"rfeform Fabrication Symposium, Austin, 1992,pp. 141-116.
[9] G. Zong, et. al., "Direct, Selective Laser Sinterinmg of High Teml)erature Materi-als," Solid Freeform Fabrication Symposium, Austin, 1992, pp. 72-85
[10] F.V. Lenel, Powder Mctallurgy: Principlhi and Applications, Metal Powder In-dustries Federation, Princeton, New Jersey, 1980.
[11] J. McWilliams, C. Hysinger, J.J. Beaman, "Design of a High Temperature Pro-cess Chamber for the Selective Laser Sintering Process," Solid Freeform Fabri-cation Symposium, Austin, 1992, pp. 110-117.
59
SOLID FREEBODY FORMING OF CERAMICSFROM POLYMERIZABLE SLURRY
Kevin Stuffle, Anthony Mulligan, Paul Calvert* and John Lombardi*ACR, Tucson, Arizona; *Arizona Materials Laboratories, Tucson Arizona.
INTRODUCTION
In solid free body forming a component is described by a CAD system as a seriesof slices. The slices are deposited as a sequence of layers which are cured or solidifiedby a moving head such that a three dimensional part is built up. Systems have beendeveloped based on photocurable polymers, solidifying polymer melts, laser fusedpowder layers, polymer-bound powders and others.
Difficulties with such systems to date include the low strength of many of thepolymer systems and poor resolution. The polymeric components can be used as formsto make molds for later casting of metals or ceramics. The powder components can besintered to higher density.
In the system described here, the part is built up by deposition of a slurry ofceramic powder in liquid acrylic monomer. As each layer is deposited the monomer isheat-cured. When the whole component is formed, the polymer is burnt-out and theceramic is sintered.
DELIVERY SYSTEM
The slurry was contained in a 50 ml polypropylene syringe which was connectedto an argon pressure line to drive the liquid through a needle of 0.3-1.3 mm diameter.The delivery was started and stopped by a shut-off valve with pressure venting in theair line.
SLURRY
Slurries of Alumina (A120 3-0.5 wt% MgO, Ceralox Corp.) in liquid acrylicmonomers were prepared. The formulations, based on the work of Janney [1], areshown in Table 1. Similar monomer systems have been used for tape casting of ceramicsheets by various workers [2]. Alumina solids loadings up to 53 vol% were used. Theacrylate monomers have the advantage of curing very rapidly. Since they arepolyfunctional, high degrees of polymerization are not necessary to achieve highmolecular weight or gelation. The polymerization rate and brittleness of the resin wascontrolled by addition of dibasic esters, a mixture of primarily dimethyl glutarate andsuccinate. Viscosity increases with solids loading as shown in Figure 1. Figure 2 shows
60
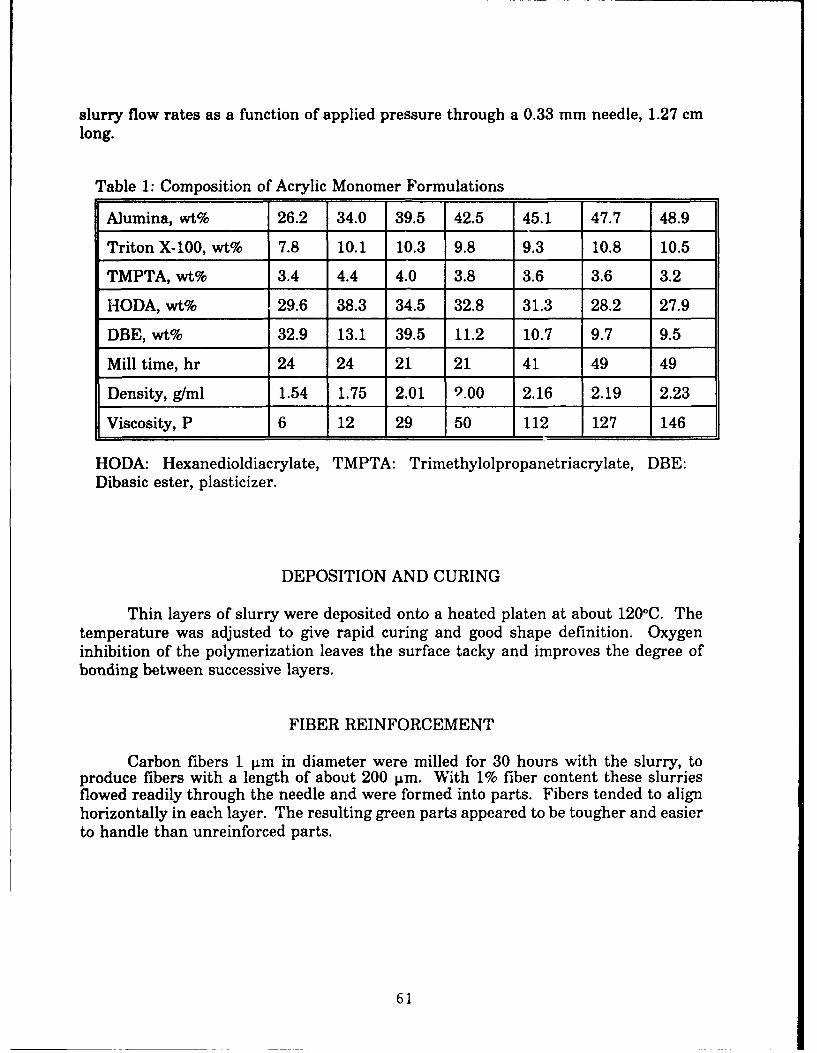
slurry flow rates as a function of applied pressure through a 0.33 mm needle, 1.27 cmlong.
Table 1: Composition of Acrylic Monomer Formulations
Alumina, wt% 26.2 34.0 39.5 42.5 45.1 47.7 48.9
Triton X-100, wt% 7.8 10.1 10.3 9.8 9.3 10.8 10.5
TMPTA, wt% 3.4 4.4 4.0 3.8 3.6 3.6 3.2
HODA, wt% 29.6 38.3 34.5 32.8 31.3 28.2 27.9
DBE, wt% 32.9 13.1 39.5 11.2 10.7 9.7 9.5
Mill time, hr 24 24 21 21 41 49 49
Density, g/ml 1.54 1.75 2.01 9.00 2.16 2.19 2.23
Viscosity, P 6 12 29 50 112 127 146
HODA: Hexanedioldiacrylate, TMPTA: Trimethylolpropanetriacrylate, DBE:Dibasic ester, plasticizer.
DEPOSITION AND CURING
Thin layers of slurry were deposited onto a heated platen at about 1200C. Thetemperature was adjusted to give rapid curing and good shape definition. Oxygeninhibition of the polymerization leaves the surface tacky and improves the degree ofbonding between successive layers.
FIBER REINFORCEMENT
Carbon fibers 1 pm in diameter were milled for 30 hours with the slurry, toproduce fibers with a length of about 200 pm. With 1% fiber content these slurriesflowed readily through the needle and were formed into parts. Fibers tended to alignhorizontally in each layer. The resulting green parts appeared to be tougher and easierto handle than unreinforced parts.
61
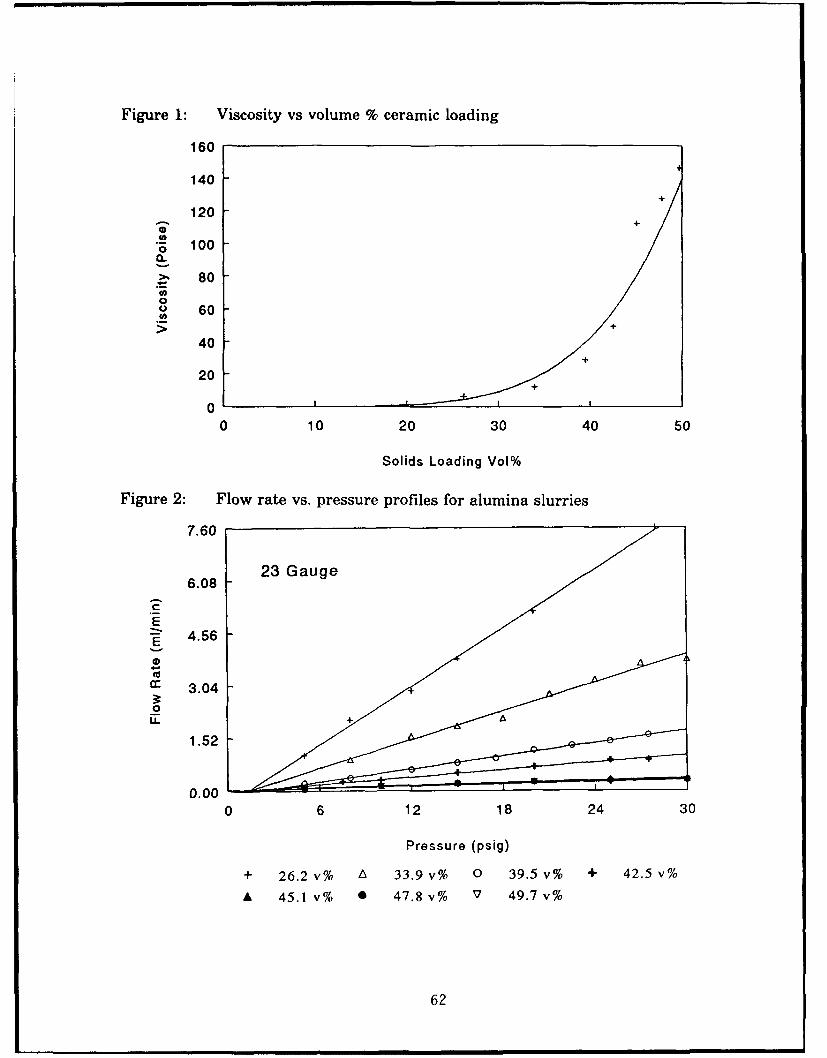
Figure 1: Viscosity vs volume % ceramic loading
1604
140
120
"z 100CL
>- 8000 60
4 6
20
0 +
010 20 30 40 s
Solids Loading Vol%
Figure 2: Flow rate vs. pressure profiles for alumina slurries
7.60
23 Gauge6.08
C
E= 4.56E
cc 3.04
0
1.52 -
0.000 6 12 18 24 30
Pressure (psig)
+ 26.2 v% A 33.9 v% 0 39.5 v% + 42.5 v%
* 45.1 v% 0 47.8 v% V 49.7 v%
62
PART PRODUCTION
Flat plates and thin walled cylinders were produced in monolithic alumina usingsimple machine instructions to a head mounted on an X-Y table. A nozzle of 0.33 mmwas used with a slurry pump pressure of 22 psig and a nozzle linear speed of 100cm/min.
PART PROPERTIES
Green parts had a density of about 60% of theoretical, based on pure alumina.After firing densities range from 3.64 to 3.94 (90-99% of theoretical). Flexural moduluswas measured to be 358 GPa and strengths ranged from 431-606 MPa for 12 samplesin three point bend for a sample 2"xl.5"x0.2". This compares favorably with commercialalumina.
REFERENCES
1. M.A.Janney, "Method for molding ceramic powders" U.S. Patent 4,894,194; Jan16 1990.
2. R.R.Landham, P.Nahass, D.K.Leung, M.Ungereit, W.E.Rhine, H.K.Bowen andP.D.Calvert, "Potential use of polymerizable solvents for tape casting ceramics",Amer. Ceram.Soc. Bull. (1987) 66, 1513.
63
DEVELOPMENT OF NANOCOMPOSITES FORSOLID FREEFORM FABRICATION
A. Manthiram, F. Chi, L. F. Johnson, B. R. Birmingham and H. L. MarcusCenter for Materials Science and Engineering, ETC 9.104
The University of Texas at AustinAustin, TX 78712
ABSTRACT
Nanocomposites in which the constituents are mixed on a nanometer scale canprovide important advantages in the Selective Laser Sintering (SLS) and Selective LaserReactive Sintering (SLRS) processes. The larger surface area and grain boundaries in thenanocomposites compared to that in the conventional microcomposites are expected toenhance the solid state diffusion during laser irradiation as well as during any othersubsequent processes. Our strategy is to design and develop nanocomposites in which onenanosize component has a lower melting point than the other nanosize component, either ofwhich can serve as the matrix phase. The nanoscale dispersion of the low meltingcomponent can aid the sintering process during SLS or SLRS. Nanocomposite powders ofA120 3 -CoOx, A120 3-NiO, A120 3 -Co and A1203-Ni have been synthesized by sol-gelprocessing and are evaluated by SLS.
INTRODUCTION
Nanostructured materials are characterized by ultrasmall building blocks whosesizes are of the order of 1-100 nanometers. These materials offer potentially useful andunusual combinations of mechanical, electrical, magnetic and optical properties that areotherwise unachievable in conventional materials [1]. The properties are controlled by acomplex interplay among the building blocks and the interfaces between them that aredetermined primarily by the synthesis and processing conditions. Nanostructured materialspromise to advance a range of technologies and there is intensive worldwide activity onthese materials both from scientific and technological points of view.
While the terms "nanocrystalline" and "nanophase" materials refer generally tosingle phase solids of nanometer size, the term "nanocomposite" refers to multiphase solidsof nanometer size [2]. The solid phases in a nanocomposite could be of different nature.They could be metals, inorganic ceramics or polymers or combinations thereof but allmixed on a truly nanometer scale. The phases could be amorphous, semicrystalline orcrystalline.
Nanocomposites exhibit ultraheterogeneity or nanoheterogeneity, which offerseveral processing advantages. Because the different phases are mixed on a nanoscale, thediffusion length for solid-solid reaction is much smaller than that in conventional materials.The larger surface and grain boundary energies associated with nanocomposites provide thedriving force for enhanced reactions. These factors reduce the reaction temperature as wellas time. Nanocomposites have been shown to sinter close to theoretical densities in severalsystems such as A120 3-SiO 2, A120 3-TiO 2, SiO2-MgO, etc. [3]. Nanocomposite gels storemuch higher metastable energy than homogeneous gels, and this extra energy enhances
64
densification. In addition, nanocomposites seem to undergo crystallization anddensification simultaneously unlike homogeneous gels. Homogeneous gels, due to theiratomic scale mixing, often undergo crystallization before densification occurs which eitherleads to lower densities or necessitates higher temperatures for sintering. It is clear thatnanocomposites have the potential to offer lower processing temperatures and flaw-freeparts with higher densities.
Our objective is to design and develop nanocomposites that can optimize SelectiveLaser Sintering (SLS) and selective Laser Reactive sintering (SLRS). Nanocomposites canbe synthesized by sol-gel processing or other "soft chemistry" techniques. Although bothsol-gel processing and solid freeform fabrication are well known, the idea of utilizing sol-gel derived nanocomposite powders that are specifically designed and synthesized tooptimize SLS or SLRS have not been exploited. Our strategy is to select ceramic-ceramicor ceramic-metal nanocomposite systems in such a way that one nanosize component has alower melting temperature than the other nanophase component, either of which can serveas the matrix phase. The objective is to achieve sintering aid from the low melting phaseduring SFF processing. Because the low melting component is dispersed on a nanoscale inthe matrix phase, it is expected to aid the sintering process, during SFF or any othersecondary processing, in a much better way than the mechanically mixed microcompositepowders. By proper selection of composite systems and control of agglomeration duringsol-gel processing, the ability to achieve full density SFF parts can be enhanced. Wepresent in this paper our preliminary results with AI20 3 -CoOx, A12 0 3-NiO, A1203-Co andA120 3-Ni nanocomposites. CoO, NiO, Co and Ni have melting points of respectively,1795, 1984, 1495 and 1455 oC, which are lower than that of A120 3 (2050 oC).
EXPERIMENTAL
The ceramic-ceramic nanocomposite powders of A1203-CoOx, and A120 3-NiOwere synthesized by a sol-gel method [4]. The steps involved in the synthesis of A120 3-CoOx are summarized in Fig. 1. To an aqueous solution of Co(N03)2. 6H 20 maintainedat about 80 OC, required amount of a solution of aluminum tri-sec-butoxide in iso-propylalcohol was added under constant stirring. Aluminum-tri-sec-butoxide hydrolyzes duringthis process to give large suspended particles of AI(OH) 3 , which was then dissolved byadding nitric acid to obtain a homogeneous sol of A13+ and Co2+. The sol was heatedgently on a hot plate to form a gel, which was then dried rapidly on the hot plate. The drygel was then heated in a muffle furnace to decompose the nitrate and hydroxide, whichresulted in a mixture of A120 3-Co 30 4. A similar procedure was adopted to obtain A120 3-NiO also. The A120 3-Co 304, and A12 0 3 -NiO powders were also fired at differenttemperatures ranging from 300-1250 °C to evaluate the reaction process. The ceramic-ceramic nanocomposites so obtained were reduced in a stream of hydrogen at 400-1100 oCto obtain the ceramic-metal nanocomposites A120 3-Co, and A120 3-Ni.
The composite powders were characterized by x-ray diffraction, electronmicroscopy and density measurements. Since the large surface area associated with thenanosize powders lead to an adsorption of water, CO 2 etc. on the surface, the powderswere baked at about 200 °C for about 24 h before scanning with the laser beam. Singlelayer tests were performed with various power levels and scan speeds. The specimensobtained were characterized by x-ray diffraction and microscopy.
65
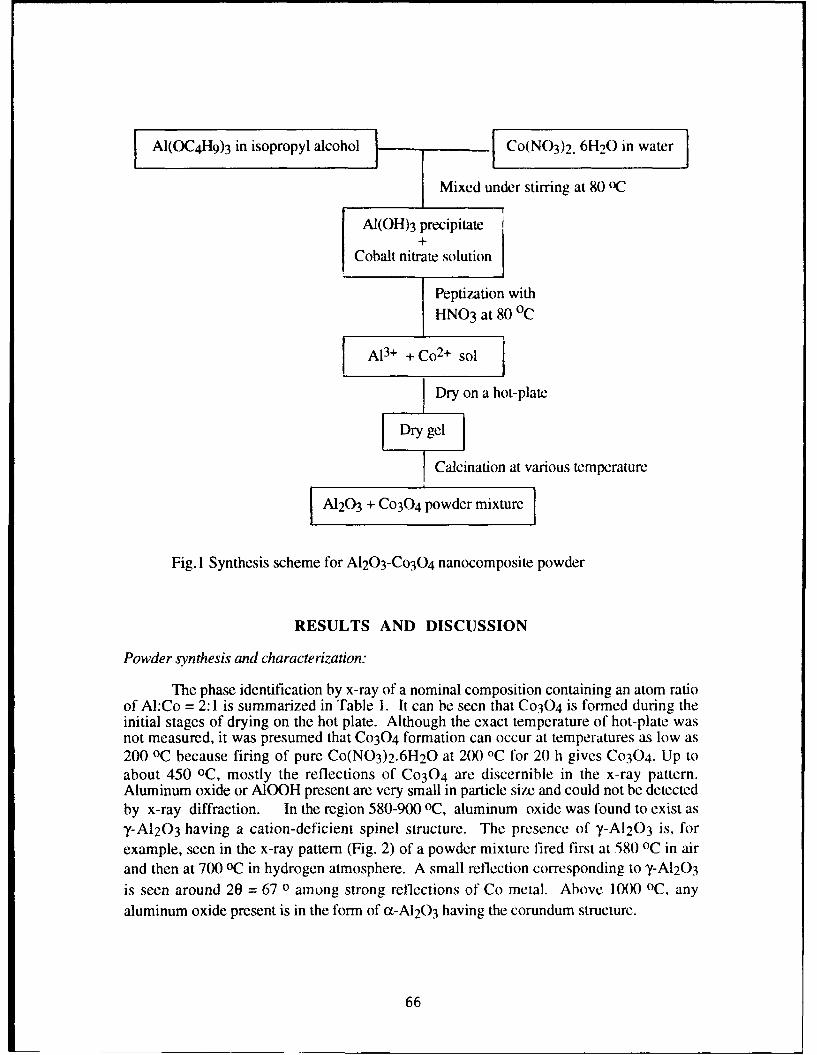
AI(OC 4H9 )3 in isopropyl alcohol Co(NO3)2 . 6H 20 in water
Mixed under stirring at 80 °C
AI(OH)3 precipitate+
Cobalt nitrate solution
Peptization withHNO3 at 80 °C
A13+ + Co2+ sol I
Dry on a hot-plate
Dry gel
I Calcination at various temperature
A120 3 + Co30 4 powder mixture
Fig. 1 Synthesis scheme for A1203-Co 30 4 nanocomposite powder
RESULTS AND DISCUSSION
Powder synthesis and characterization:
The phase identification by x-ray of a nominal composition containing an atom ratioof AI:Co = 2:1 is summarized in Table 1. It can be seen that Co304 is formed during theinitial stages of drying on the hot plate. Although the exact temperature of hot-plate wasnot measured, it was presumed that C0304 formation can occur at temperatures as low as200 OC because firing of pure Co(N03)2.6H 20 at 200 OC for 20 h gives C0304. Up toabout 450 OC, mostly the reflections of Co304 are discernible in the x-ray pattern.Aluminum oxide or A1OOH present are very small in particle size and could not be detectedby x-ray diffraction. In the region 580-900 oC, aluminum oxide was found to exist asy-A120 3 having a cation-deficient spinel structure. The presence of 'y-A1203 is, forexample, seen in the x-ray pattern (Fig. 2) of a powder mixture fired first at 580 0 C in airand then at 700 OC in hydrogen atmosphere. A small reflection corresponding to '-A120 3
is seen around 20 = 67 0 among strong reflections of Co metal. Above 1000 oC, any
aluminum oxide present is in the form of a-A120 3 having the corundum structure.
66
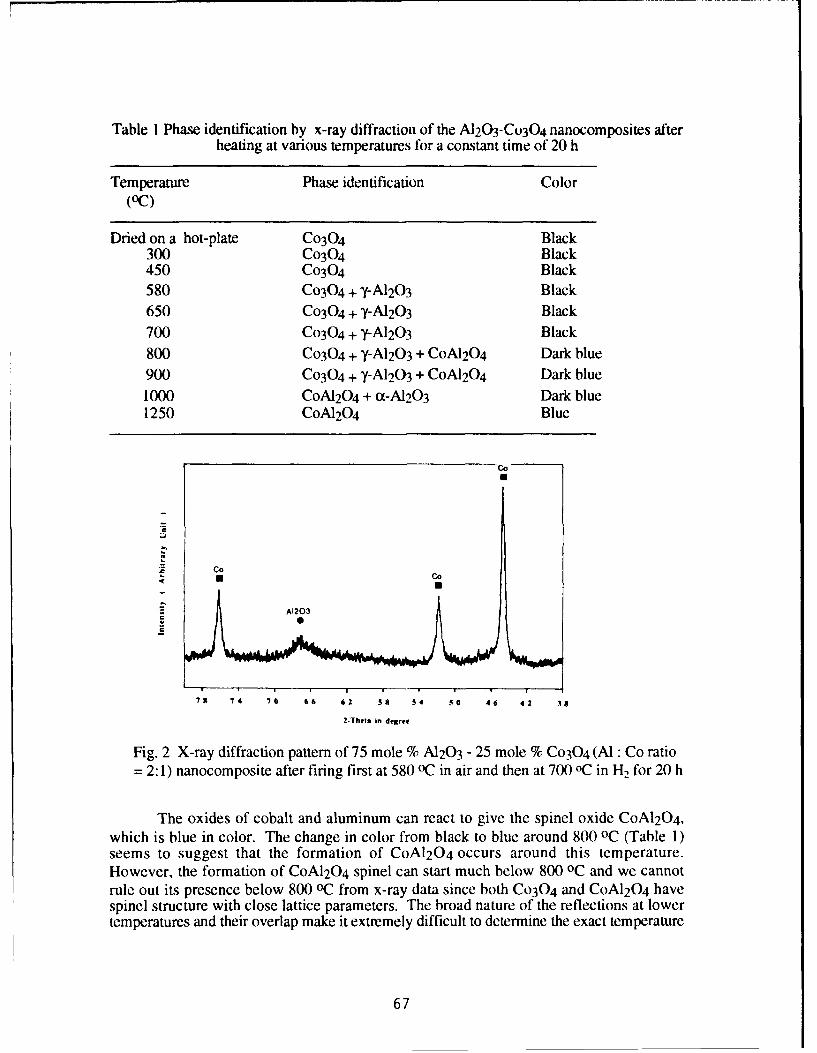
Table 1 Phase identification by x-ray diffraction of the A120 3-Co30 4 nanocomposites afterheating at various temperatures for a constant time of 20 h
Temperature Phase identification Color(oC)
Dried on a hot-plate Co30 4 Black300 Co30 4 Black450 Co30 4 Black580 Co304 + y-A1203 Black650 Co30 4 + Y-A1203 Black700 Co30 4 + y-A1203 Black800 Co304 + y-A1203 + CoA120 4 Dark blue900 Co30 4 + •y-A1 20 3 + CoA120 4 Dark blue1000 CoA1204 + a-A1203 Dark blue1250 CoA120 4 Blue
CoZ
kGO
• • A1203
7S 74 70 66 62 55 54 50 46 42 38
2-Theta in degr"
Fig. 2 X-ray diffraction pattern of 75 mole % A120 3 - 25 mole % Co304 (Al : Co ratio= 2:1) nanocomposite after firing first at 580 °C in air and then at 700 oC in H2 for 20 h
The oxides of cobalt and aluminum can react to give the spinel oxide CoA1204,which is blue in color. The change in color from black to blue around 800 °C (Table 1)seems to suggest that the formation of CoA1204 occurs around this temperature.However, the formation of CoA120 4 spinel can start much below 800 oC and we cannotrule out its presence below 800 oC from x-ray data since both Co30 4 and CoA1204 havespinel structure with close lattice parameters. The broad nature of the reflections at lowertemperatures and their overlap make it extremely difficult to determine the exact temperature
67
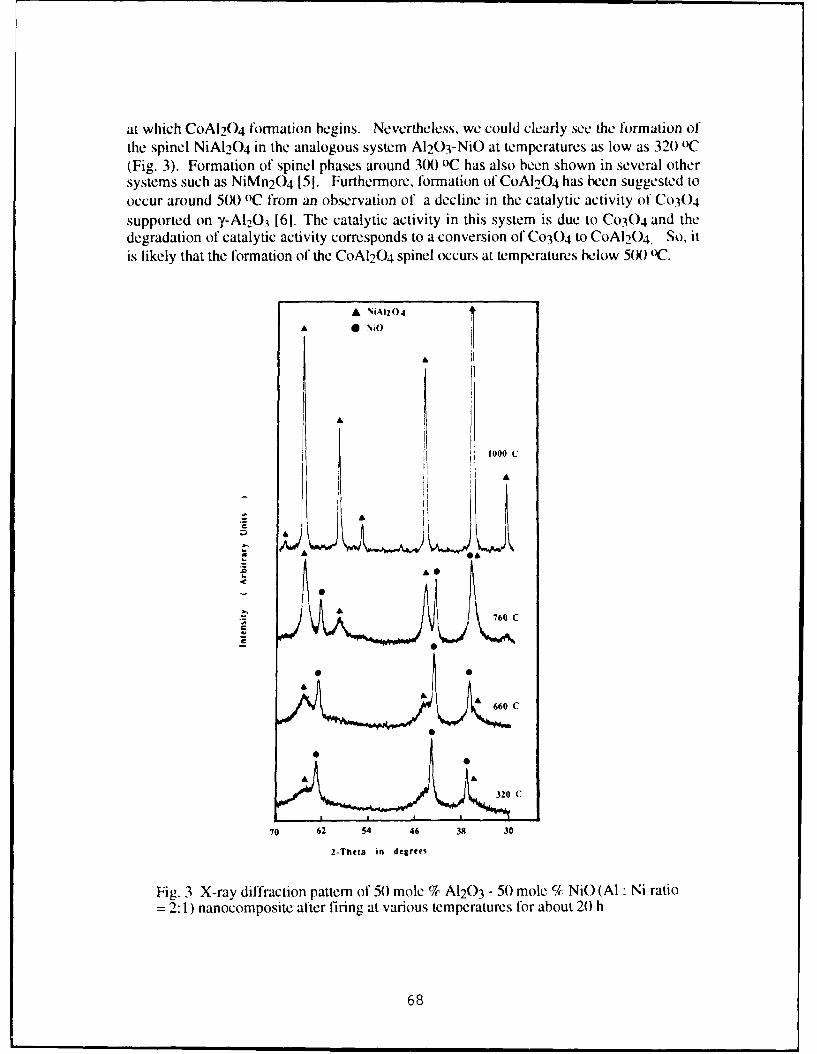
at which CoA1204 formation begins. Nevertheless, we could clearly see the formation ofthe spinel NiAI204 in the analogous system A1203-NiO at temperatures as low as 320 OC(Fig. 3). Formation of spinel phases around 3WX OC has also been shown in several othersystems such as NiMn 20 4 [51. Furthermore, formation of CoAI20 4 has been suggested tooccur around 5(M °C from an observation of a decline in the catalytic activity of Co304supported on y-A120 3 161. The catalytic activity in this system is due to Co304 and thedegradation of catalytic activity corresponds to a conversion of Co30 4 to CoA1204. So, itis likely that the formation of the CoA120 4 spinel occurs at temperatures below 5(M) (1.
A SiiAI204
IA!
Ni
100
AA
320 C
70 62 54 46 38 30
2-Theta in degrees
Fig. 3 X-ray diffraction pattern of 50 mole % A1203 - 50 mole 7c NiO (Al Ni ratio= 2:1) nanocomposite after firing at various temperatures for about 20 h
68
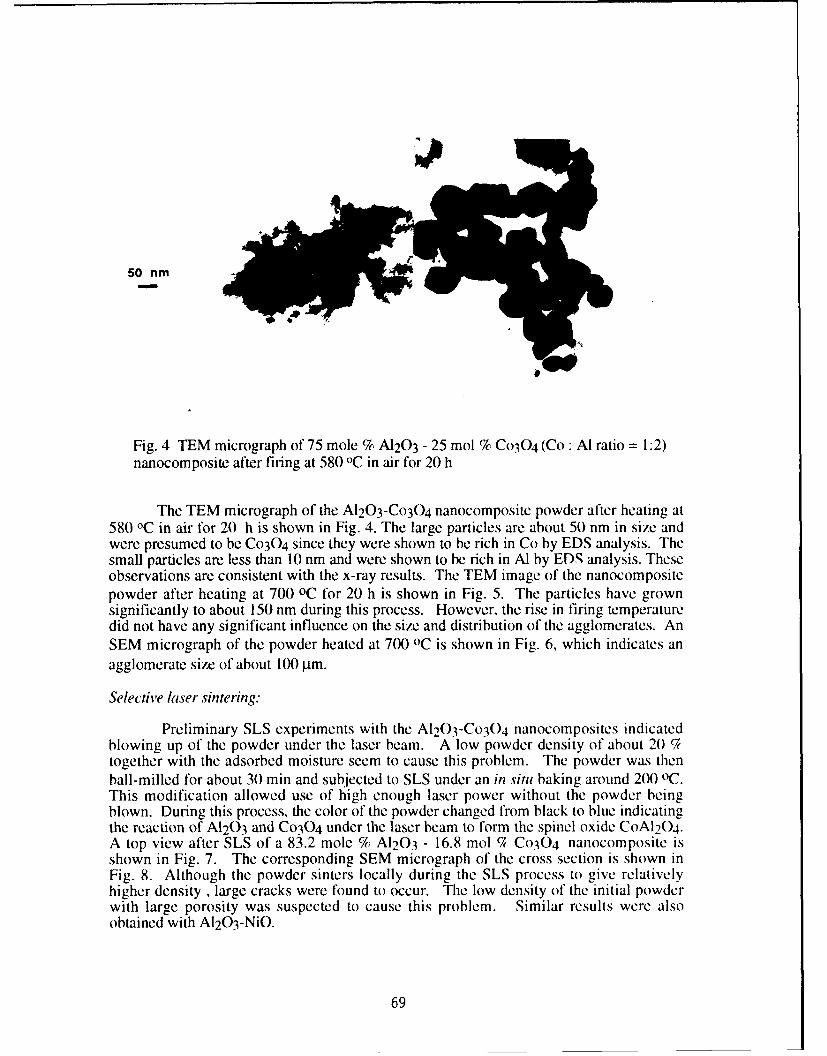
50 nm
Fig. 4 TEM micrograph of 75 mole % A120 3 - 25 mol % Co304 (Co: Al ratio = 1:2)nanocomposite after firing at 580 °C in air for 20 h
The TEM micrograph of the A1203-Co30 4 nanocomposite powder after heating at580 OC in air for 20 h is shown in Fig. 4. The large particles are about 50 nm in size andwere presumed to be Co304 since they were shown to be rich in Co by EDS analysis. Thesmall particles are less than 10 nm and were shown to be rich in Al by EDS analysis. Theseobservations are consistent with the x-ray results. The TEM image of the nanocompositepowder after heating at 700 OC for 20 h is shown in Fig. 5. The particles have grownsignificantly to about 150 nm during this process. However, the rise in firing temperaturedid not have any significant influence on the size and distribution of the agglomerates. AnSEM micrograph of the powder heated at 7(X) OC is shown in Fig. 6, which indicates anagglomerate size of about 100 pm.
Selective laser sintering:
Preliminary SLS experiments with the A120 3-Co 30 4 nanocomposites indicatedblowing up of the powder under the laser beam. A low powder density of about 20 7together with the adsorbed moisture seem to cause this problem. The powder was thenball-milled for about 30 min and subjected to SLS under an in situ baking around 200 oC.This modification allowed use of high enough laser power without the powder beingblown. During this process, the color of the powder changed from black to blue indicatingthe reaction of A1203 and Co304 under the laser beam to form the spinel oxide COA1204.A top view after SLS of a 83.2 mole % A120 3 - 16.8 mol 7V Co304 nanocomposite isshown in Fig. 7. The corresponding SEM micrograph of the cross section is shown inFig. 8. Although the powder sinters locally during the SLS process to give relativelyhigher density , large cracks were found to occur. The low density of the initial powderwith large porosity was suspected to cause this problem. Similar results were alsoobtained with A1203-NiO.
69
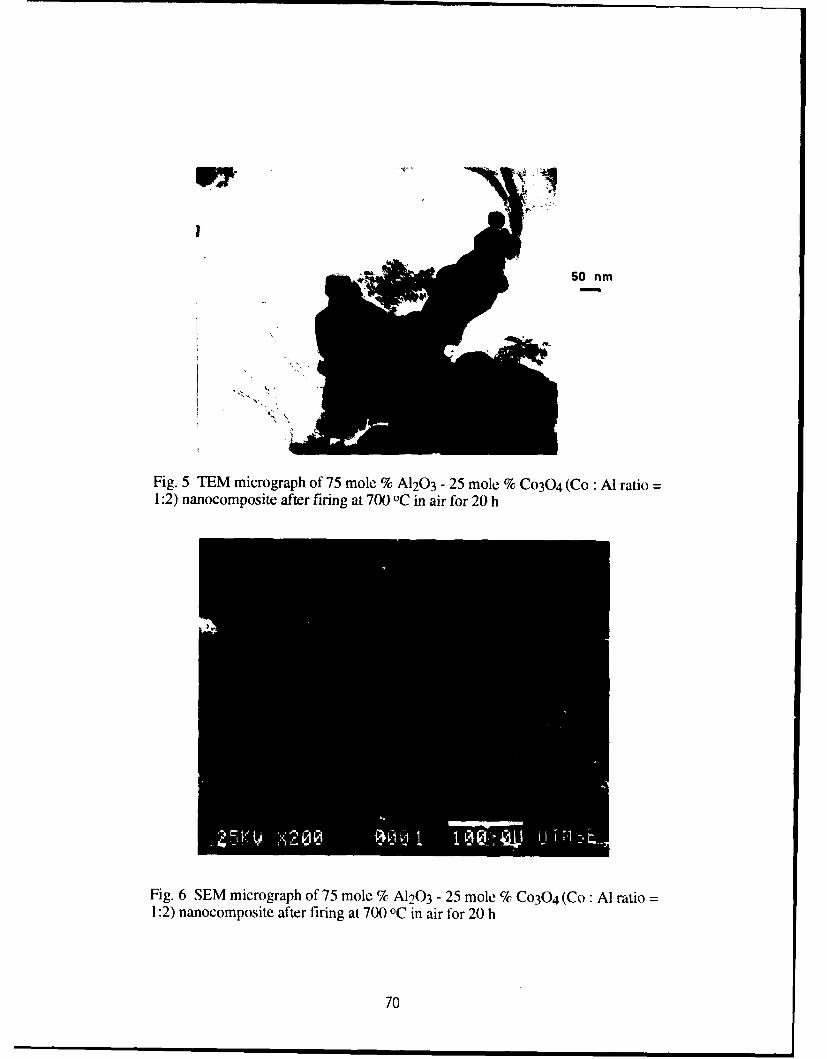
50 nm
Fig. 5 TEM micrograph of 75 mole % A120 3 - 25 mole % Co304 (Co • Al ratio =1:2) nanocomposite after firing at 700 OC in air for 20 h
Fig. 6 SEM micrograph of 75 mole % A120 3 - 25 mole % Co304 (Co: Al ratio =1:2) nanocomposite after firing at 700 oC in air for 20 h
70
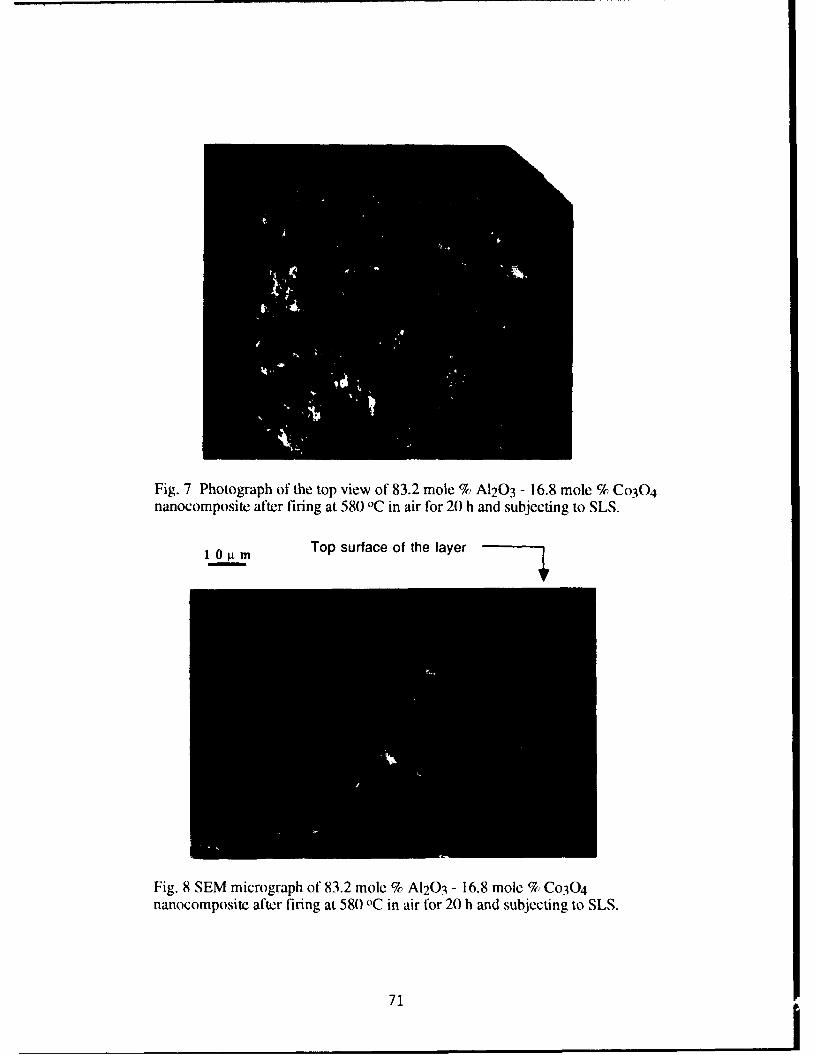
Fig. 7 Photograph of the top view of 83.2 mole % A120 3 - 16.8 mole % Co304nanocomposite after firing at 580 OC in air for 20 h and subjecting to SLS.
1 U g._ _m MTop surface of the layer
Fig. 8 SEM micrograph of 83.2 mole % A1203 - 16.8 mole % Co304nanocomposite after firing at 580 OC in air for 20 h and subjecting to SLS.
71
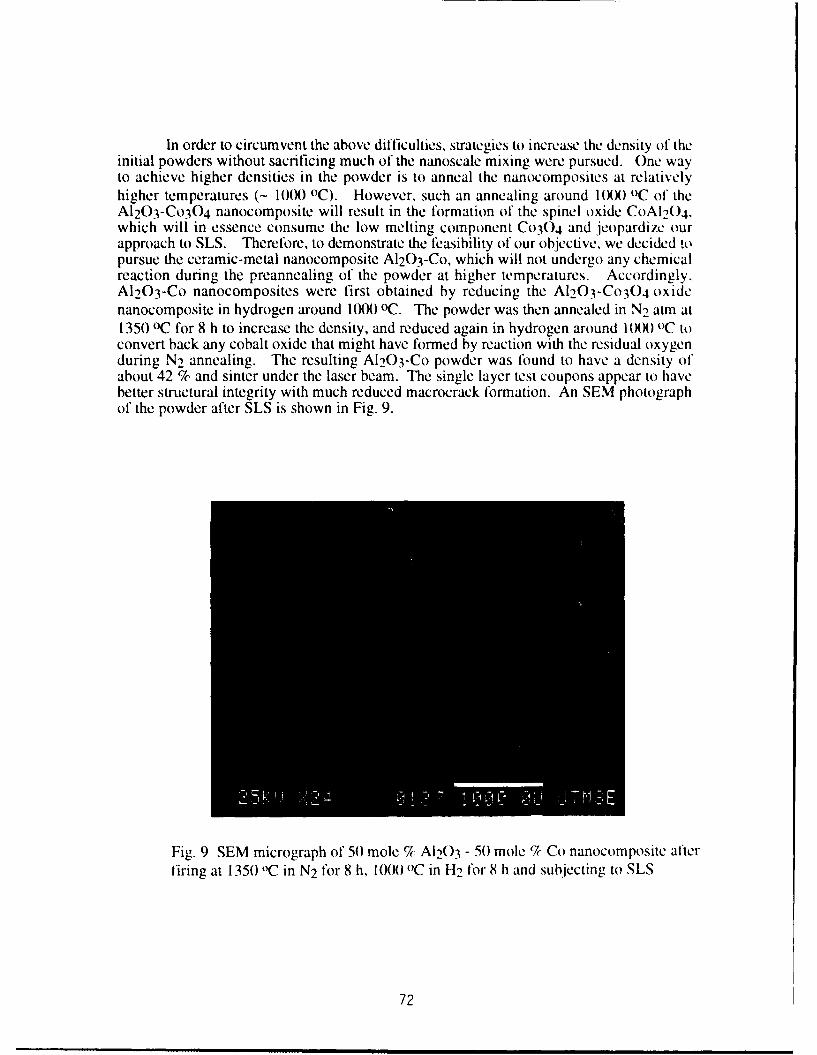
In order to circumvent the above difficulties, strategies to increase the density of theinitial powders without sacrificing much of the nanoscale mixing were pursued. One wayto achieve higher densities in the powder is to anneal the nanocomposites at relativelyhigher temperatures (- 10(X) OC). However, such an annealing around I(XX) °C of theA1203-Co304 nanocomposite will result in the formation of the spinel oxide CoAl2 ()4.which will in essence consume the low melting component Co30 4 and jeopardize ourapproach to SLS. Therefore, to demonstrate the feasibility of our objective, we decided topursue the ceramic-metal nanocomposite A120 3-Co, which will not undergo any chemicalreaction during the preannealing of the powder at higher temperatures. Accordingly.A1203-Co nanocomposites were first obtained by reducing the Al203-Co304 oxidenanocomposite in hydrogen around 10(X) OC. The powder was then annealed in N- atm at1350 °C for 8 h to increase the density, and reduced again in hydrogen around 10(X) 0C toconvert back any cobalt oxide that might have formed by reaction with the residual oxygenduring N2 annealing. The resulting A1203-Co powder was found to have a density ofabout 42 % and sinter under the laser beam. The single layer test coupons appear to havebetter structural integrity with much reduced macrocrack formation. An SEM photographof the powder after SLS is shown in Fig. 9.
Fig. 9 SEM micrograph of 50 mole % A1203 - 50 mole % Co nanocomposite afterfiring at 1350 0C in N2 for 8 h, 1(0) (C in H2 for 8 h and subjecting to SLS
72
CONCLUSIONS
Nanocomposite powders of A1203-C0Ox, A1203-NiO, A1203-Co and A1203-Nihave been successfully synthesized by sol-gel processing. The powders have beeninvestigated by SLS. Low densities (about 20 %) of the initial powders not only lead to aformation of macrocracks during SLS, but also prevent use of high enough laser powerthat can cause sintering. Increasing the initial powder densities to about 40 % seems toavoid this difficulty significantly and give structurally sound specimens. Further increasein the densities of the initial powders promises to enhance the success of our strategy, andsuch experiments are currently being pursued.
ACKNOWLEDGEMENT
Financial support by the DARPA-ONR grant No. N(*)0 14-92-J- 1394 and ONRgrant No. N00014-92-J-1514 is gratefully acknowledged.
REFERENCES
1. R. P. Andres et al, J. Mater. Res. 4, 704 (1989).2. S. Komarneni, J. Mater. Chem. 2, 1219 (1992).3. A. M. Kazakos, S. Komarneni and R. Roy, J. Mater. Res. 5, 1095 (1990).4. E. Breval, Z. Deng, S. Chiou and C. G. Pantano, J. Mater. Sci. 27, 1464 (1992).5. X. X. Tang, A. Manthiram and J. B. Goodenough, J. Less-Common Metals 156, 357
(1989).6. E. Garbowski et al, Appl. Catalysis, 64, 209 (1990).
73
PART FABRICATION USING LASER MACHINING AND WELDING
M S Pridham and G Thomson
Department of Applied Physics and Electronic and Manufacturing EngineeringUniversity of Dundee
DundeeDDI 4HN
UK
Abstract
This paper describes the current work on a laser cutting and welding system forthe fabrication of prototype parts in mild and stainless steels. The relationshipto other rapid prototyping systems and to laminated tool production techniques isdiscussed, the progress 'o date is described. Difficulties with current weldingprocedures are outlined and alternative joining techniques are considered.
IntroductionDespite the tremendous progress made in the whole field of rapid prototyping and
the development of processes, the majority of systems remain concentrated on nonmetals. However work is now being carried out on laser sintering of mild steel andstainless steel powders as well as on 3-D welding processes (1,2). Success in thesedevelopments will expand on the current prototype possibilities by enabling thedirect production of prototypes in metal, when this is required. This will offerbenefits in certain situations, cutting out the need for secondary processing ofplastic or wax prototypes, such as in producing investment casting moulds.
Laminate Processes
Work at Dundee has centered on using a laser machining centre to cut andfabricate components in mild and stainless steels, using layer cutting procedures andjoining techniques. Work in a similar area is also being undertaken by a Europeanconsortium under the BRITE initiative.
There has been considerable work in the field of laminating laser or EDM cutsheet and plate to form tooling such as injection mould cavities (3), drawing dies(4) and blanking tools (5,6). These tools have then been exploited in a number ofways for various applications. The motives for the undertaking of this type of workhave been varied, and not all in prototyping, but in all cases reductions inproduction or development times and costs have been realised.
A recent paper by Glover and Brevick (3) argues that whilst current commercialrapid prototyping systems such as Stereolithography, Selective Laser SinteringLaminated Object Manufacture and Fused Deposition Modelling, have their place in theearly stages of design, they rarely provide a full range of pre-productioninformation. For example the prototype material is rarely the same as the requiredpart, production processes, and therefore mechanical and physical properties of theprototype, differ from those intended for production, and prototype tolerances andsurface finishes are not usually representative of those obtainable by the eventualproduction processes.
74
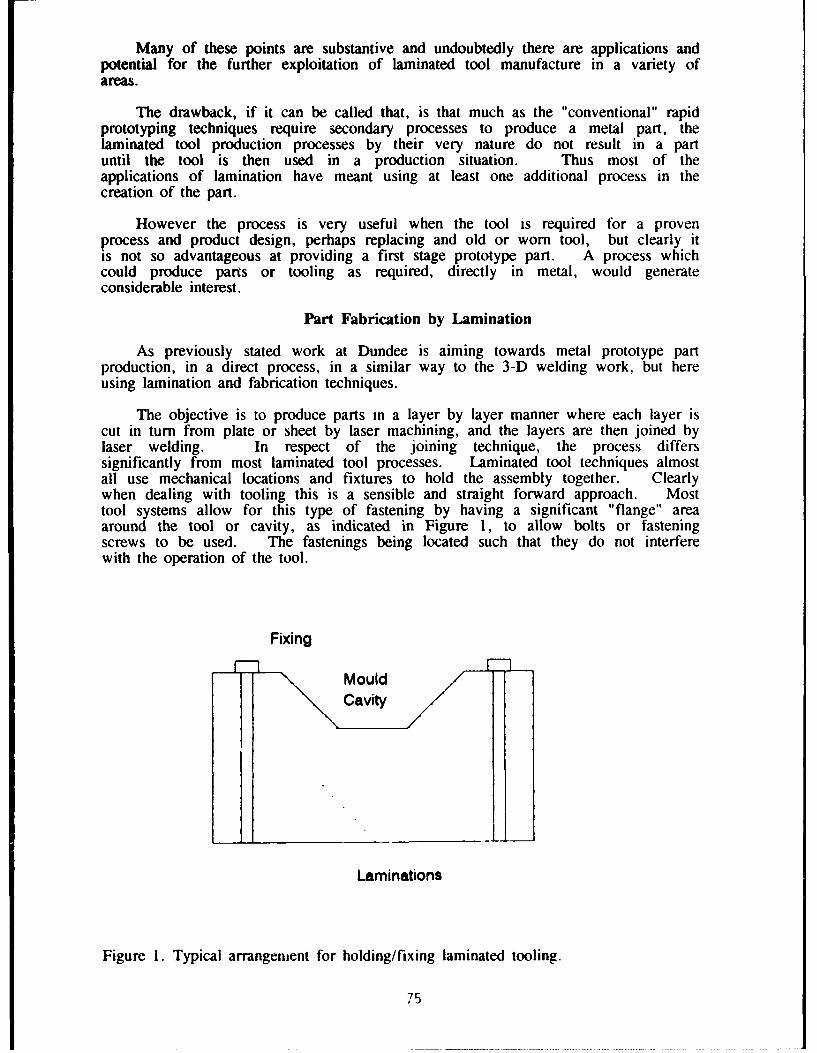
Many of these points are substantive and undoubtedly there are applications andpotential for the further exploitation of laminated tool manufacture in a variety ofareas.
The drawback, if it can be called that, is that much as the "conventional" rapidprototyping techniques require secondary processes to produce a metal part, thelaminated tool production processes by their very nature do not result in a partuntil the tool is then used in a production situation. Thus most of theapplications of lamination have meant using at least one additional process in thecreation of the part.
However the process is very useful when the tool is required for a provenprocess and product design, perhaps replacing and old or worn tool, but clearly itis not so advantageous at providing a first stage prototype part. A process whichcould produce parts or tooling as required, directly in metal, would generateconsiderable interest.
Part Fabrication by Lamination
As previously stated work at Dundee is aiming towards metal prototype partproduction, in a direct process, in a similar way to the 3-D welding work, but hereusing lamination and fabrication techniques.
The objective is to produce parts in a layer by layer manner where each layer iscut in turn from plate or sheet by laser machining, and the layers are then joined bylaser welding. In respect of the joining technique, the process differssignificantly from most laminated tool processes. Laminated tool techniques almostall use mechanical locations and fixtures to hold the assembly together. Clearlywhen dealing with tooling this is a sensible and straight forward approach. Mosttool systems allow for this type of fastening by having a significant "flange" areaaround the tool or cavity, as indicated in Figure 1, to allow bolts or fasteningscrews to be used. The fastenings being located such that they do not interferewith the operation of the tool.
Fixing
SMould F-
Cavity
Laminations
Figure 1. Typical arrangement for holding/fixing laminated tooling.
75
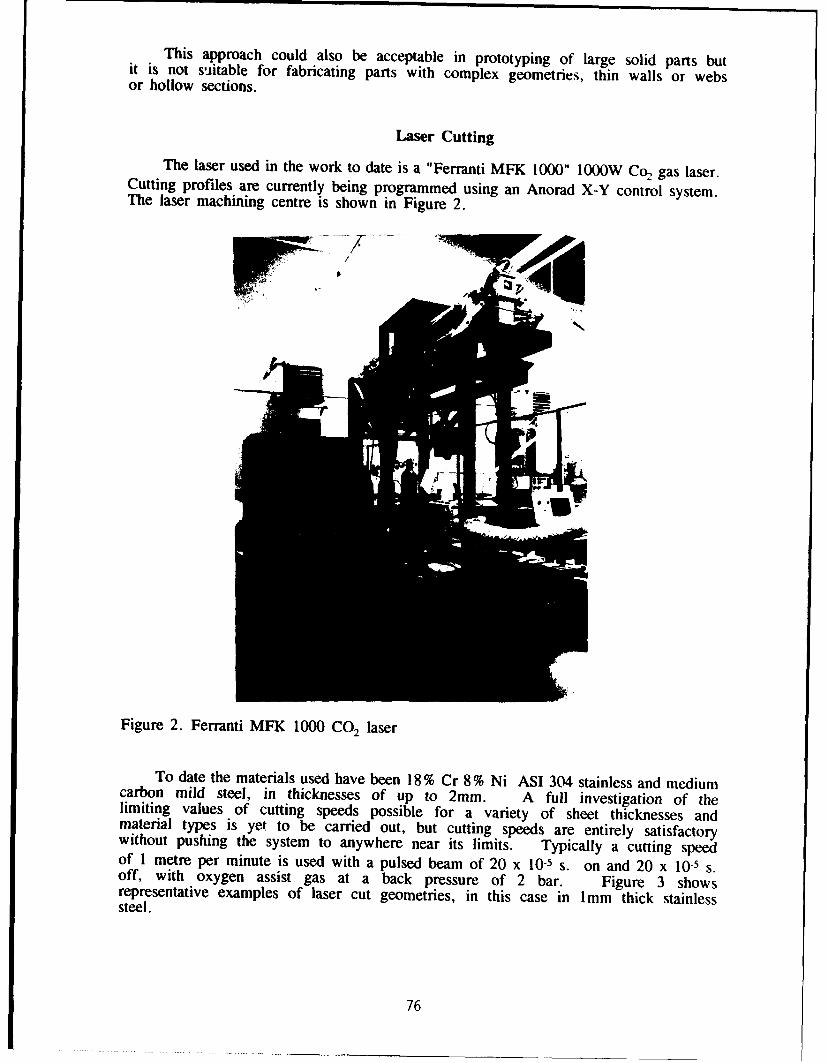
This approach could also be acceptable in prototyping of large solid parts butit is not suitable for fabricating parts with complex geometries, thin walls or websor hollow sections.
Laser Cutting
The laser used in the work to date is a "Ferranti MFK 1000" 1000W Co, gas laser.Cutting profiles are currently being programmed using an Anorad X-Y control system.The laser machining centre is shown in Figure 2.
Figure 2. Ferranti MFK 1000 CO2 laser
To date the materials used have been 18% Cr 8% Ni ASI 304 stainless and mediumcarbon mild steel, in thicknesses of up to 2mm. A full investigation of thelimiting values of cutting speeds possible for a variety of sheet thicknesses andmaterial types is yet to be carried out, but cutting speeds are entirely satisfactorywithout pushing the system to anywhere near its limits. Typically a cutting speedof 1 metre per minute is used with a pulsed beam of 20 x 10-5 s. on and 20 x 10-5 s.off, with oxygen assist gas at a back pressure of 2 bar. Figure 3 showsrepresentative examples of laser cut geometries, in this case in 1mm thick stainlesssteel.
76
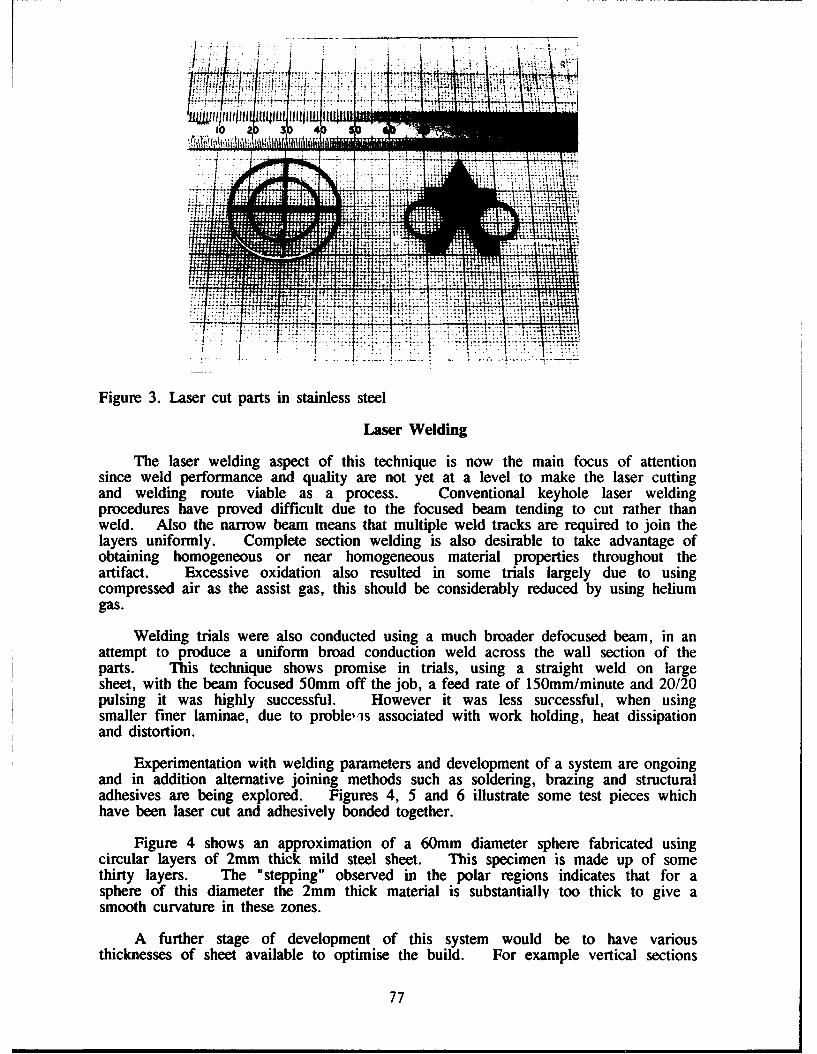
.,• Tli-j~iq7
Figure 3. Laser cut parts in stainless steel
Laser Welding
The laser welding aspect of this technique is now the main focus of attentionsince weld performance and quality are not yet at a level to make the laser cuttingand welding route viable as a process. Conventional keyhole laser weldingprocedures have proved difficult due to the focused beam tending to cut rather thanweld. Also the narrow beam means that multiple weld tracks are required to join thelayers uniformly. Complete section welding is also desirable to take advantage ofobtaining homogeneous or near homogeneous material properties throughout theartifact. Excessive oxidation also resulted in some trials largely due to usingcompressed air as the assist gas, this should be considerably reduced by using heliumgas.
Welding trials were also conducted using a much broader defocused beam, in anattempt to produce a uniform broad conduction weld across the wall section of theparts. This technique shows promise in trials, using a straight weld on largesheet, with the beam focused 50mm off the job, a feed rate of 150mm/minute and 20/20pulsing it was highly successful. However it was less successful, when usingsmaller finer laminae, due to proble,.'s associated with work holding, heat dissipationand distortion.
Experimentation with welding parameters and development of a system are ongoingand in addition alternative joining methods such as soldering, brazing and structuraladhesives are being explored. Figures 4, 5 and 6 illustrate some test pieces whichhave been laser cut and adhesively bonded together.
Figure 4 shows an approximation of a 60mm diameter sphere fabricated usingcircular layers of 2mm thick mild steel sheet. This specimen is made up of somethirty layers. The "stepping" observed in the polar regions indicates that for asphere of this diameter the 2mm thick material is substantially too thick to give asmooth curvature in these zones.
A further stage of development of this system would be to have variousthicknesses of sheet available to optimise the build. For example vertical sections
77
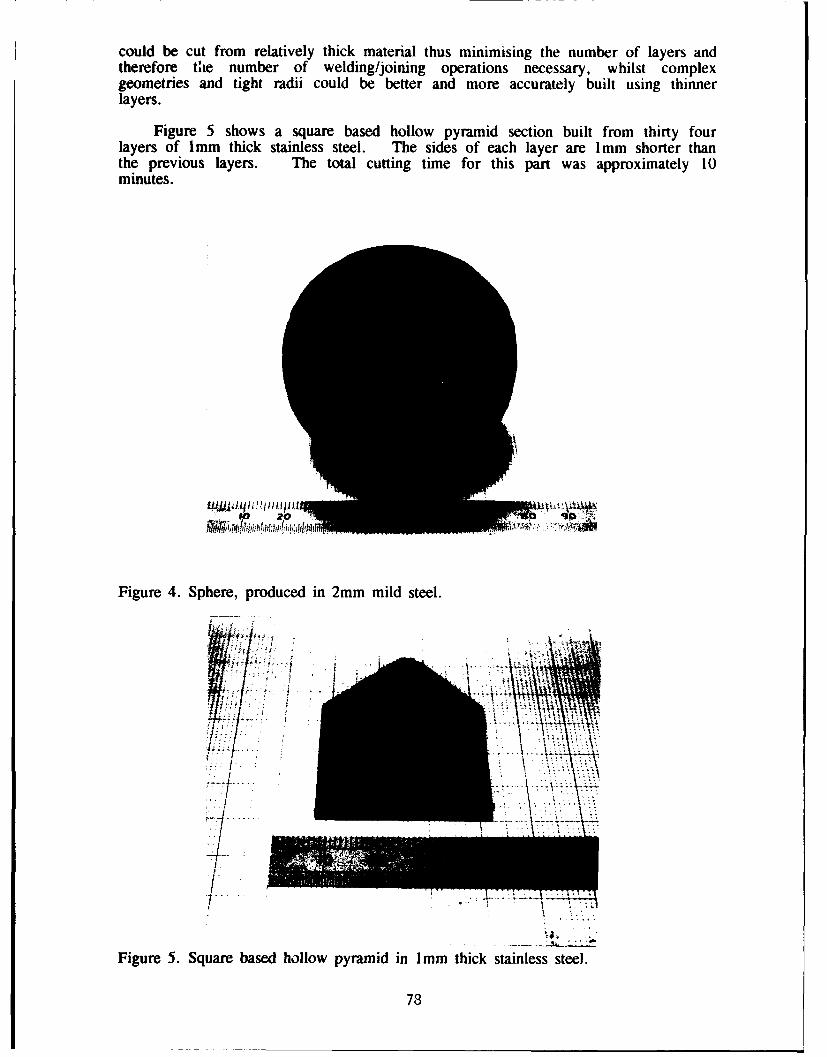
could be cut from relatively thick material thus minimising the number of layers andtherefore tie number of welding/joining operations necessary, whilst complexgeometries and tight radii could be better and more accurately built using thinnerlayers.
Figure 5 shows a square based hollow pyramid section built from thirty fourlayers of 1mm thick stainless steel. The sides of each layer are I mm shorter thanthe previous layers. The total cutting time for this part was approximately 10minutes.
Figure 4. Sphere, produced in 2mm mild steel.
S/
Figure 5. Square based hollow pyramid in 1mm thick stainless steel.
78
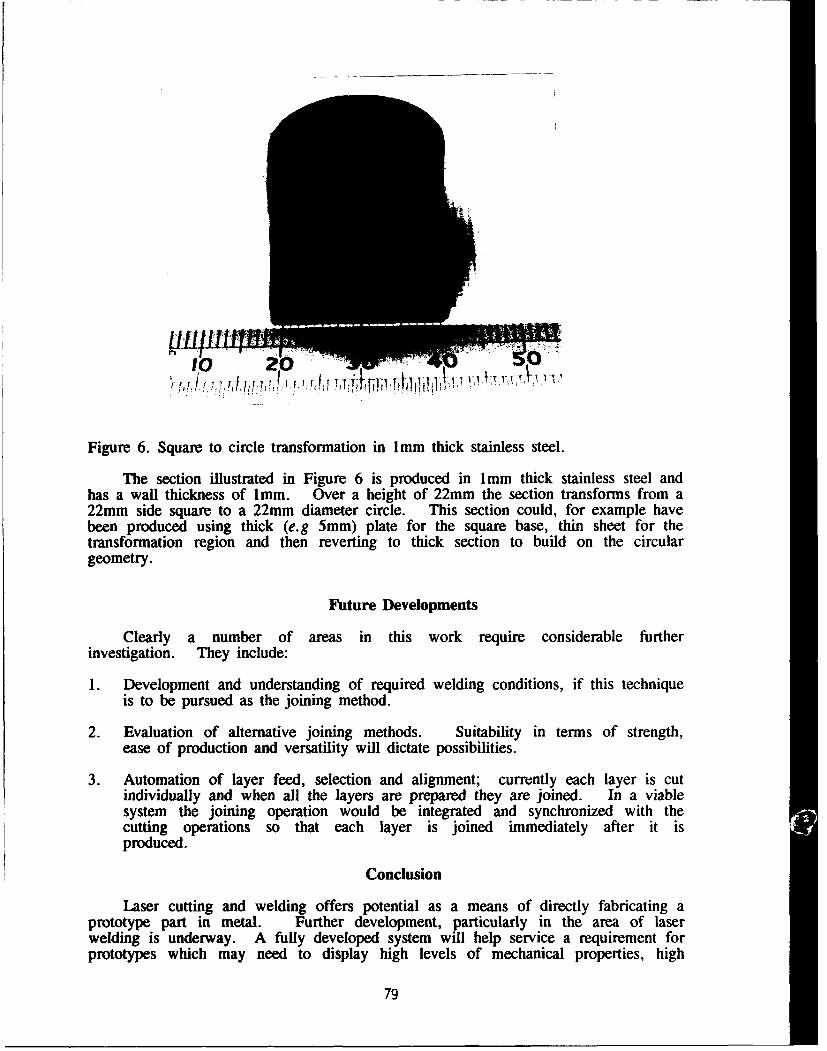
Figure 6. Square to circle transformation in 1mm thick stainless steel.
The section illustrated in Figure 6 is produced in lmm thick stainless steel andhas a wall thickness of 1mm. Over a height of 22mm the section transforms from a22mm side square to a 22mm diameter circle. This section could, for example havebeen produced using thick (e.g 5mm) plate for the square base, thin sheet for thetransformation region and then reverting to thick section to build on the circulargeometry.
Future Developments
Clearly a number of areas in this work require considerable furtherinvestigation. They include:
1. Development and understanding of required welding conditions, if this techniqueis to be pursued as the joining method.
2. Evaluation of alternative joining methods. Suitability in terms of strength,ease of production and versatility will dictate possibilities.
3. Automation of layer feed, selection and alignment; currently each layer is cutindividually and when all the layers are prepared they are joined. In a viablesystem the joining operation would be integrated and synchronized with thecutting operations so that each layer is joined immediately after it isproduced.
Conclusion
Laser cutting and welding offers potential as a means of directly fabricating aprototype part in metal. Further development, particularly in the area of laserwelding is underway. A fully developed system will help service a requirement forprototypes which may need to display high levels of mechanical properties, high
79
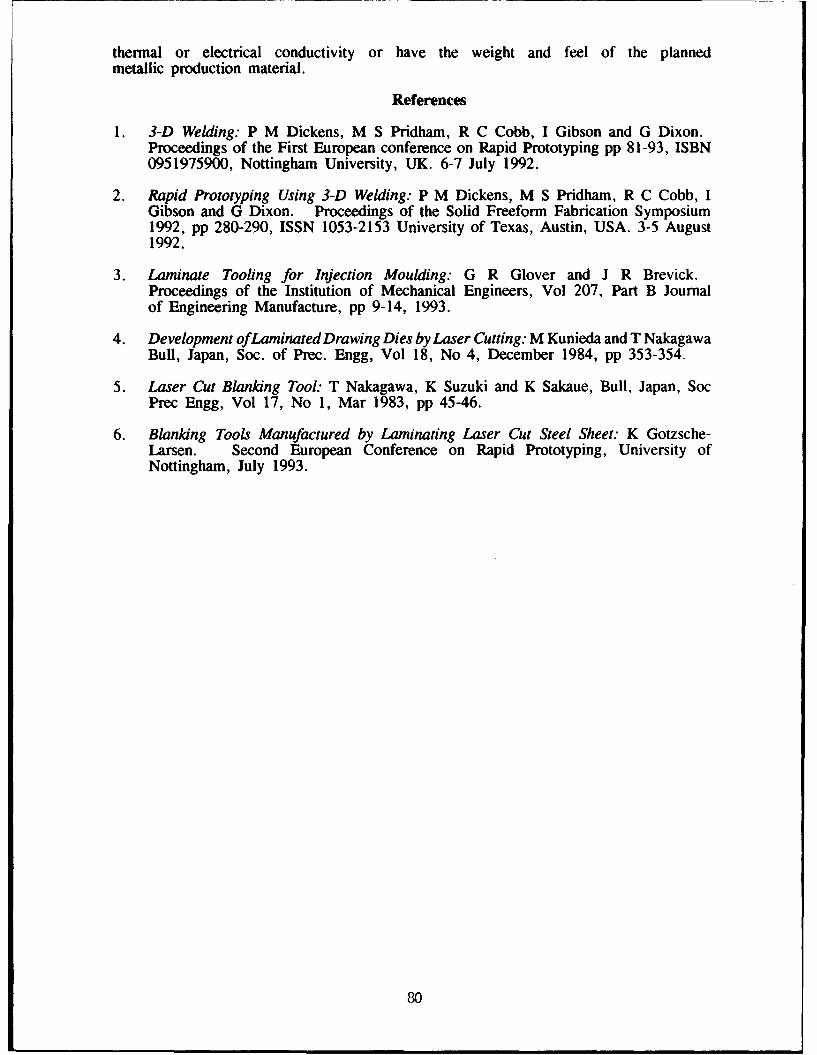
thermal or electrical conductivity or have the weight and feel of the plannedmetallic production material.
References
1. 3-D Welding: P M Dickens, M S Pridham, R C Cobb, I Gibson and G Dixon.Proceedings of the First European conference on Rapid Prototyping pp 81-93, ISBN0951975900, Nottingham University, UK. 6-7 July 1992.
2. Rapid Prototyping Using 3-D Welding: P M Dickens, M S Pridham, R C Cobb, IGibson and G Dixon. Proceedings of the Solid Freeform Fabrication Symposium1992, pp 280-290, ISSN 1053-2153 University of Texas, Austin, USA. 3-5 August1992.
3. Laminate Tooling for Injection Moulding: G R Glover and J R Brevick.Proceedings of the Institution of Mechanical Engineers, Vol 207, Part B Journalof Engineering Manufacture, pp 9-14, 1993.
4. Development of Laminated Drawing Dies by Laser Cutting: M Kunieda and T NakagawaBull, Japan, Soc. of Prec. Engg, Vol 18, No 4, December 1984, pp 353-354.
5. Laser Cut Blanking Tool: T Nakagawa, K Suzuki and K Sakaue, Bull, Japan, SocPrec Engg, Vol 17, No 1, Mar 1983, pp 45-46.
6. Blanking Tools Manufactured by Laminating Laser Cut Steel Sheet: K Gotzsche-Larsen. Second European Conference on Rapid Prototyping, University ofNottingham, July 1993.
80
Picoliter Solder Droplet Dispensing
Ronald E. Marusak, Ph.D.MicroFab Technologies, Inc.
1104 Summit, Suite 110Piano, Texas 75074
(214) 578-8076
A device based on ink-jet printing technology was used to produce and placemolten solder droplets, approximately 25-125pm in diameter, onto substrates. Theadvantages of an ink-jet based system are direct production of metallic objects, no post-cure, low cost, and the repeatability and resolution for small feature sizes. This paperdescribes the device, the supporting hardware, and experimental procedures. Results showthat bump size can be varied by placing in quick succession, multiple droplets as well asby resizing the device and by altering the signal.
Introduction
The technology that was developed for forming droplets of ink in printing hasbeen applied, over the past several years, in the dispensing of materials during themanufacture of microelectronics (see References). This work has resulted in thedevelopment of print heads that can, at elevated temperatures, deliver precise amounts ofmolten solder with exacting positional control.
This paper presents the results of forming bumps of solder using ink-jet printingtechnology. Initial applications for solder droplet dispensing include the bumping of chipsfor flip-chip bonding and tape-automated bonding (TAB), the bumping of substrates forTAB or fine pitch surface mounting, and the repair of solder joints. Potential applicationsinclude the formation of metal layers, reinforcement of metal joints, and the freeformfabrication of metal parts.
Description of the Droplet Generator
The device that was used to dispense the liquid solder is based on early ink-jetprint heads. A schematic of this droplet generator is shown in Figure 1. The end of the0.75 mm diameter tube is formed into an orifice of approximately 50 pm. The other endis attached to a fluid supply. Fluid at essentially ambient pressure fills the glass tube, andsurface tension prevents the fluid from leaking out of the orifice. A tube-shapedpiezoelectric crystal is adhesively bonded to the outer diameter of the glass. Theassembly is mounted in a protective shell.
81
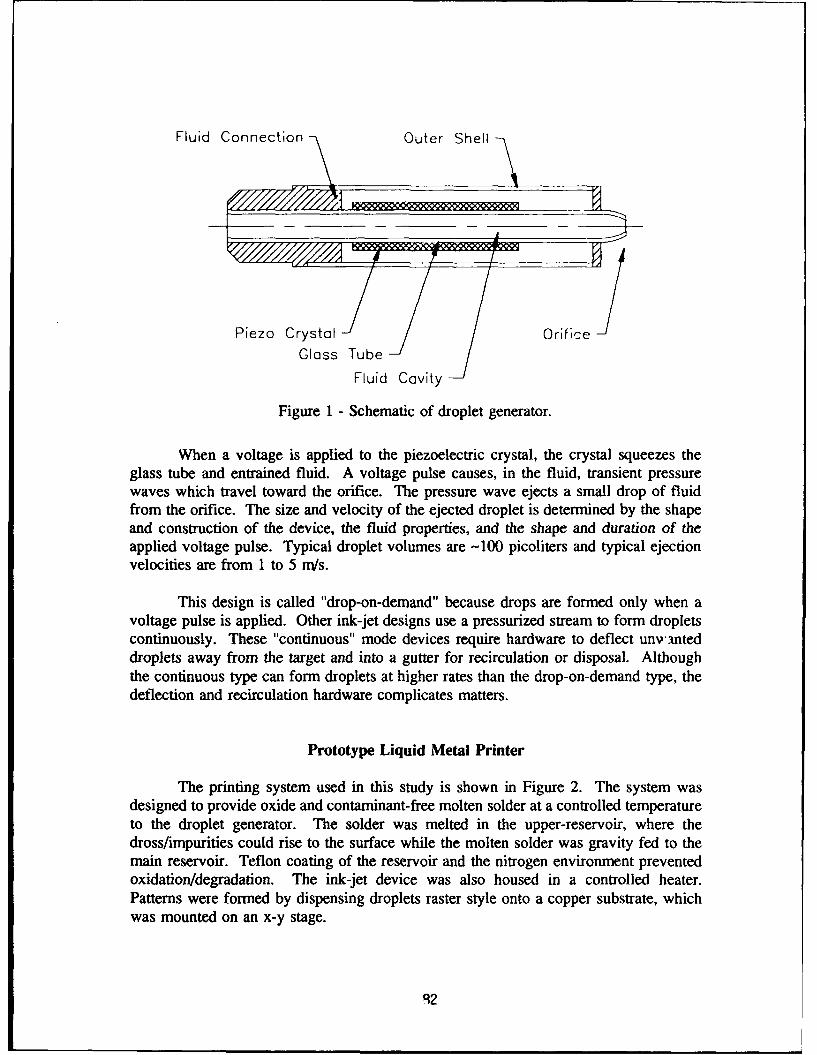
Fluid Connection Outer Shell
Piezo Crystal Orifice
Glass Tube
Fluid Cavity
Figure 1 - Schematic of droplet generator.
When a voltage is applied to the piezoelectric crystal, the crystal squeezes theglass tube and entrained fluid. A voltage pulse causes, in the fluid, transient pressurewaves which travel toward the orifice. The pressure wave ejects a small drop of fluidfrom the orifice. The size and velocity of the ejected droplet is determined by the shapeand construction of the device, the fluid properties, and the shape and duration of theapplied voltage pulse. Typical droplet volumes are -100 picoliters and typical ejectionvelocities are from 1 to 5 m/s.
This design is called "drop-on-demand" because drops are formed only when avoltage pulse is applied. Other ink-jet designs use a pressurized stream to form dropletscontinuously. These "continuous" mode devices require hardware to deflect unv-tteddroplets away from the target and into a gutter for recirculation or disposal. Althoughthe continuous type can form droplets at higher rates than the drop-on-demand type, thedeflection and recirculation hardware complicates matters.
Prototype Liquid Metal Printer
The printing system used in this study is shown in Figure 2. The system wasdesigned to provide oxide and contaminant-free molten solder at a controlled temperatureto the droplet generator. The solder was melted in the upper-reservoir, where thedross/impurities could rise to the surface while the molten solder was gravity fed to themain reservoir. Teflon coating of the reservoir and the nitrogen environment preventedoxidation/degradation. The ink-jet device was also housed in a controlled heater.Patterns were formed by dispensing droplets raster style onto a copper substrate, whichwas mounted on an x-y stage.
R2
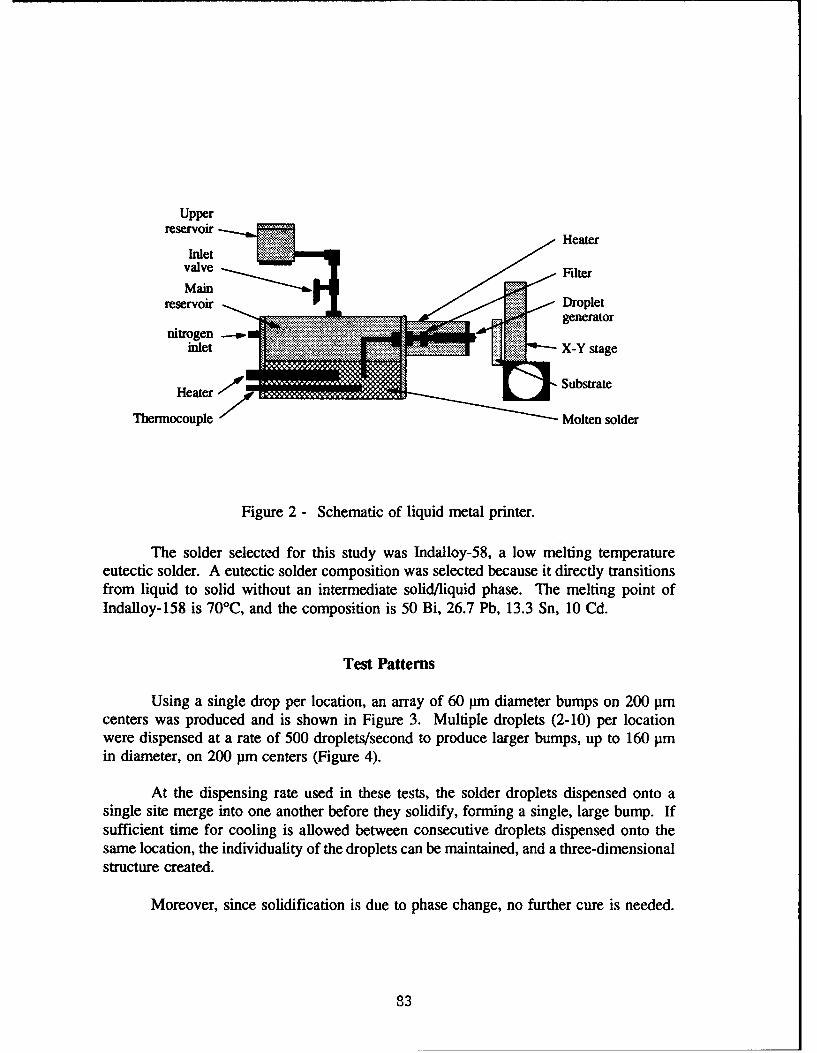
UpperreservoirHeater
Inletvalve Filter
reservoir •Dropletnitrogen--•!::::!i.
nt e ......... generatorinlet X-Y stage
Heater ,Substrate
Thermocouple Molten solder
Figure 2 - Schematic of liquid metal printer.
The solder selected for this study was Indalloy-58, a low melting temperatureeutectic solder. A eutectic solder composition was selected because it directly transitionsfrom liquid to solid without an intermediate solid/liquid phase. The melting point ofIndalloy-158 is 70'C, and the composition is 50 Bi, 26.7 Pb, 13.3 Sn, 10 Cd.
Test Patterns
Using a single drop per location, an array of 60 pm diameter bumps on 200 pmcenters was produced and is shown in Figure 3. Multiple droplets (2-10) per locationwere dispensed at a rate of 500 droplets/second to produce larger bumps, up to 160 pmin diameter, on 200 pm centers (Figure 4).
At the dispensing rate used in these tests, the solder droplets dispensed onto asingle site merge into one another before they solidify, forming a single, large bump. Ifsufficient time for cooling is allowed between consecutive droplets dispensed onto thesame location, the individuality of the droplets can be maintained, and a three-dimensionalstructure created.
Moreover, since solidification is due to phase change, no further cure is needed.
83
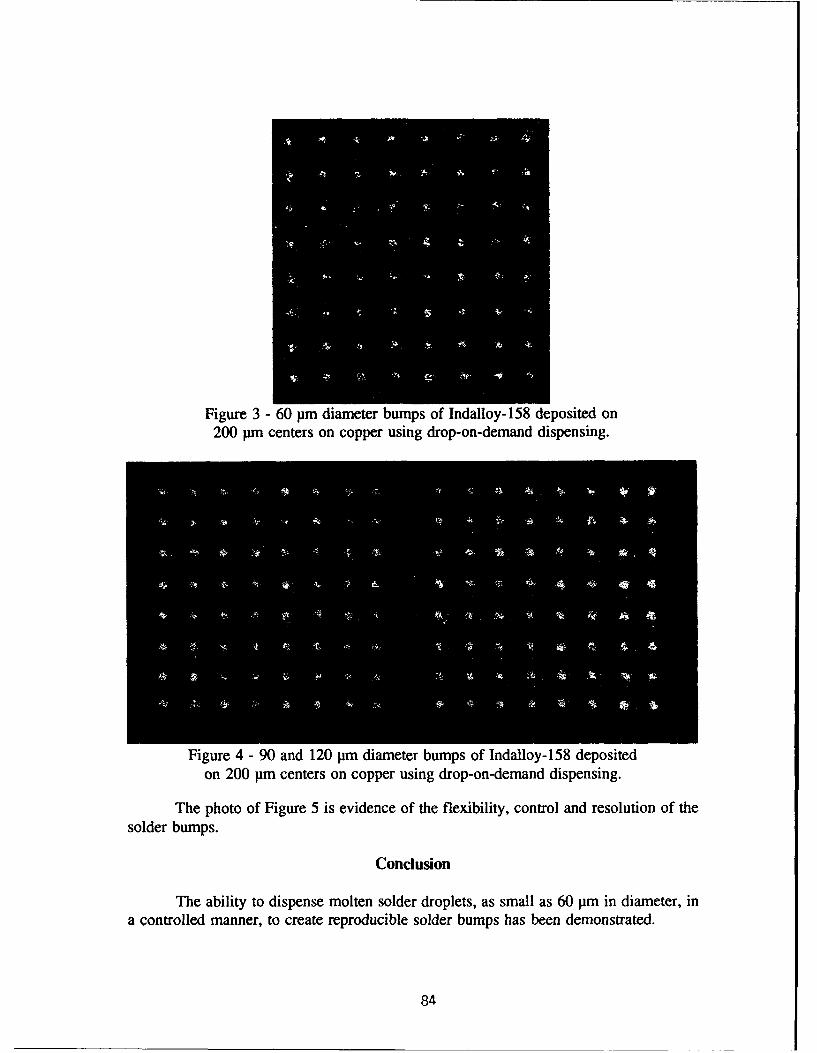
Figure 3 - 60 pm diameter bumps of Indalloy-158 deposited on200 pm centers on copper using drop-on-demand dispensing.
Figure 4 - 90 and 120 pm diameter bumps of Indalloy-158 depositedon 200 pm centers on copper using drop-on-demand dispensing.
The photo of Figure 5 is evidence of the flexibility, control and resolution of thesolder bumps.
Conclusion
The ability to dispense molten solder droplets, as small as 60 pm in diameter, ina controlled manner, to create reproducible solder bumps has been demonstrated.
84
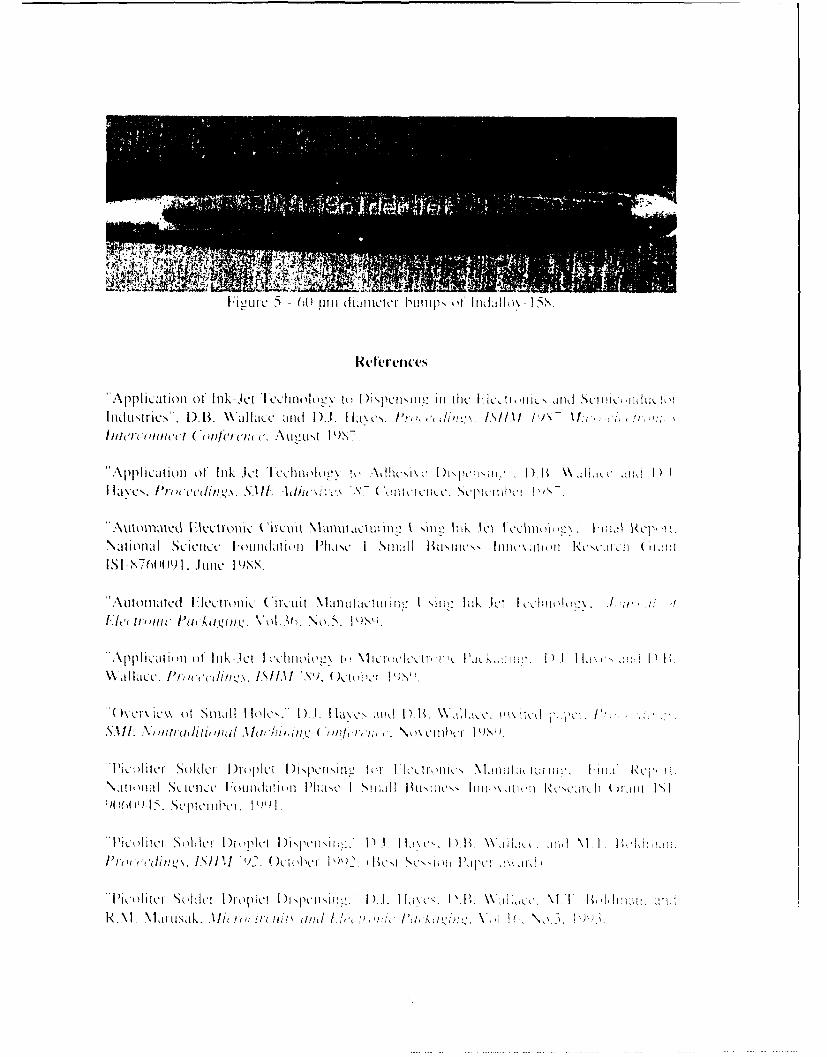
[" 5 LI-C 00~ 11111 (IJI11CtCl- humps )' I lJk\-I 5) .
":\I1Iik,:ation of Ink-Jet 'Icchnol(ok 2 it Dlilpci11\ý,I II: InlIcI C&Eli& AiiI SIJ ~ . i
In1 (t Mi l ~,'( t ( 'tu cr('f(T A. .\ 12LN1 7 ~
A~ppjIIcait Ion of' IAk-J ct 'I ctch11) no At \Ih I\ I )I~\n I)\ I p, cI~ [IM I,I Id\cYs. ltcedlim. SIiL dhi;'\T(ncccStIIiI
\,0 111 SJI~ICCio c {. O Yt..(Ufl 1 Inu JC SI.V 11' B1. 1fi Ik .1C" c..hlt 11 11.!1:111
ISI-S76( IP.)1. June INS
"A'utonlnltc(I I;Ictrou ic ('ircuit \V ILut~i ttuIl I[ I \,III! 111k IcJC1 10,1111010n .1 L f W 1,:
F ~it,( O iCd ti P It Iika -Iim I V o lcl u' Ik c t \ oC cc i c IU.,: I . [ 2 i I
*'ApII\ ct,iw tlti u~Ink Xlt hI 111,'( t t ý/c M k. lkC -'. , 1'\t cii" P .,
>%dIt~IidI Scicncc Dit1ucIul' D I'IiaCHNI SII , ~ ulu\ L'n~' .uiic 11,11 Ir 111' 1 dli ii I"f
I( I((C.5 S~dcpiuhv I )[oit ) "c
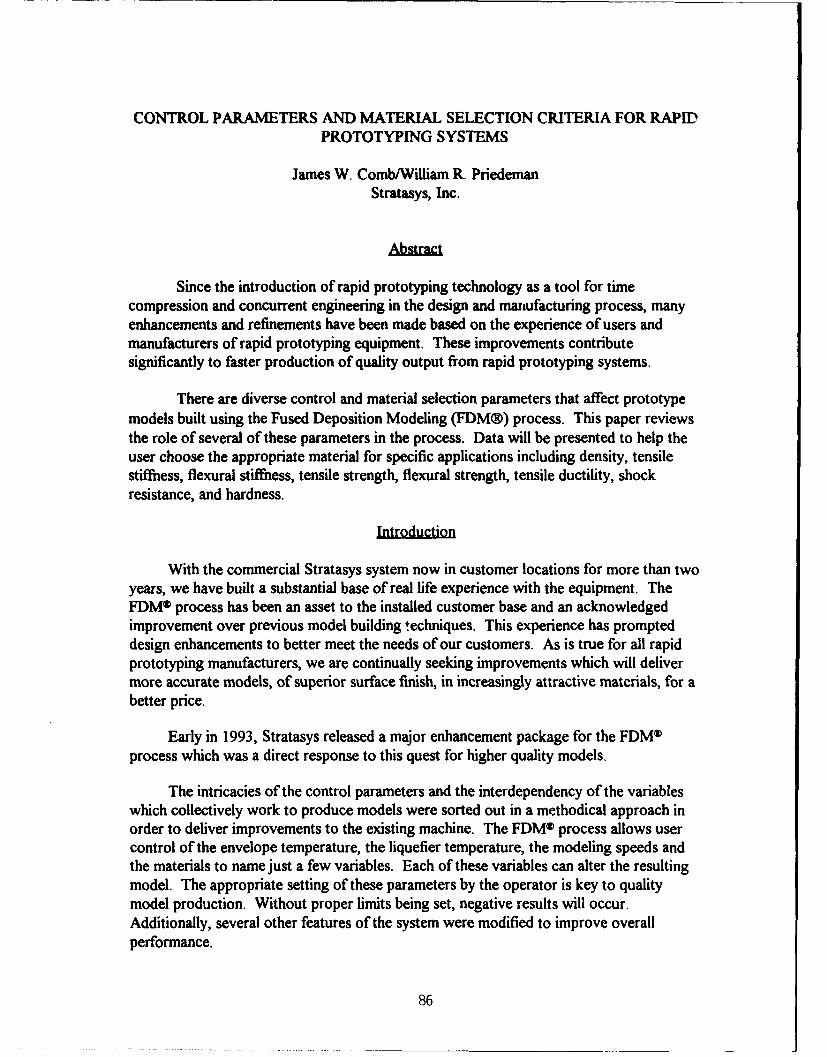
CONTROL PARAMETERS AND MATERIAL SELECTION CRITERIA FOR RAPIDPROTOTYPING SYSTEMS
James W. Comb/William R. PriedemanStratasys, Inc.
Abstract
Since the introduction of rapid prototyping technology as a tool for timecompression and concurrent engineering in the design and maniufacturing process, manyenhancements and refinements have been made based on the experience of users andmanufacturers of rapid prototyping equipment. These improvements contributesignificantly to faster production of quality output from rapid prototyping systems.
There are diverse control and material selection parameters that affect prototypemodels built using the Fused Deposition Modeling (FDM®) process. This paper reviewsthe role of several of these parameters in the process. Data will be presented to help theuser choose the appropriate material for specific applications including density, tensilestiffness, flexural stiffhess, tensile strength, flexural strength, tensile ductility, shockresistance, and hardness.
Introductin
With the commercial Stratasys system now in customer locations for more than twoyears, we have built a substantial base of real life experience with the equipment. TheFDM® process has been an asset to the installed customer base and an acknowledgedimprovement over previous model building *echniques. This experience has prompteddesign enhancements to better meet the needs of our customers. As is true for all rapidprototyping manufacturers, we are continually seeking improvements which will delivermore accurate models, of superior surface finish, in increasingly attractive materials, for abetter price.
Early in 1993, Stratasys released a major enhancement package for the FDM®process which was a direct response to this quest for higher quality models.
The intricacies of the control parameters and the interdependency of the variableswhich collectively work to produce models were sorted out in a methodical approach inorder to deliver improvements to the existing machine. The FDM® process allows usercontrol of the envelope temperature, the liquefier temperature, the modeling speeds andthe materials to name just a few variables. Each of these variables can alter the resultingmodel. The appropriate setting of these parameters by the operator is key to qualitymodel production. Without proper limits being set, negative results will occur.Additionally, several other features of the system were modified to improve overallperformance.
86
The Stratasys FDM® process extrudes material via a simple filament drive system. Ifthe capacity of the filament drive system is exceeded, the filament can break, bulge, orbuckle, causing a plug in the lower filament guide when using certain modeling materials.Other materials may not break, but slipping of the drive wheels may cause improperfilament feed (Reference Figure 4a). To address these issues, modifications of the drivesystem were developed to increase the overall drive capacity and extensive testing wasperformed to determine the operating limits to ensure reliable operailon.
Additional testing was pertormed to determine the temperature set points for theliquefier and modeling environment for each material. This information led to the re-design of the FDM® process liquefier and cabinet. A heater box package and improvedseal system were added to the cabinet to improve the uniformity of the modeling airtemperature. A longer and more powerful liquefier was added to increase the volumetricflow rate and improve the temperature consistency of the delivered material. Additionally,this liquefier was made to be easily exchanged when changing materials to eliminatecleaning and material "build-up" within the liquefier which contributed to plugging.
An improved hold-down method for the modeling foundation was developed toallow the build of larger, thicker models without foundation warping.
A firmware solution was implemented to eliminate the "oozing" that occurred at theFDM®& tip after shut-off of the material flow. Oozing is the overflow of material thatproduces small irregularities and loss of detail in the resulting model.
Experimental Results
Figure 1 is a diagram showing the relative increase in traction to drive the filamentthat was achieved with the implementation of the 1/2" elastomeric wheels. The figureshows two curves: the lower curve is a plot of traction force versus filament diameter forthe original 1" steel wheels; the upper curve shows the same for the 1/2" elastomericwheels. As seen in the figure, the available traction force of the I" steel wheels issignificantly lower than the 1/2" elastomeric wheels. The 1" wheels are more sensitive tochanges in filament diameter; i.e., normal variations in the filament diameter wouldproduce large variations in the available traction leading to slipping at high material flowrates. The 1/2" wheels, due to their rubber-like behavior, are less sensitive to filamentdiameter changes and produce more traction in the feed mechanism. This gives the FDM®filament drive system a higher flow rate capacity.
In Figure 2, the pressure flow relationship for various tip sizes and temperatures areshown. The relationship shown is characteristic of each of the modeling materials offeredby Stratasys. Curves representing liquefier pressure (P) versus volumetric flow rate (V)are depicted. The liquefier pressure is created by the drive traction force acting on thefilament divided by the filament's cross-sectional area. For a given tip diameter (di) andliquefier temperature(Ti), the relationship between pressure and flow is roughly linear. As
87
tip diameter is decreased the pressure required to produce a specific flow rate increasesdramatically. As temperature decreases, the pressure required increases due to theincreased viscosity of the material. In the Stratasys filament drive system the liquefierpressure attained is limited by: a) the force at which the filament drive slips (Fs); b) thecompressive strength of the filament (sc); and c) the stress at which the filament buckles(Sb). The force levels for each of these limits differ in magnitude and relative order forvarious materials. Therefore, the system is bounded in pressure by the lowest of thesevalues per material. The system is further bounded by the available liquefier heatexchanger capacity. If operated beyond this maximum flow rate (Vmax), the materialdelivered will not attain the desired set point temperature.
To produce a model, tip diameter, process temperature, road width (w), z-slicethickness (z), and speed (s) are selected. The volumetric flow rate is the road width timesthe z-slice thickness times the speed of the head (V-w*z*s). In order to not exceed theoperating bounds of the system, the speed must be selected so that pressure and flow rateremain within the operating limits. V I and V2 represent the maximum allowable flowrates for the upper two curves in Figure 2.
The operating parameters discussed above are hard barriers to the modelingprocess. The system must be operated within these limits to ensure reliable plug-free, slip-free operation.
Figure 3 is a diagram representing the required set points for liquefier temperatureand air temperature to achieve good models. In general, there are upper and lowerliquefier and air temperature limits for each material. Exceeding these limits do notnecessarily mean the model will fail but poor surface quality or low part strength mayresult. Typically, rippling of the model surface is caused by the air temperature being settoo high and, to a lesser degree, by the liquefier temperature being set too high.Conversely, low modeling air temperatures result in poor bonding strength between thelayers for some materials and actual delamination of the model in extreme cases. Lowliquefier temperatures result in low limits for material flow rates due to the high viscosityof the material and also poor bonding. Therefore, experiments were conducted for eachmaterial to define the guidelines to achieve the optimum balance between part strength andsurface finish.
System Enhancements
As a result of these experiments several design changes were made to the StratasysFDM® process to improve its performance. These changes were delivered to allcustomers during the first quarter of 1993. This enhancement package consisted of thefollowing design modifications:
1. Addition of Seals and Fan Heater Boxes and A New Cabinet Door Design to ImproveAir Temperature Uniformity. The combination of these three items improves the
88
uniformity of the air temperature within the FDM0 process during the modelingprocess. This improved air temperature uniformity eliminates cold spots within theenvironment that could cause poor bonding or delamination of the model.Additionally, the existing auxiliary heat circuit used to ramp the cabinet up totemperature now operates automatically.
2. Longer, More Powerful Liquefier to Improve Material Delivery and Set PointTemperature Consistency. The longer liquefier achieves two things: there is lessvariation in the temperature for both high and low flow rates and higher flow rates areattainable while maintaining the material set point temperature. This liquefier was alsodesigned to be easily exchanged when changing materials. This attribute allowsliquefiers to be dedicated to each material type, thereby eliminating the possibility ofresidual material coatings from previously used materials. The previous designrequired cleaning operations to be performed on a regular basis to ensure trouble-freeoperation. (Reference Figures 4a and 4b.)
3. Smaller, Elastomeric Wheels and Larger Filament Diameter to Increase the BucklingStrength and Available Drive Traction. The buckling strength of the filament is afunction of its diameter (d) and its compressed length (i). (Reference Figures 4a and4b.) An increase of the filament diameter and a reduction of the compressed lengthincreases significantly the filament's resistance to buckling. The decrease in thecompressed length was achieved by the use of smaller wheels and the elimination ofthe lower filament guide.
The previous 1" steel wheels were unable to conform to varying filament diameters.Smaller, 1/2" elastomeric wheels are better able to conform to the filament therebyreducing stress concentration and increasing drive traction due to their highercoefficient of friction.
4. Improved Hold-Down Tray to Prevent Warping. The Stratasys FDM® processdeposits material on a removable foam foundation. Previous methods to retain thisfoam base were limited in their ability to prevent the foam from warping during theconstruction of large, thick parts. The new design rigidly holds the foam in analuminum tray by the use of steel spears. The tray is easily removed from the machineto allow model removal and replacement during pauses in the modeling process. Thisfeature gives the operator the flexibility to perform interim operations on the modelnot previously possible.
5. Enhanced Firmware to Eliminate "Ooze." A roll-back feature was incorporated intothe firmware design which rolls back the filament drive wheels at the end of eachcurve. This feature eliminates the deposition of excess material at the tip, therebyimproving the model quality.
89
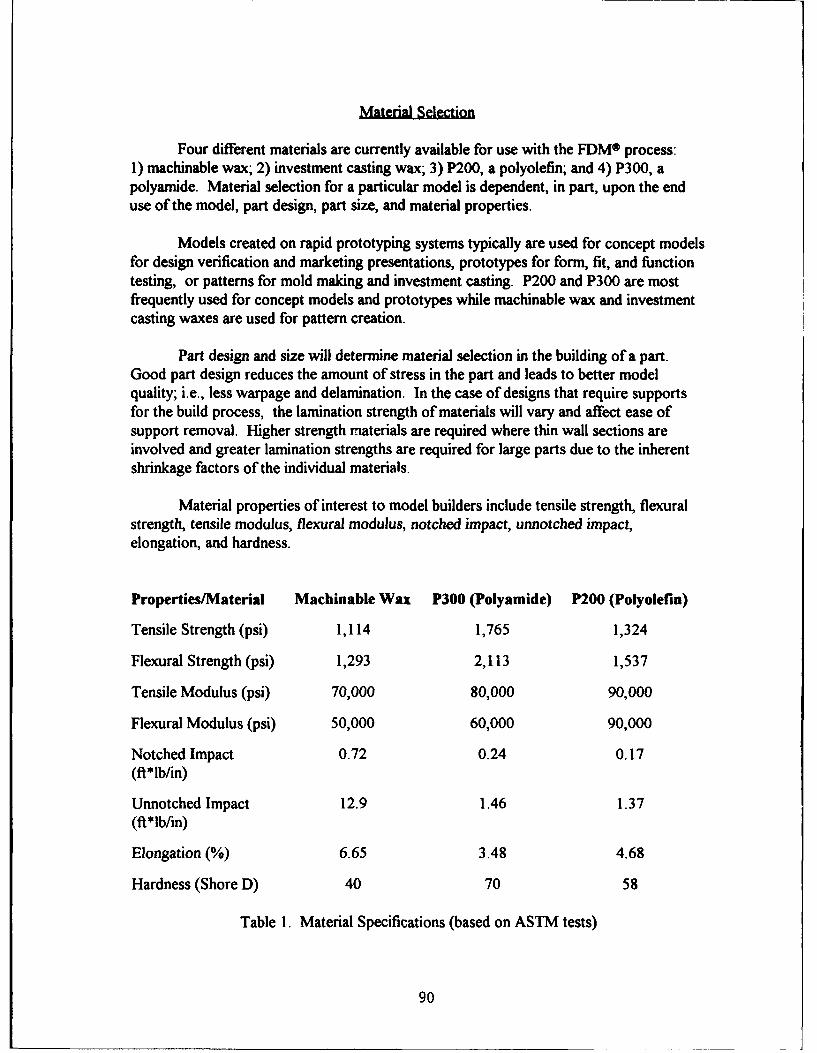
Materia Selection
Four different materials are currently available for use with the FDMO process:1) machinable wax; 2) investment casting wax; 3) P200, a polyolefin; and 4) P300, apolyamide. Material selection for a particular model is dependent, in part, upon the enduse of the model, part design, part size, and material properties.
Models created on rapid prototyping systems typically are used for concept modelsfor design verification and marketing presentations, prototypes for form, fit, and functiontesting, or patterns for mold making and investment casting. P200 and P300 are mostfrequently used for concept models and prototypes while machinable wax and investmentcasting waxes are used for pattern creation.
Part design and size will determine material selection in the building of a part.Good part design reduces the amount of stress in the part and leads to better modelquality; i.e., less warpage and delamination. In the case of designs that require supportsfor the build process, the lamination strength of materials will vary and affect ease ofsupport removal. Higher strength materials are required where thin wall sections areinvolved and greater lamination strengths are required for large parts due to the inherentshrinkage factors of the individual materials.
Material properties of interest to model builders include tensile strength, flexuralstrength, tensile modulus, flexural modulus, notched impact, unnotched impact,elongation, and hardness.
Properties/Material Machinable Wax P300 (Polyamide) P200 (Polyolefin)
Tensile Strength (psi) 1,114 1,765 1,324
Flexural Strength (psi) 1,293 2,113 1,537
Tensile Modulus (psi) 70,000 80,000 90,000
Flexural Modulus (psi) 50,000 60,000 90,000
Notched Impact 0.72 0.24 0.17(ft*lb/in)
Unnotched Impact 12.9 1.46 1.37(ft*lb/in)
Elongation (%) 6.65 3.48 4.68
Hardness (Shore D) 40 70 58
Table 1. Material Specifications (based on ASTM tests)
90
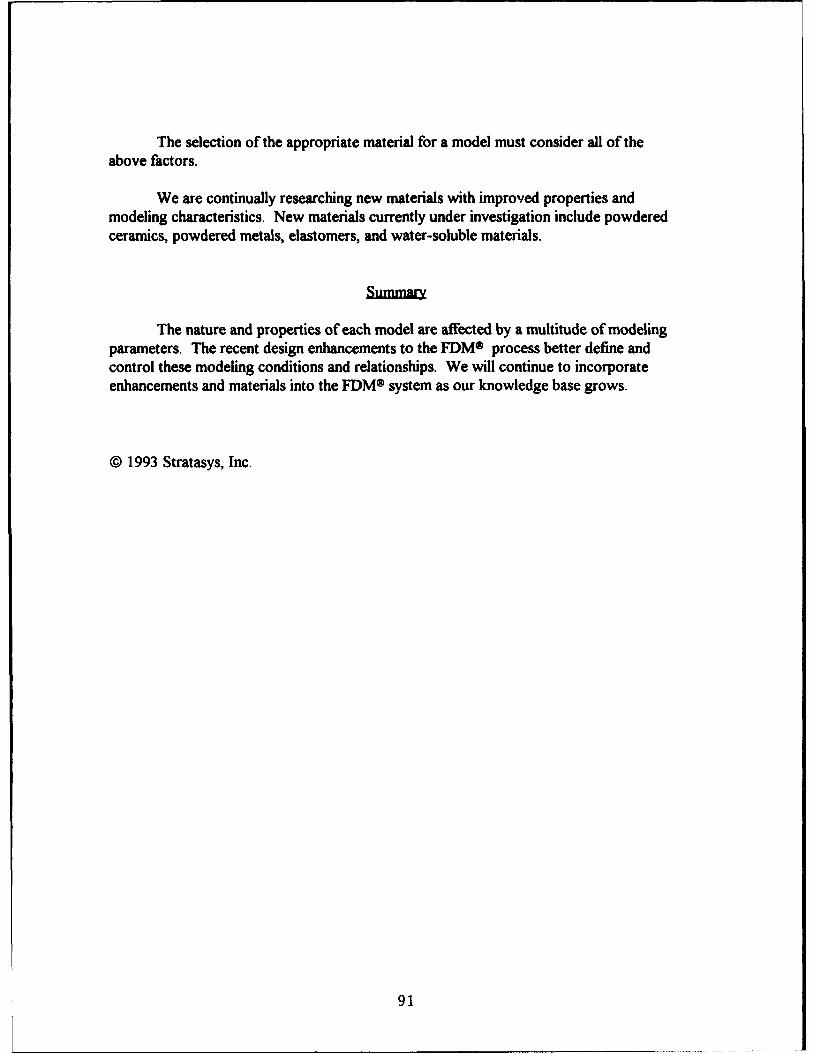
The selection of the appropriate material for a model must consider all of theabove factors.
We are continually researching new materials with improved properties andmodeling characteristics. New materials currently under investigation include powderedceramics, powdered metals, elastomers, and water-soluble materials.
SnmaMw
The nature and properties of each model are affected by a multitude of modelingparameters. The recent design enhancements to the FDM® process better define andcontrol these modeling conditions and relationships. We will continue to incorporateenhancements and materials into the FDM® system as our knowledge base grows.
© 1993 Stratasys, Inc.
91
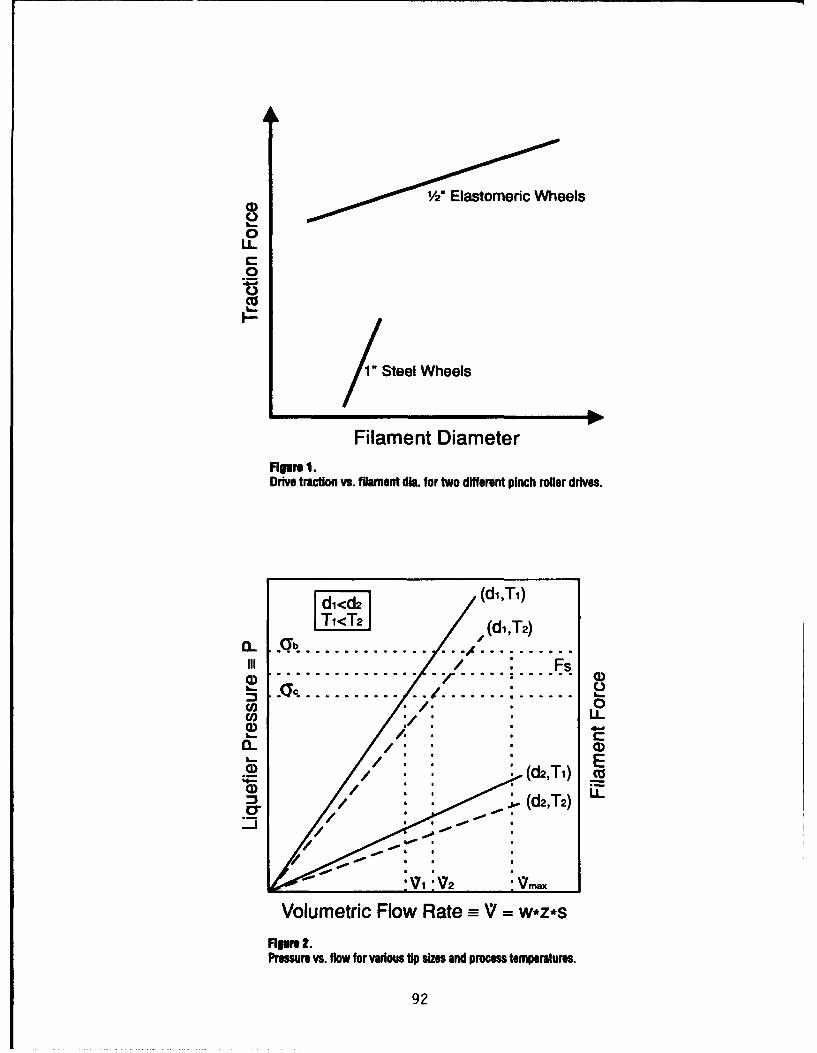
1/2* Elaastoomerricc Wheels
0LLC0
Ca
/ Steel Wheels
Filament DiameterHgure 1.Drive traction vs. filament diLa. for two different pinch roller drives.
[d1< (di,Ti)(dl,T2)
0 o b....................... .........
/./Fs
a)........................... .adT )
S............... ............... C
0)0
--
Volumetric Flow Rate --V = w*z*s
Pressure vs. flow for various tip sizes and process temperatures.
92
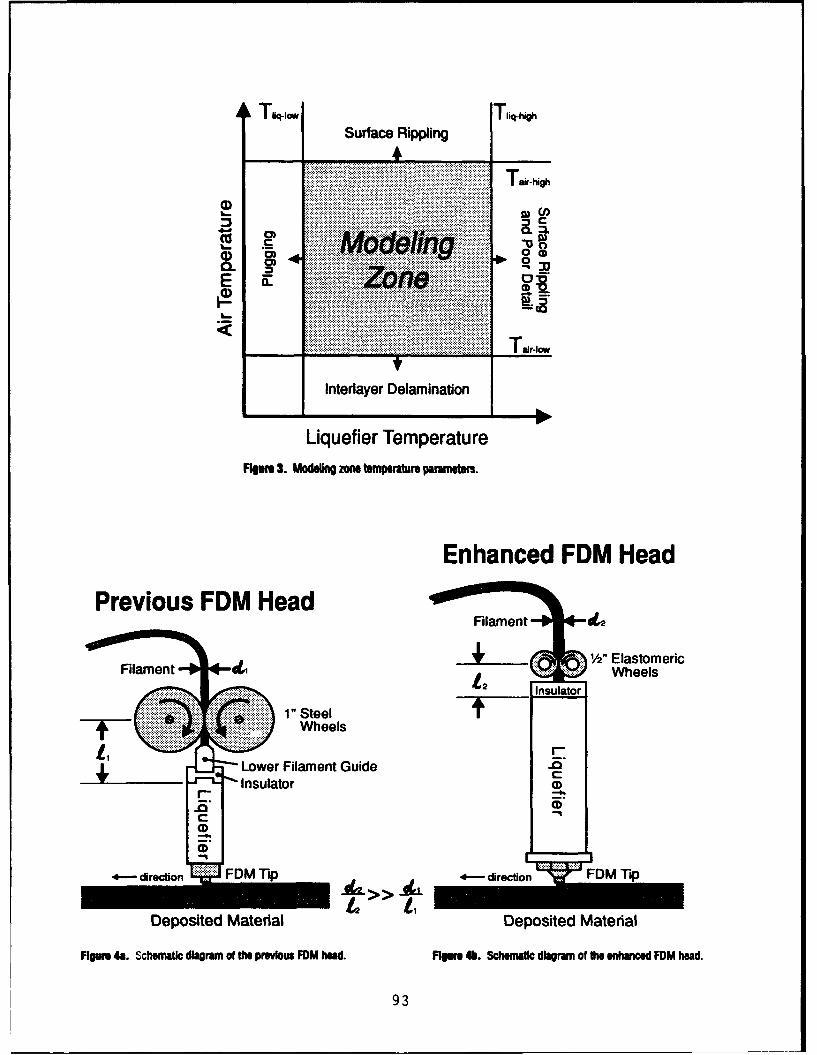
0 C
0)0
........ - ....
........ .T air-ow
Interlayer Delamination
Liquefier TemperatureFigure 3. Modeling zone temperature parameters.
Enhanced FDM HeadPrevious FDM Head
Filament 4
½/2 Elastomeric
FowrlilmeneGid
12 Whel
Depoite Maea eoitdMtraFigure~~~~~~~~. ...ceai..armo .tepeiu.. Mha.Fgue4.Shmai iga o t nace D ed
... .. ... 93
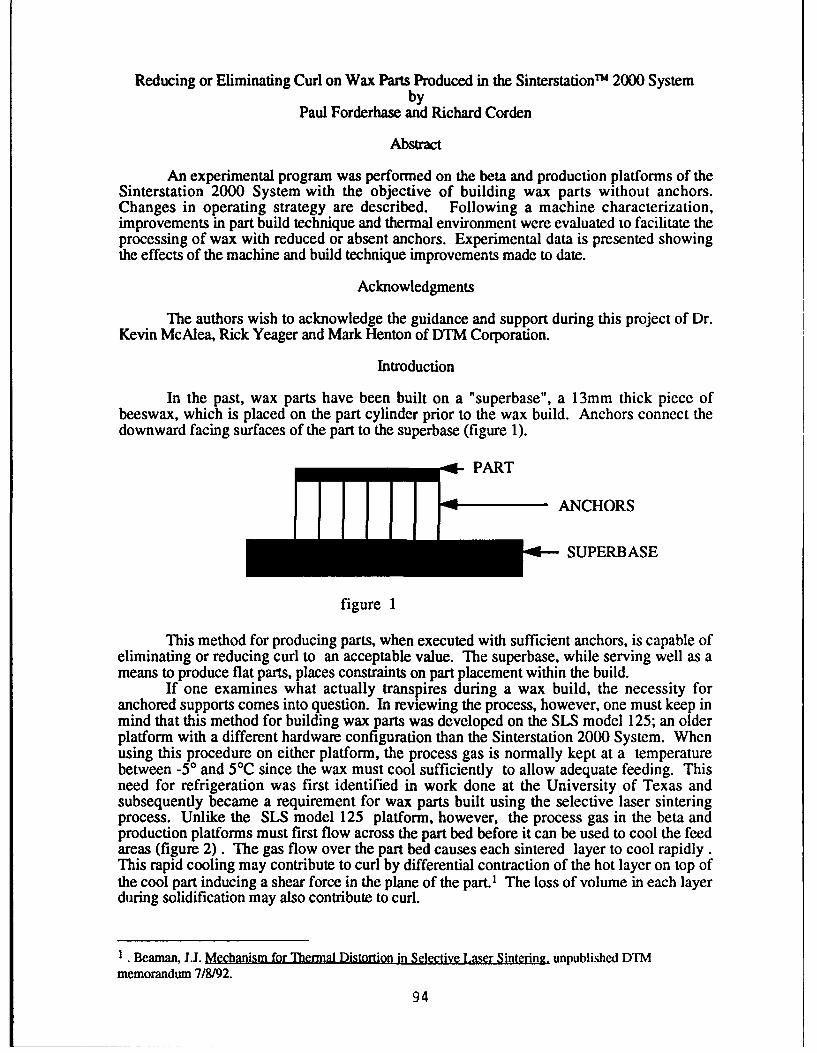
Reducing or Eliminating Curl on Wax Parts Produced in the SinterstationTm 2000 Systemby
Paul Forderhase and Richard Corden
Abstract
An experimental program was performed on the beta and production platforms of theSinterstation 2000 System with the objective of building wax parts without anchors.Changes in operating strategy are described. Following a machine characterization,improvements in part build technique and thermal environment were evaluated to facilitate theprocessing of wax with reduced or absent anchors. Experimental data is presented showingthe effects of the machine and build technique improvements made to date.
Acknowledgments
The authors wish to acknowledge the guidance and support during this project of Dr.Kevin McAlea, Rick Yeager and Mark Henton of DTM Corporation.
Introduction
In the past, wax parts have been built on a "superbase", a 13mm thick piece ofbeeswax, which is placed on the part cylinder prior to the wax build. Anchors connect thedownward facing surfaces of the part to the superbase (figure 1).
SPART
H h ANCHORS
Sn i SUPERBASE
figure 1
This method for producing parts, when executed with sufficient anchors, is capable ofeliminating or reducing curl to an acceptable value. The superbase, while serving well as ameans to produce flat parts, places constraints on part placement within the build.
If one examines what actually transpires during a wax build, the necessity foranchored supports comes into question. In reviewing the process, however, one must keep inmind that this method for building wax parts was developed on the SLS model 125; an olderplatform with a different hardware configuration than the Sinterstation 2000 System. Whenusing this procedure on either platform, the process gas is normally kept at a temperaturebetween -5' and 5*C since the wax must cool sufficiently to allow adequate feeding. Thisneed for refrigeration was first identified in work done at the University of Texas andsubsequently became a requirement for wax parts built using the selective laser sinteringprocess. Unlike the SLS model 125 platform, however, the process gas in the beta andproduction platforms must first flow across the part bed before it can be used to cool the feedareas (figure 2). The gas flow over the part bed causes each sintered layer to cool rapidly.This rapid cooling may contribute to curl by differential contraction of the hot layer on top ofthe cool part inducing a shear force in the plane of the part. 1 The loss of volume in each layerduring solidification may also contribute to curl.
I. Beaman, J.J. Mechanism for Thermal Distortion in Selective Laser Sinteriný. unpublished DTMmemorandum 7/8/92.
94
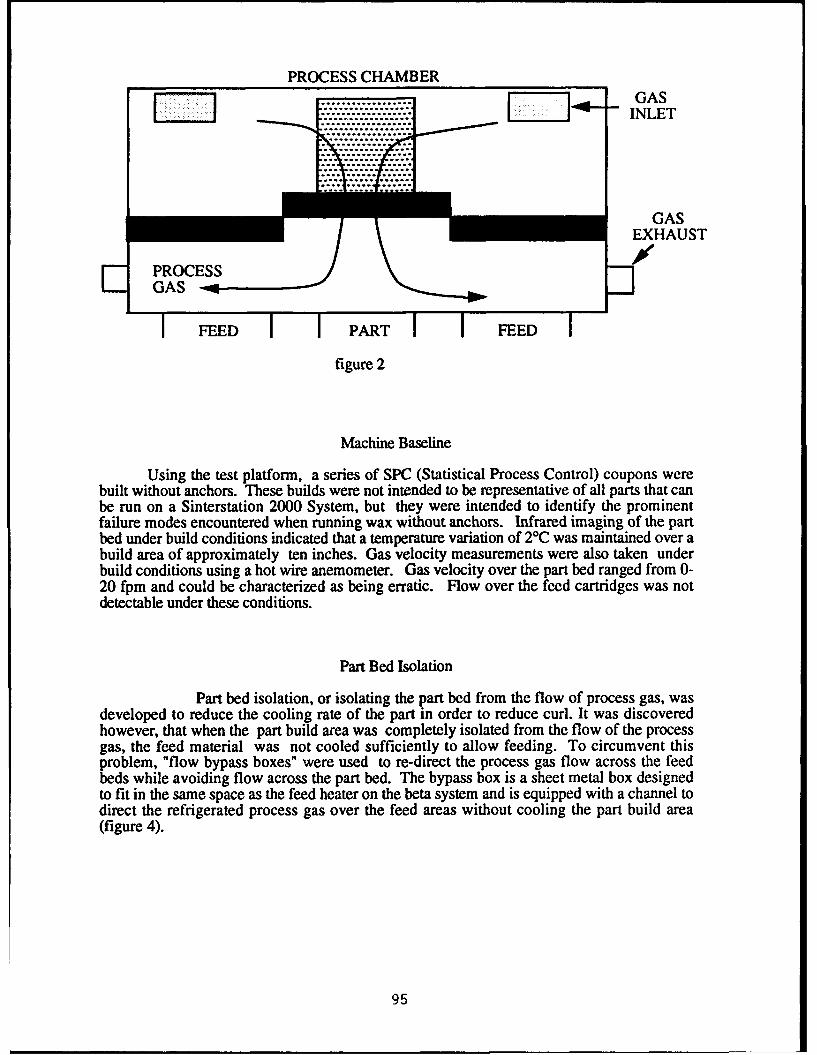
PROCESS CHAMBERmGAS
......... INLET
_=" figure 2
Machine Baseline
Using the test platform, a series of SPC (Statistical Process Control) coupons werebuilt without anchors. These builds were not intended to be representative of all parts that canbe run on a Sinterstation 2000 System, but they were intended to identify the prominentfailure modes encountered when running wax without anchors. Infrared imaging of the partbed under build conditions indicated that a temperature variation of 2°C was maintained over abuild area of approximately ten inches. Gas velocity measurements were also taken underbuild conditions using a hot wire anemometer. Gas velocity over the part bed ranged from 0-20 fpm and could be characterized as being erratic. Flow over the feed cartridges was notdetectable under these conditions.
Part Bed Isolation
Part bed isolation, or isolating the part bed from the flow of process gas, wasdeveloped to reduce the cooling rate of the part in order to reduce curl. It was discoveredhowever, that when the part build area was completely isolated from the flow of the processgas, the feed material was not cooled sufficiently to allow feeding. To circumvent thisproblem, "flow bypass boxes" were used to re-direct the process gas flow across the feedbeds while avoiding flow across the part bed. The bypass box is a sheet metal box designedto fit in the same space as the feed heater on the beta system and is equipped with a channel todirect the refrigerated process gas over the feed areas without cooling the part build area(figure 4).
95
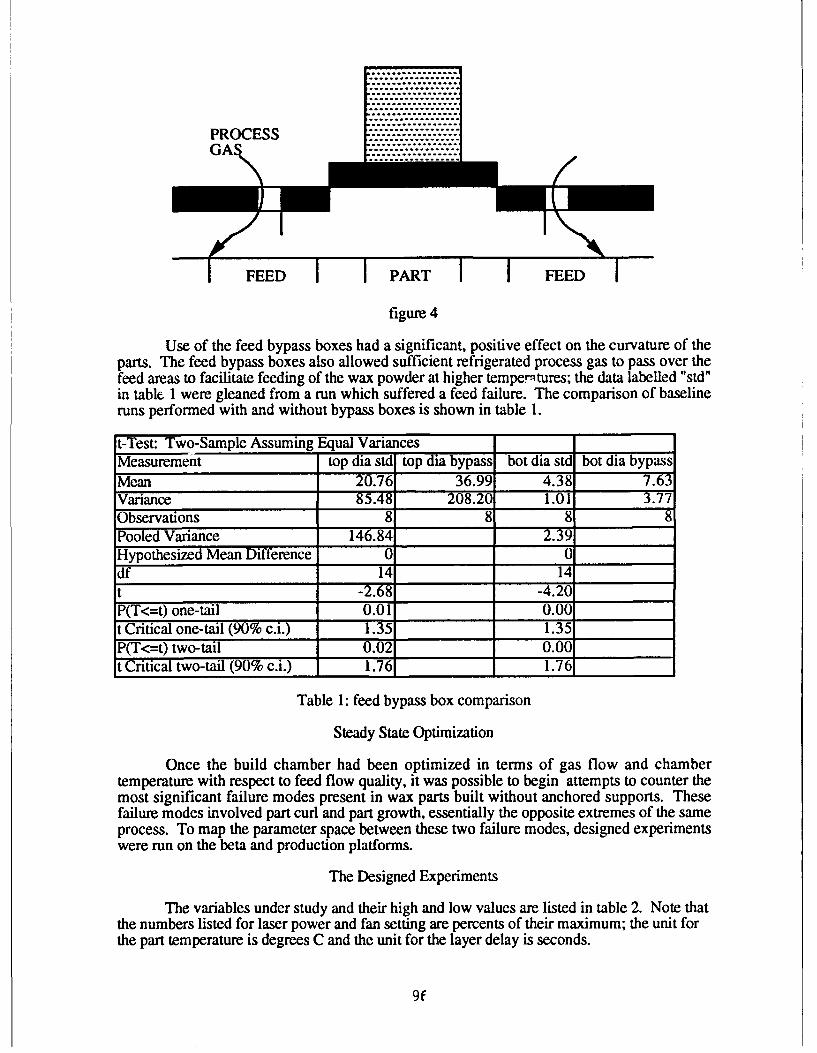
.------------.- -_
.°.°°.°°......°....
PROCESS -33333333".... :-... :...... -.....
figure 4
Use of the feed bypass boxes had a significant, positive effect on the curvature of theparts. The feed bypass boxes also allowed sufficient refrigerated process gas to pass over thefeed areas to facilitate feeding of the wax powder at higher temper~tures; the data labelled "std"in table. 1 were gleaned from a run which suffered a feed failure. The comparison of baselineruns performed with and without bypass boxes is shown in table 1.
t-Test: Two-Sample Assuming Equal VariancesMeasurement top dia std top dia bypass bt i~a std bot dia bypassMean 20.76__ 36.99 4.38 7.63Variance 85.48 20.2 1.01 3.77Observations 8 8 8 8Pooled Variance 146.84 _____ 2.39Hypothesized Mean Difference 0 ______0 _____
df 14 14 _____
t_____________ -2.68 _____ -4.20 _____
P(T<=t) one-tail 0.01_ ______ 0.00t Critical one-tail (90% c.i.) 1.35 ______1.35 _____
P(T<=t) two-tail 0.02 ______0.00 _____
t Critical two-tail (90% c.i.) 1.76 _______1.76 ______
Table 1: feed bypass box comparison
Steady State Optimization
Once the build chamber had been optimized in terms of gas flow and chambertemperature with respect to feed flow quality, it was possible to begin attempts to counter themost significant failure modes present in wax parts built without anchored supports. Thesefailure modes involved part curl and part growth, essentially the opposite extremes of the sameprocess. To map the parameter space between these two failure modes, designed experimentswere run on the beta and production platforms.
The Designed Experiments
The variables under study and their high and low values are listed in table 2. Note thatthe numbers listed for laser power and fan setting are percents of their maximum; the unit forthe part temperature is degrees C and the unit for the layer delay is seconds.
. 9t.. .. ... .
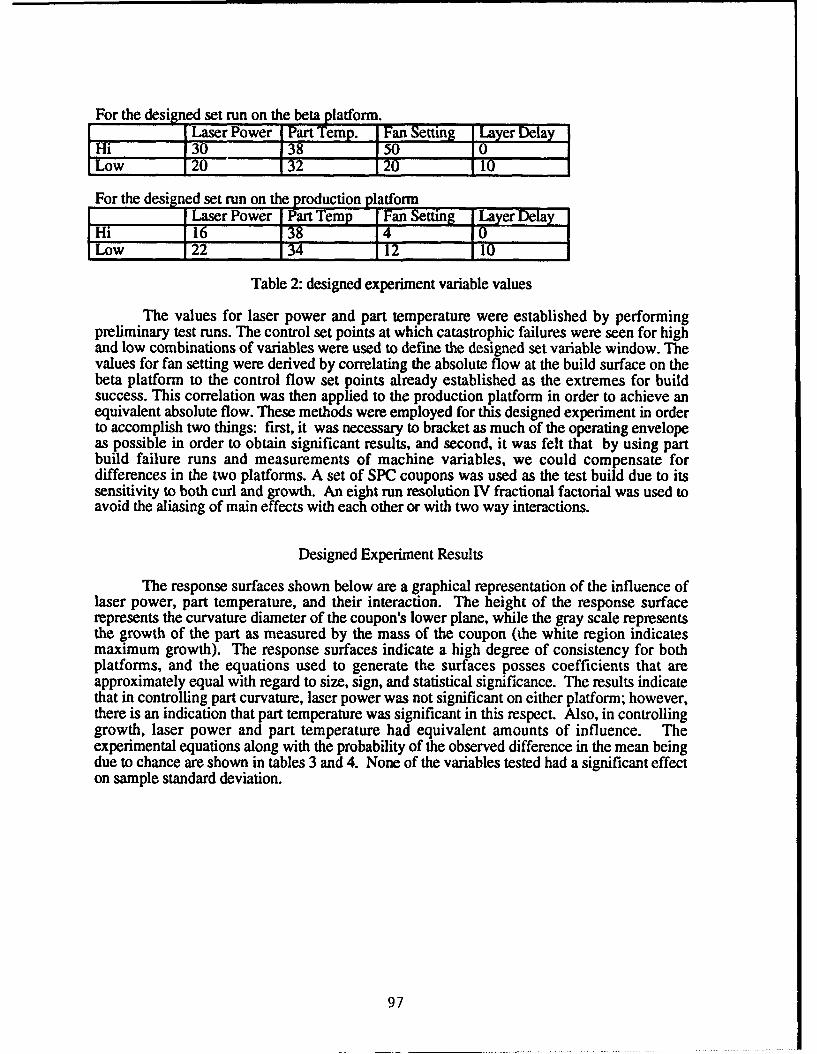
For the designed set run on the beta platform.I Laser Power Part Temp. Fan Setting Layer Delay
Hi 30 138 50 10Low 20 132 120
For the designed set run on theproduction platformI Laser Power I Part Temp Fan Setting Layer Delay
Hi 16 138 t 0Low 122 134 112 10
Table 2: designed experiment variable values
The values for laser power and part temperature were established by performingpreliminary test runs. The control set points at which catastrophic failures were seen for highand low combinations of variables were used to define the designed set variable window. Thevalues for fan setting were derived by correlating the absolute flow at the build surface on thebeta platform to the control flow set points already established as the extremes for buildsuccess. This correlation was then applied to the production platform in order to achieve anequivalent absolute flow. These methods were employed for this designed experiment in orderto accomplish two things: first, it was necessary to bracket as much of the operating envelopeas possible in order to obtain significant results, and second, it was felt that by using partbuild failure runs and measurements of machine variables, we could compensate fordifferences in the two platforms. A set of SPC coupons was used as the test build due to itssensitivity to both curl and growth. An eight run resolution IV fractional factorial was used toavoid the aliasing of main effects with each other or with two way interactions.
Designed Experiment Results
The response surfaces shown below are a graphical representation of the influence oflaser power, part temperature, and their interaction. The height of the response surfacerepresents the curvature diameter of the coupon's lower plane, while the gray scale representsthe growth of the part as measured by the mass of the coupon (the white region indicatesmaximum growth). The response surfaces indicate a high degree of consistency for bothplatforms, and the equations used to generate the surfaces posses coefficients that areapproximately equal with regard to size, sign, and statistical significance. The results indicatethat in controlling part curvature, laser power was not significant on either platform; however,there is an indication that part temperature was significant in this respect. Also, in controllinggrowth, laser power and part temperature had equivalent amounts of influence. Theexperimental equations along with the probability of the observed difference in the mean beingdue to chance are shown in tables 3 and 4. None of the variables tested had a significant effecton sample standard deviation.
97
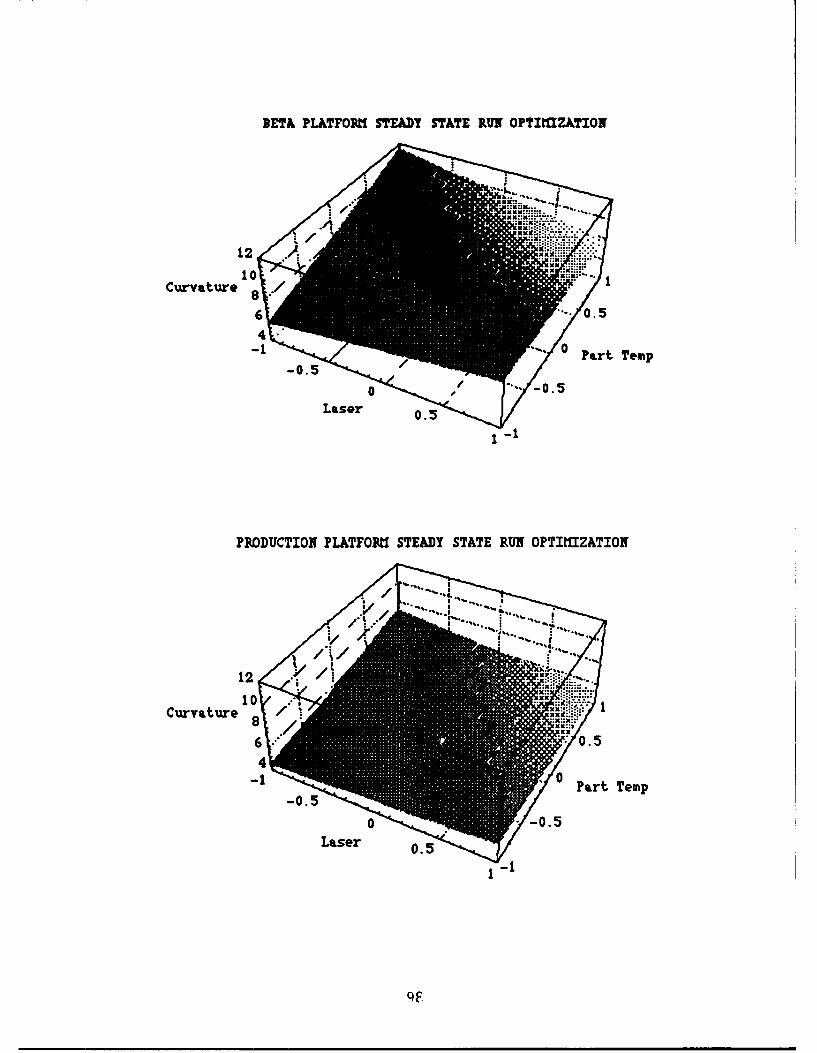
BETk PLA.TFOR11 STEADY STATE RUN OPTIMIIZATION
12
-1 -.5 0Part Temp
1
PRDUTIN LAFO41SEAY TAE UNOqIM O
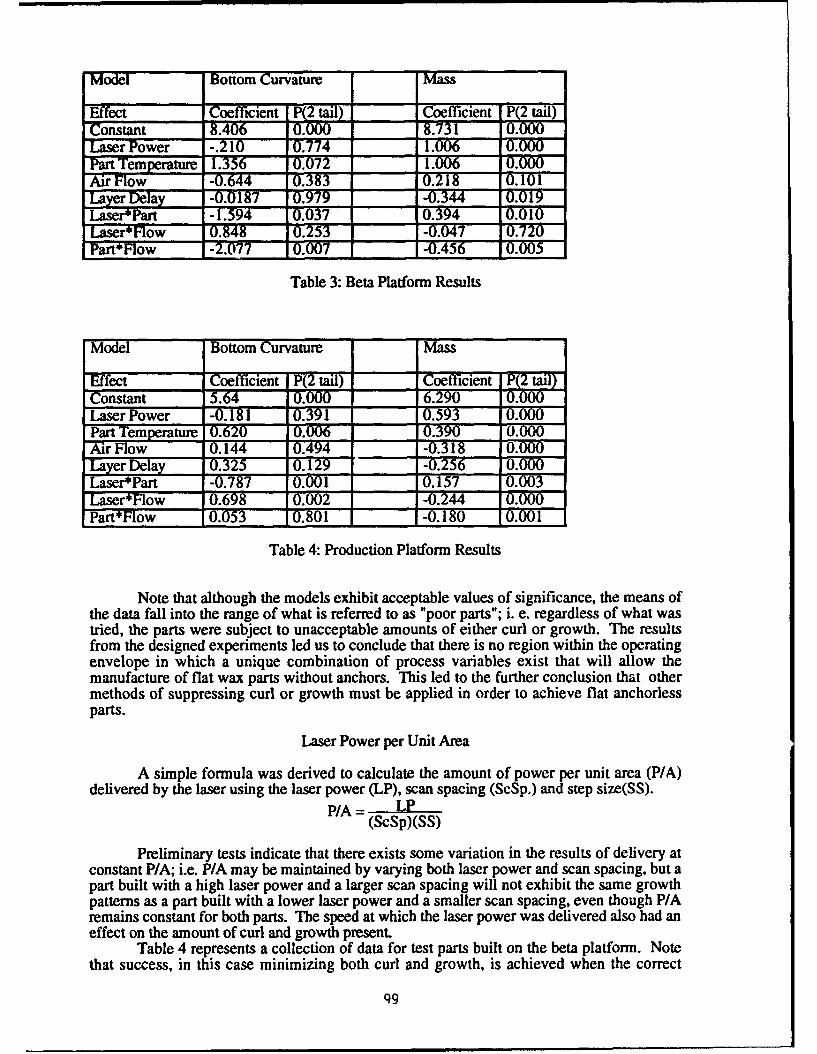
Model Bottom Curvature Mass
Effect Coefficient P(2 tail) Coefficient P(2 tail)Constant -. 0.0 731 0.7000Laser Power -.210 0.774 1.006 0.000Pan Temerrature 1.356 -7 T1 6 0.000AirFlow -0.644 0.218Layer Delay -0.0187 099-.44 0.9Laser*Part -1.594 0.037 10.394 0.01Laser* Flow 07498 - 15-0.047 0.720Part*Flow -2.077 0.1-0.456 0
Table 3: Beta Platform Results
Model Bottom Curvature Mass
Effect Coefficient PiCoefficient (tail)Constant 5.64 0.000 - .O90 00Laser Power -0.181 0.391 0.593 0.000Part Tempeýrature 10.620 0.07.30 0000Air Flow 0.144 -0.318 0.Layer Delay 0.325 .2 -0.256- 0.000Laser*Part -0.787 -00.157 0.03Laser*Flow 0.69 0 -0.244 -0.
Part*Flow 0.053 0.801 -0.180 0.001
Table 4: Production Platform Results
Note that although the models exhibit acceptable values of significance, the means ofthe data fall into the range of what is referred to as "poor parts"; i. e. regardless of what wastried, the parts were subject to unacceptable amounts of either curl or growth. The resultsfrom the designed experiments led us to conclude that there is no region within the operatingenvelope in which a unique combination of process variables exist that will allow themanufacture of flat wax parts without anchors. This led to the further conclusion that othermethods of suppressing curl or growth must be applied in order to achieve flat anchorlessparts.
Laser Power per Unit Area
A simple formula was derived to calculate the amount of power per unit area (P/A)delivered by the laser using the laser power (LP), scan spacing (ScSp.) and step size(SS).
P/A = LP(ScSp)(SS)
Preliminary tests indicate that there exists some variation in the results of delivery atconstant P/A; i.e. P/A may be maintained by varying both laser power and scan spacing, but apart built with a high laser power and a larger scan spacing will not exhibit the same growthpatterns as a part built with a lower laser power and a smaller scan spacing, even though P/Aremains constant for both parts. The speed at which the laser power was delivered also had aneffect on the amount of curl and growth present.
Table 4 represents a collection of data for test parts built on the beta platform. Notethat success, in this case minimizing both curl and growth, is achieved when the correct
q9
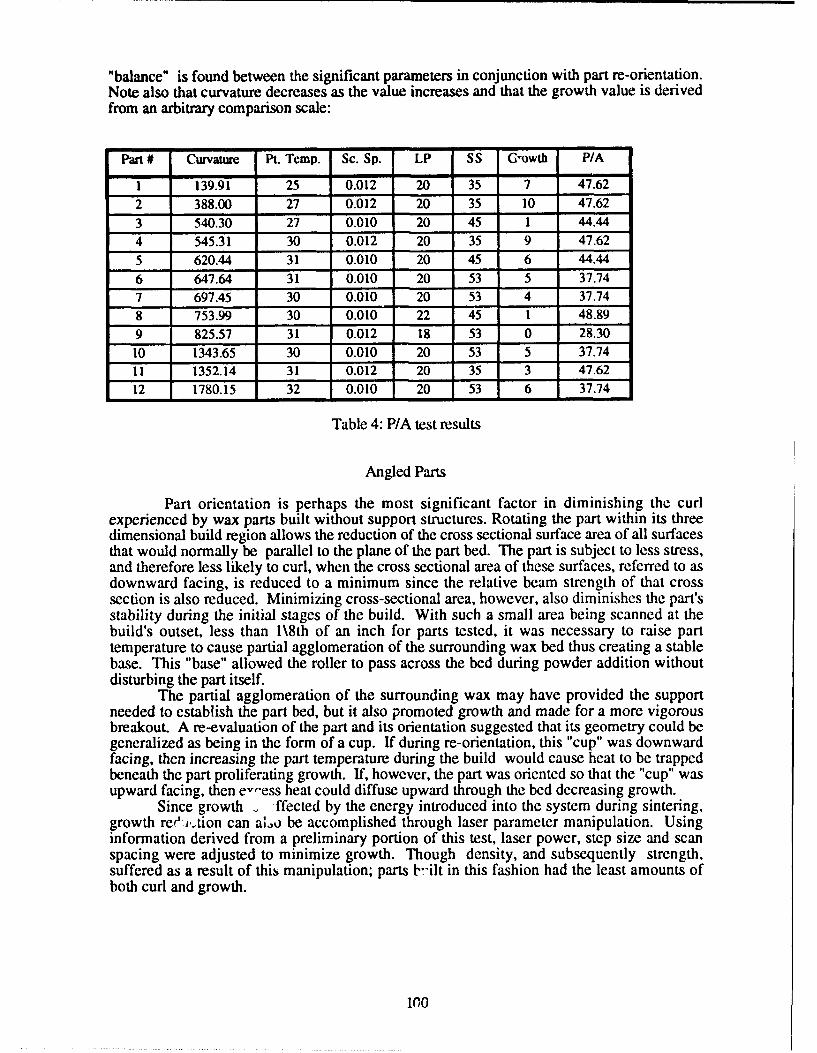
"balance" is found between the significant parameters in conjunction with part re-orientation.Note also that curvature decreases as the value increases and that the growth value is derivedfrom an arbitrary comparison scale:
Part # Curvature Pt. Temp. Sc. Sp. LP SS G-owth P/A
1 139.91 25 0.012 20 35 7 47.622 388.00 27 0.012 20 35 10 47.623 540.30 27 0.010 20 45 1 44.444 545.31 30 0.012 20 35 9 47.625 620.44 31 0.010 20 45 6 44.44
6 647.64 31 0.010 20 53 5 37.747 697.45 30 0.010 20 53 4 37.748 753.99 30 0.010 22 45 1 48.899 825.57 31 0.012 18 53 0 28.3010 1343.65 30 0.010 20 53 5 37.7411 1352.14 31 0.012 20 35 3 47.6212 1780.15 32 0.010 20 53 6 37.74
Table 4: P/A test results
Angled Parts
Part orientation is perhaps the most significant factor in diminishing the curlexperienced by wax parts built without support structures. Rotating the part within its threedimensional build region allows the reduction of the cross sectional surface area of all surfacesthat would normally be parallel to the plane of the part bed. The part is subject to less stress,and therefore less likely to curl, when the cross sectional area of these surfaces, referred to asdownward facing, is reduced to a minimum since the relative beam strength of that crosssection is also reduced. Minimizing cross-sectional area, however, also diminishes the part'sstability during the initial stages of the build. With such a small area being scanned at thebuild's outset, less than l\8th of an inch for parts tested, it was necessary to raise parttemperature to cause partial agglomeration of the surrounding wax bed thus creating a stablebase. This "base" allowed the roller to pass across the bed during powder addition withoutdisturbing the part itself.
The partial agglomeration of the surrounding wax may have provided the supportneeded to establish the part bed, but it also promoted growth and made for a more vigorousbreakout. A re-evaluation of the part and its orientation suggested that its geometry could begeneralized as being in the form of a cup. If during re-orientation, this "cup" was downwardfacing, then increasing the part temperature during the build would cause heat to be trappedbeneath the part proliferating growth. If, however, the part was oriented so that the "cup" wasupward facing, then e--ess heat could diffuse upward through the bed decreasing growth.
Since growth - ffected by the energy introduced into the system during sintering,growth ree'...tion can al.,o be accomplished through laser parameter manipulation. Usinginformation derived from a preliminary portion of this test, laser power, step size and scanspacing were adjusted to minimize growth. Though density, and subsequently strength,suffered as a result of this manipulation; parts b-ilt in this fashion had the least amounts ofboth curl and growth.
1'0
Anchor Design or "Surround Support"
Though this test did not follow the "unsupported wax" precept, it does improve uponcurrent methods for building wax parts. The part is "encased" in a box which actually servesas a support structure. The interior of this box is cross-hatched, as opposed to being filled, sothat it may be removed from the part after the build has completed. Since it is not required thatthis box be attached to the bees-wax superbase, parts may be initiated at any point in thecylinder. The initial work indicates that parts which are built without re-orientation still tend tobe subject to curl which suggests the need to redesign the box structure.
Conclusion
The ability to build sintered, wax parts without anchored supports to the standards ofquality demanded by post build applications is one that can significantly improve the viabilityand economics of the process. Once the restriction of "superbase attachment" has beenremoved, the potential for increased productivity becomes obvious. It also appears obviousfrom the results of various testing included in this paper that simply removing all supports andbalancing build parameters accordingly is not sufficient to produce quality parts. Variousamendments to the build procedure including: optimized laser parameters, angled builds and"surround support" offer the most promising potential in reducing the constraints currentlyassociated with wax builds.
101
Computer Aspects of Solid Freeform Fabrication:
Geometry, Process Control, and Design
Richard H. CrawfordDepartment of Mechanical Engineering
The University of Texas at Austin
Abstract
Solid Freeform Fabrication (SFF) is a class of manufacturing technologies aimed at theproduction of mechanical components without part-specific tooling or process planning. Originallyused for creating models for visualization, many industrial users of SFF technologies are realizingthe greater potential of SFF as legitimate manufacturing processes for producing patterns and, insome cases, functional parts. Thus, SFF is becoming an important aspect of the productrealization process in these industries.
Solid Freeform Fabrication arose from the dream of "push-button" prototyping, in whichsolid reproductions of three-dimensional geometric models are created automatically undercomputer control. Perhaps more than any other class of manufacturing technologies, computersoftware development has been an integral part of the emergence of SFF. As SFF technologiesevolve toward the ability to create functional parts, computer issues gain more importance.
This paper discusses three aspects of software design for SFF: processing of geometricdata, global and local control of SFF processes, and computer-based analysis and design for SFFmanufacturing. The discussion of geometric processing issues focuses on accuracy andcompleteness of input models, and the algorithms required to process such models. The interplaybetween the physics of SFF processing and the desired output geometry is discussed in terms ofthe development of model-based control algorithms for SFF. These two areas, geometricprocessing and control, are necessary for the practical implementation of any SFF technology.However, for SFF to realize its potential as an alternative for manufacturing functional parts,engineers must be provided with analysis and design tools for predicting mechanical properties,ensuring dimensional accuracy, choosing appropriate materials, selecting process parametervalues, etc. For each of these three different but related areas of software design, the state-of-the-art is assessed, contemporary research is summarized, and future needs are outlined.
Introduction
Solid Freeform Fabrication (SFF) is a group of emerging technologies for fabricatingphysical objects directly from computer-based descriptions (such as solid models) of the geometryof the parts. All SFF technologies are enabled by computer hardware and software, from the inputgeometric descriptions to control of the fabrication machinery. Clearly, the success of SFFdepends on the existence of sophisticated and cost-effective computing equipment and software.As the applications of SFF move beyond visualization models and design verification prototypesinto fabrication of functional components, SFF will change from rapid prototyping techniques intolegitimate manufacturing technologies. One key to this progress is improvement of the softwaresystems that enable advances in the capabilities of SFF. This paper describes potentialopportunities for improvement in SFF software in the areas of geometry processing, processmodeling and control, and design tools for SFF.
102
Geometry Processing
Most Solid Freeform Fabrication processes produce parts on a layer-by-layer basis. Theprocess proceeds by first slicing the geometric description of the part into layers. The slicingoperation generates the contours of the part for each layer. The contours are then processed in amanner dependent upon the particular SFF technology. For instance, for Selective Laser Sintering(SLS), the contours are discretized into "toggle points" at which the laser beam must be modulatedto produce the desired solid.
Faceted Geometry. The form of the geometric description of mechanical parts to beproduced by SLS significantly affects the accuracy of the final part. The current state-of-the-art formost SFF technologies consists of tessellating the surfaces of the geometric model into a mesh ofnon-overlapping triangular facets. The resulting geometry is transmitted in a standard file format,the so-called "STL" file format, established by 3D Systems, Inc. [1] This format has been adoptedby many CAD vendors, is readily available, and is considered adequate for most visualizationapplications. However, for producing accurate patterns and functional parts, the adequacy of theSTL format is unclear. There is a trade-off between the accuracy and the size of the geometricdescription. Highly non-linear surfaces, such as those that comprise turbine blades, manifolds,etc., must be tessellated into a large number of small facets, resulting in very large data files, andthe accuracy of such descriptions is still suspect.
In many cases, the tessellation operation itself introduces errors in the model. Tessellationof surfaces with large curvature can result in errors at the intersections between such surfaces (seeFigure 1), leaving gaps or "holes" along edges of the part model [4]. Tessellation of fine featuresis susceptible to round-off error, which leads to non-manifold models of parts, where more thantwo facets are adjacent to a single edge, or facets with opposing outer normals meet at a singlevertex (see Figure 2). These problems are difficult for slicing algorithms to handle and causefabrication problems for SFF processes, which require valid solids as input.
Algorithms to overcome these problems with faceted geometric descriptions depend ondeveloping richer data structures that explicitly represent the facet and edge adjacencies that areimplicit in the STL format. This information enables the development of efficient slicingalgorithms that take advantage of the explicit adjacency information when constructing slicecontours [5, 11, 121. Rock and Wozny [10] have also proposed an alternative to the STL fileformat that captures the adjacency information in the exchange file. Bohn and Wozny [4] havedeveloped a method to repair faceted geometric descriptions with problems such as that depicted inFigure 1. Their technique uses the adjacency information to locate gaps between facets. They thenuse a "shell-closure" algorithm to add missing facets to the close gaps.
Higher Order Geometric Descriptions. The problems with the STL geometryexchange format arise because tessellation is a first-order approximation of more complexgeometric entities. An obvious solution to these problems is to exchange higher order geometricentities, preferably the source geometry with which a part is designed. This approach has beenadopted at The University of Texas, where an interface based on Constructive Solid Geometry(CSG) has been developed to provide input to SFF processes [7]. With CSG the geometry of apart is modeled as a binary tree whose leaf nodes are scaled and oriented instances of primitiveshapes (e.g., spheres, cylinders, parallelepipeds, etc.) and whose non-terminal nodes are theregularized Boolean set operations union (u), intersection (rn), and difference (-). Evaluating theCSG tree with a geometric modeler results in an explicit boundary representation of the part'ssurfaces.
102
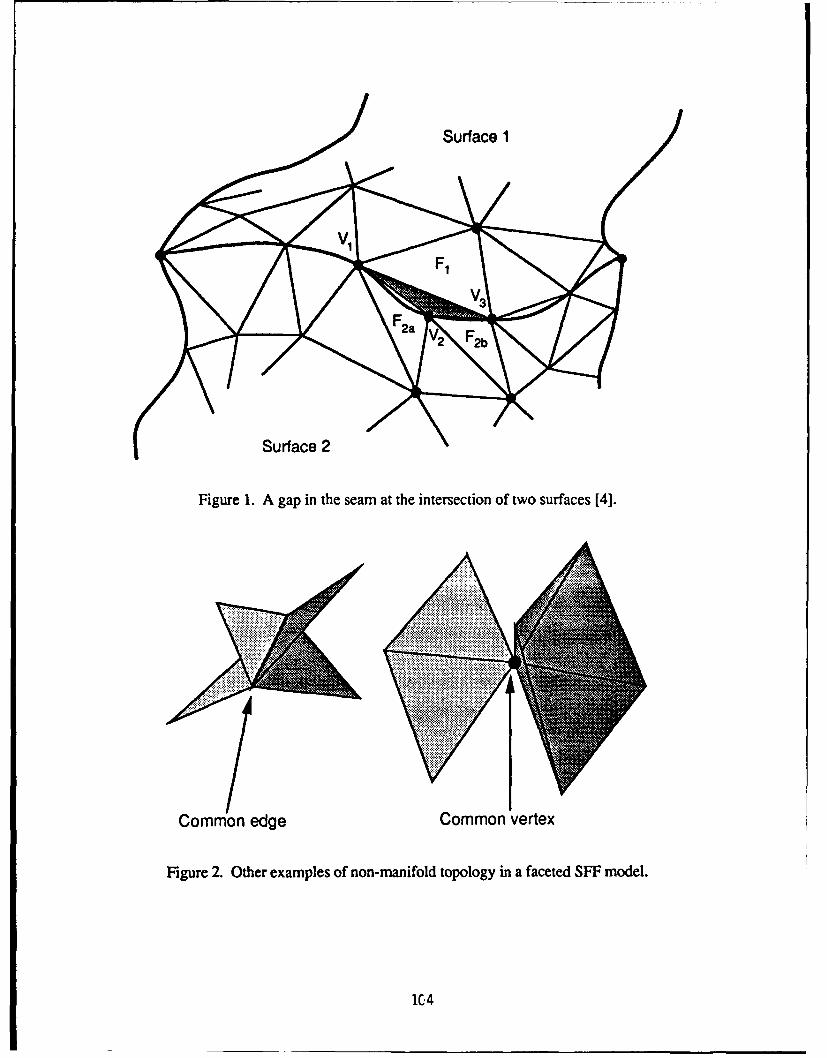
Surface 1
i Surface 2
Figure 1. A gap in the seam at the intersection of two surfaces [4].
Common edge Common vertex
Figure 2. Other examples of non-manifold topology in a faceted SFF model.
1C4
Normal evaluation of a CSG tree involves computing the intersection between pairs ofprimitive or intermediate surfaces and performing set classification in three dimensions. The UTprocess is based on evaluation of sliced primitives rather than 3-D primitives. In this process theprimitives in the CSG tree are sliced individually, generating a slice for each primitive. The partcontour in the slice plane is then produced by combining the primitive slices based on the Booleanoperations at the non-terminal nodes (see Figure 3). The contour of the part in a given slice planeis a collection of piecewise ccntinuous curves. These curves are then scan-converted to producetoggle points.
The net result of this work is a boundary evaluator developed specifically for SFFapplications. The approach provides a more accurate, compact part description. Also, all surface-surface intersections are performed in the 2D slice plane, resulting in considerably simpler andmore robust algorithms. For the common quadric surfaces (spheres, cones, cylinders, andellipsoids), the surface-surface intersection calculations are exact (subject to round-off errors). Forhigher order surfaces, such as the torus, the method requires an approximation of the slice contourof the primitive. Such an approximation is still more accurate and efficient that the linearapproximations obtained from a faceted model. In fact, the method provides a rational basis forapproximating the geometry, since it is based on error measures in the slice plane. Details of thealgorithm are included in [7].
Processing higher order geometry for SFF processes offers several advantages overexchange of faceted geometric descriptions. Generally speaking, files containing higher orderinformation will be smaller and more accurate than comparable faceted geometry files. Also, manyof the problems that result in non-manifold geometric information in faceted descriptions can beavoided. For example, because the CSG slicer described above performs the geometric modelingoperations, no explicit boundary information is needed in the input file. Instead, it is incumbentupon the SFF geometry processor to ensure that the results are realizable for the particular SFFtechnology that is used to fabricate the part. Potential problems in the slicing operation can besolved because more information is available about the intended geometry of the part; thus, higherorder descriptions are easier to troubleshoot when necessary. Finally, when approximations arenecessary for the given input geometry, the approximation process is driven by the particular SFFtechnology rather than by generic criteria meant to satisfy the requirements of many SFFtechnologies. This provides a rational basis for approximating the geometry when necessary.
There are disadvantages to higher order geometric data exchange as well. First, there is nosingle geometry form that is satisfactory for all applications. There are many different geometricdescriptions that are used in product design, each with different requirements for a slicingalgorithm. Designers of commercial SFF processing software will have to make compromisedecisions about which geometric forms to support or risk losing potential customers from lack ofgeometric coverage. Also, because the geometric input is more complex, algorithms forprocessing the geometry are more complex as well. Finally, interchange standards must bedeveloped for higher order geometric descriptions. While these standards are under development,they are still subject to change until agreed upon.
Sources of Layered Geometry. Many potential applications of SFF naturally providedata in layer-based formats. For example, Rogers et al. [13] report the use of a laser digitizer toprovide data for the fabrication of prosthetic devices using Selective Laser Sintering. Levy et al.[8] used Computed Tomography (CT) data to produce models of human temporal bones usingSLS. Bartels et al. [2] used imaging data from a confocal microscope as input to an SLS machineto create models of pollen grains. These are just three examples of the potential applications forSFF in areas other than product engineering. In each of these cases the data was presented to theSFF machine as layers.
105
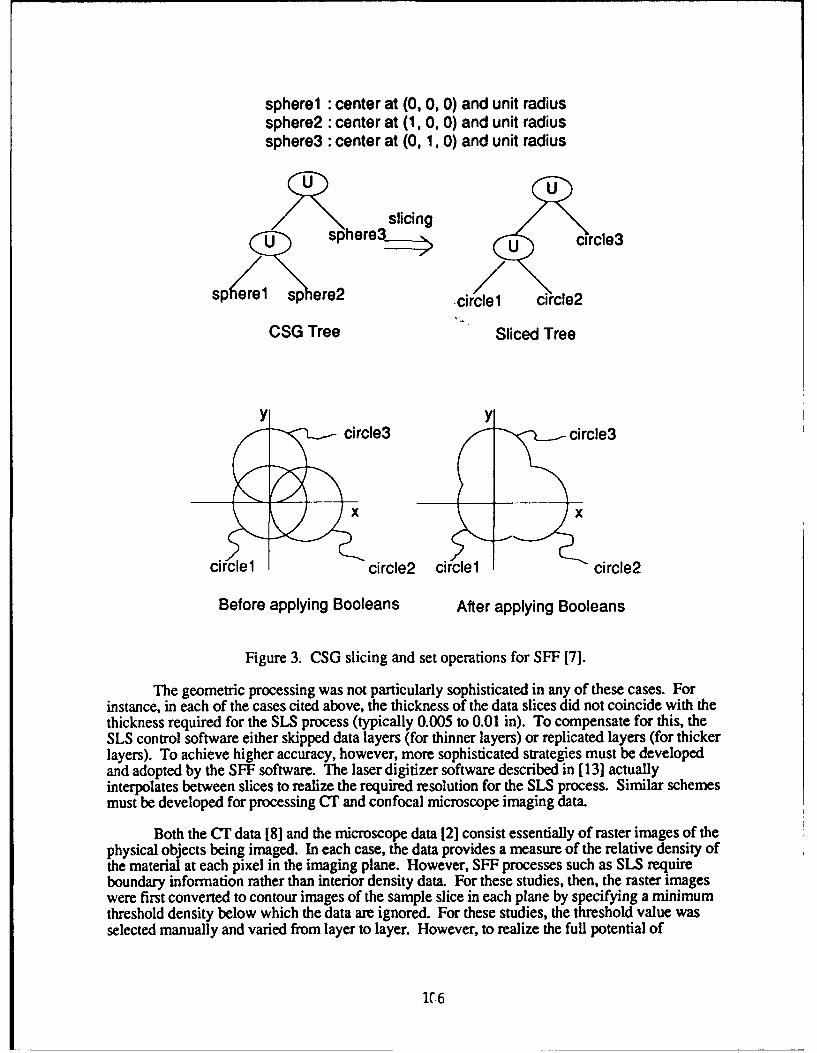
sphere1 : center at (0, 0, 0) and unit radiussphere2 : center at (1, 0, 0) and unit radiussphere3 : center at (0, 1, 0) and unit radius
U U
slicingu• sphere3_ ._ U ccle3
sp erel sp ere2 circiel circle2
CSG Tree Sliced Tree
ycircle3 cce
circiel circle2 circiel circle2
Before applying Booleans After applying Booleans
Figure 3. CSG slicing and set operations for SFF [7].
The geometric processing was not particularly sophisticated in any of these cases. Forinstance, in each of the cases cited above, the thickness of the data slices did not coincide with thethickness required for the SLS process (typically 0.005 to 0.01 in). To compensate for this, theSLS control software either skipped data layers (for thinner layers) or replicated layers (for thickerlayers). To achieve higher accuracy, however, more sophisticated strategies must be developedand adopted by the SFF software. The laser digitizer software described in [13] actuallyinterpolates between slices to realize the required resolution for the SLS process. Similar schemesmust be developed for processing CT and confocal microscope imaging data.
Both the CT data [8] and the microscope data [2] consist essentially of raster images of thephysical objects being imaged. In each case, the data provides a measure of the relative density ofthe material at each pixel in the imaging plane. However, SFF processes such as SLS requireboundary information rather than interior density data. For these studies, then, the raster imageswere first converted to contour images of the sample slice in each plane by specifying a minimumthreshold density below which the data are ignored. For these studies, the threshold value wasselected manually and varied from layer to layer. However, to realize the full potential of
1(C6
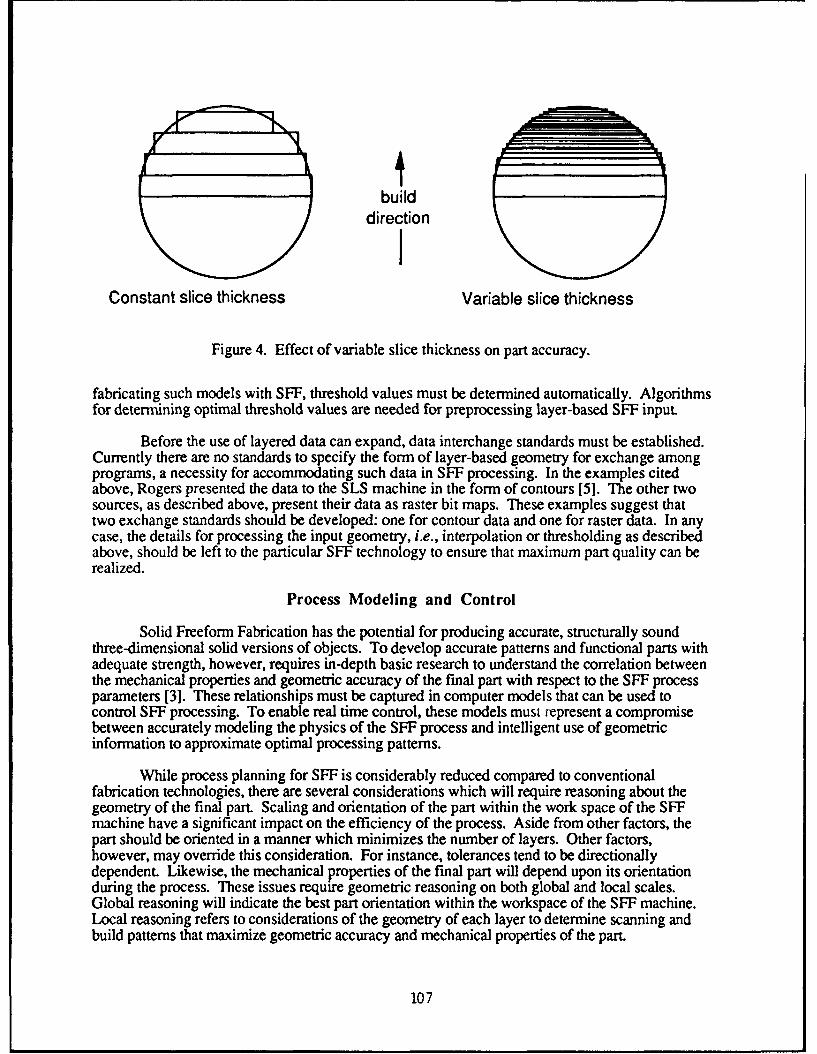
builddirection
Constant slice thickness Variable slice thickness
Figure 4. Effect of variable slice thickness on part accuracy.
fabricating such models with SFF, threshold values must be determined automatically. Algorithmsfor determining optimal threshold values are needed for preprocessing layer-based SFF input
Before the use of layered data can expand, data interchange standards must be established.Currently there are no standards to specify the form of layer-based geometry for exchange amongprograms, a necessity for accommodating such data in SFF processing. In the examples citedabove, Rogers presented the data to the SLS machine in the form of contours [5]. The other twosources, as described above, present their data as raster bit maps. These examples suggest thattwo exchange standards should be developed: one for contour data and one for raster data. In anycase, the details for processing the input geometry, i.e., interpolation or thresholding as describedabove, should be left to the particular SFF technology to ensure that maximum part quality can berealized.
Process Modeling and Control
Solid Freeform Fabrication has the potential for producing accurate, structurally soundthree-dimensional solid versions of objects. To develop accurate patterns and functional parts withadequate strength, however, requires in-depth basic research to understand the correlation betweenthe mechanical properties and geometric accuracy of the final part with respect to the SFF processparameters [3]. These relationships must be captured in computer models that can be used tocontrol SFF processing. To enable real time control, these models must represent a compromisebetween accurately modeling the physics of the SFF process and intelligent use of geometricinformation to approximate optimal processing patterns.
While process planning for SFF is considerably reduced compared to conventionalfabrication technologies, there are several considerations which will require reasoning about thegeometry of the final part. Scaling and orientation of the part within the work space of the SFFmachine have a significant impact on the efficiency of the process. Aside from other factors, thepart should be oriented in a manner which minimizes the number of layers. Other factors,however, may override this consideration. For instance, tolerances tend to be directionallydependent. Likewise, the mechanical properties of the final part will depend upon its orientationduring the process. These issues require geometric reasoning on both global and local scales.Global reasoning will indicate the best part orientation within the workspace of the SFF machine.Local reasoning refers to considerations of the geometry of each layer to determine scanning andbuild patterns that maximize geometric accuracy and mechanical properties of the part.
107
Scanning patterns. Many SFF processes build each layer of a part by raster scanningthe powder bed along a single axis, as indicated in Figure 5. For geometries such as this, aunidirectional scanning pattern will result in a large number of very short scanning vectors. Amutidirectional scanning pattern, such as that indicated on the right in Figure 5, will result in asmaller number of longer scanning vectors. Longer vectors reduce the errors associated with lasertoggling transients and repositioning of the laser beam, resulting in higher part accuracy. Thefigure implies that preferred scanning patterns are the result of geometry alone; however, otherfactors may outweigh geometry. For instance, mechanical properties within a layer may bedependent upon the scanning direction; heat transfer considerations and the creation of thermalgradients may indicate preferred scanning patterns; contour scanning of the layer boundaries mayreduce aliasing artifacts and result in better surface quality. These considerations must beincorporated into algorithms for determining arbitrary scanning patterns for SFF processes.
Contour Scanning. Recent research at UT Austin has focused on developing an optimallaser control system for scanning along curves [15]. The scanning algorithm and associatedhardware maintain constant laser power density by simultaneously controlling laser speed and laserpower. The goal is to produce parts with better surface resolution than can be obtained from vectorscanning the part contour (see Figure 6). This research emphasizes the need for higher levelgeometric descriptions for SFF process. The algorithm uses information about the the curvature ofthe contour to determine appropriate laser parameters to achieve the desired power density. Apolygonal approximation of the contour, such as that obtained from slicing a faceted part model, isnot accurate enough to support this control scheme.
Process Modeling. Advances in control of SFF processes will depend on developing abetter understanding of the physics of each process. For example, the process control program forSLS administers three areas: laser control, control of powder delivery and leveling, and control ofthe environment within the machine. Input to the module consists of a suitable geometricdescription of the part layers (at this time, scan lines and laser toggle points) and settings forprocess parameters, including material properties, bed temperature, gas flow rate, scanning speed,laser power, beam diameter, and scan spacing. The current SLS process control software is builtunder the assumption that these parameters will be constant for an entire part. However, initialinvestigations indicate that fabrication of metal parts will require local control of laser beamparameters, allowing these parameters to change from layer to layer or even within different areasin a given layer. Such physically-based scanning is depicted conceptually in Figure 7, where a partlayer has been divided into several regions based on part quality predictions from a physical modelof the process. A scanning pattern is then generated for each of the simple regions, again based onpredictions from a process model. Such a scanning scheme could be precomputed off-line beforethe part is fabricated, or it may updated on a layer-by-layer basis, with input about the status ofprevious layers from sensors. The key to solving this problem is development of physical modelsof the process. While initial models of the SLS process have been developed [9, 14], they are notstructured to support real-time process control of this kind. The solution to this problem will likelyrequire a combination of hardware and software development.
Y(~8
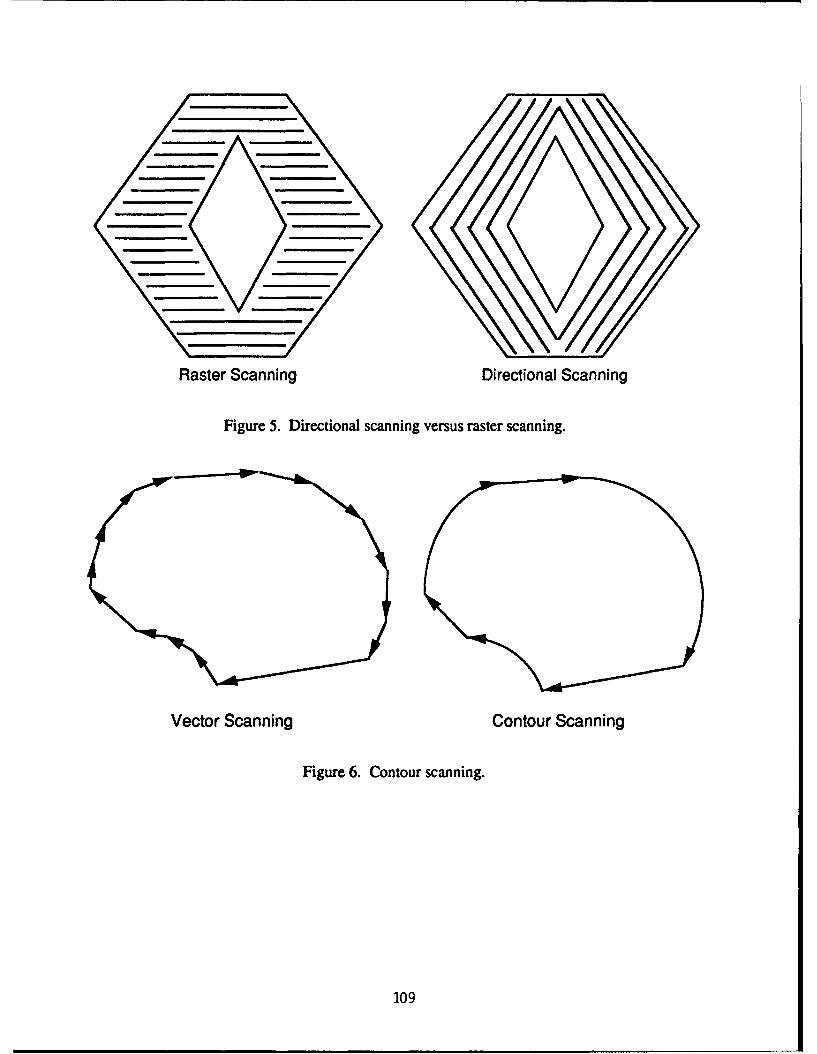
Raster Scanning Directional Scanning
Figure 5. Directional scanning versus raster scanning.
Vector Scanning Contour Scanning
Figure 6. Contour scanning.
109
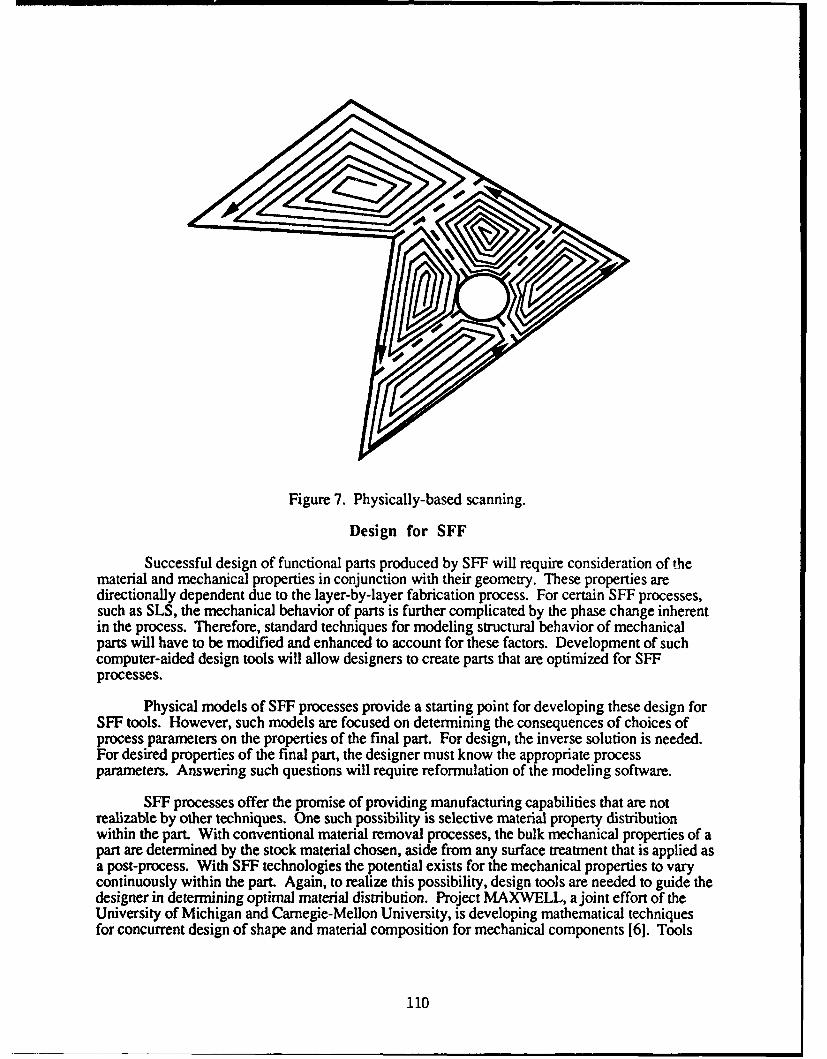
Figure 7. Physically-based scanning.
Design for SFF
Successful design of functional parts produced by SFF will require consideration of thematerial and mechanical properties in conjunction with their geometry. These properties aredirectionally dependent due to the layer-by-layer fabrication process. For certain SFF processes,such as SLS, the mechanical behavior of parts is further complicated by the phase change inherentin the process. Therefore, standard techniques for modeling structural behavior of mechanicalparts will have to be modified and enhanced to account for these factors. Development of suchcomputer-aided design tools will allow designers to create parts that are optimized for SFFprocesses.
Physical models of SFF processes provide a starting point for developing these design forSFF tools. However, such models are focused on determining the consequences of choices ofprocess parameters on the properties of the final part. For design, the inverse solution is needed.For desired properties of the final part, the designer must know the appropriate processparameters. Answering such questions will require reformulation of the modeling software.
SFF processes offer the promise of providing manufacturing capabilities that are notrealizable by other techniques. One such possibility is selective material property distributionwithin the part. With conventional material removal processes, the bulk mechanical properties of apart are determined by the stock material chosen, aside from any surface treatment that is applied asa post-process. With SFF technologies the potential exists for the mechanical properties to varycontinuously within the part. Again, to realize this possibility, design tools are needed to guide thedesigner in determining optimal material distribution. Project MAXWELL, a joint effort of theUniversity of Michigan and Carnegie-Mellon University, is developing mathematical techniquesfor concurrent design of shape and material composition for mechanical components [6]. Tools
110
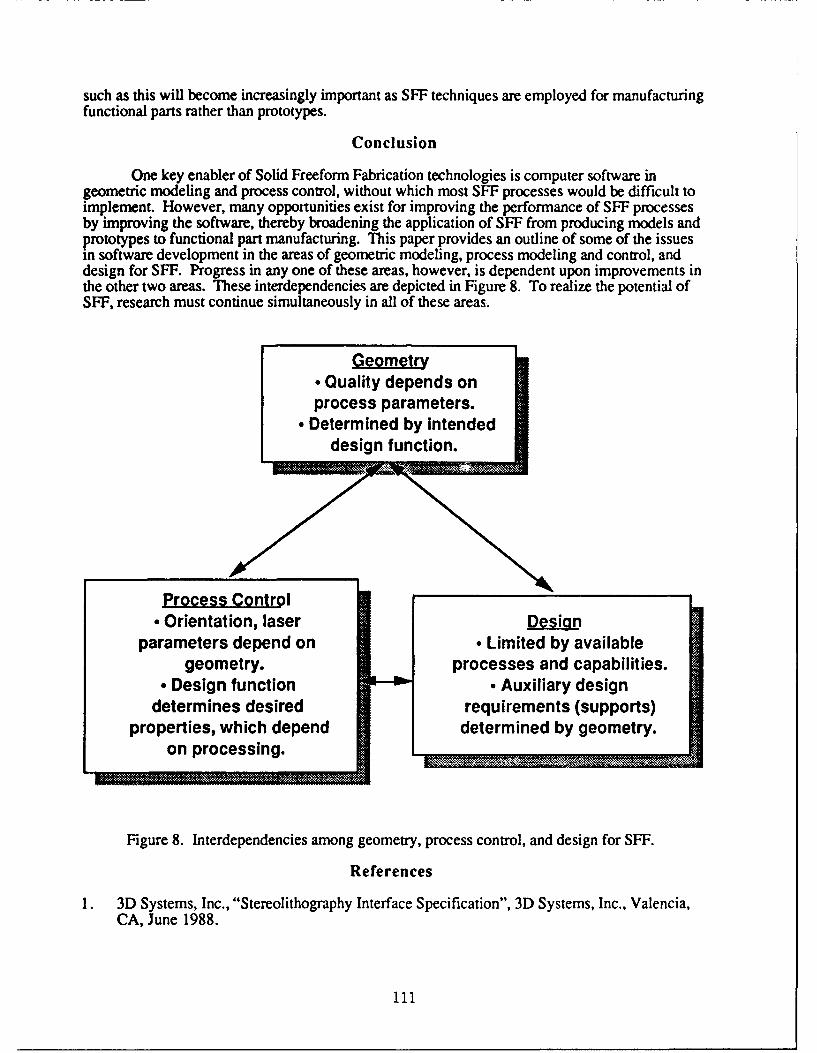
such as this will become increasingly important as SFF techniques are employed for manufacturing
functional parts rather than prototypes.
Conclusion
One key enabler of Solid Freeform Fabrication technologies is computer software ingeometric modeling and process control, without which most SFF processes would be difficult toimplement. However, many opportunities exist for improving the performance of SFF processesby improving the software, thereby broadening the application of SFF from producing models andprototypes to functional part manufacturing. This paper provides an outline of some of the issuesin software development in the areas of geometric modeling, process modeling and control, anddesign for SFF. Progress in any one of these areas, however, is dependent upon improvements inthe other two areas. These interdependencies are depicted in Figure 8. To realize the potential ofSFF, research must continue simultaneously in all of these areas.
Geometr
Quality depends onprocess parameters.Determined by intended
design function.
Process Control
• Orientation, laser Desigparameters depend on • Limited by available
geometry. processes and capabilities.* Design function • Auxiliary design
determines desired requirements (supports)properties, which depend determined by geometry.
on processing.
Figure 8. Interdependencies among geometry, process control, and design for SFF.
References
1. 3D Systems, Inc., "Stereolithography Interface Specification", 3D Systems, Inc., Valencia,CA, June 1988.
111
2. Bartels, K. A., Crawford, R. H., Das, S., Guduri, S., Bovik, A. C., Diller, K. R., andAggarwal, S. J., "Fabrication of Macroscopic Solid Models of Three-DimensionalMicroscopic Data by Selective Laser Sintering", Journal of Microscopy, Volume 169, No. 3,pp. 383-389.
3. Beaman, J. J., "Machine Issues Associated with Solid Freeform Fabrication", SolidFreeform Fabrication Proceedings 1992, Austin, TX, August 3-5, 1992, pp. 309-330.
4. Bohn, J. H. and Wozny, M. J., "Automatic CAD-Model Repair:. Shell-Closure", SolidFreeform Fabrication Proceedings 1992, Austin, TX, August 3-5, 1992, pp. 86-94.
5. Crawford, R. H., Das, S., and Beaman, J. J., "Software Testbed for Selective LaserSintering", Solid Freeform Fabrication Proceedings 1991, Austin, TX, August 12-14, 1991,pp. 21-27.
6. Dutta, D., Kikuchi, N., Papalambros, P., Prinz, F., and Weiss, L., "Project MAXWELL:Towards Rapid Realization of Superior Products", Solid Freeform Fabrication Proceedings1992, Austin, TX, August 3-5, 1992, pp. 54-62.
7. Guduri, S., Crawford, R. H., and Beaman, J. J., "A Method to Generate Exact ContourFiles for Solid Freeform Fabrication", Solid Freeform Fabrication Proceedings 1992, Austin,TX, August 3-5, 1992, pp. 95-101.
8. Levy, R. A., Guduri, S., and Crawford, R. H., "Preliminary Experience with SelectiveLaser Sintigraphic (SLS) Models of the Human Temporal Bone", Solid Freeform FabricationProceedings 1992, Austin, TX, August 3-5, 1992, pp. 161-173.
9. Nelson, J. C. and Barlow, J. W., "Relating Operating Parameters Between SLS MachinesWhich Have Different Scanner Geometries and Laser Spot Sizes", Solid FreeformFabrication Proceedings 1992, Austin, TX, August 3-5, 1992, pp. 228-236.
10. Rock, S. J. and Wozny, M. J., "A Flexible File Format for Solid Freeform Fabrication",Solid Freeform Fabrication Proceedings 1991, Austin, TX, August 12-14, 1991, pp. 1-12.
11. Rock, S. J. and Wozny, M. J., "Utilizing Topological Information to Increase Scan VectorGeneration Efficiency", Solid Freeform Fabrication Proceedings 1991, Austin, TX, August12-14, 1991, pp. 28-36.
12. Rock, S. J. and Wozny, M. J., "Generating Topological Information from a 'Bucket ofFacets"', Solid Freeform Fabrication Proceedings 1992, Austin, TX, August 3-5, 1992, pp.251-259.
13. Rogers, W. E., Crawford, R. H., Beaman, J. J., and Walsh, N. E., "Fabrication ofProsthetic Sockets by Selective Laser Sintering", Solid Freeform Fabrication Proceedings1991, Austin, TX, August 12-14, 1991, pp. 158-163.
14. Sun, M. M. and Beaman, J. J., "A Three Dimensional Model for Selective Laser Sintering",Solid Freeform Fabrication Proceedings 1991, Austin, TX, August 12-14, 1991, pp. 102-109.
15. Wu, Y-J. E. and Beaman, J. J., "Laser Tracking Control Implementation for SFFApplications", Solid Freeform Fabrication Proceedings 1992, Austin, TX, August 3-5,1992, pp. 161-173.
112
VIRTUAL REALITY AND RAPID PROTOTYPING:CONFLICTING OR COMPLIMENTARY!
I.Gibson, D.Brown, S.Cobb, R.EastgateDept. Manufacturing Engineering & Operations Management
University of NottinghamNottingham, UK
Abstract
It is likely that the uses tor virtual reality (VR) will coincide with applications thatrapid prototyping systems have already been used for. VR, with the ability to model reallife environments, presents an ideal base for the design and development of newmanufactured products. As a method of producing physical models directly from 3D CADsystems, rapid prototyping technology has also been used to visualise new product designs.This paper attempts to determine whether the two technologies are a means to the sameend or whether they combine to form a more efficient route to product development.
Virtual Reality Systems
A virtual reality system provides a platform for computer generated images tointeract with the user. As the user reacts to these images, requiring to change the scenein some way, so the computer complies. The images, along with other possible externalstimuli show objects that combine together to form virtual worlds. Perhaps the bestdefinition offered yet on the exact nature of VR comes from Zelter [1]. A virtual realityinterface system must offer a degree of 3 key components:-
- Autonomy: objects must react to external stimuli, have collision boundaries andexhibit real world effects (e.g., coefficients of restitution, gravity, and friction).- Interaction: one must be able to manipulate the parameters of each object inreal time.- Presence: a crude measure of the fidelity of the viewing system.
Whether the system used is desk top or immersive, VR is computer modelling ofreal life as experienced through sight, sound, and touch.
The above suggests that designers and engineers who wish to address the problemof development and improvement of interactive design tools should consider what benefitsVR might offer. The Nottingham University Virtual Reality Applications Research Team,VIRART, was formed specifically to investigate problems of this nature. By building upan expertise in VR systems, VIRART aim to liaise with industry and identify where VRcan be used. Current systems are not as easy to use as they should be, and VIRART alsoset out to influence the development of the technology. With respect to industrialapplications, VR appears to be useful in several areas:-
- Where the real world is too inaccessible, dangerous, or expensive to model inreal life (e.g., nuclear installations).
113
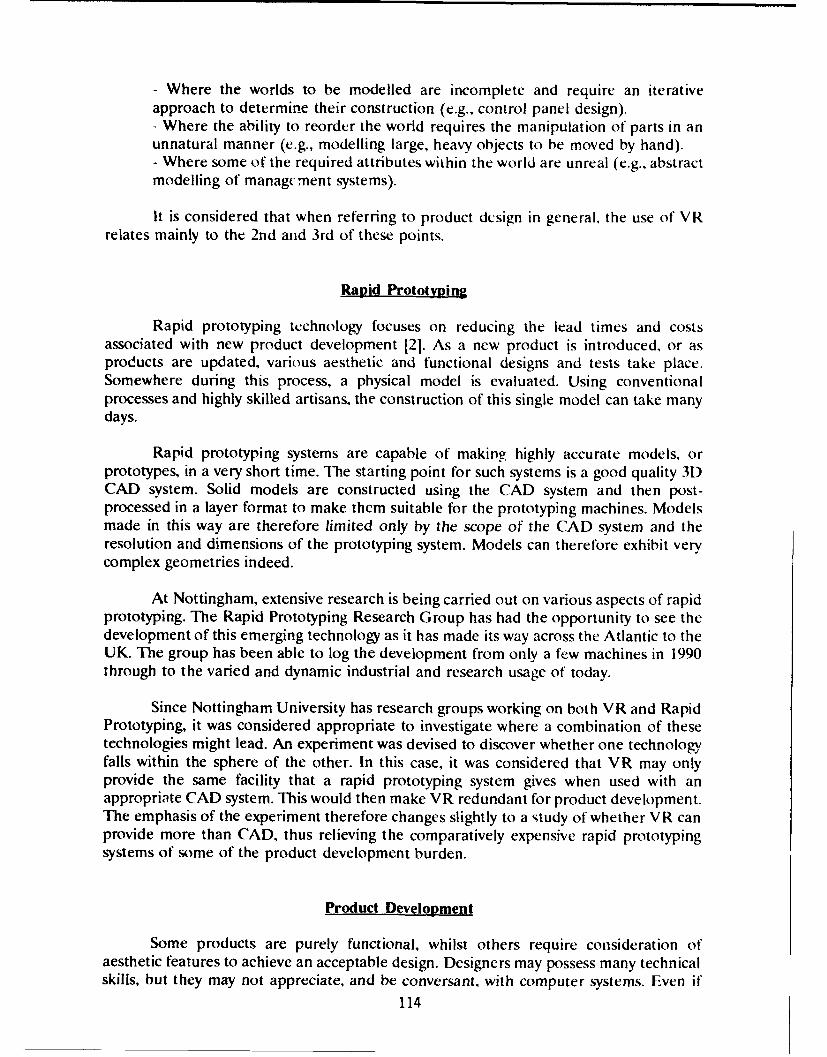
- Where the worlds to be modelled are incomplete and require an iterativeapproach to determine their construction (e.g., control panel design).- Where the ability to reorder the world requires the manipulation of parts in anunnatural manner (e.g., modelling large, heavy objects to be moved by hand).- Where some of the required attributes within the world are unreal (e.g., abstractmodelling of management systems).
It is considered that when referring to product design in general, the use of VRrelates mainly to the 2nd and 3rd of these points.
Rapid Prototyping
Rapid prototyping technology focuses on reducing the lead times and costsassociated with new product development [2]. As a new product is introduced, or asproducts are updated, various aesthetic and functional designs and tests take place.Somewhere during this process, a physical model is evaluated. Using conventionalprocesses and highly skilled artisans, the construction of this single model can take manydays.
Rapid prototyping systems are capable of making highly accurate models, orprototypes, in a very short time. The starting point for such systems is a good quality 3DCAD system. Solid models are constructed using the CAD system and then post-processed in a layer format to make them suitable for the prototyping machines. Modelsmade in this way are therefore limited only by the scope of the CAD system and theresolution and dimensions of the prototyping system. Models can therefore exhibit verycomplex geometries indeed.
At Nottingham, extensive research is being carried out on various aspects of rapidprototyping. The Rapid Prototyping Research Group has had the opportunity to see thedevelopment of this emerging technology as it has made its way across the Atlantic to theUK. The group has been able to log the development from only a few machines in 1990through to the varied and dynamic industrial and research usage of today.
Since Nottingham University has research groups working on both VR and RapidPrototyping, it was considered appropriate to investigate where a combination of thesetechnologies might lead. An experiment was devised to discover whether one technologyfalls within the sphere of the other. In this case, it was considered that VR may onlyprovide the same facility that a rapid prototyping system gives when used with anappropriate CAD system. This would then make VR redundant for product development.The emphasis of the experiment therefore changes slightly to a study of whether VR canprovide more than CAD, thus relieving the comparatively expensive rapid prototypingsystems of some of the product development burden.
Product Development
Some products are purely functional, whilst others require consideration ofaesthetic features to achieve an acceptable design. Designers may possess many technicalskills, but they may not appreciate, and be conversant, with computer systems. Even if
114
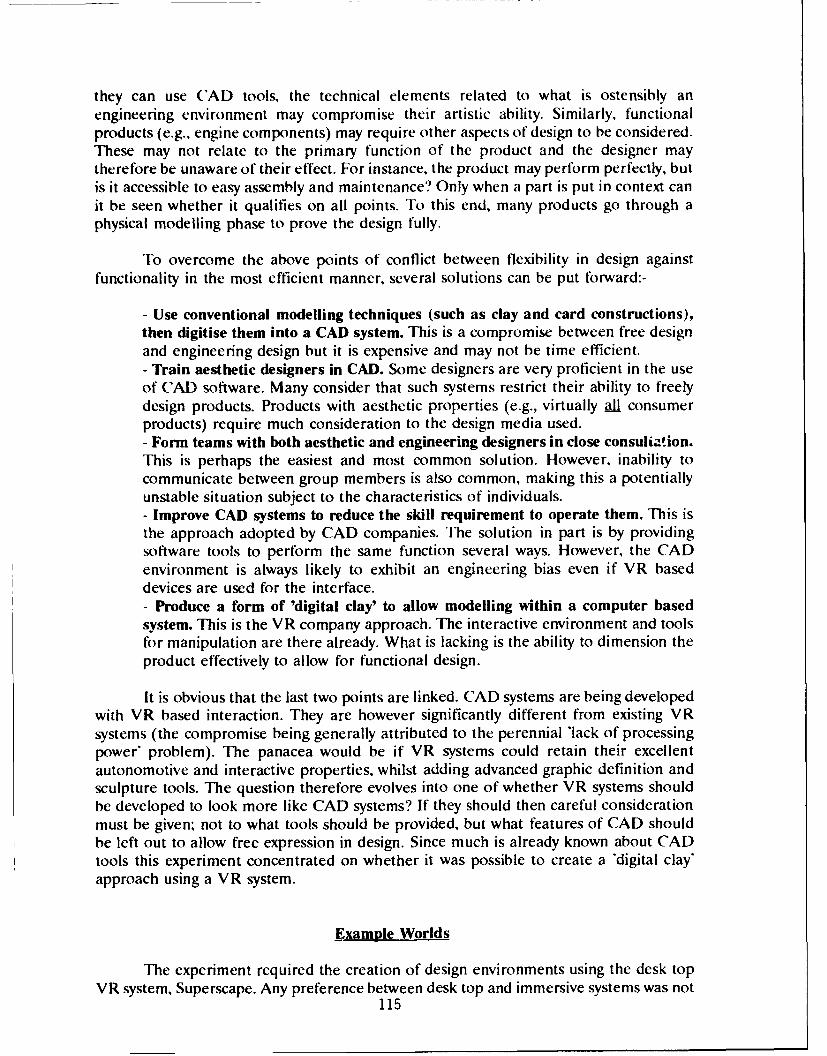
they can use CAD tools, the technical elements related to what is ostensibly anengineering environment may compromise their artistic ability. Similarly, functionalproducts (e.g., engine components) may require other aspects of design to be considered.These may not relate to the primary function of the product and the designer maytherefore be unaware of their effect. For instance, the product may perform perfectly, butis it accessible to easy assembly and maintenance? Only when a part is put in context canit be seen whether it qualifies on all points. To this end, many products go through aphysical modelling phase to prove the design fully.
To overcome the above points of conflict between flexibility in design againstfunctionality in the most efficient manner, several solutions can be put forward:-
- Use conventional modelling techniques (such as clay and card constructions),then digitise them into a CAD system. This is a compromise between free designand engineering design but it is expensive and may not be time efficient.- Train aesthetic designers in CAD. Some designers are very proficient in the useof CAD software. Many consider that such systems restrict their ability to freelydesign products. Products with aesthetic properties (e.g., virtually all consumerproducts) require much consideration to the design media used.- Form teams with both aesthetic and engineering designers in close consuliation.This is perhaps the easiest and most common solution. However, inability tocommunicate between group members is also common, making this a potentiallyunstable situation subject to the characteristics of individuals.- Improve CAD systems to reduce the skill requirement to operate them. This isthe approach adopted by CAD companies. The solution in part is by providingsoftware tools to perform the same function several ways. However, the CADenvironment is always likely to exhibit an engineering bias even if VR baseddevices are used for the interface.
Produce a form of 'digital clay' to allow modelling within a computer basedsystem. This is the VR company approach. The interactive environment and toolsfor manipulation are there already. What is lacking is the ability to dimension theproduct effectively to allow for functional design.
It is obvious that the last two points are linked. CAD systems are being developedwith VR based interaction. They are however significantly different from existing VRsystems (the compromise being generally attributed to the perennial lack of processingpower' problem). The panacea would be if VR systems could retain their excellentautonomotive and interactive properties, whilst adding advanced graphic definition andsculpture tools. The question therefore evolves into one of whether VR systems shouldbe developed to look more like CAD systems? If they should then careful considerationmust be given, not to what tools should be provided, but what features of CAD shouldbe left out to allow free expression in design. Since much is already known about CADtools this experiment concentrated on whether it was possible to create a 'digital clay'approach using a VR system.
Example Worlds
The experiment required the creation of design environments using the desk topVR system, Superscape. Any preference between desk top and immersive systems was not
115
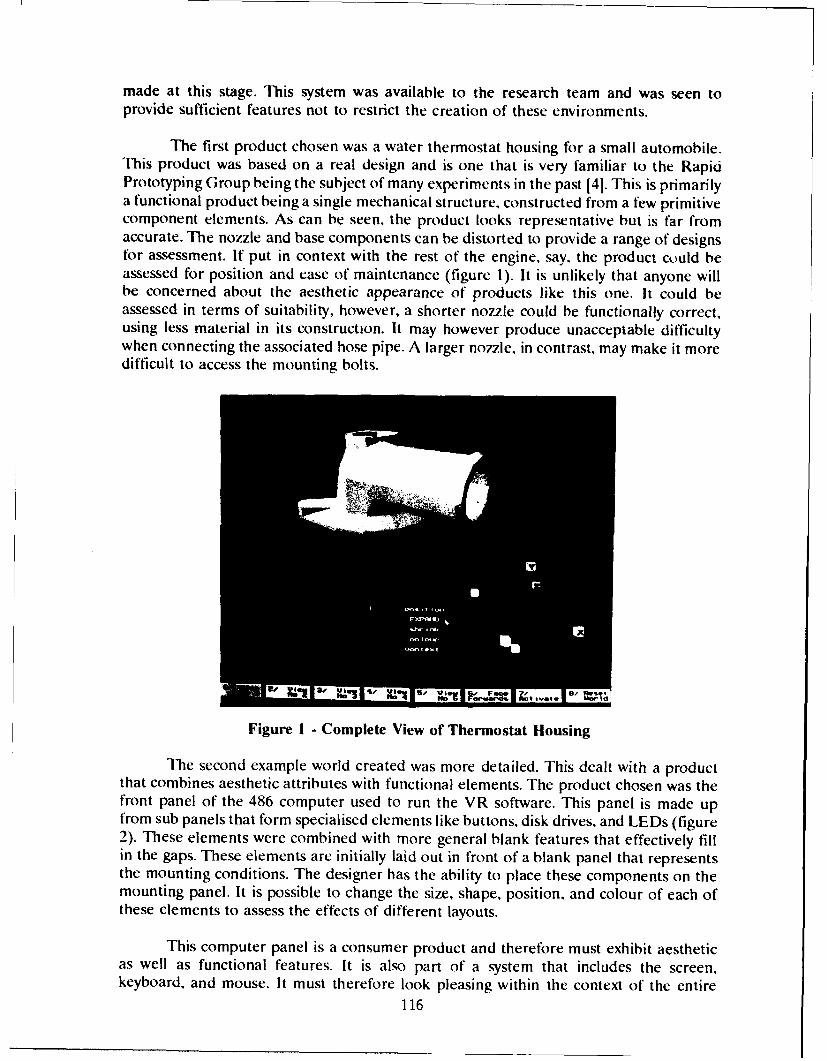
made at this stage. This system was available to the research team and was seen toprovide sufficient features not to restrict the creation of these environments.
The first product chosen was a water thermostat housing for a small automobile.This product was based on a real design and is one that is very familiar to the RapidPrototyping Group being the subject of many experiments in the past [4]. This is primarilya functional product being a single mechanical structure, constructed from a few primitivecomponent elements. As can be seen, the product looks representative but is far fromaccurate. The nozzle and base components can be distorted to provide a range of designsfor assessment. If put in context with the rest of the engine, say, the product could beassessed for position and case of maintenance (figure 1). It is unlikely that anyone willbe concerned about the aesthetic appearance of products like this one. It could beassessed in terms of suitability, however, a shorter nozzle could be functionally correct,using less material in its construction. It may however produce unacceptable difficultywhen connecting the associated hose pipe. A larger nozzle, in contrast, may make it moredifficult to access the mounting bolts.
Figure 1 - Complete View of Thermostat Housing
The second example world created was more detailed. This dealt with a productthat combines aesthetic attributes with functional elements. The product chosen was thefront panel of the 486 computer used to run the VR software. This panel is made upfrom sub panels that form specialised elements like buttons, disk drives, and LEDs (figure2). These elements were combined with more general blank features that effectively fillin the gaps. These elements are initially laid out in front of a blank panel that representsthe mounting conditions. The designer has the ability to place these components on themounting panel. It is possible to change the size, shape, position, and colour of each ofthese elements to assess the effects of different layouts.
This computer panel is a consumer product and therefore must exhibit aestheticas well as functional features. It is also part of a system that includes the screen,keyboard, and mouse. It must therefore look pleasing within the context of the entire
116
computer. Views must be acceptable from appropriate angles and each component canbe positioned to achieve the best result in many scenarios (figure 3). Assessment ofergonomic features like the clarity of layout and the position and size of control buttonscan also made for different configurations.
gl F4- gUo. I ft
Figure 2 - Base Design System for Computer Panel
Sr
Figure 3 - Completed Computer Panel Placed in Context
The concept of 'digital clay' is more refined in this second case. The elementswithin the world can be distorted and positioned with ease by merely selecting an itemusing a mouse driven pointer. The world manipulation controls can then be used tocontrol the attributes of each selected element. The disk drive has greater functionalitythan the other items and therefore its features are more constrained. Different elements
117
can therefore be changed with different degrees of freedom, dependent on whether thecontext of their movement is appropriate.
Experimental Analysis
It was found that the design environments were indeed straightforward tounderstand, use and manipulate. Rudimentary user trials showed that products could berearranged with relative ease. Users also adapted to the environment with very littleinstruction, understanding both the reason for the experiment and the tools provided tochange the world. Nobody, however, used the tools to produce products other than theones designated; a point worth mentioning. These were however initial tests and furthermore detailed trials are essential to analyze fully its use as well as the necessaryrequirements for improvement.
In real life, the user performs a more qualitative assessment of the environmentby way of comparison between objects within the working context. Quantitative tools wereavailable in the example worlds in the form of readouts of position and size of thecomponents. It was found that people using the worlds did not make use of these tools.Tn. example worlds did appear to form the basis of a useful artistically biased tool forproduct development. It does not appear that quantitative elements are an essentialrequirement. What is essential is the ability to interface quickly and efficiently toappropriate CAD systems. These transported object descriptions can then be used by thedesign engineers and form the basis of an iterative process. Currently, Superscapesupports the DXF file format but it is hoped that higher formats will soon be madeavailable.
Further Requirements
There are many features that currently do not exist that a designer would probablyprefer in a VR based design tool. Some of these features relate to current limitations inthe VR system used whilst others relate more to the example worlds created. The latterarc obviously more easy to change under the control of VIRART. Some of these pointsare more for discussion than specified desired changes.
It is uncertain at this stage whether the example worlds should be context specific.It has already been stated that users did not attempt to design out of context. This mayhave been because all those who have used the system to date have had an engineeringbackground. An aesthetic designer may have used the system differently but may alsoconsider the example worlds too restrictive. The possible solution could be to present thesystem at two levels. At the low level is the purely creative environment with nopredefined elements. Simple blobs of 'digital clay' can be combined to form morecomplex structures. At higher levels, objects appropriate to the design context will beprovided alongside these simpler elements. The next test will be to provide designers withnon context driven tools to see whether they can be used to generate somethingcompletely original.
The speed of response and resolution of the system are both inferior to whatwould ultimately be required. This does not mean however that true, life-like
118
representations are essential to the working of the system in this context. As the numberof facets increases on the screen the speed of response does appear sluggish on what isa comparatively slow machine (PC 486 running at 33MHz). As such for simple objects thespeed is probably adequate making it useable in its present form.
So far the examples have not allowed the user to define custom elements. Afacility to create new shapes with different shapes, surface features, textures, texts, etc.is desirable. This could constitute a form of digital pen and paper to be used along withthe digital clay modelling system. In effect, this becomes CAD meets DTP in 3D.
Continuing on from this point, it is also not possible to manipulate parts as muchas would be desired. For example, at present the disk drive cannot be turned on its side.This stands to highlight one of the main differences between desk top and immersivesystems. The manipulative ability within an immersive system appears to be more intuitivethaii a desk top system through its ability to provide more direct contact with the virtualworld. With the desk top system, parts are manipulated via the world control tools ratherthan directly. With an immersive system, the tendency would be to literally grab hold ofthe object.
Integration with Rapid Prototyping
When the stage is reached where quantitative test data is required then physicalprototyping becomes necessary. Rapid prototyping systems shorten this processdramatically making it possible to recoup a significant capital investment in a shortperiod. The operation time of these machines is still significantly long. Generally partsare in a finished, useable state in around 2 days. If all that the part is required for is toassess factors like dimensional fit, accessibility, optimal position, aesthetics, then a systemthat operates in real time is much more appropriate.
The primary use for rapid prototyping systems is not therefore in qualitativeassessment phase of product development. Manufacturers are realising this, and muchmore use is being made of soft tooling processes (like investment casting) to produce testparts and for short production runs. This is a much more important role for thistechnology to fill. Competitive marketing policies still dictate that physical models becreated for purposes like tendering and user evaluation. VR, with its capacity to modelreal life provides a practical replacement for rapid prototyping in this sense. VR has thepotential to fulfil at least somc part of the first 4 uses for rapid prototyping described byJacobs [2], those of visualizi!icn,. verification, iteration and optimization. There is nopossibility of VR fulfilling the 32i use, that of fabrication. With VR supporting, the moreexpensive rapid prototyping technology can therefore be considered free to perform themore production related tasks.
The ideal product development environment is therefore a rapid prototyping basesupported by CAD systems to supply the engineering detail. VR systems will be linkedto the CAD systems that are designated for product development with aesthetic content.A possible layout can be seen in figure 4. This figure also shows the post-processing unitfor conversion of CAD solid models into a layer format suitable for the rapid prototypingmachine. The ratio of machines is indeterminate but 1 rapid prototyping machine couldquite easily support 4 or 5 CAD workstations with perhaps 2 of these working along with
119
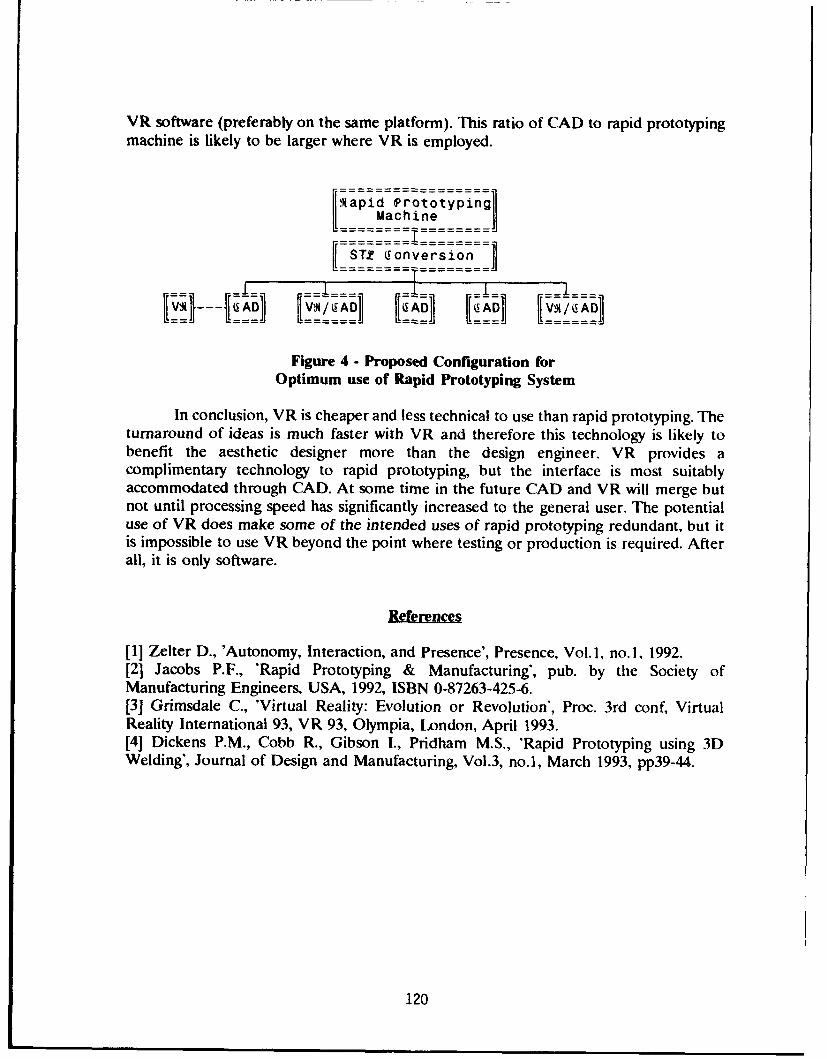
VR software (preferably on the same platform). This ratio of CAD to rapid prototypingmachine is likely to be larger where VR is employed.
:lapid PrototypingMachine
IIST.r donversion
__V= -- _-i_ [= = = I I_I_ 1 - 1E_-
Figure 4 - Proposed Configuration forOptimum use of Rapid Prototyping System
In conclusion, VR is cheaper and less technical to use than rapid prototyping. Theturnaround of ideas is much faster with VR and therefore this technology is likely tobenefit the aesthetic designer more than the design engineer. VR provides acomplimentary technology to rapid prototyping, but the interface is most suitablyaccommodated through CAD. At some time in the future CAD and VR will merge butnot until processing speed has significantly increased to the general user. The potentialuse of VR does make some of the intended uses of rapid prototyping redundant, but itis impossible to use VR beyond the point where testing or production is required. Afterall, it is only software.
References
[1] Zelter D., 'Autonomy, Interaction, and Presence', Presence, Vol.1, no.1. 1992.[2] Jacobs P.F., *Rapid Prototyping & Manufacturing', pub. by the Society ofManufacturing Engineers, USA, 1992, ISBN 0-87263-425-6.[3] Grimsdale C., 'Virtual Reality: Evolution or Revolution', Proc. 3rd conf, VirtualReality International 93, VR 93, Olympia, London, April 1993.[41 Dickens P.M., Cobb R., Gibson I., Pridham M.S., 'Rapid Prototyping using 3DWelding', Journal of Design and Manufacturing, Vol.3, no.1, March 1993, pp3 9 -4 4.
120
Optimization of 2D CT Data Sets for Three-Dimensional
Craniofacial Imaging and Modeling
by Richard A. Levy, M.D. 1
Computer-generated anatomic modeling using radiologic data is a well-known entity. Currently,
state of the art 3D modeling systems lack the variable thresholding, user interactive, capabilities of
3D imaging software.1 We investigated clinical parameters - CT scan plane, 2D filter algorithm,
surrounding medium - and tested a simple mathematical thresholding algorithm based upon
experimentation with a CT phantom, to evaluate a semiautomated approach to 3D craniofacial
imaging and model generation. (Figure 1)
Our investigation indicated that CT scan orientation is a significant determinant of accuracy in 3D
image generation. In addition, we propose a simple thresholding algorithm to optimize threshold
selection under conditions where only a single threshold value may be utilized - i.e., the generation
of anatomic models from craniofacial osseous structures as visualized on CT. This algorithm
provides a flexible framework for refining semiautomated thresholding; that is, a coefficient may
be modified after further clinical trials (e.g., substituting 0.10 for 0.16 in Appendix I) to better
approximate operator-selected thresholds.
The most significant subjective element in this semiautomated approach is the selection of
representative target and background tissues. This task is partially simplified by restricting the
anatomic region of interest, and could be theoretically improved by using cluster plot analysis2 .
Since this type of analysis is also subject to variation based upon population distribution of pixel
densities, we are confident that an experienced technician or radiologist can select representative
target and background densities based upon display options available on current CT scanners
1 Richard A. Levy, M.D.Assistant Professor of RadiologyUniversity of Michigan HospitalsAnn Arbor, MI 48109-0030
121
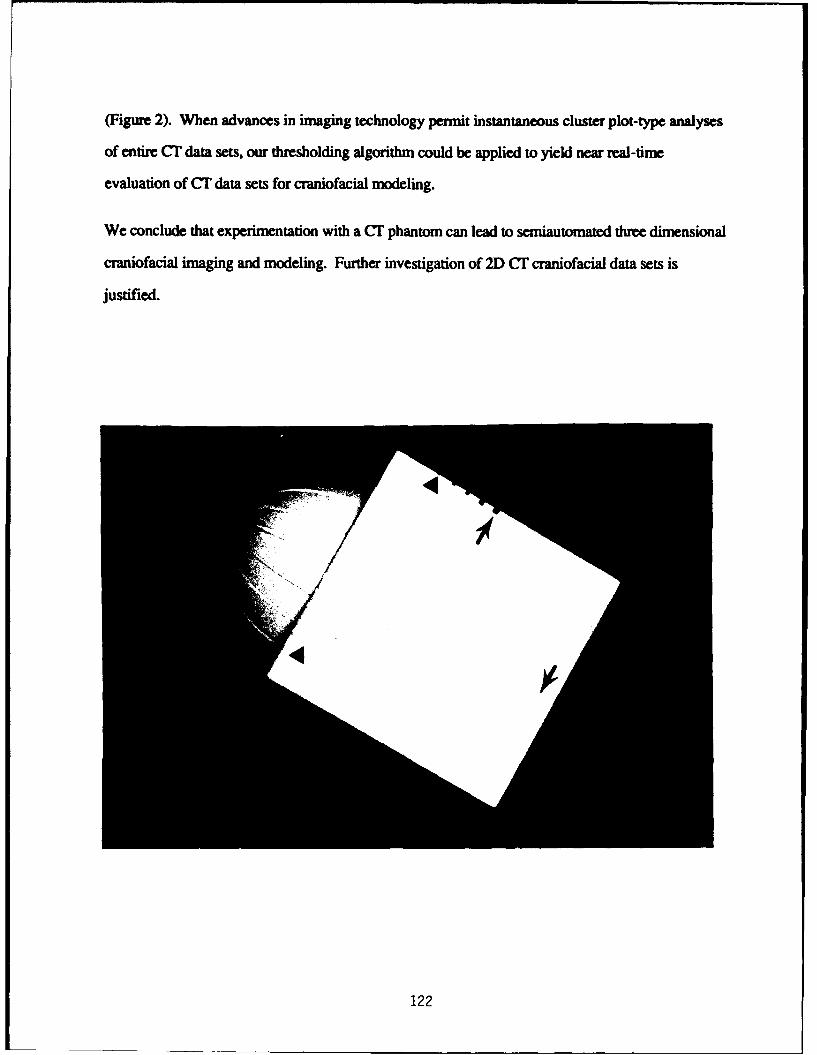
(Figure 2). When advances in imaging technology permit instantaneous cluster plot-type analyses
of entire CT data sets, our thresholding algorithm could be applied to yield near real-time
evaluation of CT data sets for craniofacial modeling.
We conclude that experimentation with a CT phantom can lead to semiautomated three dimensional
craniofacial imaging and modeling. Further investigation of 2D CT craniofacial data sets is
justified.
122
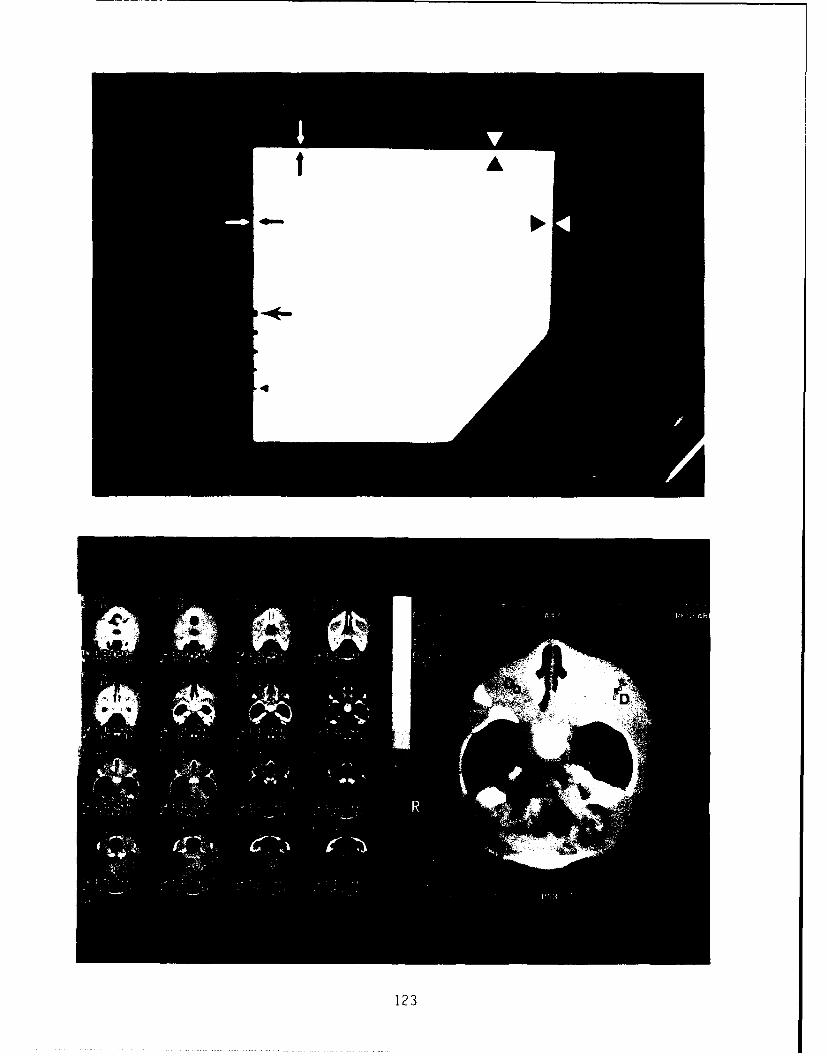
123

Legend to Figures
Figure la Photograph of a lateral view of the PVC phantom. Black arrowhead indicates slit of 0.375
mm width. Black arrow indicates slit of 1.1 mm width. Intermediate slits range from 0.55
to 0.94 mm.
Figure lb Small black arrowhead and single black arrow correspond to slits in Figure la. Paired
double black and white arrows indicate 0.375 mm-thick "shelves" forming one comer of
the phantom base. Paired large black and white arrowheads indicate 0.75 mm-thick
"shelves" forming another comer of the phantom base.
Figure 2 Generation of 16 two-dimensional CT slices for the purpose of selecting D, the highest
density target tissue in the anatomic region of interest. The "Identify" and "Multiply
Display" options are used to initially select D which is verified via an ROI cursor
(magnified CT image on the right.) In this setting, Do = the highest density background
tissue in the anatomic region of interest (intraorbital soft tissue), was also selected using the
"Multiple Display" option and measured with a ROI cursor.
References
1. Levy RA, Guduri S, Crawford RH. Preliminary experience with selective laser sintering models of
the human temporal bone. AJNR (in print)
2. Kohn MI, et al. Analysis of brain and cerebrospinal fluid volumes with MR imaging. Radiology
1991; 178:115-122.
124
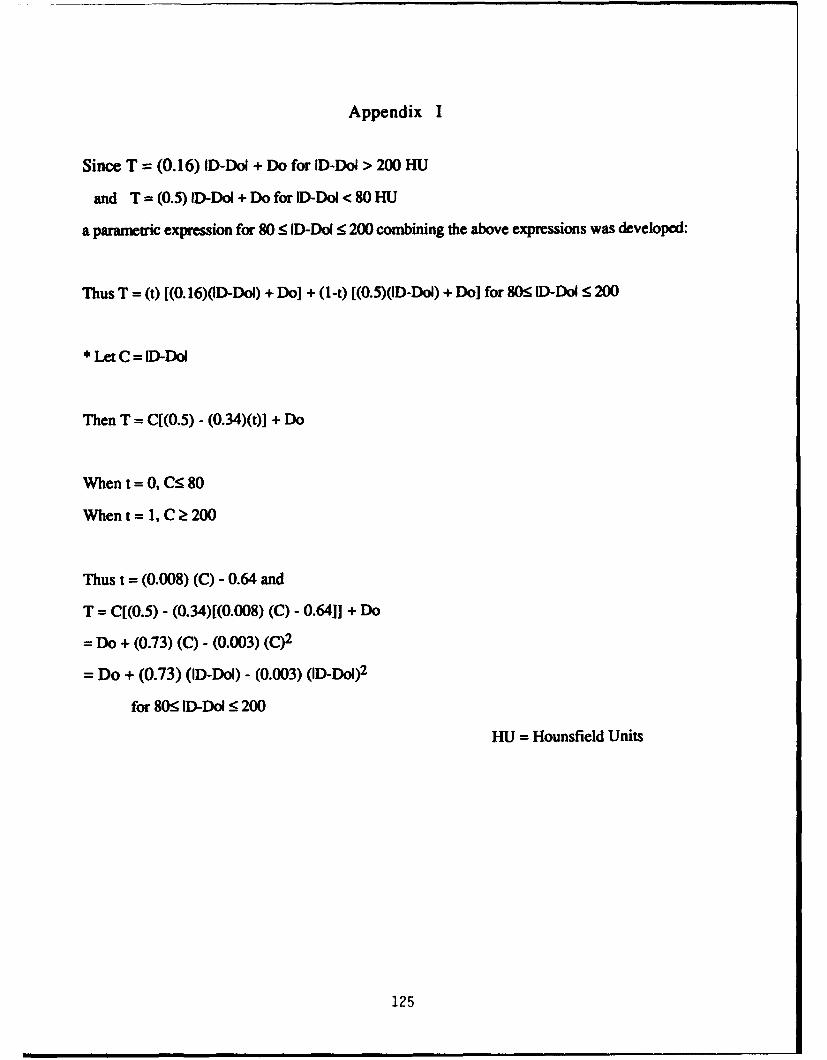
Appendix I
Since T = (0.16) ID-Doi + Do for ID-Dol > 200 HU
and T = (0.5) ID-Dol + Do for [D-DoI< 80 HU
a parametric expression for 80 5 ID-Dol •200 combining the above expressions was developed:
Thus T = (t) [(0. 16)(ID-Dot) + Do] + (I-t) [(0.5)([D-DoI) + Do] for 80• ID-Dol •200
* Let C = [D-DoI
Then T = C[(0.5) - (0.34)(t] + Do
When t = 0, CS 80
When t = 1, C > 200
Thus t = (0.008) (C) - 0.64 and
T = C[(0.5) - (0.34)[(0.008) (C) - 0.64]] + Do
= Do + (0.73) (C) - (0.003) (C)2
= Do + (0.73) (ID-Dol) - (0.003) (ID-Dol) 2
for 80• ID-Dot •200
HU = Hounsfield Units
125
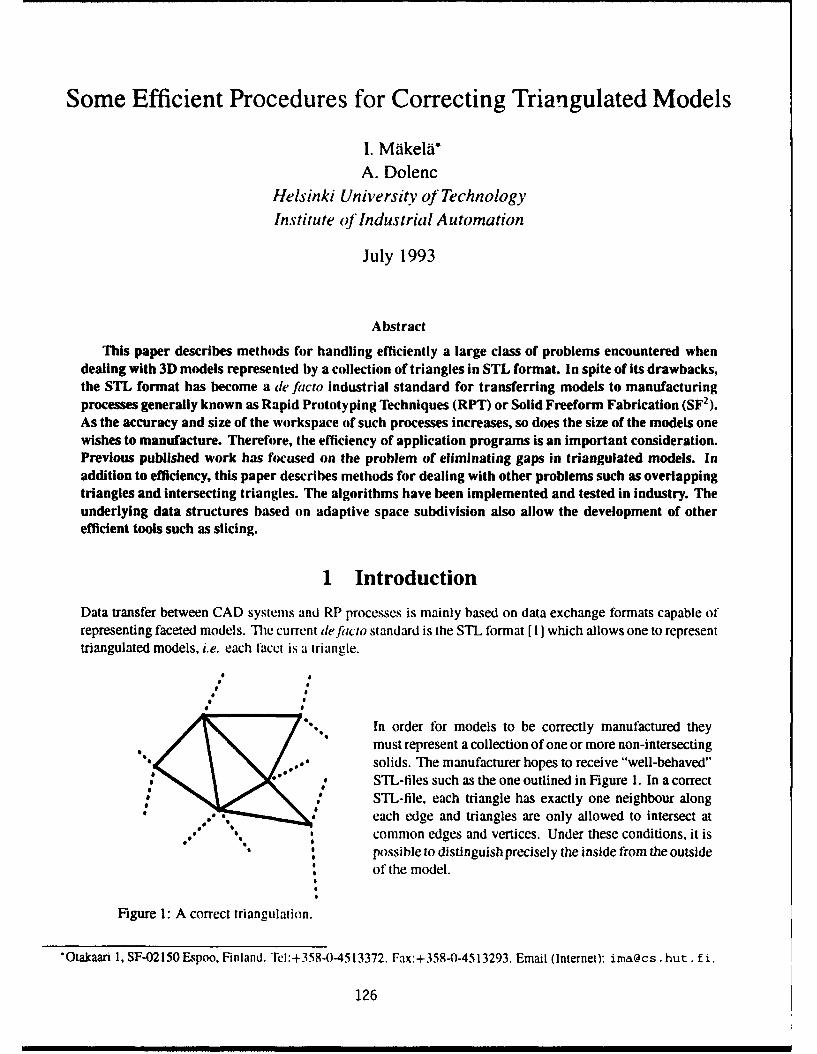
Some Efficient Procedures for Correcting Triangulated Models
I. Makela*A. Dolenc
Helsinki University of TechnologyInstitute of Industrial Automation
July 1993
Abstract
This paper describes methods for handling efficiently a large class of problems encountered whendealing with 3D models represented by a collection of triangles in STL format. In spite of its drawbacks,the STL format has become a de facto industrial standard for transferring models to manufacturingprocesses generally known as Rapid Prototyping Techniques (RPT) or Solid Freeform Fabrication (SF 2).As the accuracy and size of the workspace of such processes increases, so does the size of the models onewishes to manufacture. Therefore, the efficiency of application programs is an important consideration.Previous published work has focused on the problem of eliminating gaps in triangulated models. Inaddition to efficiency, this paper describes methods for dealing with other problems such as overlappingtriangles and intersecting triangles. The algorithms have been implemented and tested in industry. Theunderlying data structures based on adaptive space subdivision also allow the development of otherefficient tools such as slicing.
1 Introduction
Data transfer between CAD systems and RP processes is mainly based on data exchange formats capable ofrepresenting faceted models. The current defacto standard is the STL lormat [ I ] which allows one to representtriangulated models, i.e. each facet is a Wriangle.
" In order for models to be correctly manufactured they"must represent a collection of one or more non-intersectingsolids. The manufacturer hopes to receive "well-behaved"
* STL-files such as the one outlined in Figure 1. In a correctSTL-file, each triangle has exactly one neighbour alongeach edge and triangles are only allowed to intersect atcommon edges and vertices. Under these conditions, it is
* possible to distinguish precisely the inside from the outsideof the model.
Figure 1: A correct triangulation.
"Otakaari 1, SF-02150 Espoo, Finland. Tcl:+358-0-4513372. Fax:+358-O-4513293. Email (Internet): ima~cs. hut. fi.
126
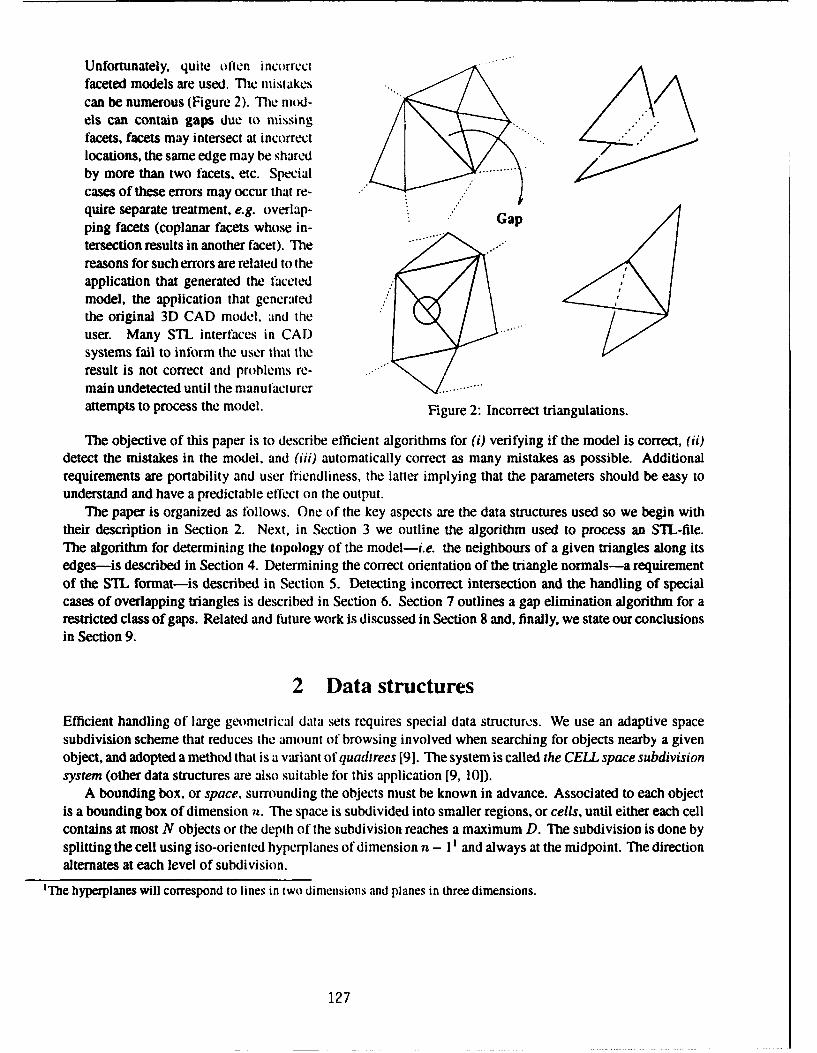
Unfortunately, quite oflten incorrectfaceted models are used. The mistakescan be numerous (Figure 2). The rmod-els can contain gaps due to missingfacets, facets may intersect at incorrectlocations, the same edge may be sharedby more than two facets. etc. Special . ..
cases of these errors may occur that re-quire separate treatment, e.g. overlap- Gapping facets (coplanar facets whose in-tersection results in another facet). Thereasons for such errors are related to theapplication that generated the facetedmodel, the application that generatedthe original 3D CAD model, and theuser. Many STL interfaces in CAD.systems fail to inform the user that theresult is not correct and problems re-main undetected until the manufacturer
attempts to process the model. Figure 2: Incorrect triangulations.
The objective of this paper is to describe efficient algorithms for (i) verifying if the model is correct, (ii)detect the mistakes in the model, and (iii) automatically correct as many mistakes as possible. Additionalrequirements are portability and user friendliness, the latter implying that the parameters should be easy tounderstand and have a predictable effect on the output.
The paper is organized as follows. One of the key aspects are the data structures used so we begin withtheir description in Section 2. Next, in Section 3 we outline the algorithm used to process an STL-file.The algorithm for determining the topology of the model-i.e. the neighbours of a given triangles along itsedges-is described in Section 4. Determining the correct orientation of the triangle normals-a requirementof the STL format-is described in Section 5. Detecting incorrect intersection and the handling of specialcases of overlapping triangles is described in Section 6. Section 7 outlines a gap elimination algorithm for arestricted class of gaps. Related and future work is discussed in Section 8 and, finally, we state our conclusionsin Section 9.
2 Data structures
Efficient handling of large geometrical data sets requires special data structures. We use an adaptive spacesubdivision scheme that reduces the amount of browsing involved when searching for objects nearby a givenobject, and adopted a method that is a variant of quadtrees [9]. The system is called the CELL space subdivisionsystem (other data structures are also suitable for this application [9, 10]).
A bounding box, or space, surrounding the objects must be known in advance. Associated to each objectis a bounding box of dimension n. The space is subdivided into smaller regions, or cells, until either each cellcontains at most N objects or the depth of the subdivision reaches a maximum D. The subdivision is done bysplitting the cell using iso-oriented hyperplanes of dimension n - 11 and always at the midpoint. The directionalternates at each level of subdivision.
'The hyperplanes will correspond to lines in two dimensions and planes in three dimensions.
127
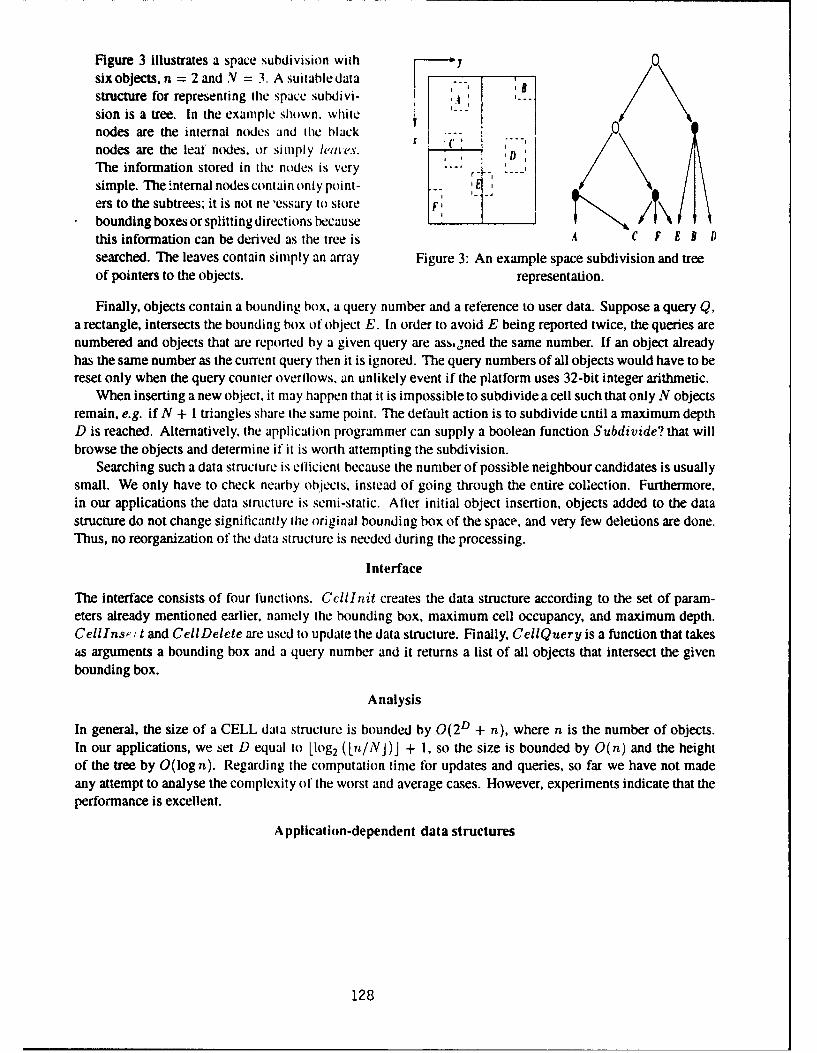
Figure 3 illustrates a space subdivision with 0six objects, n = 2 and N = 3. A suitable datastructure for representing the space subdivi- A.sion is a tree. In the example shown, white .__/nodes are the internal nodes and the black . -S•(. , .--- ,
nodes are the leaf nodes, or simply leaves.The information stored in the nodes is very .simple. The internal nodes contain only point- E , "ers to the subtrees; it is not ne -essary to store Fbounding boxes or splitting directions because Ithis information can be derived as the tree is A C F El Dsearched. The leaves contain simply an array Figure 3: An example space subdivision and treeof pointers to the objects. representation.
Finally, objects contain a bounding box, a query number and a reference to user data. Suppose a query Q,a rectangle, intersects the bounding box of object E. In order to avoid E being reported twice, the queries arenumbered and objects that are reported by a given query are assrined the same number. If an object alreadyhas the same number as the current query then it is ignored. The query numbers of all objects would have to bereset only when the query counter overflows. an unlikely event if the platform uses 32-bit integer arithmetic.
When inserting a new object, it may happen that it is impossible to subdivide a cell such that only N objectsremain, e.g. if N + 1 triangles share the same point. The default action is to subdivide until a maximum depthD is reached. Alternatively, the application programmer can supply a boolean function Subdivide? that willbrowse the objects and determine if it is worth attempting the subdivision.
Searching such a data structure is ellicient because the number of possible neighbour candidates is usuallysmall. We only have to check nearby objects, instead of going through the entire collection. Furthermore.in our applications the data stnicture is semi-static. After initial object insertion, objects added to the datastructure do not change significantly the original bounding box of the space, and very few deletions are done.Thus, no reorganization of the data structure is needed during the processing.
Interface
The interface consists of four functions. Cclllnit creates the data structure according to the set of param-eters already mentioned earlier, namely the bounding box, maximum cell occupancy, and maximum depth.CelIns•i t and CellDelete are used to update the data structure. Finally, CellQuery is a function that takesas arguments a bounding box and a query number and it returns a list of all objects that intersect the givenbounding box.
Analysis
In general, the size of a CELL data structure is bounded by 0( 2D + n), where n is the number of objects.In our applications, we set D equal to [log2 (.n/INJ)J + 1, so the size is bounded by O(n) and the heightof the tree by O(log n). Regarding the computation time for updates and queries, so far we have not madeany attempt to analyse the complexity of the worst and average cases. However, experiments indicate that theperformance is excellent.
Application-dependent data structures
128
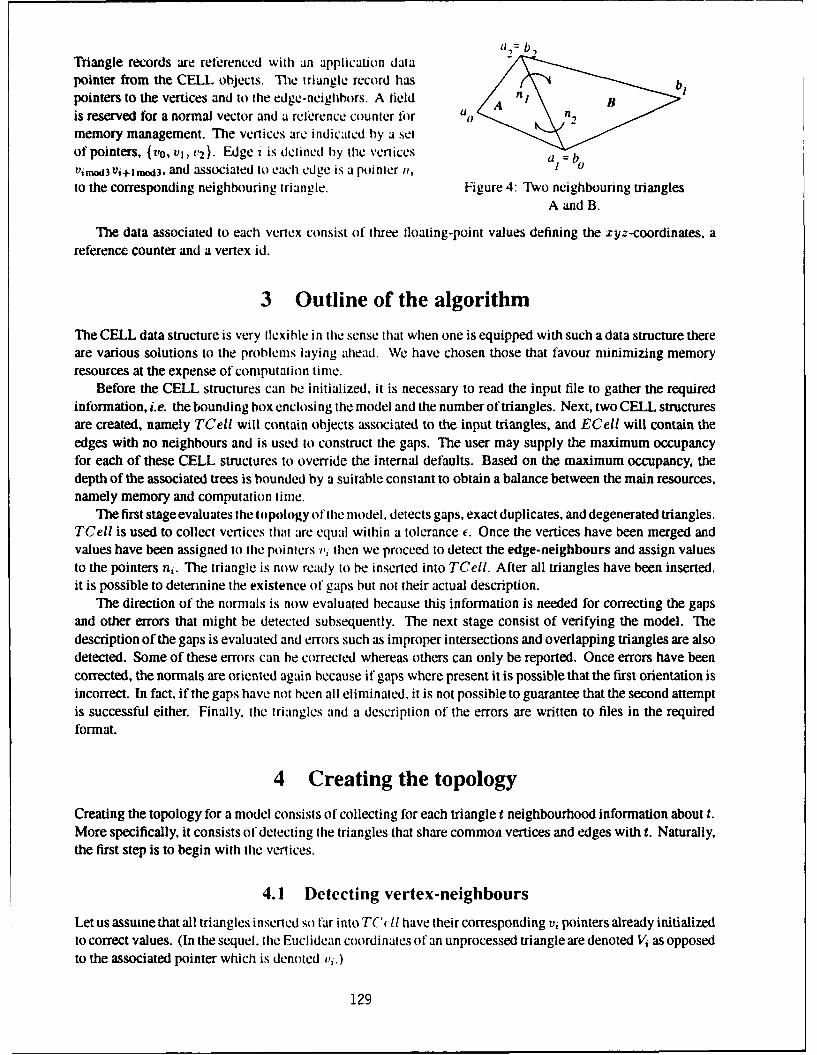
11,= b,)
Triangle records are referenced with an application datapointer from the CELL objects. The triangle record has \ipointers to the vertices and to the edge-neighbors. A field Bis reserved for a normal vector and a reference counter for 0memory management. The vertices are indicated by a setof pointers, {0o, v1, c2 }. Edge i is defined by thie vertices a =boVioan3Vi+lonw3, and associated to each edge is a pointer i, )to the corresponding neighbouring triangle. Figure 4: Two neighbouring triangles
A and B.
The data associated to each vertex consist of three floating-point values defining the xyz-coordinates, areference counter and a vertex id.
3 Outline of the algorithm
The CELL data structure is very flexible in the sense that when one is equipped with such a data structure thereare various solutions to the problems laying ahead. We have chosen those that favour minimizing memoryresources at the expense of computation time.
Before the CELL structures can he initialized, it is necessary to read the input file to gather the requiredinformation, i.e. the bounding box enclosing the model and the number of triangles. Next, two CELL structuresare created, namely TCell will contain objects associated to the input triangles, and ECell will contain theedges with no neighbours and is used to construct the gaps. The user may supply the maximum occupancyfor each of these CELL structures to override the internal defaults. Based on the maximum occupancy, thedepth of the associated trees is bounded by a suitable constant to obtain a balance between the main resources,namely memory and computation time.
The first stage evaluates the topology of the model, detects gaps, exact duplicates, and degenerated triangles.TCell is used to collect vertices that are equal within a tolerance c. Once the vertices have been merged andvalues have been assigned to the pointers vi then we proceed to detect the edge-neighbours and assign valuesto the pointers ni. The triangle is now ready to be inserted into TCell. After all triangles have been inserted,it is possible to determine the existence of gaps but not their actual description.
The direction of the normals is now evaluated because this information is needed for correcting the gapsand other errors that might be detected subsequently. The next stage consist of verifying the model. Thedescription of the gaps is evaluated and errors such as improper intersections and overlapping triangles are alsodetected. Some of these errors can be corrected whereas others can only be reported. Once errors have beencorrected, the normals are oriented again because if gaps where present it is possible that the first orientation isincorrect. In fact, if the gaps have not been all eliminated, it is not possible to guarantee that the second attemptis successful either. Finally, the triangles and a description of the errors are written to files in the requiredformat.
4 Creating the topologyCreating the topology for a model consists of collecting for each triangle t neighbourhood information about t.More specifically, it consists of detecting the triangles that share common vertices and edges with t. Naturally,the first step is to begin with the vertices.
4.1 Detecting vertex-neighbours
Let us assume that all triangles inserted so tar into TC(11 have their corresponding vi pointers already initializedto correct values. (In the sequel, the Euclidean coordinates of an unprocessed triangle are denoted Vi as opposedto the associated pointer which is denoted ti'.)
129
For each vertex V1 E t we apply the following procedure. The bounding box BB, -BoundingBoz( V. )+is evaluated, where c is a small constant to account for rounding errors that probably occurred when the modelwas created. Next, the set of triangles VNcighbouirCandidates - CellQuery(TCell, BBS) is evaluated.The vertices V' of all triangles t' E VNc:iyhbourCatndidates are searched to find the closest one to Vi E t.Once found, the associated pointer is assigned to v1i.
If a triangle collapses to a line or a point then it is deleted and is not inserted into TCell.
4.2 Detecting edge-neighbours
If a little more effort is done while finding the vertex-neighbours then enough information can be made availableto easily detect the triangles that share a common edge with t. Let Vrn, be the closest vertex to V, evaluatedby the procedure outlined above. Since the entire set VNeighbourCandidates is searched one can collectthe triangles that already share the same pointer t 11 ,.
Let us say that these triangles are placed in a set denoted by VNj. For each k = 0, 1, 2 we computeI -_ NV" n NVk+ln.d3. If III = 0 then the neighbour of t along the edge k either does not exist or has notyet been inserted in TCell. In this case, no further action is taken. If II > 1 then a possible error conditionhas been detected, namely an edge is being shared by more than two triangles. The edge is tagged accordinglyand the tag will be cleared if another edge from another triangle matches it. Edges shared by 2n triangleswith n > 1 are reported has warnings whereas edges shared by 2n + 1 triangles with n > 0 are reported haserrors. We call the latter odd-edges. Finally, if II = I then the neighbour of t along edge k has been found.The pointer nk is set equal to i,,, and a global counter. EdyeH it, is incremented by one.
After all triangles have been inserted into TCcll, the value of EdgeHit must equal 3N, where N is thenumber of triangles. If Edge! Iit < 3N then the entire set of triangles is searched for the odd-edges. Theseare placed in ECell for subsequent use during the gap elimination stage. Before a triangle is inserted, though,we verify if it is an exact duplicate, i.e. if all pointers ni have the same value. In this case, the triangle isdiscarded because it is likely that it is the result of duplicate or coincident surfaces2.
5 Orienting the trianglesAn initial triangle to is chosen arbitrarily and a queue of triangles U is initialized. A ray is cast in the directionof the normal vector N7o of to. The direction of g 0 is determined by the number of intersections between theray and the model. The vertex pointers vi are reordered according to the specifications of the STL format whichstates that as the fingers of the rigth-hand follow the vertices the thumb must be pointing towards the outsideof the model. TCell is used to minimize the number of ray-triangle intersection tests. Only the triangles thatare located in cells that are hit by the ray need to be taken into consideration.
Once a triangle t has been oriented, all its edge-neighbours that have not yet been processed are placed inthe queue U, if not already there. The next triangle to be processed is the one at the head of the queue. Whenthe queue is empty we verify if all triangles i n the model have been processed. If not then the next unprocessedtriangle t' is again chosen arbitrarily and the same procedure is applied once more.
At this point, we would like to introduce the concept of a component. Loosely speaking, a triangle t belongsto the same component as t' if one can be reached by the other by "walking" along edge-neighbours. (Forprecision purposes we include the following definition using concepts from Graph Theory. Let G = (V, E)be a graph where each vertex n E V corresponds to a triangle and an edge e = vw with v, w E V is an edgeof G if the triangle associated to v is an edge-neighbour of the triangle associated to w. Because the propertyis reflexive, G is an un-directed graph. In a sense, the graph G is the "dual" of the triangulated model. Apath in G is any connected set of edges. Two vertices are said to be in the same component C of G if afinite path can be found between them. Two triangles t,, and t, are in the same component if the associatedvertices v, w E V are in the same component of G. Finally, notice that the algorithm above corresponds to abreadth-first search-BFS, for short---on the graph G.)
21n some cases, discarding both is a better alternative.
130
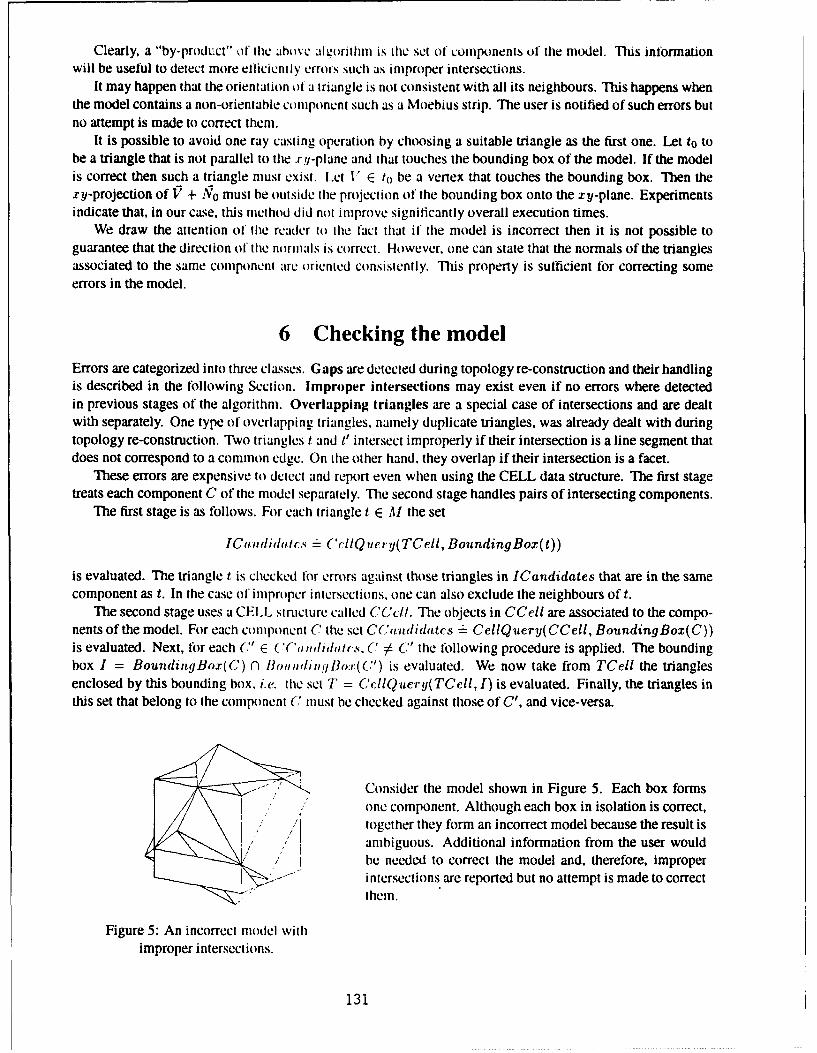
Clearly, a "by-produ~ct" of the ahove alorithim is the set of components of the model. This informationwill be useful to detect more efficiently errors such as improper intersections.
It may happen that the orientation of a triangle is not consistent with all its neighbours. This happens whenthe model contains a non-orientable component such as a Moebius strip. The user is notified of such errors butno attempt is made to correct them.
It is possible to avoid one ray casting operation by choosing a suitable triangle as the first one. Let to tobe a triangle that is not parallel to the .x!-plane and that touches the bounding box of the model. If the modelis correct then such a triangle must exist. Let V E to be a vertex that touches the bounding box. Then thery-projection of Vý + No must be outside the projection of the bounding box onto the xy-plane. Experimentsindicate that, in our case, this method did not improve significantly overall execution times.
We draw the attention of the reader to [he fact that it the model is incorrect then it is not possible toguarantee that the direction of the normals is correct. However, one can state that the normals of the trianglesassociated to the same component are oriented consistently. This property is sufficient for correcting someerrors in the model.
6 Checking the modelErrors are categorized into three classes. Gaps are detected during topology re-construction and their handlingis described in the following Section. Improper intersections may exist even if no errors where detectedin previous stages of the algorithm. Overlapping triangles are a special case of intersections and are dealtwith separately. One type of overlapping triangles, namely duplicate triangles, was already dealt with duringtopology re-construction. Two triangles t and t' intersect improperly if their intersection is a line segment thatdoes not correspond to a common edge. On the other hand. they overlap if their intersection is a facet.
These errors are expensive to detect and report even when using the CELL data structure. The first stagetreats each component C of the model separately. The second stage handles pairs of intersecting components.
The first stage is as follows. For each triangle t E M the set
ICaumdiditcrs - ('cllQutery(TCell, BoundingBox(t))
is evaluated. The triangle t is checked for errors against those triangles in ICandidates that are in the samecomponent as t. In the case of inproper intersections, one can also exclude the neighbours of t.
The second stage uses a CELL stnicture called MCc l. The objects in CCell are associated to the compo-nents of the model. For each component C (lie set CCadidatcs - CellQuery(CCell, BoundingBox(C))is evaluated. Next, for each C" E ('('a ndidawc,, C $ C' the following procedure is applied. The boundingbox I = BoundingBox(C) n laoundinfqlBox(C") is evaluated. We now take from TCell the trianglesenclosed by this bounding box, i.e. the set T = C'clIQu.ery(TCcll, I) is evaluated. Finally, the triangles inthis set that belong to the component C must be checked against those of C', and vice-versa.
: - Consider the model shown in Figure 5. Each box formsone component. Although each box in isolation is correct,
I• / together they form an incorrect model because the result is/,' !ambiguous. Additional information from the user would
/, I be needed to correct the model and, therefore, improperintersections are reported but no attempt is made to correctthem.
Figure 5: An incorrect model withimproper intersections.
131
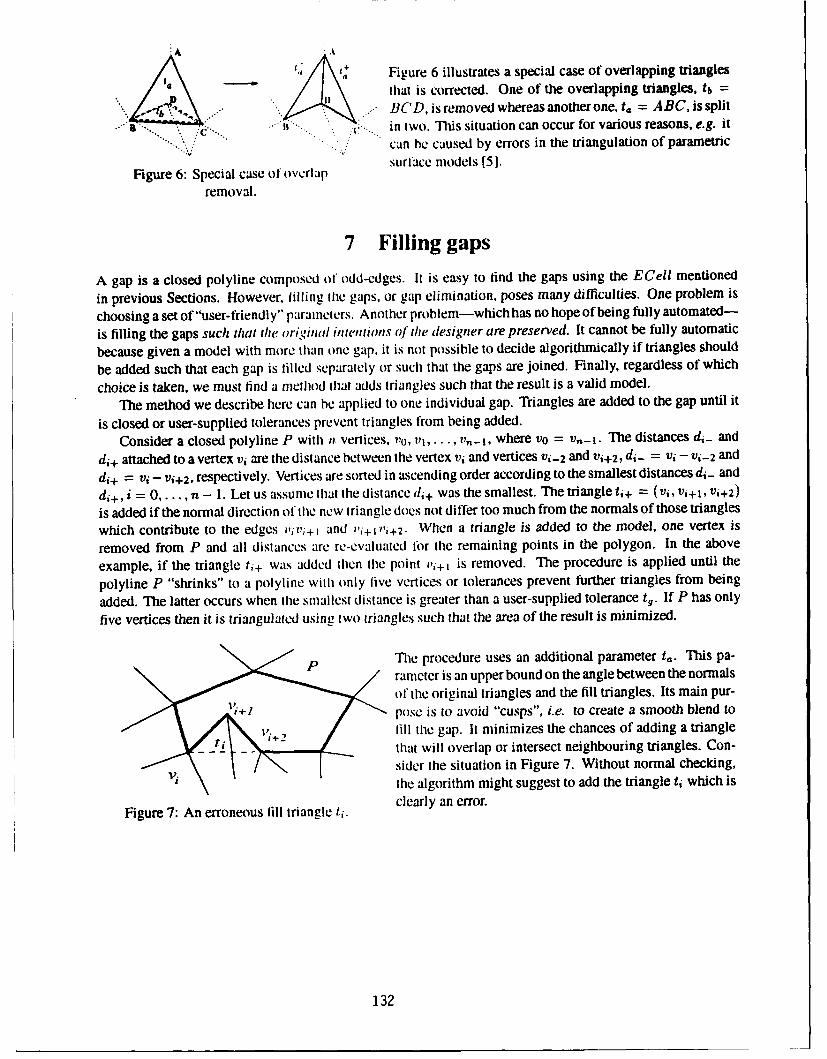
Figure 6 illustrates a special case of overlapping triangles
that is corrected. One of the overlapping triangles, tb =
"b.. BCD, is removed whereas another one, = ABC, is splitin two. This situation can occur for various reasons, e.g. itcan be caused by errors in the triangulation of parametricsurface models [5].
Figure 6: Special case of overlap
removal.
7 Filling gaps
A gap is a closed polyline composed of odd-edges. It is easy to find the gaps using the ECell mentioned
in previous Sections. However, filling the gaps, or gap elimination, poses many difficulties. One problem is
choosing a set of "user-friendly" parameters. Another problem-which has no hope of being fully automated-
is filling the gaps such that the origyinal inlentions of the designer are preserved. It cannot be fully automatic
because given a model with more than one gap. it is not possible to decide algorithmically if triangles should
be added such that each gap is tilled separately or such that the gaps are joined. Finally, regardless of which
choice is taken, we must find a method ihat adds triangles such that the result is a valid model.
The method we describe here can be applied to one individual gap. Triangles are added to the gap until it
is closed or user-supplied tolerances prevent triangles from being added.
Consider a closed polyline P with n. vertices, vo, v1,. .. , v,- , where vo = v,,-1. The distances di- and
di+ attached to a vertex vi are the distance between the vertex vi and vertices vi- 2 and Vi+2, di- = Vi - Vi-2 and
di+ = vi - vi+ 2 , respectively. Vertices are sorted in ascending order according to the smallest distances di- and
di+, i = 0,. ., n - 1. Let us assume that the distance di+ was the smallest. The triangle ti+ = (Vi, Vi+1, vi+2)
is added if the normal direction of the new triangle does not differ too much from the normals of those triangles
which contribute to the edges vi ,;+I and vi+I vi+2. When a triangle is added to the model, one vertex is
removed from P and all distances are re-evaluated for the remaining points in the polygon. In the above
example, if the triangle ti+ was added then the point vi+' is removed. The procedure is applied until the
polyline P "shrinks" to a polyline with only live vertices or tolerances prevent further triangles from being
added. The latter occurs when tile smallest distance is greater than a user-supplied tolerance tg. If P has only
five vertices then it is triangulated using two triangles such that the area of the result is minimized.
p The procedure uses an additional parameter t,. This pa-
rameter is an upper bound on the angle between the normalsof the original triangles and the fill triangles. Its main pur-
pose is to avoid "cusps", i.e. to create a smooth blend tolill the gap. It minimizes the chances of adding a triangle
that will overlap or intersect neighbouring triangles. Con-sider the situation in Figure 7. Without normal checking,
the algorithm might suggest to add the triangle ti which is
Figure 7: An erroneous fill trianglet clearly an error.
132
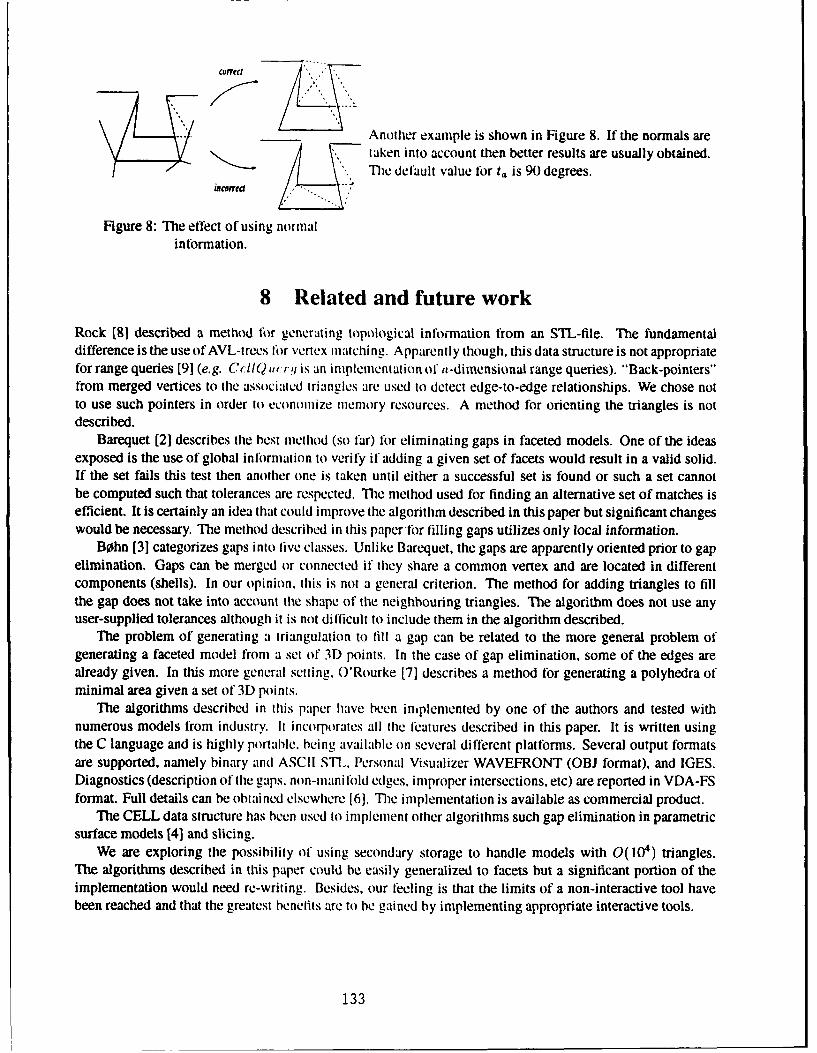
__Another example is shown in Figure 8. If the normals areitaken into account then better results are usually obtained.The default value for to, is 90 degrees.
incorred
Figure 8: The effect of using normalinformation.
8 Related and future work
Rock [81 described a method for generating topological information from an STL-file. The fundamentaldifference is the use of AVL-trees lor vertex matching. Apparently though, this data structure is not appropriatefor range queries [91 (e.g. C0-41Q w tr! is an implementation of it-dimensional range queries). "Back-pointers"from merged vertices to the associated triangles are used to detect edge-to-edge relationships. We chose notto use such pointers in order to econonmize memory resources. A method for orienting the triangles is notdescribed.
Barequet [2] describes the best method (so far) for eliminating gaps in faceted models. One of the ideasexposed is the use of global information to verify if adding a given set of facets would result in a valid solid.If the set fails this test then another one is taken until either a successful set is found or such a set cannotbe computed such that tolerances are respected. The method used for finding an alternative set of matches isefficient. It is certainly an idea that could improve the algorithm described in this paper but significant changeswould be necessary. The method described in this paper for filling gaps utilizes only local information.
Bohn [3] categorizes gaps into live classes. Unlike Barequet, the gaps are apparently oriented prior to gapelimination. Gaps can be merged or connected if they share a common vertex and are located in differentcomponents (shells). In our opinion, this is not a general criterion. The method for adding triangles to fillthe gap does not take into account the shape of the neighbouring triangles. The algorithm does not use anyuser-supplied tolerances although it is not difficult to include them in the algorithm described.
The problem of generating a triangulation to till a gap can be related to the more general problem ofgenerating a faceted model from a set of 3D points. In the case of gap elimination, some of the edges arealready given. In this more general setting, O'Rourke [71 describes a method for generating a polyhedra ofminimal area given a set of 3D points.
The algorithms described in this paper have been inmplemented by one of the authors and tested withnumerous models from industry. It incorporates all the features described in this paper. It is written usingthe C language and is highly portable. being available on several different platforms. Several output formatsare supported, namely binary and ASCII STIL. Personal Visualizer WAVEFRONT (OBJ format), and IGES.Diagnostics (description of the gaps. non-mani fold edges, improper intersections, etc) are reported in VDA-FSformat. Full details can be obtained elsewhere [6]. The implementation is available as commercial product.
The CELL data structure has been used to implement other algorithms such gap elimination in parametricsurface models [4) and slicing.
We are exploring the possibility of using secondary storage to handle models with O( 104) triangles.The algorithms described in this paper could be easily generalized to facets but a significant portion of theimplementation would need re-writing. Besides, our feeling is that the limits of a non-interactive tool havebeen reached and that the greatest benefits are to be gained by implementing appropriate interactive tools.
133
9 Conclusions
In this paper we have presented an etlicient algorithm for handling polyhedra models represented in STIformat. An algorithm for tilling individual gaps that takes into account the shape of the neighbouring triangleswas presented. In addition, we have explained how to generate the topology of the model, orient the facets, anddetect all errors that can occur in the description of a model in addition to gaps. Special cases of these errorsare automatically corrected. The etliciency of the algorithms is based on the usage of good data structures,nameiy binary trees associated to spatial subdivision. The algorithm has been successfully tested in industryand proven useful.
We would expect productivity to improve if a better data exchange format replaced the STL-format.Not that the problems discussed here would simply vanish; rather they would be minimized and occur lessfrequently. The "quality" of a tuodel represented in a neutral file format is directly related to the capabilitiesof the format, the tool used to convert the model to the given format, and the user. Due to user expectationsregarding RPT, it will always be necessary to verify and correct models regardless of the format chosen fordata transfer.
10 Acknowledgements
This work was done within the INSTANTCAM project, an European Consortium of partners from both industryand research centers. Although not all partners have been directly involved in software development, theyhave all contributed in some way. either with suggestions. support. patience, or testing of the tools. Thepartners are, in alphabetical order, BIBA (G), Black&Decker GmbH (G), Danfoss A/S (DK), the DanishTechnological Institute (DK), E&D Design (SF), Helsinki University of Technology (SF), Instituto SuperiorTdcnico (P), NTH-SINTEF Production Engineering (N), Raufoss A/S (N), Oy Saab-Valmet Ab (SF), andWilhelm Karmann GmbH (G). At HUT, we received the financial support of TEKES.
References
[1] 3D Systems, Inc. Stereolithography hter tlice Specification, July 1988.
[2] G. Barequet and M. Sharir. Filling Gaps in the Boundary of a Polyhedron. Under preparation, 1993.
[31 J. H. Bohn and M. J. Wozny. Automatic CAD-model Repair: Shell-Closure. In Proceedings of SolidFreeform Fabrication Symposium. pages 86-94. Austin, Texas USA, 1992.
[4] A. Dolenc. Rapid recipes for parametric surface models. Submitted to Computer-Aided Design, 1993.
[51 A. Dolenc and I. Maikelai. Optimized Triangulation of Parametric Surfaces. Technical Report TKO-B74,Helsinki University of Technology, 199 1. To be published in Mathematics of Surfaces IV.
[6] Helsinki University of Technology, Otakaari 1. SF-02150 Espoo, Finland. TR2STL User Guide, Opus1.9d, January 1993.
[7] J. O'Rourke. Polyhedra ot Minimal Area as 3D Object Models. In A. Drinan, editor. Proceedings of the7th Joint Conference on Artificial hinelligence (I.ICAI-81), volume II, pages 664-666, August 1981.
[81 S. J. Rock and M. J. Wozny. Generating Topological Information from a Bucket of Facets. In Proceedingsof Solid Freeform Fabrication Symposiwn. pages 1- 15, Austin, Texas USA, 1992.
191 H. Samet. The Design attd Analysis of Spatial Data Structures. Addison-Wesley Publishing Company,
Inc., 1989.
[10] M. Tamminen and R. Sulonen. The EXCELL Method for Efficient Geometric Access to Data. InACM/IEEE 19th Design Automation Conference. pages 345-35 1, June 1982.
134
ROBUST PROTOTYPING
Jana K. ChariDr. Jerry L. Hall
Department of Mechanical EngineeringEngel Manufacturing Laboratory
Iowa State UniversityAmes, IA 50011
Submitted for Publication inSolid Freeform Fabrication Symposium, The University of Texas, Austin
August 1993
ABSTRACT
This paper presents a new prototyping system consisting of a computer interface basedon IGES standard to represent and path plan objects with precise curve and surface defi-nitions and a laser-metal deposition process for the prototype fabrication. The advantageof using the Non-Uniform Rational B-Splines (NURBS) data instead of the traditional tri-angular data is that it requires fewer data conversions as most standard analytical shapes(like lines, conics, circles, planes and quadratic surfaces) as well as free form curves andsurfaces are represented with one common underlying mathematical form. By addressingthis issue of improved data representation on the CAD file front-end and an improvedprocessing technique, this research will significantly impact the output of rapid prototyp-ing with functional parts of improved tolerance and surface finish capabilities. A detaileddescription of the implementation of the computer interface on different hardware plat-forms and an outline of the fabrication process are presented. We conclude that NURBSinterfacing technique is a robust mathematical technique and offers great potential forprecise rapid prototyping.
135
1. INTRODUCTION
Many engineering design and manufacturing situations involve the evolution of a newproduct and a rethinking of many manufacturing activities. The CAD systems allow de-signers to routinely develop computer models of parts to be fabricated. When coupledwith CAM capability, the part specifications can be down loaded directly to the manufac-turing equipment. Currently, several processes such as selective laser sintering, 3D lasercutting of sheet metals, stereolithography and rapid prototyping or solid freeform fabri-cation use such CAD/CAM systems. One advantage is the speed at which a conceptualdesign is converted to a form testable prototypes. Robust prototyping is one such chal-lenging fabrication technique to convert conceptual designs to testable functional parts.
2. TECHNICAL BACKGROUND AND LIMITATIONS
The state-of-the-art systems currently available for solid freeform manufacturing per-form many of the fabrication functions required. However their limitations include:
1. Metal parts have not been produced rapidly for functional testing.
2. Inaccuracies due to improper CAD representation result in limited application ofthe fabrication process.
Current prototyping or fabrication systems build three-dimensional shapes by incre-mental material buildup of thin layers of materials. These prototypes or models are usedfor form testing only. Functional testing cannot be done due to their fragility. There alsoseems to be no method available to fabricate metal parts directly using the same principleof successive solidification. NC fabrication of complex geometry remains expensive andtime consuming.
These manufacturing systems are also limited in terms of geometric inaccuracies dueto the approximation of CAD triangulation. The surfaces of the object are defined asa set of interfacing triangles (many CAD packages use such technique to draw surfacesof on-screen images). The triangles are defined by their vertices and a normal, whichidentifies which side faces out and which faces in. This planer faceted representation hasinherent limitations in terms of its ability to approximate the original part design withacceptable precision.
136
3. PROBLEM DEFINITION
Although several parts of the problem of providing a computer interface for rapidprototyping have been attempted, there has been no attempt to provide an interfacewhich uses the precise information from the solid modeling system for path planning thelaser curing process. At the beginning of this research, the need for such a computerinterface was identified. During the development of such an interface based on a CADrepresentation, a more fundamental understanding of the process of 2D path planningwas obtained and this understanding prompted a reexamination of the concepts currentlyin use. It also seemed clear that the increasing need for functioning prototypes producedthrough rapid prototyping systems would necessitate more refined methods of geometricrepresentation and advanced material fabrication techniques. The problem addressed inthis paper can be defined as:
0 "Given a complete geometric description of the part to be prototyped,design appropriate techniques to retrieve precise cross-sectional infor-mation and automatically produce a cross-hatch pattern suitable for thelaser post processor and develop methods to fabricate functional parts di-rectly through successive solidification using laser-metal deposition tech-niques."
4. OVERALL METHODOLOGY
The 3D computer models created in the CAD system have to be sliced into a stackof 2D cross-sections for laser path planning in rapid prototyping. In commercial systemsthe object is tessellated (triangulated) before it is sent to the rapid prototyping systemand sliced by a special software there. This results in the error/inaccuracy introduced bythe triangulation to propagate through the entire process.
The research initiative here is therefore to design and implement a "slicing program"that can be associated with any geometric model. This program can either be an exter-nal program or an internal program using the "section cutting" capabilities of the solidmodeler. The overall methodology is to provide a system that will help users to extractthe information of the cross-sectional profiles based on NURBS data and to then use itfor the generation of 2D cross-hatch patterns. The following are the steps in providingsuch an interface:
1. Design the part using a solid model CAD system and orient it in the way that itwould be built.
137
2. Run the slice program such that the set of cutting planes are defined perpendicularto the build direction. Output all the curves describing the cross-sections in IGESformat.
3. Transform these IGES formatted files to the interface software.
4. Obtain the 2D cross-hatch pattern for each cross-section using the intersection al-gorithm.
5. Verify the correctness of the solution by simulating the laser curing and the partbuilding process using a graphical user interface.
4.1 Obtaining The Cross-sectional Profiles
The cross-sectional profiles are obtained from the intersection calculations betweenthe object and a regularly spaced stack of planar faces. The spacing between these planescan be varied. One or more profiles are created and stored by this operation. The profilescorresponding to a particular cross-section are retrieved and joined together to exactlyrepresent the cross-section of the model. This cross-sectional information is output to anIGES file with the RationaLB-Spline option. IGES files are those which conform to theInitial Graphics Exchange Specifications [5].
4.2 Vector Scanning or 2D path planning
The 2D path planning is the task of designing a cross-hatch pattern to move thelase/scanner system over the cross-sectional profiles. This motion involves identifying thesolid/hole areas for the laser light to be turned on/off. Normally the motion is specifiedby assigning a sequence of points between the initial and final points which are termedintersection points. Each of these intersection points specifies whether the light has tobe turned on/off. Between these points the motion of the scanning system is defined tobe a smooth function. The intersection calculations are based upon the Newton-Raphsonmethod and cross-hatch pattern is generated using the Ray Casting method
4.3 Newton-Raphson Method
Many geometric algorithms include tests for intersection between geometric entities.For example, identification of the interior and skin-fill areas of the cross-sectional profilefor laser curing applications involves intersection operations. The intersection betweenthe cross-section and the cross-hatch grid identifies the vectors to be scanned by the
138
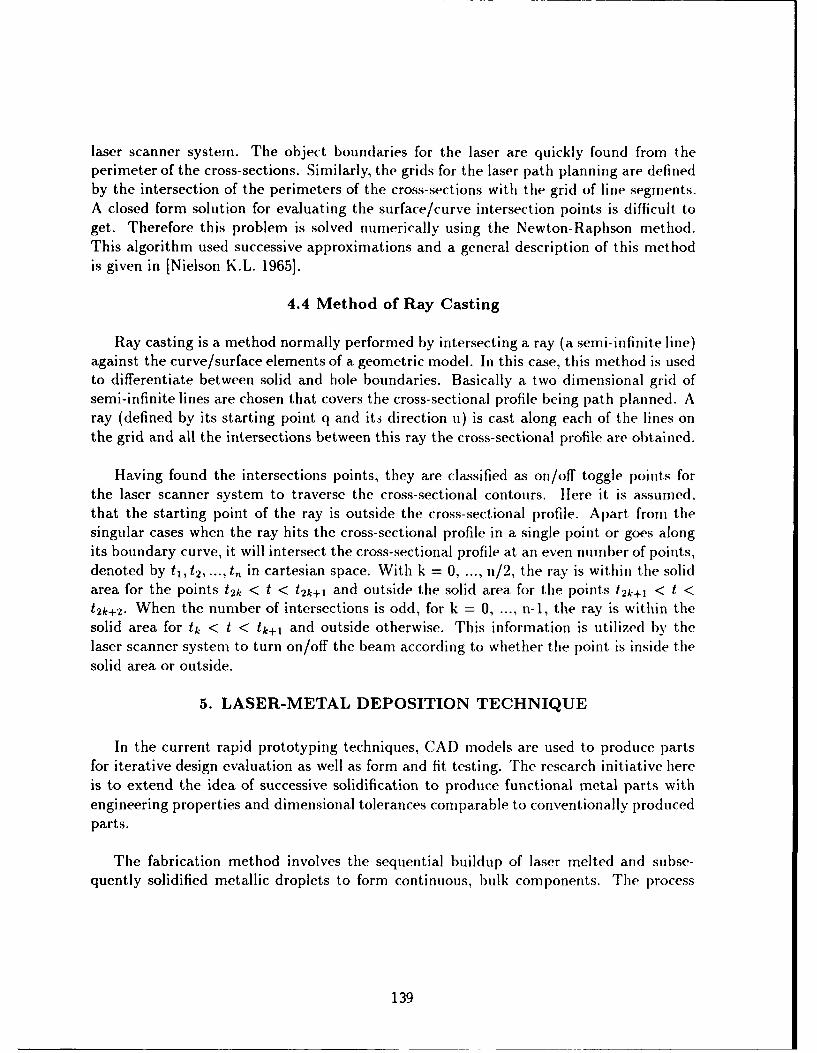
laser scanner system. The object boundaries for the laser are quickly found from theperimeter of the cross-sections. Similarly, the grids for the laser path planning are definedby the intersection of the perimeters of the cross-sections with the grid of line segments.A closed form solution for evaluating the surface/curve intersection points is difficult toget. Therefore this problem is solved numerically using the Newton-Raphson method.This algorithm used successive approximations and a general description of this methodis given in [Nielson K.L. 1965).
4.4 Method of Ray Casting
Ray casting is a method normally performed by intersecting a ray (a semi-infinite line)against the curve/surface elements of a geometric model. In this case, this method is usedto differentiate between solid and hole boundaries. Basically a two dimensional grid ofsemi-infinite lines are chosen that covers the cross-sectional profile being path planned. Aray (defined by its starting point q and its direction u) is cast along each of the lines onthe grid and all the intersections between this ray the cross-sectional profile are obtained.
flaving found the intersections points, they are classified as on/off toggle points forthe laser scanner system to traverse the cross-sectional contours. Here it is assumed.,that the starting point of the ray is outside the cross-sectional profile. Apart from thesingular cases when the ray hits the cross-sectional profile in a single point or goes alongits boundary curve, it will intersect the cross-sectional profile at an even number of points,denoted by t1,t2, ... ,t n in cartesian space. With k = 0, ... , n/2, the ray is within the solidarea for the points t2k < t < /2k+l and outside the solid area for the points 12k+1 < t <
t2k+2. When the number of intersections is odd, for k = 0, ... , n-i, the ray is within thesolid area for tk < t < t k+1 and outside otherwise. This information is utilized by thelaser scanner system to turn on/off the beam according to whether the point is inside thesolid area or outside.
5. LASER-METAL DEPOSITION TECHNIQUE
In the current rapid prototyping techniques, CAD models are used to produce partsfor iterative design evaluation as well as form and fit testing. The research initiative hereis to extend the idea of successive solidification to produce functional metal parts withengineering properties and dimensional tolerances comparable to conventionally producedparts.
The fabrication method involves the sequential buildup of laser melted and subse-quently solidified metallic droplets to form continuous, bulk components. The process
139
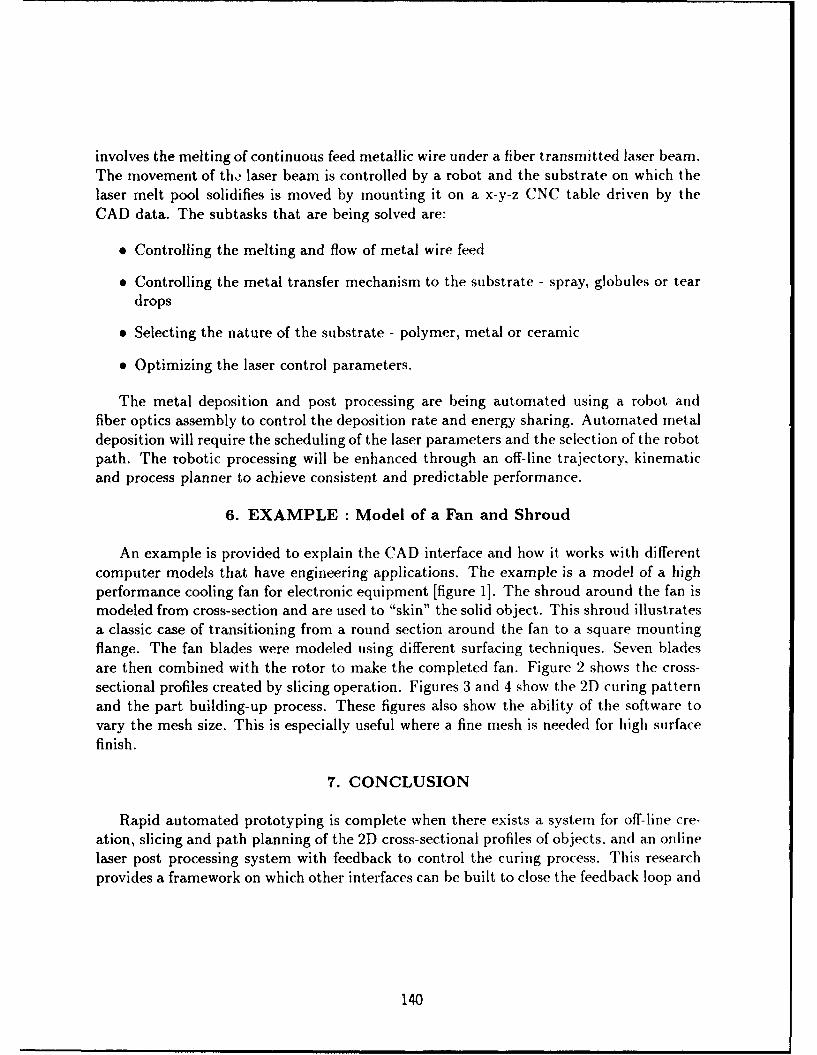
involves the melting of continuous feed metallic wire under a fiber transmitted laser beam.The movement of tho laser beam is controlled by a robot and the substrate on which thelaser melt pool solidifies is moved by mounting it on a x-y-z CNC table driven by theCAD data. The subtasks that are being solved are:
"* Controlling the melting and flow of metal wire feed
"* Controlling the metal transfer mechanism to the substrate - spray, globules or teardrops
"* Selecting the nature of the substrate - polymer, metal or ceramic
"* Optimizing the laser control parameters.
The metal deposition and post processing are being automated using a robot andfiber optics assembly to control the deposition rate and energy sharing. Automated metaldeposition will require the scheduling of the laser parameters and the selection of the robotpath. The robotic processing will be enhanced through an off-line trajectory, kinematicand process planner to achieve consistent and predictable performance.
6. EXAMPLE : Model of a Fan and Shroud
An example is provided to explain the CAD interface and how it works with differentcomputer models that have engineering applications. The example is a model of a highperformance cooling fan for electronic equipment [figure 1]. The shroud around the fan ismodeled from cross-section and are used to "skin" the solid object. This shroud illustratesa classic case of transitioning from a round section around the fan to a square mountingflange. The fan blades were modeled using different surfacing techniques. Seven bladesare then combined with the rotor to make the completed fan. Figure 2 shows the cross-sectional profiles created by slicing operation. Figures 3 and 4 show the 2D curing patternand the part building-up process. These figures also show the ability of the software tovary the mesh size. This is especially useful where a fine mesh is needed for high surfacefinish.
7. CONCLUSION
Rapid automated prototyping is complete when there exists a system for off-line cre-ation, slicing and path planning of the 2D cross-sectional profiles of objects, and an onlinelaser post processing system with feedback to control the curing process. This researchprovides a framework on which other interfaces can be built to close the feedback loop and
140
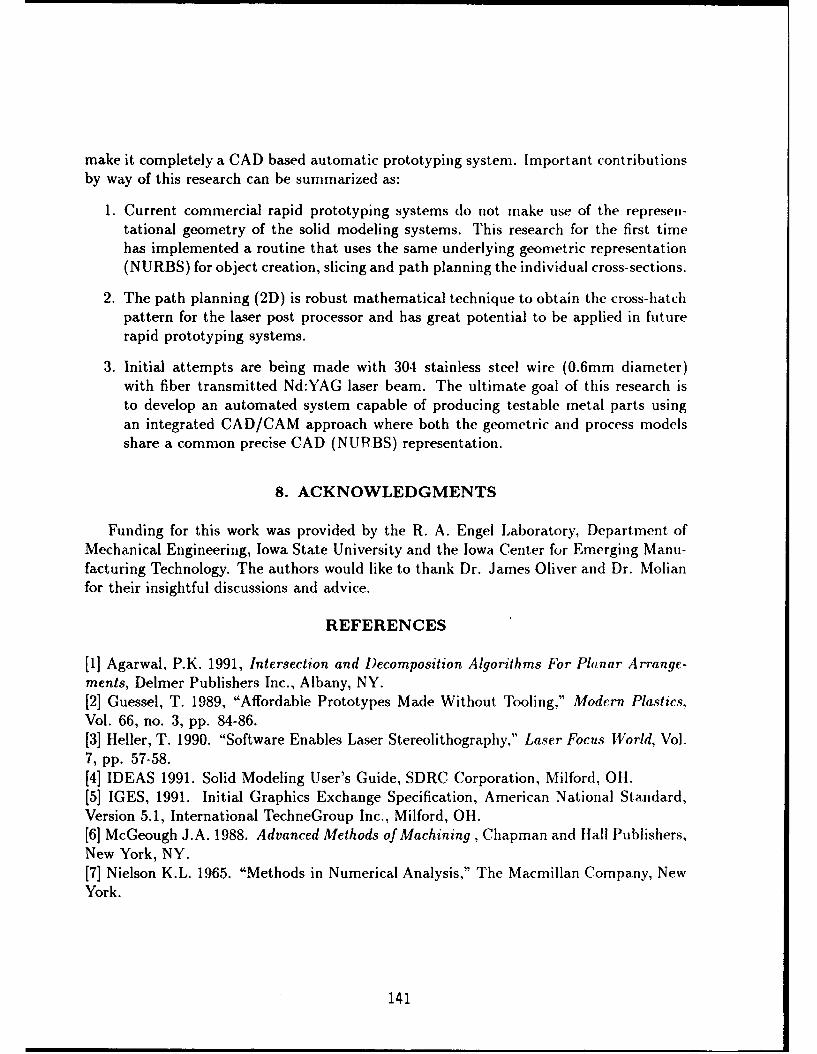
make it completely a CAD based automatic prototyping system. Important contributionsby way of this research can be summarized as:
1. Current commercial rapid prototyping systems do not make use of the represen-tational geometry of the solid modeling systems. This research for the first timehas implemented a routine that uses the same underlying geometric representation(NURBS) for object creation, slicing and path planning the individual cross-sections.
2. The path planning (2D) is robust mathematical technique to obtain the cross-hatchpattern for the laser post processor and has great potential to be applied in futurerapid prototyping systems.
3. Initial attempts are being made with 304 stainless steel wire (0.6mm diameter)with fiber transmitted Nd:YAG laser beam. The ultimate goal of this research isto develop an automated system capable of producing testable metal parts usingan integrated CAD/CAM approach where both the geometric and process modelsshare a common precise CAD (NUPBS) representation.
8. ACKNOWLEDGMENTS
Funding for this work was provided by the R. A. Engel Laboratory, Department ofMechanical Engineering, Iowa State University and the Iowa Center for Emerging Manu-facturing Technology. The authors would like to thank Dr. James Oliver and Dr. Molianfor their insightful discussions and advice.
REFERENCES
[1] Agarwal, P.K. 1991, Intersection and Decomposition Algorithms For Planar Arrange-ments, Delmer Publishers Inc., Albany, NY.[21 Guessel, T. 1989, "Affordable Prototypes Made Without Tooling," Modern Plastics,Vol. 66, no. 3, pp. 84-86.[3] Heller, T. 1990. "Software Enables Laser Stereolithography," Laser Focus World, Vol.7, pp. 57-58.[4] IDEAS 1991. Solid Modeling User's Guide, SDRC Corporation, Milford, OH.[5] IGES, 1991. Initial Graphics Exchange Specification, American National Standard,Version 5.1, International TechneGroup Inc., Milford, OH.[6) McGeough J.A. 1988. Advanced Methods of Machining, Chapman and Hall Publishers,New York, NY.[7] Nielson K.L. 1965. "Methods in Numerical Analysis," The Macmillan Company, NewYork.
141
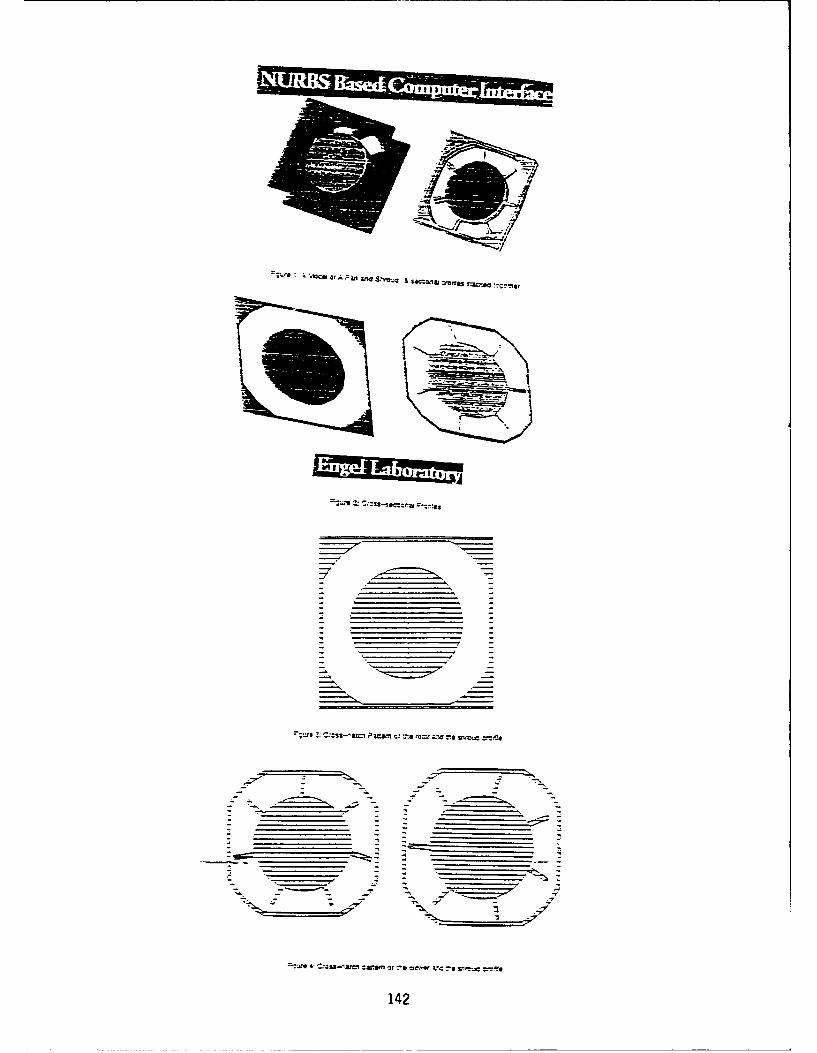
41all .~~~*
IMP
I 'Jaceor A,=3m a'A a mu
9-r - - cao- r7 r-
142
SIMULATION OF SOLID FREEFORM FABRICATION
Stuart Brown
Department of Materials Science and Engineering
Massachusetts Institute of Technology
Cambridge, Massachusetts 02139
Ahstr~ac
Solid freeform fabrication involves highly coupled, nonlinear, thermomechanical processes. Thisinvestigation simulates the formation of a simple SFF geometry, a right, rectangular prism withaspect ratios of 1:1:2. We include the effects of material variation, deposition path, and initial con-ditions to predict resulting distortion.
Most SFF processes are constrained in their range of application by certain mechanical andmicrostructural phenomena. Thermally-induced distortion limits the dimensional precision ofthese processes due to several inherent characteristics. First, the high temperature, local sinteringor solidification zone produces large thermal gradients that in turn cause plastic deformation anddistortion. Second, the subsequent shrinkage cooling of the high temperature and previouslyporous material introduce further distortion. Certain processes also introduce distortion due to dif-ferential cooling of a polymer stream.
In the case of 3D Printing, where the heating is primarily isothermal, distortion still results due tospatial variation in capillary forces developed between the binder and powder particles. This dis-tortion can occur in certain extensions of SLS technology, where the laser is used to bind metaland ceramic powders coated with a thermoplastic binder. Distortion also results from the unevenshrinkage of the printed, porous green body during sintering. Finally, stereolithography can expe-rience shrinkage due to the polymerization reaction [Iwanaga, et al., 1992; Weissman, et al.,1992].
This temperature-, polymerization- and binder-induced distortion also introduce residual stressesduring processing. Cooling of a local high temperature zone surrounded by a lower temperaturematerial introduces tensile stresses in the local zone. Unless removed, these tensile stresses can
143
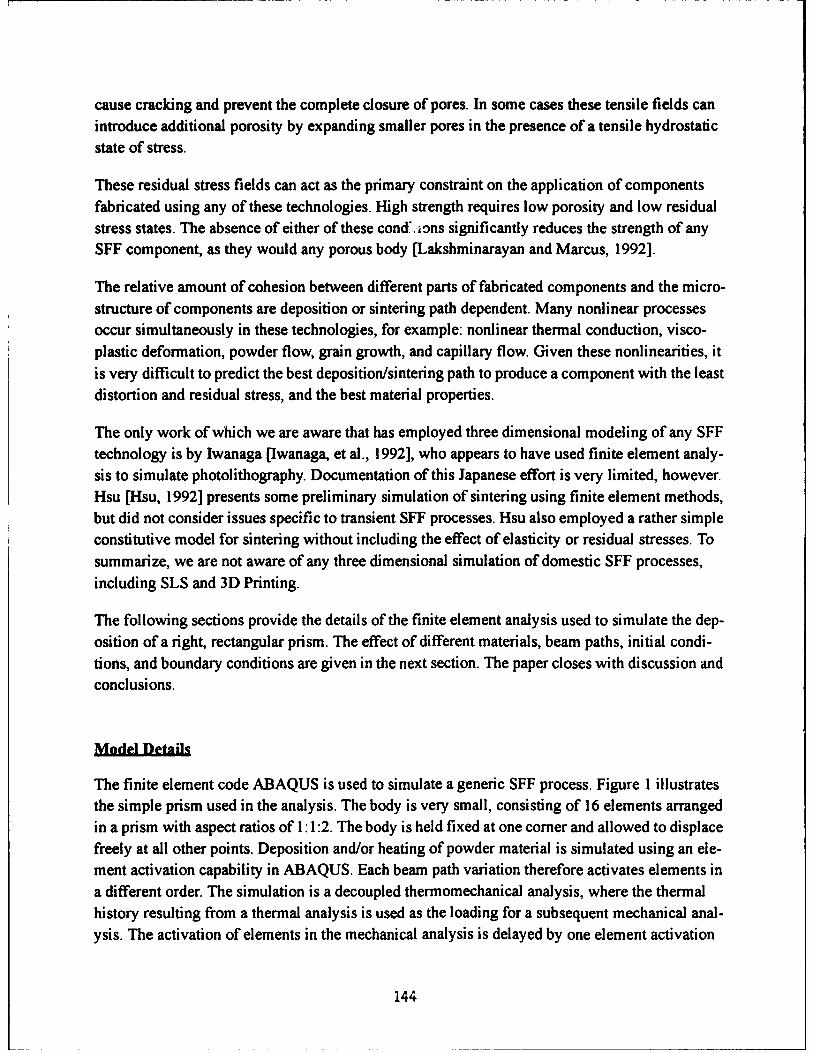
cause cracking and prevent the complete closure of pores. In some cases these tensile fields canintroduce additional porosity by expanding smaller pores in the presence of a tensile hydrostaticstate of stress.
These residual stress fields can act as the primary constraint on the application of componentsfabricated using any of these technologies. High strength requires low porosity and low residualstress states. The absence of either of these cond. ions significantly reduces the strength of anySFF component, as they would any porous body [Lakshminarayan and Marcus, 1992].
The relative amount of cohesion between different parts of fabricated components and the micro-structure of components are deposition or sintering path dependent. Many nonlinear processesoccur simultaneously in these technologies, for example: nonlinear thermal conduction, visco-plastic deformation, powder flow, grain growth, and capillary flow. Given these nonlinearities, itis very difficult to predict the best deposition/sintering path to produce a component with the leastdistortion and residual stress, and the best material properties.
The only work of which we are aware that has employed three dimensional modeling of any SFFtechnology is by Iwanaga [Iwanaga, et al., 1992], who appears to have used finite element analy-sis to simulate photolithography. Documentation of this Japanese effort is very limited, however.Hsu [Hsu, 1992] presents some preliminary simulation of sintering using finite element methods,but did not consider issues specific to transient SFF processes. Hsu also employed a rather simpleconstitutive model for sintering without including the effect of elasticity or residual stresses. Tosummarize, we are not aware of any three dimensional simulation of domestic SFF processes,including SLS and 3D Printing.
The following sections provide the details of the finite element analysis used to simulate the dep-osition of a right, rectangular prism. The effect of different materials, beam paths, initial condi-tions, and boundary conditions are given in the next section. The paper closes with discussion andconclusions.
The finite element code ABAQUS is used to simulate a generic SFF process. Figure 1 illustratesthe simple prism used in the analysis. The body is very small, consisting of 16 elements arrangedin a prism with aspect ratios of 1:1:2. The body is held fixed at one corner and allowed to displacefreely at all other points. Deposition and/or heating of powder material is simulated using an ele-ment activation capability in ABAQUS. Each beam path variation therefore activates elements ina different order. The simulation is a decoupled thermomechanical analysis, where the thermalhistory resulting from a thermal analysis is used as the loading for a subsequent mechanical anal-ysis. The activation of elements in the mechanical analysis is delayed by one element activation
144
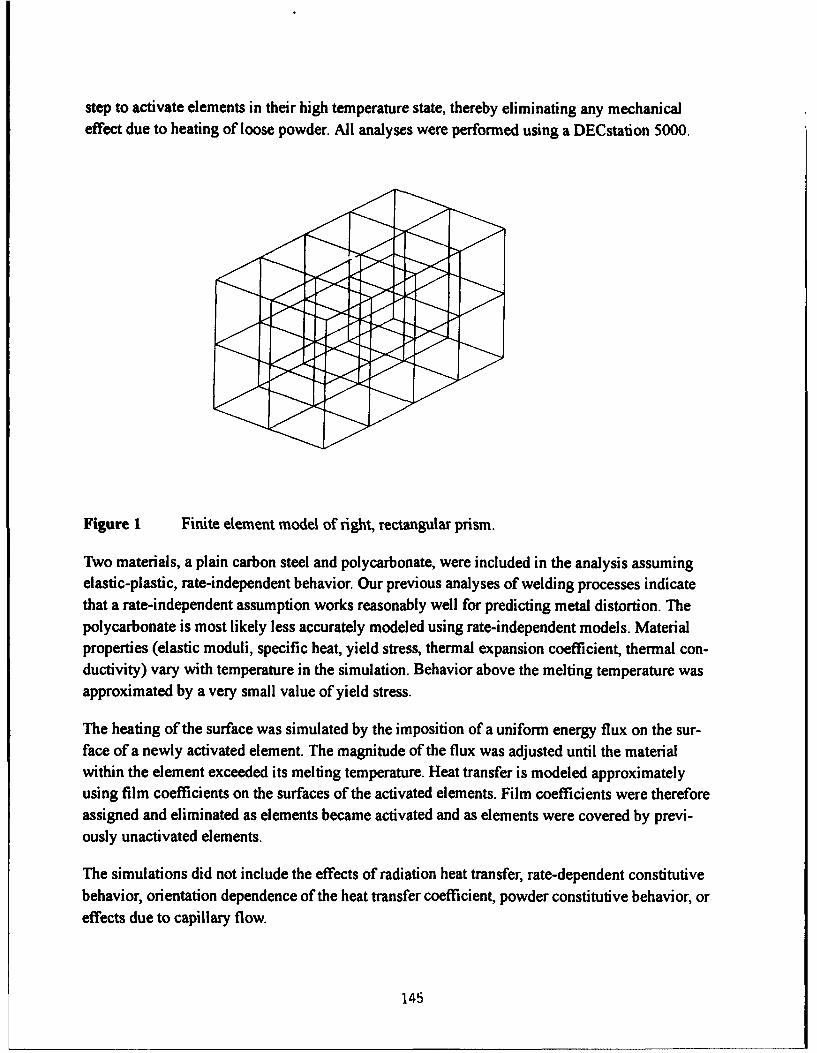
step to activate elements in their high temperature state, thereby eliminating any mechanicaleffect due to heating of loose powder. All analyses were performed using a DECstation 5000.
<<
Figure 1 Finite element model of right, rectangular prism.
Two materials, a plain carbon steel and polycarbonate, were included in the analysis assumingelastic-plastic, rate-independent behavior. Our previous analyses of welding processes indicatethat a rate-independent assumption works reasonably well for predicting metal distortion. Thepolycarbonate is most likely less accurately modeled using rate-independent models. Materialproperties (elastic moduli, specific heat, yield stress, thermal expansion coefficient, thermal con-ductivity) vary with temperature in the simulation. Behavior above the melting temperature wasapproximated by a very small value of yield stress.
The heating of the surface was simulated by the imposition of a uniform energy flux on the sur-face of a newly activated element. The magnitude of the flux was adjusted until the materialwithin the element exceeded its melting temperature. Heat transfer is modeled approximatelyusing film coefficients on the surfaces of the activated elements. Film coefficients were thereforeassigned and eliminated as elements became activated and as elements were covered by previ-ously unactivated elements.
The simulations did not include the effects of radiation heat transfer, rate-dependent constitutivebehavior, orientation dependence of the heat transfer coefficient, powder constitutive behavior, oreffects due to capillary flow.
145
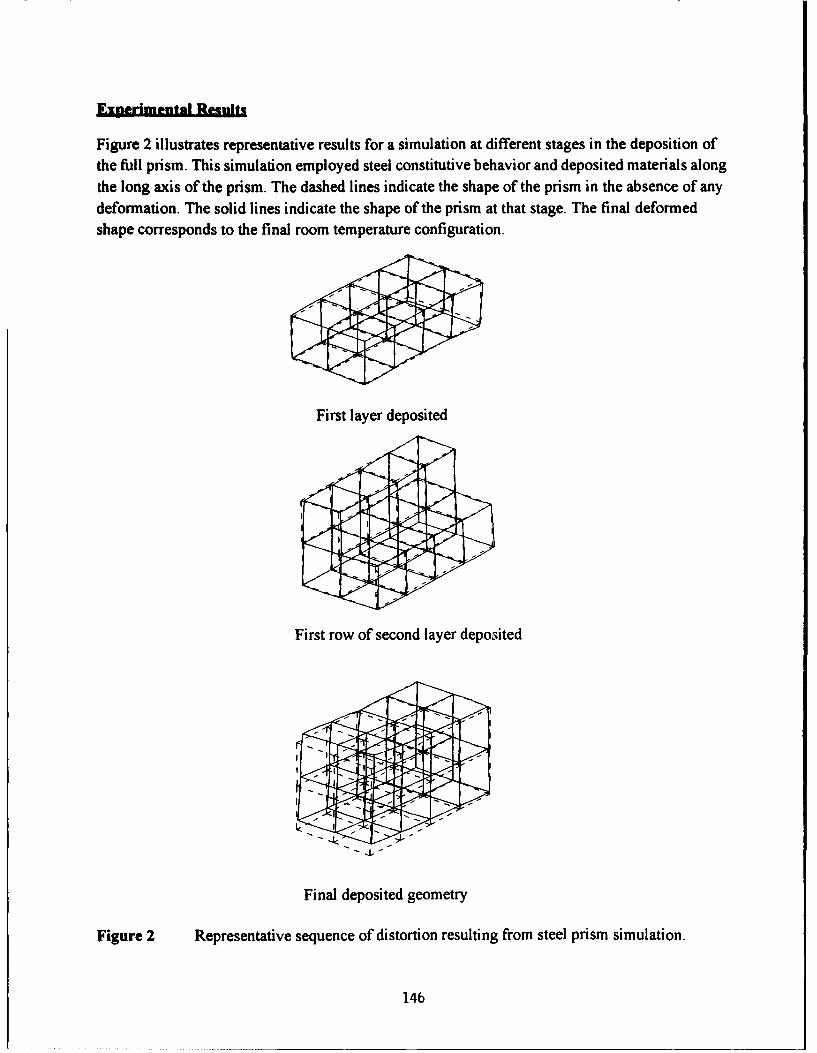
E~xnerimental Reutn~t
Figure 2 illustrates representative results for a simulation at different stages in the deposition ofthe full prism. This simulation employed steel constitutive behavior and deposited materials alongthe long axis of the prism. The dashed lines indicate the shape of the prism in the absence of any
deformation. The solid lines indicate the shape of the prism at that stage. The final deformedshape corresponds to the final room temperature configuration.
First layer deposited
First row of second layer deposited
Final deposited geometry
Figure 2 Representative sequence of distortion resulting from steel prism simulation.
146
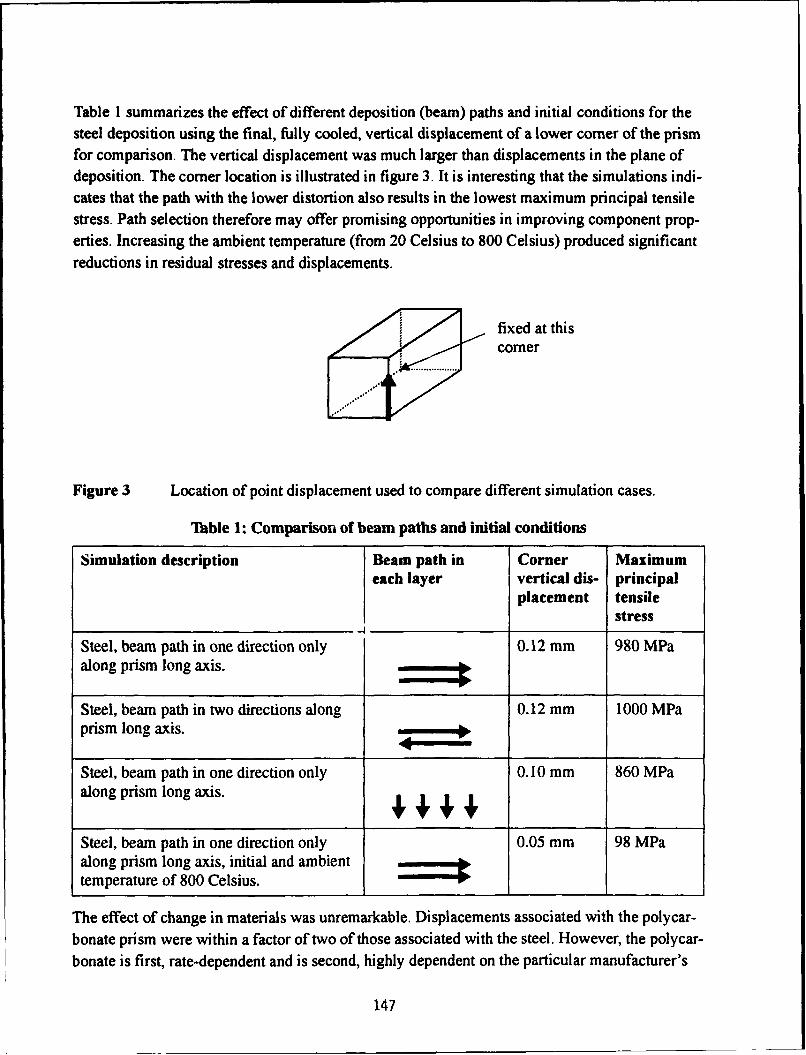
Table I summarizes the effect of different deposition (beam) paths and initial conditions for thesteel deposition using the final, fully cooled, vertical displacement of a lower comer of the prismfor comparison. The vertical displacement was much larger than displacements in the plane ofdeposition. The comer location is illustrated in figure 3. It is interesting that the simulations indi-cates that the path with the lower distortion also results in the lowest maximum principal tensilestress. Path selection therefore may offer promising opportunities in improving component prop-erties. Increasing the ambient temperature (from 20 Celsius to 800 Celsius) produced significantreductions in residual stresses and displacements.
fixed at thisS~comer
Figure 3 Location of point displacement used to compare different simulation cases.
Thble 1: Comparison of beam paths and initial conditions
Simulation description Beam path in Corner Maximumeach layer vertical dis- principal
placement tensilestress
Steel, beam path in one direction only 0.12 mm 980 MPaalong prism long axis. =
Steel, beam path in two directions along 0.12 mm 1000 MPaprism long axis. - 4
Steel, beam path in one direction only 0.10 mm 860 MPaalong prism long axis. € € €
Steel, beam path in one direction only 0.05 mm 98 MPaalong prism long axis, initial and ambienttemperature of 800 Celsius.
The effect of change in materials was unremarkable. Displacements associated with the polycar-bonate prism were within a factor of two of those associated with the steel. However, the polycar-bonate is first, rate-dependent and is second, highly dependent on the particular manufacturer's
147
formulation. More accurate simulation of the polycarbonate therefore requires more accurate con-stitutive models for the polymer thermal and mechanical behavior.
Dis*nion and Candlunin.
Given the guidance that such process modeling has provided to other processes, such as welding[Brown and Song, 1992], we expect even greater benefit to be derived in SFF. SFF processing isat a sufficiently early stage of maturity where many of the nonlinear process interactions are notwell understood. We believe that accurate simulation capabilities will provide substantial assis-tance in understanding these nonlinearities.
The simulation work proposed here is not coupled to any one particular SFF technology, butinstead is applicable to a number of SFF processes, including SLS, 3D Printing, Stereophoto-lithography and the Stratasys process. Consequently, the insights gained through this effort shouldassist the development of several competing processes.
Ae~knnwldgment
This work was funded primarily by the Office of Naval Research (grant number N00014-90-J-1938). Additional support was provided by the Materials Processing Center at M.I.T. and theRichard P. Simmons Career Development Chair in the Department of Materials Science and Engi-neering.
1 Brown, S. and Song, H., "Implications of 3D Numerical Simulations of Welding of LargeStructures," The Welding Journal, February 1992, pp. 55s-62s.
2 Brown, S. and Song, H., "Finite Element Simulation of Welding of Large Structures," Journalof Engineering for Industry, November 1992, pp. 441-451.
3 Cima, M., Sachs, E., Proceedings of the Solid Freeform Fabrication Symposium, Universityof Texas at Austin, 1991, pp. 187-194.
4 Cima, M., Lauder, A., Khanuja, S., Sachs, E., "Microstructural Elements of ComponentsDerived from 3D Printing," Proceedings Solid Freeform Fabrication Symposium, August 3-5,1992, University of Texas, Austin, Texas, pp. 220-227.
5 Crump, S.S., "The Extrusion Process of Fused Deposition Modeling," Proceedings, ThirdInternational Conference on Rapid Prototyping, June 7-10, 1992, University of Dayton, Ohio,pp. 91-100.
6 Hsu, M.B., "Numerical Simulation of Viscous Sintering under Mechanical Loads," Proceed-ings Solid Freeform Fabrication Symposium, August 3-5, 1992, University of Texas, Austin,Texas, pp. 188-195.
148
7 Iwanaga, S., Ohkawa, M., Igarashi, K., Kurihara, F., "Influence of Material Characterizationon Dimensional Stability," Proceedings, Third International Conference on Rapid Prototyp-ing, June 7-10, 1992, University of Dayton, Ohio, pp. 77-89.
8 Jacobs, PF., "Rapid Prototyping and Manufacturing," Society of Mechanical Engineers, 1992.
9 Lakshminarayan, U. and Marcus, H.L, "An Experimental Study of the Relationship betweenMicrostructure and Mechanical Properties of a Ceramic Composite Fabricated by SelectiveLaser Sintering," Proceedings Solid Freeform Fabrication Symposium, August 3-5, 1992,University of Texas, Austin, Texas, pp. 44-53.
10 Marcus, H.L., Beaman, J.J., Barlow, J.W. and Bourell, D.L., "From Computer to Componentin 15 Minutes: Integrated Manufacture of Three Dimensional Objects," Journal of Metals,April, 1990, p. 8.
11 Weissman, P., Bolan, B., and Chartoff, R., "Measurements of Linear Shrinkage and the Resid-ual Stresses Developed During Laser Photopolymerization," Proceedings, Third InternationalConference on Rapid Prototyping, June 7-10, 1992, University of Dayton, Ohio, pp. 103-112.
149
AUTOMATED 4 AXIS ADAPTIVE SCANNING
WITH THE DIGIBOTICS LASER DIGITIZER
INTRODUCTION
The DIGIBOT 3D Laser Digitizer is a high performance 3D input device whichcombines laser ranging technology, personal computing, and Microsoft Windows in anattractive desktop package.
With its full four-axis scanning capabilities, the DIGIBOT provides a simple,accurate, and quick way to copy or inspect complex, sculpted surfaces. The DIGIBOTprovides an effective solution for many industrial and academic problems involving 3Ddesign, inspection, replication, analysis, and visualization/animation. By measuringsequential points and producing a standard list of x/y/z coordinates, the DIGIBOTinterfaces to any CAD/CAM/CAE imaging or animation software that reads 3D points,contours, or triangular facets.
UNIQUE BENEFITS OF THE DIGIBOT SYSTEM
The following unique benefits are provided by the DIGIBOT technology:"* DIGIBOT's ranging system measures individual surface points without using
complex, non-linear imaging optics or sophisticated detector-array processingtechniques.
"* The ranging system provides high resolution and accuracy while maintaining asmall, fixed triangulation angle across a large work volume.
"* Unlike camera-based ranging devices, the Digibot Ranging System has a very longranging length with a small stand-off and does no suffer from focal problems suchas lens aberrations and depth-of-field issues.
"* Systems can be mechanically configured to provide up to two rotations and twotranslations between the object and the ranging system.
"* Advanced positioning capabilities make possible the complete, one-scanmeasurement of complex objects.
"* Adaptive 4 axis scanning procedures minimize shadowing effects, provide optimalmeasurement orientations, and produce homogenous point spacing with nomeasurement redundancy.
"* Semi-adaptive, systematic, and interactive scanning procedures provide efficientalternatives for less sculpted, more regular surfaces. A complete library of C-basedsystem functions can be used to develop custom scanning procedures.
"* The system is a peripheral device which interfaces to an IBM compatible PCthrough a controller board located inside the PC. The system is self-orienting andmaintenance free. The Digibot calibration/registration procedure is quick and easyto perform. This procedure is much less complicated than thecalibration/registration processes used for camera-based systems.
150
* DIGIBOT systems are easy to set up and move because of their small size and lowweight.
* Digibot's windows-based software provides a conventional, intuitive interface to thescanning procedures and a variety of data processing utilities, including contourediting, surface editing, polygonal surface generation, adaptive surface filtering, 3Dviewing, and data formatting.
DIGITIZING DESCRIPTION
Digitizing an object begins by first mounting the object on the platter in front of thelaser scanning system. The operator then uses the Windows interface to select from avariety of scanning procedures, each of which will be more or less appropriate for agiven object. Once selected, the operator instructs the system to execute the scanningprocedure. Typical scanning procedures, systematic or adaptive, provide samplingrates on the order of 10,000-100,000 points per hour. A course sampling grid can beexecuted in minutes while high resolution sampling of complex surfaces can take hours.
DATA (GEOMETRY AND TOPOLOGY)
The DIGIBOT device, including the control software resident on the customer'shost computer (IBM PC), is essentially an automatic data acquisition system.Typically, the next step after acquiring data with the digitizer is to manipulate the datafor some purpose such as graphical display or numerical analysis. At this time the usermust understand and appreciate the 'art and science' of using a set of discrete surfacepoints to mathematically represent a surface. In essence, the 3D coordinate values ofindividual surface points only provide information about the geometry of a surface. Acomplete surface representation also requires topology (i.e. information about how eachpoint is connected to its neighboring points). The selection of one scanning procedureover another will typically have a great influence on the amount of explicit topologyinformation that can be acquired during the digitizing process. Some scanningprocedures can provide complete topology while others provide only partial or notopology. Any data that is lacking in topology information must typically be subjectedto some form of mathematical topology generator. A procedure of this type mustattempt to establish topology from the available geometry. In general, the user must beaware that the selection of one scanning procedure over another also involves aconscious decision to use one data processing procedure over another.
ADAPTIVE SCANNING AND FILTERING
When measuring an analog subject, it is generally a good idea to perform a highresolution sampling procedure so that high frequency components are adequatelyresolved. This principle is appropriately applied when digitizing a 3-dimensionalobject. The representation of a sharp edge will typically require a dense grid of closelyspaced surface points. Although essential, high resolution scanning procedures alsopresent a problem. Slowly curving surfaces, which can be represented with relatively
151
few widely spaced surface points, tend to be over-sampled producing excessiveamounts of unnecessary data. The solution to this problem is provided by introducingsome form of filtering mechanism which uses the local rate of surface curvature toadaptively adjust the spacing between neighboring surface points. With the DIGIBOTsystem, a filtering procedure of this type can be introduced in two ways. Whendigitizing, an adaptive scanning procedure can be executed so that the spacing betweenconsecutive measurements is decreased for increasing rates of surface curvature. Afterdigitizing, the acquired data can be subjected to a flexible filtering procedure whichremoves unnecessary points in over-sampled surface regions. Generally, the secondapproach is the most attractive and flexible (i.e. it is the best to over-sample the objectand then use a data filter to selectively remove a desired set of surface points).
POINT MEASUREMENT BY TRIANGULATION
Individual range measurements are obtained using an active triangulation method.The ranging system is composed of a laser source and a translating photo-directiondetector. The laser source and the photo-direction detector are positioned at twocorners of a right triangle formed by the orthogonal intersection of the laser line andthe base line. At the third comer of the triangular system the laser beam illuminates asmall surface producing a diffuse point-source of light. The photo-detector is translateduntil the illuminated surface point enters the detector's field of view. At this time thesystem can accurately determine the distance and the angle theta from which the rangecan be computed.
Active triangulation requires that the surface be a relatively diffuse reflector andthat the angle of incidence between the laser line and the surface normal be withinlimits. Polished surfaces cannot be measured because, in most orientations, no lightwill be reflected back toward the photo-detector. Increasing incident angles will tendto illuminate an increasingly larger surface area while decreasing the amount of lightreflected back toward the photo-sensor.
There is a limit to the effectiveness of a triangulating range system. As surfaceconcavity increases, the photo-detector's view of points located within concave regionsbecomes increasingly obstructed, producing increasing limited laser/photo-sensororientations. Reduced probing angles provide improved probability but tend todecrease measurement resolution and accuracy. Typical applications will use a 30degree probing angle.
RELATIVE MOTIONS (DOFs) BETWEEN LASER BEAM AND OBJECT
Assuming that the ranging device has a long ranging length and does not need tomove toward or away from an object, there remains four forms of relative motionbetween an object and a laser beam needed to illuminate a point on any exposed surfaceof a 3-dimensional object. More specifically, a 3D digitizer needs two translational andtwo rotational degrees-of-freedom (DOFs) between the ranging system and object toprovide full 3D sampling capabilities. DIGIBOT offers two translational DOFs andone rotational DOF. This is also known as four axis scanning. The laser can be
152
translated vertically and horizontally while the object can be rotated about a verticalaxis. By not providing the fourth DOF (i.e. rotation of the object about a horizontalaxis), DIGIBOT is not capable of measuring points along vertical facing surfaces. Formost applications, the practicality of using a 4-DOF digitizer is questionable due tomechanical, operational, and data processing difficulties. The fourth DOF can,however, be partially realized by digitizing the same object multiple times in differentorientations. This approach requires that the multiple data sets be merged to form asingle surface mesh.
By using different combinations of its three DOFs, DIGIBOT is capable ofperforming three types of 3D scanning procedures:
1. two DOF scan using two translational DOFs,2. two DOF scan using translational DOF and rotational DOF, and3. three DOF scan using two translational DOFs and one rotational DOF.Each of these three scanning options is useful for different types of objects. Flat
objects are best digitized using two translational DOFs while convex objects are bestdigitized using both translation and rotation. Three DOF scanning offers a veryattractive method for digitizing complex objects with non-axial geometry, multiplecontours, and concavities. The following three discussions provide a more detaileddescription of when and how the different scanning options can be used to digitizedifferent types of objects.
SCANNING WITH TWO TRANSLATIONAL DOFs
Probably the simplest scanning procedure that can be performed with DIGIBOTemploys two translations of the ranging system. As a result, this type of scanningoption should be used to measure relatively flat surfaces. Once the user has decidedwhich combination of motions are appropriate for a given application, a decision mustbe made to perform either a systematic scanning procedure or an adaptive scanningprocedure.
The surface mesh generated from adaptive data is very attractive because itproduces a homogeneous, evenly spaced set of points on all exposed regions of asurface. An adaptive mesh can also be optimized to provide more points in highfrequency regions and fewer points in regions where high sample density isunnecessary. Though the data produced by adaptive scanning procedures is attractive,in practice it is generally more practical for simple-shaped objects to employ fullysystematic procedures with only two DOFs. The reasoning for this is two fold:
1. the grid topology of systematic data is provided implicitly while the meshtopology of adaptive data must, by some method, be explicitly specified andrecorded (this can be difficult), and
2. systematic data from a high density grid can be adaptively filtered to produce anadaptive surface mesh that is very similar in quality to that produced by adaptivescanning procedures.
Though adaptive scanning methods are used for most applications, systematicscanning procedures should be used whenever possible because they are easy toperform and they provide structured data that can be flexibly filtered to provide an
153
optimal data sub-set. Another advantage to using high frequency systematic samplingprocedures is realized when the user decides that more data is needed. It is generallyeasier to refilter a set of data than to re digitize an object.
SCANNING WITH ONE TRANSLATIONAL DOF ANDONE ROTATIONAL DOF
A very popular form of 2-DOF scanning utilizes both rotation and translation. Byfirst positioning the laser line to pass orthogonal through the center of rotation, a set ofradial measurements can be obtained by rotating the object and vertically translating theranging system. This scanning configuration is useful for convex objects becauseacceptable incident angles are possible only at locations where the surface normal doesnot depart significantly from the radial direction. When choosing between systematicversus adaptive scanning procedures, the very same reasoning, introduced in theprevious discussion describing 2-translation scanning, can again be used. A systematicscanning procedure will produce a data-grid (with complete topology and filteringcapabilities) by incrementally rotating the object and incrementally translating theranging system. Some subtle properties of rotation contour sampling are:
"* points with a surface tangent that passes through, or near, the center of rotationcannot be measured,
"* negative radiuses can be measured because the active range of the rangingsystem extends past the center of rotation,
"• closer spacing between measurements occurs along contours that are closer tothe center of rotation,
"* off-center objects are sampled during two portions of a complete rotationcausing partial loss of topology and partial loss of the contour on two sideswhere large incident angles make measurement impossible, and
"* most concave surfaces cannot, or can only partially, be measured.
Two DOF scanning procedures are very attractive because they are easy to performand they produce data that is easy to work with. Unfortunately, the type of object thatcan be digitized using 2-DOF methods is limited. With its third DOF, DIGIBOT iscapable of digitizing much more complex objects, including off-center contours,multiple contours, and concavities. However, as a general rule, 2-DOF scanningprocedures should be used whenever possible to take advantage of gridded data and toavoid the difficulties associated with the processing and compatibility of 3-DOF data.The reasoning behind this rule will become clearer after reading the followingdescription of 3-DOF scanning.
154
SCANNING WITH ALL THREE DOFs (4 AXIS SCANNING)
The work volume generated using all three DOFs (i.e. rotation of the object andboth vertical and horizontal translation of the laser line ) will be cylindrical in shape.With three DOFs, DIGIBOT provides a work volume with an 18" diameter and a 18"height. The advantage of using a third DOF is two fold:
1. the surface normal at any given V int is limited only by the requirement that itnot depart significantly from the horizontal, and
2. each individual point can be measured from a variety of different perspectives(i.e. the laser beam can illuminate a single surface point from a variety ofdifferent directions).
Complex contours can be better sampled along a horizontal plane by both rotatingthe object and translating the ranging system. Deep concavities and multiple contourscan only be measured using both rotation and translation while, for complex contoursof this type, rotations by itself will yield comparatively poor results.
An efficient 3-DOF procedure for sampling contours along a horizontal cross-section requires adaptive feedback control. The direction and rate of curvature along acontour are computed using previously acquired points to help predict the location andsurface normal of a target point (i.e. the next point to be measured). In this way, theobject is rotated and the ranging system is translated to provide an optimalmeasurement perspective (i.e., the laser as normal as possible to the surface) for eachconsecutive target point as the system adaptively tracks a contour. For convexsurfaces, the optimal measurement perspective is obtained with a zero incident anglebetween the laser beam and the surface normal. For concave surfaces, optimalmeasurement perspectives are obtained when the laser line is closely pivoted about theouter edges of the concavity. Orientations of this type will typically produce non-zeroincident angles. A very useful result of adaptively moving along a contour can be seenby measuring consecutive points. The system effectively acquires complete topologyinformation (i.e. the points are connected in the same order in which they are acquired)and, when multiple contours exist, each contour is scanned separately (i.e. oncestarted, the systems attempts to complete a contour by pivoting around any otherobstructing contours.)
Though two DOFs are used to scan adaptively within a horizontal plane, the thirdDOF is typically used to systematically position the ranging system at verticallydisplaced planes. For this reason, this type of 3-DOF scanning could be referred to as'semi-adaptive.' It is important to recognize that adaptive scanning along planar cross-sections provides complete contour topology in the horizontal direction. This is a greatadvantage but, by blindly moving to vertically displaced planes, semi-adaptive scanningwill provide no vertical topology between neighboring cross-sections (i.e. noinformation is provided to establish how points in one planar contour are connected topoints in a corresponding, vertical-displaced planar contour). As a result, a procedurefor vertical topology generation must be employed before a valid surface mesh can beobtained from semi-adaptive data.
155
A filtering mechanism can be incorporated into the procedure for semi-adaptivescanning to provide a flexible way to discriminate between rapid and slow rates ofsurface curvature. By using the local rate of surface curvature to adjust the spacingbetween consecutive measurements, a relatively small number of measurements areneeded to define a contour containing sharp comers and slow curving sides. Without afiltering mechanism, a contour of this type must be sampled frequently to guaranteethat the sharp comers will be adequately resolved. Such a procedure will requiresignificantly more time and will, in this case, produce an over-abundant amount of dataalong slow curving surfaces.
There is, unfortunately, a competing disadvantage to using an adaptive filteringmechanism along planar cross-sections when performing a semi-adaptive scanningprocedure. By systematically stepping to consecutive planes, no filtering mechanism isapplied in the vertical direction producing a non-homogenous surface mesh composedof long, skinny polygons. This problem can be resolved by employing a vertical filtereither during or after the scanning procedure. When scanning, a fully adaptiveprocedure is fast and concise but it is difficult to implement and the resulting data mustexplicitly specify topology. After scanning, a vertical data filter must first be appliedto produce a homogenous surface mesh which will also require explicit topologyinformation. As a consequence, unless time is a factor, or for some other specificreason, it is generally more practical to execute a semi-adaptive scanning procedurewith equal sample spacing in both the vertical direction and along horizontal contours.The data produced from such a procedure can be subjected to a vertical topologygenerator, and then filtered to extract the desired data subset.
SUMMARY
The Digibot 3D Laser Digitizer is a high performance 3D input device whichcombines laser ranging technology, personal computing, and Microsoft Windows in adesktop package. With its full four-axis scanning capabilities, the Digibot provides asimple, accurate, and quick way to copy or inspect complex, sculpted surfaces. TheDigibot provides an effective solution for many industrial and academic problemsinvolving 3D design, inspection, replication, analysis, and visualization/animation Bymeasuring sequential points and producing a standard list of x/y/z coordinates, theDigibot interfaces to any CAD/CAM/CAE imaging or animation software that reads3D points, contours, or triangular facets.
The DIGIBOT uses a unique triangulation technique that does not use complicatedimaging optics or array detectors. The scan head resides outside of the scan region anddoes not move back and forth from the object to maintain focus of the laser beam spot.Consequently, scanning is simple and efficient. Adaptive scanning proceduresintelligently position the beam spot on the object's surface while effectively walkingfrom one point to the next. For complex objects, this technique, unique to theDIGIBOT, can reach into deep concavities, undercuts, and between surfaces to producea complete, homogeneous data mesh. Simple systematic scanning procedures producegrid data for single faced (i.e., flat-faced) objects or convex, cylindrical shapedobjects.
156

Three dimensional modeling is becoming the technology of choice for the majorityof designers and manufacturers. In order to be effective, many industries need toautomate the acquisition of 3D geometry into the computer. The Digibot solves thisneed with industry leadership in technology, usability, and affordability.
157
Stereo~Ithography 1993:
QuickCastTm
Drm. Thomas H. Pang and Paul F. JacobsResearch and Development Department
3D Systems, Inc.26081 Avenue Hall
Valencia, California 91355
Abstract
Previously, StereoLithography (SL) generated solid patterns had limited success in highlyaccurate shell investment casting applications. The majority of the failures involved the cracking ofthe ceramic investment casting shell. However, the recent invention of the QuickCast " build-styleand the development of a new epoxy resin, XB 5170, led to an unprecedented level of success inthe burnout process of SL patterns from investment casting shells. Unlike conventional SLbuilding techniques, QuickCast involves the building of SL patterns with essentially hollowstructures. When the low viscosity liquid epoxy resin is drained from the interior of the pattern,voids are formed, allowing the cured resin to collapse inwards during the autoclave and burn-outstages. This effectively prevents the shells from cracking as the result of outward thermalexpansion. 3D Systems formed QuickCast teams with three respected foundries to test shellinvestment casting using SL patterns. A test part having relatively complex geometries (i.e. aBoeing 737 cargo door bracket) was selected. To date, this SL part has been successfully cast inaluminum, titanium, beryllium-copper, and stainless steel, with RMS surface finish as low as 1micrometer, without any subsequent finishing operations.
Background
Recently, one of the authors visited a large foundry that has specialized in investmentcasting for decades. Until just a few years ago, typical projects involved highly complexgeometries in hundred to multi-thousand lot quantities for various aerospace applications. On suchprojects, the development of the tooling typically cost from $ 30,000 to as much as $ 200,000.Obviously, this was a lot of money. However, considering the critical characteristics of the finalcomponents, investment casting was often the least expensive production method capable ofsatisfying the specifications and was commonly the preferred approach. Furthermore, theamortized cost of the tooling, on a per part basis, was quite reasonable.
As a consequence of the profound changes in the aerospace business within the past twoyears, the situation has altered significantly. This foundry is now receiving hundreds of requestsfor quotation (RFQs) on projects involving one, two, or three prototype parts. Obviously, iftraditional methods were used, the amortized cost of the tooling could be tens to hundreds of
158
thousands of dollars per component. This is clearly not very economical. It is also not especiallycompetitive. As a result, the company has been forced to no-bid hundreds of RFQs. Under the bestof conditions this would not be desirable, but in a serious recession, sustained non-responsivenesscould be critical to their future viability.
An economical means to produce accurate patterns with a smooth surface finish was clearlyneeded. Further, these patterns must be sufficiently robust to allow handling, assembly, andceramic shell investing without breakage. Also, the pattern material must have characteristics thatallow for excellent burnout without damage to the shell. And finally, prototype quantities shouldrequire minimal initial pattern generation expense. Stereolithography can be a solution if a processcan be developed to address all these elements. While definitely ambitious, 3D Systems hasadvanced considerably towards this goal. Much of the progress has been led by improvedphotopolymers working in concert with still newer part building methods discussed below.
New Epoxy Resin XB 5170
Ciba-Geigy (Switzerland) and the Research and Development Department at 3D Systemshave been involved in a program of joint SL photopolymer research and development since 1988.Ciba-Geigy, one of the leading chemical companies in the area of epoxy chemistry, had beenlooking at SL epoxy resins for sometime. In July, 1993, Ciba-Geigy released a new resin for theSLA-250 based on epoxy chemistry. The epoxy resin has an excellent set of physical, mechanical,and dimensional properties that exceed those of acrylate resins in almost every single category.'Namely, XB 5170 has
1) very low viscosity2) high laser-cured (green) modulus3) high postcured modulus4) good elongation at break5) good impact strength6) substantially reduced thin flat slab distortion7) almost twice the overall UserPart accuracy compared to XB 5081-1 acrylate resin
(Note: XB 5081-1 was formerly the most accurate SL resin until XB 5170 wasintroduced.)
8) negligible curl during the SL building process9) superb dimensional stability in the laser-cured state.
It is clear that XB 5170 possesses many of the key stereolithography characteristics neededfor the generation of substantially more accurate parts. The combined properties make this epoxyresin, XB 5170, the resin of choice, especially for the new QuickCast Ihibuild style.
159
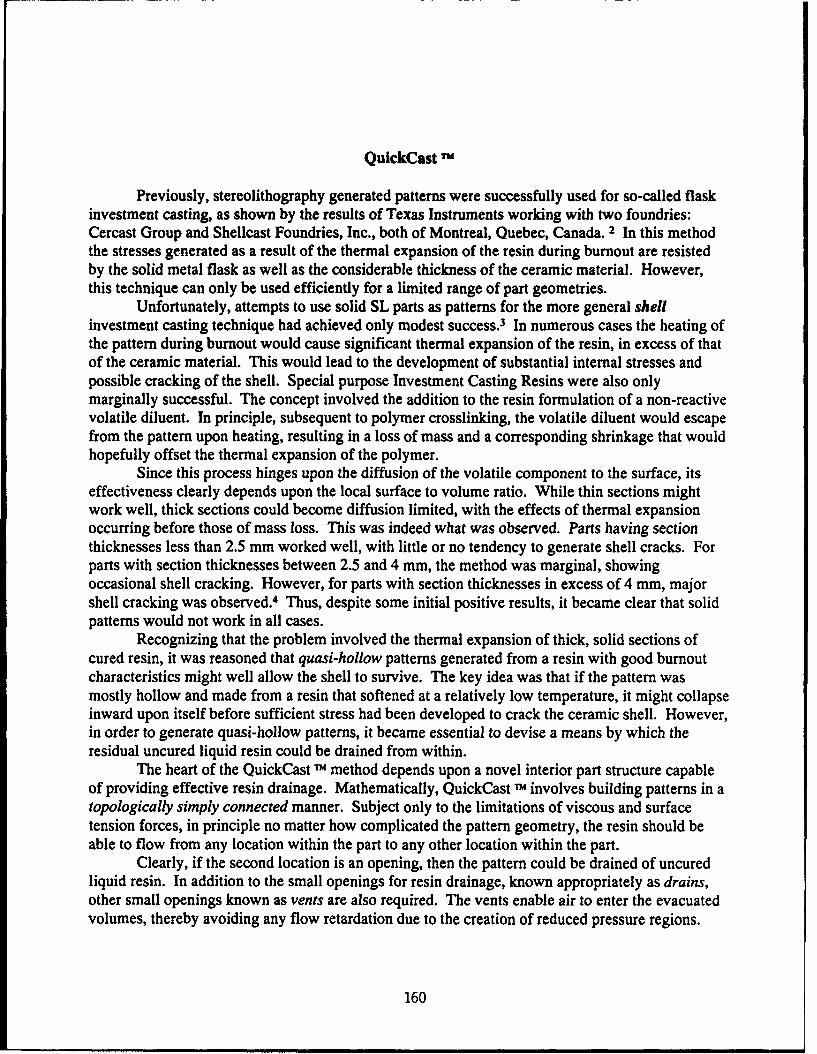
QuickCastm
Previously, stereolithography generated patterns were successfully used for so-called flaskinvestment casting, as shown by the results of Texas Instruments working with two foundries:Cercast Group and Shellcast Foundries, Inc., both of Montreal, Quebec, Canada. 2 In this methodthe stresses generated as a result of the thermal expansion of the resin during burnout are resistedby the solid metal flask as well as the considerable thickness of the ceramic material. However,this technique can only be used efficiently for a limited range of part geometries.
Unfortunately, attempts to use solid SL parts as patterns for the more general shellinvestment casting technique had achieved only modest success. 3 In numerous cases the heating ofthe pattern during burnout would cause significant thermal expansion of the resin, in excess of thatof the ceramic material. This would lead to the development of substantial internal stresses andpossible cracking of the shell. Special purpose Investment Casting Resins were also onlymarginally successful. The concept involved the addition to the resin formulation of a non-reactivevolatile diluent. In principle, subsequent to polymer crosslinking, the volatile diluent would escapefrom the pattern upon heating, resulting in a loss of mass and a corresponding shrinkage that wouldhopefully offset the thermal expansion of the polymer.
Since this process hinges upon the diffusion of the volatile component to the surface, itseffectiveness clearly depends upon the local surface to volume ratio. While thin sections mightwork well, thick sections could become diffusion limited, with the effects of thermal expansionoccurring before those of mass loss. This was indeed what was observed. Parts having sectionthicknesses less than 2.5 mm worked well, with little or no tendency to generate shell cracks. Forparts with section thicknesses between 2.5 and 4 mm, the method was marginal, showingoccasional shell cracking. However, for parts with section thicknesses in excess of 4 mm, majorshell cracking was observed.4 Thus, despite some initial positive results, it became clear that solidpatterns would not work in all cases.
Recognizing that the problem involved the thermal expansion of thick, solid sections ofcured resin, it was reasoned that quasi-hollow patterns generated from a resin with good burnoutcharacteristics might well allow the shell to survive. The key idea was that if the pattern wasmostly hollow and made from a resin that softened at a relatively low temperature, it might collapseinward upon itself before sufficient stress had been developed to crack the ceramic shell. However,in order to generate quasi-hollow patterns, it became essential to devise a means by which theresidual uncured liquid resin could be drained from within.
The heart of the QuickCast TM method depends upon a novel interior part structure capableof providing effective resin drainage. Mathematically, QuickCast Tu involves building patterns in atopologically simply connected manner. Subject only to the limitations of viscous and surfacetension forces, in principle no matter how complicated the pattern geometry, the resin should beable to flow from any location within the part to any other location within the part.
Clearly, if the second location is an opening, then the pattern could be drained of uncuredliquid resin. In addition to the small openings for resin drainage, known appropriately as drains,other small openings known as vents are also required. The vents enable air to enter the evacuatedvolumes, thereby avoiding any flow retardation due to the creation of reduced pressure regions.
160
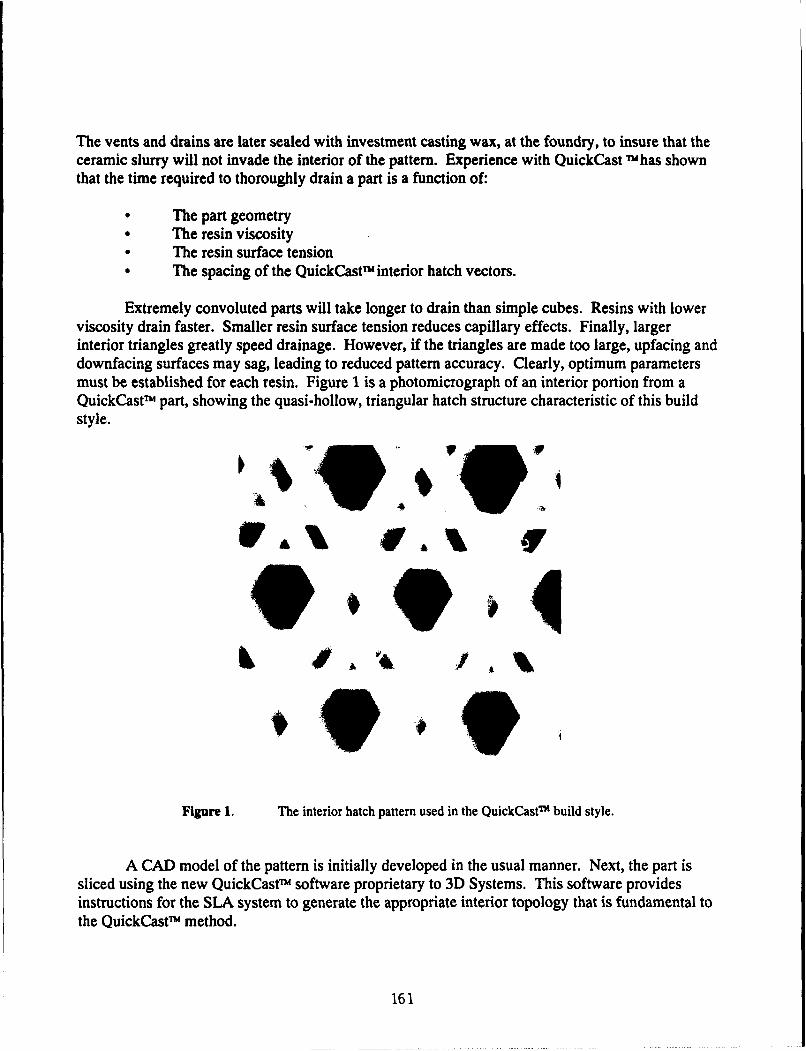
The vents and drains are later sealed with investment casting wax, at the foundry, to insure that theceramic slurry will not invade the interior of the pattern. Experience with QuickCast Im has shownthat the time required to thoroughly drain a part is a function of:
* The part geometry* The resin viscosity* The resin surface tension* The spacing of the QuickCastTm interior hatch vectors.
Extremely convoluted parts will take longer to drain than simple cubes. Resins with lowerviscosity drain faster. Smaller resin surface tension reduces capillary effects. Finally, largerinterior triangles greatly speed drainage. However, if the triangles are made too large, upfacing anddownfacing surfaces may sag, leading to reduced pattern accuracy. Clearly, optimum parametersmust be established for each resin. Figure 1 is a photomicrograph of an interior portion from aQuickCastTm part, showing the quasi-hollow, triangular hatch structure characteristic of this buildstyle.
1%9,
Figure 1. The interior hatch pattern used in the QuickCastm build style.
A CAD model of the pattern is initially developed in the usual manner. Next, the part issliced using the new QuickCastTM software proprietary to 3D Systems. This software providesinstructions for the SLA system to generate the appropriate interior topology that is fundamental tothe QuickCastTM method.
161
Upon completion of the SLA building process, the pattern is allowed to drain under theinfluence of gravity. With the new epoxy resin, XB 5170, simple parts drain within 30 minutes,while even the extremely complicated geometries require only a few hours. Subsequent todrainage, the part is simply wiped clean. XB 5170 leaves little residual photopolymer on exteriorsurfaces after about 45 minutes. The part is then postcured in a standard PCA for 1 hour.
Next, the pattern is wrapped in bubble-pack, boxed and shipped to an appropriate foundrythat is thoroughly familiar with QuickCastTM. The foundry will then seal the vents and drains with athin coating of investing casting wax, add their usual wax gating, etc., and apply pretested ceramicshell coatings that have proven to be fully compatible with the resin used to fabricate theQuickCast"'pattern. This is one of the reasons that prior testing and approval of the foundry isessential for success.
At this point the wax gating is removed in an autoclave. During the early testing ofQuickCastTm this step was problematic. However, over the past six months we have learned thatsuccessful autoclaving (i.e. removing the wax gating without pattern expansion causing damage tothe ceramic shell) depends upon:
* The type of resin used to build the pattern* The spacing of the interior hatch vectors* How well the resin has been drained from the pattern.
All three of these items affect the so-called void ratio, or R., defined by the relation
Rv = 1-[Mq/Ms]
where Mq is the mass of the QuickCastTm pattern, and Mr is the mass of a solid STAR-WEAVETMpart of identical size. Obviously, when the parts have not been drained at all, and Mq=Ms, thenR,=0. Conversely, the smailer the value of Mq the higher the value of Rv. Observations fromnumerous foundry autoclaving tests have shown that the greater the value of Rv, the higher theprobability of successful autoclaving. Recently, using XB 5170, void ratios as high as 0.67 havebeen achieved. As a result, successful autoclaving is now occurring for about 80 % of the patternstested. Further improvements in this ratio are anticipated as experience with QuickCastT increases.
Subsequent to autoclaving, the shell is cured and the QuickCastTM pattern is burned out all inone step. Here the shell is elevated from room temperature to roughly 1,000°C within about 2hours in a fully aspirated furnace. The shell is then maintained at this temperature for another 1 - 2hours and finally allowed to cool. Since the resin is almost entirely hydrocarbon based, if theburnout is done in a sufficiently oxygen rich environment, the vast majority of the pattern materialwill be converted to carbon dioxide and water vapor. Any residual ash should be removed withcompressed air or fluid rinsing and drying.
Next, the appropriate metal is poured into the ceramic shell mold and allowed to cool. Inthe case of either titanium or magnesium this must be done under vacuum to avoid oxygencontamination and subsequent damage to the surface of the casting. For aluminum, ferrous metaland beryllium-copper alloys conventional methods apply.
162
Finally, the shell is broken away, the gates removed and the usual finishing steps taken suchas grinding, sandblasting, milling, etc. The end result is then a precision shell investment castmetal part produced directly from a stereolithography generated pattern; bypassing the traditionalrequirements for expensive and time consuming hard tooling.
Results to Date
3D Systems formed QuickCast IN teaming arrangements with three respected NorthAmerican foundries in May-June 1992. These were the following:
* Solidiform, Inc. Fort Worth, Texas, USA* Precision Castparts Corp., Portland, Oregon, USA* Cercast Group, Montreal, Quebec, Canada.
QuickCast Tu patterns were generated in five different resins: three for the SLA-250 andtwo for the SLA-500. These patterns involved a variety of different hatch spacings, drainageintervals, and post processing methods.
Early in the testing phase it was found that the most critical step involved the removal ofwax gating during the autoclave process. A resin that softens at elevated temperature is definitelybeneficial. Further, a very high correlation was found between successful autoclaving and theextent to which the pattern had been drained of excess resin. In all cases those patterns with thehighest void ratios, always produced the best results.
After some initial trial and error, all three foundries have now achieved successful resultsusing QuickCast TH patterns for shell investment casting. To date, a Boeing 737 cargo door brackethas been successfully cast in the following metals:
* A-356 Aluminum Solidiform* A-357 Aluminum Cercast* TI 6 Ai-4V Titanium PCC* C-20 Beryllium-Copper Cercast• 304 L Stainless Steel PCC
Figure 2 shows a QuickCast Tm pattern of the cargo door bracket, and examples of the finalmetal parts in stainless steel, beryllium-copper and aluminum.
163
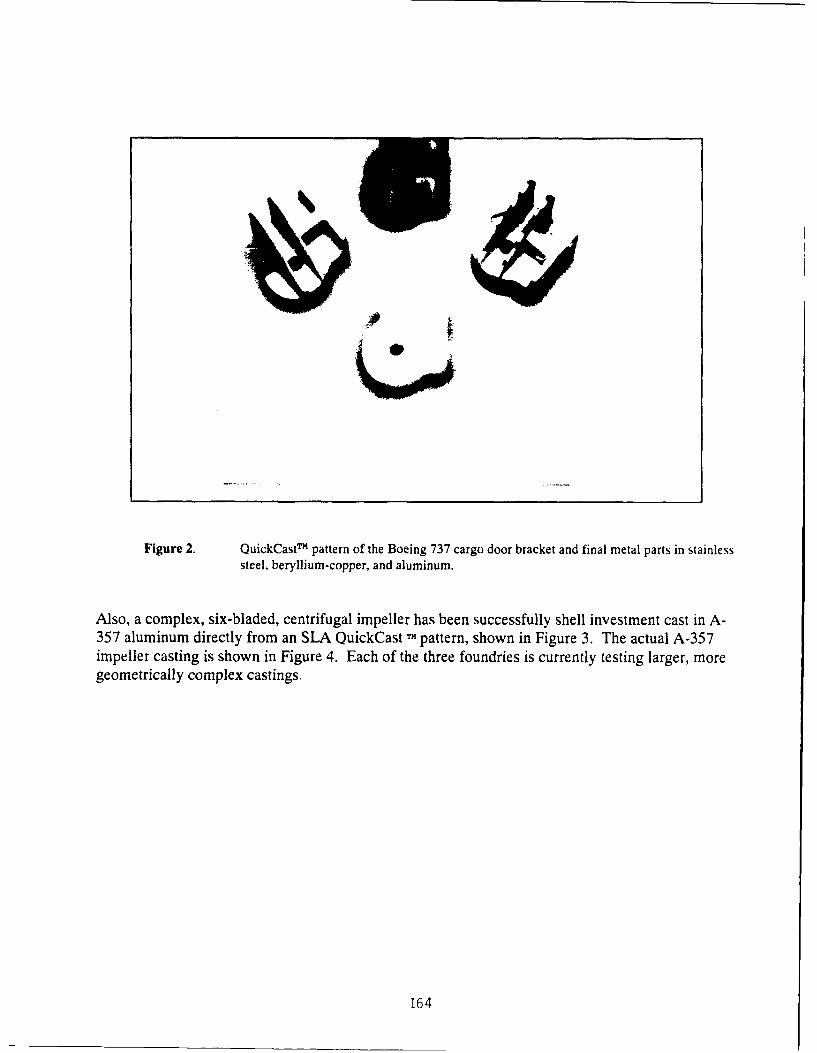
Figure 2. QuickCastTm pattern of the Boeing 737 cargo door bracket and final metal parts in stainlesssteel, beryllium-copper, and aluminum.
Also, a complex, six-bladed, centrifugal impeller has been successfully shell investment cast in A-357 aluminum directly from an SLA QuickCast TM pattern, shown in Figure 3. The actual A-357impeller casting is shown in Figure 4. Each of the three foundries is currently testing larger, moregeometrically complex castings.
164
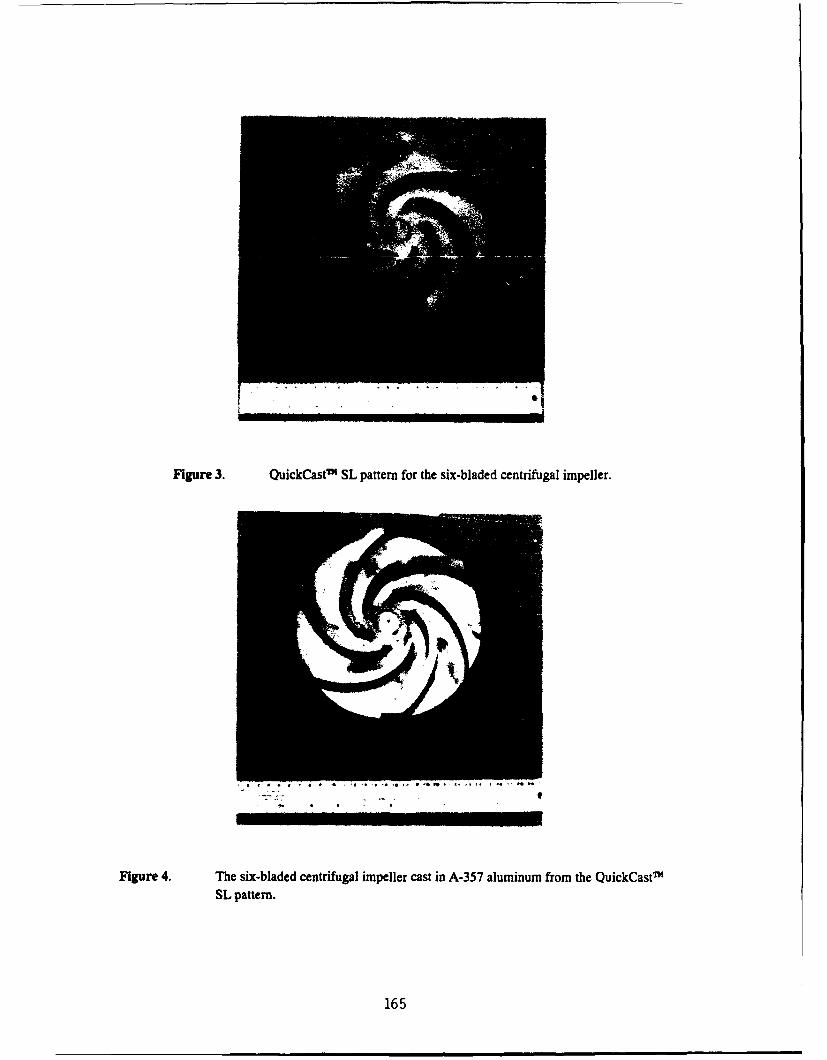
Figure 3. QuickCastTh SL pattern for the six-bladed centrifugal impeller.
Figure 4. The six-bladed centrifugal impeller cast in A-357 aluminum from the QuickCastmSL pattern.
165
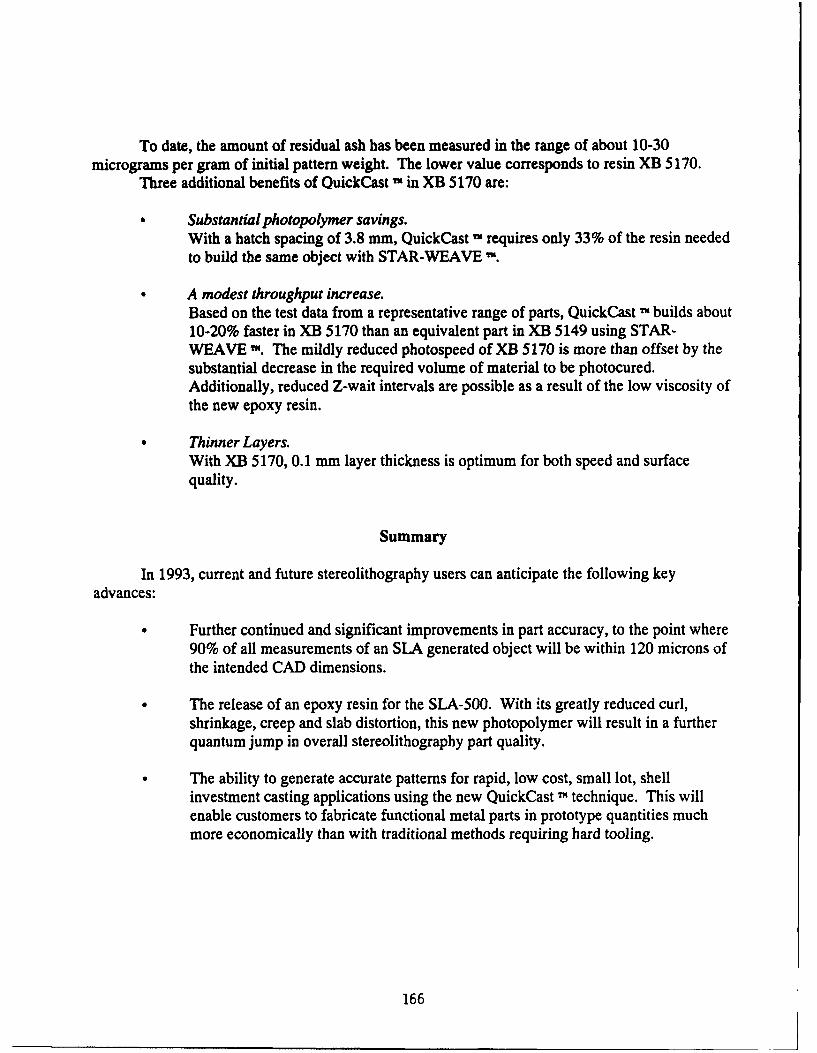
To date, the amount of residual ash has been measured in the range of about 10-30micrograms per gram of initial pattern weight. The lower value corresponds to resin XB 5170.
Three additional benefits of QuickCast T" in XB 5170 are:
Substantial photopolymer savings.With a hatch spacing of 3.8 mm, QuickCast - requires only 33% of the resin neededto build the same object with STAR-WEAVE '.
A modest throughput increase.Based on the test data from a representative range of parts, QuickCast TM builds about10-20% faster in XB 5170 than an equivalent part in XB 5149 using STAR-WEAVE ". The mildly reduced photospeed of XB 5170 is more than offset by thesubstantial decrease in the required volume of material to be photocured.Additionally, reduced Z-wait intervals are possible as a result of the low viscosity ofthe new epoxy resin.
Thinner Layers.With XB 5170, 0.1 mm layer thickness is optimum for both speed and surfacequality.
Summary
In 1993, current and future stereolithography users can anticipate the following keyadvances:
Further continued and significant improvements in part accuracy, to the point where90% of all measurements of an SLA generated object will be within 120 microns ofthe intended CAD dimensions.
The release of an epoxy resin for the SLA-500. With its greatly reduced curl,shrinkage, creep and slab distortion, this new photopolymer will result in a furtherquantum jump in overall stereolithography part quality.
The ability to generate accurate patterns for rapid, low cost, small lot, shellinvestment casting applications using the new QuickCast -" technique. This willenable customers to fabricate functional metal parts in prototype quantities muchmore economically than with traditional methods requiring hard tooling.
166
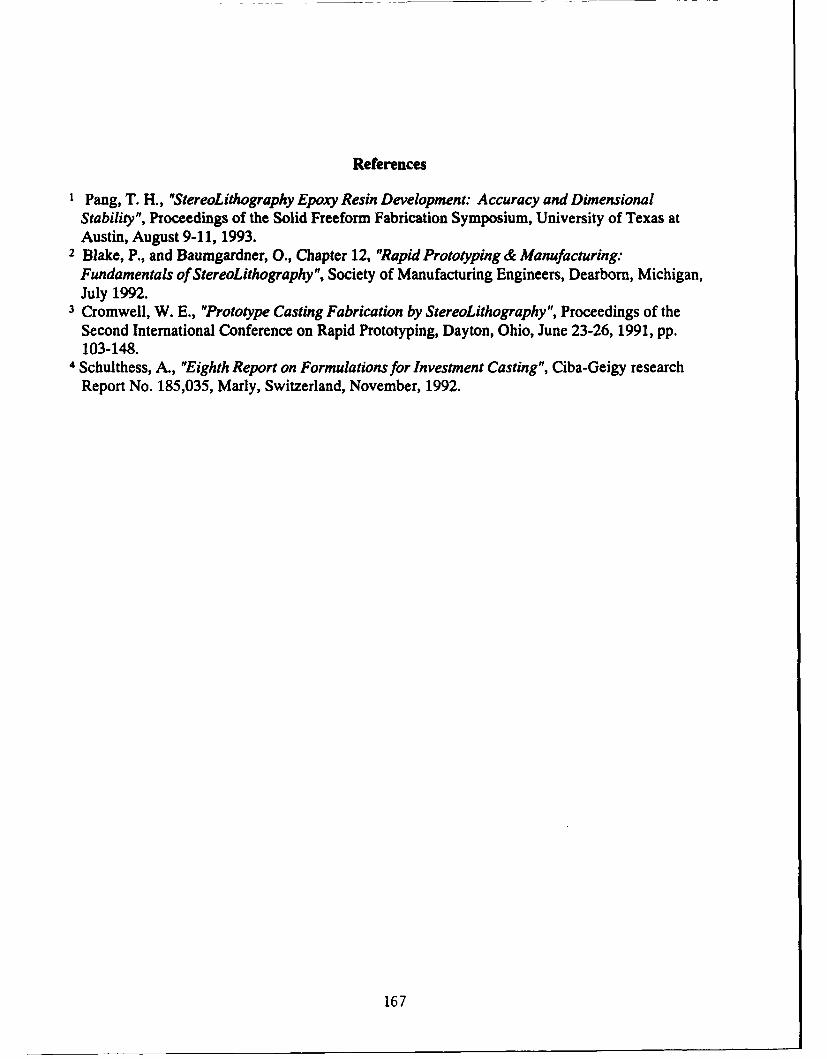
References
1 Pang, T. H., "StereoLithography Epoxy Resin Development. Accuracy and DimensionalStability", Proceedings of the Solid Freeform Fabrication Symposium, University of Texas atAustin, August 9-11, 1993.
2 Blake, P., and Baumgardner, 0., Chapter 12, "Rapid Prototyping & Manufacturing:Fundamentals of StereoLithography", Society of Manufacturing Engineers, Dearborn, Michigan,July 1992.
3 Cromwell, W. E., "Prototype Casting Fabrication by StereoLithography", Proceedings of theSecond International Conference on Rapid Prototyping, Dayton, Ohio, June 23-26, 1991, pp.103-148.
4 Schulthess, A., "Eighth Report on Formulations for Investment Casting", Ciba-Geigy researchReport No. 185,035, Marly, Switzerland, November, 1992.
167
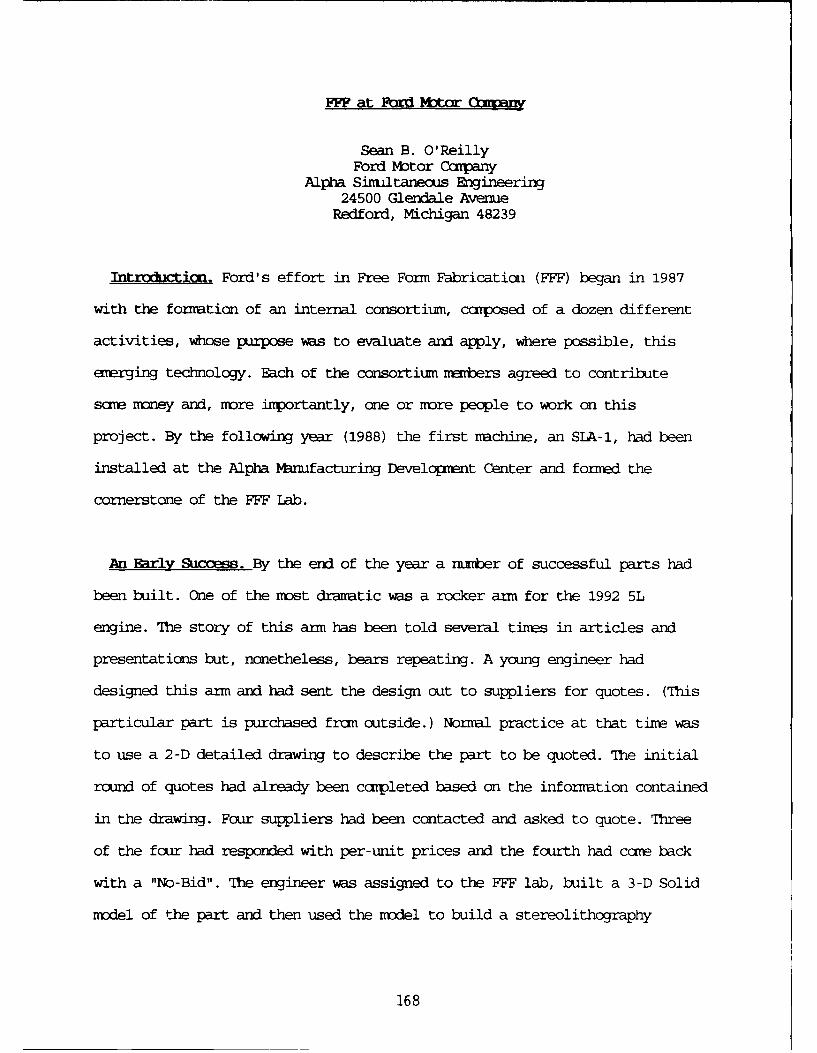
FFF at Ford r b mbty
Sean B. O'ReillyFord Motor Caxpany
Alpha Simultaneous Engineering24500 Glendale Avenue
Redford, Michigan 48239
Introducticri. Ford's effort in Free Form Fabrication (FFF) began in 1987
with the fornmation of an internal consortium, composed of a dozen different
activities, whose purpose was to evaluate ard apply, where possible, this
emerging technology. Each of the consortium iedbers agreed to contribute
saoe money and, nore importantly, one or more people to work on this
project. By the following year (1988) the first machine, an SLA-l, had been
installed at the Alpha Manufacturing Development Center and formed the
cornerstone of the FFF Lab.
An Early Success. By the end of the year a number of successful parts had
been built. One of the most dramatic was a rocker arm for the 1992 5L
engine. The story of this ann has been told several times in articles and
presentations but, nonetheless, bears repeating. A young engineer had
designed this arm and had sent the design out to suppliers for quotes. (This
particular part is purchased from outside.) Normal practice at that time was
to use a 2-D detailed drawing to describe the part to be quoted. The initial
round of quotes had already been completed based on the information contained
in the drawing. Four suppliers had been contacted and asked to quote. Three
of the four had responded with per-unit prices and the fourth had come back
with a "No-Bid". The engineer was assigned to the FFF lab, built a 3-D Solid
model of the part and then used the model to build a stereolithography
168
prototype. It was only upon inspection of the prototype that he discovered a
problen with the design. He corrected the design and built a second prototype
to verify that the problem had been solved. Since the design had changed, a
second round of quoting was initiated. This time, however, plastic
stereolithography prototypes were sent to the suppliers in place of revised
drawings. Each of the suppliers came back with t lumer quoLe than on the
first round and the supplier who had "no-bid" first time around, came in at
a price roughly 50 cents lower than any one else. This reduction anmonted to
several million dollars of savings per year.
Fundamental Value of FFF. The rocker arm story illustrates the basic
value of FFF technology. The ability to take a ccnputer model and build an
accurate prototype of it in a few hours or days provides a new, high-
bandwidth nedium of canmnication for infornation about parts. Consider the
process by which 2-D drawings are produced today: the engineer conceptualizes
the part in his head; makes a few rough 2-D sketches and passes these along
to a designer or detailer who nust first get an accurate concept of the
part, then, conceptually pass planes through the conceptualized part at
various angles and then accurately conceptualize how these cross-sections
would look; then he begins drawing these conceptualized cross-sections. This
is a very conplex and error-prone process. Once the drawings are cnrplete,
they are sent to a nmnufacturer who nust then reverse the process conceptually
and reconstruct the original design intent fran the drawn cross-sectional
infornmation - an even more ccxplex and error-prone process. All of this
conceptual gyrating is completely short-circuited by FFF. The FFF prototype
becares the prinary method of cornunicating all of the geometric intricacies
169
of the part. In a sense, representations of the part are replaced by the
part itself. It is never easy to quantify the benefits of improved
ccminications, but the millions in savings spawned by the plastic rocker
arm certainly indicate that "..there's gold in them thar hills! ! !..."
FFF and Prototypirm. Prototypes have been in the mainstream of invention,
engineering and product develomnt since Alley Cop first laid chisel to
stone in search of the wheel. In the past, the role of prototyping has been
severely limited by our inability to produce prototypes rapidly and cost-
effectively. FFF holds out the prospect of being able to provide prototypes
at virtually every stage of product development. Let me emphasize that this
ability is not here today, but is coming. Prototypes seem to fall into three
main categories, related to the stage of development of the product: "touch
- feel" prototypes, "form, fit, limited function" prototypes and fully
functional prototypes.
"Touch-Feel" Prototypes: Like the rocker arm cited above, these prototypes
are used in the early stages of design for a number of purposes - concept
verification, canmunicatioui of design intent, even for verifying the CAD
representation of the part. We have seen numerous exanples where the FFF
prototype showed up a flaw ir the CAD model that was not detectable on the
screen. This is the area where FFF currently has its greatest impact.
"Form, Fit, Limited Function" Prototypes: Components designed by different
activities must often be assembled to form an integrated system. The ability
to build each component quickly and accurately is of tremendous value in
assembly studies, in finding interferences and in discovering problems early
enough that they are easily handled. Again FFF prototypes are having a
170
tremendous impact in this arena. Fig. 1. shows a partial engine block, made
in an SLA 500. This block was sent to the plant which was to manufacture it.
The plastic block was used to check out tooling, fixturing, material handling
equipment and dunnage. A number of potentially costly problem were discovered
and corrected before the final specification for the plant equipment. Fig.
2. shows an experirental intake manifold made on a Cubital solider. This
manifold was attached to an engine and run through several power cycles to
determine the effect of the design on engine performance. We have made many
such manifolds on Cubital and SLA machines. The ability to actually test a
new design within a few days is a capability that our engineers have never
had before. This is an exanple of a "limited functionality" prototype.
Several of our divisions now make this type of prototype where the
functionality is primarily due to the gecmetry. Manifolds, throttle bodies,
pump housings, alternator housings and AC housings are all exanples of this
kind of application.
"Full Functionality" Prototypes: For the nmst part, FFF-generated parts
do not have the material properties required for full functionality. In this
case, the FFF part is used as a model or pattern in a more traditional type
of manufacturing process. Fig. 3a shows a stereolithography transmission
case and Fig. 3b shows the aluminum casting that was made in our experimental
foundry. Figs. 4a and 4b show a stereolithography crankshaft and the iron on
made from it. In both instances, our engineers have gotten functional
prototypes in a fraction of the tine it would have taken using conventional
methods. Sand, plaster and investment casting of metals and molding of same
piastics (e.g. silicone rubber molding of polyurethane ) are all sped up
171
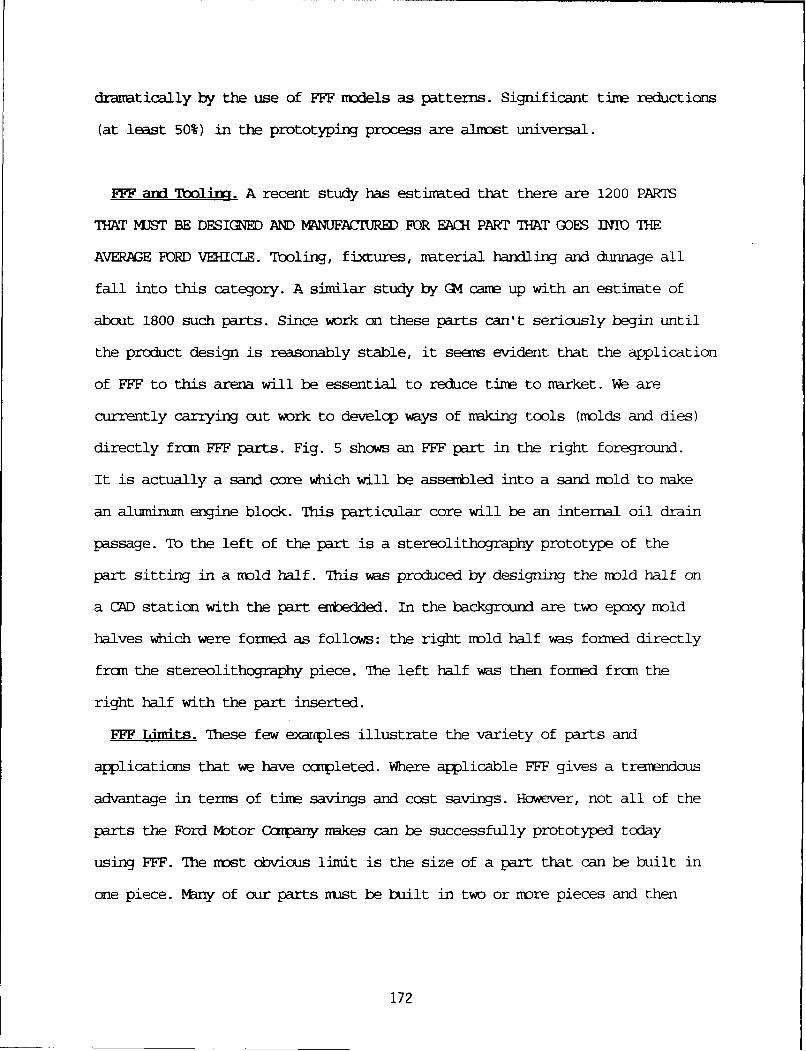
dramatically by the use of FFF models as patterns. Significant time reductions
(at least 50%) in the prototyping process are almost universal.
FFF and Tooling. A recent study has estimated that there are 1200 PARTS
THAT MJST BE DESIGNED AND MNUFACIUREL FOR EACH PART THAT GOES INTO THE
AVERAGE FORD VEHICLE. Tooling, fixtures, material handling and dunnage all
fall into this category. A similar study by GM came up with an estimate of
about 1800 such parts. Since work on these parts can't seriously begin until
the product design is reasonably stable, it seems evident that the application
of FFF to this arena will be essential to reduce time to market. We are
currently carrying out work to develcp ways of making tools (molds and dies)
directly fran FFF parts. Fig. 5 shows an FFF part in the right foreground.
It is actually a sand core which will be assembled into a sand mold to make
an aluminum engine block. This particular core will be an internal oil drain
passage. To the left of the part is a stereolithography prototype of the
part sitting in a mold half. This was produced by designing the mold half on
a CAD station with the part embedded. In the background are two epoxy mold
halves which were formed as follows: the right mold half was formed directly
frcn the stereolithography piece. The left half was then formed frcrn the
right half with the part inserted.
FFF Limits. These few exxcples illustrate the variety of parts and
applications that we have completed. Where applicable FFF gives a tremendous
advantage in terns of time savings and cost savings. However, not all of the
parts the Ford Motor Company makes can be successfully prototyped today
using FFF. The most obvious limit is the size of a part that can be built in
one piece. MNny of our parts must be built in two or more pieces and then
172
joined. In many cases this is a perfectly satisfactory process, producing
acceptable prototypes. However, this approach doesn't work, for exnple, in
the area of large sheet metal parts. No machine available today can build a
durable hood or fender out of any raterial. Along with size, the layering
process appears to be an impediment in very thin but extended parts.
Ccxrpared to more traditional processes for making prototypes, FFF is nothing
short of a miracle. After a while however, speaking of limits, one begins to
beccme inpatient with the build speed of today's FFF machines. (An exaple
of the infinite perversity of hcmo sapiens? - They're NEVER satisfied.)
Given the rapid (and seemingly accelerating) pace of development in the
FFF arena and the fact that the industry is still in its infancy, we can
expect to see many of today's limits overcome in very short order.
173
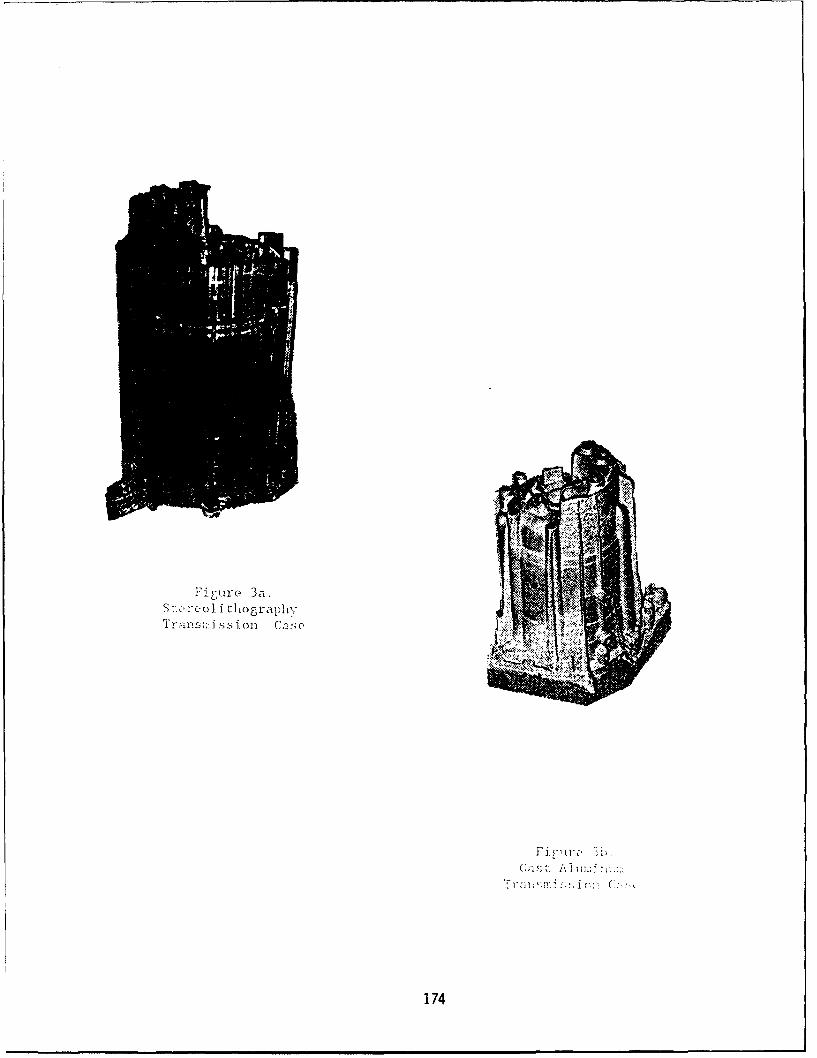
Jivurc' 3a.St,.'croli tliograipl y
174
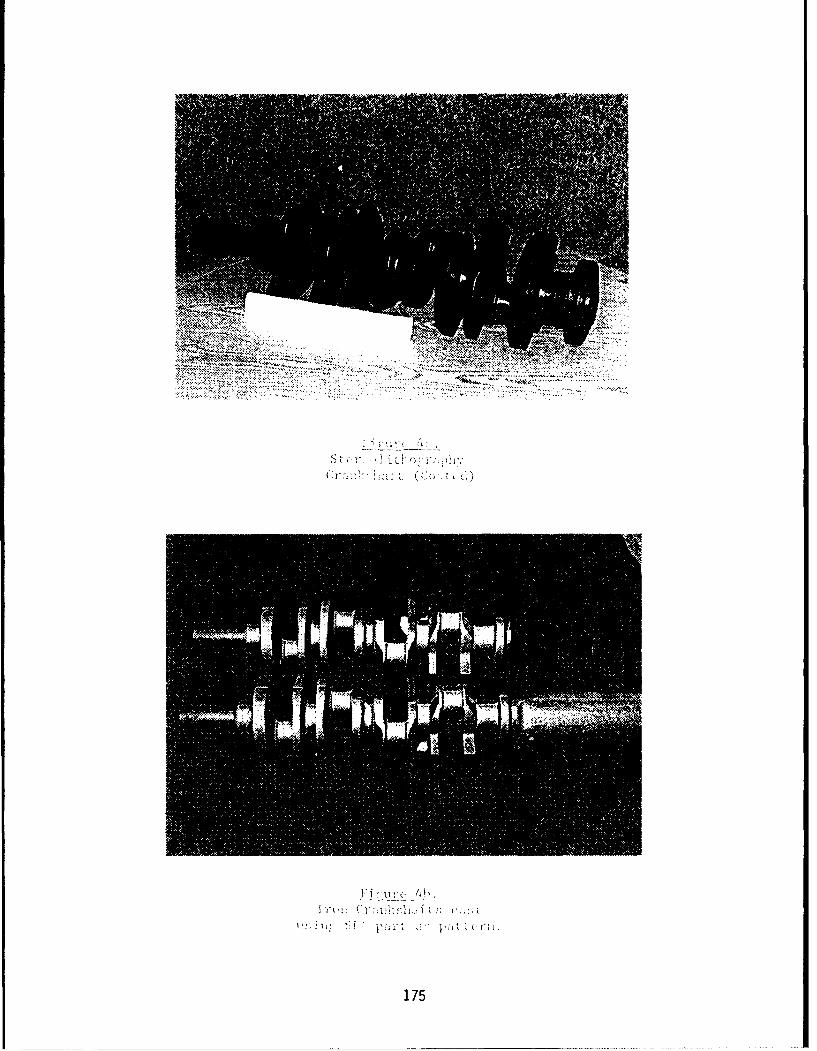
5: c
175
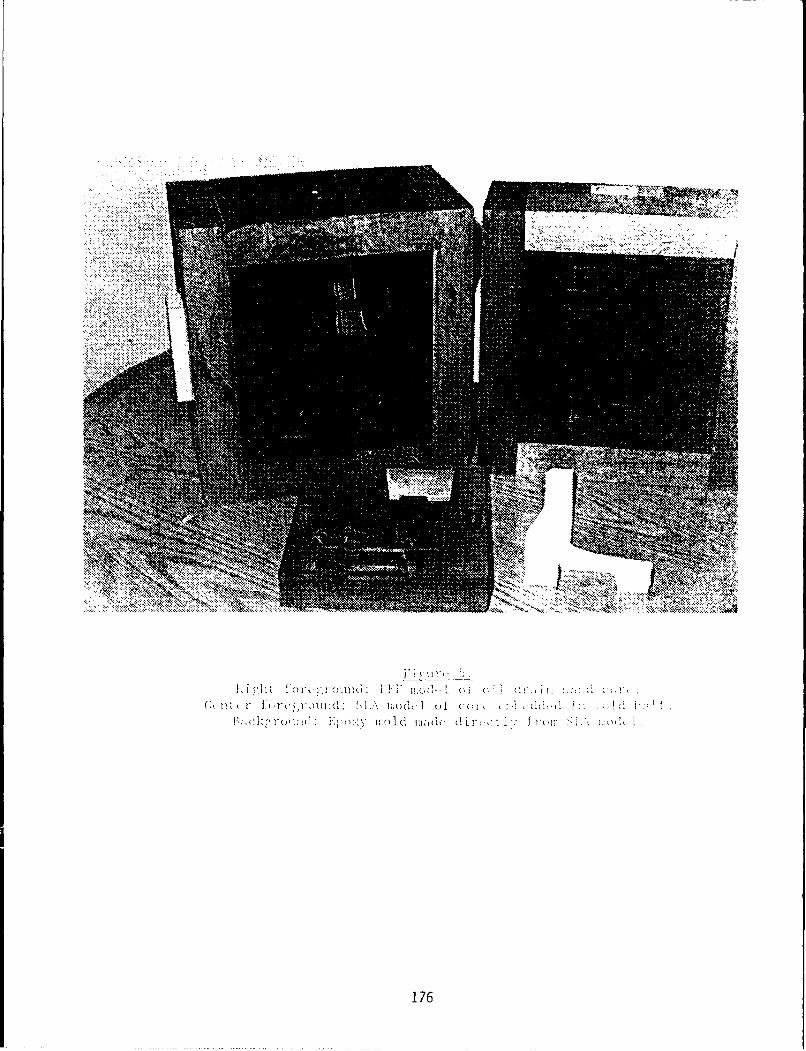
I of~1
Ick I o' .I( I~ ( 1 In" (It f
176
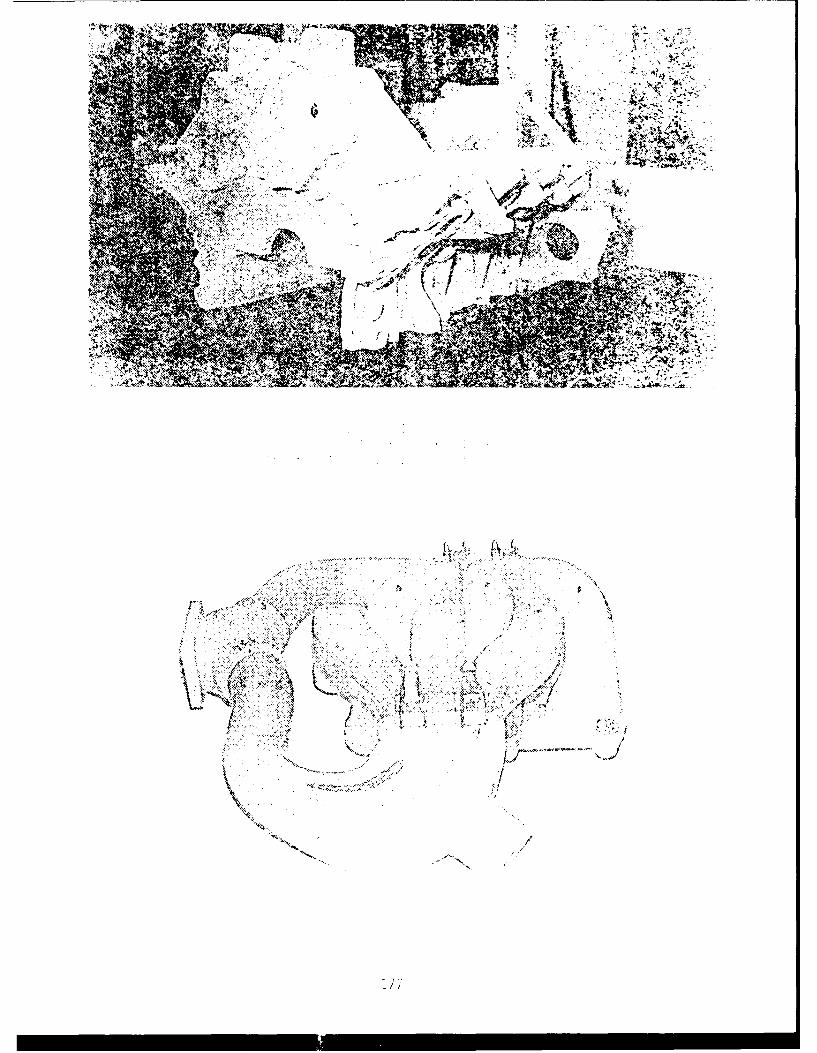
.'-
S
'A fi:$� XtI*�, ),t
�
'.S4vs� �
tt * <2 -'s"
ti
N"''" t4
<'4Ž AtI
Ii
K /it,
K7$ /
A /
'7;
An Experimental Study of the Parameters Affecting Curl in
Parts Created Using Stereolithography
Leslie Horton*, Edward Gargiulo**, Michael Keefe*
* Mechanical Engineering Department, University of Delaware, Newark,Delaware 19716.
** E.I. duPont de Nemours & Co., Inc., Wilmington, Delaware, 19880.
Abstract:
This paper describes an experimental study of some stereolithography buildparameters to determine their effect on curl deformation. The test parts were slabs 2inches long by 0.375 inch wide and 0.185 inch thick. Parts were imaged withconsideration of five parameters: hatch type, layer thickness, hatch spacing, hatchovercure, and fill cure depth However, because of the failure to create viable pieceswith certain combinations of the parameter values, statistically significant resultswere obtained only for a TRIHATCH build with a 0.010 inch layer thickness.Results indicate a primary dependence of curl on hatch spacing with the need toconsider combined effects of the parameters.
INTRODUCTION
Stereolithography is a photopolymer solid imaging process for rapid-prototyping andmanufacturing that involves scanning a laser beam to sequentially draw or print cross sections of amodel on the surface of a photo-curable liquid polymer.[ 1] With an installed capital investmentexceeding $60 million dollars in the United States alone, there is considerable incentive to make fulland efficient use of this technology.
One of the most challenging goals of rapid prototyping is the generation of accurate anddimensionally stable parts. The ultimate dimensions of a part built on a layer by layer basis dependon many factors that must be carefully balanced to produced accurate parts. The inability tounderstand and control the parameters leads to many problems including post-cure shrinkage,swelling, cantilever curl distortion, vertical wall post-cure distortion and horizontal slab distortion[2]. An unfortunate fact of acrylate polymerization is shrinkage and attendant residual stresseswhich reside in the cured parts. These stresses often result in distortion of the work-piece.[31
The problem of curl distortion has been discussed by several authors and a number of waysto minimize it have been proposed. Curl may be defined as any out-of-plane deflection of a flatlayer and is the result of interlayer shear stresses residual to the solidification process. 3DSystems, Inc., has studied this problem extensively and has developed a diagnostic test to measurecurl in terms of the distortion distance and cantilever length. [4] Although models for quantifyingthe curl parameter have been proposed and various parameters identified, the relative importance ofthe parameters and a theoretical model for curl distortion still needs to be developed.
The purpose of this study was to experimentally determine the parameters that are mostimportant in minimizing curl and warp deformation. A designed experiment was used tostatistically determine the relative importance of the parameters.
178
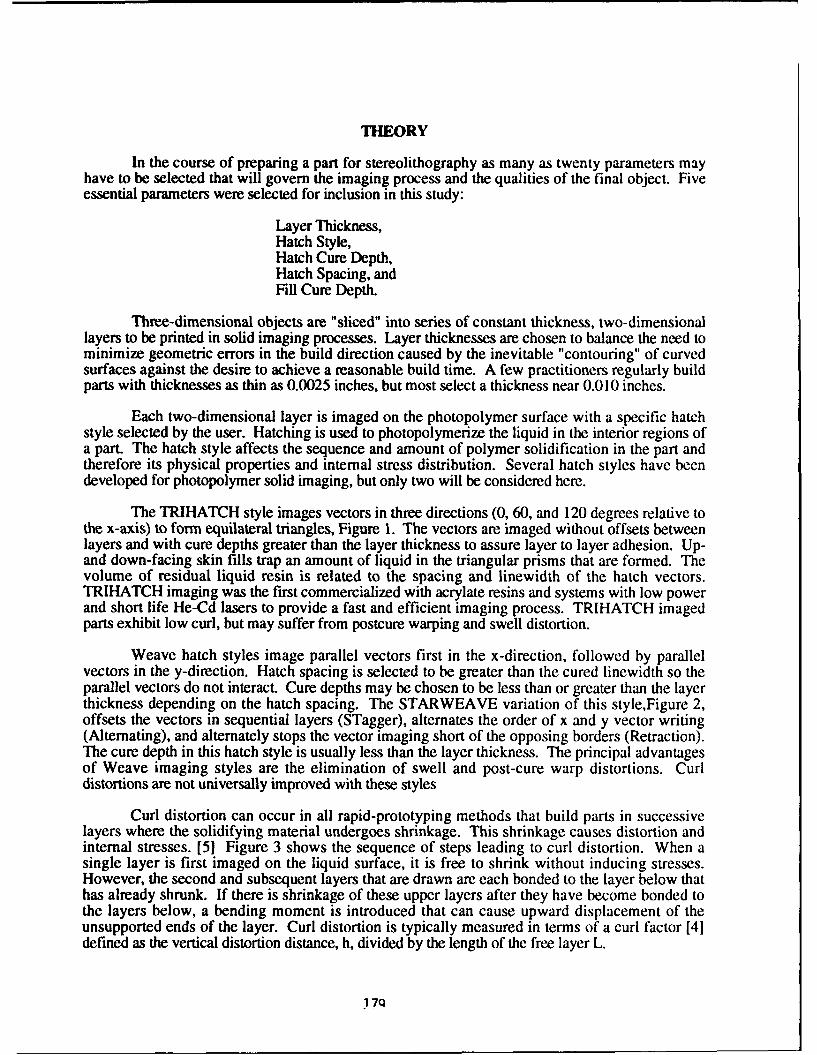
THEORY
In the course of preparing a part for stereolithography as many as twenty parameters mayhave to be selected that will govern the imaging process and the qualities of the final object. Fiveessential parameters were selected for inclusion in this study:
Layer Thickness,Hatch Style,Hatch Cure Depth,Hatch Spacing, andFill Cure Depth.
Three-dimensional objects are "sliced" into series of constant thickness, two-dimensionallayers to be printed in solid imaging processes. Layer thicknesses are chosen to balance the need tominimize geometric errors in the build direction caused by the inevitable "contouring" of curvedsurfaces against the desire to achieve a reasonable build time. A few practitioners regularly buildparts with thicknesses as thin as 0.0025 inches, but most select a thickness near 0.010 inches.
Each two-dimensional layer is imaged on the photopolymer surface with a specific hatchstyle selected by the user. Hatching is used to photopolymerize the liquid in the interior regions ofa part. The hatch style affects the sequence and amount of polymer solidification in the part andtherefore its physical properties and internal stress distribution. Several hatch styles have beendeveloped for photopolymer solid imaging, but only two will be considered here.
The TRIHATCH style images vectors in three directions (0, 60, and 120 degrees relative tothe x-axis) to form equilateral triangles, Figure 1. The vectors are imaged without offsets betweenlayers and with cure depths greater than the layer thickness to assure layer to layer adhesion. Up-and down-facing skin fills trap an amount of liquid in the triangular prisms that are formed. Thevolume of residual liquid resin is related to the spacing and linewidth of the hatch vectors.TRIHATCH imaging was the first commercialized with acrylate resins and systems with low powerand short life He-Cd lasers to provide a fast and efficient imaging process. TRIHATCH imagedparts exhibit low curl, but may suffer from postcure warping and swell distortion.
Weave hatch styles image parallel vectors first in the x-direction, followed by parallelvectors in the y-direction. Hatch spacing is selected to be greater than the cured linewidth so theparallel vectors do not interact. Cure depths may be chosen to be less than or greater than the layerthickness depending on the hatch spacing. The STARWEAVE variation of this style,Figure 2,offsets the vectors in sequential layers (STagger), alternates the order of x and y vector writing(Alternating), and alternately stops the vector imaging short of the opposing borders (Retraction).The cure depth in this hatch style is usually less than the layer thickness. The principal advantagesof Weave imaging styles are the elimination of swell and post-cure warp distortions. Curldistortions are not universally improved with these styles
Curl distortion can occur in all rapid-prototyping methods that build parts in successivelayers where the solidifying material undergoes shrinkage. This shrinkage causes distortion andinternal stresses. [51 Figure 3 shows the sequence of steps leading to curl distortion. When asingle layer is first imaged on the liquid surface, it is free to shrink without inducing stresses.However, the second and subsequent layers that are drawn are each bonded to the layer below thathas already shrunk. If there is shrinkage of these upper layers after they have become bonded tothe layers below, a bending moment is introduced that can cause upward displacement of theunsupported ends of the layer. Curl distortion is typically measured in terms of a curl factor [41defined as the vertical distortion distance, h, divided by the length of the free layer L.
"1 7Q
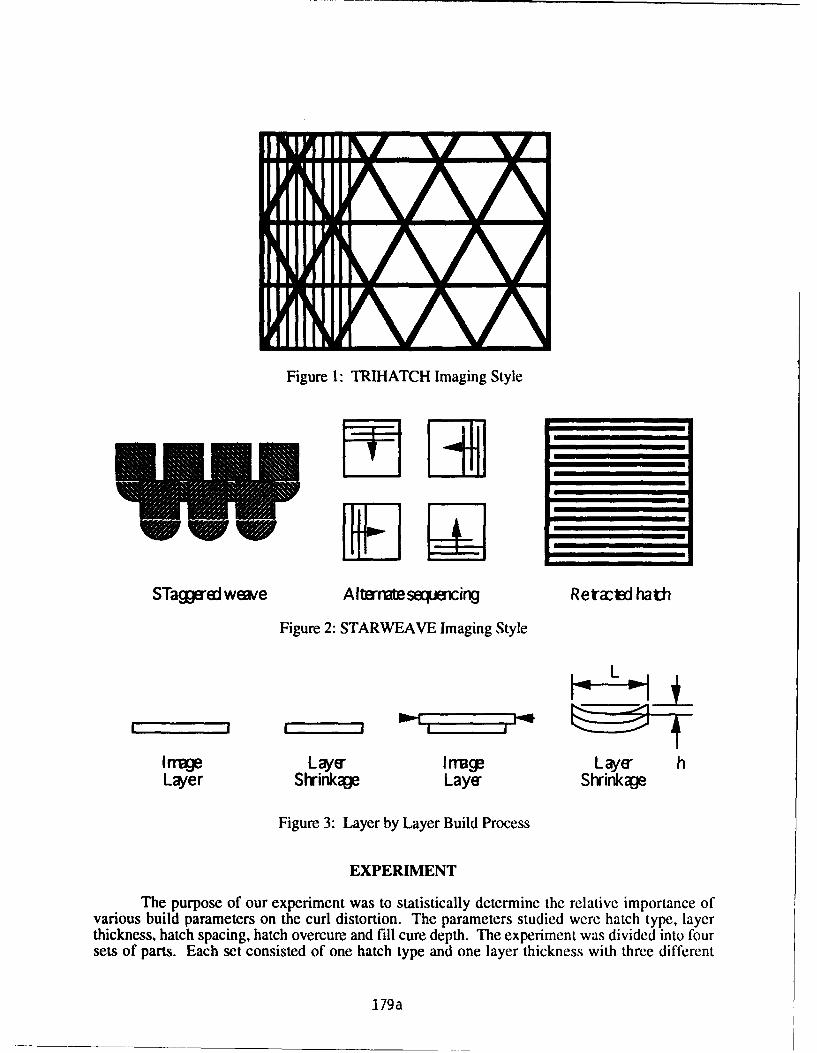
Figure 1: TRIHATCH Imaging Style
%tomF
STaggered weave Alternatese&pmncing RelarW hath
Figure 2: STARWEAVE Imaging Style
L
Image Layer Image Laye hLayer Shrinkage Layer Shrinkage
Figure 3: Layer by Layer Build Process
EXPERIMENT
The purpose of our experiment was to statistically determine the relative importance ofvarious build parameters on the curl distortion. The parameters studied were hatch type, layerthickness, hatch spacing, hatch overcure and fill cure depth. The experiment was divided into foursets of parts. Each set consisted of one hatch type and one layer thickness with three different
179a
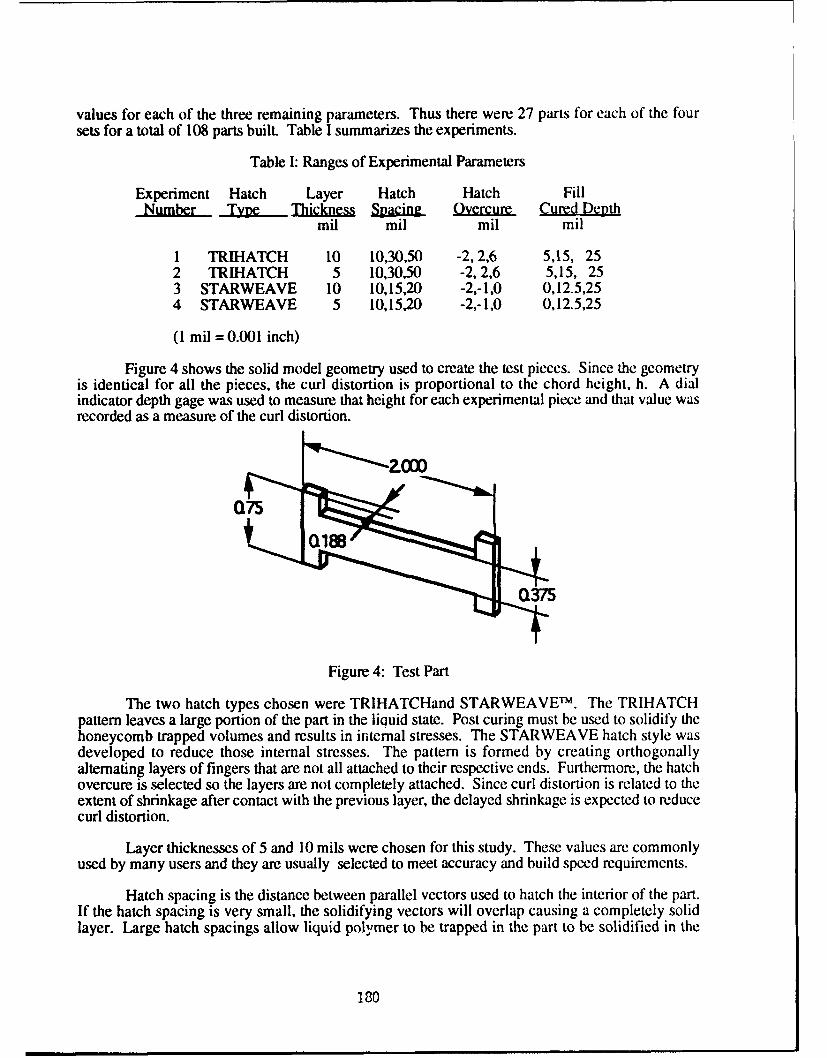
values for each of the three remaining parameters. Thus there were 27 parts for each of the four
sets for a total of 108 parts built. Table I summarizes the experiments.
Table I: Ranges of Experimental Parameters
Experiment Hatch Layer Hatch Hatch FillNumber Type Thickness S n Overcure Cured Depth
mil mil mil mil
1 TRIHATCH 10 10,30,50 -2, 2,6 5,15, 252 TRIHATCH 5 10,30,50 -2, 2,6 5,15, 253 STARWEAVE 10 10,15,20 -2,-1,0 0,12.5,254 STARWEAVE 5 10,15,20 -2,-,0 0,12.5,25
(1 mil = 0.001 inch)
Figure 4 shows the solid model geometry used to create the test pieces. Since the geometryis identical for all the pieces, the curl distortion is proportional to the chord height, h. A dialindicator depth gage was used to measure that height for each experimental piece and that value wasrecorded as a measure of the curl distortion.
Figure 4: Test Part
The two hatch types chosen were TRIHATCHand STARWEAVETM. The TRIHATCHpattern leaves a large portion of the part in the liquid state. Post curing must be used to solidify thehoneycomb trapped volumes and results in internal stresses. The STARWEAVE hatch style wasdeveloped to reduce those internal stresses. The pattern is formed by creating orthogonallyalternating layers of fingers that are not all attached to their respective ends. Furthermore, the hatchovercure is selected so the layers are not completely attached. Since curl distortion is related to theextent of shrinkage after contact with the previous layer, the delayed shrinkage is expected to reducecurl distortion.
Layer thicknesses of 5 and 10 mils were chosen for this study. These values are commonlyused by many users and they are usually selected to meet accuracy and build speed requirements.
Hatch spacing is the distance between parallel vectors used to hatch the interior of the part.If the hatch spacing is very small, the solidifying vectors will overlap causing a completely solidlayer. Large hatch spacings allow liquid polymer to be trapped in the part to be solidified in the
180
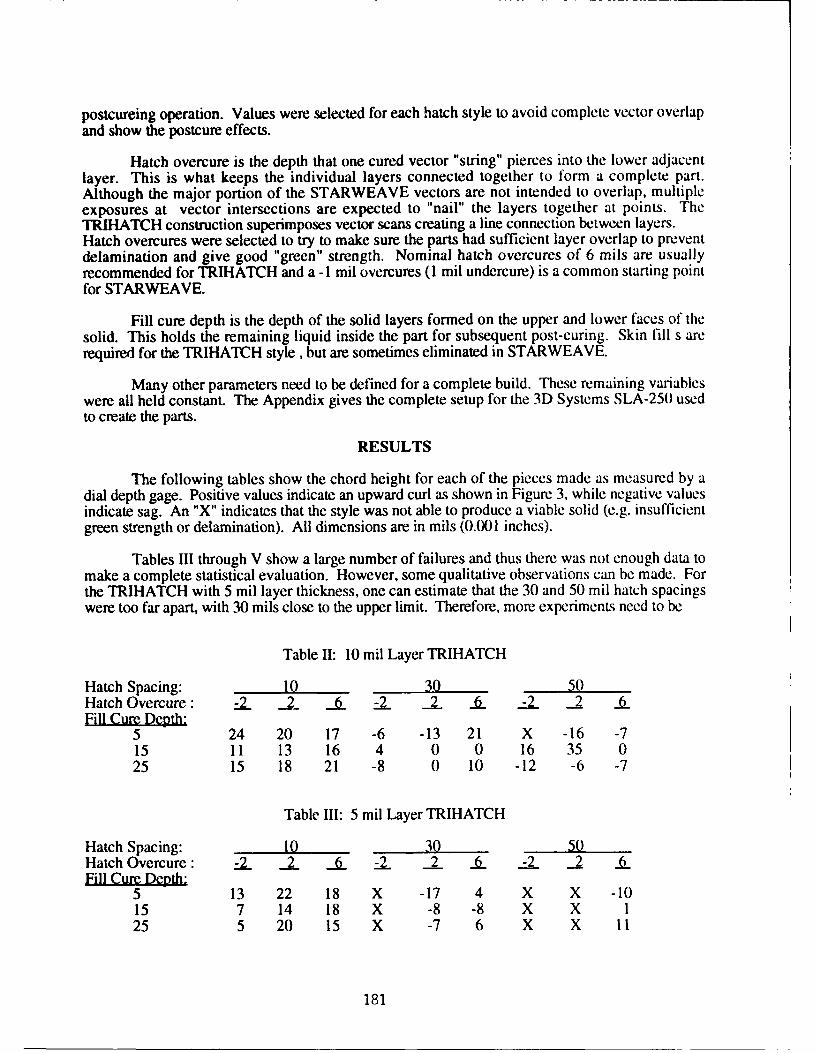
postcureing operation. Values were selected for each hatch style to avoid complete vector overlapand show the postcure effects.
Hatch overcure is the depth that one cured vector "string" pierces into the lower adjacentlayer. This is what keeps the individual layers connected together to form a complete part.Although the major portion of the STARWEAVE vectors are not intended to overlap, multipleexposures at vector intersections are expected to "nail" the layers together at points. TheTRIHATCH construction superimposes vector scans creating a line connection between layers.Hatch overcures were selected to try to make sure the parts had sufficient layer overlap to preventdelamination and give good "green" strength. Nominal hatch overcures of 6 mils are usuallyrecommended for TRIHATCH and a -1 mil overcures (1 mil undercure) is a common starting pointfor STARWEAVE.
Fill cure depth is the depth of the solid layers formed on the upper and lower faces of thesolid. This holds the remaining liquid inside the part for subsequent post-curing. Skin fill s arerequired for the TRIHATCH style, but are sometimes eliminated in STARWEAVE.
Many other parameters need to be defined for a complete build. These remaining variableswere all held constant. The Appendix gives the complete setup for the 3D Systems SLA-250 usedto create the parts.
RESULTS
The following tables show the chord height for each of the pieces made as measured by adial depth gage. Positive values indicate an upward curl as shown in Figure 3, while negative valuesindicate sag. An "X" indicates that the style was not able to produce a viable solid (e.g. insufficientgreen strength or delamination). All dimensions are in mils (0.001 inches).
Tables III through V show a large number of failures and thus there was not enough data tomake a complete statistical evaluation. However, some qualitative observations can be made. Forthe TRIHATCH with 5 mil layer thickness, one can estimate that the 30 and 50 mil hatch spacingswere too far apart, with 30 mils close to the upper limit. Therefore, more experiments need to be
Table II: 10 mil Layer TRIHATCH
Hatch Spacing: 10 30 50Hatch Overcure • 2 .. 62 .. 2._ -2 .1_ 6 -2 2 6.6_Fill Cure De
5 24 20 17 -6 -13 21 X -16 -715 11 13 16 4 0 0 16 35 025 15 18 21 -8 0 10 -12 -6 -7
Table III: 5 mil Layer TRIHATCH
Hatch Spacing: 10 30 50Hatch Overcure• -2 -.. .. 2 .2_ . -2 .2
5 13 22 18 X -17 4 X X -1015 7 14 18 X -8 -8 X X 125 5 20 15 X -7 6 X X 11
181
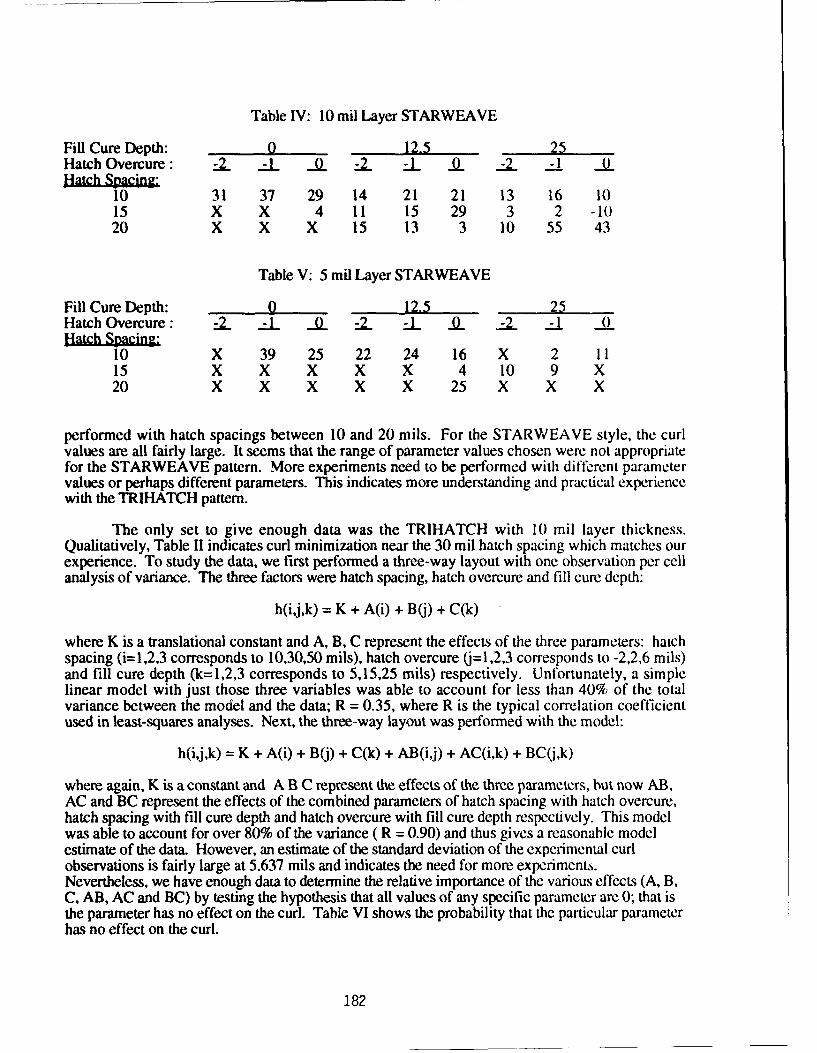
Table IV: 10 mil Layer STARWEAVE
Fill Cure Depth: 0 12.5 2Hatch Overcure • 2 --L A. -2 I O -2 -..l ..jL
10 31 37 29 14 21 21 13 16 1015 X X 4 11 15 29 3 2 -1020 X X X 15 13 3 10 55 43
Table V: 5 mil Layer STARWEAVE
Fill Cure Depth: 0 12.5 25Hatch Overcure: -- -1 0AL -L -L O -22_ --1 (_.L
10 X 39 25 22 24 16 X 2 1115 X X X X X 4 10 9 X20 X X X X X 25 X X X
performed with hatch spacings between 10 and 20 mils. For the STARWEAVE style, the curlvalues are all fairly large. It seems that the range of parameter values chosen were not appropriatefor the STARWEAVE pattern. More experiments need to be performed with different parametervalues or perhaps different parameters. This indicates more understanding and practical experiencewith the TRIHATCH pattern.
The only set to give enough data was the TRIHATCH with 10 mil layer thickness.Qualitatively, Table II indicates curl minimization near the 30 mil hatch spacing which matches ourexperience. To study the data, we first performed a three-way layout with one observation per cellanalysis of variance. The three factors were hatch spacing, hatch overcure and fill cure depth:
h(ij,k) = K + A(i) + B(j) + C(k)
where K is a translational constant and A, B, C represent the effects of the three parameters: hatchspacing (i=1,2,3 corresponds to 10,30,50 mils), hatch overcure 0=1,2,3 corresponds to -2,2,6 mils)and fill cure depth (k=1,2,3 corresponds to 5,15,25 mils) respectively. Unfortunately, a simplelinear model with just those three variables was able to account for less than 40% of the totalvariance between the model and the data; R = 0.35, where R is the typical correlation coefficientused in least-squares analyses. Next, the three-way layout was performed with the model:
h(ij,k) = K + A(i) + B(j) + C(k) + AB(ij) + AC(i,k) + BC(j,k)
where again, K is a constant and A B C represent the effects of the three parameters, but now AB,AC and BC represent the effects of the combined parameters of hatch spacing with hatch overcure,hatch spacing with fill cure depth and hatch overcure with fill cure depth respectively. This modelwas able to account for over 80% of the variance ( R = 0.90) and thus gives a reasonable modelestimate of the data. However, an estimate of the standard deviation of the experimental curlobservations is fairly large at 5.637 mils and indicates the need for more experiments.Nevertheless, we have enough data to determine the relative importance of the various effects (A, B,C, AB, AC and BC) by testing the hypothesis that all values of any specific parameter are 0; that isthe parameter has no effect on the curl. Table VI shows the probability that the particular parameterhas no effect on the curl.
182
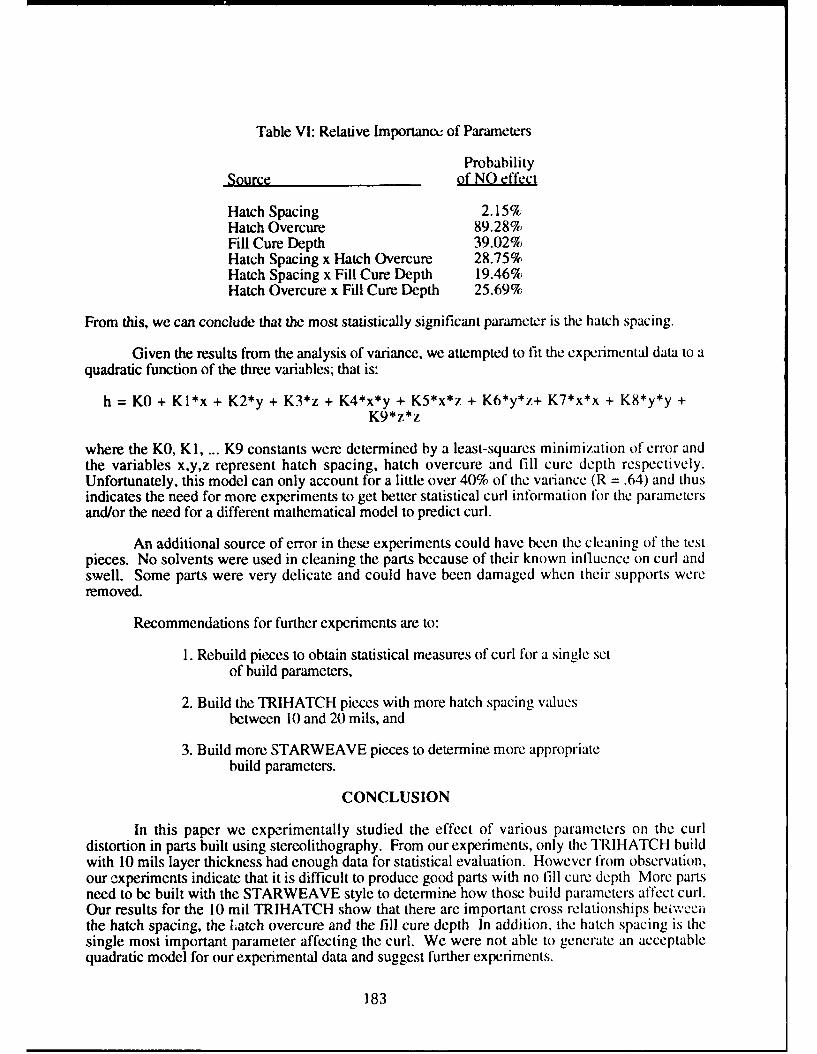
Table VI: Relative Importance of Parameters
ProbabilitySource of NO effect
Hatch Spacing 2.15%Hatch Overcure 89.28%Fill Cure Depth 39.02%Hatch Spacing x Hatch Overcure 28.75%Hatch Spacing x Fill Cure Depth 19.46%Hatch Overcure x Fill Cure Depth 25.69%
From this, we can conclude that the most statistically significant parameter is the hatch spacing.
Given the results from the analysis of variance, we attempted to fit the experimental data to aquadratic function of the three variables; that is:
h = KO + Kl*x + K2*y + K3*z + K4*x*y + K5*x*z + K6*y*z+ K7*x*x + K8*y*y +K9*z*z
where the KO, K 1, ... K9 constants were determined by a least-squares minimization of error andthe variables xy,z represent hatch spacing, hatch overcure and fill cure depth respectively.Unfortunately, this model can only account for a little over 40% of the variance (R = .64) and thusindicates the need for more experiments to get better statistical curl information for the parametersand/or the need for a different mathematical model to predict curl.
An additional source of error in these experiments could have been the cleaning of the testpieces. No solvents were used in cleaning the parts because of their known influence on curl andswell. Some parts were very delicate and could have been damaged when their supports wereremoved.
Recommendations for further experiments are to:
1. Rebuild pieces to obtain statistical measures of curl for a single setof build parameters,
2. Build the TRIHATCH pieces with more hatch spacing valuesbetween 10 and 20 mils, and
3. Build more STARWEAVE pieces to determine more appropriatebuild parameters.
CONCLUSION
In this paper we experimentally studied the effect of various parameters on the curldistortion in parts built using stereolithography. From our experiments, only the TRIHATCH buildwith 10 mils layer thickness had enough data for statistical evaluation. However from observation,our cxperiments indicate that it is difficult to produce good parts with no fill cure depth More partsneed to be built with the STARWEAVE style to determine how those build parameters affect curl.Our results for the 10 mil TRIHATCH show that there are important cross relationships beiwecnithe hatch spacing, the liatch overcure and the fill cure depth In addition, the hatch spacing is thesingle most important parameter affecting the curl. We were not able to generate an acceptablequadratic model for our experimental data and suggest further experiments.
183
REFERENCES
1. SLA-250 User Guide, 3D Systems, Inc., April 1991.
2. Richter, J. and P.F. Jacobs, "The Present State of Accuracy in Stereolithography," Proceedingsof the Second International Conference on Rapid Prototyping. Dayton, Ohio, 1991.
3. Murphy, E.J., Ansel, R.E. and J.J. Krajewski, "Reduced Distortion in Optical FreeformFabrication with UV Lasers," Stereolithography Users Group Meeting, 1988.
4. Jacobs, P.F., Rapid Prototyping and Manufacturing - Fundamentals of Stereolithography.Society of Manufacturing Engineers, 1992.
5. Weissman, P.T, Bolan, B.A., and Chartoff, R.P., "Measurements of Linear Shrinkage and theResidual Stresses Developed During Laser Polymerization," Proceedings of the ThirdInternational Conference on Rapid Prototypino. Dayton, Ohio, 1992.
184
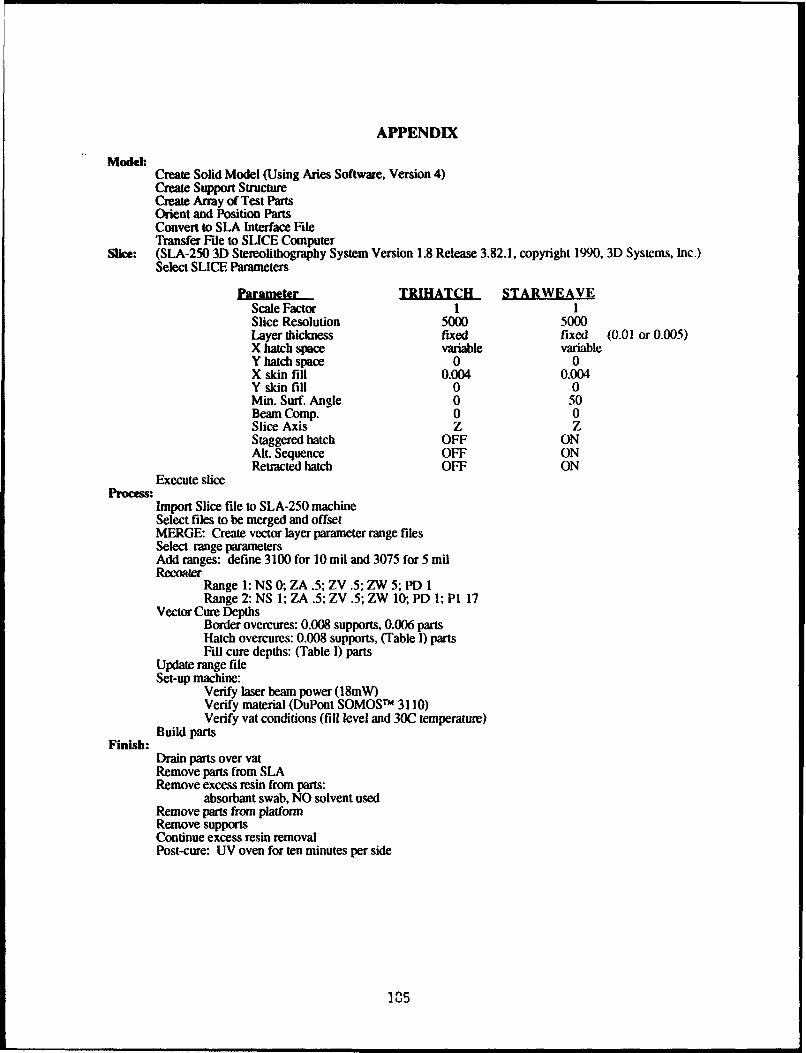
APPENDIX
Model:Create Solid Model (Using Aries Software, Version 4)Create Support StructureCreate Array of Test PartsOrient and Position PartsConvert to SLA Interface FileTransfer File to SLICE Computer
Slice: (SLA-250 3D Stereolithography System Version 1.8 Release 3.82.1, copyright 1990, 3D Systems, Inc.)Select SLICE Parameters
Parameter TRIHATCH S;TARWEAVE
Scale Factor 1 1Slice Resolution 5000 5000Layer thickness fixed fixed (0.01 or 0.005)X hatch space variable variableY hatch space 0 0X skin fill 0.004 0.004Y skin fill 0 0Min. Surf. Angle 0 50Beam Comp. 0 0Slice Axis Z ZStaggered hatch OFF ONAlL Sequence OFF ONRetracted hatch OFF ON
Execute sliceProcess:
Import Slice file to SLA-250 machineSelect files to be merged and offsetMERGE: Create vector layer parameter range filesSelect range parametersAdd ranges: define 3100 for 10 mil and 3075 for 5 milRecoater
Range 1: NS 0; ZA .5; ZV .5; ZW 5; PD 1Range 2: NS 1; ZA .5; ZV .5; ZW 10; PD 1; PI 17
Vector Cure DepthsBorder overcures: 0.008 supports, 0.006 partsHatch overcures: 0.008 supports, (Table I) partsFill cure depths: (Table I) parts
Update range fileSet-up machine:
Verify laser beam power (18mW)Verify material (DuPont SOMOSTMI 3110)Verify vat conditions (fill level and 30C temperature)
Build partsFinish:
Drain parts over vatRemove parts from SLARemove excess resin from parts:
absorbant swab, NO solvent usedRemove parts from platformRemove supportsContinue excess resin removalPost-cure: UV oven for ten minutes per side
1'5
Homogenization Design and Layered Manufacturingof a Lower Control Arm in
Project MAXWELL
Roy JohansonNoboru Kikuchi
Panos Papalambros
Department of Mechanical Engineering& Applier Mechanics
The University of MichiganAnn Arbor, MI 48109
and
Fritz PrinzLee Weiss
Engineering Design Research CenterCarnegie Mellon University
Pittsburgh, PA 15213
Abstract
We briefly describe a new methodology for the design and manufacture ofmechanical components and demonstrate the process for the design of an automobilesuspension component. The methodology is a unique coupling between advancedtechnologies for product design and manufacture, which leads to the rapid realization ofsuperior products. The concurrent design and analysis strategy yields information aboutthe optimal structural layout, as well as details about the material composition. Thefabrication of such designs requires unconventional manufacturing processes, such aslayered manufacturing. Project MAXWELL, therefore, offers the possibility for theintegration of layered manufacturing into the mainstream product development andfabrication proccss.
1. INTRODUCTION
Project MAXWELL embodies a methodology that provides a rigorous technique forthe concurrent design of material composition and shape of components, and a newmanufacturing process for their realization. At the University of Michigan (U-M), a newmethodology has been developed for designing the form and material composition ofmechanical and structural components based only on a description of the loading conditionsand packaging requirements. At Carnegie Mellon University (CMU), a new manufacturingprocess has been developed for the free-form fabrication of parts from single or compositematerials by thermal spray shape deposition. The goal of Project MAXWELL is todemonstrate the validity of an integrated approach for the rapid realization of superiorcomponents. Such components will possess superior structural and mechanical properties,and will satisfy packaging and assembly requirements.
The current application domain is in the design and manufacture of automobilecomponents. The design methodology has been applied to the design of stiffened sheet
186
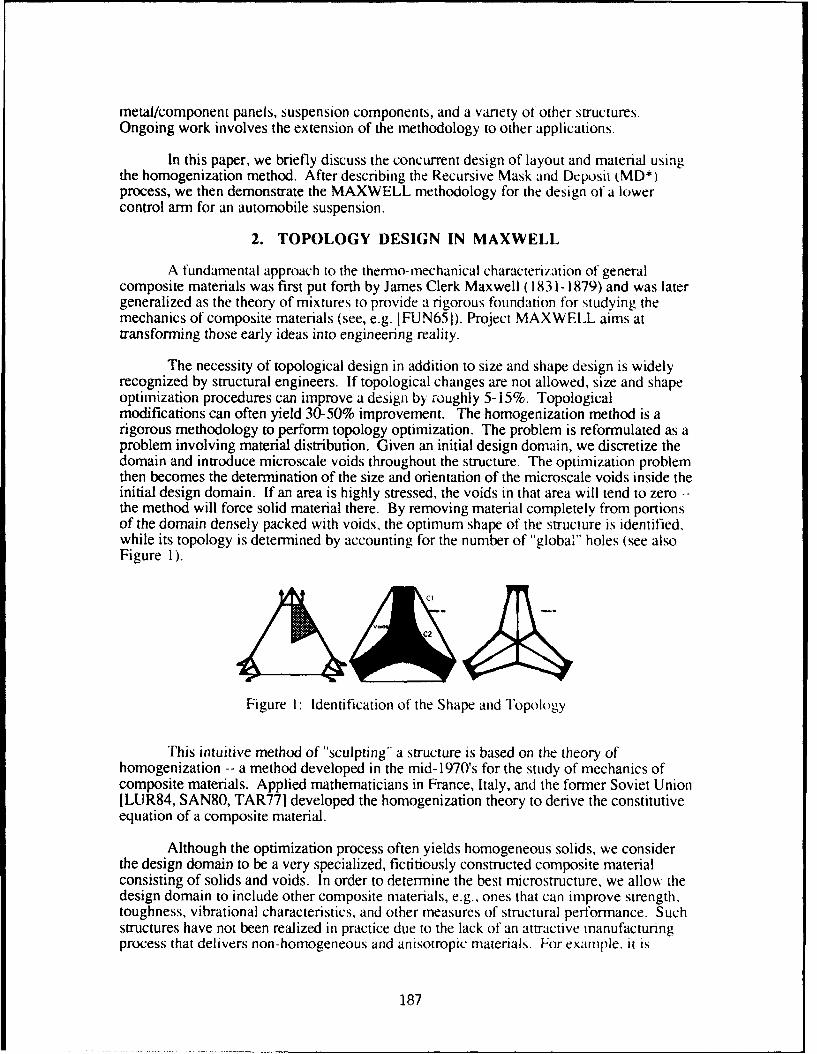
metal/component panels, suspension components, and a variety ot other structures.Ongoing work involves the extension of the methodology to other applications.
In this paper, we briefly discuss the concurrent design of layout and material usingthe homogenization method. After describing the Recursive Mask and Deposit (MD*)process, we then demonstrate the MAXWELL methodology for the design of a lowercontrol arm for an automobile suspension.
2. TOPOLOGY DESIGN IN MAXWELL
A fundamental approach to the thermo-mechanical characterization of generalcomposite materials was first put forth by James Clerk Maxwell (1831-1879) and was latergeneralized as the theory of mixtures to provide a rigorous foundation for studying themechanics of composite materials (see, e.g. IFUN65 I). Project MAXWELL aims attransforming those early ideas into engineering reality.
The necessity of topological design in addition to size and shape design is widelyrecognized by structural engineers. If topological changes are not allowed, size and shapeoptimization procedures can improve a design by roughly 5-15%. Topologicalmodifications can often yield 30-50% improvement. The homogenization method is arigorous methodology to perform topology optimization. The problem is reformulated as aproblem involving material distribution. Given an initial design domain, we discretize thedomain and introduce microscale voids throughout the structure. The optimization problemthen becomes the determination of the size and orientation of the microscale voids inside theinitial design domain. If an area is highly stressed, the voids in that area will tend to zero --the method will force solid material there. By removing material completely from portionsof the domain densely packed with voids, the optimum shape of the structure is identified,while its topology is determined by accounting for the number of "global" holes (see alsoFigure 1).
Figure I: Identification of the Shape and Topology
This intuitive method of "sculpting" a structure is based on the theory ofhomogenization -- a method developed in the mid-1970's for the study of mechanics ofcomposite materials. Applied mathematicians in France, Italy, and the former Soviet Union[LUR84, SAN80, TAR771 developed the homogenization theory to derive the constitutiveequation of a composite material.
Although the optimization process often yields homogeneous solids, we considerthe design domain to be a very specialized, fictitiously constructed composite materialconsisting of solids and voids. In order to determine the best microstructure, we alloy, thedesign domain to include other composite materials, e.g., ones that can improve strength,toughness, vibrational characteristics, and other measures of structural performance. Suchstructures have not been realized in practice due to the lack of an attractive manufacturingprocess that delivers non-homogeneous and anisotropic materials. For examiple. it is
187
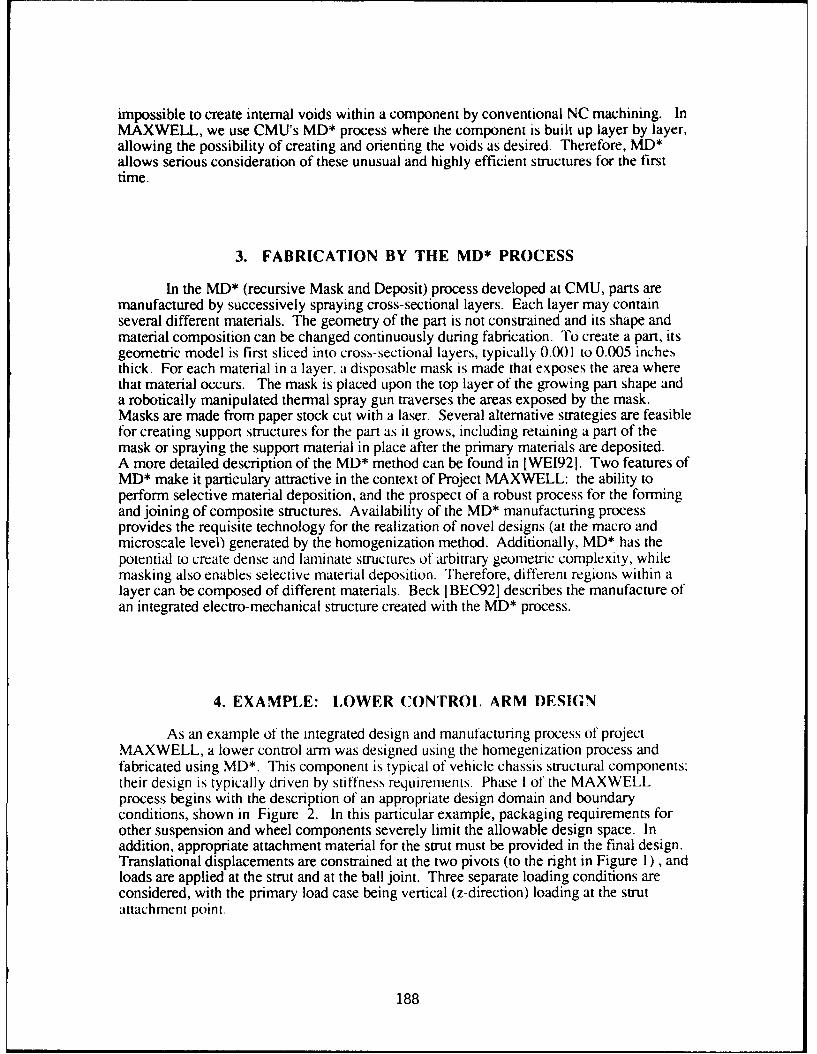
impossible to create internal voids within a component by conventional NC machining. InMAXWELL, we use CMU's MD* process where the component is built up layer by layer,allowing the possibility of creating and orienting the voids as desired. Therefore, MD*allows serious consideration of these unusual and highly efficient structures for the firsttime.
3. FABRICATION BY THE MD* PROCESS
In the MD* (recursive Mask and Deposit) process developed at CMU, parts aremanufactured by successively spraying cross-sectional layers. Each layer may containseveral different materials. The geometry of the part is not constrained and its shape andmaterial composition can be changed continuously during fabrication. To create a part, itsgeometric model is first sliced into cross-sectional layers, typically O.(X)l to 0.(X)5 inchesthick. For each material in a layer, a disposable mask is made that exposes the area wherethat material occurs. The mask is placed upon the top layer of the growing part shape anda robotically manipulated thermal spray gun traverses the areas exposed by the mask.Masks are made from paper stock cut with a laser. Several alternative strategies are feasiblefor creating support structures for the part as it grows, including retaining a part of themask or spraying the support material in place after the primary materials are deposited.A more detailed description of the MD* method can be found in [WE1921. Two features ofMD* make it particulary attractive in the context of Project MAXWELL: the ability toperform selective material deposition, and the prospect of a robust process for the formingand joining of composite structures. Availability of the MD* manufacturing processprovides the requisite technology for the realization of novel designs (at the macro andmicroszale level) generated by the homogenization method. Additionally, MD* has thepotential to create dense and laminate structures of arbitrary geometric complexity, whilemasking also enables selective material deposition. Therefore, different regions within alayer can be composed of different materials. Beck I BEC92] describes the manufacture ofan integrated electro-mechanical structure created with the MD* process.
4. EXAMPLE: LOWER CONTROL ARM DESIGN
As an example of the integrated design and manufacturing process of projectMAXWELL, a lower control arm was designed using the homegenization process andfabricated using MD*. This component is typical of vehicle chassis structural components;their design is typically driven by stiffness requirements. Phase I of the MAXWELLprocess begins with the description of an appropriate design domain and boundaryconditions, shown in Figure 2. In this particular example, packaging requirements forother suspension and wheel components severely limit the allowable design space. Inaddition, appropriate attachment material for the strut must be provided in the final design.Translational displacements are constrained at the two pivots (to the right in Figure 1) , andloads are applied at the strut and at the ball joint. Three separate loading conditions areconsidered, with the primary load case being vertical (z-direction) loading at the strutattachment point.
188
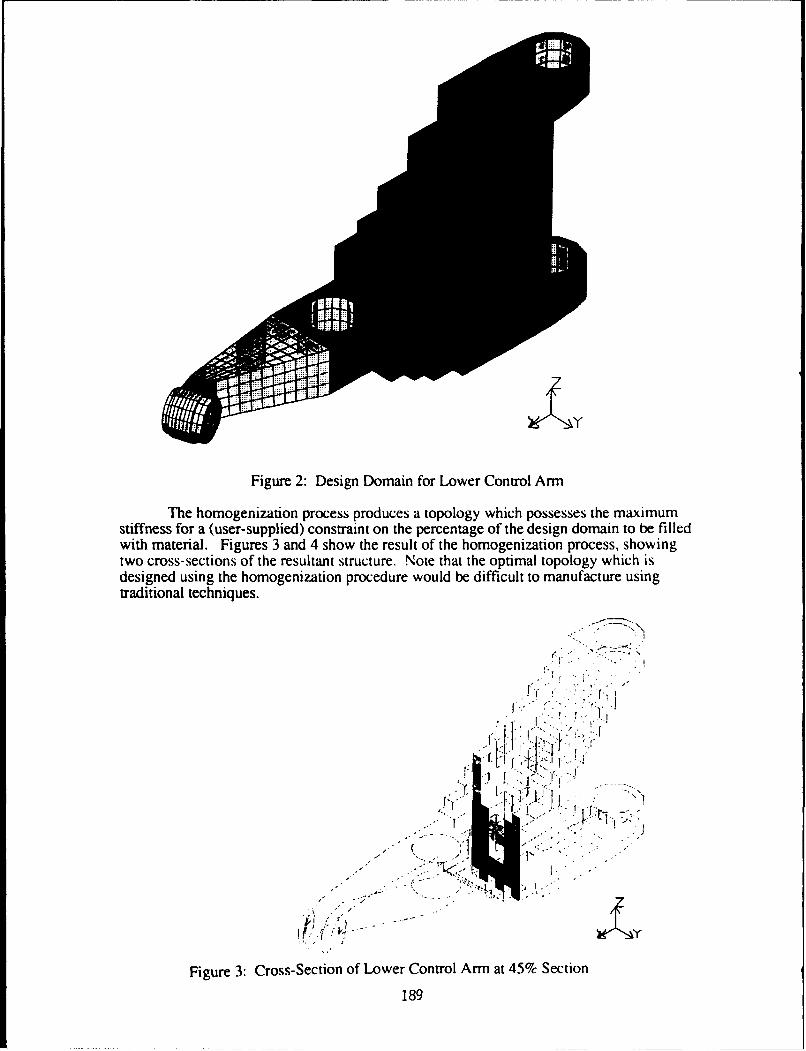
Y
Figure 2: Design Domain for Lower Control Arm
The homogenization process produces a topology which possesses the maximumstiffness for a (user-supplied) constraint on the percentage of the design domain to be filledwith material. Figures 3 and 4 show the result of the homogenization process, showingtwo cross-sections of the resultant structure. Note that the optimal topology which isdesigned using the homogenization procedure would be difficult to manufacture usingtraditional techniques.
Figure 3: Cross-Section of Lower Control Arm at 45% Section
189
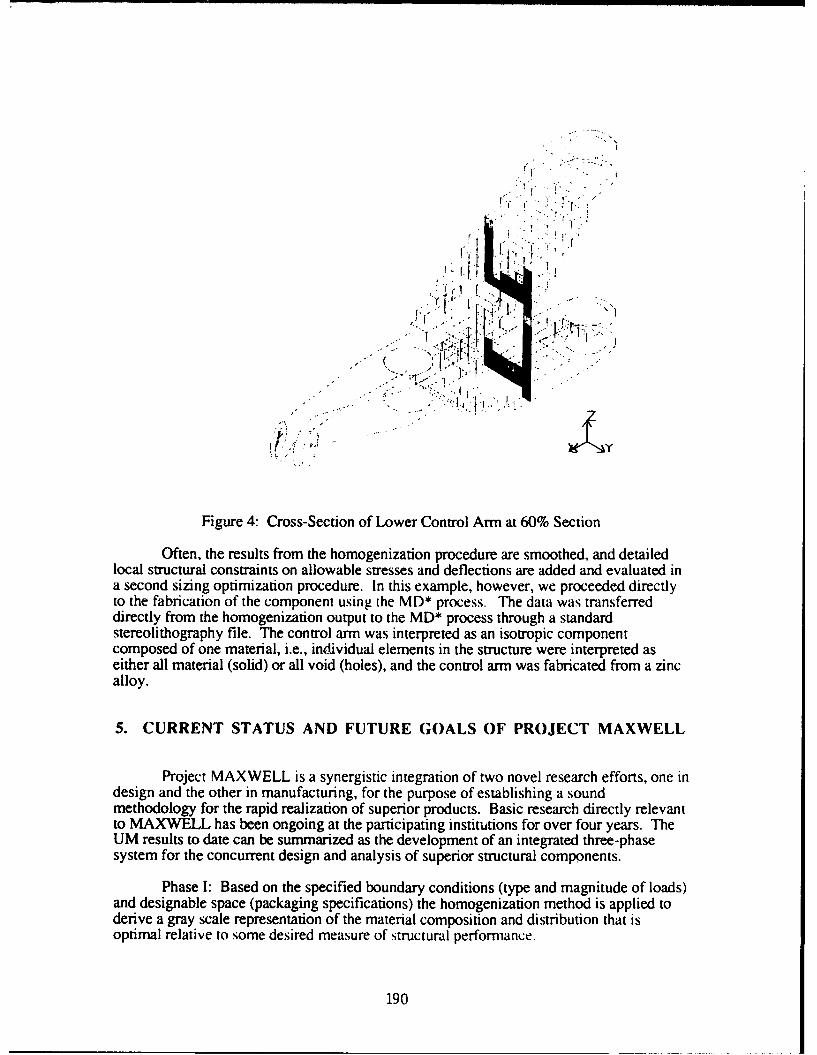
f I I I
I i sl
Figure 4: Cross-Section of Lower Control Arm at 60% Section
Often, the results from the homogenization procedure are smoothed, and detailedlocal structural constraints on allowable stresses and deflections are added and evaluated ina second sizing optimization procedure. In this example, however, we proceeded directlyto the fabrication of the component using the MD* process. The data was transferreddirectly from the homogenization output to the MD* process through a standardstereolithography file. The control arm was interpreted as an isotropic componentcomposed of one material, i.e., individual elements in the structure were interpreted aseither all material (solid) or all void (holes), and the control arm was fabricated from a zincalloy.
5. CURRENT STATUS AND FUTURE G;OALS OF PROJECT MAXWELL
Project MvAX WELL is a synergistic integration of two novel research efforts, one indesign and the other in manufacturing, for the purpose of establishing a soundmethodology for the rapid realization of superior products. Basic research directly relevantto MAXWELL has been ongoing at the participating institutions for over four years. TheUM results to date can be summarized as the development of an integrated three-phasesystem for the concurrent design and analysis of superior structural components.
Phase 1: Based on the specified boundary conditions (type and magnitude of loads)and designable space (packaging specifications) the homogenization method is applied toderive a gray scale representation of the material composition and distribution that isoptimal relative to some desired measure of structural performance.
190
Phase 11: Using computer vision and geometric modeling techniques, this image isinterpreted and translated into a realistic structure.
Phase 111: A parametric optimization model based on finite element analysis isformulated and solved to determine a complete dimensional and material description of thestructure.
Phase IV: The manutacture o1 the Phase Ill output (i.e., discrete parts of arbitrarygeometry and possibly varying material composition) using the MD* process is performed.
Phase V: The final phase in MAXWELL is the testing phase, where the Phase IVproducts will be subjected to various mechanical tests. Qualitative indices of performancein Phase V will include measures such as weight to stiffness ratio, impact energyabsorption rates, and fatigue life.
Currently the UM system can develop structural layouts for 2D, 2.5D and full 3Dcomponents. A major area of current research is appropriate geometric representation ofoptimal topologies in three dimensions. Ongoing research at CMU directly relevant toMAXWELL can be summarized as the development of the MD* pro',.ss for the rapidmanufacture of single or multi-material components.
ACKNOWLEDGMENTS
The UM research was partially funded by the National Science Foundation. CMUhas received partial support from the National Science Foundation Engineering ResearchCenter
REFERENCES
LASH911 Ashley,S "Rapid Prototyping Systms Mechanical Engineering, 113(4), 34-43 (1991)[BEC92] Beck, J.E., F.B. Prinz, D.P. Siewiorek, and L.E. Weiss. "ManufactuingMechatronics using Thermal Spray Shape Deposition." in Proceedings of Solid FreeformFabrication Symposium, The University of Texas at Austin, August, 1992 , pp. 272-279.[BEN861 Bennet, J.A. and Botkin, M.E., The Optimum Shape: Automated StructuralDesign, Plenum Press, New York, 1986.[BEN881 Bendsoe, P.M. and Kikuchi, N., "Generating Optimal Topologies in StructuralDesign Using a Homogenization Method". Comp. Meth. Appl. Mech. Eng., Vol 71, 197-224, 1988.1BOT851 Botkin, M.E. and Bennet, J.A., "Shape Optimization of Three DimensionalFolded Plate Structures" AIAA J., 23(11) 1804-1810, 1985.IBRE91] Bremicker, M. Chirehdast, M. Kikuchi, N. Papalambros, P.Y., "Topologyand Shape Optimization in Structural Design." J of Mechanics of Structures and Machines[DUT92] Dutta, D. et. al. "Project MAXWELL: Towards Rapid Realization of SuperiorProducts" in Proceedings of Solid Freeform Fabrication Symposium, The University ofTexas at Austin, 1992., pp. 54-62.[FUN651 Fung, Y.C. Foundations of Solid Mechanics, Prentice-Hall, EnglewoodCliffs. NJ. 1965ILUR841 Lurie. K.A. and Cherakev, A.V. "Exact Estimates of Conductivity ofComposites formed by two lsotropically CondtIcting Media taken in PrescribedProportion". Proc RoYal Soc Edinhurgh, 99A. pp. 71-78. 1984.
191
[SAN80 Sanchez-Palencia, E. "Non-homogeneous media and vibration theory",Springer Lecture Notes in Physics, Berlin, 1980.ITAR771 Tartar, L. "Estimation de coefficients homogeneises, Springer Lecture Notes inMathematics, Berlin, pp.364-373, 1977.[WEI91J Weiss, L.E., Prinz, F.B.and Siewiorek, D.P. "A Framework for Thermal SprayShape Deposition in the MD* System" in Proceedings of Solid Freeform FabricationSymposium, The University of Texas at Austin, August, 1991.[WEI90 Weiss, L. Guroz, E.L., Prinz, F.B. Fussel, P.S.. Mahalingham, S. and Patrick.E.P., "A Rapid Tool Manufacturing System Based on Stereolithography and ThermalSpraying" Manufacturing Review, 3(1), 40-48, 1990.JWE192) Weiss, L. E., F. Prinz, D. Adams. "Solid Freeform Fabrication by thermalspray shape deposition" in ASM International Thermal Spray Conference, Orlando, FL.June 1992.
192
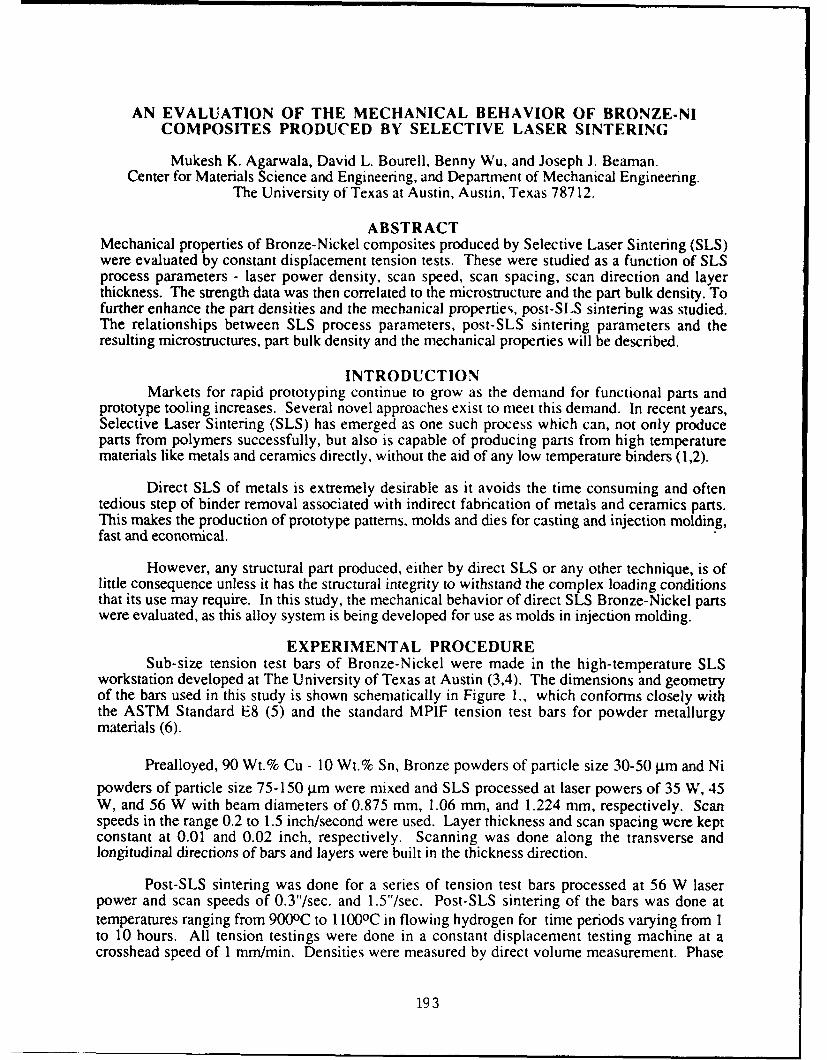
AN EVALUATION OF THE MECHANICAL BEHAVIOR OF BRONZE-NICOMPOSITES PRODUCED BY SELECTIVE LASER SINTERING
Mukesh K. Agarwala, David L. Bourell, Benny Wu, and Joseph J. Beaman.Center for Materials Science and Engineering, and Department of Mechanical Engineering.
The University of Texas at Austin, Austin, Texas 78712.
ABSTRACTMechanical properties of Bronze-Nickel composites produced by Selective Laser Sintering (SLS)were evaluated by constant displacement tension tests. These were studied as a function of SLSprocess parameters - laser power density, scan speed, scan spacing, scan direction and layerthickness. The strength data was then correlated to the microstructure and the part bulk density. Tofurther enhance the part densities and the mechanical properties, post-SLS sintering was studied.The relationships between SLS process parameters, post-SLS sintering parameters and theresulting microstructures, part bulk density and the mechanical properties will be described.
INTRODUCTIONMarkets for rapid prototyping continue to grow as the demand for functional parts and
prototype tooling increases. Several novel approaches exist to meet this demand. In recent years,Selective Laser Sintering (SLS) has emerged as one such process which can, not only produceparts from polymers successfully, but also is capable of producing parts from high temperaturematerials like metals and ceramics directly, without the aid of any low temperature binders (1,2).
Direct SLS of metals is extremely desirable as it avoids the time consuming and oftentedious step of binder removal associated with indirect fabrication of metals and ceramics parts.This makes the production of prototype patterns, molds and dies for casting and injection molding,fast and economical.
However, any structural part produced, either by direct SLS or any other technique, is oflittle consequence unless it has the structural integrity to withstand the complex loading conditionsthat its use may require. In this study, the mechanical behavior of direct SLS Bronze-Nickel partswere evaluated, as this alloy system is being developed for use as molds in injection molding.
EXPERIMENTAL PROCEDURESub-size tension test bars of Bronze-Nickel were made in the high-temperature SLS
workstation developed at The University of Texas at Austin (3,4). The dimensions and geometryof the bars used in this study is shown schematically in Figure 1., which conforms closely withthe ASTM Standard E8 (5) and the standard MPIF tension test bars for powder metallurgymaterials (6).
Prealloyed, 90 Wt.% Cu - 10 Wt.% Sn, Bronze powders of particle size 30-50 gtm and Nipowders of particle size 75-150 gim were mixed and SLS processed at laser powers of 35 W, 45W, and 56 W with beam diameters of 0.875 mm, 1.06 mm, and 1.224 mm, respectively. Scanspeeds in the range 0.2 to 1.5 inch/second were used. Layer thickness and scan spacing were keptconstant at 0.01 and 0.02 inch, respectively. Scanning was done along the transverse andlongitudinal directions of bars and layers were built in the thickness direction.
Post-SLS sintering was done for a series of tension test bars processed at 56 W laserpower and scan speeds of 0.3"/sec. and 1.5"/sec. Post-SLS sintering of the bars was done attemperatures ranging from 9000 C to 1 1000C in flowing hydrogen for time periods varying from 1to 10 hours. All tension testings were done in a constant displacement testing machine at acrosshead speed of 1 mm/min. Densities were measured by direct volume measurement. Phase
193
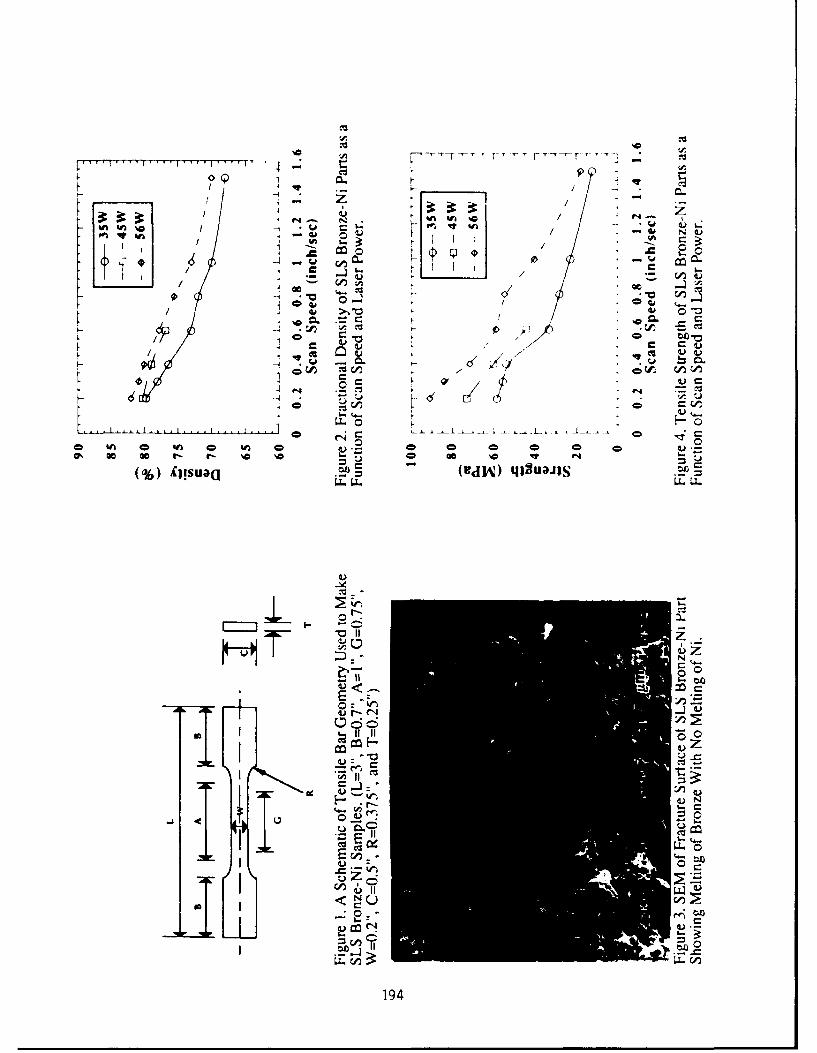
CCL
M' cr CA (A rA''
Cu
/'/
ac ta
"._ua (L WII ) qlu"JIS .
C' 0
-72.r, 0 E_ A
194
/z
72 C
Eu c/w)tj Z
to
1940 0

analysis and microstructural analysis of the material was done at every step of processing by X-raydiffraction, optical microscopy, EDS and SEM.
RESULTS AND DISCUSSIONPreliminary experiments were done to investigate the effect of scan direction and layer
thickness. From these experiments it was found that strengths were considerably lower whenscanned in the longitudinal direction when compared to transverse direction. This is due to a bettersintered part when the scan vector is short. Nelson, et al (7) have shown that a series of short scanvectors would receive more net energy than a series of longer scan vectors because of less delaybetween successive pulses.
As expected, lowering the layer thickness from 0.02" to 0.01" resulted in higher strength.However, on further lowering the layer thickness to 0.005" resulted in difficulty in spreading freshlayers without disturbing the previously sintered layers. This is especially the case during the earlybuild-up of the part. Therefore, all further experiments were done at a constant layer thickness of0.01" and all scanning was done along the short-transverse direction.
EFFECT OF SCAN SPEED AND LASER POWERAs shown in Figure 2, for a given laser power, density of the SLS Bronze-Nickel parts
increased as the scan speed decreases. Also, the density is found to increase with increasing laserpower, at a constant scan speed. Higher density is achieved with slower scan speed and higherlaser power due to an increased amount of energy input to the powder surface. A higher amount ofenergy to the powders increases the temperature high enough to result in a larger amount of liquidphase formation. Bronze, which melts incongruently between 870 0 C (solidus) and 1030 0 C(liquidus), exhibits a higher degree of liquid formation as the temperature above the solidusincreases. Also, as temperature increases, the viscosity of molten bronze decreases, facilitatingmore efficient densification with the solid nickel particles. An increase in temperature also lowersthe wetting angle between liquid bronze and solid nickel to result in better wetting characteristicsand improved densification. Figure 3 shows the fracture surface of a typical Bronze-Nickel partshowing melting of bronze particles while the nickel particles are present without any significantmelting. However, at very high laser powers and slow scan speeds (0.2"/sec. - 0.8"/sec.),significant amount of "curling" phenomenon was observed in the parts, as observed by Zonget.al.also (1). Experiments with varying bed temperatures showed that "curling" can be minimised byusing high bed temperatures while keeping laser power high enough with slow scan speedsnecessary for high density parts. However, at bed temperatures above 4500C, the entire powderbed undergoes light sintering and forms a "cake" around the SLS part. This makes it difficult toremove the SLS parts from the surrounding powder bed. Therefore, all experiments in this studywere done at a bed temperature of 4500C.
Strength, which is primarily a function of fractional density (or porosity) (8), exhibited asimilar trend as density with respect to scan speed and laser power, Figure 4. Pores reduce theeffective load carrying capacity of a material. Also, pores act as stress concentrators and aseffective crack initiation sites. Therefore, a sample with density less than 100% is expected to havea strength less than that of a fully dense wrought material. In addition to fractional density, thestrength of such porous compacts depends on various powder characteristics such as particle size,particle size distribution and particle shape. The strength of porous compacts is expected to varywith fractional density p of the compact as follows .
19= C5 o f(p)5
195
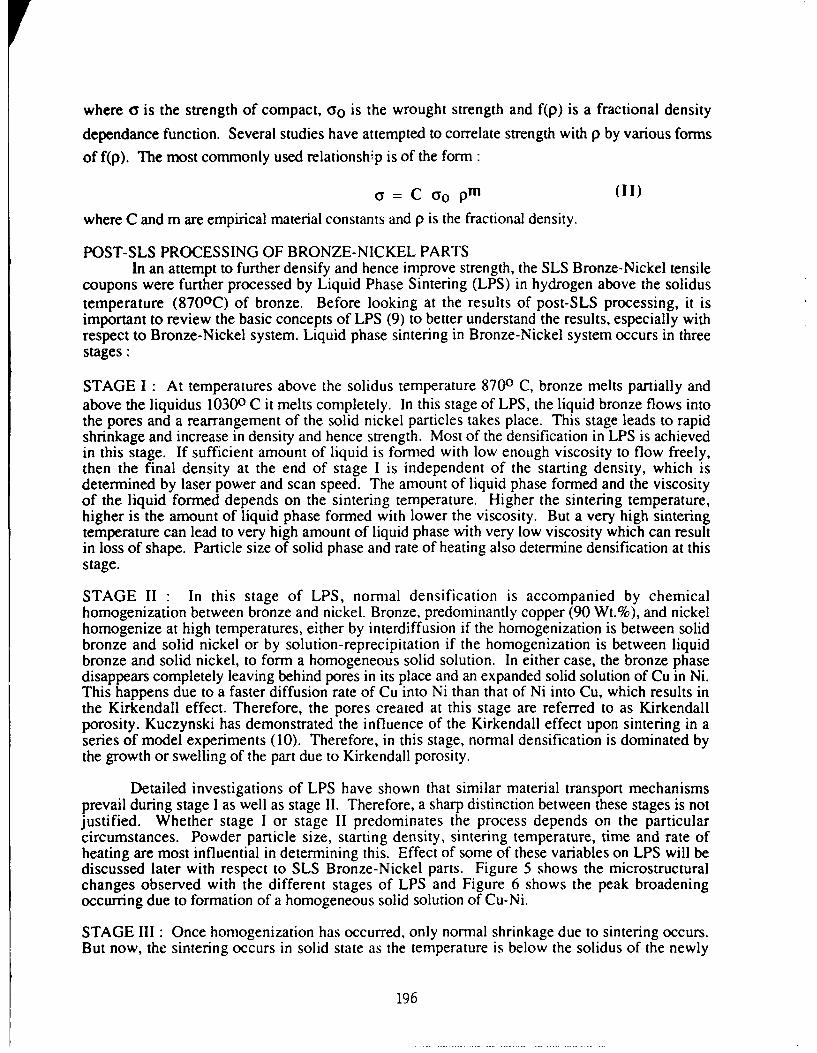
where Y is the strength of compact, 0o is the wrought strength and f(p) is a fractional density
dependance function. Several studies have attempted to correlate strength with p by various forms
of f(p). The most commonly used relationship is of the form :
o = C o pm (II)
where C and m are empirical material constants and p is the fractional density.
POST-SLS PROCESSING OF BRONZE-NICKEL PARTSIn an attempt to further densify and hence improve strength, the SLS Bronze-Nickel tensile
coupons were further processed by Liquid Phase Sintering (LPS) in hydrogen above the solidustemperature (870 0 C) of bronze. Before looking at the results of post-SLS processing, it isimportant to review the basic concepts of LPS (9) to better understand the results, especially withrespect to Bronze-Nickel system. Liquid phase sintering in Bronze-Nickel system occurs in threestages:
STAGE I : At temperatures above the solidus temperature 8700 C, bronze melts partially andabove the liquidus 10300 C it melts completely. In this stage of LPS, the liquid bronze flows intothe pores and a rearrangement of the solid nickel particles takes place. This stage leads to rapidshrinkage and increase in density and hence strength. Most of the densification in LPS is achievedin this stage. If sufficient amount of liquid is formed with low enough viscosity to flow freely,then the final density at the end of stage I is independent of the starting density, which isdetermined by laser power and scan speed. The amount of liquid phase formed and the viscosityof the liquid formed depends on the sintering temperature. Higher the sintering temperature,higher is the amount of liquid phase formed with lower the viscosity. But a very high sinteringtemperature can lead to very high amount of liquid phase with very low viscosity which can resultin loss of shape. Particle size of solid phase and rate of heating also determine densification at thisstage.
STAGE II : In this stage of LPS, normal densification is accompanied by chemicalhomogenization between bronze and nickel. Bronze, predominantly copper (90 Wt.%), and nickelhomogenize at high temperatures, either by interdiffusion if the homogenization is between solidbronze and solid nickel or by solution-reprecipitation if the homogenization is between liquidbronze and solid nickel, to form a homogeneous solid solution. In either case, the bronze phasedisappears completely leaving behind pores in its place and an expanded solid solution of Cu in Ni.This happens due to a faster diffusion rate of Cu into Ni than that of Ni into Cu, which results inthe Kirkendall effect. Therefore, the pores created at this stage are referred to as Kirkendallporosity. Kuczynski has demonstrated the influence of the Kirkendall effect upon sintering in aseries of model experiments (10). Therefore, in this stage, normal densification is dominated bythe growth or swelling of the part due to Kirkendall porosity.
Detailed investigations of LPS have shown that similar material transport mechanismsprevail during stage I as well as stage II. Therefore, a sharp distinction between these stages is notjustified. Whether stage I or stage II predominates the process depends on the particularcircumstances. Powder particle size, starting density, sintering temperature, time and rate ofheating are most influential in determining this. Effect of some of these variables on LPS will bediscussed later with respect to SLS Bronze-Nickel parts. Figure 5 shows the microstructuralchanges observed with the different stages of LPS and Figure 6 shows the peak broadeningoccurring due to formation of a homogeneous solid solution of Cu-Ni.
STAGE III : Once homogenization has occurred, only normal shrinkage due to sintering occurs.But now, the sintering occurs in solid state as the temperature is below the solidus of the newly
196
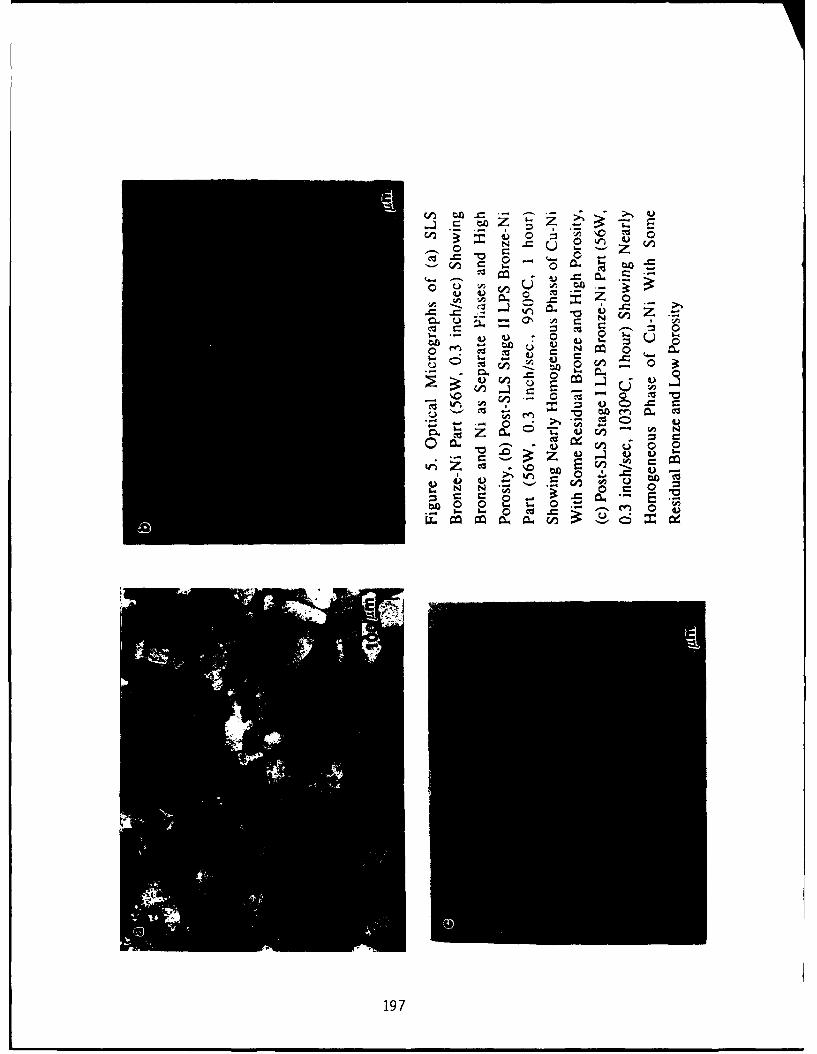
0
C~)CA
4)4 *0 0 s-.$- 1.
197) ~
U 0 qj0
0
40o0 0
1C 0 U~
cc C C
0%0to c
En xcL %~
vi0%
Qnc0%e
c 4%
Q 0% V
00 00
198
formed solid solution of Cu-Ni (-11000 C). Therefore,even for prolonged periods of times,shrinkage or densification during this stage is very small, leaving an overall expansion orshrinkage in the samples, depending on whether first stage or second stage of LPS dominates.
EFFECT OF SINTERING TEMPERATURE AND TIMEAs shown in Figures 7, at temperatures below 10000 C the density and strength of SLS
parts decrease irrespective of starting densities. The density and strength reach a minimum andthen increase slowly to nearly starting densities. At such low temperatures, amount of liquid phaseformed is very small with high viscosity which prevents any significant densification normallyassociated with stage I LPS. Instead, stage II dominates the LPS initially and then stage IIIcontinues till the end of the process.
At 1060oC, a temperature well above the liquidus of bronze, bronze is completely in liquidstate and has sufficiently low viscosity to allow stage I LPS to dominate. Therefore, the densityand hence the strength of the SLS parts increase rapidly at short times of 1 hour. Following thisrapid gain in density and strength, there is a slight loss of density and strength due to stage II LPSwhen the density and strength decrease due to Kirkendall porosity. Some of this loss in densityand strength is regained in stage III of LPS due to solid state sintering of Cu-Ni solid solution. Atsuch a high temperature the flow of liquid in stage I is free of any restriction due to low enoughviscosity. Therefore, the final density and strength at the end of stage I is independent of startingdensity and strength. At temperature above 1060 0 C, the SLS parts exhibited loss of shape even atsmall times due to significantly lower viscosity of the liquid bronze.
At the liquidus temperature of 10300 C, liquid bronze is more viscous than at 10600 C.Therefore, flow of liquid into pores and rearrangement of solid nickel particles is less dominant.Therefore, the density and strength in stage I at 10300 C is lower than that at 10600 C. In a high-starting-density part, the rigid network of solid nickel particles restrict the flow further and preventtheir rearrangement. While in a lower-starting-density part the liquid is more free to flow andrearrange the solid particles. Also, the interdiffusion lengths in a high-starting-density part issmaller, thereby promoting stage II LPS and thus resulting in lower final strengths and densitythan that for a lower-starting-density part. This effect is more pronounced at 10000 C when thestage II homogenization completely dominates over the stage I densification for a higher-starting-density part. Therefore, at 1000oC, while a high-starting density part exhibits worsening ofdensity and strength, a low-starting-density part exhibits improvements in density and strength.
ANISOTROPIC LINEAR DIMENSIONAL CHANGESNet volume changes (expansion or shrinkage) of SLS parts during LPS was in accordance
with the observed density and strength changes. However, the linear dimensional changes,AL/Lo, was not same in all three directions (11). They exhibited some rather interesting trendsreflecting the anistropy in SLS parts.
In general, parts that exhibited swelling or growth during LPS, had a net volume expansionexceeding 10% and was mostly of the order of 15%, resulting in a decrease in fractional density ofthe order of 8% to 12%, as seen earlier. In accordance with stage II LPS, this decrease wasobserved over a relatively short period of time followed by a nearly constant density, as would beexpected in stage III of LPS. However, the linear dimensional expansion in these parts wasanisotropic with least expansion (-2%-3%) in the thickness direction, i.e. direction normal to thesintering plane. Most of the expansion (5%-9%) was confined to the transverse direction (scandirection), Figure 8 (a). A higher degree of sintering along the scan direction, during SLS, resultsin better density along the transverse direction, thus forming a rigid network of solid nickel anddecreasing the interdiffusion lengths. Therefore, stage I LPS is suppressed and stage II LPSdominates along the scan direction yielding a high linear expansion. While a lower degree of
199
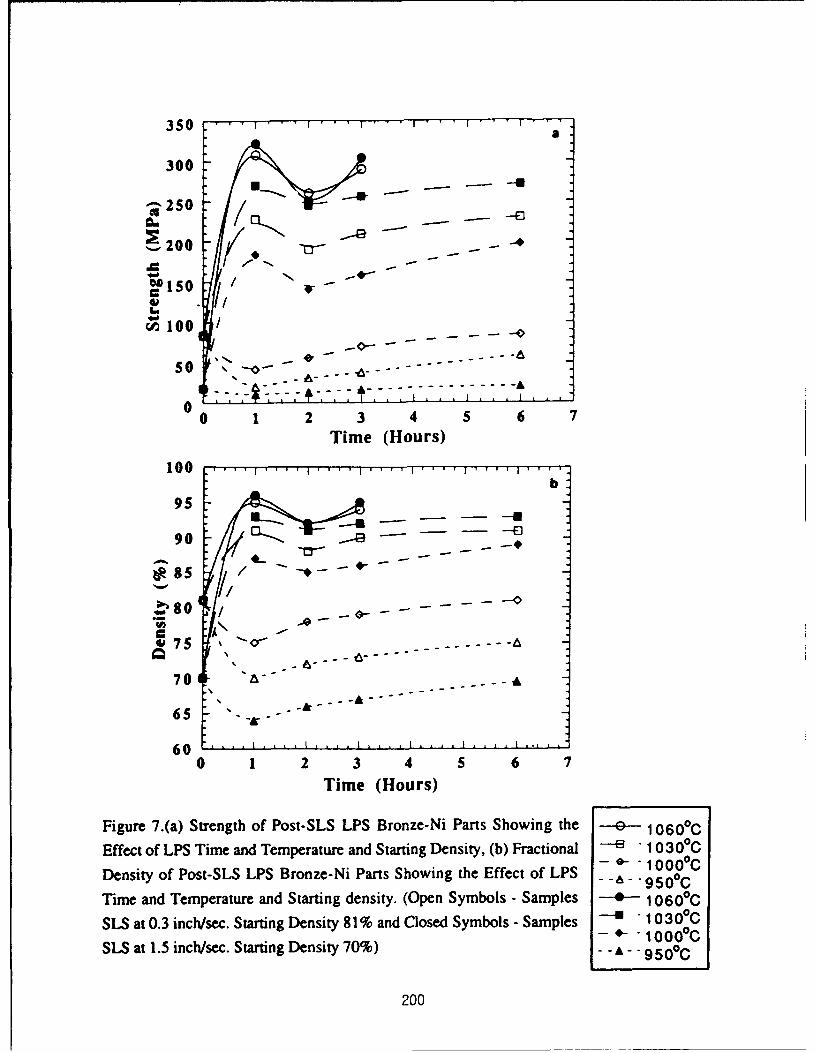
350 •
300
..200.._.--_ - -- -2l50 - •
c 200 ... -50 L"IlSO
1• 00 ,.
- - - -• - -. _A
00 1 2 3 4 5 6 7
Time (Hours)
100b
95-- -- E
Q 75
70 A
65 " - -
0 1 2 3 4 5 6 7
Time (Hours)
Figure 7.(a) Strength of Post-SLS LPS Bronze-Ni Parts Showing the E' 10600C
Effect of LPS Time and Temperature and Starting Density, (b) Fractional • 10300C- .. 10000CDensity of Post-SLS LPS Bronze-Ni Parts Showing the Effect of LPS - -00Oc-6 -- -950OC
Time and Temperature and Starting density. (Open Symbols - Samples 0 10600C
SLS at 0.3 inch/sec. Starting Density 81% and Closed Symbols - Samples - 10300C- - 10000C
SLS at 1.5 inch/sec. Starting Density 70%) 9- - 50Oc
200
sintering normal to the sintering plane results in poor density between layers leaving a loosenetwork of solid nickel and large interdiffusion lengths. Therefore, stage I LPS is less suppressedand stage II LPS is less dominating between the layers resulting in considerably lower linearexpansion. Also, flow of liquid bronze in stage I along the thickness direction is aided by gravityas the samples were post processed with the thickness direction along the direction of gravity.
Like the parts which exhibited growth, the parts exhibiting overall shrinkage ordensification also exhibited volume changes according to changes in density, but the lineardimensional changes in the three directions were different. As explained above, since stage I LPSis more dominant along the thickness direction than along the scan direction, higher linearshrinkage was observed in the thickness direction than along the transverse direction. Shrinkage inthe longitudinal direction was comparable but higher than along the transverse direction, Figure8(b).
STRENGTH VARIATION WITH DENSITYAs discussed earlier, pores reduce the effective load carrying capacity of a material, thus
decreasing the strength of the material. Equation II relates the strength to the fractional densityempirically, based on the premise that pores reduce the load bearing capacity of the material.Based on the discussions of results thus far, it can be seen that both the strength as well as densityof SLS parts increased with increasing laser power and decreasing scan speed. Therefore, it seemsreasonable to relate the strength and density of SLS parts irrespective of the laser power or scanspeeds at which they were processed. As shown in Figure 9, a near perfect fit was obtained forthe strength and density by relating them using the power law Equation II, with the empiricalconstants Coo and m as 590.8 and 9.43 respectively. A high exponent factor, m, of 9.43 indicateslarge gains in strength for small incremental gains in density. This makes it possible to produceless than fully dense yet structurally sound parts of Bronze-Nickel by direct SLS, without anypost-processing. Small incremental gains in density are achievable by increasing the laser powerand/or decreasing the scan speed. The "curl" phenomenon associated with high laser power andslow scan speeds can be overcome by using higher bias temperatures in the high-temperatureworkstation, if light sintering of the powder bed can be avoided or minimised.
Liquid Phase Sintering (LPS) of the SLS Bronze-Ni parts results in an increase or decreasein density and strengths simultaneously as a function of LPS time and temperature, as discussedearlier. Therefore, relating strength with density using the power law form given by Equation II,yields a near perfect fit with the empirical constants Coo and m as 527.94 and 8.73 respectively,Figure 9(b). From comparison of the empirical constants Coo and m for SLS Bronze-Nickel partsand for post-SLS LPS Bronze-Nickel parts, it is clear that density and strength vary in a similarway irrespective of the processing. During SLS scan speed and laser power determine the densityand strength, while during LPS time and temperature determine the density and strength. SLSlaser power is analogous to the LPS temperature as it determines the processing temperature.Similarly, SLS scan speed is analogous to the LPS time as it determines the time of processing.Therefore, by careful manipulation of these four variables it is possible to produce high density,structurally sound parts with no "curl" by direct SLS followed by LPS in very short processingtime periods.
CONCLUSIONSDirect SLS of Bronze-Nickel parts was studied by evaluating the density and strength of
the parts as a function of SLS process parameters : laser power, scan speed, scan direction, andlayer thickness. Post-SLS processing of the parts was done by Liquid Phase Sintering (LPS) tofurther enhance the density and strength. LPS of the SLS parts was studied as a function of timeand temperature. The relationships between the SLS processing parameters, LPS parameters andthe resulting microstructures, density and strengths can be summarized as follows
201
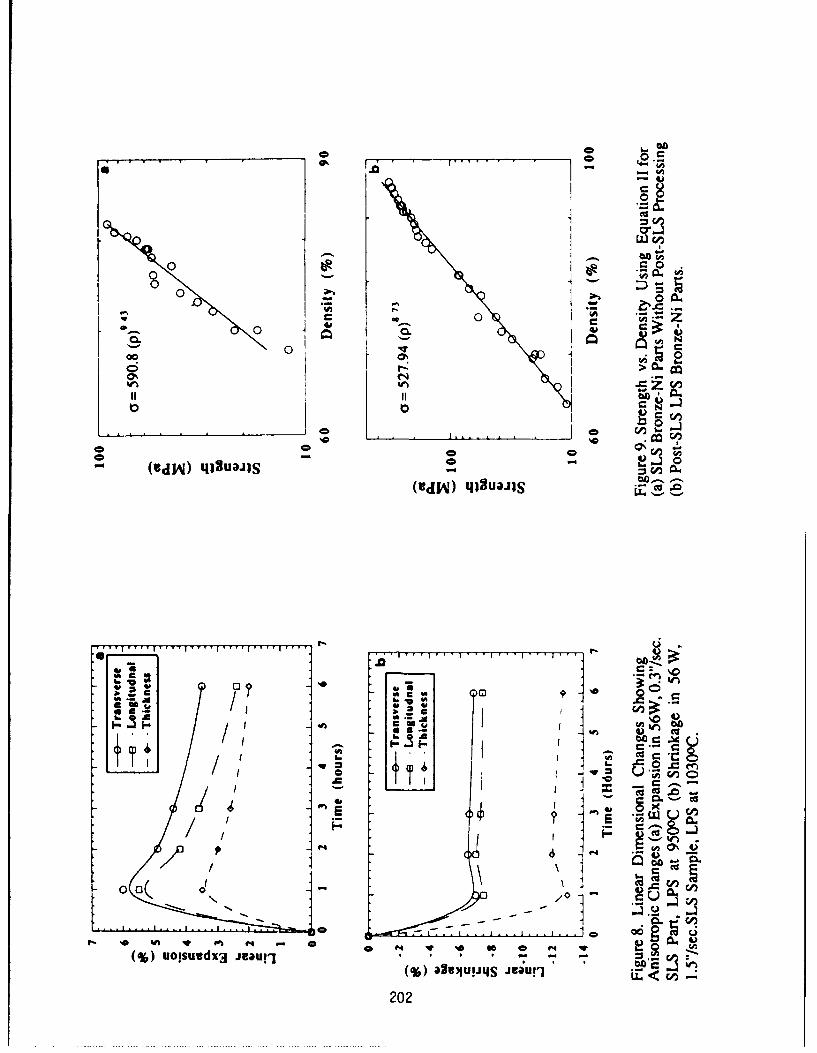
Cý
CDU
cio
o 0. .
o CC('E~ qjun
('dJi) qu~J ~ C d
o_ _ _ _ _ _ _ 0(-C.
*............**,..g
0?202
1. Density and strength increase as the layer thickness decreases, scan speed decreases and laserpower increases.2. Scanning in the short transverse direction y-ielded best results.3. Strength and density of SLS Bronze-Nickel parts show a very strong power law dependence.4. LPS of SLS Bronze-Nickel parts improved density and strength at temperatures well above theliquidus temperature of bronze.5. By LPS at temperatures well below the liquidus temperature of Bronze, density and strength ofSLS Bronze-Nickel parts decreased due to Kirkendall porosity resulting from the homogenizationof Bronze and Ni.6. Linear dimensional changes during LPS were anisotropic.7. Strength and density of post-SLS LPS Bronze-Nickel parts show a similar power lawdependence as the SLS Bronze-Nickel parts.
ACKNOWLEDGMENTSThe authors gratefully acknowledge research grants from.DTM Corporation, Austin, Texas andNSF Small Grant for Exploratory Research, Grant # DDM-9312603.
REFERENCES1. G.Zong, Y.Wu, N.Tran. I.Lee, D.L.Bourell, J.J.Beaman, and H.L.Marcus, "Direct SelectiveLaser Sintering of High Temperature Materials," Proc. of the SFF Symp., Austin, Texas, Aug 3-5, 1992.2. D.L.Bourell, H.L.Marcus, J.W.Barlow, and J.J.Beaman, "Selective Laser Sintering of Metalsand Ceramics," Int. J. Powder Met., 28(4), 369, 1992.3. S.Das, J.C.McWilliams, Y.Wu, and J.J.Beaman, "Design of a High Temperature Workstationfor the Selective Laser Sintering Process," Proc. of the SFF Symp., Austin, Texas, Aug, 1991.4. J.McWilliams, C.Hysinger, and J.J.Beaman, "Design of a High Temperature Process Chamberfor the Selective Laser Sintering Process," Proc. of the SFF Symp., Austin, Texas, Aug 3-5,1992.5. ASTM, "Standard Methods of Tension Testing of Metallic Material," 1977 Annual Book ofASTM Standards, Part 6 : Copper and Copper Alloys, ASTM Designation : E8-77, 898-917,1977..6. Metals Handbook, Vol.7, 9th Ed., American Society of Metals, Metals Park, OH.7. J.C.Nelson, and J.W.Barlow, "Relating Operating Parameters Between Selective LaserSintering Machines which have Different Scanner Geometries and Laser Spot Sizes," Proc. of theSFF Symp., Austin, Texas, Aug 3-5, 1992.8. R.M.German, "Powder Metallurgy Science," Metal Powder Industries Federation, Princeton,NJ.9. F.V.Lenel, "Powder Metallurgy - Principles and Applications," Metal Powder IndustriesFederation, Princeton, NJ.10. G.C.Kuczynski, "Model Experiments and the Theory of Sintering." From "Sintering - KeyPapers," Ed. by S.Somiya and Y.Moriyoshi, Elsevier Applied Science, London and New York.11. J.C.Nelson, N.K.Vail, M.M.Sun, and J.W.Barlow, "Post-Processing of Selective LaserSintered Polycarbonate Parts," Proc. of the SFF Symp., Austin, Texas, Aug, 1991.
203
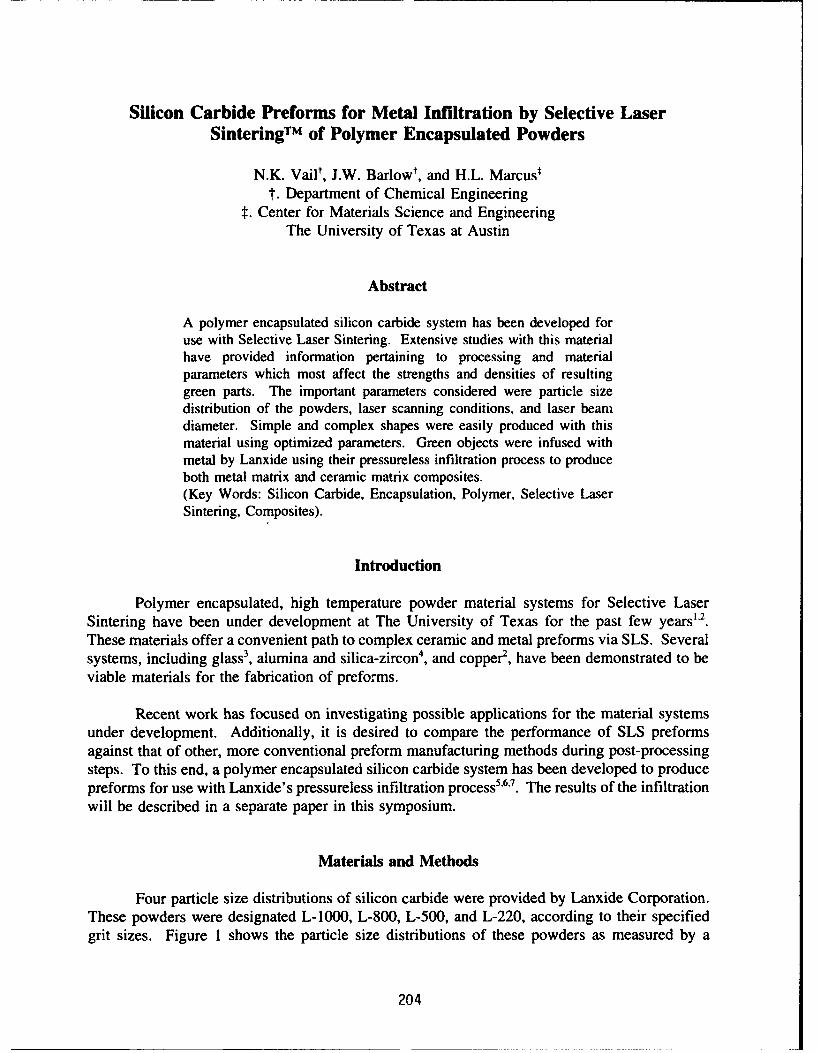
Silicon Carbide Preforms for Metal Infiltration by Selective LaserSinteringTM of Polymer Encapsulated Powders
N.K. Vailt, J.W. Barlowt , and H.L. Marcusýt. Department of Chemical Engineering
t. Center for Materials Science and EngineeringThe University of Texas at Austin
Abstract
A polymer encapsulated silicon carbide system has been developed foruse with Selective Laser Sintering. Extensive studies with this materialhave provided information pertaining to processing and materialparameters which most affect the strengths and densities of resultinggreen parts. The important parameters considered were particle sizedistribution of the powders, laser scanning conditions, and laser beamdiameter. Simple and complex shapes were easily produced with thismaterial using optimized parameters. Green objects were infused withmetal by Lanxide using their pressureless infiltration process to produceboth metal matrix and ceramic matrix composites.(Key Words: Silicon Carbide, Encapsulation, Polymer, Selective LaserSintering, Composites).
Introduction
Polymer encapsulated, high temperature powder material systems for Selective LaserSintering have been under development at The University of Texas for the past few years"2.These materials offer a convenient path to complex ceramic and metal preforms via SLS. Severalsystems, including glass3, alumina and silica-zircon 4, and copper2, have been demonstrated to beviable materials for the fabrication of preforms.
Recent work has focused on investigating possible applications for the material systemsunder development. Additionally, it is desired to compare the performance of SLS preformsagainst that of other, more conventional preform manufacturing methods during post-processingsteps. To this end, a polymer encapsulated silicon carbide system has been developed to producepreforms for use with Lanxide's pressureless infiltration process5"6 '7 . The results of the infiltrationwill be described in a separate paper in this symposium.
Materials and Methods
Four particle size distributions of silicon carbide were provided by Lanxide Corporation.These powders were designated L-1000, L-800, L-500, and L-220, according to their specifiedgrit sizes. Figure 1 shows the particle size distributions of these powders as measured by a
204
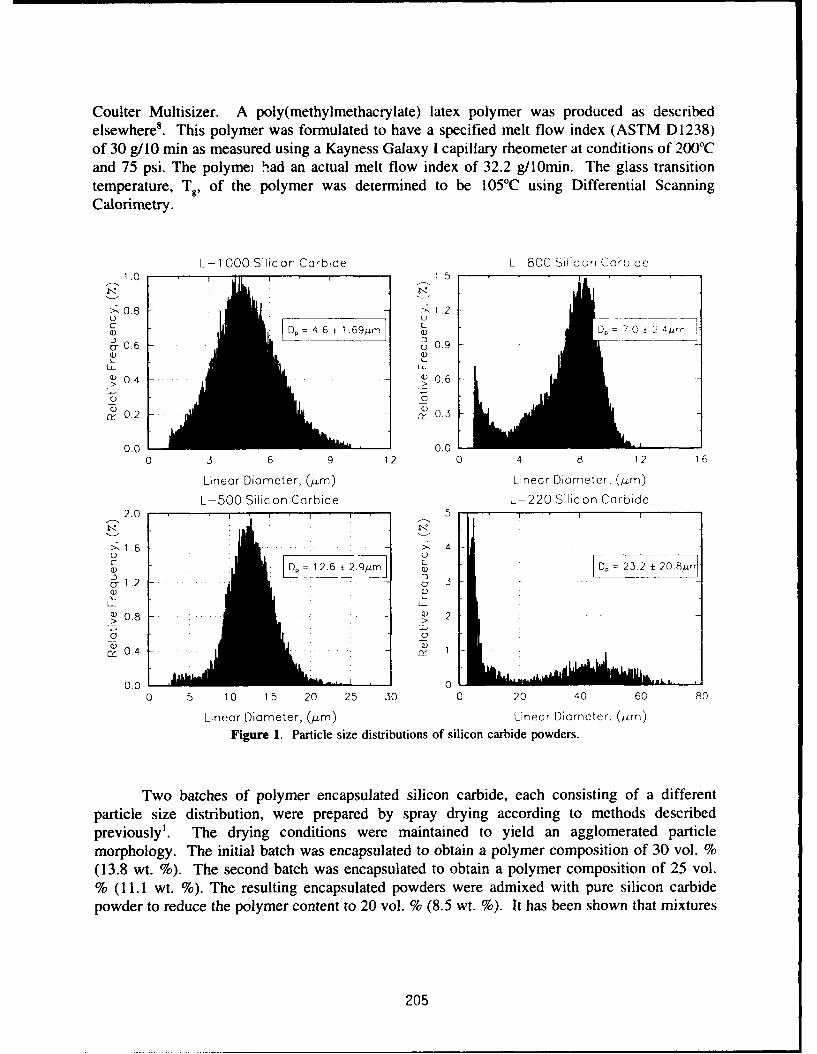
Coulter Multisizer. A poly(methylmethacrylate) latex polymer was produced as describedelsewhere8. This polymer was formulated to have a specified melt flow index (ASTM D1238)of 30 g/10 min as measured using a Kayness Galaxy I capillary rheometer at conditions of 200'Cand 75 psi. The polymei had an actual melt flow index of 32.2 g/l0min. The glass transitiontemperature, T9, of the polymer was determined to be 105'C using Differential ScanningCalorimetry.
L-1 000 Silicon Carbide L -800 Silcon Carbide1.0 1.5 I
>, 0.8 1, 20
UDa) Dp =46 t 1.694zm D - 7 0 1? 2 4Air
a- 0.6 C0.9a) V
> 0 .4 . 0 .6
a acr 0.2 ~i~ih~j~0.3
0.0 0.0
0 3 6 9 12 0 4 8 12 16
Linear Diameter, (,um) Linear Diameter, (4Lm)
L-500 Silicon Carbide L-220 Silicon Carbide2.0 i. 5
N. ". • ,N
>•1.6 "4-
CaDp =1 2.6 ±2.90m Dp 23.2 ±20.8yir
CT 1.2 ... : 3a aa0.8 q a 2
a 0.4 a...: :0 1
0.0 0
0 5 10 15 20 25 30 0 20 40 60 80
Linear Diameter, (,um) Linear Diameter, (Am)Figure 1. Particle size distributions of silicon carbide powders.
Two batches of polymer encapsulated silicon carbide, each consisting of a differentparticle size distribution, were prepared by spray drying according to methods describedpreviously'. The drying conditions were maintained to yield an agglomerated particle
morphology. The initial batch was encapsulated to obtain a polymer composition of 30 vol. %(13.8 wt. %). The second batch was encapsulated to obtain a polymer composition of 25 vol.% (11.1 wt. %). The resulting encapsulated powders were admixed with pure silicon carbidepowder to reduce the polymer content to 20 vol. % (8.5 wt. %). It has been shown that mixtures
205
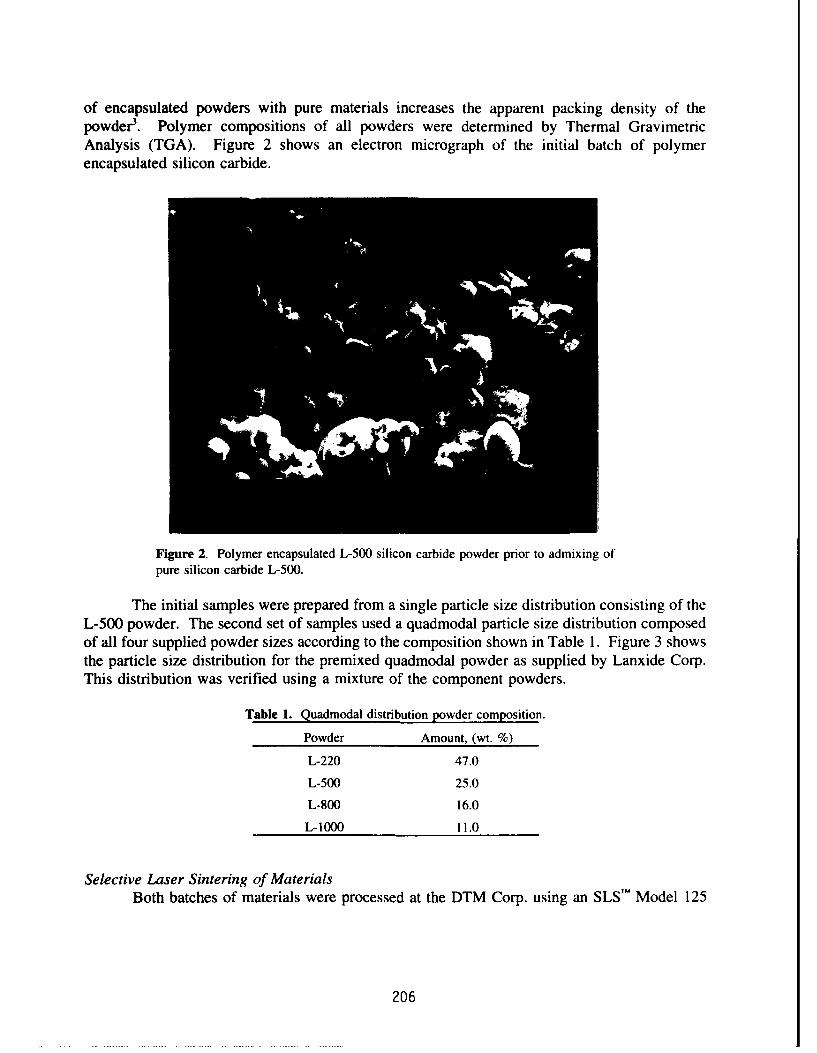
of encapsulated powders with pure materials increases the apparent packing density of thepowder3. Polymer compositions of all powders were determined by Thermal GravimetricAnalysis (TGA). Figure 2 shows an electron micrograph of the initial batch of polymerencapsulated silicon carbide.
Figure 2. Polymer encapsulated L-500 silicon carbide powder prior to admixing ofpure silicon carbide L-500.
The initial samples were prepared from a single particle size distribution consisting of theL-500 powder. The second set of samples used a quadmodal particle size distribution composedof all four supplied powder sizes according to the composition shown in Table 1. Figure 3 showsthe particle size distribution for the premixed quadmodal powder as supplied by Lanxide Corp.This distribution was verified using a mixture of the component powders.
Table 1. Quadmodal distribution powder composition.
Powder Amount, (wt. %)
L-220 47.0
L-500 25.0
L-800 16.0
L- 1000 11.0
Selective Laser Sintering of MaterialsBoth batches of materials were processed at the DTM Corp. using an SLST Model 125
206
workstation equipped with a calibrated 25 watt CO, laser. The laser beam profile and diameterwere determined using a beam profilometer. Processing was conducted in a nitrogenenvironment, less than 2% 02, with a gas flow rate produced by a pressure differential of 0.04in. H20. Surface bed temperatures were maintained at 119'C as determined by a infrared sensorusing an emissivity, e, of 0.90.
QuadModal Silicon Carbide QuadMcacI Siicoon Car iceAs Supplied by Lanxide Corp. Mixea in L.aboratcry6 4
U -3
-5 3 20) 4 0)0 o
Liea 0im tr)A )LnarDantr " ,
"- 2Fi 3
> .>
0 0 -0 1 0 20 30 40 50 60 70 80 0 1 0 20 350 40 50 60 7•
Linear Diameter, (,um) Linear DOameter, (/zrnK
Figure 3. QuadModal particle size distribution.
Table 2 lists SLS operating parameters for the materials studied. 2"x2"xO.3" coupons formetal infiltration tests and l"x3"x' coupons for characterization of green part properties wereproduced using the full range of SLS operating parameters. Complex shapes consisting of a thinwalled electronical packaging box and an engine cowling were produced using optimized SLSoperating parameters.
Table 2. Range of Selective Laser Sintering operating conditions.
Laser Power, Scan Speed, Beam Spacing, Layer Thickness,(W) (ips) (mils) (mil)
6- 16 50- 100 2- 5 4.5
Characterization of SLS PartsPowder bed densities were measured using the method of density cups. Cups having a
wall thickness of 3/16" and a volume 1.5" in diameter by 1" depth are produced by SLS usingoptimized operating parameters. Bed density is determined from the contained volume ofpowder. Cups are made at different bed locations to observe positional density variance. Partdensities were determined from volume and mass measurements. Part green strengths weremeasured by three point bend analysis. Fracture planes of the bend specimens were examinedby Scanning Electron Microscopy (SEM). Polymer content of the green parts were measured byTGA.
207
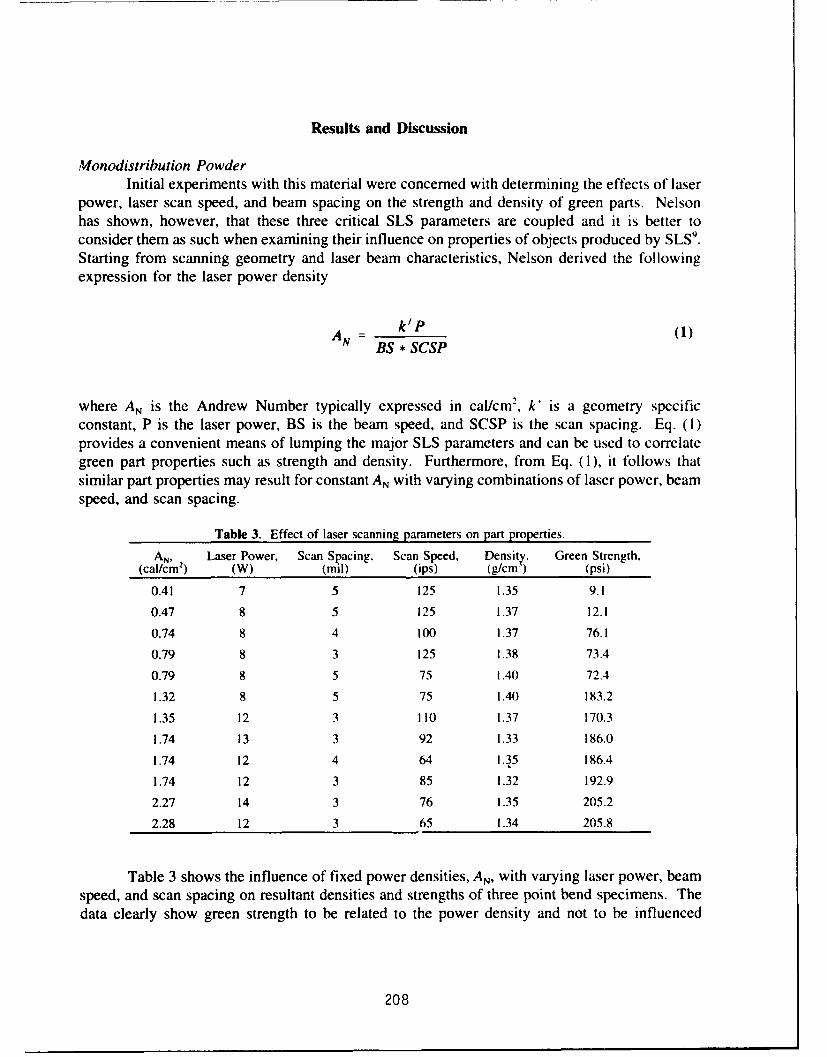
Results and Discussion
Monodistribution PowderInitial experiments with this material were concerned with determining the effects of laser
power, laser scan speed, and beam spacing on the strength and density of green parts. Nelsonhas shown, however, that these three critical SLS parameters are coupled and it is better toconsider them as such when examining their influence on properties of objects produced by SLS9.Starting from scanning geometry and laser beam characteristics, Nelson derived the followingexpression for the laser power density
AN- k'P (1)BS * SCSP
where AN is the Andrew Number typically expressed in cal/cm 2, k' is a geometry specificconstant, P is the laser power, BS is the beam speed, and SCSP is the scan spacing. Eq. (1)provides a convenient means of lumping the major SLS parameters and can be used to correlategreen part properties such as strength and density. Furthermore, from Eq. (1), it follows thatsimilar part properties may result for constant AN with varying combinations of laser power, beamspeed, and scan spacing.
Table 3. Effect of laser scanning parameters on part properties.
AN, Laser Power, Scan Spacing, Scan Speed, Density, Green Strength,(cal/cm') (W) (mil) (ips) (g/cm) (psi)
0.41 7 5 125 1.35 9.1
0.47 8 5 125 1.37 12.1
0.74 8 4 100 1.37 76.1
0.79 8 3 125 1.38 73.4
0.79 8 5 75 1.40 72.4
1.32 8 5 75 1.40 183.2
1.35 12 3 110 1.37 170.3
1.74 13 3 92 1.33 186.0
1.74 12 4 64 1.35 186.4
1.74 12 3 85 .32 192.9
2.27 14 3 76 1.35 205.2
2.28 12 3 65 1.34 205.8
Table 3 shows the influence of fixed power densities, AN, with varying laser power, beamspeed, and scan spacing on resultant densities and strengths of three point bend specimens. Thedata clearly show green strength to be related to the power density and not to be influenced
208
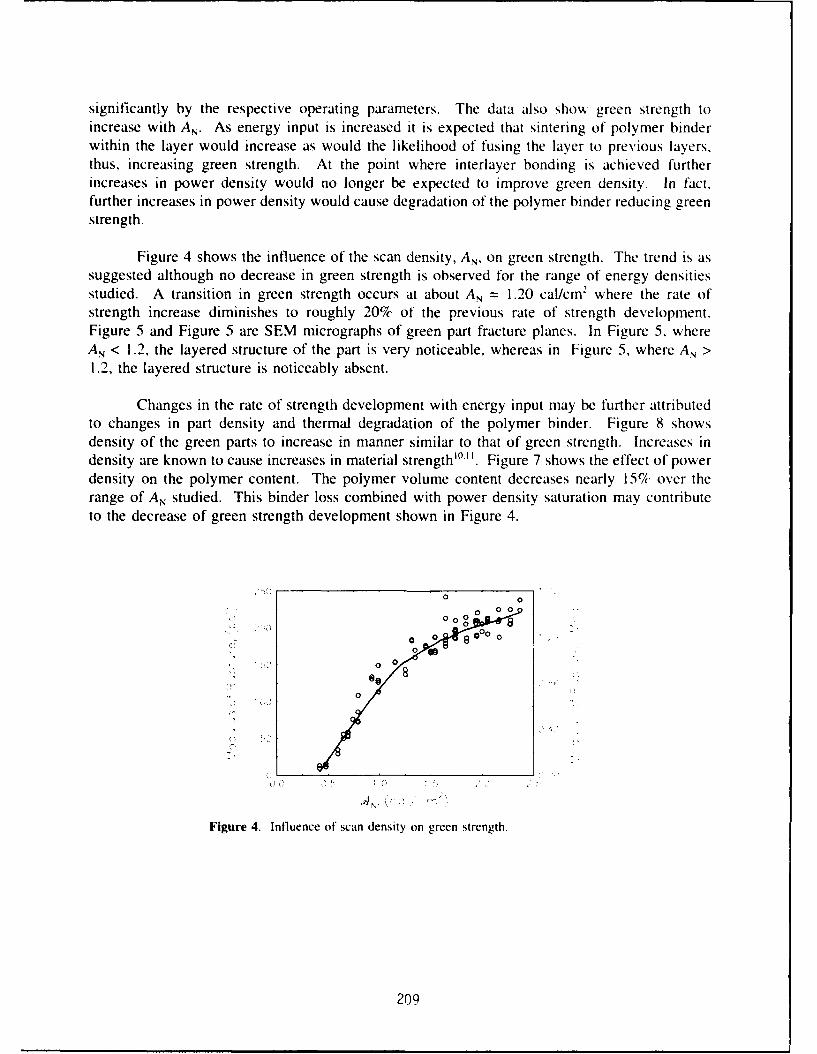
significantly by the respective operating parameters. The data also show green strength toincrease with AN. As energy input is increased it is expected that sintering of polymer binderwithin the layer would increase as would the likelihood of fusing the layer to previous layers.thus, increasing green strength. At the point where interlayer bonding is achieved furtherincreases in power density would no longer be expected to improve green density. In fact,further increases in power density would cause degradation of the polymer binder reducing greenstrength.
Figure 4 shows the influence of the scan density, AN, on green strength. The trend is assuggested although no decrease in green strength is observed for the range of energy densitiesstudied. A transition in green strength occurs at about AN = 1.20 cal/cm2 where the rate ofstrength increase diminishes to roughly 20% of the previous rate of strength development.Figure 5 and Figure 5 are SEM micrographs of green part fracture planes. In Figure 5, whereAN < 1.2, the layered structure of the part is very noticeable, whereas in Figure 5, where AN >
1.2, the layered structure is noticeably absent.
Changes in the rate of strength development with energy input may be further attributedto changes in part density and thermal degradation of the polymer binder. Figure 8 showsdensity of the green parts to increase in manner similar to that of green strength. Increases indensity are known to cause increases in material strength"'- ". Figure 7 shows the effect of powerdensity on the polymer content. The polymer volume content decreases nearly 15%T over therange of AN studied. This binder loss combined with power density saturation may contributeto the decrease of green strength development shown in Figure 4.
0 0
N'0 0
•i~ do 0••oo••
Figure 4. Influence of scan density on green strength.
209
Figure 5. Poor interlayer bonding. AN = 0.69 cal/cm 2. Scan conditions: 7W, 75 ips,and 3 mil beam spacing.
Figure 6. Good interlayer bonding. AN = 2.00 cal/cm 2. Scanning conditions: 12W,74 ips, and 3 mil beam spacing.
210
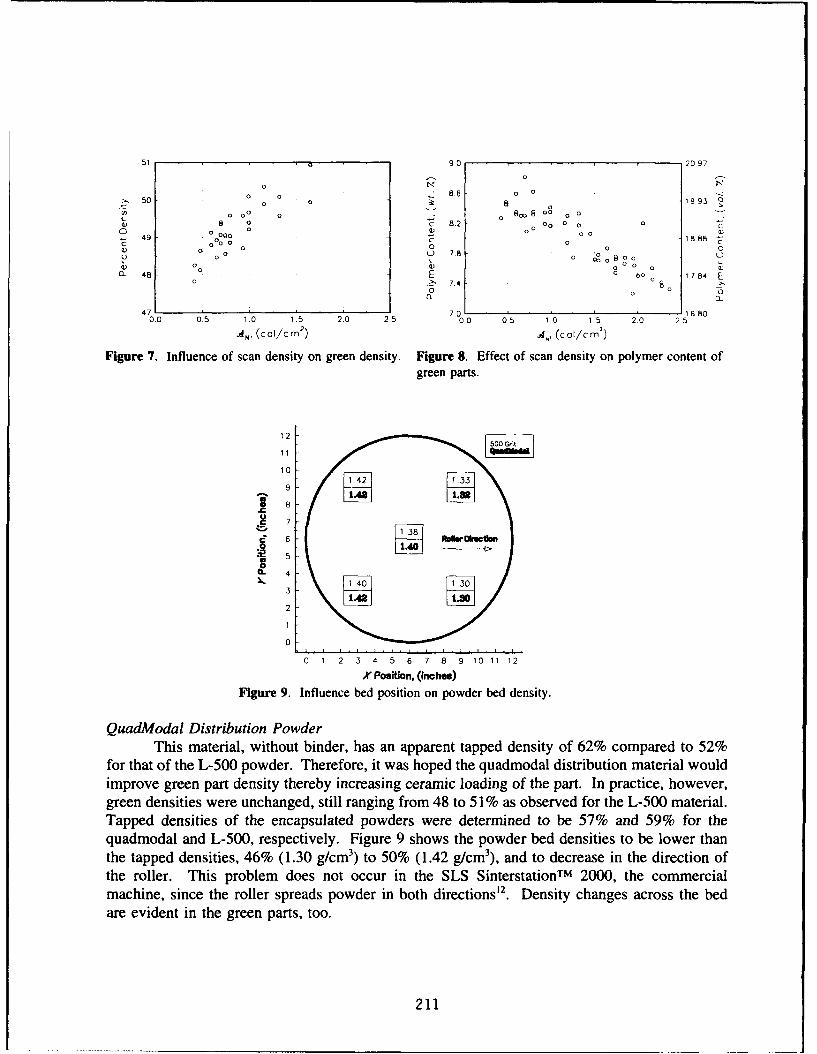
51 90 2097
0 N
50 0 0
c0 00 0 SW 8.8 00 0 08.2 00 0 0
o 49 0 0 0 0 18.88 "
C000 0 1
" ~7.8 .0 0 0
01 00 0 001Q_ 48 E 0.o 1 7 84
>- 7.4 ° o0 0CL 0
47 1 7 0 1 1 6.800.0 0.5 1.0 1.5 2.0 25 00 05 10 15 20 25
A", (cal/cm2) A,1 (c al/cm')
Figure 7. Influence of scan density on green density. Figure 8. Effect of scan density on polymer content ofgreen pans.
12
10
9
5.1 3
A~ 5
4
2A I
0. . . . . . . . . . . .
0 1 2 3 4 5 6 7 8 9 10 11 12
X Position, (Qnc hos)
Figure 9. Influence bed position on powder bed density.
QuadModal Distribution PowderThis material, without binder, has an apparent tapped density of 62% compared to 52%
for that of the L-500 powder. Therefore, it was hoped the quadmodal distribution material wouldimprove green part density thereby increasing ceramic loading of the part. In practice, however,green densities were unchanged, still ranging from 48 to 51% as observed for the L-500 material.Tapped densities of the encapsulated powders were determined to be 57% and 59% for thequadmodal and L-500, respectively. Figure 9 shows the powder bed densities to be lower thanthe tapped densities, 46% (1.30 g/cm 3) to 50% (1.42 g/cm 3), and to decrease in the direction ofthe roller. This problem does not occur in the SLS Sinterstationrm 2000, the commercialmachine, since the roller spreads powder in both directions' 2. Density changes across the bedare evident in the green parts, too.
211
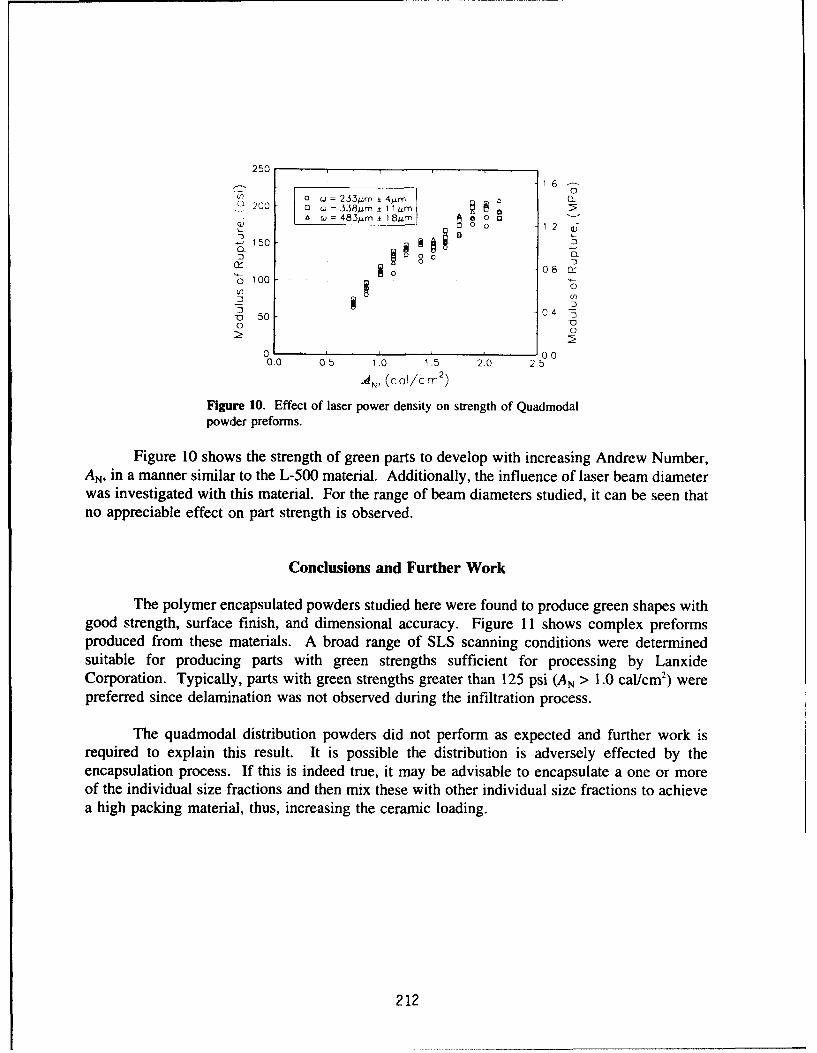
250
1 6 -
2 12 3-
2I00 35 -S050 1
0
8 OL
0. 08
00 2. 2500 05
"AN (Cal/cm 2 )
Figure 10. Effect of laser power density on strength of Quadmodalpowder preforms.
Figure 10 shows the strength of green parts to develop with increasing Andrew Number,AN, in a manner similar to the L-500 material. Additionally, the influence of laser beam diameterwas investigated with this material. For the range of beam diameters studied, it can be seen thatno appreciable effect on part strength is observed.
Conclusions and Further Work
The polymer encapsulated powders studied here were found to produce green shapes withgood strength, surface finish, and dimensional accuracy. Figure 11 shows complex preformsproduced from these materials. A broad range of SLS scanning conditions were determinedsuitable for producing parts with green strengths sufficient for processing by LanxideCorporation. Typically, parts with green strengths greater than 125 psi (AN > 1.0 cal/cm2) werepreferred since delamination was not observed during the infiltration process.
The quadmodal distribution powders did not perform as expected and further work isrequired to explain this result. It is possible the distribution is adversely effected by theencapsulation process. If this is indeed true, it may be advisable to encapsulate a one or moreof the individual size fractions and then mix these with other individual size fractions to achievea high packing material, thus, increasing the ceramic loading.
212
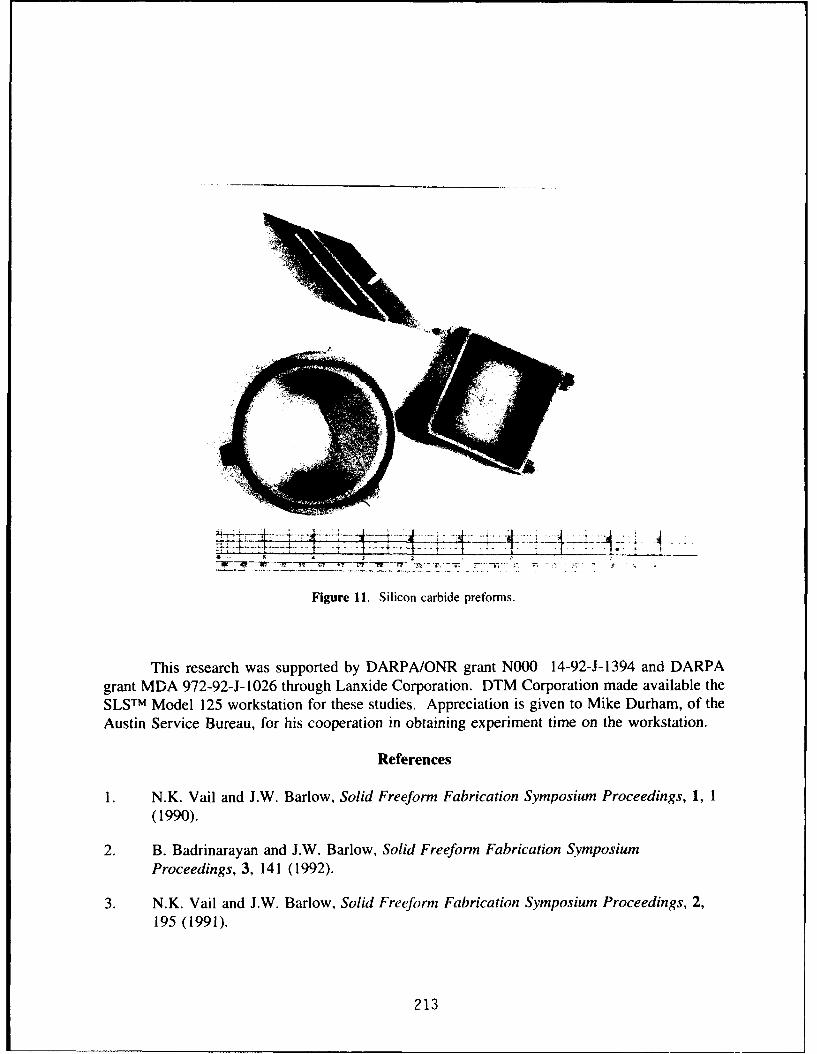
- S - - e .S
Figure 11. Silicon carbide preforms.
This research was supported by DARPA/ONR grant NOOO 14-92-J-1394 and DARPAgrant MDA 972-92-J- 1026 through Lanxide Corporation. DTM Corporation made available theSLSTM Model 125 workstation for these studies. Appreciation is given to Mike Durham, of theAustin Service Bureau, for his cooperation in obtaining experiment time on the workstation.
References
1. N.K. Vail and J.W. Barlow, Solid Freeform Fabrication Symposium Proceedings, 1, 1(1990).
2. B. Badrinarayan and J.W. Barlow, Solid Freeform Fabrication SymposiumProceedings, 3, 141 (1992).
3. N.K. Vail and J.W. Barlow, Solid Freeform Fabrication Symposium Proceedings, 2,195 (1991).
213
4. N.K. Vail and J.W. Barlow, ibid, ref 2, p. 124.
5. B.W. Sorenson, G.H. Schiroky, and A.W. Urquhart, Turbomachinery International, [91(1990).
6. A.W. Urquhart, Advanced Materials and Processes, [71 (1991).
7. S. Ashley, Mechanical Engineering, [7] (1991).
8. N.K. Vail and J.W. Barlow, "Development of a Poly(methyl methacrylate - co - n-butyl methacrylate) Copolymer Binder System", in press.
9. J.C. Nelson, Ph.D. Dissertation, The University of Texas at Austin, 1993.
10. U. Lakshminarayan, Ph.D. Dissertation, The University of Texas at Austin, 1992.
11. M. Yu. Bal'shin, Doklady Akademi Science, USSR, 67 [5], 831.
12. U. Lakshminarayan, Ph.D., DTM Corporation, Private Communication.
214
Fabrication of Ceramic and Metal Matrix Composites FromSelective Laser Sintered Ceramic Preforms
Lucy Deckard and T. Dennis ClaarLanxide CorporationNewark, Delaware
Abstract
This paper will discuss the tool-less fabrication of functional advanced composites by infusion of aceramic or metal matrix into Selective Laser Sintered (SLS) porous ceramic preforms usingLanxide's patented matrix infusion processes. The fabrication of porous preforms of particulateceramics by SLS at the University of Texas at Austin is described in a companion paper. ThePRIMEXTM pressureless metal infiltration process was used to infiltrate aluminum matrices intoboth SiC and Al20 3 particulate SLS preforms to make metal matrix composites without the use oftooling. Also, SiQCAI2O3 ceramic matrix composites were fabricated using the DIMOXTmdirected metal oxidation process to grow an Al2 0 3 matrix into porous SiC particulate SLSpreforms. Measured properties and microstructures of the resulting composites will be presentedand compared to similar composites made using conventionally fabricated preforms. The rapidprototyping of a SiC/Al MMC electronic power package to near-net shape from an SLS preformwill also be described.
Introduction
Lanxide's matrix infusion processes for fabricating ceramic and metal matrix composites arenear-net shape processes in which a matrix is infused into a porous ceramic preform. The finalcomposite shape is dictated by the shape of the preform; therefore, a critical step in the process isthe fabrication of a porous preform to near-net shape. Preforms typically have been made using avariety of standard ceramic processing methods, including tape casting, injection molding, greenmachining, dry pressing, etc. Many of these conventional processes either do not have thecomplex shape-making capabilities needed or require tooling that is expensive and time-consumingto fabricate for prototypes or small production runs. The newly-emerging Solid FreeformFabrication tehnologies, and in particular Selective Laser Sintering (SLS), appear to be ideallysuited to fill the need for a method to fabricate porous preforms to near-net shape quickly andwithout the use of tooling.
One of the objectives of the current work is to evaluate the feasibility of fabricating CeramicMatrix Composites (CMCs) and Metal Matrix Composites (MMCs) using preforms formed to netshape using SFF processes. Fabrication of the SLS ceramic preforms is described in a companionpaper, the results of work to convert these preforms to CMCs and MMCs via Lanxide's matrixinfusion processes are discussed below.
Lanxide's Matrix Infusion Processes
The DIMOXTM directed metal oxidation process for fabricating ceramic matrix composites (Fig.1) and the PRIMEXTM pressureless metal infiltration process for metal matrix composites (Fig. 2)are similar. In both processes, a ceramic preform is made from the desired reinforcing material,which can be ceramic particulates or fibers. In the current work, SiC and Al 2 03 particles rangingin size from I pim to 60 gtm, which are typical reinforcing materials, were used'(fibers werebeyond the scope of this work). The preform is formed to the desired shape of the final part, abarrier is applied to the upper surfaces to stop infiltration and retain shape, and the preform isplaced in contact with the growth alloy which is typically an aluminum alloy. In the CMC process,
215
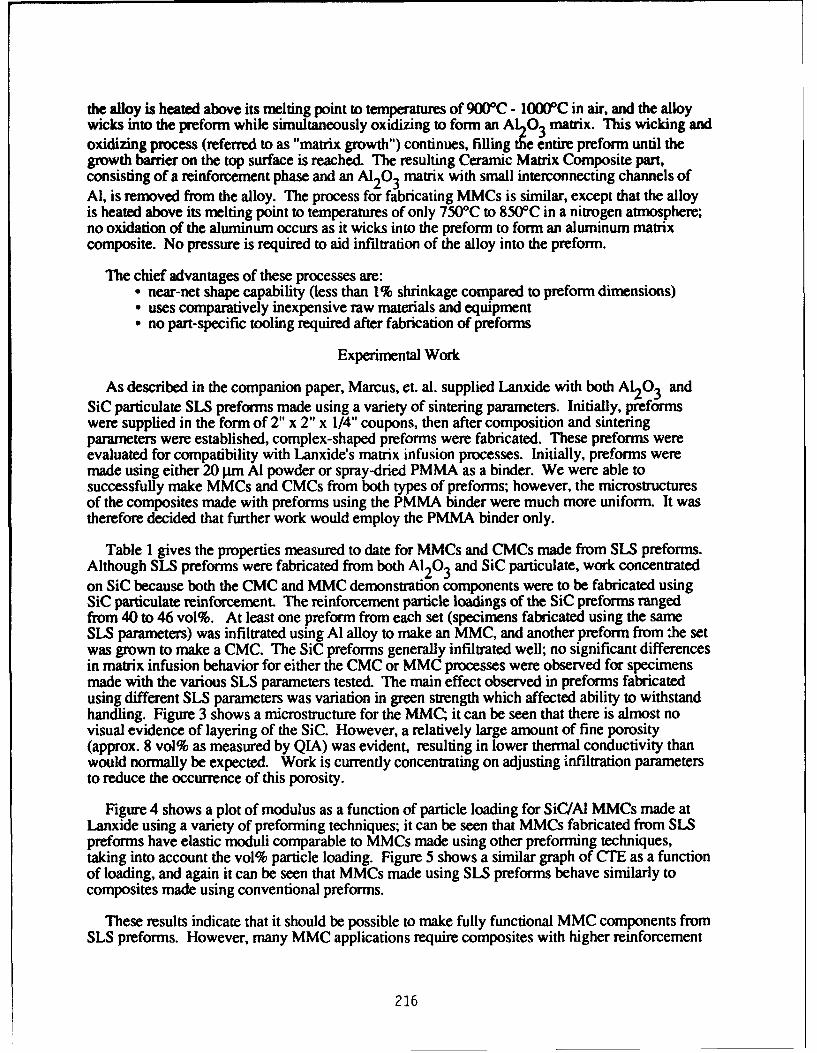
the alloy is heated above its melting point to temperatures of 900*C - 10000C in air, and the alloywicks into the preform while simultaneously oxidizing to form an AL203 matrix. This wicking andoxidizing process (referred to as "matrix growth") continues, filling the entire preform until thegrowth barrier on the top surface is reached. The resulting Ceramic Matrix Composite part,consisting of a reinforcement phase and an Al2 0 3 matrix with small interconnecting channels ofAl, is removed from the alloy. The process for fabricating MMCs is similar, except that the alloyis heated above its melting point to temperatures of only 7500C to 850C in a nitrogen atmosphere;no oxidation of the aluminum occurs as it wicks into the preform to form an aluminum matrixcomposite. No pressure is required to aid infiltration of the alloy into the preform.
The chief advantages of these processes are:* near-net shape capability (less than 1% shrinkage compared to preform dimensions)* uses comparatively inexpensive raw materials and equipment• no part-specific tooling required after fabrication of preforms
Experimental Work
As described in the companion paper, Marcus, et. al. supplied Lanxide with both AI2 0 3 andSiC particulate SLS preforms made using a variety of sintering parameters. Initially, preformswere supplied in the form of 2" x 2" x 1/4" coupons, then after composition and sinteringparameters were established, complex-shaped preforms were fabricated. These preforms wereevaluated for compatibility with Lanxide's matrix infusion processes. Initially, preforms weremade using either 20 lim Al powder or spray-dried PMMA as a binder. We were able tosuccessfully make MMCs and CMCs from both types of preforms; however, the microstructuresof the composites made with preforms using the PMMA binder were much more uniform. It wastherefore decided that further work would employ the PMMA binder only.
Table 1 gives the properties measured to date for MMCs and CMCs made from SLS preforms.Although SLS preforms were fabricated from both A12 0 3 and SiC particulate, work concentratedon SiC because both the CMC and MMC demonstration components were to be fabricated usingSiC particulate reinforcement. The reinforcement particle loadings of the SiC preforms rangedfrom 40 to 46 vol%. At least one preform from each set (specimens fabricated using the sameSLS parameters) was infiltrated using Al alloy to make an MMC, and another preform from the setwas grown to make a CMC. The SiC preforms generally infiltrated well; no significant differencesin matrix infusion behavior for either the CMC or MMC processes were observed for specimensmade with the various SLS parameters tested. The main effect observed in preforms fabricatedusing different SLS parameters was variation in green strength which affected ability to withstandhandling. Figure 3 shows a microstructure for the MMC; it can be seen that there is almost novisual evidence of layering of the SiC. However, a relatively large amount of fine porosity(approx. 8 vol% as measured by QIA) was evident, resulting in lower thermal conductivity thanwould normally be expected. Work is currently concentrating on adjusting infiltration parametersto reduce the occurrence of this porosity.
Figure 4 shows a plot of modulus as a function of particle loading for SiC/Al MMCs made atLanxide using a variety of preforming techniques; it can be seen that MMCs fabricated from SLSpreforms have elastic moduli comparable to MMCs made using other preforming techniques,taking into account the vol% particle loading. Figure 5 shows a similar graph of CTE as a functionof loading, and again it can be seen that MMCs made using SLS preforms behave similarly tocomposites made using conventional preforms.
These results indicate that it should be possible to make fully functional MMC components fromSLS preforms. However, many MMC applications require composites with higher reinforcement
216
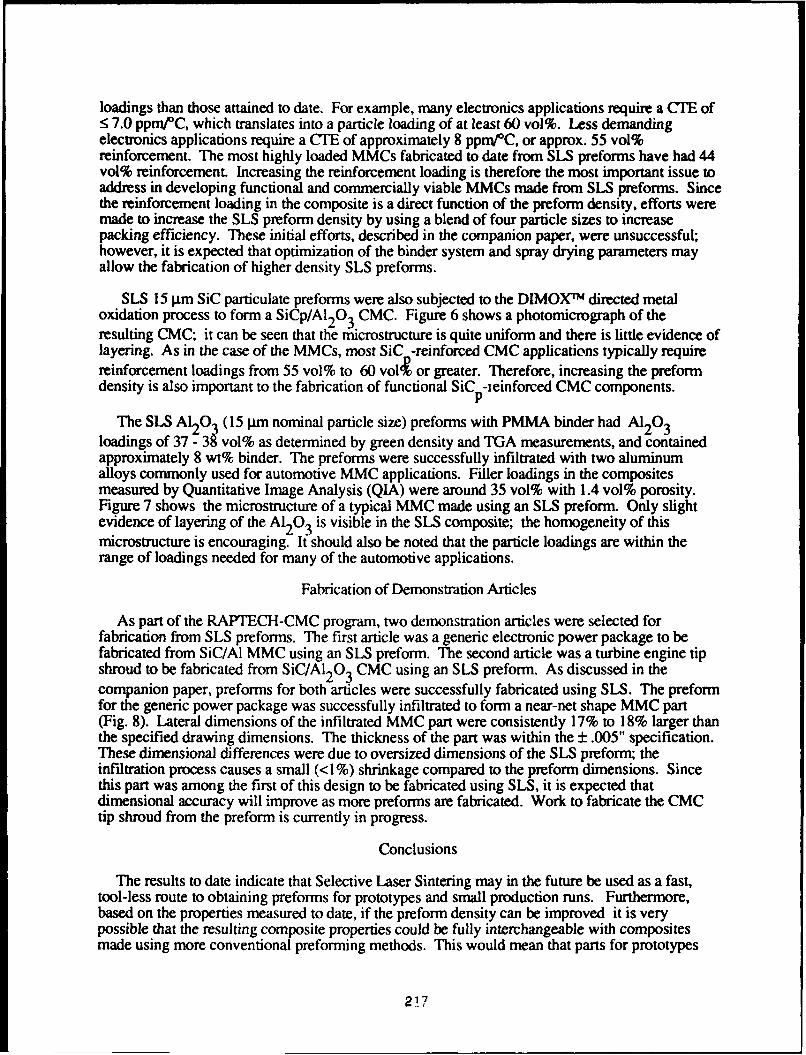
loadings than those attained to date. For example, many electronics applications require a CTE of< 7.0 ppmWC, which translates into a particle loading of at least 60 vol%. Less demandingelectronics applications require a CTE of approximately 8 ppm 0PC, or approx. 55 vol%reinforcement. The most highly loaded MMCs fabricated to date from SLS preforms have had 44vol% reinforcement. Increasing the reinforcement loading is therefore the most important issue toaddress in developing functional and commercially viable MMCs made from SLS preforms. Sincethe reinforcement loading in the composite is a direct function of the preform density, efforts weremade to increase the SLS preform density by using a blend of four particle sizes to increasepacking efficiency. These initial efforts, described in the companion paper, were unsuccessful;however, it is expected that optimization of the binder system and spray drying parameters mayallow the fabrication of higher density SLS preforms.
SLS 15 gim SiC particulate preforms were also subjected to the DIMOX'm directed metaloxidation process to form a SiCp/A120 3 CMC. Figure 6 shows a photomicrograph of theresulting CMC; it can be seen that the microstructure is quite uniform and there is little evidence oflayering. As in the case of the MMCs, most SiC -reinforced CMC applications typically requirereinforcement loadings from 55 vol% to 60 vol'k or greater. Therefore, increasing the preformdensity is also important to the fabrication of functional SiC p-einforced CMC components.
The SLS AIO (15 P.m nominal particle size) preforms with PMMA binder had Al 20 3loadings of 37 - 3R vol% as determined by green density and TGA measurements, and containedapproximately 8 wt% binder. The preforms were successfully infiltrated with two aluminumalloys commonly used for automotive MMC applications. Filler loadings in the compositesmeasured by Quantitative Image Analysis (QIA) were around 35 vol% with 1.4 vol% porosity.Figure 7 shows the microstructure of a typical MMC made using an SLS preform. Only slightevidence of layering of the Al 2 0 3 is visible in the SLS composite; the homogeneity of thismicrostructure is encouraging. It should also be noted that the particle loadings are within therange of loadings needed for many of the automotive applications.
Fabrication of Demonstration Articles
As part of the RAPTECH-CMC program, two demonstration articles were selected forfabrication from SLS preforms. The first article was a generic electronic power package to befabricated from SiC/Al MMC using an SLS preform. The second article was a turbine engine tipshroud to be fabricated from SiC/A12 0 3 CMC using an SLS preform. As discussed in thecompanion paper, preforms for both articles were successfully fabricated using SLS. The preformfor the generic power package was successfully infiltrated to form a near-net shape MMC part(Fig. 8). Lateral dimensions of the infiltrated MMC part were consistently 17% to 18% larger thanthe specified drawing dimensions. The thickness of the part was within the ± .005" specification.These dimensional differences were due to oversized dimensions of the SLS preform; theinfiltration process causes a small (<1%) shrinkage compared to the preform dimensions. Sincethis part was among the first of this design to be fabricated using SLS, it is expected thatdimensional accuracy will improve as more preforms are fabricated. Work to fabricate the CMCtip shroud from the preform is currently in progress.
Conclusions
The results to date indicate that Selective Laser Sintering may in the future be used as a fast,tool-less route to obtaining preforms for prototypes and small production runs. Furthermore,based on the properties measured to date, if the preform density can be improved it is verypossible that the resulting composite properties could be fully interchangeable with compositesmade using more conventional preforming methods. This would mean that parts for prototypes
21_7
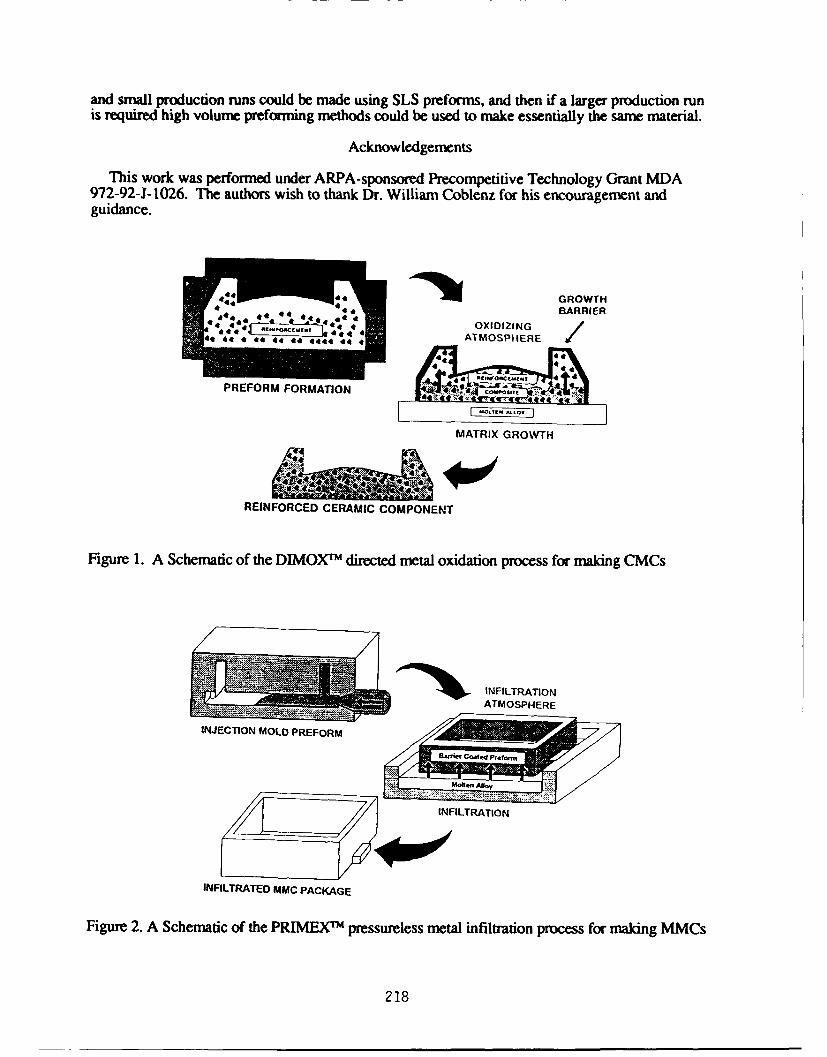
and small production runs could be made using SLS preforms, and then if a larger production run
is required high volume preforming methods could be used to make essentially the same material.
Acknowledgements
This work was performed under ARPA-sponsored Precompetitive Technology Grant MDA972-92-J-1026. The authors wish to thank Dr. William Coblenz for his encouragement andguidance.
*44 GROWTHBARRIER
* 4 OXIDIZING /S*4, , 44 ATMOSPHERE
PREFORM FORMATION
MATRIX GROWTH
REINFORCED CERAMIC COMPONENT
Figure 1. A Schematic of the DIMOXTNm directed metal oxidation process for making CMCs
INFILTRATION
ATMOSPHERE
INJECTION MOLD PREFORM -
8- oed Preo.",
INFILTRATION
INFILTRATED MMC PACKAGE
Figure 2. A Schematic of the PRIMEXTm pressureless metal infiltration process for making MMCs
218
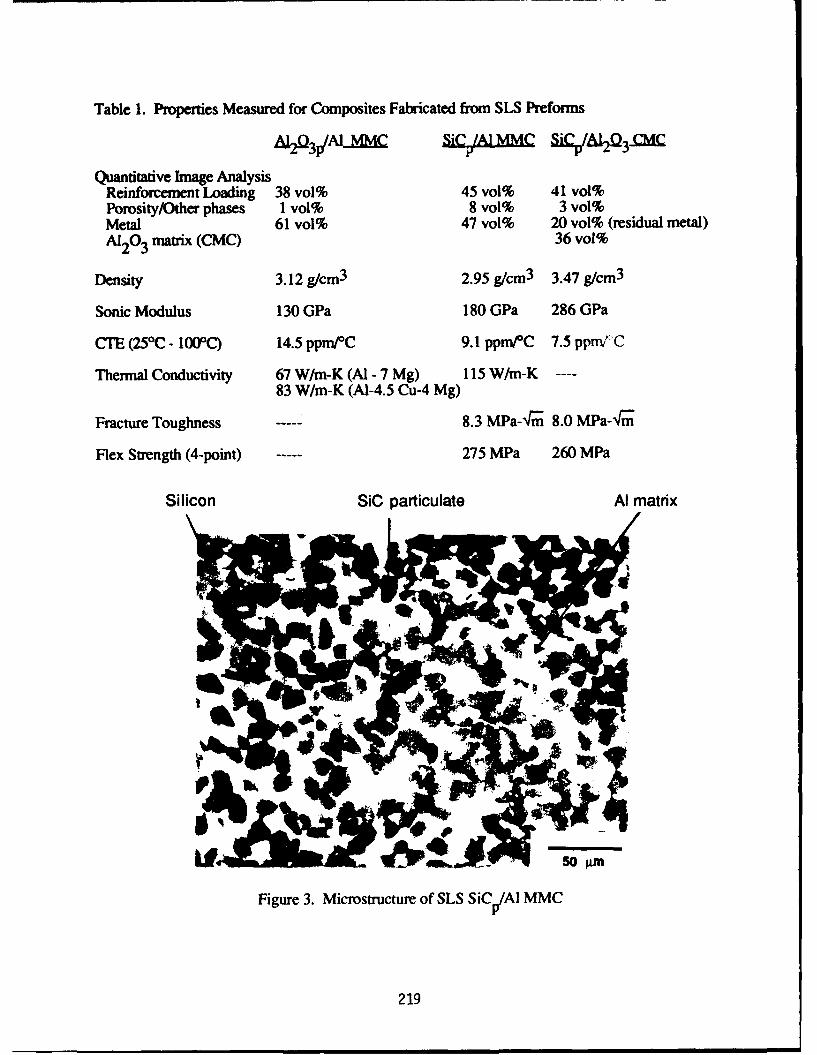
Table 1. Properties Measured for Composites Fabricated from SLS Preforms
AI2Q3p/AlMMfC SiC /l&LMMC 5LYpA1Q 3-C'K
Quantitative Image AnalysisReinforcement Loading 38 vol% 45 vol% 41 vol%Porosity/Other phases 1 vol% 8 vol% 3 vol%Metal 61 vol% 47 vol% 20 vol% (residual metal)
AI203 matrix (CMC) 36 vol%
Density 3.12 g/cm 3 2.95 g/cm3 3.47 g/cm 3
Sonic Modulus 130 GPa 180 GPa 286 GPa
CTE (250C - 100°C) 14.5 pprn/0C 9.1 ppm/nC 7.5 pprrn 'C
Thermal Conductivity 67 W/m-K (Al - 7 Mg) 115 W/n-K ----83 W/m-K (A1-4.5 Cu-4 Mg)
Fracture Toughness 8.3 MPa-Gm 8.0 MPa--4 m
Flex Strength (4-point) 275 MPa 260 MPa
Silicon SiC particulate Al matrix
0 L I '0 PM
Figure 3. Microstructure of SLS SiC/AI MMC
219
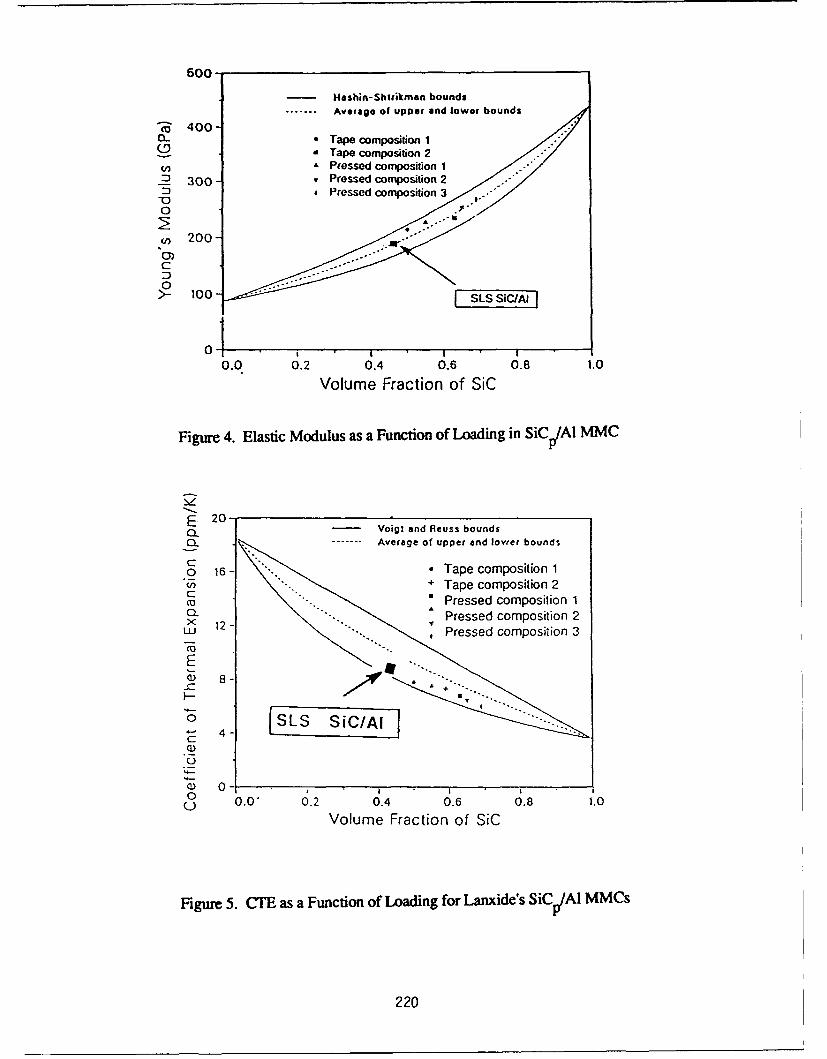
600
He shin-Shtltkman bounds....... Average of UpPer and lower bounds
a 4000. * Tape composition 1C9 a Tape composition 2( A Pressed composition 1-2 300 , Pressed composition 20 e Pressed composition 3
"-0
" 200
cJ)C
0 > t-o00 SLS SiCIAI]
0 1 1 i
0.0 0.2 0.4 0.6 0.8 1.0
Volume Fraction of SiC
Figure 4. Elastic Modulus as a Function of Loading in SiC /AI MMC
vp
S2E 2o0-L 2- - Voigi and Reuss bounds
-------. Average of upper and lower bounds
C0O 16 - •Tape composition 1"• + Tape composition 2
(U Pressed composition ICL "-. "Pressed composition 2
x 12-".Lu '.. ,Pressed composition 3
(D 8-
0
C
0 0.0, 0.2 0.4 0.6 081.0Volume Fraction of SIC
Figure 5. CTE as a Function of Loading for Lanxide's SiC1AAI MMCs
220
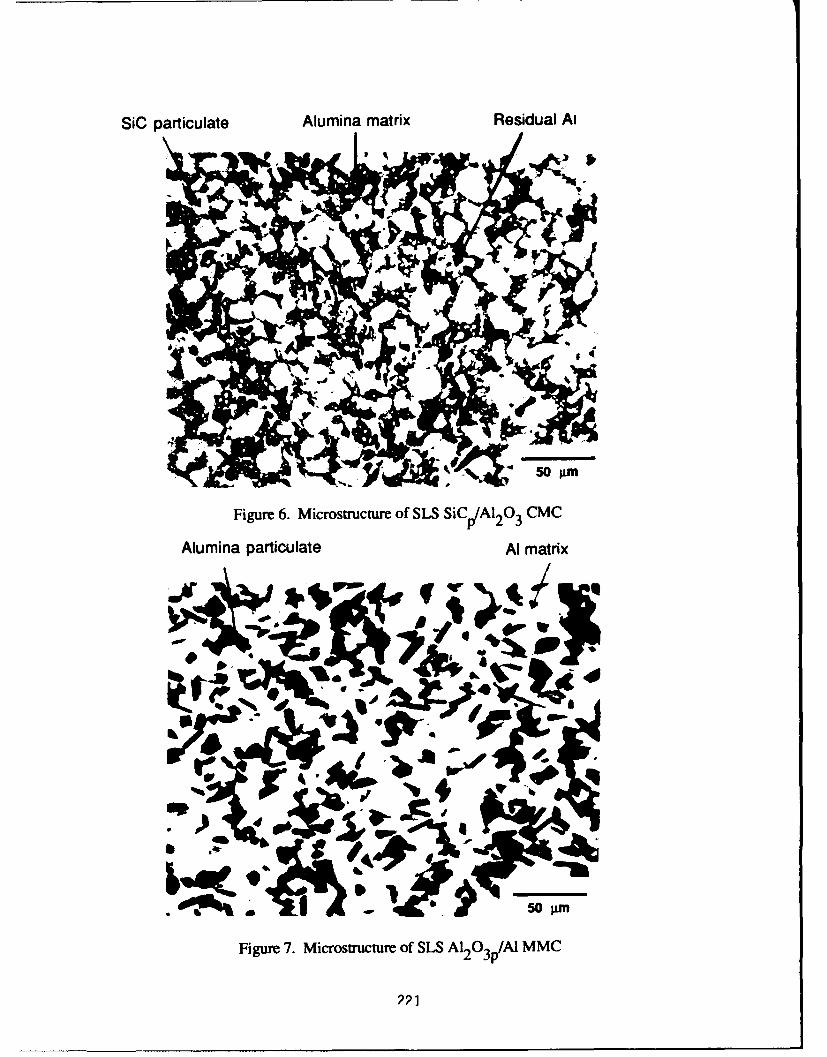
SiC particulate Alumina matrix Residual Al
5 AM
Figure 6. Microstructure of SLS SiCp/A120 3 CMC
Alumina particulate Al matrix
0 q0
Figure 7. Microstructure of SLS A12 03 p/AI MMC
2P2
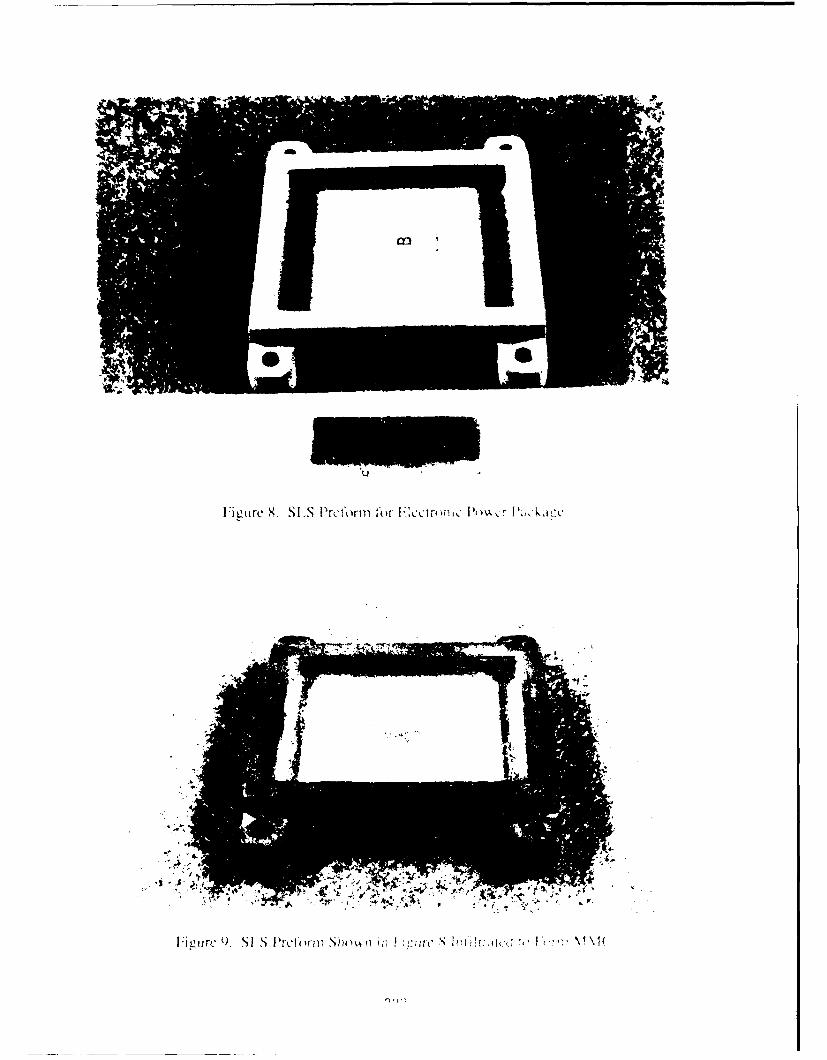
Eiliiirc X SLS Prcrnt'Orm I'( rr)cI~~r PcAi'uc
'I i i rc SI S Picr lwn Sh w is 7o'iic j: ir I: J ~ \ 1
POWDER LAYER POSITION ACCURACYIN POWDER-BASED RAPID PROTOTYPING
Sang-Joon John Lee Emanuel Sachs Michael Cima
Department of Mechanical EngineeringDepartment of Materials Science and Engineering
Massachusetts Institute of TechnologyCambridge, Massachusetts 02139
Abstract
Layer position accuracy in powder-based processes such as Three Dimensional Printing andSelective Laser Sintering is a fundamental concern for dimensional control in the verticaldirection. Ideally, each powder layer is generated at a vertical position that remains fixed at aprescribed distance from the floor of the powder bed. However, the powder bed beneath anygiven layer is compressible. Loads imparted to the top of that layer may cause it to displacedownward. The weight of subsequent layers is an inherent source of load, that increases with thenumber of layers added. Other possible causes for position error include mechanical forcesapplied during powder spreading and powder densification from vibration.
Vertical displacements at various levels within powder beds have been measured for a set ofaluminum oxide powders, using the layering process of 3D Printing. The mean displacement ina 76.2 mm deep bed ranged from 23 microns for a 30-micron platelet-shaped powder to over 260microns for a 9-micron platelet-shaped sample. In all cases, position errors were most severe inthe middle regions of the powder beds, with diminishing magnitude toward the top and bottom.
A model for layer displacement has been examined using experimental data for compressibilityaid applied load. Predictions made from the model captured the relative magnitudes of actualerrors at various positions within layered powder beds.
Introduction
Several rapid prototyping technologies fabricate solid freeforms in a layer-by-layer sequence,with each layer representing a two-dimensional "slice" of the final part [Wohlers]. Processesknown as Three Dimensional Printing [Sachs] and Selective Laser Sintering [Deckardi create theslices by joining selected areas of thin powder distributions.
Figure 1 shows the basic operating sequence of 3D Printing. Each cycle begins with finepowder, spread into a thin layer. A slicing algorithm draws detailed information for every layer,from a CAD representation of the desired part, Then a raster-scanning printhead (using atechnology similar to ink-jet printing) selectively applies a binder material to join particles wherethe object is to be formed. A piston that supports the powder bed lowers so that the next powderlayer can be leveled and selectively joined. The layered building cycle repeats until the part iscompleted. After a heat treatment, removal of the unbound powder reveals the finsihed part.
223
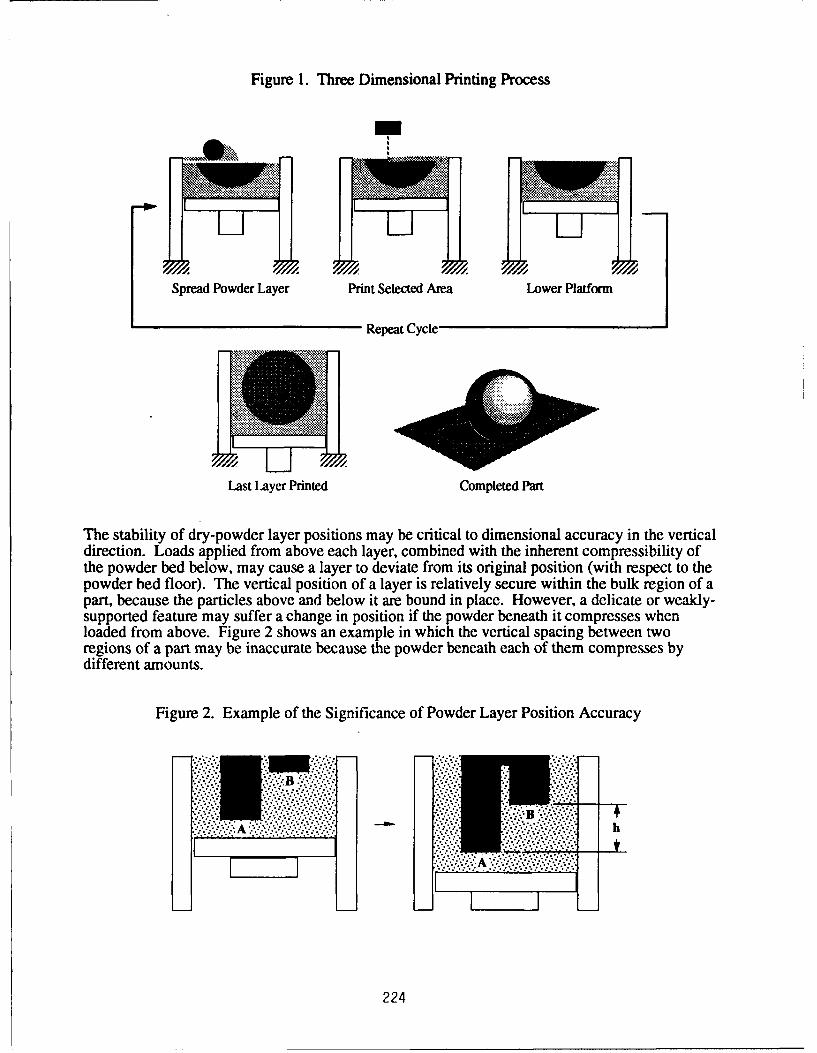
Figure 1. Three Dimensional Printing Process
Spread Powder Layer Print Selected Area Lower Platform
Repeat Cycle
: :. ... .. :
Last Layer Printed Completed Part
The stability of dry-powder layer positions may be critical to dimensional accuracy in the verticaldirection. Loads applied from above each layer, combined with the inherent compressibility ofthe powder bed below, may cause a layer to deviate from its original position (with respect to thepowder bed floor). The vertical position of a layer is relatively secure within the bulk region of apart, because the particles above and below it are bound in place. However, a delicate or weakly-supported feature may suffer a change in position if the powder beneath it compresses whenloaded from above. Figure 2 shows an example in which the vertical spacing between tworegions of a part may be inaccurate because the powder beneath each of them compresses bydifferent amounts.
Figure 2. Example of the Significance of Powder Layer Position Accuracy
V B
A h
iA
224
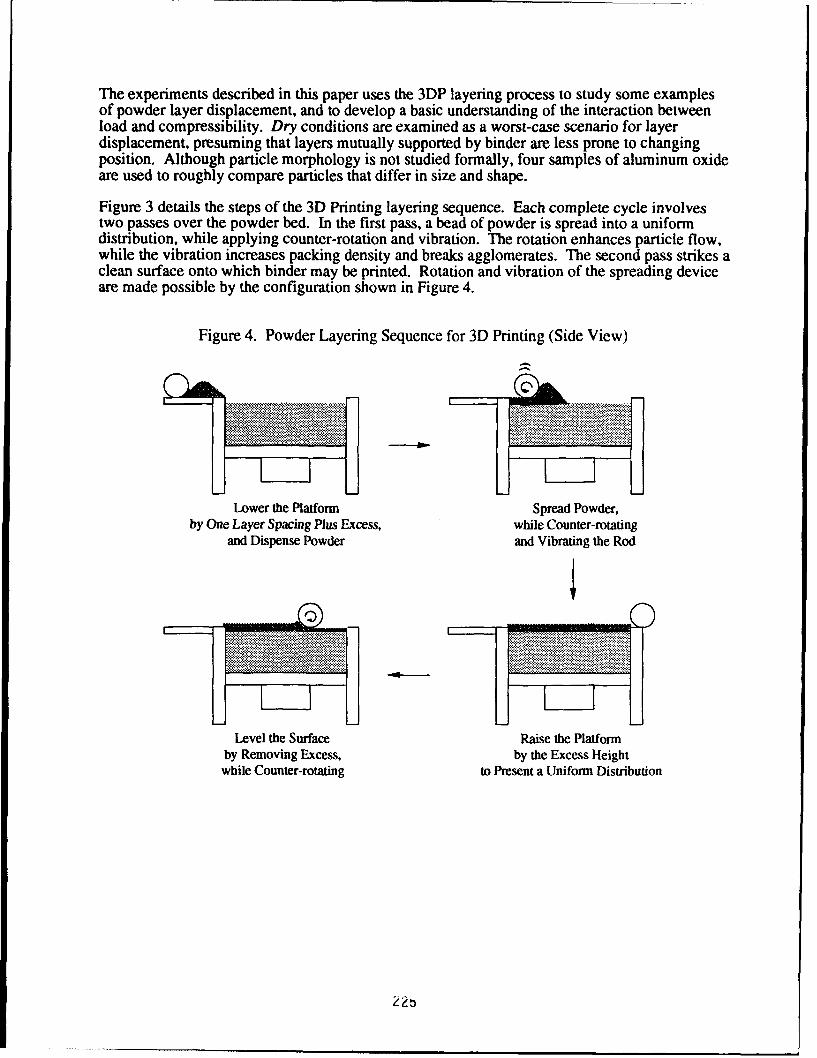
The experiments described in this paper uses the 3DP layering process to study some examplesof powder layer displacement, and to develop a basic understanding of the interaction betweenload and compressibility. Dry conditions are examined as a worst-case scenario for layerdisplacement, presuming that layers mutually supported by binder are less prone to changingposition. Although particle morphology is not studied formally, four samples of aluminum oxideare used to roughly compare particles that differ in size and shape.
Figure 3 details the steps of the 3D Printing layering sequence. Each complete cycle involvestwo passes over the powder bed. In the first pass, a bead of powder is spread into a uniformdistribution, while applying counter-rotation and vibration. The rotation enhances particle flow,while the vibration increases packing density and breaks agglomerates. The second pass strikes aclean surface onto which binder may be printed. Rotation and vibration of the spreading deviceare made possible by the configuration shown in Figure 4.
Figure 4. Powder Layering Sequence for 3D Printing (Side View)
Lower the Platform Spread Powder,by One Layer Spacing Plus Excess, while Counter-rotating
and Dispense Powder and Vibrating the Rod
Level the Surface Raise the Platformby Removing Excess, by the Excess Heightwhile Counter-rotating to Present a Uniform Distribution
2 2!
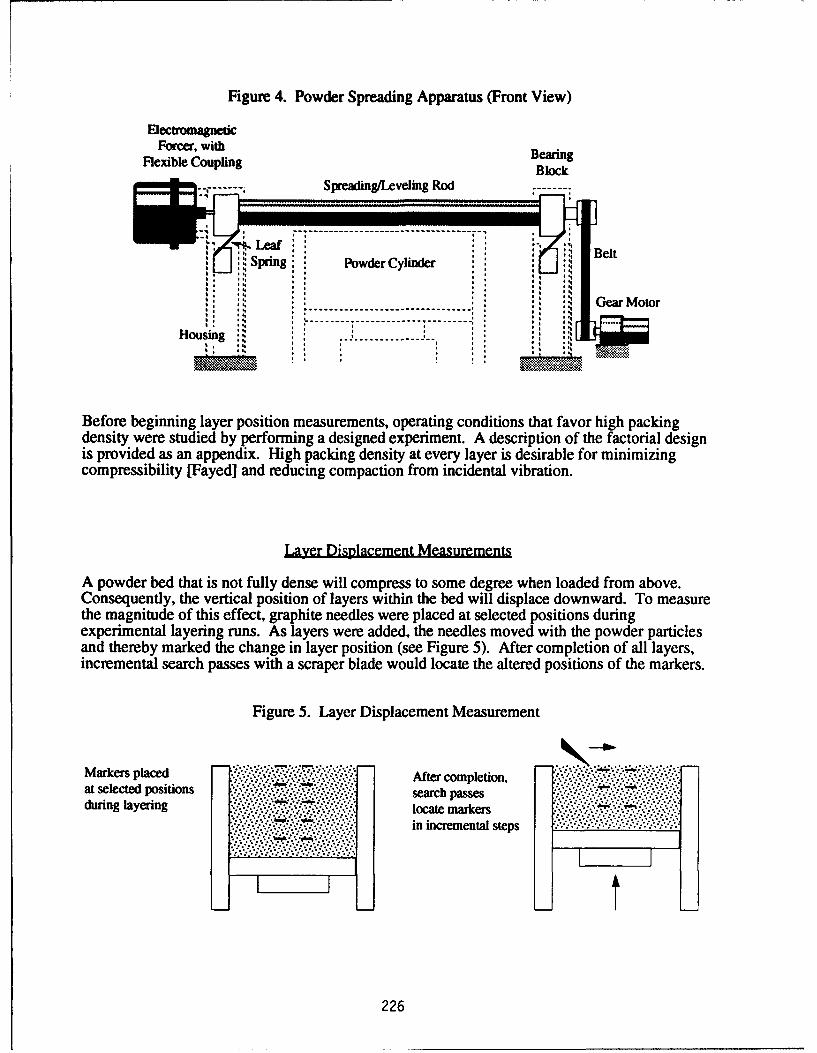
Figure 4. Powder Spreading Apparatus (Front View)
ElectromagneticForcer, with Bearing
Flexible Coupling Block
-------- Spreading(Leveling Rod ----
., ., elt
*, * '
, :• * Gear Motor
H o u s in g' : -- ---. . . . . .- - .-;I. ** , **;e
.t*q ft
Before beginning layer position measurements, operating conditions that favor high packingdensity were studied by performing a designed experiment. A description of the factorial designis provided as an appendix. High packing density at every layer is desirable for minimizingcompressibility [Fayed] and reducing compaction from incidental vibration.
Layer Displacement Measurements
A powder bed that is not fully dense will compress to some degree when loaded from above.Consequently, the vertical position of layers within the bed will displace downward. To measurethe magnitude of this effect, graphite needles were placed at selected positions duringexperimental layering runs. As layers were added, the needles moved with the powder particlesand thereby marked the change in layer position (see Figure 5). After completion of all layers,incremental search passes with a scraper blade would locate the altered positions of the markers.
Figure 5. Layer Displacement Measurement
M arkers placed":"'':''":-" ':'' -- " "' •" .... "..."• """'""" ""''" ' "'" """:A fter com ple tion, •at selected positions •'serhpss
during layering locate marin incremental steps
226
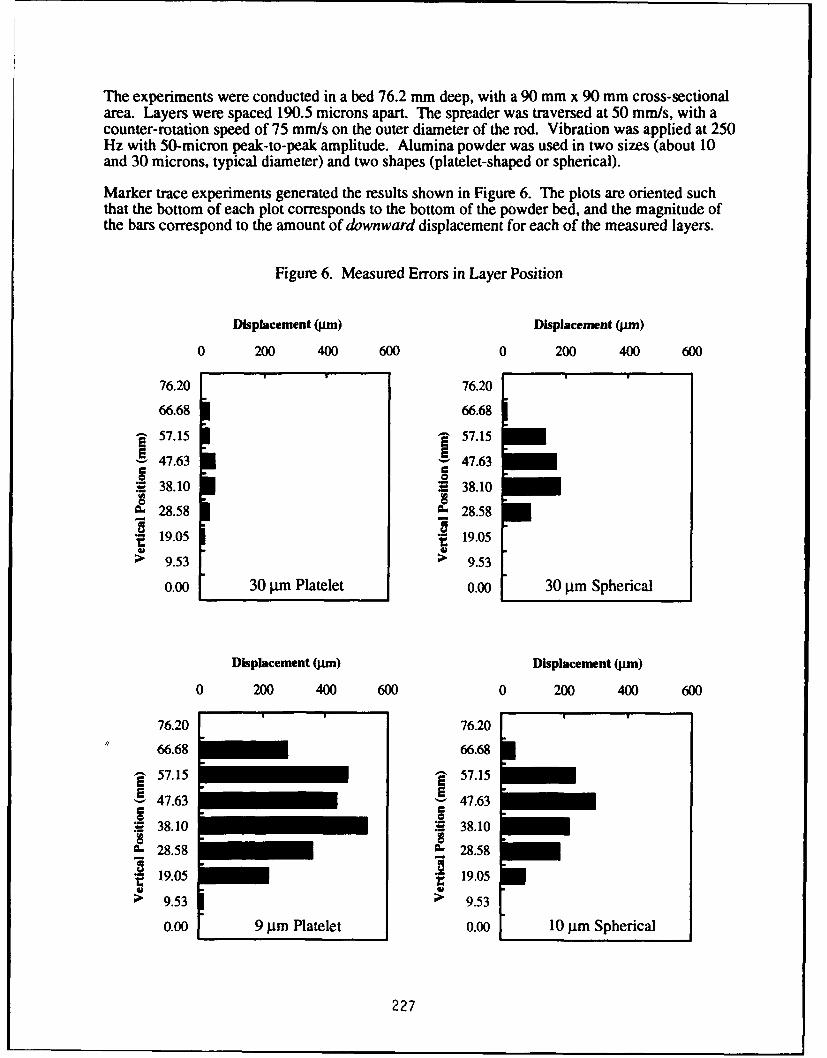
The experiments were conducted in a bed 76.2 mm deep, with a 90 mm x 90 mm cross-sectionalarea. Layers were spaced 190.5 microns apart. The spreader was traversed at 50 mrm/s, with acounter-rotation speed of 75 mm/s on the outer diameter of the rod. Vibration was applied at 250Hz with 50-micron peak-to-peak amplitude. Alumina powder was used in two sizes (about 10and 30 microns, typical diameter) and two shapes (platelet-shaped or spherical).
Marker trace experiments generated the results shown in Figure 6. The plots are oriented suchthat the bottom of each plot corresponds to the bottom of the powder bed, and the magnitude ofthe bars correspond to the amount of downward displacement for each of the measured layers.
Figure 6. Measured Errors in Layer Position
Displacement (pim) Displacement (jm)
0 200 400 600 0 200 400 600
76.20 76.20
66.68 66.68
57.15 57.15
47.63 47.63-- 38.10 38.10
S28.58 28.5819.05 t 19.05
> 9.53 > 9.53
0.00 30 gm Platelet 0.00 30 gmin Spherical
Displacement (prm) Displacement (pim)
0 200 400 600 0 200 400 600
76.20 76.20
66.68 66.68
57.15 q 57.15
47.63 47.63
S38.10 38.10S28.58 28.58
19.05 t~ 19.05
> 9.53 " 9.53
0.00 9 pm Platelet 0.00 10 gm Spherical
227
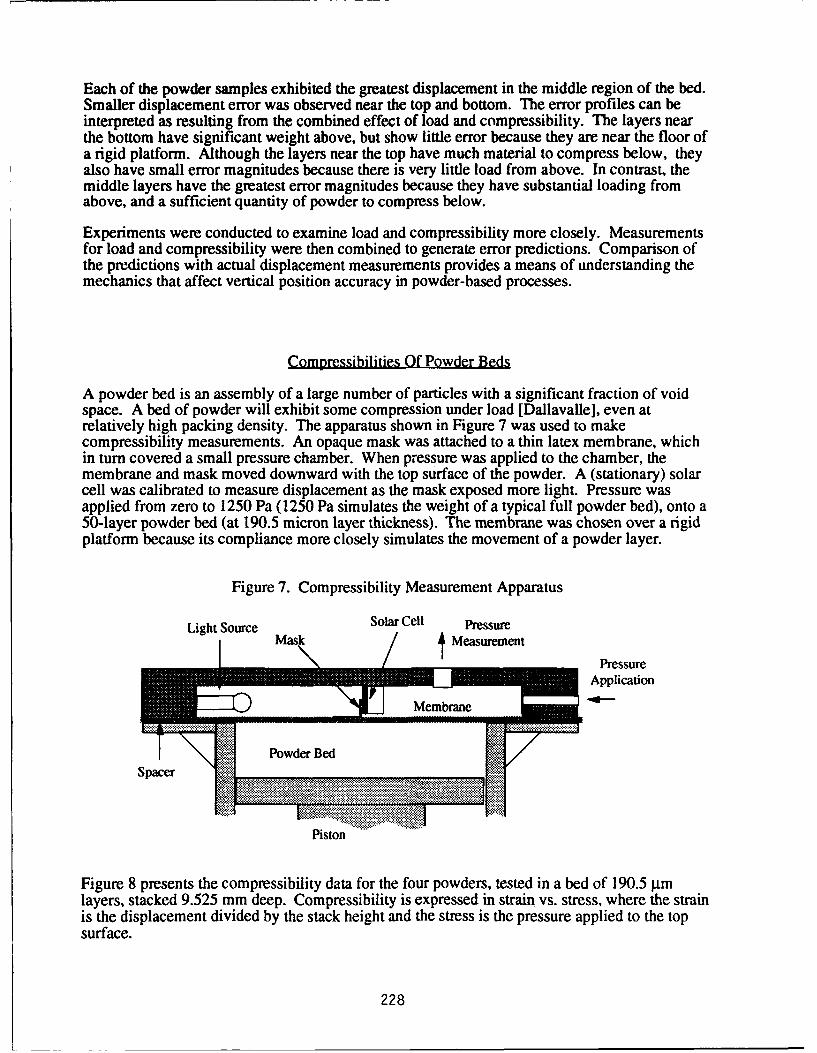
Each of the powder samples exhibited the greatest displacement in the middle region of the bed.Smaller displacement error was observed near the top and bottom. The error profiles can beinterpreted as resulting from the combined effect of load and cnmpressibility. The layers nearthe bottom have significant weight above, but show little error because they are near the floor ofa rigid platform. Although the layers near the top have much material to compress below, theyalso have small error magnitudes because there is very little load from above. In contrast, themiddle layers have the greatest error magnitudes because they have substantial loading fromabove, and a sufficient quantity of powder to compress below.
Experiments were conducted to examine load and compressibility more closely. Measurementsfor load and compressibility were then combined to generate error predictions. Comparison ofthe predictions with actual displacement measurements provides a means of understanding themechanics that affect vertical position accuracy in powder-based processes.
Compressibilities Of Powder Beds
A powder bed is an assembly of a large number of particles with a significant fraction of voidspace. A bed of powder will exhibit some compression under load [Dallavalle], even atrelatively high packing density. The apparatus shown in Figure 7 was used to makecompressibility measurements. An opaque mask was attached to a thin latex membrane, whichin turn covered a small pressure chamber. When pressure was applied to the chamber, themembrane and mask moved downward with the top surface of the powder. A (stationary) solarcell was calibrated to measure displacement as the mask exposed more light. Pressure wasapplied from zero to 1250 Pa (1250 Pa simulates the weight of a typical full powder bed), onto a50-layer powder bed (at 190.5 micron layer thickness). The membrane was chosen over a rigidplatform because its compliance more closely simulates the movement of a powder layer.
Figure 7. Compressibility Measurement Apparatus
Light Source Solar Cell PressureMas~k Measurement
PressureApplication
Membrane
"Powder BedSpacer
Piston
Figure 8 presents the compressibility data for the four powders, tested in a bed of 190.5 p.mlayers, stacked 9.525 mm deep. Compressibility is expressed in strain vs. stress, where the strainis the displacement divided by the stack height and the stress is the pressure applied to the topsurface.
228
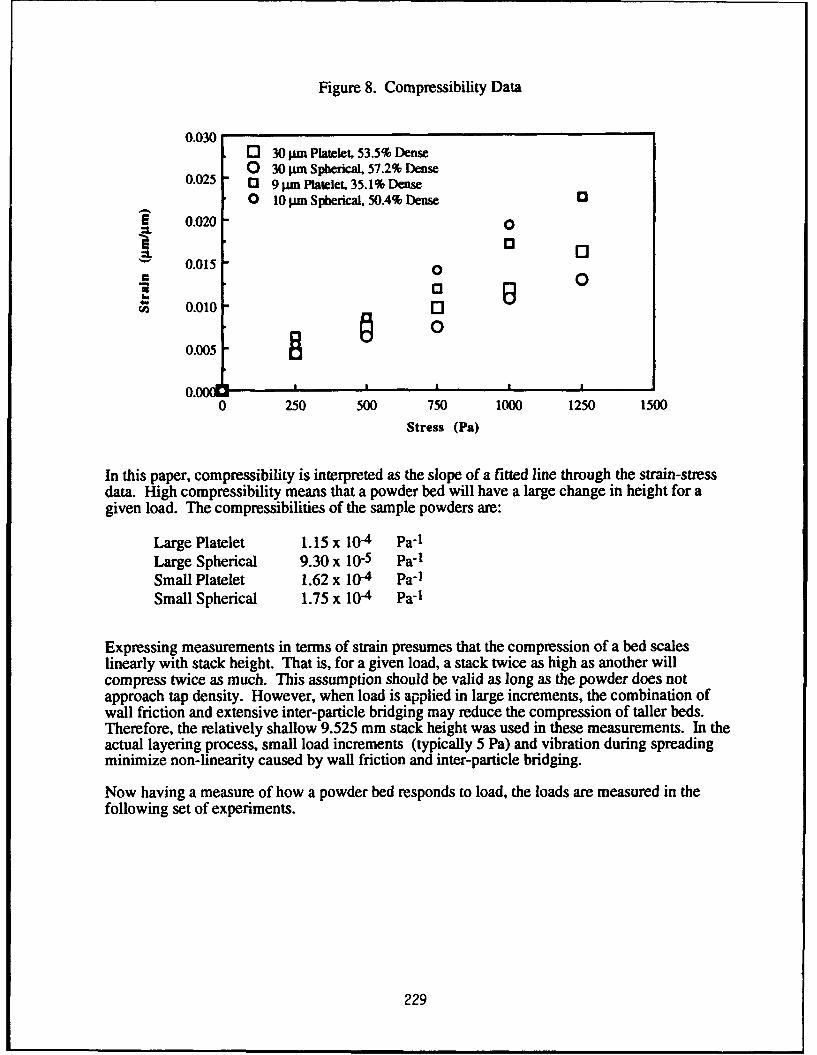
Figure 8. Compressibility Data
0.030o 30 jim Platelet, 53.5% Dense0 30 pAm Spherical, 57.2% Dense
0.025 0! 9 pm Platelet, 35.1% Denseo 10 pm Spherical, 50.4% Dense 0
S0.020 O=Lo"0.015 0
S0.010 03
0.0050
0.000 250 500 750 1000 1250 1500
Stress (Pa)
In this paper, compressibility is interpreted as the slope of a fitted line through the strain-stressdata. High compressibility means that a powder bed will have a large change in height for agiven load. The compressibilities of the sample powders are:
Large Platelet 1.15 x 10⁻⁴ Pa-1
Large Spherical 9.30 x 10⁻⁵ Pa-1
Small Platelet 1.62 x 10⁴ Pa-1
Small Spherical 1.75 x 10⁻⁴ Pa-1
Expressing measurements in terms of strain presumes that the compression of a bed scaleslinearly with stack height. That is, for a given load, a stack twice as high as another willcompress twice as much. This assumption should be valid as long as the powder does notapproach tap density. However, when load is applied in large increments, the combination ofwall friction and extensive inter-particle bridging may reduce the compression of taller beds.Therefore, the relatively shallow 9.525 mm stack height was used in these measurements. In theactual layering process, small load increments (typically 5 Pa) and vibration during spreadingminimize non-linearity caused by wall friction and inter-particle bridging.
Now having a measure of how a powder bed responds to load, the loads are measured in thefollowing set of experiments.
229
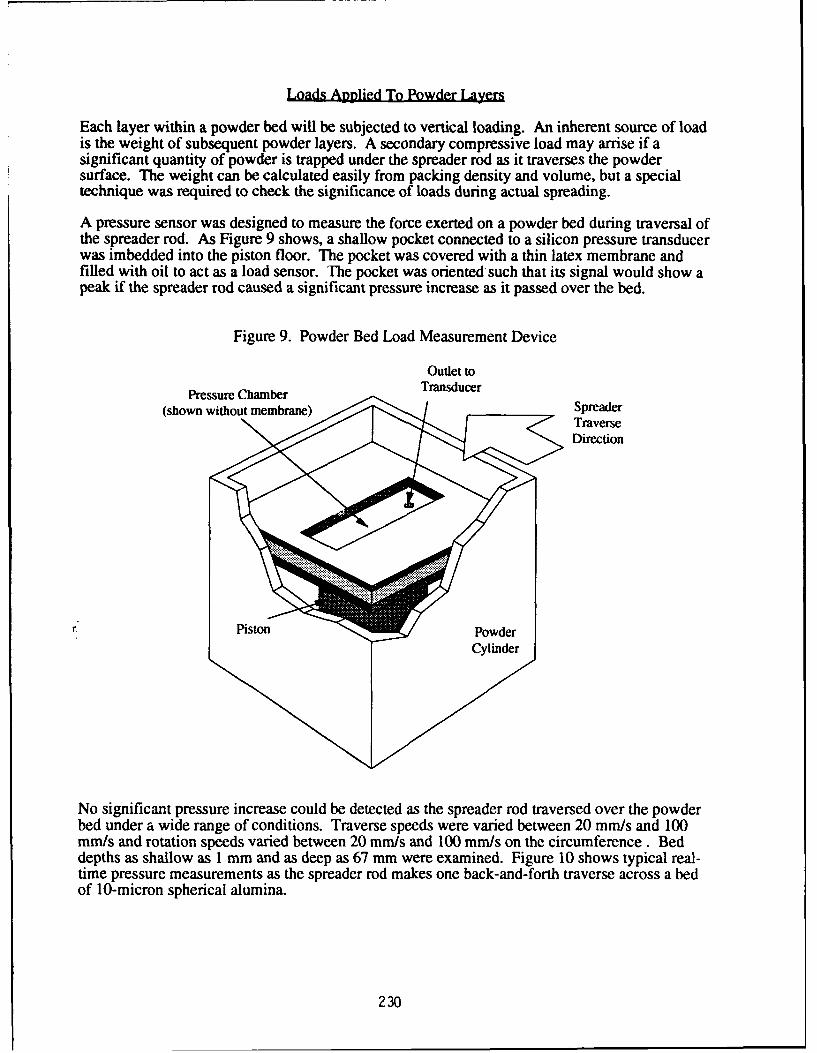
Loads Applied To Powder Layers
Each layer within a powder bed will be subjected to vertical loading. An inherent source of loadis the weight of subsequent powder layers. A secondary compressive load may arrise if asignificant quantity of powder is trapped under the spreader rod as it traverses the powdersurface. The weight can be calculated easily from packing density and volume, but a specialtechnique was required to check the significance of loads during actual spreading.
A pressure sensor was designed to measure the force exerted on a powder bed during traversal ofthe spreader rod. As Figure 9 shows, a shallow pocket connected to a silicon pressure transducerwas imbedded into the piston floor. The pocket was covered with a thin latex membrane andfilled with oil to act as a load sensor. The pocket was oriented such that its signal would show apeak if the spreader rod caused a significant pressure increase as it passed over the bed.
Figure 9. Powder Bed Load Measurement Device
Outlet to
Pressure Chamber Transducer(shown without membrane) Spreader
TraverseDirection
rPi s to Powder
No significant pressure increase could be detected as the spreader rod traversed over the powderbed under a wide range of conditions. Traverse speeds were varied between 20 mm/s and 100mm/s and rotation speeds varied between 20 mm/s and 100 mm/s on the circumference. Beddepths as shallow as 1 mm and as deep as 67 mm were examined. Figure 10 shows typical real-time pressure measurements as the spreader rod makes one back-and-forth traverse across a bedof 10-micron spherical alumina.
230
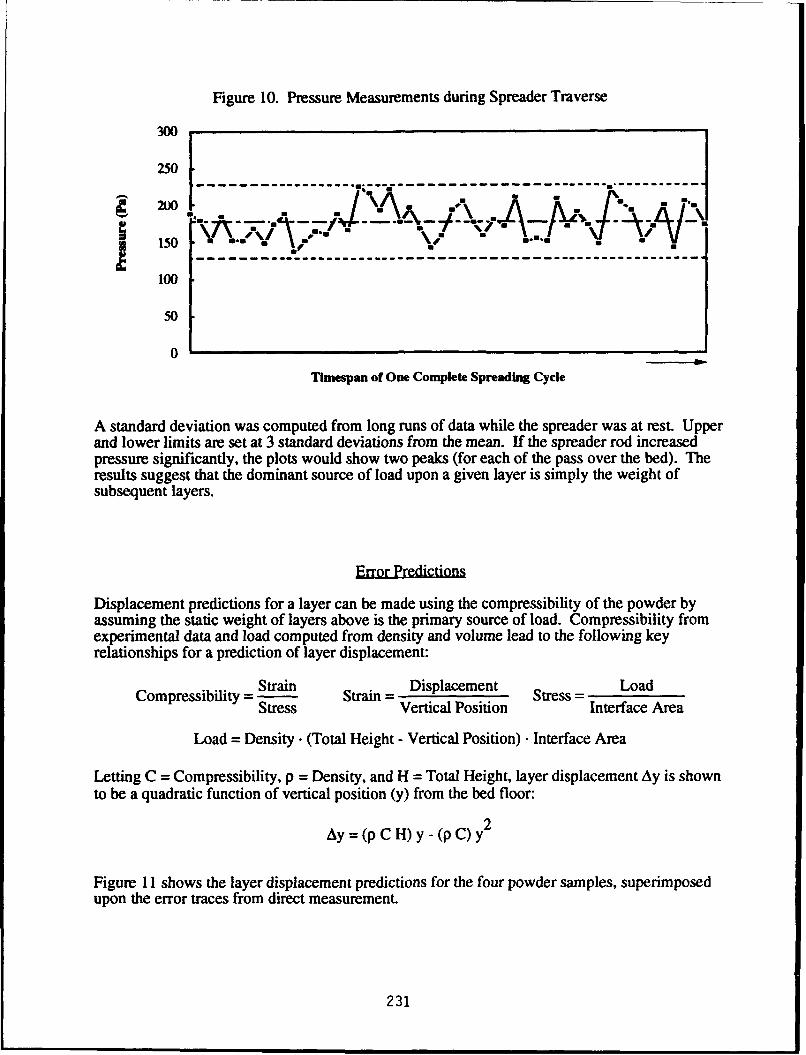
Figure 10. Pressure Measurements during Spreader Traverse
300
250
100 /\ . .. ^ ^..
L.. -. rI "\' I\ •,' / / -/
50
Timespan of One Complete Spreading Cycle
A standard deviation was computed from long runs of data while the spreader was at rest. Upperand lower limits are set at 3 standard deviations from the mean. If the spreader rod increasedpressure significantly, the plots would show two peaks (for each of the pass over the bed). Theresults suggest that the dominant source of load upon a given layer is simply the weight ofsubsequent layers.
Error Predictions
Displacement predictions for a layer can be made using the compressibility of the powder by
assuming the static weight of layers above is the primary source of load. Compressibility fromexperimental data and load computed from density and volume lead to the following keyrelationships for a prediction of layer displacement:
Compressibility = Strain Strain = Displacement Stress Load
Stress Vertical Position Interface Area
Load = Density a (Total Height - Vertical Position)a . Interface Area
Letting C = Compressibility, p = Density, and H = Total Height, layer displacement Ay is shownto be a quadratic function of vertical position (y) from the bed floor:
Ay = (p C H) y - (p Q) y 2
Figure D1 shows the layer displacement predictions for the four powder samples, superimposedupon the error traces from direct measurement.
231
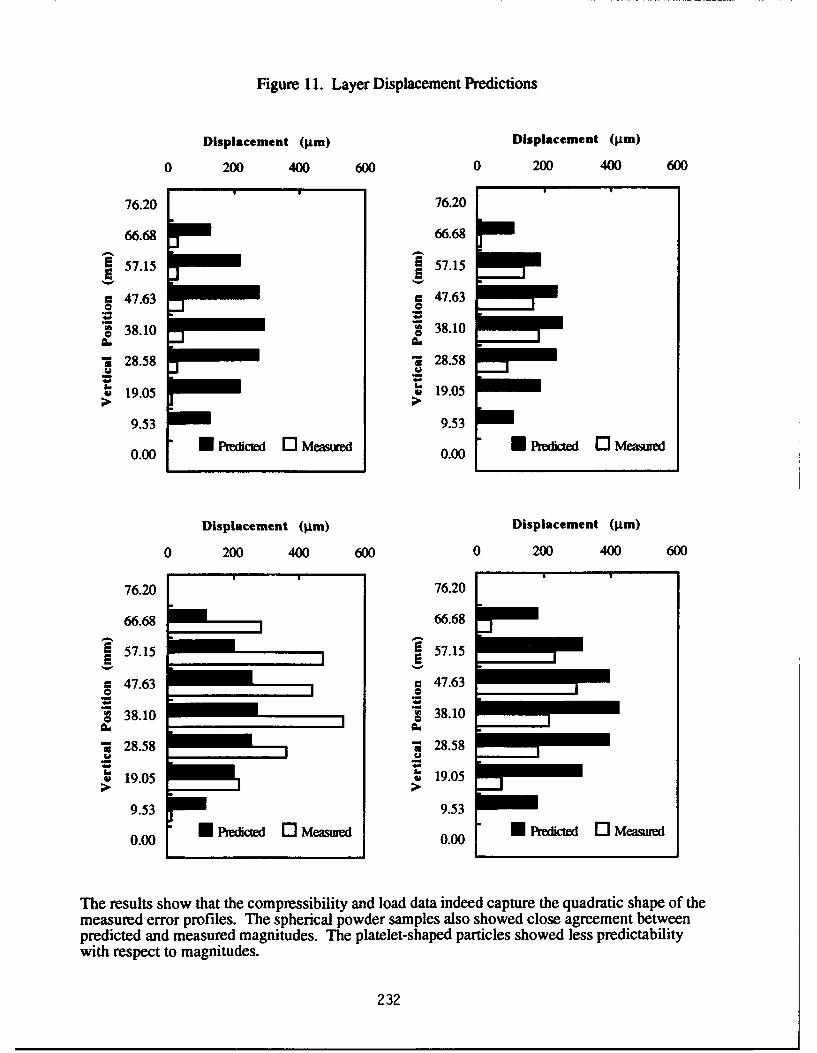
Figure 11. Layer Displacement Predictions
Displacement (jpm) Displacement (jim)
0 200 400 600 0 200 400 600SI •
76.20 76.20
66.68 66.68
E 57.15 57.15
q 47.63 c 47.63
m 38.10 m 38.10
"-j 28.58 1 28.58
S19.05 . 19.05
9.53 9.53
0.00 0 edicted 0 Mesured 0.00 Prdcte Measred
Displacement (gim) Displacement (pim)
0 200 400 600 0 200 400 600
76.20 76.20
66.68 66.68
S57.15 5 .15
c 47.63 - 47.63
"• 38.10 38.10
128.58 *;28.58
• 19.05 • 19.05
9.53 9.53
0.00 Meaud 0.00 U Redcte 0 Measure
The results show that the compressibility and load data indeed capture the quadratic shape of themeasured error profiles. The spherical powder samples also showed close agreement betweenpredicted and measured magnitudes. The platelet-shaped particles showed less predictabilitywith respect to magnitudes.
232
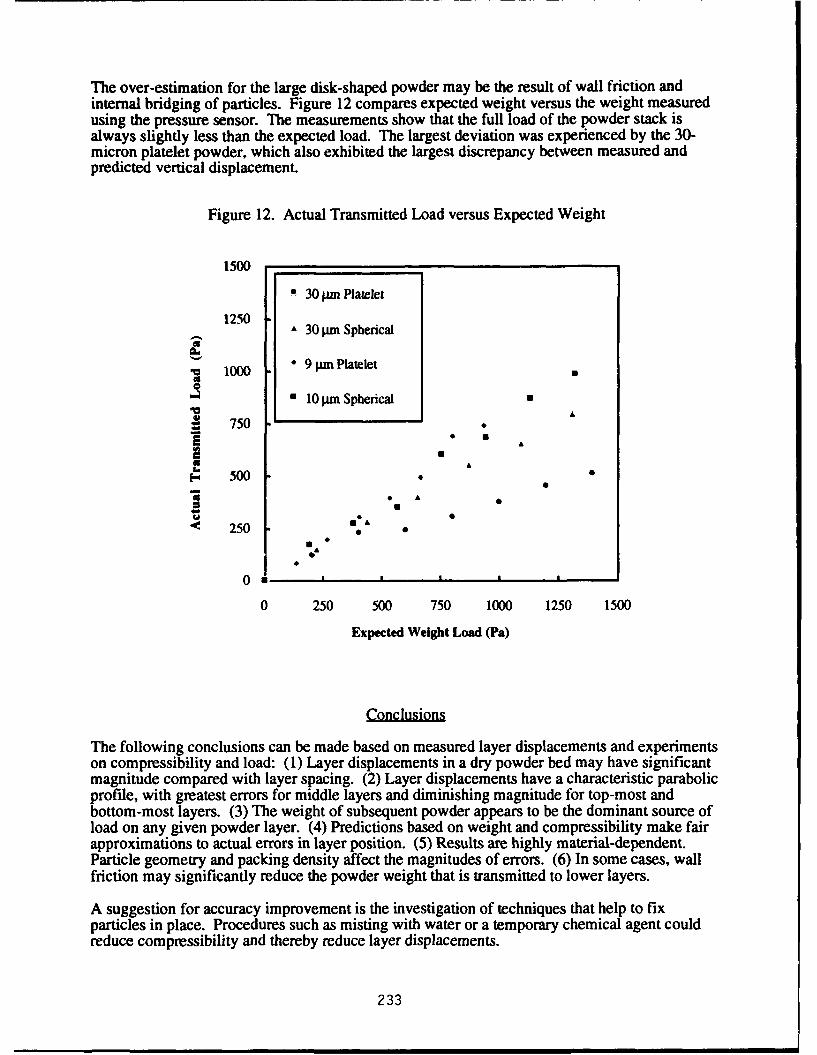
The over-estimation for the large disk-shaped powder may be the result of wall friction andinternal bridging of particles. Figure 12 compares expected weight versus the weight measuredusing the pressure sensor. The measurements show that the full load of the powder stack isalways slightly less than the expected load. The largest deviation was experienced by the 30-micron platelet powder, which also exhibited the largest discrepancy between measured andpredicted vertical displacement.
Figure 12. Actual Transmitted Load versus Expected Weight
1500 ,,
"- 30 pm Platelet
125030 pm Spherical
"00 * 9 9pm Platelet
"10 pm Spherical
S 750S- .
E.. 500S0 A
"• 250
000u p
0 250 500 750 1000 1250 1500
Expected Weight Load (Pa)
Conclusions
The following conclusions can be made based on measured layer displacements and experimentson compressibility and load: (1) Layer displacements in a dry powder bed may have significantmagnitude compared with layer spacing. (2) Layer displacements have a characteristic parabolicprofile, with greatest errors for middle layers and diminishing magnitude for top-most andbottom-most layers. (3) The weight of subsequent powder appears to be the dominant source ofload on any given powder layer. (4) Predictions based on weight and compressibility make fairapproximations to actual errors in layer position. (5) Results are highly material-dependent.Particle geometry and packing density affect the magnitudes of errors. (6) In some cases, wallfriction may significantly reduce the powder weight that is transmitted to lower layers.
A suggestion for accuracy improvement is the investigation of techniques that help to fixparticles in place. Procedures such as misting with water or a temporary chemical agent couldreduce compressibility and thereby reduce layer displacements.
233
,Acknowledgement
NSF Strategic Manufacturing InitiativeMIT Leaders for ManufacturingARPAThree Dimensional Printing Consortium
3MAMPAshland ChemicalBoeingE-SystemsHasbroHowmetJohnson & JohnsonNational Center for Manufacturing SciencesProcter & GambleSandia National LabsUnited Technologies
References
Brown, R. L. & Richards, J. C., Principles of Powder Mechanics, Pergamon Press, Oxford, 1970.
Dallavalle, J. M., Micrometrics: The Technology of Fine Particles, 2nd ed., Pitman PublishingCorporation, New York, 1948.
Deckard, C. & Beaman, J., "Recent Advances in Selective Laser Sintering," FourteenthConference on Production Research and Technology, University of Michigan, Oct. 1987, pp.447-452.
Fayed, M. E. & Otten, L., eds., Handbook of Powder Science and Technology, Van Nostr.ndReinhold Company, New York, 1984.
Iinoya, K., Gotoh, K., Higashitani, K., eds., Powder Technology Handbook, Marcel Decker, Inc.,New York, 1991.
Sachs, E., Cima, M., Williams, P., Brancazio, D, and Cornie, J., "Three Dimensional Printing:Rapid Tooling and Prototypes Directly From a CAD Model," accepted for publication in theJournal of Engineering for Industry, 1990, p. 13.
Wohlers, T., "Creating Parts by Layers", Cadence, April 1989, pp. 73-76.
234
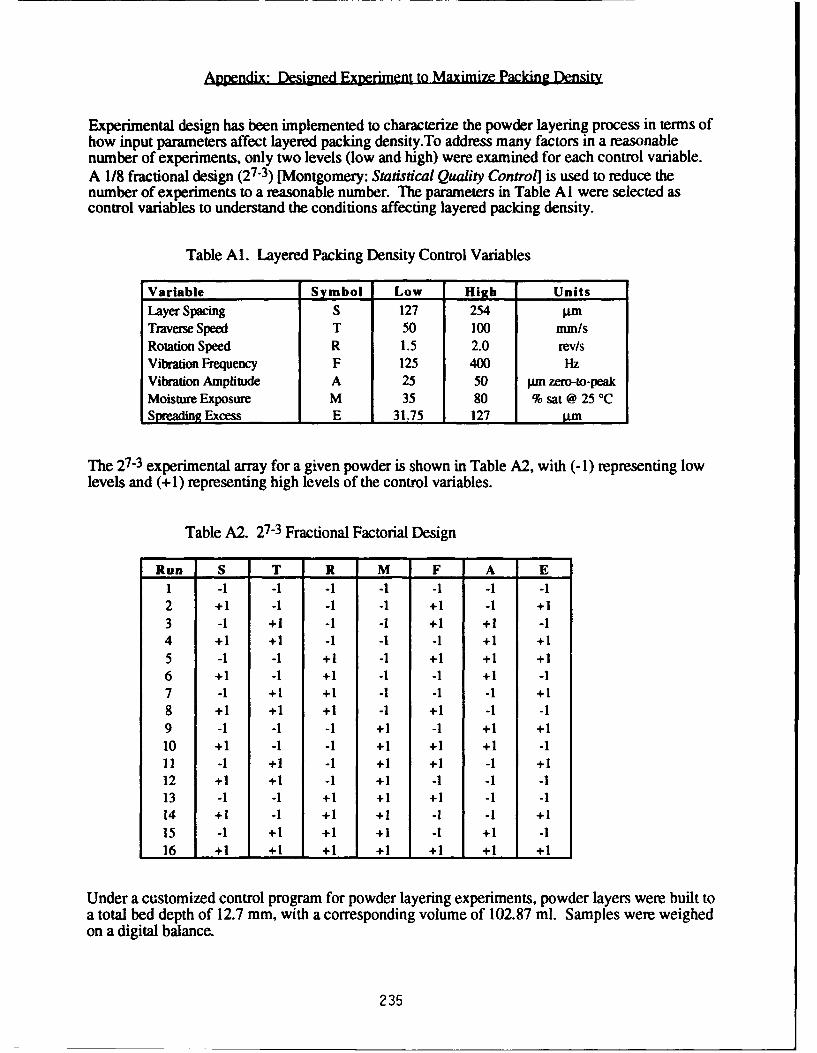
Appendix: Designed Experiment to Maximize Packing Density
Experimental design has been implemented to characterize the powder layering process in terms ofhow input parameters affect layered packing density.To address many factors in a reasonablenumber of experiments, only two levels (low and high) were examined for each control variable.A 1/8 fractional design (27-3) [Montgomery: Statistical Quality Control] is used to reduce thenumber of experiments to a reasonable number. The parameters in Table AI were selected ascontrol variables to understand the conditions affecting layered packing density.
Table Al. Layered Packing Density Control Variables
Variable Symbol Low High Units
Layer Spacing S 127 254 AmTraverse Speed T 50 100 mm/sRotation Speed R 1.5 2.0 rev/sVibration Frequency F 125 400 HzVibration Amplitude A 25 50 in zero-to-peakMoisture Exposure M 35 80 % sat @ 25 OCSpreading Excess E 31.75 127 Am
The 27-3 experimental array for a given powder is shown in Table A2, with (-1) representing lowlevels and (+1) representing high levels of the control variables.
Table A2. 27-3 Fractional Factorial Design
Run S T R M F A E1 -1 -1 -1 -1 -1 -1 -12 +1 -1 -1 -1 +1 -1 +13 -1 +1 -1 -1 +1 +1 -14 +1 +1 -1 -1 -1 +1 +15 -1 -1 +1 -1 +1 +1 +16 +1 -1 +1 -1 -1 +1 -17 -1 +1 +1 -1 -1 -1 +18 +1 +1 +1 -1 +1 -1 -19 -1 -1 -1 +1 -1 +1 +110 +1 -1 -1 +1 +1 +1 -111 -1 +1 -1 +1 +1 -1 +112 +1 +1 -1 +1 -1 -1 -113 -1 -1 +1 +1 +1 -1 -114 +1 -1 +1 +1 -1 -1 +115 -1 +1 +1 +1 -1 +1 -116 +1 +1 +1 +1 +1 +1 +1
Under a customized control program for powder layering experiments, powder layers were built toa total bed depth of 12.7 mm, with a corresponding volume of 102.87 ml. Samples were weighedon a digital balance.
235
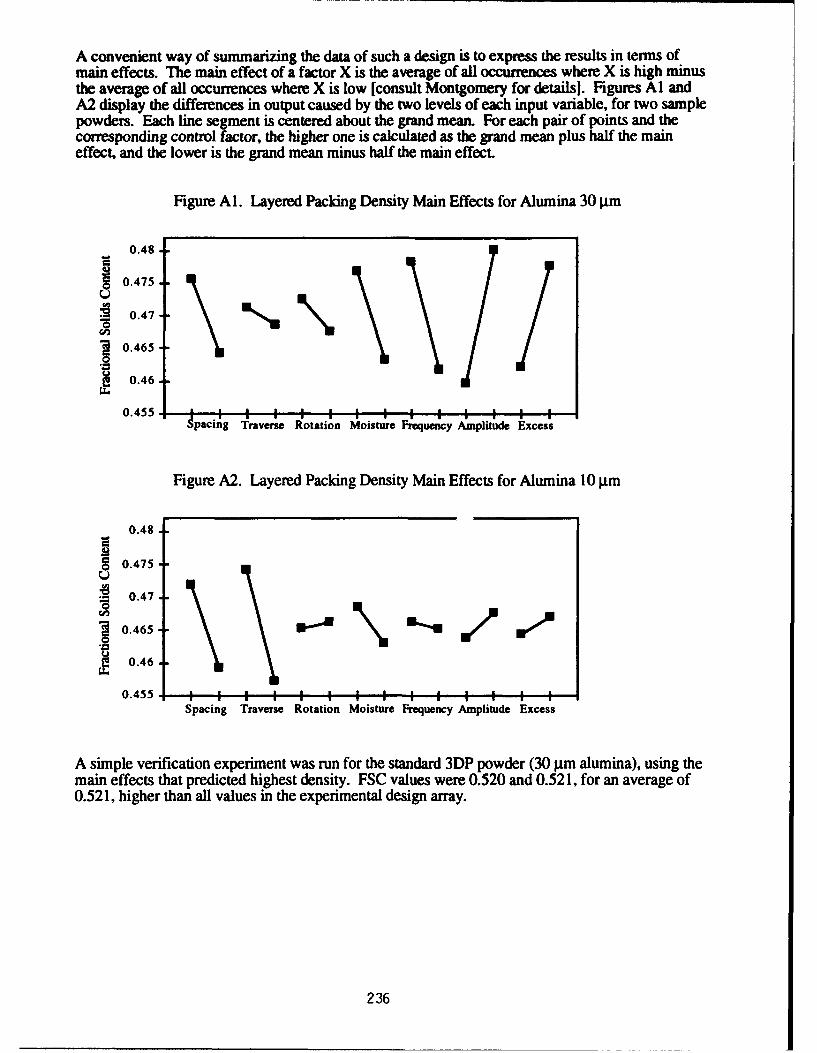
A convenient way of summarizing the data of such a design is to express the results in terms ofmain effects. The main effect of a factor X is the average of all occurrences where X is high minusthe average of all occurrences where X is low [consult Montgomery for details]. Figures Al andA2 display the differences in output caused by the two levels of each input variable, for two samplepowders. Each line segment is centered about the grand mean. For each pair of points and thecorresponding control factor, the higher one is calculated as the grand mean plus half the maineffect, and the lower is the grand mean minus half the main effect.
Figure Al. Layered Packing Density Main Effects for Alumina 30 tim
0.48
S0.475
0.47.
S0.465
0.46
0.455 ',Spacing Traverse Rotation Moisture Frequency Amplitude Excess
Figure A2. Layered Packing Density Main Effects for Alumina 10 gim
0.48
S0.475-
0.47
710.465-mU
0.455
Spacing Traverse Rotation Moisture Frequency Amplitude Excess
A simple verification experiment was run for the standard 3DP powder (30 pim alumina), using themain effects that predicted highest density. FSC values were 0.520 and 0.521, for an average of0.521, higher than all values in the experimental design array.
236
The Physics of Digital Microfabrication with Molten
Microdrops*
Fuquan Gao and Ain A. Sonin
Department of Mechanical EngineeringMassachusetts Institute of Technology
Cambridge, MA 02139
1. Introduction
Precise deposition of molten microdrops under controlled thermal conditionsprovides a means of 3D "digital microfabrication", microdrop by microdrop, undercomplete computer control, much in the same way as 2D hard copy is obtained by ink-jetprinting. This paper describes some results from a study of the basic modes of microdropdeposition and solidification (Gao & Sonin, 1993). The conditions required for controlleddeposition are discussed, and some experimental results and theoretical analyses are givenfor various basic deposition modes. These include columnar (i.e. drop-on-drop)deposition at low and high frequencies, sweep deposition of continuous beads on flatsurfaces, and repeated sweep deposition for buildup of larger objects or materials.
2. Experimental Conditions
We are concerned with systems in which individual molten droplets are dispensedon demand and delivered ballistically to a target location where they impact and solidify.To avoid drop breakup or splattering at impact, and thus set the stage for precise controlover the deposition process, we use conditions where capillarity forces dominate duringimpact. This requires that, roughly, We = pV 2a/a < 10, where We is the Weber numberbased on droplet density p, impact speed V, droplet radius a and surface tension a.
In our experiments individual droplets of molten wax with diameter 2a=50 p.m wereejected at controlled frequencies in the range 0-15 kHz from a heated, piezoelectricallydriven drop-on-demand generator (an adapted ink-jet print head) and directed to a targetlocated typically 3-5 mm away, where they impacted at a speed V of the order of 3 m/s.The ambient air and the target were maintained at a temperature below the melt'ssolidification point. In-flight cooling of the droplets was typically insignificant, and thedrops arrived at the target in superheated liquid form with essentially the temperature theyhad at the generator.
Two types of waxes were used in the experiments referred to in this paper. Onewas a candelilla wax with a solidification temperature of 700C, and the other amicrocrystalline petroleum wax (Reed 6882) with a solidification temperature of 9 1°C.
3. Deposition of Single Droplets; the Solidification Angle
Figure 1 shows the impact of a single melt droplet on a surface (in this caseplexiglas), recorded through a microscope objective with the aid of strobe lighting. Thedrop impacts with essentially its source temperature To. The impact occurs in this casewith We=10. The droplet touches the surface, wets it, showing some inertial distortion
* © F. Gao & A. A. Sonin, 1993. Correspondence should be addressed to Prof. Ain A. Sonin,
Room 3-256, MIT, Cambridge, MA 02139, USA. Tel: (617) 253 2247. Fax: (617) 258 8559.
237
about 20 pts after impact, but quickly assimes a spherical-cap shape under the action ofcapillarity forces, reaching what appears to be a state of mechanical equilibrium with finitecontact angle long before it solidifies. The entire spreading process takes only about 40 ptsin this case. The droplet's solidification time on plexiglas, on the other hand, can beestimated (Gao & Sonin, 1993; Hill & Kucera, 1983) as about 20 ms, three orders ofmagnitude longer than the spreading time.
The contact angle which the drop assumes before solidifying is not an equilibriumproperty. The drop spreading occurs under thermally nonequilibrium conditions, with thebulk of the liquid superheated and the target surface subcooled. Nevertheless, we haveobserved that under conditions where the drop spreading on the target is completed in atime much shorter than the solidification time, as in Fig. 1, the molten drop appears topossess an apparent (nonequilibrium) contact angle which is, at least approximately, aproperty of the melt material, the target material and the characteristic temperaturesinvolved, but independent of the spreading process. A melt droplet stops spreading whenit reaches this "melt contact angle", having apparently attained a mechanical but not thermalequilibrium, and then freezes on a much longer time scale while maintaining this angle.The solidification angle is in such cases equal to the (nonequilibrium) melt contact angle,and thus, like that angle, appears to be a property of the melt material, the target materialand the characteristic temperatures, but independent of the spreading process (Gao &Sonin, 1993). Our studies with waxes have shown that for the case where the target is thesame material as the melt, the solidification angle depends iargely on the target temperatureand tends to increase as the target's subcooling is increased.
4. Columnar Deposition
The letters "MIT" in Fig. 2 are about 300 pm tall and stand upright on a plasticsurface. They are fabricated by precise deposition of molten microdrops from above, at afrequency low enough for each droplet to solidify by heat transfer to the ambientatmosphere before the next one arrives.
Figure 3 shows the effect of frequency on the solid structures formed by columnardeposition. Here, 25 consecutive droplets have been depositied on top of each other atvarious frequencies ranging from 0 to 10 kHz. At sufficiently low frequencies - belowabout 10 Hz in this case - a distinct dropwise solidification takes place where identical,vertical pillars of solidified droplets are formed independent of frequency, much like in Fig.2. A transition away from dropwise solidification occurs as the frequency increases to thepoint where there is insufficient time for the previous droplet to completely solidify andcool down to ambient temperature before the next one arrives. As a result the next droplethits a "target" with higher than ambient temperature, the solidification angle between thearriving droplet and the previous droplet is reduced, and the 25-drop pillar becomes shorterand stouter. The effect increases as the frequency rises, until successive droplets begin tomelt together.
At frequencies greater than about 50 Hz, there is insufficient time for solidificationbefore the next drop arrives. The impinging droplets coalesce into a hemispherical liquidcap, and solidif>'ation takes place below the shoulder of the cap. If the deposition iscontinued instead of being curtailed after 25 drops, there results a continuous growth modewhere the liquid tip moves upward as the new drops arrive, leaving behind a solid rod withdiameter larger than the individual droplets (Fig. 4). At still higher frequencies - above200 Hz, say, in Fig. 3 - the whole burst of 25 droplets coalesces into a spherical dropwhich solidifies only after the salvo stops. The droplet delivery rate affects the base radiusof the large drop, the base radius increasing (solidification angle decreasing) as the liquiddelivery rate increases. This can be attributed to the fact that the delivery time of the 25-droplet liquid volume is in this case longer than the solidification time, and the contact linefreezes and becomes arrested on its way cutward before it can attain the apparent
238
mechanical equilibrium displayed in Fig. 1. Note that all the large drops formed by highfrequency deposition would in fact grow into solid rods as in Fig. 4 if droplet depositionwere continued.
S. Low Frequency Dropwise Deposition
Three parameters characterize a "vertical" pillar produced in the low-frequencyregime: (i) the radius r measured at the maximum point (Fig.5), (ii) the length h which isadded to the pillar by each deposited drop, and (iii) the maximum frequency at which thedeposition is frequency-independent.
Mass conservation and the fact that the drop's radius of curvature is constant (theBond number is small at the microscale) allow the first two of these quantities to be derivedstraightforwardly in terms of the incoming drop radius, a, and the solidification angle 0 ofthe droplet after impact on subcooled solid material of its own kind (Gao & Sonin, 1993).This reduces the problem of the geometry of dropwise columnar solidification to that ofestablishing the solidification angle 0 of the droplets: the smaller the contact angle, theshorter and stouter the column. The solidification angle will depend on the properties ofthe melt material and the temperatures of the incoming droplet and the previously solidifiedmaterial on which it lands.
The maximum frequency fmax at which dropwise deposition is independent offrequency can be estimated from the time required for the tip of the pillar to cool back toambient temperature after a drop is deposited. The derivation is lengthy, in part because thepillar acts as a heat transfer fin (Gao & Sonin, 1993), and we will not give it here, but forthe data of Fig. 3 one obtains fmax= 12 Hz, in good agreement with the observations.
The free-standing letters in Fig. 1 were created in the dropwise solidification mode.Note that even a "horizontal" member can easily be made with this technique by depositionfrom "above", since capillarity forces dominate over inertial forces at impact. The"horizontal" center-to-center separation between two consecutive droplets simply has to beadjusted so that the next drop will touch the last solidified one, grab onto it by capillarityand spread partly over it, and solidify. By adjusting the ratio of the horizontal center-to-center drop spacing, w, to the incoming droplet radius, a, one can give a pillar of dropletsany slope j0 between 00 and 900 (Fig. 5). The precise relationship between w/a and 13depends on the apparent contact angle (and possibly also somewhat on the Weber numberat impact, if that number is not sufficiently small). If inertial effects are insignificantcompared with capillarity forces (i.e. the Weber number pV2a/A is not too large) one wouldexpect that
w(f3)h - cosP (1)
where h is the height added to a vertical pillar by each drop and can be calculated easily interms of a and 0 . Equation (1) is in good accord with our observations (Fig. 6).
6. High Frequency Columnar Deposition: the ContinuousSolidification Mode
A gradual transition away from dropwise solidification occurs in Fig. 3 as thefrequency increases from about 10 Hz to 50 Hz. At sufficiently high frequencies there isinsufficient time between droplets for any solidification. The first of the arriving dropletscoalesce on the target surface into a larger, spherical-cap liquid drop (surface tensiondominates at this scale) which spreads as more liquid arrives, maintaining at first aspherical cap shape. As this coalesced drop grows, however, its contact line advance rateover the cool target surface slows and eventually becomes so slow that solidification sets in
239
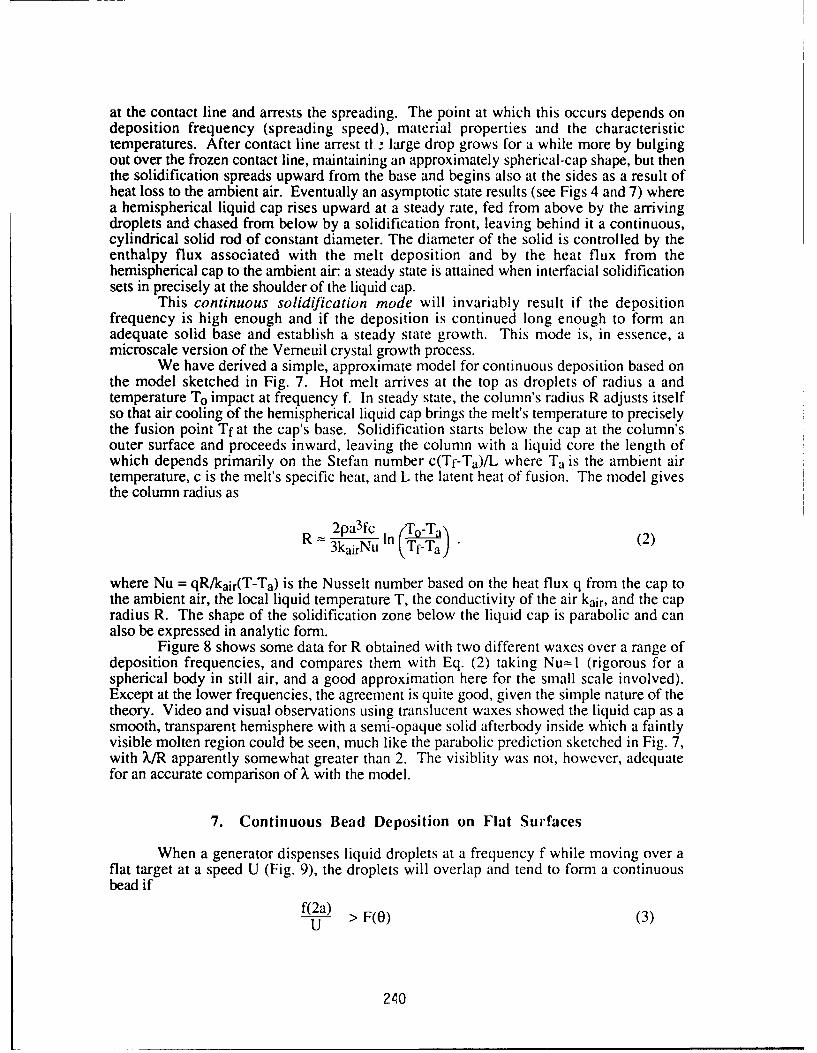
at the contact line and arrests the spreading. The point at which this occurs depends ondeposition frequency (spreading speed), material properties and the characteristictemperatures. After contact line arrest tt - large drop grows for a while more by bulgingout over the frozen contact line, maintaining an approximately spherical-cap shape, but thenthe solidification spreads upward from the base and begins also at the sides as a result ofheat loss to the ambient air. Eventually an asymptotic state results (see Figs 4 and 7) wherea hemispherical liquid cap rises upward at a steady rate, fed from above by the arrivingdroplets and chased from below by a solidification front, leaving behind it a continuous,cylindrical solid rod of constant diameter. The diameter of the solid is controlled by theenthalpy flux associated with the melt deposition and by the heat flux from thehemispherical cap to the ambient air: a steady state is attained when interfacial solidificationsets in precisely at the shoulder of the liquid cap.
This continuous solidification mode will invariably result if the depositionfrequency is high enough and if the deposition is continued long enough to form anadequate solid base and establish a steady state growth. This mode is, in essence, amicroscale version of the Vemeuil crystal growth process.
We have derived a simple, approximate model for continuous deposition based onthe model sketched in Fig. 7. Hot melt arrives at the top as droplets of radius a andtemperature To impact at frequency f. In steady state, the column's radius R adjusts itselfso that air cooling of the hemispherical liquid cap brings the melt's temperature to preciselythe fusion point Tf at the cap's base. Solidification starts below the cap at the column'souter surface and proceeds inward, leaving the column with a liquid core the length ofwhich depends primarily on the Stefan number c(Tf-Ta)/L where Ta is the ambient airtemperature, c is the melt's specific heat, and L the latent heat of fusion. The model givesthe column radius as
2pa3fc nE-Ta(R 3 airNu In :fTr (2)
where Nu = qR/kair(T-Ta) is the Nusselt number based on the heat flux q from the cap tothe ambient air, the local liquid temperature T, the conductivity of the air kair, and the capradius R. The shape of the solidification zone below the liquid cap is parabolic and canalso be expressed in analytic fom.
Figure 8 shows some data for R obtained with two different waxes over a range ofdeposition frequencies, and compares them with Eq. (2) taking Nu•l (rigorous for aspherical body in still air, and a good approximation here for the small scale involved).Except at the lower frequencies, the agreement is quite good, given the simple nature of thetheory. Video and visual observations using translucent waxes showed the liquid cap as asmooth, transparent hemisphere with a semi-opaque solid afterbody inside which a faintlyvisible molten region could be seen, much like the parabolic prediction sketched in Fig. 7,with X/R apparently somewhat greater than 2. The visiblity was not, however, adequatefor an accurate comparison of X with the model.
7. Continuous Bead Deposition on Flat Surfaces
When a generator dispenses liquid droplets at a frequency f while moving over aflat target at a speed U (Fig. 9), the droplets will overlap and tend to form a continuousbead if
f(2a) > F(O) (3)U
240
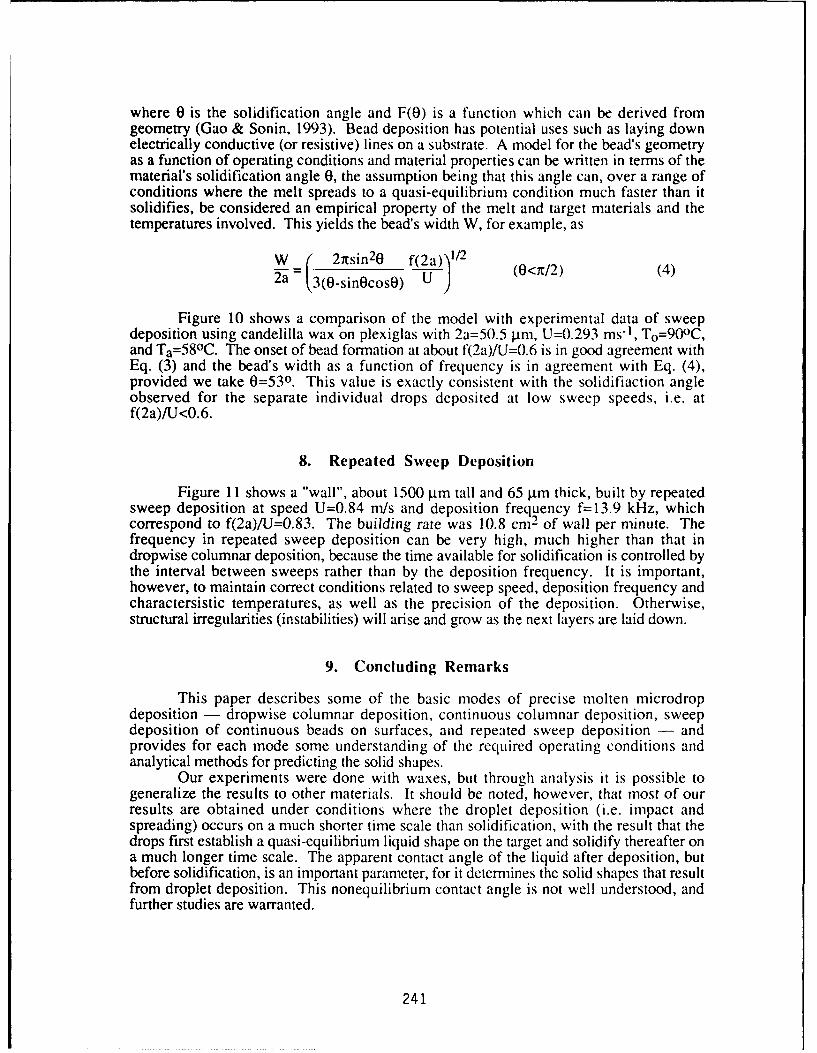
where 0 is the solidification angle and F(0) is a function which can be derived fromgeometry (Gao & Sonin, 1993). Bead deposition has potential uses such as laying downelectrically conductive (or resistive) lines on a substrate. A model for the bead's geometryas a function of operating conditions and material properties can be written in terms of thematerial's solidification angle 0, the assumption being that this angle can, over a range ofconditions where the melt spreads to a quasi-equilibrium condition much faster than itsolidifies, be considered an empirical property of the melt and target materials and thetemperatures involved. This yields the bead's width W, for example, as
w 2rtsin20 f(2 a)1/2
2a (3(0-sin0cosO) (0<t/2) (4)
Figure 10 shows a comparison of the model with experimental data of sweepdeposition using candelilla wax on plexiglas with 2a=50.5 lpim, U=0.293 ms-1, To=900 C,and Ta=580 C. The onset of bead formation at about f(2a)/U=0.6 is in good agreement withEq. (3) and the bead's width as a function of frequency is in agreement with Eq. (4),provided we take 0=530. This value is exactly consistent with the solidifiaction angleobserved for the separate individual drops deposited at low sweep speeds, i.e. atf(2a)/U<0.6.
8. Repeated Sweep Deposition
Figure 11 shows a "wall", about 1500 gam tall and 65 ptm thick, built by repeatedsweep deposition at speed U=0.84 m/s and deposition frequency f=13.9 kHz, whichcorrespond to f(2a)/U=0.83. The building rate was 10.8 cm 2 of wall per minute. Thefrequency in repeated sweep deposition can be very high, much higher than that indropwise columnar deposition, because the time available for solidification is controlled bythe interval between sweeps rather than by the deposition frequency. It is important,however, to maintain correct conditions related to sweep speed, deposition frequency andcharactersistic temperatures, as well as the precision of the deposition. Otherwise,structural irregularities (instabilities) will arise and grow as the next layers are laid down.
9. Concluding Remarks
This paper describes some of the basic modes of precise molten microdropdeposition - dropwise columnar deposition, continuous columnar deposition, sweepdeposition of continuous beads on surfaces, and repeated sweep deposition - andprovides for each mode some understanding of the required operating conditions andanalytical methods for predicting the solid shapes.
Our experiments were done with waxes, but through analysis it is possible togeneralize the results to other materials. It should be noted, however, that most of ourresults are obtained under conditions where the droplet deposition (i.e. impact andspreading) occurs on a much shorter time scale than solidification, with the result that thedrops first establish a quasi-equilibrium liquid shape on the target and solidify thereafter ona much longer time scale. The apparent contact angle of the liquid after deposition, butbefore solidification, is an important parameter, for it determines the solid shapes that resultfrom droplet deposition. This nonequilibrium contact angle is not well understood, andfurther studies are warranted.
241
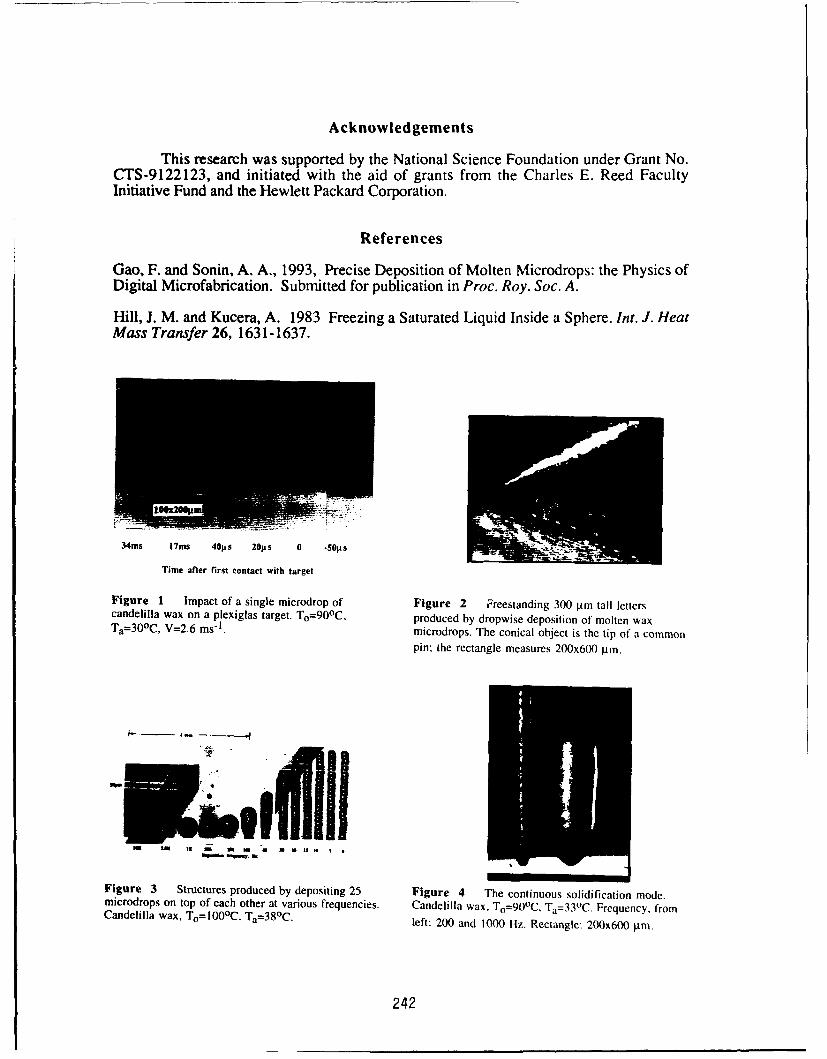
Acknowledgements
This research was supported by the National Science Foundation under Grant No.CTS-9122123, and initiated with the aid of grants from the Charles E. Reed FacultyInitiative Fund and the Hewlett Packard Corporation.
References
Gao, F. and Sonin, A. A., 1993, Precise Deposition of Molten Microdrops: the Physics ofDigital Microfabrication. Submitted for publication in Proc. Roy. Soc. A.
Hill, J. M. and Kucera, A. 1983 Freezing a Saturated Liquid Inside a Sphere. Int. J. HeatMass Transfer 26, 1631-1637.
34ms 17ms 4 0p s 20p s 0 -50p s
Time after first contact with target
Figure I Impact of a single microdrop of Figure 2 Freestanding 300 pm tall letterscandelilla wax on a plexiglas target. To=90 0 C, produced by dropwise deposition of molten waxTa=30 °C, V=2.6 ms-1. microdrops. The conical object is the tip of a common
pin; the rectangle measures 200x600 pim.
W LM
IS I -hm U, U UIA
Figure 3 Structures produced by depositing 25 Figure 4 The continuous solidification mode.microdrops on top of each other at various frequencies. Candelilla wax, To-900 C, Ta=33 0 C. Frequency, fromCandelilla wax, T,=1000C, Ta=380 C. left: 200 and 1000 Hz. Rectangle: 200x600 pm.
242
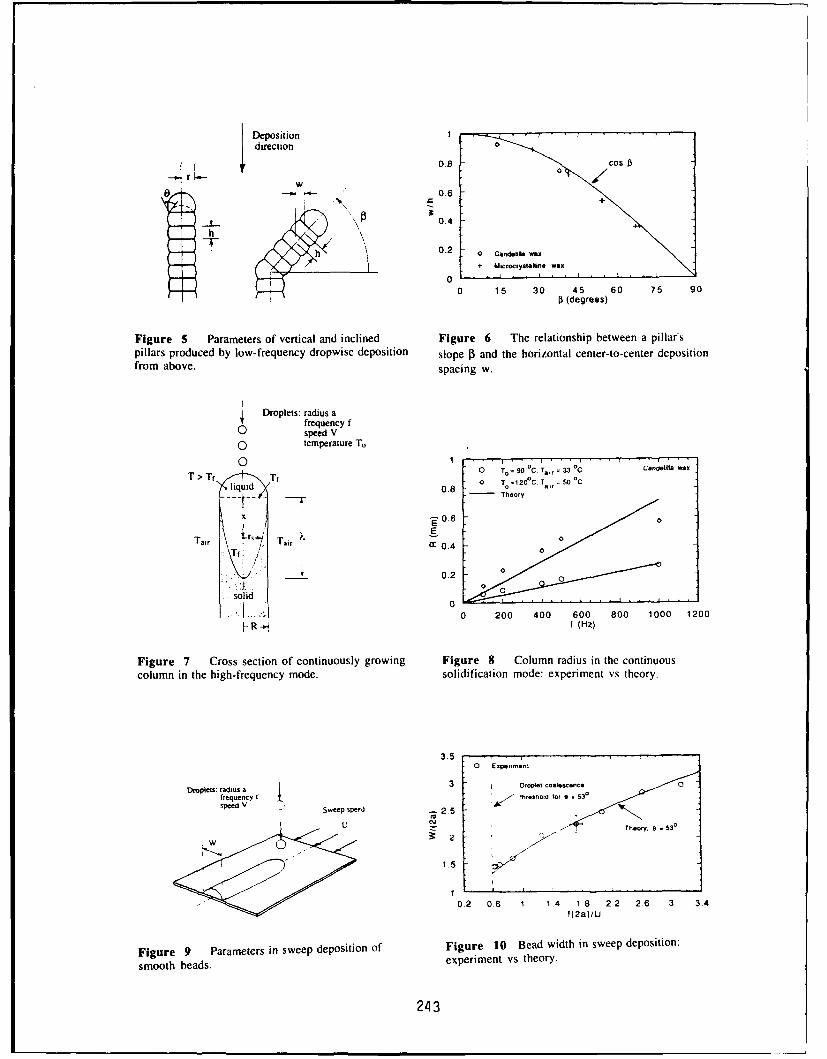
Depoiin I
0.8 Cos 0
o -~--- 0.6 e
0.4h
A h 0.2 0 carxdiOma wax+ uicrorystafinfl wax
00 15 30 45 60 75 90
II (degrees)
Figure 5 Parameters of vertical and inclined Figure 6 The relationship between a pillar'spillars produced by low-frequency dropwise deposition slope 13 and the horizontal center-to-center depositionfrom above. spacing w.
1. Droplets: radius a
frequencyf0 ~speedV
0temperature To
0 13To T T,-90 C,Ta,r=330
C Carrd"iri w"x
Iliquid 0.8 0- o-1 ' . 0'
Q~qu~d
0.8 TheorV
Tair, -r Tair,0
Tfc 0.4
0.20 0
solid 0
I -0 200 400 600 800 1000 1200
HR- f (Hz)
Figure 7 Cross section of continuously growing Figure 8 Column radius in the continuouscolumn in the high-frequency mode. solidification mode: experiment vs theory.
3.50 Expir-mrr
Droplets: radius a3 Drooilr CoaluesonCefrtquexcY I' threshrol for e 530speed Vsweep speed 2.5
U ~Th.ory. ef S3
1.5
>0.2 0.6 1 1.4 1 8 2 2 26 3 3.4t(2a)/U
Figure 9 Parameters in sweep deposition of Figure 10 Bead width in sweep deposition:
smooth beads. experiment vs theory.
24 3
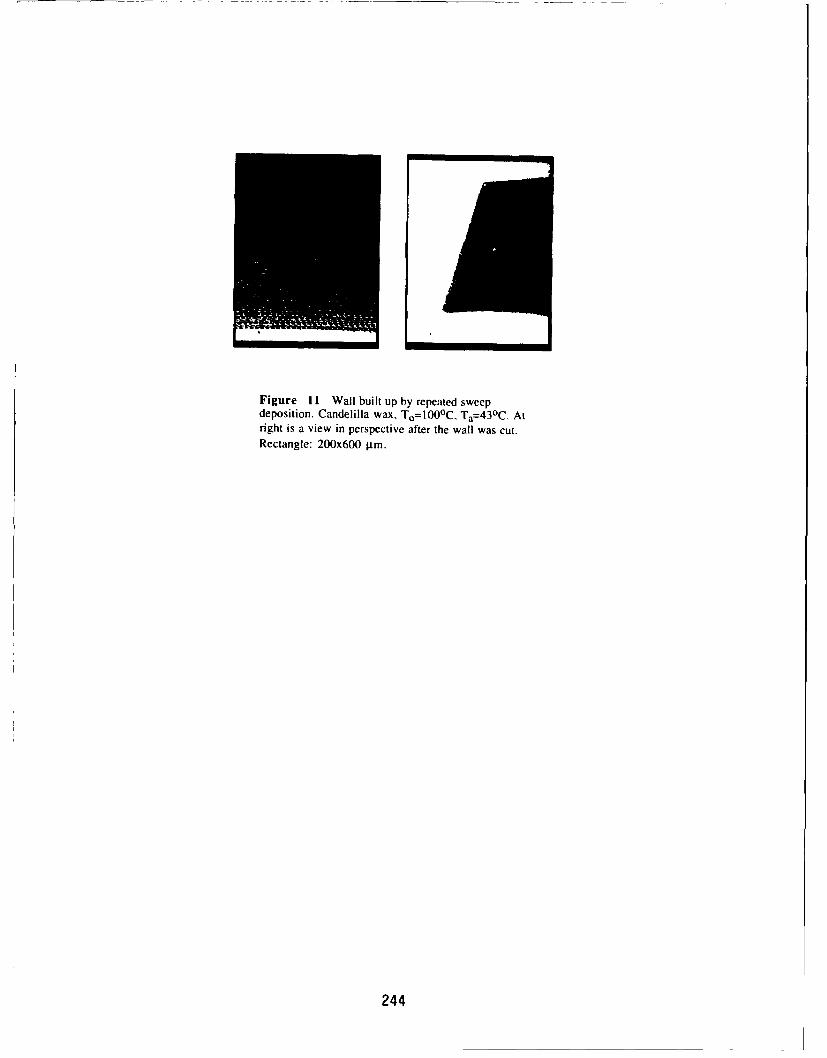
Figure 11 Wall built up by repeated sweepdeposition. Candelilla wax, T0=100oC, Ta=430C. Atright is a view in perspective after the wall was cut.Rectangle: 200x600 gm.
244
MATERIAL AND PROCESS PARAMETERSTHAT AFFECT ACCURACY IN STEREOLITHOGRAPHY
Richard P. Chartoff, Lawrance Flach,and Peter Weissman*University of Dayton
Rapid Prototype Development Laboratory andCenter for Basic and Applied Polymer Research
Dayton, Ohio 45469-0130
ABSTRACT
Experimental real time linear shrinkage rate measurements simulating stereolithographyare used in an analysis of shrinkage during line drawing in stereolithography. While the amount ofshrinkage depends on the polymerization kinetics, shrinkage kinetics and overall degree of cure, italso depends on the length of time to draw a line of plastic. A line drawn slowly will exhibit lessapparent shrinkage than one drawn very quickly because much of the shrinkage is compensatedfor as the line is drawn. The data also indicates that a typical stereolithography resin in the greenstate may shrink to only 65% of its maximum, thus retaining considerable potential for shrinkageduring post-cure. This information can be used to predict the amount of shrinkage to be expectedunder certain exposure conditions and to formulate overall strategies to reduce shrinkage andsubsequent warpage that causes shape distortion.
INTRODUCTION
In order to better understand the shrinkage-related problems associated withstereolithography, and to minimize their effect, it is essential to understand the relationshipbetween the polymerization kinetics, shrinkage kinetics, total shrinkage, and the laser scan rate.These variables directly affect the amount of shrinkage that will occur in a line of plastic drawn bythe stereolithography apparatus (SLA) and ultimately in the warpage and shape distortion of thefinal part. In this paper we discuss the results of a series of real time shrinkage rate measurements(in an apparatus that simulates stereolithography) and use the rate data in an analysis of theshrinkage that occurs when a single strand of material is formed. The analysis indicates that therate of shrinkage rather than shrinkage itself is the key parameter for controlling shrinkage-relateddimensional effects.
EXPERIMENTAL
Real time shrinkage measurements were performed on "full line" exposures of threephotopolymers: Ciba XB5081-1, UD experimental formulas 60.1 and 61.1. The so-called "fullline" exposure is performed by exposing an approximately 7 mm long by 0.2 mm wide line to afocused Argon-Ion UV laser beam. The apparatus and procedures for making thesemeasurements have been described elsewhere [ 1,2]. The current experiments were designed to
Current Address: UCB Radcure, Inc., 200 Lake Park Drive, Smyrna, GA 30080-7611.
245
compare the shrinkage rates as well as the shrinkage occurring under both short term and longterm laser illumination. This was accomplished by exposing a line of polymer to a single 40 m secpulse (short term exposure) and subsequently a series of successive 40 m sec pulses untilmaximum shrinkage was achieved.
Real time shrinkage measurements were made, in duplicate, for the three polymers. Thelaser power was varied for each so that a cure depth (C..,.) of 0.85 mm was obtained. Theenergy densities 76.9, 65.2, and 66.5 mJ/cm 2 were used to obtain a uniform specified cure depthfor XB5081-1, 60.1, and 61.1, respectively. The total shrinkage was noted five minutes after thefirst exposure. Each sample was then exposed again the standard amount and the additionalshrinkage noted after five minutes. This procedure was repeated to obtain the desired number ofexposures. Each material was subjected to five consecutive exposures with a five minute pausebetween each. XB5081-1 was tested using eight consecutive exposures.
DISCUSSION OF EXPERIMENTAL RESULTS
The real time shrinkage data for the six samples (three polymers in duplicate) that wereexposed once are shown in Figure 1. Resins 60.1 and 61.1 show a shorter induction time, steeperslope, and higher shrinkage than XB5081-1.
The data of Figure 2 indicate that 60.1 and 61.1 complete a greater percentage of theirultimate shrinkage after the first exposure than does the XB508 1-1. Table I tabulates thepercentage of maximum shrinkage that has occurred after each individual exposure. The changein shrinkage due to additional exposures became very small after the fifth exposure for 60.1 and61.1. However, for XB5081-1 the change in shrinkage with continued exposures does notdecrease significantly until the eighth exposure. Therefore, the maximum shrinkage for 60.1 and61.1 was taken as that which had occurred after the fifth exposure, while for XB5081-1 it wastaken as that which had occurred after the eighth exposure.
Additional data on the density changes for the three photopolymers measured after longterm cure under Hg vapor lamp exposure indicates that approximately 15-25% of the totalshrinkage that occurs is missed by the real time shrinkage apparatus. This is the amount thatoccurs before gelation and does not affect the dimensions of a line actually drawn by a laser.Further density characterization of full line specimens after long term laser exposure is now beingcarried out to determine more exactly the amount of initial shrinkage not detected in the real timeshrinkage measurements.
SHRINKAGE ANALYSIS
The amount of shrinkage observed when a line of plastic is drawn by the SLA isdetermined by the polymerization kinetics, the shrinkage kinetics, and the laser scan rate. Adetailed analysis is required in order to determine the inter-relationships between the appropriatevariables. There are two shrinkage components that must be considered. These are: (1) curerelated shrinkage arising due to a change in chemical bond distances in the unpolymerizedmonomer relative to the polymer, and (2) thermal expansion/contraction due to temperature
246
changes in the resin on polymerization. The latter is assumed negligible as discussed elsewhere[2]. The analysis incorporates the experimental shrinkage rate data described previously.
The basis for the analysis is that any shrinkage that occurs before completing the laser scanfor a particular line of plastic will be compensated for at least partially by the fact that the laserstill scans a line of the correct length. The actual shrinkage that will be observed should be basedon the amount of shrinkage that will occur at each point along the line at the time the line iscompleted. At that time the line is the correct length (due to a scan of the correct length) and anychange in length is a result of polymerization and shrinkage occurring after completion ofexposure.
If L is the desired length of a line of plastic drawn by the SLA, then the overall linearshrinkage (fraction) due to cure for the line of plastic will be given by:
F, = f fr,(x)dx (1)
where fr(x) is the residual shrinkage (fraction) at position x along the line, i.e. the amount ofshrinkage that will occur at that point after completion of the line as indicated in Figure 3.
The residual shrinkage, fr(x), can be obtained from experimentally determined shrinkagevs. time data, or can be estimated from model-based predictions of the degree of cure along theline of plastic. If ts is the time taken for the laser to scan from position x to the end of the line L,and fts(x) the fractional shrinkage that has occurred up to time ts at position x, then the residualshrinkage is just
fr(x) = f. - fts(x) (2)
where f.. is the maximum fractional shrinkage that occurs at t--oo (see Figure 4).
Using the fact that
f, = f(t) as t--*-- (3)
and
fts (x) = f(t) at t = L-x (4)S
where s is the laser scan (draw) rate and f(t) the shrinkage vs. time curve, eqn. (2) can betransformed to a time integral as follows:
S L/,IsF, = f_ - - fJf(t)dt (5)
247
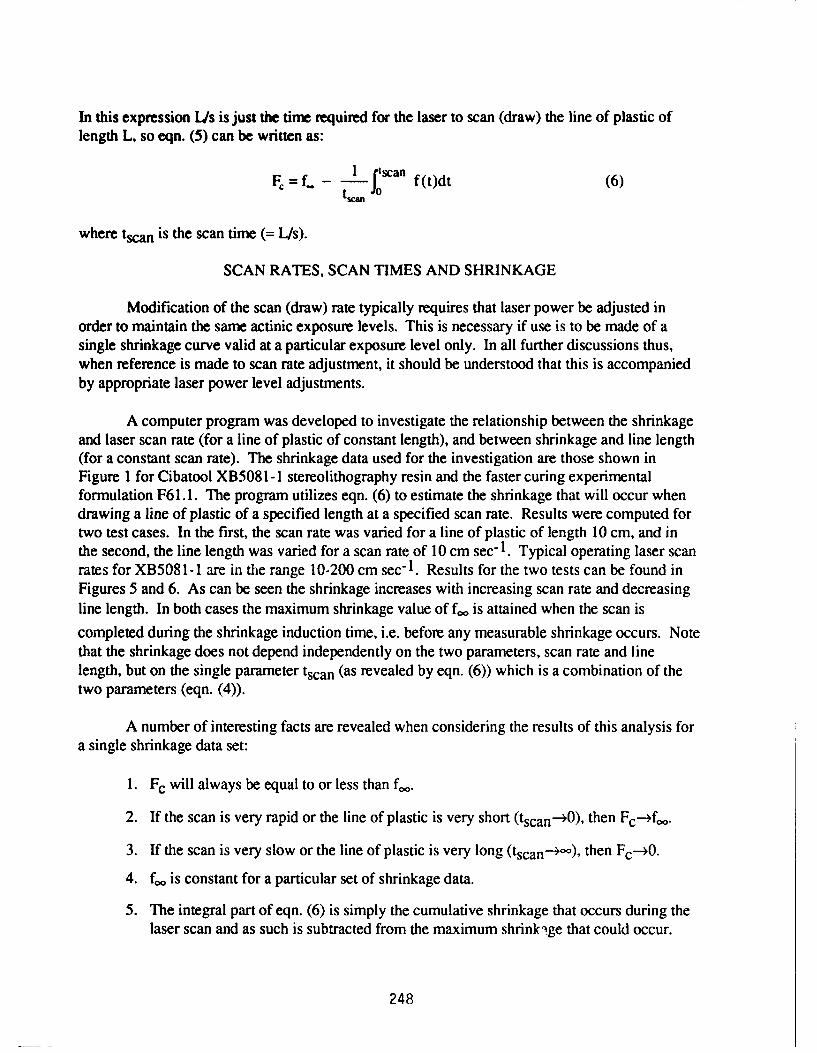
In this expression Us is just the time required for the laser to scan (draw) the line of plastic oflength L, so eqn. (5) can be written as:
F =f-a - f(t)dt (6)
where tscan is the scan time (= L/s).
SCAN RATES, SCAN TIMES AND SHRINKAGE
Modification of the scan (draw) rate typically requires that laser power be adjusted inorder to maintain the same actinic exposure levels. This is necessary if use is to be made of asingle shrinkage curve valid at a particular exposure level only. In all further discussions thus,when reference is made to scan rate adjustment, it should be understood that this is accompaniedby appropriate laser power level adjustments.
A computer program was developed to investigate the relationship between the shrinkageand laser scan rate (for a line of plastic of constant length), and between shrinkage and line length(for a constant scan rate). The shrinkage data used for the investigation are those shown inFigure 1 for Cibatool XB5081-1 stereolithography resin and the faster curing experimentalformulation F61.1. The program utilizes eqn. (6) to estimate the shrinkage that will occur whendrawing a line of plastic of a specified length at a specified scan rate. Results were computed fortwo test cases. In the first, the scan rate was varied for a line of plastic of length 10 cm, and inthe second, the line length was varied for a scan rate of 10 cm sec- 1. Typical operating laser scanrates for XB5081-1 are in the range 10-200 cm sec-1 . Results for the two tests can be found inFigures 5 and 6. As can be seen the shrinkage increases with increasing scan rate and decreasingline length. In both cases the maximum shrinkage value of fo, is attained when the scan is
completed during the shrinkage induction time, i.e. before any measurable shrinkage occurs. Notethat the shrinkage does not depend independently on the two parameters, scan rate and linelength, but on the single parameter tscan (as revealed by eqn. (6)) which is a combination of thetwo parameters (eqn. (4)).
A number of interesting facts are revealed when considering the results of this analysis fora single shrinkage data set:
1. Fc will always be equal to or less than fo.
2. If the scan is very rapid or the line of plastic is very short (tscan-0), then Fc-Af,,.
3. If the scan is very slow or the line of plastic is very long (tscan---OO), then Fc--O.
4. foo is constant for a particular set of shrinkage data.
5. The integral part of eqn. (6) is simply the cumulative shrinkage that occurs during thelaser scan and as such is subtracted from the maximum shrinkige that could occur.
248
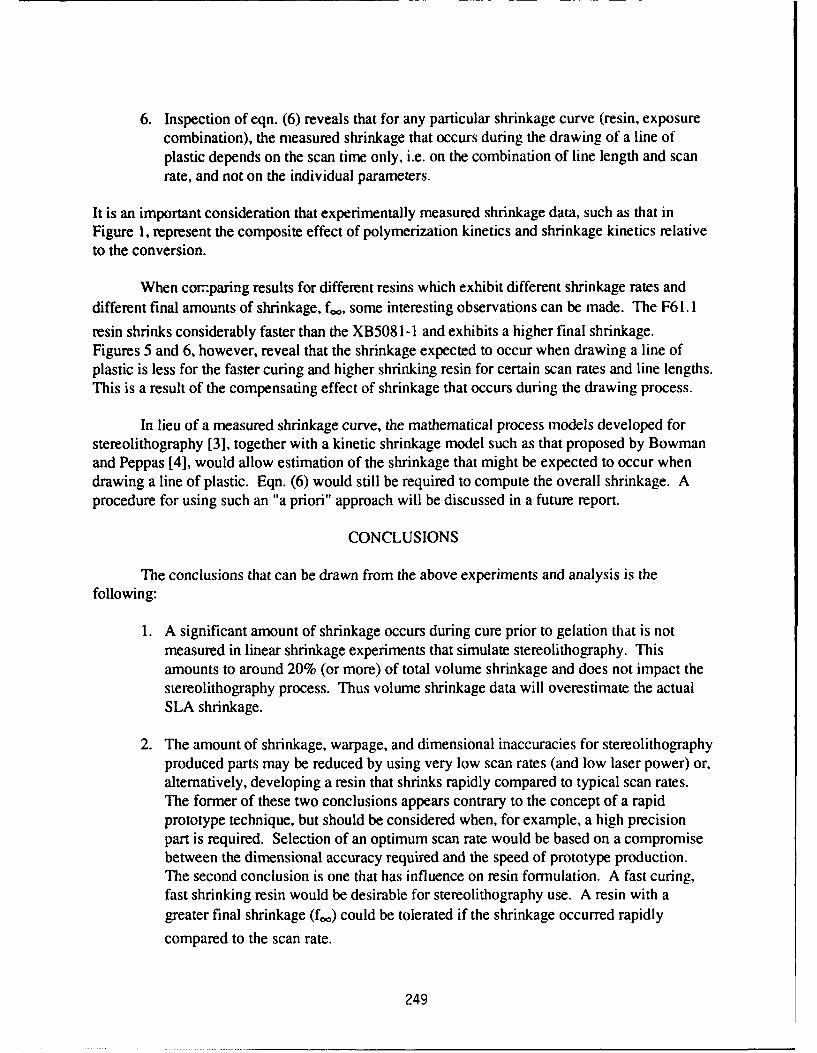
6. Inspection of eqn. (6) reveals that for any particular shrinkage curve (resin, exposurecombination), the measured shrinkage that occurs during the drawing of a line ofplastic depends on the scan time only, i.e. on the combination of line length and scanrate, and not on the individual parameters.
It is an important consideration that experimentally measured shrinkage data, such as that inFigure 1, represent the composite effect of polymerization kinetics and shrinkage kinetics relativeto the conversion.
When comparing results for different resins which exhibit different shrinkage rates anddifferent final amounts of shrinkage, f,, some interesting observations can be made. The F61. 1
resin shrinks considerably faster than the XB508 1-1 and exhibits a higher final shrinkage.Figures 5 and 6, however, reveal that the shrinkage expected to occur when drawing a line ofplastic is less for the faster curing and higher shrinking resin for certain scan rates and line lengths.This is a result of the compensating effect of shrinkage that occurs during the drawing process.
In lieu of a measured shrinkage curve, the mathematical process models developed forstereolithography [3], together with a kinetic shrinkage model such as that proposed by Bowmanand Peppas [4], would allow estimation of the shrinkage that might be expected to occur whendrawing a line of plastic. Eqn. (6) would still be required to compute the overall shrinkage. Aprocedure for using such an "a priori" approach will be discussed in a future report.
CONCLUSIONS
The conclusions that can be drawn from the above experiments and analysis is thefollowing:
1. A significant amount of shrinkage occurs during cure prior to gelation that is notmeasured in linear shrinkage experiments that simulate stereolithography. Thisamounts to around 20% (or more) of total volume shrinkage and does not impact thestereolithography process. Thus volume shrinkage data will overestimate the actualSLA shrinkage.
2. The amount of shrinkage, warpage, and dimensional inaccuracies for stereolithographyproduced parts may be reduced by using very low scan rates (and low laser power) or,alternatively, developing a resin that shrinks rapidly compared to typical scan rates.The former of these two conclusions appears contrary to the concept of a rapidprototype technique, but should be considered when, for example, a high precisionpart is required. Selection of an optimum scan rate would be based on a compromisebetween the dimensional accuracy required and the speed of prototype production.The second conclusion is one that has influence on resin formulation. A fast curing,fast shrinking resin would be desirable for stereolithography use. A resin with agreater final shrinkage (fo,) could be tolerated if the shrinkage occurred rapidly
compared to the scan rate.
249
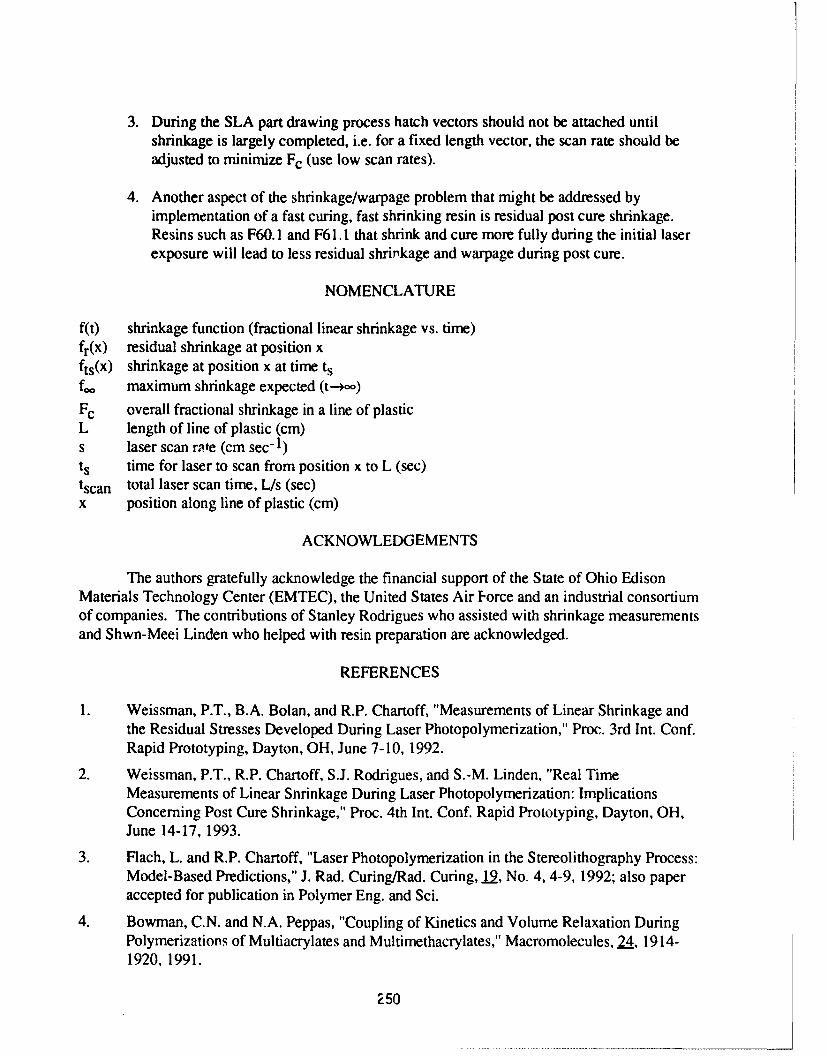
3. During the SLA part drawing process hatch vectors should not be attached untilshrinkage is largely completed, i.e. for a fixed length vector, the scan rate should beadjusted to minimize Fc (use low scan rates).
4. Another aspect of the shrinkage/warpage problem that might be addressed byimplementation of a fast curing, fast shrinking resin is residual post cure shrinkage.Resins such as F60.1 and F61.1 that shrink and cure more fully during the initial laserexposure will lead to less residual shrinkage and warpage during post cure.
NOMENCLATURE
f(t) shrinkage function (fractional linear shrinkage vs. time)fr(x) residual shrinkage at position xfts(x) shrinkage at position x at time tsf,, maximum shrinkage expected (t-4o-)Fc overall fractional shrinkage in a line of plasticL length of line of plastic (cm)s laser scan rmte (cm sec- 1)ts time for laser to scan from position x to L (see)tscan total laser scan time, L/s (sec)x position along line of plastic (cm)
ACKNOWLEDGEMENTS
The authors gratefully acknowledge the financial support of the State of Ohio EdisonMaterials Technology Center (EMTEC), the United States Air Force and an industrial consortiumof companies. The contributions of Stanley Rodrigues who assisted with shrinkage measurementsand Shwn-Meei Linden who helped with resin preparation are acknowledged.
REFERENCES
I. Weissman, P.T., B.A. Bolan, and R.P. Chartoff, "Measurements of Linear Shrinkage andthe Residual Stresses Developed During Laser Photopolymerization," Proc. 3rd Int. Conf.Rapid Prototyping, Dayton, OH, June 7-10, 1992.
2. Weissman, P.T., R.P. Chartoff, S.J. Rodrigues, and S.-M. Linden, "Real TimeMeasurements of Linear Snrinkage During Laser Photopolymerization: ImplicationsConcerning Post Cure Shrinkage," Proc. 4th Int. Conf. Rapid Prototyping, Dayton, OH,June 14-17, 1993.
3. Flach, L. and R.P. Chartoff, "Laser Photopolymerization in the Stereolithography Process:Model-Based Predictions," J. Rad. Curing/Rad. Curing, 12, No. 4, 4-9, 1992; also paperaccepted for publication in Polymer Eng. and Sci.
4. Bowman, C.N. and N.A. Peppas, "Coupling of Kinetics and Volume Relaxation DuringPolymerizations of Multiacrylates and Multimethacrylates," Macromolecules, 24, 1914-1920, 1991.
250
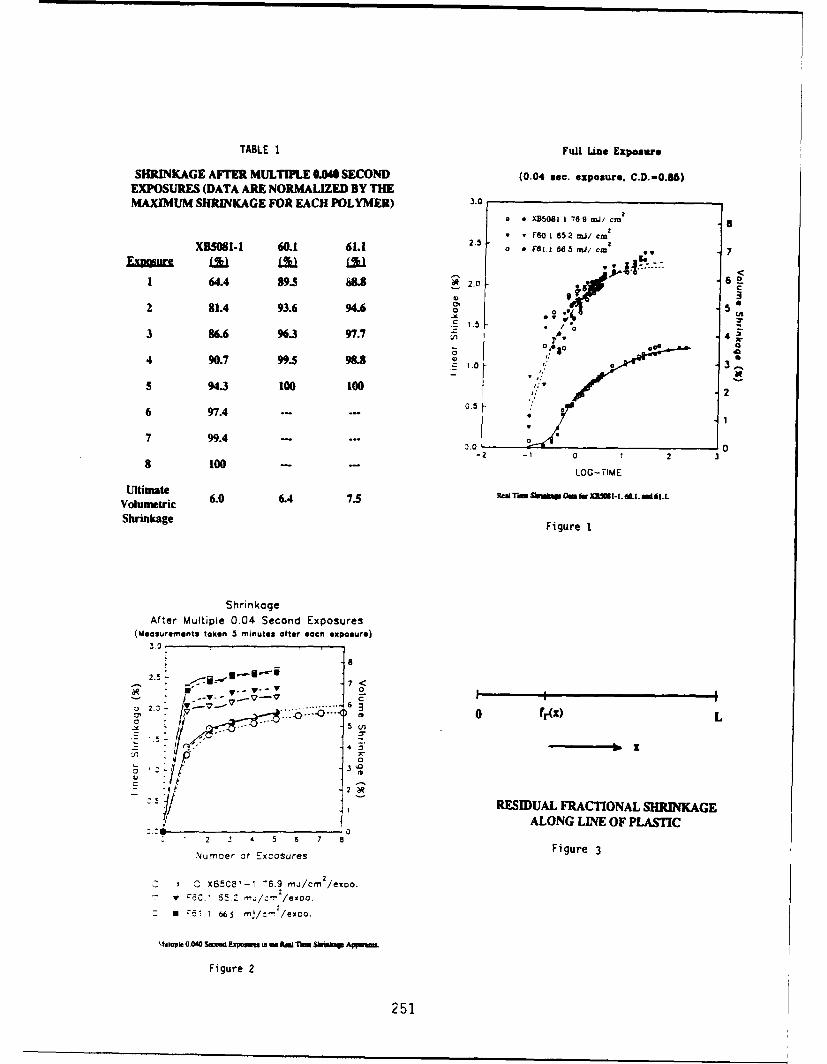
TABLE 1 Full Line Exposure
SHRINKAGE AFTER MULTIPLE O.0 SECOND (0.04 sec. exposure. C.D.-,0.6)EXPOSURES (DATA ARE NORMALIZED BY THEMAXIMUM SHRINKAGE FOR EACH POLYMER) 3.0
o a XB5081 l 76 9 mJ/ cm8
160 1 65 2 nJ/ cm,
XBS081-1 60.1 61.1 2.5 F 1 I 5 mu COS 7
64.4 89.5 8"6 ~ 2.0 C~
2 81.4 93.6 94.6 a
.o1. * 'l!6 5r./c 'av
3 86&6 96.3 97.7
"90.7 99.5 9 3,
- 0.
5 94.3 100 100 2
6 97.4 .0.. 5
7 "A 0
-2 -1 0 1 2 08 100 - LOG-TIME
UltimateVolumetric 6.0 6.4 7.5 503 Th Sh Om f X5,.I. 6 .L
Shrinkage Figure 1
ShrinkageAfter Multiple 0.04 Second Exposures
(Measurements token 5 minutes ofter eacn exposure)3,
2. v .. ....... . 6. 3.
-v -!
0 ,0 f1.(z) L
1; , RESIDUAL FRACTIONAL SHRINKAGE
ALONG LINE OF PLASTIC2 2 s 5 6 7 8
*Numaer of Excosures Figure 32
C x8508'-1 76.9 mj/cm /exoo.v" • :60. 62.2 2/xcSV ., I 66j r..I/C /exOo.
- !• 66 X•5 m.J/c'/exo)o.
\Iulaple 0.0*0 Swod Exzpumn min we Red Tuns Shra ApU
Figure 2
251
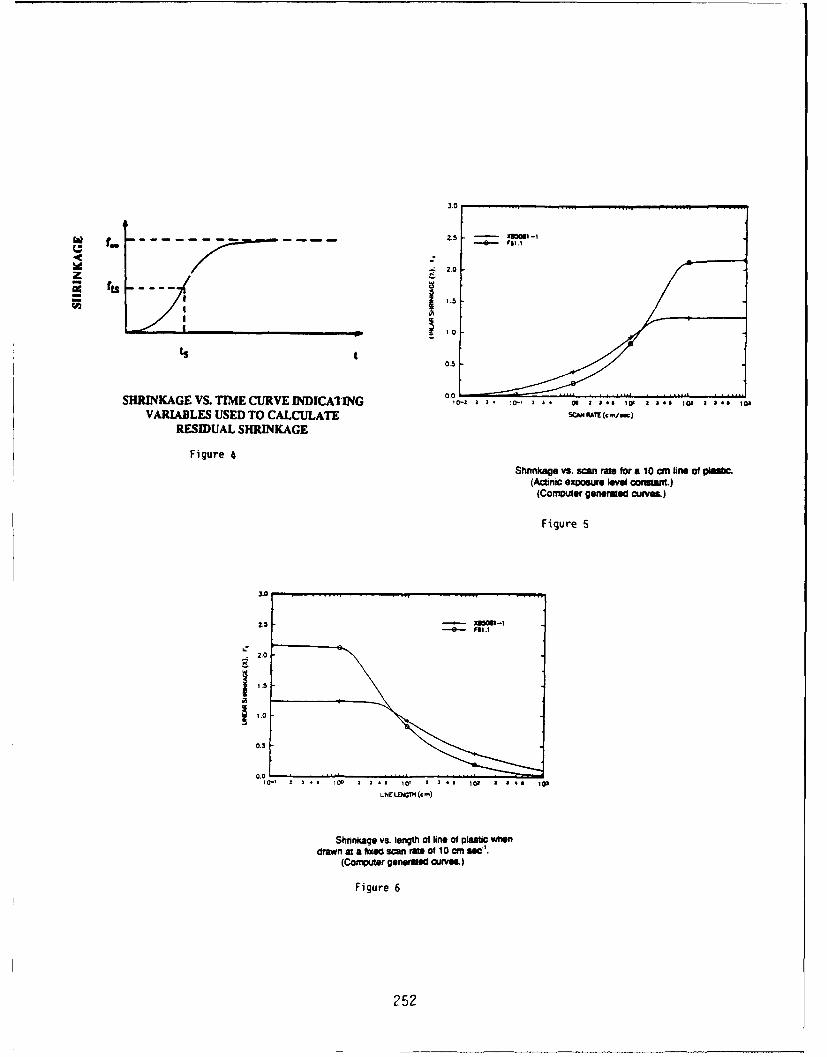
3.0
* f- - - z2.5 -- .- I
,2.0z
re fis
Its Ito0.5
SHRINKAGE VS. TIME CURVE INDICATING 10. a 3 - 0 2 3' 01 3 .. 101 . 3 820. . 3 40 103
VARIABLES USED TO CALCULATE SC MP('./,.)RESIDUAL SHRINKAGE
Figure 4
Shnnkage vs. scan rate for a 10 cm line of pim(Actinic exposure level constant.)
(Computer generated curves.)
Figure 5
3.0
2.3 -
2.0
20.
0.0
0.0-0 220 1 0 a ,0 23 i8 103 2 4 0 102
UNELD& W(cn)
Shnnkage vs. length of line Of Plastic whendrawn at a fixed scan ret of 10 cm secý".
(Computer generated curves.)
Figure 6
252
Thermal Analysis and Modeling of Steady-State Rod Growth DuringGas-Phase Solid Freeform Fabrication
James L. MaxwellJoseph Pegna
Alexandar G. OstrogorskyRensselaer Polytechnic Institute
Troy, New York
Abstract: An analysis of the steady-state growth of rods during gas-phase solid freeform fabricationis presented. It is demonstrated that heat transfer controls the evolution of shape during laser-inducedpyrolysis of slender 3-D structures. Insulating and conductive deposit materials were studied, usingboth simple analytic and numerical simulations to demonstrate how steady-state rod growth isachieved.
Keywords: LCVD, SALD, Microfabrication.
1 Introduction
Laser-induced Chemical Vapor Deposition, or LCVD-also known as Selective Area LaserDeposition, or SALD- has been used extensively in the microelectronics industry for the fabricationof custom IC interconnects. While its use in the solid freeform fabrication of millimeter-length rodswas first demonstrated by Bauerle et. al. [1],[2], only recently has the process been applied to themicrofabrication of other 3-dimensional structures [3],[4]. We assert that LCVD holds great promiseas a general-purpose manufacturing tool for micro- and millimeter-scale mechanical systems.
Compared with traditional microfabrication processes, LCVD offers the potential for a highlyflexible manufacturing tool. It possesses many of the same advantages found in other SFF processes,namely:
1. One-step fabrication, where the entire structure is created directly under computer control.
2. Complex structures with internal features can be created as easily as simple block structures.
In addition, LCVD has other benefits inherent to the scale at which the process is applied;these are not-necessarily found in all SFF processes:
1. The need for assembly of small mechanical components is eliminated.
2. In-situ fabrication is possible. (No handling of fragile components during the process, andincreased technological integration).
PNoccedits of the Solid Freeftor Fabrication Sympo-
sium 11J. Mar Editor. Austin. Texas August 9-11,1993.
253
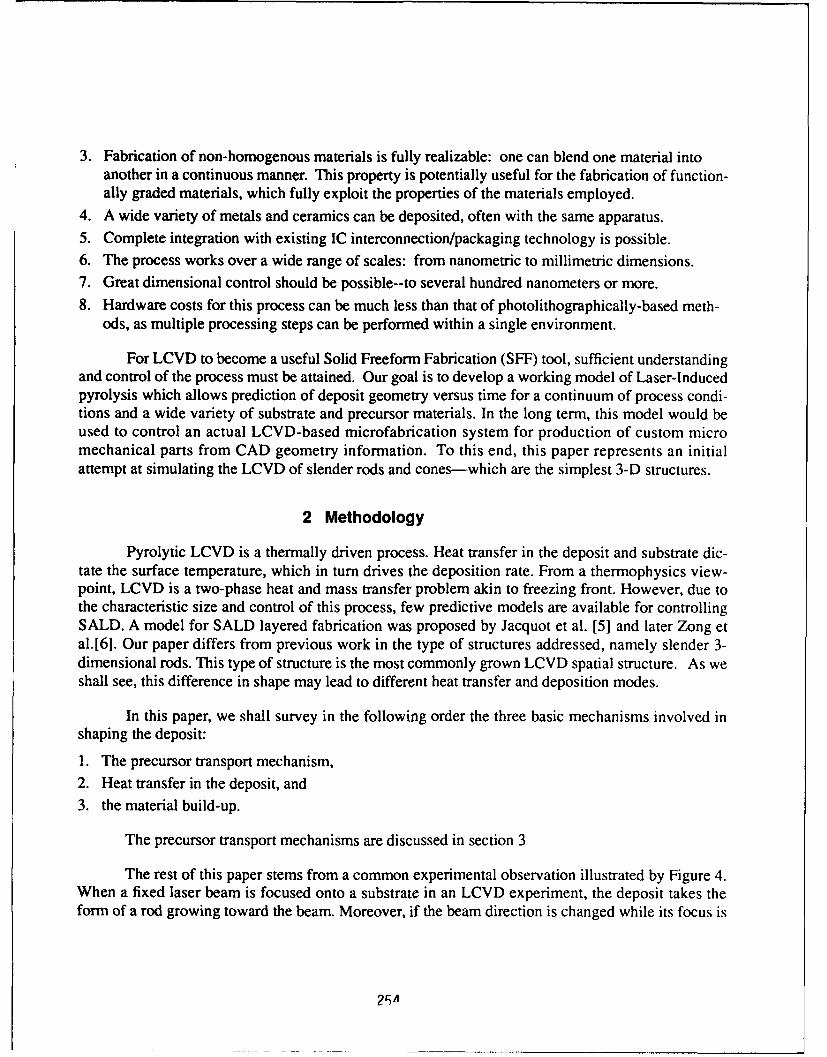
3. Fabrication of non-homogenous materials is fully realizable: one can blend one material intoanother in a continuous manner. This property is potentially useful for the fabrication of function-ally graded materials, which fully exploit the properties of the materials employed.
4. A wide variety of metals and ceramics can be deposited, often with the same apparatus.5. Complete integration with existing IC interconnection/packaging technology is possible.6. The process works over a wide range of scales: from nanometric to millimetric dimensions.7. Great dimensional control should be possible--to several hundred nanometers or more.8. Hardware costs for this process can be much less than that of photolithographically-based meth-
ods, as multiple processing steps can be performed within a single environment.
For LCVD to become a useful Solid Freeform Fabrication (SFF) tool, sufficient understandingand control of the process must be attained. Our goal is to develop a working model of Laser-Inducedpyrolysis which allows prediction of deposit geometry versus time for a continuum of process condi-tions and a wide variety of substrate and precursor materials. In the long term, this model would beused to control an actual LCVD-based microfabrication system for production of custom micromechanical parts from CAD geometry information. To this end, this paper represents an initialattempt at simulating the LCVD of slender rods and cones-which are the simplest 3-D structures.
2 Methodology
Pyrolytic LCVD is a thermally driven process. Heat transfer in the deposit and substrate dic-tate the surface temperature, which in turn drives the deposition rate. From a thermophysics view-point, LCVD is a two-phase heat and mass transfer problem akin to freezing front. However, due tothe characteristic size and control of this process, few predictive models are available for controllingSALD. A model for SALD layered fabrication was proposed by Jacquot et al. [51 and later Zong etal.[6]. Our paper differs from previous work in the type of structures addressed, namely slender 3-dimensional rods. This type of structure is the most commonly grown LCVD spatial structure. As weshall see, this difference in shape may lead to different heat transfer and deposition modes.
In this paper, we shall survey in the following order the three basic mechanisms involved in
shaping the deposit:
1. The precursor transport mechanism,2. Heat transfer in the deposit, and
3. the material build-up.
The precursor transport mechanisms are discussed in section 3
The rest of this paper stems from a common experimental observation illustrated by Figure 4.When a fixed laser beam is focused onto a substrate in an LCVD experiment, the deposit takes theform of a rod growing toward the beam. Moreover, if the beam direction is changed while its focus is
2A
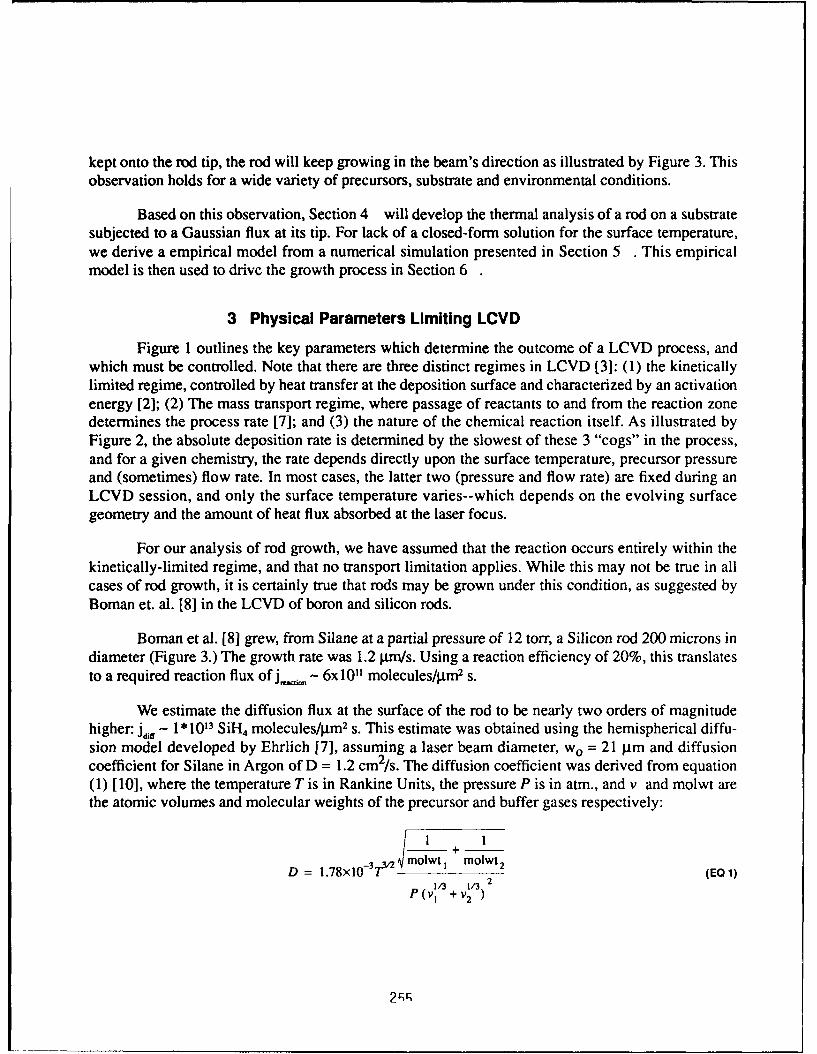
kept onto the rod tip, the rod will keep growing in the beam's direction as illustrated by Figure 3. Thisobservation holds for a wide variety of precursors, substrate and environmental conditions.
Based on this observation, Section 4 will develop the thermal analysis of a rod on a substratesubjected to a Gaussian flux at its tip. For lack of a closed-form solution for the surface temperature,we derive a empirical model from a numerical simulation presented in Section 5 . This empiricalmodel is then used to drive the growth process in Section 6
3 Physical Parameters Limiting LCVD
Figure 1 outlines the key parameters which determine the outcome of a LCVD process, andwhich must be controlled. Note that there are three distinct regimes in LCVD [3]: (1) the kineticallylimited regime, controlled by heat transfer at the deposition surface and characterized by an activationenergy [2]; (2) The mass transport regime, where passage of reactants to and from the reaction zonedetermines the process rate [7]; and (3) the nature of the chemical reaction itself. As illustrated byFigure 2, the absolute deposition rate is determined by the slowest of these 3 "cogs" in the process,and for a given chemistry, the rate depends directly upon the surface temperature, precursor pressureand (sometimes) flow rate. In most cases, the latter two (pressure and flow rate) are fixed during anLCVD session, and only the surface temperature varies--which depends on the evolving surfacegeometry and the amount of heat flux absorbed at the laser focus.
For our analysis of rod growth, we have assumed that the reaction occurs entirely within thekinetically-limited regime, and that no transport limitation applies. While this may not be true in allcases of rod growth, it is certainly true that rods may be grown under this condition, as suggested byBoman et. al. [8] in the LCVD of boron and silicon rods.
Boman et al. [8] grew, from Silane at a partial pressure of 12 torr, a Silicon rod 200 microns indiameter (Figure 3.) The growth rate was 1.2 pnm/s. Using a reaction efficiency of 20%, this translatesto a required reaction flux of j,,, - 6x10¹¹ molecules/p.m 2 s.
We estimate the diffusion flux at the surface of the rod to be nearly two orders of magnitudehigher: jd,, - 1* 1013 SiHl4 molecules/gm 2 s. This estimate was obtained using the hemispherical diffu-sion model developed by Ehrlich [7], assuming a laser beam diameter, wo = 21 pm and diffusioncoefficient for Silane in Argon of D = 1.2 cm 2/s. The diffusion coefficient was derived from equation(1) [10], where the temperature T is in Rankine Units, the pressure P is in atm., and v and molwt arethe atomic volumes and molecular weights of the precursor and buffer gases respectively:
+ -
D = 1.78x10 3 T- 7"-- molwt 2 (EQl)1 V / 3 + 1 / 3 2P +2
2r r
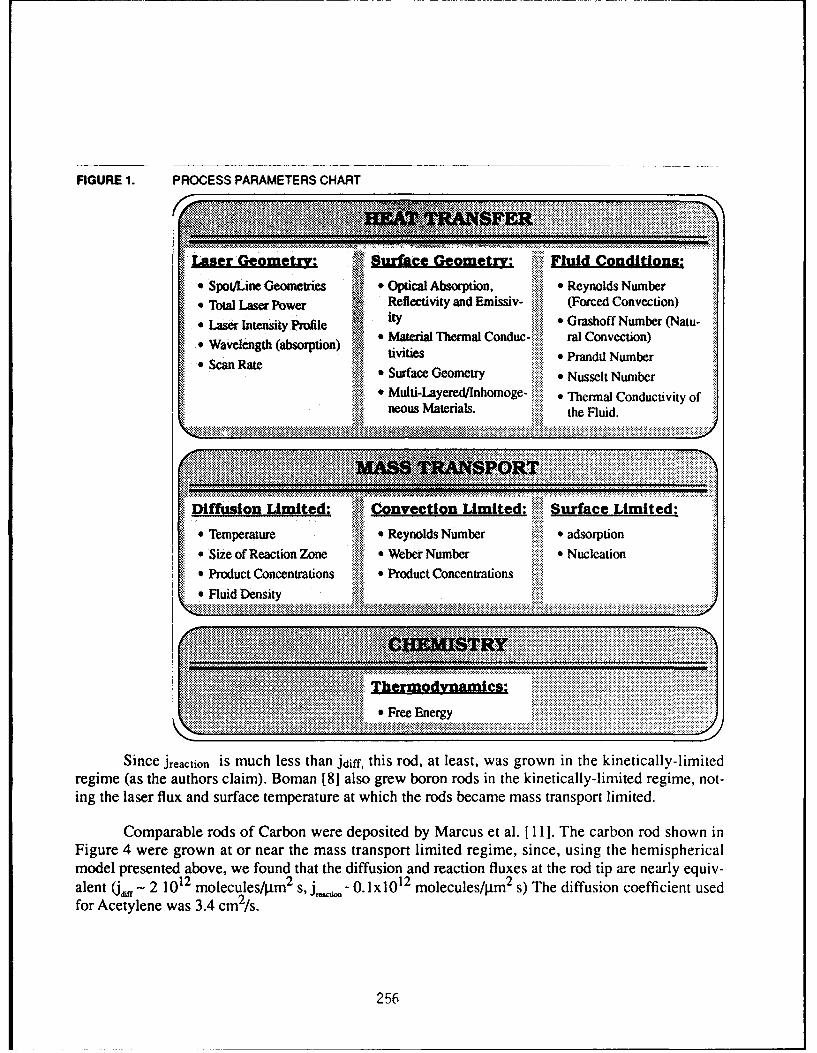
FIGURE 1. PROCESS PARAMETERS CHART
". ,s' ,'
" N ~~~ ~ ~ ' ......NN N. ~ st ~ .
Laser Geometry: Surface Geometry: Fluid Conditions:
"• Spo/Line Gometries t* Optical Absorption, * Reynolds Number"• Total Laser Power Reflectivity and Emissiv- iii (Forced Convection)
ity ....~i Grashoff Number (Natu-"* Laser Intensity Profile ~ fy*CrsofNme NtSWavelnengith (absorpioi)e •* Material Thermal Conduc- ral Convection)"• Wavelength (absorption) tiiis:::::::: Pad Nme
tivities *Prandtl NumberX.Scan Ra* Surface Geometry * Nusselt Number
- Multi-Layered/Inhomoge- ........ Thermal Conductivity offlC,01 Maeias the Fluid.
MAS ................
------------. .. .. . . ... . .... . ..... ..... ..... .......... .:i: ............... ................... .... ..................... . . .... .:':~~~~~~~~~~~~~~ ~ ~~~~ ~ ~ ...........• :•: :.• • ::• • :• • :•: • : :: :S•:• : ,,. ...
DifsinLimited: Convection Limited: i!iii Surface Limited:
*Temperature * Reynolds Number * adsorptioSSize of Reaction Zone Weber Number....* Nucleation
* Product Concentrations *ll Product Concentrations*Fluid Density il iiii
Since jreaction is much less than jdiff, this rod, at least, was grown in the kinetically-limitedregime (as the authors claim). Boman [18] also grew boron rods in the kinetically-limited regime, not-ing the laser flux and surface temperature at which the rods became mass transport limited.
Comparable rods of Carbon were deposited by Marcus et al. 1 11]. The carbon rod shown inFigure 4 were grown at or near the mass transport limited regime, since, using the hemisphericalmodel presented above, we found that the diffusion and reaction fluxes at the rod tip are nearly equiv-alent (J,•t- 2 1012 molecules/pm2 s,j_ j,,- 0.1lxl0 12 molecules/p•m 2 s) The diffusion coefficient usedfor Acetylene was 3.4 cm2/s.
256
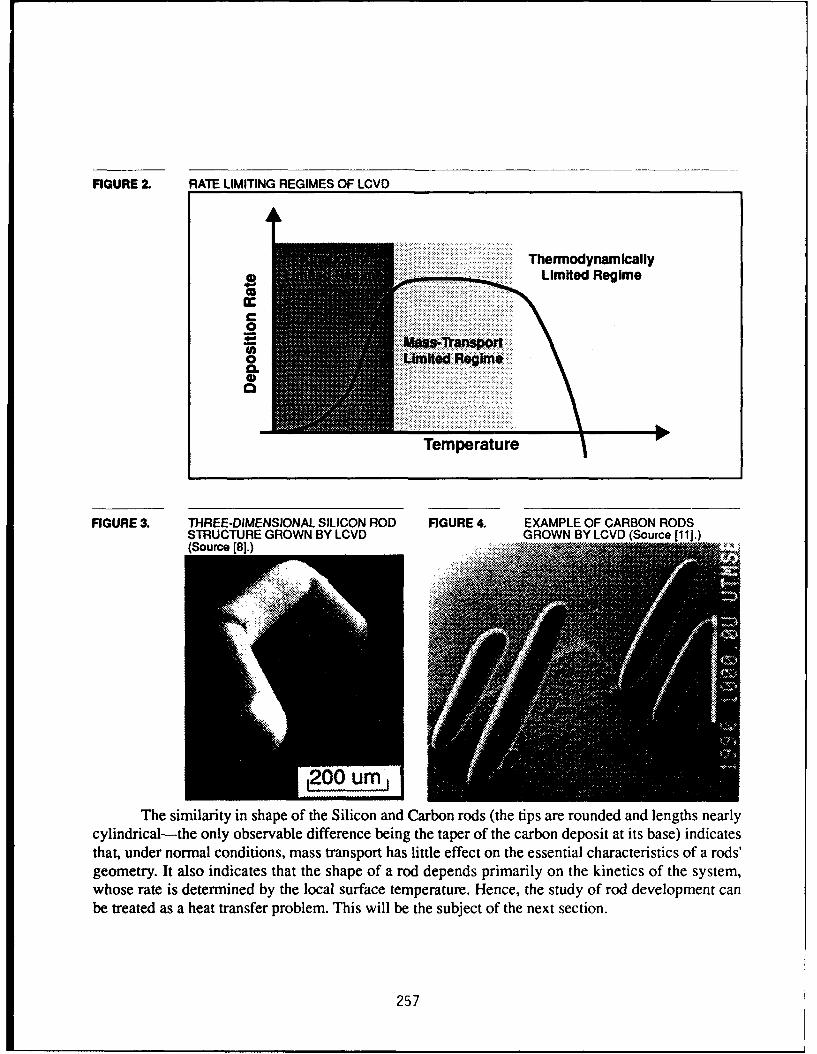
FIGURE 2. RATE LIMITING REGIMES OF LCVD
Thermodynamicallyo i Limited Regimecis4-
C0 ..4-
0iie Re ime~i
Temperature
FIGURE 3. THREE-DIMENSIONAL SILICON ROD FIGURE 4. EXAMPLE OF CARBON RODSSTRUCTURE GROWN BY LCVD GROWN BY LCVD (Source [11].)(Source [8].)
,200 umn,The similarity in shape of the Silicon and Carbon rods (the tips are rounded and lengths nearly
cylindrical-the only observable difference being the taper of the carbon deposit at its base) indicatesthat, under normal conditions, mass transport has little effect on the essential characteristics of a rods'geometry. It also indicates that the shape of a rod depends primarily on the kinetics of the system,whose rate is determined by the local surface temperature. Hence, the study of rod development canbe treated as a heat transfer problem. This will be the subject of the next section.
257
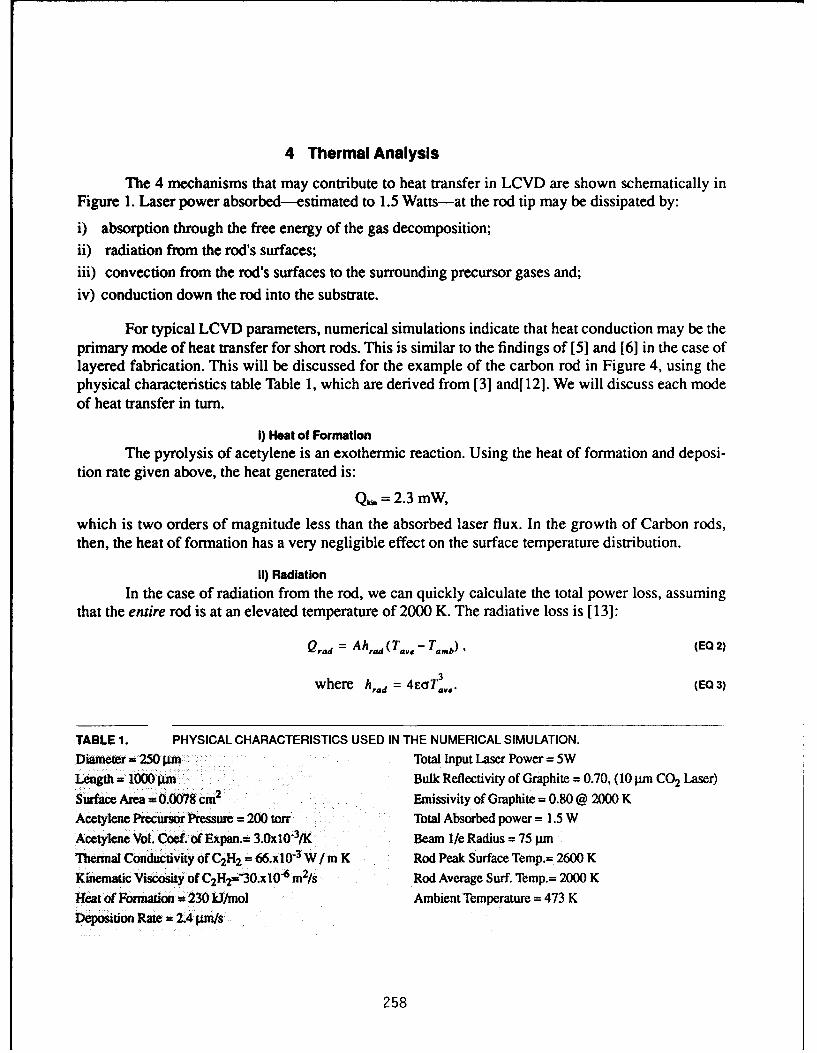
4 Thermal Analysis
The 4 mechanisms that may contribute to heat transfer in LCVD are shown schematically inFigure 1. Laser power absorbed-estimated to 1.5 Watts-at the rod tip may be dissipated by:
i) absorption through the free energy of the gas decomposition;ii) radiation from the rod's surfaces;
iii) convection from the rod's surfaces to the surrounding precursor gases and;iv) conduction down the rod into the substrate.
For typical LCVD parameters, numerical simulations indicate that heat conduction may be theprimary mode of heat transfer for short rods. This is similar to the findings of [5] and [6] in the case oflayered fabrication. This will be discussed for the example of the carbon rod in Figure 4, using thephysical characteristics table Table 1, which are derived from [3] and[ 121. We will discuss each modeof heat transfer in turn.
1) Heat of FormationThe pyrolysis of acetylene is an exothermic reaction. Using the heat of formation and deposi-
tion rate given above, the heat generated is:
Qi. = 2.3 mW,
which is two orders of magnitude less than the absorbed laser flux. In the growth of Carbon rods,then, the heat of formation has a very negligible effect on the surface temperature distribution.
il) RadiationIn the case of radiation from the rod, we can quickly calculate the total power loss, assuming
that the entire rod is at an elevated temperature of 2000 K. The radiative loss is [13]:
Qrad = Ahad (Ta, - Tamb) (EQ 2)3
where h,,d = 4eaT,,,- (EQ 3)
TABLE 1. PHYSICAL CHARACTERISTICS USED IN THE NUMERICAL SIMULATION.Diameter = 250 pm Total Input Laser Power = 5WLength = 1000 gim Bulk Reflectivity of Graphite = 0.70, (10 PM CO2 Laser)Surface Area f 0.0078 cm2 Emissivity of Graphite = 0.80 @ 2000 KAcetylene Precursor Pressure = 200 torr Total Absorbed power = 1.5 WAcetylene Vol. Coef. of Expan.= 3.0xl0 3/K Beam l/e Radius = 75 PmThermal Conductivity of C2H2 = 66.xlO 3 W/ m K Rod Peak Surface Temp.= 2600 KKinematic Viscosity of C2H2fi30.xl0-6 m2/s Rod Average Surf. Temp.= 2000 KHeat of Formation u 230 ki/mol Ambient Temperature = 473 KDeposition Rate = 2.4 pm/s
258
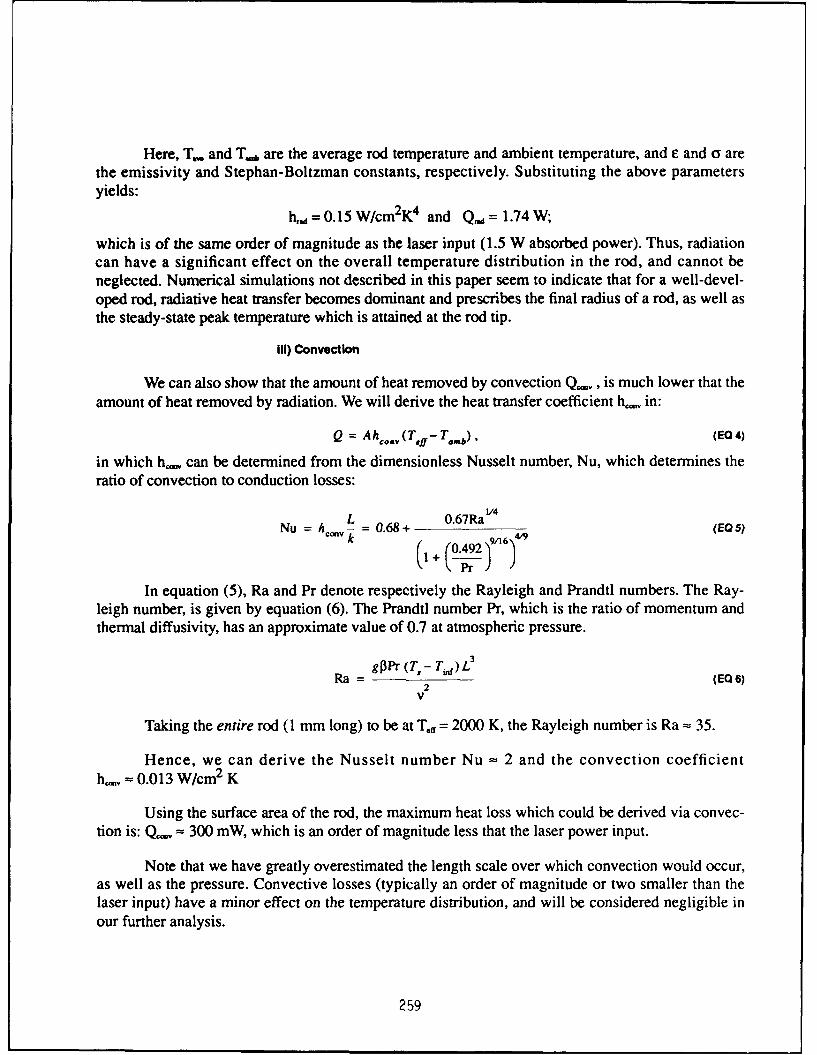
Here, T,. and T, are the average rod temperature and ambient temperature, and e and Y arethe emissivity and Stephan-Boltzman constants, respectively. Substituting the above parametersyields:
h.=0.15 W/cm2K4 and Q, = 1.74 W;
which is of the same order of magnitude as the laser input (1.5 W absorbed power). Thus, radiationcan have a significant effect on the overall temperature distribution in the rod, and cannot beneglected. Numerical simulations not described in this paper seem to indicate that for a well-devel-oped rod, radiative heat transfer becomes dominant and prescribes the final radius of a rod, as well asthe steady-state peak temperature which is attained at the rod tip.
III) Convection
We can also show that the amount of heat removed by convection Q,,. , is much lower that theamount of heat removed by radiation. We will derive the heat transfer coefficient h,,., in:
Q = Ah,...( - a.b) , (EO 4)
in which h,• can be determined from the dimensionless Nusselt number, Nu, which determines theratio of convection to conduction losses:
Nu = h L = 0.68 -V (EQ 5)
Pr ))In equation (5), Ra and Pr denote respectively the Rayleigh and Prandtl numbers. The Ray-
leigh number, is given by equation (6). The Prandtl number Pr, which is the ratio of momentum andthermal diffusivity, has an approximate value of 0.7 at atmospheric pressure.
gpPr (T",- T•) L
Ra = (EQ 6)2
v
Taking the entire rod (1 mm long) to be at Tff = 2000 K, the Rayleigh number is Ra = 35.
Hence, we can derive the Nusselt number Nu = 2 and the convection coefficienth., = 0.013 W/cm2 K
Using the surface area of the rod, the maximum heat loss which could be derived via convec-tion is: Q,, = 300 mW, which is an order of magnitude less that the laser power input.
Note that we have greatly overestimated the length scale over which convection would occur,as well as the pressure. Convective losses (typically an order of magnitude or two smaller than thelaser input) have a minor effect on the temperature distribution, and will be considered negligible inour further analysis.
259
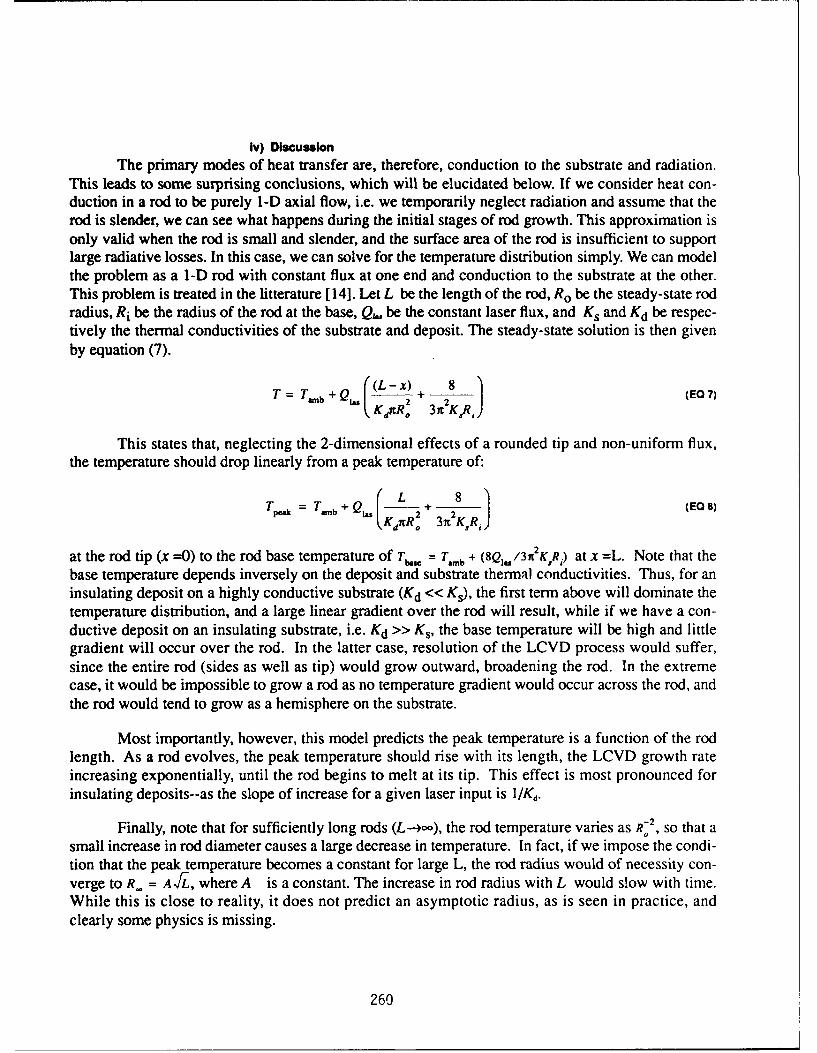
Iv) DiscussionThe primary modes of heat transfer are, therefore, conduction to the substrate and radiation.
This leads to some surprising conclusions, which will be elucidated below. If we consider heat con-duction in a rod to be purely 1-D axial flow, i.e. we temporarily neglect radiation and assume that therod is slender, we can see what happens during the initial stages of rod growth. This approximation isonly valid when the rod is small and slender, and the surface area of the rod is insufficient to supportlarge radiative losses. In this case, we can solve for the temperature distribution simply. We can modelthe problem as a 1-D rod with constant flux at one end and conduction to the substrate at the other.This problem is treated in the litterature [141. Let L be the length of the rod, Ro be the steady-state rodradius, Ri be the radius of the rod at the base, Q, be the constant laser flux, and Ks and Kd be respec-tively the thermal conductivities of the substrate and deposit. The steady-state solution is then givenby equation (7).
T(L- x) 8 _ 7)
T=T~b + K 2 2 (E7
4ixR. 31c KRj
This states that, neglecting the 2-dimensional effects of a rounded tip and non-uniform flux,the temperature should drop linearly from a peak temperature of:
=T + 28 (EQ 8)
at the rod tip (x --0) to the rod base temperature of Tbm = T b + (8Q,./3n 2K5 R,) at x =L. Note that thebase temperature depends inversely on the deposit and substrate thermal conductivities. Thus, for aninsulating deposit on a highly conductive substrate (Kd << Ks), the first term above will dominate thetemperature distribution, and a large linear gradient over the rod will result, while if we have a con-ductive deposit on an insulating substrate, i.e. Kd >> Ks, the base temperature will be high and littlegradient will occur over the rod. In the latter case, resolution of the LCVD process would suffer,since the entire rod (sides as well as tip) would grow outward, broadening the rod. In the extremecase, it would be impossible to grow a rod as no temperature gradient would occur across the rod, andthe rod would tend to grow as a hemisphere on the substrate.
Most importantly, however, this model predicts the peak temperature is a function of the rodlength. As a rod evolves, the peak temperature should rise with its length, the LCVD growth rateincreasing exponentially, until the rod begins to melt at its tip. This effect is most pronounced forinsulating deposits--as the slope of increase for a given laser input is l/Kd.
Finally, note that for sufficiently long rods (L----*), the rod temperature varies as R 2 , so that asmall increase in rod diameter causes a large decrease in temperature. In fact, if we impose the condi-tion that the peak temperature becomes a constant for large L, the rod radius would of necessity con-verge to R_ = AfL, where A is a constant. The increase in rod radius with L would s!ow with time.While this is close to reality, it does not predict an asymptotic radius, as is seen in practice, andclearly some physics is missing.
260
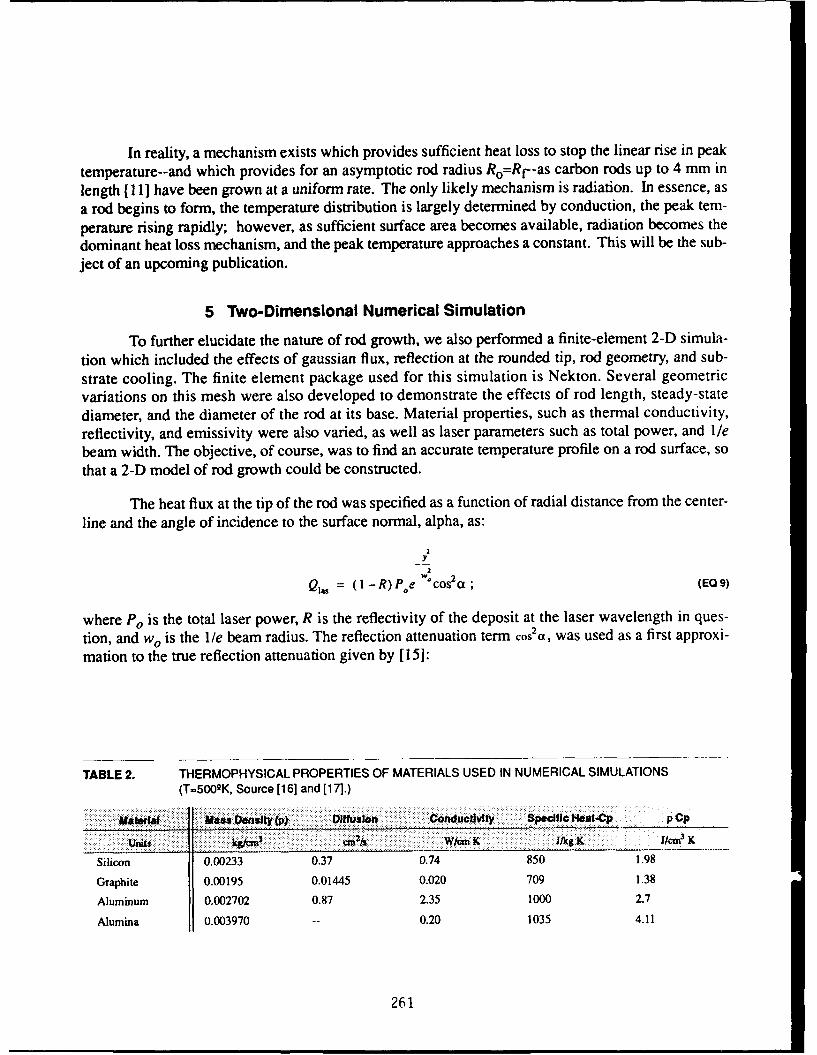
In reality, a mechanism exists which provides sufficient heat loss to stop the linear rise in peaktemperature--and which provides for an asymptotic rod radius Ro=Rf--as carbon rods up to 4 mm inlength [( I I have been grown at a uniform rate. The only likely mechanism is radiation. In essence, asa rod begins to form, the temperature distribution is largely determined by conduction, the peak tem-
perature rising rapidly; however, as sufficient surface area becomes available, radiation becomes thedominant heat loss mechanism, and the peak temperature approaches a constant. This will be the sub-ject of an upcoming publication.
5 Two-Dimensional Numerical Simulation
To further elucidate the nature of rod growth, we also performed a finite-element 2-D simula-tion which included the effects of gaussian flux, reflection at the rounded tip, rod geometry, and sub-strate cooling. The finite element package used for this simulation is Nekton. Several geometricvariations on this mesh were also developed to demonstrate the effects of rod length, steady-statediameter, and the diameter of the rod at its base. Material properties, such as thermal conductivity,reflectivity, and emissivity were also varied, as well as laser parameters such as total power, and Ilebeam width. The objective, of course, was to find an accurate temperature profile on a rod surface, so
that a 2-D model of rod growth could be constructed.
The heat flux at the tip of the rod was specified as a function of radial distance from the center-line and the angle of incidence to the surface normal, alpha, as:
2Y
W2
Q1., = (1 - R) Poe °cos2 a; (EO 9)
where P0 is the total laser power, R is the reflectivity of the deposit at the laser wavelength in ques-tion, and wo is the lie beam radius. The reflection attenuation term cos2 a, was used as a first approxi-mation to the true reflection attenuation given by [ 151:
TABLE 2. THERMOPHYSICAL PROPERTIES OF MATERIALS USED IN NUMERICAL SIMULATIONS(T=5009K, Source [16] and [17].)
Mafeda Mass Density (p) Diffusion ConduefivIly Specific Heat-Cp P CP
Units Wzcni -CM21 W-c K/n IkK 3 y
Silicon 0.00233 0.37 0.74 850 1.98
Graphite 0.00195 0.01445 0.020 709 1.38
Aluminum 0.002702 0.87 2.35 1000 2.7
Alumina 0.003970 -- 0.20 1035 4.11
261
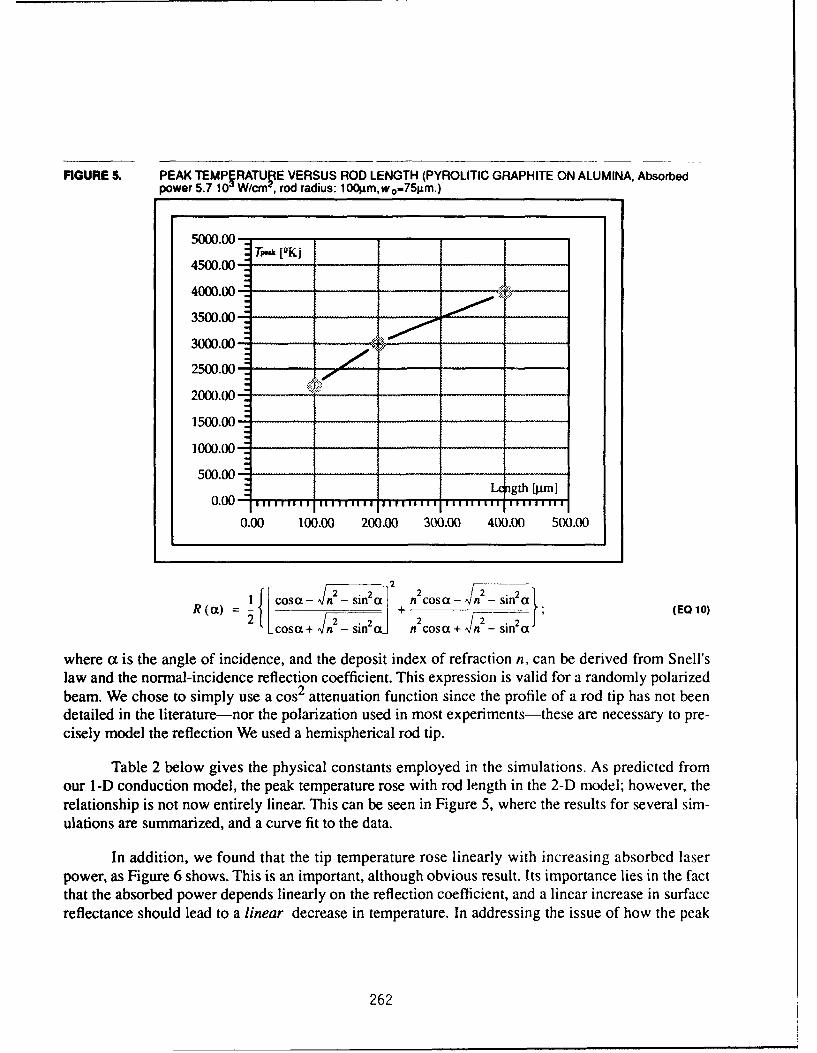
FIGURE S. PEAK TEMPERATURE VERSUS ROD LENGTH (PYROLITIC GRAPHITE ON ALUMINA, Absorbedpower 5.7 104 W/cm2 , rod radius: 100Lm,wo=75grm.)
5000.00-Truk [QKj
4500.00-
4000.00
35W0.00
2000.00
1500.00 -
1000.001
500.00 -
0.00. 1. 1 ýgth [jim]0.00- IIIIIIII 4II II I IIII III 1IIII-1 iI III loggallll
0.00 100.00 200.00 300.00 400.00 500.00
-21 - -sn2 2 na
2 (a) = -- F (EQ 10)2RcosL Jn - sin 20i n 2 cos a+ Jn2 -sin a
where ac is the angle of incidence, and the deposit index of refraction n, can be derived from Snell'slaw and the normal-incidence reflection coefficient. This expression is valid for a randomly polarizedbeam. We chose to simply use a cos2 attenuation function since the profile of a rod tip has not beendetailed in the literature-nor the polarization used in most experiments-these are necessary to pre-cisely model the reflection We used a hemispherical rod tip.
Table 2 below gives the physical constants employed in the simulations. As predicted fromour 1-D conduction model, the peak temperature rose with rod length in the 2-D model; however, therelationship is not now entirely linear. This can be seen in Figure 5, where the results for several sim-ulations are summarized, and a curve fit to the data.
In addition, we found that the tip temperature rose linearly with increasing absorbed laserpower, as Figure 6 shows. This is an important, although obvious result. Its importance lies in the factthat the absorbed power depends linearly on the reflection coefficient, and a linear increase in surfacereflectance should lead to a linear decrease in temperature. In addressing the issue of how the peak
262
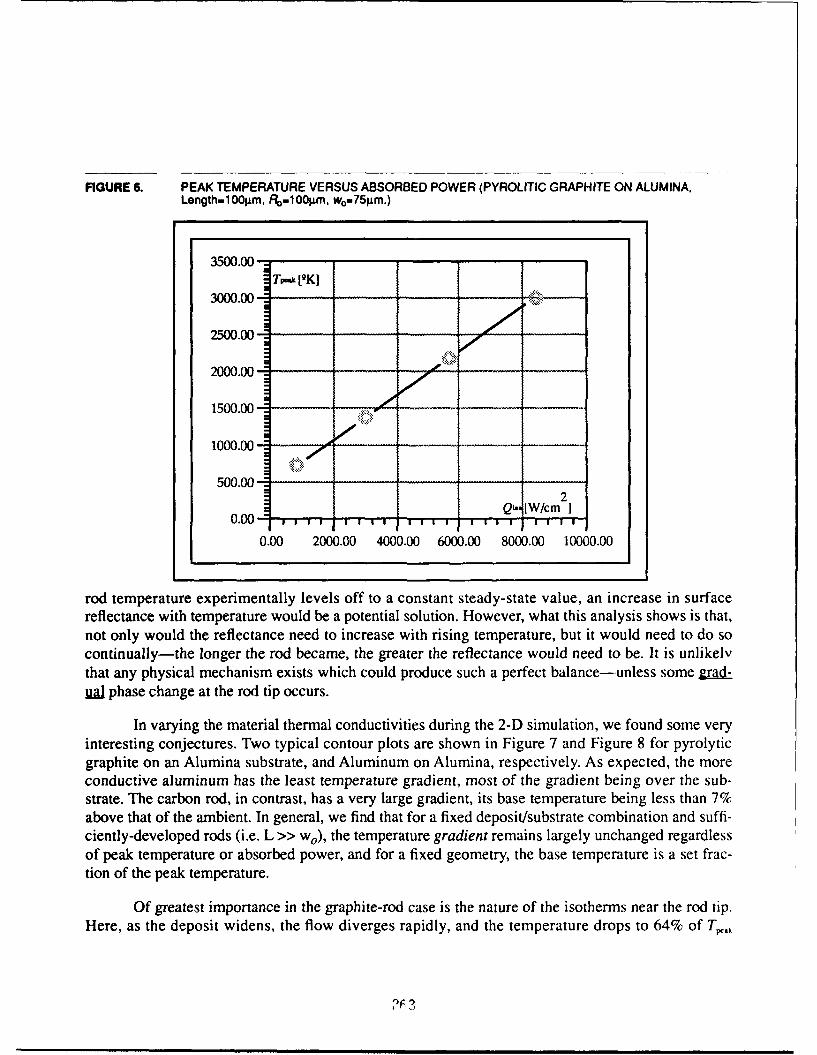
FIGURE 6. PEAK TEMPERATURE VERSUS ABSORBED POWER (PYROLITIC GRAPHITE ON ALUMINA.Length-100gm. FR=1001gm. wo=751im.)
3500.00-
300.00T-k rK]
2500.00-
2 0 0 0 .0 0 - ------ --- - .... . -- ---------
1 5 0 0 .00o o - --- - ............................... .
10 0 0 .0 0 - . --. --.--
500.00-2
0Q-, [W/cm 10.00 1 1 1 1 1 1
0.00 2000.00 4000.00 6000.00 8000.00 10000.00
rod temperature experimentally levels off to a constant steady-state value, an increase in surfacereflectance with temperature would be a potential solution. However, what this analysis shows is that,not only would the reflectance need to increase with rising temperature, but it would need to do socontinually-the longer the rod became, the greater the reflectance would need to be. It is unlikelythat any physical mechanism exists which could produce such a perfect balance--unless some grndual phase change at the rod tip occurs.
In varying the material thermal conductivities during the 2-D simulation, we found some veryinteresting conjectures. Two typical contour plots are shown in Figure 7 and Figure 8 for pyrolyticgraphite on an Alumina substrate, and Aluminum on Alumina, respectively. As expected, the moreconductive aluminum has the least temperature gradient, most of the gradient being over the sub-strate. The carbon rod, in contrast, has a very large gradient, its base temperature being less than 7%above that of the ambient. In general, we find that for a fixed deposit/substrate combination and suffi-ciently-developed rods (i.e. L >> wo), the temperature gradient remains largely unchanged regardlessof peak temperature or absorbed power, and for a fixed geometry, the base temperature is a set frac-tion of the peak temperature.
Of greatest importance in the graphite-rod case is the nature of the isotherms near the rod tip.Here, as the deposit widens, the flow diverges rapidly, and the temperature drops to 64% of Tp,.
263
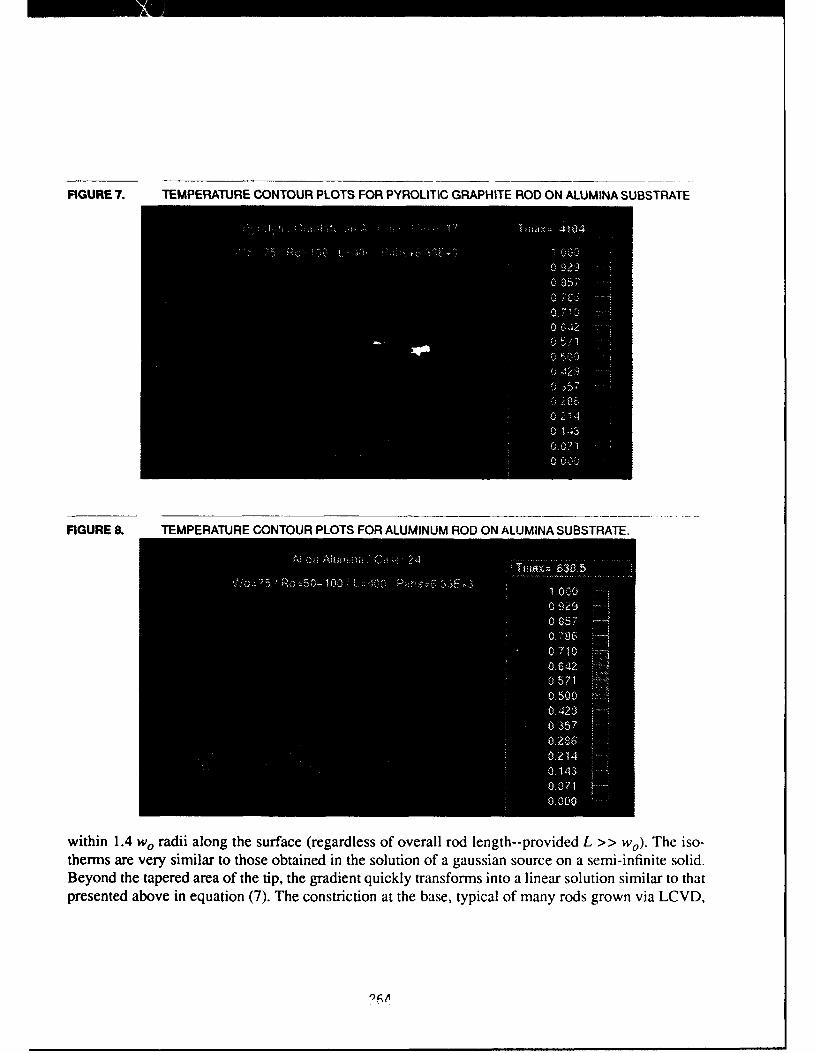
FIGURE 7. TEMPERATURE CONTOUR PLOTS FOR PYROLITIC GRAPHITE ROD ON ALUMINA SUBSTRATE
FIGURE 8.TEMPERATURE CONTOUR PLOTS FOR ALUMINUM ROD ON ALUMINA SUBSTRATE.
0 8
withi1.4 rdiiaonghesrfac ( s o, oeral rd lvidd L
,herareverysimil -- tothos obtain tutono sianas
presented4 abov rdin eqationg()hosrcina the bufc rgrlsfoeasero typca of manyrovddsL> grown via LCVD,tbs
Beon te aerd re o heti, hegaden qicl tanfomsitoa ina soluto iia ota
C, '4
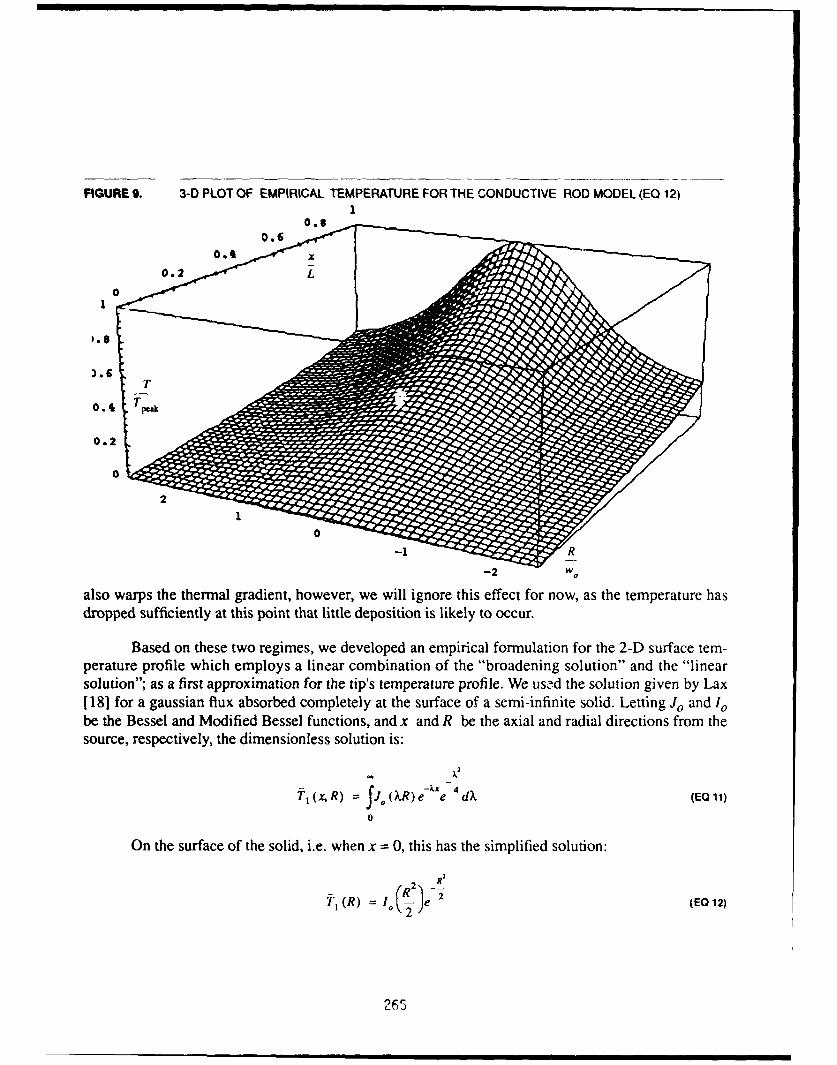
FIGURE 9. 3-D PLOT OF EMPIRICAL TEMPERATURE FOR THE CONDUCTIVE ROD MODEL (EQ 12)1
0.2 L
0
3.8
T
0.2
01
oW
also warps the thermal gradient, however, we will ignore this effect for now, as the temperature hasdropped sufficiently at this point that little deposition is likely to occur.
Based on these two regimes, we developed an empirical formulation for the 2-D3 surface tem-perature profile which employs a linear combination of the "broadening solution" and the "linearsolution"; as a first approximation for the tip's temperature profile. We used the solution given by Lax118] for a gaussian flux absorbed completely at the surface of a semi-infinite solid. Letting J0 and Iobe the Bessel and Modified Bessel functions, and x and R be the axial and radial directions from thesource, respectively, the dimensionless solution is:
t,( (x, R) = Jo (XR) e-'xe 4 dX (EQ 11)
0
On the surface of the solid, i.e. when x = 0, this has the simplified solution:
2 R2
"1(R) = Io -22 (EQ 12)
265
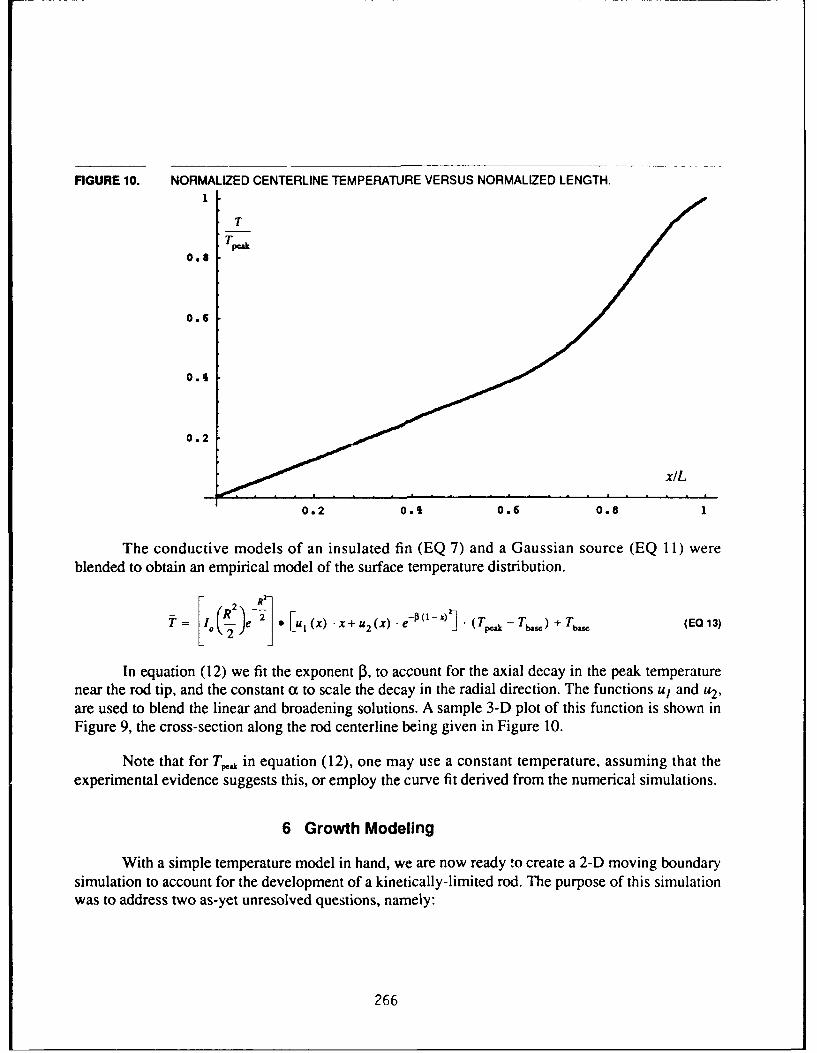
FIGURE 10. NORMALIZED CENTERLINE TEMPERATURE VERSUS NORMALIZED LENGTH.1
T
0.8
0.6
0.4
0.2
x/L
0.2 0A4 0.6 0.8 1
The conductive models of an insulated fin (EQ 7) and a Gaussian source (EQ 11) wereblended to obtain an empirical model of the surface temperature distribution.
R )e- u(x) x+u 2 (x) .e(T -T) + T (EQ 13)
In equation (12) we fit the exponent f0, to account for the axial decay in the peak temperaturenear the rod tip, and the constant a to scale the decay in the radial direction. The functions u1 and u2,are used to blend the linear and broadening solutions. A sample 3-D plot of this function is shown inFigure 9, the cross-section along the rod centerline being given in Figure 10.
Note that for T,, in equation (12), one may use a constant temperature, assuming that theexperimental evidence suggests this, or employ the curve fit derived from the numerical simulations.
6 Growth Modeling
With a simple temperature model in hand, we are now ready !o create a 2-D moving boundarysimulation to account for the development of a kinetically-limited rod. The purpose of this simulationwas to address two as-yet unresolved questions, namely:
266
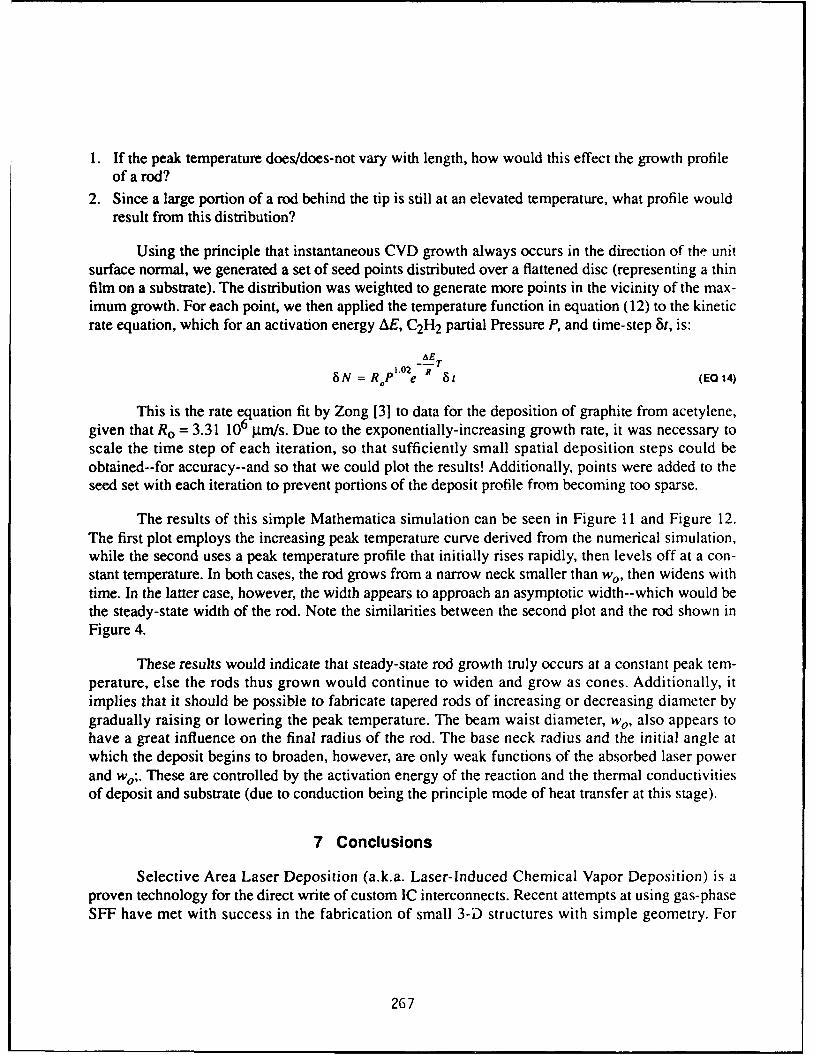
1. If the peak temperature does/does-not vary with length, how would this effect the growth profileof a rod?
2. Since a large portion of a rod behind the tip is still at an elevated temperature, what profile wouldresult from this distribution?
Using the principle that instantaneous CVD growth always occurs in the direction of the unitsurface normal, we generated a set of seed points distributed over a flattened disc (representing a thinfilm on a substrate). The distribution was weighted to generate more points in the vicinity of the max-imum growth. For each point, we then applied the temperature function in equation (12) to the kineticrate equation, which for an activation energy AE, C2H2 partial Pressure P, and time-step 8r, is:
_AE T
BN = RP 1.2e R8 (EQ 14)
This is the rate equation fit by Zong [3] to data for the deposition of graphite from acetylene,given that Ro = 3.31 106 Itm/s. Due to the exponentially-increasing growth rate, it was necessary toscale the time step of each iteration, so that sufficiently small spatial deposition steps could beobtained--for accuracy--and so that we could plot the results! Additionally, points were added to theseed set with each iteration to prevent portions of the deposit profile from becoming too sparse.
The results of this simple Mathematica simulation can be seen in Figure 11 and Figure 12.The first plot employs the increasing peak temperature curve derived from the numerical simulation,while the second uses a peak temperature profile that initially rises rapidly, then levels off at a con-stant temperature. In both cases, the rod grows from a narrow neck smaller than wo, then widens withtime. In the latter case, however, the width appears to approach an asymptotic width--which would bethe steady-state width of the rod. Note the similarities between the second plot and the rod shown inFigure 4.
These results would indicate that steady-state rod growth truly occurs at a constant peak tem-perature, else the rods thus grown would continue to widen and grow as cones. Additionally, itimplies that it should be possible to fabricate tapered rods of increasing or decreasing diameter bygradually raising or lowering the peak temperature. The beam waist diameter, wo, also appears tohave a great influence on the final radius of the rod. The base neck radius and the initial angle atwhich the deposit begins to broaden, however, are only weak functions of the absorbed laser powerand wo;. These are controlled by the activation energy of the reaction and the thermal conductivitiesof deposit and substrate (due to conduction being the principle mode of heat transfer at this stage).
7 Conclusions
Selective Area Laser Deposition (a.k.a. Laser-Induced Chemical Vapor Deposition) is aproven technology for the direct write of custom IC interconnects. Recent attempts at using gas-phaseSFF have met with success in the fabrication of small 3-D structures with simple geometry. For
267
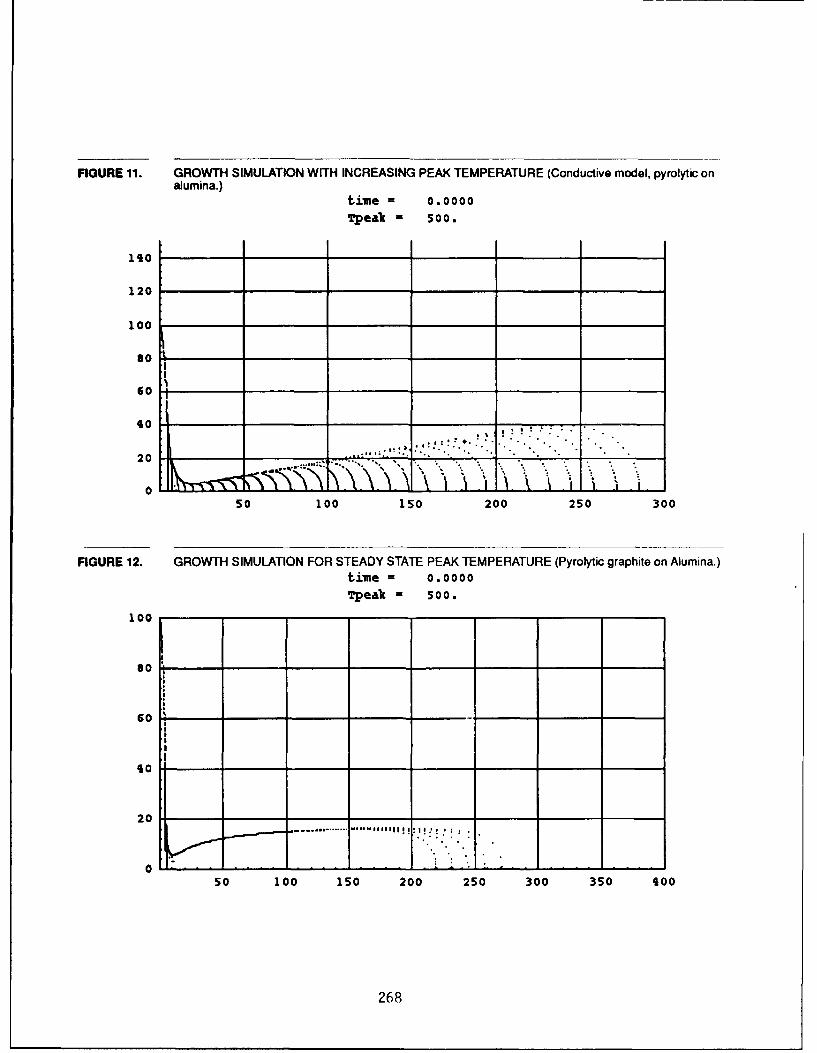
FIGURE 11. GROWTH SIMULATION WITH INCREASING PEAK TEMPERATURE (Conductive model, pyrolytic onalumina.)
ti.le = 0.0000
Tpea: • 500.
ISO
120
100
so _ _
60 _ _ _ _ _
01 *o ,I
50 100 150 200 250 300
FIGURE 12. GROWTH SIMULATION FOR STEADY STATE PEAK TEMPERATURE (Pyrolytic graphite on Alumina.)time = 0.0000
Tpeak = 500.
100
80
so
20
20
60 =- ---*-
50 100 150 200 250 300 350 t00
268
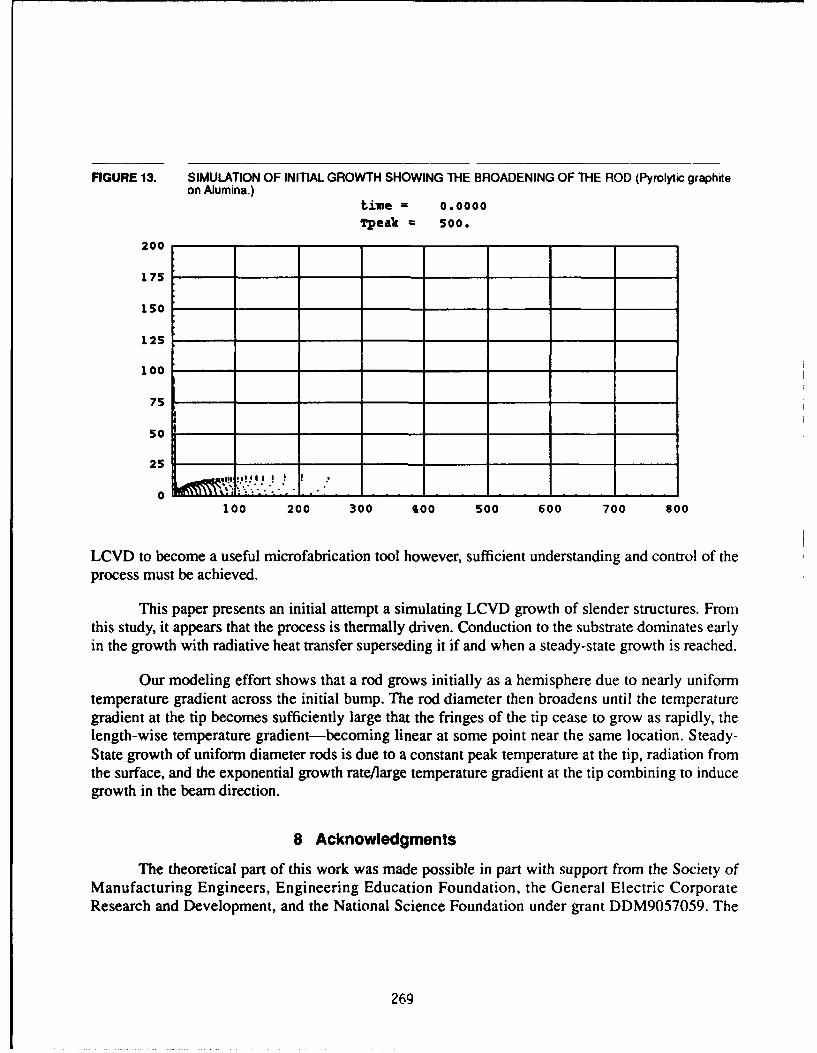
FIGURE 13. SIMULATION OF INITIAL GROWTH SHOWING THE BROADENING OF THE ROD (Pyrolytic graphiteon Alumina.)
time = 0.0000T5peak 50o.
200
175
150
125
100
75
50
25
0 l | - - -
100 200 300 S00 500 600 700 800
LCVD to become a useful microfabrication tool however, sufficient understanding and control of theprocess must be achieved.
This paper presents an initial attempt a simulating LCVD growth of slender structures. Fromthis study, it appears that the process is thermally driven. Conduction to the substrate dominates earlyin the growth with radiative heat transfer superseding it if and when a steady-state growth is reached.
Our modeling effort shows that a rod grows initially as a hemisphere due to nearly uniformtemperature gradient across the initial bump. The rod diameter then broadens until the temperaturegradient at the tip becomes sufficiently large that the fringes of the tip cease to grow as rapidly, thelength-wise temperature gradient-becoming linear at some point near the same location. Steady-State growth of uniform diameter rods is due to a constant peak temperature at the tip, radiation fromthe surface, and the exponential growth rate/large temperature gradient at the tip combining to inducegrowth in the beam direction.
8 Acknowledgments
The theoretical part of this work was made possible in part with support from the Society ofManufacturing Engineers, Engineering Education Foundation, the General Electric CorporateResearch and Development, and the National Science Foundation under grant DDM9057059. The
269
numerical simulation was performed with the NEKTONTM thermal analysis software from the NEK-TONICS Corporation. Experimental support is provided by an equipment grant from the GeneralElectric Corporation, a National Science Foundation Small Grant for Exploratory Research (ECS9314071). The clean room laboratory facilities were provided by the Center for Integrated Electronicsat Rensselaer. All contributors to the Rensselaer Freeform Microfabrication Project are gratefullyacknowledged.
9 References
I11 Leyendecker, G., Bauerle, D. , Geittner, P. and Lydtin, H. ,"Laser Induced Chemical VaporDeposition of Carbon," Auplied Physics Letters Vol. 39, p. 921 (1981).
121 Bauerle, D., "Laser-Induced Chemical Vapor Deposition," Laser Processing and Diagnos-tics, Springer Series in Chemical Physics 39, (1984) pp. 166-181.
131 Zong, G. "Solid Freeform Fabrication Using Gas-Phase Selective Area Laser Deposition,"Ph.D. Thesis, U. Texas at Austin (1991)
[41 Bloomstein, T. M., Ehrlich, D. J., "Stereo Laser Micromachining of Silicon," Appl. Phys, Le•-,61, (6), (Aug. 1992), pp. 708-710.
151 Jacquot, Y. , Zong, G., and Marcus, H.L., "Modeling of Selective Area Laser Deposition forSolid Freeform Fabrication," Proceedings of the Solid Freeform Fabrication Symposium,Edited by J.J. Beaman, H.L Marcus, D.L. Bourell, and J.W. Barlow, Austin, Texas, August 6-8, 1990, pp. 74-82.
[61 Zong, G., and Marcus, H.L., "Moving Boundary Transport Phenomena in Selective AreaLaser Deposition Process," Proceedings of the Solid Freeform Fabrication Symposium,Edited by H.L. Marcus, J.J. Beaman, J. W. Barlow, and D.L. Bourell, Austin, Texas, August12-14, 1991, pp. 279-287.
[71 Zeiger, H. J., Ehrlich, D. J., Tsao, J. Y, "Transport and Kinetics," Laser Microfabrication. ThinFilm Processes and Lithography, ed. Ehrlich, D. J., Tsao, J. T., Academic Press, 1989, pp.299-329
181 M. Boman, H. Westburg, "Helical Microstructures Grown by Laser-Assisted Chemical VaporDeposition," Proc. Micro Electro Mechanical Systems (Feb 1992), p. 162-167.
191 Zeiger, H. J., Ehrlich, D. J., Tsao, J. Y, "Transport and Kinetics," Laser Microfabrication, ThinFilm Processes and Lithography ed. Ehrlich, D. J., Tsao, J. T., Academic Press, 1989, pp.299-329
1101 Rohsenow, W. and Choi, H., "Heat, Mass, and Momentum Transfer", p. 383, Prentice Hall (1964)[ill Zong, G. , Thompkins, J.V., Thissel, W.R. , Sajot, E. , and Marcus, H.L., "Processing Prob-
lems Aisociated with Gas-Phase Solid Freeform Fabrication Using Pyrolytic Selective AreaLaser Depoýatiw,," Proceedings of the Solid Freeform Fabrication Symposium, Edited byH.L. Marcus, J.J. Beaman, J. W. Barlow, and D.L. Bourell, Austin, Texas, August 12-14,1991, pp. 271-278.
[121 Incropera, F. , and DeWitt, D., "Introduction to Heat Transfer,", John Wiley and Sons, 1990,Appendix A.
[131 Kern, D. and Kraus, A, "Extended Surface Heat Transfer," McGraw-Hill, 1972, p. 44.
2 70
[141 Carslaw, J. and Yeager, J., "Conduction of Heat in Solids," 2nd edition, Clarendon Press,Oxford, 1959, p. 125.
115 Dichburn, R.W., Light, Dover, 1991.[161 Toukoulin, Y.S. and Ho, C.Y. Eds."Thermophysical Properties," Thermophysical Properties
Research Center, Purdue University, ISI/Plenum New York, 1972, Vol. 1- 13.
[171 CRC Handbook of Chemistry and Physics, 72nd Edition, 1991/1992.[181 Lax, M., "Temperature Rise Induced by a Laser Beam II, Ti.e Non-Linear Case," Applied
Physics Letters, Vol. 33, #8, 15 Oct. 1978, pp. 786-788.[191 NEKTON'M user's manual, Nektonics Corporation.
270a
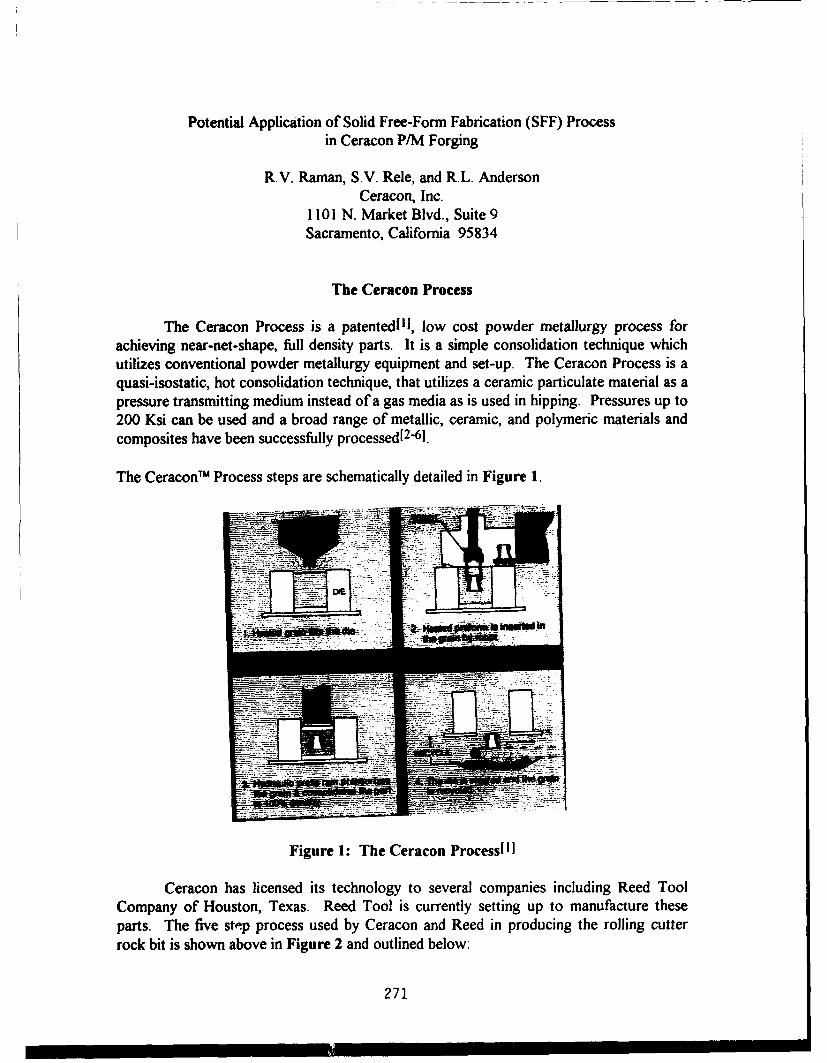
Potential Application of Solid Free-Form Fabrication (SFF) Processin Ceracon P/M Forging
R.V. Raman, S.V. Rele, and R.L. AndersonCeracon, Inc.
1101 N. Market Blvd., Suite 9Sacramento, California 95834
The Ceracon Process
The Ceracon Process is a patentedl'l, low cost powder metallurgy process forachieving near-net-shape, full density parts. It is a simple consolidation technique whichutilizes conventional powder metallurgy equipment and set-up. The Ceracon Process is aquasi-isostatic, hot consolidation technique, that utilizes a ceramic particulate material as apressure transmitting medium instead of a gas media as is used in hipping. Pressures up to200 Ksi can be used and a broad range of metallic, ceramic, and polymeric materials andcomposites have been successfully processed[2"61.
The CeraconTM Process steps are schematically detailed in Figure 1.
Figure 1: The Ceracon Process[l]
Ceracon has licensed its technology to several companies including Reed ToolCompany of Houston, Texas. Reed Tool is currently setting up to manufacture theseparts. The five ste•p process used by Ceracon and Reed in producing the rolling cutterrock bit is shown above in Figure 2 and outlined below:
271
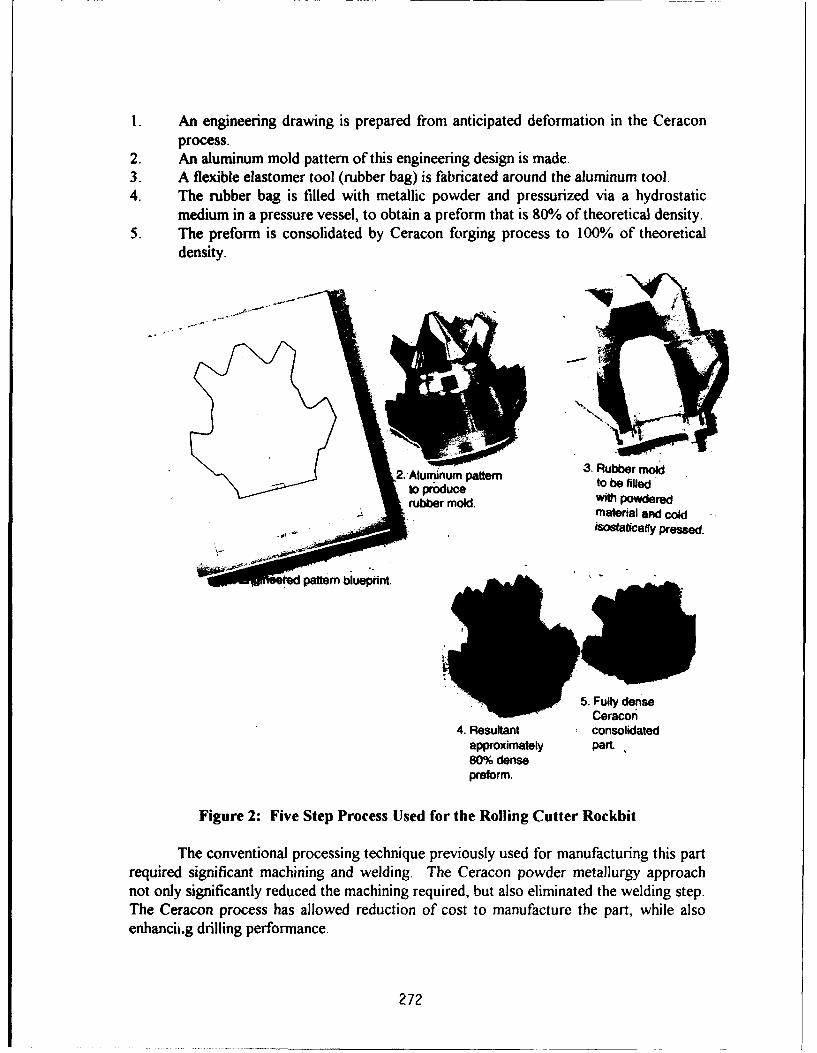
1. An engineering drawing is prepared from anticipated deformation in the Ceraconprocess.
2. An aluminum mold pattern of this engineering design is made.3. A flexible elastomer tool (rubber bag) is fabricated around the aluminum tool.4. The rubber bag is filled with metallic powder and pressurized via a hydrostatic
medium in a pressure vessel, to obtain a preform that is 80% of theoretical density.5. The preform is consolidated by Ceracon forging process to 100% of theoretical
density.
/I
2. Aluminum pattern 3. Rubber moldto produce to be filledSrubber mold. with powderedmaterial anKd cold4osoaticamfy pressed.
etdpattern blueprint.
5. Fully denseCeracon
4. Resultant consolidated
approximately parL
80% densepreform.
Figure 2: Five Step Process Used for the Rolling Cutter Rockbit
The conventional processing technique previously used for manufacturing this partrequired significant machining and welding. The Ceracon powder metallurgy approachnot only significantly reduced the machining required, but also eliminated the welding step.The Ceracon process has allowed reduction of cost to manufacture the part, while alsoenhancing drilling performance.
272
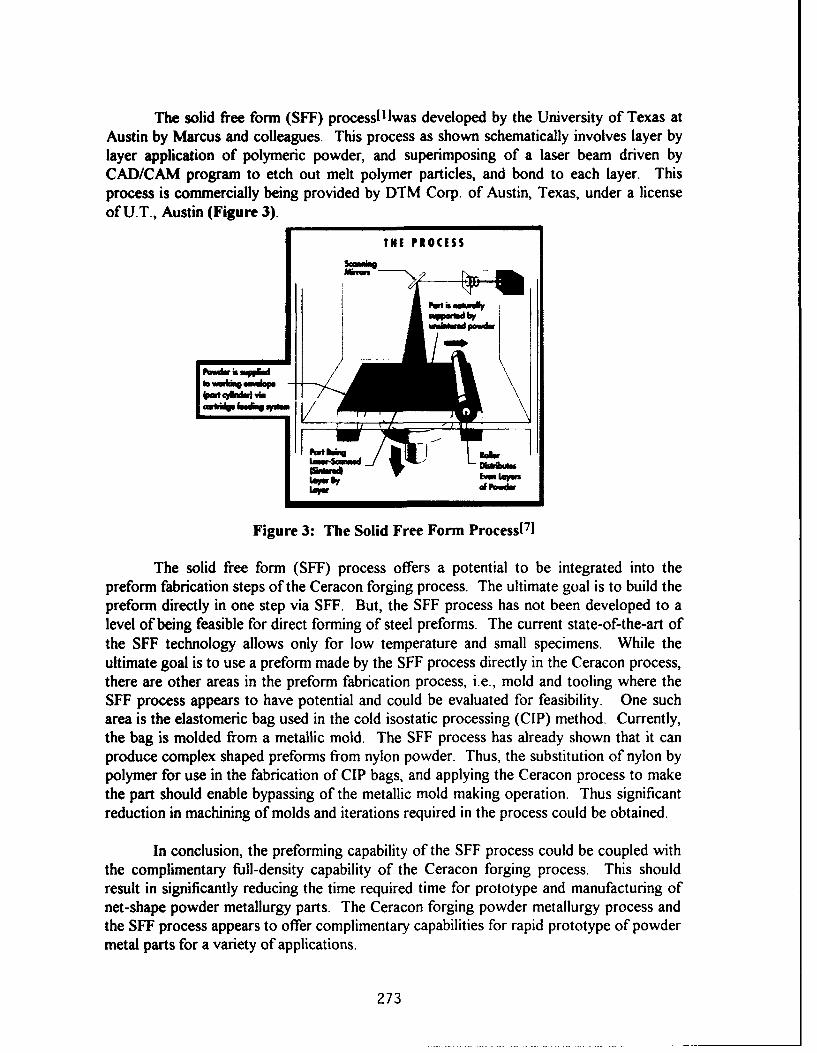
The solid free form (SFF) processillwas developed by the University of Texas atAustin by Marcus and colleagues. This process as shown schematically involves layer bylayer application of polymeric powder, and superimposing of a laser beam driven byCAD/CAM program to etch out melt polymer particles, and bond to each layer. Thisprocess is commercially being provided by DTM Corp. of Austin, Texas, under a licenseof U.T., Austin (Figure 3).
TNE PROCESS
Pwmiw is~b
!vmimg.hp
Ws h
IVIoftPwdar
Figure 3: The Solid Free Form Process[ 71
The solid free form (SFF) process offers a potential to be integrated into thepreform fabrication steps of the Ceracon forging process. The ultimate goal is to build thepreform directly in one step via SFF. But, the SFF process has not been developed to alevel of being feasible for direct forming of steel preforms. The current state-of-the-art ofthe SFF technology allows only for low temperature and small specimens. While theultimate goal is to use a preform made by the SFF process directly in the Ceracon process,there are other areas in the preform fabrication process, i.e., mold and tooling where theSFF process appears to have potential and could be evaluated for feasibility. One sucharea is the elastomeric bag used in the cold isostatic processing (CIP) method. Currently,the bag is molded from a metallic mold. The SFF process has already shown that it canproduce complex shaped preforms from nylon powder. Thus, the substitution of nylon bypolymer for use in the fabrication of CIP bags, and applying the Ceracon process to makethe part should enable bypassing of the metallic mold making operation. Thus significantreduction in machining of molds and iterations required in the process could be obtained.
In conclusion, the preforming capability of the SFF process could be coupled withthe complimentary full-density capability of the Ceracon forging process. This shouldresult in significantly reducing the time required time for prototype and manufacturing ofnet-shape powder metallurgy parts. The Ceracon forging powder metallurgy process andthe SFF process appears to offer complimentary capabilities for rapid prototype of powdermetal parts for a variety of applications.
273
References:
1. The Ceracon Process is protected by 25 U.S. patents.
2. Oxidation Resistance of Powder Metallurgy Zirconium Aluminide Densified Usingthe Ceracon Process, R.V. Raman, S.V. Rele, and D.L. Hunn, presented at theInternational Conference & Exhibition on Powder Metallurgy & ParticulateMaterials, May 16-19, 1993.
3. A Novel Processing Route for the Fabrication of Monolithic and CompositeSilicon Nitride, R. V. Raman and S. V. Rele, Proceedings of the MRS Meeting,Vol. 289, April, 1993.
4. In-Situ Synthesis and Rapid Consolidation of MoSi2 to Full Density, R. V. Raman,S V. Rele, and M. J. Paskowitz, Journal of Metals, January, 1993
5. Advances in Full Density Consolidation of Engineered Materials, R. V. Raman,Advances in Powder Metallurgy and Particulate Materials - Vol. 2, 1992, Pages401-420
6. Powder Consolidation In The 1990's: Recent Advances at Ceracon, Inc.", PowderMetal Report, April, 1990 issue entitled, "Advances in Powder Consolidation".
7. DTM Corporation Brochure,"The SLS Process, Rapid Prototyping and TheSelective Laser Sintering Process".
274
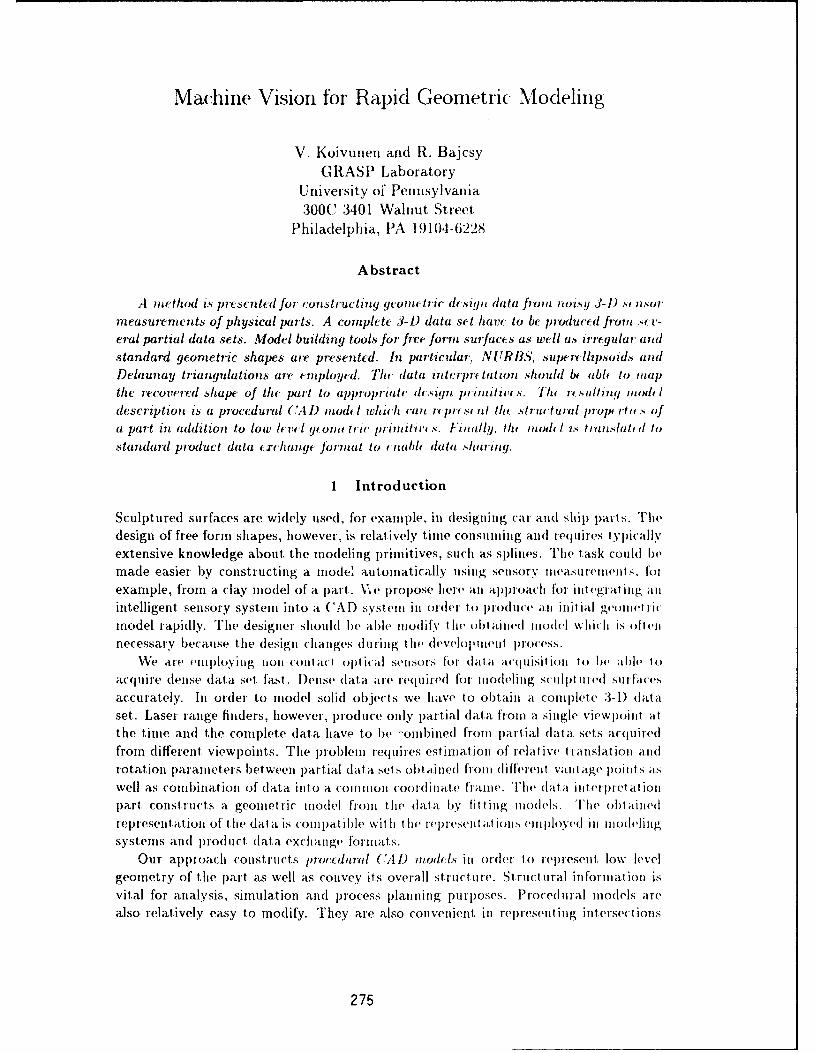
Machine Vision for Rapid Geometric Modeling
V. Koivunen and RI. Baj'csyGRASP Laboratory
University of Pennsylvania300C 3401 Walnut Street
Philadelphia, PA 19104-6228
Abstract
A ne~thod is presented for constructling gioniitric d&'tigii datai froin noisy J-I)t nsomeasurements of physical parts. A complete 3-D data set ham to be produced from s v-eral partial data sets. Model building tools for free formn surfaces as uwell as irregular armidstandard geometric shapes are presented. In particular, NUTRBS, supcrellipsoidsý andDelaunay triangulations are emnploye-d. Thc data iiiterpr( tat ion should bt abi to mapijthe recovered shape of the part to appropriate design piiiiiitiii s. Thu it-.1111 11u)(n 1 Iotdescription i's a procedural (,4 D inodel which (-ni ure i.st tit the structurail propt itl~ it f
a part in.i addition to low' level ginomiu tir priimmi'm is. Itially. III muoilf I is transaUSII d to
stnadproduct data e(rchamgf formnat to ittiblth (laa sharing.
1 Introduction
Sculptured surfaces are widely used, for examnple, inl (esigililig car and~ shill parts. Thedesign of free form shapes, however, is relatively tunie conisumning andl requires typicall *Nextensive knowledge about the modeling primitives, such as splines. The task couIld bemade easier lby constructing a miode. automnatically using senisory mieasuremnent s. foiexamp~le, from a clay model of a p~art. V,'~ e prmopose here all approach for ilil egrat iiig a;IIintelligent. sensory system inito a CAD systeml ill ordIer to produ lce alli ii ll al geol lie ri Cmodel rapidly. Thel( designer should be ab~le 1110(1 ly t lle 01)1ai ied ii iodel w I ilid Is (ill ci
necessary b~ecause the (lesigni chanlges d ui ing ti.li (levelop iiienl process.We are eiii1ploy'iiig lioli-collil ad optical senlsors for (alali a((jlisit ionl to be ab~le to
acquire dense (data set. fast. lDeiise (lat~a are required for Iliodlefliig sclulp~t uired suirfacesaccurately. Ili ordler to model solidl objects we have to obtaini a compJlete 3-D 1)dlataset. Laser range finders, however, produce only p~artial dlata fromn a single viCw 1 )oilit at
the time and the complete (data have to be -onibined fromi p~art ial dat a set~s acquiredfrom different, viewpoints. Thme p~rob~lem requires estiniationi of relative t ranislatiomi anl(Irotationm Iaranieters Ibet~weeli p~artial data sets olbtaiiined fromi di flereiit va iiiage poil iis as
well as commibiiat ioni of dlata hiii1. a o(olli111(11o1 (001(1in ate framle . The (lat aii Mterpret at ionl
p~art, const ruct~s a. geomietri n imodel from t.he data by fitt iig iumioels . Thel( o1)1aiiiedlepreseit'atiomi of the dat ais (oiiipatible witl Hi te represelilat lonls eni1ploYedl Ill iioleloiiiigsystemis anid prod uct. dat~a exchanige lorinat~s.
Our app~roach (;oistructs prcdua (C I4D iwdcls ili ordler to represelit, low levelgeometry of the part as well as conivey its overall structure. Structura.] infonrmationi isvital for analysis, simulation and process planii i ng purposes. Procedunral models arealso relatively easy to modify. They are also conivenlient inl representing iiitersectionls
275
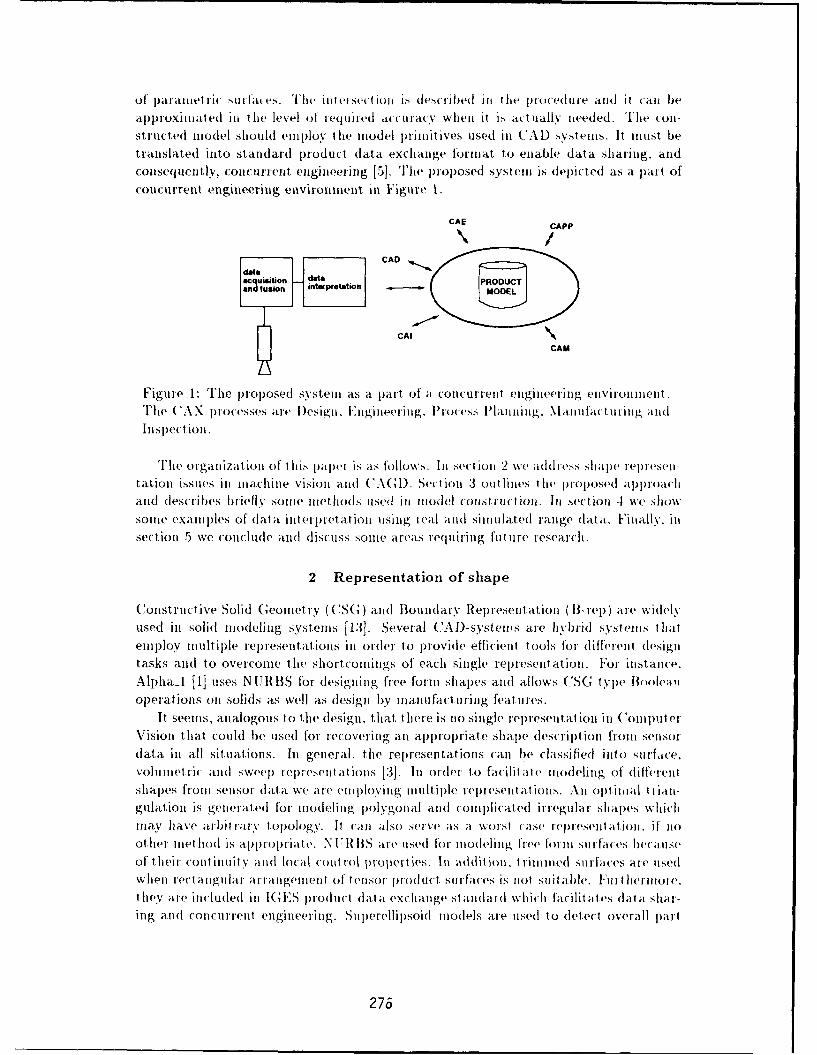
of' pa rainet Iil niul~v at e I lie vtesec tion i., (IQScriibed ill thle pioced ure and ( it call he
alpproxiI[liltI ed in thle level of req nired atc uiacv whein it is a~t alix' needed. The con-struictedl luiodele slhouldI euploy the miodel primliltives used in (CAD s'vstelins. It muist be
translated into standard product dlata exchange format to enable data sharing, andconsequently, concurrent engineering [5b. The p~roposed systemin s depicted as a p~art ofconcurrent engineering euvironniemi in Figure 1.
CAE CAPP
CAD
acqusto W a PRODUCT.=d uson" MODELeta
CAI
CAM
Figure 1: The p~roposedf systemi as a panl of a cowncut et engiiieerinig eliviroullleut.
The ( AX pr1ocesses5 are( D~esigii. Enigiineerinig. P~rocess P~lanniniig. laiiutactmii ig and~Insp~ect ion.
T[le organiizatlion of I hiis p~aper is as folloxvs. lIn sectiou 2 we adrens shiape repnrseli -tatioli issues iii miachinle visioni and C AM ). Sect ion 3 outlIinies thle proposed aplproacliand dlescri bes briefl v sorine muet hods used ill muode(l conistruction . Ill sect ion -1 we showsome exanipJles of dlata int erpretat ion using reol anid siminul ated range data. Finially. insection 5 we cotnclude and discuss some areas requiring fiit nre research.
2 Representation of shape
C'onstructive Solid Ceomtetr 'v ((3GC) and Bounidary Represent ation ( li-rep) are( widelyused iii solid miodlelinig systems [13]. Several UAD-sYstenis are hybrid systemus thatemploy mutitple relpreseiitatiolin in ornler to p~rovidle efficienit tools or (lifl~enei Idesign
tasks and to overcomte the short comiings of each single rep~resentation. For instatice.Alpha-1 [1] uses NTIMRS for (lesigl-ijg fre formi shtapes and allows ('SC type lBoole~lvloperations on solis as well as (designi by manufacturing featuires.
It seeuis, analogous to the (lesign, that. there is no single rqn~eseital iOn in (%opuilutrVision that. could be used] for recovering an applropriate sliae (lescript~on froem sensor
data in all situations. Iii general, the representations can be classified into su rface,vol iiumetric anid sweep relpnesellIa tiolis [I]. lIn ordr to Wfia(liit e miodeling of dilfferent
shiapes froui sensor dIata we are( emiployi ng miiult~iple relpresenlitalions...X Ai0flii opial Iiian-
gulation is genleratedl for iiodel ing polvgotuia andl comp 1licat ed i rreguila r shapes whIiichI
may' have a rbit rary topology. It. canu also serve ais aI wvorst case rep~resenitat ion, if' 1o
other iiethuod is appropriate. N U11HHS are Wse for miodelinig free form surfaces becauseof their conitinuity and local control prtopertijes. Inl addit ion . tr1immuled surfaces are ulsed
when red agular arranguineit of t ensor prod uct. surfaces is not sluitah ble Fr hueriuore.they are iincluded in IC S product (dat a exchange st an~lad which failitates (fata sitar-iNg and~ comncu rett engineeinig. 5 uplerellipsoidl miodels are used to detect overall part
276
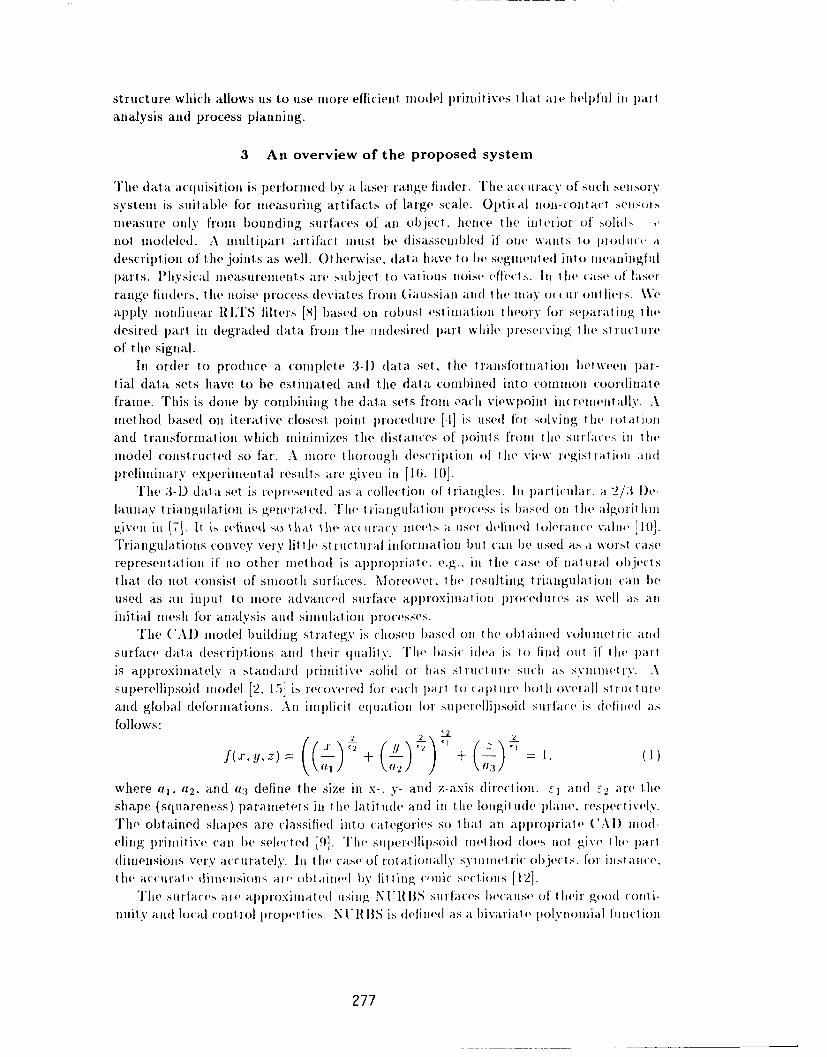
structure which allows us to use inore efficient iiiodel prililit ives that are lhelpfuil ini partanalysis andl process planninig.
3 An overview of the proposed system
[1e data acquiisitionl is pert oriiied Iby at laser range Mind. Thle act iracv of sitiih seitsory
systern is suit able for mneasuring artifacts of large scale. QptiAl liol-colitart senisors
rneasu re only' front bounding s u rfaces of an object lieiie thle hinteori of solidsnot miodeled. \ ritiult ipari artifact riust be (lisassemb lled if mwi wants to pIodL~e at
description of' the joints as well. Ot lierwise. data have to be segmnentedl int o ineanimigful
p~art s. P)htysical ineasu reitielts are su bject1 to various nioise eflec Is. lIn thle case of laserrange finider s, t lie noise p~rocess deviates fronti Gaussianl aid ie( ilay occur olii hers. Weapply nionlinimear H LTS filters [8'] lbased omil robust e'stimliat loll t lVieory for s eparat ing tlie
dhesi red p~art inl (hegradled (lata frontm tle i li~lesi redh part whbile preservi hg I lie sI t ii ~reof tile signal.
lIt ordIer to produlce a colmillete 3-1) (lat a set. the t rasformuat ion bet weem par-tial data sets have to lbe est iiiatedl aimd the (lat a colilhined into cornniioii coo~idinat efranie. This is dlone by coimibi ning thle dat a sets froint inch viewpoi mi in riviielit ally. Aimiethod b~asedl onl iterative closest p~oinlt procedulre [-I] is uIsedl for solv'i hg th lrot at ii )and t ratisforinat ion wvhiichlinini huizes the (list ances of lpoinits lolin tie s irface hin 16i
niodel conist ructed so far . kmore t horoughi descripijioll ol thle vievw registrlat ion aiid
Iprehlinulary exlperiillielt al results are gi veii in [1 fi. 10].The 3-D) dat a.set is rep~resenlt ed as at collectionl oh Iriauigles. Ill hpart iuilar. at 2/3 D~e-
laullay trinalgulationi is generaled . Ilhe I llnguilaitoll ploh'ss is balsedh onl the ailgoiiiht
given inl (7[. It is rfMied so Ihat he accuracy linee s a 115(1 dehllevl I ulealince wkl [1(AY.Triangulat ions con vey very lit1.1le st ructuiiral iiiforlinatio but 11 caii be uisedl as il worst case
represent at ion if no0 ot her mnet 110( is applrolni ate. e.g.. ill t he case of natural ola 1)jct
that do not1 consist of snioot. Iisurfaces. Moreover. thle resullting trnianigulatio coll( I be
usedC~ as ali input to miiore ad vanlced su1rfa ce alplroxiIl iatloll prloceduIIres its well as- alli
initial nieshi for arilllysis and silliulatioll proJes(se..
The CAl) lllo0lel building strategy- is chosen, based onl lie( obt ainied voluirietrit and
surface data lescrilttions and t heir (jallaht. 11ie Imsirl iihea is to liiid =u A Ih li rt Ii
is apploxiialely itv . stand~ardh prinitkive .solid or has sI1ru(1 111 such1 a5s 5Ilunllet i. A%suilrelelipsoidh 1110(1( [2. 15)] isi recmveredl for each palt to capl)uire bothI overaI;ll strctlntime
and global (helorillat ions. kn illiphicit equlat ion for suljerellipsoid sulface is (lehilied as
follows:
where at, US and U3 defiiie t he se hin x-. y- and P-als (lirec-tion. E i andt E2 are 1 leshape (squiiareness ) lparalinet ers in the latitude anld in thle loilgi tudle Ilaiie. rspec i vev..
The obtained shiapes are classifiedli 0o cat gories so thIiat ani appropriat e (iAl) illod
elimig prililitiýve call be Selected [9]. The Sllperellipsoid Ihet110(1d does not gixve thle plart
(lilielisiols very accuratel ,y. Ill I lie case of rotat jolallyN SYlhillie iric objects. for instalice.thle accuirat e dilneivisionls are obt ainied by lit hug c'uiic sect ions [121.
The surfaces ale aprl)loilliat ed using IN U IMs suimfaces becaulse oft ichir 'good cl (011-
nuity and loca~l (0l1110 properlties. N U hS is definled as at bivariat e iiolymomiial funlct ion
277
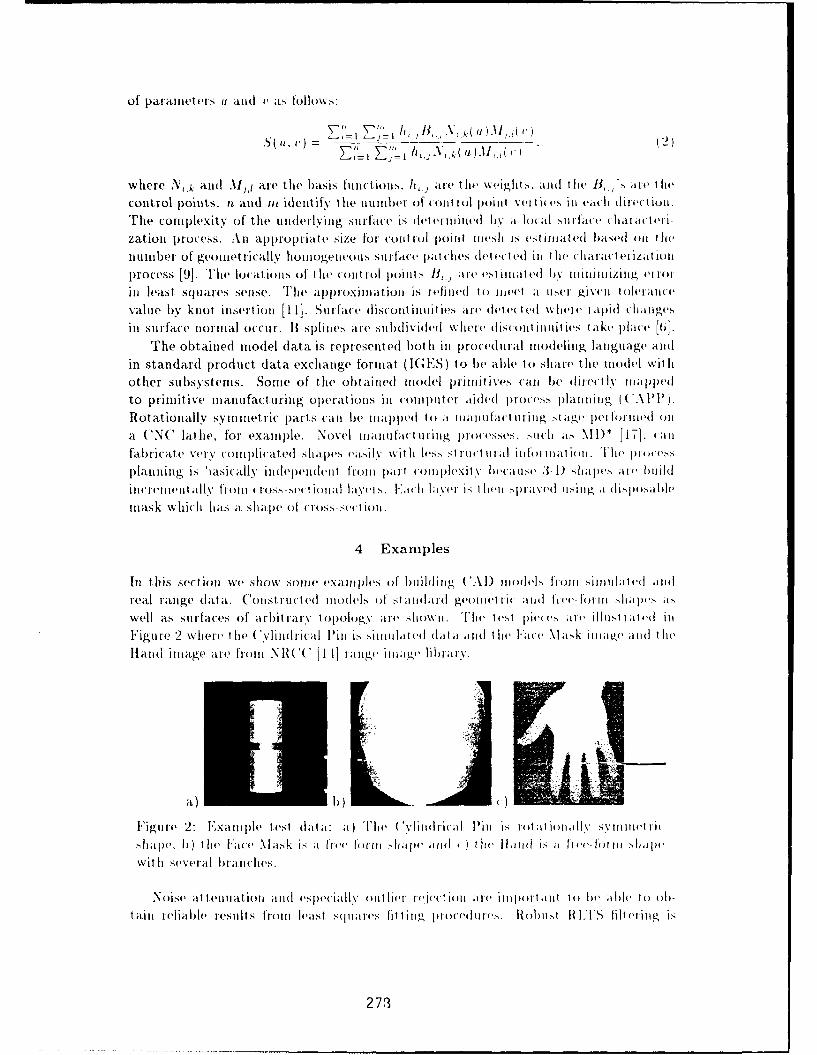
of lpdlallletel i'i aind 1' as tullo%%,,
where N ,k aiid 11jj are the basis fiuncti~on,,. hare ;t( Ilie weighits. and lhe I3,~ *s are t lie
control p~oints. it and tit identfifyv the numbiier oif cont vol poinlt yellices ill each thi ectiolull
The complexity of the uiilerlviig surface is deteininiied by a local suruihic hai acterl-
zatioti process. Anf appropriate size lo r ton t iol po int Illes-J itl s I"'illila I based l ~(l Il thle
number ot geuiiietrically homiogenieous surac lhiatlchies (elet ledt( ill Ilhe chlaraljIelizattoll
process [].- Thie locationls of thle (ont rol points I11. ale e~t in lat ed by mninimiizinlg errorin least Squares senlse. Th'le approximaiu onl is ]&'hile(I loi Iiieelt a 115( givenlltolelalite
value by knot inlsert ion [11]. Surflace d isconit iniiities are detec't ed where lapi d Ii allges
ill surface nornital occtir. Il-spliites are stlhdlidued whtere djscoitllilit les t ake. place (61,The obtainied nwidel ilata is represented bothI in lprucedltl ramI odeliiig lanItgtiage ad i
in stan(Iarl p~rodutct data exchlange forniiat (ICE1"S) to be able to ')hilre( thie tiiItleb withIother su bystenis. Sontic of the MOW m) ile lodel primtliti ves call be directly IV ill I
to primnit ive mtiaintifacturng II~operatin in compu1 l lter aidled p~iiocess plann1 in Ig (C(APP).PRotationally sytintrite c part s cani be ilialpled to a lIlaltluallttlrilig stage lperlflllletl on
a CNC lat he, for exauiple. .Novel manuitiactutring profiesses. sulit Iit. %i lD* [I17. (allfabricate vel y(ollII lhicat~et shIt; Ipes easilIy wit Ill le.",stt tI IIaIII!; itI II') llaIa it I I Th I tcw
plathi ijg is iasically indepenidenit front patt cotuiplexity hecausie 3-1) shapes are butild
incrlem~ent ably fronit (loss-sv( Iioialh ha 've Is. VaCl 11;IY(el is t Ihet I'I)Ii sI yled u s in I 1, is I) oahilv
miask which bias at shape of ctoss-seitl loll.
4 Examples
Int this section We show solict examtiples of' buildiniig (*..\I) ~ilo~hel.- fromh sitnulat ed aind
ieal raitige data. ('onst tucteti nmidels of staiidai-d gooeotiet nctid( hfoe m - cllsapsi
well as suIrfaces of a rbit rar lVtop~oiogv are sblo'snl. 'Ile' test pieces ate, ilbt"Istat 'i ill
Juigtire 2 where t he C( 'vitldrical Pin is simulated (hat a and lt lt, ace Ma~sk ittiage antd t hue
Hland illiage ale fronti N R( [1-I lanlge ilinag'' likriav.y
Figure 2: [xatiiple test (dat a: at) Th'e Cylvinldrical Pill is lot at otall ,N s , Itittlet Ill(
shiape. b) tI lie Face Mask is a free I lott 11ape atild < I 1t lie alid is at 1tee-lot HI Nl~hapf
Witlli Several brlancthes.
.Noise attllenuatioli alid 'sjteciill , ov mliet l('j(' oll ale i1111 )tmtalit If) he' able tfo oh-dain rteliable results 110111 least squares hit t g pnrottlitt's. Rawis Hur LIS ilt ernig is
273
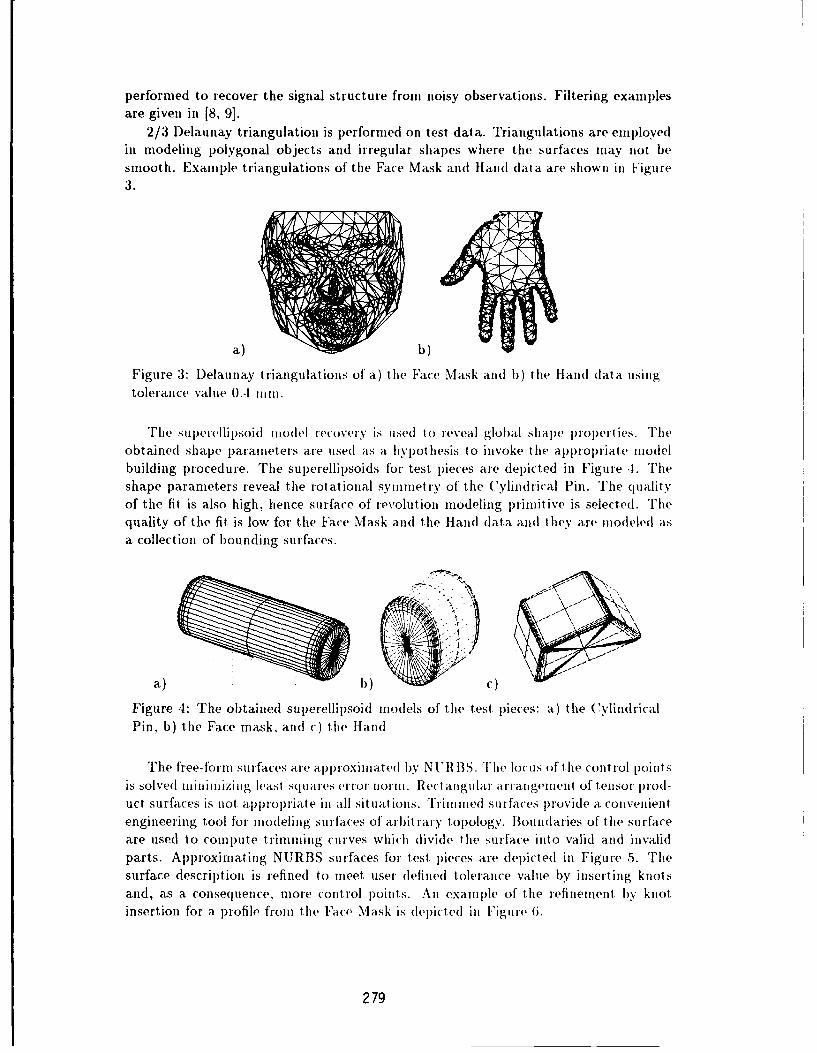
performed to recover the signal structure front noisy observations. Filtering exampllesare given in [8, 91.
2/3 Delaunay triangulation is performed on test data. Triangulations are employedin modeling p~olygonal objects and irregular shapes where the surfaces may not besmnooth. Examplle triangulations of* the Face Mask and Hand dlata are showni inl Figure3.
a) b)
Figure 3: Delaunay triangulation.- of a) the Face Mask and 1)) tie( Hand dat a usingtolerance value 0.4 mnin.
'fle 5 tpereil ipsOidl imodel recovery is used to( reveal globl~ sh~ape properl ies 'riteobtained shape p~aramleters are tisedl as a hiypothesis to invoke the applropriat~e imodelb~uilding p~rocedur'e. The superellipsoids for test p~ieces are depicted in Figure -1. 'rtheshape parameters reveal the rotational symumetry of the Cylindrical Pin. The qualityof the fit is also high, hence surface of revolution modeling p~rimiit~ive is selected. Thtequality of the fit is low for the Face Mask and the Hand (data and t hey are modeled asa collection of bounding surfaces.
a) c)
Figure 4: The obtained superellipsoid models of the test pieces: a.) t he Cylindr icalPin, b) the Face mnask, and c) thie H~and
The free-formi surfaces are app~roxilmatedl b)'y NVI' 113S. The locuis oft hie control p)ointsis solve VC( 1 ii iniIiIImg least sq Ilare 1(5 eror lioni Il. Ret an1gimlam a rrangemient. of tensor p~rod-
uct, surfaces is not, appropriate in all situiations. Trimmimed surfaces provide a convenmientengineering tool for imodeling surfaces of arblitraix'* topology. Boundaries of thle surf~aceare used to complut~e trimming curves which dhividle the surface intto validl and invalidparts. Approximating NUR.BS surfaces for test. pieces are dlepictedI in Figure 5. Thesurface description is refined to rineet. user defined tolerance value b~y inserting knotsand, as a. conseqluence, more control points. Ani example of the refinement. by kinot.insertion for a p~rofile fromt the Face Mask is dlepict~ed inl Figmre (6.
279
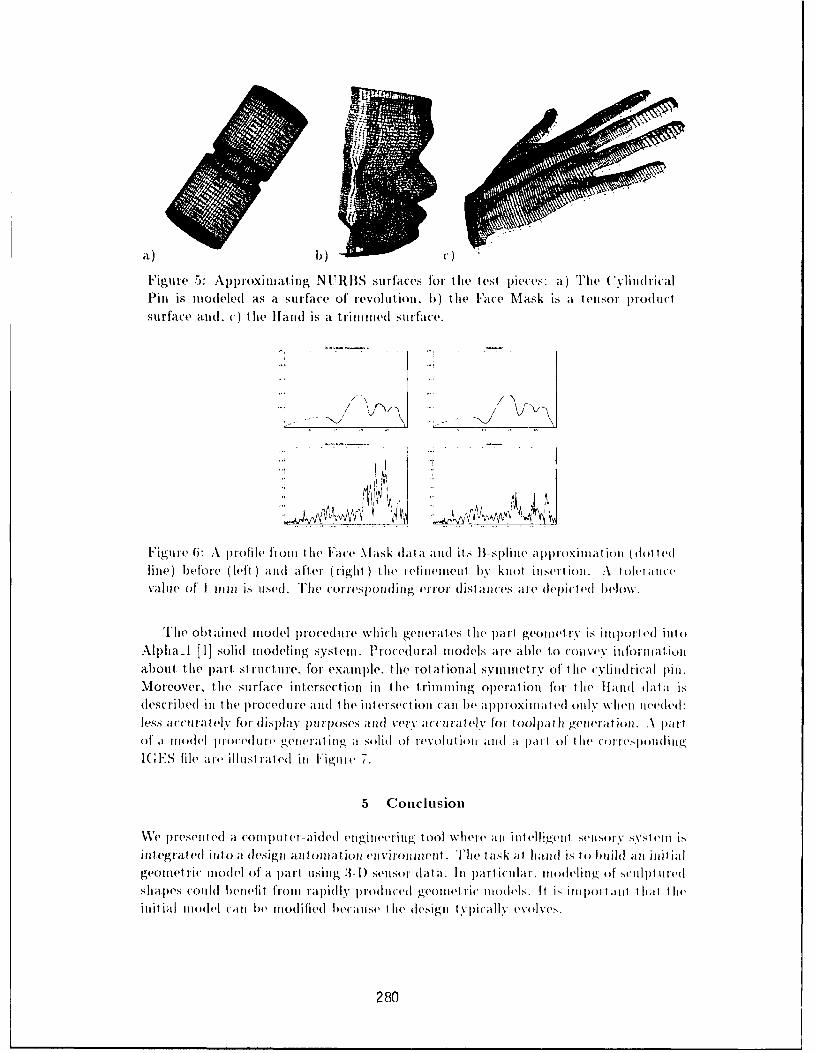
a) c)
Figure 5: Approximatling NURBS surfaces for tihe test pieces: a) The ('y N.lindricalPill is modeled as a surface of revolution, b) the Face Mask is a ten(s11or product'surface aind. c') the H[and is a, trimmed surface.
/ / "X-
/ -. i•;N -N . . ..
I . - .
Figure 6: A profile from I ite Face NI ask dallt a llnd its B-splinle ,lIq•'prximallon jl (dolle•tline) before (left) and afler (right ) Ihli refiniemuent by knot is•.•selol. A I oleilticeValue of, 1 1II111 is utsed(. The corresponding ('1101. ilist alices are' (epiult belo)11w.
Tlhe obt ained iiiodel procedure which genlerates I lie pal't geolliet ry is imported lioltAlpha-l [1] solid modeling systemi. Plroced ural models are able to conivey ilifor•iatioli
about, the pa.rt struct1ure, for example, thel rotalional symvinletrv of Ilhe cyli1dri'cal pill.Moreover, the surface intlersection in lhe trimniiilg operat ion for the Hand d(at a isdescribed in the procedure anl(h li• iltersqclioll call ble app•roximillaed only ,vhNe heu•i'ded:less ac'lcutatelYv fto display purposes an11d1 vei acciura, fo1 f ollolpith g(,ll•,riol. .A pa;rtof' *i 1,10l Iao llol'ellll"' gele•ilt• g a, slidl (1 of evoliitloll ailld ;i part of Ilihe corre.spoildiig
I(ES file are ilhuistilr ledh ill iig rllr, 7.
5 Conclusion
W~e presenited at (ollillilt er-aniled ('ilgillveel-ipg tool Where ali intelligen elsorvsvs('Ill isi/ntegrated i111to a dlesigil alito1liatioll e'znviz'oilZlit ll. The task- at hand is to build a i i/it iilgeometric" mode• of a pall using 3-DI) sellisor ilata. Ill part icular, mloldeling of s('1ll1 t iierdshapes couhld be•lefit from rapidly piroiduiced geollietlic Illodels. It is i1mporta•lt lIhlat the
iitial iiioiei call lie moifiedbecau i Ilitile designi t~picallv evolve.".
280
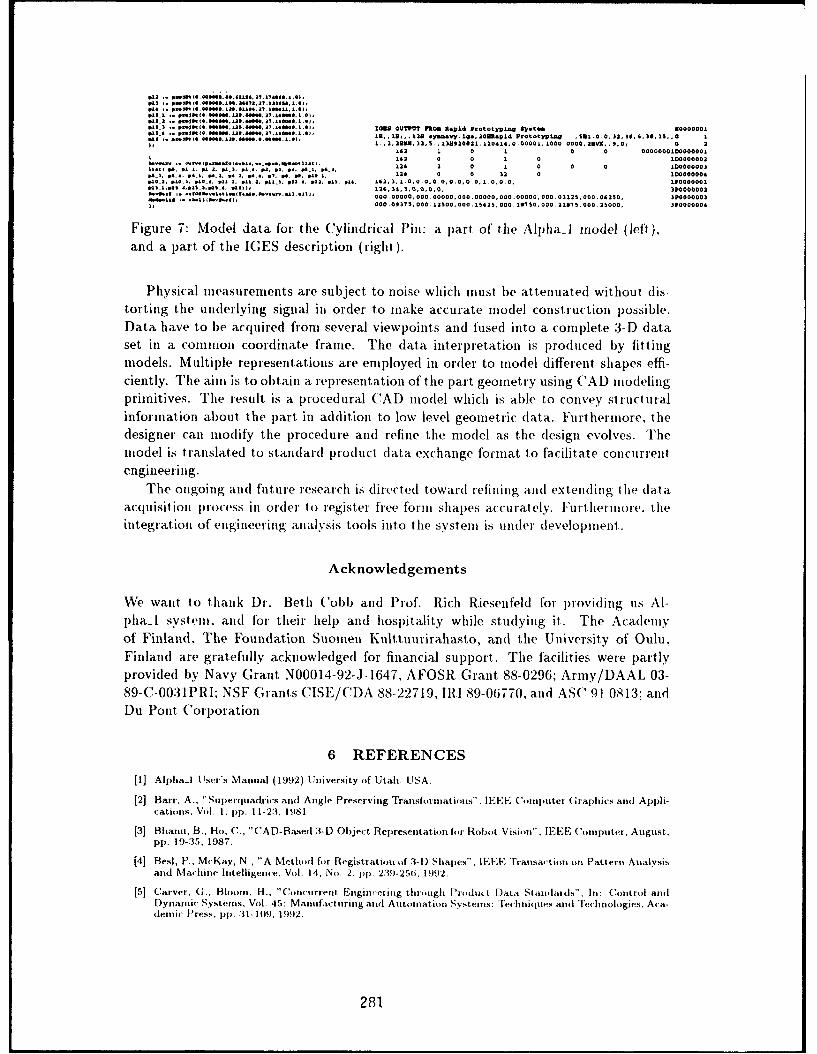
Ma .. puItP.0ll•€+~~e e .60.60P6.2.0t6P.PI4|,1.)
nS_.61 j~c ... .* *.3t10,lflb.6Z,.6 l6. P.a6e4 t. 6 IIM , . . .flI .flf .** .6 . ..10060
a4S_ 3. *1. W0• OUTP,6 .UT06.UT.fl66o PlOR Ra3pild iPootolypi4g Systes 0000O01idtSl * le lll(0,4Hl4141t~,14eNa1.11OmlO/t.~l Is, LIn, Las1 eyana~v'rj., L90. 20113tapict P-lotyopia S100.;,1, ,),5,
... Z3.3881,• .31 .1 3102031.,120411,0.00001,1000,0000,2VKý,,*.0, 0 2 2.62 1 0 1 0 0 00000001D00OOO01163 0 0 1 0 0 1)00000002
%A.. I W. 61. M .4MI 01. p.2 .1. p. .1. WI3. 1316 2 0 00 1 00 0 0 100000003PS.)I, p1.0. . pi~ . pI_;I 6 6. pA. p, I7 , I . M•O.6 l•136 0 0 332 0 1.00000004p1_0l, p0o.3, p4o6 plOl S. PSl~,. ML ). pot . 0*. 010.41 I 064,.l 162I,3.1.0,0.0.0.0.0.0, 0.0. 1.0.0.0. 110000001p10M .p.I +,I.MI, _t. p 1,6 L31. 31. 3,.0.0. 0.0.:+ 3P00000003
kvlllllI I l6OI4~t~~ld~~~+ .J 3POD000
0..P ,. io00p.0b. 1 .. Oop000.000,0,000.O000,00.000.00000.000 00000. 000.03123S.000 06350, 3P0000003
000.0935.0 00.123500.000.IS633,000,1o730.000.2187i ,000.35000. 310000004
Figure 7: Model data for the Cylindrical Pitl: a part of the Alpha-1 model (Jeft),and a part of the IGES description (right).
Physical measurements are subject to noise which must be attenuated without dis-torting the underlying signal in order to make accurate model construction possible.Data have to be acquired from several viewpoints and fused into a complete 3-D dataset in a commoln coordinate fralne. The data i11terpretation is produced by fittingmodels. Multiple representations are employed in order to model different shapes effi-ciently. The aim is to obtain a representation of the part geometry using ('AD modelingprimitives. The result is a procedural CAD mnodel which is able to convey structuralinformnation about the part in addition to low level geometric data. Furthermore, thedesigner can modify the procedure and refine the model as the design evolves. Themodel is translated to standard product data exchange forfmat to facilitate concurrentengineering.
The ongoing and future research is directed toward refining and extending the dataacquisition process in order to register free form shapes accurately. Furthermore. theintegration of engineering analysis tools into the system is under developmeni.
Acknowledgements
We want to thank Dr. Beth ('ob) and Prof. Rich Riesenfeld for providing us Al-pha-l system. and for their help and hospitality while studying it.. The Academyof Finland, The Foundation Suomen Kulttuurirahasto, and the University of Oulu,Finland are gratefully acknowledged for financial support. The facilities were l)artlyprovided by Navy Grant N00014-92-J-1647, AFOSR Grant 88-0296; Army/DAAL 03-89-C-0031PRI; NSF Grants CISE/CDA 88-22719, IRI 89-06770, and ASC 91 0813; andDu Pont ('orporation
6 REFERENCES
[1] Alpha-I User's Manual (1992) University of Utah. LISA.
[2] Barr, A., "Sulrperquadrics and Angle Preserving Transforrmations". IEEE Compuiter Graphics and Appli-catrio s, Vol. 1. pp. 11-23, 1981.
[3] Bliainu. B., Ho. C., "CAD-Based 3-D Object Representation for Robot Vision", IEEE ('omputer, August,pp. 19-35, 1987.
[4] Best, P.. McKay, N., "A Method for Registration (if 3-D Shapes", IEEE Transaction (o01 Pattern Analysisand Machine Intelligence, Vol. 14, No. 2. pp. 23!9-256. 1992.
[5) Carver, (,., Bloom, H., "Concurrent Engin,'cmi iig thr,,ugh Product Data S tandlads", In: Control andDynamic- Systems. Vol. 45: Manuf.ct urig arnd Automnation Systems: Techniques arid Technologies, Aca-demnic Press, plp. :31-109. 1992.
281
[61 Cohven, E., Lyclte, T., Rieserifeld, R., " Discrete B-Splines ankd Subdivitsion Tlechniitques ini C'omputer AidedGeomietric De~sign and Computer Graphics", Computer Graphics And Image Prucessinig, 14. pp 87-111,1980.
[7] Field, D., "A Generic Delauntay Triangulation Algorithm for Finite, Eleuieu~it eshes". Ad%, Enig. Solt wale.1991, Vol. 13, No. 5/6 combined, pp. 263-272, 1991.
[8] Koivunien, V. "Robust Approach to Filtering of Scalar and Vector Valued Signals",ý IEEE Workhop~j onImage and Multidimensional Signal Processing. Cannes. France, 1MM3
[9] Koii'uueza, V., Bajcsy, R., "Geortietric Methods for Building (CAD Mod.~els front Range Data". In (iei-metric Methods in Computer Vision 11, SPIE Vol. 2031. San Diego, 1993.
[flu] Komi witn, V. V ezien J- M ., Hajcsy, R_ " 'MulItiple Represent at ion A ppri aili (, Geotiet ni M oIde ('ftttioti fronm Range Data", Technical Report MS-CIS-93-ti6, University of Pennrsyvliania, 199:3.
(111 Piegl, L., "Modifying the shape of rational B-splirtes. Part 2; Surfaces", Comnputer Aided Design, Vol. 21.No. 9, pp. 538-546, 1989.
[12] Pratt, V., " Direct Least-Squares Fitting of Algebraic Surfaces" Comuputer Graphics 21, No. 4, pp. 145-152, 1987.
[13] Requicha, A., Voelcker, H., "Solid Modeling: A Historical Summiary anid Couttemuprary Assessmen't".IEEE Computer Graphics and Applications, Vol. 2, No. 2, pp. 9-24, 1982.
[14] Rioux, M., Cirnoyer, L. "The NRCC Three Dimenesionial uImage Data Files'". C'NRC 29077, NationtalResearch Council of Canada, 1988.
[15] Solina, F., Bajcsy, R., ''Recovery of Paramretric Models fronm Range Imnages : The case of Sit erqttai I icsw i th Global Deformnationts'' IEEE '1ransact ionsm onIattcmuit Anat~lysis arid Nti MaItilti Int ellig-x ice. PAMI Ni-12No. 2, pp. 1:31-147, 1990.
[16] Veziert J-M, "Data Acquisition and Registrationt of Range uImages fur Reverse Engineering Appliiatiiins",Technical Report, University of Pennusylvantia, Departm~enit of ('ornutttei Sc iecite'. Jutl~, 1993.
[17] Weiss, L., Prinzx, F. & Siewiork, D., "A Framework for Thernmal Spray Shape Deposition: The MD*Systemn", Solid Freeformn Fabrication Symposium, Auistin, Te~xas-, USA, 1991.
2 82"
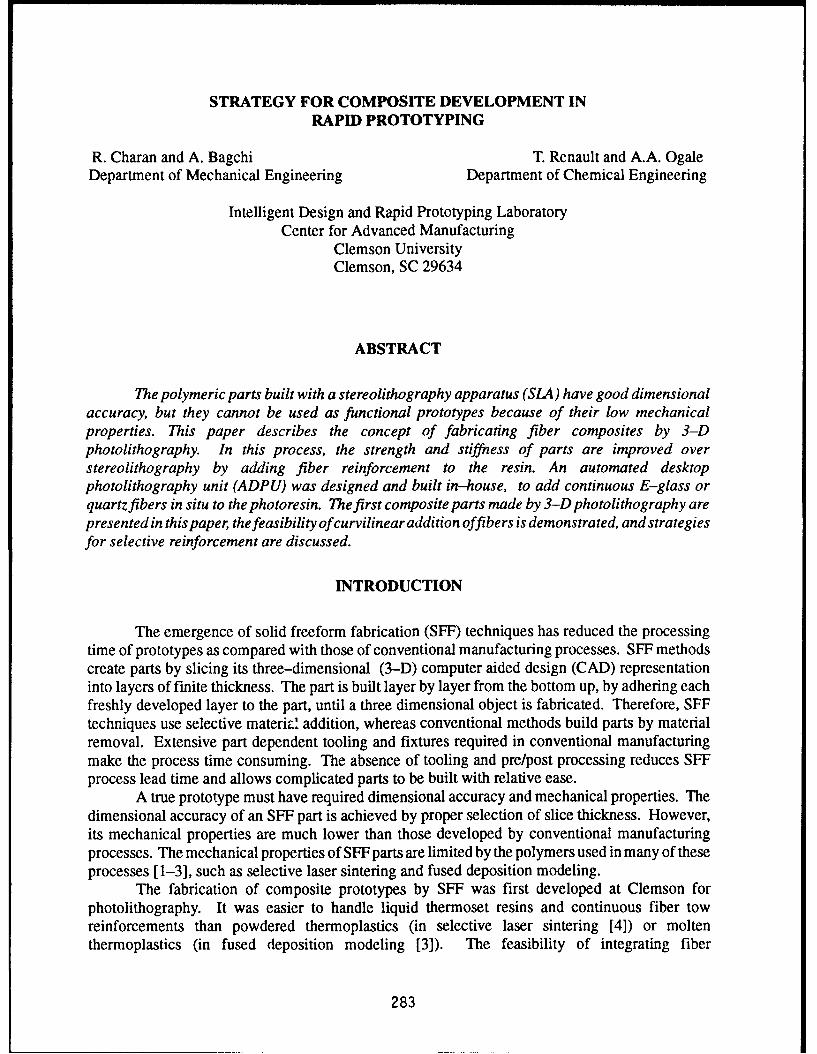
STRATEGY FOR COMPOSITE DEVELOPMENT INRAPID PROTOTYPING
R. Charan and A. Bagchi T. Renault and A.A. OgaleDepartment of Mechanical Engineering Department of Chemical Engineering
Intelligent Design and Rapid Prototyping LaboratoryCenter for Advanced Manufacturing
Clemson UniversityClemson, SC 29634
ABSTRACT
The polymeric parts built with a stereolithography apparatus (SLA) have good dimensionalaccuracy, but they cannot be used as functional prototypes because of their low mechanicalproperties. This paper describes the concept of fabricating fiber composites by 3-Dphotolithography. In this process, the strength and stiffness of parts are improved overstereolithography by adding fiber reinforcement to the resin. An automated desktopphotolithography unit (ADPU) was designed and built in-house, to add continuous E-glass orquartz fibers in situ to the photoresin. The first composite parts made by 3-D photolithography arepresented in this paper, the feasibility of curvilinear addition offibers is demonstrated, and strategiesfor selective reinforcement are discussed.
INTRODUCTION
The emergence of solid freeform fabrication (SFF) techniques has reduced the processingtime of prototypes as compared with those of conventional manufacturing processes. SFF methodscreate parts by slicing its three-dimensional (3-D) computer aided design (CAD) representationinto layers of finite thickness. The part is built layer by layer from the bottom up, by adhering eachfreshly developed layer to the part, until a three dimensional object is fabricated. Therefore, SFFtechniques use selective materic"' addition, whereas conventional methods build parts by materialremoval. Extensive part dependent tooling and fixtures required in conventional manufacturingmake the process time consuming. The absence of tooling and pre/post processing reduces SFFprocess lead time and allows complicated parts to be built with relative ease.
A true prototype must have required dimensional accuracy and mechanical properties. Thedimensional accuracy of an SFF part is achieved by proper selection of slice thickness. However,its mechanical properties are much lower than those developed by conventional manufacturingprocesses. The mechanical properties of SFF parts are limited by the polymers used in many of theseprocesses [1-3], such as selective laser sintering and fused deposition modeling.
The fabrication of composite prototypes by SFF was first developed at Clemson forphotolithography. It was easier to handle liquid thermoset resins and continuous fiber towreinforcements than powdered thermoplastics (in selective laser sintering [4]) or moltenthermoplastics (in fused deposition modeling [3]). The feasibility of integrating fiber
283
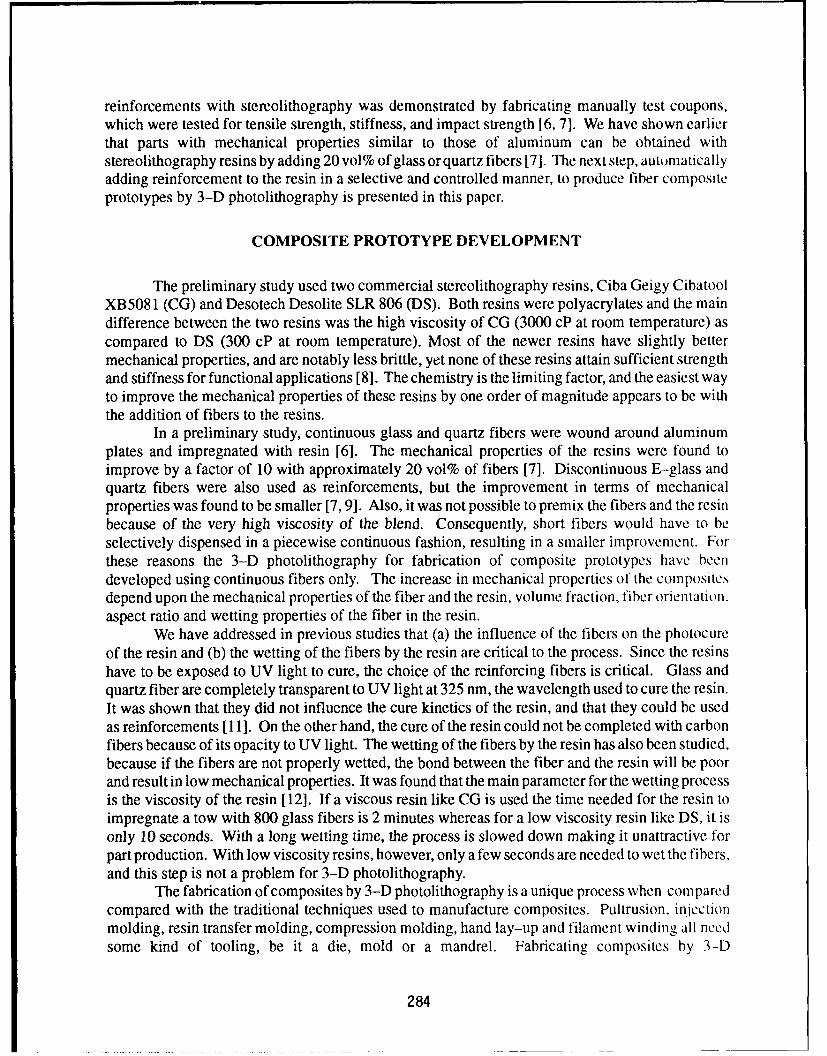
reinforcements with stereolithography was demonstrated by fabricating manually test coupons,which were tested for tensile strength, stiffness, and impact strength 16, 7]. We have shown earlierthat parts with mechanical properties similar to those of aluminum can be obtained withstereolithography resins by adding 20 vol% of glass or quartz fibers [7]. The next step, automaticallyadding reinforcement to the resin in a selective and controlled manner, to produce fiber compositeprototypes by 3-D photolithography is presented in this paper.
COMPOSITE PROTOTYPE DEVELOPMENT
The preliminary study used two commercial stereolithography resins, Ciba Geigy CibatoolXB5081 (CG) and Desotech Desolite SLR 806 (DS). Both resins were polyacrylates and the maindifference between the two resins was the high viscosity of CG (3000 cP at room temperature) ascompared to DS (300 cP at room temperature). Most of the newer resins have slightly bettermechanical properties, and are notably less brittle, yet none of these resins attain sufficient strengthand stiffness for functional applications [8]. The chemistry is the limiting factor, and the easiest wayto improve the mechanical properties of these resins by one order of magnitude appears to be withthe addition of fibers to the resins.
In a preliminary study, continuous glass and quartz fibers were wound around aluminumplates and impregnated with resin [6]. The mechanical properties of the resins were found toimprove by a factor of 10 with approximately 20 vol% of fibers [7]. Discontinuous E-glass andquartz fibers were also used as reinforcements, but the improvement in terms of mechanicalproperties was found to be smaller [7, 9]. Also, it was not possible to premix the fibers and the resinbecause of the very high viscosity of the blend. Consequently, short fibers would have to beselectively dispensed in a piecewise continuous fashion, resulting in a smaller improvement. Forthese reasons the 3-D photolithography for fabrication of composite prototypes have beendeveloped using continuous fibers only. The increase in mechanical properties of the compositesdepend upon the mechanical properties of the fiber and the resin, volume fraction, fiber orientation.aspect ratio and wetting properties of the fiber in the resin.
We have addressed in previous studies that (a) the influence of the fibers on the photocureof the resin and (b) the wetting of the fibers by the resin are critical to the process. Since the resinshave to be exposed to UV light to cure, the choice of the reinforcing fibers is critical. Glass andquartz fiber are completely transparent to UV light at 325 nm, the wavelength used to cure the resin.It was shown that they did not influence the cure kinetics of the resin, and that they could be usedas reinforcements [11]. On the other hand, the cure of the resin could not be completed with carbonfibers because of its opacity to UV light. The wetting of the fibers by the resin has also been studied,because if the fibers are not properly wetted, the bond between the fiber and the resin will be poorand result in low mechanical properties. It was found that the main parameter for the wetting processis the viscosity of the resin [12]. If a viscous resin like CG is used the time needed for the resin toimpregnate a tow with 800 glass fibers is 2 minutes whereas for a low viscosity resin like DS, it isonly 10 seconds. With a long wetting time, the process is slowed down making it unattractive forpart production. With low viscosity resins, however, only a few seconds are needed to wet the fibers,and this step is not a problem for 3-D photolithography.
The fabrication of composites by 3-D photolithography is a unique process when comparedcompared with the traditional techniques used to manufacture composites. Pultrusion. injectionmolding, resin transfer molding, compression molding, hand lay-up and filament winding all needsome kind of tooling, be it a die, mold or a mandrel. Fabricating composites by 3-D
284

photolithography therefore combines the advantages of SFF methods with the improved mechanicalproperties of composite materials. Another advantage of 3-D photolithography for the fabricationof composite materials is that until recently composites were developed with fibers laid out straightand parallel to each other on any plane, e.g., a 0/90/0 orientation. Although these parts displayedimproved mechanical properties, they did not take advantage of the full potential of the fibers.Studies have indicated that for a given volume fraction fibers, laying them in a curvilinear formatyields best results [13]. The part will be selectively reinforced with greater percentage of fibersplaced in the high stress region. The idea of building parts using fibers laid out in curvilinear formathas been hampered by the inability to implement such a design. However, with the developmentof 3-D photolithography it is now possible to selectively lay down fibers along any curve.
AUTOMATED DESKTOP PHOTOLITHOGRAPHY UNIT
The automated desktop photolithography unit (ADPU) was designed and built in-house toallow in situ addition of fibers. A schematic of the current setup of the ADPU is shown in Figure1. The part is built on an aluminum platform which is immersed in a rectangular vat containingmonomeric resin. The platform and the vat are positioned manually to control the thickness of theresin over the plate and the distance of the top layer from the light source. The unique feature ofthe ADPU is the fiber dispensing device which is used to automatically dispense the continuousfibers into the resin. The light source consists of an optical fiber with a focusing lens connected toa 100W mercury lamp. The light source and the fiber dispensing device are mounted on a circularplate which can traverse in the X-Y direction and rotate about the Z axis. Because the fibersdispensed in the resin have to be wetted before the resin is polymerized, the light source is locatedat the center of the plate while the fibers are dispensed lcm off the center. A traverse speed of 1 mim/sallows the fibers to be wetted for 10 s before cure. The translational motion is provided by the X-Ypositioning table and the rotation by the rotational drive mounted on the positioning table. The threecontrollers for positioning table (X, Y) and the rotational drive (theta) are supervised by a computer.The motion of the X and Y axes can be combined to develop any curvilinear path, while the rotationensures that the fibers are dispensed ahead of the lamp and along the desired path. Each axis is setin motion as soon as a command is received from the supervisory program. With this setup it ispossible to dispense fibers in the resin and polymerize the composite in any desired orientation onany layer.
The first step in part building is the creation of data file which consists of the coordinatesof all the points that are to be joined sequentially. The location and the order of these points dependon part geometry and loading conditions. This data file along with the translational/rotational speedof each axis form the input to the program to create motion commands for each controller. Theoutput of this program is fed to a supervisory program resident in the computer which distributesthe information between the two controllers.
PART BUILDING
Test coupons were built to compare the tensile strength of parts with and without fibers. Thesamples were 100 mm x 10 mm x 1.5 mm, and were reinforced by 20 fiber tows placed along itslength. The concept of curvilinear fiber layout was demonstrated by building a circular ring withone, two, and three concentric passes of fiber, 24, 27, and 30 mm in diameter, respectively. The data
285
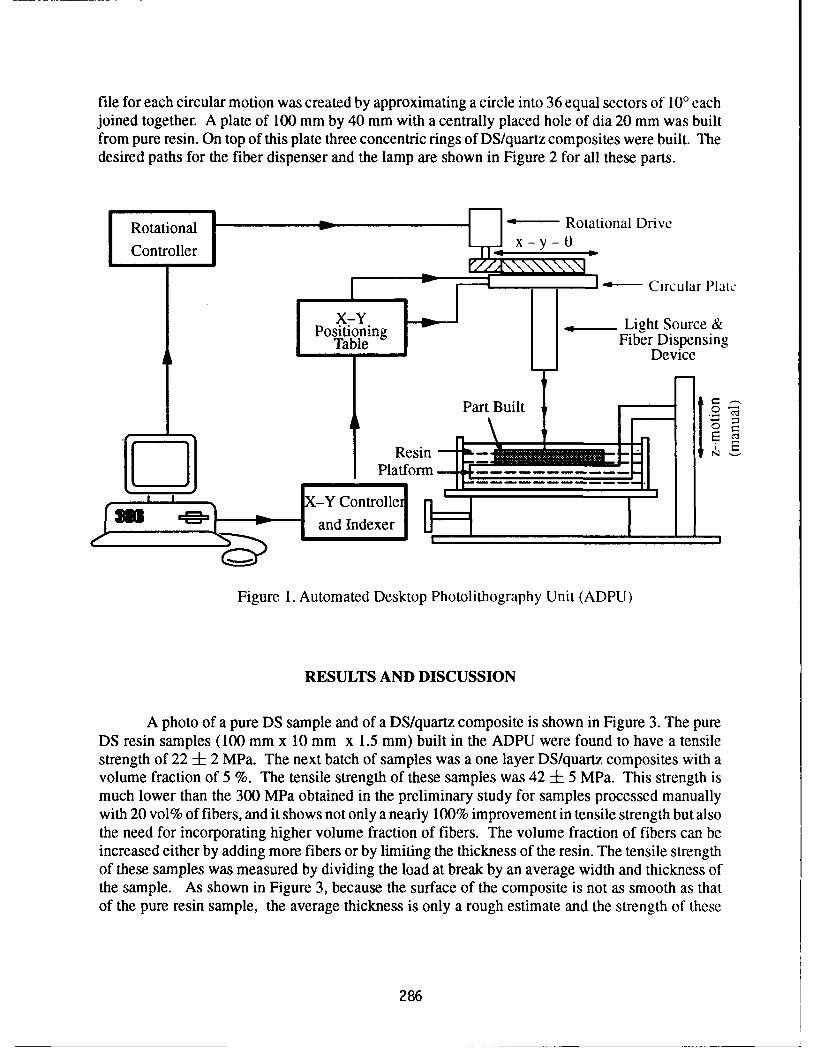
file for each circular motion was created by approximating a circle into 36 equal sectors of 100 eachjoined together. A plate of 100 mm by 40 mm with a centrally placed hole of dia 20 mm was builtfrom pure resin. On top of this plate three concentric rings of DS/quartz composites were built. Thedesired paths for the fiber dispenser and the lamp are shown in Figure 2 for all these parts.
--atoal Rotational Drive
1Controllerl
s- Circular Platc
PX-Y Light Source &PositioningTab~le Fiber Dispensing
Device
Resin -
PlatformI I -Y Controllei
j " •• , ~andlIndexer ,, ]
Figure 1. Automated Desktop Photolithography Unit (ADPU)
RESULTS AND DISCUSSION
A photo of a pure DS sample and of a DS/quartz composite is shown in Figure 3. The pureDS resin samples (100 mm x 10 mm x 1.5 mm) built in the ADPU were found to have a tensilestrength of 22 ± 2 MPa. The next batch of samples was a one layer DS/quartz composites with avolume fraction of 5 %. The tensile strength of these samples was 42 ± 5 MPa. This strength ismuch lower than the 300 MPa obtained in the preliminary study for samples processed manuallywith 20 vol% of fibers, and it shows not only a nearly 100% improvement in tensile strength but alsothe need for incorporating higher volume fraction of fibers. The volume fraction of fibers can beincreased either by adding more fibers or by limiting the thickness of the resin. The tensile strengthof these samples was measured by dividing the load at break by an average width and thickness ofthe sample. As shown in Figure 3, because the surface of the composite is not as smooth as thatof the pure resin sample, the average thickness is only a rough estimate and the strength of these
286
Figure 2. Path of the lamp and the fibers generated by computer simulation for(a) composite tensile test coupon(b) ring with three concentric passes of fiber (thick lines) over a layer of
plate with hole in the center
Figure 3. Tensile test coupons of pure DS resin (top) and DS/ Quartz composite(bottom) made in ADPU
287
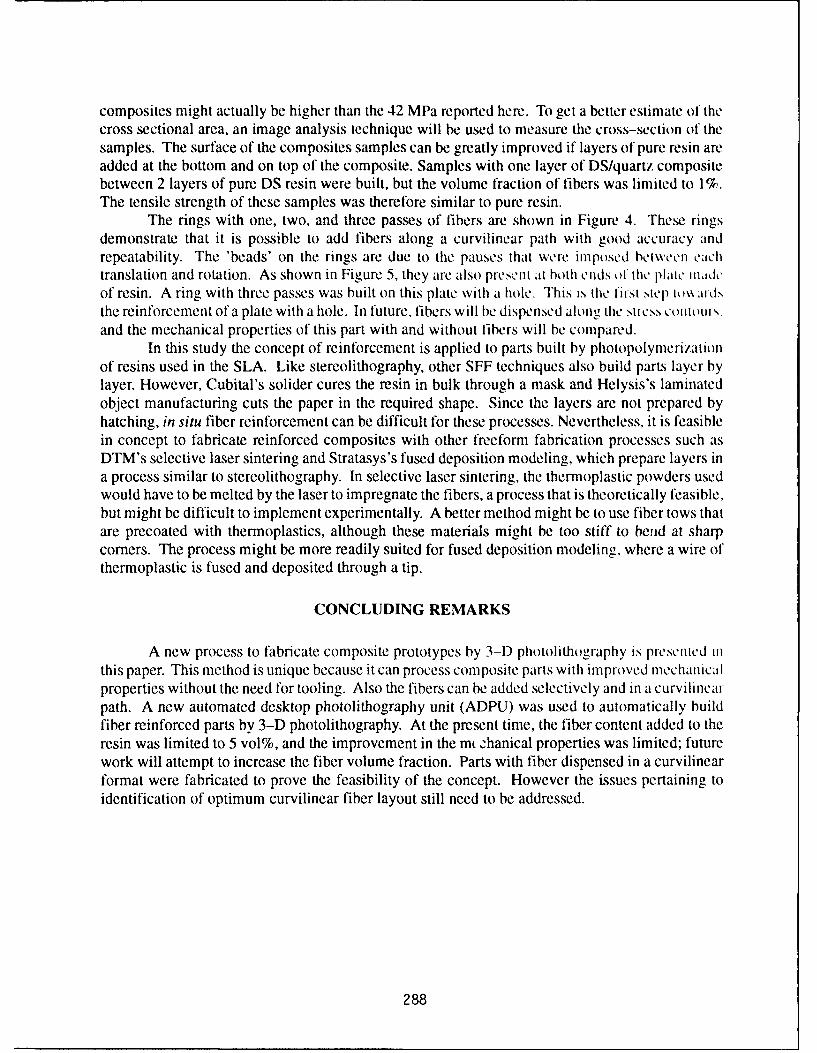
composites might actually be higher than the 42 MPa reported here. To get a better estimate of thecross sectional area, an image analysis technique will be used to measure the cross-section of thesamples. The surface of the composites samples can be greatly improved if layers of pure resin areadded at the bottom and on top of the composite. Samples with one layer of DS/quartz compositebetween 2 layers of pure DS resin were built, but the volume fraction of fibers was limited to 1%.The tensile strength of these samples was therefore similar to pure resin.
The rings with one, two, and three passes of fibers are shown in Figure 4. These ringsdemonstrate that it is possible to add fibers along a curvilinear path with good accuracy andrepeatability. The 'beads' on the rings are due to the pauses that were imposed between eachtranslation and rotation. As shown in Figure 5, they are also pres,'et at both ends of the plate liu•et"of resin. A ring with three passes was built on this plate with a hole. This is the Ilirst Mtep Lto•,jid,the reinforcement of a plate with a hole. In future, fibers will be dispensed along the stress ct1otoMr.Sand the mechanical properties of this part with and without fibers will be compared.
In this study the concept of reinforcement is applied to parts built by photopolymerizationof resins used in the SLA. Like stereolithography, other SFF techniques also build parts layer bylayer. However, Cubital's solider cures the resin in bulk through a mask and Helysis's laminatedobject manufacturing cuts the paper in the required shape. Since the layers are not prepared byhatching, in situ fiber reinforcement can be difficult for these processes. Nevertheless, it is feasiblein concept to fabricate reinforced composites with other freeform fabrication processes such asDTM's selective laser sintering and Stratasys's fused deposition modeling, which prepare layers ina process similar to stereolithography. In selective laser sintering, the thermoplastic powders usedwould have to be melted by the laser to impregnate the fibers, a process that is theoretically feasible,but might be difficult to implement experimentally. A better method might be to use fiber tows thatare precoated with thermoplastics, although these materials might be too stiff to bend at sharpcorners. The process might be more readily suited for fused deposition modeling, where a wire ofthermoplastic is fused and deposited through a tip.
CONCLUDING REMARKS
A new process to fabricate composite prototypes by 3-D photolithography is presented inthis paper. This method is unique because it can process composite parts with improved mechlanicalproperties without the need for tooling. Also the fibers can be added selectively and in a curvilinearpath. A new automated desktop photolithography unit (ADPU) was used to automatically buildfiber reinforced parts by 3-D photolithography. At the present time, the fiber content added to theresin was limited to 5 vol%, and the improvement in the m ,:hanical properties was limited; futurework will attempt to increase the fiber volume fraction. Parts with fiber dispensed in a curvilinearformat were fabricated to prove the feasibility of the concept. However the issues pertaining toidentification of optimum curvilinear fiber layout still need to be addressed.
288
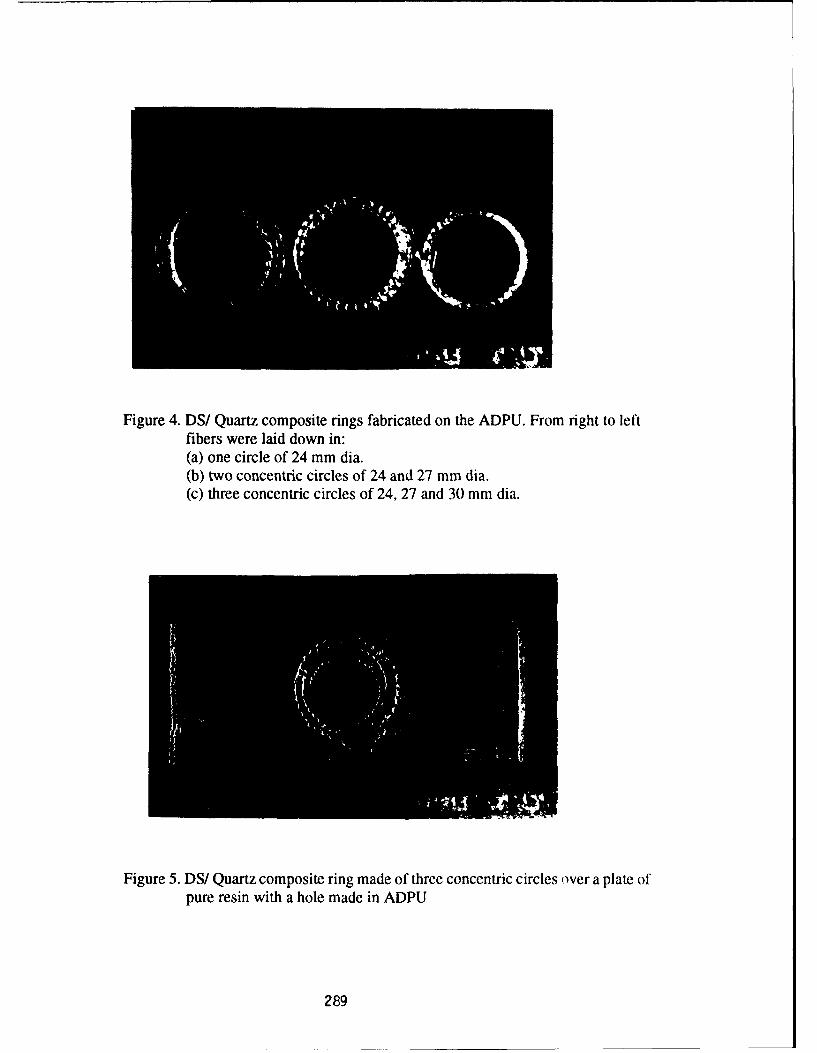
Figure 4. DS/ Quartz composite rings fabricated on the ADPU. From right to leftfibers were laid down in:(a) one circle of 24 mm dia.(b) two concentric circles of 24 and 27 mm dia.(c) three concentric circles of 24, 27 and 30 mm dia.
Figure 5. DS/ Quartz composite ring made of three concentric circles over a plate ofpure resin with a hole made in ADPU
289
REFERENCES
1. Deitz, D., "Stereolithography Automates Prototyping," Mechanical Engineering, Feb 1990,pp. 34-9 (1990).
2. Feygin, M., "LOM System goes into Production," Proc. of Second International Conference onRapid Prototyping, pp. 351-7 (1991).
3. Crump, S., "The Extrusion Process of Fused Deposition Modeling," Proc. of Third InternationalConference on Rapid Prototyping, pp. 91-102 (1992).
4. Barlow, J. W., "Metallic and Ceramic Structures from Selective Laser Sintering of CompositePowders," Proc. of Third International Conference on Rapid Prototyping, pp. 73-6 (1992).
5. Sachs, E., M. Cima, and J. Cornie, "3-D Printing: Ceramic Shells and Cores for Casting and OtherApplications," Proc. of Second International Conference on Rapid Prototyping, pp. 39-54 (1991).
6. Renault, T., A. A. Ogale, R. L. Dooley, A. Bagchi, and C. C. Jara-Almonte, "Photolithographyfor Composites Manufacturing: Continuous Glass Fiber/Polyacrylate Composites," SAMPEQuarterly. 22 (2), pp. 19-25 (1991).
7. Renault, T. and A. A. Ogale, "3-D Photolithography: Mechanical Properties of Glass and QuartzFiber Composites," Proceedings ANTEC 92, Detroit, Michigan, May 3-7, pp.745-7(1992).
8. Chartoff, R. P., P. T. Weissman, and S. M. Linden,"Advances in Polymer Technology forStereolithography," Proc. of Second International Conference on Rapid Prototyping, pp. 55-68(1991).
9. Ogale, A. A., T. Renault, A. Bagchi, C. C. Jara-Almonte and R. L. Dooley, "3-DPhotolithography for Composites Development: Discontinuous Reinforcements, " SAMPEOuarterly 23 (1), pp. 28-38 (1991).
10. Charan, R., A. Bagchi, T. Renault, and A.A. Ogale, "Fabrication of Composite Prototypes by3-D Photolithography," Proc. of Fourth International Conference on Rapid Prototyping, pp. 15-23(1993).
11. Renault, T., A. A. Ogale, and M. J. Drews, "Influence of Reinforcements on Photocuring: PhotoDynamic Mechanical Analysis," Proceedings ANTEC 93, New Orleans, May 9-13, pp.1]252-4(1993).
12. Ogale, A. A., Tr Renault, A. 3agchi, C. C. Jara-Almonte and R. L. Dooley, "Processing ofComposites by 3-D Photolithography," Proceedings of International Conference on TransportPhenomena in Processing, S. Guceri, Ed., Waikiki, Hawaii, March 22-26, pp. 13 4 2 - 5 2 (1992).
13. Hyer, M.W. and R.F. Charette, "Use of Curvilinear Fiber Format in Composite StructureDesign," AIAA Journal, 29(6), pp. 1011-15 (1991).
290
Direct Generation of Contour Files from Constructive Solid GeometryRepresentations
Sashidhar Guduri, Research AssistantRichard H. Crawford, Assistant Professor
Joseph J. Beaman, ProfessorDepartment of Mechanical Engineering
The University of Texas at AustinAustin, TX 78712
Abstract
Geometry processing for layer-based Solid Freeform Fabrication consists of at least twosteps: slicing the geometry to obtain the part contours for each layer, and scan-converting thelayers for laser scanning (or other device-dependent in-layer processing). This paper discussesthe generation of contour files directly from Constructive Solid Geometry (CSG) representationsfor the Selective Laser Sintering process. Previous work at The University of Texas focused onslicing CSG representations composed of quadric primitives. This paper extends previous workat UT to include the torus, a fourth degree- surface, as one of the CSG primitives. Slicing a torusresults in a fourth degree equation in two variables, which represents a curve in two-dimensionalreal space. For some special cases, this fourth degree equation may be sub-divided into twosecond degree equations. For the cases where the fourth degree equation cannot be sub-divided,a method is presented to approximate the fourth degree curve with second degree curvesegments.
Introduction
Solid Freeform Fabrication (SFF) techniques manufacture solid objects directly fromthree-dimensional computer models. Most SFF processes produce parts on a layer-by-layerbasis. The process begins by slicing the geometric description of the part into layers. The slicingoperation generates the contours of the part for each layer. The contours are then processed in amanner dependent upon the particular SFF technology. For instance, for Selective LaserSintering (SLS) the contours are discretized into "toggle points" at which the laser beam must bemodulated to produce the desired solid.
The geometric description used to represent solid objects significantly affects theaccuracy and quality of the final parts produce with SFF. One way to improve the final accuracyand definition of SFF parts is to improve the geometric descriptions that represent threedimensional objects. As described in [1], Constructive Solid Geometry is one geometricdescription where the accuracy of the final contours can be improved as compared to presentgeometric representations. A method was presented in [1] for generating contour files fromConstructive Solid Geometry representations composed of quadric objects. This paper extendsthat work to include higher degree surfaces (degree greater than two) in the primitive set.Special attention is given to the torus, a fourth degree surface.
Slicing a higher degree surface results in a boundary curve whose degree may be greaterthan two. A curve of degree greater than two is parametrizable if the genus (g) of the curve iszero. The genus of a curve is defined by
291
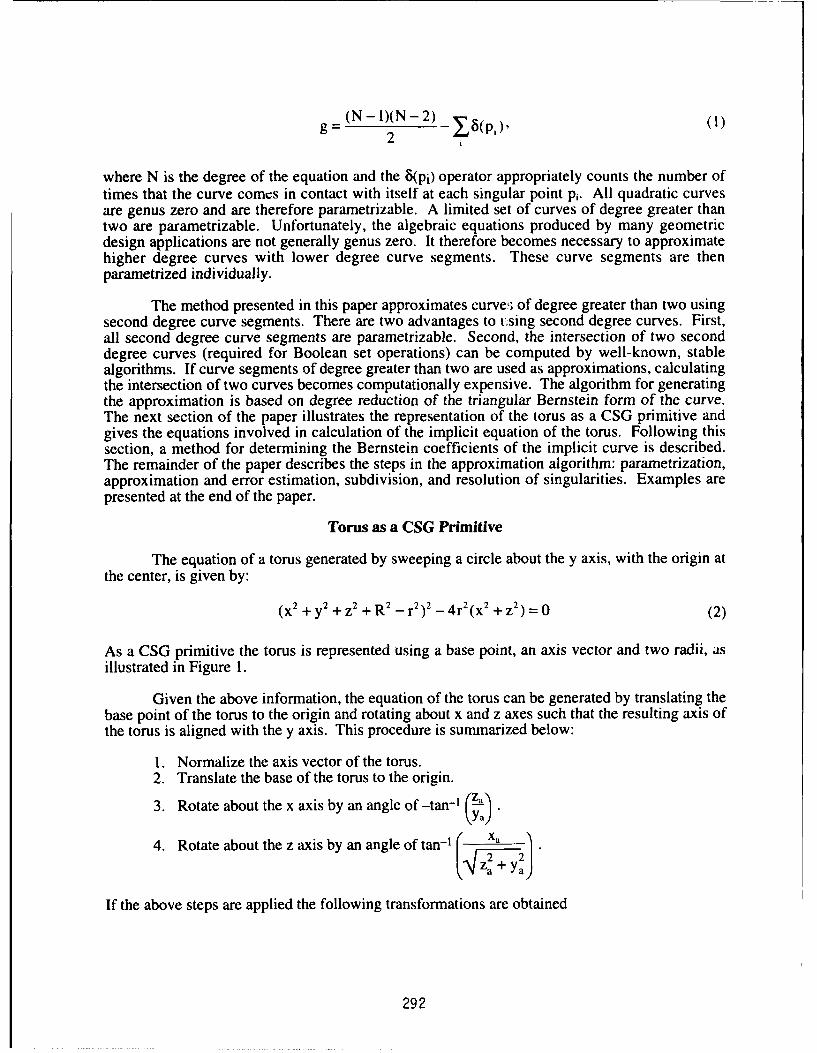
g = (N 1 )(N -2) 8 •(p'), 12
where N is the degree of the equation and the 8(pi) operator appropriately counts the number oftimes that the curve comes in contact with itself at each singular point pi. All quadratic curvesare genus zero and are therefore parametrizable. A limited set of curves of degree greater thantwo are parametrizable. Unfortunately, the algebraic equations produced by many geometricdesign applications are not generally genus zero. It therefore becomes necessary to approximatehigher degree curves with lower degree curve segments. These curve segments are thenparametrized individually.
The method presented in this paper approximates curve!; of degree greater than two usingsecond degree curve segments. There are two advantages to t-sing second degree curves. First,all second degree curve segments are parametrizable. Second, the intersection of two seconddegree curves (required for Boolean set operations) can be computed by well-known, stablealgorithms. If curve segments of degree greater than two are used as approximations, calculatingthe intersection of two curves becomes computationally expensive. The algorithm for generatingthe approximation is based on degree reduction of the triangular Bernstein form of the curve.The next section of the paper illustrates the representation of the torus as a CSG primitive andgives the equations involved in calculation of the implicit equation of the torus. Following thissection, a method for determining the Bernstein coefficients of the implicit curve is described.The remainder of the paper describes the steps in the approximation algorithm: parametrization,approximation and error estimation, subdivision, and resolution of singularities. Examples arepresented at the end of the paper.
Torus as a CSG Primitive
The equation of a torus generated by sweeping a circle about the y axis, with the origin atthe center, is given by:
(x2 + y2 + z2 + - r2)2 -4r 2 (x2 +z 2) =0 (2)
As a CSG primitive the torus is represented using a base point, an axis vector and two radii, asillustrated in Figure 1.
Given the above information, the equation of the torus can be generated by translating thebase point of the torus to the origin and rotating about x and z axes such that the resulting axis ofthe torus is aligned with the y axis. This procedure is summarized below:
1. Normalize the axis vector of the torus.2. Translate the base of the torus to the origin.
3. Rotate about the x axis by an angle of -tan-, (zp)
4. Rotate about the z axis by an angle of tan-' z a•'x
If the above steps are applied the following transformations are obtained
292
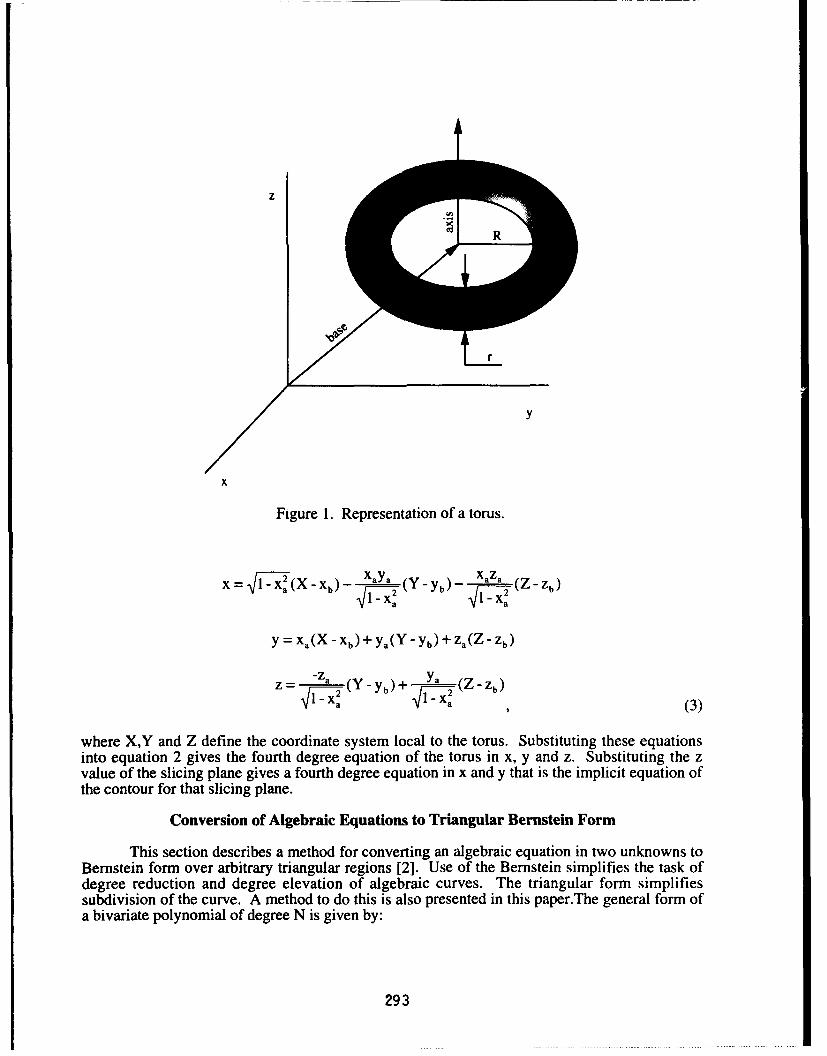
z
R
x
Figure 1. Representation of a torus.
a= l Xb) - Xa2 (Y - yb) - XaZa (Z-Z)a-X Xa-
y = Xa(X - Xb) + Ya(Y Yb) + Za(Z Zb)
z=TIZa(Y-Yb) • z b)
lX2 1-xa X(3)
where X,Y and Z define the coordinate system local to the torus. Substituting these equationsinto equation 2 gives the fourth degree equation of the torus in x, y and z. Substituting the zvalue of the slicing plane gives a fourth degree equation in x and y that is the implicit equation ofthe contour for that slicing plane.
Conversion of Algebraic Equations to Triangular Bernstein Form
This section describes a method for converting an algebraic equation in two unknowns toBernstein form over arbitrary triangular regions [2]. Use of the Bernstein simplifies the task ofdegree reduction and degree elevation of algebraic curves. The triangular form simplifiessubdivision of the curve. A method to do this is also presented in this paper.The general form ofa bivariate polynomial of degree N is given by:
293
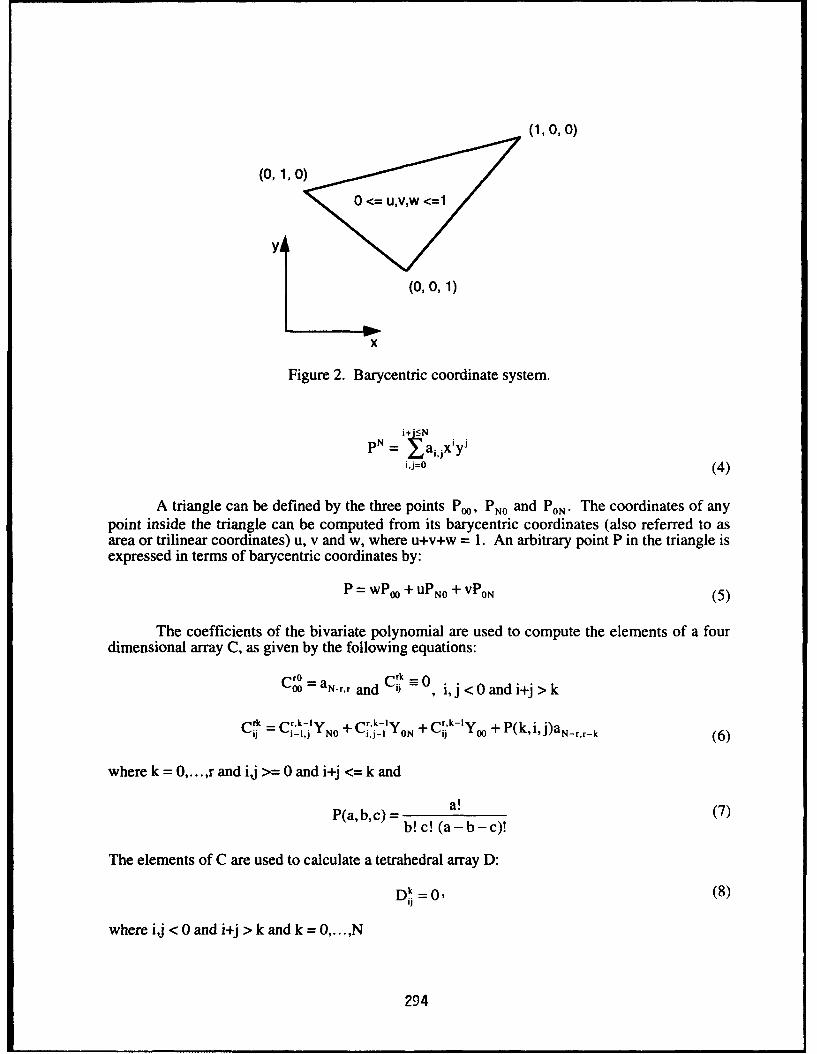
(1, 0, 0)
yA
(0,0,1)
X
Figure 2. Barycentric coordinate system.
pN = .ai~jx'yj
i j=O (4)
A triangle can be defined by the three points Poo, PNO and PON. The coordinates of anypoint inside the triangle can be computed from its barycentric coordinates (also referred to asarea or trilinear coordinates) u, v and w, where u+v+w = 1. An arbitrary point P in the triangle isexpressed in terms of barycentric coordinates by:
P = wPO0 + uPNO + VPON (5)
The coefficients of the bivariate polynomial are used to compute the elements of a fourdimensional array C, as given by the following equations:
0=aNrr and =0, i,j<0andii+j>k
Crk =r,.k-ly Crr~k-ly +cr.k-ly0+pkija_._Cii = i-C'j -NO + ij-1 ON + 00 + P(kij)aN..r-k (6)
where k = 0,....,r and ij >= 0 and i+j <= k and
P(a,b,c) = a! (7)b! c! (a - b - c)!
The elements of C are used to calculate a tetrahedral array D:
Dk =0, (8)
where ij < 0 and i+j > k and k = 0,...,N
294
D ,k = k-ijXN + k,-1iON +DkIX + Ck(9)ij -j N ' 1 ii 0 ij(9
where k = 0 ........ N and ij >= 0 and i+j <= k. Finally the Bernstein coefficients are given by:
b N = u (10)U P(N,i,j)
After the Bernstein coefficients are obtained, the algorithm proceeds with approximation, as
described in the next section.
Approximation of Higher Degree Curves
The algorithm for approximating algebraic curves of degree greater than two consists offour stages [3]. The parametrization stage builds a parametric definition. The approximationstage attempts to build a degree N-1 equation that matches the given degree N expression withinacceptable error. The subdivision stage partitions the region where the curve is defined intosmaller regions, if the region is not already too small. In the fourth stage, the algorithm resolvessingularities. The complete algorithm is summarized as follows:
Stage 1: Parametrization
An attempt is made to parametrize the curve f(x, y) = 0 if the degree is less than 3.Should the degree be greater than 2, the algorithm proceeds with the approximation stage, wherethe degree of the equation is reduced to two.
Stage 2: Approximation
If the degree k function f(x, y) monotonically increases or decreases with respect to anyone edge of the domain triangle, estimate the error present in the k-1 approximation. If the erroris within limits, return the approximation to stage I of the algorithm; if not, proceed with thesubdivision stage.
Stage 3: Subdivision
If the size of the triangular region is smaller than a preset limit, assume the regioncontains a singularity and proceed to stage 4. Otherwise, divide the triangle into subregions andreturn to stage 1.
Stage 4: Resolution of Singularities
Using quadratic transformations for resolving singularities, generate an approximation forthe curve segment through the given region.
Parametrization
If the degree of an equation is less than three, it can be parametrized. The procedureconsists of two steps. First, the Bernstein equation is transformed into standard polynomial form(eqn. 4). Then the parameter values are calculated at the intersections of the triangle and thecurve. The Bernstein equation is a function of parameters u and v. The coordinates x and y varylinearly with respect to u and v according to the following equations:
2F5
x = wX0o + UXNO + vXON
Y = wYoo + UYNO + VYON (11)
Transforming the above equations such that u and v are obtained in terms of x and y andsubstituting these equations for u and v in f(u,v), we get a bivariate polynomial equation in termsof x and y.
( x(Yo1 - Yoo) -y(Xo1 - X00)(Xlo - X~o)(Yo1 - Yoo) - (Y10 - Y~o)(Xo0 - X00)
(V x(Y 10 - Yoo) - Y(Xo - X0o)(Xo1 - X~O)(Y1o - Y~o) - (YO, - Y0o)(XIo - X0o)
f(x,y) = f(uv) (12)
The parametrization algorithm is described in [4]. The intersection points of the curve and theBernstein triangle are calculated and the appropriate curve segments are taken by determining ifthe curve segment lies inside the triangle or not.
Approximation
In this stage of the algorithm approximations of degree N-1 are generated for degree Ncurves and the characteristics such as convex hull property of the Bernstein polynomial basis areexploited to estimate the maximum error present in the approximation. This section describesthe equations involved in degree reducing and degree elevating Bernstein polynomials.
Given a degree N algebraic curve in Bernstein form, an exact representation of this curvecan be created using a degree N+1 Bernstein polynomial basis [5]. Mathematically, this meansthe expression
i~j +1) (N+lI)'!+
ij<O i!j!(N+ 1 -i-j)! y (1-x~ y)N+Iih 1 1 (13)
is equivalent to
i+j-<N N!Ij.. __ x ) -y biji,j= i!j!(N _- i_- j)!xy l (-i-)
This degree augmentation process, shown in the following equations, defines thecoefficients of the degree N+1 expression in terms of those from the degree N equation:
hN+1,O,0 = buo 9
ho.N+1o =b0No,
296
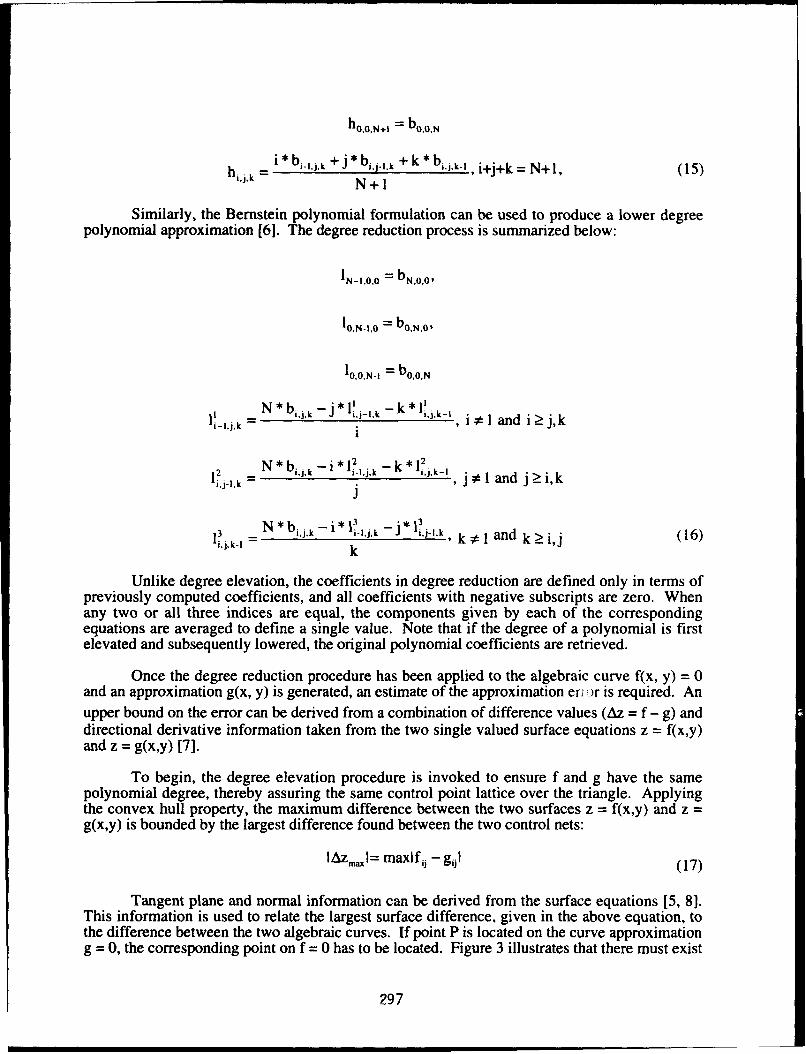
h 0o0 ,N+1 = booN
i *bi-I,j.k + j * b +k*bI.j.k- , i+j+k = N+1, (15)"'~~ N+1
Similarly, the Bernstein polynomial formulation can be used to produce a lower degreepolynomial approximation [6]. The degree reduction process is summarized below:
IN-1,OO =bN,oO,O
l10,N1,0 bo.N.,
10.0N.I = booN
it'.~ Niik j itJ•k-k l'' - I i land iýj,k
1I N*bik _i *12 i k12
i-j-kN.j.k -k*Cj.k-, j j#1 and j _ i,k
N*bi,j,k _ili'jk J*i j'1k, k #l and k > ij (16)i~jk-I k
Unlike degree elevation, the coefficients in degree reduction are defined only in terms ofpreviously computed coefficients, and all coefficients with negative subscripts are zero. Whenany two or all three indices are equal, the components given by each of the correspondingequations are averaged to define a single value. Note that if the degree of a polynomial is firstelevated and subsequently lowered, the original polynomial coefficients are retrieved.
Once the degree reduction procedure has been applied to the algebraic curve f(x, y) = 0and an approximation g(x, y) is generated, an estimate of the approximation en or is required. Anupper bound on the error can be derived from a combination of difference values (Az = f - g) anddirectional derivative information taken from the two single valued surface equations z = f(x,y)and z = g(x,y) [7].
To begin, the degree elevation procedure is invoked to ensure f and g have the samepolynomial degree, thereby assuring the same control point lattice over the triangle. Applyingthe convex hull property, the maximum difference between the two surfaces z = f(x,y) and z =g(x,y) is bounded by the largest difference found between the two control nets:
IAz.l= maxlf i - g9i0 (17)
Tangent plane and normal information can be derived from the surface equations [5, 8].This information is used to relate the largest surface difference, given in the above equation, tothe difference between the two algebraic curves. If point P is located on the curve approximationg = 0, the corresponding point on f = 0 has to be located. Figure 3 illustrates that there must exist
297
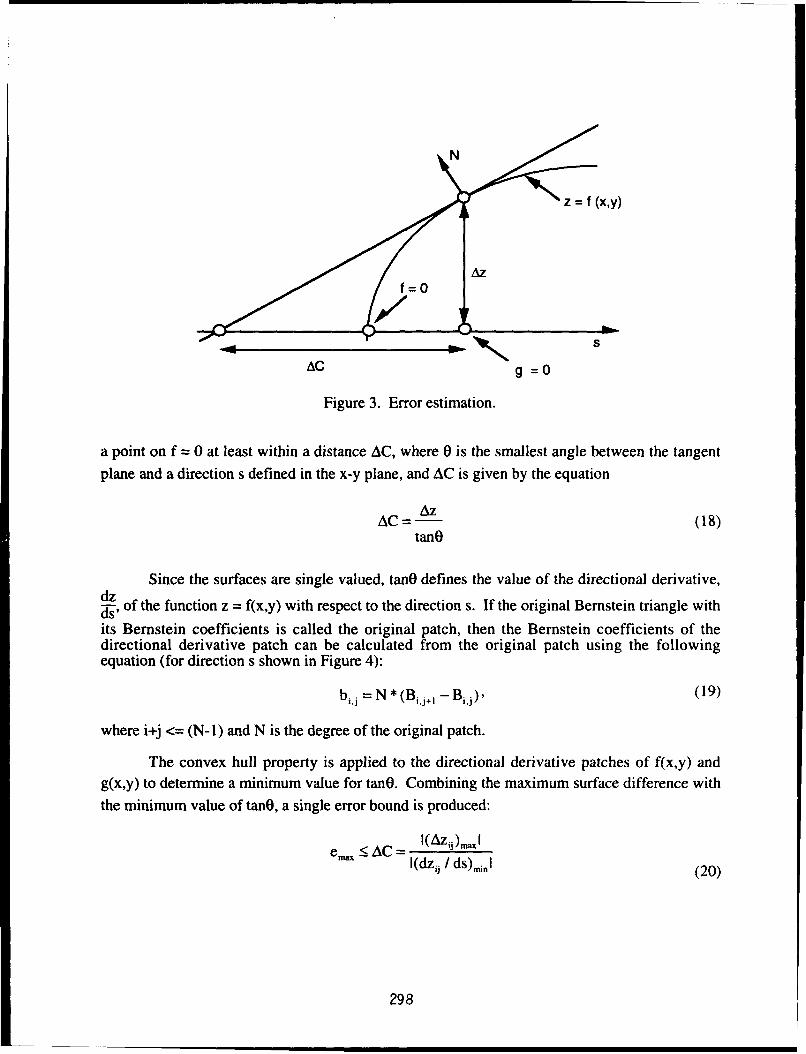
Figure 3. Error estimation.
a point on f = 0 at least within a distance AC, where 0 is the smallest angle between the tangentplane and a direction s defined in the x-y plane, and AC is given by the equation
A zC = (18)
tanO
Since the surfaces are single valued, tanO defines the value of the directional derivative,dz... ..d-, of the function z = f(x,y) with respect to the direction s. If the original Bernstein triangle with
its Bernstein coefficients is called the original patch, then the Bernstein coefficients of thedirectional derivative patch can be calculated from the original patch using the followingequation (for direction s shown in Figure 4):
bij = N * (Bij+I - Bi,j), (19)
where i+j <= (N-i) and N is the degree of the original patch.
The convex hull property is applied to the directional derivative patches of f(x,y) andg(x,y) to determine a minimum value for tanG. Combining the maximum surface difference withthe minimum value of tanG, a single error bound is produced:
e ,,. S AC = I(Azij)maxlI(dz1, / ds).il (20)
298
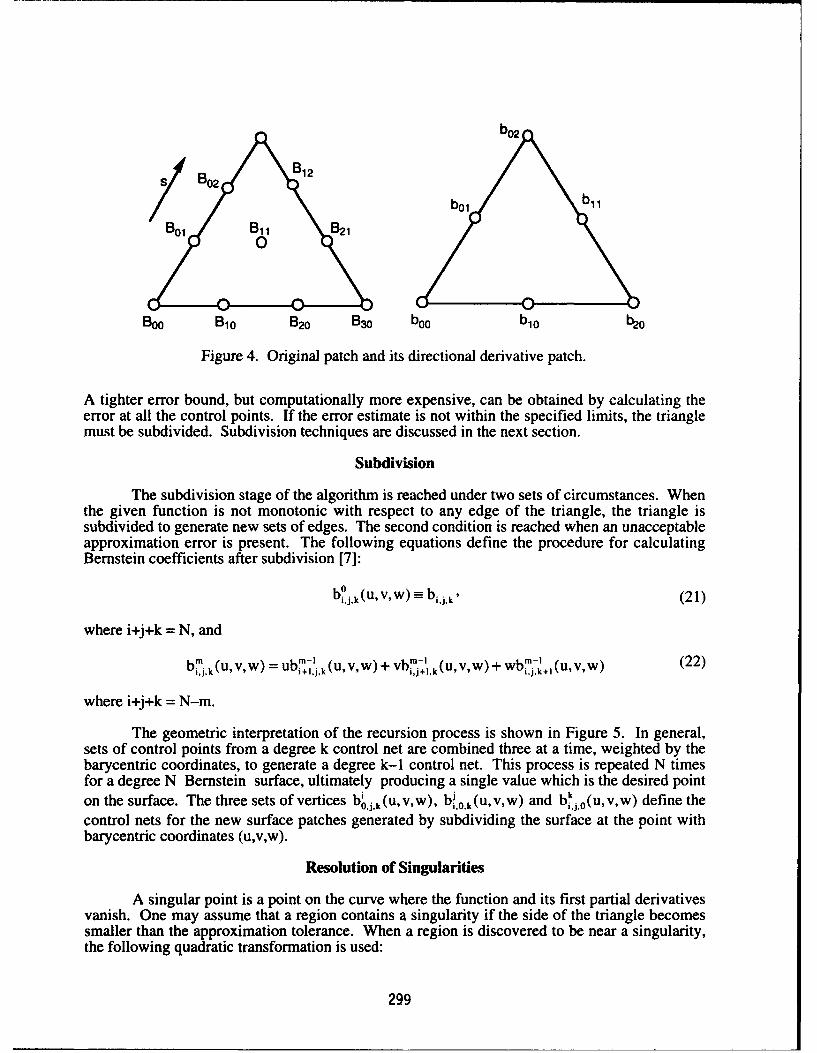
B01 Bj 1 B21 obl
0
Boo Blo B20 B30 boo blo b20
Figure 4. Original patch and its directional derivative patch.
A tighter error bound, but computationally more expensive, can be obtained by calculating theerror at all the control points. If the error estimate is not within the specified limits, the trianglemust be subdivided. Subdivision techniques are discussed in the next section.
Subdivision
The subdivision stage of the algorithm is reached under two sets of circumstances. Whenthe given function is not monotonic with respect to any edge of the triangle, the triangle issubdivided to generate new sets of edges. The second condition is reached when an unacceptableapproximation error is present. The following equations define the procedure for calculatingBernstein coefficients after subdivision [7]:
bij,k (u, v, w) " (21)
where i+j+k = N, andbij.k(u,v,w) = ubijl. (U,VW) + vbil,k(u,v,w) + wbi7 +i (u,v,w)
where i+j+k = N-in.
The geometric interpretation of the recursion process is shown in Figure 5. In general,sets of control points from a degree k control net are combined three at a time, weighted by thebarycentric coordinates, to generate a degree k-I control net. This process is repeated N timesfor a degree N Bernstein surface, ultimately producing a single value which is the desired pointon the surface. The three sets of vertices bk(u,v,w), Ok(uvw) and bj. 0(u,v,w) define thecontrol nets for the new surface patches generated by subdividing the surface at the point withbarycentric coordinates (u,v,w).
Resolution of Singularities
A singular point is a point on the curve where the function and its first partial derivativesvanish. One may assume that a region contains a singularity if the side of the triangle becomessmaller than the approximation tolerance. When a region is discovered to be near a singularity,the following quadratic transformation is used:
299
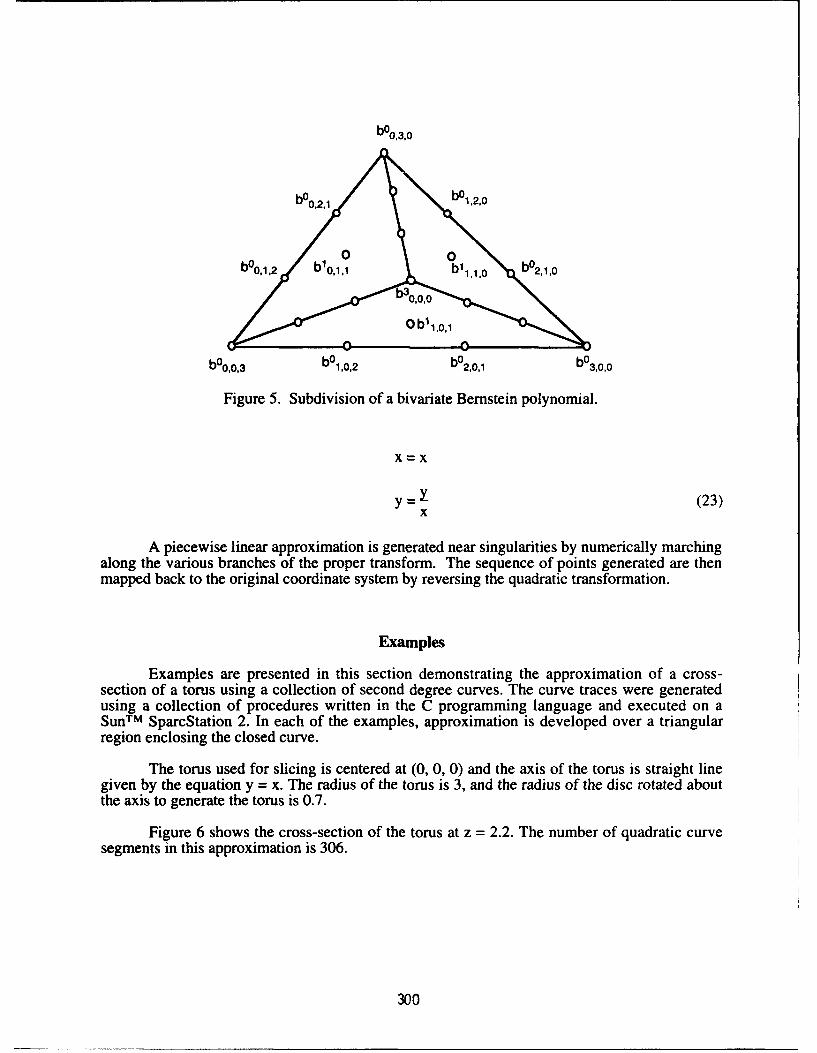
b00 30
b~o,2,1 O,2.0
boo0 0b O 12 b10,1,1 b 11,1,0 b °2, 1,o
0Ob11,o,1
b~oo,3 b 01,0 ,2 b0
2 ,0 ,1 b°3,0,0
Figure 5. Subdivision of a bivariate Bernstein polynomial.
x-x
y =Y (23)x
A piecewise linear approximation is generated near singularities by numerically marchingalong the various branches of the proper transform. The sequence of points generated are thenmapped back to the original coordinate system by reversing the quadratic transformation.
Examples
Examples are presented in this section demonstrating the approximation of a cross-section of a torus using a collection of second degree curves. The curve traces were generatedusing a collection of procedures written in the C programming language and executed on aSunTM SparcStation 2. In each of the examples, approximation is developed over a triangularregion enclosing the closed curve.
The torus used for slicing is centered at (0, 0, 0) and the axis of the torus is straight linegiven by the equation y = x. The radius of the torus is 3, and the radius of the disc rotated aboutthe axis to generate the torus is 0.7.
Figure 6 shows the cross-section of the torus at z = 2.2. The number of quadratic curvesegments in this approximation is 306.
300
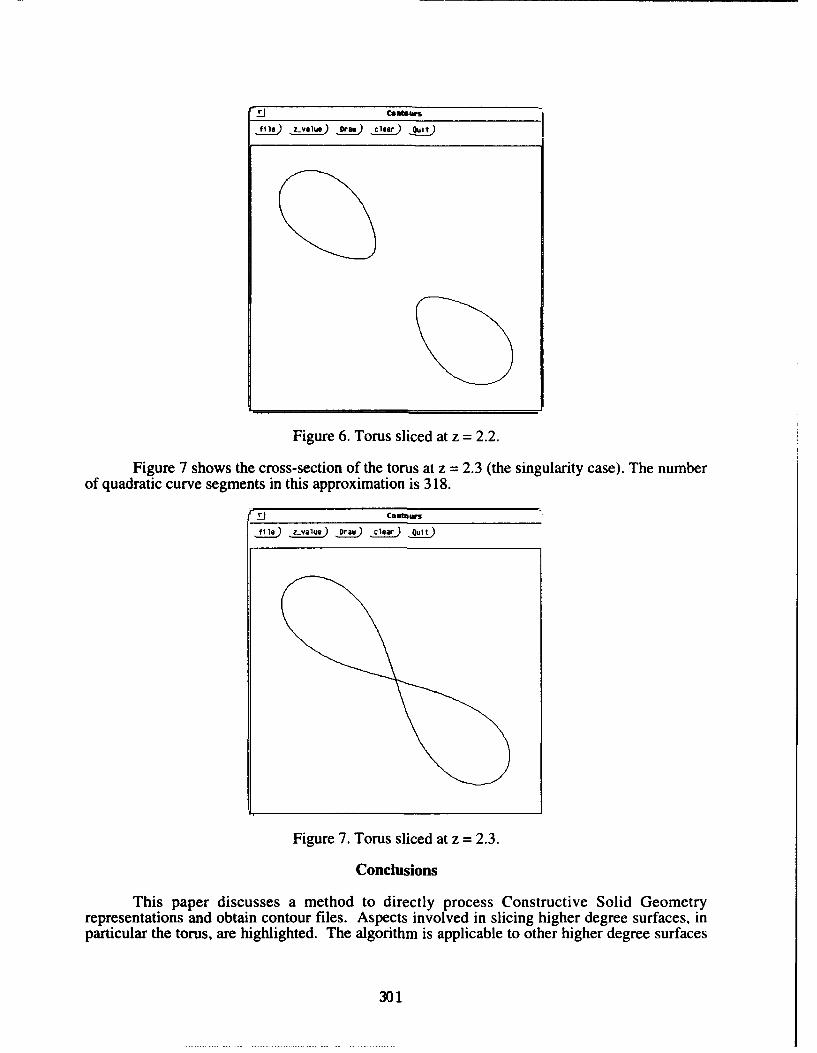
fi-e ) .. l ) Dre) ) it
Figure 6. Torus sliced at z = 2.2.
Figure 7 shows the cross-section of the torus at z = 2.3 (the singularity case). The numberof quadratic curve segments in this approximation is 318.
Srl oetmurs
fýile) z-.vaiue) DRew) clear) Quit)
Figure 7. Torus sliced at z = 2.3.
Conclusions
This paper discusses a method to directly process Constructive Solid Geometryrepresentations and obtain contour files. Aspects involved in slicing higher degree surfaces, inparticular the torus, are highlighted. The algorithm is applicable to other higher degree surfaces
301
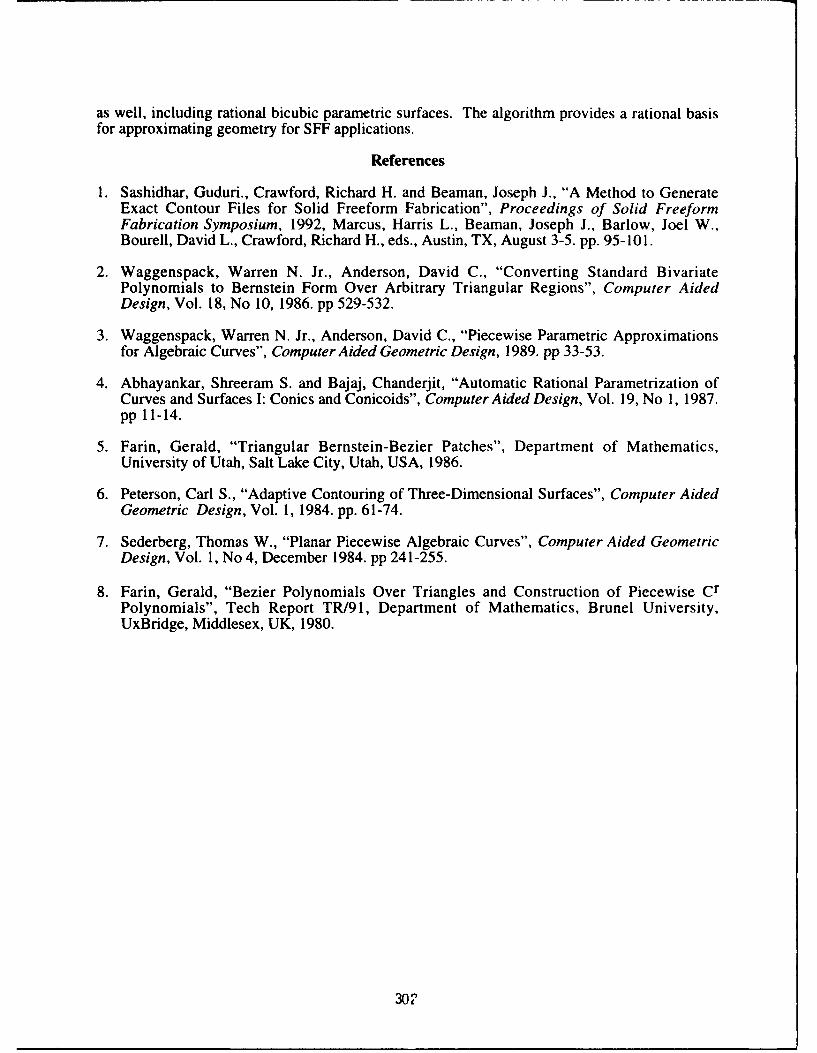
as well, including rational bicubic parametric surfaces. The algorithm provides a rational basis
for approximating geometry for SFF applications.
References
1. Sashidhar, Guduri., Crawford, Richard H. and Beaman, Joseph J., "A Method to GenerateExact Contour Files for Solid Freeform Fabrication", Proceedings of Solid FreeformFabrication Symposium, 1992, Marcus, Harris L., Beaman, Joseph J., Barlow, Joel W.,Bourell, David L., Crawford, Richard H., eds., Austin, TX, August 3-5. pp. 95-101.
2. Waggenspack, Warren N. Jr., Anderson, David C., "Converting Standard BivariatePolynomials to Bernstein Form Over Arbitrary Triangular Regions", Computer AidedDesign, Vol. 18, No 10, 1986. pp 529-532.
3. Waggenspack, Warren N. Jr., Anderson, David C., "Piecewise Parametric Approximationsfor Algebraic Curves", Computer Aided Geometric Design, 1989. pp 33-53.
4. Abhayankar, Shreeram S. and Bajaj, Chanderjit, "Automatic Rational Parametrization ofCurves and Surfaces I: Conics and Conicoids", Computer Aided Design, Vol. 19, No 1, 1987.pp 11-14.
5. Farin, Gerald, "Triangular Bernstein-Bezier Patches", Department of Mathematics,University of Utah, Salt Lake City, Utah, USA, 1986.
6. Peterson, Carl S., "Adaptive Contouring of Three-Dimensional Surfaces", Computer AidedGeometric Design, Vol. 1, 1984. pp. 61-74.
7. Sederberg, Thomas W., "Planar Piecewise Algebraic Curves", Computer Aided GeometricDesign, Vol. 1, No 4, December 1984. pp 241-255.
8. Farin, Gerald, "Bezier Polynomials Over Triangles and Construction of Piecewise CrPolynomials", Tech Report TR/91, Department of Mathematics, Brunel University,UxBridge, Middlesex, UK, 1980.
30I
Indirect Metal Composite Part Manufacture Using the SLS Process
James R. Tobinl, B. Badrinarayan 2 , J. W. Barlow2 , J. J. Beamanl, and D. L. Bourelll3
1. Department of Mechanical Engineering2. Department of Chemical Engineering
3. The Center for Materials Science and Engineering
ABSTRACT
As a near term alternative process to direct metal sintering, an intermediatepolymer binder is combined with powder to produce green preforms with theSelective Laser Sintering (SLS) process. To produce parts with desirable strengthand dimensional control, the binder is gradually removed from the green preform(obtained from the SLS process), and the remaining form is lightly bonded. Thisporous part is then infiltrated. Final part density, shrinkage, and strength data arepresented. An injection mold insert was fabricated from this material and used tomold ABS, PMMA, polyester, and polycarbonate parts. To date, the mold inserthas survived 176 shots at injection pressures up to 35,000 psi and melttemperatures of up to 300"C.
INTRODUCTION
Molds to be used for the injection molding of thermoplastics aretraditionally manufactured from cast metal by precision metal cutting devices.The machining and polishing times are quite extensive and the costs arecorrespondingly high. These high costs and production times effectively precludethe preparation of prototype plastic parts by injection molding. Prototype plasticparts are consequently usually manufactured by other processes. Unfortunately,the properties of such parts may not be truly representative of those of injectionmolded parts due to the thermal stresses and molecular orientation inherent to theinjection molding process.
Clearly, there is a great need for low cost, low production time moldswhich could produce the 50 - 500 plastic parts needed to prove a design. TheUniversity of Texas at Austin is presently investigating new material systems andprocesses that potentially permit the rapid fabrication of molds by SLS andsubsequent processes. In addition to cost and time savings, potential advantagesto mold making by the SLS process include: incorporation of custom coolingchannels and other features that are not easily machined, ease of manufacturingduplicate molds, opportunity to evaluate the runner system prior to machining aproduction mold, and ease of cavity design by use of commercial CAD solidmodelers.
Two of the important goals of the material system and process include:minimal, predictable, shrinkage from original CAD design, and sufficient strengthfor withstanding injection pressures and temperatures. With most powderprocesses, there is usually a trade-off between minimal shrinkage and strength.In an attempt to minimize shrinkage issues and still have enough strength, apowder/infiltrant system was chosen as the first material system for investigation.
303
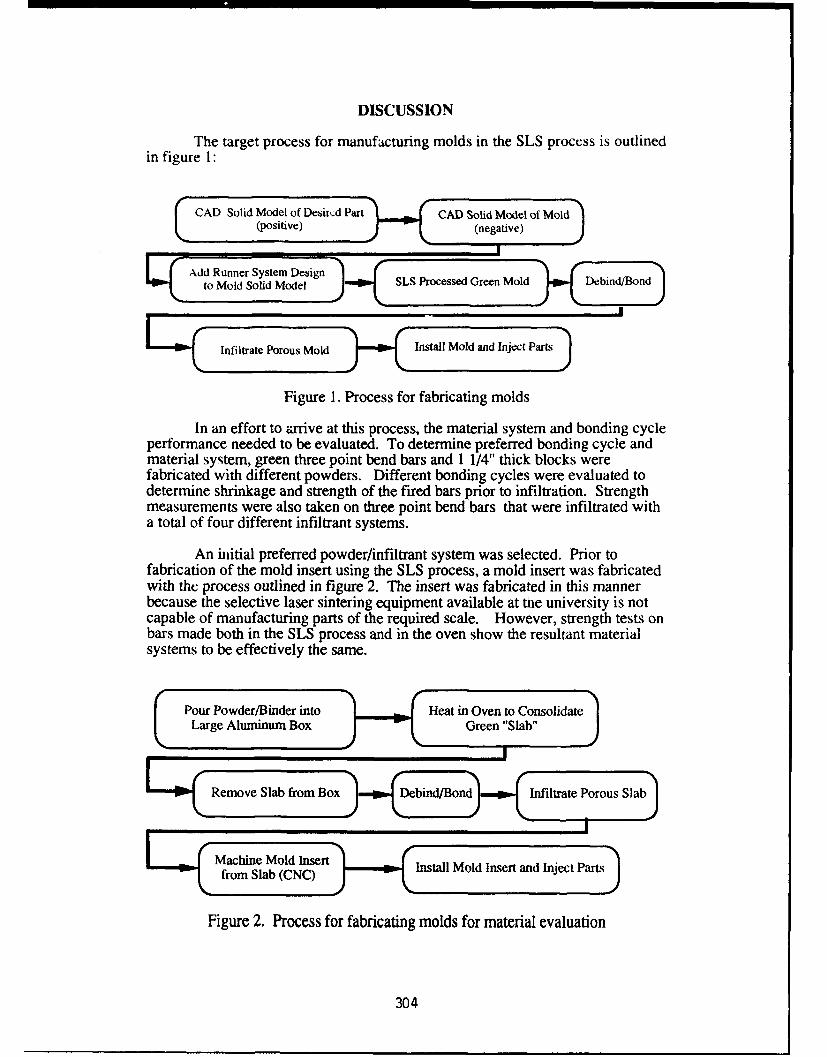
DISCUSSION
The target process for manufacturing molds in the SLS process is outlinedin figure 1:
•CAD Solid Model of Desird Part (pstv)CAD Solid Mý-ode fMlljeai
... to Mold Solid Model SLS Processed Green Mold Debind!Bond
Infiltrate Porous M~old Install Mold and Inject Parts
Figure 1. Process for fabricating molds
In an effort to arrive at this process, the material system and bonding cycleperformance needed to be evaluated. To determine preferred bonding cycle andmaterial system, green three point bend bars and 1 1/4" thick blocks werefabricated with different powders. Different bonding cycles were evaluated todetermine shrinkage and strength of the fired bars prior to infiltration. Strengthmeasurements were also taken on three point bend bars that were infiltrated witha total of four different infiltrant systems.
An initial preferred powder/infiltrant system was selected. Prior tofabrication of the mold insert using the SLS process, a mold insert was fabricatedwith the process outlined in figure 2. The insert was fabricated in this mannerbecause the selective laser sintering equipment available at the university is notcapable of manufacturing parts of the required scale. However, strength tests onbars made both in the SLS process and in the oven show the resultant materialsystems to be effectively the same.
E Large Aluminum Box / -Green "Slab"
-- CRemnove Slab from B~o~x •= Debind/Bond)- Ihnfiltrate Porous Slab)
• ~~Machine Mold Insert •Install Mold Insert and Inject PartsfrmSa(NC
from Slab (CNC)
Figure 2. Process for fabricating molds for material evaluation
304
Figure 3 shows a photograph of a completed mold assembly. For testingpurposes, a standard Master Unit Die plaque mold was modified by replacing thesteel plaque cavity with the insert. As shown in the foreground, the insert is 8.4"x 5.3" x 0.6" and the part cavity is 5" x 2.5" x 0.25". It is equipped with sevenstandard ejector pins (4 through holes in the part cavity, and 3 through holes in therunner cavity). The runner is 1/4" in diameter and the letters are 1/16" deep. Theinsert was not channeled for water cooling. For this reason, the cooling timeswere kept long (near 55 seconds).
Figure 3. Mold Assembly
RESULTS
Table 1 shows the average density and strength measurements taken on 10SLS processed three point bend bars with the same material used to fabricate thetooling insert.
TABLE 1
SLS Processed Three Point Bend Bar Data
Relative Density (%) Modulus of Rupture (psi)
Green: 51 421
Porous: 32 95
Infiltrated: 98 3,841
305
These same bars demonstrated linear shrinkages of 0.45% in the X direction,0.82% in the Y direction, and 1.41% in the Z direction. To date, the 1 1/4" thickblocks have also shown linear shrinkages of less than 2% in all directions afterbonding.
Table 2 shows the molding conditions used to inject the first 176 shots intothe mold insert.
TABLE 2Molding Conditions
Polymer # of Shots Peak Inj. Temperature (QC) InjectionPress. (psi) zones 1, 2, 3, & 4 Time (sec)
ABS 101 8000 200,190,200,200 3
PMMA 28 35000 175, 170, 160, 160 3
Kodar A150 22 35000 275, 275, 275, 275 4
PC 25 35000 245, 275, 300, 300 4
Additionally, for all plastics, the injection hold pressure time was set to 2 secondsand the cooling time was set to 55 seconds.
Observations of the molded parts show only 2 defects during the 176 shotrun. Both of these defects occurred while molding PMMA. At shot 105 a hairlinefracture (perhaps surface) started at one of the ejector pins and grew over the next25 shots to a total length of approximately one inch. The crack did not noticeablypropagate further after that point and did not affect the performance of the moldother than the faint mark left in the moldings. At shot 123, a small but noticeablechip of material around another ejector pin broke loose. This breakage progressedthrough shot 127 to a total size of approximately 1/16" x 3/16" x 1/16". Thisdefect, similar to the hairline fracture, did not grow further. We are currently inthe process of evaluating mold erosion by measuring dimensions of the moldedparts.
CONCLUSIONS
The generally low shrinkages associated with post processing green shapessuggest acceptably good geometric fidelity for successful molding of plastic parts.Our evaluation of the mold material is presently incomplete, however, these initialresults are most encouraging. They suggest that even materials with relativelylow strengths can be adequate for prototype insert service, provided reasonablecare is exercised in the overall tool design. Mold erosion does not qualitativelyappear to be significant. The deficiencies seen near 2 out of 7 ejector pins are ofsome concern. We are presently developing a higher strength material that couldcorrect this problem. Ejector pin sleeves could also be installed in future designs.
We intend to prepare new inserts with cooling channels and variousgeometric features to gain additional understanding of the relationships betweeninsert material properties, mold design, and molding conditions
306

ACKNOWLEDGMENTS
The authors gratefully acknowledge the financial and general '.upport of the DTMCorporation, Austin, Texas, for portions of this work. J. Tobin especially wishesto thank Brian Carr of the DTM Corporation and Hank Franklin of the UT AustinMechanical Engineering Machine Shop for their assistance.
307
Solid Freeform Fabrication of Silicon Carbide Shapes by Selective Laser
Reaction Sintering (SLRS)
BR. Birmingham and H.L. Marcus
Center for Afaterials Science and Engineering
The University of Texas at Austin
Austin. Texas 78712
Abstract
This paper describes an investigation of the production of silicon carbide shapes by
Selective Laser Reaction Sintering (SLRS). One type of SLRS process, which combines
laser sintering of silicon with acetylene decomposition, is briefly outlined, and the
mechanisms important to the process are discussed. A series of test shapes are made at
different acetylene pressures to determine pressure effects on conversion to silicon
carbide. X-ray diffraction spectroscopy is used for bulk analysis of the shapes, and Auger
electron spectroscopy is used for surface analysis. The results indicate that acetylene
pressure does have a strong effect on silicon conversion to silicon carbide, and SLRS can
be used successfully to make silicon carbide shapes.
Introduction
Selective Laser Reaction Sintering as a Solid Freeform Fabrication (SFF)
technique and the processing equipment used for this study have been previously reported
[I]. Briefly, the technique uses a scanning laser to selectively sinter a thin layer of
powder. Laser sintering is accompanied by a reaction between sintering powders or
sintering powder(s) and a gas precursor. The sintering/reaction combination results in a
solid layer of material compositionally different from the powder source(s). Successive
layers of powder are spread and selectively laser reaction sintered to build up the desired
shape.
308
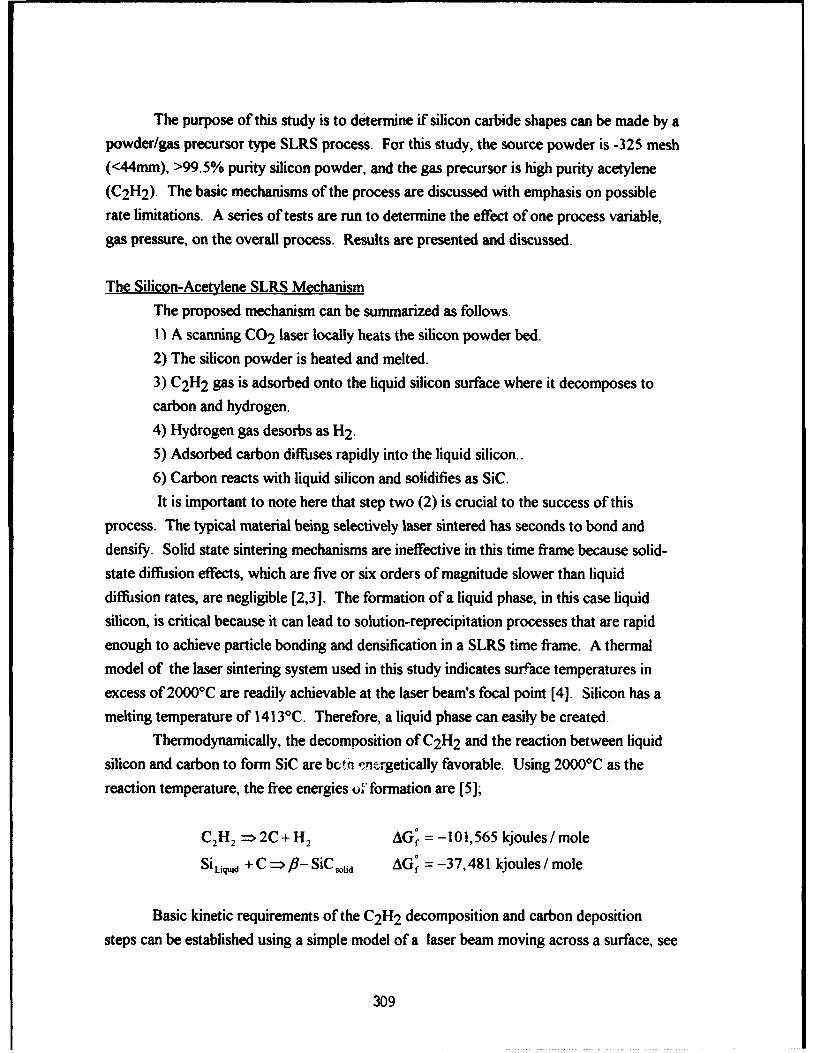
The purpose of this study is to determine if silicon carbide shapes can be made by a
powder/gas precursor type SLRS process. For this study, the source powder is -325 mesh
(<44mm), >99.5% purity silicon powder, and the gas precursor is high purity acetylene(C2 H2 ). The basic mechanisms of the process are discussed with emphasis on possiblerate limitations. A series of tests are run to determine the effect of one process variable,
gas pressure, on the overall process. Results are presented and discussed.
The Silicon-Acetylene SLRS Mechanism
The proposed mechanism can be summarized as follows.
1) A scanning CO2 laser locally heats the silicon powder bed.
2) The silicon powder is heated and melted.
3) C2 H2 gas is adsorbed onto the liquid silicon surface where it decomposes to
carbon and hydrogen.
4) Hydrogen gas desorbs as H2 .
5) Adsorbed carbon diffuses rapidly into the liquid silicon..
6) Carbon reacts with liquid silicon and solidifies as SiC.
It is important to note here that step two (2) is crucial to the success of this
process. The typical material being selectively laser sintered has seconds to bond and
densify. Solid state sintering mechanisms are ineffective in this time frame because solid-
state diffusion effects, which are five or six orders of magnitude slower than liquid
diffusion rates, are negligible [2,3]. The formation of a liquid phase, in this case liquid
silicon, is critical because it can lead to solution-reprecipitation processes that are rapid
enough to achieve particle bonding and densification in a SLRS time frame. A thermalmodel of the laser sintering system used in this study indicates surface temperatures in
excess of 2000'C are readily achievable at the laser beam's focal point [4]. Silicon has amelting temperature of 1413'C. Therefore, a liquid phase can easily be created.
Thermodynamically, the decomposition of C2 H2 and the reaction between liquid
silicon and carbon to form SiC are bci fn ýirgetically favorable. Using 2000'C as thereaction temperature, the free energies uo formation are [5];
C 2• 2 => 2C + H2 AGf = -101,565 kjoules / mole
Si Liqd +C => 8- SiC •oid AG = -37,481 kjoules/mole
Basic kinetic requirements of the C2 H2 decomposition and carbon deposition
steps can be established using a simple model of a laser beam moving across a surface, see
309
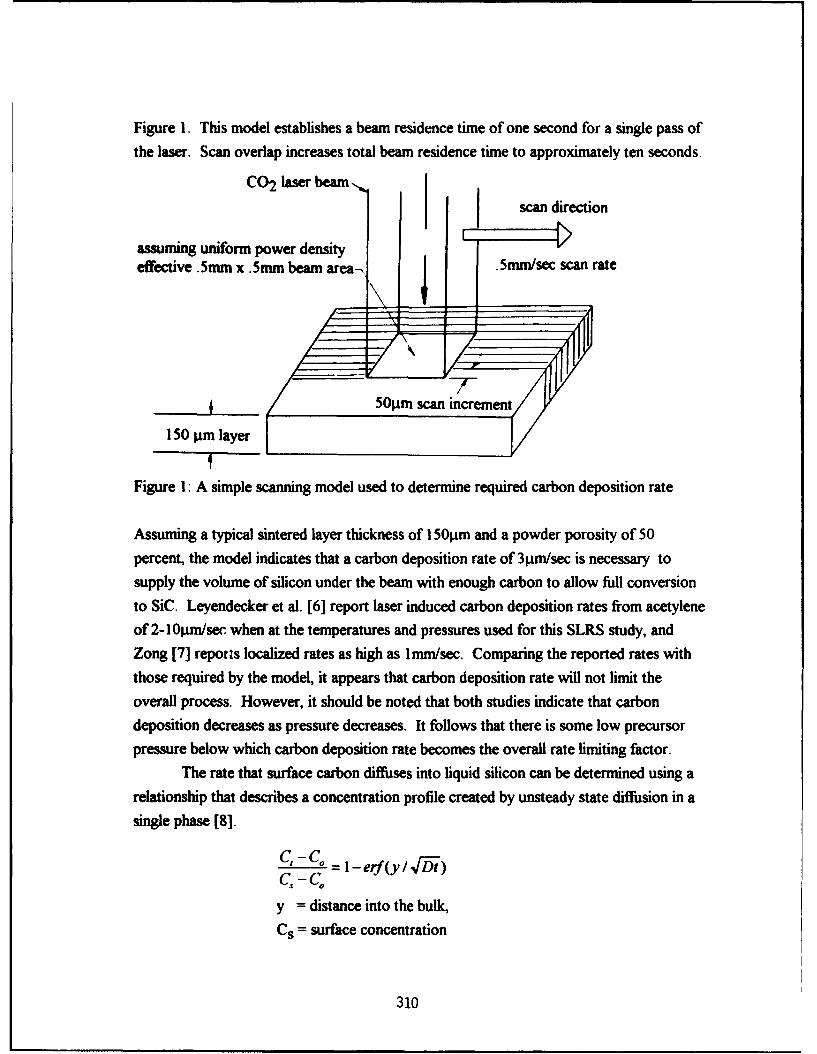
Figure 1. This model establishes a beam residence time of one second for a single pass ofthe laser. Scan overlap increases total beam residence time to approximately ten seconds.
CO2 laser beam
scan direction
assuming uniform power density .e v5mm x.5mm beam area I.5mm/sec scan rate
-! -
50pm scan increment
150 pm layer P
Figure 1: A simple scanning model used to determine required carbon deposition rate
Assuming a typical sintered layer thickness of 150pm and a powder porosity of 50percent, the model indicates that a carbon deposition rate of 3prn/sec is necessary tosupply the volume of silicon under the beam with enough carbon to allow full conversionto SiC. Leyendecker et al. [6] report laser induced carbon deposition rates from acetyleneof 2-101pm/se, when at the temperatures and pressures used for this SLRS study, andZong [7] reports localized rates as high as 1mm/sec. Comparing the reported rates withthose required by the model, it appears that carbon deposition rate will not limit theoverall process. However, it should be noted that both studies indicate that carbondeposition decreases as pressure decreases. It follows that there is some low precursorpressure below which carbon deposition rate becomes the overall rate limiting factor.
The rate that surface carbon diffuses into liquid silicon can be determined using arelationship that describes a concentration profile created by unsteady state diffusion in a
single phase [8].
-Co -C.=I- -erf(y / f/-)c*-co
y = distance into the bulk,
Cs = surface concentration
310
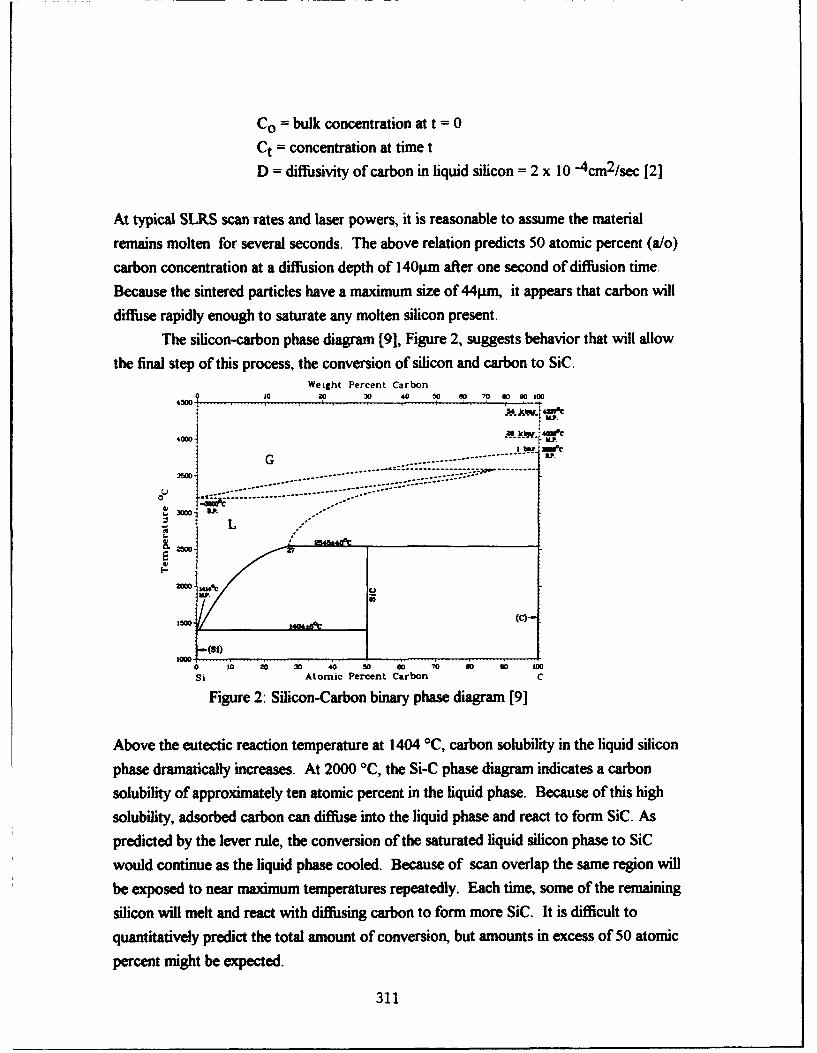
Co = bulk concentration at t = 0
Ct= concentration at time t
D = diffusivity of carbon in liquid silicon = 2 x 10 4cm2/sec [2]
At typical SLRS scan rates and laser powers, it is reasonable to assume the materialremains molten for several seconds. The above relation predicts 50 atomic percent (a/o)
carbon concentration at a diffusion depth of 140pm after one second of diffusion time.Because the sintered particles have a maximum size of 44pr, it appears that carbon will
diffuse rapidly enough to saturate any molten silicon present.The silicon-carbon phase diagram [91, Figure 2, suggests behavior that will allow
the final step of this process, the conversion of silicon and carbon to SiC.Weight Percent Carbon
0 10 20 30 40 W0 so 70 so 90 100454.I00c
ae kr - 4606
- - -1-- -014000 ... ...
Une
• ';.................... --- ------- - - - --
13000 -. .
L
E
(C)
0 10 i0 30 40 50 6o 7o so so 100
Si Atomic Percent Carbon C
Figure 2: Silicon-Carbon binary phase diagram [9]
Above the eutectic reaction temperature at 1404 °C, carbon solubility in the liquid silicon
phase dramatically increases. At 2000 °C, the Si-C phase diagram indicates a carbonsolubility of approximately ten atomic percent in the liquid phase. Because of this high
solubility, adsorbed carbon can diffuse into the liquid phase and react to form SiC. Aspredicted by the lever rule, the conversion of the saturated liquid silicon phase to SiC
would continue as the liquid phase cooled. Because of scan overlap the same region willbe exposed to near maximum temperatures repeatedly. Each time, some of the remaining
silicon will melt and react with diffusing carbon to form more SiC. It is difficult toquantitatively predict the total amount of conversion, but amounts in excess of 50 atomic
percent might be expected.
311
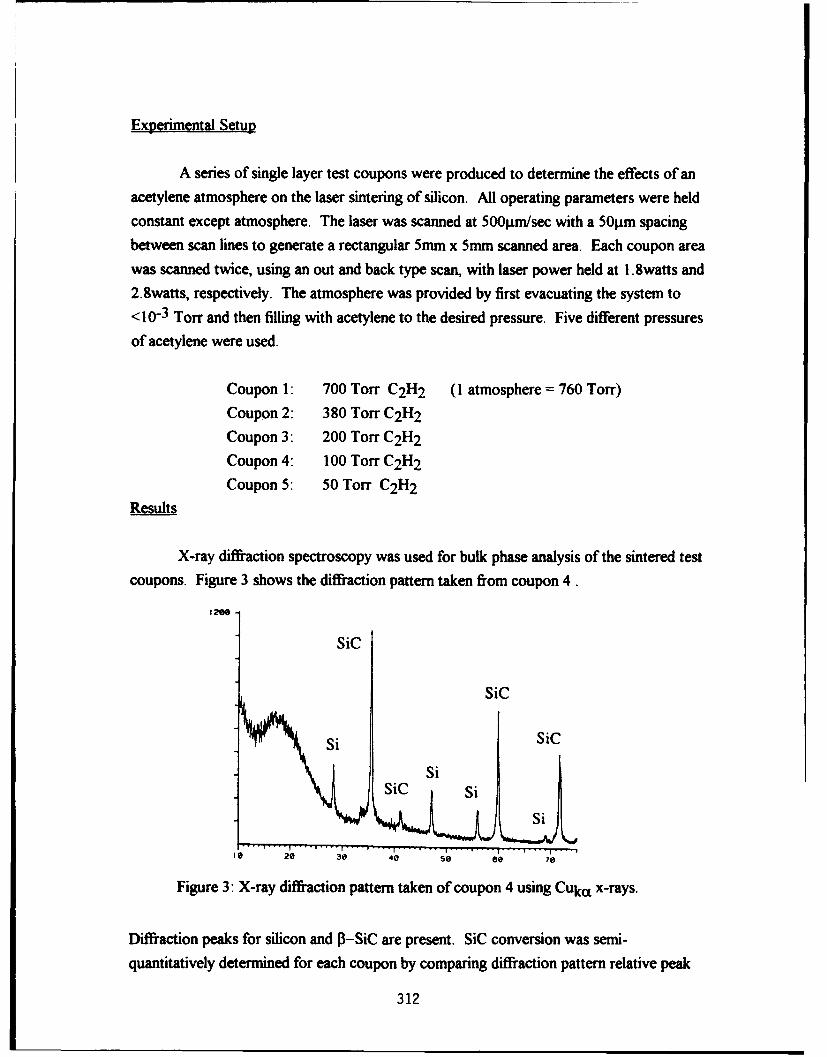
Experimental Setup
A series of single layer test coupons were produced to determine the effects of anacetylene atmosphere on the laser sintering of silicon. All operating parameters were heldconstant except atmosphere. The laser was scanned at 500pm/sec with a 50pm spacingbetween scan lines to generate a rectangular 5mm x 5mm scanned area. Each coupon areawas scanned twice, using an out and back type scan, with laser power held at 1.8watts and2.8watts, respectively. The atmosphere was provided by first evacuating the system to< 10-3 Torr and then filling with acetylene to the desired pressure. Five different pressures
of acetylene were used.
Coupon 1: 700 Torr C2H2 (1 atmosphere = 760 Torr)Coupon 2: 380 Torr C2H2
Coupon 3: 200 Torr C2H2
Coupon 4: 100 Torr C2 H2
Coupon 5: 50 Torr C2H2
Results
X-ray diffraction spectroscopy was used for bulk phase analysis of the sintered test
coupons. Figure 3 shows the diffraction pattern taken from coupon 4.
SiC
SiC
Sisic S
Si
26 30 40 so ee 70
Figure 3: X-ray diffraction pattern taken of coupon 4 using Cuka x-rays.
Diffraction peaks for silicon and P3-SiC are present. SiC conversion was semi-
quantitatively determined for each coupon by comparing diffraction pattern relative peak
312
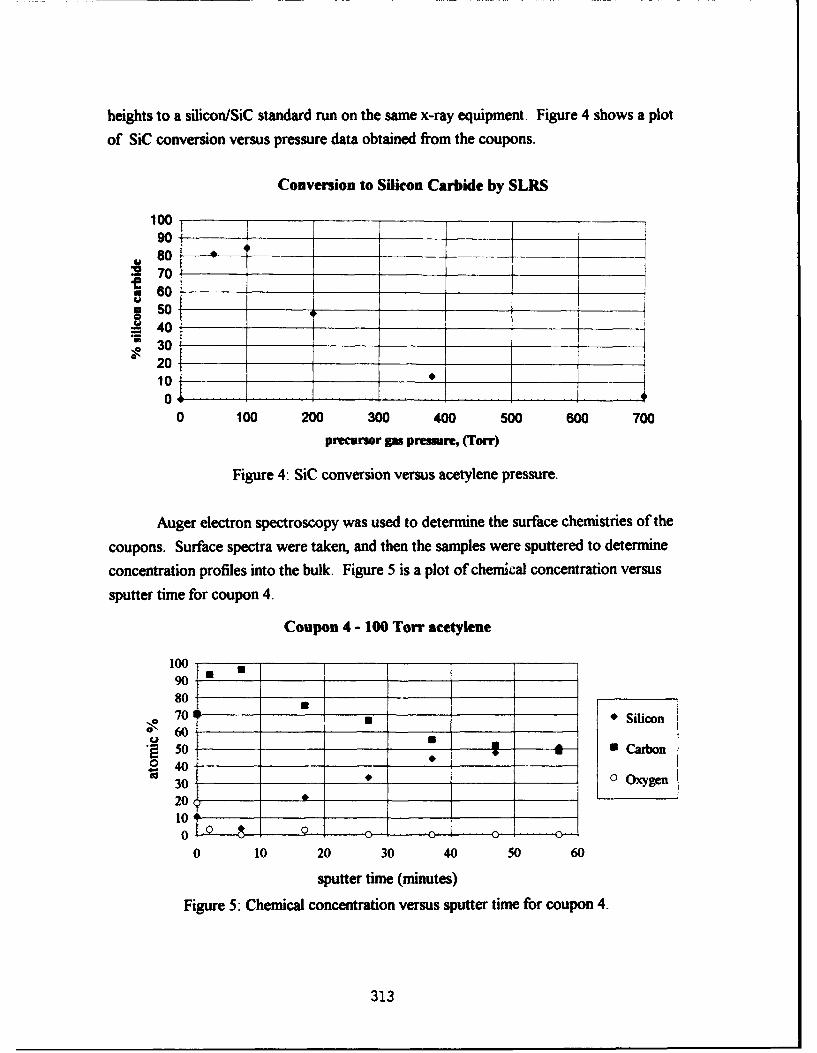
heights to a silicon/SiC standard run on the same x-ray equipment. Figure 4 shows a plot
of SiC conversion versus pressure data obtained from the coupons.
Conversion to Silicon Carbide by SLRS
100901 _
80 -S70
S60
*50_ _ __ _ __ __
~40
2010 -
0 100 200 300 400 500 600 700precursor gas pressure, (Torr)
Figure 4: SiC conversion versus acetylene pressure.
Auger electron spectroscopy was used to determine the surface chemistries of the
coupons. Surface spectra were taken, and then the samples were sputtered to determine
concentration profiles into the bulk. Figure 5 is a plot of chemical concentration versus
sputter time for coupon 4.
Coupon 4 - 100 Torr acetylene
100 T90 •80701 * Silicon
"50 - - - • Carbon0 40 -
30 0__ Oxygen2010 .0 .• 0 .. . .. . . . . .. . . . .
0 10 20 30 40 50 60
sputter time (minutes)
Figure 5: Chemical concentration versus sputter time for coupon 4.
313
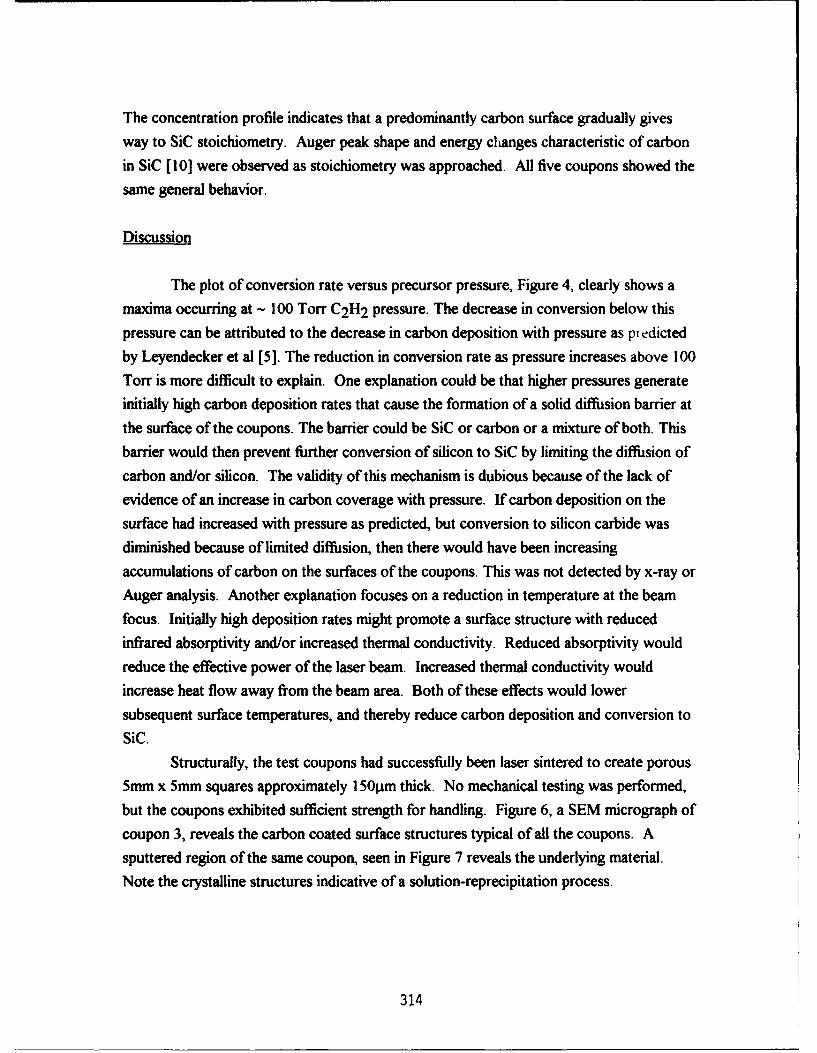
The concentration profile indicates that a predominantly carbon surface gradually givesway to SiC stoichiometry. Auger peak shape and energy changes characteristic of carbon
in SiC [101 were observed as stoichiometry was approached. All five coupons showed thesame general behavior.
Discussion
The plot of conversion rate versus precursor pressure, Figure 4, clearly shows amaxima occurring at - 100 Torr C2H2 pressure. The decrease in conversion below thispressure can be attributed to the decrease in carbon deposition with pressure as predicted
by Leyendecker et al [5]. The reduction in conversion rate as pressure increases above 100Torr is more difficult to explain. One explanation could be that higher pressures generateinitially high carbon deposition rates that cause the formation of a solid diffusion barrier atthe surface of the coupons. The barrier could be SiC or carbon or a mixture of both. Thisbarrier would then prevent further conversion of silicon to SiC by limiting the diffusion ofcarbon and/or silicon. The validity of this mechanism is dubious because of the lack ofevidence of an increase in carbon coverage with pressure. If carbon deposition on thesurface had increased with pressure as predicted, but conversion to silicon carbide wasdiminished because of limited diffusion, then there would have been increasingaccumulations of carbon on the surfaces of the coupons. This was not detected by x-ray orAuger analysis. Another explanation focuses on a reduction in temperature at the beamfocus. Initially high deposition rates might promote a surface structure with reducedinfrared absorptivity and/or increased thermal conductivity. Reduced absorptivity wouldreduce the effective power of the laser beam. Increased thermal conductivity wouldincrease heat flow away from the beam area. Both of these effects would lower
subsequent surface temperatures, and thereby reduce carbon deposition and conversion toSiC.
Structurally, the test coupons had successfully been laser sintered to create porous5mm x 5mm squares approximately 150pm thick. No mechanical testing was performed,but the coupons exhibited sufficient strength for handling. Figure 6, a SEM micrograph ofcoupon 3, reveals the carbon coated surface structures typical of all the coupons. Asputtered region of the same coupon, seen in Figure 7 reveals the underlying material.Note the crystalline structures indicative of a solution-reprecipitation process.
314
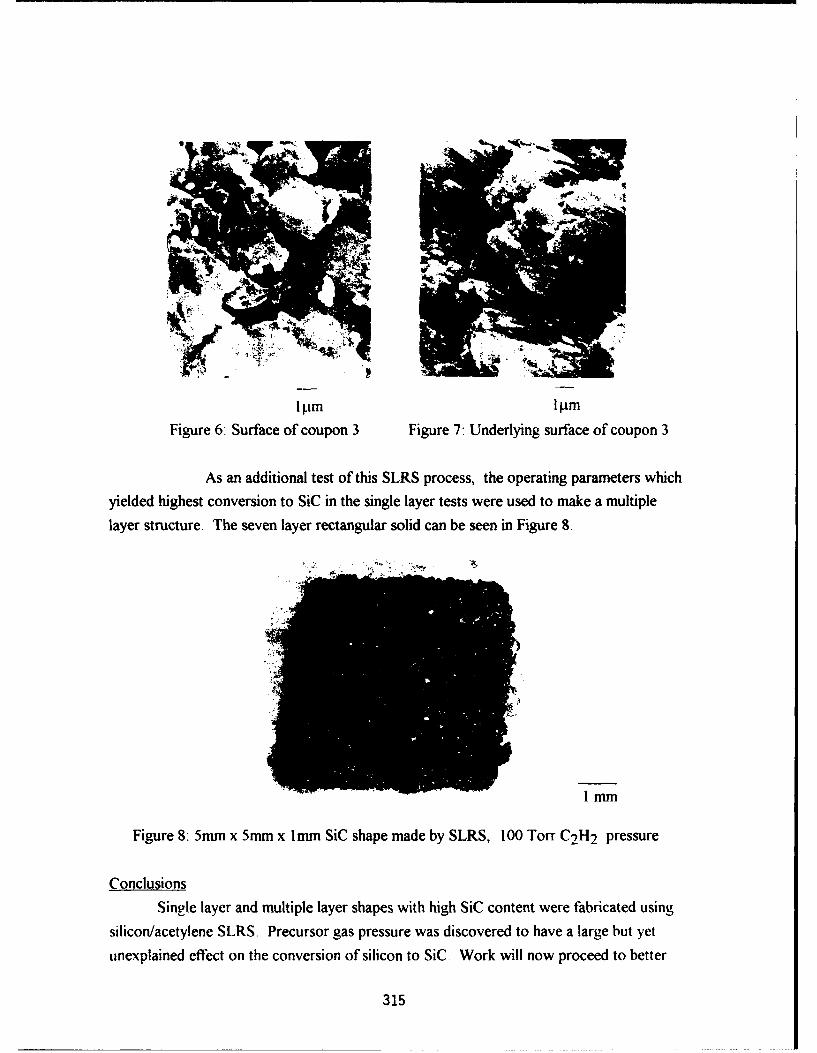
I m mFigure 6: Surface of coupon 3 Figure 7: Underlying surface of coupon 3
As an additional test of this SLRS process, the operating parameters which
yielded highest conversion to SiC in the single layer tests were used to make a multiple
layer structure. The seven layer rectangular solid can be seen in Figure 8.
1mm
Figure 8: 5mm x 5mm x 1mm SiC shape made by SLRS, 100 Torr C2 H2 pressure
ConclusionsSingle layer and multiple layer shapes with high SiC content were fabricated using
silicon/acetylene SLRS. Precursor gas pressure was discovered to have a large but yet
unexplained effect on the conversion of silicon to SiC Work will now proceed to better
315

understand the mechanisms of the process so that operating parameters can be controlled
to produce denser, stronger, more fully converted multiple layer SiC shapes.
Acknowledgments
Thanks go to the Office of Naval Research, grant # N00014-92-J-1514, for
support of this work.
References
1. B.R. Birmingham, J.V. Tompkins, G. Zong, and H.L. Marcus, "Development of aSelective Laser Reaction Sintering Workstation," Proceedings of the SolidFreeform Fabrication Symposium, Austin, Texas, August, 1992, pp 147-153.
2. Silicon Chemical Etching, edited by J. Grabmier, Berlin, Springer-Verlag, 1982,
p62.
3. Ibid, p 28.
4. G. Zong, "Solid Freeform Fabrication Using Gas Phase Selective Area LaserDeposition," Ph.D. Dissertation, The University of Texas at Austin, Austin, Texas,1991, pp 90-105.
5. JANAF Thermochemical Tables, 2nd edition, edited by D.R. Shull and H. Prophetet al., NSRDS-NBS37, U.S. Department of Commerce, National Bureau ofStandards.
6. G. Leyendecker, H. Noll, D. Bauerle, P. Geittner, and H. Lydtin, "RapidDetermination of Apparent Activation Energies in Chemical Vapor Deposition,"Journal of Electrochemical Society: Solid-State Science and Technology, January,1983, pp 157-160.
7. G. Zong, "Solid Freeform Fabrication Using Gas Phase Selective Area LaserDeposition," Ph.D. Dissertation, The University of Texas at Austin, Austin, Texas,1991, p 76.
8. F.D. Richardson, Physical Chemistry of Melts in Metallurgy Vol.2, London,Academic Press, 1974, pp 398-399.
9. Binary Alloy Phase Diagrams, 2nd edition, T.B. Massalski editor-in-chief, Ohio,ASM International, 1990, pp 882-883.
10. J.C. Riviere, The Analyst, 108, 1983, p 649.
316
SUPERSOLIDUS LIQUID PHASE SELECTIVE LASER SINTERINGOF PREALLOYED BRONZE POWDER
Gopalakrishna B. Prabhu and David L. Bourell,Center for Materials Science and Engineering,The University of Texas at Austin, Austin TX 78712.
Abstrac
The use of Selective Laser Sintering (SLS) as a method of Solid FreeformFabrication (SFF) in the direct sintering of metal powders to form the final part has beeninvestigated earlier [1,2,31. The phenomenon of supersolidus liquid phase sintering(SLPS) is studied using prealloyed bronze powder. The influence of laser parameters,bed temperature and secondary heat treatment on the density and the dimensional stabilityof the final product are discussed.
Introduction
Supersolidus Liquid Phase Sintering (SLPS) involves heating prealloyedpowder to a temperature between the solidus and the liquidus to attain partial melting [4].Densification occurs by capillary-induced rearrangement and solution reprecipitation in thepartially liquid particles and is shown in Figure 1. Liquid forms along grain boundariesand regions of contact. The sintering temperature and alloy composition are thus the mostimportant process variables needing optimization since they dictate the liquid fraction. Atypical amount of liquid is 30% which is slightly higher than that observed in liquid phasesintering of mixed powders [5,6,7]. The requisites for a material system include a higherconcentration of the alloying element and steep solidus and liquidus lines. A higherconcentration in general gives a larger separation between the solidus and the liquidus andso a larger temperature range to investigate. Steep solidus and liquidus lines are desirablebecause temperature control becomes less critical as the volume fraction of the liquid doesnot change rapidly. Taking into account these requisites and making use of phasediagrams, the Cu-Sn system with a nominal composition of 89Cu- I ISn was chosen forstudy. The phase diagram of the Cu-Sn system is shown in Figure 2.
Experimental Procedure
The SLS technique and the workstations used have been describedelsewhere [8,9]. In the present study, the prealloyed bronze powder was sintered usingeither a Nd-YAG or a C02 laser. The main laser parameters are listed in Table 1.
Initial experiments were conducted in a room temperature environment 4oestablish optimum laser parameters. Multilayer parts were made with a laser power of 35watts and a scan speed of 2.5 cm/sec. Attempts to make parts with higher powers wereunsuccessful because of excessive curling of the part due to the presence of residualstresses in the part when it cooled down to room temperature. The next set of experimentswere run using a high temperature bed in order to alleviate the residual stresses and to
317
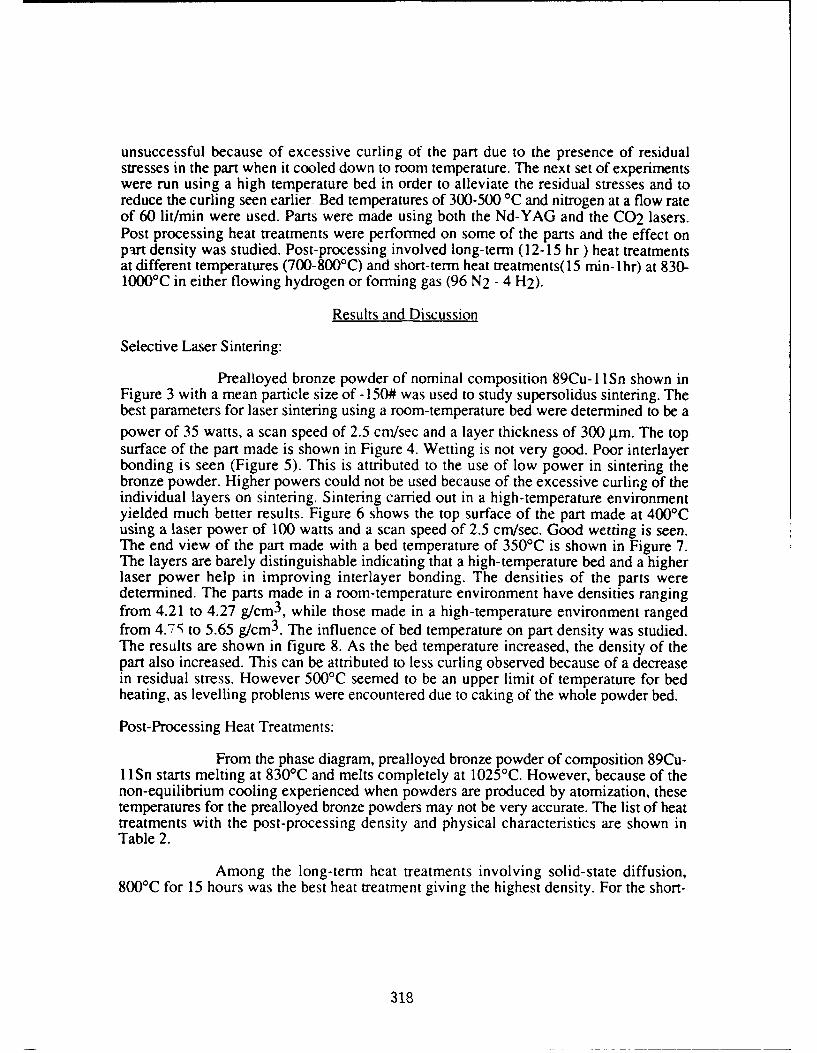
unsuccessful because of excessive curling of the part due to the presence of residualstresses in the part when it cooled down to room temperature. The next set of experimentswere run using a high temperature bed in order to alleviate the residual stresses and toreduce the curling seen earlier. Bed temperatures of 300-500 'C and nitrogen at a flow rateof 60 lit/min were used. Parts were made using both the Nd-YAG and the C02 lasers.Post processing heat treatments were performed on some of the parts and the effect onpart density was studied. Post-processing involved long-term (12-15 hr ) heat treatmentsat different temperatures (700-800'C) and short-term heat treatments(15 min-lhr) at 830-1000'C in either flowing hydrogen or forming gas (96 N2 - 4 H2).
Results and Discussion
Selective Laser Sintering:
Prealloyed bronze powder of nominal composition 89Cu- I ISn shown inFigure 3 with a mean particle size of -150# was used to study supersolidus sintering. Thebest parameters for laser sintering using a room-temperature bed were determined to be apower of 35 watts, a scan speed of 2.5 cm/sec and a layer thickness of 300 gam. The topsurface of the part made is shown in Figure 4. Wetting is not very good. Poor interlayerbonding is seen (Figure 5). This is attributed to the use of low power in sintering thebronze powder. Higher powers could not be used because of the excessive curling of theindividual layers on sintering. Sintering carried out in a high-temperature environmentyielded much better results. Figure 6 shows the top surface of the part made at 4001Cusing a laser power of 100 watts and a scan speed of 2.5 cm/sec. Good wetting is seen.The end view of the part made with a bed temperature of 350'C is shown in Figure 7.The layers are barely distinguishable indicating that a high-temperature bed and a higherlaser power help in improving interlayer bonding. The densities of the parts weredetermined. The parts made in a room-temperature environment have densities rangingfrom 4.21 to 4.27 g/cm 3 , while those made in a high-temperature environment rangedfrom 4.7S to 5.65 g/cm 3 . The influence of bed temperature on part density was studied.The results are shown in figure 8. As the bed temperature increased, the density of thepart also increased. This can be attributed to less curling observed because of a decreasein residual stress. However 500'C seemed to be an upper limit of temperature for bedheating, as levelling problems were encountered due to caking of the whole powder bed.
Post-Processing Heat Treatments:
From the phase diagram, prealloyed bronze powder of composition 89Cu-1 Sn starts melting at 830'C and melts completely at 1025°C. However, because of thenon-equilibrium cooling experienced when powders are produced by atomization, thesetemperatures for the prealloyed bronze powders may not be very accurate. The list of heattreatments with the post-processing density and physical characteristics are shown inTable 2.
Among the long-term heat treatments involving solid-state diffusion,800'C for 15 hours was the best heat treatment giving the highest density. For the short-
318
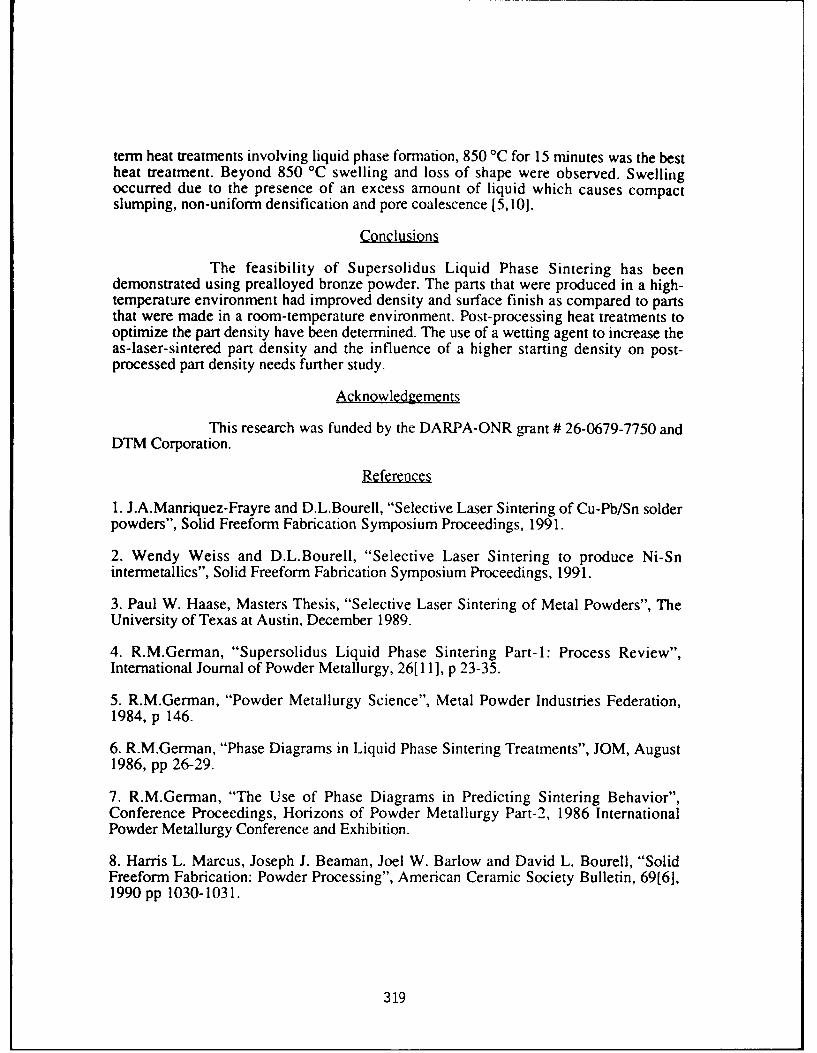
term heat treatments involving liquid phase formation, 850 OC for 15 minutes was the bestheat treatment. Beyond 850 °C swelling and loss of shape were observed. Swellingoccurred due to the presence of an excess amount of liquid which causes compactslumping, non-uniform densification and pore coalescence [5,10].
Conclusions
The feasibility of Supersolidus Liquid Phase Sintering has beendemonstrated using prealloyed bronze powder. The parts that were produced in a high-temperature environment had improved density and surface finish as compared to partsthat were made in a room-temperature environment. Post-processing heat treatments tooptimize the part density have been determined. The use of a wetting agent to increase theas-laser-sintered part density and the influence of a higher starting density on post-processed part density needs further study.
Acknowledgements
This research was funded by the DARPA-ONR grant # 26-0679-7750 andDTM Corporation.
References
1. J.A.Manriquez-Frayre and D.L.Bourell, "Selective Laser Sintering of Cu-Pb/Sn solderpowders", Solid Freeform Fabrication Symposium Proceedings, 1991.
2. Wendy Weiss and D.L.Bourell, "Selective Laser Sintering to produce Ni-Snintermetallics", Solid Freeform Fabrication Symposium Proceedings, 1991.
3. Paul W. Haase, Masters Thesis, "Selective Laser Sintering of Metal Powders", TheUniversity of Texas at Austin, December 1989.
4. R.M.German, "Supersolidus Liquid Phase Sintering Part-I: Process Review",International Journal of Powder Metallurgy, 26[111, p 23-35.
5. R.M.German, "Powder Metallurgy Science", Metal Powder Industries Federation,1984, p 146.
6. R.M.German, "Phase Diagrams in Liquid Phase Sintering Treatments", JOM, August1986, pp 26-29.
7. R.M.German, "The Use of Phase Diagrams in Predicting Sintering Behavior",Conference Proceedings, Horizons of Powder Metallurgy Part-2, 1986 InternationalPowder Metallurgy Conference and Exhibition.
8. Harris L. Marcus, Joseph J. Beaman, Joel W. Barlow and David L. Bourell, "SolidFreeform Fabrication: Powder Processing", American Ceramic Society Bulletin, 69[6],1990 pp 1030-1031.
319
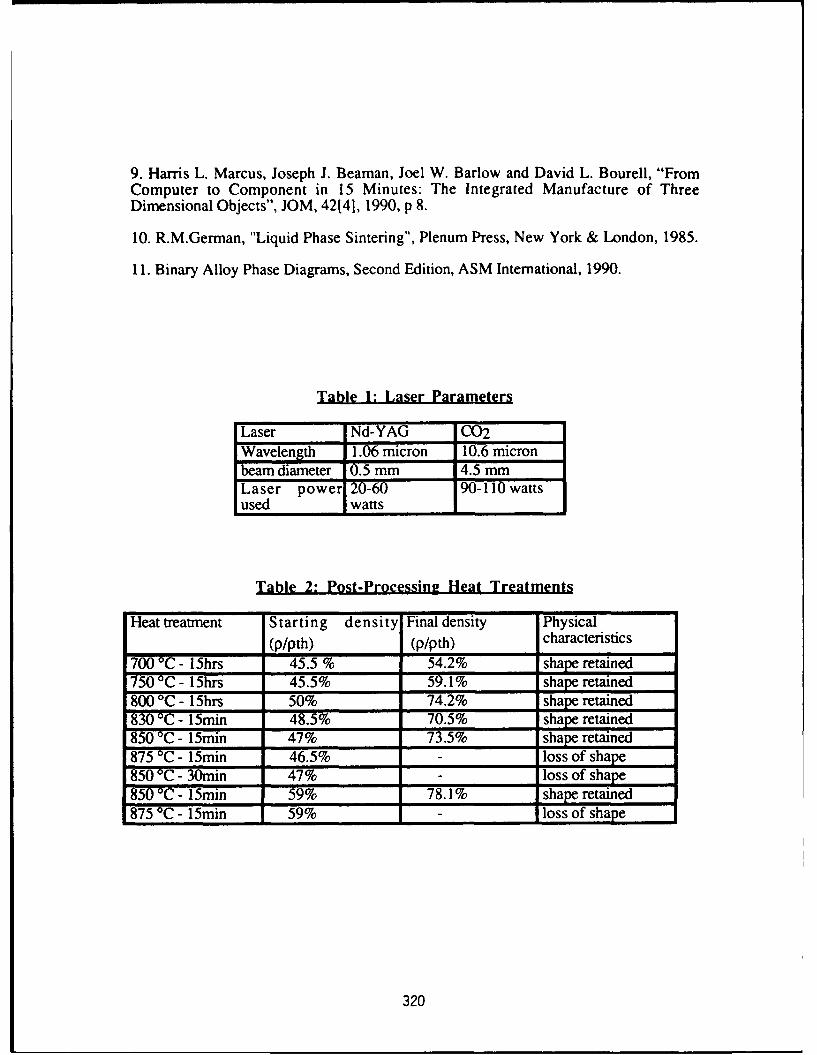
9. Harris L. Marcus, Joseph J. Beaman, Joel W. Barlow and David L. Bourell, "FromComputer to Component in 15 Minutes: The Integrated Manufacture of ThreeDimensional Objects", JOM, 42[41, 1990, p 8.
10. R.M.German, "Liquid Phase Sintering", Plenum Press, New York & London, 1985.
11. Binary Alloy Phase Diagrams, Second Edition, ASM International, 1990.
Table 1: Laser Parameters
Laser Nd-YAG C02Wavelength 1.06 micron 10.6 micronbeam diameter 0.5 mm 4.5 mmLaser power 20-60 90-110 watts
used watts I
Table 2: Post-Processing Heat Treatments
Heat treatment Starting density Final density Physical(p/pth) (p/pth) characteristics
700 'C - 15hrs 45.5 % 54.2% shape retained750 0C - 15hrs 45.5% 59.1% shape retained800 0C - 15hrs 50% 74.2% shape retained830 0C - 15min 48.5% 70.5% shape retained850 TC - 15min 47% 73.5% shape retained875 0C - 15min 46.5% - loss of shape850 TC - 30min 47% - loss of shape850 °C - 15min 59% 78.1% shape retained875 'C - 15min 59% _ loss of shape
320
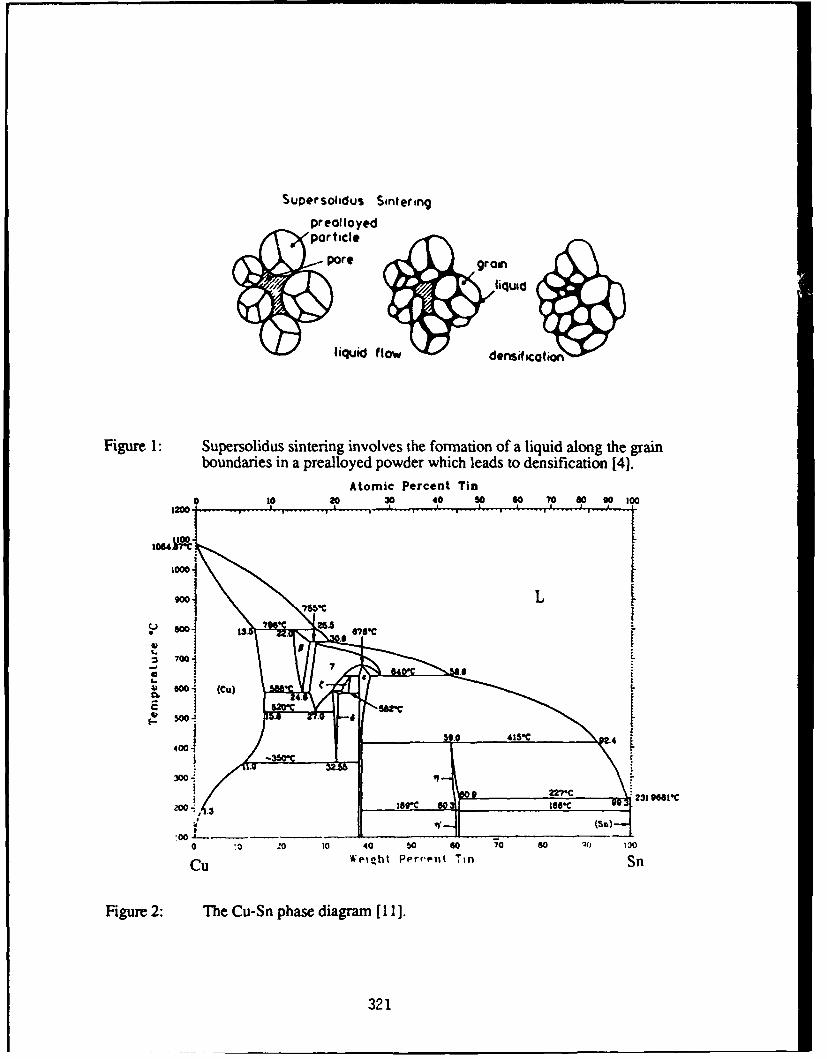
Supersoldus Sintering
preolloyed
particle.pore grain
liquid
*liquid fl~ow densif cation
Figure 1: Supersolidus sintering involves the formation of a liquid along the grainboundaries in a prealloyed powder which leads to densification [4].
Atomic Percent Tin0 10 20 30 40 so 60 70 8090 10oo
1200 p "
too
1000
900- 5*
,.J 6
700 L
04.
400- 1301
-3Sm)
00 20 t 40 50 60 0o s0 Wo E 1oCu •Weight Pi'rv.-nt Tin S
Figure 2: The Cu-Sn phase diagram [1 I].
321
Figure 3: Scanning Electron Micrograph of as received Bronze (89Cu-1 1Sn)powder.
Figure 4: Top surface of the part made in a room-temperature environment showspoor wetting. Laser Power = 35 Watts, Scan Speed = 2.5 cm/sec.
322
Figure 5: End-view of the part made in the room-temperature environment showspoor interlayer bonding. Laser Power = 35 Watts, Scan Speed = 2.5cm/sec.
Figure 6: Top surface of the part made with a bed temperature of 350'C shows betterwetting than before. Laser Power = 100 Watts, Scan Speed = 2.5 cm/sec.
323
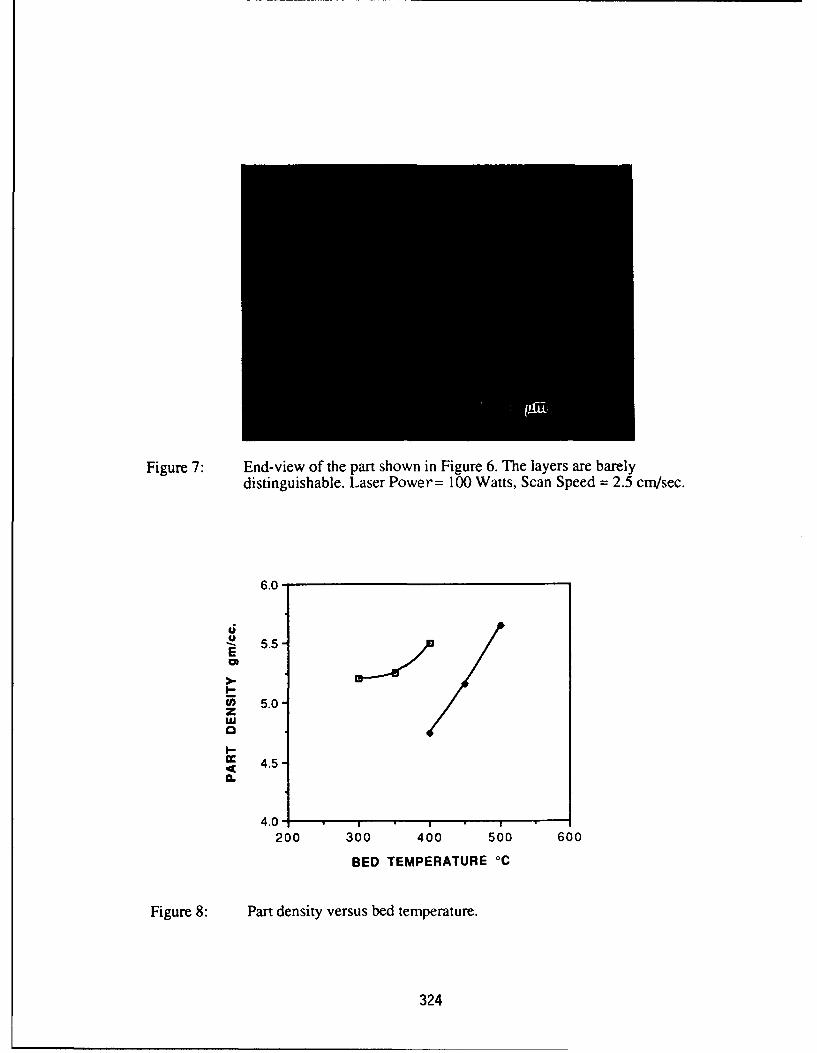
Figure 7: End-view of the part shown in Figure 6. The layers are barelydistinguishable. Laser Power= 100 Watts, Scan Speed = 2.5 cm/sec.
6.0
- 5.5E
( 5.0zLua
I,-
- 4.5a.
4.0 . *
200 300 400 500 600
BED TEMPERATURE °C
Figure 8: Part density versus bed temperature.
324
Selective Area Laser Deposition
of Silicon Carbide
James V. Tompkins and Harris L. Marcus
Center for Materials Science and EngineeringThe University of Texas at Austin
Abstract
Selective Area Laser Deposition (SALD) is a Solid Freeform Fabricationapproach which uses a moving laser beam to deposit solid material from aprecursor gas. We have achieved a deposition rate of 1.5 mm/min for siliconcarbide within the focused laser beam, sufficient for constructing threedimensional objects. Use of tetramethylsilane vapor yielded freestanding rodsand uniform single layers. Critical issues include the effect of nucleation rate onmaterial quality, thermal shock complications, and non-uniform growth.
Selective Area Laser Deposition
The ability to develop a mature Solid Freeform Fabrication industrydepends in part on materials processing technologies which can quickly andinexpensively produce three dimensional objects. Currently, many of theestablished rapid prototyping systems employ solid materials (often as powders)[1,2,3], and liquids (especially photopolymers) 141 for rapid prototypingapplications.
Selective Area Laser Deposition (SALD) uses gas exclusively to producesolid material [5]. In this method, a focussed laser beam causes a precursor gas tochemically react to produce solid material only where the beam strikes asubstrate. As the beam moves over the substrate, it leaves behind a trail of thematerial, which one may use to build up a solid object.
SALD offers several advantages. It can use a relatively simple mechanicalsystem since it doesn't require precision powder or liquid delivery systems.SALD also offers spatial resolution which is not limited by powder grain size orfinite thicknesses of powder layers. Further, depositing from a gas minimizes theporosity inherent with powders, suggesting full strength, structural parts arepossible. SALD is not limited to successive planar cross sections of uniformcomposition. In principle, it offers a nearly unlimited ability to produce internalvariations in composition by switching precursor gases, or possibly even to createinternal voids or ducts.
325
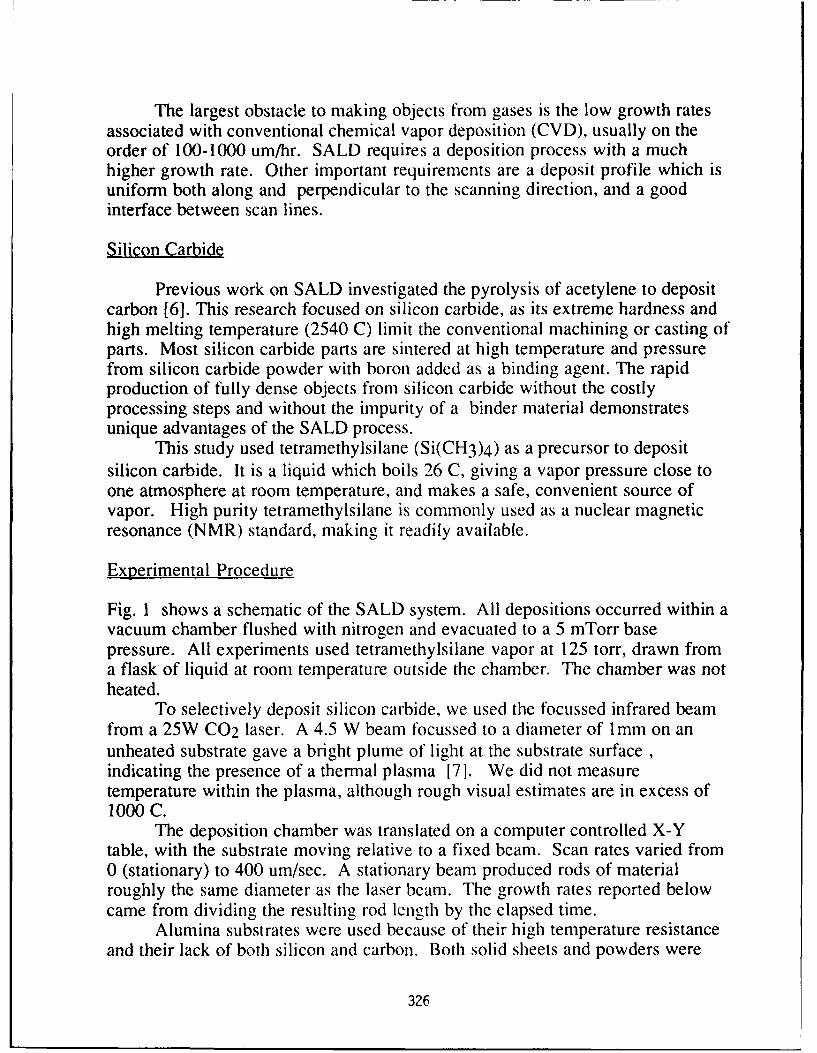
The largest obstacle to making objects from gases is the low growth ratesassociated with conventional chemical vapor deposition (CVD), usually on theorder of 100-1000 urn/hr. SALD requires a deposition process with a muchhigher growth rate. Other important requirements are a deposit profile which isuniform both along and perpendicular to the scanning direction, and a goodinterface between scan lines.
Silicon Carbide
Previous work on SALD investigated the pyrolysis of acetylene to depositcarbon [6]. This research focused on silicon carbide, as its extreme hardness andhigh melting temperature (2540 C) limit the conventional machining or casting ofparts. Most silicon carbide parts are sintered at high temperature and pressurefrom silicon carbide powder with boron added as a binding agent. The rapidproduction of fully dense objects from silicon carbide without the costlyprocessing steps and without the impurity of a binder material demonstratesunique advantages of the SALD process.
This study used tetramethylsilane (Si(CH3)4) as a precursor to depositsilicon carbide. It is a liquid which boils 26 C, giving a vapor pressure close toone atmosphere at room temperature, and makes a safe, convenient source ofvapor. High purity tetramethylsilane is commonly used as a nuclear magneticresonance (NMR) standard, making it readily available.
Experimental Procedure
Fig. 1 shows a schematic of the SALD system. All depositions occurred within avacuum chamber flushed with nitrogen and evacuated to a 5 mTorr basepressure. All experiments used tetramethylsilane vapor at 125 torr, drawn froma flask of liquid at room temperature outside the chamber. The chamber was notheated.
To selectively deposit silicon carbide, we used the focussed infrared beamfrom a 25W C02 laser. A 4.5 W beam focussed to a diameter of 1 mm on anunheated substrate gave a bright plume of light at the substrate surface,indicating the presence of a thermal plasma [7]. We did not measuretemperature within the plasma, although rough visual estimates are in excess of1000 C.
The deposition chamber was translated on a computer controlled X-Ytable, with the substrate moving relative to a fixed beam. Scan rates varied from0 (stationary) to 400 um/sec. A stationary beam produced rods of materialroughly the same diameter as the laser beam. The growth rates reported belowcame from dividing the resulting rod length by the elapsed time.
Alumina substrates were used because of their high temperature resistanceand their lack of both silicon and carbon. Both solid sheets and powders were
326
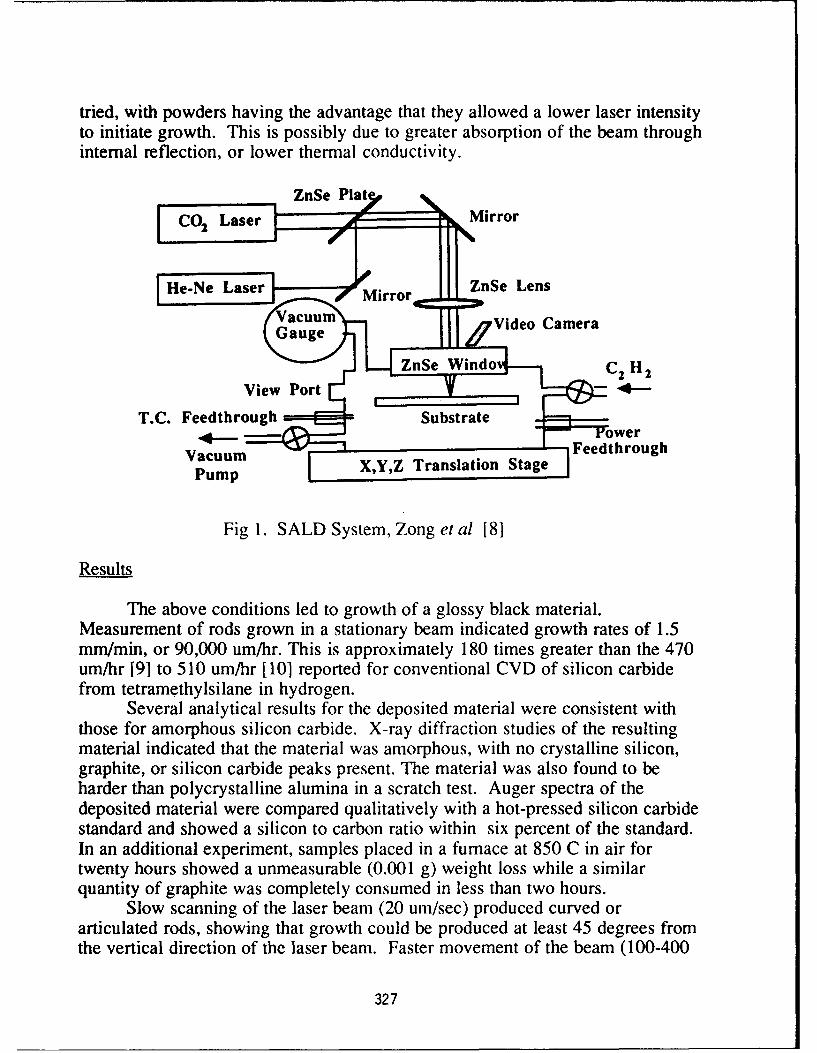
tried, with powders having the advantage that they allowed a lower laser intensityto initiate growth. This is possibly due to greater absorption of the beam throughinternal reflection, or lower thermal conductivity.
ZnSe Pt M
C02 Laser o
HNeLase Mirr ZnSe Lens
Vaacu Video Camera
ZnSe W n oC2 H 2View Port C
T.C. Feedthrough Substrate ioe
Pump X,Y,Z Translation Stage
Fig 1. SALD System, Zong et al [8]
Results
The above conditions led to growth of a glossy black material.Measurement of rods grown in a stationary beam indicated growth rates of 1.5mm/min, or 90,000 um/hr. This is approximately 180 times greater than the 470um/hr [9] to 510 um/hr [10] reported for conventional CVD of silicon carbidefrom tetramethylsilane in hydrogen.
Several analytical results for the deposited material were consistent withthose for amorphous silicon carbide. X-ray diffraction studies of the resultingmaterial indicated that the material was amorphous, with no crystalline silicon,graphite, or silicon carbide peaks present. The material was also found to beharder than polycrystalline alumina in a scratch test. Auger spectra of thedeposited material were compared qualitatively with a hot-pressed silicon carbidestandard and showed a silicon to carbon ratio within six percent of the standard.In an additional experiment, samples placed in a furnace at 850 C in air fortwenty hours showed a unmeasurable (0.001 g) weight loss while a similarquantity of graphite was completely consumed in less than two hours.
Slow scanning of the laser beam (20 um/sec) produced curved orarticulated rods, showing that growth could be produced at least 45 degrees fromthe vertical direction of the laser beam. Faster movement of the beam (100-400
327
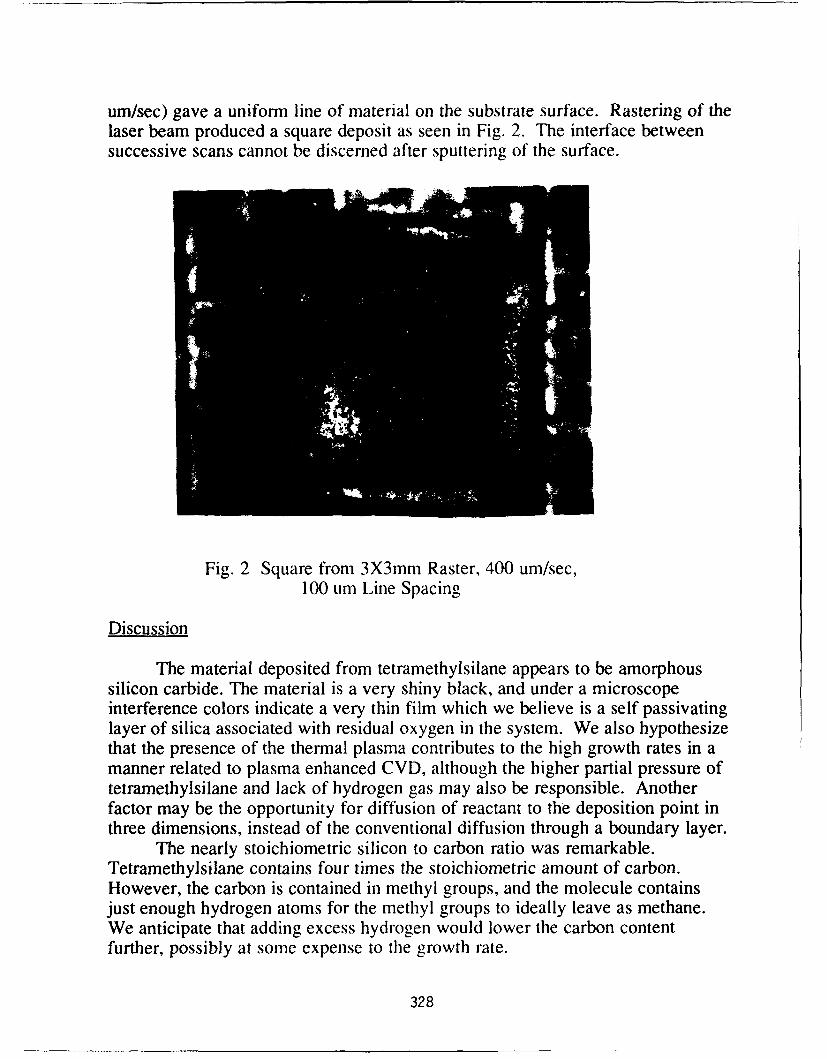
um/sec) gave a uniform line of material on the substrate surface. Rastering of thelaser beam produced a square deposit as seen in Fig. 2. The interface betweensuccessive scans cannot be discerned after sputtering of the surface.
Fig. 2 Square from 3X3mm Raster, 400 um/sec,
100 um Line Spacing
Discussion
The material deposited from tetramethylsilane appears to be amorphoussilicon carbide. The material is a very shiny black, and under a microscopeinterference colors indicate a very thin film which we believe is a self passivatinglayer of silica associated with residual oxygen in the system. We also hypothesizethat the presence of the thermal plasma contributes to the high growth rates in amanner related to plasma enhanced CVD, although the higher partial pressure oftetramethylsilane and lack of hydrogen gas may also be responsible. Anotherfactor may be the opportunity for diffusion of reactant to the deposition point inthree dimensions, instead of the conventional diffusion through a boundary layer.
The nearly stoichiometric silicon to carbon ratio was remarkable.Tetramethylsilane contains four times the stoichiometric amount of carbon.However, the carbon is contained in methyl groups, and the molecule containsjust enough hydrogen atoms for the methyl groups to ideally leave as methane.We anticipate that adding excess hydrogen would lower the carbon contentfurther, possibly at some expense to the growth rate.
328
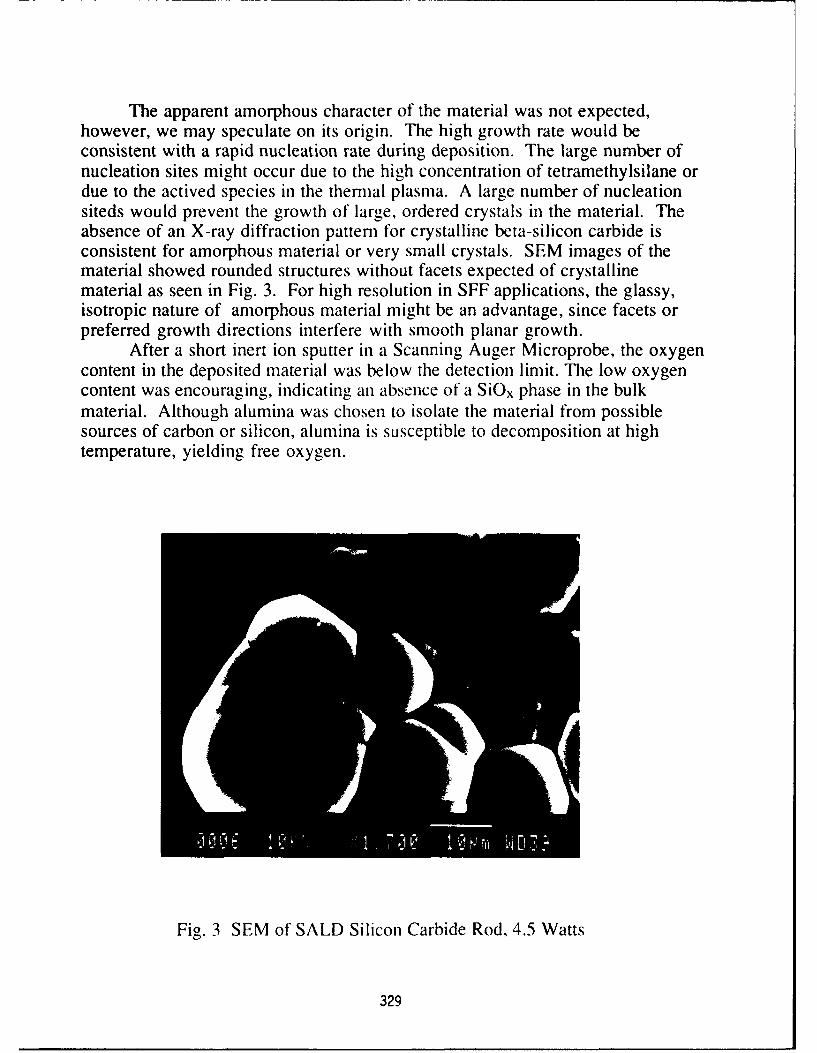
The apparent amorphous character of the material was not expected,however, we may speculate on its origin. The high growth rate would beconsistent with a rapid nucleation rate during deposition. The large number ofnucleation sites might occur due to the high concentration of tetramethylsilane ordue to the actived species in the thermal plasma. A large number of nucleationsiteds would prevent the growth of large, ordered crystals in the material. Theabsence of an X-ray diffraction pattern for crystalline beta-silicon carbide isconsistent for amorphous material or very small crystals. SEM images of thematerial showed rounded structures without facets expected of crystallinematerial as seen in Fig. 3. For high resolution in SFF applications, the glassy,isotropic nature of amorphous material might be an advantage, since facets orpreferred growth directions interfere with smooth planar growth.
After a short inert ion sputter in a Scanning Auger Microprobe, the oxygencontent in the deposited material was below the detection limit. The low oxygencontent was encouraging, indicating an absence of a SiOx phase in the bulkmaterial. Although alumina was chosen to isolate the material from possiblesources of carbon or silicon, alumina is susceptible to decomposition at hightemperature, yielding free oxygen.
Fig. 3 SEM of SALD Silicon Carbide Rod, 4.5 Watts
329
We encountered two obstacles when we attempted to deposit thick ormultiple layers of silicon carbide to produce three dimensional objects. First,when scanning over an existing layer, the steep, rapidly moving temperaturegradient caused severe cracking in the underlying layer. The thermal shockcombined with any residual stresses in the first layer cannot be resisted by thethin silicon carbide, even though silicon carbide has a good thermal shockresistance for a ceramic material. Several approaches may have to be employedin the future to alleviate this problem: First, the entire deposition area may beheated to a high temperature, reducing the thermal gradient needed. Secondly, adeposition chemistry which can use a lower temperature may be employed.
Another problem encountered is non-uniform growth in thick or multiplelayers. Although the uniformity in a single layer seems quite good, the smallestprojection from the surface becomes excessively hot during subsequent heatingwith the laser beam. This rise in temperature accelerates growth, making anymicroscopic projection unstable for extended growth. This is separate from theproblem of localized growth due to a nucleation barrier observed by Zong in theSALD of pyrolytic carbon [ 11 .
Conclusion
We have successfully produced silicon carbide rods and single layers usingthe SALD process, demonstrating its potential as a rapid prototyping tool as wellas a method for producing structural parts. The lack crystallinity may beexplained by the extremely high growth rates achieved, and may be desirablewhere high resolution is needed. Thermal shock considerations may be solved inthe near future using proposed techniques, but the instability of microscopicirregularities in the first layer will require further study.
The authors acknowledge the support of ONR grant N00014-92-J-1514 infunding this research. The assistance of Britton Birmingham and Steve Lin inthis work is greatly appreciated.
330
References
[1] Proceedings of the Solid Freeform Fabrication Symposium, edited by J.J.Beaman, Harris L. Marcus, David L. Bourell, and J. W. Barlow, TheUniversity of Texas at Austin, Austin,Texas, August 6-8, 1990
[2] Proceedings of the Solid Freeform Fabrication Symposium, edited byHarris L. Marcus, Joeseph J. Beaman,David L. Bourell, and Richard H.Crawford, The University of Texas at Austin, Austin,Texas, August 12-14,1991.
[3] Proceedings of the Solid Freeform Fabrication Symposium, edited byHarris L. Marcus, Joseph J. Beaman, Joel W. Barlow, David L. Bourell,and Richard H. Crawford, The University of Texas at Austin,Austin,Texas, August 3-5, 1992.
[41 Jacobs, Dr. Paul F., and Jan Richter, Advances in StereolithographyAccuracy", Proceedings of the Solid Freeform Fabrication Symposium,edited by Harris L. Marcus, Joeseph J. Beaman,David L. Bourell, andRichard H. Crawford, The University of Texas at Austin, Austin,Texas,August 12-14, 1991.
[5] Zong, G., Yves Jacquot, W. Richards Thissell, and H.L. Marcus, "SolidFreeform Fabrication Using Selective Area Laser Deposition", Plasma andLaser Processing of Materials, edited by K. Upadhya, The Minerals,Metals, and Materials Society, 1991.
[6] Zong, G., J.V. Tompkins, W.R.Thissell, E. Sajot, and H.L. Marcus,"Processing Problems Associated With Gas Phase Solid FreeformFabrication Using Pyrolytic Selective Area Laser Deposition", Proceedingsof the Solid Freeform Fabrication Symposium, edited by Harris L.Marcus, Joeseph J. Beaman,David L. Bourell, and Richard H. Crawford,The University of Texas at Austin, Austin,Texas, August 12-14, 1991,p.271
[7] Radziemski, Leon, and David A. Cremers, Laser Induced Plasmas andApplications, Marcel Drekker Inc., New York, NY, 1989 pp 327-9
331
[81 G. S. Zong, R. Carnes, H. G. Wheat, and H. L. Marcus, "Solid FeeformFabrication by Selective Area Laser Deposiion", Proceedings of the SolidFreeform Fabrication Symposium, edited by J.J. Beaman, Harris L.Marcus, David L. Bourell, and J. W. Barlow, The University of Texas atAustin, Austin,Texas, August 6-8, 1990
[91 Figueras, A., S. Garelik, J. Santiso, R. Rodroguez-Clemente, B. Armas, C.Combescure, R. Berjoan, J. M. Saurel, R. Caplain, "Growth andProperties of CVD-SiC Layers Using Tetramethylsilane", MaterialsScience and Engineering, 'volume B 11, Nos 1-4, January 15, 1992, pp 83-88.
[10] Figueras, A., R. Rodroguez-Clemente, S. Garelik, J. Santiso, B.Armas, C. Combescure, A. Mazel, Y. Kihn, J. Sevely, "Influence of H2Partial Pressure on the Morphology and Crystallization of SiC LayersObtained by LPCVD Using Tetramethylsilane", Journal de Physique IV,Colloque C2 Supple. au Journal de Physique II, Volume 1, September 1991,pp C2-225-232
[111 Zong, G., J.V. Tompkins, W.R.Thissell, E. Sajot, and H.L. Marcus,"Processing Problems Associated With Gas Phase Solid FreefornFabrication Using Pyrolytic Selective Area Laser Deposition", Proceedingsof the Solid Freeform Fabrication Symposium, edited by Harris L.Marcus, Joeseph J. Beaman,David L. Bourell, and Richard H. Crawford,The University of Texas at Austin, Austin,Texas, August 12-14, 1991,p.271
332
Drying of Colloidal Binder Infiltrated Ceramic GreenParts Produced by Selective Laser SinteringTM
M. Glazert, N.K. Vail, and J.W. Barlowtt. Department of Mechanical Engineering
: Department of Chemical EngineeringThe University of Texas at Austin
Abstract
Colloidal ceramic binders have been used to strengthen ceramicgreen shapes produced by Selective Laser Sintering. This paperfocuses on the effectiveness of the colloid infiltration withrespect to the physical properties of the colloidal binder. Massgains, strength gains, and dimensional changes resulting frominfiltration were monitored. Controlled drying experiments wereconducted to predict the factors influencing drying times forcomplex shapes.(Key Words: Alumina, Silica Colloid, Drying)
Introduction
Ceramic preforms can be produced by Selective Laser Sintering of ceramic powders thathave been encapsulated with a fugitive polymer binder. In this process, the polymer binder sintersproducing a composite ceramic matrix. However, the polymer binder must be replaced because itdoes not have sufficient strength nor the thermal resistance necessary for functional ceramicobjects. This paper discusses the infiltration of these preforms with ceramic colloids to improvestrength and temperature capabilities. Green alumina coupons were infiltrated with colloids ofvarying solids content and then dried under controlled conditions. Physical properties of thecoupons were determined prior to and following colloidal infiltration.
Materials
The polymer encapsulated ceramic used in this study is the same as that used in a previousstudy'. This material consists of a high purity, electronical grade aluminum oxide, provided byLanxide Corporation, coated with a polymethylmethacrylate polymer having a specified melt flowindex of 20g/lOmin as measured by a Kayness Capillary Rheometer at 200'C and 75 psi (ASTMD1238). Figure 1 shows the mean particle size of the uncoated alumina to be 10.31gm, asmeasured by a Coulter Multisizer. The particles were observed to be regular in shape using ascanning electron microscope.
Samples of Ludox rM colloidal silica, grade TM, were provided by Dupont Corporation.This colloid is 50% wt. si!ica and consists of particles having a mean diameter of 22nm. A sampleof Dupanol ME, a sodium dodecyl sulfate based emulsifier, was also provided by DupontCorporation.
Methods
SLS Production of Test CouponsTest specimens were produced using an SLS Model 125 workstation equipped with a 25
watt C02 laser. Fabrication of parts was conducted in an inert nitrogen environment using the
333
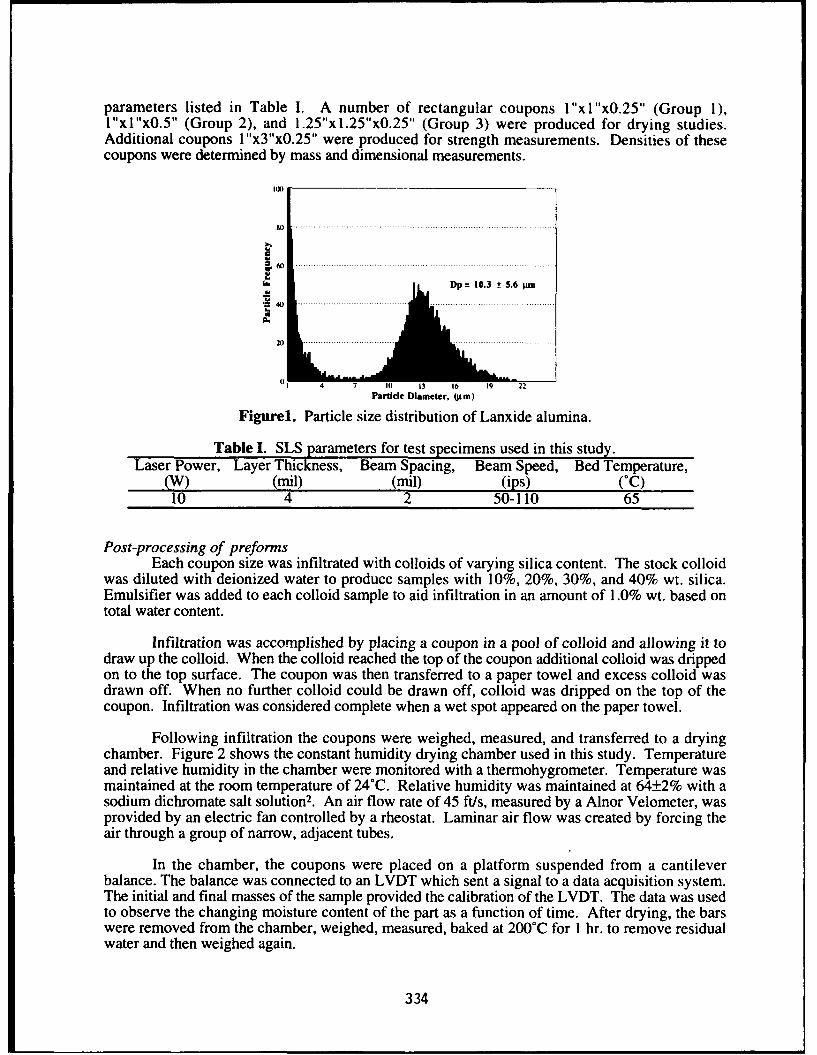
parameters listed in Table I. A number of rectangular coupons l"x1"x0.25" (Group 1),l"xl"xO.5" (Group 2), and 1.25"xl.25"xO.25" (Group 3) were produced for drying studies.Additional coupons I "x3"xO.25" were produced for strength measurements. Densities of thesecoupons were determined by mass and dimensional measurements.
1R)
=60 ....
-Dp= 10.3 t 5.6 pm
20 .. . . .. . . . . . .. .. . . . .- . .. .
4 7 10 13 16 19 21
Particle Diameter, (gom)
Figurel. Particle size distribution of Lanxide alumina.
Table I. SLS parameters for test specimens used in this study.Laser Power, Layer Thickness, Beam Spacing, Beam Speed, Bed Temperature,
(W) (mil) (mil) (ips) (*C)10 4 2 50-110 65
Post-processing of preformsEach coupon size was infiltrated with colloids of varying silica content. The stock colloid
was diluted with deionized water to produce samples with 10%, 20%, 30%, and 40% wt. silica.Emulsifier was added to each colloid sample to aid infiltration in an amount of 1.0% wt. based ontotal water content.
Infiltration was accomplished by placing a coupon in a pool of colloid and allowing it todraw up the colloid. When the colloid reached the top of the coupon additional colloid was drippedon to the top surface. The coupon was then transferred to a paper towel and excess colloid wasdrawn off. When no further colloid could be drawn off, colloid was dripped on the top of thecoupon. Infiltration was considered complete when a wet spot appeared on the paper towel.
Following infiltration the coupons were weighed, measured, and transferred to a dryingchamber. Figure 2 shows the constant humidity drying chamber used in this study. Temperatureand relative humidity in the chamber were monitored with a thermohygrometer. Temperature wasmaintained at the room temperature of 24*C. Relative humidity was maintained at 64±2% with asodium dichromate salt solution2. An air flow rate of 45 ft/s, measured by a Alnor Velometer, wasprovided by an electric fan controlled by a rheostat. Laminar air flow was created by forcing theair through a group of narrow, adjacent tubes.
In the chamber, the coupons were placed on a platform suspended from a cantileverbalance. The balance was connected to an LVDT which sent a signal to a data acquisition system.The initial and final masses of the sample provided the calibration of the LVDT. The data was usedto observe the changing moisture content of the part as a function of time. After drying, the barswere removed from the chamber, weighed, measured, baked at 200'C for 1 hr. to remove residualwater and then weighed again.
334
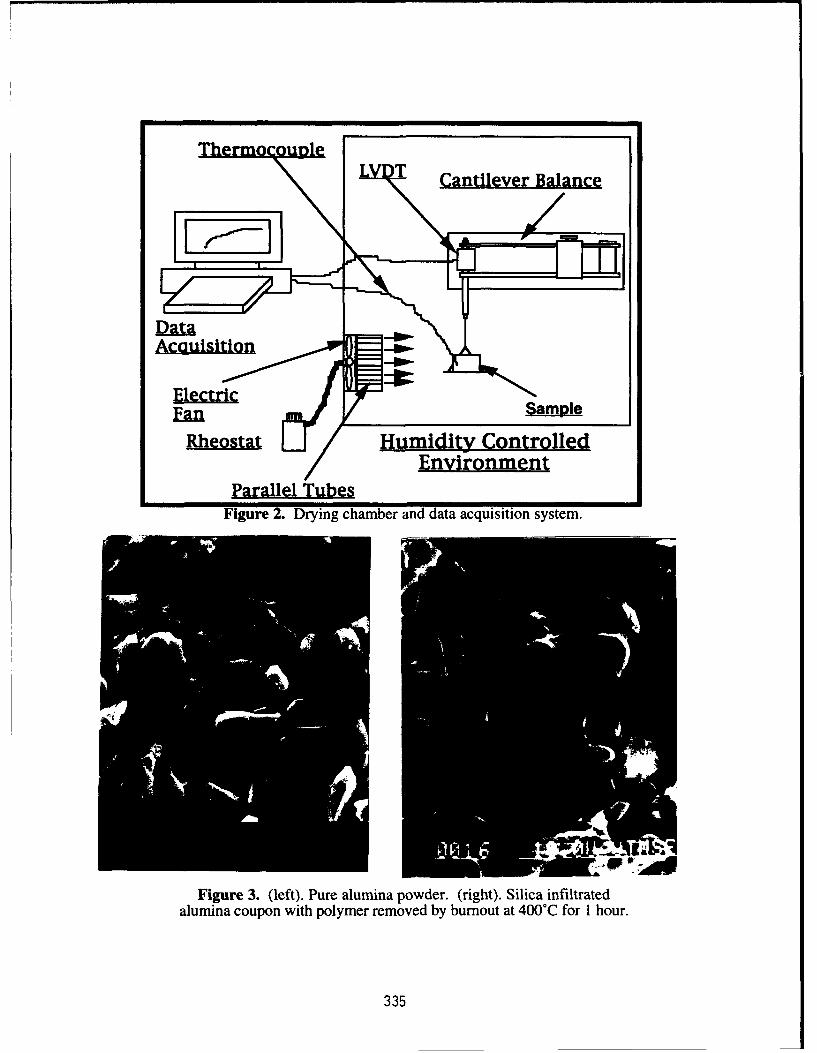
LVD Cdantilever Balance
Acquisition ,-' -W
Electri Sample
Rheostat Humidity ControlledEnvironment
Parallel TubesFigure 2. Drying chamber and data acquisition system.
Rik
Figure 3. (left). Pure alumina powder. (right). Silica infiltratedalumina coupon with polymer removed by burnout at 400'C for 1 hour.
335
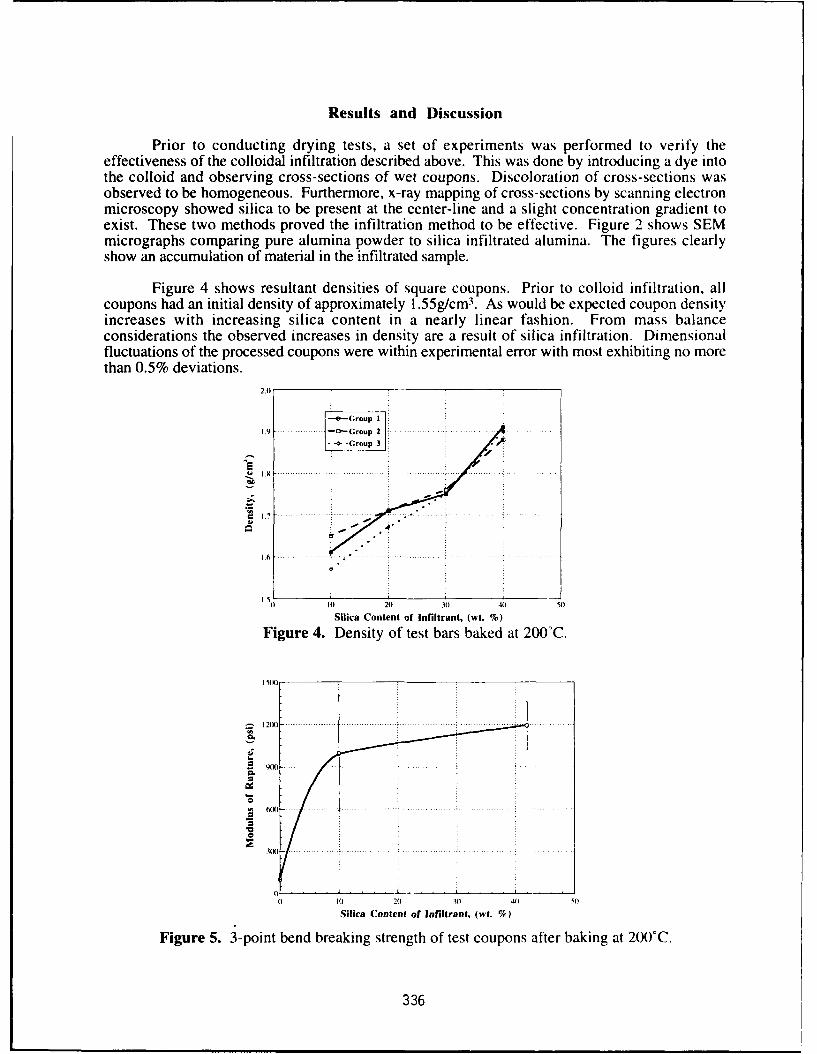
Results and Discussion
Prior to conducting drying tests, a set of experiments was performed to verify theeffectiveness of the colloidal infiltration described above. This was done by introducing a dye intothe colloid and observing cross-sections of wet coupons. Discoloration of cross-sections wasobserved to be homogeneous. Furthermore, x-ray mapping of cross-sections by scanning electronmicroscopy showed silica to be present at the center-line and a slight concentration gradient toexist. These two methods proved the infiltration method to be effective. Figure 2 shows SEMmicrographs comparing pure alumina powder to silica infiltrated alumina. The figures clearlyshow an accumulation of material in the infiltrated sample.
Figure 4 shows resultant densities of square coupons. Prior to colloid infiltration, allcoupons had an initial density of approximately 1.55g/cm 3. As would be expected coupon densityincreases with increasing silica content in a nearly linear fashion. From mass balanceconsiderations the observed increases in density are a result of silica infiltration. Dimensionalfluctuations of the processed coupons were within experimental error with most exhibiting no morethan 0.5% deviations.
2.0
-- e-(Group I
19............. - G-roup 2'o-roup3: -0--Croup 3
EU 1.6 ... . ..... ' '9 ....... • .. . ..... ... ....... ...............
1.6
if) 201 30 4:) 501
Silica Content of Infiltrant, (wt. %)Figure 4. Density of test bars baked at 200'C.
15M1121M) .......... ... .......................... .......... i. ... .
C 6 (M
4 M .. ....... ......... ...3 ( X , - -. . . . ... L.. ._ _, ,-
0• 30 2<) SO)Silica Content of infiltrant, (wt. %)
Figure 5. 3-point bend breaking strength of test coupons after baking at 200°C.
336
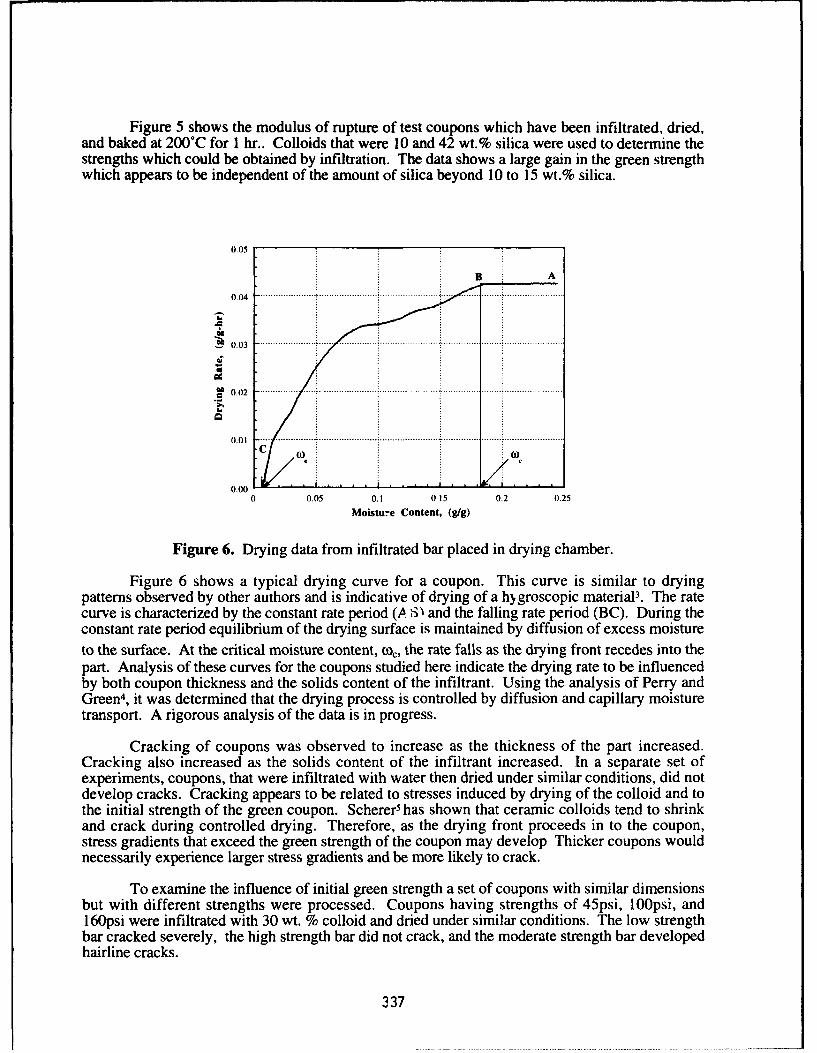
Figure 5 shows the modulus of rupture of test coupons which have been infiltrated, dried,and baked at 200"C for 1 hr.. Colloids that were 10 and 42 wt.% silica were used to determine thestrengths which could be obtained by infiltration. The data shows a large gain in the green strengthwhich appears to be independent of the amount of silica beyond 10 to 15 wt.% silica.
0.05
B A0 .o ,4 ....... ............ ..... .................. .... ....................... .i . .. ..... .. ]...... i.......................
I.I
S0.2
I.
0.01
0.0000.05 0.1 0 .15 0.2 0.25
Moisture Content, (gig)
Figure 6. Drying data from infiltrated bar placed in drying chamber.
Figure 6 shows a typical drying curve for a coupon. This curve is similar to dryingpatterns observed by other authors and is indicative of drying of a hygroscopic materialP. The ratecurve is characterized by the constant rate period (A..S" and the falling rate period (BC). During theconstant rate period equilibrium of the drying surface is maintained by diffusion of excess moistureto the surface. At the critical moisture content, 0oc, the rate falls as the drying front recedes into thepart. Analysis of these curves for the coupons studied here indicate the drying rate to be influencedby both coupon thickness and the solids content of the infiltrant. Using the analysis of Perry andGreen4, it was determined that the drying process is controlled by diffusion and capillary moisturetransport. A rigorous analysis of the data is in progress.
Cracking of coupons was observed to increase as the thickness of the part increased.Cracking also increased as the solids content of the infiltrant increased. In a separate set ofexperiments, coupons, that were infiltrated with water then dried under similar conditions, did notdevelop cracks. Cracking appears to be related to stresses induced by drying of the colloid and tothe initial strength of the green coupon. Scherer5 has shown that ceramic colloids tend to shrinkand crack during controlled drying. Therefore, as the drying front proceeds in to the coupon,stress gradients that exceed the green strength of the coupon may develop Thicker coupons wouldnecessarily experience larger stress gradients and be more likely to crack.
To examine the influence of initial green strength a set of coupons with similar dimensionsbut with different strengths were processed. Coupons having strengths of 45psi, 100psi, and160psi were infiltrated with 30 wt. % colloid and dried under similar conditions. The low strengthbar cracked severely, the high strength bar did not crack, and the moderate strength bar developedhairline cracks.
337
Conclusions/Further Work
Infiltration with silica colloids is an effective method for increasing strength and density ofpolymer bound prototypes produced by Selective Layer Sintering. Strength gains of the couponswere nearly independent of the solids content of the infiltrant. However, high solids infiltrantsincreased cracking, especially in parts with low inherent green strength.
Further study is required to optimize the infiltration and drying processes. Additionalstrength measurements need to conducted on coupons from which the polymer binder has beenremoved. It may be necessary to subject the coupons to an additional colloid infiltration followingbinder removal to further increase density and strength. The strength of fired bars need to bestudied, also.
A detailed analysis of stresses during the drying period, which includes the contributions ofcapillary and diffusion induced drying, is in progress. Infiltration with other ceramics couldprovide improved strength, temperature, and drying characteristics.
Acknowledgments
The authors gratefully acknowledge support of this work by the University of Texas SFFIndustrial Associates Program.
References
1. N.K. Vail and J.W. Barlow, "Ceramic Structures by Selective Laser Sintering ofMicroencapsulated, Finely Divided Ceramic Materials,"Solid Freeform FabricationSymposium Proceedings, 3 (1992), pp. 124-130..
2. A. Wexler and S. Hasegawa, "Relative Humidity-Temperature Relationships of SomeSaturated Salt Solutions in the Temperature Range 00 to 50'C," Journal of Research ofthe National Bureau of Standards, vol. 53, no. 1 (1954), pp. 19-25.
3. C. Strumillo and T. Kudra, Drying: Principles, Applications and Design, Gordon andBreach Science Publishers, Switzerland (1986), pp. 69-97.
4. R.H. Perry and D. Green, Perry's Chemical Engineering Handbook, 6th ed., McGraw-Hill, St. Louis (1984), pp. 20.9-20.14.
5. G.W. Scherer, "Drying Gels," Journal of Non-Crystalline Solids, 87 (1986),pp. 199-225.
338
SYNTHESIS, SELECTIVE LASER SINTERING AND INFILTRATION OF HIGHTc DUAL PHASE Ag-YBa 2Cu 3O.7- SUPERCONDUCTOR COMPOSITES.
Mukesh K. Agarwala, David L. Bourell, Arumugam Manthiram,Britton R. Birmingham, and Harris L. Marcus.Center For Materials Science and Engineering.
The University of Texas at Austin, Austin, Texas 78712.
ABSTRACTFine, homogeneous dual phase Ag-YBa 2Cu3O7 x composite powders were prepared by a simplecolloidal sol-gel co-precipitation technique. Silver did not react with or degrade YBa 2Cu 30 7..xBulk porous samples of pure YBa 2Cu3O7 .x and Ag-YBa 2Cu 3O 7.x were made from powders bySelective Laser Sintering. The porous parts were further densified by infiltrating silver into pores,resulting in a dense, structurally sound dual phase superconducting composite. Laser processingparameters were varied to obtain optimum microstructure. The laser sintered parts required oxygenannealing after infiltration to restore the orthorhombic, superconducting structure. X-raydiffraction and Tc measurements indicate some impurity phases present in samples processedunder aggressive laser conditions.
INTRODUCTIONSince the discovery of high Tc ceramic superconductors (1) much work has been devoted
to develop them for practical applications. Considerable success has been achieved in the area ofthin films (2). However, prototype applications in bulk form are still being investigated. Themajor obstacles in making practical bulk shapes from these materials are their inferior currentcarrying capacity in bulk form and poor mechanical properties. Numerous synthesis andfabrication techniques have been attempted to tackle these issues, but with limited success.
In the synthesis of these materials, several elements and compounds have beenincorporated in the YBa 2Cu 3O.7x ceramic superconductor either as substitutional elements in theYBa 2Cu3O 7.x structure or as dispersoids in the YBa 2Cu 3O 7.x matrix (3,4). Noble metals, goldand silver, are one such class of additives that have been widely investigated and found to bepromising (3-6). Due to its inertness, silver does not react with and degrade the superconductingproperties of the ceramic YBa 2Cu 3O7 .x and has, therefore, been used as an appropriate secondphase and as a sheath or cladding material in bulk fabrication (3,6). Silver doping has been foundto improve the critical current density, due to the presence of silver at voids between theYBa2Cu3O7 grains (5,6). A further problem associated with the YBa 2Cu3O 7.x superconductors isincomplete oxygenation during processing or gradual loss of oxygen subsequently, especially atgrain boundaries. Due to high solubility of oxygen in silver and presence of silver at grainbondaries, it is an efficient source of oxygen for the YBa 2Cu3O7.x superconductor matrix.
Similarly, in an attempt to improve the critical current density and mechanical properties,several fabrication techniques have been studied to make bulk parts from pure YBa 2Cu 3O 7.x orAg-YBa 2 Cu30 7.x powders. High critical current density parts have been made by melt texturing(7) that results in oriented grained structures necessary for high critical current density. Otherfabrication techniques such as cold pressing and sintering (8), tape casting (8), and powder-in-tuberolling (9), have used Ag and YBa 2Cu 3O 7.. powder mix to improve the mechanical properties.Most of the studies done on fabrication employing Ag-YBa2Cu3O7Tx systems have employed thepowder metallurgy route of mixing elemental silver powder with YBa2Cu3O7_x powder indifferent proportions (5,6). This technique may result in rather non-homogeneous distribution ofsilver in YBa2Cu3O7.x matrix. In contrast to the powder metallurgy route of mixing powders, sol-gel co-precipitation provides a homogeneous distribution of various phases in composites.
339
In this study, we report on a technique for synthesizing fine, homogeneous Ag-YBa2Cu3OT.x composite powders by extending the citrate sol-gel technique proposed by Kakihanaet al (10) to make single phase YBa2Cu3O7 -- powders. We have also made an attempt to producestructurally sound dense parts of Ag-YBa 2 Cu 3O 7 .x which have the potential of carrying highcurrent densities. Porous preforms of YBa 2Cu 3O 7.x were made, which were then infiltrated withsilver to give dense parts. The porous preforms of near net shape were made by the rapidprototype technique - Selective Laser Sintering (SLS) (11,12).
SLS is a pressureless sintering process which usually involves a liquid phase (13). Partiali.,quid phase is formed and solidified as the laser beam is scanned across the powder bed in adirectional fashion. Such directional formation and solidification of liquid phase can result in anoriented-grained structure. Since YBa 2Cu3O 7.x melts incongruently (14,15), it is possible to formpartial liquid phase by careful control of the laser power density to induce interphase melting. Otherlaser processing parameters that affect the microstructure and hence the properties are : laser scanspeed, scan spacing and the layer thickness. These laser processing parameters have been studiedextensively for various ceramic, metals and polymer systems (12,13). By careful manipulation ofthese parameters and the powder characterstics such as particle size, desirable microstructure withoptimum properties can be obtained.
EXPERIMENTAL PROCEDURE
SYNTHESIS OF YBa 2Cu3O.7x And Ag-YBa 2Cu3O7.x POWDERSMetal nitrates, Y(N0 3 )3 , Ba(N0 3)2 , Cu(NO 3)2 and AgNO 3, were dissolved in water in
required amounts. 1.9 g citric acid to I g of Ba(N0 3)2 was dissolved in the nitrate solution. Thiswas followed by addition of 10 ml of ethylene glycol per I mmol of Y. The ratios of citric acid toBa(N0 3)2 and ethyleneglycol to Y are same as that proposed by Kakihana et al (10) as the processis insensitive to pH. The amounts of various nitrates were varied to produce lOg batches of Ag-YBa 2Cu3O7 .x composite powders with compositions in the range 0 - 60 weight percent silver. Allthe solutions were heated on a hot plate at 100 0C - 1500C to obtain a brown-black solid which wasground into powder and referred to as "precursor". The precursor was calcined at 9000 C inoxygen for 10-12 hours followed by furnace cooling. The calcined powder was ground and itsstructure and purity were assessed by x-ray diffraction. Following calcination, the powders wereoxygen annealed at 6000 C for 6 hours.
SELECTIVE LASER SINTERINGThe Selective Laser Sintering workstation system developed and described by Birmingham
et al (13) was used to carry out the sintering. Pure YBa 2Cu3O 7.x and Ag-YBa 2 Cu3O 7 _x, powdersof compositions 20% and 30% by weight of silver, were used in this study. All SLS processingwere carried out in air at room temperature. A 25 Watt CO2 laser was used with a beam diameter
of 700 p.m. Three dimensional square parts of 8 mm side dimension were made layer by layer tofinal thicknesses ranging from I to 3 mm. Laser power density was varied from 500 W/cm 2 to1300 W/cm 2. Laser scan speeds of I to 3 mm/second were employed. Scan spacing was kept
constant at 100 g.m for all runs. Layer thickness was varied from 250 g.m to 150 p.m. Initial layers
were thicker (200-250 4im) to avoid displacement of the previously sintered layers by the rolleraction during the spreading of powder to lay fresh layers for sintering. As subsequent layers were
sintered the layer thickness was gradually reduced to 150 gam. The final thickness of the samplewas thus controlled by the layer thickness and the number of layers.
346
INFILTRATIONThe porous parts obtained by SLS were infiltrated with silver to fill up the pores and
provide a reinforcing ductile phase. Silver infiltration was accomplished by placing the samples inan alumina boat with sufficient silver powde-r (0.7-1.3 gam) atop the samples (16). The boat withthe sample and infilterant was heated in a vertical tube furnace at 970 0 C in air for 10 to 30 minutes.The process was continuously monitored to allow melting of silver and its infiltration, by capillaryeffect, into the porous YBa 2Cu 3O7T.. samples while avo;-"ng any significant melting of theYBa 2Cu3O 7.x which would result in loss of shape.
CHARACTERIZATIONThe SLS porous parts and the silver infiltrated dense parts were annealed at 9300 C for 8 to
10 hours in flowing oxygen and slow cooled in flowing oxygen. Structural phases of the powderssynthesized by sol-gel and of parts fabricated by SLS and infiltration were investigated at eachstage of processing by X-ray diffraction. Critical transition temperatures were measured by aSQUID magnetometer. Samples were weighed before and after silver infitration to determine thevolume fraction of porosity at each stage and to find the degree of silver infilteration. AMicromeritics Accupyc 1330 pycnometer was used to determine the degree of open versus closedporosity. The sample microstructures and the distribution of silver were studied by SEM.
RESULTS AND DISCUSSIONPOWDER SYNTHESIS
Submicron (-100nm) size YBa 2 Cu3O 7.x and Ag-YBa 2Cu3O 7.x powders were synthesizedby the citrate sol-gel technique. X-ray diffraction spectra of Ag-YBa 2Cu 3O 7_x composites withdifferent weight percents silver are shown in Figure 1. The x-ray diffraction patterns show theorthorhombic YBa 2 Cu3O 7.x structure for all samples The x-ray peaks for silver are present asseparate peaks suggesting that the silver is present as a separate crystalline phase in theYBa 2 Cu 3O7 .x matrix. However, in some samples of Ag-YBa 2 Cu 3 O7 .x, reflections fromY2BaCuO 5 and/or BaCuO 2 are present. Presence of these impurity phases arise due to greaterdifficulty in complete and efficient removal of CO 2 evolved from the decomposition of citrate gelcomplexes during heat treatments. YBa 2Cu 3O7Tx reacts strongly with CO 2 and the reactionproducts depend on the CO2/0 2 ratio and the annealing temperature (17).
YBa 2Cu 3O 7..x precursor derived from the gel decomposition requires calcination andoxygen annealing to obtain the superconducting orthorhombic structure. In this study, it wasnoticed that presence of silver had a significant effect on the degree of oxygen annealing required toobtain complete oxygenation of the YBa 2 Cu 3O 7.x structure. Batches of Ag-YBa 2Cu 3 0 7.xcontaining less than 30 weight percent silver required oxygen annealing following calcination toobtain superconducting orthorhombic structure. No such oxygen annealing was necessary fordeveloping a completely oxygenated structure when batches of Ag-YBa 2Cu30 7., contained 30weight percent or more silver. X-ray diffraction of powder samples from Ag-YBa 2Cu 30 7.xcontaining 20 and 30 weight percent silver without any oxygen annealing, Figure.2., indicate anincompletely oxygenated tetragonal structure for the lower silver content sample but completelyoxygenated orthorhombic YBa 2Cu 3O 7.x structure for the higher silver content sample. Table Ishows the heat treatments required to obtain completely oxygenated orthorhombic YBa 2Cu30 7.xstructure in Ag-YBa 2Cu 3O 7 _. composites with different silver contents. Oxygenation of theYBa 2Cu3O7_x structure occurs by diffusion during the heat treatment and subsequent cooling of theprecursor. In this study it was seen that the process of diffusion is slow in bulk samples with lowsilver content while the diffusive process is enhanced by increasing the silver content. Also, itseems possible to decrease the time of calcination with increasing silver content.
341
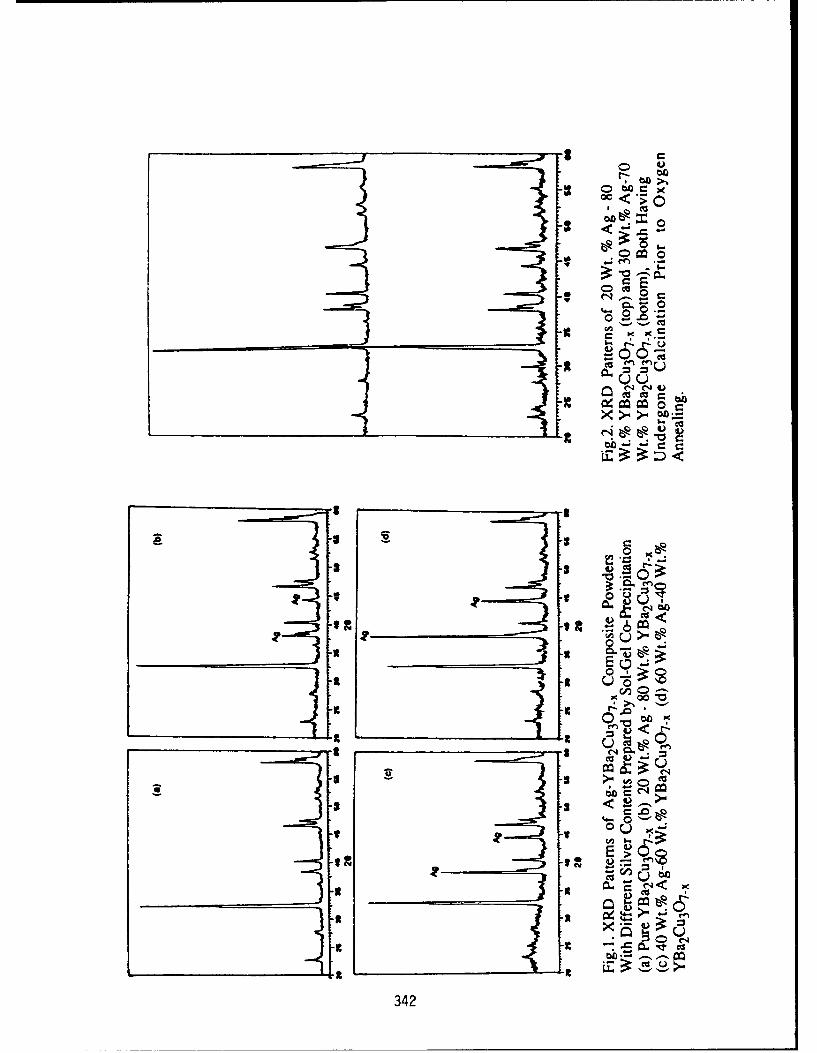
3 00
O~E.- 0
u u3 Cu qm z
M Q
> Os
3C u
342
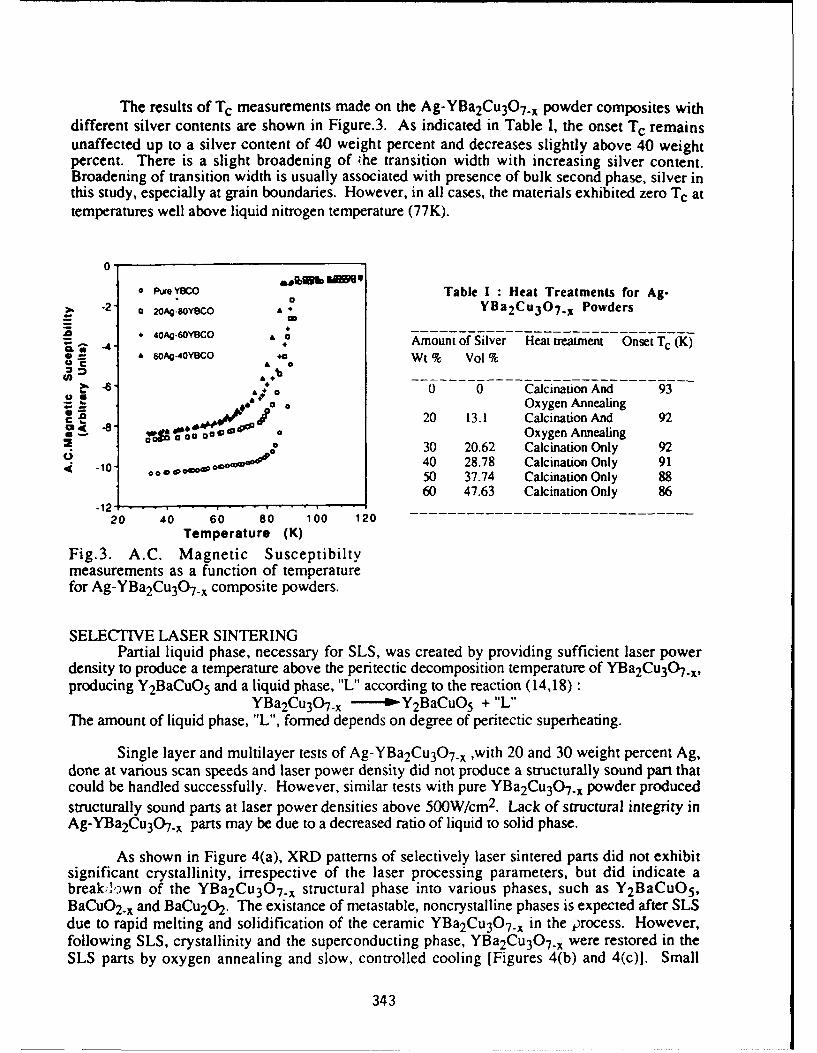
The results of Tc measurements made on the Ag-YBa 2Cu3O 7.. powder composites withdifferent silver contents are shown in Figure.3. As indicated in Table I, the onset Tc remainsunaffected up to a silver content of 40 weight percent and decreases slightly above 40 weightpercent. There is a slight broadening of -he transition width with increasing silver content.Broadening of transition width is usually associated with presence of bulk second phase, silver inthis study, especially at grain boundaries. However, in all cases, the materials exhibited zero Tc attemperatures well above liquid nitrogen temperature (77K).
0.
oPu UOYew Table I : Heat Treatments for Ag--2 a 20Ag-goYBCO YBa 2 Cu 3 07. Powders
- 4 4OAQ.6YVCO a a Amount of Silver Heat treatment Onset Tc (K)& 6 OA-4oYBCO Wt % Vol %
-6- 0 0 Calcination And 93OxygenA
20 13.1 Calcination And 92-8 • 4 CO 0 Oxygen Annealing
SO 30 20.62 Calcination Only 921 -io*•..oaa * 40 28.78 Calcination Only 91
50 37.74 Calcination Only 8860 47.63 Calcination Only 86
20 40 60 80 100 120
Temperature (K)Fig.3. A.C. Magnetic Susceptibiltymeasurements as a function of temperaturefor Ag-YBa 2Cu3O 7.x composite powders.
SELECTIVE LASER SINTERINGPartial liquid phase, necessary for SLS, was created by providing sufficient laser power
density to produce a temperature above the peritectic decomposition temperature of YBa 2Cu3OT.x,producing Y2BaCuO 5 and a liquid phase, "L" according to the reaction (14,18):
YBa 2Cu3O7.x -.--- Y2BaCuO 5 + "L"The amount of liquid phase, "LU, formed depends on degree of peritectic superheating.
Single layer and multilayer tests of Ag-YBa 2Cu 3O7 .x ,with 20 and 30 weight percent Ag,done at various scan speeds and laser power density did not produce a structurally sound part thatcould be handled successfully. However, similar tests with pure YBa 2Cu3O7.x powder producedstructurally sound parts at laser power densities above 500W/cm 2. Lack of structural integrity inAg-YBa 2Cu3O7.x parts may be due to a decreased ratio of liquid to solid phase.
As shown in Figure 4(a), XRD patterns of selectively laser sintered parts did not exhibitsignificant crystallinity, irrespective of the laser processing parameters, but did indicate abreak lown of the YBa 2Cu 3O 7.x structural phase into various phases, such as Y2 BaCuO 5,BaCuO 2.x and BaCu20 2 . The existance of metastable, noncrystalline phases is expected after SLSdue to rapid melting and solidification of the ceramic YBa 2Cu 3O 7 _x in the process. However,following SLS, crystallinity and the superconducting phase, YBa 2Cu 3O7.x were restored in theSLS parts by oxygen annealing and slow, controlled cooling [Figures 4(b) and 4(c)1. Small
343
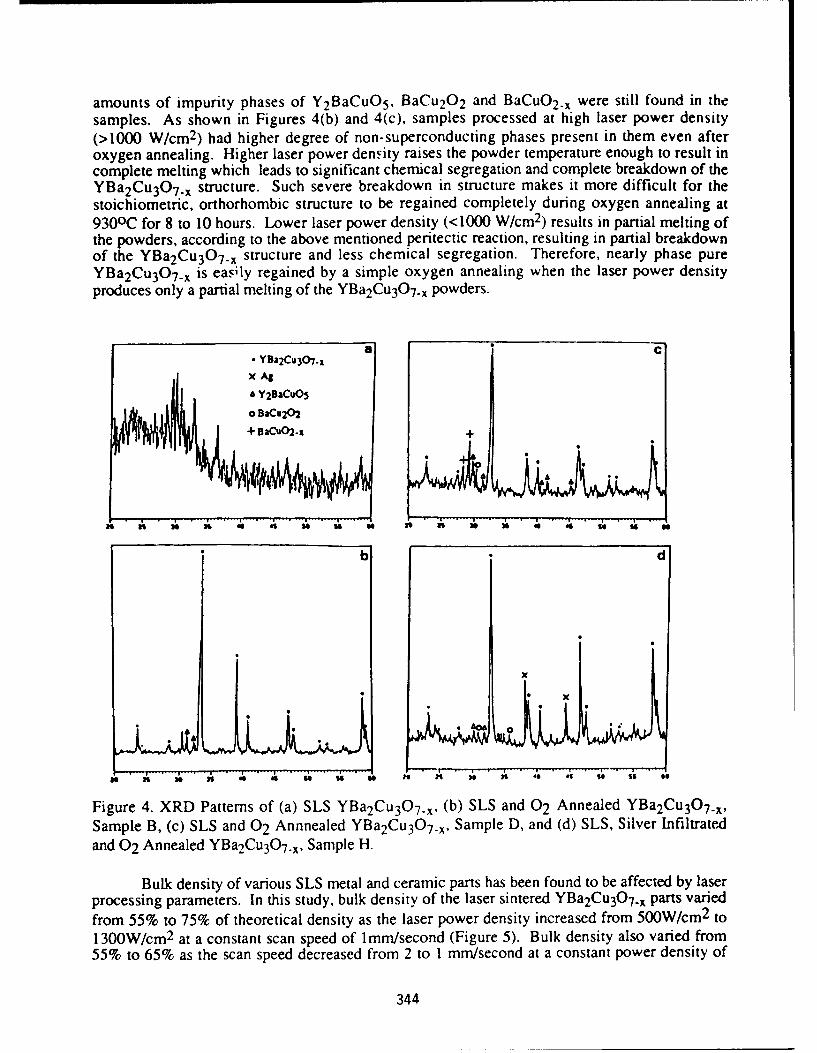
amounts of impurity phases of Y2BaCuO 5 , BaCu 20 2 and BaCu0 2 _.. were still found in thesamples. As shown in Figures 4(b) and 4(c), samples processed at high laser power density(>1000 W/cm 2) had higher degree of non-superconducting phases present in them even afteroxygen annealing. Higher laser power density raises the powder temperature enough to result incomplete melting which leads to significant chemical segregation and complete breakdown of theYBa 2 Cu3 0 7.x structure. Such severe breakdown in structure makes it more difficult for thestoichiometric, orthorhombic structure to be regained completely during oxygen annealing at930 0 C for 8 to 10 hours. Lower laser power density (<1000 W/cm 2 ) results in partial melting ofthe powders, according to the above mentioned peritectic reaction, resulting in partial breakdownof the YBa2 Cu 3 OT.x structure and less chemical segregation. Therefore, nearly phase pureYBa 2Cu 3O7 .x is easily regained by a simple oxygen annealing when the laser power densityproduces only a partial melting of the YBa 2Cu3O7..x powders.
- YBa2Cu 3O.7czX A&
A Y2BaCUOs
o BaCu202+ BaCUO2-x +
3 3 , 3e 3 , 4 45, 3 1 1 i s 3 S A5 , I
b d
* .
Figure 4. XRD Patterns of (a) SLS YBa 2 Cu 3OT7 x, (b) SLS and 02 Annealed YBa 2Cu 30 7 T,,Sample B, (c) SLS and 02 Annnealed YBa 2Cu 3OT7 x, Sample D, and (d) SLS, Silver Infiltratedand 02 Annealed YBa 2Cu3O7.x, Sample H.
Bulk density of various SLS metal and ceramic parts has been found to be affected by laserprocessing parameters. In this study, bulk density of the laser sintered YBa2Cu 307 .x parts variedfrom 55% to 75% of theoretical density as the laser power density increased from 500W/cm 2 to
1300W/cm 2 at a constant scan speed of 1 mm/second (Figure 5). Bulk density also varied from55% to 65% as the scan speed decreased from 2 to 1 mm/second at a constant power density of
344
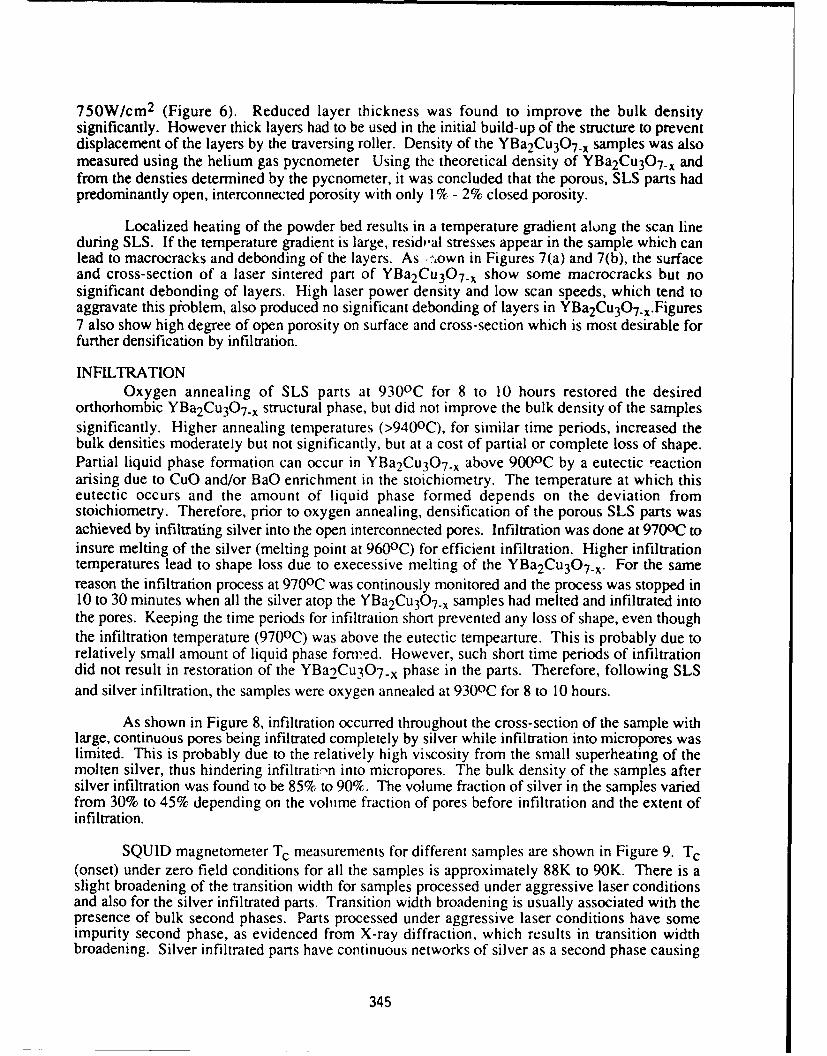
750W/cm 2 (Figure 6). Reduced layer thickness was found to improve the bulk densitysignificantly. However thick layers had to be used in the initial build-up of the structure to preventdisplacement of the layers by the traversing roller. Density of the YBa 2Cu3O7 .x samples was alsomeasured using the helium gas pycnometer Using the theoretical density of YBa 2 Cu3O7 .. andfrom the densties determined by the pycnometer, it was concluded that the porous, SLS parts hadpredominantly open, interconnected porosity with only 1% - 2% closed porosity.
Localized heating of the powder bed results in a temperature gradient along the scan lineduring SLS. If the temperature gradient is large, residal stresses appear in the sample which canlead to macrocracks and debonding of the layers. As sown in Figures 7(a) and 7(b), the surfaceand cross-section of a laser sintered part of YBa 2 Cu 3O7-x show some macrocracks but nosignificant debonding of layers. High laser power density and low scan speeds, which tend toaggravate this pioblem, also produced no significant debonding of layers in YBa 2Cu3O7.x.Figures7 also show high degree of open porosity on surface and cross-section which is most desirable forfurther densification by infiltration.
INFILTRATIONOxygen annealing of SLS parts at 9300C for 8 to 10 hours restored the desired
orthorhombic YBa 2Cu 3O7.x structural phase, but did not improve the bulk density of the samplessignificantly. Higher annealing temperatures (>9400C), for similar time periods, increased thebulk densities moderately but not significantly, but at a cost of partial or complete loss of shape.Partial liquid phase formation can occur in YBa 2Cu 3O 7 _x above 9000 C by a eutectic reactionarising due to CuO and/or BaO enrichment in the stoichiometry. The temperature at which thiseutectic occurs and the amount of liquid phase formed depends on the deviation fromstoichiometry. Therefore, prior to oxygen annealing, densification of the porous SLS parts wasachieved by infiltrating silver into the open interconnected pores. Infiltration was done at 9700C toinsure melting of the silver (melting point at 9600 C) for efficient infiltration. Higher infiltrationtemperatures lead to shape loss due to execessive melting of the YBa2Cu 3O7.,. For the samereason the infiltration process at 9700C was continously monitored and the process was stopped in10 to 30 minutes when all the silver atop the YBa2Cu 307.x samples had melted and infiltrated intothe pores. Keeping the time periods for infiltration short prevented any loss of shape, even thoughthe infiltration temperature (9700C) was above the eutectic tempearture. This is probably due torelatively small amount of liquid phase formed. However, such short time periods of infiltrationdid not result in restoration of the YBa2Cu307_x phase in the parts. Therefore, following SLSand silver infiltration, the samples were oxygen annealed at 9300 C for 8 to 10 hours.
As shown in Figure 8, infiltration occurred throughout the cross-section of the sample withlarge, continuous pores being infiltrated completely by silver while infiltration into micropores waslimited. This is probably due to the relatively high viscosity from the small superheating of themolten silver, thus hindering infiltration into micropores. The bulk density of the samples aftersilver infiltration was found to be 85% to 90%. The volume fraction of silver in the samples variedfrom 30% to 45% depending on the vohime fraction of pores before infiltration and the extent ofinfiltration.
SQUID magnetometer Tc measurements for different samples are shown in Figure 9. Tc(onset) under zero field conditions for all the samples is approximately 88K to 90K. There is aslight broadening of the transition width for samples processed under aggressive laser conditionsand also for the silver infiltrated parts. Transition width broadening is usually associated with thepresence of bulk second phases, Parts processed under aggressive laser conditions have someimpurity second phase, as evidenced from X-ray diffraction, which results in transition widthbroadening. Silver infiltrated parts have continuous networks of silver as a second phase causing
345
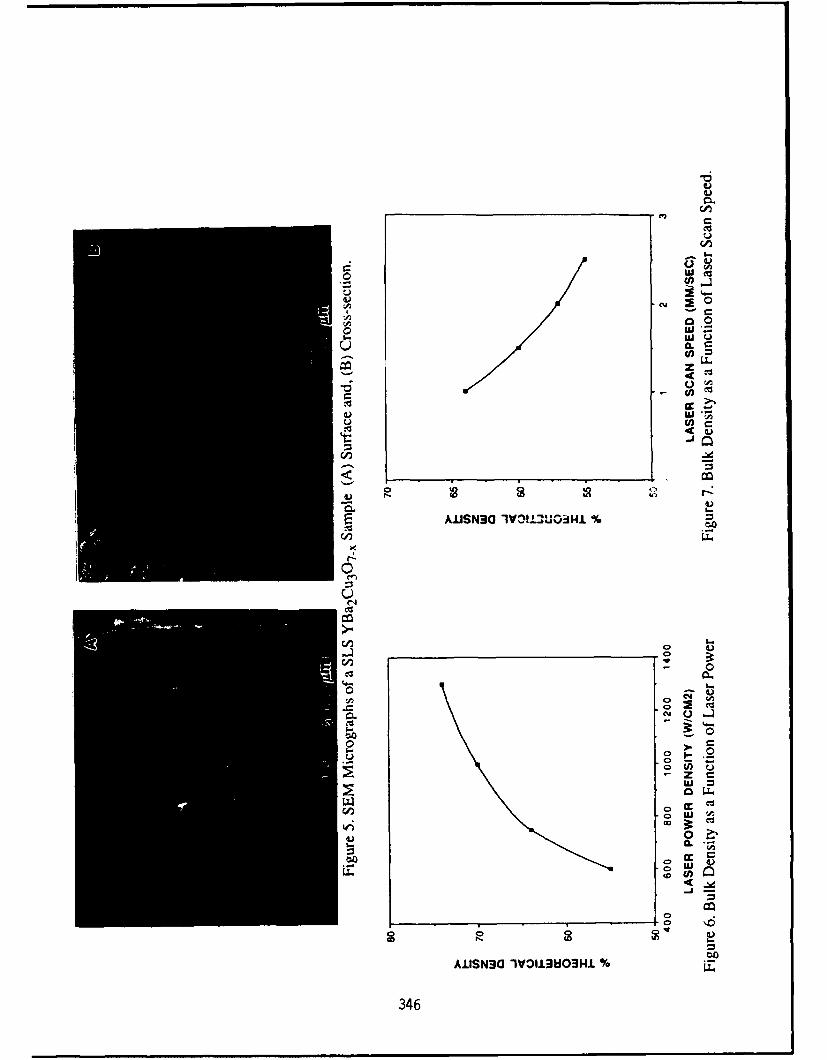
ci,
O CU3
u 4 U)
~0jC - 0 75
E MS3 I*
e 00
CCU
Cii
C-))
346
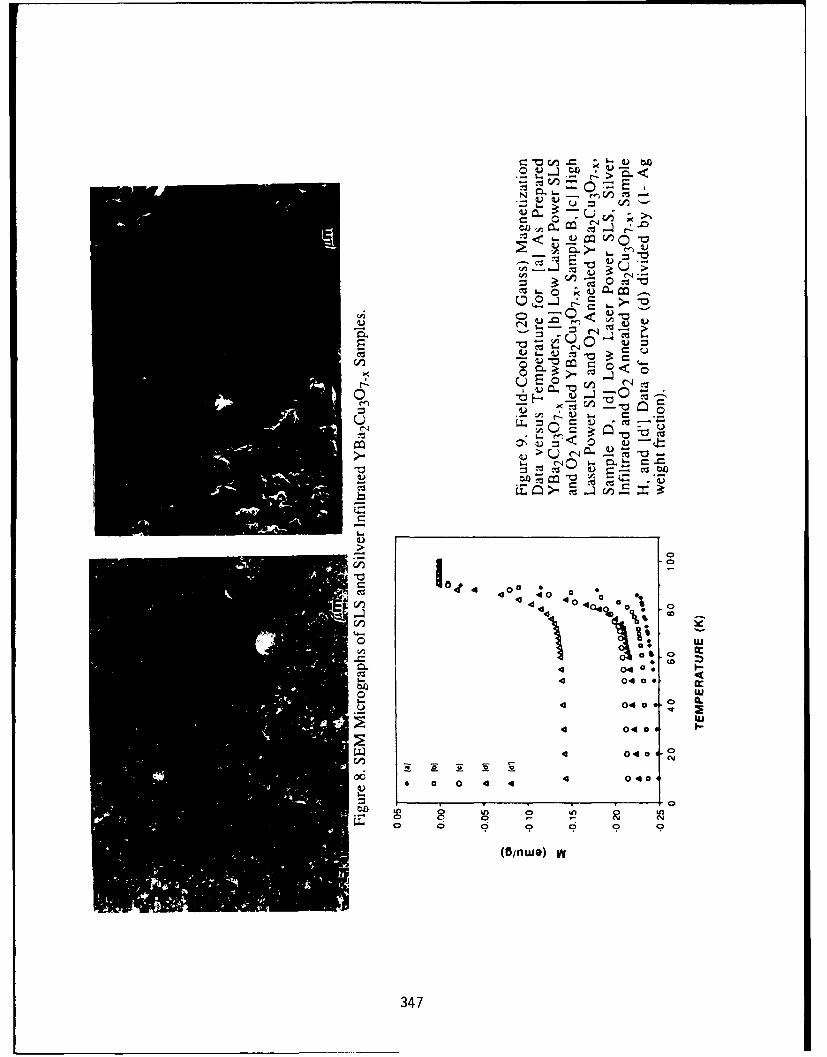
C C)
~u c4)0 ~ Q.
CLM nC
E 04
~(
~ C
C'
r4 0
r_~a 00 *
d 4 a 4
4o 00 0 0.
i.4 0,4
40 04 0 0
0 f 9 UI0 04 0 0- C'J
0 0 a 0 4 0 040
347
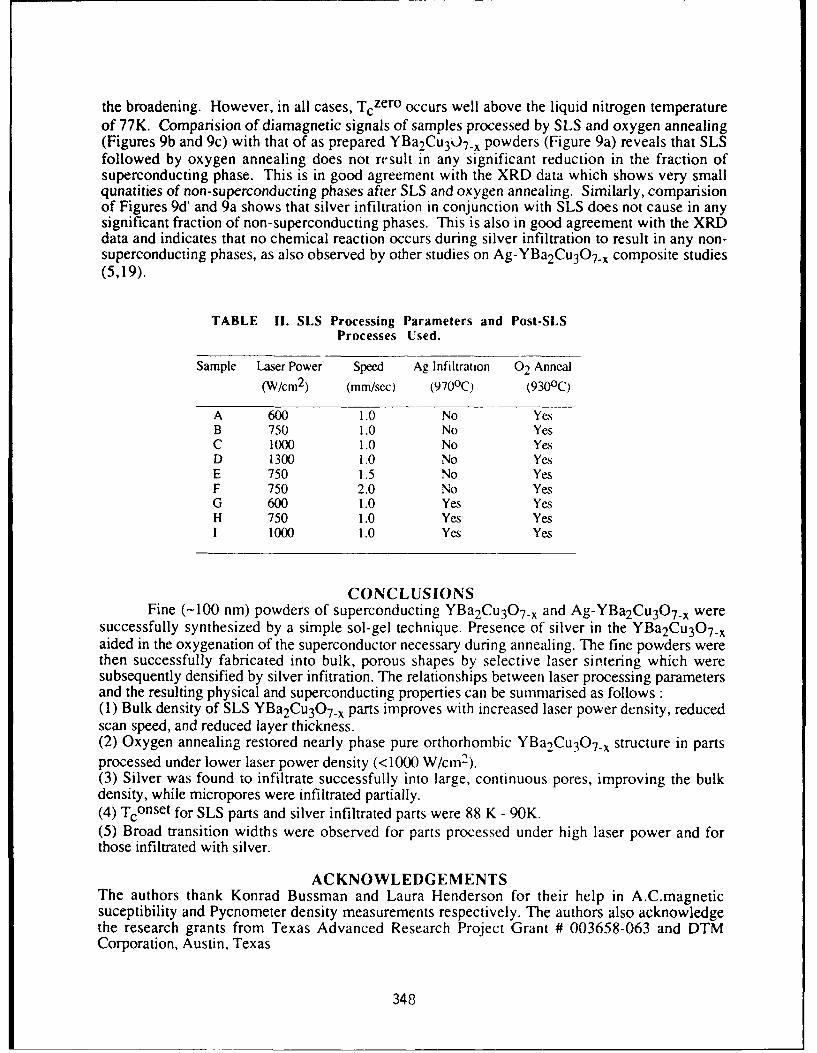
the broadening. However, in all cases, Tczero occurs well above the liquid nitrogen temperatureof 77K. Comparision of diamagnetic signals of samples processed by SLS and oxygen annealing(Figures 9b and 9c) with that of as prepared YBa 2Cu 3OU7 x powders (Figure 9a) reveals that SLSfollowed by oxygen annealing does not rrsult in any significant reduction in the fraction ofsuperconducting phase. This is in good agreement with the XRD data which shows very smallqunatities of non-superconducting phases after SLS and oxygen annealing. Similarly, comparisionof Figures 9d' and 9a shows that silver infiltration in conjunction with SLS does not cause in anysignificant fraction of non-superconducting phases. This is also in good agreement with the XRDdata and indicates that no chemical reaction occurs during silver infiltration to result in any non-superconducting phases, as also observed by other studies on Ag-YBa 2Cu3O 7..x composite studies(5,19).
TABLE II. SLS Processing Parameters and Post-SLSProcesses Used.
Sample Laser Power Speed Ag Infiltration 02 Anneal
(W/cm 2 ) (mm/sec) (9700 C) (930 0 C)
A 600 1.0 No YesB 750 1.0 No YesC 1000 1.0 No YesD 1300 1.0 No YesE 750 1.5 No YesF 750 2.0 No YesG 600 1.0 Yes YesH 750 1.0 Yes YesI 1000 1.0 Yes Yes
CONCLUSIONSFine (-100 nm) powders of superconducting YBa 2Cu 3O7T. and Ag-YBa 2Cu 3O7.x were
successfully synthesized by a simple sol-gel technique. Presence of silver in the YBa 2Cu 3O 7.xaided in the oxygenation of the superconductor necessary during annealing. The fine powders werethen successfully fabricated into bulk, porous shapes by selective laser sintering which weresubsequently densified by silver infitration. The relationships between laser processing parametersand the resulting physical and superconducting properties can be summarised as follows :(1) Bulk density of SLS YBa 2Cu3O7T, parts improves with increased laser power density, reducedscan speed, and reduced layer thickness.(2) Oxygen annealing restored nearly phase pure orthorhombic YBa2Cu 307_x structure in partsprocessed under lower laser power density (<1000 W/cm2 ).(3) Silver was found to infiltrate successfully into large, continuous pores, improving the bulkdensity, while micropores were infiltrated partially.(4) Tconset for SLS parts and silver infiltrated parts were 88 K - 90K.(5) Broad transition widths were observed for parts processed under high laser power and forthose infiltrated with silver.
ACKNOWLEDGEMENTSThe authors thank Konrad Bussman and Laura Henderson for their help in A.C.magneticsuceptibility and Pycnometer density measurements respectively. The authors also acknowledgethe research grants from Texas Advanced Research Project Grant # 003658-063 and DTMCorporation, Austin, Texas
348
References
1. J.G.Bednorz, and K.A.Muller, "Possible High-Tc Superconductivity in the Ba-La-Cu-OSystem," Z. Phys. B: Condens. Matter 64, 189, (1986).2. T.Venkatesan, X.D.Wu, B.Dutta, A.Inam, M.S.Hegde, D.M.Hwang, C.C.Chang, L.Nazar,and B.Wilkins, Appl. Phys. Lett., 54, 6, (1989).3.R.C.Sherwood, S.Jin, T.H.Tiefel, R.B.Van Dover, R.A.Fastnacht, M.F.Yan andW.W.Rhodes,"Superconducting Properties of YBa 2Cu 3O7 .x Doped with Various Metals andOxides," Mat. Res. Soc. Symp. Proc. Vol. 99. 503-506 (1988).4. M.F.Yan, W.W.Rhodes, and P.K.Gallagher, "Dopant Effects on the Superconductivity ofYBa2 Cu3O7 Ceramics," J. Appl. Phys. 63(3) 821-828 (1988).5. Y.Matsumot6, J.Hombo, Y.Yamaguchi, M.Nishida, and A.Chiba, "Origin of the SilverDoping Effects on Superconducting Oxide Ceramics," Appl. Phys. Lett., vol. 56 No. 16 1585-1587 (1990).6. M.Itoh, H.Ishigaki, T.Ohyama, T.Minemoto, H.Nojiri, and M.Motokawa, "Influence of Silveron Critical Current of the Y-Ba-Cu-O Superconductor," J. Mater. Res. 6[11] 2272-2279 (1991).7.S.Jin, T.H.Tiefel, R.C.Sherwood, R.B.Van Dover, M.E.Davis, G.W.Kammlott, andR.A.Fastnacht, "Melt Textured Growth of Polycrystalline YBa2 Cu3O7 .x with High Transport Jc at77K," Phys. Rev. B, 37, 7850, (1988).8. J.P.Singh, H.J.Leu, R.B.Poeppel, E.van Voorhees, G.T.Goudey, K.Winsley, and D.Shi,"Effect of Silver and Silver Oxide Additions on the Mechanical and Superconducting Properties ofYBa 2Cu3O7.x Superconductors," J. Appl. Phys., 66(7), 3154, (1989).9. S.Sen, I.Chen, C.H.Chen, and D.M.Stefanescu, "Fabrication of Stable Superconductive Wireswith YBa 2Cu3Ox/Ag2O Composite Core," Appl. Phys. Lett., 54(8), 766, (1989).10. M.Kakihana, L.Borjesson, S.Erikson, P.Svedlindh, and P.Norling, "Synthesis of HighlyPure YBa 2Cu 3O7Tx Superconductors Using a Colloidal-Processing Technique," Physica C, 162,931, (1989).11. D.L.Bourell, H.L.Marcus, J.W.Barlow, and J.J.Beaman, "Selective Laser Sintering of Metalsand Ceramics," Int. J. Powder. Met., 28(4), 369, (1992).12. Proceedings of the Solid Freeform Fabrication Symposium, 1991. Edited by H.L.Marcus,J.J.Beaman, J.W.Barlow, D.L.Bourell, and R.H.Crawford, Aug. 12-14, 1991, The Universityof Texas at Austin, Austin, Texas.13. Proceedings of the Solid Freeform Fabrication Symposium, 1992. Edited by H.L.Marcus,J.J.Beaman, J.W.Barlow, D.L.Bourell, and R.H.Crawford, Aug. 3-5, 1992, The University ofTexas at Austin. Austin, Texas.14. K.Oka, K.Nakane, M.Ito, M.Saito, and H.Unoki, " Phase-Equilibrium Diagram in theTernary System Y2 0 3 -BaO-CuO," Jpn. J. Appl. Phys., 27(6), L1065, (1988).
15. N.Nevriva, P.Holba, S.Durcok, D.Zemanova, E.Pollert, and A.Trisk, " On the MeltEquilibria in the Y-Ba-Cu-(O) System," Physica C, 157, 334, (1989)16. R.M.German,"Phase Diagrams in Liquid Phase Sintering Treatments," J. Metals, 38(8), 26,(1986).17. Y.Gao, K.L.Merkle, C.Zhang, U.Balachandran and R.B.Poeppel, "Decomposition ofYBa 2Cu3O7 During Annealing in C02/0 2 Mixtures," J. Mater. Res. 5[7] 1363-1367 (1990).
18. N.Ozkan, B.A.Glowacki, E.A.Robinson, and P.A. Freeman, "Infrared Zone Melting Processfor YBa 2 Cu3O7Tx Wires," J. Mater. Res., 6(9), 1829, (1991).19. B.Ropers, R.Canet, F.Carmona, and S.Flandrois, "Transport Properties and PercolatingBehavior of YBaCuO/Ag Random Composites Above and Below Tc," Solid State Comm.,75(10), 791, (1990).
349
Selective Laser Sintering of A12 0 3.
P. Kamatchi Subramanian, G. Zong, N.K. Vail,J.W. Barlow and H.L. Marcus
Center for Materials Science and Engineering,The University of Texas at Austin
Abstract
Selective Laser Sintering (SLS) of A120 3 with an organic binderto create the green part is reported. The effect of processingparameters on the strength and density of parts produced by SLS are
examined. The effect of particle size on the process and resultinggreen strength was studied. Two methods of applying the polymerbinder to the ceramic powder, i) spray drying and ii) mixing, are
compared.
IntroductionSelective Laser Sintering (SLS) has been employed as a method
of forming parts from A120 3. Three approaches to SLS of A120 3 maybe employed to make parts. These are i) use an inorganic binderl. 2,3
to bond the A120 3 particles, ii) use an organic binder such as polymethyl methacrylate 4 (PMMA) to bond the alumina and iii) direct
sintering of the A120 3 powder. This paper describes the experiments
done on the laser sintering of A1 203 powder of various sizes withorganic binders and reports the properties of the green SLS parts.
When an organic binder is used the binder may be removed
completely at a later stage by burnout. Thus, with the proper choiceof the binder, it has the advantage of little material contaminationand of being a low temperature SLS process.
ExperimentsThree kinds of A120 3 powder were investigated for this study.
The characteristics are shown in table I. The 24m and 8.tm powders
contained some flocculants that were removed by heating to 8000 C.
350
Agglomeration of the particles as received was observed only for8grm particles. The 2gm particles had limited agglomerationfollowing the 800C thermal treatment.
Table I
Sample Ave. Composition Agglomeration
Particle size
2 gm 99.5% A1203 Some
8 gm 85%A1203, 2%CaO Particles were in70-100gimIl%Mg-O, Bal SiO2lM B iagglomerates.
15 gm 99.5% A1203 None
Two methods of applying the PMMA to the powder were used:i) mixing the polymer powder with the ceramic powder and ii)Spraydrying the ceramic powder with the polymer emulsion usingconditions shown in table II. The polymer powder used for the mixwas obtained by spray drying the polymer emulsion.
The 2gm powder was spray dried with poly methylmethacrylate (PMMA) emulsion to 35 and 25 vol% respectivelyaccording to conditions listed in table II.
Table II Spray drier conditionsInlet temperature Outlet temperature Atomizer speed
(OC) (OC) (RPM)
250 90 to 105 30,000
The agglomerates of the 8grm powder were mixed with PMMA
powder produced by spray drying and processed by SLS. Threevolume fractions 20, 30and 40 vol% of PMMA were employed. Theseexhibited good green strengths after SLS.
The agglomerates of the 8pgm material were also spray driedwith PMMA to 30 vol% after adding a viscosity enhancer (Xantham
351
gum , 0.5%) and tested by SLS. The Xantham gum was necessary toreduce the settling of the agglomerates.
The 70-100ltm agglomerates of 81.in particles were brokendown using an attritor. This attrited powder was processed both bymixing with PMMA powder and also by spray drying with PMMA.
The 15jtm powder was spray dried with PMMA to 30 vol% andthe uncoated 15iim ceramic was added to dilute the concentration ofPMMA to 25 vol%. Parts were made and density and bend strengthdetermined. As a comparison the 15.tm was also mixed with PMMA
powder to 25 vol% and parts made by SLS and density and bendstrength determined.
The following processing parameters were used for the SLSexperiments. The powder bed was maintained at a temperature ofabout 850C and laser power kept a constant at IOW. The scan linespacing was fixed at 0.005". The layer thickness was fixed at 0.007".The beam speed was varied to alter the power density incident onthe layer. Power density is defined as the amount of energy incidenton the layer per unit area in cal/cm 2 . Specimens were tested forboth bend strength and density. The volume of the specimen wasdetermined by mensuration to estimate the density. The bendstrength was determined with a three point bend test using aINSTRON constant displacement rate machine.
Results and discussion.SLS of parts from the 21am powder at both 25 and 35 vol%
produced low strength green parts. Strong green parts wereproduced when the agglomerates of 8[tm powder was mixed withPMMA powder and processed by SLS. The variation of bend strengthand density with power density of these samples are shown inFigure 1 and Figure 2. When the agglomerated powder was spraydried with PMMA the agglomerates broke down during spray drying.Strong parts were not produced by SLS from the spray driedpowder. When the 8jtm powder is deagglomerated it does not form
352
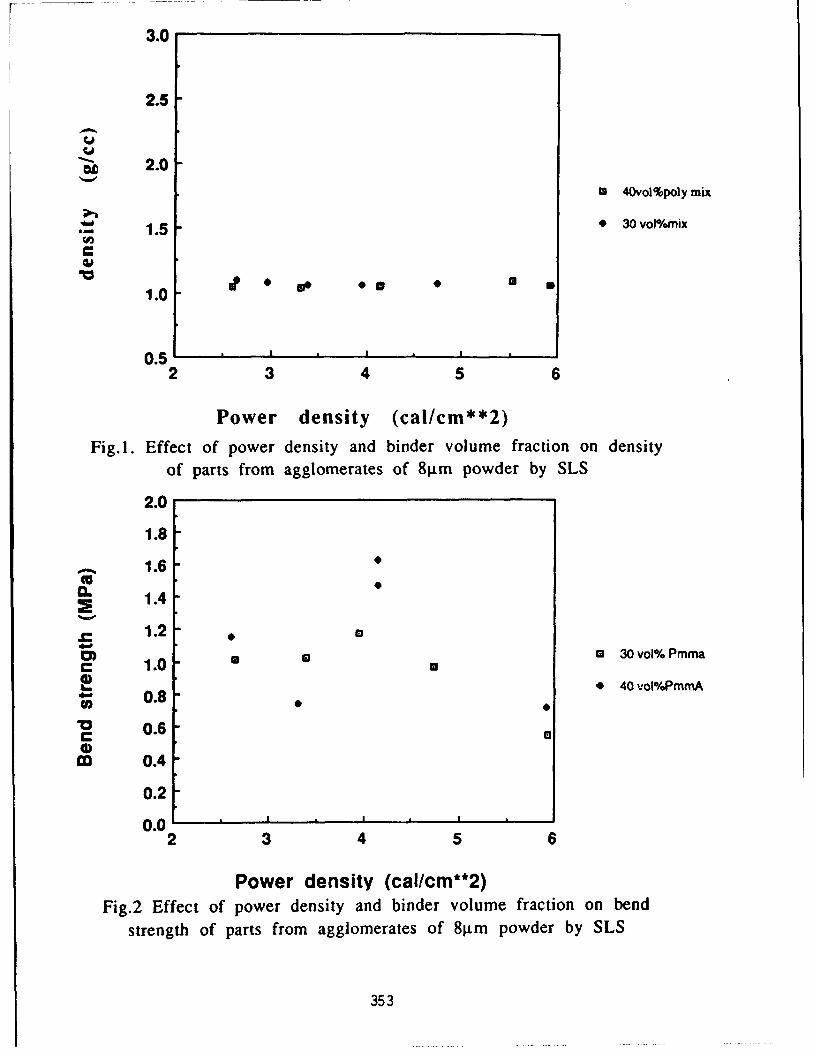
3.0
2.5
qj
2.0
M 40vol%poly mix
.�5 * 30 volmix1.5 .
1.0 -9g
0.5 *
2 3 4 5 6
Power density (cal/cm**2)
Fig.1. Effect of power density and binder volume fraction on density
of parts from agglomerates of 81jm powder by SLS
2.0
1.8,-• 1.6 9
ccCL 1.4
1.2 U
* UI 30 vol% Pmma1.00.8 • 40 vol'o/fmmA
V 0.6C0)
i•1 0.4
0.2
0 .0 - ----2 3 4 5 6
Power density (cal/cm**2)Fig.2 Effect of power density and binder volume fraction on bend
strength of parts from agglomerates of 8tim powder by SLS
353

strong parts when mixed or spray dried with PMMA partly due to
the nonuniform coating of the powder. The 151am powder mixed and
spray dried produced reasonable green strengths. The bend strengthand density of the samples from 151gm powder are shown in Figure 4
and Figure 5.
Effect of binder content on strength.
Equation 1 relates the effect of binder content to the strength
of composite5 .a = k (Vb/Vp )0.75 (yE/G)°.5 (1)
where a =strength of porous material, k= constant, Vb=volume
content of binder phase , VP= volume content of primary phase,
y= Surface fracture energy, E= Young's modulus and G= Grain
size. This equation was derived for brittle materials built up of
particles joined at points of contact. A curve fit of the strength to theVb/VP ratio for three volume fractions of the polymer in the case of
10
0.1 -
0.1 1Vb/Vp
Figure3. Effect of binder volume fraction on bend strength
35t
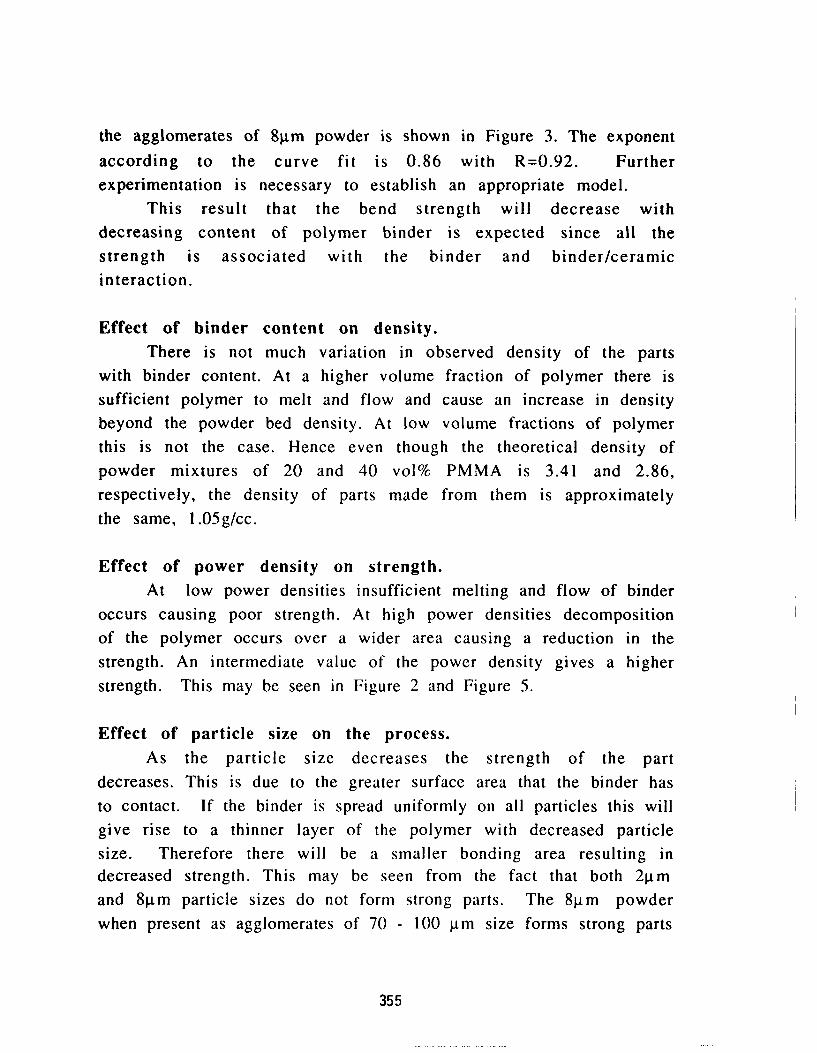
the agglomerates of 8jim powder is shown in Figure 3. The exponent
according to the curve fit is 0.86 with R=0.92. Furtherexperimentation is necessary to establish an appropriate model.
This result that the bend strength will decrease with
decreasing content of polymer binder is expected since all thestrength is associated with the binder and binder/ceramicinteraction.
Effect of binder content on density.There is not much variation in observed density of the parts
with binder content. At a higher volume fraction of polymer there is
sufficient polymer to melt and flow and cause an increase in densitybeyond the powder bed density. At low volume fractions of polymerthis is not the case. Hence even though the theoretical density ofpowder mixtures of 20 and 40 vol% PMMA is 3.41 and 2.86,respectively, the density of parts made from them is approximately
the same, 1.05g/cc.
Effect of power density on strength.At low power densities insufficient melting and flow of binder
occurs causing poor strength. At high power densities decompositionof the polymer occurs over a wider area causing a reduction in the
strength. An intermediate value of the power density gives a higherstrength. This may be seen in Figure 2 and Figure 5.
Effect of particle size on the process.As the particle size decreases the strength of the part
decreases. This is due to the greater surface area that the binder hasto contact. If the binder is spread uniformly on all particles this willgive rise to a thinner layer of the polymer with decreased particle
size. Therefore there will be a smaller bonding area resulting indecreased strength. This may be seen from the fact that both 2timand 8g.m particle sizes do not form strong parts. The 8gm powderwhen present as agglomerates of 70 - 100 gtm size forms strong parts
355
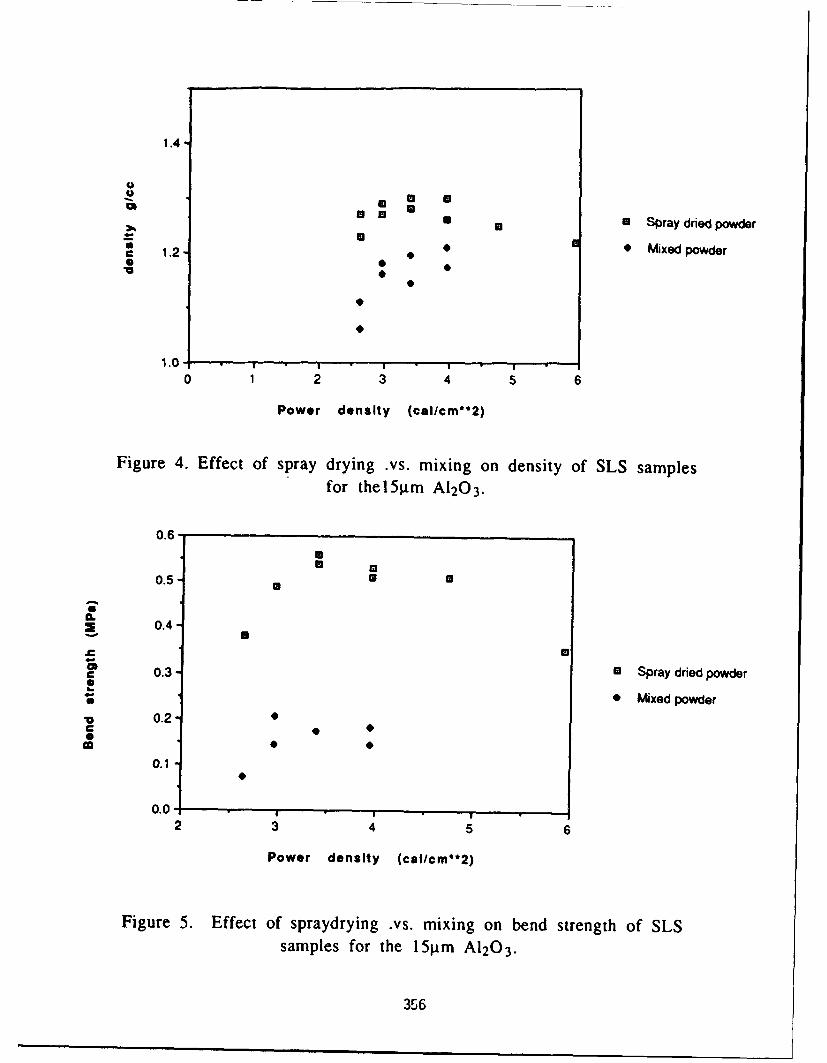
1.4
U
mU Um U Spray dried powder1 .2 Mixed powderC 1.2-
1.0 , . I , ,0 1 2 3 4 5 6
Power density (Cal/cm*'2)
Figure 4. Effect of spray drying .vs. mixing on density of SLS samplesfor thel5g.tm A120 3.
0.6
0.5 U UUm
C.2 0.4
,,• lU
0.3 - Spray dried powderU
.b* Mixed powder
0.2-
0.1
0.0,2 3 4 5 6
Power density (cal/cm**2)
Figure 5. Effect of spraydrying .vs. mixing on bend strength of SLSsamples for the 15g.m A120 3.
356
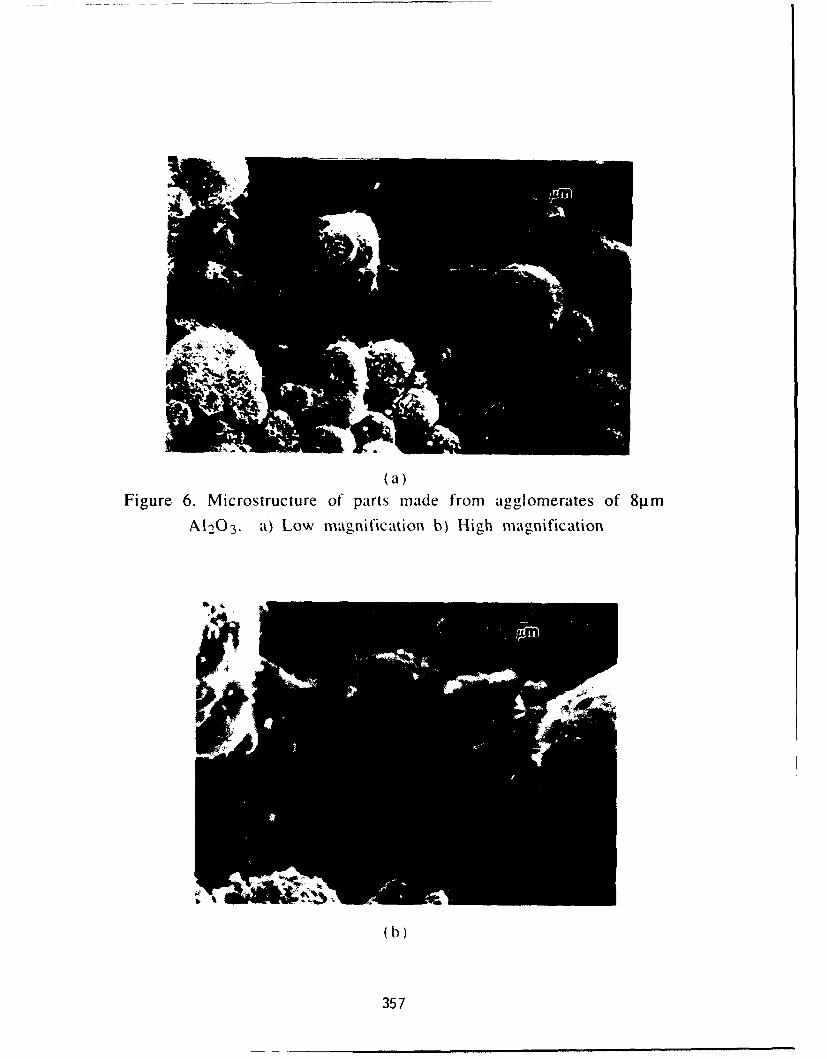
(a)Figure 6. Microstructure of parts made from agglomerates of 81.tm
Al•_O3. a) Low magnificatio• b) High magnification
S!I !I1 '
•"•.•
(b)
357
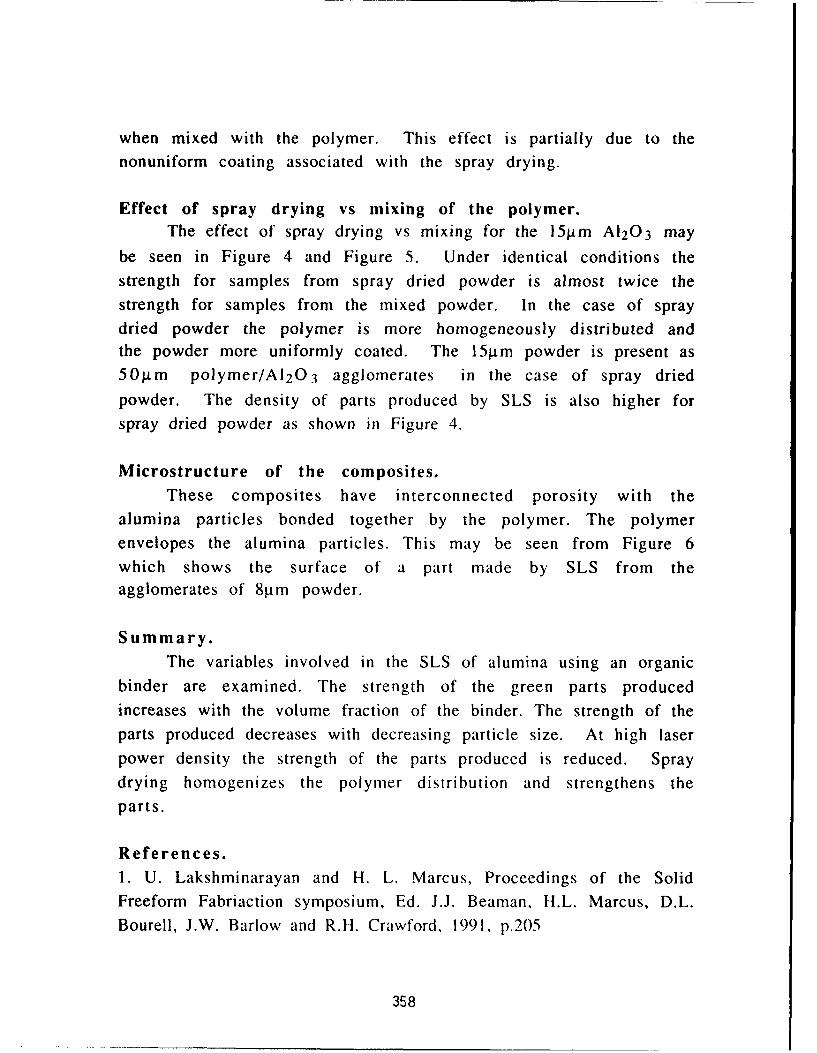
when mixed with the polymer. This effect is partially due to thenonuniform coating associated with the spray drying.
Effect of spray drying vs mixing of the polymer.The effect of spray drying vs mixing for the 15iim A120 3 may
be seen in Figure 4 and Figure 5. Under identical conditions thestrength for samples from spray dried powder is almost twice thestrength for samples from the mixed powder. In the case of spraydried powder the polymer is more homogeneously distributed andthe powder more uniformly coated. The 15gm powder is present as50m polymer/A12 0 3 agglomerates in the case of spray dried
powder. The density of parts produced by SLS is also higher forspray dried powder as shown in Figure 4.
Microstructure of the composites.These composites have interconnected porosity with the
alumina particles bonded together by the polymer. The polymerenvelopes the alumina particles. This may be seen from Figure 6which shows the surface of a part made by SLS from theagglomerates of 8itm powder.
Summary.The variables involved in the SLS of alumina using an organic
binder are examined. The strength of the green parts producedincreases with the volume fraction of the binder. The strength of theparts produced decreases with decreasing particle size. At high laserpower density the strength of the parts produced is reduced. Spraydrying homogenizes the polymer distribution and strengthens theparts.
References.1. U. Lakshminarayan and H. L. Marcus, Proceedings of the SolidFreeform Fabriaction symposium, Ed. J.J. Beaman, H.L. Marcus, D.L.Bourell, J.W. Barlow and R.H. Crawford, 1991, p.205
358
2. U. Lakshminarayan and H. L. Marcus, Proceedings of the SolidFreeform Fabriaction symposium, Ed. J.J. Beaman, H.L. Marcus, D.L.Bourell, J.W. Barlow and R.H. Crawford, 1992, p. 4 4
3. P.K. Subramanian, G. Zong and H.L. Marcus, Proceedings of the Solid
Freeform Fabriaction symposium, Ed. J.1. Beaman, H.L. Marcus, D.L.Bourell, J.W. Barlow and R.H. Crawford, 1992, p. 6 3
4. N.K. Vail and J.W. Barlow, Proceedings of the Solid FreeformFabriaction symposium, Ed. J.J. Beaman, H.L. Marcus, D.L. Bourell, J.W.Barlow and R.H. Crawford, 1992, p. 12 4
5. H.H. Bache, Journal of American Ceramic Society, 53 (12), 1970,
p.654
Ackn,'wledgmentsWe acknowledge financial support of this work from DARPA-
ONR grant N0014-92-J-1394. We also acknowledge the assistance ofMr. B. Balasubramanian in some stages of this work.
359
Laser Sintering Model for Composite Materials
J. C. Nelson, N. K. Vail and J. W. BarlowDepartment of Chemical Engineering
The University of Texas at Austin
Abstract
A computer model for the sintering of ceramic/polymer compositematerials has been established based on empirical sintering rate data. Themodel calculates sintering depths which result from variations in theoperating parameters which include laser power, beam speed, scanspacing, scan vector length, and initial temperatures of the powder andsurroundings. Sintering depths measured in multiple layer parts made ofpolymer coated ceramic powders art compared to sintering depthscalculated by the sintering model.
Introduction
In this paper, the development of a sintering model for composite materials isexamined. The sintering model for composites is based strongly on a previouslydeveloped model which calculates the extent of sintering and subsequent densification ofamorphous polymer powders in response to Selective Laser Sintering (SLS) operatingconditions and scanning parameters [Nelson, 1993].
Composite materials are comprised of a non-sintering phase, ceramic or metal,and a sintering phase, polymer. The non-sintering phase is either mixed or coated withthe polymer prior to sintering. As the laser scans the composite powder during the partbuild, the polymer is selectively melted, and upon cooling, solidifies binding the non-sintering phase together. Post-processing of green1 SLS part removes the polymer phaseand bonds the ceramic or metal in a homogeneous phase.
The material system examined in this paper is a ceramic/polymex composite. Theceramic is Silicon Carbide (SiC), and the polymer is poly(methyl methacrylate). Thepolymer is polymerized in emulsion form, and in a subsequent step, the SiC powder iscoated with a thin layer of polymer in a spray dryer. Twenty-five volume percentpolymer is applied to the ceramic powder in the spray drying step, then uncoated ceramicis added to reduce the polymer content to twenty volume percent.
Sintering Model
The development of a computer model is crucial in the understanding and futureautomation of the SLS process. The sintering model is used as a tool to investigate howthe various process variables (i.e. scan speed, laser power, and scan spacing) effect thequality of the finished SLS parts. A sintering model also allows one to perform a
"1A "green" part refers to the state of the SLS object after removal from the sintering machine but beforeundergoing any post-processing steps.
360
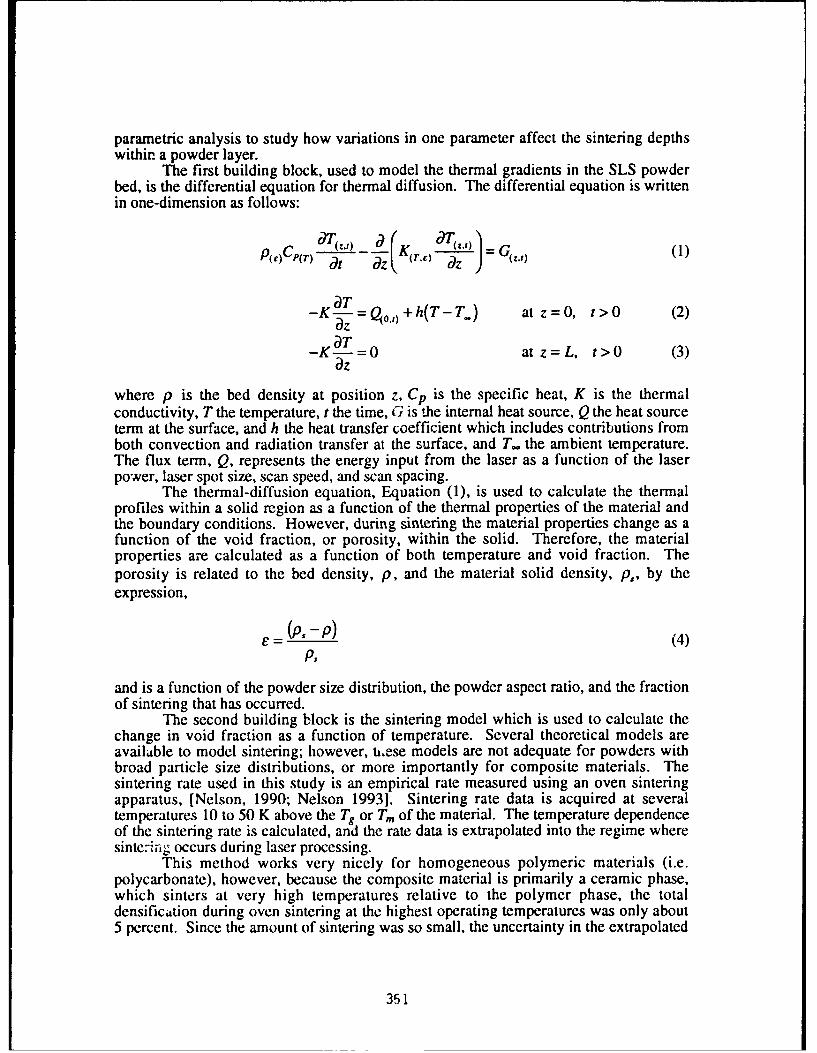
parametric analysis to study how variations in one parameter affect the sintering depthswithin a powder layer.
The first building block, used to model the thermal gradients in the SLS powderbed, is the differential equation for thermal diffusion. The differential equation is writtenin one-dimension as follows:
P(I)Cp(r) dt d K(r.,)_ = (1)dt dz K(rE (z~
- at z=O, t>0 (2)aT
-K -Z = 0 atz=L, t>0 (3)
where p is the bed density at position z, Cp is the specific heat, K is the thermalconductivity, T the temperature, t the time, G is the internal heat source, Q the heat sourceterm at the surface, and h the heat transfer coefficient which includes contributions fromboth convection and radiation transfer at the surface, and T* the ambient temperature.The flux term, Q, represents the energy input from the laser as a function of the laserpower, laser spot size, scan speed, and scan spacing.
The thermal-diffusion equation, Equation (1), is used to calculate the thermalprofiles within a solid region as a function of the thermal properties of the material andthe boundary conditions. However, during sintering the material properties change as afunction of the void fraction, or porosity, within the solid. Therefore, the materialproperties are calculated as a function of both temperature and void fraction. Theporosity is related to the bed density, p, and the material solid density, p, by theexpression,
_ = (p, -P) (4)P,
and is a function of the powder size distribution, the powder aspect ratio, and the fractionof sintering that has occurred.
The second building block is the sintering model which is used to calculate thechange in void fraction as a function of temperature. Several theoretical models areavailable to model sintering; however, tb.ese models are not adequate for powders withbroad particle size distributions, or more importantly for composite materials. Thesintering rate used in this study is an empirical rate measured using an oven sinteringapparatus, [Nelson, 1990; Nelson 19931. Sintering rate data is acquired at severaltemperatures 10 to 50 K above the Tg or Tm. of the material. The temperature dependenceof the sintering rate is calculated, and the rate data is extrapolated into the regime wheresinte-rng occurs during laser processing.
This method works very nicely for homogeneous polymeric materials (i.e.polycarbonate), however, because the composite material is primarily a ceramic phase,which sinters at very high temperatures relative to the polymer phase, the totaldensification during oven sintering at the highest operating temperatures was only about5 percent. Since the amount of sintering was so small, the uncertainty in the extrapolated
351
rate data was large. For this reason, we measured the sintering rate of a sample ofpolymer binder in powder form.
Therefore, instead of measuring the rate at which the composite material sinters,we obtained the sintering rate of the binder. Our next task, was to relate the polymersintering rate to the composite sintering rate. After proposing several models for theinteractions that may occur during the sintering of ceramic agglomerates coated with apolymer binder, we settled on a very simple model. Basically, the ceramic and thepolymer are treated as two separate powders, and the change in void fraction only occursin the polymer phase. By this approximation, if the polymer phase completely sinters tofull density, the overall change in void faction is proportional to the amount of polymerpresent. In our study, the complete sintering of polymer results in the complete sinteringof 20 percent of the composite material.
The two building blocks described above, the thermal diffusion equation and thesintering rate equation, are combined in a one-dimensional finite element programoptimized to model powder sintering. This transient model calculates the temperatureprofiles within the powder bed during SLS processing. Within each time step, thetemperature profile is used to compute the degree of sintering at each node, and anychanges in porosity are calculated. The simulation is complete when the temperature ofthe powder bed drops below the softening temperature of the polymer where sintering nolonger occurs.
Material Properties
In order to model sintering and the subsequent densification during SLSprocessing, four pieces of information about the material system must be known whichare the thermal conductivity, specific heat, density, and sintering rate of the compositematerial. Traditionally, the thermal properties of powders are not readily available,therefore, methods of measurement and calculation of the thermal properties must beexamined. Calculation of the thermal properties of a powder poses several challenges.The fact that the material system focused upon in this paper is a composite, increases thedifficulty of calculation. Techniques for measurement and prediction of the thermalproperties needed for the development of a sintering model are presented below.
DensityThe solid density of the composite material is calculated as a function of densities
of the individual materials,
pA = •PP. +(l - )psic (5)
where 0 is the volume fraction of polymer binder. For our material system, the polymercomprises 20 percent of the total volume and has a density of 1.2 g/cm 3. The ceramic,Silicon Carbide has a solid density of 3.217 g/cm 3 . Therefore the solid density of thecomposite material is 2.81 g/cm 3 by Equation (5).
The density of the agglomerated powder is calculated as a function of the soliddensity and the powder porosity, Equation (4). The initial porosity of the powder bed is0.5, which corresponds to a density of 1.41 g/cm 3 . As the porosity decreases, the densityof the powder bed approaches the solid density of the composite.
369
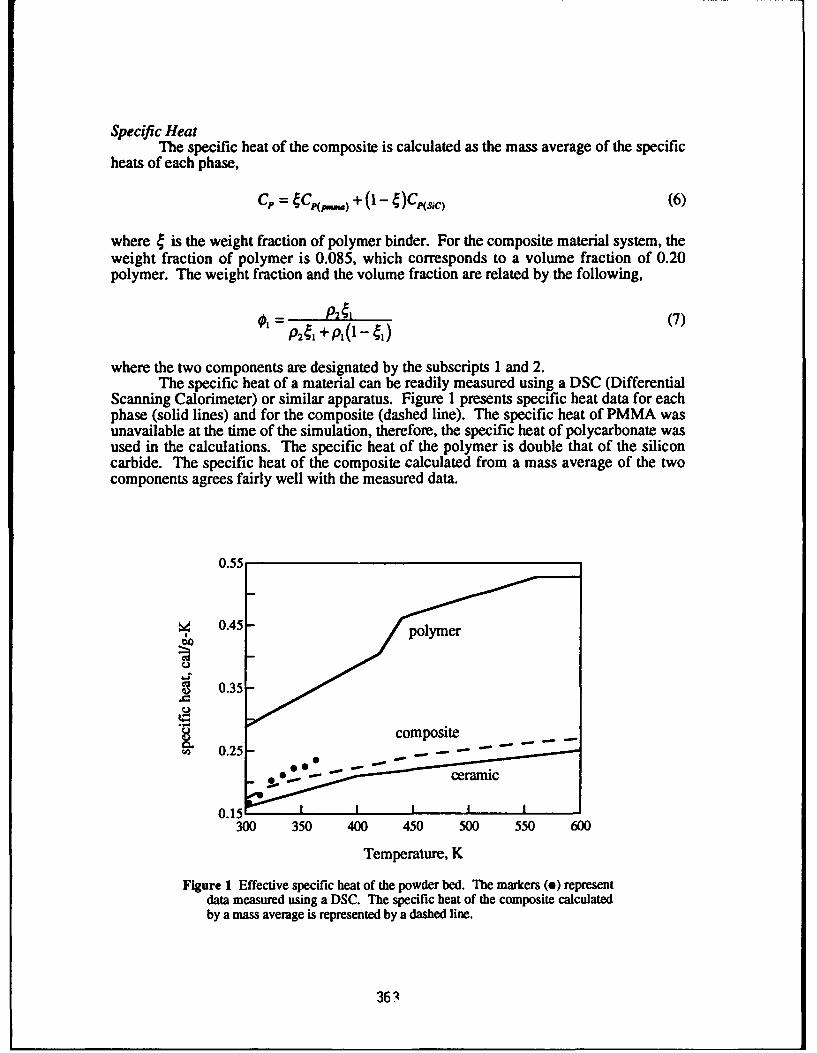
Specific HeatThe specific heat of the composite is calculated as the mass average of the specific
heats of each phase,
C, = g + (I- )C,.si) (6)
where 4 is the weight fraction of polymer binder. For the composite material system, theweight fraction of polymer is 0.085, which corresponds to a volume fraction of 0.20polymer. The weight fraction and the volume fraction are related by the following,
O,= P241 (7)P241 +P,(l -41
where the two components are designated by the subscripts 1 and 2.The specific heat of a material can be readily measured using a DSC (Differential
Scanning Calorimeter) or similar apparatus. Figure 1 presents specific heat data for eachphase (solid lines) and for the composite (dashed line). The specific heat of PMMA wasunavailable at the time of the simulation, therefore, the specific heat of polycarbonate wasused in the calculations. The specific heat of the polymer is double that of the siliconcarbide. The specific heat of the composite calculated from a mass average of the twocomponents agrees fairly well with the measured data.
0.55
• 0.45
S0.35-
composite-0.25 -- - I --
S.ceramic
0.1i I I I I
300 350 400 450 500 550 600
Temperature, K
Figure 1 Effective specific beat of the powder bed. The markers (9) representdata measured using a DSC. The specific beat of the composite calculatedby a mass average is represented by a dashed line.
363
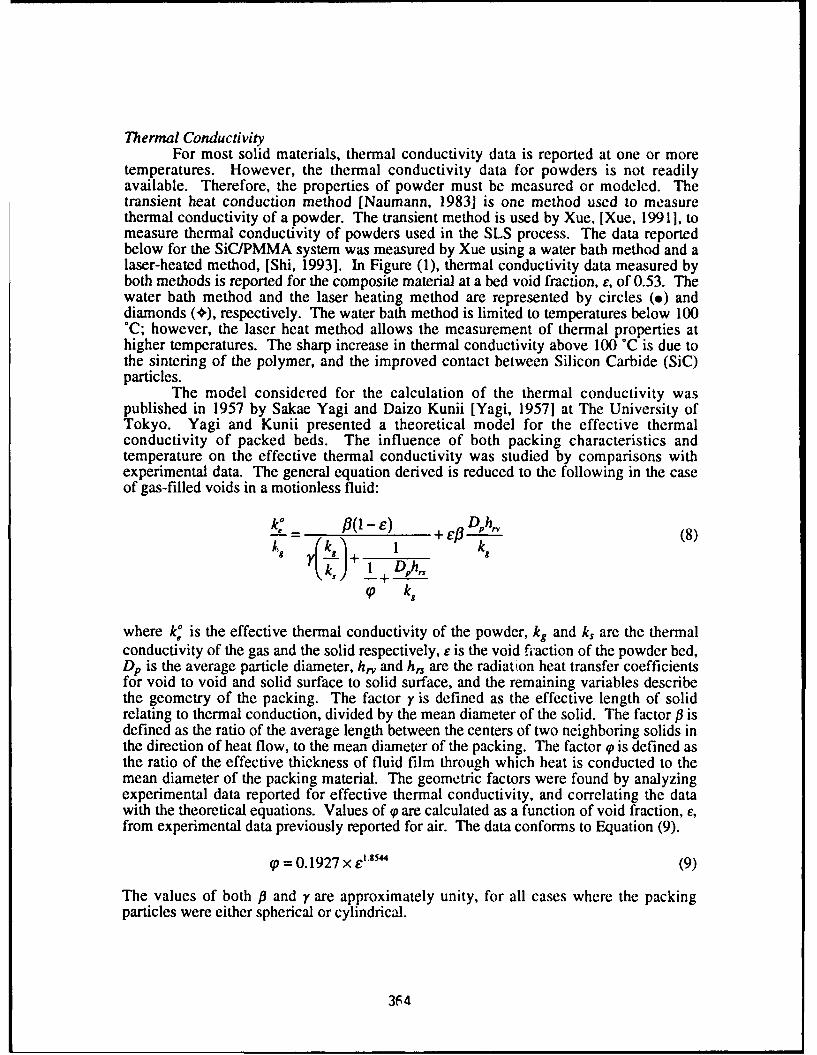
Thermal ConductivityFor most solid materials, thermal conductivity data is reported at one or more
temperatures. However, the thermal conductivity data for powders is not readilyavailable. Therefore, the properties of powder must be measured or modeled. Thetransient heat conduction method [Naumann, 19831 is one method used to measurethermal conductivity of a powder. The transient method is used by Xue, [Xue, 19911, tomeasure thermal conductivity of powders used in the SLS process. The data reportedbelow for the SiC/PMMA system was measured by Xue using a water bath method and alaser-heated method, [Shi, 1993]. In Figure (1), thermal conductivity data measured byboth methods is reported for the composite material at a bed void fraction, E, of 0.53. Thewater bath method and the laser heating method are represented by circles (.) anddiamonds (+), respectively. The water bath method is limited to temperatures below 100*C; however, the laser heat method allows the measurement of thermal properties athigher temperatures. The sharp increase in thermal conductivity above 100 °C is due tothe sintering of the polymer, and the improved contact between Silicon Carbide (SiC)particles.
The model considered for the calculation of the thermal conductivity waspublished in 1957 by Sakae Yagi and Daizo Kunii [Yagi, 1957] at The University ofTokyo. Yagi and Kunii presented a theoretical model for the effective thermalconductivity of packed beds. The influence of both packing characteristics andtemperature on the effective thermal conductivity was studied by comparisons withexperimental data. The general equation derived is reduced to the following in the caseof gas-filled voids in a motionless fluid:
k_..• = ( O(- e•) + lOh,, 8119( ~ e +_ (8 )
+ Doh.( k,
where k,' is the effective thermal conductivity of the powder, kg and k, are the thermalconductivity of the gas and the solid respectively, e is the void firaction of the powder bed,Dp is the average particle diameter, hi, and hrs are the radiation heat transfer coefficientsfor void to void and solid surface to solid surface, and the remaining variables describethe geometry of the packing. The factor y is defined as the effective length of solidrelating to thermal conduction, divided by the mean diameter of the solid. The factor p isdefined as the ratio of the average length between the centers of two neighboring solids inthe direction of heat flow, to the mean diameter of the packing. The factor (P is defined asthe ratio of the effective thickness of fluid film through which heat is conducted to themean diameter of the packing material. The geometric factors were found by analyzingexperimental data reported for effective thermal conductivity, and correlating the datawith the theoretical equations. Values of q, are calculated as a function of void fraction, e,from experimental data previously reported for air. The data conforms to Equation (9).
(p = 0.1927 x e"'44 (9)
The values of both fi and , are approximately unity, for all cases where the packingparticles were either spherical or cylindrical.
364
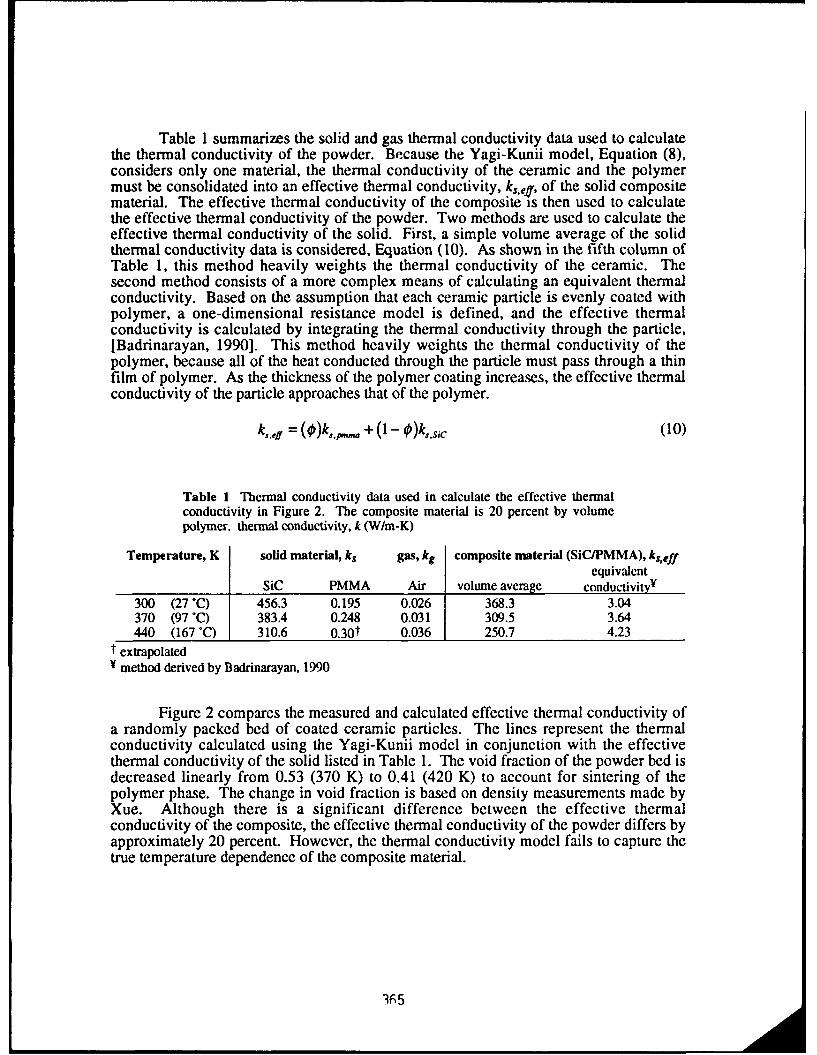
Table 1 summarizes the solid and gas thermal conductivity data used to calculatethe thermal conductivity of the powder. Because the Yagi-Kunii model, Equation (8),considers only one material, the thermal conductivity of the ceramic and the polymermust be consolidated into an effective thermal conductivity, k, ef', of the solid compositematerial. The effective thermal conductivity of the composite is then used to calculatethe effective thermal conductivity of the powder. Two methods are used to calculate theeffective thermal conductivity of the solid. First, a simple volume average of the solidthermal conductivity data is considered, Equation (10). As shown in the fifth column ofTable 1, this method heavily weights the thermal conductivity of the ceramic. Thesecond method consists of a more complex means of calculating an equivalent thermalconductivity. Based on the assumption that each ceramic particle is evenly coated withpolymer, a one-dimensional resistance model is defined, and the effective thermalconductivity is calculated by integrating the thermal conductivity through the particle,[Badrinarayan, 1990]. This method heavily weights the thermal conductivity of thepolymer, because all of the heat conducted through the particle must pass through a thinfilm of polymer. As the thickness of the polymer coating increases, the effective thermalconductivity of the particle approaches that of the polymer.
k3.ff = (O)k,,,.. + (I - O)k,.sic (10)
Table 1 Thermal conductivity data used in calculate the effective thermalconductivity in Figure 2. The composite material is 20 percent by volumepolymer. thermal conductivity, k (W/m-K)
Temperature, K solid material, ks gas, kg composite material (SiCIPMMA), kseffequivalent
SiC PMMA Air volume average conductivity"300 (27 C) 456.3 0.195 0.026 368.3 3.04370 (97 *C) 383.4 0.248 0.031 309.5 3.64440 (167 *C) 310.6 0.30t 0.036 250.7 4.23
t extrapolated¥ method derived by Badrinarayan, 1990
Figure 2 compares the measured and calculated effective thermal conductivity ofa randomly packed bed of coated ceramic particles. The lines represent the thermalconductivity calculated using the Yagi-Kunii model in conjunction with the effectivethermal conductivity of the solid listed in Table 1. The void fraction of the powder bed isdecreased linearly from 0.53 (370 K) to 0.41 (420 K) to account for sintering of thepolymer phase. The change in void fraction is based on density measurements made byXue. Although there is a significant difference between the effective thermalconductivity of the composite, the effective thermal conductivity of the powder differs byapproximately 20 percent. However, the thermal conductivity model fails to capture thetrue temperature dependence of the composite material.
IF 5
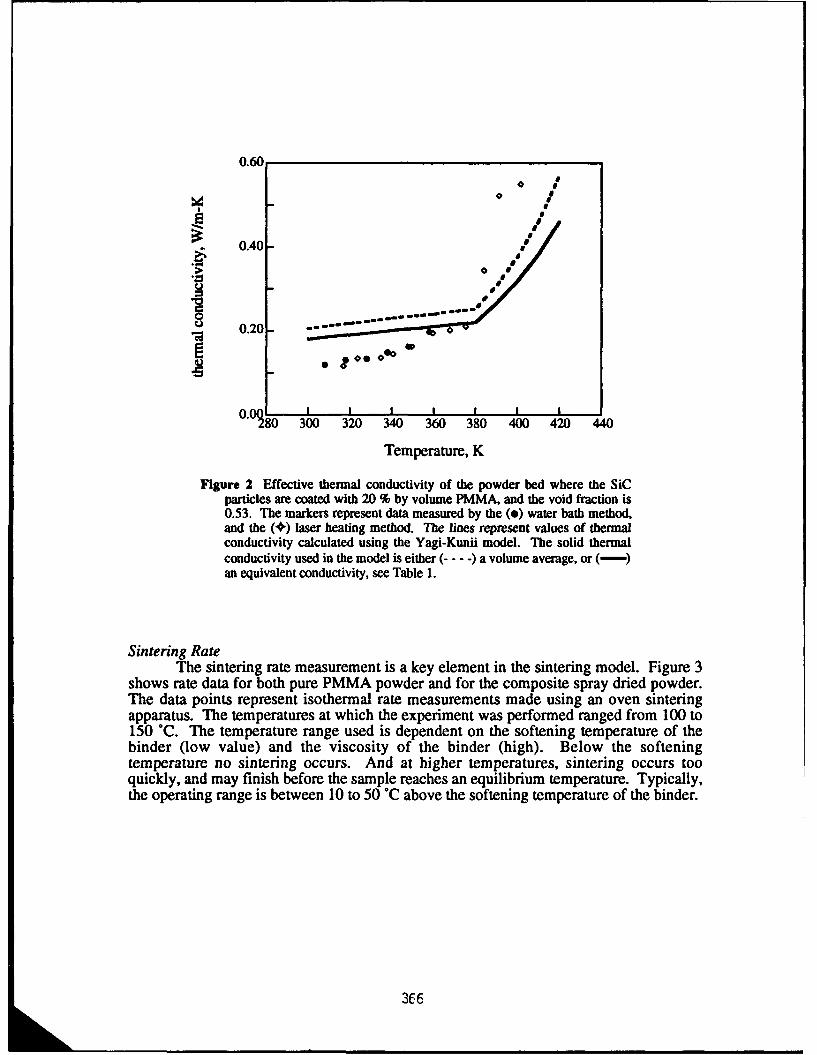
0.60
S 0.40
799
0.0
0.0 300 320 340 360 380 400 420 440
Temperature, K
Figure 2 Effective thermal conductivity of the powder bed where the SiCparticles are coated with 20 % by volume PMMA, and the void fraction is0.53. The markers represent data measured by the (e) water bath method,and the (+) laser heating method. The lines represent values of thermalconductivity calculated using the Yagi-Kunii model. The solid thermalconductivity used in the model is either ( .. ) a volume average, or (-)an equivalent conductivity, see Table 1.
Sintering RateThe sintering rate measurement is a key element in the sintering model. Figure 3
shows rate data for both pure PMMA powder and for the composite spray dried powder.The data points represent isothermal rate measurements made using an oven sinteringapparatus. The temperatures at which the experiment was performed ranged from 100 to150 *C. The temperature range used is dependent on the softening temperature of thebinder (low value) and the viscosity of the binder (high). Below the softeningtemperature no sintering occurs. And at higher temperatures, sintering occurs tooquickly, and may finish before the sample reaches an equilibrium temperature. Typically,the operating range is between 10 to 50 °C above the softening temperature of the binder.
3E6
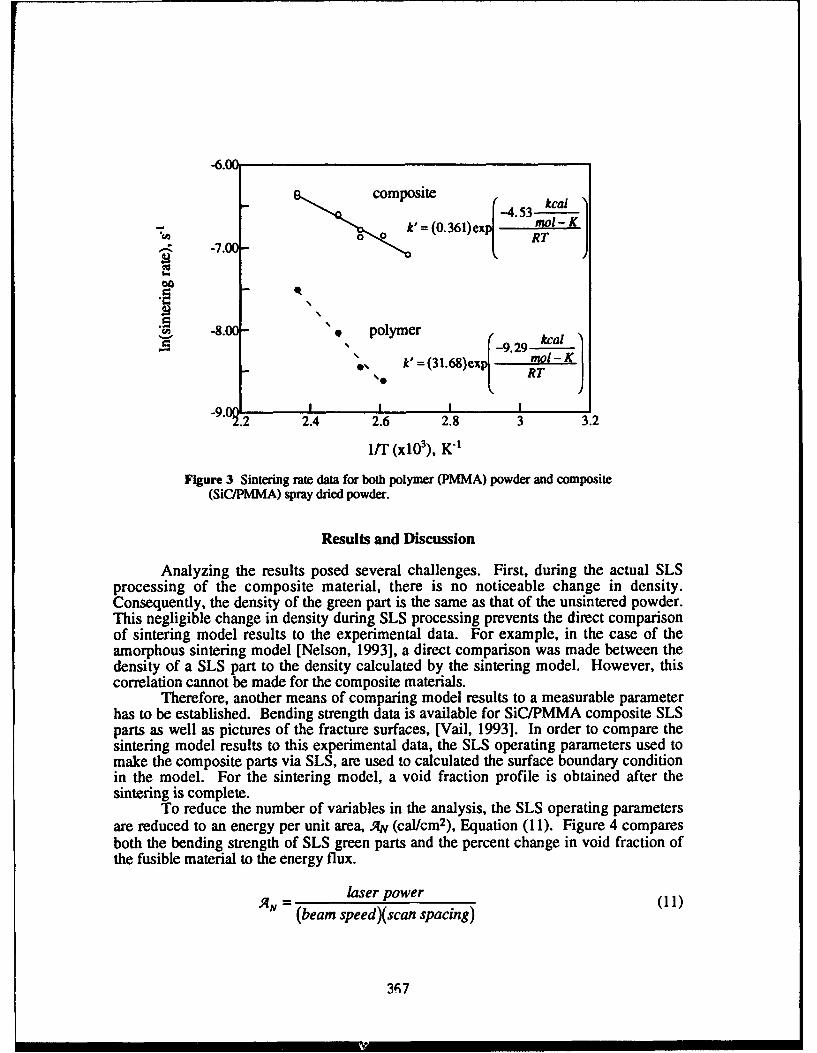
-6.00• o kccomposite -45
-45 kcal
k'= (0.361)exp ool-KICA 0 0RT
-7.
-8.0 0 polymer -9 ctal"-929
"*, k'= (31.68)exp mol - K
-9.I I I I.2 2.4 2.6 2.8 3 3.2
l/T (x10 3), K-'
Figure 3 Sintering rate data for both polymer (PMMA) powder and composite(SiC/PMMA) spray dried powder.
Results and Discussion
Analyzing the results posed several challenges. First, during the actual SLSprocessing of the composite material, there is no noticeable change in density.Consequently, the density of the green part is the same as that of the unsintered powder.This negligible change in density during SLS processing prevents the direct comparisonof sintering model results to the experimental data. For example, in the case of theamorphous sintering model [Nelson, 1993], a direct comparison was made between thedensity of a SLS part to the density calculated by the sintering model. However, thiscorrelation cannot be made for the composite materials.
Therefore, another means of comparing model results to a measurable parameterhas to be established. Bending strength data is available for SiC/PMMA composite SLSparts as well as pictures of the fracture surfaces, [Vail, 1993]. In order to compare thesintering model results to this experimental data, the SLS operating parameters used tomake the composite parts via SLS, are used to calculated the surface boundary conditionin the model. For the sintering model, a void fraction profile is obtained after thesintering is complete.
To reduce the number of variables in the analysis, the SLS operating parametersare reduced to an energy per unit area, .I (cal/cm 2), Equation (11). Figure 4 comparesboth the bending strength of SLS green parts and the percent change in void fraction ofthe fusible material to the energy flux.
A laser power 011)
(beam speed)(scan spacing)
367
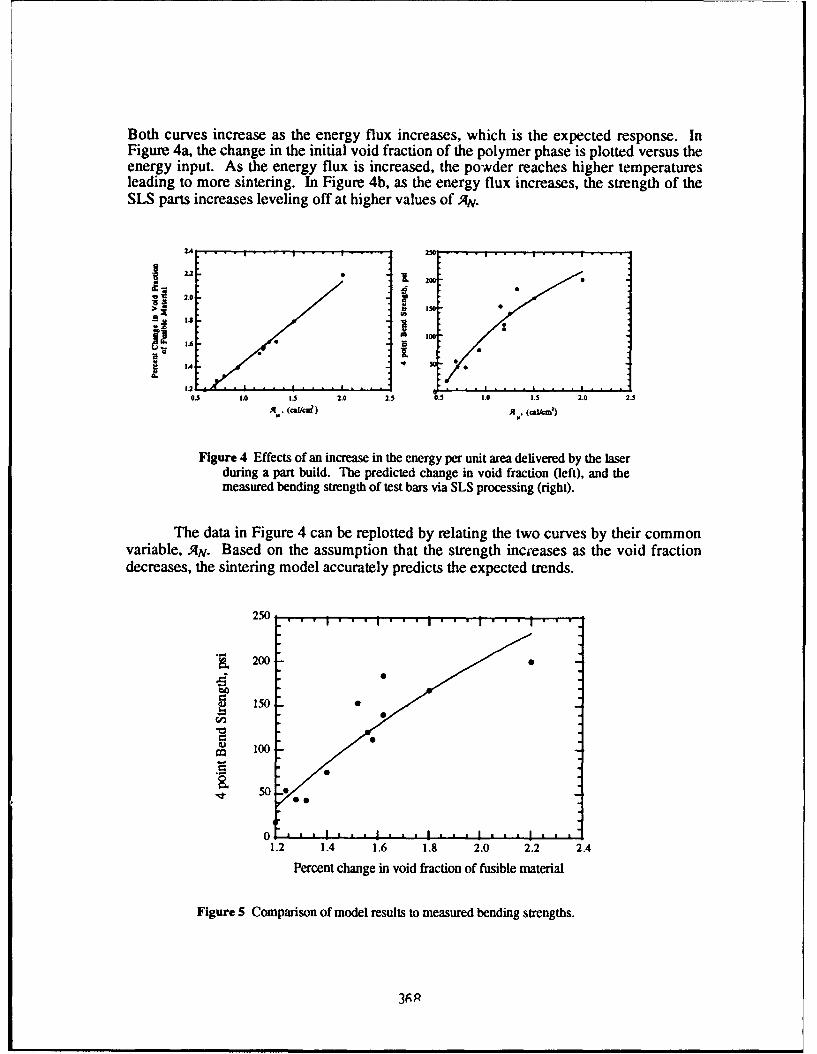
Both curves increase as the energy flux increases, which is the expected response. InFigure 4a, the change in the initial void fraction of the polymer phase is plotted versus theenergy input. As the energy flux is increased, the powder reaches higher temperaturesleading to more sintering. In Figure 4b, as the energy flux increases, the strength of theSLS parts increases leveling off at higher values of A4N.
2A4 . . . . . . .. .. .. 20 .. .. . . . .
U
"- 0
2.2 , . . . . i , .
2.0
IsI
A.. Sa.ka€ ) A., (i1j U)
Figure 4 Effects of an increase in the energy per unit area delivered by the laserdurng a part build. Ile predicted change in void fraction (left), and the
measured bending strength of test bars via SLS processing (right).
The data in Figure 4 can be replotted by relating the two curves by their common
variable, AN. Based on the assumption that the strength increases as the void fractiondecreases, the sintering model accurately predicts the expected trends.
250
"200
C oo
1.2 1.4 1.6 1.8 2.0 2.2 2.4
Percent change in void fraction of fusible material
Figure 5 Comparison of model results to measured bending strengths.
3A;R
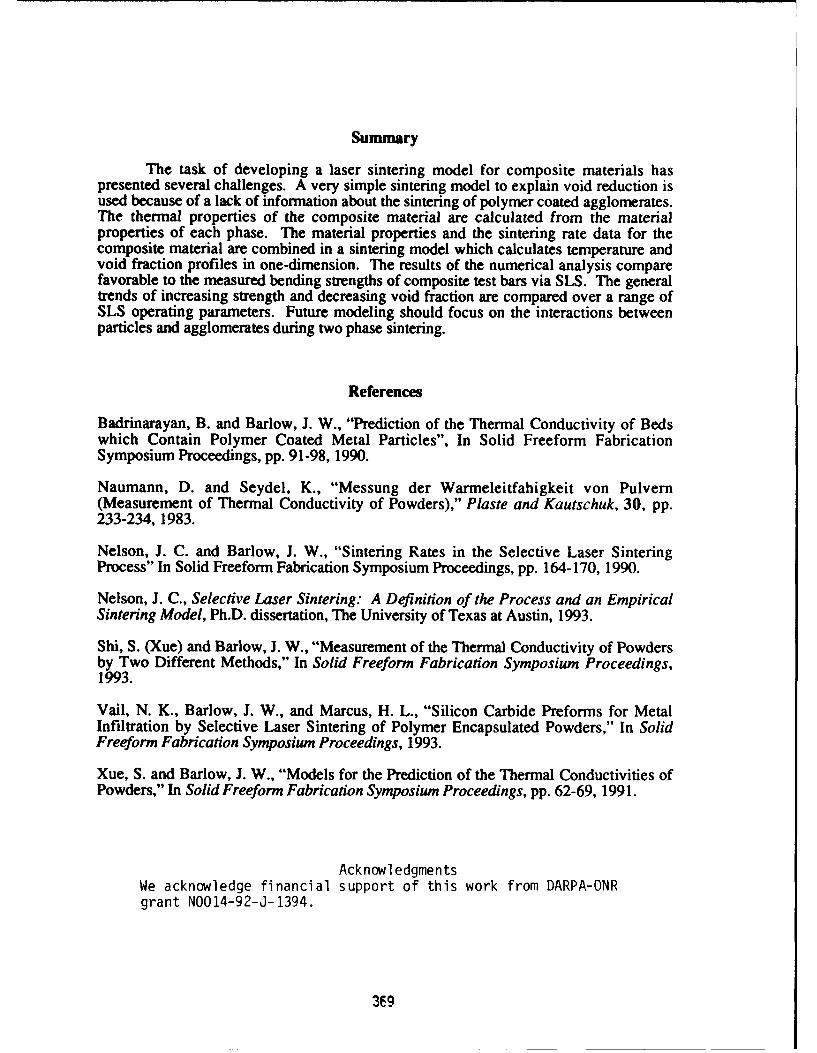
Summary
The task of developing a laser sintering model for composite materials haspresented several challenges. A very simple sintering model to explain void reduction isused because of a lack of information about the sintering of polymer coated agglomerates.The thermal properties of the composite material are calculated from the materialproperties of each phase. The material properties and the sintering rate data for thecomposite material are combined in a sintering model which calculates temperature andvoid fraction profiles in one-dimension. The results of the numerical analysis comparefavorable to the measured bending strengths of composite test bars via SLS. The generaltrends of increasing strength and decreasing void fraction are compared over a range ofSLS operating parameters. Future modeling should focus on the interactions betweenparticles and agglomerates during two phase sintering.
References
Badrinarayan, B. and Barlow, J. W., "Prediction of the Thermal Conductivity of Bedswhich Contain Polymer Coated Metal Particles", In Solid Freeform FabricationSymposium Proceedings, pp. 91-98, 1990.
Naumann, D. and Seydel, K., "Messung der Warmeleitfahigkeit von Pulvern(Measurement of Thermal Conductivity of Powders)," Plaste and Kautschuk, 30, pp.233-234, 1983.
Nelson, J. C. and Barlow, J. W., "Sintering Rates in the Selective Laser SinteringProcess" In Solid Freeform Fabrication Symposium Proceedings, pp. 164-170, 1990.
Nelson, J. C., Selective Laser Sintering: A Definition of the Process and an EmpiricalSintering Model, Ph.D. dissertation, The University of Texas at Austin, 1993.
Shi, S. (Xue) and Barlow, J. W., "Measurement of the Thermal Conductivity of Powdersby Two Different Methods," In Solid Freeform Fabrication Symposium Proceedings,1993.
Vail, N. K., Barlow, J. W., and Marcus, H. L., "Silicon Carbide Preforms for MetalInfiltration by Selective Laser Sintering of Polymer Encapsulated Powders," In SolidFreeform Fabrication Symposium Proceedings, 1993.
Xue, S. and Barlow, J. W., "Models for the Prediction of the Thermal Conductivities ofPowders," In Solid Freeform Fabrication Symposium Proceedings, pp. 62-69, 1991.
AcknowledgmentsWe acknowledge financial support of this work from DARPA-ONRgrant N0014-92-J-1394.
309
MEASUREMENT OF THE THERMAL CONDUCTIVITY
OF POWDERS BY TWO DIFFERENT METHODS
Samuel S. Sih and Joel W. BarlowChemical Engineering Department
University of Texas at Austin
Abstract
The thermal diffusivities and thermal conductivities of powders, especially PMMA-coatedsilicon carbide, at various temperatures, have been tested by two different dynamic methods, thewater-bath method and the laser-heated method. The thermal conductivity data found by these twotechniques are found to be consistent with each other.
A Review of the Two Techniques
A Differential scanning calorimeter (DSC), DSC-7 made by the Perkin-Elmer Company, hasbeen used [1] to measure the heat capacities at various temperatures for all of the powders used.The heat capacities of the powders were found to be functions of temperature. The specific heatsof all the powders are found to be the same as those of the corresponding solids.
The thermal conductivities of powders are measured by an unsteady state method with twowate, 'jaths of small temperature differences[ 1,2,3]. The range of the temperatures investigated,limited by the boiling point of water in the water-bath method, was mainly from 30-90'C, i.e.below the sintering temperatures of the powders. During the process of raising the temperature,sometimes bubbles of air were seen to adhere to the outside surface of the sample tube whichobviously decreases the rate of the transfer of heat. The authors found that the formation of airbubbles may be avoided by the addition of some soap solution into the water baths to decrease thesurface tension of the water used. Only small changes in temperature, typically 10'C, are used.This is necessary to account for the temperature dependent thermal properties at the powder beds.
As the temperatures used during the SLS process are not limited to the ambient temperatures, alaser-heated method [5,6,7] was adopted to study thermal conductivity at the higher temperatures.This technique uses a laser to heat the surface of a sample powder bed while a thermocouple at acertain depth inside the powder bed records the rise of temperature against time.
Figure 1 shows the basic experiment. The powder bed is contained in a 1 inch diameter by 5inch long glass tube. The bed temperature is maintained at the desired temperature by a 675 wattTempco Co. coil heater (MHS 1255BL02). That is controlled by a pulsed DC output temperaturecontroller (Omega CN76120). The pulsed output is used to switch a solid state relay connected athe heater AC power line. The powder samples completely fill the sample tube. The centertemperature, 1 cm below the bed surface, is measured with a thermocouple. The tube is wrappedwith thin aluminum foil and placed inside the coil heater.
370
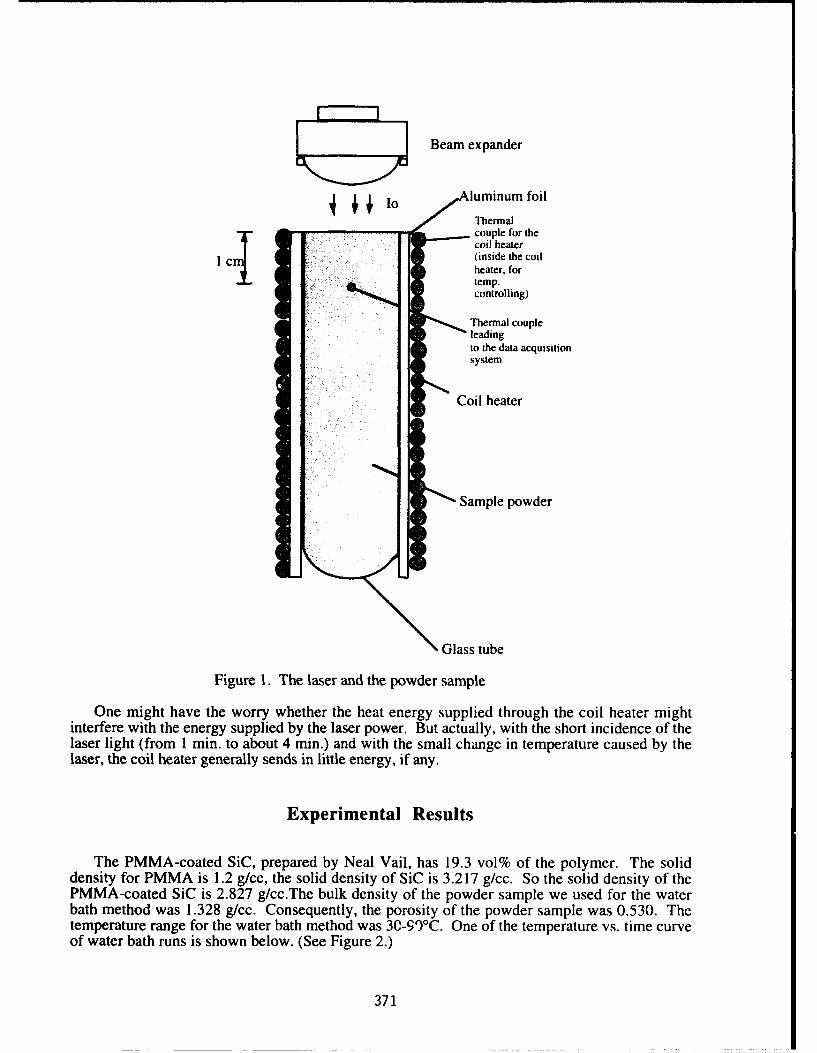
Beam expander
4 luminum foil
Thermalcouple for thecoil heater
c "(inside the coil
heater, fortemp.controlling)
Thermal coupleleadingto the data acquisitionsystem
Coil heater
Sample powder
Glass tube
Figure 1. The laser and the powder sample
One might have the worry whether the heat energy supplied through the coil heater mightinterfere with the energy supplied by the laser power. But actually, with the short incidence of thelaser light (from 1 min. to about 4 min.) and with the small change in temperature caused by thelaser, the coil heater generally sends in little energy, if any.
Experimental Results
The PMMA-coated SiC, prepared by Neal Vail, has 19.3 vol% of the polymer. The soliddensity for PMMA is 1.2 g/cc, the solid density of SiC is 3.217 g/cc. So the solid density of thePMMA-coated SiC is 2.827 g/cc.The bulk density of the powder sample we used for the waterbath method was 1.328 g/cc. Consequently, the porosity of the powder sample was 0.530. Thetemperature range for the water bath method was 30-99'C. One of the temperature vs. time curveof water bath runs is shown below. (See Figure 2.)
371
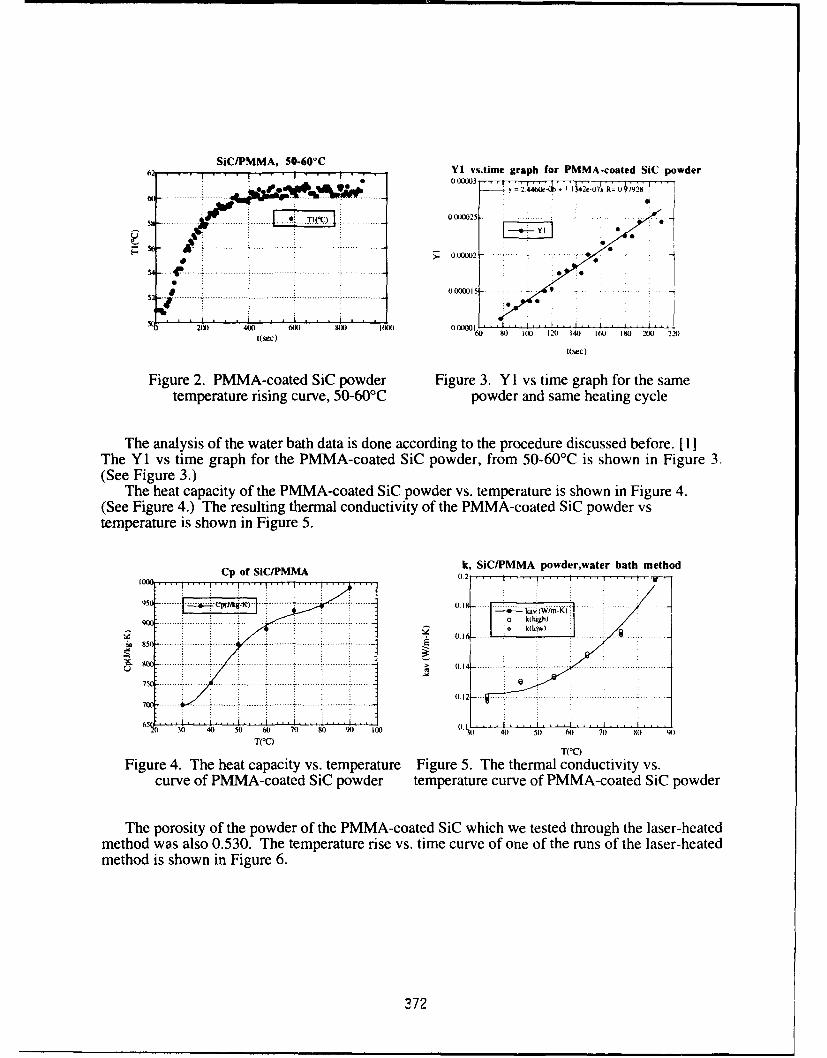
SiCIPMMA, 50-60°C62 5YI vs.time graph for PMMA-coated SiC powder
000003
5 H ... . . . . . . . . . . . . . . . .. 1 .0"0.. . . .-
56- ........... . . ....... ...... . .
5 4 .0 1 ..... ..... ........ ..........
S. .................................. -..... ........... ... ................. ...241) 4 600 64 1) .2 LX . . . ) ]44(X)
(S4) 80 (100 1 2)) 414 4] 480 l 2M0 22V4
4(sse) t(44cc)
Figure 2. PMMA-coated SiC powder Figure 3. Y I vs time graph for the sametemperature rising curve, 50-60'C powder and same heating cycle
The analysis of the water bath data is done according to the procedure discussed before. [ 1The Y1 vs time graph for the PMMA-coated SiC powder, from 50-60'C is shown in Figure 3.(See Figure 3.)
The heat capacity of the PMMA-coated SiC powder vs. temperature is shown in Figure 4.(See Figure 4.) The resulting thermal conductivity of the PMMA-coated SiC powder vstemperature is shown in Figure 5.
k, SiC/PMMA powder,water bath method1 0 0 .C p o f S i C /P M M A 0 .2 . . . . t . . . . . . t . .
954 ! ... . ! . . . ....... .I . . ..... ......... ........
8 0......... ........ ....... ......... ......... ! ....... !......... E " ... .. .. . .. ....
Ss o . .. ... .... ... ........ ..... ........... ......... :. . .
0.127000
05) 30 40 50 60 70 80 90 W00 (.4)0 40. 5( 6 7 0
Tro)T(°C)
Figure 4. The heat capacity vs. temperature Figure 5. The thermal conductivity vs.curve of PMMA-coated SiC powder temperature curve of PMMA-coated SiC powder
The porosity of the powder of the PMMA-coated SiC which we tested through the laser-heatedmethod was also 0.530. The temperature rise vs. time curve of one of the runs of the laser-heatedmethod is shown in Figure 6.
372
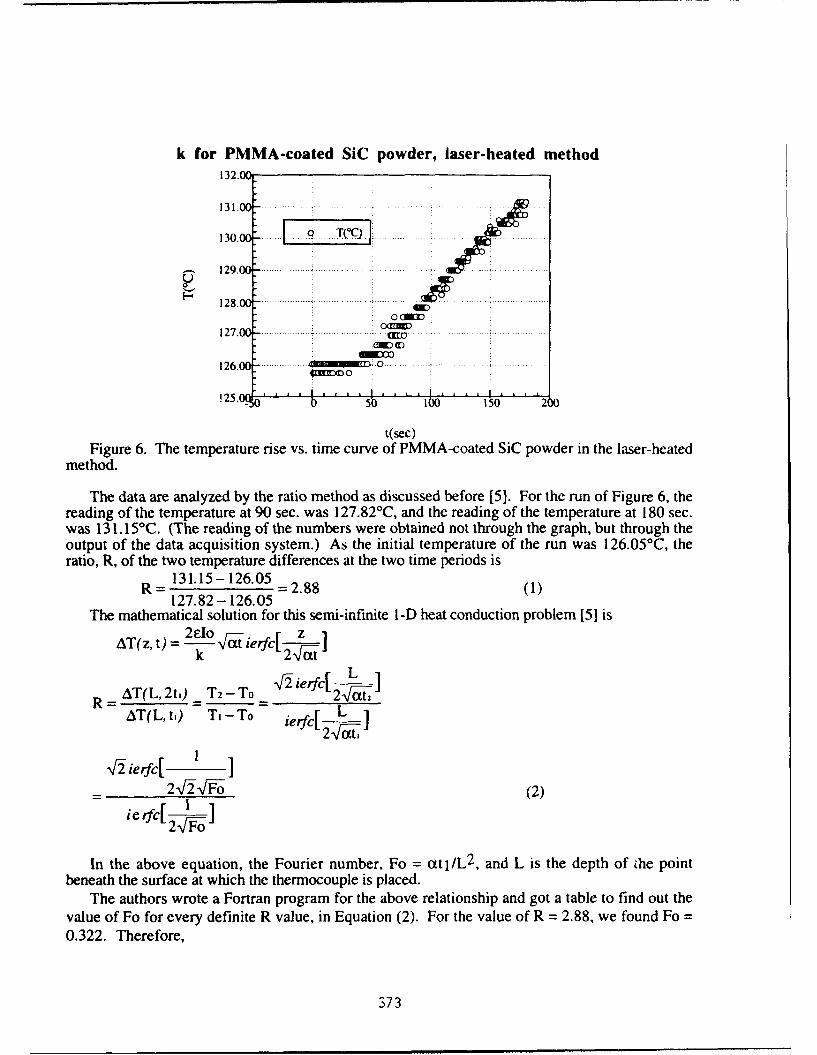
k for PMMA-coated SiC powder, laser-heated method132.o0
131.0
130.0
S 129,0-
1 2 9 .0 0 -. ...... ............ ... ... .. . .... ... . . . . . . . . . . . . . , . . . . . . . . .P, 128.0
0 CM
127 . . . . .. ... . . .. . . .C i.
126.00 .........
!25. I I 2
t(sec)Figure 6. The temperature rise vs. time curve of PMMA-coated SiC powder in the laser-heated
method.
The data are analyzed by the ratio method as discussed before [5]. For the run of Figure 6, thereading of the temperature at 90 sec. was 127.82'C, and the reading of the temperature at 180 sec.was 131.15'C. (The reading of the numbers were obtained not through the graph, but through theoutput of the data acquisition system.) As the initial temperature of the run was 126.051C, theratio, R, of the two temperature differences at the two time periods is
131.15-126.05 = 2.88 (1)127.82 -126.05
The mathematical solution for this semi-infinite I--D heat conduction problem [51 is2WIo r _-- rz
AT(z, t) = I[ iezct Z
-Jierfc[ LR= AT(L, 2t.) T2-TTo = rfc[2--
AT(L, ti) Ti-To ierfc[ L2V
",F ierfc[ 1 I
2-J-q-Fv (2)
S 1~Fo]
In the above equation, the Fourier number, Fo = ttlL 2 , and L is the depth of "he pointbeneath the surface at which the thermocouple is placed.
The authors wrote a Fortran program for the above relationship and got a table to find out thevalue of Fo for every definite R value, in Equation (2). For the value of R = 2.88, we found Fo =
0.322. Therefore,
373
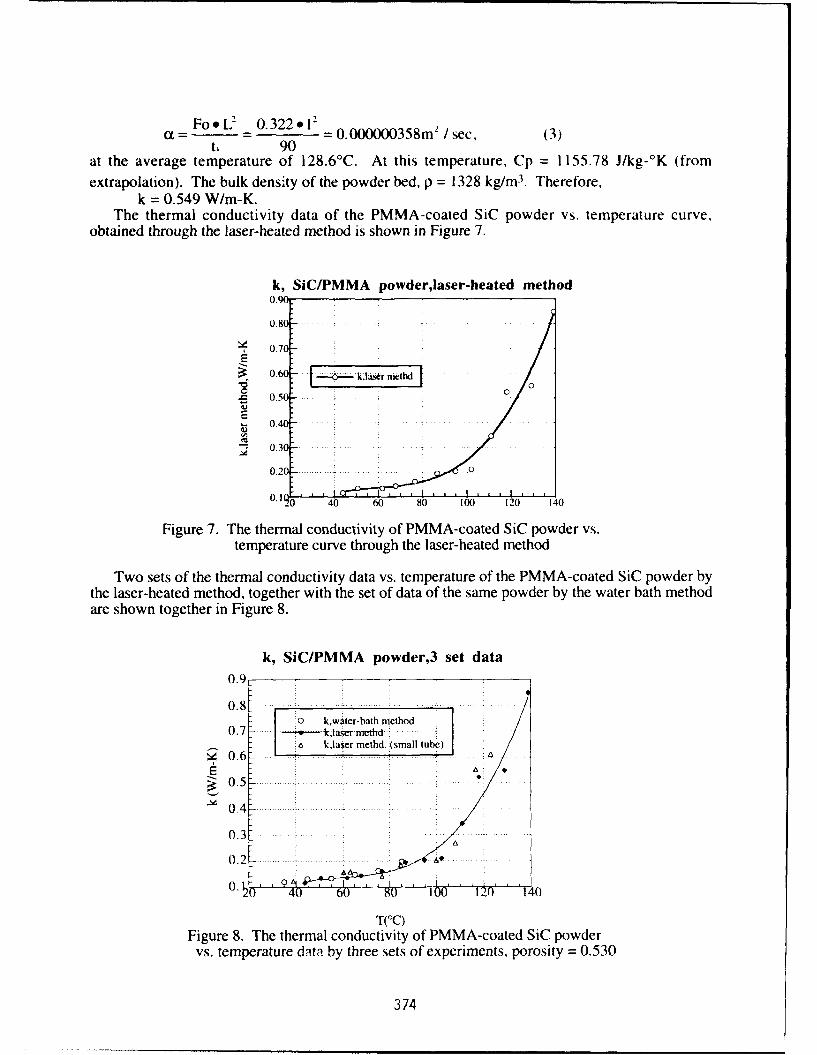
FooL 2 _0.322 012
o L2 =0 = 0.000000358m 2 /sec, (3)90
at the average temperature of 128.6°C. At this temperature, Cp = 1155.78 J/kg-0 K (fromextrapolation). The bulk density of the powder bed, p = 1328 kg/m 3. Therefore,
k = 0.549 W/m-K.The thermal conductivity data of the PMMA-coated SiC powder vs. temperature curve,
obtained through the laser-heated method is shown in Figure 7.
k, SiC/PMMA powder,laser-heated method0.90
0.80 . .. . . .
0.70
0.60- k thd
0.50
E. 0.40
0.30.20 ... ._ . . ! . • • • . . : . . .0
0 40 60 80 100 120 140
Figure 7. The thermal conductivity of PMMA-coated SiC powder vs.temperature curve through the laser-heated method
Two sets of the thermal conductivity data vs. temperature of the PMMA-coated SiC powder bythe laser-heated method, together with the set of data of the same powder by the water bath methodare shown together in Figure 8.
k, SiC/PMMA powder,3 set data0.9 - -
0.8-6 . .. ..-1 0 k,water-bath method
0.7- -Ah *,Iaefmtd
0.6.L W~a~er methd. (small tubeý)
S0.5
0.37 .f'
0 .2 -. ... ...i . . . .! . . .. . :. .
0 40 60 s0 I0 120 10
T(°C)Figure 8. The thermal conductivity of PMMA-coated SiC powder
vs. temperature data by three sets of experiments, porosity = 0.530
374
It may be seen that the data of the thermal conductivity of the PMMA-coated SIC powderobtained by us through the water bath method and the laser-heated method are very consistent.
Just for the sake of reference, the thermal conductivity of pure SiC powder (E = 0.4357) hasalso been tested by the authors by using the water bath method. It increases from 0.24 W/m-K to0.32 W/m-K as the temperature changes from 35'C to 85'C. This agrees well with the reportedvalue of the thermal conductivity of SiC powder in air (porosity = 0.425) of 0.263 W/m-K (0.226kcallm-h-K). [9,10,111
Summary and Conclusions
The water-bath method used by the authors for the investigation of the thermal properties ofpowders is limited to a temperature range below 100°C. The laser-heated method shows similarresults for thermal conductivity tests of the PMMA-coated silicon carbide powder samples below100°C to those obtained by the water-bath method. This suggests the validity of the laser-heatedmethod for the investigation of the properties of powders near the sintering temperatures of thepowders.
Acknowledgments
The authors gratefully acknowledge support for this work by the University of Texas SFFIndustrial Associates Program and by Lanxide Corporation.
References
1. Xue, Samuel S. and Barlow, J.W., 'Thermal Properties of Powders', in the Solid FreeformFabrication Symposium Proceedings, the University of Texas at Austin, Austin, Texas (1990), pp.179-185.
2. Xue, S.S., Master's thesis, The Thermal Properties of Polymer Powders, the University ofTexas at Austin, December, 1991, pp. 69-71, 76.
3. Dieter Naumann and Klaus-Jirgen Seydel, "Messung der Warmeleitf'higkeit von Pulvern,"Plaste und Kautschuk, vol. 30, no.4 (1983), p. 233-234.
4. Carslaw, H.S., and J. C. Jaeger, Conduction of Heat in Solids, Oxford University Press,Oxford, 1959, p. 112; 256-263.
5. Xue, Samuel S. and Barlow, Joel W., 'The Measurement the Thermal Properties andAbsorptances of Powders near their Melting Temperatures,' in the Solid Freeform FabricationSymposium Proceedings, the University of Texas at Austin, Austin, Texas (1992), pp. 131-140.
6. Taniguchi, N., Ikeda, M., Miyamoto, I., and Miyazaki, T., Energy-Beam Processing ofMaterials, Clarendon Press, Oxford, 1989.
7. Ikeda, M. et al., 'Basic Techniques of Laser Processing,' Precision Machinery,(inJapanese) vol.51 (1985), no. 12, pp. 2253-2258.
8. Tavman,Ismail, 'Flash Method of Measuring Thermal Diffusivity and Conductivity,' inConvective Heat and Mass Transfer in Porous Media, edited by Sadik Kakaq, et al., KluewerAcademic Publishers, London, 1991, pp. 923-936.
9. Kannuluick, W.G., and Martin, L.H., 'Conduction of Heat in Powders,' Proc. Royal Soc.(London) A141, 144 (1933).
10. Wilhelm, R.H., Johnson, W.C., Wynkoop, R. and Collier, O.H., 'Reaction rate, heattransfer and temperature distribution in fixed-bed catalytic converters,' Chem. EngineeringProgress, vol. 44(2), 105 (1948).
11. Krupiczka, R., 'Analysis of Thermal Conductivity in Granular Materials,' InternationalChemical Engineering, vol.7, no. 1, January 1967, pp. 122-144.
375
Selective Laser Sintering ofBioceramic Materials for Implants
Goonhee Lee and J.W.BarlowDepartment of Chemical Engineering
The University of Texas at Austin
ABSTRACT
Selective Laser Sintering (SLS) process is employed for fabrication of bioceramicsfor orthopedic implants. Hydroxyapatite and Calcium Phosphate ceramics are coated withpolymer as a intermediate binder by using a spray drier. Polymer coated materials areSLS processed to make green parts, which are infiltrated and fired to remove the polymer.SLS processed green parts of hydroxyapatite have low density due to the small particlesize with large specific surface area. This paper discusses the possibilities and problems infree-form fabrication of bioceramic.
INTRODUCTION
Many attempts have been made to find material that will assist in the regeneration ofbone defects and injuries. Calcium phosphate ceramics, particularly hydroxyapatite(HA),Ca5(OH)(PO4 )3, has received special attention as potential bone implant material because ofits biocompatibility with the tissue and its compositional similarities to human bone and tooth.Many studies and methods, from powder compaction sintering to hot isostactic pressing, havebeen reported for the fabrication of HA. However, sintered HA materials by conventionaltechniques are as weak as sea coral even at high compacting pressure, because HAdecomposes at temperatures lower than the required temperature for sintering.
Selective Laser Sintering (SLS) processes for preparing ceramic green parts withpolymer as intermediate binder and post processing with the aid of ceramic cement have beendiscussed in detail in literature [1]. One advantage of SLS process for fabrication ofbioceramic is the accurate construction of a complete facsimile bone structure from thegeometric information obtained from either patient computed tomographic (CT) data or acomputer Aided Design (CAD) software package[2]. Another advantage is the ability tocontrolling pore structure for biogenesis through control of polymer content.
MATERIALS and METHODS
HA, obtained from Monsanto Inc. as Tricalcium Phosphate, TCP, was used as startingmaterial. HA powders are very cohesive and consist of very porous agglomerates with meanparticle size of I to 2 Rm and bulk density of less than 0.4 g/cm 3 [3]. The surface areadetermined by Mercury intrusion analysis is about 60 m2 /g, suggesting very small particles.Stoichiometric HA contains constitutional water in the form of OH- ions. This water can bedriven off at 1200 oC. Figure 1 shows the microstructure of finely divided HA powders.
376
I | P *1
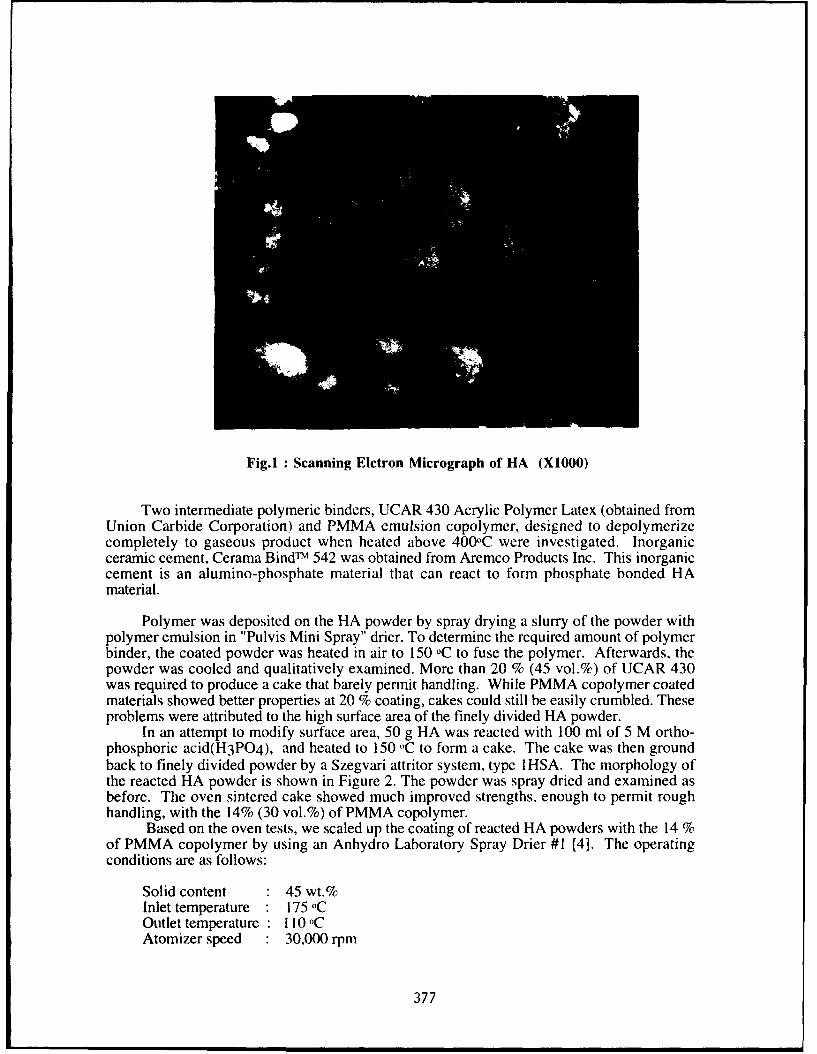
Fig.1 Scanning Elctron Micrograph of HA (XIO00)
Two intermediate polymeric binders, UCAR 430 Acrylic Polymer Latex (obtained fromUnion Carbide Corporation) and PMMA emulsion copolymer, designed to depolymerizecompletely to gaseous product when heated above 400oC were investigated. Inorganicceramic cement, Cerama BindTM 542 was obtained from Aremco Products Inc. This inorganiccement is an alumino-phosphate material that can react to form phosphate bonded HAmaterial.
Polymer was deposited on the HA powder by spray drying a slurry of the powder withpolymer emulsion in "Pulvis Mini Spray" drier. To determine the required amount of polymerbinder, the coated powder was heated in air to 150 °C to fuse the polymer. Afterwards, thepowder was cooled and qualitatively examined. More than 20 % (45 vol.%) of UCAR 430was required to produce a cake that barely permit handling. While PMMA copolymer coatedmaterials showed better properties at 20 % coating, cakes could still be easily crumbled. Theseproblems were attributed to the high surface area of the finely divided HA powder.
In an attempt to modify surface area, 50 g HA was reacted with 100 ml of 5 M ortho-phosphoric acid(H3P04), and heated to 150 "C to form a cake. The cake was then groundback to finely divided powder by a Szegvari attritor system, type I HSA. The morphology ofthe reacted HA powder is shown in Figure 2. The powder was spray dried and examined asbefore. The oven sintered cake showed much improved strengths, enough to permit roughhandling, with the 14% (30 vol.%) of PMMA copolymer.
Based on the oven tests, we scaled up the coating of reacted HA powders with the 14 %of PMMA copolymer by using an Anhydro Laboratory Spray Drier #1 [4]. The operatingconditions are as follows:
Solid content : 45 wt.%Inlet temperature : 175 ,COutlet temperature : 110 oCAtomizer speed : 30,000 rpm
377
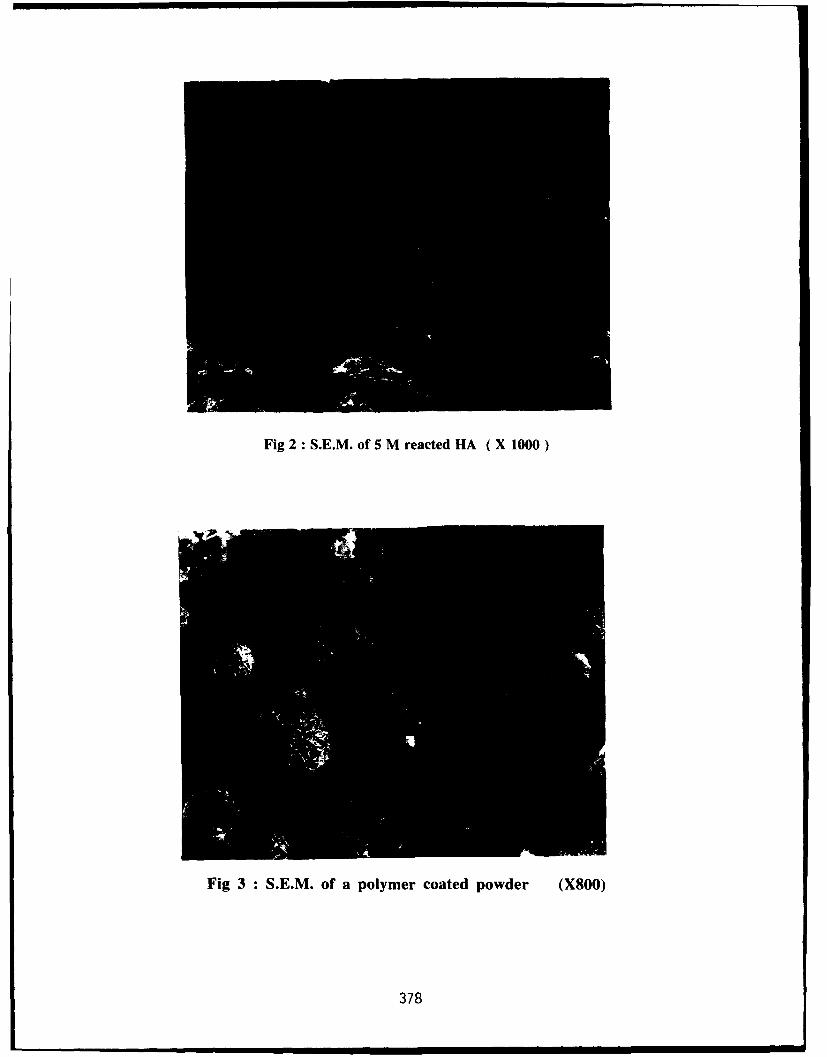
Fig 2 S.E.M. of 5 M reacted HA (X 1000)
Fig 3 S.E.M. of a polymer coated powder (X800)
378
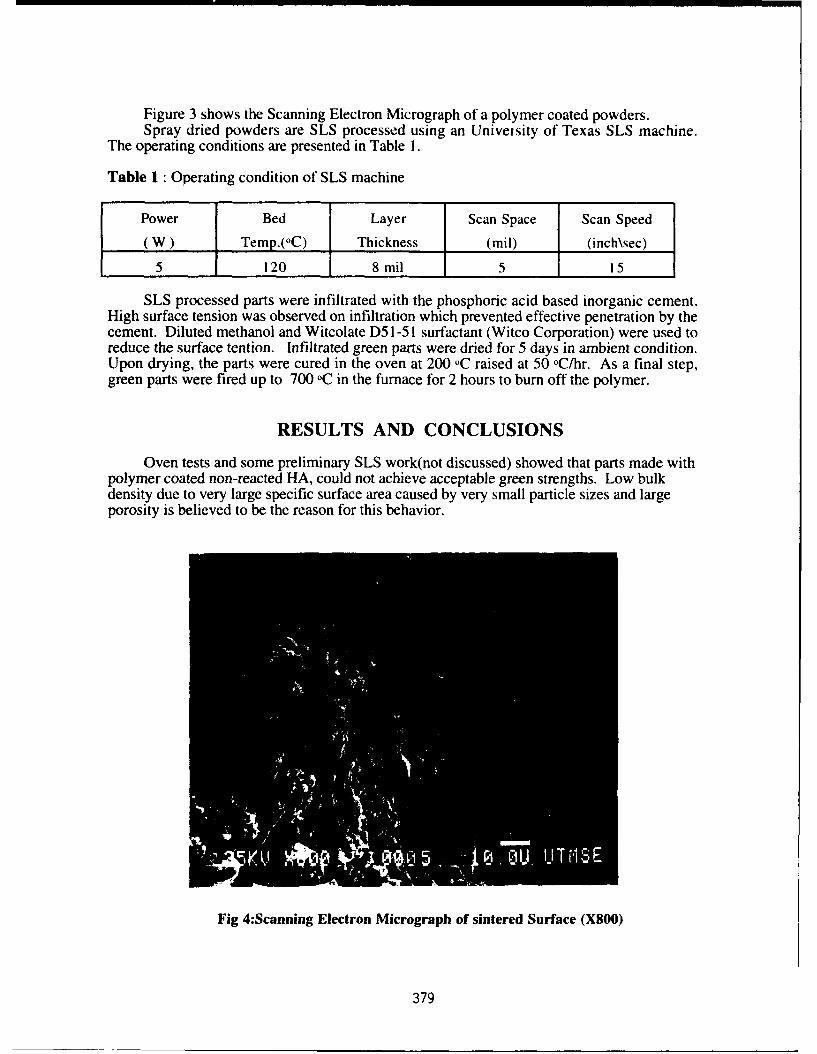
Figure 3 shows the Scanning Electron Micrograph of a polymer coated powders.Spray dried powders are SLS processed using an University of Texas SLS machine.
The operating conditions are presented in Table 1.
Table I : Operating condition of SLS machine
Power Bed Layer Scan Space Scan Speed
(W) Temp.(OC) Thickness (mil) (inch\sec)
5 120 8 mil 5 15
SLS processed parts were infiltrated with the phosphoric acid based inorganic cement.High surface tension was observed on infiltration which prevented effective penetration by thecement. Diluted methanol and Witcolate D51-51 surfactant (Witco Corporation) were used toreduce the surface tention. Infiltrated green parts were dried for 5 days in ambient condition.Upon drying, the parts were cured in the oven at 200 oC raised at 50 oC/hr. As a final step,green parts were fired up to 700 °C in the furnace for 2 hours to burn off the polymer.
RESULTS AND CONCLUSIONS
Oven tests and some preliminary SLS work(not discussed) showed that parts made withpolymer coated non-reacted HA, could not achieve acceptable green strengths. Low bulkdensity due to very large specific surface area caused by very small particle sizes and largeporosity is believed to be the reason for this behavior.
Fig 4:Scanning Electron Micrograph of sintered Surface (X800)
379
While HA in its pure form has bulk density of less than 0.4 g/cm 3, HA reacted with 5 Mphosphoric acid shows increased density over 0.7 g/cm 3 . SLS processed part made ofreacted HA has sufficient strengths for rough handling as oven tests of sintered cakespredicted. The strengths of post-processed bioceramic parts have shown even more promiseand are currently being evaluated.
While the SLS processed parts have promising strengths with sufficient pores,biological and mechanical limitations are still prevalent in bioceramics. The implant materialshould be not only strong enough to be compatible with its use, but also biologicallyacceptable. The material's porosity should be suitable for bone tissue growth to fix theprosthesis with connecting bones. Fig 4. shows a fractured surface of a part that was postprocessed and fired. Clearly, there is considerable porosity, and we believe that thisinterconnected porosity should be sufficient for ingrowth of fibulious tissue. The strengths ofthese porous structures are currently being evaluated. We believe that the strengths will besufficient for low-load bearing implants.
REFERENCES
1. N.K. Vail and J.W.Barlow, "Ceramic Structures by Selective Laser Sintering ofMicroencapsulated, Finely Divided Ceramic Materials", Solid FreeformFabrication Symposium Proceedings, 3, 124-130(1992)
2. Richard A. Levy, "Preliminary Experience with Selective Laser Sintigraphic(SLS) Models of the Human Temporal Bone", Solid Freeform FabricationSymposium Proceedings, 3, 161-173 (1992)
3. T.Hattori and Y.Iwadate, "Hydrothermal Preparation of Calcium HydroxyapatitePowders" J. Am. Ceram. Soc., 73(6) 1803(1990)
4. N.K. Vail and J.W.Barlow, "Effect of Polymer Coatings as Intermediate Binders onSintering of Ceramic Particles", Solid Freeform Fabrication SymposiumProceedings, 2, 195-205 (1991)
380
Key Word Index
3 Degrees of Freedom scanning (150) Digibot (150)3D imaging and modeling (121) digital microfabrication (237)3D laser digitizer (150) dimensional control (223)3D Systems (11, 158)) dimensional stability (11)abrasives (27) direct metal fabrication (135)accuracy (11, 245) directional derivative (29 1)acetylene (308) distortion (11)acrylate photopolymers (178) drying (333)acrylic polymers (60) DTM wax process (94) improvements (94)acrylic resins (27) efficient data structures (126)active triangulation (150) elastomeric (86)adaptive 4 axis scanning (150) electronics (215)adaptive surface filtering (150) encapsulation (204)altermative to STL (135) Epoxy resin (11)alumina (40, 60, 333, 350, 370) expansion (193)aluminum (158) FDM® (86)amorphous (325) feed bypass boxes (94)angled wax builds (94) fiber reinforcement (283)anisotrophy (193) filament (86)applications (168) finishing (27)bend strength (350, 370) finite element simulation (143)Bernstein form (291) Fused Deposition Modeling (FDM®) (86)beryllium (158) gap elimination (126)Boeing 737 cargo door bracket (158) geometric design (275)burn out process (158) geometry (102)CAD (102) hard tooling (158)cantilever (11) hard waxes (237)carbon fibers (60) homogenization (193)Ceracon Forging Process (271) Hot Isolastic Pressing (HLP) (51)ceramic (360) Hydroxapatite (376)ceramic matrix composites (215) IGES (275) standard (135)ceramic shell (158) implant sintering (376)chemical vapor deposition (325) infiltration (215, 339, 376)Ciba-Geigy (11, 158) injection molding (303)co-precipitation (339) ink-jet printing (81)composite (283, 360) iron (51)composites (204) laminate (74)Constructive Solid Geometry (291) laser (308, 360)contour editing (150) laser cutting (74)convex hull (291) laser maching (74)copper (158) laser welding (74)creep (11) latex binder (40)creep rate (11) layer displacement (223)curl (11) layered manufacturing (1)curl distortion (178) LCVD (253)degree elevation (29 1) liquefier (86)degree reduction (291) liquid phase sintering (193, 317)densification (193) MD* process (186)density (350) mechanical forces (223)design for SFF (102) mechanical properties (40, 283, 303)design primitives (275) melting (1)designed experiment (178) metal (51)desk-top VR (113) metal matrix composites (215)diagnostic test (11) metals (158)
381
Microfabrication (253) silver (339)mixing (350) sintering (1, 360)model (360) slurry viscosity (60)modeling (143) softwarc (126)molds (271) sol-gel (339)molten microdrops (237) sol-gel synthesis (64)monomers (60) solder (81)multi material structures (1) solid freeform fabrication (81, 168, 271,nanocomposites (64) 308,325)net-shape (27 1) spray drying (350, 376)new directions (168) stainless steel (158)NURBS (275) StereoLithography (11, 158, 178, 245)NURBS based precise geometry (135) STL-files (126)organic binder (370) strength (193)oxygenation (339) stress cracking (1)particle size (350, 370) submicron powders (40)photolithography (283) superconductors (339)polyamide (86) superellipsoids (275)polygonal surface generation (150) supersolidus (317)polymer (204, 360) surface editing (150)polymerization (60) surface roughness (27)polyolefin (86) systematic scanning (150)position errors (223) tension test (193)post-processing (317) tetramethylsilane (325)powder density (370) thermal conductivity (360)powder processing (64) thermal modeling (1)powder-based processes (223) thermal spray deposition (186)prealloyed bronze powder (317) Three Dimensional Printing (3DP) (40,precursor (325) 223)preform (271) three dimension geometry (143)process control (102) thresholding algorithms (121)process modeling (102) titanium (158)process parameters (245) tooling (271, 303)product design (113) topology design (186)product development (113) topology reconstruction (126)quasi-hollow structure (158) triangulation (275)QuickCast (158) ultrasonic finishing (27)range queries (126) UserPart (11)rapid prototyping (11, 158, 178) vibratory bowl abrasion (27)reaction sintering (308) virtual reality (113)residual stress (1) volumetric flow rate (86)residual stresses (143) wax build designed experiments (94)robust prototyping (135) XB 5170 (11, 158)SALD (253)selective area laser deposition (325)selective laser reative sintering (64)selective laser sintering (51, 64, 204,215)SFF (143)shell investment casting (11, 158)shrinkage (193, 245, 303)shrinkage rate (245)silica colloid (333)silicon carbide (204, 308, 325)
382

Author/Attendee List
ikesh Agarwala (193, 339) John A. Benda David Bunnelle University of Texas at Austin United Technologies Research Center The University of Texas at Austinoter for Materials Science & Engineering 411 Silver Lane MS 129-39 Center for Matenals Science & Engineenng201 East Hartford CT 06108 62201stin TX 78712 203 727-7215 fax: 203 727-7852 Austin TX 78712
512 471-3578
irk Atkeson Britton R. Birmingham (64, 308, 339) Marshall Bumsited Technologies Research Center Center for Materials Science & Engineering ENNEX Fabrication Technologies1 Silver Lane, MS 129-48 The University of Texas at Austin 549 Landfair Avenuest Hartford CT 06108 62201 Los Angeles CA 900243 727-7409 / fax: 203 727-7880 Austin TX 78712 310 824-5185 (voice & fax)
,nt Atwood Paul Blake Dan Cainindia National Laboratories Texas Instruments Lockheed Aeronautical Systems Co-D. Box 5800, Org. 2484-1 P. O. Box 405, MS 3428 86 S. Cobb Drive,uquerque NM 87185 Lewisville TX 75067 Marietta GA 301325844-0816 fax: 505 844-5589 214 462-3015/ fax: 214 462-2684 404 494-1671/ fax: 404 494-1436
nit Bagchi (283) Rick Booth Paul Calvert (60)xchanical Engineering Department DTM Corporation University of Arizonaemson University 1611 Headway Circle, Bldg. 2 Arizona Materials Labsix 340921 Austin TX 78754 4715 East Ft. Lowell Roademson SC 29634-0921 Tucson AZ 857123 656-5641/ fax: 803 656-4435
kdrinarayan Balasubramanian (303) David L. Bourell (193, 303, 317, I. Campbellrpartment of Chemical Engineering 339) Dept. Man. Eng. & Ops. Mangmt.ie University of Texas at Austin The Center for Materials Science and Engr. The University of Nottingham400 The University of Texas at Austin University Parkistin TX 78712 Austin TX 78712 Nottingham, NG7 2RD UNITED KINGDOM2 471-5838 512 471-3170 44 602 514 063/ fax: 0602 514 000
el Barlow (204,303,333,350, Walter Bradley William T. Carter, Jr. (51)360,370,376) Texas A & M University GE Research & Development Center
)partment of Chemical Engineering Department of Mechanical Engineering P.O. Box 8ie University of Texas at Austin College Station TX 77843 Bldg. Ki, Room 235 MBistin TX 78712 Schenectady NY 123012471-1271 518 387-64521 fax: 518 387-7495
Nen Baumgardner Bob Brown (113) Robert S. Chambers
Pxas Instruments BPM Technology Inc. Sandia National Laboratories0. Box 405 1200 Woodruff Rd. Org. 1561, P. O. Box 58003 3471 Suite A19 Albuquerque NM 87185wisville TX 75067 Greenville SC 29607 505 844-0771 fax: 505 844-92974 462-44621 fax: 214 462-5610 803-297-7700/ fax 803-297-7711
seph Beaman (193, 291, 303) Robert L Brown Jana K. Chad (135)ie University of Texas at Austin Director Iowa State Universityiterials Science & Engineering Advanced Process and Control R&D 1051 Black Engineering Bldg.201 The Gillette Company Engel Manufacturing Laboratoryistin TX 78712 Gillette Park Ames IA 500102 471-3058 617463-2315 fax: 463-2527 515 294-0569 fax: 294-3261
on Beha Stuart B. Brown (143) Richard P. Chartoff (245)E Research & Development Center MIT University of Dayton0. Box 8 Dept. of Materials Science & Engineering Rapid Prototype Development Laboratory
dg. K1, Room 235 MB Bldg 8-106 300 College Park Avenue:henectady NY 12301 Cambridge MA 02139 Dayton OH 45469-00018 387-7648/fax 518 387-5576 617 253-2100 fax: 253-8669 513 229-2517/ tax: 229-3433
383

FengCN (64) A. Do Fpp Mark GanringerCenter for Matedals Science and Engineering Politeocnico Di Tonno DTM CorporationThe University of Texas at Austin Diparftiento di Sistemi di Produzione 1611 Headway Circle, Bldg 2Austin TX 78712 Ed Economia DeirAzienda Austin TX 78754
Corso Duca Abruzzi 24 512 339-2922J fax: 512 339-063439 11-5647268/fax 564-7294
Michael J. Cima (40, 223) Carl Deckard Edward P. Gargiulo (178)Ceramics Processing Research Laboratory DTM Corporation DuPont Medical ProductsMIT 1611 Headway Circle, Bldg. 2 Glasgow Business Community # 71377 Massachusetts Ave. Austin TX 78754 P. 0. Box 6101Room 12-011 Newark DE 19714617 253-6877 fax: 612 258-6936 302 451-9577 fax: 328-5693
T. Dennis Claar (215) P.M. Dickens (27) Ian Gibson (113)Lanxide Corporation Dept. Man. Eng. & Ops. Mangmt. Department of Manufactunng Engineering1300 Marrows Road The University of Nottingham and Operations ManagementP. 0. Box 6077 University Park The University of NottinghamNewark DE 19714-6077 Nottingham NG7 2RD UNITED KINGDOM University Park
602 515151/fax: 602 51400 011 0602 514018 tax: 0602 514000
Richard C. Cobb (27) Michael A. Ervin Paul GiletteDept. Man. Eng. & Ops. Mangmt. DTM Corporation Hercules Research CenterThe University of Nottingham 1611 Headway Circle 500 Hercules RoadUniversity Park Austin TX 78754 Wilmington DE 19804-0001Nottingham, NG7 2RD UNITED KINGDOM 512 339-2922 / fax: 512 339-0634 302 995-3815/ fax: 302 995-412144 602 514 063/ fax: 0602 514 000
Ed Coggins Brian Fabes Dan GirouardReliance Electric Arizona Materials Lab DTM CorporationP. O. Box 499 4715 E. Fort Lowell 1611 Headway Circle, Bldg. 2Greenville SC 29602 Tucson AZ 85712 Austin TX 78754803 281-2248/fax 803 281-2487 602 621-6372/ fax: 322-2993 512 339-2922/ fax: 512 339-0634
Robert Connelly Steven G. Fishman Marc Glazer (333)Motorola, Inc. Program Manager Department of Mechanical Engineering8000 W. Sunrise Blvd. Office of Naval Research The University of Texas at AustinFt. Lauderdale FL 33322 800 N. Quincy St. 62200305 475-6148/ fax: 305 475-5584 Arlington VA 22217-5000 Austin TX 78712
703 696-0285/ fax: 696-0285 512 471-5838
Richard Corden (94) Paul Forderhase (94) Jeffrey A. GravesDTM Corporation DTM Corporation Rockwell Science Center1611 Headway Circle, Bldg. 2 1611 Headway Circle, Bldg. 2 1049 Camino Dos RiosAustin TX 78754 Austin TX 78754 Thousand Oaks CA 91360
512 339-2922 fax: 339-0634 805-373-4438/fax 805-373-4775
Richard H. Crawford (102, 291) Douglas W. Freitag Sashidhar Guduri (291)The University of Texas at Austin Loral Vought Systems Department of Mechanical EngineeringDepartment of Mechanical Engineering P. 0. Box 650003, M/S WT-21 The University of Texas at AustinETC 4.138 Dallas TX 75265-0003 62200Austin TX 78712 214 603-1632 fax: 214 603-0419 Austin TX 78712512 471-1504
Stephen C. Danforth Paul S. Fussell Tommy R. GuessRutgers University Alcoa Labs Sandia National LabsCenter for Ceramic Research 100 Technical Drive P. 0. Box 5800P. 0. Box 909 Alcoa Center PA 15069-0001 Albuquerque NM 87185Brett and Bowser Roads 505 845-9748/ fax: 505 844-1110908 932-2211 fax: 932-3258danforth @silicon-nitride-rutgers.edu 384

lorry Lee Hall (135) Luke L. Kimble Sang-Joon John Lee (223)
owa State University Market Development Manager MIT1051 Black Engineering Bldg. DTM Corporation 35-231Engel Manufactunng Laboratory 1611 Headway Circle, Bldg. 2 77 Massachusetts Ave.kmes IA 50010 Austin TX 78754 Cambridge MA 02139i15 294-0569/ fax: 515 294-3261 517 253-2606/ fax 617 253-2123
lames Hetzner Chuck Kirschman Richard Levy (121)3eneral Motors Corporation BPM Technology, Inc, Department of Radiology=owertrain Division 1200 Woodruff Rd. The University of Michigan Medical Center1629 N. Washington Suite A19 1500 E. Medical Center DriveSaginaw MI 48605 Clemson SC 29607 Ann Arbor MI 48109-0030$17 757-0015/ fax: 517 757-1484 313 936-9878 fax: 764-2412
.eslie Horton ,178) Ron Knight Brent Looby?537 Park Heights Terrace Loral Vought Systems Department of Mechanical Engineering3aftimore MD 21215 P. 0. Box 650003 M/S WT-21 The University of Texas at Austint10 542-7709 Dallas TX 75265-0003 MC 62200
Austin TX 78712
>hris Hysinger Visa Koivunen (275) Ismo MAkelI (126)3epartment of Mechanical Engineering General Robotics and Active Sensory Perception Helsinki University of TechnologyThe University of Texas at Austin (GRASP) Laboratory Institute of Industrial AutomationVIC 62200 University of Pennsylvania Otakaari 1Austin TX 78712 300C 3401 Walnut Street SF-02150 Espoo FINLAND
358 0 4513372/ Fax: 358 0 451 3293
Kevin Jakubenas Uday Lakshminarayan Arumugam Manthiram (64, 339)The University of Texas at Austin DTM Corporation The University of Texas at AustinCenter for Materials Science & Engineering 1611 Headway Circle, Bldg. 2 Center for Materials Science & Engineering52201 Austin TX 78754 62201Austin TX 78712 Austin TX 78712
512 471-1791 fax: 471-7681
Anand Jog Thomas S. Latham Harris Marcus (64, 204, 308,Department of Mechanical Engineering United Technologies Research Center 325, 339, 350)The University of Texas at Austin 411 Silver Lane The University of Texas at Austin
MC 62200 East Hartford CT 06140 Center for Materials Science & Engineering
Austin TX 78712 203 727-7409 / fax: 203 727-7880 62201Austin TX 78712512 471-3188 fax: 471-7681
Roy Johanson (186) Allen Lauder Ronald E. Marusak (81)
University of Michigan E-Systems MicroFab Technologies. Inc.2250 G.G. Brown 7700 Arlington Blvd. 1104 Summit, Suite 110Ann Arbor MI 4810'-- Falls Church VA 22046 Piano TX 75074313-936-2624 (703) 560-5000 fax: 703 280-4627 214 578-8076 / fax: 423-2438
Lloyd Johnson Goonhee Lee (376) Kevin McAlea
Center for Materials Science and Engineering The University of Texas at Austin DTM CorporationThe University of Texas at Austin Department of Chemical Engineering 1611 Headway Circle, Bldg. 2Austin TX 78712 MC 60400 Austin TX 78754
Austin TX 78712 512 339-2922/ fax: 512 339-0634512 471-5828
Dale Karr Insup Lee Larry Melvin
University of Michigan Center for Materials Science & Engineering Department of Mechanical EngineeringDept. of Naval Architecture & Marine Engineering The University of Texas at Austin The University of Texas at AustinAnn Arbor MI 48109-2145 62201 MC 62200
Austin TX 78712 Austin TX 78712
385

Robert Merz (1) Theo Pintat Emanuel Sachs (40.223)Carne Melo University Fraunhot•e-IFAM MIT5000 Forbes Avenue Leewmer Heerhsee 36 35-231Pitburgh PA 15213 (Lesum) 77 Mass Avenue412 268-3788 fax: 412 268-5229 D-2820 Breman 77 GERMANY Cambuidge MA 02139
49 4216383153/Fax: 421-6383190 617 253-2606/ fax 617 253-2123
Nathan Moore Gopalakrishna Prabhu (317) Greg SandersDepartment of Mechanical Engineenng The University of Texas at Austin General Motors CorporationThe University of Texas at Austin Center for Materials Science & Engineering 30300 Mound RoadMC 62200 62201 Mail Drop A/MD36Austin TX 78712 Austin TX 78712 Warren MI 48090-9040512 471-5838 512 471-3170 fax: 471-7681 313 986-9057
Anthony Mulligan (60) William R. Pratt Don SiffordAdvanced Ceramics Research Sr. Programmer Analyst Texas Instruments, Inc.841 E. 47th Street Techmedica, Inc. P.O. Box 405Tucson AZ 85713 3760 Calle Tecate MS 3412602 792-2616/ fax: 602 792-2635 Camarillo CA 93012 Lewisville TX 75067
805 987-0466/fax: 987-4111 214 462-21511 fax: 214 462-5610
Ulrike Naerger Mark S. Pridham (74) Manfred SinduDaimler-Benz TEPIM University of Dundee Fraunhofer-Institut fur AngewandteP. O. Box 2360 Dept. of Applied Physics & Electronic MaterialforschungUlm GERMANY 89013 and Manufacturing Engineering Lesumer-Heerstrabe 3649 ,31-505 2913 fax: 49 731-5054212 Dundee DD1 4HN UNITED KINGDOM D-2820 Bremen/77(Lesum) GERMANY
011 4438223181/ fax: 02830 0421 6383-0/ fax: 0421 6383 190
Christian Nelson (360) William R. Priedeman (86) Ain A. Sonin (237)DTM Corporation Stratasys, Inc. MIT1611 Headway Circle, Bldg. 2 14950 Martin Drive Department of Mechanical EngineeringAustin TX 78754 Eden Prairie MN 55343 Room 3-258512 339-2922/ fax: 512 339-0634 612 937-3000 Cambridge MA 02139
617 253-2247 fax: 258-8559
Kurt O'Connor Fritz Prinz (1, 186) Dieter SteinhauserAllison Gas Turbine Director, EDRC Dr. Ing. h.c.F. Porsche AG2001 South Tibbs Ave. Camegie Mellon University PorschestrasserIndianapolis IN 46241 5000 Forbes Avenue 71287 Weissach GERMANY317 230-6282 fax: 230-2990 Pittsburgh PA 15213 7044352142/ tax: 7044352058
412 268-2499 fax: 412 268-5229
Sean O'Reilly (168) Ramas V. Raman (271) Jim StewartFord Motor Company Ceracon, Inc. Allison Gas TurbineManufacturing Development Center 1101 N. Market Blvd. # 9 2001 South Tibbs Ave.Operations Engineering Sacramento CA 95834 Indianapolis IN 4624124500 Glendale Avenue (916) 928-1933/ Fax: 928-1934 317 230-4337 fax: 230-2990fax 313 592-2381
Thomas Pang (11, 158) Sandra Rider Brent Stucker3D Systems Xerox Texas A & M University26081 Ave. Hall 800 Phillips Road 208-04H Department of Mechanical EngineeringValencia CA 91355 Webster NY 14580 College Station TX 77843(805) 295-5600/ fax: 805 257-1200 716-422-9354/fax 716-422-9435
Joseph Pegna (253) D. Romano Kevin Stuffle (60)Rensselaer Polytechnic Institute Politecnico Di Torino Advanced Ceramics ResearchDepartment of Mechanical Engineering, Dipartimento di Sistemi di Produzione 841 E, 47th StreetAeronautical Engineering & Mechanics Ed Economia DellAzienda Tucson AZ 85713Troy NY 12180 Corso Duca Abruzzi 24 602 792-2616/ fax: 602 792-2635(518) 276-6999 fax: 276-2623 39 11-564-7268/ fax 564-7294
386
P. Karatchi Subramanian (350) Lee Weiss (1, 186)
Center for Materials Science & Engineering Carnegie Mellon UniversityThe University of Texas at Austin 5000 Forbes Avenue62201 Pittsburgh PA 15213Austin TX 78712 412 268-7657 /fax: 412 258-5016
Martin Sun Eric M. Weissman
3A BF Goodrich R&D6801 River Place Blvd A 146-1503 9921 Brecksville RoadA146-SS-03 Brecksville OH 44141Austin TX 78726-9000 216 447-5420/ fax:216 838-4413(512) 984-5496 fax: 984-7258
Rich Thissell Bemd Wiedemann
The University of Texas at Austin University of Stuttgart-IUPCenter for Materials Science & Engineering Pfaffenwaldoing 3262201 Stuttgart, Valingen GERMANYAustin TX 78712 0211 685-2678/ fax: 0211 685-2066
James R. Tobin (303) Christian Wilkening
Department of Mechanical Engineering FGB, TU MunichThe University of Texas at Austin Arcisstr. 2762200 8000 Mjchen 2 GERMANYAustin TX 78712512 837-7137
James V. Tompkins (325) P.R. Winans
Center for Materials Science & Engineering Rocketdyne, Div. of Rockwell Int.The University of Texas at Austin 6633 Canoga Ave IB1762201 P. 0. Box 7922Austin TX 78712 Canoga Park CA 93109-7922
818 718-3798 fax 818 718-4840
N.K. Vail (204, 333, 350, Wayne Winkelman360) Digibotics
Department of Chemical Engineering 2800 Longhorn Blvd. Suite 102The University of Texas at Austin Austin TX 7875860400 512 832-9040 fax:832-1163Austin TX 78712512 471-5838
Ralph Wachter John Wooten
Office of Naval Research Rockwell International Corp.Computer Science Division, Code 1133 Rocketdyne Division800 N. Quincy Street 6633 Canoga Ave., MS IB15Arlington VA 22217-5660 P.O. Box 7922703-696-4304/ fax 703-696-0934 818 718-4897/ fax: 718-4600
Craig T. Wadham Benny Wu (193)
DTM Corporation Department of Mechanical Engineering1611 Headway Circle, Bldg. 2 The University of Texas at Austin
Austin TX 78754 MC 62200
512 339-2922 / fax: 512 339-0634 Austin TX 78712
Gary Waite Rick YeagerVertical Dimensions DTM Corporation630 So. 4th St. Suite 100 1611 Headway Circle, Building 2
Las Vegas NV 89101 Austin TX 78754
702 387-6453 fax: 702 382-0365 512 339-2922/ fax: 512 339-0634
387
Related Documents