Final Report SOLAR WATER HEATERS IN INDIA: MARKET ASSESSMENT STUDIES AND SURVEYS FOR DIFFERENT SECTORS AND DEMAND SEGMENTS Submitted to Project Management Unit Global Solar Water Heating Project Ministry of New and Renewable Energy 20 th January 2010 Submitted by: Greentech Knowledge Solutions (P) Ltd New Delhi -110078 (India) Website: www.greentechsolution.co.in

Welcome message from author
This document is posted to help you gain knowledge. Please leave a comment to let me know what you think about it! Share it to your friends and learn new things together.
Transcript

Final Report
SOLAR WATER HEATERS IN INDIA: MARKET ASSESSMENT STUDIES AND SURVEYS FOR DIFFERENT SECTORS
AND DEMAND SEGMENTS
Submitted to
Project Management Unit Global Solar Water Heating Project
Ministry of New and Renewable Energy
20th January 2010
Submitted by:
Greentech Knowledge Solutions (P) Ltd
New Delhi -110078 (India) Website: www.greentechsolution.co.in
PROJECT TEAM
Core Team Dr Sameer Maithel, Greentech Knowledge Solutions (GKS), New Delhi Mr Shailesh Modi, Fourth Vision (FV), Ahmedabad Mr Minhaj Ameen, Auroville Renewable Energy (AURORE), Auroville Mr Prashant Bhanware, GKS, New Delhi Regional Teams North Dr Sameer Maithel & Mr Prashant Bhanware, GKS, New Delhi Mr Anil Kumar, Ms Aesha Basri & Mr Saurabh Srivastava, BTECON, New Delhi South Mr Minhaj Ameen, Mr P J Tejas, Mr Hemant Lamba, Mr Erik Conesa, Mr Akshay Roongta, AURORE, Auroville West Mr Shailesh Modi, Mr Vimal Suthar, Mr Mintu Patel, Mr Vipin Thakur, Fourth Vision (FV), Ahmedabad East Mr S B Rath, Mr.Rahul Gon, Mr.Abhijit Kanungo, Mr. Tapan Laha, Mr.Smurtiranjan Dash, Varun Techno Infrastructure Pvt Ltd, Bhaubaneswar North-East and West Bengal Mr P C Sarma, Mr P.L.Ghosh, Mr Anupam Boral, Mr Avijeet Dutta, Ms Manikankana Majumder, Mr Amit Dhar, N B Institute of Rural Technology, Kolkata, Guwahati and Agartala

ACKNOWLEDGEMNETS
The project team would like to sincerely thank Dr Bibek Bandyopadhyay, Advisor and Head, MNRE and Mr Ajit Gupta, National Project Manager, UNDP/GEF Global Solar Water Heating Project for their guidance during the entire duration of the project. Periodic review meetings organized by the Project Management Unit helped immensely in shaping the study. We are also grateful to the members of the Project Executive Committee as well as participants of the stakeholders consultation workshop for their suggestions and inputs. During the course of the study, we had the opportunity to interact with a large number of solar water heater manufacturers/dealers, as well as office bearers of SWH manufacturers Associations in Karnataka and Maharashtra, the project team would like to thank them for sharing their knowledge and insights about the SWH market. The study relied heavily on interactions with a wide range of stakeholders, such as, SWH users, potential SWH users, state level renewable energy development agencies, architects and builders, banks, municipal corporations, electricity distribution companies, pollution control boards. Our special thanks go to all of them for sparing their valuable time to interact with us and for sharing their experiences, perceptions and thoughts on the subject.
Executive Summary – SWH Market Assessment
Greentech Knowledge Solutions i
Executive Summary
Solar Water Heater Market Assessment Studies and Surveys for Different Sectors and Demand Segments
1.0 Introduction The present report addresses the following objectives.
• Understanding SWH market
• Projecting realizable demand for SWH till 2022
• Generating policy inputs (specific, separate studies on policy and
regulation are underway)
The report is an outcome of work done by Greentech Knowledge Solutions Pvt. Ltd
(GKS), New Delhi led consortium of consultants. The other members of the
consortium are located at Pondicherry, Ahmedabad, Bhubaneshwar and Kolkata.
In addition to literature survey focused on global and Indian SWH market, we carried
out a primary survey among 1000 users and non-users of SWH in household,
commercial/institutional and industrial segments in 29 districts of India; selected in
consultation with MNRE. We also held semi-structured interviews of 200
stakeholders- SWH manufacturers, dealers, SNA’S, banks, municipal corporations,
electricity distribution companies, architects and builders. This was followed by
analysis leading to demand projection and delineation of key areas for action to
realize projected demand. The primary survey was followed by realizable demand
projections.

Executive Summary – SWH Market Assessment
Greentech Knowledge Solutions ii
LehShimla
HaridwarLudhiana
South West DelhiGurgaon Agra
Bangalore Chennai
Coimbatore
Cochin (Ernakulam)
Hyderabad
Bhubaneshwar
Sambalpur
Raipur
Ranchi
Patna
Ahmedabad
Pune
Thane
Nagpur
Jaipur
Indore
Guwahati(Kamrup)
Shillong (East Khasi)
Agartala (West
Darjiling
Kolkata
Pondicherry
Figure 1. Primary Survey – 29 Selected Districts
2.0 SWH Global Market
In 2008, the cumulative SWH capacity was 15 GWth. Growth in recent years has
been 15% per year. There are estimated 40 million households (2.5% of the total)
which were using SWH worldwide in 2004.
China is the leader; 10% of Chinese households use SWH; the target for 2020 being
30%. In 2008, 65.6% of existing global SWH capacity was in China; followed by
European Union (12.3%), Turkey (5.8%), Japan (4.1%) and Israel (2.8%). The Indian
share was 1.2%.
The residential sector is the mainstay of SWH in the two largest SWH markets; 98%
of annual sale in China and 90% of installed capacity in Europe is in the residential
sector. The market is urban-centric; 90% of installations in China are in urban areas.

Executive Summary – SWH Market Assessment
Greentech Knowledge Solutions iii
While households-level SWH in Europe are installed predominantly in independent
houses, it is both-independent houses and multi-storied buildings-in China.
3.0 Indian Market
The segment-wise statistics on Indian market are not available. Based on our work,
we have pieced together the following picture.
Table 1. Estimated Breakup: Functional SWH Installations Till 2009
Sector million m2
Residential (80%) 2.108
Hotels (6%) 0.158
Hospitals (3%) 0.079
Industry (6%) 0.158
Other (Railway + Defence + Hostel + Religious places,
other) (5%)
0.132
Total 2.635
* It is assumed that 85% of the installed SWH are functional
The sale during 2009 is estimated at 0.55 million m2. The CAGR of cumulative
installation during 1995-2000 was 8.23%. It spurted to 20.6% during 2000-04 and
further to 24.6% during 2004-08, denoting overall CAGR of 16.8% over 1995-2008.
The following explains demand upsurge in recent years.
• Growth in new urban housing; rising disposable income; increased propensity
for consumer durables
• Arrival of ETC & improvements in supply chain
• Energy price hike
• Policy initiatives

Executive Summary – SWH Market Assessment
Greentech Knowledge Solutions iv
4.0 Primary Survey: Key Findings
In the residential sector, there are 0.7 million SWH user households; 65% of which
are concentrated in Karnataka and Maharasthra. There is overall satisfaction with
product- experience; some concern being voiced over after-sale support. The use of
SWH-water is mainly for bathing. The average size of the domestic installations that
were surveyed is around 150 lpd. Among non-users, in states other than
Karnataka/Maharashtra, there is sketchy awareness of the bare concept of SWH. The
customers perceive it as a product suited for independent houses and not so much for
apartment buildings. Hot water demand expressed though months/year and supply
chains are important demand drivers. The high demand regions report hot water
demand for ≥ 9 months/year, while the lower end is 4 months/year.
In the hotel sector, SWH experience exists across regions and hotel/guest-house
standards. The provisioning recognizes year-round demand for hot water. The use of
expensive petroleum fuels and electricity support the case for SWH. Roof availability,
for 15 room upward capacity hotels, is not a significant barrier. However, capital cost
is a major consideration. Among hospitals and hostels, awareness/exposure levels are
low; compared to hotels. Supply hour management/regulation is a key advantage for
both. Roof availability is not a noticeable constraint.
The SWH experience among industries is limited and scattered. Heating of boiler feed
water is the major application. Some of the candidate industries –rice-mills, pulp and
paper, tea-gardens, leather, textile processing-utilize biomass and coal; lengthening
the payback period. It is industries utilizing oil-fired boilers-mainly dairy, fertilizer
and sub-set of textile which are the prime markets for SWH. In addition, there are
industrial canteens. The report enumerates geographical clusters, where SWH-
relevant industries are concentrated.
In the rural sector, the households, dhabas, primary health-centers, hostels and
village- industries (silk-reeling, textile-dyeing, puffed rice-making) are the main
segments. The capital cost, recourse to biomass, lack of piped water supply, roof
design/strength and virtual absence of supply chain are the roadblocks. The report
highlights a low-cost innovative product introduced in Ladakh and a community-level

Executive Summary – SWH Market Assessment
Greentech Knowledge Solutions v
positive experience in Himachal Pradesh. The development of rural market warrants
large, fresh work in terms of product-development, demonstration, policy and
promotion of supply chain.
5.0 Industry Structure, Supply Conditions And Value Proposition
There are two technologies in vogue; flat plate collector and evacuated tube collector;
the later has flourished on the strength of import of glass tubes from China. There are
113 approved Indian producers. The largest player market share is under 15%. The
producers do not have nation-wide, SWH- specific brand equity. The dealer network
is limited. The manufacturing is concentrated in southern India and Maharashtra.
Barring ETC, there have not been any major product/technology breakthrough in last
two decades. The system cost for a household varies from Rs. 20000 to Rs. 60000,
depending on size and standard. It is positioned as an electricity-saving consumer
durable. ESCO or pay-per-use models have not been attempted in a significant way.
6.0 Approach To Estimating Realizable Potential
The empirical data, over a period of time, in terms of SWH sale, its region-wise and
segment-wise breakup and behaviour of relevant variations is not available. The
present installations are concentrated in Karnataka and Maharashtra; compounding
the inadequacy of data required for all-India model-building.
We were required to devote considerable effort to the task of estimating present and
future stock of housing, hotel-rooms, hospital-beds, hostel-beds, etc. The
establishment of hot water- consumption norms involved a probe into the applications
and working out weighted average since norms vary across hotel/hospital categories.
We have identified the parameters driving demand and built three scenarios for
demand projection-realistic or most likely; optimistic and pessimistic which are, both,
considered less likely.

Executive Summary – SWH Market Assessment
Greentech Knowledge Solutions vi
Our estimates in terms of SWH penetration and CAGR, for a given segment under the
concerned scenario, recognizes the following.
• Historical trends and best-case (Karnataka) performance
• Assessment of potential based estimated growth for a given segment and its
response to SWH; considering payback period prospect,
• Variations in SWH penetration vis-à-vis new and old buildings
7.0 SWH Potential Projection
Under realistic scenario, we estimate demand as follows 1.
Table 2. SWH potential under realistic scenario (cumulative million m2)
2010 2013 2017 2022
Residential 2.58 4.25 7.68 15.74
Commercial/Institutional
• Hotels 0.19 0.35 0.61 0.97
• Hospitals 0.10 0.17 0.27 0.43
• Others 0.18 0.27 0.39 0.52
Industry 0.19 0.33 0.57 1.05
Total 3.24 5.37 9.52 18.70
Residential sector would remain the largest sector and would contribute to 84% of the
cumulative installations.
Residential84%
Commercial and Institutional
10%
Industries6%
Figure 2 : Percentage-share of sectors in SWH installations 2022
1 1 m2 = 50 lpd
Executive Summary – SWH Market Assessment
Greentech Knowledge Solutions vii
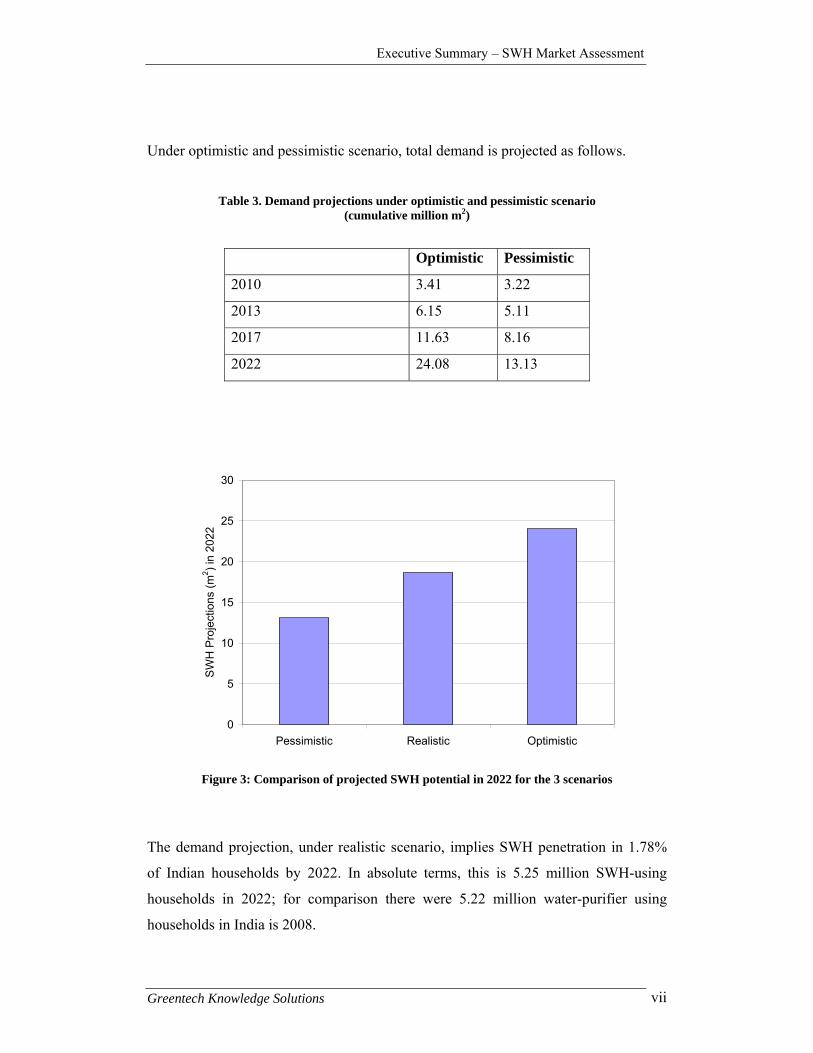
Under optimistic and pessimistic scenario, total demand is projected as follows.
Table 3. Demand projections under optimistic and pessimistic scenario
(cumulative million m2)
Optimistic Pessimistic
2010 3.41 3.22
2013 6.15 5.11
2017 11.63 8.16
2022 24.08 13.13
0
5
10
15
20
25
30
Pessimistic Realistic Optimistic
SW
H P
roje
ctio
ns (m
2 ) in
2022
Figure 3: Comparison of projected SWH potential in 2022 for the 3 scenarios
The demand projection, under realistic scenario, implies SWH penetration in 1.78%
of Indian households by 2022. In absolute terms, this is 5.25 million SWH-using
households in 2022; for comparison there were 5.22 million water-purifier using
households in India is 2008.

Executive Summary – SWH Market Assessment
Greentech Knowledge Solutions viii
In the hotel and hospital segments, SWH penetration will reach 53% and 29% by
2022.
The demand projections under the realistic scenario are compared with the targets set
for solar water heating in the recently announced Jawaharlal Nehru National Solar
Mission (JNNSM) in the following table. The comparison shows a considerable gap
between the targets set for the year 2017 and the projected potential. This indicates a
need for having a much closer scrutiny of the JNNSM targets and the strategies to
achieve the targets.
Table 4 Comparison of JNNSM targets and projected potential under realistic scenario
JNNSM target (million
m2)
Projected potential
(million m2)
2013 7.0 5.4
2017 15 9.5
2022 20 18.7
8.0 Spatial Distribution of Projected Demand
Five states will lead demand-expansion, as is evident from the following table.
Table 5. Five top states
(cumulative SWH potential in million m2 for 2022 under the realistic scenario)
State Residential million m2
Commercial/ Institutional million m2
Total (Excluding Industrial) million m2
Karnataka 3.72 0.16 3.88 Maharashtra 3.5 0.31 3.80 Tamil Nadu 1.53 0.14 1.67 Andhra Pradesh 1.08 0.09 1.17 Gujarat 0.90 0.06 0.96 %age of 5 states 67.10%

Executive Summary – SWH Market Assessment
Greentech Knowledge Solutions ix
Further analysis of demand at the district level shows that a large part of the demand would come from selected urbanized districts. Some of the key districts (out of the 29 surveyed districts) which have large potential are listed in the table below.
Table 6: Selected districts with large SWH potential
(Cumulative SWH potential in million m2 for 2022 under the realistic scenario)
District/Region SWH potential (excluding industry) million m2
Bangalore 1.94 Pune 1.11 National Capital Region 0.77 Thane 0.68 Hyderabad 0.58 Nagpur 0.38 Kolkata 0.36 Chennai 0.35 Coimbatore 0.33 Ahmedabad 0.29 Jaipur 0.27
9.0 Recommendations for Key Areas for Action We have identified 10 key action points for MNRE and UNDP/GEF project. In our
view these actions are important for relizing the potential of SWH in the country and
achiving targets set under JNNSM. Please note that these do not follow any specific
order of priority.
9.1 Select high-potential districts for implementation
The analysis presented in the report shows that the adoption of SWH depends
primarily on the demand for hot water, regulations, SWH supply chain and paying
capacity of the users. As presented in the previous section, a large part of the demand
is concentrated in urban centers. Given this reality, MNRE should identify 10-20
districts and focus its attention on implementing SWH programme during the first
phase of JNNSM (2010-2013) in these districts.
Executive Summary – SWH Market Assessment
Greentech Knowledge Solutions x
9.2 Implementation through Electricity Distribution Companies
There is a need to provide soft-term loan and, depending on the region and building
vintage, a financial incentive to promote the market over next 5 to 8 years. Electricity
distribution companies are the most appropriate vehicle to operate the package. The
customer will appreciate readily the proposition of electricity-saving, rebate on
electricity bill and outgo on account of SWH- purchase for a specified period because
the company will make a single, consolidated proposal; smoothening all transactions.
The distribution companies are also best equipped to operate compulsory installation
policy for new buildings as well as old ones requiring extra power. They will build a
clear database of installations, loan/rebate provided, SWH- performance and
electricity saving. MNRE should set-up a working group to initiate a dialogue with
Ministry of Power, Electricity Sector Regulators and Electricity Distribution
Companies to develop a SWH programme for implementation through Electricity
Distribution Companies by 2011.
9.3 Implementation-Oriented Mandatory Regulations
Mandatory regulations would remain a very important tool for developing market for
SWH. Thus, it is imperative that the SWH mandatory regulations addresses the
essential legal, administrative and technical issues and outlines the implementation
mechanism. Prioritization and phasing might help, e.g., the policy may focus on new
buildings above a cut-off point and limit itself to selected cities initially; extending the
target-constituency and city-list over time. MNRE should initiate work with selected
(3-5) municipal corporations and state governments having prior experience in
implementing SWH mandatory regulations to update the regulations and develop a
fool-proof strategy for implementation.
9.4 Strategy for Multi-storied Buildings
Given the shift towards multi-storey residential buildings, addressing water heating in
multi-storey residential buildings through solar water heaters would be the key to
realize potential in residential sector. A package of mandatory regulations, techno-
managerial solutions, working models and best practices and incentives is essential
for multi-storied buildings. Existing buildings will warrant special incentive. MNRE

Executive Summary – SWH Market Assessment
Greentech Knowledge Solutions xi
may set-up a task force to study the issues and for developing a comprehensive
strategy for multi-storey residential buildings.
9.5 Targeted and Variable Incentives Package
The payback period in respect of SWH varies across regions. It is not practical to
stipulate compulsory SWH-installation for old buildings. The incentive package needs
to address regional and vintage differences. MNRE should develop targeted and
variable incentive packages that takes into account the specific requirements of
different regions, sectors and vintage of builings.
9.6 Rural Market Development
Rural market particularly in the cold region may offer large potential. In the report we
have indicated the barriers and successful experiences. MNRE should work out a blue
print for the development of appropriate products, supply chains and a policy package
focused on developing rural market for SWH.
9.7 Strategy to strengthen SWH Supply Chain
We have already elucidated the problem-areas. MNRE needs to work on a package of
fiscal/monetary/subsidy policy to promote industry- consolidation,
product/technology development appropriate to low/middle-income group market,
visible and extensive distribution network, quality-standards and rating. It will help if
the industry, on its part, works out a collective vision and strategy for realizing
market-volume projected under the report. For example the industry and government
can work together to constitute a fund of the order of around 5% of the annual
turnover of the industry to be used for advertising and promotion.
9.8 Developing a database of SWH installations
Presently, there is no system for collecting information of SWH market and
installations. Unavailability of this data was one of the main hurdles faced by the
project team. MNRE should consider giving this responsibility to an independent

Executive Summary – SWH Market Assessment
Greentech Knowledge Solutions xii
organisation to develop and maintain a data-base of SWH manufacturing, sales and
installations.
9.9 Sector and Region Specific Market Assessment Studies
The present study should be seen as the first attempt to gain an understanding of the
Solar Water Heating market. As indicated in the report there are several sectors which
require more in-depth market assessment studies, two such sectors are industry and
rural sectors. Amongst regions, cold region requires a detailed study. There is also a
need to continue updating market assessment every alternate year.
9.10 Promoting Energy Service Company (ESCO) based models
For setting-up large SWH installations in commercial buildings, industries and large
residential developments , ESCO approach has the potential to become the most
preferred implementation arrangement. MNRE should develop an action plan to
develop feasible ESCO models and create conducive environment for development of
sustainable SWH ESCO businesses.

CONTENTS
CHAPTER 1. INTRODUCTION ......................................................................................................... 1
1.1 GLOBAL STATUS OF SOLAR WATER HEATERS ...................................................................................... 1 1.2 SOLAR WATER HEATERS IN INDIA .................................................................................................... 3 1.3 OBJECTIVE OF THE STUDY ............................................................................................................... 4 1.4 METHODOLOGY ........................................................................................................................... 5 1.5 LITERATURE SURVEY ON SWH POTENTIAL IN INDIA ............................................................................. 6 1.6 LIMITATIONS OF THE STUDY ............................................................................................................ 7 1.7 OUTLINE OF THE REPORT ............................................................................................................... 7
CHAPTER 2. PRIMARY SURVEY DESIGN ......................................................................................... 9
2.1 BACKGROUND ............................................................................................................................. 9 2.2 PRIMARY SURVEY ......................................................................................................................... 9 2.3 HOUSEHOLDS .............................................................................................................................. 9 2.4 HOTELS & GUESTHOUSES ............................................................................................................ 10 2.5 HOSPITAL, NURSING HOMES AND HOSTELS ..................................................................................... 10 2.6 INDUSTRY ................................................................................................................................. 10 2.7 SAMPLING FRAME ...................................................................................................................... 11 2.8 STAKEHOLDER INTERVIEWS .......................................................................................................... 11 2.9 GEOGRAPHICAL COVERAGE .......................................................................................................... 12 2.10 WORK ORGANIZATION ................................................................................................................ 14
CHAPTER 3. PRIMARY SURVEY RESULTS ..................................................................................... 15
3.1 RESIDENTIAL SECTOR .................................................................................................................. 15 3.1.1 Growth of SWH in Residential Sector ........................................................................... 15 3.1.2 Factors Influencing SWH Market in Residential Sector ................................................. 17 3.1.3 SWH Size ...................................................................................................................... 19 3.1.4 Satisfaction with SWH .................................................................................................. 19
3.2 COMMERCIAL AND INSTITUTIONAL BUILDINGS .................................................................................. 21 3.2.1 Hotels .......................................................................................................................... 21 3.2.2 Hospitals ...................................................................................................................... 22 3.2.3 Hostels ......................................................................................................................... 24
3.3 INDUSTRIES .............................................................................................................................. 24 3.3.1 Dairy ............................................................................................................................ 24 3.3.2 Textile Industry ............................................................................................................ 25
3.4 RURAL AREAS ........................................................................................................................... 26 3.5 INTERVIEWS WITH STAKEHOLDERS ................................................................................................. 26
CHAPTER 4. APPROACH TO DEMAND PROJECTION ..................................................................... 29
4.1 APPROACH ............................................................................................................................... 29 4.2 PRESENT CONFIGURATION OF SWH MARKET ................................................................................... 30 4.3 ALTERNATIVE SCENARIOS ............................................................................................................. 32
4.3.1 Growth in GDP ............................................................................................................. 32 4.3.2 Product Technology and Value Proposition .................................................................. 32 4.3.3 Industry‐Structure and Distribution .............................................................................. 33 4.3.4 A Solution for Multi‐Storey Buildings ............................................................................ 34 4.3.5 Policy ........................................................................................................................... 35 4.3.6 Promotion .................................................................................................................... 36

4.4 CONCLUSION ............................................................................................................................ 37
CHAPTER 5. SWH POTENTIAL IN RESIDENTIAL SECTOR ................................................................ 41
5.1 WATER HEATING IN INDIAN HOUSEHOLDS ....................................................................................... 41 5.2 ESTIMATION OF SWH PENETRATION RATE IN STATES ........................................................................ 42 5.3 PROJECTION OF NUMBER OF HOUSEHOLDS ...................................................................................... 43 5.4 ALTERNATE SCENARIOS ............................................................................................................... 44 5.5 RESULTS .................................................................................................................................. 45
CHAPTER 6. SWH POTENTIAL IN COMMERCIAL AND INSTITUTIONAL BUILDINGS......................... 53
6.1 SWH POTENTIAL IN HOTELS ........................................................................................................ 53 6.1.1 Existing Stock of Hotel/Guesthouse Rooms in India ...................................................... 53 6.1.2 Development of Hot Water Requirement Norms .......................................................... 58 6.1.3 Projection of Hotel Rooms ............................................................................................ 59 6.1.4 Hot Water Requirement ............................................................................................... 65 6.1.5 Present Penetration Rate of SWH in Hotels .................................................................. 65 6.1.6 Alternative Scenarios ................................................................................................... 65 6.1.7 Results ......................................................................................................................... 66
6.2 SWH POTENTIAL IN HOSPITALS .................................................................................................... 71 6.2.1 Hospital Beds in India ................................................................................................... 71 6.2.2 Development of Hot Water Requirement Norms .......................................................... 73 6.2.3 Projected Hospital Beds and Hot Water Requirement .................................................. 74 6.2.4 Hot Water Requirement ............................................................................................... 74 6.2.5 Current Penetration Rate of SWH in Hospitals ............................................................. 74 6.2.6 Alternative Scenarios ................................................................................................... 74 6.2.7 Results ......................................................................................................................... 75
6.3 SWH POTENTIAL IN HOSTEL SECTOR .............................................................................................. 80 6.3.1 Hostel rooms in India ................................................................................................... 80 6.3.2 SWH Projection ........................................................................................................... 85
CHAPTER 7. INDUSTRIES ............................................................................................................. 89
7.1 INTRODUCTION .......................................................................................................................... 89 7.2 TEXTILE INDUSTRY ...................................................................................................................... 90 7.3 DAIRY INDUSTRY ........................................................................................................................ 91 7.4 PHARMACEUTICAL AND DRUGS ..................................................................................................... 93 7.5 ELECTROPLATING ....................................................................................................................... 94 7.6 FOOD PROCESSING INDUSTRIES ..................................................................................................... 94 7.7 PROJECTION OF DEMAND OF SWH IN INDUSTRIES ............................................................................ 98 7.8 CONCLUSIONS ......................................................................................................................... 100
CHAPTER 8. RURAL SECTOR ...................................................................................................... 101
8.1 HOT WATER CONSUMING SEGMENTS ............................................................................................ 101 8.2 BARRIERS IN USE OF SWH ......................................................................................................... 103 8.3 SWH STRATEGY FOR RURAL AREAS .............................................................................................. 104
CHAPTER 9. CONCLUSIONS ....................................................................................................... 107
9.1 SWH GLOBAL MARKET ............................................................................................................. 107 9.2 INDIAN MARKET ...................................................................................................................... 107 9.3 PRIMARY SURVEY: KEY FINDINGS................................................................................................. 108 9.4 INDUSTRY STRUCTURE, SUPPLY CONDITIONS AND VALUE PROPOSITION ............................................... 109

9.5 APPROACH TO ESTIMATING REALIZABLE POTENTIAL ........................................................................ 109 9.6 SWH POTENTIAL PROJECTION .................................................................................................... 110 9.7 SPATIAL DISTRIBUTION OF PROJECTED DEMAND ............................................................................. 112 9.8 RECOMMENDATIONS FOR KEY AREAS FOR ACTION .......................................................................... 113
ANNEXURE I: DISTRICT REPORTS .................................................................................................. A.1
ANNEXURE II: PROJECTIONS AT A GLANCE ..................................................................................A.47
ANNEXURE III: SUMMARY OF LBNL REPORT ................................................................................A.57

List of Table TABLE 1.1: SOLAR WATER HEATERS‐ GLOBAL GROWTH ..................................................................................... 1 TABLE 1.2: CAPACITY ADDITION TARGET UNDER JNNSM ................................................................................... 4 TABLE 3.1: PENETRATION (%) IN HOUSEHOLDS OF CONSUMER DURABLES ............................................................ 16 TABLE 3.2: DATA PRESENTED FOR SURVEYED DISTRICTS ON SOME OF THE KEY PARAMETERS THAT AFFECT SWH MARKET IN
THE RESIDENTIAL SECTOR ................................................................................................................. 20 TABLE 4.1: ESTIMATED BREAKUP: FUNCTIONAL SWH INSTALLATION TILL 31ST
DECEMBER 2009‐3.1 MILLION M2 ....... 31
TABLE 4.2: ESTIMATED BREAKUP: SWH SALES DURING 2009‐ 0.55 MILLION M2 .................................................. 31
TABLE 4.3: SUMMARY TABLE ON SCENARIOS FOR POTENTIAL PROJECTION ........................................................... 37 TABLE 5.1: CLASSIFICATION OF STATES AS PER PENETRATION RATE OF SWH IN HOUSEHOLDS .................................... 43 TABLE 5.2: HOUSEHOLD SIZE AND URBANIZATION RATE USED FOR PROJECTING NUMBER OF HOUSEHOLDS IN 2020 ....... 43 TABLE 5.3: STATE‐WISE, YEAR‐WISE CUMULATIVE SWH DEPLOYMENT IN RESIDENTIAL SECTOR IN M
2 FOR PESSIMISTIC
SCENARIO ..................................................................................................................................... 49 TABLE 5.4: STATE‐WISE, YEAR‐WISE CUMULATIVE SWH DEPLOYMENT IN RESIDENTIAL SECTOR IN M
2 FOR REALISTIC
SCENARIO ..................................................................................................................................... 50 TABLE 5.5: STATE‐WISE, YEAR‐WISE CUMULATIVE SWH DEPLOYMENT IN RESIDENTIAL SECTOR IN M
2 FOR OPTIMISTIC
SCENARIO ..................................................................................................................................... 51 TABLE 6.1: GOI CLASSIFIED/APPROVED HOTEL ROOMS IN INDIA: 1996‐2007 ..................................................... 54 TABLE 6.2: HOTELS/GUESTHOUSES ROOMS IN GUJARAT (2007): AN OVERVIEW .................................................. 55 TABLE 6.3: CONSOLIDATED POSITION OF HOTEL/GUESTHOUSE ROOMS FOR 2007 (NO OF ROOMS) .......................... 57 TABLE 6.4: HOTEL AREAS FOR HOT WATER CONSUMPTION AND INDUSTRY PRACTICE ............................................... 58 TABLE 6.5: HOT WATER CONSUMPTION NORM FOR HOTELS/GUESTHOUSES (LPD/ROOM) ........................................ 58 TABLE 6.6: DOMESTIC TOURIST VISITS: 1996 TO 2007 ................................................................................... 59 TABLE 6.7: FOREIGN TOURIST VISITS: 1996 TO 2007 ..................................................................................... 60 TABLE 6.8: HOTEL ROOM PROJECTION ......................................................................................................... 61 TABLE 6.9: PRESENT AND FUTURE HOT WATER REQUIREMENT: AN ESTIMATE ...................................................... 63 TABLE 6.10: CLASSIFICATION OF STATES AS PER PENETRATION RATE OF SWH IN HOTELS .......................................... 65 TABLE 6.11: STATE‐WISE CUMULATIVE SWH INSTALLATION IN M
2 FOR PESSIMISTIC SCENARIO ‐ HOTELS .................... 68
TABLE 6.12: STATE‐WISE CUMULATIVE SWH INSTALLATION IN M2 FOR REALISTIC SCENARIO ‐ HOTELS ....................... 69
TABLE 6.13: STATE‐WISE CUMULATIVE SWH INSTALLATION IN M2 FOR OPTIMISTIC SCENARIO ‐ HOTELS ..................... 70
TABLE 6.14: STATE‐WISE DISTRIBUTION OF GOVERNMENT HOSPITALS AND HOSPITAL BEDS ....................................... 72 TABLE 6.15: CLASSIFICATION OF STATES AS PER PENETRATION RATE OF SWH IN HOSPITALS ..................................... 74 TABLE 6.16: STATE‐WISE CUMULATIVE SWH INSTALLATION IN M
2 FOR PESSIMISTIC SCENARIO ‐ HOSPITALS ................ 77
TABLE 6.17: STATE‐WISE CUMULATIVE SWH INSTALLATION IN M2 FOR REALISTIC SCENARIO (HOSPITALS) ................... 78
TABLE 6.18: STATE‐WISE CUMULATIVE SWH INSTALLATION IN M2 FOR OPTIMISTIC SCENARIO ‐ HOSPITALS ................. 79
TABLE 6.19: ACTUAL NUMBER OF HIGHER EDUCATION STUDENTS ..................................................................... 81 TABLE 6.20: NUMBER OF HIGHER EDUCATION INSTITUTES IN 2006 ................................................................... 82 TABLE 6.23: ESTIMATED HOT WATER DEMAND OF PROFESSIONAL HIGHER EDUCATION HOSTEL STUDENTS (‘000 LPD) . 86 TABLE 6.24: ESTIMATED HOT WATER DEMAND OF ALL HOSTEL STUDENTS (‘ 000 LPD) .......................................... 87 TABLE 6.25: PROJECTED SWH INSTALLATION (‘000 LTRS) –REALISTIC SCENARIO .................................................. 88 TABLE 7.1: LIST OF IMPORTANT TEXTILE CLUSTERS FOR EXPLORING POTENTIAL OF SWH .......................................... 90 TABLE 7.2: STATE‐WISE MILK PROCESSING CAPACITY IN THE COOPERATIVE SECTOR ................................................. 92 TABLE 7.3: TYPICAL SPECIFIC THERMAL ENERGY CONSUMPTION ........................................................................ 93 TABLE 7.5: LIST OF IMPORTANT ELECTROPLATING CLUSTERS ............................................................................. 94 TABLE 7.6: LIST OF FOOD PARKS ................................................................................................................. 95 TABLE 7.7: YEAR WISE CUMULATIVE SWH PROJECTION FOR INDUSTRIES IN M2 .................................................... 100 TABLE.9.1: FIVE TOP STATES (CUMULATIVE SWH POTENTIAL IN MILLION M
2 FOR 2022 UNDER THE REALISTIC SCENARIO)
................................................................................................................................................ 112

TABLE.9.2: SELECTED DISTRICTS WITH LARGE SWH POTENTIAL (CUMULATIVE SWH POTENTIAL IN MILLION M2 FOR 2022
UNDER THE REALISTIC SCENARIO) ...................................................................................................... 112
List of Figure FIGURE 1.1: SHARE OF SOLAR HOT WATER (TOP 10 COUNTRIES, 2007) ............................................................... 1 FIGURE 1.2: SHARE OF SOLAR WATER HEATER CAPACITY ADDED (TOP 10 COUNTRIES, 2007) ................................... 2 FIGURE 1.3: CUMULATIVE INSTALLATION OF SOLAR WATER HEATERS IN INDIA (1995‐2008) .................................... 3 FIGURE 2.1: SELECTED DISTRICTS FOR PRIMARY SURVEY ................................................................................... 13 FIGURE 3.1: NO OF HOUSEHOLDS HAVING ANNUAL INCOME > RS 5 LAKH (2001‐02 PRICES) ................................... 16 FIGURE 5.1: PROJECTED GROWTH IN NUMBER OF ELECTRIC GEYSER HOUSEHOLDS .................................................. 42 FIGURE 5.2: YEAR‐WISE CUMULATIVE SWH DEPLOYMENT IN RESIDENTIAL SECTOR FOR PESSIMISTIC SCENARIO ............. 46 FIGURE 5.3: YEAR‐WISE CUMULATIVE SWH DEPLOYMENT IN RESIDENTIAL SECTOR FOR REALISTIC SCENARIO ................ 46 FIGURE 5.4: ELECTRIC GEYSERS SALES V/S SWH SALES ..................................................................................... 47 FIGURE 5.5: YEAR‐WISE CUMULATIVE SWH DEPLOYMENT IN RESIDENTIAL SECTOR FOR OPTIMISTIC SCENARIO .............. 47 FIGURE 5.6: YEAR‐WISE CUMULATIVE SWH DEPLOYMENT IN RESIDENTIAL SECTOR FOR ALL SCENARIOS ....................... 48 FIGURE 6.1: CUMULATIVE SWH INSTALLATION IN MILLION M
2 UNDER 3 SCENARIOS FOR HOTELS .............................. 67
FIGURE 6.2: CUMULATIVE SWH INSTALLATION IN MILLION M2 UNDER 3 SCENARIOS FOR HOSPITALS .......................... 76
FIGURE 7.1: PAYBACK ACCEPTANCE SCHEDULE25 ............................................................................................. 99 FIGURE 7.2: YEAR WISE CUMULATIVE SWH PROJECTION FOR INDUSTRIES ............................................................ 99 FIGURE 9.1: PERCENTAGE‐SHARE OF SECTORS IN SWH INSTALLATIONS 2022 ..................................................... 110 FIGURE 9.2: COMPARISON OF PROJECTED SWH POTENTIAL IN 2022 FOR THE 3 SCENARIOS ................................... 111

SWH Market Assessment
Greentech Knowledge Solutions Page | 1
Chapter 1. Introduction
1.1 Global Status of Solar Water Heaters Use of solar energy for heating water is one of the oldest and most mature renewable energy technologies. The two predominant technologies that are used are Flat Plate Collectors (FPC) and Evacuated Tube Collectors (ETC)2. Solar Water Heater installations are witnessing a rapid growth throughout the world (table1.1). Globally, the industry has been growing at 15% annually. China and European Union are the two largest markets of solar water heaters. India accounts for around 1.5% of the total installed capacity (fig 1.1) and 1% of the sales during 20083(fig 1.2).
Table 1.1: Solar Water Heaters- Global Growth
Year Installed Capacity (GWth) 2006 105 2007 126 2008 145
China66.6%
European Union12.3%
Turkey5.8%
Japan4.1%
Israel 2.8%
Brazil2.0%
United States1.3%
Australia1.0%
India1.2%
Jordon0.5%
Others2.4%
Figure 1.1: Share of Solar Hot Water (Top 10 countries, 2007)
2 A FPC consists of a weatherproofed, insulated box covered with glass sheet, containing a black metal absorber sheet with built in pipes. An ETC has multiple evacuated glass tubes. The working fluid flows in the inner tube; the vacuum within the evacuated tubes reduces convection and conduction heat losses. 3 REN 21. Renewables Global Status Report 2009 update
SWH Market Assessment
Greentech Knowledge Solutions Page | 2
China80.2%
European Union9.5%
Turkey3.5%
India1.0%
Brazil1.5%
Australia0.5%
Japan0.5%
Israel0.3%
United States0.5% Others
2.5%
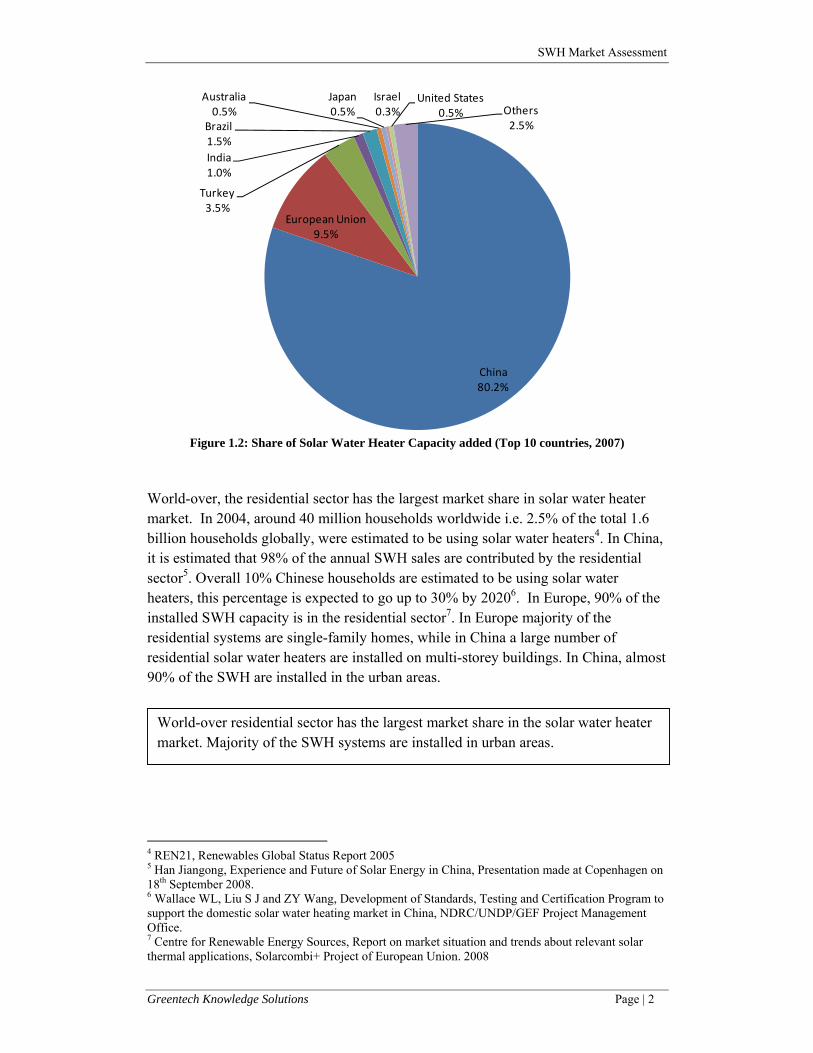
Figure 1.2: Share of Solar Water Heater Capacity added (Top 10 countries, 2007)
World-over, the residential sector has the largest market share in solar water heater market. In 2004, around 40 million households worldwide i.e. 2.5% of the total 1.6 billion households globally, were estimated to be using solar water heaters4. In China, it is estimated that 98% of the annual SWH sales are contributed by the residential sector5. Overall 10% Chinese households are estimated to be using solar water heaters, this percentage is expected to go up to 30% by 20206. In Europe, 90% of the installed SWH capacity is in the residential sector7. In Europe majority of the residential systems are single-family homes, while in China a large number of residential solar water heaters are installed on multi-storey buildings. In China, almost 90% of the SWH are installed in the urban areas.
4 REN21, Renewables Global Status Report 2005 5 Han Jiangong, Experience and Future of Solar Energy in China, Presentation made at Copenhagen on 18th September 2008. 6 Wallace WL, Liu S J and ZY Wang, Development of Standards, Testing and Certification Program to support the domestic solar water heating market in China, NDRC/UNDP/GEF Project Management Office. 7 Centre for Renewable Energy Sources, Report on market situation and trends about relevant solar thermal applications, Solarcombi+ Project of European Union. 2008
World-over residential sector has the largest market share in the solar water heater market. Majority of the SWH systems are installed in urban areas.

SWH Market Assessment
Greentech Knowledge Solutions Page | 3
1.2 Solar Water Heaters in India The first serious attempts to deploy the technology were made with the formation of Department of Non-Conventional Energy Sources (DNES) in 1982, though the history of research and pilot-demonstration go back to 1960’s. The total installed collector area increased from 119000 m2 in 1989 to 525000 m2 in 2001 8; and to estimated 3.1 million m2 by December 20099. The growth in installed solar water heater area is shown in figure 1.3. The annual average growth rate in SWH installations during 1995-2008 was 16.8%. Further, this period (1995-2008) can be divided into three phases:
• 1995-2000: The average annual growth during this period was 8.2%. A study reported that in 2001, almost 80% of the SWH installations were in the commercial and industrial sectors10.
• 2001-2004: The average annual growth rate during this period was 20.6%. The market for residential systems became pre-dominant.
• 2004-2008: The average annual growth rate during this period was 24.6%
Cumulative installation of solar water heating systems
0
500
1000
1500
2000
2500
3000
1995 1996 1997 1998 1999 2000 2001 2002 2003 2004 2005 2006 2007 2008Year
X 1000 sq m
8 OPET-TERI & HECOPET: Status of Solar Thermal Technologies and Markets in India and Europe. 2002 9 The data presented is MNRE data. MNRE data is based on voluntary disclosures by SWH manufacturers on sales. There is no third-party inspection system in place to cross-check and verify these claims. In absence of any other data source, this study is based on MNRE data. 10 same as 6
Figure 1.3: Cumulative Installation of Solar Water Heaters in India (1995-2008)

SWH Market Assessment
Greentech Knowledge Solutions Page | 4
UNDP-GEF global solar water heater project is aimed at further accelerating the market development of solar water heating and facilitating the installation of 5 million m2 of installed collector area by 2012. Solar water heaters are also an integral part of the recently announced Jawaharlal Nehru National Solar Mission (JNNSM) of Government of India. The Mission targets to have 20 million m2 of Solar Water Heater collectors by the year 2022 (Table 1.2)
Table 1.2: Capacity addition target under JNNSM
Cumulative Target Addition during the Phase
Phase I (2010-13) 7 million m2 3.45 million m2 Phase II (2013- 17) 15 million m2 8 million m2 Phase III (2017-22) 20 million m2 5 million m2 Source: JNNSM document, MNRE The overarching objective of the UNDP-GEF Solar Water Heating project is to leverage the MNRE National Programme and create markets and widespread demand for solar water heating in different sectors especially in the thus far untapped potential areas. One of the pre-requisite is to gain a better understanding of the current Solar Water Heater market in the country and identify sectors and geographical areas having high potential for SWH. The present study is aimed at this objective and is titled “Market Assessment Studies and Surveys for different Sectors and Demand Segments”.
1.3 Objective of the study The objective is to carry out sector and segment-wise market assessment studies and surveys; to gain an insight into the current market for solar water heaters and, to project realizable market potential in each sector and segment till the year 2022. Following sectors and demand segments were identified for the study:
• Residential buildings • Institutional and commercial sector • Industrial sector • Rural/ small-town sector
SWH Market Assessment
Greentech Knowledge Solutions Page | 5
1.4 Methodology The assignment was divided into three phases: (i) Secondary information collection; (ii) primary survey; (iii) assessment of market potential. Specific tasks are outlined below: Phase I: Secondary Information Collection & Planning of Survey
In this phase, secondary information on solar water heating sector in India was collected. This information consisted of information on manufacturers, products, policies, barriers and markets. This information was collected through literature survey as well as selected interviews with stakeholders and field visits. The collected information was used for planning of survey (phase II) of the study. In consultation with MNRE during project inception meeting held on 28 July 2009, 29 districts were selected for conducting the primary survey. It was planned to conduct 1000-1200 interviews with various stakeholders. Data collection formats, structured interview formats were drafted and pilot-tested and sample size for different categories of stakeholders was finalized. Phase II: Survey (primary data collection)
The primary purpose of the survey and stakeholder interviews was to collect information on:
o Hot water demand (present as well as growth trends) o Fuel/energy source/technology used o Current status of solar water heater markets o Local policies and their enforcement o Gain insights into technical issues that are relevant for application of SWH
(water quality, resource available, space availability, etc) o Case-studies on previous experiences of SWH applications and profile of the
users o Awareness and users perception and feedback about SWH
For conducting the primary survey, 5 regional teams were deployed. Phase III: Assessment of market potential
The work under this phase consisted of: • An appreciation of sector-level issues concerning installation of SWH and
implications of these in terms of SWH market prospects. This is based on the primary survey and stakeholder interviews done.
• Development of hot water requirement norms based on literature survey, primary survey and stakeholder consultations.
• Putting together a full picture of existing stock for different sectors in India and expected growth until 2020

SWH Market Assessment
Greentech Knowledge Solutions Page | 6
• Clarifying the present base of SWH installations in the sector and outlining the alternative scenarios for demand buildup
• SWH installation projection under alternative scenarios till 2020
1.5 Literature Survey on SWH Potential in India In India, very little published information exists on the SWH markets. In recent years, two research studies have presented methodologies for the assessment of SWH potential. Chandrasekar and Kandpal11 have presented a methodology to estimate the potential number of households that can use SWH systems. The methodology establishes a relationship between the seasonal and diurnal variations in ambient temperature at a place and the need of hot water for bathing. This has been used to estimate the expected capacity utilization of SWH for different locations in the country. The income levels of the households directly affect their capacity to purchase SWH. Using the income distribution of households in the country, the capital cost of typical SWH, and the rate of interest on the loans provided to the users to purchase SWH, the potential number of households who can use SWH have been estimated. In one of the examples presented in the paper, it is estimated that 45 million households in India can use SWH. This translates into a potential of 90 million m2 of SWH in the residential sector. Pillai and Banerjee12 have presented a methodology for potential estimation of SWH in an area taking into consideration the factors affecting adoption at the end use level (micro-level factors) and factors that affect the aggregate market (macro-level factors). The methodology can be used to estimate the potential for the individual sectors and also for the target area as a whole. In the paper, the methodology is illustrated for a synthetic area at Pune with an area of 2 sq. km and population of 10,000. The end use sectors considered are residential, hospitals, nursing homes and hotels. The estimated technical potential and market potential are 1700 m2 and 350 m2
of collector area, respectively. The two studies were considered while designing the primary survey.
11 Chandrasekar, B., Kandpal, T.C., 2004. Techno-economic evaluation of domestic solar water heating systems in India. Renewable Energy 29,319–332. 12 Pillai I.R., Banerjee, R., 2007. Methodology for estimation of potential for solar water heating in a target area. Solar Energy 81 , 162-172.

SWH Market Assessment
Greentech Knowledge Solutions Page | 7
1.6 Limitations of the Study Due to lack of availability of published literature and data on solar water heater market as well as in some cases about the future growth trends of certain segments, the study team has made several assumptions while projecting the demand for solar water heaters. We have tried to state these assumptions clearly in various chapters. The readers are advised to consider these assumptions carefully, while interpreting the results presented in the study.
1.7 Outline of the Report The report has nine chapters. Chapter 2 explains the methodology used for the survey, chapter 3 presents the key findings of the primary survey. Chapter 4 deals with the methodology for projecting potential; chapter 5 to 8 presents the assumptions and the results for projection of SWH demand in residential, commercial and institutional buildings, industries and rural sector respectively. Conclusions are presented in Chapter 9. Brief survey reports of 29 districts are presented in Annexure –I, while projections at a glance are provided in Annexure-II. Annexure III gives the summary of LBNL report on “Residential and Transport Energy Use in India: Past Trend and Future Outlook”, which is used as reference for few data inputs while doing projections.

SWH Market Assessment
Greentech Knowledge Solutions Page | 8
SWH Market Assessment
Greentech Knowledge Solutions Page | 9
Chapter 2. Primary Survey Design
2.1 Background In addition to desk research, primary survey among owners of solar water heaters (SWH) as well as among non-owners and interviews of stakeholders formed the main component of work during phase II of the project. For survey, 29 districts were selected, the names of these districts are provided later in the chapter.
2.2 Primary Survey The SWH installations in India are distributed across the following market-segments.
• Households (residential sector) – Urban and Rural • Commercial and institutional buildings e.g. hotels, hospitals, hostels, religious
complexes, etc. • Industries
SWH owners as well as non-owners in each of the above mentioned categories were interviewed using a structured questionnaire. The focus and other details of work, segment-wise, are elucidated below.
2.3 Households At least 18 households were interviewed per district. We tried to follow the principle of interviewing 2 non-SWH owners per every SWH owner because we needed a larger (than owner) sample of non-owners to derive meaningful indications. We did not interview any family consuming under 100 kWh of electricity per month. It was considered a non-candidate for SWH on the economic means ground. We have tried to cover some households, apparently possessing the economic means, in the rural areas and such households are largely non-SWH owners. For SWH owners as well as non-owners, the objective was to get an understanding of consumption of hot water, purpose of water-heating, consumption pattern through the year and present arrangement for water-heating In respect of SWH owners, we looked into SWH experience in terms of hot water availability through the year, specific problems encountered, SWH acquisition process, installation process and after-sale support process. We also secured feedback

SWH Market Assessment
Greentech Knowledge Solutions Page | 10
on SWH in terms of product-usefulness/standard, price, main positive/negatives and suggestions. The SWH owner household interviews in a district were done largely across SWH manufacturers to avoid bias implicit in a single-supplier sample. In respect of non-owners, the focus was on deciphering levels of perception, awareness and exposure to SWH. While we have collected information on the basic profile- economic status, family size- of the respondents, we have not drawn any conclusions from it.
2.4 Hotels & Guesthouses For hotels and guesthouse, in addition to issues cited earlier, the salient points of enquiry were
• Present fuel • Purposes of water-heating- bathroom, kitchen, other uses • Roof suitability and availability for SWH • Availment of soft term loan/incentives in case of SWH owners.
The guideline was to interview 5 hotels/guesthouses per district, 2 of which should be SWH owner.
2.5 Hospital, Nursing Homes and Hostels The approach was identical to the one for hotels and guesthouses. The target was to interview one SWH owner and two non-SWH owner hospitals/ nursing homes per district. For hostels and other establishment, the number of interviews per district is two.
2.6 Industry In the industrial sector, the objective was to cover six industries per district- a mix of SWH-owners and non- owners. The industries prioritized were-dairy, textile, drugs and pharmaceuticals, food processing. During the course of the study we were able to identify some other relevant industries also.

SWH Market Assessment
Greentech Knowledge Solutions Page | 11
2.7 Sampling Frame The sample size per district flowed from budget and time limitation. The objective was to cover a large number of districts (but few interviews per district) rather than do few districts. Given the extremely small size of the sample per district and absence of knowledge regarding the universe – there do not exist any overall state-level statistics on SWH installations, leave alone segment-wise installations or installation-listing, it was not possible to develop a statistically significant sample and hence (statistically significant) conclusions. Nevertheless, it should be borne in mind that this a maiden and most extensive effort across climate zones in India to reach out to SWH owners and non-owners and it did throw up recurring or common messages. District-wise salient observations are provided in chapter 3.
2.8 Stakeholder Interviews The stakeholders, in addition to those listed under the primary survey are as follows.
• State nodal agencies (SNAs) • SWH manufacturers/dealers • Architects and builders • Banks • Municipal corporations • Electricity distribution companies • Pollution control boards
The SNA’s and SWH manufacturers/dealers are the most important stakeholders. We set out to interview the stakeholders with the aid of a checklist of issues. The checklist was meant to be a guide rather than an exhaustive or compulsory coverage framework. We focused on the following issues. SNAs:
• State-level statistics on SWH installations • Database on SWH manufacturers and dealers • SWH schemes/promotional programmes in vogue and details of utilization
and achievement • Perspective on SWH
SWH Manufacturers/Dealers
• Estimate of SWH installations, annual growth, segment-wise break-up and SWH type wise break-up of the market for the given district

SWH Market Assessment
Greentech Knowledge Solutions Page | 12
• Promising geographical areas, segments and reason for this • Significance of SWH in relation to their overall business operations • Understanding of SWH market drivers/barriers and competition • Perspective on SWH, including sale projection for the city
Other Stakeholders We restricted ourselves to specific issues, while holding discussions with architects/builders, banks, municipal corporations, electricity distribution companies, etc.
2.9 Geographical Coverage The approach has been to select districts from each climatic zone:
• Hot – dry • Composite • Warm and humid • Cold • Temperate
We have chosen 29 districts in consultation with MNRE and PMU (Figure 2.1). A gamut of variables underline district-selection-existing hub of SWH manufacturing, new policy initiative, emerging market, tourist character, solar city status. We had put together a demographic-cum- economic profile of individual districts in India. However, our primary survey, as we saw, is not built on the edifice of statistical significance and so it was considered appropriate to follow practical considerations rather than a statistical approach. The district coverage, it may be seen from the map, is quite dispersed.

SWH Market Assessment
Greentech Knowledge Solutions Page | 13
Figure 2.1: Selected Districts for Primary survey

SWH Market Assessment
Greentech Knowledge Solutions Page | 14
2.10 Work Organization For effective conduct of the fieldwork, primary survey and stakeholder interview work was divided among regional partners of the consultant consortium. The work was carried out as follows. Organisation Office Location Districts covered GKS New Delhi Ludhiana, South Delhi, Gurgaon, Leh,
Shimla, Haridwar, Agra FVC Ahmedabad Ahmedabad, Jaipur, Nagpur, Pune,
Thane, Indore NBIRT Guwahati, Kolkata and
Agartala Gauwahati (Kamrup), Shilong (East Khasi Hills), Agartala (West Tripura), Darjeeling
Varun Techno Infrastructure (P) Ltd., Bhubaneswar
Bhubaneswar Kolkata, Ranchi, Sambalpur, Raipur, Bhubaneshwar, Patna
AURORE
Auroville Hyderabad, Bangalore, Coimbatore, Cochin (Ernakulam), Chennai, Pondicherry

SWH Market Assessment
Greentech Knowledge Solutions Page | 15
Chapter 3. Primary Survey Results During the primary survey, approximately 1000 interviews were conducted in 28 districts. Summary district reports have been prepared for all the surveyed districts and are presented in Annexure I. Sector-wise main findings are presented in this chapter.
3.1 Residential Sector Residential sector is the largest sector both in terms of installations as well as sales. As per industry estimates, currently, almost 70-80% of the SWH sales occur in the residential sector. As mentioned in chapter 1, in the year 2001, almost 80% of the SWH installations in India were in the commercial and industrial sectors, since then, residential sector has overtaken commercial and industrial sectors and has become the main driver of growth of SWH in India. It is estimated that in 2009 around 7 lakh households (around 0.4% of the total households) in the country were using SWH systems13. Almost 60% of these households are located in two states - Karnataka and Maharashtra. More than 95% of these households are located in the urban areas.
3.1.1 Growth of SWH in Residential Sector
The main reasons for growth in SWH in residential sector in recent years are:
• Growth in new housing: During 1991-2001 period, 54 million new housing units were added. In recent years, the demand for new housing has shown rapid increase. This is attributed to: increase in disposable incomes, easy availability of credit, trend towards smaller household size, and urbanization. A recent study predicts the demand for new housing units to range between 6.9 million to 9.7 million per year for the period 2005-203014.
• Rising income and increased propensity for consumer durables:
India has been experiencing consistent economic growth since early 1990’s, this is reflected also in the household incomes. The number of households having an annual income > Rs 5 lakh/ year has been estimated to grow 10 times -- from around 1 million households in 1995-96 to 10 million
13 Assuming a) 70% of the total installed 3 million m2 is in the residential sector b) average size of a SWH systems is taken as 3 m2 14 Deutsche Bank Research. Building up India – Outlook for India’s real estate markets, May 8, 2006

SWH Market Assessment
Greentech Knowledge Solutions Page | 16
households in 2009-10 15 (figure 3.1). Increase in household incomes has resulted in increased penetration of consumer durables in households (Table 3.1) e.g. the penetration rate of cars has been estimated to triple from 3% in 2001-02 to over 9% in 2009-10. It is fair to assume that the demand for SWH in the residential sector has been fuelled by rising incomes.
0
2
4
6
8
10
12
1995-96 2001-02 2005-06 2009-10
No.
in h
h ha
ving
ann
ual i
ncom
e >
Rs
5 la
kh/y
ear(
mill
ions
)
Figure 3.1: No of households having annual income > Rs 5 lakh (2001-02 prices)
Table 3.1: Penetration (%) in households of consumer durables
1995-96 2001-02 2005-06 2009-10 Cars 1.6 3 5 9.14 Motorcycle 2.9 7.1 14.8 28.3 Refrigerators 8.6 13.4 16.1 22.5 White Goods 14.9 24.7 31.9 45.2
Source: NCAER (2005): The Great Indian Market
• Arrival of Evacuated Tube Collector (ETC) & improvements in SWH
supply chain: Since 2000, the arrival of ETC has had a significant impact on the SWH market. As per MNRE data, in the year 2008-09, ETC constituted more than 30% of the total sales. On July 1, 2009, there were 61 MNRE approved ETC suppliers and manufacturers. The arrival of ETC has resulted in expanding the SWH supply chain significantly. It has also resulted in reduction in costs of the domestic SWH systems.
15 NCAER (2005). The Great Indian Market.

SWH Market Assessment
Greentech Knowledge Solutions Page | 17
3.1.2 Factors Influencing SWH Market in Residential Sector
One of the main objectives of the primary survey was to gain a better understanding of the factors influencing market for SWHs. The main findings are summarized below:
Demand for hot water: Demand for hot water for bathing shows significant variations across regions. The survey tried to capture this by collecting information from households on the number of months in a year when they use hot water for bathing. The results are shown in table 3.2. Some of the earlier studies have tried to link hot water demand with climatic factors. The primary survey results show that the demand for hot water not only depends on climatic factors but also depends on human behaviour (which is influenced by culture and traditional practices). The survey found that apart from cold and moderate climatic regions, which show a high demand for hot water (> 8 months/year) for bathing. There are certain areas in the country which do not fall under cold and moderate climate regions but exhibit high use of hot water e.g. parts of Maharashtra, Kerala, Tamil Nadu where surveyed households responded that hot water is used for more than 8 months in a year. Higher demand for hot water results in better capacity utilization and hence has a positive effect on SWH market. So it does not come as a surprise that the two largest urban residential markets are Bangalore and Pune. Type of house: Low-rise independent houses with clear ownership of the roof offer most favourable conditions for installation of SWH. A majority of existing SWH installations fall under this category. In recent years, SWH have been installed on multi-storey apartment buildings. Some of the prominent multi-story systems are located at Pune, Thane, Bangalore and Gurgaon. Despite some well-functioning SWH systems in multi-storey apartment buildings, the general perception amongst stakeholders is that SWH are more suitable for independent house. Some of the apprehensions about the feasibility of a centralized solar water heating system in multi-story buildings are related with:
• Inadequate area on the roof for installation of SWH. • Non-availability of technical solutions to ensure equitable distribution,
metering of hot water • Problems associated with the management of a community system.
SWH supply chain: Leaving out some of the more evolved SWH markets in Karnataka and Maharashtra, the number of active dealers of SWH in surveyed districts was small (ranging from one to four per district). Most of these dealers were found to be small and part-timers, pursing SWH business along with other businesses. Weakness in supply chain is a significant barrier in increasing penetration of SWH. Several of the SWH owners (particularly in low-density SWH areas) reported dissatisfaction by the service provided during installation, commissioning and maintenance.

SWH Market Assessment
Greentech Knowledge Solutions Page | 18
Electricity supply situation: Electric geysers were found to be the most common water-heating device in the surveyed households. As a result, electricity shortages particularly power-cuts during morning hours influences the demand for SWH. During survey, it was found that in some states e.g. Karnataka, UP, Bihar and Punjab, the SWH market is influenced by poor electricity supply situation. Awareness about SWH : Leaving out states like Karnataka and parts of Maharashtra which have relatively high penetration of SWH, general awareness about SWH was found to be low in rest of the country. Though people are familiar with the concept, the awareness on technologies and products was found to be very low. Household income: SWH is a product owned by affluent households. 76 % of the surveyed SWH owner households owned a car and thus it can be concluded that a majority of the households owning SWH fall under the ‘rich’ and ‘striver’ categories as per affluence layers distribution based on household income by NCAER16. New v/s existing Houses: The interviews with SWH manufacturers and dealers indicate that around 80% of the SWH sales are for new housing and only 20% can be attributed to existing/old housing. The urban centres showing large growth in upper and middle class housing are potentially large market for SWH. Policy: The highlights of the present policy environment are as follows:
• Several of the municipal corporations have issued orders making SWH use compulsory for new multi-story housing and houses constructed on plots having area more than 500 sq. yards.
• A few of the municipal corporations are offering rebate in property tax • A few of electricity distribution companies offer rebate in monthly electricity
bills. • Several states offer upfront subsidy for residential systems • IREDA through banks is operating an interest subsidy scheme to offer
concessional finance for installation of SWH.
The impact of policy measures is mixed. Implementation of mandatory regulations is weak across cities, if implemented rigorously it has the potential to become an important driver in market development. Upfront subsidies by states do assist in development of market in the initial stages but the process of availing subsidy is generally long and cumbersome and in the states where it is offered only a fraction of the SWH owner households are availing subsidies. Rebate on property tax is being offered by only few cities, the amount of rebate available is small; the effectiveness of this instrument is yet to be tested. Rebate in electricity bills is a useful instrument to
16 ‘Rich’ households have annual household income> Rs 1 million; ‘Strivers’ have annual household income between Rs 0.5 – 1 million.

SWH Market Assessment
Greentech Knowledge Solutions Page | 19
promote SWH, however, it is being offered in very limited number of cities. Only a few banks and financial intermediaries are putting effort in implementing IREDA interest subsidy scheme. The scheme is being implemented successfully in some pockets; however, there is a scope to improve implementation of this scheme.
3.1.3 SWH Size
Generally the size of a domestic SWH installation is taken as 100 lpd. However, the average size of solar water heating system in surveyed SWH owner household was found to be 164 lpd (by dividing the cumulative capacity (lpd) by number of households). Thus for calculating number of SWH household and for projecting demand for SWH, the average collector area of a domestic SWH system is taken as 3 m2 collector area.
3.1.4 Satisfaction with SWH
One of the heartening features of the survey was that more than 80% of the SWH owner households exhibited satisfaction with the performance of the SWH. However, the degree of satisfaction with the after-sales service was much lower, and this was an aspect on which the respondents wanted improvement. The degree of satisfaction was lower in some of the multi-storey residential buildings where SWH has been installed by the builder under the Municipal Corporation mandate. Some of the occupants of Government housing also showed dissatisfaction. Thus it can be concluded that in cases where the user households have not been directly involved in the buying decision of SWH, special efforts are required to educate and train them in the use of SWH.

SWH Market Assessment
Greentech Knowledge Solutions Page | 20
Table 3.2: Data presented for surveyed districts on some of the key parameters that affect SWH
market in the Residential Sector
District Hot water demand in middle & high income hh (Months/year)
State electricity shortage % (2008-09)
SWH Supply chain
Shimla ≥9 0.2 Poor Gurgaon 4-5 8.5 Poor Agra 4-5 20.9 Poor Ludhiana 4-5 10.6 Fair Delhi 4-5 0.6 Fair Haridwar 4-5 1.2 Poor Coimbatore 8 7.9 Good Bangalore ≥9 6 Good Chennai 8 7.9 Fair Pondicherry 9 12.3 Fair Hyderabad 9 6.8 Good Kochi 8 11.8 Fair Thane ≥9 21.4 Good Ahmedabad 4-5 9.8 Fair Indore 5-6 17.2 Fair Jaipur 4-5 1.1 Fair Nagpur 5-6 21.4 Good Pune 8 21.4 Good Patna 4-5 17.6 Poor Ranchi 5-6 4.7 Poor Bhubaneswar 5-6 1.5 Poor Sambalpur 5-6 1.5 Poor Raipur 4-5 2.6 Fair Guwahati 9 10.6 Poor Darjeeling 7 3.2 Poor Kolkata 6 3.2 Fair Shillong ≥9 19.1 Poor Agartala 4-5 9 Poor
Source: Primary survey and Central Electricity Commission.

SWH Market Assessment
Greentech Knowledge Solutions Page | 21
3.2 Commercial and Institutional Buildings
3.2.1 Hotels
The major observations are as follows. SWH Awareness and Exposure The awareness on SWH, among hotel owners/managers, is good across hotel-standards. The owner of a budget hotel, in terms of SWH-concept and to some extent exposure, is nearly as aware as that of a General Manager of a luxury hotel in south, west, north and, to some extent, in the eastern region. Likewise, SWH installations exist across hotel standards. Thus, hotel-standard, other things being equal, is not a deterrent to readiness for SWH. Poor Radiation Days in a Year Unlike households, hotel/guesthouses are not discouraged by cloud cover or low radiation for a few days or weeks in the year. Thus, monsoon or fog in winter in itself is not the reason for hotel/guesthouses to stay away from SWH. Roof Availability The roof-availability for SWH is an issue mainly for hotels/guesthouses which do not own the roof. The roof-ownership, in turn, is linked to the hotel-size. Based on consultation with hotel managers/civil engineers, we have utilized a premise that hotels/guesthouses having 15 room upward capacity own the roof. There is the trend, among centrally air-conditioned hotels, of setting up cooling towers, hydro equipment, satellite dish antennas on the roof. Despite this trend, there remains adequate space to install SWH to meet the hot water requirement in most of such hotels. A six-storied, 200 room five-star hotel commissioned recently at Ahmedabad, has utilized 75% of its roof for the installation of other equipment, 20% of its roof space is enough to meet 100% of its hot water requirement through SWH installation. Though it should be mentioned that roof availability could be an issue in some of the high-rise (tower) hotels. Present Fuel Use The hotels having a room capacity upward of 30 rooms largely utilize liquid fuel (or gaseous fuels in cities having piped natural gas supply) for water-heating. The small hotels- room capacity up to 30 rooms-rely on electricity or wood. It is attractive, from a payback period perspective, for electricity and liquid fuel dependent hotels/guest-

SWH Market Assessment
Greentech Knowledge Solutions Page | 22
houses to adopt SWH. It is, only small wood-using hotels/guest-houses, existing on a limited scale, for which SWH is less attractive. Hotels located in areas facing severe power shortage and long hours of power cut often opt for SWH. During field survey a hotel owner in Begusarai in Bihar has opted for a 2000 m2 SWH system primarily due to non-availability of electricity. Policy Environment: SWH for Hotels/Guesthouses The highlights of the present policy environment are as follows.
• A municipal corporation order making it compulsory for new hotels to install SWH is in force in many cities. Norms, under the order, for SWH sizing, are lax in most cities. Implementation of mandatory use is weak across cities
• A scheme of loans at the concessional interest rate of 5% pa for SWH is being implemented by IREDA but its delivery and utilization are low-key.
• There is accelerated depreciation provision for commercial hotels/guesthouses. The awareness of the accelerated depreciation provision among owners of modest hotels/guesthouses is low and when informed, the appeal seems unexciting.
Other Issues The hotel/guesthouse industry expressed the following wish-list
• Lowering of SWH capital cost • Technical solution of the problem of somewhat-staggered-through-the-day
demand for hot water • SWH delivering hot water round the year
3.2.2 Hospitals
The major observations are as follows: SWH Awareness and Exposure The awareness on SWH, among private hospital owners, is mixed across hospital standards/size. The knowledge of owners of small private hospitals is less-favourable- for-SWH climatic zones, in most instances, the knowledge is limited to existence of SWH product.

SWH Market Assessment
Greentech Knowledge Solutions Page | 23
Poor Radiation Days in a Year Unlike households, hospitals are not discouraged by cloud cover or low radiation for a few days or weeks in the year. Thus, monsoon or fog in winter in itself is not the reason for private hospitals to stay away from SWH.
Roof Availability
For government hospitals, roof is clearly available for SWH installation. The roof in respect of private hospitals appears substantially available but the precise position is not clear. Most private hospitals having 15 patient bed upward are assumed to possess roof for SWH installation. In respect of up to 15 bed hospitals, roof availability is mixed because many of these hospitals are independent buildings with own roof. We estimate that 10% to 15% of private hospital beds cannot be serviced by SWH because of roof availability. The new private hospitals, regardless of size and ownership of roof, can be mandated to install SWH through working out access to the common roof, since a policy of compulsory SWH for hospital is already in vogue in principle.
Present Fuel Use
The hospitals, barring large private hospitals- use electricity for water-heating. The cost of water-heating, therefore, is high. The large hospitals generally have liquid or gaseous fuel (Furnace oil/LPG/LDO/Gas) based boilers and hot water generation systems.
Policy Environment: SWH for Hospital
This is identical to one for hotels- compulsory SWH for new hospitals, concessional interest loan and accelerated depreciation. Other Issues Unlike hotels, it is not too difficult, barring luxury hospitals, to regulate hot water timing, a positive for SWH installation. We came across an SWH- dependent hospital where the system is turned off in summer. Many owners of small/medium hospitals analyze the techno-economics of SWH at great length; the SWH suppliers find it difficult to cope with the demands they raise in terms of time and effort. In several of the large hospitals which are spread over a large area, extensive piping is required for supplying hot water from a central facility and hence the cost involved in piping through a centarlised SWH emerges as a major issue.

SWH Market Assessment
Greentech Knowledge Solutions Page | 24
3.2.3 Hostels
The demand for hot water from hostels emanates largely for bathing purpose. There is hot water required for kitchen-cleaning but this is small compared to the bathing demand. The interviews of SWH owners and non-owners, among hostels, highlighted the following.
• Roof availability is almost a non-issue, it is available. However, security and
upkeep of SWH installations may demand care in the light of potential student -activity on the terrace.
• It is possible to maximize SWH performance because regulating hot water supply to morning hours is easy.
• It is in summer that hostels have low occupancy. The vacations, thus, do not hurt, demand for hot water.
• From the pay-back period perspective, the business case should assume 150 days of hot water demand per year.
• The common method of water-heating is electricity. SWH, therefore, offers significant scope for cost-saving. The recourse to individual electric heating rods, inefficient and electricity-intensive, is considerable, enhancing further scope for saving.
• The decision-making, in case of hostels, managed by registered societies/ trusts, rests with key managing trustees. They are generally far removed from everyday management of hostels and will have to be educated.
• Many hostel-owners are sensitive to capital expenditure proposals, notwithstanding recurring saving. This, combined with 150 days/year hot water demand business case, makes a strong financial incentive, necessary to convert potential into actual demand.
• The promotional effort should target both- hostel owners and students.
3.3 Industries
3.3.1 Dairy
• In the organized dairy industry, the milk collection and processing is generally
three stage process. The milk is collected at the milk collection centre. It is then transported to the chilling centre and then to the dairy processing plant. In some cases, milk is directly transported from the collection centre to the dairy processing plant.
• Most of the hot water requirements occur at the dairy processing plant. There may be some requirement of hot water at collection and chilling centre for

SWH Market Assessment
Greentech Knowledge Solutions Page | 25
cleaning of vessels. At the dairy processing plant the practice is to have a central boiler to produce steam and then use steam to produce hot water.
• It is a common practice in the dairy industry to use petroleum fuels for steam generation in boilers.
• SWH can meet only a small part of the total thermal heating requirement. Four cases of use of SWH in dairy processing plants were studied. The SWH installation varied from 1500 lpd to 70000 lpd. The petroleum fuel replacement due to use of SWH in these four cases is estimated to vary between 1-5%.
• Space for SWHs is not a very big constraint for dairies as compared to several other industries. As water treatment facilities already exist for supplying boiler feed water, water quality is also not an important issue. Rapid growth in organized dairy opens a significant opportunity for SWHs.
• Dairy is one of the industrial sectors that has seen the largest number of SWH installations. Apart from major players in the cooperative dairy e.g. Amul, Mother Dairy, Mahanada, etc., large private players like Nestle also has fairly good exposure to SWH applications. While the application of SWH at dairy processing plants is fairly widespread, we were informed the presence of several hundred small (200 lpd) SWH installations in milk collection centres in Punjab.
3.3.2 Textile Industry
• Textile industry is one of the largest industrial consumers of process steam. • The number of SWH installations in textile industry is very low. Most of the
existing installations are for boiler feed water heating. • During the field survey, some textile units located at Ludhiana, Ahmedabad,
Gurgaon were visited. The main barriers in deployment of solar water heaters in textile industry are: o Use of low-cost solid fuels like biomass and coal which results in longer
pay-back periods for SWH. Relatively smaller number of textile mills use petroleum fuels.
o A large number of textile dying units come under unorganized and small-scale sector, for them both space and ability to organise funds for SWH systems is a big issue. Moreover, textile dying industry in India is currently faced with the issue of setting-up treatment plants for effluent water, so SWH is not a priority for them.

SWH Market Assessment
Greentech Knowledge Solutions Page | 26
3.4 Rural Areas
• Hot water requirement in rural areas is mainly for following applications:
o Households, particularly those in cold and moderate climate region. Based on the primary survey data and data available in some earlier studies, average hot water requirement range from 15 to 110 litres per day.
o Primary health centers o Dhabas o Rural industries (silk reeling, textile/yarn dyeing, milk collection centers,
puffed rice making, rice mills, etc.)
• At present, use of SWH in rural areas is very limited. During the primary survey, some instances of use of conventional SWH was found in high-income rural households in parts of Karnataka, Kearala, Punjab, Himachal Pradesh and Uttarakhand. The main barriers in use of conventional SWH systems in rural areas are: o High initial cost of the system o Longer pay-back period as the fuel replaced is low-cost biomass fuel o Lack of piped water supply o Lack of SWH supply chain
3.5 Interviews with Stakeholders SNAs For SNA’s, SWH is one of the products, presumably less important than other ones in the basket. Hence, we received somewhat low-key insights and less specific suggestions on SWH. Some of the SNA’s were very vocal about the need for a comprehensive quality control mechanism for the SWH systems. SWH Manufacturers and Dealers The SWH production industry in India is fragmented and so respondents articulated their observations and ideas based on a localized/regional perspective. We did come across few bold initiatives in terms of business model and technology-adoption but sensed an overall tendency on the part of manufacturing fraternity, understanding, to view the sector in incremental gain rather than quantum jump terms.
SWH Market Assessment
Greentech Knowledge Solutions Page | 27
Other stakeholders The architects and builders have been quite forthcoming, particularly on the subject of practical difficulties in implementation of mandatory SWH regulations and SWH suitability for multi-storied buildings. The bank response was sharply divided. Active SWH-financing bank managers articulated their views clearly; most of the others almost pleaded ignorance. The agenda vis-à-vis municipal corporations somewhat overlapped with that for SNA’s. We inquired into the status of compulsory SWH policy and its implementation. Our effort to hold discussion with officials of electricity distribution companies and pollution control boards did not yield significant results.

SWH Market Assessment
Greentech Knowledge Solutions Page | 28

SWH Market Assessment
Greentech Knowledge Solutions Page | 29
Chapter 4. Approach to Demand Projection
4.1 Approach
SWH, introduced in India in 1980’s, is at the beginning of the growth phase in terms of product life-cycle.
The radiation availability and demand for hot water are the primary drivers of demand for SWH. In real life, there is a range of variables- affordability, growth in urban housing, energy price-hike, improvement in supply chain, industrial demand for energy-saving devices, a policy mix of compulsion and incentives for SWH installation- which have shaped the demand for SWH from time to time. The empirical data, over a period of time, in terms of SWH sale, its region-wise and segment-wise break-up, and influence of relevant variables does not exist. The present installations are concentrated (65%) in Karnataka and Maharashtra; compounding the inadequacy of data required for all-India model-building.
In view of this, we have adopted the following approach to demand projection.
• Utilizing learning from the primary survey and stakeholder interviews • Putting together the present configuration of SWH market (2009) • Prioritizing market- segments for SWH • Estimating the present size of market- segments in terms of hot water
requirement and projecting future hot water requirement. • Estimating SWH growth-segment-wise and state-wise under each scenario • Building alternative market scenarios in terms of performance of key
parameters which drive SWH growth • Developing SWH growth- estimates, segment-wise, from 2010 to 2022
The estimation of market-segment volume entailed determining the present stock of customer- base under each segment, projecting growth in such base and establishing hot water consumption norms. A scenario is envisaged to be a composite, encompassing demographic, economic, demand-condition, supply-condition, product/technology, industry-structure, policy and promotion parameters. The objective of scenario building is two-fold. First, to project demand corresponding to conditions described under a scenario. Secondly, to highlight action which the major stakeholders need to organize to accomplish demand under a given scenario.

SWH Market Assessment
Greentech Knowledge Solutions Page | 30
Three alternative scenarios are realistic (most likely) and two less likely -- optimistic and pessimistic scenarios. The demand projection, thus, needs to be viewed in conjunction with a scenario because it is linked to developments summarized under the scenario. We have utilized the following concepts for estimation.
• SWH penetration: This denotes % of total hot water demand which will be
met through SWH for a given segment (e.g. hotel, hospitals) in a concerned year. In case of households, it is the % of households owning a SWH.
• CAGR: This is annual growth percentage; treating the immediate previous year as the base.
Our estimates in terms of SWH penetration and CAGR, for a given segment under the concerned scenario, recognizes the following.
• Historical trends and best-case (Karnataka) performance • Assessment of potential based on growth of a given segment and its response
to SWH; considering payback period prospect, roof- availability, etc. • Variations in SWH penetration vis-à-vis new and old buildings because new
buildings are an easier proposition than old ones.
In addition to above work, we have used benchmarks. Electric geyser for the residential segment is a somewhat comparable product. We have used the electric geyser demand and its projection as a broad benchmark to put our projection in proper perspective.
We have incorporated a box on water purifier market to illustrate how technology/product/value proposition conditions can accelerate demand build-up. We have elucidated the learning from primary survey and stakeholder interviews for a given segment under the concerned chapter on demand projection for the segment. Likewise, projection regarding growth of housing, hotel-rooms, hospital-beds and other segments and water-consumption norms for these segments are given under the concerned chapters.
4.2 Present Configuration of SWH Market
This has been discussed briefly in both chapter 1 and 3. To recap, SWH market in India has grown as follows.

SWH Market Assessment
Greentech Knowledge Solutions Page | 31
• 1995-00 : 8.23% • 2000-04 : 20.6% • 2004-08 : 24.6% • 1995-2008 : 16.8%
The growth since 2000 has come largely from the residential and commercial sectors. In the absence of any available information on the break-up of the market, we have used the information gathered during stakeholder interviews to build-up an estimated segment-wise breakup of existing installations. This is presented in Table 4.1. Table 4.1: Estimated Breakup: Functional SWH Installation Till 31st December 2009-3.1 million
m2
Sector million m2 Residential (80%) 2.108 Hotels (6%) 0.158 Hospitals (3%) 0.079 Industry (6%) 0.158 Other (Railway + Defence + Hostel + Religious places, other) (5%) 0.132 Total 2.635
* It is assumed that out of the installed base of 3.1 million m2, 85% of the installed SWH are functional Similarly for our projection model, we needed a segment wise break-up of sales during 2009. The estimated break-up of sales in 2009 is given below.
Table 4.2: Estimated Breakup: SWH Sales during 2009- 0.55 million m2
Sector million m2 Residential (77%) 0.425 Hotels (5%) 0.027 Hospitals (3%) 0.016 Industry + Others (15%) 0.082 Total 0.55
We would like to stress that these are rough estimates based on information gathered during the primary survey. To get a clear picture on the segment wise installation and sales network, there is a strong case for conducting a census of the existing SWH systems and also to put in place an information gathering system to collect and compile information on new systems being installed from all manufacturers and installers.

SWH Market Assessment
Greentech Knowledge Solutions Page | 32
4.3 Alternative Scenarios Radiation or resource availability and demand for hot water are the main determinants of pay-back period for SWH. The value of these parameters, across regions, will remain largely unchanged over the projection period. We, therefore, do not need to assume alternative values. The existing base of SWH in a given region already captures the impact of these parameters and we are building projection from the base. It is the other variables in terms of economic growth, industry-structure, supply chain, policy and promotion in respect of which alternative conditions are possible and hence the scenarios are built in terms of these. The scenario encompasses the following variables.
• Growth in GDP • Product/technology/value proposition • Industry structure and distribution • Solution package for multi-storey buildings • Policy • Promotion
An elucidation of present position with reference to above-cited variables is essential to understanding of alternative scenarios. This is done below.
4.3.1 Growth in GDP
This has multiplier effect and impacts disposable income, income-distribution and growth of various SWH market segments. Indian GDP, growth over 1999-2009 has averaged 7.1% (CAGR), according to Central Statistical Organization. We expect 7% CAGR in GDP growth under realistic or most likely scenario over 2010-2022 period.
4.3.2 Product Technology and Value Proposition
On the product/technology side, the following is pertinent.
During last decade, there have not been any major product/technology breakthroughs in the Indian SWH market, in terms of heat-collection under low radiation conditions, overnight temperature-loss, distribution piping, available standard sizes, space- intensity relative to capacity, capital cost per unit of output. ETC has been the most significant technological development; leading to marginal lowering of capital cost and significant market-expansion. Most of the ETC tubes are being imported from China.

SWH Market Assessment
Greentech Knowledge Solutions Page | 33
Enamel-coating of tank; intended to plug leakage, facilitate use of pressure- pumps and enable recourse to mild steel is in the incipient stage in India, with one manufacturer setting-up a manufacturing facility. It will upscale the product and to some extent the capital cost. The unit-price, depending on whether it is ETC and FPC, is in Rs. 8000 to 10000 and Rs. 12000 to 15000 per m2 price-band. It has moved up in line with spurt in commodity prices in general and copper and steel in particular. In terms of value proposition, the manufacturers have positioned it as an electricity or recurring cost-saving (water-heating) consumer durable for the residential sector-mostly owners of independent house. There is a mild sub-text of environmental concern and status symbol. The cost of typical household system, depending on size and specifications, is in Rs. 20000 to Rs. 60000 range, for 100 to 300 lpd systems. However, unlike durables, it is not available on hire purchase basis. A recent effort by a producer to sell it on pay-per-use appears to be a promotional effort rather than an enduring value proposition. Under most likely scenario, we expect incremental improvements in above condition. Under optimistic scenario, we anticipate a quantum-improvement in terms of product-feature, technology, pricing value proposition. It is difficult to outline the contours of such improvement. However, case study on water purifier (please refer chapter 8) market amplifies how innovative product-features, pricing, distribution and value proposition can lead to market expansion. A deepening of the market through offer of product-categories and price-points and fresh value proposition is the crux of caselet in the water purifier case study, denoting optimistic scenario. Under pessimistic scenario, we expect continuance of present condition impact-making market-expansion.
4.3.3 IndustryStructure and Distribution
The manufacturing remains concentrated in Southern India and Maharashtra. It remains a fragmented industry-113 reporting producers/ suppliers (excluding a significant number of non-reporting ones). No manufacturer seems to have reached 15% market share. All manufacturers, consequently, suffer from limitation in terms of capacity to invest in product development, geographical outreach, dealer-network, advertisement and promotion spend and intensity of after-sale support. The manufacturer brand-equity is limited to few players and this, too, in regions where SWH market is concentrated. A few well-known companies are engaged in SWH-manufacturing but they have not built strong SWH- specific brand equity.

SWH Market Assessment
Greentech Knowledge Solutions Page | 34
In parts other than Karnataka and Maharasthra where we carried out the survey the number of active dealers per district does not exceed four and most- SWH- owners are not aware of all dealers; reducing scope for choice of dealers to one or two. The customers in areas other than Karnataka and Maharashtra pay 15% to 30% extra on account of freight, intermediaries and overall imperfect market. The incidence of entry/exit among dealers is high. For several dealers, SWH is one of the product-lines; reducing its significance in their own business mix. Under realistic scenario, we expect significant improvement in supply chain e.g., a few players exceeding 20% individual market-share; establishing multi-location assembly facility and select brands commanding large scale recognition and customer- confidence. Under optimistic scenario, we expect still better conditions e.g., large network of well- advertised dealers, easily accessible demonstartion points, exchange offers (against malfunctioning electric geysers). Under pessimistic scenario, we anticipate marginal improvement in present condition.
4.3.4 A Solution for MultiStorey Buildings
The residential construction in urban India is more and more shifting towards multi-storey apartments. Though we could not find present break-up and future trends in multi-storey housing v/s independent housing, we could get information on growth of elevator market in India, which supports the shift towards multi-storey apartments. The elevator market has grown by 15-25% since 2001. The current market size of elevator market is around 30000 units per year. It is estimated that 70% of the sales is for residential buildings17. As briefly mentioned in chapter 3, there are challenges associated with SWH solution for multi-storey residential buildings. We presume the policy of mandatory provision of SWH as being pursued by several municipal corporations would continue but this will not be adequate. A product/proposition which addresses the issues of terrace-availability, floor space index (FSI), collective ownership, fair distribution of hot-water among building occupants, maintenance, and such other matters through a process of development, piloting, scaling up and stakeholder involvement is the main priority. Under realistic scenario, we presume this will be addressed effectively. Under optimistic scenario, we expect stringent compulsion backed by an additional and exclusive financial incentive for multi-storey building.
17 http://www.constructionweekonline.in/article-5315-destination_upward__in_focus_july_2009/ accessed on 29 December 2009.

SWH Market Assessment
Greentech Knowledge Solutions Page | 35
Under pessimistic scenario, we anticipate marginal improvement to the present policy/product package for multi-storied building.
4.3.5 Policy
The present policy consists of following ingredients.
• Loan @ 2%, 3% and 5% respectively to residential, institutional and industrial/commercial customers. Interest free loans to residential customers in selected regions of India.
• Capital subsidy equivalent to upfront interest subsidy to institutional and industrial/commercial customers who do not avail of concessional interest loan
• Capital subsidy @ Rs.6000 per 100 lpd, in addition to concessional interest loans, to residential customers in few states, e.g., Delhi
• Accelerated depreciation @ 80% to profit-making industrial/commercial customers
• Rebate in electricity bill, @ Rs. 50 to 150 per month, to residential customers in some cities
• Rebate in municipal property tax @ 6% to 10%, to SWH- owners in few Indian cities
• BIS standards established for FPC producers and a system of MNRE approval for ETC producers.
• Incorporation of SWH among building components covered under Energy Conservation Building Code (ECBC)
• Soft loans to SWH manufacturers for improvement in technology and expansion of production facilities
• Municipal Corporation regulations in several cities, making installation of SWH compulsory for o Housing units above a cut-off size o hospitals & nursing homes, o hotels, lodges and guest houses, o hostel, school, colleges, training centers and other institutes, o barracks of armed forces, paramilitary forces and police
The present policy, at the ground-level, has been implemented on a low key. While it has created an atmosphere favourable to SWH growth, the incidence of SWH- installation as a consequence of legal compulsion has remained limited to Banglore, Thane and Kalyan. The interest/capital subsidy entailing installations form a small percentage of total installations or annual installations. Under realistic scenario, our key premises for policy action are as follows.

SWH Market Assessment
Greentech Knowledge Solutions Page | 36
a) Mix of Mandatory Regulations, Guidelines, Best Practices and Incentives: MNRE, city governments, builders, architects, BEE will work together to formulate and implement a mix of SWH- favouring legal/administrative mandatory regulations, guidelines and best practices for residential and non-residential buildings at least in high-potential cities. A large-number of the cities covered under the primary survey fall under the category of high-potential cities. We presume the mix of mandatory regulations and best practices will be accompanied by a financial incentive for new residential buildings. The new non-residential buildings under hotel/hospital/hostel segments will require lesser financial incentive. It is imperative that the incentive reaches most customers. Likewise, it is important that multiple incentives are largely merged into a single, powerful incentive. The quantum of incentive will depend on the price-points which industry follows. UNDP-GEF project has commissioned separate studies on policy and regulatory issues and hence we are not proposing a specific quantum of incentive but the other contours of incentive policy are explained below. b) Regional Variation in Incentive Quantum We expect regional variations in the quantum of incentive because pay-back period varies across regions. c) Incentive Linked to Building Vintage For old buildings, we assume, under realistic scenario, that the financial incentive would be, significantly higher than for new buildings. Under optimistic scenario, the incentive quantum will be larger and more importantly, it will be delivered through electricity distribution companies. We assume electric distribution companies will become, under this scenario, the main vehicle for promotion of SWH. Under pessimistic scenario, we expect marginal fine-tuning of present compulsion-cum-incentive policy.
4.3.6 Promotion
The advertising and promotional effort by SWH producers, dealers, MNRE, SNA’s and others is now negligible in terms of spend, outreach and impact. MNRE has already commissioned a study on communication strategy. Under realistic scenario, we expect all stakeholders to spend, over 2010-15 period, 3.5% to 5% of the projected turnover for advertising and promotion. Under optimistic scenario, this would be in 7% to 8% range.

SWH Market Assessment
Greentech Knowledge Solutions Page | 37
4.4 Conclusion The details of the three scenarios are presented in the table below (table 4.3). Sector-wise assumptions made for projection and projection results are presented in the following chapters.
Table 4.3: Summary table on Scenarios for Potential Projection
1.0 Basic Parameter: Radiation Resource and Present Demand for Hot Water Key Premise: Present level of SWH installation in a state captures these. The present level is the base for growth projection till 2020. Radiation and demand for hot water are stable parameters; unlikely to change significantly over the projection period.
2.0 Other Parameters
2.1 GDP Growth 2010- 22 (CAGR) Realistic: 7%, Optimistic: 8.5%, Pessimistic: 5.5%
2.2 Product, Technology, Value Proposition Present: Two technologies; one considered less suitable for non-residential buildings. No major breakthrough- except advent of ETC- during last two decades in terms of product features, sizing, space- requirement, unit-costing. Realistic: Incremental improvements Optimistic: A deepening of the market through development of product categories, multiple price points and innovative value propositions, e.g, pay-per use Pessimistic: Continuance of present conditions
2.3 Industry-Structure And Distribution Present: Fragmented character. Manufacturing concentrated in southern India/Maharashtra. Low brand-equity. Sub-optimal dealer network. Realistic: Significant improvement in present conditions, viz., • Industry-consolidation, emergence of few large players
• Manufacturing/assembling spreading to several regions and consequential relative price parity across regions

SWH Market Assessment
Greentech Knowledge Solutions Page | 38
• A choice of brands and dealers in major Indian cities/ towns Optimistic: Still better conditions, e.g., large network of visible dealers, demo points, switch over from customer call to outlet based selling. Pessimistic: Marginal improvement in present condition
2.4 Multi-Storied Building Present : Mandatory SWH installation policy implemented in a few cities on low key. Dearth of success models. Realistic: Clear enunciation and effective implementation of mandatory installation policy and institutionalization of guidelines, best practices, product features, hot water distribution mechanism, ownership and management model suitable for multi-storied buildings. Optimistic: In addition to above, stringent implementation of mandatory installation policy backed by a financial incentive exclusively for multi-storied buildings Pessimistic: Marginal improvement to present policy/ product package
2.5 Policy Present: A range of instruments- compulsion (substantially theoretical), soft interest loan, capital subsidy, accelerated depreciation, municipal property rebate tax, electricity bill rebate, BIS standards for SWH producers, SWH- coverage under ECBC, etc in vogue. The incentives reach a small proportion of installers; given the availment mechanism. Realistic: • Mandatory installation Policy: To cover residential and non- residential
buildings, supported by useful guidelines and best practices in major Indian cities. Te be driven by stakeholder involvement
• Balancing compulsion: A financial incentive to all installers; higher quantum for residential buildings than non-residential ones. A single, strong incentive rather than diffused, multiple ones. Incentive to reach most installers.
• A larger financial incentive for old buildings: Relative to new ones
• Regional variation in incentive quantum: SWH pay-back period varies

SWH Market Assessment
Greentech Knowledge Solutions Page | 39
across regions
• Fiscal/monetary/other policy support: To encourage product-development, industry- consolidation, distribution network and product-pricing favourable to SWH market growth
Optimistic: In addition to above
• Larger quantum of financial incentives
• Incentive being delivered mainly through electricity distribution companies-prime vehicle for SWH market- promotion
Pessimistic: Marginal fine-tuning of present low-key compulsion-cum-multiple- incentive basket
2.6 Promotion Present : Negligible direct spend on advertising and promotion by SWH producers, dealers, MNRE, SNA’s and others Realistic: The industry-government to spend 3.5% to 5% of projected turnover during 2010-15 period. To work in tandem. Optimistic: Spend @ 7% to 8% of projected turnover. Other action, e.g., exchange offers against malfunctioning electric geysers. Pessimistic: Marginal improvement to present position

SWH Market Assessment
Greentech Knowledge Solutions Page | 40

SWH Market Assessment
Greentech Knowledge Solutions Page | 41
Chapter 5. SWH Potential in Residential Sector
5.1 Water heating in Indian Households Hot water is required in households for bathing, cleaning of utensils, washing of clothes, cooking, preparation of cattle feed, etc. In majority of the households in the country, water heating is carried out using the device (stove) used for cooking. While in rural areas, biomass is the main fuel that is used for water heating, in urban households, LPG stove, electrical immersion rod, electric geyser, LPG/PNG geyser are the main appliances that are used for water heating. Penetration of electric geysers is still low in the country and is mostly restricted to urban areas. Studies on ownership of appliances conducted by NSSO indicate that while the ownership of basic appliances like fans and TV are distributed across different income categories. Appliances like electric geysers, washing machines and air-conditioners which can be considered as more luxurious goods are owned by households with the highest level of income. As per the estimates of electric geyser industry, the current sale of electric geysers (mostly 15 and 25 liter capacity) in the country is 1.5-1.8 million pieces/ year and the annual growth in sale is around 20%18. A study on energy use in residential sector carried out by Ernest Orlando Lawrence Berkley Laboratory , USA estimates that in the year 2010, around 17 million households in India (6.5% of the total households) would be using electric geysers19. This number is estimated to increase sharply to 56 million households (17.6% of the total households) by the year 2020 (figure 5.1). The sharp increase is mainly attributed to increase in household incomes, with greater percentage of population being able to afford an electric geyser.
1. Hot water demand varies significantly across different regions in the country. 2. Biomass fuels, LPG and electricity are the three main fuels used for heating water. 3. The percentage of households using electric geysers for water heating is still low and mainly concentrated in urban areas. The demand is rising sharply and 56 million households are expected to use electric geysers by the year 2020.
18 Personal communication. Meeting with Electric Geyser Manufacturers held with Secretary, MNRE on 30th September 2009 at Delhi 19 Stephane de la Rue du Can, V Letschert, M McNeil, N Zhou & J Sathaye. Residential and Transport Energy Use in India: Past Trends and Future Outlook. Ernest Orlando Lawrence Berkley Laboratory. January 2009 . For details of the study refer Annexure III.

SWH Market Assessment
Greentech Knowledge Solutions Page | 42
0.0
10.0
20.0
30.0
40.0
50.0
60.0
1990 1995 2000 2005 2010 2015 2020Year
Hou
seho
lds
havi
ng E
lect
ric G
eyse
r (m
illio
ns)
Figure 5.1: Projected growth in number of electric geyser households
5.2 Estimation of SWH Penetration Rate in States Data collected during primary survey was used to calculate:
a) Penetration rate of SWH in urban households in a state, which is the percentage of urban households owning SWH in the year 2009 and is obtained by dividing the estimated number of SWH owner households in 2009 by the total number of urban households in the state in 2009.
b) Penetration rate in new-urban households, which is obtained by dividing estimated number of new urban households who have installed SWH in 2009 by the total number of new urban households added during 2009 in a state.
Based on the average penetration rates, the states have been classified into 5 categories (Table 5.1).

SWH Market Assessment
Greentech Knowledge Solutions Page | 43
Table 5.1: Classification of states as per penetration rate of SWH in households
Category Average SWH Penetration rate (% of urban household owning SWH)
SWH penetration rate in new-urban households
States
I 6 % 24% Karnataka II 1 % 6 % Maharashtra III 0.3% 2.4 % HP, Punjab, Haryana, UK,
Rajasthan, Goa, Tamil Nadu, Kerala, AP,
IV 0.1 % 1.2 % Delhi, UP, Bihar, MP, Chhatisgarh, Orissa, WB, Jharkhand
V 0.01 % 0.6 % N-E states, Sikkim
5.3 Projection of Number of Households
A bottom-up model was developed to project growth of SWH in the residential sector.
• State-wise number of urban and rural households for 2001 were computed using district-wise household data from census report of 2001.
• State-wise number of households falling under 4 categories -- urban-existing, urban-new, rural-existing and rural-new were calculated for every year from 2009 to 2022. The size of rural and urban households and the urbanization rate were taken from the LBNL study (table 5.2) 19.
Table 5.2: Household size and urbanization rate used for projecting number of households in 202020
Year Urban household size (persons/hh)
Rural household size (persons/hh)
Urbanization rate (%)
2000 4.60 5.19 27.7 2005 4.31 4.91 28.7 2010 4.05 4.80 30.1 2015 3.85 4.77 31.9 2020 3.70 4.75 34.3
20 Stephane de la Rue du Can, V Letschert, M McNeil, N Zhou & J Sathaye. Residential and Transport Energy Use in India: Past Trends and Future Outlook. Ernest Orlando Lawrence Berkley Laboratory. January 2009
SWH Market Assessment
Greentech Knowledge Solutions Page | 44
5.4 Alternate Scenarios Pessimistic Scenario The main assumptions have already been defined in the previous chapter. Specific assumptions made for the residential sector under pessimistic scenario are as follows: i. State-wise penetration rate of SWH in urban-new households given in table 5.1
are used. An annual growth of 5% in the penetration rate is assumed.
ii. The ratio of deployment in new housing: existing houses is assumed to remain same as that in 2009 i.e. 4:1.
iii. SWH deployment in rural areas are calculated by taking penetration rates in rural areas as 12% that of urban areas. This percentage has been taken from the electric geyser study by LBNL in which the ratio of penetration of electric geysers in rural areas is 12% of that in urban areas in 2009.
iv. State-wise projection of annual number of SWH households is made separately for four categories of households: • Urban-new • Urban-existing i.e. existing number of urban households at the end of the
previous year • Rural –new • Rural-existing
Realistic scenario One of the major assumptions is a gradual stronger enforcement of the mandatory provisions for installation of SWH in new housing. It assumes that due to enforcement of mandatory provisions, the penetration rate of SWH in new housing, in the year 2022, in all the states would gradually increase and would reach levels of 10% (for category IV and V states) , 15 % (for category III states), 20% for category II. For Karnataka (category I) it is assumed that the penetration level in new housing would remain constant at 24%. Optimistic scenario One of the major assumptions here is policy and awareness initiative to increase penetration in existing housing. It is assumed that due to these initiatives the ratio of sales to new housing: existing housing would become 3:2 , resulting in increase in installation in existing housing.

SWH Market Assessment
Greentech Knowledge Solutions Page | 45
5.5 Results Pessimistic scenario: The cumulative installation of SWH in residential sector is expected to grow from 2.56 million m2 in 2010 to 10.23 million m2 in 2022. The deployment of SWH during 2010-2022 in residential sector would be 7.67 million m2. Please refer to figure 5.2 for cumulative SWH deployment in residential sector for years 2010, 2013, 2017 & 2022 for pessimistic scenario. Table 5.3 provides state-wise SWH deployment in residential sector for pessimistic scenario. Realistic scenario: The cumulative installation of SWH in residential sector is expected to grow from 2.58 million m2 in 2010 to 15.74 million m2 in 2022. The deployment of SWH during 2010-2022 in residential sector would be 13.16 million m2. Please refer to figure 5.3 for cumulative SWH deployment in residential sector for years 2010, 2013, 2017 & 2022 for realistic scenario. Table 5.4 provides state-wise SWH deployment in residential sector for realistic scenario. Five states – Karnataka, Maharashtra, Tamil Nadu, Andhra Pradesh and Gujarat are expected to contribute to 68.1% of the installations under this scenario. A comparison of cumulative electric geyser sales 19 v/s SWH sales is shown figure 5.4. The projection show that the SWH market would grow at a faster rate than electric geysers. The ratio of total electric geyser to SWH for the year 2009 is 20.5 and under this scenario, the ratio would decrease to 13.3 by 2022. Optimistic scenario: The cumulative installation of SWH in residential sector is expected to grow from 2.74 million m2 in 2010 to 20.28 million m2 in 2022. The deployment of SWH during 2010-2022 in residential sector would be 17.54 million m2. Please refer to figure 5.5 for cumulative SWH deployment in residential sector for years 2010, 2013, 2017 & 2022 for optimistic scenario. Table 5.5 provides state-wise SWH deployment in residential sector for optimistic scenario. Five states – Karnataka, Maharashtra, Tamil Nadu, Andhra Pradesh and Gujarat are expected to contribute to 67.5% of the installations under this scenario. A comparison of above three scenarios is done and the cumulative SWH deployment for the years 2010, 2013, 2017 & 2022 is shown in figure 5.6.

SWH Market Assessment
Greentech Knowledge Solutions Page | 46
Figure 5.2: Year-wise cumulative SWH deployment in residential sector for pessimistic scenario
Figure 5.3: Year-wise cumulative SWH deployment in residential sector for realistic scenario

SWH Market Assessment
Greentech Knowledge Solutions Page | 47
Figure 5.4: Electric geysers sales v/s SWH sales
Figure 5.5: Year-wise cumulative SWH deployment in residential sector for optimistic scenario

SWH Market Assessment
Greentech Knowledge Solutions Page | 48
0.00
5.00
10.00
15.00
20.00
25.00
2010 2013 2017 2022
million m
2
Residential Sector: Cumulative SWH installation
Pessimistic Scenario Realistic Scenarion Optimistic Scenario
Figure 5.6: Year-wise cumulative SWH deployment in residential sector for all scenarios

SWH Market Assessment
Greentech Knowledge Solutions Page | 49
Table 5.3: State-wise, Year-wise cumulative SWH deployment in residential sector in m2 for Pessimistic Scenario
Rural Urban Rural Urban Rural Urban Rural UrbanKarnataka 186,289 1,122,203 210,203 1,627,688 235,788 2,378,559 259,399 3,458,692Maharashtra 55,064 487,872 66,574 822,928 80,993 1,413,912 97,812 2,475,684Tamil Nadu 12,983 124,178 16,396 225,958 20,672 405,481 25,661 728,015 Andhra Pradesh 19,758 85,563 24,952 155,693 31,460 279,390 39,050 501,626 Gujarat 9,312 72,961 11,760 132,761 14,828 238,239 18,406 427,743 Uttar Pradesh 11,848 42,254 16,045 85,193 21,303 160,930 27,437 297,001 Rajasthan 11,179 46,612 14,119 84,815 17,801 152,201 22,096 273,267 West Bengal 6,554 36,107 8,877 72,800 11,786 137,520 15,179 253,796 Kerala 7,852 33,393 9,916 60,763 12,502 109,039 15,519 195,772 Punjab 4,382 30,205 5,534 54,963 6,978 98,631 8,661 177,086 Madhya Pradesh 4,650 22,881 6,298 46,132 8,361 87,144 10,768 160,825 Haryana 3,984 22,773 5,031 41,439 6,343 74,362 7,873 133,513 Delhi 105 20,039 142 40,402 188 76,320 242 140,850 Bihar 7,215 10,492 9,772 21,154 12,974 39,959 16,708 73,746 Orissa 3,849 8,785 5,213 17,712 6,921 33,459 8,913 61,751 Jharkhand 2,173 8,338 2,943 16,812 3,907 31,757 5,031 58,609 Uttranchal 1,858 8,124 2,347 14,783 2,959 26,528 3,673 47,629 Chhatisgarh 1,904 6,418 2,578 12,940 3,423 24,445 4,409 45,113 Jammu &Kashmir 679 3,150 919 6,351 1,220 11,997 1,572 22,141 Chandigarh 35 3,578 44 6,511 56 11,684 70 20,977 Assam 543 1,719 975 4,553 1,518 9,553 2,151 18,535 Himachal Pradesh 1,692 2,759 2,137 5,020 2,695 9,009 3,345 16,175 Goa 228 2,911 288 5,297 363 9,505 450 17,065 Pondicherry 114 2,774 144 5,048 182 9,059 226 16,264 Tripura 70 301 125 798 195 1,674 276 3,249 Manipur 35 247 64 653 99 1,370 140 2,659 Meghalaya 43 207 77 549 120 1,152 170 2,235 Mizoram 11 216 20 571 32 1,199 45 2,325 Nagaland 34 157 61 416 95 872 135 1,693 Arunachal Pradesh 22 119 38 315 60 660 85 1,281 Andaman & Nicobar 7 64 12 169 19 354 27 688 Sikkim 13 31 24 83 37 174 52 338 Daman & Diu 3 30 5 80 8 168 12 326 Dadra & Nagar Haveli 5 29 8 75 12 157 17 305 Lakshadweep 1 10 2 28 2 58 3 113 TOTAL 354,493 2,207,499 423,642 3,571,453 505,899 5,836,520 595,614 9,637,088
2010 2013 2017 2022State

SWH Market Assessment
Greentech Knowledge Solutions Page | 50
Table 5.4: State-wise, Year-wise cumulative SWH deployment in residential sector in m2 for Realistic Scenario
Rural Urban Rural Urban Rural Urban Rural UrbanKarnataka 186,289 1,122,203 210,203 1,627,688 235,788 2,378,559 259,399 3,458,692 Maharashtra 55,064 492,302 66,574 875,613 80,993 1,665,426 97,812 3,400,615 Tamil Nadu 12,983 127,079 16,396 262,352 20,672 593,663 25,661 1,503,906 Andhra Pradesh 19,758 87,562 24,952 180,769 31,460 409,053 39,050 1,036,241 Gujarat 9,312 74,665 11,760 154,144 14,828 348,806 18,406 883,618 Uttar Pradesh 11,848 43,789 16,045 104,942 21,303 267,119 27,437 760,960 West Bengal 6,554 37,418 8,877 89,676 11,786 228,260 15,179 650,261 Rajasthan 11,179 47,700 14,119 98,476 17,801 222,837 22,096 564,505 Madhya Pradesh 4,650 23,712 6,298 56,826 8,361 144,645 10,768 412,058 Kerala 7,852 34,173 9,916 70,549 12,502 159,644 15,519 404,420 Punjab 4,382 30,911 5,534 63,816 6,978 144,406 8,661 365,818 Delhi 105 20,767 142 49,769 188 126,680 242 360,879 Haryana 3,984 23,305 5,031 48,113 6,343 108,873 7,873 275,805 Bihar 7,215 10,873 9,772 26,058 12,974 66,326 16,708 188,948 Orissa 3,849 9,104 5,213 21,819 6,921 55,538 8,913 158,213 Jharkhand 2,173 8,641 2,943 20,708 3,907 52,712 5,031 150,163 Chhatisgarh 1,904 6,652 2,578 15,941 3,423 40,575 4,409 115,589 Uttranchal 1,858 8,314 2,347 17,163 2,959 38,839 3,673 98,390 Assam 543 1,871 975 6,646 1,518 21,999 2,151 81,984 Jammu &Kashmir 679 3,265 919 7,824 1,220 19,914 1,572 56,728 Chandigarh 35 3,662 44 7,559 56 17,106 70 43,334 Himachal Pradesh 1,692 2,823 2,137 5,829 2,695 13,190 3,345 33,415 Goa 228 2,979 288 6,150 363 13,916 450 35,252 Pondicherry 114 2,839 144 5,861 182 13,263 226 33,599 Tripura 70 328 125 1,165 195 3,857 276 14,373 Manipur 35 269 64 954 99 3,157 140 11,764 Mizoram 11 235 20 834 32 2,760 45 10,286 Meghalaya 43 226 77 801 120 2,653 170 9,888 Nagaland 34 171 61 607 95 2,009 135 7,488 Arunachal Pradesh 22 129 38 459 60 1,520 85 5,663 Andaman & Nicobar 7 69 12 246 19 816 27 3,042 Sikkim 13 34 24 121 37 402 52 1,499 Daman & Diu 3 33 5 117 8 386 12 1,439 Dadra & Nagar Haveli 5 31 8 109 12 361 17 1,344 Lakshadweep 1 11 2 40 2 134 3 499 TOTAL 354,493 2,228,144 423,642 3,829,743 505,899 7,169,404 595,614 15,140,678
State2010 2013 2017 2022

SWH Market Assessment
Greentech Knowledge Solutions Page | 51
Table 5.5: State-wise, Year-wise cumulative SWH deployment in residential sector in m2 for Optimistic Scenario
Rural Urban Rural Urban Rural Urban Rural UrbanKarnataka 190,619 1,177,142 222,503 1,851,121 256,618 2,852,284 288,098 4,292,460 Maharashtra 56,952 526,746 72,298 1,037,826 91,524 2,090,911 113,950 4,404,496 Tamil Nadu 13,543 138,061 18,094 318,424 23,796 760,172 30,448 1,973,830 Andhra Pradesh 20,610 95,128 27,536 219,404 36,212 523,783 46,333 1,360,034 Gujarat 9,714 81,117 12,978 187,089 17,068 446,638 21,839 1,159,721 Uttar Pradesh 12,536 48,525 18,133 130,063 25,143 346,299 33,321 1,004,753 West Bengal 6,935 41,466 10,032 111,142 13,911 295,922 18,435 858,590 Rajasthan 11,661 51,822 15,580 119,523 20,490 285,338 26,217 740,896 Madhya Pradesh 4,920 26,276 7,117 70,429 9,868 187,521 13,078 544,072 Kerala 8,190 37,126 10,943 85,628 14,391 204,420 18,413 530,788 Punjab 4,571 33,582 6,107 77,455 8,032 184,908 10,277 480,125 Delhi 111 23,013 160 61,682 222 164,230 294 476,496 Haryana 4,155 25,319 5,552 58,396 7,301 139,410 9,342 361,986 Bihar 7,634 12,049 11,043 32,296 15,312 85,987 20,292 249,482 Orissa 4,073 10,089 5,891 27,042 8,168 72,000 10,825 208,901 Jharkhand 2,299 9,576 3,325 25,666 4,611 68,337 6,110 198,272 Chhatisgarh 2,014 7,371 2,914 19,757 4,040 52,603 5,354 152,621 Uttranchal 1,938 9,032 2,590 20,832 3,406 49,732 4,358 129,134 Assam 614 2,201 1,191 8,567 1,914 29,039 2,758 109,018 Jammu &Kashmir 718 3,618 1,038 9,696 1,440 25,816 1,909 74,903 Chandigarh 37 3,978 49 9,175 65 21,904 83 56,875 Himachal Pradesh 1,765 3,067 2,359 7,074 3,102 16,889 3,969 43,856 Goa 238 3,236 317 7,464 417 17,819 534 46,267 Pondicherry 119 3,085 159 7,114 210 16,983 268 44,097 Tripura 79 386 153 1,502 246 5,091 354 19,112 Manipur 40 316 78 1,230 125 4,167 180 15,643 Mizoram 13 276 25 1,075 40 3,643 57 13,678 Meghalaya 49 266 94 1,033 151 3,502 218 13,149 Nagaland 38 201 75 782 120 2,652 173 9,957 Arunachal Pradesh 24 152 47 592 75 2,006 109 7,530 Andaman & Nicobar 8 82 15 318 24 1,078 34 4,045 Sikkim 15 40 29 156 47 531 67 1,993 Daman & Diu 3 39 6 151 10 510 15 1,914 Dadra & Nagar Haveli 5 36 10 141 15 477 22 1,788 Lakshadweep 1 13 2 52 3 177 4 664 TOTAL 366,243 2,374,431 458,442 4,509,896 568,117 8,962,777 687,738 19,591,143
State2010 2013 2017 2022

SWH Market Assessment
Greentech Knowledge Solutions Page | 52

SWH Market Assessment
Greentech Knowledge Solutions Page | 53
Chapter 6. SWH Potential in Commercial and Institutional Buildings
This section covers three important types of commercial and institutional buildings. These are:
• Hotels • Hospitals • Hostels
The main observations of primary survey for hotels, hospitals and hostels has been described in chapter 3 and the general methodology used for projecting realistic potential along with description of the three scenarios has been described in chapter 4. This chapter now describes the details of the methodology for each segment and the results in the form of projected realistic potential for each segment.
6.1 SWH Potential in Hotels
6.1.1 Existing Stock of Hotel/Guesthouse Rooms in India
There do not exist, officials or otherwise, statistics on existing stock of hotel/guesthouse rooms in India. The official statistics are limited to the hotels which are approved and/or classified into star-rating or heritage-rating by the Government of India. The GOI approves a hotel at the planning stage and classifies it after it operates for some time. The approval/classification is not required for building plan or use approval from the local body or for loan assistance from a bank or for electricity connection or for a wide range of permits which a hotel requires. The possession of GOI approval/classification, for hotels other than the upscale ones, does not generate tangible, significant advantage. The approval/classification process does not seem designed to attract modest hotels, e.g., the owner of a one star hotel in a small town needs to apply to the Regional District of Tourism at Mumbai or Delhi at the hotel planning stage. As a consequence of these ground-realities concerning GOI approval/classification of hotels/guest-houses, the official statistics on the stock of hotel/guest-house rooms capture the “tip of an iceberg”. The various studies on hotel-sector focus on demand, and if supply is touched upon, it is essentially the supply of upscale hotels because the studies are meant to address the needs of clients of large consulting firms or credit rating organizations.

SWH Market Assessment
Greentech Knowledge Solutions Page | 54
The state governments do not operate any hotel approval mechanism; they administer luxury tax applicable to hotels/guesthouses charging room-tariff above a cut-off point stipulated by respective state governments. However, a system of compiling monthly tourist flow operated by Government of Gujarat helped us to overcome the problem of estimating the present stock of rooms. This is explained below. There were 1425 GOI approved/classified hotels having 83781 rooms in India in 2007 (Table-6.1). In Gujarat, there were 3097 GOI approved/classified rooms. However, the total hotel/guesthouse/dharamshala rooms in Gujarat were 56685 (Table-6.2). Excluding dharamshalas and hotels/guesthouses having up to 15 rooms, there were 28583 rooms in Gujarat; yielding a ratio of 1 to 8.22 in terms of GOI approved/classified rooms to other rooms.
Table 6.1: GoI Classified/Approved Hotel Rooms in India: 1996-2007 (No of Rooms)
Apartment Hotel No. of Rooms
1996 1997 1998 1999 2000 2001 2002 2003 2004 2005 2006 2007 One Star 4286 4912 5115 5419 6169 6296 6343 6606 6765 1629 1435 1774 Two Star 10326 11136 11366 12938 15078 16153 15999 17629 18449 5673 5823 6637 Three Star 14074 14776 15725 17531 19271 20542 22783 26071 28783 19985 20342 24496 Four Star 5172 5450 5990 7014 7588 7958 8551 8655 8831 5483 7354 7584 Five Star 0 0 0 0 0 9845 10107 10416 10982 7367 8470 9792 Five Star Deluxe 18502 18610 18647 21608 23598 25086 16240 16885 17885 15739 20943 20110 Apartment Hotel 0 0 0 0 0 0 0 0 0 0 334 461 Time Share Resort 0 0 0 0 0 0 0 0 0 0 0 62 Heritage Hotel 1176 1292 1372 1655 1758 2530 2124 2124 2173 1970 2211 2450 Unclassified 8438 8397 8307 5949 3731 3616 3334 3334 3902 9767 8924 10415 Total 61974 64573 66522 72114 77193 92026 85481 91720 97770 67613 75836 83781 CAGR % (3.68) 4.19 3.02 8.41 7.04 19.22 -7.11 7.30 6.60 -30.84 12.16 10.48
Source: Ministry of Tourism, Govt of India

SWH Market Assessment
Greentech Knowledge Solutions Page | 55
Table 6.2: Hotels/Guesthouses Rooms In Gujarat (2007): An Overview
(GOI Classified/Approved Rooms: 3097)
Location Total Rooms
Rooms Excluding Dharamshalas
Rooms Excluding Up to 15 room Properties and Dharamshalals
Ahmedabad 7409 6651 5561 Surat 3513 3474 3156 Vadodara 2760 2760 2493 Rajkot 1933 1870 1693 Vapi 1360 1360 1069 Dwarka 2024 1205 1027 Gandhidham 1203 1141 933 Bharuch 961 933 746 Jamnagar 902 902 740 Bhuj 786 729 603 Ambaji 2974 940 583 Junagadh 872 757 583 Bhavnagar 795 691 570 Saputara 531 531 502 Bechraji 731 450 450 Veraval 611 585 449 Gandhinagar 1391 714 430 Porbandar 572 515 422 Mehsana 506 506 370 Somnath 657 438 364 Ankleshwar 566 554 353 Sardar Sarovar 320 320 320 Valsad 500 500 318 Mundra 302 279 223 Tithal 191 191 179 Sasan 187 179 170 Anand 288 228 158 Virpur 814 710 153 Palitana 4465 161 150 Morbi 205 205 118 Chotila 405 239 116 Pavagadh 278 146 95 Patan 227 227 66 Dakor 515 219 52 Ubharat 61 61 45 Other 14843 6676 3323 Total 56658 38047 28583 Source: Tourism Corporation of Gujarat Ltd

SWH Market Assessment
Greentech Knowledge Solutions Page | 56
We do not have comparable ratio in respect of other states. However, the states which are relatively developed in an overall sense and/or developed from a tourism perspective, can be expected to have a Gujarat comparable ratio of GOI approved/classified rooms to other rooms. Such states are: Sikkim, Delhi, Haryana, Himachal Pradesh, Punjab, Rajasthan, Uttarakhand, Chandigarh, Andhra Pradesh, Karnataka, Kerala, Tamilnadu, Goa and Maharashtra. These states account for 86% of GOI approved/classified rooms in India. Hence, we have considered it appropriate to apply Gujarat ratio to all states. From a hot-water requirement angle, excessively layered classification of establishments is not helpful. We have, therefore, merged the GOI classified rooms as follows.
• Low-End= 1 Star and 2 Star • Mid-End= 3 Star • High-End = 4 Star + 4 Star Apartment + 5 Star + 5 Star Apartment + 5 Star
Deluxe+ Heritage+ Heritage Grand The rooms which are approved by GOI but are awaiting classification are merged into low-end, mid-end and high-end categories, on a pro-rata basis for the respective state. A full estimate of GOI approved/classified and other SWH relevant rooms (non-GOI approved/classified establishments having upward of 15 rooms each) is presented under Table –6.3.
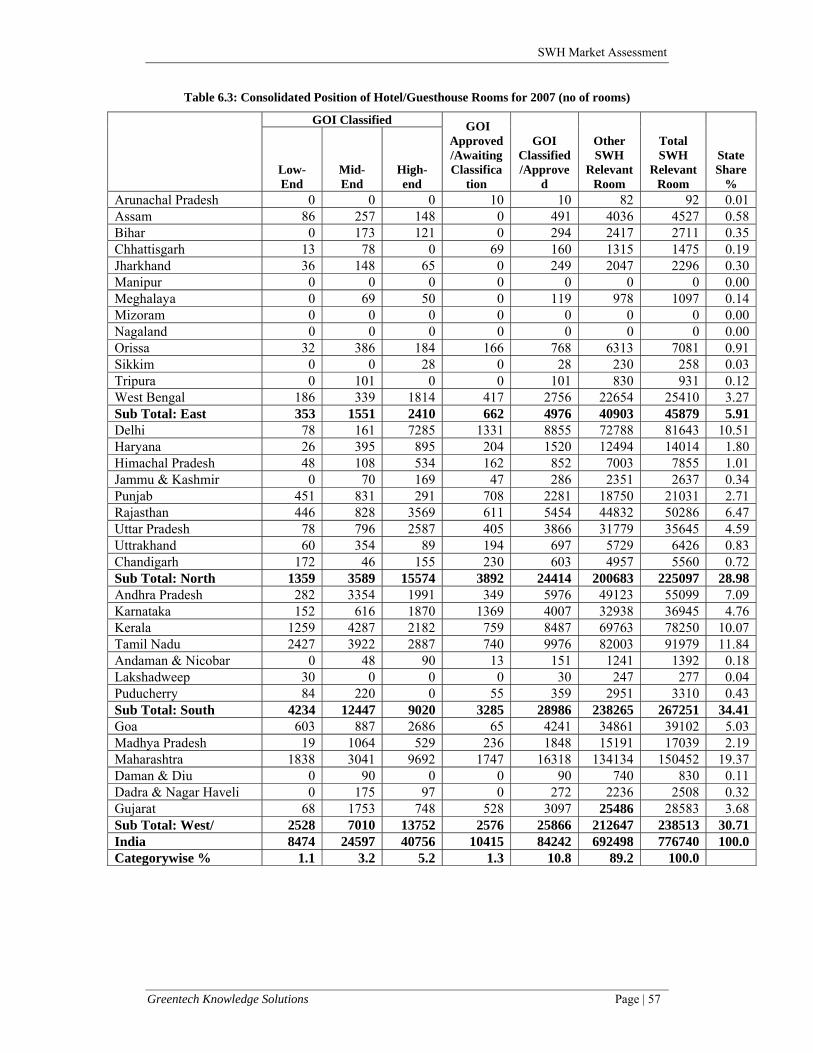
SWH Market Assessment
Greentech Knowledge Solutions Page | 57
Table 6.3: Consolidated Position of Hotel/Guesthouse Rooms for 2007 (no of rooms)
GOI Classified GOI Approved/Awaiting Classifica
tion
GOI
Classified/Approve
d
Other SWH
Relevant Room
Total SWH
Relevant Room
State Share
%Low-End
Mid-End
High-end
Arunachal Pradesh 0 0 0 10 10 82 92 0.01Assam 86 257 148 0 491 4036 4527 0.58Bihar 0 173 121 0 294 2417 2711 0.35Chhattisgarh 13 78 0 69 160 1315 1475 0.19Jharkhand 36 148 65 0 249 2047 2296 0.30Manipur 0 0 0 0 0 0 0 0.00Meghalaya 0 69 50 0 119 978 1097 0.14Mizoram 0 0 0 0 0 0 0 0.00Nagaland 0 0 0 0 0 0 0 0.00Orissa 32 386 184 166 768 6313 7081 0.91Sikkim 0 0 28 0 28 230 258 0.03Tripura 0 101 0 0 101 830 931 0.12West Bengal 186 339 1814 417 2756 22654 25410 3.27Sub Total: East 353 1551 2410 662 4976 40903 45879 5.91Delhi 78 161 7285 1331 8855 72788 81643 10.51Haryana 26 395 895 204 1520 12494 14014 1.80Himachal Pradesh 48 108 534 162 852 7003 7855 1.01Jammu & Kashmir 0 70 169 47 286 2351 2637 0.34Punjab 451 831 291 708 2281 18750 21031 2.71Rajasthan 446 828 3569 611 5454 44832 50286 6.47Uttar Pradesh 78 796 2587 405 3866 31779 35645 4.59Uttrakhand 60 354 89 194 697 5729 6426 0.83Chandigarh 172 46 155 230 603 4957 5560 0.72Sub Total: North 1359 3589 15574 3892 24414 200683 225097 28.98Andhra Pradesh 282 3354 1991 349 5976 49123 55099 7.09Karnataka 152 616 1870 1369 4007 32938 36945 4.76Kerala 1259 4287 2182 759 8487 69763 78250 10.07Tamil Nadu 2427 3922 2887 740 9976 82003 91979 11.84Andaman & Nicobar 0 48 90 13 151 1241 1392 0.18Lakshadweep 30 0 0 0 30 247 277 0.04Puducherry 84 220 0 55 359 2951 3310 0.43Sub Total: South 4234 12447 9020 3285 28986 238265 267251 34.41Goa 603 887 2686 65 4241 34861 39102 5.03Madhya Pradesh 19 1064 529 236 1848 15191 17039 2.19Maharashtra 1838 3041 9692 1747 16318 134134 150452 19.37Daman & Diu 0 90 0 0 90 740 830 0.11Dadra & Nagar Haveli 0 175 97 0 272 2236 2508 0.32Gujarat 68 1753 748 528 3097 25486 28583 3.68Sub Total: West/ 2528 7010 13752 2576 25866 212647 238513 30.71India 8474 24597 40756 10415 84242 692498 776740 100.0Categorywise % 1.1 3.2 5.2 1.3 10.8 89.2 100.0
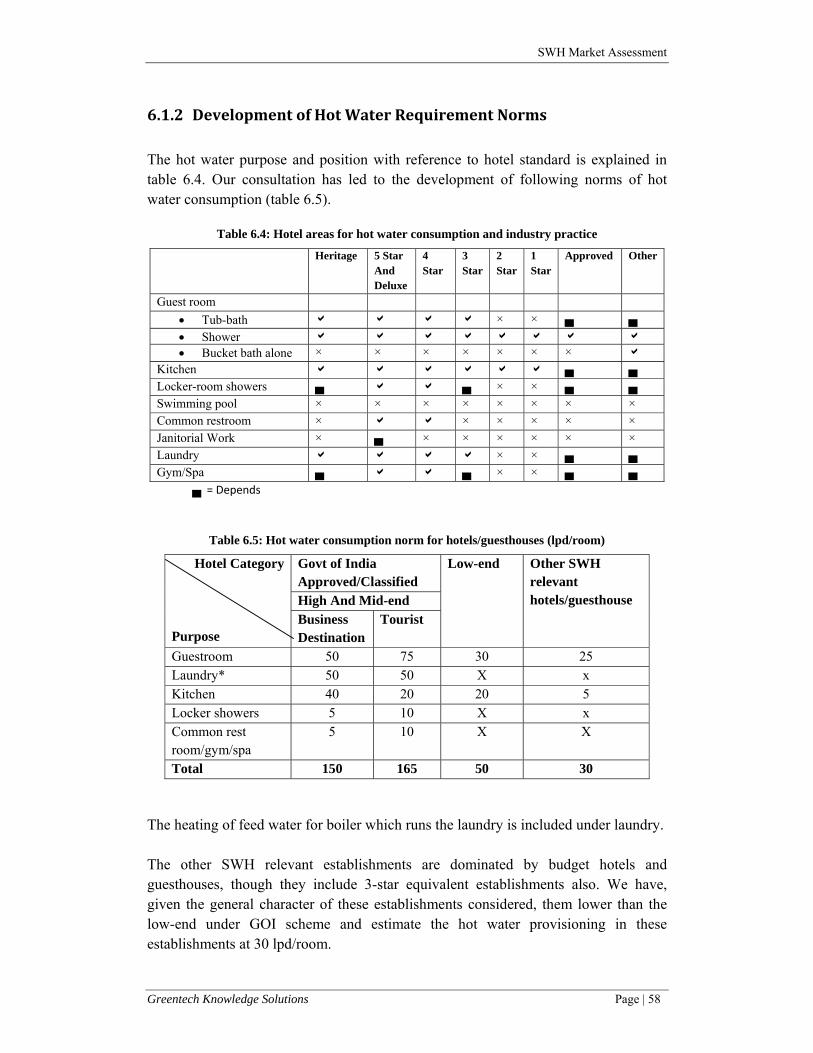
SWH Market Assessment
Greentech Knowledge Solutions Page | 58
6.1.2 Development of Hot Water Requirement Norms
The hot water purpose and position with reference to hotel standard is explained in table 6.4. Our consultation has led to the development of following norms of hot water consumption (table 6.5).
Table 6.4: Hotel areas for hot water consumption and industry practice
Heritage 5 Star And Deluxe
4 Star
3 Star
2 Star
1 Star
Approved Other
Guest room • Tub-bath × × ▄ ▄ • Shower • Bucket bath alone × × × × × × ×
Kitchen ▄ ▄ Locker-room showers ▄ ▄ × × ▄ ▄ Swimming pool × × × × × × × × Common restroom × × × × × × Janitorial Work × ▄ × × × × × × Laundry × × ▄ ▄ Gym/Spa ▄ ▄ × × ▄ ▄
▄ = Depends
Table 6.5: Hot water consumption norm for hotels/guesthouses (lpd/room)
Hotel Category Purpose
Govt of India Approved/Classified
Low-end Other SWH relevant hotels/guesthouse High And Mid-end
Business Destination
Tourist
Guestroom 50 75 30 25 Laundry* 50 50 X x Kitchen 40 20 20 5 Locker showers 5 10 X x Common rest room/gym/spa
5 10 X X
Total 150 165 50 30 The heating of feed water for boiler which runs the laundry is included under laundry. The other SWH relevant establishments are dominated by budget hotels and guesthouses, though they include 3-star equivalent establishments also. We have, given the general character of these establishments considered, them lower than the low-end under GOI scheme and estimate the hot water provisioning in these establishments at 30 lpd/room.

SWH Market Assessment
Greentech Knowledge Solutions Page | 59
We have taken, all things considered, the following hot water provisioning norm. High-end : 150 lpd/room Mid-end : 125 lpd/room Low-end : 50 lpd/room Other : 30 lpd/room
6.1.3 Projection of Hotel Rooms
There is the question of projected growth of hotel/guesthouse rooms in India. The evidence in terms of actual growth over a period in the number of establishments/rooms covered under GOI approval/classification is partial; it highlights a CAGR of 3.68% (Table 6.1). The record, on the demand side, in terms of growth in domestic tourist visits and foreign tourist visits over 1996-2007 is also available; the respective CAGR is 11.6% and 9.55 (Table 6.6 & 6.7).
Table 6.6: Domestic Tourist Visits: 1996 to 2007
Year Tourist Visits (in million) CAGR (%) 1996 140.12 2.5 1997 159.88 14.1 1998 168.2 5.2 1999 190.67 13.4 2000 220.11 15.4 2001 236.47 7.4 2002 269.6 14 2003 309.04 14.6 2004 366.27 18.5 2005 391.95 7 2006 462.31 18 2007 526.56 13.9
2008 (P) 562.92 6.9 Average 11.6
Source: Ministry of Tourism, Govt of India
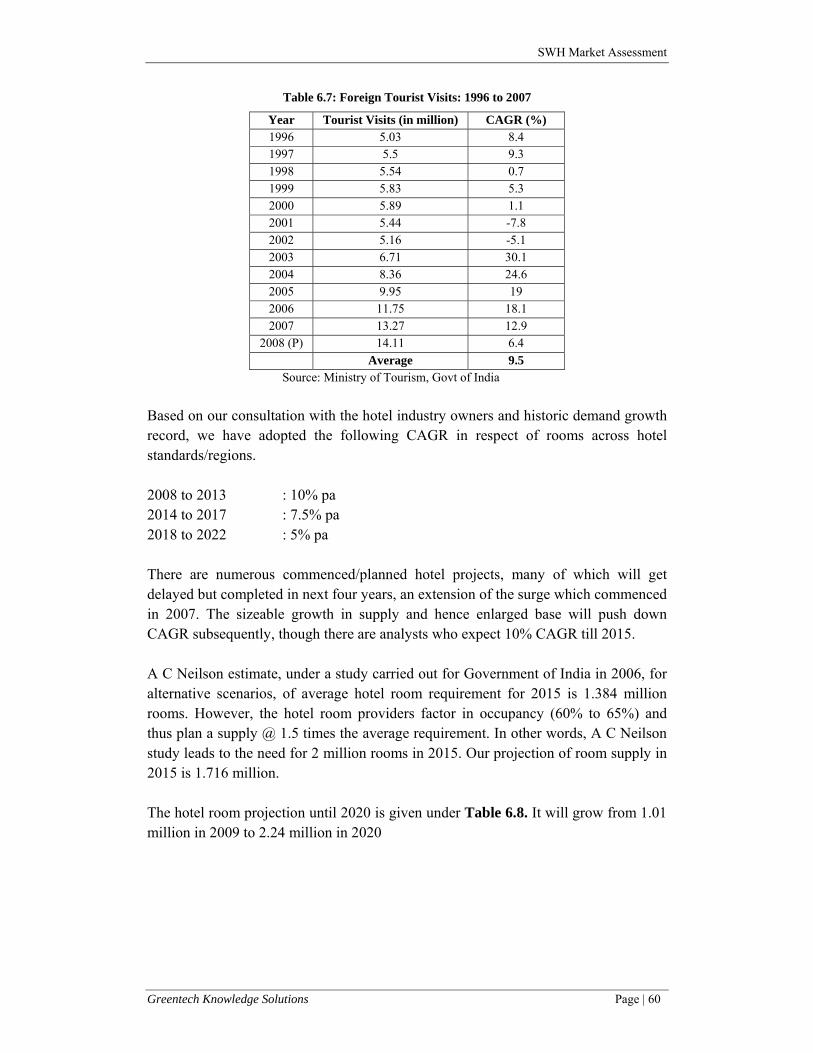
SWH Market Assessment
Greentech Knowledge Solutions Page | 60
Table 6.7: Foreign Tourist Visits: 1996 to 2007
Year Tourist Visits (in million) CAGR (%) 1996 5.03 8.4 1997 5.5 9.3 1998 5.54 0.7 1999 5.83 5.3 2000 5.89 1.1 2001 5.44 -7.8 2002 5.16 -5.1 2003 6.71 30.1 2004 8.36 24.6 2005 9.95 19 2006 11.75 18.1 2007 13.27 12.9
2008 (P) 14.11 6.4 Average 9.5 Source: Ministry of Tourism, Govt of India
Based on our consultation with the hotel industry owners and historic demand growth record, we have adopted the following CAGR in respect of rooms across hotel standards/regions. 2008 to 2013 : 10% pa 2014 to 2017 : 7.5% pa 2018 to 2022 : 5% pa There are numerous commenced/planned hotel projects, many of which will get delayed but completed in next four years, an extension of the surge which commenced in 2007. The sizeable growth in supply and hence enlarged base will push down CAGR subsequently, though there are analysts who expect 10% CAGR till 2015. A C Neilson estimate, under a study carried out for Government of India in 2006, for alternative scenarios, of average hotel room requirement for 2015 is 1.384 million rooms. However, the hotel room providers factor in occupancy (60% to 65%) and thus plan a supply @ 1.5 times the average requirement. In other words, A C Neilson study leads to the need for 2 million rooms in 2015. Our projection of room supply in 2015 is 1.716 million. The hotel room projection until 2020 is given under Table 6.8. It will grow from 1.01 million in 2009 to 2.24 million in 2020

SWH Market Assessment
Greentech Knowledge Solutions Page | 61
Table 6.8: Hotel Room Projection
State 2007 2008 2009 2010 2011 2012 2013 2014 2015 2016 2017 2018 2019 2020
Arunachal Pradesh 92 101 112 123 135 148 163 176 189 203 213 224 235 247
Assam 4527 4980 5478 6025 6628 7291 8020 8621 9268 9963 10461 10984 11534 12110
Bihar 2711 2982 3280 3608 3969 4366 4802 5162 5549 5966 6264 6577 6906 7251
Chhattisgarh 1475 1623 1785 1963 2160 2376 2613 2809 3020 3247 3409 3579 3758 3946
Jharkhand 2296 2525 2778 3056 3361 3697 4067 4372 4700 5053 5305 5570 5849 6141
Manipur 0 0 0 0 0 0 0 0 0 0 0 0 0 0
Meghalaya 1097 1207 1328 1460 1606 1767 1944 2090 2246 2415 2535 2662 2795 2935
Mizoram 0 0 0 0 0 0 0 0 0 0 0 0 0 0
Nagaland 0 0 0 0 0 0 0 0 0 0 0 0 0 0
Orissa 7081 7789 8568 9425 10367 11404 12544 13485 14497 15584 16363 17181 18040 18942
Sikkim 258 284 312 344 378 416 457 492 529 568 597 626 658 691
Tripura 931 1024 1127 1239 1363 1500 1650 1773 1906 2049 2152 2260 2372 2491
West Bengal 25410 27951 30746 33821 37203 40924 45016 48392 52022 55923 58719 61655 64738 67975
Sub Total:East 45879 50467 55513 61065 67171 73888 81277 87373 93926 100970 106019 111320 116886 122730
Delhi 81643 89807 98788 108667 119534 131487 144636 155483 167145 179681 188665 198098 208003 218403
Haryana 14014 15416 16957 18653 20518 22570 24827 26689 28691 30843 32385 34004 35705 37490
Himachal Pradesh 7855 8641 9505 10456 11501 12651 13916 14960 16082 17288 18153 19060 20013 21014
Jammu & Kashmir 2637 2901 3191 3510 3861 4247 4671 5022 5398 5803 6094 6398 6718 7054
Punjab 21031 23134 25447 27992 30791 33870 37257 40052 43056 46285 48599 51029 53580 56259
Rajasthan 50286 55314 60846 66931 73624 80986 89085 95766 102948 110669 116203 122013 128114 134519
Uttar Pradesh 35645 39209 43130 47443 52187 57406 63146 67882 72974 78447 82369 86487 90812 95352
Uttrakhand 6426 7069 7776 8553 9409 10350 11385 12239 13156 14143 14850 15593 16372 17191

SWH Market Assessment
Greentech Knowledge Solutions Page | 62
Chandigarh 5560 6116 6727 7400 8140 8954 9849 10588 11382 12236 12848 13490 14164 14873
Sub Total: North 225097 247607 272367 299604 329565 362521 398773 428681 460832 495395 520164 546173 573481 602155
Andhra Pradesh 55099 60609 66669 73336 80670 88737 97611 104932 112801 121262 127325 133691 140375 147394
Karnataka 36945 40639 44703 49173 54091 59500 65450 70358 75635 81308 85373 89642 94124 98830
Kerala 78250 86075 94683 104151 114566 126023 138625 149022 160198 172213 180824 189865 199358 209326
Tamil Nadu 91979 101177 111294 122424 134666 148133 162946 175167 188304 202427 212549 223176 234335 246052 Andaman & Nicobar Islands 1392 1531 1685 1853 2038 2242 2466 2651 2850 3064 3217 3378 3547 3724
Lakshadweep 277 304 335 368 405 445 490 527 566 609 639 671 705 740
Puducherry 3310 3641 4005 4406 4846 5331 5864 6304 6776 7285 7649 8031 8433 8855
Sub Total: South 267251 293976 323374 355711 391282 430410 473451 508960 547132 588167 617575 648454 680877 714921
Goa 39102 43012 47313 52045 57249 62974 69272 74467 80052 86056 90359 94877 99620 104601
Madhya Pradesh 17039 18742 20617 22678 24946 27441 30185 32449 34882 37499 39373 41342 43409 45580
Maharashtra 150452 165497 182047 200252 220277 242304 266535 286525 308014 331115 347671 365055 383307 402473
Daman & Diu 830 913 1004 1104 1215 1336 1470 1580 1699 1826 1918 2013 2114 2220
Dadra & Nagar Haveli 2508 2759 3034 3338 3672 4039 4443 4776 5134 5519 5795 6085 6389 6709
Gujarat 28583 31441 34585 38044 41848 46033 50637 54434 58517 62906 66051 69353 72821 76462
Sub Total: West 238513 262364 288601 317461 349207 384128 422541 454231 488299 524921 551167 578725 607662 638045
India 776740 854414 939855 1033841 1137225 1250947 1376042 1479245 1590189 1709453 1794925 1884672 1978905 2077851

SWH Market Assessment
Greentech Knowledge Solutions Page | 63
Table 6.9: Present and Future Hot Water Requirement: An Estimate
(‘000 lpd) State 2007 2008 2009 2010 2011 2012 2013 2014 2015 2016 2017 2018 2019 2020
Arunachal Pradesh 3.8 4.2 4.6 5.1 5.6 6.2 6.8 7.3 7.8 8.4 9.0 9.5 10.0 10.5
Assam 179.7 197.7 217.4 239.2 263.1 289.4 318.4 342.2 367.9 395.5 425.2 446.4 468.7 492.2
Bihar 112.3 123.5 135.9 149.4 164.4 180.8 198.9 213.8 229.9 247.1 265.6 278.9 292.9 307.5
Chhattisgarh 57.7 63.5 69.9 76.9 84.5 93.0 102.3 110.0 118.2 127.1 136.6 143.4 150.6 158.1
Jharkhand 91.5 100.6 110.7 121.7 133.9 147.3 162.0 174.2 187.2 201.3 216.4 227.2 238.5 250.5
Manipur 0.0 0.0 0.0 0.0 0.0 0.0 0.0 0.0 0.0 0.0 0.0 0.0 0.0 0.0
Meghalaya 45.5 50.0 55.0 60.5 66.6 73.2 80.6 86.6 93.1 100.1 107.6 113.0 118.6 124.5
Mizoram 0.0 0.0 0.0 0.0 0.0 0.0 0.0 0.0 0.0 0.0 0.0 0.0 0.0 0.0
Nagaland 0.0 0.0 0.0 0.0 0.0 0.0 0.0 0.0 0.0 0.0 0.0 0.0 0.0 0.0
Orissa 288.2 317.0 348.7 383.6 421.9 464.1 510.6 548.8 590.0 634.3 681.8 715.9 751.7 789.3
Sikkim 11.1 12.2 13.4 14.8 16.3 17.9 19.7 21.1 22.7 24.4 26.3 27.6 29.0 30.4
Tripura 37.5 41.3 45.4 50.0 55.0 60.4 66.5 71.5 76.8 82.6 88.8 93.2 97.9 102.8
West Bengal 1061.1 1167.2 1284.0 1412.4 1553.6 1709.0 1879.9 2020.8 2172.4 2335.3 2510.5 2636.0 2767.8 2906.2
Sub Total: East 1888.4 2077.3 2285.0 2513.5 2764.8 3041.3 3345.5 3596.4 3866.1 4156.1 4467.8 4691.2 4925.7 5172.0
Delhi 3498.0 3847.8 4232.6 4655.8 5121.4 5633.5 6196.9 6661.6 7161.3 7698.4 8275.7 8689.5 9124.0 9580.2
Haryana 588.4 647.3 712.0 783.2 861.5 947.7 1042.4 1120.6 1204.7 1295.0 1392.1 1461.7 1534.8 1611.6
Himachal Pradesh 328.6 361.5 397.7 437.4 481.2 529.3 582.2 625.9 672.8 723.3 777.5 816.4 857.2 900.1
Jammu & Kashmir 111.3 122.5 134.7 148.2 163.0 179.3 197.2 212.0 227.9 245.0 263.4 276.6 290.4 304.9
Punjab 809.1 890.0 979.0 1076.9 1184.6 1303.1 1433.4 1540.9 1656.5 1780.7 1914.3 2010.0 2110.5 2216.0
Rajasthan 2089.5 2298.5 2528.3 2781.1 3059.3 3365.2 3701.7 3979.3 4277.8 4598.6 4943.5 5190.7 5450.2 5722.7
Uttar Pradesh 1502.3 1652.5 1817.8 1999.6 2199.5 2419.5 2661.4 2861.0 3075.6 3306.3 3554.3 3732.0 3918.6 4114.5

SWH Market Assessment
Greentech Knowledge Solutions Page | 64
Uttrakhand 255.9 281.4 309.6 340.5 374.6 412.1 453.3 487.3 523.8 563.1 605.3 635.6 667.4 700.7
Chandigarh 209.5 230.4 253.5 278.8 306.7 337.4 371.1 398.9 428.9 461.0 495.6 520.4 546.4 573.7
Sub Total: North 9392.7 10331.9 11365.1 12501.6 13751.8 15127.0 16639.7 17887.7 19229.2 20671.4 22221.8 23332.9 24499.5 25724.5
Andhra Pradesh 2251.1 2476.2 2723.8 2996.2 3295.8 3625.4 3987.9 4287.0 4608.6 4954.2 5325.8 5592.0 5871.6 6165.2
Karnataka 1542.7 1697.0 1866.7 2053.3 2258.7 2484.5 2733.0 2938.0 3158.3 3395.2 3649.8 3832.3 4023.9 4225.1
Kerala 3110.0 3421.0 3763.1 4139.4 4553.3 5008.7 5509.5 5922.7 6366.9 6844.5 7357.8 7725.7 8112.0 8517.6
Tamil Nadu 3588.4 3947.3 4342.0 4776.2 5253.8 5779.2 6357.1 6833.9 7346.5 7897.4 8489.7 8914.2 9359.9 9827.9 Andaman & Nicobar Islands 58.6 64.4 70.9 78.0 85.8 94.3 103.8 111.5 119.9 128.9 138.6 145.5 152.8 160.4
Lakshadweep 8.9 9.8 10.8 11.8 13.0 14.3 15.8 16.9 18.2 19.6 21.1 22.1 23.2 24.4
Puducherry 126.0 138.6 152.4 167.7 184.4 202.9 223.2 239.9 257.9 277.2 298.0 312.9 328.6 345.0
Sub Total: South 10685.6 11754.2 12929.6 14222.6 15644.8 17209.3 18930.2 20350.0 21876.2 23517.0 25280.7 26544.8 27872.0 29265.6
Goa 1598.2 1758.0 1933.8 2127.2 2340.0 2574.0 2831.3 3043.7 3272.0 3517.4 3781.2 3970.2 4168.7 4377.2
Madhya Pradesh 700.2 770.3 847.3 932.0 1025.2 1127.8 1240.5 1333.6 1433.6 1541.1 1656.7 1739.5 1826.5 1917.8
Maharashtra 6180.7 6798.8 7478.7 8226.6 9049.2 9954.1 10949.6 11770.8 12653.6 13602.6 14622.8 15353.9 16121.6 16927.7
Daman & Diu 33.4 36.8 40.5 44.5 49.0 53.9 59.2 63.7 68.5 73.6 79.1 83.1 87.2 91.6
Dadra & Nagar Haveli 103.5 113.9 125.2 137.8 151.5 166.7 183.4 197.1 211.9 227.8 244.9 257.1 270.0 283.5
Sub Total: West 1168.1 1284.9 1413.4 1554.7 1710.2 1881.2 2069.4 2224.6 2391.4 2570.8 2763.6 2901.7 3046.8 3199.2
Sub Total 9784.3 10762.7 11838.9 13022.8 14325.1 15757.6 17333.4 18633.4 20030.9 21533.2 23148.2 24305.6 25520.9 26797.0
India 31751.0 34926.1 38418.7 42260.5 46486.6 51135.2 56248.8 60467.4 65002.5 69877.7 75118.5 78874.4 82818.1 86959.1

SWH Market Assessment
Greentech Knowledge Solutions Page | 65
6.1.4 Hot Water Requirement
Based on the norms set out and hotel room projection in previous sections, we have worked out the hot water requirement for hotel rooms till 2020 (Table 6.9). It will grow from 38.41 million lpd in 2009 to 86.96 million lpd in 2020. The large requirement states are Maharashtra, Delhi, Rajasthan, Uttar Pradesh, Andhra Pradesh, Tamilnadu, Karnataka, Goa and Gujarat.
6.1.5 Present Penetration Rate of SWH in Hotels
The stakeholders, including SNA’s, in the course of our interviews, found it difficult to throw light on the existing base of hotel SWH capacity in a given state. However, they could hazard an estimate in terms of percentage-range share of hotel sector in the state total of SWH installations. The percentage-range share of hotel sector in a state has enabled us to build a picture as shown under Table 6.10 of state-wise penetration of SWH in hotels.
6.1.6 Alternative Scenarios
Pessimistic Scenario State-wise penetration rate of SWH in existing and new hotels for 2009 are taken from table 6.10. An annual growth of 5% in the penetration rate is assumed, except for Karnataka
Table 6.10: Classification of states as per penetration rate of SWH in hotels
Category SWH Penetration rate in hotels (% of the total hotel hot water demand met through SWH) -2009
SWH penetration rate in new-hotels
States
I 50 % 50% Karnataka II 25 % 25 % Maharashtra III 15% 20 % HP, Punjab, Haryana,
UK, Rajasthan, Goa, Tamil Nadu, Kerala, AP,
IV 10 % 20 % Delhi, UP, Bihar, MP, Chhatisgarh, Orissa, WB, Jharkhand
V 5 % 20 % N-E states, Sikkim

SWH Market Assessment
Greentech Knowledge Solutions Page | 66
Realistic Scenario Under this scenario, the penetration rate of SWH in new hotels, in the year 2022, in all the states would become 50% (current level of penetration of SWH in new hotels in Karnataka). For Karnataka it is assumed that the penetration level in new hotels would remain constant at 50%. Optimistic Scenario This scenario assumes greater penetration in existing hotels as well, with this the overall penetration rate of SWH in hotels would rise to 68% by 2022.
6.1.7 Results
Pessimistic: The cumulative installation of SWH in hotel sector is expected to grow from 193,660 m2 /year in 2010 to 920,340 m2/year in 2022 (figure 6.1). The deployment of SWH during 2010-2022 in hotel sector would be 0.727 million m2. Table 6.11 provides state-wise SWH deployment in hotel sector for the scenario. Realistic: The cumulative installation of SWH in hotel sector is expected to grow from 193,920 m2 /year in 2010 to 966,180 m2/year in 2022 (figure 6.1). The deployment of SWH during 2010-2022 in hotel sector would be 0.772 million m2. Table 6.12 provides state-wise SWH deployment in hotel sector for the scenario. Five states – Maharashtra, Tamil Nadu , Kerala, Delhi and Karnataka are expected to contribute to 61.7% of the installations under this scenario. Optimistic: The cumulative installation of SWH in hotel sector is expected to grow from 198,520 m2 /year in 2010 to 1,273,200 m2/year in 2022. The deployment of SWH during 2010-2022 in hotel sector would be 1.075 million m2 (figure 6.1). Table 6.13 provides state-wise SWH deployment in hotel sector for this scenario.

SWH Market Assessment
Greentech Knowledge Solutions Page | 67
0.00
0.20
0.40
0.60
0.80
1.00
1.20
1.40
2010 2013 2017 2022
million m
2Hotels: Cumulative SWH installation
Pessimistic Scenario Realistic Scenarion Optimistic Scenario
Figure 6.1: Cumulative SWH installation in million m2 under 3 scenarios for Hotels

SWH Market Assessment
Greentech Knowledge Solutions Page | 68
Table 6.11: State-wise cumulative SWH installation in m2 for Pessimistic Scenario - Hotels
State 2010 2013 2017 2022 Maharashtra 52,380 91,840 159,020 247,540 Tamil Nadu 19,240 34,880 61,220 96,200 Kerala 16,680 30,220 53,020 83,360 Delhi 13,740 26,260 47,080 75,180 Karnataka 24,500 38,120 56,620 73,200 Andhra Pradesh 12,080 21,880 38,420 60,380 Rajasthan 11,200 20,300 35,620 56,020 Goa 8,580 15,580 27,300 42,920 Uttar Pradesh 5,880 11,300 20,260 32,320 Gujarat 6,260 11,380 19,960 31,340 West Bengal 4,180 7,980 14,300 22,820 Punjab 4,360 7,880 13,820 21,700 Haryana 3,140 5,700 10,020 15,760 Madhya Pradesh 2,760 5,280 9,460 15,080 Himachal Pradesh 1,760 3,200 5,600 8,820 Uttranchal 1,360 2,480 4,360 6,860 Orissa 1,140 2,160 3,880 6,200 Chandigarh 1,120 2,060 3,600 5,640 Pondicherry 680 1,240 2,160 3,380 Assam 440 960 1,760 2,900 Bihar 440 860 1,520 2,420 Jammu &Kashmir 440 860 1,520 2,400 Jharkhand 360 680 1,220 1,980 Dadra & Nagar Haveli 260 540 1,040 1,680 Chhatisgarh 220 440 780 1,240 Andaman & Nicobar 140 300 580 940 Meghalaya 100 220 440 720 Tripura 100 180 360 600 Daman & Diu 80 180 320 540 Sikkim 20 20 60 140 Lakshadweep 20 20 40 40 Arunachal Pradesh ‐ ‐ 20 20 Manipur ‐ ‐ ‐ ‐ Mizoram ‐ ‐ ‐ ‐ Nagaland ‐ ‐ ‐ ‐ TOTAL 193,660 345,000 595,380 920,340

SWH Market Assessment
Greentech Knowledge Solutions Page | 69
Table 6.12: State-wise cumulative SWH installation in m2 for Realistic Scenario - Hotels
State 2010 2013 2017 2022 Maharashtra 52,400 92,060 159,900 250,080 Tamil Nadu 19,280 35,380 63,320 102,640 Kerala 16,720 30,680 54,900 88,980 Delhi 13,780 26,760 49,200 81,560 Karnataka 24,500 38,120 56,620 73,200 Andhra Pradesh 12,100 22,180 39,740 64,400 Rajasthan 11,240 20,620 36,900 59,780 Goa 8,600 15,780 28,220 45,720 Uttar Pradesh 5,900 11,500 21,120 35,000 Gujarat 6,260 11,500 20,600 33,420 West Bengal 4,180 8,120 14,920 24,740 Punjab 4,360 7,980 14,300 23,180 Haryana 3,160 5,800 10,380 16,840 Madhya Pradesh 2,760 5,380 9,860 16,360 Himachal Pradesh 1,760 3,240 5,800 9,400 Uttranchal 1,360 2,520 4,520 7,300 Orissa 1,140 2,200 4,060 6,740 Chandigarh 1,120 2,060 3,700 5,980 Pondicherry 680 1,240 2,220 3,600 Assam 440 960 1,840 3,220 Bihar 440 860 1,580 2,620 Jammu &Kashmir 440 860 1,580 2,620 Jharkhand 360 700 1,300 2,120 Dadra & Nagar Haveli 260 580 1,120 1,880 Chhatisgarh 220 440 800 1,340 Andaman & Nicobar 140 300 600 1,020 Meghalaya 100 260 480 820 Tripura 100 200 420 700 Daman & Diu 80 180 340 600 Sikkim 20 20 80 200 Lakshadweep 20 20 40 100 Arunachal Pradesh ‐ ‐ 20 20 Manipur ‐ ‐ ‐ ‐ Mizoram ‐ ‐ ‐ ‐ Nagaland ‐ ‐ ‐ ‐ TOTAL 193,920 348,500 610,480 966,180

SWH Market Assessment
Greentech Knowledge Solutions Page | 70
Table 6.13: State-wise cumulative SWH installation in m2 for Optimistic Scenario - Hotels
State 2010 2013 2017 2022 Maharashtra 52,440 92,260 160,580 251,740 Tamil Nadu 19,920 39,500 77,920 141,600 Delhi 14,520 31,860 68,460 138,080 Kerala 17,280 34,260 67,540 122,760 Andhra Pradesh 12,480 24,780 48,900 88,860 Rajasthan 11,620 23,020 45,400 82,480 Karnataka 24,500 38,120 56,620 73,200 Goa 8,880 17,620 34,720 63,080 Uttar Pradesh 6,220 13,700 29,400 59,260 Gujarat 6,480 12,840 25,360 46,100 West Bengal 4,400 9,660 20,760 41,880 Punjab 4,500 8,920 17,600 31,960 Madhya Pradesh 2,900 6,400 13,720 27,660 Haryana 3,260 6,480 12,780 23,240 Himachal Pradesh 1,820 3,620 7,140 12,980 Orissa 1,200 2,620 5,660 11,400 Uttranchal 1,420 2,820 5,560 10,080 Chandigarh 1,160 2,300 4,540 8,240 Assam 480 1,220 2,940 7,060 Pondicherry 700 1,380 2,720 4,980 Bihar 460 1,020 2,200 4,440 Jammu &Kashmir 460 1,020 2,200 4,420 Dadra & Nagar Haveli 280 740 1,740 4,100 Jharkhand 380 840 1,800 3,600 Andaman & Nicobar 160 400 940 2,280 Chhatisgarh 240 520 1,120 2,260 Meghalaya 120 320 760 1,800 Tripura 100 260 640 1,500 Daman & Diu 100 220 540 1,320 Sikkim 20 40 140 440 Lakshadweep 20 40 80 300 Arunachal Pradesh ‐ 20 40 100 Manipur ‐ ‐ ‐ ‐ Mizoram ‐ ‐ ‐ ‐ Nagaland ‐ ‐ ‐ ‐ TOTAL 198,520 378,820 720,520 1,273,200

SWH Market Assessment
Greentech Knowledge Solutions Page | 71
6.2 SWH Potential in Hospitals
6.2.1 Hospital Beds in India
A state-wise estimate of government hospital beds in 2007 is given under Table 6.14. There are estimated 482522 beds. There do not exist any statistics on the existence of private hospital beds in India. The Government of India, healthcare industry organization or healthcare specialist organizations have not put together, in public domain, either all-India or state-level information on private hospital beds. However, a recent report by Bureau of Energy Efficiency21, estimates number of all-India private beds as 500000 for 2008, which is almost equal to the number of beds available in the government hospitals (482522). Thus we have assumed similar state-wise distribution for private hospitals as Government hospitals for 2009.
21 BEE and ECO-III: Energy Efficiency in Hospitals – Best Practice Guide, March 2009

SWH Market Assessment
Greentech Knowledge Solutions Page | 72
Table 6.14: State-wise distribution of government hospitals and hospital beds
S. No.
State/UT Rural Hospitals Urban Hospitals Total Hospitals Reference
Period No. Beds No. Beds No. Beds
India 6,955 154,031 3,021 328,491 9,976 482,522 01.01.2007
1 Andhra Pradesh 167 6220 192 28113 359 34333 01.01.2007
2 Arunachal Pradesh 36 379 30 1674 66 2053 01.01.2005
3 Assam 100 3000 ‐ ‐ 100 3000 01.09.2004
4 Bihar 101 3030 ‐ ‐ 101 3030 01.09.2004
5 Chattisgarh 116 3514 22 2051 138 5565 01.01.2004
6 Goa 9 452 11 2127 20 2579 01.01.2007
7 Gujarat 1483 18832 229 22200 1712 41032 01.01.2008
8 Haryana 56 1178 93 6484 149 7662 01.01.2008
9 Himachal Pradesh 94 2146 55 5963 149 8109 01.01.2008
10 (a) Jammu Division 28 830 8 870 36 1700 01.01.2000
(b) Kashmir Division 33 990 23 1255 56 2245 01.01.2008
11 Jharkhand 47 1410 ‐ ‐ 47 1410 01.09.2004
12 Karnataka 444 7290 424 35301 868 42591 01.01.2007
13 Kerala 173 12450 77 15945 250 28395 01.01.2008
14 Madhya Pradesh 275 8179 102 11739 377 19918 01.01.2008
15 Maharashtra 424 15380 242 30593 666 45973 01.01.2007
16 Manipur 24 669 4 1251 28 1920 01.01.2008
17 Meghalaya 26 780 8 1839 34 2619 01.01.2007
18 Mizoram 10 320 10 904 20 1224 01.01.2008
19 Nagaland 123 1962 12 790 135 2752 01.01.2006
20 Orissa 1623 5882 84 8668 1707 14550 01.01.2008
21 Punjab 77 2100 172 8927 249 11027 01.01.2007
22 Rajasthan 347 11850 128 20217 475 32067 01.01.2008
23 Sikkim 29 700 3 820 32 1520 01.01.2008
24 Tamil Nadu 533 25078 48 22120 581 47198 01.01.2008
25 Tripura 16 500 15 1762 31 2262 01.01.2008
26 Uttar Pradesh 397 11910 528 20550 925 32460 01.01.2007
27 Uttarakhand 24 100 94 5413 118 5513 01.01.2007
28 West Bengal 99 5171 284 44510 383 49681 01.01.2008
29 A&N Island 6 355 1 450 7 805 01.01.2007
30 Chandigarh 2 50 5 2150 7 2200 01.01.2004
31 D&N Haveli 1 30 1 130 2 160 01.01.2008
32 Daman & Diu 2 52 2 140 4 192 01.01.2004
33 Delhi 21 972 102 20220 123 21192 01.01.2008
34 Lakshadweep 5 160 ‐ ‐ 5 160 01.01.2005
35 Puducherry 4 110 12 3315 16 3425 01.01.2008
(Source: BEE and ECO-III: Energy Efficiency in Hospitals – Best Practice Guide, March 2009)

SWH Market Assessment
Greentech Knowledge Solutions Page | 73
6.2.2 Development of Hot Water Requirement Norms
In hospitals, heat stream is used in the form of steam and hot water. Steam is used in the kitchens and for humidification in HVAC and sterilization process. In addition steam is used to transport heat over longer distances. In many cases heat is transported from the heat generating station in the form of steam and then converted locally into central heating or hot tap water. Oil/Gas-fired boilers are used to generate steam and hot water.
The hot water requirement in hospitals, theoretically, stems from three purposes
• Patient room • Laundry • Kitchen
The position is as follows. Bathroom Kitchen Laundry Govt Pvt Govt Pvt Govt Pvt Hospital up to 15 beds √ √ × × × × Hospital from to 16 to 50 beds √ √ limited limited × × Hospital with over 50 beds √ √ √ √ limited √
The laundry and kitchen are features of large corporate or public hospitals and these hospitals contribute a tiny percentage of total hospital beds in India. The kitchen requirement is for cleaning and works out under 5 litres per bed. For practical purpose, patient room or bathing constitutes the hot water requirement of hospitals. The arrangement, typically, is shower and/or bucket bath. There are patients who, for medical reasons, are required to abstain from bathing. The care-takers accompanying the patient, in many instances, do not bathe in the hospitals. These practices bring down the hot water consumption in a hospital. The hospital owners/managers interviewed by us estimated hot water consumption per bed around 25 lpd/bed for patients who are permitted to bathe. The hospital covered under the survey reported SWH provisioning at rates varying from 15 to 60 lpd/bed, the popular provisioning norm, though, is in the vicinity of 30 lpd/bed. We have, therefore, followed the norm of SWH provisioning @ 30 lpd/bed for government and private hospitals, except for modern multi-specialty private hospitals. For multi-specialty private hospitals a norm of 190 lpd/bed has been taken based on discussions with some prominent services consultants involved in the design of new multi-specialty private hospitals.

SWH Market Assessment
Greentech Knowledge Solutions Page | 74
6.2.3 Projected Hospital Beds and Hot Water Requirement
Not-withstanding the shortfall in beds/1000 population, the growth of beds in government hospitals is expected to be tardy- 2% pa till 2022. We expect private hospital growth @7% pa till 2013 and to taper to 5% over 2014-17 period and 3% pa thereafter. The gross number of hospital beds, estimated at 1.004 million in 2009 will grow to 1.58 million by 2022.
6.2.4 Hot Water Requirement
The total hot water requirement will escalate from 45.18 million lpd in 2009 to 75.11 million lpd in 2022. It is assumed that 20% of the private hospital beds are in multi-specialty private hospitals having a higher requirement of 190 lpd/bed, while for all other government and private hospitals hot water demand has been calculated @ 30 lpd/day.
6.2.5 Current Penetration Rate of SWH in Hospitals
Based on stakeholders consultations and assumptions made by the project team, the estimated current state-wise penetration rate of SWH in hospitals is shown in Table-6.15.
6.2.6 Alternative Scenarios
Pessimistic Scenario: The state-wise penetration rate of SWH in existing and new hospitals for 2009 are taken from table 6.15. An annual growth of 5% in the penetration rate is assumed.
Table 6.15: Classification of states as per penetration rate of SWH in hospitals
Category SWH Penetration rate in hospitals (% of the total hospital hot water demand met through SWH) -2009
SWH penetration rate in new-hospitals
States
I 20 % 50% Karnataka II 10 % 25 % Maharashtra III 5% 20 % HP, Punjab, Haryana, UK,
Rajasthan, Goa, Tamil Nadu, Kerala, AP,

SWH Market Assessment
Greentech Knowledge Solutions Page | 75
IV 2.5 % 20 % Delhi, UP, Bihar, MP, Chhatisgarh, Orissa, WB, Jharkhand
V 1 % 20 % N-E states, Sikkim Realistic Scenario: It assumes that the penetration rate of SWH in new hospitals, in the year 2022, in all the states would reach a level of 50%. For Karnataka it is assumed that the penetration level in new hospitals would remain constant at 50%. Optimistic Scenario: It assumes strong enforcement of mandatory provision in new hospitals along with a policy and awareness initiative to increase penetration in existing hospitals.
6.2.7 Results
Pessimistic: The cumulative installation of SWH in hospital sector is expected to grow from 97,418 m2 /year in 2010 to 402,625 m2/year in 2022. The deployment of SWH during 2010-2022 in hospital sector would be 0.3052 million m2 (figure 6.2). Table 6.16 provides state-wise SWH deployment in hospital sector for the scenario. Realistic: The cumulative installation of SWH in hospital sector is expected to grow from 97,615 m2 /year in 2010 to 426,446 m2/year in 2022. The deployment of SWH during 2010-2022 in hospital sector would be 0.3288 million m2 (figure 6.2). Table 6.17 provides state-wise SWH deployment in hospital sector for the scenario. Five states – Karnataka, Maharashtra, Tamil Nadu, Gujarat and West Bengal are expected to contribute to 58.0% of the installations under the scenario. Optimistic: The cumulative installation of SWH in hospital sector is expected to grow from 103,643 m2 /year in 2010 to 958,118 m2/year in 2022. The deployment of SWH during 2010-2022 in hospital sector would be 0.8545 million m2 (figure 6.2). Table 6.18 provides state-wise SWH deployment in hospital sector for the scenario.

SWH Market Assessment
Greentech Knowledge Solutions Page | 76
0.00
0.20
0.40
0.60
0.80
1.00
1.20
2010 2013 2017 2022
million m
2
Hospitals: Cumulative SWH installation
Pessimistic Scenario Realistic Scenarion Optimistic Scenario
Figure 6.2: Cumulative SWH installation in million m2 under 3 scenarios for Hospitals

SWH Market Assessment
Greentech Knowledge Solutions Page | 77
Table 6.16: State-wise cumulative SWH installation in m2 for Pessimistic Scenario - Hospitals
State 2010 2013 2017 2022 Karnataka 26,435 41,282 62,653 91,501 Maharashtra 14,482 23,111 36,245 55,058 Tamil Nadu 8,197 13,979 22,607 34,730 Gujarat 7,127 12,155 19,657 30,197 West Bengal 5,366 10,295 17,471 27,302 Andhra Pradesh 5,965 10,171 16,448 25,266 Rajasthan 5,570 9,500 15,362 23,599 Kerala 4,934 8,413 13,604 20,897 Uttar Pradesh 3,506 6,727 11,414 17,838 Delhi 2,290 4,393 7,452 11,647 Madhya Pradesh 2,151 4,127 7,003 10,944 Punjab 1,915 3,267 5,283 8,116 Orissa 1,572 3,016 5,117 7,996 Himachal Pradesh 1,409 2,402 3,884 5,967 Haryana 1,331 2,270 3,671 5,639 Uttranchal 958 1,632 2,639 4,057 Chhatisgarh 601 1,152 1,957 3,058 Pondicherry 595 1,015 1,641 2,520 Jammu &Kashmir 426 817 1,386 2,167 Goa 448 763 1,234 1,897 Bihar 328 629 1,067 1,666 Chandigarh 383 650 1,052 1,617 Assam 205 461 826 1,313 Nagaland 188 424 756 1,204 Meghalaya 180 403 719 1,147 Tripura 154 348 622 988 Arunachal Pradesh 141 316 566 899 Manipur 131 296 529 842 Jharkhand 152 293 495 773 Sikkim 104 233 418 665 Mizoram 83 188 337 536 Andaman & Nicobar 55 124 222 354 Daman & Diu 14 30 53 85 Dadra & Nagar Haveli 11 25 45 70 Lakshadweep 11 25 45 70 TOTAL 97,418 164,932 264,479 402,625

SWH Market Assessment
Greentech Knowledge Solutions Page | 78
Table 6.17: State-wise cumulative SWH installation in m2 for Realistic Scenario (Hospitals)
State 2010 2013 2017 2022 Karnataka 26,435 41,282 62,653 91,501 Maharashtra 14,488 23,171 36,481 55,696 Tamil Nadu 8,221 14,235 23,602 37,495 Gujarat 7,148 12,379 20,524 32,602 West Bengal 5,390 10,570 18,531 30,240 Andhra Pradesh 5,981 10,356 17,170 27,275 Rajasthan 5,585 9,673 16,038 25,477 Kerala 4,947 8,565 14,200 22,559 Uttar Pradesh 3,522 6,907 12,107 19,758 Delhi 2,300 4,509 7,904 12,900 Madhya Pradesh 2,161 4,237 7,428 12,122 Orissa 1,579 3,095 5,425 8,854 Punjab 1,921 3,326 5,515 8,759 Himachal Pradesh 1,414 2,447 4,056 6,443 Haryana 1,336 2,312 3,833 6,089 Uttranchal 960 1,663 2,757 4,382 Chhatisgarh 604 1,184 2,076 3,388 Pondicherry 596 1,034 1,715 2,723 Jammu &Kashmir 427 839 1,472 2,401 Goa 450 780 1,292 2,051 Bihar 329 645 1,132 1,847 Chandigarh 384 663 1,099 1,747 Assam 207 478 890 1,490 Nagaland 190 440 817 1,369 Meghalaya 181 418 777 1,301 Tripura 155 360 671 1,123 Arunachal Pradesh 141 326 607 1,019 Manipur 132 306 570 955 Jharkhand 154 301 526 858 Sikkim 104 242 451 755 Mizoram 84 196 364 608 Andaman & Nicobar 55 128 238 400 Daman & Diu 14 30 56 96 Dadra & Nagar Haveli 11 26 49 80 Lakshadweep 11 26 49 80 TOTAL 97,615 167,148 273,073 426,446

SWH Market Assessment
Greentech Knowledge Solutions Page | 79
Table 6.18: State-wise cumulative SWH installation in m2 for Optimistic Scenario - Hospitals
State 2010 2013 2017 2022 West Bengal 5,966 14,615 35,398 97,389 Karnataka 26,492 41,593 63,552 93,662 Tamil Nadu 8,936 18,833 40,354 92,517 Maharashtra 15,182 27,258 49,646 92,195 Gujarat 7,770 16,376 35,088 80,436 Andhra Pradesh 6,501 13,700 29,356 67,301 Uttar Pradesh 3,898 9,550 23,127 63,630 Rajasthan 6,072 12,797 27,419 62,860 Kerala 5,377 11,333 24,280 55,660 Delhi 2,545 6,235 15,100 41,543 Madhya Pradesh 2,392 5,859 14,191 39,043 Orissa 1,747 4,280 10,366 28,520 Punjab 2,087 4,400 9,429 21,614 Himachal Pradesh 1,536 3,237 6,934 15,896 Haryana 1,451 3,059 6,553 15,022 Chhatisgarh 668 1,637 3,965 10,910 Uttranchal 1,043 2,200 4,714 10,808 Jammu &Kashmir 473 1,160 2,811 7,733 Pondicherry 648 1,367 2,930 6,715 Bihar 365 892 2,161 5,942 Assam 228 642 1,721 5,881 Nagaland 208 590 1,580 5,395 Meghalaya 199 560 1,503 5,133 Goa 490 1,031 2,207 5,056 Tripura 172 484 1,298 4,432 Chandigarh 416 877 1,880 4,312 Arunachal Pradesh 155 438 1,177 4,024 Manipur 146 411 1,103 3,764 Sikkim 114 325 872 2,978 Jharkhand 170 415 1,004 2,762 Mizoram 93 262 703 2,399 Andaman & Nicobar 61 173 460 1,577 Daman & Diu 15 41 109 377 Dadra & Nagar Haveli 13 35 93 316 Lakshadweep 13 35 93 316 TOTAL 103,643 206,701 423,176 958,118

SWH Market Assessment
Greentech Knowledge Solutions Page | 80
6.3 SWH Potential in Hostel Sector
6.3.1 Hostel rooms in India
There does not exist any estimate of hostel rooms in India. Under the circumstances, we have been required to develop it on the basis of available evidence. We have utilized the following assumptions.
• The hostel bed capacity in India is linked largely to professional higher education. It is assumed that “general” higher education does not entail any worthwhile demand for hostels.
• It is not possible to estimate precisely niche streams of hostel demand- school children, working women, vocational course students, general higher education programmes. These together are taken at 20% of the demand from professional higher education students. The estimate is made after considering the absolute number of professional higher education hostel-staying students.
• Within the professional higher education stream, there are the following typologies.
o Students who stay at home o Students who rent out apartments or make similar other
arrangements o Private house owners who house say 10 to 15 students in a hostel-
like arrangement o Students who live in organized on-campus or off-campus hostel
having capacity to house over 15 students. • We have considered the last category as SWH- relevant and assumed that it
forms 25% of the students pursuing higher professional education. • There were 15.55 million higher education students in 2006-07 (Table 6.19).
15% of these were enrolled in technical and professional streams- 2.33 million22.
• There are 16890 higher education institutes in India (Table 6.20) in 2006;.31.6% of which are professional/deemed universities/national institutes.
• The students are divided among states based on the number of professional/ deemed universities and national institutes in the respective states (Table 6.21).
• The students staying in organized hostels are estimated at 25% of all students, enrolled for higher professional education (Table 6.22); 0.58 million in 2006.
22 Indian Education Services- A Hot Opportunity

SWH Market Assessment
Greentech Knowledge Solutions Page | 81
• In addition there are 0.12 million other students– schools, vocational courses, general higher education, etc. who stay in organized hostels and need hot water
• We have followed SWH provisioning norm of 30 lpd/student.
Table 6.19: Actual Number of Higher Education Students
2004 2005 2006 East Arunachal Pradesh 6745 8839 10550 East Assam 214342 217652 215761 East Bihar 553693 524856 539738 East Chhattisgarh 163254 195604 199670 East Jharkhand 209176 260625 262088 East Manipur 38679 38177 40457 East Meghalaya 30716 38658 40540 East Mizoram 12180 14575 13844 East Nagaland 13644 28965 28242 East Orissa 367187 413269 438550 East Sikkim 6596 8985 10171 East Tripura 22447 24845 26102 East West Bengal 746509 787228 835825 Sub-Total 2385168 2562278 2661538 North Delhi 709169 867400 1183892 North Haryana 264331 298146 353484 North Himachal Pradesh 103628 108982 121865 North Jammu & Kashmir 80405 158667 132812 North Punjab 279707 347641 373461 North Rajasthan 394478 488530 524381 North Uttar Pradesh 1507991 1760595 1903489 North Uttrakhand 131742 163961 175153 North Chandigarh 51309 55077 57193 Sub-Total 3522760 4248999 4825730 South Andhra Pradesh 1056719 1411103 1520724 South Karnataka 706241 951786 1061456 South Kerala 313155 450577 451367 South Tamil Nadu 809366 1324359 1587532
South Andaman & Nicobar Islands 2706 3438 3641
South Lakshadweep 0 0 259 South Puducherry 20199 31154 32454 Sub-Total 2908386 4172417 4657433 West Goa 21643 23748 23919 West Madhya Pradesh 758418 968760 995362 West Maharashtra 1534613 1681789 1806825 West Dadra & Nagar Haveli 0 0 0 West Gujarat 645689 664347 580770 Sub-Total 2960982 3339872 3408155 India 11777296 14323566 15552856
Source: Indiastat.com

SWH Market Assessment
Greentech Knowledge Solutions Page | 82
Table 6.20: Number of Higher Education Institutes In 2006
College for General Education
College for Professional Education
Deemed Universities/national institutes Total
East Arunachal Pradesh 10 5 2 17 East Assam 348 28 7 383 East Bihar 743 57 13 813 East Chhattisgarh 213 29 8 250 East Jharkhand 113 26 7 146 East Manipur 58 9 2 69 East Meghalaya 54 4 1 59 East Mizoram 26 4 1 31 East Nagaland 37 4 1 42 East Orissa 700 144 11 855 East Sikkim 3 6 1 10 East Tripura 14 6 1 21 East West Bengal 374 179 20 573 Sub-Total 2693 501 75 3269 North Delhi 68 66 17 151 North Haryana 168 146 8 322 North Himachal Pradesh 95 48 5 148 North Jammu & Kashmir 65 149 6 220 North Punjab 232 152 8 392 North Rajasthan 751 200 20 971 North Uttar Pradesh 1637 331 33 2001 North Uttrakhand 86 28 9 123 North Chandigarh 12 10 3 25 Sub-Total 3114 1130 109 4353 South Andhra Pradesh 1603 810 21 2434 South Karnataka 930 539 23 1492 South Kerala 189 183 10 382 South Tamil Nadu 490 699 35 1224 South Andaman & Nicobar 3 3 0 6 South Lakshadweep 0 0 0 0 South Puducherry 17 38 1 56 Sub-Total 3232 2272 90 5594 West Goa 23 18 1 42 West Madhya Pradesh 760 159 17 936 West Maharashtra 1208 613 41 1862 West Daman & Diu 1 2 0 3
West Dadra & Nagar Haveli 0 1 0 1
West Gujarat 518 295 17 830 Sub-Total 2510 1088 76 3674 India 11549 4991 350 16890
Source: www.education.nic.in annual report 2007-08

SWH Market Assessment
Greentech Knowledge Solutions Page | 83
Table 6.21: Estimated No of Technical and Professional Higher Education Students 2009 2010 2011 2012 2013 2014 2015 2016 2017 2018 2019 2020 Arunachal Pradesh 1729 1781 1835 1890 1946 2005 2065 2127 2191 2256 2324 2394 Assam 35365 36426 37519 38644 39804 40998 42228 43495 44800 46144 47528 48954 Bihar 88468 91122 93856 96671 99571 102559 105635 108804 112069 115431 118894 122460 Chhattisgarh 32728 33710 34721 35762 36835 37940 39079 40251 41458 42702 43983 45303 Jharkhand 42959 44247 45575 46942 48350 49801 51295 52834 54419 56051 57733 59465 Manipur 6631 6830 7035 7246 7464 7687 7918 8156 8400 8652 8912 9179 Meghalaya 6645 6844 7050 7261 7479 7703 7934 8172 8418 8670 8930 9198 Mizoram 2269 2337 2407 2480 2554 2631 2709 2791 2875 2961 3050 3141 Nagaland 4629 4768 4911 5058 5210 5366 5527 5693 5864 6040 6221 6408 Orissa 71882 74039 76260 78548 80904 83331 85831 88406 91058 93790 96604 99502 Sikkim 1667 1717 1769 1822 1876 1933 1991 2050 2112 2175 2240 2308 Tripura 4278 4407 4539 4675 4815 4960 5109 5262 5420 5582 5750 5922 West Bengal 136999 141109 145343 149703 154194 158820 163584 168492 173547 178753 184116 189639 Sub-Total 436250 449338 462818 476702 491003 505734 520906 536533 552629 569208 586284 603872 Delhi 194051 199872 205868 212044 218406 224958 231707 238658 245818 253192 260788 268611 Haryana 57939 59677 61468 63312 65211 67167 69182 71258 73396 75598 77865 80201 Himachal Pradesh 19975 20574 21191 21827 22482 23156 23851 24566 25303 26063 26844 27650 Jammu & Kashmir 21769 22422 23095 23788 24501 25236 25993 26773 27576 28404 29256 30134 Punjab 61214 63050 64942 66890 68896 70963 73092 75285 77544 79870 82266 84734 Rajasthan 85951 88529 91185 93921 96738 99641 102630 105709 108880 112146 115511 118976 Uttar Pradesh 311999 321359 331000 340930 351158 361692 372543 383720 395231 407088 419301 431880 Uttrakhand 28709 29570 30458 31371 32312 33282 34280 35309 36368 37459 38583 39740 Chandigarh 9374 9656 9945 10244 10551 10868 11194 11529 11875 12232 12598 12976 Sub-Total 790981 814710 839152 864326 890256 916964 944472 972807 1001991 1032051 1063012 1094902 Andhra Pradesh 249260 256738 264440 272374 280545 288961 297630 306559 315756 325228 334985 345035 Karnataka 173982 179202 184578 190115 195819 201693 207744 213976 220396 227007 233818 240832 Kerala 73983 76203 78489 80843 83269 85767 88340 90990 93720 96531 99427 102410 Tamil Nadu 260211 268017 276058 284339 292870 301656 310705 320027 329627 339516 349702 360193 Andaman & Nicobar 597 615 633 652 672 692 713 734 756 779 802 826 Lakshadweep 42 44 45 46 48 49 51 52 54 55 57 59 Puducherry 5320 5479 5643 5813 5987 6167 6352 6542 6739 6941 7149 7363 Sub-Total 763395 786297 809886 834183 859208 884985 911534 938880 967046 996058 1025940 1056718 Goa 3921 4038 4159 4284 4413 4545 4681 4822 4966 5115 5269 5427 Madhya Pradesh 163149 168043 173085 178277 183625 189134 194808 200652 206672 212872 219258 225836 Maharashtra 296155 305040 314191 323617 333325 343325 353625 364233 375160 386415 398008 409948 Daman & Diu 210 216 222 229 236 243 250 258 266 274 282 290 Gujarat 95193 98049 100991 104020 107141 110355 113666 117076 120588 124206 127932 131770 Sub-Total 558627 575386 592648 610427 628740 647602 667030 687041 707653 728882 750749 773271 India 2549254 2625731 2704503 2785639 2869208 2955284 3043942 3135261 3229319 3326198 3425984 3528764

SWH Market Assessment
Greentech Knowledge Solutions Page | 84
Table 6.22: Estimated No of Technical and Professional Higher Education Hostel Students
2009 2010 2011 2012 2013 2014 2015 2016 2017 2018 2019 2020 Arunachal Pradesh 432 445 459 472 487 501 516 532 548 564 581 598 Assam 8841 9107 9380 9661 9951 10249 10557 10874 11200 11536 11882 12238 Bihar 22117 22780 23464 24168 24893 25640 26409 27201 28017 28858 29723 30615 Chhattisgarh 8182 8427 8680 8941 9209 9485 9770 10063 10365 10676 10996 11326 Jharkhand 10740 11062 11394 11736 12088 12450 12824 13208 13605 14013 14433 14866 Manipur 1658 1708 1759 1812 1866 1922 1980 2039 2100 2163 2228 2295 Meghalaya 1661 1711 1762 1815 1870 1926 1984 2043 2104 2168 2233 2300 Mizoram 567 584 602 620 638 658 677 698 719 740 762 785 Nagaland 1157 1192 1228 1265 1303 1342 1382 1423 1466 1510 1555 1602 Orissa 17971 18510 19065 19637 20226 20833 21458 22102 22765 23448 24151 24875 Sikkim 417 429 442 455 469 483 498 513 528 544 560 577 Tripura 1070 1102 1135 1169 1204 1240 1277 1315 1355 1396 1437 1481 West Bengal 34250 35277 36336 37426 38548 39705 40896 42123 43387 44688 46029 47410 Sub-Total 109063 112334 115704 119176 122751 126433 130226 134133 138157 142302 146571 150968 Delhi 48513 49968 51467 53011 54601 56239 57927 59664 61454 63298 65197 67153 Haryana 14485 14919 15367 15828 16303 16792 17296 17814 18349 18899 19466 20050 Himachal Pradesh 4994 5144 5298 5457 5620 5789 5963 6142 6326 6516 6711 6912 Jammu & Kashmir 5442 5606 5774 5947 6125 6309 6498 6693 6894 7101 7314 7533 Punjab 15303 15763 16235 16722 17224 17741 18273 18821 19386 19967 20567 21183 Rajasthan 21488 22132 22796 23480 24185 24910 25657 26427 27220 28037 28878 29744 Uttar Pradesh 78000 80340 82750 85232 87789 90423 93136 95930 98808 101772 104825 107970 Uttrakhand 7177 7393 7614 7843 8078 8320 8570 8827 9092 9365 9646 9935 Chandigarh 2344 2414 2486 2561 2638 2717 2798 2882 2969 3058 3150 3244 Sub-Total 197745 203678 209788 216082 222564 229241 236118 243202 250498 258013 265753 273726 Andhra Pradesh 62315 64185 66110 68093 70136 72240 74407 76640 78939 81307 83746 86259 Karnataka 43496 44800 46144 47529 48955 50423 51936 53494 55099 56752 58454 60208 Kerala 18496 19051 19622 20211 20817 21442 22085 22747 23430 24133 24857 25602 Tamil Nadu 65053 67004 69014 71085 73217 75414 77676 80007 82407 84879 87425 90048 Andaman & Nicobar 149 154 158 163 168 173 178 183 189 195 201 207 Lakshadweep 11 11 11 12 12 12 13 13 13 14 14 15 Puducherry 1330 1370 1411 1453 1497 1542 1588 1636 1685 1735 1787 1841 Sub-Total 190849 196574 202472 208546 214802 221246 227884 234720 241762 249014 256485 264179 Goa 980 1010 1040 1071 1103 1136 1170 1205 1242 1279 1317 1357 Madhya Pradesh 40787 42011 43271 44569 45906 47284 48702 50163 51668 53218 54815 56459 Maharashtra 74039 76260 78548 80904 83331 85831 88406 91058 93790 96604 99502 102487 Daman & Diu 52 54 56 57 59 61 63 64 66 68 70 73 Gujarat 23798 24512 25248 26005 26785 27589 28416 29269 30147 31051 31983 32943 Sub-Total 139657 143847 148162 152607 157185 161901 166758 171760 176913 182221 187687 193318 India 637313 656433 676126 696410 717302 738821 760986 783815 807330 831550 856496 882191

SWH Market Assessment
Greentech Knowledge Solutions Page | 85
6.3.2 SWH Projection
The hot water demand of higher professional education students staying in organized hostels and that of all students staying hostels is given under Table 6.23 and Table 6.24 respectively. Realistic Scenario: We expect varied penetration of SWH vis-à-vis the zones. Our estimate is as follows.
Zone Beginning penetration 2010
Penetration in 2020
South 5 25 North 2 15 West 3 20 East 1 10
The SWH potential will grow from 0.696 million lpd in 2010 to 6.89 million lpd in 2022 (Table 6.25). This translates to 0.124 million m2 of SWH installation during 2010- 2022. The overall SWH penetration in the hostel sector will touch 20.5% in 2022.

SWH Market Assessment
Greentech Knowledge Solutions Page | 86
Table 6.23: Estimated Hot Water Demand of Professional Higher Education Hostel Students (‘000 lpd)
2009 2010 2011 2012 2013 2014 2015 2016 2017 2018 2019 2020 Arunachal Pradesh 13 13 14 14 15 15 15 16 16 17 17 18 Assam 265 273 281 290 299 307 317 326 336 346 356 367 Bihar 664 683 704 725 747 769 792 816 841 866 892 918 Chhattisgarh 245 253 260 268 276 285 293 302 311 320 330 340 Jharkhand 322 332 342 352 363 374 385 396 408 420 433 446 Manipur 50 51 53 54 56 58 59 61 63 65 67 69 Meghalaya 50 51 53 54 56 58 60 61 63 65 67 69 Mizoram 17 18 18 19 19 20 20 21 22 22 23 24 Nagaland 35 36 37 38 39 40 41 43 44 45 47 48 Orissa 539 555 572 589 607 625 644 663 683 703 725 746 Sikkim 13 13 13 14 14 14 15 15 16 16 17 17 Tripura 32 33 34 35 36 37 38 39 41 42 43 44 West Bengal 1027 1058 1090 1123 1156 1191 1227 1264 1302 1341 1381 1422 Sub-Total 3272 3370 3471 3575 3683 3793 3907 4024 4145 4269 4397 4529 Delhi 1455 1499 1544 1590 1638 1687 1738 1790 1844 1899 1956 2015 Haryana 435 448 461 475 489 504 519 534 550 567 584 602 Himachal Pradesh 150 154 159 164 169 174 179 184 190 195 201 207 Jammu & Kashmir 163 168 173 178 184 189 195 201 207 213 219 226 Punjab 459 473 487 502 517 532 548 565 582 599 617 636 Rajasthan 645 664 684 704 726 747 770 793 817 841 866 892 Uttar Pradesh 2340 2410 2482 2557 2634 2713 2794 2878 2964 3053 3145 3239 Uttrakhand 215 222 228 235 242 250 257 265 273 281 289 298 Chandigarh 70 72 75 77 79 82 84 86 89 92 94 97 Sub-Total 5932 6110 6294 6482 6677 6877 7084 7296 7515 7740 7973 8212 Andhra Pradesh 1869 1926 1983 2043 2104 2167 2232 2299 2368 2439 2512 2588 Karnataka 1305 1344 1384 1426 1469 1513 1558 1605 1653 1703 1754 1806 Kerala 555 572 589 606 625 643 663 682 703 724 746 768 Tamil Nadu 1952 2010 2070 2133 2197 2262 2330 2400 2472 2546 2623 2701 Andaman & Nicobar Islands 4 5 5 5 5 5 5 6 6 6 6 6 Lakshadweep 0 0 0 0 0 0 0 0 0 0 0 0 Puducherry 40 41 42 44 45 46 48 49 51 52 54 55 Sub-Total 5725 5897 6074 6256 6444 6637 6837 7042 7253 7470 7695 7925 Goa 29 30 31 32 33 34 35 36 37 38 40 41 Madhya Pradesh 1224 1260 1298 1337 1377 1419 1461 1505 1550 1597 1644 1694 Maharashtra 2221 2288 2356 2427 2500 2575 2652 2732 2814 2898 2985 3075 Daman & Diu 2 2 2 2 2 2 2 2 2 2 2 2 Gujarat 714 735 757 780 804 828 852 878 904 932 959 988 Sub-Total 4190 4315 4445 4578 4716 4857 5003 5153 5307 5467 5631 5800
India 1911
9 1969
3 2028
4 2089
2 2151
9 2216
5 2283
0 2351
4 2422
0 2494
6 2569
5 2646
6

SWH Market Assessment
Greentech Knowledge Solutions Page | 87
Table 6.24: Estimated Hot Water Demand of All Hostel Students (‘ 000 lpd) 2009 2010 2011 2012 2013 2014 2015 2016 2017 2018 2019 2020 Arunachal Pradesh 16 16 17 17 18 18 19 19 20 20 21 22 Assam 318 328 338 348 358 369 380 391 403 415 428 441 Bihar 796 820 845 870 896 923 951 979 1009 1039 1070 1102 Chhattisgarh 295 303 312 322 332 341 352 362 373 384 396 408 Jharkhand 387 398 410 422 435 448 462 476 490 504 520 535 Manipur 60 61 63 65 67 69 71 73 76 78 80 83 Meghalaya 60 62 63 65 67 69 71 74 76 78 80 83 Mizoram 20 21 22 22 23 24 24 25 26 27 27 28 Nagaland 42 43 44 46 47 48 50 51 53 54 56 58 Orissa 647 666 686 707 728 750 772 796 820 844 869 896 Sikkim 15 15 16 16 17 17 18 18 19 20 20 21 Tripura 39 40 41 42 43 45 46 47 49 50 52 53 West Bengal 1233 1270 1308 1347 1388 1429 1472 1516 1562 1609 1657 1707 Sub-Total 3926 4044 4165 4290 4419 4552 4688 4829 4974 5123 5277 5435 Delhi 1746 1799 1853 1908 1966 2025 2085 2148 2212 2279 2347 2418 Haryana 521 537 553 570 587 605 623 641 661 680 701 722 Himachal Pradesh 180 185 191 196 202 208 215 221 228 235 242 249 Jammu & Kashmir 196 202 208 214 221 227 234 241 248 256 263 271 Punjab 551 567 584 602 620 639 658 678 698 719 740 763 Rajasthan 774 797 821 845 871 897 924 951 980 1009 1040 1071 Uttar Pradesh 2808 2892 2979 3068 3160 3255 3353 3453 3557 3664 3774 3887 Uttrakhand 258 266 274 282 291 300 309 318 327 337 347 358 Chandigarh 84 87 90 92 95 98 101 104 107 110 113 117 Sub-Total 7119 7332 7552 7779 8012 8253 8500 8755 9018 9288 9567 9854 Andhra Pradesh 2243 2311 2380 2451 2525 2601 2679 2759 2842 2927 3015 3105 Karnataka 1566 1613 1661 1711 1762 1815 1870 1926 1984 2043 2104 2167 Kerala 666 686 706 728 749 772 795 819 843 869 895 922 Tamil Nadu 2342 2412 2485 2559 2636 2715 2796 2880 2967 3056 3147 3242 Andaman & Nicobar Islands 5 6 6 6 6 6 6 7 7 7 7 7 Lakshadweep 0 0 0 0 0 0 0 0 0 0 1 1 Puducherry 48 49 51 52 54 56 57 59 61 62 64 66 Sub-Total 6871 7077 7289 7508 7733 7965 8204 8450 8703 8965 9233 9510 Goa 35 36 37 39 40 41 42 43 45 46 47 49 Madhya Pradesh 1468 1512 1558 1604 1653 1702 1753 1806 1860 1916 1973 2033 Maharashtra 2665 2745 2828 2913 3000 3090 3183 3278 3376 3478 3582 3690 Daman & Diu 2 2 2 2 2 2 2 2 2 2 3 3 Gujarat 857 882 909 936 964 993 1023 1054 1085 1118 1151 1186 Sub-Total 5028 5178 5334 5494 5659 5828 6003 6183 6369 6560 6757 6959
India 2294
3 2363
2 2434
1 2507
1 2582
3 2659
8 2739
5 2821
7 2906
4 2993
6 3083
4 3175
9

SWH Market Assessment
Greentech Knowledge Solutions Page | 88
Table 6.25: Projected SWH Installation (‘000 ltrs) –Realistic Scenario
2010 2011 2012 2013 2014 2015 2016 2017 2018 2019 2020 2021 2022 South 5 7 9 11 13 15 17 19 21 23 25 27 29 North 2 4 6 8 10 10 12 14 15 15 15 15 15 West 3 5 7 9 11 13 15 15 17 19 20 21 22 East 1 2 3 4 5 6 7 8 9 9 10 11 12 2010 2011 2012 2013 2014 2015 2016 2017 2018 2019 2020 2021 2022 South 354 510 676 851 1035 1231 1436 1654 1883 2124 2378 2662 2981 North 147 302 467 641 825 850 1051 1263 1393 1435 1478 1522 1568 West 155 267 385 509 641 780 928 955 1115 1284 1392 1509 1636 East 40 83 129 177 228 281 338 398 461 475 543 621 710 Total 696 1162 1656 2178 2729 3142 3753 4269 4852 5317 5791 6314 6894 Penetration % 2.95 4.78 6.6 8.43 10.3 11.5 13.3 14.7 16.2 17.2 18.23 19.32 20.48

SWH Market Assessment
Greentech Knowledge Solutions Page | 89
Chapter 7. Industries
7.1 Introduction Hot water and steam are used in a variety of industries. Some of the important segments are:
• Textile • Dairy • Drug and pharmaceuticals • Pulp and paper • Food processing • Electroplating • Fertilizer • Leather
In addition, most of the organized small, medium and large industries have canteens, which also require hot water. The potential applications of SWH in the industries are:
• Pre-heating of boiler feed water: In this application, either full or part of the boiler feed water is heated in solar water heaters to a temperature of 60-80oC before being supplied to the boiler. This replaces part of the fuel used in the boiler. In general, maximum fuel savings possible are of the order of 5%. From the point of integration with the existing process, this is simple to implement. The economics of this option becomes favourable when petroleum fuels are being used. The pay-back period after considering depreciation and subsidy benefits for a furnace oil based industry is reported to be around 3 years, while for a coal using industry, the pay-back period is around 5-6 years.23
• Heating of process hot water: There are several industrial processes e.g.
electroplating, textile dyeing, cleaning/degreasing, drying, etc. which require hot water below 100oC. In these applications, solar water heater in conjunction with a conventional water heating system can be used. In such cases, the fuel savings are much larger, but the system integration generally is more complex. The economics of this option becomes favourable when petroleum fuel or electricity is being used.
23 CII. Case-study booklet on Renewable Energy. 2009

SWH Market Assessment
Greentech Knowledge Solutions Page | 90
• Canteen applications: Industrial canteens exist in most of the organized
small, medium and large industries. Hot water is required for both cooking as well as washing of utensils, hands etc.
7.2 Textile Industry Textile is one of the largest industries in the country. The total production of cloth in the country was 49871 million m2 in 2007-08 24. The industry is growing at a rate of around 5% annually. Major part of the steam requirement in a textile industry is in the chemical processing department. In chemical processing, the grey cloth is given various chemical treatments to make it acceptable for the ultimate end use. Some of the chemical processes are scouring, bleaching, dyeing, mercerizing, printing, curing etc. The steam consumption depends on a large number of factors – main being – choice of process and machines and type of cloth. In this study we have taken typical steam requirement as 20 kg of steam/kg of cloth. A list of important textile clusters in India is provided in Table 7.1
Table 7.1: List of important textile clusters for exploring potential of SWH
Textile Cluster Products
Panipat Bed covers, towels, shawls, durries, blankets,etc.
Coimbatore Textiles Tiruppur Knitted garments Salem Garments Ludhiana Knitted garments Ahmedabad Woven garments Surat Textiles Bhilwara Textiles Sanganer (Jaipur) Dying and Printing Okhala (Delhi) Woven garments Noida (UP) Woven garments Bangalore Woven garments Mumbai Woven garments Jabalpur (MP) Woven garments Kanpur Knitted garmenst
During the field survey, some textile units located at Ludhiana, Ahmedabad, Gurgaon were visited. One of the most important barriers in deployment of solar water heaters in textile industry is use of low-cost solid fuels like biomass and coal which results in
24 NCAER. Assessing the prospects for India’s Textile and Clothing Sector. July 2009.

SWH Market Assessment
Greentech Knowledge Solutions Page | 91
longer pay-back periods for SWH. A large number of textile dyeing units come under unorganized and small-scale sector and availability of adequate space is also an issue for installing SWH systems. Interaction with dyeing industry revealed that at this point of time their main concern is in meeting water pollution norms and in setting-up of common effluent treatment plants; also several of the industries have already gone for energy conservation measures such as condensate recovery, which has reduced the scope for pre-heating of boiler feed water using SWH.
7.3 Dairy Industry
India is the largest producer of milk in the world. The milk production in the country was estimated at around 94.5 million MT in 200525, the milk production is expected to grow to 120 million MT by 2012. The milk production in the country is growing at a rate of around 4% per year. In 1995, only 17% of the total milk produced is processed in the formal dairy sector, this is expected to go up to 36% in 2012. There are around 700 milk processing plants in the formal dairy sector. Cooperative dairy federations account for almost 60% of the milk processing in the formal dairy sector, processing around 10 million MT of milk per year in 2005. Among private players, Nestle India, Hindustan Lever Ltd. and Britannia are some of the important players. Table 7.2 provides the details of state-wise milk processing capacity in the cooperative sector. Thermal energy is used for various processes e.g. pasteurization, washing etc. Typical thermal energy consumption in dairies is given in Table 7.3. Specific thermal energy depends on the product-mix as well as the process and machinery used. SWH are used for pre-heating boiler feed water or for generating hot water that is directly used for cleaning and other process applications. A case study on SWH use in a dairy is provided in box 7.1.
25 The Babcock Institute. Dairy Industry in India. 2007

SWH Market Assessment
Greentech Knowledge Solutions Page | 92
Source: Gujarat Energy Development Agency
Table 7.2: State-wise milk processing capacity in the cooperative sector
State No.of Plants
Milk processing capacity
LPD Gujarat 19 6595000Maharashtra 29 3820000Andhra Pradesh 12 2437000Bihar 10 720000Haryana 5 470000Karnataka 15 2130000Kerala 9 900000Punjab 9 1525000MP 5 1030000Orissa 5 135000UP 16 1680000Rajasthan 15 1425000West Bengal 5 1510000Tamil Nadu 15 2700000Himachal Pradesh 3 30000Total 172 27107000
Source: The Babcock Institute. Dairy Industry in India. 2007
Box 7.1 SWH System at Panchmahal Dairy, Godhara A Solar Water Heating System of capacity 20000 Lits/Day has been installed and commissioned at Panchmahal Dairy Godhara . This system produces 20000 liters of hot water at 80-degree centi. Temperature. Hot water produced by Solar System is used as pre heated boiler feed water and helps to save about 110 lit of furnace oil per day. The system consist of 236 Nos. of Solar Flat Plate Collectors, and insulated tank of 20000 lit capacity for storage of hot water. Controls are provided for automatic functioning of the system. Necessary instruments are provided for regular monitoring of the system.

SWH Market Assessment
Greentech Knowledge Solutions Page | 93
Table 7.3: Typical Specific Thermal Energy Consumption
Dairy Specific thermal energy (kcal/Ton) Dairy A, Surat 40000 Dairy B, Nagpur 83000 Dairy C, Maharashtra 57000 Average 60000
Source: Information on energy conservation award winning dairies, available on Bureau of Energy Efficiency web-site www.bee-india.nic.in
7.4 Pharmaceutical and Drugs During the primary survey, some pharmaceutical and drug companies located at Hyderabad were visited. Some of them were using SWH for pre-heating boiler feed water. One such case-study is given in box 7.2. A list of important pharmaceutical and drug clusters is provided in table 7.4.
Table 7.4: Pharmaceutical and Drug Clusters in India
Cluster Product Delhi Pharmaceuticals Ahmedabad Pharmaceuticals Mumbai, Thane and Belapur Basic drugs Hyderabad Drugs
Box 7.2: Synthokem Labs Pvt. Ltd., Hyderabad This is one of the few examples where an Industrial user has chosen solar water heaters for economical reasons and successfully implemented it in their production process. Their factory which used to be in an industrial estate is now part of a residential area as Hyderabad city has expanded. Being in a residential zone there are restrictions on fuels with high particle content. So they use furnace oil for boilers, which they found to be too expensive and highly volatile. As the price of furnace oil rose in mid 2000, the company started to look at ways to cut on fuel costs. With the help of consultants they concluded it was worth trying solar water heaters to pre heat the water fed into the boiler to reduce the furnace oil consumption in the boiler. With a 10,000 litre system they found they could raise the water temperature by 30 oC thereby reducing the energy cost by 16%. They believe the payback is around 2 years if the solar water heaters are reducing furnace oil consumption. Now they have become passionate advocates of solar water heaters and offer advice and support to other factories.

SWH Market Assessment
Greentech Knowledge Solutions Page | 94
7.5 Electroplating Electroplating is one of the varieties of several techniques of metal finishing. It is a technique of deposition of a fine layer of one metal on another through electrolytic process to impart various properties and attributes, such as corrosion protection, enhanced surface hardness, luster, colour, aesthetics, value addition etc. Electroplating operations are either performed as a part of manufacturing process by large scale manufacturing plants (e.g. automobile, cycle, engineering and numerous other industries) or performed as job-work for a wide variety of components by small and tiny units. These are spread across the entire country. However certain states have large number of units concentrated in some towns / cities. The list of clusters is given in table 7.5.
Table 7.5: List of Important Electroplating Clusters
Maharashtra Mumba, Pune, Nashik Karnataka Bangalore Tamil Nadu Chennai, Madurai Andhra Pradesh Hyderabad Punjab Ludhiana Delhi & NCR Faridabad, Haryana, Okhla, Manesar Gujarat Ahmedabad and Rajkot
During the field survey, Kangaroo Industries, Ludhiana was visited. The company is the market leader in office equipments and products and has more that 100000 LPD of solar water heater installations at its factories at Ludhiana and Nalagarh (HP). Over last few years, the company has progressively added more capacity of SWH. It was interesting to note that none of the other electroplating industries in Ludhiana, which happens to be a large cluster of electroplating industry, is using SWH. The experience indicates that in several industries, integration of SWH with the existing process is a major issue. In general, this knowledge does not exist with the SWH manufacturers/suppliers and they have to rely completely on the knowledge of the sector experts or technical manpower in the industry to design and implement a SWH system.
7.6 Food Processing Industries The food processing sector is highly fragmented industry, it widely comprises of the following sub-segments: fruits and vegetables, beer and alcoholic beverages, meat and poultry, marine products, grain processing, packaged or convenience food and packaged drinks. A huge number of entrepreneurs in this industry are small in terms of their production and operations, and are largely concentrated in the unorganized segment. Several of the food processing units require hot water or steam for

SWH Market Assessment
Greentech Knowledge Solutions Page | 95
processing. One of the strategies for targeting SWH growth in food processing industry could be to focus on food parks which are being set-up at various locations in the country. A food park provides common infrastructure to food processing industries and has a large concentration of such industries. A list of food parks approved by Ministry of Food Processing Industries is provided in table 7.6
Table 7.6: List of Food Parks
Ministry of Food Processing Industries STATEMENT OF FOOD PARKS APROVED FOR FINANCIAL
ASSISTANCE S.No State Location of the
Project Implementing Agency Year
Approval 1 2 3 4 5 1 Andhra
Pradesh Kuppam, Dist -Chittor
Andhra Pradesh Industrial Infrastructure corporation Ltd
2000-01
2 Assam Chaygaon, Distt, Kamrup
Assam small Industries Development Corporation Ltd.
2000-01
3 Bihar Hajipur, District Vaishali
North Bihar Ind Area Dev, Authority, C/o Department of Industries
2002-03
4 Chhatisgarh Vill-Teadesara, Dist-Rajnandgaon
Chhatisgarh State Industrial Development Corporation
2001-02
5 Haryana Saha, Dist. Ambala Haryana State Ind. Dev. Corporation Ltd.
2001-02
6 Haryana Raj, Dist-Sonipat Haryana State Ind. Dev. Corporation Ltd.
2001-02
7 Jammu & Kashmir
Khumoh, Distt-Srinagar
J&K State Industrial Development Corporation Ltd.
2000-01
8 Jammu & Kashmir
Sopore, Baramulia J&K State Industrial Development Corporation Ltd. (J&K SIDCO)
2002-03
9 Jammu & Kashmir
Jammu Jammu Agro Industrial food Park,
2001-02
10 Karnataka Malur, Distt-Kolar, M/S Innova Agri-Bio Park Ltd. 2000-01
11 Karnataka bagalkot M/S Green Food Park Limited 2000-01 12 Karnataka Jevargi M/S Jewargi Agro Food Park 2002-03
13 Karnataka Hirriyur M/S Akshya Food park Limited 2006-07

SWH Market Assessment
Greentech Knowledge Solutions Page | 96
14 Kerala Distt. Mallapuram Kerala industrial Infrastructure Development Corporation
1996-97
15 Kerala Aroor, Distt-Alappuzha,
Marine Products infrastructure Development Corporation P. Ltd. 9MIDCON)/Seafood Park India Ltd.
2001-02
16 Kerala Mazhuvannur, Ernakulam
Kerala industrial Infrastructure Development Corporation (KINFRA)
2002-03
17 Kerala Adoor Kerala industrial Infrastructure Development Corporation (KINFRA)
2005-06
18 Madhya Pradesh
Jaggakhedi, Distt-Mandsaur,
Madhya Pradesh Audyogic Kendrra Vikas Nigam (Indore) Ltd.
2000-01
19 Madhya Pradesh
Nimrani, Dist, Khargone,
Madhya Pradesh Audyogic Kendrra Vikas Nigam (Indore) Ltd.
2001-02
20 Madhya Pradesh
Piparia Babai, Distt Hoshangabad
Madhya Pradesh Audyogic Kendrra Vikas Nigam (Indore) Ltd.
2001-02
21 Madhya Pradesh
Borgaon, Distt. Chhindwara
M.P.Audyogik Kendra, Vikas Nigam (Jabalpur) Ltd.
2001-02
22 Madhya Pradesh
Malan[pur, Ghirongi, Distict Bhind (M.P)
M.P.Audyogik Kendra, Vikas Nigam (Gwalior) Ltd.
2002-03
23 Madhya Pradesh
Maneri, Distt. Mandla
M.P.Audyogik Kendra, Vikas Nigam (Jabalpur) Ltd.
2002-03
24 Maharashtra Butibori, Distt. Nagpur,
Maharashtra Agro Industries Development Corporation Ltd.
200-01
25 Maharashtra Vinchur, Distt, Nashik
Maharashtra Industrial Development Corporation
2001-02
26 Maharashtra Mouza Gumthala, Bhandara Road, Dist. Nagpur.
M/S Haldiram Krishi Udyog Pvt. Ltd. Dist. Nagpur.
2002-03
27 Maharashtra Village Sangvi, Distt. Satara
M/S Agrifood Informatics (India) Ltd, Pune- 411013
2002-03
28 Maharashtra Palus, Distt-Sangli Maharashtra Industrial Development Corporation
2003-04
29 Maharashtra Kapsi, Taluka Kamtee, Distt. Nagpur
M/S Maa Umiya Audyogic Sahakari Vasahat Maryadit
2005-06

SWH Market Assessment
Greentech Knowledge Solutions Page | 97
30 Maharashtra MIDC Industrial Area, Shendra, Aurangbad
M/S Laxmi Nirmal Pratisthan 2006-07
31 Manipur Lamphelpat, Imphal Manipur Food industries Corporation Ltd.
2001-01
32 Manipur Distt-Ukhrul Rishang Keishing Foundation for Management of tribal Areas
20014-02
33 Mizoram Chhingchip, Mizoram Food and Allied Industries
2001-02
34 Nagaland Bamunpukri, Dimapur
Progressive Rural Development Society
2006-07
35 Orissa Khurda Orissa indl. Infrastructure Development Corporation
2001-02
36 Punjab Sirhind, Distt, Fatehgarh Sahib
Punjab Agri Export Corporation 2000-01
37 Rajasthan Ranpur, Distt. Kota. Rajasthan state Industrial Development & Investment Corporation ltd. (RIICO)
2002-03
38 Rajasthan Boranada, District- Jodhpur
Rajastha State Industrial Development & Investment Corporation Ltd. (RIICO),
2002-03
39 Rajasthan Sri Ganganagar Rajastha State Industrial Development & Investment Corporation Ltd. (RIICO),
2003-04
40 Rajasthan Alwar Rajastha State Industrial Development & Investment Corporation Ltd. (RIICO),
2006-07
41 Tamilnadu Virudhunagar, Distt. Madurai
V.P.S. Ayyemperumal Nadar & sons.
2000-01
42 Tamilnadu Dindigul District Nilakottai Food Park Ltd. 2004-05 43 Tripura Bodhjungnagar, west
Tripura Tripura Industrial Development Corporation Ltd.
2000-01
44 Uttar Pradesh
Ghaziabad Wise Industrial Park Ltd. 1999-00
45 Uttar Pradesh
Kharkion, Distt.-Varanasi
U.P State Industrial Development Corporation Ltd.
2000-01
46 Uttar Pradesh
Shahajanwa, gorakhpur
Gorakhpur Industrial Dev. Authority.
2004-05
47 Uttar Pradesh
Village Kushalipur, District Saharanpur
M/S Kushal International Limited.
2002-03

SWH Market Assessment
Greentech Knowledge Solutions Page | 98
48 Uttar Pradesh
Kursi Road, Distt.-Barabanki
U.P State Industrial Development Corporation Ltd.
2000-01
49 West Bengal Chakgaria, 24 Parganas (South)
State Fishermen's Cooperative Ltd. (BENFISH), Kolkata
1998-99
50 West Bengal Dankuni, Distt. Hooghly
Modular Consultants Pvt. Ltd. 1996-97
51 West Bengal Haldia District Midnapore.
Haldia Development Authority, Haldia,
2002-03
52 West Bengal Sultanpur, South 24 Parganas
State Fishermen's Cooperative Ltd. (BENFISH), Kolkata
2003-04
53 West Bengal Malda Deptt. Of Food Processing Industries and Horticulture, Govt. of West Bengal.
2003-04
54 West Bengal Shankarapur, Dist. Purba Medinipur
Department of Fisheries, Aquaculture, Aquatic Resources, Govt. of West Bengal,
2004-05
55 West Bengal Sankhrail, Howrah West Bengal Industrial Development Corporation (WBIDC)
2004-05
56 West Bengal Murshidabad M/S Pataka Industries Limited 2005-06
Source: http://mofpi.nic.in accessed on 22 December 2009
7.7 Projection of Demand of SWH in Industries The projection of demand of SWH in industries has been done industry sector wise using the following methodology:
a. Estimating the total production for 2009 and subsequently till 2022. b. Taking a norm for specific thermal energy consumption or steam consumption
based on information collected from the industry. c. Calculation of steam consumption per year. d. Calculation of maximum SWH potential by assuming that SWH can provide
5% of the heating requirement for producing steam. Considering the fact the industries using coal and biomass the pay-back period for SWH is long (5-8 years) and hence the potential for acceptance is very low (please refer to pay-back acceptance schedule in figure 7.1)26, these have not been considered and the potential has been calculated only for industries using petroleum fuels.
26 Pillai I.R., Banerjee, R., 2007. Methodology for estimation of potential for solar water heating in a target area. Solar Energy 81 , 162-172.

SWH Market Assessment
Greentech Knowledge Solutions Page | 99
e. Using progressively increasing penetration rate of SWH to calculate the cumulative SWH installations
Figure 7.1: Payback acceptance schedule25
The projected demand for SWH in industries is shown in figure 7.2 and table 7.7. The cumulative SWH area for industrial applications is expected to grow to 1.05 million m2 by 2022. It is expected that dairy and textile would provide around 70 % of the new demand; the rest of the demand would be by other industries and industrial canteens.
Figure 7.2: Year wise cumulative SWH projection for Industries

SWH Market Assessment
Greentech Knowledge Solutions Page | 100
Table 7.7: Year wise cumulative SWH projection for Industries in m2
Year Up to 2009 Dairy Textile Others TOTAL 2010 158,000 10,806 11,519 13,975 194,300 2013 158,000 50,150 53,462 64,856 326,468 2017 158,000 123,575 131,735 159,812 573,123 2022 158,000 264,991 282,489 342,695 1,048,174
7.8 Conclusions The projections done for industries should be seen as preliminary assessment. Given the complexity of issues involved and no mandatory provisions for the sector, it is necessary to conduct detailed studies of individual sectors (even clusters) and have interactions with industry bodies and concerned government departments e.g. agencies running the industrial energy efficiency programme (BEE) and Industry Departments/Ministries to come up with sector specific strategies. Advent of ESCOs has the potential to open-up this sector. If we consider the Low Pressure Steam requirements, industries offer a huge potential, and from that point of view MNRE should take a combined view of solar thermal applications in industries taking all solar thermal technologies i.e. FPC, ETC and solar concentrators together.
SWH Market Assessment
Greentech Knowledge Solutions Page | 101
Chapter 8. Rural Sector
Hot water requirement in rural areas is mainly for following sectors/segments:
• Households • Primary health centers • Hostels • Dhabas • Rural industries: micro, small and informal industries located in rural areas
e.g. silk reeling, puffed-rice, rice mills, textile dyeing, dairy, fruit and vegetable processing, etc.
8.1 Hot water consuming segments Residential Sector Biomass is the main fuel for heating water in rural areas of the country. Very little information is available on hot water use and energy used for heating water in rural areas of India. Most of the studies on household energy in rural areas do not provide break-up of energy use for cooking and water heating separately, the main reason being that the same device i.e. cook stove is used for both the end-uses. The highest requirement of hot water in rural households is in the cold region of the country, which essentially consists of the Himalayan states.
• A study in Ladakh has found actual hot water consumption in rural household to vary between 15 litres to 110 litres per day27. The large variation in the amount of hot water consumed depends on the fuel availability and economic status of the family.
• Another study in Kandaghat block of Shimla district28, found that on an average a household, consumed about 50 liters of hot water per day during winter months. Hot water is mainly required for bathing, washing of clothes and for cleaning of utensils. The study further estimated that a household
27 TERI. Renewable Energy Master Plan for Ladakh. 1998 28 R Prasad , S Maithel and A Mirza. Solar Water Heaters for Rural Communities in Indian Himalayas – Experiences from a Pilot Project in Himachal Pradesh. Eds.R L Sawhney , D Buddhi and R P Gautam . Renewable Energies and Energy Efficiency for Sustainable Development, Proceedings of the 23rd National Energy Convention ‘ 99, Indore, December 20-22, 1999.

SWH Market Assessment
Greentech Knowledge Solutions Page | 102
consumed about 720 kg of firewood per year for water heating, which is about 15 % of the total annual firewood consumption.
• The use of hot water is also high in the hilly areas of Western Ghats. A study
on fuel use in rural households in Uttar Kannada district of Karnataka reported a high consumption of 1.7 kg/capita/day of biomass for water heating 29.
Primary Health Centres Primary health centres and their sub-centres meet the health care needs of rural population. Each PHC covers a population of 1,00,000 and is spread over about 100 villages. It has 4 - 6 beds for patients. The activities of Primary Health Centres involve curative, preventive, primitive and Family Welfare Services. There are 23236 PHCs functioning as on September 2005 in the country30. Each PHC is estimated to have hot water requirement in the range of 100 – 200 lpd.
Hostels A large number of hostels attached to schools run by Government e.g. Ministry of Tribal Affairs as well as by a variety of NGOs exists. Hot water requirement is for cooking as well as bathing. Dhabas A large number of dhabas (mostly in rural areas) exist on the highways. Hot water is required for cooking as well as for cleaning of utensils. Rural Industries
There are several rural industries that require hot water. Some of these are:
a. Silk reeling: Hot water is required for reeling operation. There are estimated to
be around 60,000 silk reeling ovens in the country31. b. Textile dyeing: Hot water is required for dyeing operation. There are several
rural clusters engaged in textile/ yarn dyeing and fabric printing.
29 T. V. Ramachandra, D. K. Subramanian, N. V. Joshi, S. V. Gunaga and R. B. Harikantra. Domestic energy consumption patterns in Uttara Kannada District, Karnataka State, India. Energy Conversion and Management Volume 41, Issue 8, May 2000, Pages 775-831. 30 http://india.gov.in/citizen/health/primary_health.php 31 Mande S and Kishore VVN. Towards Cleaner Technologies: A process Story on Biomass Gasifier for Heat applications in small and micro enterprises. TERI. 2007

SWH Market Assessment
Greentech Knowledge Solutions Page | 103
c. Puffed rice making and rice flake making: Hot water is required for soaking paddy during puffed rice and rice flake making operations. There are estimated to be 50,000 puffed-rice making units32 and around 500 rice flake making units, most of them are located in villages or small towns.
d. Rice mills: Hot water is required for soaking paddy. e. Dairy – milk collection centers: Hot water is required for cleaning of drums
and vessels. It estimated that around 80,000 villages are engaged in production of milk for the organized dairy sector.
8.2 Barriers in Use of SWH At present, use of SWH in rural areas is very limited. During the primary survey, some instances of use of conventional SWH was found in high-income rural households in parts of Karnataka, Kerala, Punjab, Himachal Pradesh and Uttarakhand. The main barriers in use of conventional SWH systems in rural areas are:
• High initial cost of the system • Longer pay-back period as the fuel replaced is low-cost biomass fuel • Lack of piped water supply • Absence of SWH supply chain • Difficulty in installing conventional SWH systems on sloping roofs made of
metal sheets, thatch, etc.
During the literature survey and primary survey some instances of innovations were observed. These include:
• Collector and storage type SWH in Ladakh • Community solar water heaters in Himachal Pradesh
Box 8.1 Collector and Storage Type SWH in Ladakh One of the potential technologies which should have a good potential in rural areas is a low cost collector cum storage SWH. This type of systems have been found to be very useful in Ladakh. These solar water heaters consist of a thin metal tank (painted black); has insulation at the back, and has a glass glazing on the front side. The systems in Ladkah has a capacity of 30 liters and has been found to provide at least 30 liters of water at a temperature of 50oC for a minimum of 250 days in a year. One of the local NGO was involved in manufacturing and installations of these systems. (Source: Renewable Energy Master Plan for Ladakh. TERI /MNRE. 1998)
32 Srinivas S N . Design and Development of 25 kW Integrated Wood Gasifier System for Production of Puffed Rice. Ph D Thesis. B.V. Bhoomaraddi College of Engineering and Technology Hubli. 2009
SWH Market Assessment
Greentech Knowledge Solutions Page | 104
Box 8.2 Pilot Project On Use of Community Solar Water Heaters in Villages of Himachal Pradesh The concept of community solar water heaters of about 750 lpd for small rural hill communities of about 15 households was successfully demonstrated at three sites in Himachal Pradesh. Involvement of villagers, particularly women and local NGOs was the highlight of the implementation approach. No major technical problem was faced during first two years of the operation. A simplified monitoring approach involving users in data collection was adopted for monitoring the performance of the installed SWHs. The data collected for the first year of operation showed that a 750 lpd community SWH resulted in fuel savings of about 18000 kg of fire wood per annum. During the monitoring, seasonal variation in hot water withdrawn from SWH as well as daily load profile for hot water use were also recorded. Economic analysis showed that the life-cycle cost per liter of hot water supplied from SWH was Rs 0.12/liter. On life cycle cost basis, the community solar water heater matches the present method of water heating using traditional chulha with firewood as fuel. (Source: R Prasad , S Maithel and A Mirza. Solar Water Heaters for Rural Communities in Indian Himalayas – Experiences from a Pilot Project in Himachal Pradesh. Proceedings of the 23rd National Energy Convention ‘ 99, Indore, December 20-22, 1999)
8.3 SWH strategy for rural areas A two-pronged strategy is suggested for rural areas:
• Technology innovation to develop low-cost appropriate products to meet
requirements of different rural applications is a must for opening up this potentially large market for solar water heaters. Here an example of water purifier industry is useful, where product innovation has resulted in opening-up of a large market for water purifiers in rural and small town segment (Box 8.3)
The UNDP/GEF project may initiate work to understand in much greater detail: • The demand for hot water in rural areas (quantity, time of the day, application) • The issues in installation of SWH in rural houses. • The economics of the present water heating practices.
Such a study would then lead the way for suitable SWH product identification /development.

SWH Market Assessment
Greentech Knowledge Solutions Page | 105
• In parallel, a demonstration programme can be launched to install more SWH systems in dhabas, PHCs, hostels and community SWHs. Monitoring should be an integral part of the programme so that necessary data can be collected to establish feasibility of SWH technology.
Box 8.3: Water Purification Market
Product, Technology, Pricing and Distribution Innovations
Introduction in 1980’s: Zero B meant to derive clean tap water. No electricity required. Game-changer: UV-based purifiers in late 1980’s. market dominated by two large players. UV held sway over the market for a decade. Upscaled Product: RO purifiers. Several consumer durable companies entered business. Problem-Solution Product: RO price averages Rs. 16000. UV price-band is Rs. 7000 to 8000. 80% of Indian households cannot afford either. So, chemical purifiers priced in Rs. 1000 – 2000 band entered the market. Neither electricity nor continuous water- supply required for chemical purifiers. 20% of water purifiers in use are now low- priced chemical purifiers, whose sale is driven by two large Indian companies. Bottom of The Pyramid Product To be launched soon by a top Indian company. A rice-husk based bulb, to be priced at Rs. 299 and to be sold through grocery-shops. No after-sale support. Can purify 3000 ltrs (annual requirement). The value proposition moves away from consumer durable to Rs. 1 per day for water-purification and outgo of Rs. 299 per year. customer risk vastly cut. Market Growth In 2008, 5.2 million or 2.6% of households in India used water purifiers; thanks to product- innovation. The chemical purifiers, in physical terms, are expected, to outpace UV/Ro market growth. The overall market is growing @ 25% in rupee terms. If Rs. 299 product works out, industry expects exponential growth. There is intense competition among six large players.

SWH Market Assessment
Greentech Knowledge Solutions Page | 106

SWH Market Assessment
Greentech Knowledge Solutions Page | 107
Chapter 9. Conclusions
9.1 SWH Global Market In 2008, the cumulative SWH capacity was 15 GWth. Growth in recent years has been 15% per year. There are estimated 40 million households (2.5% of the total) which were using SWH worldwide in 2004. China is the leader; 10% of Chinese households use SWH; the target for 2020 being 30%. In 2008, 65.6% of existing global SWH capacity was in China; followed by European Union (12.3%), Turkey (5.8%), Japan (4.1%) and Israel (2.8%). The Indian share was 1.2%. The residential sector is the mainstay of SWH in the two largest SWH markets; 98% of annual sale in China and 90% of installed capacity in Europe is in the residential sector. The market is urban-centric; 90% of installations in China are in urban areas. While households-level SWH in Europe are installed predominantly in independent houses, it is both-independent houses and multi-storied buildings-in China.
9.2 Indian Market
The segment-wise statistics on Indian market are not available. Based on our work, we have pieced together the following picture.
Estimated Breakup: Functional SWH Installations Till 2009
Sector million m2
Residential (80%) 2.108
Hotels (6%) 0.158
Hospitals (3%) 0.079
Industry (6%) 0.158
Other (Railway + Defence + Hostel + Religious places,
other) (5%)
0.132
Total 2.635
* It is assumed that 85% of the installed SWH are functional
SWH Market Assessment
Greentech Knowledge Solutions Page | 108
The sale during 2009 is estimated at 0.55 million m2. The CAGR of cumulative installation during 1995-2000 was 8.23%. It spurted to 20.6% during 2000-04 and further to 24.6% during 2004-08, denoting overall CAGR of 16.8% over 1995-2008. The following explains demand upsurge in recent years.
• Growth in new urban housing; rising disposable income; increased propensity for consumer durables
• Arrival of ETC & improvements in supply chain • Energy price hike • Policy initiatives
9.3 Primary Survey: Key Findings
In the residential sector, there are 0.7 million SWH user households; 65% of which are concentrated in Karnataka and Maharasthra. There is overall satisfaction with product- experience; some concern being voiced over after-sale support. The use of SWH-water is mainly for bathing. The average size of the domestic installations that were surveyed is around 150 lpd. Among non-users, in states other than Karnataka/Maharashtra, there is sketchy awareness of the bare concept of SWH. The customers perceive it as a product suited for independent houses and not so much for apartment buildings. Hot water demand expressed though months/year and supply chains are important demand drivers. The high demand regions report hot water demand for ≥ 9 months/year, while the lower end is 4 months/year. In the hotel sector, SWH experience exists across regions and hotel/guest-house standards. The provisioning recognizes year-round demand for hot water. The use of expensive petroleum fuels and electricity support the case for SWH. Roof availability, for 15 room upward capacity hotels, is not a significant barrier. However, capital cost is a major consideration. Among hospitals and hostels, awareness/exposure levels are low; compared to hotels. Supply hour management/regulation is a key advantage for both. Roof availability is not a noticeable constraint.
The SWH experience among industries is limited and scattered. Heating of boiler feed water is the major application. Some of the candidate industries –rice-mills, pulp and paper, tea-gardens, leather, textile processing-utilize biomass and coal; lengthening the payback period. It is industries utilizing oil-fired boilers-mainly dairy, fertilizer and sub-set of textile which are the prime markets for SWH. In addition, there are industrial canteens. The report enumerates geographical clusters, where SWH- relevant industries are concentrated. In the rural sector, the households, dhabas, primary health-centers, hostels and village- industries (silk-reeling, textile-dyeing, puffed rice-making) are the main segments. The capital cost, recourse to biomass, lack of piped water supply, roof
SWH Market Assessment
Greentech Knowledge Solutions Page | 109
design/strength and virtual absence of supply chain are the roadblocks. The report highlights a low-cost innovative product introduced in Ladakh and a community-level positive experience in Himachal Pradesh. The development of rural market warrants large, fresh work in terms of product-development, demonstration, policy and promotion of supply chain.
9.4 Industry Structure, Supply Conditions And Value Proposition There are two technologies in vogue; flat plate collector and evacuated tube collector; the later has flourished on the strength of import of glass tubes from China. There are 113 approved Indian producers. The largest player market share is under 15%. The producers do not have nation-wide, SWH- specific brand equity. The dealer network is limited. The manufacturing is concentrated in southern India and Maharashtra. Barring ETC, there have not been any major product/technology breakthrough in last two decades. The system cost for a household varies from Rs. 20000 to Rs. 60000, depending on size and standard. It is positioned as an electricity-saving consumer durable. ESCO or pay-per-use models have not been attempted in a significant way.
9.5 Approach To Estimating Realizable Potential The empirical data, over a period of time, in terms of SWH sale, its region-wise and segment-wise breakup and behaviour of relevant variations is not available. The present installations are concentrated in Karnataka and Maharashtra; compounding the inadequacy of data required for all-India model-building. We were required to devote considerable effort to the task of estimating present and future stock of housing, hotel-rooms, hospital-beds, hostel-beds, etc. The establishment of hot water- consumption norms involved a probe into the applications and working out weighted average since norms vary across hotel/hospital categories. We have identified the parameters driving demand and built three scenarios for demand projection-realistic or most likely; optimistic and pessimistic which are, both, considered less likely. Our estimates in terms of SWH penetration and CAGR, for a given segment under the concerned scenario, recognizes the following.
• Historical trends and best-case (Karnataka) performance • Assessment of potential based estimated growth for a given segment and its
response to SWH; considering payback period prospect, • Variations in SWH penetration vis-à-vis new and old buildings

SWH Market Assessment
Greentech Knowledge Solutions Page | 110
9.6 SWH Potential Projection Under realistic scenario, we estimate demand as follows (cumulative million m2)33.
2010 2013 2017 2022
Residential 2.58 4.25 7.68 15.74
Commercial/Institutional
• Hotels 0.19 0.35 0.61 0.97
• Hospitals 0.10 0.17 0.27 0.43
• Others 0.18 0.27 0.39 0.52
Industry 0.19 0.33 0.57 1.05
Total 3.24 5.37 9.52 18.70
Residential sector would remain the largest sector and would contribute to 84% of the cumulative installations.
33 1 m2 = 50 lpd
Residential84%
Commercial and Institutional
10%
Industries6%
Figure 9.1: Percentage-share of sectors in SWH installations 2022
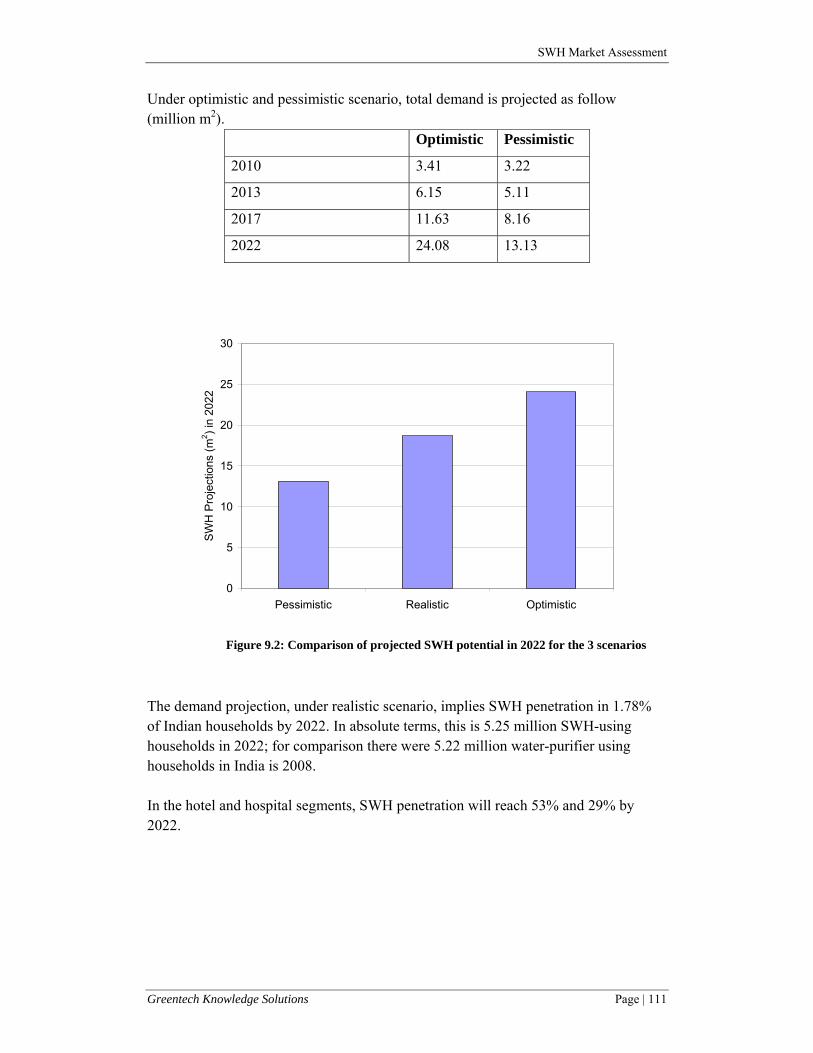
SWH Market Assessment
Greentech Knowledge Solutions Page | 111
Under optimistic and pessimistic scenario, total demand is projected as follow (million m2).
Optimistic Pessimistic
2010 3.41 3.22
2013 6.15 5.11
2017 11.63 8.16
2022 24.08 13.13
The demand projection, under realistic scenario, implies SWH penetration in 1.78% of Indian households by 2022. In absolute terms, this is 5.25 million SWH-using households in 2022; for comparison there were 5.22 million water-purifier using households in India is 2008. In the hotel and hospital segments, SWH penetration will reach 53% and 29% by 2022.
0
5
10
15
20
25
30
Pessimistic Realistic Optimistic
SWH
Pro
ject
ions
(m2 ) i
n 20
22
Figure 9.2: Comparison of projected SWH potential in 2022 for the 3 scenarios

SWH Market Assessment
Greentech Knowledge Solutions Page | 112
9.7 Spatial Distribution of Projected Demand
Five states will lead demand-expansion, as is evident from the following table.
Table.9.1: Five top states (cumulative SWH potential in million m2 for 2022 under the realistic
scenario)
State Residential million m2
Commercial/ Institutional million m2
Total (Excluding Industrial) million m2
Karnataka 3.72 0.16 3.88 Maharashtra 3.5 0.31 3.80 Tamil Nadu 1.53 0.14 1.67 Andhra Pradesh 1.08 0.09 1.17 Gujarat 0.90 0.06 0.96 %age of 5 states 67.10%
Further analysis of demand at the district level shows that a large part of the demand would come from selected urbanized districts. Some of the key districts (out of the 29 surveyed districts) which have large potential are listed in the table below: Table.9.2: Selected districts with large SWH potential (cumulative SWH potential in million m2
for 2022 under the realistic scenario)
District/Region SWH potential (excluding industry) million m2
Bangalore 1.94 Pune 1.11 National Capital Region 0.77 Thane 0.68 Hyderabad 0.58 Nagpur 0.38 Kolkata 0.36 Chennai 0.35 Coimbatore 0.33 Ahmedabad 0.29 Jaipur 0.27

SWH Market Assessment
Greentech Knowledge Solutions Page | 113
9.8 Recommendations for Key Areas for Action We have identified 10 key action points for MNRE and UNDP/GEF project. In our view these actions are important for realizing the potential of SWH in the country and achieving targets set under JNNSM. Please note that these do not follow any specific order of priority. 1. Select high-potential districts for implementation The analysis presented in the report shows that the adoption of SWH depends primarily on the demand for hot water, regulations, SWH supply chain and paying capacity of the users. As presented in the previous section, a large part of the demand is concentrated in urban centres. Given this reality, MNRE should identify 10-20 districts and focus its attention on implementing SWH programme during the first phase of JNNSM (2010-2013) in these districts. 2. Implementation through Electricity Distribution Companies There is a need to provide soft-term loan and, depending on the region and building vintage, a financial incentive to promote the market over next 5 to 8 years. Electricity distribution companies are the most appropriate vehicle to operate the package. The customer will appreciate readily the proposition of electricity-saving, rebate on electricity bill and outgo on account of SWH- purchase for a specified period because the company will make a single, consolidated proposal; smoothening all transactions. The distribution companies are also best equipped to operate compulsory installation policy for new buildings as well as old ones requiring extra power. They will build a clear database of installations, loan/rebate provided, SWH- performance and electricity saving. MNRE should set-up a working group to initiate a dialogue with Ministry of Power, Electricity Sector Regulators and Electricity Distribution Companies to develop a SWH programme of implementation through Electricity Distribution Companies by 2011. 3. Implementation-Oriented Mandatory Regulations Mandatory regulations would remain a very important tool for developing market for SWH. Thus, it is imperative that the SWH mandatory regulations addresses the essential legal, administrative and technical issues and outlines the implementation mechanism. Prioritization and phasing might help, e.g., the policy may focus on new buildings above a cut-off point and limit itself to selected cities initially; extending the target-constituency and city-list over time. MNRE should initiate work with selected (3-5) municipal corporations and state governments having prior experience in implementing SWH mandatory regulations to update the regulations and develop a fool-proof strategy for its implementation.
SWH Market Assessment
Greentech Knowledge Solutions Page | 114
4. Strategy for Multi-storied Buildings Given the shift towards multi-storey residential buildings, addressing water heating in multi-storey residential buildings through solar water heaters would be the key to realize potential in residential sector. A package of mandatory regulations, techno-managerial solutions, working models and best practices and incentives is essential for multi-storied buildings. Existing buildings will warrant special incentive. MNRE may set-up a task force to study the issues and for developing a comprehensive strategy for multi-storey residential buildings. 5. Targeted and Variable Incentives Package The payback period in respect of SWH varies across regions. It is not practical to stipulate compulsory SWH-installation for old buildings. The incentive package needs to address regional and vintage differences. MNRE should develop targeted and variable incentive packages that takes into account the specific requirements of different regions, sectors and vintage of builings.
6. Rural Market Development Rural market particularly in the cold region may offer large potential. In the report we have indicated the barriers and successful experiences. MNRE should work out a blue print for the development of appropriate products, supply chains and a policy package focused on developing rural market for SWH.
7. Strategy to strengthen SWH Supply Chain We have already elucidated the problem-areas. MNRE needs to work on a package of fiscal/monetary/subsidy policy to promote industry- consolidation, product/technology development appropriate to low/middle-income group market, visible and extensive distribution network, quality-standards and rating. It will help if the industry, on its part, works out a collective vision and strategy for realizing market-volume projected under the report. For example the industry and government can work together to constitute a fund of the order of around 5% of the annual turnover of the industry to be used for advertising and promotion. 8. Developing a database of SWH installations Presently, there is no system for collecting information of SWH market and installations. Unavailability of this data was one of the main hurdles faced by the project team. MNRE should consider giving this responsibility to an independent organisation to develop and maintain a data-base of SWH manufacturing, sales and installations.

SWH Market Assessment
Greentech Knowledge Solutions Page | 115
9. Sector and Region Specific Market Assessment Studies The present study should be seen as the first attempt to gain an understanding of the Solar Water Heating market. As indicated in the report there are several sectors which require more in-depth market assessment studies, two such sectors are industry and rural sector. Amongst regions, cold region perhaps requires a detailed study. There is also a need to continue updating market assessment every alternate year. 10. Promoting Energy Service Company (ESCO) based models For setting-up large SWH installations in commercial buildings, industries and large residential developments , ESCO approach has the potential to become the most preferred implementation arrangement. MNRE should develop an action plan to develop feasible ESCO models and create conducive environment for development of sustainable SWH ESCO businesses.
SWH Market Assessment
Greentech Knowledge Solutions A.1
Annexure I: District Reports
1. Agra
Profile: Agra is one of the major districts of Uttar Pradesh spreading over 4027 km2 of land. As per census of 2001, the population of the district was 3,620,436 with an urban share of 43.3%. Average annual growth in population for 1991-2001 was 3.5%. As per census 2001, total numbers of households were 544,463 with an average household size of 7. Primarily the economy of the Agra district is agriculture based while the economy of Agra city depends on tourism, small scale industries, commerce and trade. Agra city is famous for the leather goods, handicrafts, zari zardozi, marble and stone carving & inlay work, sweets and snacks. SWH Scenario: Agra falls under composite climate and receives good solar radiation (5.6 kWh/m2/day). Almost, 85.5% of the households are of permanent construction. Agra Municipal Corporation has adopted the SWH regulations as per the MNRE guidelines. • Residential: Hot water is required for 4-5 months in a year, out of which around
15-20 days remains cloudy/rainy when the backup is needed. The current market penetration of SWH in the district is very low (<0.1%). There are only 2 dealers in the district for SWH. A 100 lpd system with electric backup costs around Rs.20,000. Recently one of the private developer has provided SWH in a project (independent houses).
• Hotels: Agra being a tourist town has a large number of hotels. Hotel could be the biggest potential users of SWH as the hot water is required round the year and many hotels use diesel or furnace oil based boilers to get hot water. Less than 10 hotels have installed SWH. As a lot of hotels are old, there is an issue of retrofitting them with SWH.
• Hospitals and Hostels: No major installation in hospitals and hostels. Agra has a large number of educational institutes which can potentially be targeted for SWH. In one the hospitals, SWH system is installed but not working due to improper installation. This suggests that services need to be improved.
• Industries: There are 4-5 dairies in the city but none has installed SWH. There is no SWH installation in the food processing and leather industry.
Summary of stakeholder interviews: • SNA: State Govt. provides subsidy of Rs. 5000/6000 per domestic system. Also
processes IREDA subsidy. Recently organized a solar expo which was visited by 50,000 visitors. Target for Agra for year 2009-10 is 40,000 lpd (200 systems x

SWH Market Assessment
Greentech Knowledge Solutions A.2
200 lpd). SWH is made mandatory in Agra as done in other places but implementation is low key. Target for UP for year 2008-09 was 2,50,000 lpd.
• Dealers: Banks are not cooperative in processing soft loans. Gas geysers are available at a price of Rs.2,000-2,500 and hot water demand for 2-3 months can be met by spending ~Rs.300 in a year. This makes SWH economically not viable (payback >10 years). Very difficult to convince existing building owner for SWH installations due to retrofit and piping requirements. High capital cost is one of the major barriers for SWH installation. Lowering the initial cost by Rs.4,000-5,000 (for 100 LPD system) can significantly increase the sales.
• Architects/Builders: No subsidy is available to the builder, so they are not interested in SWH. There is an issue of electricity theft which de-motivates people to for energy saving appliance such as SWH. SNA is not cooperative in providing knowledge or subsidy for SWH. Piping costs for SWH are also significant, especially for a family which requires hot water at 4-5 bathrooms. In multi-storey apartments there could be control issues and individual may not be interested in sharing the facilities. Problems with monkeys who can damage the costly SWH system.
Caselet: Mr. Anurag Jain, Dealer Mr. Jain is a dealer of Kotak Urja for SWH and SHARP for PV based products. His main business is with Canon for photo copier and audio-visual products. He has a sales network in 13 districts in UP which he is utilizing for the sales of solar products. He started work 6 months back and has installed 1,500 LPD. Around 1,800 LPD SWH system installations are under process. Overall, he has done 20 installations and targeting for 100 during the year. At present, more demand is there in the Aligarh district. 1. Marketing approach:
Meeting with NEDA, builders, architects Advertisement in newspapers and distributing leaflets
2. There is a lot of curiosity about the SWH but the conversion ratio is very low e.g. out of 500-600 enquiries only 1-2 go for installation. 3. There are few systems installed in the Govt. building which are not working due to inadequate maintenance. 4. SWH performance may not be adequate in the cloudy days of December month.
Agra Very low-penetration rates for SWH, even the hotel sector has not been
exploited. Weak supply chain. Target sectors: New residential construction, hotels, hospitals and hostels. Electricity shortage, low-rise construction favours SWH. Regulation on mandatory use of SWH in
place, yet to be implemented efficiently.

SWH Market Assessment
Greentech Knowledge Solutions A.3
Getting loans from the banks is not easy. Also, the Govt. subsidy part is not clear. 5. Very difficult to convince existing building owner for SWH installations due to retrofit and piping requirements 6. High capital cost is one of the major barriers for SWH installation. Lowering the initial cost by Rs.4,000-5,000 (for 100 LPD system) can significantly increase the sales.
2. Ludhiana
Profile: Ludhiana is one of the major districts of Punjab spreading over 3767 km2 of land. As per census of 2001, the population of the district was 3,032,831 with an urban share of 55.84%. Average annual growth in population for 1991-2001 was 3.26%. As per census 2001, total numbers of households were 558,650 with an average household size of 5. Ludhiana is one of the richest cities in India. The main industries are bicycle parts and hosiery. SWH Scenario: Ludhiana falls under composite climate and receives good solar radiation (5.5 kWh/m2/day). Almost, 93.1% of the households are of permanent construction. SWH installation is going to be mandatory as per MNRE guidelines. There is no state Govt. subsidy or rebate in electricity tariff for SWH. • Residential: Hot water is required for 4-6 months in a year, out of which around
20-25 days remains cloudy/rainy when the backup is needed. Market penetration of SWH in the district is very low (<0.1%). There are 2 national brand dealers, 1 assembler and 4-5 other brand dealers in the district. The typical installation in the residential sector is 300 lpd system with electric backup, which costs Rs.50,000-75,000 depending on configuration (pressurized, indirect heating, etc). SWH are becoming popular in large independent houses. SWH dealers are trying to systematically target new large independent houses through architects, plumbers as well as direct promotion. There are 20-30 systems in nearby villages, most of these are installed by NRI families.
• Hotels: Total of around 75000 -100000 lpd installation in hotels. Most of the prominent hotels are having SWH installation.
• Hospitals: There are two large installations in hospitals, some other hospitals are seriously considering SWH option. Small private hospitals and nursing home segment is yet to be exploited.
• Hostels: Recently some systems have been put in both government as well as private institutions. In one of the installation, the respondent was not satisfied with the quality of the system. This segment has good potential.

SWH Market Assessment
Greentech Knowledge Solutions A.4
• Religious buildings: Gurudwara require hot water for cooking and cleaning of utensils throughout the year. This segment is yet to be exploited.
• Industries: Electroplating, textile dying and dairy are three industrial segments which offer large opportunity for SWH. There is only one large SWH installation for electroplating.
Summary of stakeholder interviews: • SNA: There no subsidy given by the state government; central subsidy is
processed through PEDA. The quality of SWH and after sales service is the major issue. There should be some quality control mechanism to allow only quality products to be sold in the market. Industry may potentially be a large user.
• Dealers: The banks are not cooperative in providing finance for SWH especially for industrial user. Gurudwaras are not willing to pay for SWH system and expects that the system would be donated. Moreover, the electricity tariff for Gurudwaras is very low. Dying industry has use of hot water and steam, but most of them have recently invested in heat recovery system. Plumber association is also a key stakeholder in SWH industry. Electricity situation in Ludhiana is not good and could be a key driver for SWH. There is trend to show-off and copy, which can be exploited for marketing SWH systems. Price is not a barrier for SWH installation as many installations are done without subsidy and/or bank finance.
• Architects/Builders: Capital cost is a concern for the consumer as the gas geysers are available at cheaper rate. Moreover, the hot water is required only for 3-4 months in year. Capital cost reduction can help in SWH penetration. SWH penetration & potential is quite good in hotel and residential sector and these sectors could be targeted first. SWH penetration has increased due to frequent electricity outages.
Ludhiana Except hotel segment, all other segments are under-exploited. Regulation
on mandatory use of SWH yet to be implemented efficiently. Good potential for SWH in all segments i.e. residential, hotels, hospitals,
hostels, gurudwaras and industries (electroplating, textile dying and dairy). Electricity shortage, low-rise construction favours SWH.

SWH Market Assessment
Greentech Knowledge Solutions A.5
3. Haridwar
Profile: Haridwar is located in Uttarakhand spreading over 2360 km2 of land. As per census of 2001, the population of the district was 1,447,187 with an urban share of 30.8%. Average annual growth in population for 1991-2001 was 2.36%. As per census 2001, total numbers of households were 240,702 with an average household size of 6. Agriculture is the mainstay of this well irrigated district. Industrialization had commenced with industrial giants like Hindustan Lever, Dabur, Mahendra & Mahendra and Havells having moved in. It is one of the holiest places for Hindus and a large number of pilgrims visit the city. Hotel industry has developed a lot due to tourism. SWH Scenario: Haridwar falls under composite climate and receives good solar radiation (5.4 kWh/m2/day). Almost, 77.4% of the households are of permanent construction. • Residential: Hot water is required for 3-5 months in a year, out of which around
few days remains foggy/cloudy/rainy when the backup is needed. There is limited apartment culture; more individual houses. Hence, good scope for SWH. Power situation in quite good and outages are very few. Hot water is required mostly for bathing.
• Hotels: Despite a large number of hotels, guest houses, dharamshalas, only a few hotels have installed SWH. SWH users have installed systems with a capacity of 40-100 lpd per room. SWH meets almost 90% of their hot water demand. There are leakage problem in few installation.
• Hospital/Hostel: There is a demand for hot water in these sectors but the level of awareness is low, most of the respondents say that they have not been approached by manufacturer or dealers.
• Industry: There are few textile and pharmaceutical industries in the district who could be the potential users of SWH.
Haridwar Very low penetration rates and weak supply chain. Limited potential in the residential sector with the present product range. Affordable product required to increase penetration in the residential sector.
Ashrams, hotels and dharamshalas, ayurvedic medicine industry offer potential. Focus on awareness, Technical support and strengthening of
the supply chain.

SWH Market Assessment
Greentech Knowledge Solutions A.6
4. Shimla
Profile: Shimla is one of the major districts of Himachal Pradesh spreading over 5131 km2 of land. As per census of 2001, the population of the district was 722,502 with an urban share of 23.15%. Average annual growth in population for 1991-2001 was 1.57%. As per census 2001, total numbers of households were 154,693 with an average household size of 5. Agriculture is the major source of income. The place is famous for its natural beauty, architectural buildings, wooden crafts and apples. Shimla is one of the favorite tourist places in India. Hotel industry has developed a lot due to tourism. SWH Scenario: Shimla falls under cold climate and receives good solar radiation (5.4 kWh/m2/day). Almost, 83.2% of the households are of permanent construction. Hot water is required for atleast 9 months/year, out of which around 20-25 days remains foggy/cloudy/rainy when the backup is needed. SWH installation processed through SNA is about 1,00,000 lpd. • Residential: Most of the construction is independent houses with sloping roof.
Most of the household use electric geyser for getting hot water. Power situation is quite good as there are very few outages in the winter mornings. Other than bathing, hot water is required for utensil scrubbing, hand washing, shaving, etc.
• Hotels: Several hotel users. On an average the hot water requirement is around 30-100 liters per room. Most of the installations are done after the construction. Most of the installations are done without any subsidy. The experience of users is good is there is no issue of leakage, scaling, etc. SWH system meets the 100% of hot water requirement.
• Hospital: The hot water demand in hospitals is found very less. Surveyed hospitals were approached by the SWH dealers but they didn’t go for SWH installation.
Shimla High hot water demand but low penetration rate, except hotels. Weak supply chain. Affordable product required to increase penetration in
the residential sector. Hotels, hospitals and hostels offer potential. Focus on awareness, Technical support and strengthening of the
supply chain.

SWH Market Assessment
Greentech Knowledge Solutions A.7
5. Gurgaon
Profile: Gurgaon is one of the fastest growing districts of Haryana spreading over 1253 km2 of land. As per census of 2001, the population of the district was 1,660,289 with an urban share of 22.22%. Average annual growth in population for 1991-2001 was 3.76%. As per census 2001, total numbers of households were 273,881 with an average household size of 6. The commercial and industrial sector has grown at a very fast pace in Gurgaon. There are many prominent and prestigious units involved in the manufacturing of Cars, Motors-Cycles, Automobile parts, Telecommunication equipments, electrical goods, software development, hardware, sports goods, rubber products, readymade garments, light engineering goods, pharmaceuticals, terry towels, food items, air conditioners, shoes, pesticides, insecticides etc. SWH Scenario: Gurgaon falls under composite climate and receives good solar radiation (5.5 kWh/m2/day). Almost, 86.0% of the households are of permanent construction. SWH installation in the Haryana is around 7,00,000 lpd and the sales for the year 2008-09 was around 2,00,000 lpd (Haryana). The Government has very favorable policies for SWH installation. • Residential: Hot water is required for 4-5 months in a year. Construction is a mix
independent bungalow and apartments. Most of the household use electric geyser for getting hot water. Power situation is poor as there are very frequent outages in the winter mornings. Other than bathing, hot water is required for utensil scrubbing. Awareness about SWH is quite low. Power situation and affordability could be the key driver for SWH. Some of the new multi-storey apartments by one of the private builders and Haryana Housing Board have made provision of SWH.
• Hotels: Year-round hot water requirement but very few hotels have SWH installations. The total number of hotel rooms is expected to be around 5000 (2000 in star category + 3000 in lower categories) by 2010. Surveyed hotels showed interest in SWH.
• Hospital: Only a few hospital users. Many of the surveyed hospitals are neither aware about the technology nor approached by the SWH dealers. Total number of beds in existing private hospitals are estimated to be 2000, another 1500 hospital beds would be added at the upcoming medi-city.
• Hostels: The hot water requirement is found to be 10-25 liters per room. There are some installations in government supported institutions done with the support of HAREDA. Some of the private residential schools have opted for SWH. SWH installed are working fine without any scaling, leakage or deterioration problem.
• Industries: The number of installations are few given the large base of the industry in the district. There is one large installation in a textile factory and some for industrial canteens.

SWH Market Assessment
Greentech Knowledge Solutions A.8
Stakeholder interview: State Nodal Agency (HAREDA) • State has a proactive SWH policy which consists of subsidy on domestic systems
and monthly rebate in electricity bill of Rs. 100 to 300 per month for first 3 years. In addition, subsidy is available for non-commercial institutions.
• HAREDA has actively pursued amendment in municipal by-laws for SWH and SWH provisioning has now been included in the municipal bye-laws, but the implementation is not effective.
6. South-West Delhi
Profile: South west Delhi densely populated district of Delhi spreading over 420 km2 of land. As per census of 2001, the population of the district was 1,755,041 with an urban share of 87.15%. Average annual growth in population for 1991-2001 was 4.9%. As per census 2001, total numbers of households were 364,511 with an average household size of 5. Being the capital of the country, the commercial and residential sector has grown at a very fast pace in the district. SWH Scenario: South West Delhi falls under composite climate and receives good solar radiation (5.5 kWh/m2/day). Almost, 91.7% of the households are of permanent construction. Most of the national SWH players are present. The policies are quite favorable for SWH installation; still the SWH penetration is very low in the district. • Residential: Hot water is required for 4-5 months in a year. Construction in the
district is mostly apartment buildings. Most of the household use electric geyser for getting hot water. Power situation is not very bad but still there are few outages in the winter mornings. Other than bathing, hot water is required for utensil scrubbing, washing machine, hand washing, etc. People are some-what aware about SWH but have limited knowledge about manufacture, subsidy, costs, etc.
• Hotels: Delhi has only a small number of SWH installations in hotels. Some of the hotels having SWH were interviewed and were found to be satisfied with the SWH performance and it meets most of their hot water requirement. There is still no awareness in small hotels about the SWH.
Gurgaon Regulation on mandatory use of SWH yet to be implemented
efficiently. Good potential for SWH in all segments i.e. residential, hotels, hospitals, hostels and industries (electroplating, textile, dairy
and industrial canteens). Electricity shortage favours SWH.

SWH Market Assessment
Greentech Knowledge Solutions A.9
• Hospital: The hot water demand in hospitals is found 10-20 liters per bed. Due to mandatory provisions several of the hospitals (both small and large) are in the process of installing SWH. SWH owner has no problems with the SWH system.
• Industry: We could not locate relevant industries for SWH.
Stakeholder interview: State Nodal Agency • State Govt. provides a subsidy of Rs.6000 per domestic system.
• For non-commercial institutions, Rs.6000 per 100 lpd, maximum for 1000 lpd i.e. Rs.60,000. (Subsidy is directly given to the supplier)
• Govt. of Delhi has a climate change action plan. The target is to have 5 lacs lpd capacity by 2012.
• The Govt. has made SWH mandatory for all hospitals, hotels, hostels and nursing homes. The Govt. has collected information on institutions that have not complied and is in the process of enforcing penalty for non-compliance.
7. Bangalore
Profile: Bangalore is the largest district of Karnataka spreading over 2191 km2 of land. As per census of 2001, the population of the district was 6,537,124 with an urban share of 75.48%. Average annual growth in population for 1991-2001 was 3.03%. As per census 2001, total numbers of households were 1,460,697 with an average household size of 4.5. Bangalore is home to some of the most well-recognized colleges and research institutions in India. Numerous public sector heavy industries, software companies, aerospace, telecommunications, and defense organizations are located in the city. Bangalore is known as the Silicon Valley of India because of its position as the nation's leading IT exporter. SWH Scenario: Bangalore falls under temperate climate and receives good solar radiation (5.5 kWh/m2/day). Almost, 89.7% of the households are of permanent construction. Bangalore is the largest market for SWH and has the maximum penetration of SWH in the country. Most of the national players are present along with large number of local players.
South-West Delhi Regulation on mandatory use of SWH is yet to be implemented efficiently. Good potential for SWH in hotels, hospitals and hostels. Group housing, DDA flats and new apartment buildings can have large potential but lack
of demonstrated alternatives is a big barrier. Thus focus on demonstration of practical application of SWH should be a priority.

SWH Market Assessment
Greentech Knowledge Solutions A.10
Summary of primary survey & stakeholder interviews: • A good reason for the SWH to have taken off here is the weather and conditions,
as it is cold (hence the need for hot water is all year round) at the same time the city like the rest of South India has good solar radiation enabling efficient usage of the SWH all year round.
• As there was demand for a product a very healthy eco-system of manufacturers and suppliers has grown here. As was pointed out by a senior manufacturer, though there are many manufacturers (which increases competition) it doesn’t affect negatively as there is more than enough demand, also it boosts cluster growth so that raw materials and labour becomes easier to find. However not all the consumers are happy with the after-sales service and quality of the installations which requires immediate attention.
• With a stable market, architects and builders want the industry to go a step further in quality, innovation of the product and the services. This statement, points towards the need for standardization of the product, the quality, the service and the training.
• SWH’s is being sold predominantly to a middle and high income population. The product needs to be sold through a different scope, e.g. as an appliance.
• Not many banks are interested in offering loans under the IREDA scheme. Many have stopped giving out subsidies due to bad experiences with the dealers who bring costumers.
• Hospitals and institutions, in general, have a great potential, but there seems to be a lack of incentive. Government orders making the use of SWH mandatory isn’t working. Builders and architects might not even know them. Suggestions are to promote official policies that offer incentives to these sectors.
• The stability of the market in Bangalore district is clear. Some key stakeholders convey the idea of pushing SWH into rural and semi-urban areas.
Bangalore Year-round demand of hot water; best manufacturing and dealership base in the country and best penetration rate of SWH in the country. Product
innovation and intensification of marketing require to increase the customer-base (e.g lower-income households, existing housing). Still
untapped potential in commercial and institutional buildings as well as industries. Regulation on mandatory use of SWH yet to be implemented
efficiently. It has the potential to drive growth in new-housing.

SWH Market Assessment
Greentech Knowledge Solutions A.11
Caselet 1: R. Prassana Venkatesh (Chief Engineer), Bhagwan Mahavir Jain Hospital The Bhagwan Mahavir Jain Hospital is situated in a residential area of Bangalore and caters for the poorest section of the society, without excluding patients who decide to be in better wards. In 2003 they installed a 9000 lpd SWH. Chief Engineer R. Prassana Venkatesh wasn't there when it was installed but he knows everything about it. He is of the opinion that the issue of deployment of SWH and energy-efficiency in hospitals, can best be solved through official policies that offer incentives to the hospital sectors, encouraging the use of solar energy, and on the other hand making mandatory provisions for their use. Caselet.2: Thomas P. , Selco Solar Light Private Ltd, Bangalore Selco started as a Solar Lighting systems provider for rural Karnataka back in 1994. Solar water heaters entered their portfolio some time after and they have since been selling and servicing them for about 10 years now. Today they have their own plant producing flat plate solar water heaters. Their main customer base are the middle and upper classes of rural Karnataka, concentrated in the Western Ghats. They are mostly farmers with land holdings of 5 acres and more. Their annual SWH sales is 3.5 to 4 crores; 75% of this is accounted for by domestic (households) sales while the remainder 25% comes from the commercial/Industrial sector. Most of the demand (almost 75%) are for 100 and 200 lpd systems. Their non household clientele includes hostels, hotels, orphanages, silk, wax and biscuit manufacturers. Their annual sales volumes show an increase of upto 30% SELCO have an active client base of about 100,000 individuals . But, according to them, only about 30% of this customer bank are interested in SWH. The reason for this lack of interest is the easy and cheap (almost free) availability of firewood and biomass that grow naturally in the rural parts of Karnataka that SELCO is active in. It is the semi-urban market who tend to exercise options (like SWH) as they have less access to firewood or biomass as fuel. In the years to come the biggest driver of transition is likely to be the shrinking availability, rising costs and supply of firewood. Note: This same phenomenon is actually underway in the Nilgiris district of Tamilnadu,forcing many to turn to options for water heating. SWH is gaining in priority in these parts. For details refer our notes on Coimbatore. The question of subsidy is a vexing one as experienced by SELCO. The paperwork and time involved is in inverse proportion to the benefit :2% subsidy. There is a critical lack of awareness about renewable energy amongst bank personnel. They will have to be trained intensely; but for that to happen, there should be official policies that give due priority to renewable energy initiatives starting with SWH and going on successively to include other technologies and applications over time.

SWH Market Assessment
Greentech Knowledge Solutions A.12
SELCO is successful in promoting SWH and other renewable energy products only because of their big rural market base, which they have built up over time. As a result of this close connection with their market they are able to offer the whole package – product, finance and after sales service – that keeps their customers happy and adds to their growing number. They have now started to apply for voluntary CER verification for their various projects with a carbon credits trader in the UK. Caselet.3: Manjunath D. V., Managing Director, EMMVEE Solar Systems Private Ltd, Bangalore Emmvee,a pioneer in solar technology, has set up one of the largest solar water heater manufacturing plants in the country. When completed, the total production capacity of the plant is expected to be 200 Flat plate collectors and upto 400 tanks/day. They have 6 distributors, 175 dealers and 22 sales staff that keep operations going. Lining the inner tank with ceramic is a technological feature they are adding to their systems, which can set a new industry benchmark. Their association with Solar Cap of Denmark has helped them incorporate this feature in the tanks of their solar water heaters with only a marginal price increment for this valuable add-on. When we visited, they were running trial runs with ceramic coating in tanks and were getting ready to commence volume production. We believe that this innovation will help SWH gain greater traction upon the Indian market, which is being plagued by the problem of hard-water in many geographical areas across the country leading to gradual deterioration of the tanks due to corrosion. Their current annual sales is in the range of Rs 50 crores and they aspire to be a Rs 200 crore company with full plant capacity. About one half of their production is planned for exports while the rest is meant for the home market. Of this about 60% will be consumed by the Karnataka market alone and the rest will retail in the states of Delhi, Punjab, MP, HP, TN and Kerala. Kalyan outside Mumbai and, recently Delhi, are starting to show interest in SWH. Govt clients account for 25-30% of net sales and the whole SWH market is poised to grow by about 20% each year. Power cuts, rising power tariffs and a new ecological consciousness will be the drivers of SWH and other renewable energy applications in the years to come. As for market dampeners, the following were cited by the management as potential hurdles needing to be transcended 1. Policy: The market and industry can benefit from clear official policies originating from the government and capable of being executed on the ground with ease.

SWH Market Assessment
Greentech Knowledge Solutions A.13
2. Mass awareness can stimulate the sector .Media can help with meaningful campaigns that highlight benefits to the environment and economy due to renewable energy. 3. Architects and builders should be made to believe in the inherent necessity and benefits of SWH 4. Cost to the end user have to come down. 5. Service and maintenance have to develop significantly if this industry is to mature and bear fruit. Caselet.4: T. J. Joseph, Managing Director, Anu Solar Private Ltd, Bangalore ANU SOLAR is an example of an innovative ESCO in the area of Solar Water Heaters; perhaps the only one in the country. Started a novel initiative ( Pay per litre,pay as per use) in January 2009. Under this, the company offers to set up 200 lpd system against a refundable security deposit Rs. 1,900 + minimal non-refundable installation costs from customers. Hot water supply is metered; minimum monthly charges for hot water use is Rs. 80 The company claims to have spent about Rs. 5 crore in publicity and has 500 people in the field for sales, installation and service to promote this scheme. Focus is on Bangalore but hopes to be able to use this model for replication elsewhere. ANU SOLAR commenced manufacturing/assembling SWH systems since 1990.While their biggest market is Karnataka other emerging markets for SWH include Vizag, Vijaywada, Nellore, Hyderabad, Pune, Nasik, and the states of Maharashtra, Tamil Nadu, Haryana, Punjab, and Gujarat Issues : Lack of awareness both amongst customers and the banking sector. The Govt. should create a long term and far sighted policy to promote SWH, as it is in national interests. The market is big and ever growing. Bangalore alone (the solar capital of the country) has currently about 14 lakh houses in Bangalore, growing by about 343 houses per day (estimated).This scenario has relevance for every major city and town across India making SWH a very viable addition to a house. Industry and the commercial sector too can reap big dividends with SWH. The company is considering a CDM project as a natural extension of their work in the field of renewable energy. Their clients include Apollo hospitals, Infosys, Ginger hotels and Wockhart Hospitals.

SWH Market Assessment
Greentech Knowledge Solutions A.14
8. Coimbatore
Profile: Coimbatore, a district of Tamil Nadu, spreads over 7469 km2 of land. As per census of 2001, the population of the district was 4,271,856 with an urban share of 66.01%. Average annual growth in population for 1991-2001 was 1.87%. As per census 2001, total numbers of households were 1,095,354 with an average household size of 4. Almost, 73.4% of the households are of permanent construction. Coimbatore is known chiefly for its numerous textile mills, factories, engineering firms, automobile parts manufacturers, health care facilities & educational institutions. The hill stations of Ooty, Coonnor and Valparai are close to the city making it a good tourist attraction all over the year. SWH Scenario: Coimbatore falls under warm humid climate and receives good solar radiation (5.6 kWh/m2/day). Summary of primary survey & stakeholder interviews: • Home to a very dynamic SWH industry and market, accounting for about 25% of
the net SWH market in the state of Tamil Nadu.
• Has about 6-10 successful SWH manufacturers, three of whom are big and have a national presence.
• Industry and the commercial sector (hotels/educational-religious institutions/hospitals) feature big on the client list of these manufacturers. Significant savings on power along with a bonus 'green image' are the chief incentives for this sector to embrace SWH. The domestic sector is slower but gaining in importance in the eyes of the industry. The wide prevalence of hard water in many parts of Coimbatore seems to be a market dampener. However, increasing power cuts is forcing householders to look for other options. A year round cool climate is a market driver.
• The constant “media noise” (advertisements, schemes and offers) made by Coimbatore's resident SWH manufacturers and distributors ensures that SWH – as a viable product and technology – is always kept in the public domain. This accounts for the unusually high awareness about SWH amongst the general public.
• Absence of trained maintenance staff for installations and post sale service is an industry/market 'speed-breaker' acknowledged by all. The industry is still in its infancy and the market is yet to attain maturity. This makes it difficult to create a 'job market' aimed at SWH technicians successfully. Production, sales and service feed off one another in a systemic loop. They will all have to come of age at the same time for market health to be achieved. It has been suggested that concerted and focussed training programs for solar technologies aimed at youth and others can meet this need in the long run.

SWH Market Assessment
Greentech Knowledge Solutions A.15
• Absence of quality controls in product manufacture is a problem. It tends to cast SWH in a poor light in the eyes of uninformed customers. It also permits for poor quality products to enter the market and compete on the same platform with its higher quality cousins. While these reap the profits, the 'bad name' is shared equally by the entire industry. Govt. branding/certification of products and components will do much to elevate the standing of SWH in the eyes of the public and the market in general.
• Participation of banks can be enhanced through establishing a 'green policy' and creating special training modules for bank personnel, who currently lack much awareness about RE themselves. Loan/subsidy schemes have to be simplified to make it appealing to all.
• Enlightened official policies and proactive legislation is felt by all to be able to help the industry and market develop more rapidly than it can otherwise.
Caselet: R.Venkatesh (MD), VESAT Solar Energy Systems, Coimbatore VESAT solar energy systems was started in 2004. It is a mid-league player manufacturing/assembling solar water heaters and distributing solar lights and solar cookers. Venkatesh, its founder and MD, is an instrumentation engineer by training who was drawn to renewable energy since the 90s. He went to work for a well known maker of electric geysers and helped set up their SWH division. In 2004 he left to begin his own enterprise based on his understanding of the potential of this market. VESAT's subtle agenda is the popularization of renewable energy applications amongst the public so that a viable alternative is developed to replace our dependency on fossil fuel based energy generation. Being an ardent spokesman for renewable energy, Venkatesh gives lectures on how RE can make for positive changes in the environment. He tells his young audiences about the current technologies in RE and how these could provide career openings for them soon. He also uses social platforms (Lions and Rotary clubs) to talk about RE in its wider relation to man, his environment and its future. He is contemplating developing a course (in RE technologies with emphasis on solar energy products maintenance) for one or two of Coimbatore's premier technical institutions. He believes that it is time for renewable energy – technologies and applications – to go mainstream. Part of the public's current
Coimbatore Year-round demand of hot water; strong manufacturing and dealership base. Residential sector is yet to be exploited fully. SWH industry should
focus on delivering a quality product. Product innovation and intensification of marketing require to increase the customer-base.
Industrial segment (mainly textile) may offer potential. Regulation on mandatory use of SWH yet to be implemented efficiently. It has the
potential to drive growth in new construction.

SWH Market Assessment
Greentech Knowledge Solutions A.16
indifference is due to a lack of mass awareness. Education can help people take more readily to alternatives. The Govt. can play a big role here. Venkatesh maintains that the SWH market is a promising and growing one in need of committed players with long term visions and strategies. Being an astute technologist and entrepreneur, he realised that if he were to be successful in the business then he would have to address some of the industry's (and market) most glaring lacuna – quality and post marketing service. Product quality and maintenance were the two biggest hurdles that kept new customers out, according to Venkatesh. And so his business philosophy began to revolve around these two aspects. Today these are the two pillars upon which his success rests. He is building a network of trained local plumbers who carry out installations and maintenance of solar water heaters under his team's supervision. Some of them are a part of his team. They also serve as sales agents for his products, further closing the gap between supplier and user , creating a bond that is hard to break and inevitably leading to new business. VESAT services customers big and small. Their clients are varied and include textile mills, hospitals, schools, hotels and homes. Recommendations from satisfied clients have served to expand VESAT's customer base considerably over the years. A lot of these are individuals and organisations who are aware of the benefits of RE in helping reduce costs as well as minimising environmental footprints. However, this is a small group accounting for a very small fraction of the SWH market. Enlightened Govt. policies can help the RE market grow considerably. Favourable policies and practical financial mechanisms can be a winning combination that can provide RE and its attendant markets with the boost it needs to go mainstream.
9. Hyderabad
Profile: Hyderabad, a district of Andhra Pradesh, spreads over 650 km2 of land. As per census of 2001, the population of the district was 3,829,753 with an urban share of 100%. Average annual growth in population for 1991-2001 was 1.60%. As per census 2001, total numbers of households were 695,906 with an average household size of 5.5. Almost, 86% of the households are of permanent construction. Hyderabad has developed into a major hub for the information technology industry in India. SWH Scenario: Hyderabad falls under composite climate and receives a solar radiation of about 5.6 kWh/m2/day. Andhra Pradesh is one of the emerging markets for solar water heaters particularly, the cities of Hyderabad, Vijaywada and Vishakapatnam, of which Hyderabad is the biggest. Summary of primary survey & stakeholder interviews: • One of the large national brands of solar water heaters is based in Hyderabad.
They have created a lot of awareness in the market and now are moving towards

SWH Market Assessment
Greentech Knowledge Solutions A.17
institutional and industrial segments. They have installed systems in a number of hotels. They have also done a few industry installations for pharmaceuticals and dairy clients. However, the installed base is still limited compared to the potential.
• The Andhra Government has enacted law (GOM) for usage of renewable energy particularly solar water heater in new hotels, lodges, guest houses, hospitals, nursing homes and multi-storeyed buildings. The municipal corporations are supposed to enforce it with the support of the nodal agency. The agency has an approved list of 20 supplier/installers. However, our research revealed that the law is toothless and is not enforced. The nodal agency indicated that some municipal corporations are more active in enforcing it then others. In fact some of the builders and architects even in Hyderabad are not even aware that such a law exists.
• With increased awareness among users of different segments, hotels and industry users are switching to solar water heaters for economical reasons. However, the awareness level is still very poor and the installed base is relatively small
• Technical expertise of suppliers and installers is poor. Customers have complained of inadequate advise on very simple issues such as cold water at the furthest user point without wasting water, solar water heater installation location etc. Training for installers is still non-existent.
Caselet.1: Joseph Pentony (Manager), Fernandez Hospital Pvt. Ltd., Hyderabad Fernandez Hospital in Hyderabad is managed by a missionary trust. It endeavours to provide high quality service particularly to the poor and deprived sections of society. The manager, Joseph Pentony, is also responsible for the building and its maintenance. Joesph and the management got interested in solar water heaters early on for both economical and environmental reasons. They caught on to solar water heaters back in 1997 when they installed a flat plate system of 2,000 litre capacity. Encouraged by the power savings and low maintenance, they installed the second system of 2,000 litre capacity in 2003. This time they installed an ETC system. They decided on ETC as
Hyderabad Year-round demand of hot water. Manufacturing and dealership base is developing. The penetration rate is still low compared to
potential in all the segments. SWH industry should focus on increasing its reach and delivery of quality product and services.
Industrial segment (e.g pharmaceutical) may offer potential. Regulation on mandatory use of SWH yet to be implemented
efficiently. It has the potential to drive growth in new construction.
SWH Market Assessment
Greentech Knowledge Solutions A.18
they perceive it to be more efficient with less maintenance because of glass tubes. Now they are also hoping to have a solar water heater system in an upcoming building. One of the challenges they had with putting up their first system was with laying out the hot water plumbing over the hospital. The installer did not make them aware of the cold water discharge for the first few litres, if the end user is located far away from the solar water heater. They found no one in Hyderabad to suggest a solution for this problem despite the fact that a circulatory system with a thermostat has been around for along time, which could easily solve this problem. He felt there was a critical lack of training and expertise in marketing solar water heaters in the city of Hyderabad, considered to be an emerging market in India, and certainly the biggest in the state of Andhra Pradesh. Caselet.2: K. Laxma Reddy (General Manager), Synthokem Labs Pvt. Ltd., Hyderabad This is one of the few examples where an Industrial user has chosen solar water heaters for economical reasons and successfully implemented it in their production process. Their factory which used to be in an industrial estate is now part of a residential area as Hyderabad city has expanded. Being in a residential zone there are restrictions on fuels with high particle content. So they use furnace oil for boilers, which they found to be too expensive and highly volatile. As the price of furnace oil rose in mid 2000, the company started to look at ways to cut on fuel costs. With the help of consultants they concluded it was worth trying solar water heaters to pre heat the water fed into the boiler to reduce the furnace oil consumption in the boiler. With a 10,000 litre system they found they could raise the water temperature by 30 degree C thereby reducing the energy cost by 16%. They believe the payback could be under 2 years if the solar water heaters are reducing furnace oil consumption. Now they have become passionate advocates of solar water heaters and offer advice and support to other factories.
10. Ernakulam
Profile: Ernakulam, a district of Kerala state, spreads over 2407 km2 of land. As per census of 2001, the population of the district was 3,105,798 with an urban share of 47.6%. Average annual growth in population for 1991-2001 was 0.87%. As per census 2001, total numbers of households were 693,161 with an average household size of 4.5. Almost, 92.3% of the households are of permanent construction. Ernakulam is the commercial capital of the state of Kerala. SWH Scenario: Ernakulam falls under warm-humid climate and receives a solar radiation of about 5.6 kWh/m2/day. The SWH market is significant and relatively untapped in the twin cities of Kochi (formerly Cochin) and Ernakulam. These two are

SWH Market Assessment
Greentech Knowledge Solutions A.19
the principal metros of Ernakulam district, considered by many to be the biggest SWH market in the state of Kerala, accounting for up to 30% of net SWH sales. Summary of primary survey & stakeholder interviews: • The commercial sector - hospitality and health in particular – is a big and growing
market for SWH and accounts for up to 60% of sale. The domestic sector is sluggish in comparison. Old habits, availability of cheap electric geysers and concern over losing roof space have been cited as some possible reasons for this resistance. However, steeply rising power tariffs and frequent power cuts can be leveraged successfully to the advantage of SWH and RE in the long run.
• After sales service has been cited by many – manufacturers, distributors and customers alike - as a very real gap in the system impacting negatively upon the industry and market at large. Finding, training and retaining trained technicians for SWH is a problem in Kerala due to multiple socio-economic reasons. Currently, plumbers are being sought and enlisted for this job, sometimes successfully and many times not. A dependable, respectable and profitable job economy (based on RE technologies and applications) is still to emerge. To catalyze this, efforts are underway by some proactive organizations to develop a training curriculum (for SWH and other RE technologies) to be included in ITI training programs. Its intent is to produce certified SWH technicians who can be employed by manufacturers and distributors, leading to a balanced market equation through fulfilling the needs of the demand - supply chain in this sector.
• Product quality and pricing were mentioned by a few as potential market deterrents.
• Banks are not proactive enough. Manpower shortages, diffused signals from their HOs and complex loan/subsidy procedures have been cited by many as the reason for restricted bank participation. Making RE a priority issue amongst banks could reverse this trend.
• The role of positive legislation cannot be overstated and may be needed to provide the stimulus this industry needs. Making mandatory the use of renewable energy in new buildings and offering meaningful incentives for others to embrace RE applications can be a big step in this direction.
Ernakulam Good demand of hot water in households. Dealership base is still
developing, no significant local manufacturing. The penetration rate is low compared to potential. Main immediate market is in the hospitality sector. SWH industry should focus on increasing its reach and delivery of quality
product and services. Regulation on mandatory use of SWH yet to be implemented, it has the potential to drive growth in new construction.
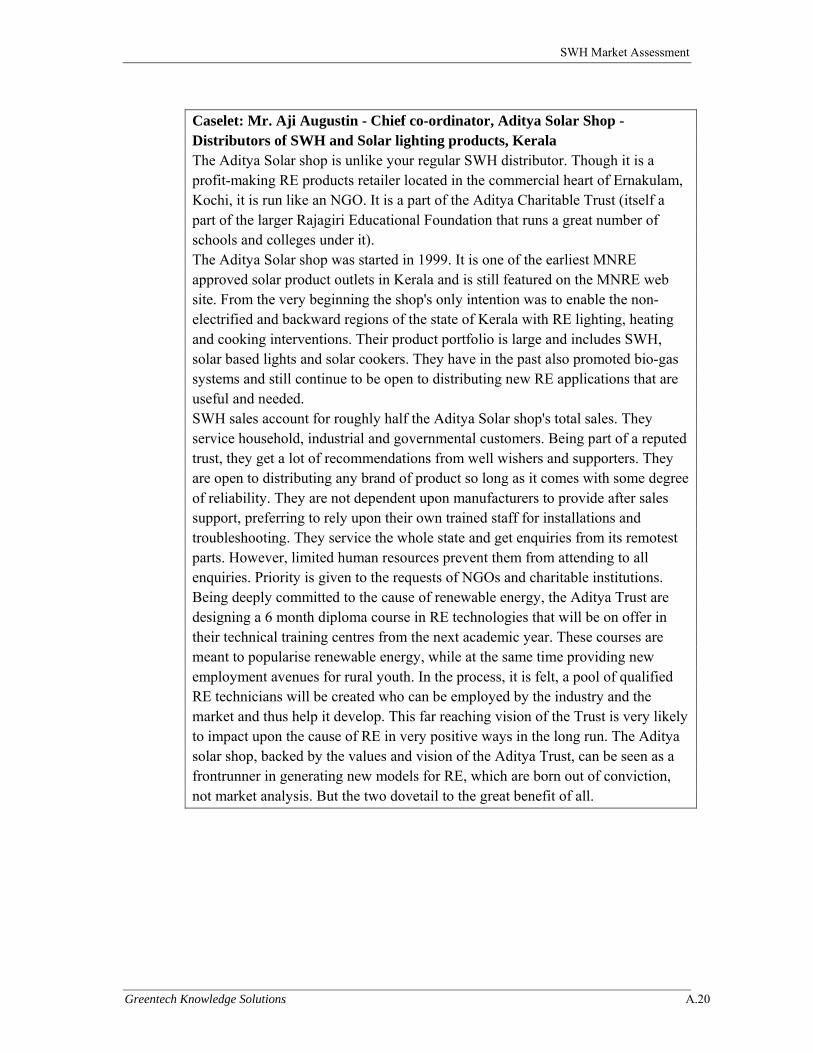
SWH Market Assessment
Greentech Knowledge Solutions A.20
Caselet: Mr. Aji Augustin - Chief co-ordinator, Aditya Solar Shop - Distributors of SWH and Solar lighting products, Kerala The Aditya Solar shop is unlike your regular SWH distributor. Though it is a profit-making RE products retailer located in the commercial heart of Ernakulam, Kochi, it is run like an NGO. It is a part of the Aditya Charitable Trust (itself a part of the larger Rajagiri Educational Foundation that runs a great number of schools and colleges under it). The Aditya Solar shop was started in 1999. It is one of the earliest MNRE approved solar product outlets in Kerala and is still featured on the MNRE web site. From the very beginning the shop's only intention was to enable the non-electrified and backward regions of the state of Kerala with RE lighting, heating and cooking interventions. Their product portfolio is large and includes SWH, solar based lights and solar cookers. They have in the past also promoted bio-gas systems and still continue to be open to distributing new RE applications that are useful and needed. SWH sales account for roughly half the Aditya Solar shop's total sales. They service household, industrial and governmental customers. Being part of a reputed trust, they get a lot of recommendations from well wishers and supporters. They are open to distributing any brand of product so long as it comes with some degree of reliability. They are not dependent upon manufacturers to provide after sales support, preferring to rely upon their own trained staff for installations and troubleshooting. They service the whole state and get enquiries from its remotest parts. However, limited human resources prevent them from attending to all enquiries. Priority is given to the requests of NGOs and charitable institutions. Being deeply committed to the cause of renewable energy, the Aditya Trust are designing a 6 month diploma course in RE technologies that will be on offer in their technical training centres from the next academic year. These courses are meant to popularise renewable energy, while at the same time providing new employment avenues for rural youth. In the process, it is felt, a pool of qualified RE technicians will be created who can be employed by the industry and the market and thus help it develop. This far reaching vision of the Trust is very likely to impact upon the cause of RE in very positive ways in the long run. The Aditya solar shop, backed by the values and vision of the Aditya Trust, can be seen as a frontrunner in generating new models for RE, which are born out of conviction, not market analysis. But the two dovetail to the great benefit of all.
SWH Market Assessment
Greentech Knowledge Solutions A.21
11. Chennai
Profile: Chennai, the capital Tamil Nadu state, spreads over 178 km2 of land. As per census of 2001, the population of the district was 4,343,645 with an urban share of 100%. Average annual growth in population for 1991-2001 was 0.94%. As per census 2001, total numbers of households were 962,213 with an average household size of 4.5. Almost, 87.2% of the households are of permanent construction. Chennai's economy has a broad industrial base in the automobile, technology, hardware manufacturing, and healthcare industries. The city is India's second largest exporter of software, information technology (IT) and information-technology-enabled services (ITES). SWH Scenario: Chennai falls under warm-humid climate and receives a solar radiation of about 5.6 kWh/m2/day. Summary of primary survey & stakeholder interviews: There is a potential here based on numbers but there are various other issues • Very low penetration despite being one of the districts with more electric geyser
sales. Despite, culturally, there seems to be a need of hot showers now and then, pricing and weather play unfavorably for its success. The weather plays a role in low penetration as when the consumer is about to buy the product the logic given is that it is hot throughout the year except in the monsoon when the SWH is not very effective anyways.
• Industry can play an important role in a SWH boom in cities like Chennai. However, the market is still immature, where dealers and manufacturers don’t have the training and sales capacity to import this product in this segment. The agencies selling SWH are not working out solutions for industries that work with pre-heating etc. as there isn’t a focus on pre-assessment.
• The Nodal agency has awareness programmes but they do not seem to be effective.
Chennai Strong sales of electric geysers indicate good demand of hot water in households. The penetration rate is low compared to potential. SWH
industry should focus on establishing SWH as a viable product in Chennai. Regulation on mandatory use of SWH yet to be
implemented, it has the potential to drive growth in new construction.

SWH Market Assessment
Greentech Knowledge Solutions A.22
12. Pondicherry
Profile: Pondicherry is the main district of Union Territory Pondicherry, spreading over 479 km2 of land. As per census of 2001, the population of the district was 974,345 with an urban share of 51.93%. Average annual growth in population for 1991-2001 was 1.91%. As per census 2001, total numbers of households were 163,864 with an average household size of 6. Almost, 77% of the households are of permanent construction. Pondicherry is also considered an educational hub of southern India. SWH Scenario: Pondicherry falls under warm-humid climate and receives a solar radiation of about 5.7 kWh/m2/day. Summary of primary survey & stakeholder interviews: There is a potential here based on numbers but there are various other issues • Need of SWH’s is very low for two main reasons. First of all, electricity rate is
very cheap. Economically is not worth it, not even considering the effort of going through months of paperwork for a subsidy.
• Secondly, there is a need of hot water, but the market can do with not more than 50 lpd of it. Electric geysers are no more than 30 lpd, according to the Nodal Agency in Pondicherry and an architect interviewed. Why would they pay so much for a 100 lpd SWH, when they could pay less for a system that fits more their necessities?
13. Ahmedabad
Profile: Ahmedabad is has a area of 8,707 km2 . As per census of 2001, the population of the district was 5,816,519 with an urban share of 80.2%. Total numbers of households were 1,150,588 with an average household size of 5. Household have grown by 1.27 & 3.65% in rural and urban area, respectively. Almost, 85.5% of the households are of permanent construction. Ahmadabad city established itself as the home of a booming textile industry and witnessing a major construction boom and population increase.
Pondicherry There is a demand of hot water in households. More affordable product required for a break-through in the household sector.
Growing hospitality sector offers growth prospects. Regulation on mandatory use of SWH yet to be implemented, it has the potential to
drive growth in new construction.

SWH Market Assessment
Greentech Knowledge Solutions A.23
SWH Scenario: Ahmadabad falls under hot-dry climate and receives a solar radiation of about 5.8 kWh/m2/day. Summary of primary survey & stakeholder interviews: • Non-Owners Household: Hot water is required 4-5 months in a year. There is less
interest for SWH and people have mild exposures to SWH.
• Non-Owners Hospital: Two small hospitals were interviewed. Both depend on electricity for water heating. Low interest in SWH, mild exposure to SWH.
• Non-Owners Hotels: Three hotels were interviewed. The average hot water demand is 40 to 50 ltrs/ room per day. Use fire wood for heating water. Less inclined to go for SWH. Mild exposure to SWH. Roof availability is an issues
• Non-Owners Industry: Three dairy and two pharmaceutical industries were interviewed. All of them need steam. Use liquid fuel or PNG. Not convinced about the viability of SWH. Some exposure to SWH
• SWH Owner households : All six households were independent houses. Four of them have electric geysers. The hot water requirement is estimated at 180 days/year for bathing. Average capacity of SWH works out to be135 lpd. No loan, electricity/property tax benefit. Some problems reported but on the whole, happy with the product
• SWH Owner Hotels: Two hotels having 34 and 24 rooms respectively. Hot water requirement @ 20 to 30 ltrs/room/day. Wood was used earlier. SWH meets 35% and 75% of hot water requirement. Mixed feedback on product and performance.
• SWH Owner Hospital: Interviewed one hospital having 19 rooms. It has installed a 400 lpd during renovation of the hospital. No loan or benefits. Use SWH fully and round the year. Good product but some problems and sub-standard after sale support.
• Stakeholders Manufacture/dealers : Largely FPC sale. Annual sale is 4000 sq.mtrs. Ahmedabad account for 25% to 35% of Gujarat market. Hotels and hostel considered other promising categories. Cost/payback and product quality are the main barriers. Market expected to decline because of PNG.
• SNA : The state Govt. SWH policy has operated, since 1979, in an on-off manner. Capital subsidy is the main vehicle. The governmrnt. took a view that SWH is an established product and discontinued the subsidy this year. There is a move to make SWH for 200 sq.mtr (terrace or plot not clear) housing mandatory. There is no proposal on property tax or electricity rebate. They feel that they should have targeted industries/institutions rather than households.

SWH Market Assessment
Greentech Knowledge Solutions A.24
14. Indore
Profile: Indore, a district of state Madhya Pradesh, spreads over 3,898 km2 of land. As per census of 2001, the population of the district was 2,923,770 with an urban share of 71.21%. Growth in population for rural & urban sector for the period 1991-2001 was 2.7 & 3.7% respectively. Total numbers of households were 419,904 with an average household size of 7. Almost, 66.6% of the households are of permanent construction. Household with two wheeler ownership is around 36%. Indore is also called as 'Mini Mumbai', due to the similar lifestyles of people residing here. The market size of the district is Rs.8920 crore. Per capita income for urban & rural sector is Rs. 49089 & 24922. SWH Scenario: Indore falls under composite climate and receives a solar radiation of about 5.7 kWh/m2/day. SWH installation in the city is estimated to be around 5,00,000 lpd with an annual sales of 1,00,000 lpd. Almost 30% installation is in residential sector. FPC and ETC sales ratio is 80:20 while installations have ratio of 95:5. The city shares around 30% of SWH market of the state. There are 4 national brand SWH dealers and 7 other dealers in the city. Summary of primary survey & stakeholder interviews: • The demand from hotels, hospitals and hostels are encouraging. Being an
educational hub, the hostels could be large users of SWH
• Bank-credit and policy support is weak.
• The apartments are growing very fast and the power situation seems to be good in the city.
• FPC dominates the market as there is demand for FPC in commercial and industrial sectors.
• At present, people give very less preference to SWH while building a house. Also, the dealers have not paid much attention to promote SWH in residential sector.
Ahmedabad Hot water demand in households limited to winter months though significant percentage of population can afford SWH. Innovative
marketing, enforcement of regulation and strengthening of supply chain is required to develop SWH market. Commercial buildings and industries
(textile, pharma, dairy) needs to be targeted.

SWH Market Assessment
Greentech Knowledge Solutions A.25
• The announcement has been done to make SWH mandatory as per MNRE guidelines. There is no property tax rebate, nor any electricity rebate. Banks are also not active in providing loans for SWH.
15. Jaipur
Profile: Jaipur, a district of state Rajasthan, spreads over 11,143 km2 of land. As per census of 2001, the population of the district was 6,117,522 with an urban share of 51.24%. Growth in population for rural & urban sector for the period 1991-2001 was 2.3 & 3.8%, respectively. Total numbers of households were 785,030 with an average household size of 8. Almost, 83.2% of the households are of permanent construction. Household with two wheeler ownership is around 36.3%. The market size of the district is Rs.16218 crore. Per capita income for Urban & rural sector is Rs.60282 & 26170. SWH Scenario: Jaipur falls under composite climate and receives a solar radiation of about 5.8 kWh/m2/day. SWH installation in the city is estimated to be around 4,00,000 lpd with an annual sales of 50,000 lpd. Almost 35% installation is in residential sector. FPC and ETC sales ratio is 90:10 while installations have ration of 95:5. The city shares around 40-50% of SWH market of the state. There are only 2 national brand SWH dealers in the city. The market is expected to grow by 40% per annum for next few years. Summary of primary survey & stakeholder interviews: • Demand-enhancers: A large population of hotels and hospitals. Households tend
to choose larger than 100 lpd system
• Demand-Dampeners: Short winter, slender base of local production of SWH, weak bank-credit and policy support
• Low level of competition dealer of two national brands, one producer focused on all-India defence market, another is a recent entrant
• Brisk demand from hostel because it is possible to regulate bathing hours and optimize use. 35% to 40% of existing installation are hostels
Indore Fair to good potential for SWH in all segments i.e. residential, hotels,
hospitals, hostels. Regulation on mandatory use of SWH yet to be implemented, it has the potential to drive growth in new construction.

SWH Market Assessment
Greentech Knowledge Solutions A.26
• The demand from hotels is good. However, it is large hotels, say, 60 room upward which go in for SWH. They use it to heat feed water for boiler. The small hotels have roof availability problem- cable dish, water tank, diesel tank, etc
• We could not locate a single industrial installation. The pharma reported temperature requirement depending on the batch- whether it is syrup or non-syrup and need to control temperature precisely. The textile printing reports recurring cost of 5 or 10 paise/ltr; depending on whether it uses wood or LPD
• Policy: SWH is mandatory for all residential building located on 500 sq.mtr or larger plot. An order making SWH compulsory for commercial and relevant industrial establishments is expected soon. No rebate on municipal property tax. No state- govt. subsidy. 5 paise/unit rebate on electricity tariff. SWH producers/dealers stay away from banks because effort to help customer get bank-credit proves counter productive
16. Nagpur
Profile: Nagpur, a district of state Maharashtra, spreads over 9802 km2 of land. As per census of 2001, the population of the district was 4,521,073 with an urban share of 65.61%. Growth in population for rural & urban sector for the period 1991-2001 was 1.4 & 3.1%, respectively. Total numbers of households were 790,524 with an average household size of 6. Almost, 53.7% of the households are of permanent construction. Household with two wheeler ownership is around 37.8%. The market size of the district is Rs. 13860 crore. Per capita income for Urban & rural sector is Rs. 49161 & 2304. SWH Scenario: Nagpur falls under composite climate and receives a solar radiation of about 5.6 kWh/m2/day. SWH installation in the city is estimated to be around 1000000 lpd with an annual sales of 2,00,000 lpd. Almost 90% installation is in residential sector. FPC and ETC sales ratio is 20:80 while installations have ration of 65:35. The city shares around 8-10% of SWH market of the state. There are 2 national brand SWH dealers, 1 assembler and one other dealer in the city. The market is expected to grow by 25-30% per annum for next few years. Summary of primary survey & stakeholder interviews: • Demand-enhancers: Limited apartment culture. Hence, good scope for SWH.
Daily 4 hour power-cut. 2 hours in the morning; 2 hours in the evening. High radiation 300 days/year
• Demand-Dampeners: Dissatisfied customers spread negative publicity far more actively than satisfied ones. Dealer churn- 20 dealers have entered/existed in last seven years.

SWH Market Assessment
Greentech Knowledge Solutions A.27
• Co-operative banks active on SWH-financing. Nationalized banks passive and this is a demand dampener
• Brisk demand from hospitals/nursing homes. The owner-doctor stays on the top floor; feels mentally assured of SWH water-supply for his family. Hostel demand is strong
• Hotel demand is affected by capex requirement and recourse to wood. A 30-room hotel spends Rs. 50000 per annum on wood.
• Weak industrial demand. Capex requirement and recourse to agro waste prevent build up of industrial demand. Dairy utilizes SWH to meet cleaning water requirement; not pasteurization because pasteurization demand 80oC temperature. Pharma industry has stayed away from SWH because of 100oC temperature requirement.
• Nagpur Municipal Corporation has issued an order dt. 3-1-2008, making SWH compulsory in the context of issuing building use permission. The details are as follows.
Sr. No Type of buildings Per capita capacity recommended (ltrs) per day
1 Hospitals 100 2 Hotels 150 3 Hostels and other such buildings 25 4 Canteen As required 5 Laboratory and research institutions As required 6 Residence (for 100 sq.mtr and above
except LIG/EWS and slum) 25
The order is not implemented at the ground-level
• Nagpur Municipal Corporation has passed a resolution to provide 10% rebate on property tax but this is not implemented.
• There is no electricity tariff rebate.
• Non-household establishments report complete lack of awareness of capital subsidy for SWH.
• International Council for Local Environmental Initiatives (ICLEI)- GTZ has a resource center in Nagpur Municipal Corporation premises where SWH sample and info displayed; including dealer list.

SWH Market Assessment
Greentech Knowledge Solutions A.28
Caselet: MM Solar Nagpur This is owned by Yogesh Ranade who is into SWH business since 1999. His brother used to work for an SWH manufacturer and, together, they graduated to becoming a dealer. He is also engaged in institutional marketing of streetlight, LED and CFL products. He was a dealer for a large manufacturer until 2008. The growing popularity of ETC and own experience prompted Yogesh to enter the business of producing ETC SWH in 2008. He produces the tank and sources imported tubes. He is supported in the ETC marketing business by a dealer each at Gondia, Bhandara, Vardha, Yavatmal and Gadhchiroli. The dealer remains responsible for marketing, installation and after-sale support in these cities. Encouraged by initial success, Yogesh is preparing to manufacturer FPC SWH in a year. There are commercial/industrial customers who do not accept ETC, are keen on FPC. This explains Yogesh’s desire to produce FPC SWH.
17. Pune
Profile: Pune, a district of state Maharashtra, spreads over 15,642 km2 of land. As per census of 2001, the population of the district was 7,232,555 with an urban share of 58.08%. The current population of Pune urban agglomerate is over 4 million. Total numbers of households were 1,517,041 with an average household size of 5. Almost, 61% of the households are urban and the growth rates in household for urban and rural sector during 1991-2001 was 4% & 1.1%, respectively. Household with two wheeler ownership is around 47.37%. The market size of the district is Rs.31415 crore. Almost, 74.94% of the household are of permanent construction. Today, Pune is known for its educational facilities, having more than a hundred educational institutes and nine universities. Pune has well-established Manufacturing, Glass, Sugar and Metal Forging industries. Being the eighth largest city of India, the commercial sector has also developed rapidly. SWH Scenario: Pune falls under warm-humid climate and receives a solar radiation of about 5.6 kWh/m2/day. Summary of primary survey & stakeholder interviews: • Non-Owners Household: Households- hot water bath almost round the year; 13
out of 16 have geysers; mixed reaction on power-cuts in winter but cannot depend on power in winter; reaction to SWH somewhat unfavorable but exposure is considerable.
• Non-Owners Hospital: 40 to 80 lit/day of hot water requirement per day per room, Depends on electricity and LPG. Mixed reaction to SWH but exposure is considerable.

SWH Market Assessment
Greentech Knowledge Solutions A.29
• Non-Owners Hotel: Room capacity in 20 to 50 range, hot water requirement is 20 to 25 litre/room, Electricity for water heating, mixed reaction to SWH but good exposure.
• Non-Owners Industry: Interviewed three pharmaceutical industries. All three need steam- 500 to 2000 kg range. None needs hot water. Use liquid fuel. Low interest in SWH but good exposure
• Owner Household: Interviewed 6 bunglows and 2 apartments. Power- cuts in winters, Average capacity per HH: 175 lpd largely no electric backup. All use FPC syetems. 50% of them availed of loan and 25% availed of subsidy. Electricity/property tax rebate not availed, most use it for over 300 days. Over-all happy experience
• Owner Hotels: Three hotels having 51 , 87 and 228 rooms respectively. Hotel reports hot water requirement @150 ltrs/room/day, hostel reports 50 ltrs/room/day. All systems are FPC. SWH provision @ 80% to 90% of hot water requirement. Over-all satisfied with SWH.
• Owner Hospital: 88 rooms. Water requirement @ 20 ltrs/room. Power cut problem. SWH @ 30% of hot water requirement. Over-all satisfied with SWH.
• Owner Industry: Alfa Laval and Finolex, SWH used for hot water in canteen. System size, 2000 ltrs/day and 1500 ltrs/day respectively. One of them availed of subsidy. No loan, no other benefit. Used for 250 to 300 days/year. Back up is electricity. Over-all satisfied with SWH.
• Manufacture/dealers : 90% to 95% of the market is for households. Flat plate dominates but relatively new entrants pushing ETC. Existing base estimated at 50 lacs lpd. Annual sale in Pune estimated at 25 lacs lpd. Pune expected to account for 30% to 50% of Maharashtra.
• SNA: Has computed 9.5 million m2 potential for Maharashtra: New HH-0.51, Existing building-8.50, Hotel/hostel etc.-0.27, Hospital-0.18, Govt.-0.02.
• Municipal Corporation): 5% rebate on property tax, PMC has installed SWH at three crematoria, two hostels, and three hospitals. It believes that it is appropriate mainly for individual houses.
• Bank: Bank of Maharashtra and Bank of India. BOM has financed 7500 systems in last three years; 80% individual, 10% institutional, 10% commercial. Manufacturers/dealers bring cases. Repayment is good, but hurt by supposed Govt. ownership of the scheme. People think they need not pay, if it is Govt. scheme. BOM suggested reduced margin. BOI has not financed but aware. Too much paperwork for too small amount.

SWH Market Assessment
Greentech Knowledge Solutions A.30
• Architect: Good for independent houses. Not for apartment because distribution policy not easy to work out. There is permission problem. Supports mandatory regulation. Never invited to any SWH event. Households and hotels most potential categories.
• Builder: Positive feedback. Supports compulsion. Cost and customer acceptance are not issues. FPC more suitable. Another builder, however, considers it unsuitable for apartments. Both have used it in their projects. One of them advocates subsidy and electricity tariff rebate.
18. Thane
Profile: Thane, a district of state Maharashtra, spreads over 9558 km2 of land. As per census of 2001, the population of the district was 81,31,849 with an urban share of 72.58%. Total numbers of households were 1,755,124 with an average household size of 5. Almost, 74.6% of the households are urban and the growth rates in household for urban and rural sector during 1991-2001 was 5.5% & 1.8%, respectively. Household with two wheeler ownership is around 15%. The market size of the district is Rs.34678 crore. Almost, 77% of the household are of permanent construction. Thane is the third-most industrialized district in Maharashtra. SWH Scenario: Thane falls under warm-humid climate and receives a solar radiation of about 5.6 kWh/m2/day. Summary of primary survey & stakeholder interviews: • Manufacture/dealers: Existing Base of SWH in the district is estimated as 10 to
12 lacs lpd. Household have 90% share of the total SWH installation, and 95% of it is in apartments, mainly due to compulsion. FPC share 90% of installations. Thane district share in Maharahstra is estimated to be 6 % to 10%. The competition is intense and price-based; quality overlooked.
• Municipal Corporation : TMC was the first city in India to make SWH compulsory. Compulsory SWH since 2005- new hospitals, hotels, guest-houses, barracks, canteens, labs, research institutions, hostels, and Govt./public sector buildings plus residential building. Compulsory for existing buildings, if they seek change of use other than residential and Govt./public sector use. Intention to make it compulsory for all existing buildings, except residential. 10% property tax rebate for residential buildings. Capacity norm prescribed @ 25 lpd/person for most buildings. 100 lpd and 125 lpd for hospitals and hotels respectively. No fixed norm for canteens and research institutions. FPC of IS no 12933 mandatory. Implicitly, no scope for ETC. TMC could furnish a list of 58 buildings, totaling over 3 lac lpd where SWH is installed from Sept 2005 to June 2008. Not sure if this is an exhaustive list. TMC estimates that 3000 SWH systems (presumably of

SWH Market Assessment
Greentech Knowledge Solutions A.31
150 lpd, on average are coming up annually. This ties in with trade estimate of 5 lac lpd/year. The suggestions received by TMC pertain to additional space to be allowed for SWH installation. TMC highlights need for a separate authority to check and monitor SWH installations.
• Architect : Two architects who have designed provision for SWH are enthusiastic about SWH in independent houses but not so enthusiastic for apartments. Terrace space is a problem in apartments; they advocate extra terrace being allowed. They give an impression that in apartment buildings, hot water timings are regulated and occupants grudge this.
• Builder : Two builders interviewed have installed. Both support the product. However, one of them reports problems in a multi-storied building where early bathers exhaust the quota and late bathers do not get hot water.
• Bank : A line of credit for builders can change credit position. Most SWH enquires are turned down. A mechanism to track these and offer to them an alternative credit product. It may not help to make all banks/all branches credit distributors; the functionaries will not build knowledge/experience. Let there be a select but focused SWH credit outlets in the city. A mechanism to respond to product/scheme queries of bank officials.
• Non-Owners Household Presently, most of them use electric geyser for heating water. Hot water requirement is round the year. People are well aware of the technology.
• Non-Owners Hospital: 20-30 lit/day of hot water requirement per day per room, Depends mainly on electricity, Mixed reaction to SWH but exposure is considerable.
• Non-Owners Hotel: Terrace availability is a major problem. Aware that such a product exists but not aware of types or cost. Not approached by manufacturer/dealer. Not aware of Govt. support schemes. All are strongly interested in learning.
• Non-Owners Industry : Interviewed three food processing and three pharma. Except one, all others need steam- 200 to 1000 kg range. Use liquid fuel and one uses firewood. Low interest in SWH but good exposure.
• Owner Household: Interviewed 3 bunglows and 4 apartments. Only one has the electric geyser. Power- cuts in winters. No one has taken loan or availed subsidy. Most use it for over 300 days. Happy experience.
• Owner Hospital: Total 21 rooms. Water requirement @100 lit/room. Power cut problem.

SWH Market Assessment
Greentech Knowledge Solutions A.32
• Other observations: In Thane, many builders put up a system which will meet, say, 10% (1000 lpd for 100 families) of hot water demand. Some builders shift the system to another building, once cleared. Many builders want a cheap system; good enough for 3 to 4 years. Some builders connect only the top floor to SWH. The hot water hours in apartment buildings are regulated typically 5 to 11 a.m; the valve is turned off. The terrace availability does not pose a problem till 12 floors. Beyond that, provisioning reduces. There is a system in 24 storied building designed to cater to 35% of the requirement.
19. Bhubaneswar
Profile: Bhubaneswar, a district of Orissa, spreads over 2888 km2 of land. As per census of 2001, the population of the district was 18.77 lacs with an urban share of 42.9%. Average annual growth in population for 1991-2001 in rural and urban sector was 1.66 & 2.19%, respectively. As per census 2001, total numbers of households were 268,950 with an average household size of 7. Almost, 73.4% of the households are of permanent construction. Almost, 49% of the households own a two wheeler. Market size of the district is around Rs.8600 crores and the per capita income for urban and rural sector is Rs.25,500 & Rs.1700, respectively. Bhubaneswar is the largest city in central Orissa, 2nd largest city in east India. With its large number of Hindu temples, Bhubaneswar is often referred to as a Temple City of India.
SWH Scenario: Bhubaneswar falls under warm-humid climate and receives a solar radiation of about 5.4 kWh/m2/day. The city has 1 SWH assembler, 6 national brand dealers and one local dealer. FPC-ETC split up of existing installation is 80:20 while the split up for annual sale is 20:80. The district has 7-10% of the SWH market share for state. The SWH market is expected to grow by 25-30% in next few years. According to dealer a sales of 10,000 LPD has been recorded in the upcoming institutions during the year 2008-09. Nearby markets are Angul, Bherhampur, Koraput, Sunabeda, Baripada, Baleswar, Bhadhrak, Rourkela, Sambalpur. Summary of primary survey & stakeholder interviews: • There are several unsatisfied customers because of non-functioning of SWH due
to various reasons. They spread negative publicity far more actively than satisfied ones.
• No banks are active on SWH-financing. Nationalized banks passive and this is a demand dampener. Bank of India & Union Bank has financed 3 and 4 nos.100 LPD systems respectively).

SWH Market Assessment
Greentech Knowledge Solutions A.33
• The demand for hospitals/ nursing homes is significant. The hospital management feels that providing hot water through SWH reduce their cost and contribute to environment but are worried about after sales services. Hostel demand is also strong.
• Hotel demand is affected by initial capital requirement they want that SWHS of 500 LPD should be considered as commercial unit and 100% depreciation benefit would encourage them to go for it.
• Weak industrial demand. They also feel same as hotelier, Dairy never tried to utilize the system. The rice mill owners and fly ash brick manufacture are keen to utilize as pre-boiling equipment.
• Bhubaneswar Municipal Corporation does not have any policy for SWH.
• Non-Owner Households: Households- hot water use almost round the year; 25 out of 50 have geysers. The use of hot water is almost 275-280 days of the year; mixed reaction on future power-cuts but; reaction to SWH somewhat unfavorable because of no awareness, how it functions & cost of system.
• Non-Owners Hospital: 20 lit/day of hot water requirement per day per room and 200 lit/day for sanitation entirely depends on electricity & LPG. Mixed reaction to SWH, not clear how it will help sanitation activity. Very much hopeful on long term cost factor
• Non-Owners Hotel: Room capacity in 20 to 50 range, hot water requirement is 20 to 25 litre/room, Electricity, LPG & mini wood boiler for water heating, mixed reaction to SWH, because no good exposure.
• Non-Owners Industry: Interviewed one dairy industries (Orissa Milk Federation co-op Ltd.). They require steam- 2000 kg range. During 1985 used 10000lits/day, lack of support and service discouraged them, which forced the management to dismantle the unit.
• Owner Household: Interviewed 6 bungalows, most use it for over 300 days. All of them face after sales service problem. Developed their own technician; over-all happy experience.
• Owner Hotels: Three hotels having 150, 100, & 60 room. Most of them converted to electric heater. It presumed that, to acquire the system with subsidy was the intention. Not aware about current technological development like ETC.
• Owner Hospital: 30 rooms. Water requirement @ 25 ltrs/room. Power cut problem. SWH meets 60% of hot water requirement. Over-all satisfied with SWH.

SWH Market Assessment
Greentech Knowledge Solutions A.34
• Manufacture/dealers : 90% market is for households and 10 for institution and service industry .New ETC technology. Existing base estimated at one lacs lpd. Several national level brand dealers are present.
Caselet: Gayatri Solar Bhubaneswar A young engineer in the year 1994 began his mission “Solar Energy System on each rooftop of Orissa” inspired by new technology on visualizing the future energy demand with market development and guided by his father Er.G.H.Panigrahi without any support from any Govt. body. He traveled and surveyed entire state with his bike and found interesting facts and defects on Solar Water Heating System installed an approximate capacity of 20000LPD spread over different locations/district by OREDA . Repaired free of cost the minor defects and made the system functional with smile on customers face and building the confidence that solar systems can be operational for longtime if minor maintenance is carried on time. In due course the survey, contacts, effort, timely service & dedication helped his business of solar water heating system.
20. Sambalpur
Profile: Sambalpur, a district of Orissa, spreads over 6702 km2 of land. As per census of 2001, the population of the district was 935,613 with an urban share of 27.12%. As per census 2001, total numbers of households were 202,247 with an average household size of 5. Almost, 33% of the households are of permanent construction. Average annual growth in household construction for rural and urban sector is 1.2 & 2.1%, respectively. Almost, 19% of the households own a two wheeler. Market size of the district is around Rs.1200 crores. The place is famous for its globally renowned textile bounded patterns and fabrics. Apart from textiles, Sambalpur is also famous for rice production and rice mill hub. SWH Scenario: Sambalpur falls under warm- dry climate and receives a solar radiation of about 5.4 kWh/m2/day. Summary of primary survey & stakeholder interviews: • Demand-enhancers: Limited apartment culture. Hence, good scope for SWH.
Daily unscheduled power cut, High radiation 300 days/year, Nov- Mid February experienced sharp fall in temp to 3-4 degree.
• No banks are active on SWH-financing. Nationalized banks passive and this is a demand dampener.
• Sector specific scenarios in Sumbalpur is very much encouraging; particularly large number of rice mills currently use boilers . During interview it is learnt that,

SWH Market Assessment
Greentech Knowledge Solutions A.35
considering environmental factor and saving of resources SWH could be good option as primary feeder to boiler cannot be ruled out. This alone could be 2lac lpd capacity.
• Sambalpur Municipal Corporation does not have any policy for SWH.
21. Patna
Profile: Patna, the capital of Bihar state, spreads over 3202 km2 of land. As per census of 2001, the population of the district was 3,618,210 with an urban share of 44%. As per census 2001, total numbers of households were 726,364 with an average household size of 5. Almost, 68% of the households are of permanent construction. Average annual growth in household construction for rural and urban sector is 2.1 & 3.6%, respectively. Almost, 17% of the households own a two wheeler. Market size of the district is around Rs.11210 crores. Major industries in the district include Leather, Handicrafts, Agro processing. There are a lot of educational institutes in the Patna city. SWH Scenario: Patna falls under composite climate and receives a solar radiation of about 5.5 kWh/m2/day. Last year Sales recorded 10,000 lpd. Summary of primary survey & stakeholder interviews: • Residential: Almost half of the non SWH users have electric geyser and other use
LPG stove for heating water. There are frequent power cuts in the winter morning. Hot water demand in a year ranges from 4-5 months/year. People have mild exposure and interest in SWH. All 4 SWH owners have independent bungalow. Hot water is used for bathing and utensil washing. Hot water usage in a year is up to 250 days. Two of them have done retrofit for SWH installation. Two of them have used subsidy.
• Hospitals: 2 non users with 72 & 24 room capacity. Using electric geyser for heating water. Hot water demand per room ~20 lpd. Not aware of the technology but shown interest. For them cost is the major barrier. One user with 2000 lpd SWH installation. Installation done without loan or subsidy. Overall happy with the product and the after sales service.
• Hotels: 2 non users with 60 & 35 room capacity. Using electric geyser for heating water. Hot water demand per room ~20 lpd. Not aware of the technology and not shown any interest. Feels that the cost is high and requires efforts in maintaining.
In the city of Sambalpur the rice mill could be a potential user of the SHW in coming years.

SWH Market Assessment
Greentech Knowledge Solutions A.36
Two users 21 & 42 rooms. Both availed the subsidy. One of them has some issues with scaling and leakage. SWH meets 100 & 50% of their hot water demand.
• Industries: 2 non users, one has the hot water demand of 500 lpd. Presently use diesel for heating water. Aware of the technology but interest is low. One dairy is using SWH system of 25,000 lpd. Satisfied with the product.
22. Ranchi
Profile: Ranchi, the capital of Jharkhand state, spreads over 7574 km2 of land. As per census of 2001, the population of the district was 2,785,064 with an urban share of 35%. As per census 2001, total numbers of households were 505,508 with an average household size of 5.5. Almost, 33% of the households are of permanent construction. Average annual growth in household construction for rural and urban sector is 2 & 3%, respectively. Almost, 19% of the households own a two wheeler. Market size of the district is around Rs.33609 crores. Ranchi is a prominent political, commercial, industrial, and educational hub of eastern India. Ranchi accounts for 50% mineral production of the state, nearing about 18% of nation's mineral production. SWH Scenario: Ranchi falls under composite climate and receives a solar radiation of about 5.4 kWh/m2/day. Here 1 lac lpd in residential sector and 2 lacs lpd in institutional/ industry is possible in next 2-3 yrs. Summary of primary survey & stakeholder interviews: • Residential: Almost half of the non SWH users have electric geyser and other use
LPG stove for heating water. There are frequent power cuts in the winter morning. Hot water demand in a year ranges from 76 to 225 days. People have mild exposure and interest in SWH. Except one, all 5 SWH owners have independent bungalow. Hot water is used for bathing and utensil washing. Hot water usage in a year ranges from 76 to 250 days. Three of them have done retrofit for SWH installation. SWH meets most of their hot water demand.
• Hospitals: 2 non users with 10 & 20 room capacity. Using electric geyser for heating water. Hot water demand per room ~5 lpd. Not aware of the technology and shown some interest. One user with 500 lpd SWH installation. Installation done without loan or subsidy. Usage is round the year. Overall happy with the product performance and the after sales service.
• Hotels: 2 non users with 50 & 75 room capacity. Hot water requirement is very low. Cost seems to be high for them. Two users 20 & 25 rooms having 2000 & 3000 lpd SWH system. Both availed the subsidy.

SWH Market Assessment
Greentech Knowledge Solutions A.37
• Industries: One Pharma industry is using SWH system of 18,000 lpd. Round the year usage. Availed subsidy. Two dairy units use 2000 lpd.
• Non-Owners Industry: Interviewed one dairy industries one fly ash brick unit . They required steam- 1000 kg range. The fly ash brick unit looking to change technology where hot water will be used the approximate requirement will be 10,000 lts, for him SHW could be a good option.
• Manufacture/dealers: 70% market is for households and 30% for institution and service industry .New ETC technology. Existing base estimated at 2 to 2.5 lacs lpd. Annual sale in and around of Ranchi.
23. Raipur
Profile: Raipur, the capital of Chhattisgarh state, spreads over 2517 km2 of land. As per census of 2001, the population of the district was 3,016,930 with an urban share of 30%. As per census 2001, total numbers of households were 5 81,582 with an average household size of 5. Almost, 40.7% of the households are of permanent construction. Almost, 22% of the households own a two wheeler. Market size of the district is around Rs.5157 crores. The district is rich in mineral resources. SWH Scenario: Raipur falls under composite climate and receives a solar radiation of about 5.4 kWh/m2/day. Last year sales recorded 25,000 lpd (by Govt. Guest house & govt. quarters). The current estimate shows 2lac LPD could be achievable in next 2-3 years Summary of primary survey & stakeholder interviews: • Residential: Majority of the non SWH users have electric geyser while others use
LPG stove for heating water. Among the geysers small on line are mostly used. There are power cuts in the winter morning. Hot water demand in a year is for 4-5 months. Awareness is low but shown some interest in SWH. All 3 SWH owners have independent bungalow. Hot water is used for bathing and utensil washing. Hot water usage in a year ranges from 76 to 175 days. One of them have done retrofit for SWH installation. Two of them have availed subsidy.
• Hospitals: 3 non users, presently using electric geyser for heating water. Hot water demand per room ~20 lpd. Not aware of the technology but shown interest.
• Hotels: 2 non users with 60 & 40 room capacity. Using electric geyser for heating water. Hot water demand per room is around 20-25 lpd. Not aware of the technology but showed high interest. Feels that the cost is high. Two users 52 &
Ranchi is one of most potential city for SWH System among the eastern state due to its climate and industrial demand.

SWH Market Assessment
Greentech Knowledge Solutions A.38
35 rooms, having 2000 & 500 lpd system. Both availed the subsidy. Overall experience is good.
• Non-Owners Household: Households- hot water use almost round the year; 60 out of 100 have geysers. The use of hot water is almost 100-150 days of the year; mixed reaction on future power-cuts but; reaction to SWH somewhat unfavorable because of no awareness, how it functions & cost of system.
• Non-Owners Industry: Interviewed one dairy and one rice mill unit both use boiler for steam and hot water. Did not show much interest in SWH.
• Owner Household: Interviewed 6 independent, most use it for over 270-300 days. All of them have FTC model face after sales service problem. Over-all happy experience.
24. Kamrup (Guwahati)
Profile: Kamrup, A district of Assam state, spreads over 2740 km2 of land. As per census of 2001, the population of the district was 2,522,324 with an urban share of 36%. As per census 2001, total numbers of households were 490,740 with an average household size of 5. Almost, 33% of the households are of permanent construction. Almost, 17% of the households own a two wheeler. Market size of the district is around Rs.8396 crores. SWH Scenario: Kamrup falls under warm-humid climate and receives a solar radiation of about 4.9 kWh/m2/day. There are around 19 installations in the city, out of which 3 are not functioning.
Summary of primary survey & stakeholder interviews: • From the experiences of the solar hot water users of Guwahati, it is found that
most of the users are satisfied with the performance of the systems and are using such systems almost all the year round except, for a few days of continuous cloudy days.
• During recent years a number of SWH systems have been installed within Guwahati city without any Government subsidy or bank loan and the users are fully satisfied.
• It is found from the primary survey of non owner households that, out of 11 non owner (of SHW) households of Guwahati city as many as 9 households have electric Geysers (standard size, 2 kW). Most of these users would opt for Solar
For the city of Raipur in coming years both residential sector and institutional sector will be potential user for SWH system.

SWH Market Assessment
Greentech Knowledge Solutions A.39
system if such systems are dependable and economically viable. Further, a large numbers of multistoried residential complexes are coming up in Guwahati and in such complexes there are electric geysers in 90% of apartments. Present population of geyser in such residential complex is estimated to be around 6,000.
• From the feedback received from primary surveys of guest houses and hospitals, even without any subsidy or support solar hot water systems are considered economically viable for hotels, guesthouses, hospitals and hostels, particularly when combined with preheating of water for cooking purpose.
• WEAKNESS: Lack of awareness, system cost is high (Rs.28,500 for 100 lpd FPC system), no regulation binding the hotels , hospitals and residential complexes to use solar hot water system, very poor after sale service and low marketing effort by the solar hot water companies/ dealers.
• The potential industries are
o Milk pasteurization plants- preheating boiler water. 9 plants in Govt. sector and 8 plants in private sector with average requirement of 500 LPD.
o Tea factories steam /boiling where water is used for sterilizing the floor. The average requirement of factories is 1000 LPD and there are around 1000 factories in Assam.
• Policy: In the electricity tariff taxed by the State Regulatory Commission for the electrical distribution companies there is a provision of rebate of Rs. 40.00 per month per 100 LPD SHW installed. There is no other regulatory / mandatory provision for use of SHW system in Assam. There is a Govt. of India scheme of bank loan at ‘nil’ interest for SHW system for NE States. Higher level of subsidy is available from MNRE. Govt. of India for Solar Water Heating System.
Caselets: i) Guwahati Neurological Research Centre (Hospital) invested Rs. 3,10,000.00 in a 2500 LPD SHW system during the year 2005 . Yearly saving is estimated by the Engineer in-charged at Rs.11,250.00. Thus the payback period was about 3 years only. ii) Similarly, the St. John’s Hospital who invested Rs. 2,50,000 for a 1000 LPD system, is saving about Rs. 4320.00 in electricity per month. As such, the payback period is about 5.years. iii) Sisters’ of Superior Auxiliary is using a 1000 LPD SWH for last 4 years and meeting over 80% of hot water requirement from the SHW. iv) The Indian Institute of Entrepreneurship, Guwahati is fully depending on hot water supply in the 42 rooms (single bed ) trainees’ guesthouse for last nine years on the 2500 LPD hot water system installed in their guest house.

SWH Market Assessment
Greentech Knowledge Solutions A.40
v) The Purabi Dairy saved around 30% of cost of fuel (diesel) when their 2500 LPD solar hot water system, when the system was in use for 10 years from1991.
25. Darjeeling
Profile: Darjeeling, a district of West Bengal state, spreads over 3149 km2 of land. As per census of 2001, the population of the district was 1,609,172 with an urban share of 32.3%. Annual growth rate in population during 1991-2001 was 2.1%. As per census 2001, total numbers of households were 318,737 with an average household size of 5. Almost, 37.6% of the households are of permanent construction. Almost, 11% of the households own a two wheeler. Market size of the district is around Rs.3242 crores. SWH Scenario: Darjeeling District falls under warm-humid climate and receives a solar radiation of about 5.2 kWh/m2/day. The hills of Darjeeling gets less than 4 kwh/m2 / day solar radiation. The existing installation in the city is around 5000 lpd. Annual sale is around 2500 lpd in the city. Households share 25% of the existing installation. FPC-ETC split up of existing installation is 90:10 while the split up for annual sale is 85:15. Siliguri city share in West Bengal market is around 5-7%. There are 3 assembler, 3 national brand dealers and 1 other dealer in the city. Market is expected to grow by 50% for next few years. Summary of primary survey & stakeholder interviews: • Demand-enhancers: Daily uses of hot water almost throughout the year. High
radiation is available in the Siliguri and Kalimpong area almost 200 days in a year. High cost of electricity in WBSEDCL area. Average Temperature is low in comparison to other part of West Bengal.
• Demand-Dampeners: After sales service is very poor from the supplier’s side. Low radiation in the hill areas is the main barrier for growth in demand.
• Some systems was found non functional due to low radiation and poor after sales service of the suppliers.
• Bank loan is not available till now.
• Siliguri Corporation has not issued any policy regarding use of the SWH system.
• Easy bank finance for installing the SWH system is needed.
• Hostels, institutions & hotel industry have good potential r in Darjeeling town and also in the sub divisions particularly. Kalimpong has better potential because of high number of sunny days with low ambient temperature.
SWH Market Assessment
Greentech Knowledge Solutions A.41
Caselet: North Bengal Alternative Energy & Rural Development Association Mr. Ashok Barari Secretary of this organization has worked a lot in various sectors like old-age home, orphanage home, institutions, hostels, households etc. for installing the solar energy systems like solar hot water, home lighting, street light, lantern etc. for the past 30 years in remote areas of North Bengal such as Panighata, Mirik, Matigara (situated in Darjeeling dist.), Sikkim North, East, South, West (situated in Sikkim). In last year Mr Barari took initiative to install Solar Water Heater system in a orphanage home called “Ashagram” situated at Rani danga , Darjeeling district. They have installed 1600 LPD system and now they are very much satisfied with their experience. They are using hot water for residential children bathing, cooking, clothes cleaning etc. Last year they have installed 200 LPD SWH system in “Apna Ghar” an old-age home situated at Calom Jote, Matigara, Darjeeling District, they are also satisfied with the system.There are more such examples. He works silently to improve the market and generating the awareness of the people.
26. Kolkata
Profile: Kolkata, the capital of state West Bengal, spreads over 187 km2 of land. As per census of 2001, the population of the district was 4,580,544 with an urban share of 45%. Annual growth rate in population during 1991-2001 was 0.4%. As per census 2001, total numbers of households were 929,586 with an average household size of 5. Almost, 91.3% of the households are of permanent construction. Almost, 19% of the households own a two wheeler. Market size of the district is around Rs.13980 crores. SWH Scenario: Kolkata falls under warm-humid climate and receives a solar radiation of about 5.4 kWh/m2/day. The existing installation in the city is around 100,000 lpd. Annual sale is around 45,000 lpd in the city. Households share 70% of the existing installation. FPC-ETC split up of existing installation is 75:25 while the split up for annual sale is 60:40. Kolkata city share in West Bengal market is around 50-60%. There are 1 manufacturer, 5 assemblers, 2 national brand dealers and 3 other dealer in the city. Market is expected to grow by 50% for next few years. Summary of primary survey & stakeholder interviews: • Demand-enhancers: Frequent Power cut in Kolkata. High radiation in almost 265
days in a year. High cost of electricity in CESC / WBSEDCL area. Availability of soft loan.
• Demand-Dampeners: Leakage problems. Initial high cost. Poor service provided by the supplier. Non availability of water with full pressure at the Roof. (In case of old houses)

SWH Market Assessment
Greentech Knowledge Solutions A.42
• Competition exists only in dealers of SWH system. Practically no manufacturers exist in Kolkata, except one of inferior quality. After sale service is very poor from the supplier side.
• Bank loan is not available easily.
• Awareness of general people is low.
• Kolkata Corporation has not issued any policy regarding use of the SWH system.
• Annual Maintenance Contract from Supplier is required for the growth of the market.
• Low industrial demand. Household sector & hotels industry and Hospitals are very much potential sector in Kolkata
• In West Bengal most of the system installed in Govt. sector are non functional.
• Old aged homes run by NGOs are also prospective customers
Caselet 1:Ramakrishna Mission Residential College, Narendrapur, The College, set up in 1960 and affiliated to the University of Calcutta, has 6 science departments. Since the college is dedicated to the ideal of man-making and character building education as propounded by Swami Vivekananda, the college lays much emphasis on values both moral and spiritual and on games and sports. The College has well-equipped prayer halls at the hostels; cricket, football and table-tennis teams which perform quite creditably in different sports meets
Ram Krishna Mission Residential College, Narendrapur
Swami Suparananda Maharaj Principal, College is so much satisfied with this system. 2800 LPD installed in this college. There are three 3- storied hostel building (Brahmananda Bhavan, Gauranga Bhavan, Ramkrishna Bhavan) where the system has been installed. Mainly cooking and bathing purposes they use the hot water and they are quite satisfied with the system because of getting instant hot water in any time of the day.
27. Shillong (East Khasi Hills)

SWH Market Assessment
Greentech Knowledge Solutions A.43
Profile: Shillong, the capital of state Meghalaya, spreads over 2752 km2 of land. As per census of 2001, the population of the district was 660,923 with an urban share of 42%. Annual growth rate in population during 1991-2001 was 2.1%. As per census 2001, total numbers of households were 125,567 with an average household size of 5. Almost, 43.7% of the households are of permanent construction. Almost, 5% of the households own a two wheeler. Market size of the district is around Rs.1484 crores. SWH Scenario: Shillong falls under warm-humid climate and receives a solar radiation of about 4.8 kWh/m2/day. There are around 27 installations in the city, out of which 24 are domestic. Summary of primary survey & stakeholder interviews: • There is hot water demand round the year. From the radiation availability point of
view, SWH can fully meet hot water demand for 8 months, 50% for 2 months and 2 months electric backup is required. From the experiences of the solar hot water users, it is found that all the users are satisfied with the performance of the systems and are using such systems almost all the year round, except during continuous cloudy days.
• Cost is not a major barrier as SWH systems have been installed in hotels/hostels within the city without any Government subsidy or bank loan.
• As most of the residential houses in Meghalaya are with sloping roofs there are problem /extra cost in installation of SWH system.
• Awareness is quite low. System cost is high (Rs.28,500 for 100 lpd system).
• Very poor after sale service and low marketing effort by the solar hot water companies/ dealers.
• Policy: The state Govt. provides Rs 3000.00 per domestic system for targeted numbers of beneficiaries every year. There are no other regulatory/Tariff incentive. There is a Govt. of India scheme of bank loan at ‘nil’ interest for SWH system for NE States.
28. West Tripura (Agartala)
Profile: West Tripura, a district of state Tripura, spreads over 2997 km2 of land. As per census of 2001, the population of the district was 1,532,982 with an urban share of 27%. Annual growth rate in population during 1991-2001 was 1.7%. As per census 2001, total numbers of households were 321,777 with an average household size of 5. Only, 13.7% of the households are of permanent construction. Almost, 8% of the households own a two wheeler. Market size of the district is around Rs.3415 crores. SWH Scenario: Agartala falls under warm-humid climate and receives a solar radiation of about 5.2 kWh/m2/day. The existing installation in the city is around 6300

SWH Market Assessment
Greentech Knowledge Solutions A.44
lpd. Annual sale is around 200 lpd in the city. Households share 20% of the existing installation. FPC-ETC split up of existing installation is 75:25 while the split up for annual sale is 70:30. Agartala city share in Tripura market is around 25-30%. There are 2 national brand dealers and 1 other dealer in the city. Market is expected to grow by 50% for next few years. Nearby markets: Bishalgarh, Sekerkut, Teliamura, Khowai, Ranirbazar, Jirania. Summary of primary survey & stakeholder interviews: • Demand-enhancers: Limited apartment culture, good scope for SWH. Daily
average 2 hour power-cut. Almost 250 clear days in a year. Winter is of 5 months.
• Demand-Dampeners: Leakage problems. High initial cost. Absence of marketing network of SWH manufactures.
• Awareness of general people is low.
• There is only growth in Govt. sector.
• Annual Maintenance Contract from Supplier is required for the growth of the market.
• Policy: A local assembler has tied up with two co-operative banks for providing of low interest loan to SWH users. Agartala Municipal Corporation has not issued any policy regarding the use of the SWH System. There is no electricity tariff rebate on use of SWH. Agartala Municipal Corporation has not passed any resolution to provide any rebate on property tax to encourage SWH user.
Caselet: Sagarmahal Guest House under ICAT Dept. Govt. of Tripura. There is a tourist place named Nirmahal under Melaghar block in West Tripura district. The Nirmahal is constructed in the middle of the big water body with an attractive design before 100 years by the kingdom of Tripura. Hence it has become an attractive tourist spot in the state. The Sagarmahal has been constructed for accommodation of the tourist who stay there for one or two days. The authorities approached TREDA for installing of SWH system in the Sagarmahal for hot water uses. Accordingly TREDA has installed the SWH in the following manner.
Year of installation: 2006. Capacity: 1000 lpd. Supplier: Rashmi Solar. Cost: Rs. 200000. Subsidy from TREDA: Rs. 160000. Contribution from Sagarmahal: Rs. 40000.
The side of installation is shadow free and sunshine is available for whole day. Beneficiary is fully satisfied about the functioning of the SWH.

SWH Market Assessment
Greentech Knowledge Solutions A.45
It does not work for 40 to 50 days in a year due to rainy days and cloudy sky. In other days they are getting full quantity of water at a temperature of 55°C to 65°C. They are using this hot water for bathing and cooking regularly. Previously they were using geysers’ for bathing in 16 rooms of the guest house but now they have stopped using geysers’ as they have the solar hot water. They are saving 2400 kwh electricity per year and 500 to 700 kg biomass per year. Net savings Rs.25000/year (approx.). No major problem has been faced by them. Only some minor problem in piping & tape including the insulation of the piping. These have been repaired and servicing was done by TREDA with an cost of Rs. 6000 (approx.) from 2006. Tourist and visitors become inspired by seeing the SWH system.This is a very good technology because it runs without any fuel and operators. Tourism dept. are now very much interested to install such type of SWH system in their other guest houses in Tripura.
29. LehLadakh
Profile: LehLadakh, a district of state Jammu & Kashmir, spreads over 45, 110 km2 of land (largest in India). As per census of 2001, the population of the district was 117,232 with an urban share of 24%. Annual growth rate in population during 1991-2001 was 2.7%. As per census 2001, total numbers of households were 24,147 with an average household size of 5. Only, 3.5% of the households are of permanent construction. Almost, 9% of the households own a two wheeler. Market size of the district is around Rs.359 crores. SWH Scenario: Leh falls under cold climate and receives a solar radiation of about 5.4 kWh/m2/day. At present, SWH deployment in the district is less but the potential is quite good for the district. As per the recent study, the SWH potential for the Leh district is estimated around 9.4 lacs lpd (~18,800 m2 of collector area). Almost 40% of the total potential falls under residential sector. Hotels & guest houses have 35% share in the overall potential. As per census 2001, total number of hospital beds in the district was 310. Residential: Having the very cold climate conditions, hot water is required throughout the year. Based on the studies done in 90’s it was found that, on an average, 100 lpd system is required per household to meet their demand. Recent studies show that around 4000 households can be targeted for SWH deployment. Drain-down type solar water heaters have been found to be very useful in Ladakh. In this design, a rectangular tank with a large area/volume ratio is contained in an insulated box with a double-glazed cover. This collector is then mounted on the roof (roofs in Ladakh are flat), and inclined at a 45 degree angle to the horizontal, as a compromise between optimum summer and winter tilts. Cold water is piped into the top of the tank, and hot water drawn from the bottom. The collector tank is constructed of 2mm welded GI sheet metal with internal support to prevent buckling.

SWH Market Assessment
Greentech Knowledge Solutions A.46
The tank is generally about 10mm deep, with a surface of the tank is painted matte black. Hotels/Guest House: Being one of the favorite tourist spots in India, Leh has a large number of tourists visiting every year (~38,000). The tourist season here begins from June, reaching the peak in July-August, and then slackens from September. By October end, activities associated with tourism come to a halt. To cater to the boarding and lodging requirements of the tourists, a number of hotels and guest houses (approximately 500 in number) are available. Average SWH system size for hotels and guest house can be taken as 1000 lpd and 500 lpd, respectively. Hotels and guest houses are not operational throughout the year. On an average, they are open for five months (June to October) out of which August and September are the peak months (almost 100% occupancy). During the rest of the operating months, the average occupancy is about 25%. Almost all the hotels have a central wood fired boiler for heating water. Hot water is supplied to individual rooms through pipelines. Pipelines are not insulated resulting in heavy energy losses. The average hot water requirement per occupant per day is 30 lpd in hotels. In the guest houses, kerosene stoves are used for heating water and hot water is supplied in buckets. The average hot water requirement per occupant per day is 15 lpd. Govt. buildings: Apart from residential sector & hotels/guest houses, there are a large number of Govt. buildings which can be targeted for SWH deployment. The estimated potential for Govt. buildings is ~1.3 lac lpd. Caselet: The Grand Dragon Hotel, Ladakh The hotel has around 53 rooms. It blends traditional architecture with "green" philosophy as they have 95 solar panels (total 9500 lpd, 190 m2 of collector area) to help heat the water for central heating, and bathroom. The windows are double glazed and the hotel including the water supply, are well insulated to conserve energy.

SWH Market Assessment
Greentech Knowledge Solutions A.47
Annexure II: Projections at a glance

SWH Market Assessment
Greentech Knowledge Solutions A.48
Table A3: SWH projections for India (Sector-wise cumulative installations in million m2 of collector area)
Year Res.Urban Res.Rural Hotel Hospital Industry Others Total Res.Urban Res.Rural Hotel Hospital Industry Others Total Res.Urban Res.Rural Hotel Hospital Industry Others Total2010 2.21 0.35 0.19 0.10 0.19 0.18 3.22 2.23 0.35 0.19 0.10 0.19 0.18 3.24 2.37 0.37 0.20 0.10 0.19 0.18 3.412013 3.57 0.42 0.35 0.16 0.33 0.27 5.11 3.83 0.42 0.35 0.17 0.33 0.27 5.37 4.51 0.46 0.38 0.21 0.33 0.27 6.152017 5.84 0.51 0.60 0.26 0.57 0.39 8.16 7.17 0.51 0.61 0.27 0.57 0.39 9.52 8.96 0.57 0.72 0.42 0.57 0.39 11.632022 9.64 0.60 0.92 0.40 1.05 0.52 13.13 15.14 0.60 0.97 0.43 1.05 0.52 18.70 19.59 0.69 1.27 0.96 1.05 0.52 24.08
Pessimistic Scenario Realistic Scenario Optimistic Scenario

SWH Market Assessment
Greentech Knowledge Solutions A.49
Table A2: SWH projections for States for 2010 (Cumulative installations in m2 of collector area)
2010State Res.Urban Res.Rural Hotel Hospital Total Res.Urban Res.Rural Hotel Hospital Total Res.Urban Res.Rural Hotel Hospital TotalKarnataka 1,122,203 186,289 24,500 26,435 1,359,427 1,122,203 186,289 24,500 26,435 1,359,427 1,177,142 190,619 24,500 26,492 1,418,752 Maharashtra 487,872 55,064 52,380 14,482 609,797 492,302 55,064 52,400 14,488 614,255 526,746 56,952 52,440 15,182 651,320 Tamil Nadu 124,178 12,983 19,240 8,197 164,598 127,079 12,983 19,280 8,221 167,563 138,061 13,543 19,920 8,936 180,460 Andhra Pradesh 85,563 19,758 12,080 5,965 123,365 87,562 19,758 12,100 5,981 125,400 95,128 20,610 12,480 6,501 134,719 Gujarat 72,961 9,312 6,260 7,127 95,660 74,665 9,312 6,260 7,148 97,385 81,117 9,714 6,480 7,770 105,081 Rajasthan 46,612 11,179 11,200 5,570 74,561 47,700 11,179 11,240 5,585 75,704 51,822 11,661 11,620 6,072 81,176 Uttar Pradesh 42,254 11,848 5,880 3,506 63,488 43,789 11,848 5,900 3,522 65,059 48,525 12,536 6,220 3,898 71,180 Kerala 33,393 7,852 16,680 4,934 62,858 34,173 7,852 16,720 4,947 63,692 37,126 8,190 17,280 5,377 67,974 West Bengal 36,107 6,554 4,180 5,366 52,207 37,418 6,554 4,180 5,390 53,543 41,466 6,935 4,400 5,966 58,767 Punjab 30,205 4,382 4,360 1,915 40,863 30,911 4,382 4,360 1,921 41,574 33,582 4,571 4,500 2,087 44,741 Delhi 20,039 105 13,740 2,290 36,173 20,767 105 13,780 2,300 36,951 23,013 111 14,520 2,545 40,189 Madhya Pradesh 22,881 4,650 2,760 2,151 32,442 23,712 4,650 2,760 2,161 33,282 26,276 4,920 2,900 2,392 36,488 Haryana 22,773 3,984 3,140 1,331 31,228 23,305 3,984 3,160 1,336 31,785 25,319 4,155 3,260 1,451 34,186 Bihar 10,492 7,215 440 328 18,475 10,873 7,215 440 329 18,858 12,049 7,634 460 365 20,508 Orissa 8,785 3,849 1,140 1,572 15,346 9,104 3,849 1,140 1,579 15,672 10,089 4,073 1,200 1,747 17,109 Uttranchal 8,124 1,858 1,360 958 12,300 8,314 1,858 1,360 960 12,492 9,032 1,938 1,420 1,043 13,434 Goa 2,911 228 8,580 448 12,167 2,979 228 8,600 450 12,257 3,236 238 8,880 490 12,843 Jharkhand 8,338 2,173 360 152 11,024 8,641 2,173 360 154 11,328 9,576 2,299 380 170 12,425 Chhatisgarh 6,418 1,904 220 601 9,143 6,652 1,904 220 604 9,379 7,371 2,014 240 668 10,293 Himachal Pradesh 2,759 1,692 1,760 1,409 7,621 2,823 1,692 1,760 1,414 7,689 3,067 1,765 1,820 1,536 8,189 Chandigarh 3,578 35 1,120 383 5,116 3,662 35 1,120 384 5,201 3,978 37 1,160 416 5,591 Jammu &Kashmir 3,150 679 440 426 4,695 3,265 679 440 427 4,811 3,618 718 460 473 5,270 Pondicherry 2,774 114 680 595 4,163 2,839 114 680 596 4,230 3,085 119 700 648 4,552 Assam 1,719 543 440 205 2,907 1,871 543 440 207 3,061 2,201 614 480 228 3,523 Tripura 301 70 100 154 625 328 70 100 155 653 386 79 100 172 736 Meghalaya 207 43 100 180 530 226 43 100 181 550 266 49 120 199 633 Manipur 247 35 ‐ 131 413 269 35 ‐ 132 436 316 40 ‐ 146 502 Nagaland 157 34 ‐ 188 379 171 34 ‐ 190 395 201 38 ‐ 208 448 Mizoram 216 11 ‐ 83 311 235 11 ‐ 84 330 276 13 ‐ 93 382 Dadra & Nagar Haveli 29 5 260 11 304 31 5 260 11 306 36 5 280 13 334 Arunachal Pradesh 119 22 ‐ 141 281 129 22 ‐ 141 292 152 24 ‐ 155 332 Andaman & Nicobar 64 7 140 55 266 69 7 140 55 271 82 8 160 61 310 Sikkim 31 13 20 104 168 34 13 20 104 171 40 15 20 114 189 Daman & Diu 30 3 80 14 127 33 3 80 14 130 39 3 100 15 157 Lakshadweep 10 1 20 11 42 11 1 20 11 43 13 1 20 13 47 TOTAL 2,207,499 354,493 193,660 97,418 2,853,070 2,228,144 354,493 193,920 97,615 2,874,172 2,374,431 366,243 198,520 103,643 3,042,837
Pessimistic Scenario Realistic Scenario Optimistic Scenario
Note: The above table excludes the SWH projections for Industrial and other sectors.

SWH Market Assessment
Greentech Knowledge Solutions A.50
Table A3: SWH projections for States for 2013 (Cumulative installations in m2 of collector area)
2013State Res.Urban Res.Rural Hotel Hospital Total Res.Urban Res.Rural Hotel Hospital Total Res.Urban Res.Rural Hotel Hospital TotalKarnataka 1,627,688 210,203 38,120 41,282 1,917,293 1,627,688 210,203 38,120 41,282 1,917,293 1,851,121 222,503 38,120 41,593 2,153,338 Maharashtra 822,928 66,574 91,840 23,111 1,004,452 875,613 66,574 92,060 23,171 1,057,417 1,037,826 72,298 92,260 27,258 1,229,643 Tamil Nadu 225,958 16,396 34,880 13,979 291,213 262,352 16,396 35,380 14,235 328,362 318,424 18,094 39,500 18,833 394,851 Andhra Pradesh 155,693 24,952 21,880 10,171 212,696 180,769 24,952 22,180 10,356 238,257 219,404 27,536 24,780 13,700 285,420 Gujarat 132,761 11,760 11,380 12,155 168,057 154,144 11,760 11,500 12,379 189,783 187,089 12,978 12,840 16,376 229,284 Rajasthan 84,815 14,119 20,300 9,500 128,734 98,476 14,119 20,620 9,673 142,887 119,523 15,580 23,020 12,797 170,921 Uttar Pradesh 85,193 16,045 11,300 6,727 119,265 104,942 16,045 11,500 6,907 139,394 130,063 18,133 13,700 9,550 171,447 Kerala 60,763 9,916 30,220 8,413 109,312 70,549 9,916 30,680 8,565 119,710 85,628 10,943 34,260 11,333 142,163 West Bengal 72,800 8,877 7,980 10,295 99,952 89,676 8,877 8,120 10,570 117,242 111,142 10,032 9,660 14,615 145,449 Delhi 40,402 142 26,260 4,393 71,197 49,769 142 26,760 4,509 81,179 61,682 160 31,860 6,235 99,937 Punjab 54,963 5,534 7,880 3,267 71,644 63,816 5,534 7,980 3,326 80,656 77,455 6,107 8,920 4,400 96,882 Madhya Pradesh 46,132 6,298 5,280 4,127 61,836 56,826 6,298 5,380 4,237 72,740 70,429 7,117 6,400 5,859 89,805 Haryana 41,439 5,031 5,700 2,270 54,440 48,113 5,031 5,800 2,312 61,257 58,396 5,552 6,480 3,059 73,488 Bihar 21,154 9,772 860 629 32,415 26,058 9,772 860 645 37,334 32,296 11,043 1,020 892 45,250 Orissa 17,712 5,213 2,160 3,016 28,101 21,819 5,213 2,200 3,095 32,327 27,042 5,891 2,620 4,280 39,833 Jharkhand 16,812 2,943 680 293 20,727 20,708 2,943 700 301 24,652 25,666 3,325 840 415 30,246 Uttranchal 14,783 2,347 2,480 1,632 21,242 17,163 2,347 2,520 1,663 23,693 20,832 2,590 2,820 2,200 28,442 Goa 5,297 288 15,580 763 21,927 6,150 288 15,780 780 22,997 7,464 317 17,620 1,031 26,432 Chhatisgarh 12,940 2,578 440 1,152 17,111 15,941 2,578 440 1,184 20,143 19,757 2,914 520 1,637 24,828 Himachal Pradesh 5,020 2,137 3,200 2,402 12,760 5,829 2,137 3,240 2,447 13,653 7,074 2,359 3,620 3,237 16,290 Jammu &Kashmir 6,351 919 860 817 8,947 7,824 919 860 839 10,441 9,696 1,038 1,020 1,160 12,915 Chandigarh 6,511 44 2,060 650 9,265 7,559 44 2,060 663 10,327 9,175 49 2,300 877 12,401 Assam 4,553 975 960 461 6,950 6,646 975 960 478 9,059 8,567 1,191 1,220 642 11,620 Pondicherry 5,048 144 1,240 1,015 7,447 5,861 144 1,240 1,034 8,279 7,114 159 1,380 1,367 10,021 Tripura 798 125 180 348 1,451 1,165 125 200 360 1,850 1,502 153 260 484 2,398 Meghalaya 549 77 220 403 1,249 801 77 260 418 1,556 1,033 94 320 560 2,008 Manipur 653 64 ‐ 296 1,013 954 64 ‐ 306 1,323 1,230 78 ‐ 411 1,718 Nagaland 416 61 ‐ 424 902 607 61 ‐ 440 1,108 782 75 ‐ 590 1,447 Mizoram 571 20 ‐ 188 780 834 20 ‐ 196 1,050 1,075 25 ‐ 262 1,362 Arunachal Pradesh 315 38 ‐ 316 670 459 38 ‐ 326 823 592 47 20 438 1,097 Dadra & Nagar Haveli 75 8 540 25 648 109 8 580 26 724 141 10 740 35 925 Andaman & Nicobar 169 12 300 124 605 246 12 300 128 687 318 15 400 173 905 Sikkim 83 24 20 233 360 121 24 20 242 407 156 29 40 325 550 Daman & Diu 80 5 180 30 295 117 5 180 30 332 151 6 220 41 418 Lakshadweep 28 2 20 25 75 40 2 20 26 88 52 2 40 35 129 TOTAL 3,571,453 423,642 345,000 164,932 4,505,027 3,829,743 423,642 348,500 167,148 4,769,033 4,509,896 458,442 378,820 206,701 5,553,859
Pessimistic Scenario Realistic Scenario Optimistic Scenario
Note: The above table excludes the SWH projections for Industrial and other sectors.

SWH Market Assessment
Greentech Knowledge Solutions A.51
Table A4: SWH projections for States for 2017 (Cumulative installations in m2 of collector area)
2017State Res.Urban Res.Rural Hotel Hospital Total Res.Urban Res.Rural Hotel Hospital Total Res.Urban Res.Rural Hotel Hospital TotalKarnataka 2,378,559 235,788 56,620 62,653 2,733,621 2,378,559 235,788 56,620 62,653 2,733,621 2,852,284 256,618 56,620 63,552 3,229,073 Maharashtra 1,413,912 80,993 159,020 36,245 1,690,169 1,665,426 80,993 159,900 36,481 1,942,800 2,090,911 91,524 160,580 49,646 2,392,661 Tamil Nadu 405,481 20,672 61,220 22,607 509,981 593,663 20,672 63,320 23,602 701,257 760,172 23,796 77,920 40,354 902,242 Andhra Pradesh 279,390 31,460 38,420 16,448 365,717 409,053 31,460 39,740 17,170 497,423 523,783 36,212 48,900 29,356 638,251 Gujarat 238,239 14,828 19,960 19,657 292,684 348,806 14,828 20,600 20,524 404,758 446,638 17,068 25,360 35,088 524,154 Uttar Pradesh 160,930 21,303 20,260 11,414 213,907 267,119 21,303 21,120 12,107 321,649 346,299 25,143 29,400 23,127 423,970 Rajasthan 152,201 17,801 35,620 15,362 220,984 222,837 17,801 36,900 16,038 293,576 285,338 20,490 45,400 27,419 378,647 West Bengal 137,520 11,786 14,300 17,471 181,076 228,260 11,786 14,920 18,531 273,497 295,922 13,911 20,760 35,398 365,990 Kerala 109,039 12,502 53,020 13,604 188,166 159,644 12,502 54,900 14,200 241,246 204,420 14,391 67,540 24,280 310,631 Delhi 76,320 188 47,080 7,452 131,040 126,680 188 49,200 7,904 183,972 164,230 222 68,460 15,100 248,012 Punjab 98,631 6,978 13,820 5,283 124,712 144,406 6,978 14,300 5,515 171,198 184,908 8,032 17,600 9,429 219,969 Madhya Pradesh 87,144 8,361 9,460 7,003 111,968 144,645 8,361 9,860 7,428 170,294 187,521 9,868 13,720 14,191 225,300 Haryana 74,362 6,343 10,020 3,671 94,396 108,873 6,343 10,380 3,833 129,429 139,410 7,301 12,780 6,553 166,044 Bihar 39,959 12,974 1,520 1,067 55,520 66,326 12,974 1,580 1,132 82,012 85,987 15,312 2,200 2,161 105,660 Orissa 33,459 6,921 3,880 5,117 49,377 55,538 6,921 4,060 5,425 71,943 72,000 8,168 5,660 10,366 96,195 Jharkhand 31,757 3,907 1,220 495 37,379 52,712 3,907 1,300 526 58,444 68,337 4,611 1,800 1,004 75,752 Uttranchal 26,528 2,959 4,360 2,639 36,486 38,839 2,959 4,520 2,757 49,074 49,732 3,406 5,560 4,714 63,411 Chhatisgarh 24,445 3,423 780 1,957 30,604 40,575 3,423 800 2,076 46,874 52,603 4,040 1,120 3,965 61,727 Goa 9,505 363 27,300 1,234 38,401 13,916 363 28,220 1,292 43,791 17,819 417 34,720 2,207 55,164 Assam 9,553 1,518 1,760 826 13,656 21,999 1,518 1,840 890 26,247 29,039 1,914 2,940 1,721 35,614 Himachal Pradesh 9,009 2,695 5,600 3,884 21,187 13,190 2,695 5,800 4,056 25,741 16,889 3,102 7,140 6,934 34,066 Jammu &Kashmir 11,997 1,220 1,520 1,386 16,124 19,914 1,220 1,580 1,472 24,186 25,816 1,440 2,200 2,811 32,268 Chandigarh 11,684 56 3,600 1,052 16,392 17,106 56 3,700 1,099 21,961 21,904 65 4,540 1,880 28,389 Pondicherry 9,059 182 2,160 1,641 13,042 13,263 182 2,220 1,715 17,380 16,983 210 2,720 2,930 22,843 Tripura 1,674 195 360 622 2,851 3,857 195 420 671 5,142 5,091 246 640 1,298 7,274 Meghalaya 1,152 120 440 719 2,432 2,653 120 480 777 4,030 3,502 151 760 1,503 5,916 Manipur 1,370 99 ‐ 529 1,998 3,157 99 ‐ 570 3,826 4,167 125 ‐ 1,103 5,395 Mizoram 1,199 32 ‐ 337 1,567 2,760 32 ‐ 364 3,155 3,643 40 ‐ 703 4,386 Nagaland 872 95 ‐ 756 1,724 2,009 95 ‐ 817 2,922 2,652 120 ‐ 1,580 4,353 Arunachal Pradesh 660 60 20 566 1,306 1,520 60 20 607 2,207 2,006 75 40 1,177 3,298 Andaman & Nicobar 354 19 580 222 1,175 816 19 600 238 1,673 1,078 24 940 460 2,502 Dadra & Nagar Haveli 157 12 1,040 45 1,254 361 12 1,120 49 1,542 477 15 1,740 93 2,325 Sikkim 174 37 60 418 689 402 37 80 451 970 531 47 140 872 1,589 Daman & Diu 168 8 320 53 549 386 8 340 56 790 510 10 540 109 1,169 Lakshadweep 58 2 40 45 146 134 2 40 49 225 177 3 80 93 353 TOTAL 5,836,520 505,899 595,380 264,479 7,202,279 7,169,404 505,899 610,480 273,073 8,558,855 8,962,777 568,117 720,520 423,176 10,674,590
Pessimistic Scenario Realistic Scenario Optimistic Scenario
Note: The above table excludes the SWH projections for Industrial and other sectors.

SWH Market Assessment
Greentech Knowledge Solutions A.52
Table A5: SWH projections for States for 2022 (Cumulative installations in m2 of collector area)
2022State Res.Urban Res.Rural Hotel Hospital Total Res.Urban Res.Rural Hotel Hospital Total Res.Urban Res.Rural Hotel Hospital TotalKarnataka 3,458,692 259,399 73,200 91,501 3,882,792 3,458,692 259,399 73,200 91,501 3,882,792 4,292,460 288,098 73,200 93,662 4,747,421 Maharashtra 2,475,684 97,812 247,540 55,058 2,876,095 3,400,615 97,812 250,080 55,696 3,804,204 4,404,496 113,950 251,740 92,195 4,862,381 Tamil Nadu 728,015 25,661 96,200 34,730 884,607 1,503,906 25,661 102,640 37,495 1,669,703 1,973,830 30,448 141,600 92,517 2,238,394 Andhra Pradesh 501,626 39,050 60,380 25,266 626,323 1,036,241 39,050 64,400 27,275 1,166,967 1,360,034 46,333 88,860 67,301 1,562,529 Gujarat 427,743 18,406 31,340 30,197 507,687 883,618 18,406 33,420 32,602 968,046 1,159,721 21,839 46,100 80,436 1,308,096 Uttar Pradesh 297,001 27,437 32,320 17,838 374,595 760,960 27,437 35,000 19,758 843,155 1,004,753 33,321 59,260 63,630 1,160,965 West Bengal 253,796 15,179 22,820 27,302 319,096 650,261 15,179 24,740 30,240 720,420 858,590 18,435 41,880 97,389 1,016,293 Rajasthan 273,267 22,096 56,020 23,599 374,982 564,505 22,096 59,780 25,477 671,858 740,896 26,217 82,480 62,860 912,452 Kerala 195,772 15,519 83,360 20,897 315,548 404,420 15,519 88,980 22,559 531,477 530,788 18,413 122,760 55,660 727,621 Delhi 140,850 242 75,180 11,647 227,919 360,879 242 81,560 12,900 455,581 476,496 294 138,080 41,543 656,413 Madhya Pradesh 160,825 10,768 15,080 10,944 197,618 412,058 10,768 16,360 12,122 451,308 544,072 13,078 27,660 39,043 623,852 Punjab 177,086 8,661 21,700 8,116 215,563 365,818 8,661 23,180 8,759 406,419 480,125 10,277 31,960 21,614 543,976 Haryana 133,513 7,873 15,760 5,639 162,786 275,805 7,873 16,840 6,089 306,608 361,986 9,342 23,240 15,022 409,590 Bihar 73,746 16,708 2,420 1,666 94,540 188,948 16,708 2,620 1,847 210,123 249,482 20,292 4,440 5,942 280,156 Orissa 61,751 8,913 6,200 7,996 84,859 158,213 8,913 6,740 8,854 182,720 208,901 10,825 11,400 28,520 259,645 Jharkhand 58,609 5,031 1,980 773 66,393 150,163 5,031 2,120 858 158,172 198,272 6,110 3,600 2,762 210,744 Chhatisgarh 45,113 4,409 1,240 3,058 53,820 115,589 4,409 1,340 3,388 124,726 152,621 5,354 2,260 10,910 171,145 Uttranchal 47,629 3,673 6,860 4,057 62,218 98,390 3,673 7,300 4,382 113,745 129,134 4,358 10,080 10,808 154,380 Assam 18,535 2,151 2,900 1,313 24,899 81,984 2,151 3,220 1,490 88,845 109,018 2,758 7,060 5,881 124,716 Goa 17,065 450 42,920 1,897 62,332 35,252 450 45,720 2,051 83,473 46,267 534 63,080 5,056 114,938 Jammu &Kashmir 22,141 1,572 2,400 2,167 28,280 56,728 1,572 2,620 2,401 63,321 74,903 1,909 4,420 7,733 88,965 Himachal Pradesh 16,175 3,345 8,820 5,967 34,307 33,415 3,345 9,400 6,443 52,603 43,856 3,969 12,980 15,896 76,702 Chandigarh 20,977 70 5,640 1,617 28,304 43,334 70 5,980 1,747 51,131 56,875 83 8,240 4,312 69,509 Pondicherry 16,264 226 3,380 2,520 22,390 33,599 226 3,600 2,723 40,147 44,097 268 4,980 6,715 56,060 Tripura 3,249 276 600 988 5,114 14,373 276 700 1,123 16,472 19,112 354 1,500 4,432 25,399 Manipur 2,659 140 ‐ 842 3,642 11,764 140 ‐ 955 12,859 15,643 180 ‐ 3,764 19,587 Meghalaya 2,235 170 720 1,147 4,272 9,888 170 820 1,301 12,180 13,149 218 1,800 5,133 20,300 Mizoram 2,325 45 ‐ 536 2,906 10,286 45 ‐ 608 10,939 13,678 57 ‐ 2,399 16,135 Nagaland 1,693 135 ‐ 1,204 3,031 7,488 135 ‐ 1,369 8,992 9,957 173 ‐ 5,395 15,526 Arunachal Pradesh 1,281 85 20 899 2,285 5,663 85 20 1,019 6,787 7,530 109 100 4,024 11,763 Andaman & Nicobar 688 27 940 354 2,009 3,042 27 1,020 400 4,488 4,045 34 2,280 1,577 7,937 Dadra & Nagar Haveli 305 17 1,680 70 2,072 1,344 17 1,880 80 3,322 1,788 22 4,100 316 6,226 Sikkim 338 52 140 665 1,196 1,499 52 200 755 2,506 1,993 67 440 2,978 5,478 Daman & Diu 326 12 540 85 963 1,439 12 600 96 2,147 1,914 15 1,320 377 3,626 Lakshadweep 113 3 40 70 226 499 3 100 80 682 664 4 300 316 1,283 TOTAL 9,637,088 595,614 920,340 402,625 11,555,667 15,140,678 595,614 966,180 426,446 17,128,919 19,591,143 687,738 1,273,200 958,118 22,510,199
Pessimistic Scenario Realistic Scenario Optimistic Scenario
Note: The above table excludes the SWH projections for Industrial and other sectors.

SWH Market Assessment
Greentech Knowledge Solutions A.53
Table A6: SWH projections for Districts for 2010 (Cumulative installations in m2 of collector area)
2010District Residential Hotel Hospital Total Residential Hotel Hospital Total Residential Hotel Hospital TotalAgra Uttar Pradesh 5,410 1,764 351 7,525 5,564 1,770 352 7,686 6,106 1,866 390 8,362 Ahmadabad Gujarat 24,682 1,878 2,138 28,698 25,193 1,878 2,144 29,216 27,249 1,944 2,331 31,524 Bangalore Karnataka 654,246 12,250 13,217 679,713 654,246 12,250 13,217 679,713 683,880 12,250 13,246 709,376 Chennai Tamilnadu 27,432 5,772 2,459 35,663 28,012 5,784 2,466 36,263 30,321 5,976 2,681 38,978 Coimbatore Tamilnadu 27,432 3,848 1,639 32,920 28,012 3,856 1,644 33,513 30,321 3,984 1,787 36,092 Darjiling West Bengal 6,399 836 805 8,040 6,596 836 809 8,240 7,260 880 895 9,035 East Khasi hills (Shillong) Meghalaya 175 70 126 371 188 70 127 385 220 84 139 443 Ernakulam (Kochi) Kerala 10,311 4,170 1,233 15,715 10,506 4,180 1,237 15,923 11,329 4,320 1,344 16,993 Gurgaon Haryana 13,378 1,570 666 15,614 13,644 1,580 668 15,892 14,737 1,630 726 17,093 Hardwar Uttarakhand 1,996 272 192 2,460 2,034 272 192 2,498 2,194 284 209 2,687 Hyderabad Andhra Pradesh 52,660 6,040 2,982 61,683 53,660 6,050 2,990 62,700 57,869 6,240 3,251 67,359 Indore Madhya Pradesh 8,259 828 645 9,733 8,509 828 648 9,985 9,359 870 717 10,946 Jaipur Rajasthan 23,116 4,480 2,228 29,824 23,552 4,496 2,234 30,282 25,393 4,648 2,429 32,470 Kamrup (Guwahati) Assam 1,131 220 103 1,453 1,207 220 104 1,530 1,407 240 114 1,761 Khordha (Bhubaneswar) Orissa 3,790 342 472 4,604 3,886 342 474 4,701 4,248 360 524 5,133 Kolkata West Bengal 21,331 2,090 2,683 26,104 21,986 2,090 2,695 26,772 24,200 2,200 2,983 29,384 LehLadakh Jammu & Kashmir 766 132 85 983 789 132 85 1,006 867 138 95 1,100 Ludhiana Punjab 12,106 1,526 670 14,302 12,353 1,526 672 14,551 13,354 1,575 731 15,659 Nagpur Maharashtra 54,294 5,238 1,448 60,980 54,737 5,240 1,449 61,425 58,370 5,244 1,518 65,132 Patna Bihar 8,853 220 164 9,237 9,044 220 165 9,429 9,842 230 182 10,254 Pondicherry Pondicherry 2,166 510 446 3,122 2,215 510 447 3,172 2,403 525 486 3,414 Pune Maharashtra 162,881 10,476 2,896 176,253 164,210 10,480 2,898 177,588 175,109 10,488 3,036 188,634 Raipur Chhattisgarh 3,329 88 240 3,657 3,422 88 241 3,752 3,754 96 267 4,117 Ranchi Jharkhand 4,205 144 61 4,410 4,326 144 61 4,531 4,750 152 68 4,970 Sambalpur Orissa 1,895 171 236 2,302 1,943 171 237 2,351 2,124 180 262 2,566 Shimla Himachal Pradesh 2,226 880 705 3,810 2,258 880 707 3,845 2,416 910 768 4,094 Delhi Delhi 20,144 13,740 2,290 36,173 20,872 13,780 2,300 36,951 23,124 14,520 2,545 40,189 Thane Maharashtra 81,440 4,190 1,159 86,789 82,105 4,192 1,159 87,456 87,555 4,195 1,215 92,964 West Tripura (Agartala) Tripura 222 60 93 375 238 60 93 392 279 60 103 442 TOTAL 1,236,276 83,805 42,432 1,362,513 1,245,306 83,925 42,516 1,371,747 1,320,041 86,089 45,042 1,451,173 NCR 45,835 16,929 3,784 66,548 47,117 16,986 3,799 67,902 51,563 17,842 4,182 73,587
StatePessimistic Scenario Realistic Scenario Optimistic Scenario
Note: The above table excludes the SWH projections for Industrial and other sectors.

SWH Market Assessment
Greentech Knowledge Solutions A.54
Table A7: SWH projections for Districts for 2013 (Cumulative installations in m2 of collector area)
2013District Residential Hotel Hospital Total Residential Hotel Hospital Total Residential Hotel Hospital TotalAgra Uttar Pradesh 10,124 3,390 673 14,186 12,099 3,450 691 16,239 14,820 4,110 955 19,885 Ahmadabad Gujarat 43,356 3,414 3,647 50,417 49,771 3,450 3,714 56,935 60,020 3,852 4,913 68,785 Bangalore Karnataka 918,945 19,060 20,641 958,646 918,945 19,060 20,641 958,646 1,036,812 19,060 20,797 1,076,669 Chennai Tamilnadu 48,471 10,464 4,194 63,129 55,749 10,614 4,271 70,634 67,303 11,850 5,650 84,803 Coimbatore Tamilnadu 48,471 6,976 2,796 58,243 55,749 7,076 2,847 65,672 67,303 7,900 3,767 78,970 Darjiling West Bengal 12,251 1,596 1,544 15,392 14,783 1,624 1,585 17,992 18,176 1,932 2,192 22,300 East Khasi hills (Shillong) Meghalaya 439 154 282 874 615 182 292 1,089 789 224 392 1,405 Ernakulam (Kochi) Kerala 17,670 7,555 2,103 27,328 20,116 7,670 2,141 29,928 24,143 8,565 2,833 35,541 Gurgaon Haryana 23,235 2,850 1,135 27,220 26,572 2,900 1,156 30,628 31,974 3,240 1,530 36,744 Hardwar Uttarakhand 3,426 496 326 4,248 3,902 504 333 4,739 4,684 564 440 5,688 Hyderabad Andhra Pradesh 90,322 10,940 5,085 106,348 102,860 11,090 5,178 119,128 123,470 12,390 6,850 142,710 Indore Madhya Pradesh 15,729 1,584 1,238 18,551 18,937 1,614 1,271 21,822 23,264 1,920 1,758 26,942 Jaipur Rajasthan 39,574 8,120 3,800 51,494 45,038 8,248 3,869 57,155 54,041 9,208 5,119 68,368 Kamrup (Guwahati) Assam 2,764 480 230 3,475 3,811 480 239 4,530 4,879 610 321 5,810 Khordha (Bhubaneswar) Orissa 6,878 648 905 8,430 8,109 660 929 9,698 9,880 786 1,284 11,950 Kolkata West Bengal 40,838 3,990 5,148 49,976 49,276 4,060 5,285 58,621 60,587 4,830 7,308 72,725 LehLadakh Jammu & Kashmir 1,454 258 163 1,875 1,748 258 168 2,174 2,147 306 232 2,685 Ludhiana Punjab 21,174 2,758 1,143 25,075 24,272 2,793 1,164 28,230 29,247 3,122 1,540 33,909 Nagpur Maharashtra 88,950 9,184 2,311 100,445 94,219 9,206 2,317 105,742 111,012 9,226 2,726 122,964 Patna Bihar 15,463 430 315 16,207 17,915 430 323 18,667 21,669 510 446 22,625 Pondicherry Pondicherry 3,894 930 761 5,585 4,504 930 775 6,209 5,455 1,035 1,026 7,515 Pune Maharashtra 266,850 18,368 4,622 289,841 282,656 18,412 4,634 305,702 333,037 18,452 5,452 356,941 Raipur Chhattisgarh 6,207 176 461 6,844 7,408 176 474 8,057 9,068 208 655 9,931 Ranchi Jharkhand 7,902 272 117 8,291 9,460 280 120 9,861 11,596 336 166 12,098 Sambalpur Orissa 3,439 324 452 4,215 4,055 330 464 4,849 4,940 393 642 5,975 Shimla Himachal Pradesh 3,579 1,600 1,201 6,380 3,983 1,620 1,224 6,827 4,717 1,810 1,619 8,145 Delhi Delhi 40,544 26,260 4,393 71,197 49,910 26,760 4,509 81,179 61,842 31,860 6,235 99,937 Thane Maharashtra 133,425 7,347 1,849 142,621 141,328 7,365 1,854 150,546 166,519 7,381 2,181 176,080 West Tripura (Agartala) Tripura 554 108 209 871 774 120 216 1,110 993 156 290 1,439 TOTAL 1,915,928 149,732 71,744 2,137,404 2,028,566 151,362 72,683 2,252,611 2,364,388 165,836 89,316 2,619,540 NCR 85,820 32,110 7,016 124,946 102,183 32,711 7,186 142,080 124,983 38,593 9,818 173,395
StatePessimistic Scenario Realistic Scenario Optimistic Scenario
Note: The above table excludes the SWH projections for Industrial and other sectors.

SWH Market Assessment
Greentech Knowledge Solutions A.55
Table A8: SWH projections for Districts for 2017 (Cumulative installations in m2 of collector area)
2017District Residential Hotel Hospital Total Residential Hotel Hospital Total Residential Hotel Hospital TotalAgra Uttar Pradesh 18,223 6,078 1,141 25,443 28,842 6,336 1,211 36,389 37,144 8,820 2,313 48,277 Ahmadabad Gujarat 75,920 5,988 5,897 87,805 109,090 6,180 6,157 121,427 139,112 7,608 10,526 157,246 Bangalore Karnataka 1,307,174 28,310 31,326 1,366,810 1,307,174 28,310 31,326 1,366,810 1,554,451 28,310 31,776 1,614,537 Chennai Tamilnadu 85,231 18,366 6,782 110,379 122,867 18,996 7,080 148,944 156,794 23,376 12,106 192,276 Coimbatore Tamilnadu 85,231 12,244 4,521 101,996 122,867 12,664 4,720 140,251 156,794 15,584 8,071 180,448 Darjiling West Bengal 22,396 2,860 2,621 27,876 36,007 2,984 2,780 41,771 46,475 4,152 5,310 55,937 East Khasi hills (Shillong) Meghalaya 891 308 504 1,702 1,941 336 544 2,821 2,557 532 1,052 4,141 Ernakulam (Kochi) Kerala 30,385 13,255 3,401 47,041 43,036 13,725 3,550 60,312 54,703 16,885 6,070 77,658 Gurgaon Haryana 40,352 5,010 1,835 47,198 57,608 5,190 1,917 64,715 73,355 6,390 3,277 83,022 Hardwar Uttarakhand 5,897 872 528 7,297 8,359 904 551 9,815 10,628 1,112 943 12,682 Hyderabad Andhra Pradesh 155,425 19,210 8,224 182,859 220,256 19,870 8,585 248,712 279,998 24,450 14,678 319,126 Indore Madhya Pradesh 28,651 2,838 2,101 33,590 45,902 2,958 2,228 51,088 59,217 4,116 4,257 67,590 Jaipur Rajasthan 68,001 14,248 6,145 88,393 96,255 14,760 6,415 117,430 122,331 18,160 10,968 151,459 Kamrup (Guwahati) Assam 5,535 880 413 6,828 11,759 920 445 13,124 15,476 1,470 861 17,807 Khordha (Bhubaneswar) Orissa 12,114 1,164 1,535 14,813 18,737 1,218 1,628 21,583 24,051 1,698 3,110 28,858 Kolkata West Bengal 74,653 7,150 8,735 90,538 120,023 7,460 9,266 136,749 154,916 10,380 17,699 182,995 LehLadakh Jammu & Kashmir 2,644 456 277 3,377 4,227 474 294 4,995 5,451 660 562 6,674 Ludhiana Punjab 36,963 4,837 1,849 43,649 52,984 5,005 1,930 59,919 67,529 6,160 3,300 76,989 Nagpur Maharashtra 149,490 15,902 3,624 169,017 174,642 15,990 3,648 194,280 218,243 16,058 4,965 239,266 Patna Bihar 26,466 760 533 27,760 39,650 790 566 41,006 50,650 1,100 1,080 52,830 Pondicherry Pondicherry 6,930 1,620 1,231 9,781 10,084 1,665 1,286 13,035 12,894 2,040 2,198 17,132 Pune Maharashtra 448,471 31,804 7,249 487,524 523,926 31,980 7,296 563,202 654,730 32,116 9,929 696,776 Raipur Chhattisgarh 11,147 312 783 12,242 17,599 320 830 18,750 22,657 448 1,586 24,691 Ranchi Jharkhand 14,266 488 198 14,952 22,647 520 210 23,378 29,179 720 402 30,301 Sambalpur Orissa 6,057 582 768 7,407 9,369 609 814 10,792 12,025 849 1,555 14,429 Shimla Himachal Pradesh 5,852 2,800 1,942 10,594 7,942 2,900 2,028 12,870 9,996 3,570 3,467 17,033 Delhi Delhi 76,508 47,080 7,452 131,040 126,868 49,200 7,904 183,972 164,452 68,460 15,100 248,012 Thane Maharashtra 224,236 12,722 2,900 239,857 261,963 12,792 2,918 277,673 327,365 12,846 3,972 344,183 West Tripura (Agartala) Tripura 1,122 216 373 1,711 2,431 252 402 3,085 3,202 384 779 4,364 TOTAL 3,026,230 258,360 114,889 3,399,479 3,605,056 265,308 118,532 3,988,897 4,466,374 318,454 181,909 4,966,738 NCR 155,689 57,400 11,748 224,837 242,632 59,904 12,409 314,945 312,249 81,977 23,043 417,269
StatePessimistic Scenario Realistic Scenario Optimistic Scenario
Note: The above table excludes the SWH projections for Industrial and other sectors.

SWH Market Assessment
Greentech Knowledge Solutions A.56
Table A9: SWH projections for Districts for 2022 (Cumulative installations in m2 of collector area)
2022District Residential Hotel Hospital Total Residential Hotel Hospital Total Residential Hotel Hospital TotalAgra Uttar Pradesh 32,444 9,696 1,784 43,924 78,840 10,500 1,976 91,315 103,807 17,778 6,363 127,948 Ahmadabad Gujarat 133,845 9,402 9,059 152,306 270,607 10,026 9,781 290,414 354,468 13,830 24,131 392,429 Bangalore Karnataka 1,859,045 36,600 45,751 1,941,396 1,859,045 36,600 45,751 1,941,396 2,290,279 36,600 46,831 2,373,710 Chennai Tamilnadu 150,735 28,860 10,419 190,014 305,913 30,792 11,249 347,954 400,855 42,480 27,755 471,091 Coimbatore Tamilnadu 150,735 19,240 6,946 176,921 305,913 20,528 7,499 333,941 400,855 28,320 18,503 447,679 Darjiling West Bengal 40,346 4,564 4,095 49,005 99,816 4,948 4,536 109,300 131,554 8,376 14,608 154,538 East Khasi hills (Shillong) Meghalaya 1,684 504 803 2,990 7,041 574 911 8,526 9,357 1,260 3,593 14,210 Ernakulam (Kochi) Kerala 52,823 20,840 5,224 78,887 104,985 22,245 5,640 132,869 137,300 30,690 13,915 181,905 Gurgaon Haryana 70,693 7,880 2,820 81,393 141,839 8,420 3,045 153,304 185,664 11,620 7,511 204,795 Hardwar Uttarakhand 10,260 1,372 811 12,444 20,413 1,460 876 22,749 26,698 2,016 2,162 30,876 Hyderabad Andhra Pradesh 270,338 30,190 12,633 313,161 537,646 32,200 13,638 583,484 703,184 44,430 33,650 781,264 Indore Madhya Pradesh 51,478 4,524 3,283 59,285 126,848 4,908 3,637 135,392 167,145 8,298 11,713 187,156 Jaipur Rajasthan 118,145 22,408 9,439 149,993 234,641 23,912 10,191 268,743 306,845 32,992 25,144 364,981 Kamrup (Guwahati) Assam 10,343 1,450 657 12,449 42,067 1,610 745 44,422 55,888 3,530 2,940 62,358 Khordha (Bhubaneswar) Orissa 21,199 1,860 2,399 25,458 50,138 2,022 2,656 54,816 65,918 3,420 8,556 77,894 Kolkata West Bengal 134,487 11,410 13,651 159,548 332,720 12,370 15,120 360,210 438,512 20,940 48,695 508,147 LehLadakh Jammu & Kashmir 4,743 720 433 5,896 11,660 786 480 12,926 15,362 1,326 1,547 18,235 Ludhiana Punjab 65,011 7,595 2,841 75,447 131,068 8,113 3,066 142,247 171,641 11,186 7,565 190,392 Nagpur Maharashtra 257,350 24,754 5,506 287,609 349,843 25,008 5,570 380,420 451,845 25,174 9,219 486,238 Patna Bihar 45,227 1,210 833 47,270 102,828 1,310 923 105,061 134,887 2,220 2,971 140,078 Pondicherry Pondicherry 12,368 2,535 1,890 16,793 25,368 2,700 2,042 30,110 33,274 3,735 5,036 42,045 Pune Maharashtra 772,049 49,508 11,012 832,569 1,049,528 50,016 11,139 1,110,683 1,355,534 50,348 18,439 1,424,321 Raipur Chhattisgarh 19,809 496 1,223 21,528 47,999 536 1,355 49,890 63,190 904 4,364 68,458 Ranchi Jharkhand 25,456 792 309 26,557 62,078 848 343 63,269 81,753 1,440 1,105 84,298 Sambalpur Orissa 10,600 930 1,199 12,729 25,069 1,011 1,328 27,408 32,959 1,710 4,278 38,947 Shimla Himachal Pradesh 9,760 4,410 2,984 17,154 18,380 4,700 3,221 26,301 23,913 6,490 7,948 38,351 Delhi Delhi 141,092 75,180 11,647 227,919 361,121 81,560 12,900 455,581 476,790 138,080 41,543 656,413 Thane Maharashtra 386,024 19,803 4,405 410,232 524,764 20,006 4,456 549,226 677,767 20,139 7,376 705,282 West Tripura (Agartala) Tripura 2,115 360 593 3,068 8,789 420 674 9,883 11,680 900 2,659 15,239 TOTAL 4,860,205 399,093 174,648 5,433,945 7,236,967 420,129 184,746 7,841,843 9,308,922 570,232 410,121 10,289,275 NCR 280,205 91,457 18,276 389,938 653,682 98,995 20,108 772,785 860,316 163,236 60,813 1,084,365
StatePessimistic Scenario Realistic Scenario Optimistic Scenario
Note: The above table excludes the SWH projections for Industrial and other sectors.
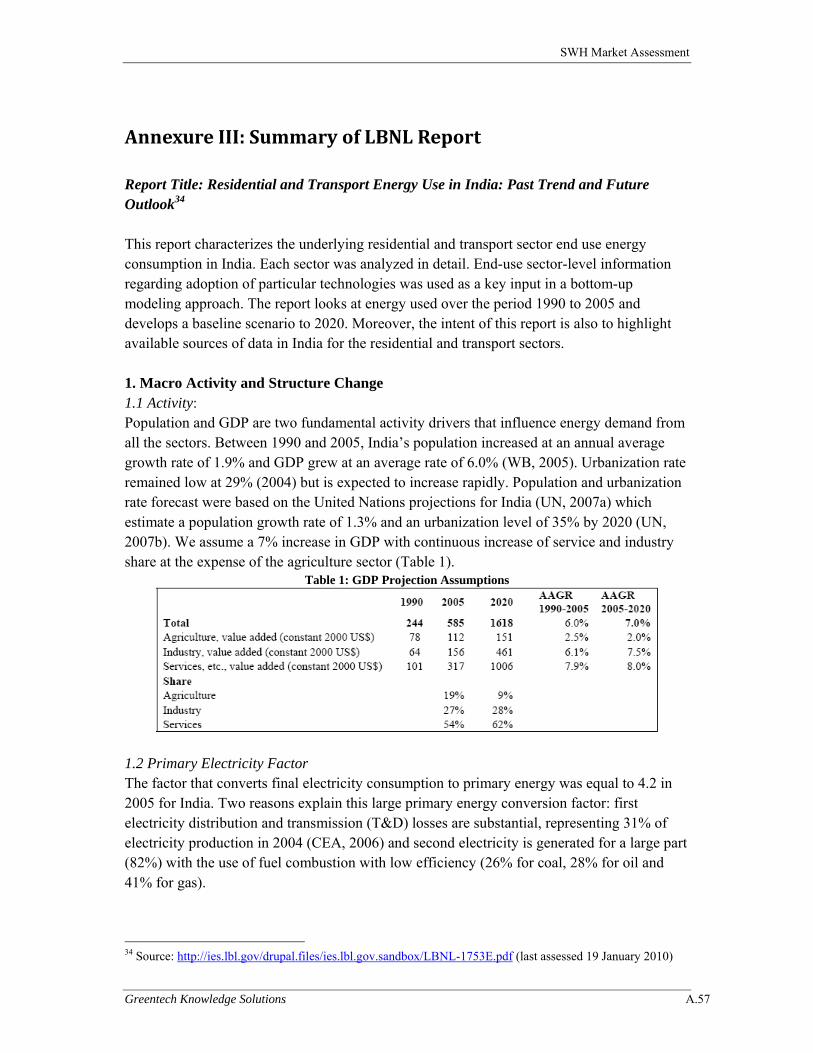
SWH Market Assessment
Greentech Knowledge Solutions A.57
Annexure III: Summary of LBNL Report Report Title: Residential and Transport Energy Use in India: Past Trend and Future Outlook34 This report characterizes the underlying residential and transport sector end use energy consumption in India. Each sector was analyzed in detail. End-use sector-level information regarding adoption of particular technologies was used as a key input in a bottom-up modeling approach. The report looks at energy used over the period 1990 to 2005 and develops a baseline scenario to 2020. Moreover, the intent of this report is also to highlight available sources of data in India for the residential and transport sectors. 1. Macro Activity and Structure Change 1.1 Activity: Population and GDP are two fundamental activity drivers that influence energy demand from all the sectors. Between 1990 and 2005, India’s population increased at an annual average growth rate of 1.9% and GDP grew at an average rate of 6.0% (WB, 2005). Urbanization rate remained low at 29% (2004) but is expected to increase rapidly. Population and urbanization rate forecast were based on the United Nations projections for India (UN, 2007a) which estimate a population growth rate of 1.3% and an urbanization level of 35% by 2020 (UN, 2007b). We assume a 7% increase in GDP with continuous increase of service and industry share at the expense of the agriculture sector (Table 1).
Table 1: GDP Projection Assumptions
1.2 Primary Electricity Factor The factor that converts final electricity consumption to primary energy was equal to 4.2 in 2005 for India. Two reasons explain this large primary energy conversion factor: first electricity distribution and transmission (T&D) losses are substantial, representing 31% of electricity production in 2004 (CEA, 2006) and second electricity is generated for a large part (82%) with the use of fuel combustion with low efficiency (26% for coal, 28% for oil and 41% for gas).
34 Source: http://ies.lbl.gov/drupal.files/ies.lbl.gov.sandbox/LBNL-1753E.pdf (last assessed 19 January 2010)

SWH Market Assessment
Greentech Knowledge Solutions A.58
Primary electricity factor was forecast to decline at an annual rate of 0.9% during the period 2005 to 2020 to account for the new policy in place and also in conjunction with recent trend that showed an annual rate of decline of -2.3% over the period 2000 to 2005 (Table 2).
Table 2: Primary Electricity Factor Forecast
2. The Residential Sector Residential energy consumption represents 39% of final energy consumed and slightly less (37%) in terms of primary energy consumption. However, energy consumption in the residential sector in India is still largely dominated by the use of firewood. A large quantity of incremental electricity demand will come from the residential sector in India. Energy services examined in the residential sector include cooking, water heating, lighting, and appliance usage. Urban and rural homes are distinguished due to their difference in energy requirement. The number of urban and rural households is used as drivers for residential energy consumption. Figure 1 shows the result of the National Sample Survey Organization’s survey on Consumption of Some Important Commodities in India (NSSO, 2001a) conducted in 2000. It shows the average quantity of fuel consumed per capita by monthly per capita expenditure (MPCE) in rural and urban areas. In rural areas, firewood remains the predominant fuel used irrespective of expenditure. The two figures shown at the bottom exclude biomass in order to better represent trends in other fuel use. All fuel consumption tends to increase with income. However, the quantity of kerosene consumed remains fairly constant across income categories in urban areas and regardless of its price. The demand for LPG and electricity are income elastic and increase considerably with higher expenditure level. These observations are even more pronounced in urban areas, where consumption of firewood phases out almost completely, while LPG consumption increases progressively and electricity use escalates with households that have the highest level of expenditure.

SWH Market Assessment
Greentech Knowledge Solutions A.59
2.1 Methodology Residential energy provides numerous services associated with household living, including space cooling, water heating, cooking, refrigeration, lighting, and the powering of a wide variety of other appliances. The end uses were further broken out by technologies. Each end use was assigned appropriate devices and fuel types, with diffusion rates and energy efficiencies based on survey data and literature research. Changes in energy demand in the model are in part a function of driver variables, e.g., GDP, population, household size and urbanization rate, which were determined exogenously and included in the model and in part a function of energy intensities. Annual average appliance Unit Energy Consumption (UEC) are calculated based on a stock turnover modeling, which includes information on initial stocks by vintage, energy efficiencies by vintage (allowing explicit modeling of the impacts of standards), efficiency degradation profiles, and lifetime or survival profiles. 2.2 End Use Analysis Residential energy is typically used for cooking, water heating, space conditioning, lighting and appliances. Cooking and lighting are the most essential activities requiring energy, while the importance of other functions varies.

SWH Market Assessment
Greentech Knowledge Solutions A.60
Figure 2 shows the decomposition of energy consumption in the residential sector by end uses. The predominant energy requirement serves the basic need of cooking and water heating. In rural areas, cooking and water heating represent up to 90% of household energy needs. The vast majority of energy use relies on traditional wood fuel. Lighting and services from basic appliances such as TVs, fans and refrigerators constitute the major remaining energy use. The substantial difference of final energy use between urban and rural areas arises from the fact that rural households use much more inefficient fuels, such as fuelwood for cooking and kerosene for lighting. Hence, their requirement to provide equivalent energy services than urban households is much higher. Cooking and Water heating Data from NSSO (2001a) as shown in Figure 1 were used to estimate the energy use for cooking and water heating. The quantities reported in the NSSO survey for LPG and wood were entirely assigned to cooking and water heating energy use. Electricity use for cooking is very small and was entirely allocated to the appliance energy use. Kerosene was the most challenging fuel to disaggregate as it is used both for cooking and lighting. A survey from NCAER (2005) shows that in rural areas, 34% of kerosene consumption is used for cooking and water heating while the remaining quantity is used for lighting. In urban areas, the share of kerosene used for cooking and water heating is much larger, representing 61.2% and 3.9% respectively, while 34% is used for lighting. Average useful energy was calculated to assess how much energy households require according to their living area (urban/rural) and income level. Useful energy consumption was derived by multiplying each quantity of fuel with its efficiency rate (Table 3).
Table 3: Efficiency of Fuel Use Wood LPG Kerosene (Heat) 13% 60% 40%

SWH Market Assessment
Greentech Knowledge Solutions A.61
The data show that useful energy consumption is correlated with income as well as with fuel choice. For instance, households using wood, use it more when their income rises but less than households with similar income that use commercial fuels. The main reason is that commercial fuels are more convenient to use and therefore people tend to use them more. Cooking and water heating useful energy for urban households is about 4,500 MJ/year whereas rural households use only 3,000 MJ/year. However, due to the preponderance of wood in rural areas, the final energy consumed by a household living in rural areas represents more than twice the energy consumed by an urban household (22,500 MJ vs 13,000 MJ). Appliances Most of the electricity consumed in the residential sector is used to power appliances. The diffusion of appliances ownership is particularly elastic to income. With increasing electricity access and raising income level, the number of households owning appliances is increasing very rapidly in India. NSSO surveys (1997, 2001a, 2005b) provide appliance saturation by MPCE for rural and urban areas. Appliances such as water heaters, washing machines and air conditioners, which can be considered as more luxurious goods, are owned only by households with the highest level of income. According to MNRE (2008), a total of about 2.15 million square meters of collector area has been installed. 2.3 Drivers of Energy Use in the Residential Sector Energy consumption in the residential sector is closely linked to the urbanization rate. Urban households tend to have higher levels of energy needs and hence, the migration of rural population towards urban centers increases the level of energy use. In addition, other factors, such as the diminution in household size and increase in housing floorspace represent major drivers of energy demand (Schipper, 1997, 2001). Table 4 shows some activity variables for the residential sector and their trends over the period 1990 to 2005.
Table 4: Residential Activity Variables
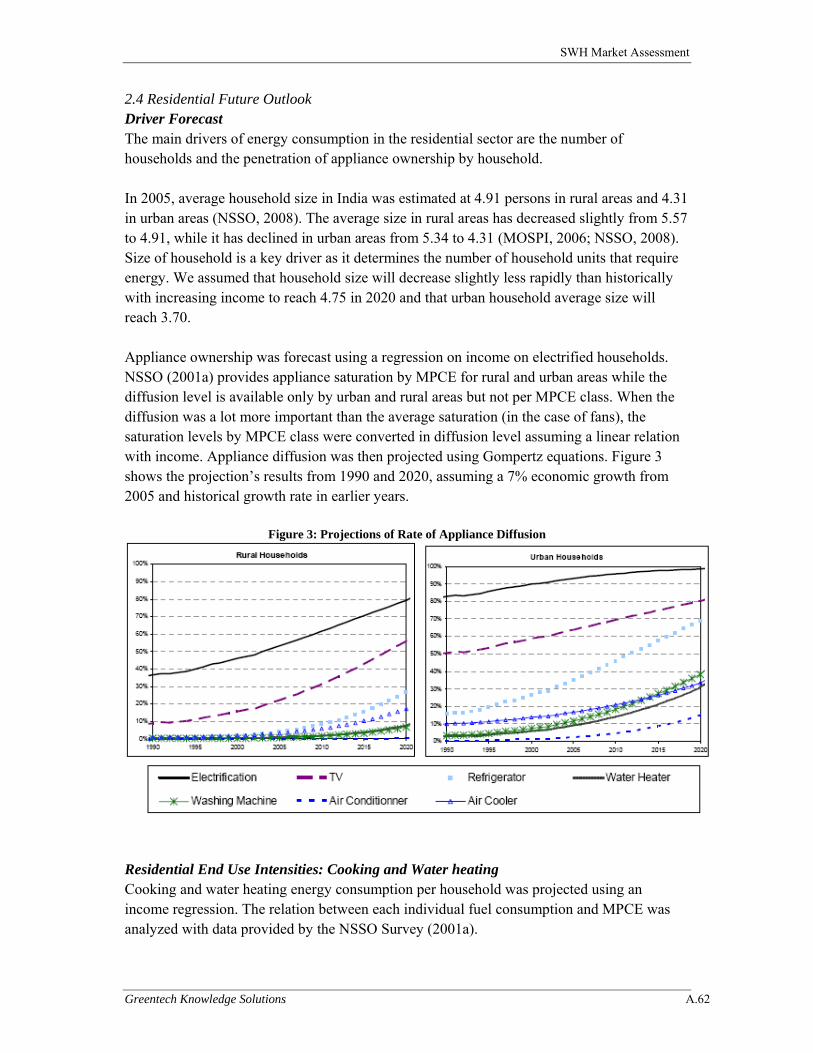
SWH Market Assessment
Greentech Knowledge Solutions A.62
2.4 Residential Future Outlook Driver Forecast The main drivers of energy consumption in the residential sector are the number of households and the penetration of appliance ownership by household. In 2005, average household size in India was estimated at 4.91 persons in rural areas and 4.31 in urban areas (NSSO, 2008). The average size in rural areas has decreased slightly from 5.57 to 4.91, while it has declined in urban areas from 5.34 to 4.31 (MOSPI, 2006; NSSO, 2008). Size of household is a key driver as it determines the number of household units that require energy. We assumed that household size will decrease slightly less rapidly than historically with increasing income to reach 4.75 in 2020 and that urban household average size will reach 3.70. Appliance ownership was forecast using a regression on income on electrified households. NSSO (2001a) provides appliance saturation by MPCE for rural and urban areas while the diffusion level is available only by urban and rural areas but not per MPCE class. When the diffusion was a lot more important than the average saturation (in the case of fans), the saturation levels by MPCE class were converted in diffusion level assuming a linear relation with income. Appliance diffusion was then projected using Gompertz equations. Figure 3 shows the projection’s results from 1990 and 2020, assuming a 7% economic growth from 2005 and historical growth rate in earlier years.
Figure 3: Projections of Rate of Appliance Diffusion
Residential End Use Intensities: Cooking and Water heating Cooking and water heating energy consumption per household was projected using an income regression. The relation between each individual fuel consumption and MPCE was analyzed with data provided by the NSSO Survey (2001a).

SWH Market Assessment
Greentech Knowledge Solutions A.63
Figure 4: Average Energy Consumption per Capita per Month
Figure 7 shows projections of final energy consumption for cooking and water heating per capita per month living in urban and rural areas. With increasing level of income, households augment their demand for energy. In urban and rural areas, this additional demand will be mostly met with LPG. Residential End Use Intensities: Appliances Appliance Unit Energy Consumption (UEC) is assumed to stay constant over time with three exceptions: refrigerators, air conditioners and water heaters. Water heater UEC is expected to decrease slightly (598 kWh for year 2020) during the forecast period due to the projected decrease of the number of persons per household. Baseline Energy Projection in the Residential Sector According to the projections, the average household will consume five times more electricity in 2020 than in 2000. Urban household consumption rises from 908 kWh in 2000 to 2972 kWh in 2020, while rural rises from 224 to 1311 kWh. Per household rural consumption grows twice as fast as urban. Figure 5 gives the urban and rural energy consumption projections for 2020.
Figure 5: 2020 Rural and Urban Energy Consumption Projections

SWH Market Assessment
Greentech Knowledge Solutions A.64
SUMMARY OF KEY PROJECTIONS AND DERIVED INPUTS FOR PRESENT STUDY
1990 1995 2000 2005 2010 2015 2020 AAGR 90-
05 AAGR 05-
20
Population Total 860,195,000 954,282,000 1,046,235,000 1,134,403,000 1,220,182,000 1,302,535,000 1,379,198,000 1.90% 1.30%
Urbanization rate 25.50% 26.60% 27.70% 28.70% 30.10% 31.90% 34.30% 0.80% 1.20%
Rural Population 640,845,275 700,442,988 756,427,905 808,829,339 852,907,218 887,026,335 906,133,086 1.70% 0.80%
Urban population 219,349,725 253,839,012 289,807,095 325,573,661 367,274,782 415,508,665 473,064,914 2.70% 2.50%
Persons/hh (Rural) 5.57 5.38 5.19 4.91 4.8 4.77 4.75 -0.80% -0.20%
Persons/hh (urban) 5.3 4.94 4.6 4.31 4.05 3.85 3.7 -1.40% -1.00%
Households (rural) 115,053,012 130,193,864 145,747,188 164,731,026 177,689,004 185,959,399 190,764,860 -1.40% -1.00%
Households (urban) 41,386,741 51,384,415 63,001,542 75,539,132 90,685,131 107,924,329 127,855,382 -1.40% -1.00%
Households CAGR (rural)
- - 2.28% 2.48% 1.53% 0.91% 0.51% - -
Households CAGR (urban)
- - 4.16% 3.70% 3.72% 3.54% 3.45% - -
Geyser penetration (rural hh)
0% 0% 1% 1% 2% 4% 8% 10.3% 14.5%
Geyser penetration (urban hh)
3% 4% 6% 9% 14% 21% 31% 7.6% 8.4%
Geyser penetration CAGR for 2010-2020 (rural hh): 14.87%
Geyser penetration CAGR for 2010-2020 (urban hh): 8.27%
Related Documents


