1 Solar microgrids in rural India: Consumers’ willingness to pay for attributes of electricity SNRE Master’s Practicum Sachiko Graber and Tara Narayanan Advisor: Jose Alfaro Client: Mr. Debajit Palit, The Energy and Resources Institute

Welcome message from author
This document is posted to help you gain knowledge. Please leave a comment to let me know what you think about it! Share it to your friends and learn new things together.
Transcript

1
Solar microgrids in rural India:
Consumers’ willingness to pay for attributes of electricity
SNRE Master’s Practicum
Sachiko Graber and Tara Narayanan
Advisor: Jose Alfaro
Client: Mr. Debajit Palit, The Energy and Resources Institute
2
Solar microgrids in rural India: Consumers’ willingness to pay for attributes of electricity
Sachiko Grabera, Tara Narayanana, Jose Alfaroa, Debajit Palitb
aSchool of Natural Resources and Environment, University of Michigan, Ann Arbor, MI 48104, USA
bThe Energy and Resources Institute (TERI), IHC Complex, Lodhi Road, New Delhi 110003, India
Abstract:
This paper explores the future of solar microgrids, as well as potential supporting government
policies and structures, by analyzing rural consumers’ willingness to pay for electricity in the
state of Uttar Pradesh, India. The study examines different attributes of electricity, including
reliability, power, and price, using choice experiments—a method uniquely able to disaggregate
the willingness to pay for each attribute. Household surveys were carried out in 22 villages,
spread across 4 districts in the state and covered a total of 216 households. Results indicate that
consumer preference for electricity is based most significantly on (in order of strength of
preference) power, reliability, and price. Further, despite 9.4 hours of electricity supply per day
from the main grid, as compared to an average of only 7.2 hours from microgrids, the
respondents exposed to both systems were almost twice as satisfied with the microgrid’s
reliability. Based on these findings, the study provides five policy recommendations for
strengthening the rural electricity supply sector and enhancing the electricity access in India.
Key words: microgrid, rural electrification, solar power, reliability, choice experiment, India
Highlights:
• Choice experiments indicate willingness to pay for attributes of electricity

3
• Rural consumer satisfaction is higher for solar microgrid than grid systems
• Policy can better support electricity structures meet consumer needs

4
1. Introduction
Many developing countries facing energy poverty, especially in South Asia and sub-Saharan
Africa, utilize off-grid electrification to meet the rural demand—often in conjunction with
national efforts to bring more consumers onto the centralized grid. When growing off-grid
systems meet centralized grid expansion, households are presented with a market choice; and
thus pricing, reliability, and quantity of supply become attributes used by households to indicate
preferences. Due to a highly irregular centralized electricity system in rural India, consumers
face trade-offs between power, reliability, and affordable pricing and frequently acknowledge the
potential of off-grid options. Whereas aspects such as high price and high reliability are
generally bundled together in urban areas, it is generally not possible to correlate the same
attributes in rural communities.
Policymakers can best support both consumers and electricity providers by understanding the
value of various electricity attributes to different stakeholders, especially household consumers.
This research analyzes rural consumers’ willingness to pay (WTP) for electricity, specifically by
using choice experiments to assess the WTP for each attributes: reliability (power and hours of
supply), power (adequate availability), and price. The objective is to inform energy policy in
India determining grid and microgrid interactions.
The study was conducted in Uttar Pradesh (UP), the most populated state in India and the state
with one of the largest numbers of unelectrified homes (Rural Electrification Corporation of
India, 2016), where recent policy changes in the electricity sector have highlighted the grid and
microgrids as distinct electricity alternatives. Policies, such as the recent Minigrid Policy and
Minigrid Regulation at the state and national level, have attempted to address the interaction
between these two electricity supply options.

5
The paper is structured as follows: the remainder of this section briefly discusses the rural
electrification setting in India. Section 2 provides a brief review of choice experiment literature
in the electricity sector. Section 3 describes the methods adopted for the study and the
frameworks for data collection and analysis. This is followed by an analysis and discussion of
the results in Section 4. The final section isolates the key findings and suggests relevant policy
recommendations for enhancing energy access. The analysis attempts to inform the rural
electricity sector not just in India, but potentially in other countries where grid and microgrids
may also interact.
1.1 Rural electrification in India
Rural electrification is a considerable problem facing India today. Challenges to the
electrification of remote rural areas include limits to grid expansion efforts, financial restrictions,
and inefficient distribution systems. State distribution companies, which already operate at a loss
in most of India, prioritize rural households less than urban ones. Rural areas have lower demand
and limited ability to pay for electricity, as opposed to their urban counterparts, accounting for
this discrepancy.
Despite current and past government mechanisms to encourage rural electrification, challenges
remain. India reports a village level electrification rate near 98% (Perwez, 2016); however, this
statistic is misleading. Village and household electrification rates are separately accounted for;
therefore, even a village with access to the distribution network in which very few homes are
connected, is counted as ‘electrified’ for state purposes1. More than 50 million households (about
1 As per the definition of village electrification in India, a village is deemed to be electrified if: (1) basic infrastructure such as distribution transformers and distribution lines are provided within the inhabited locality; (2)
6
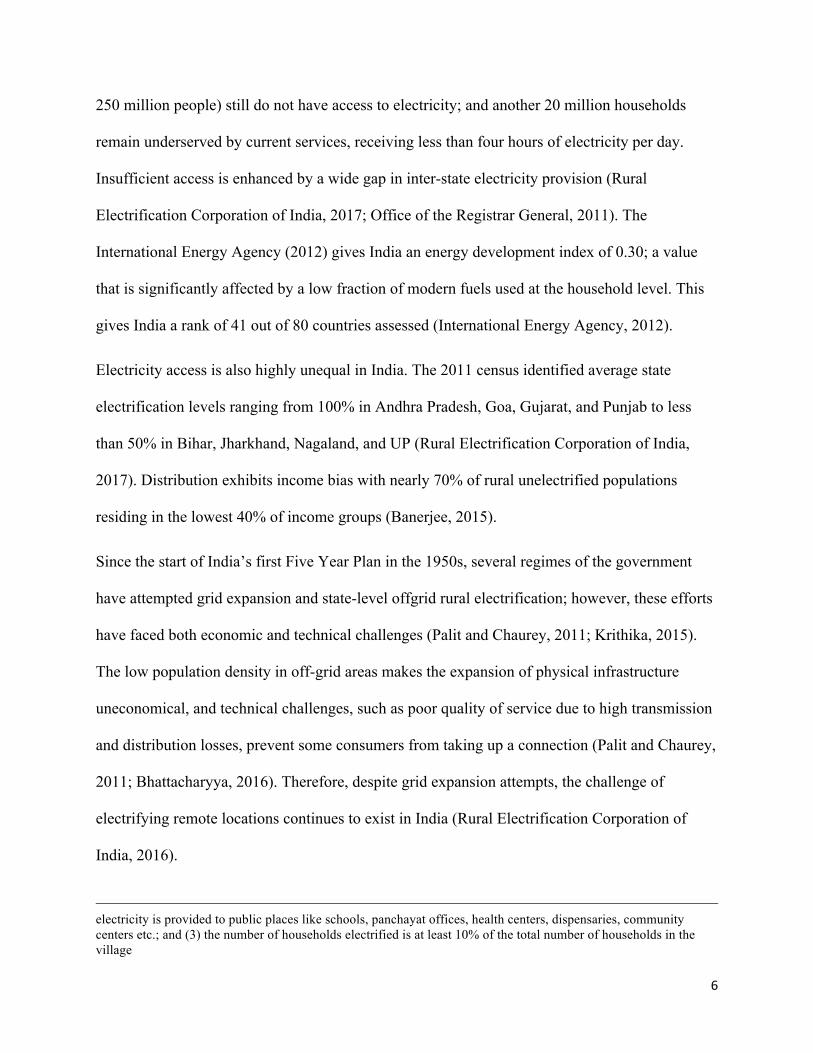
250 million people) still do not have access to electricity; and another 20 million households
remain underserved by current services, receiving less than four hours of electricity per day.
Insufficient access is enhanced by a wide gap in inter-state electricity provision (Rural
Electrification Corporation of India, 2017; Office of the Registrar General, 2011). The
International Energy Agency (2012) gives India an energy development index of 0.30; a value
that is significantly affected by a low fraction of modern fuels used at the household level. This
gives India a rank of 41 out of 80 countries assessed (International Energy Agency, 2012).
Electricity access is also highly unequal in India. The 2011 census identified average state
electrification levels ranging from 100% in Andhra Pradesh, Goa, Gujarat, and Punjab to less
than 50% in Bihar, Jharkhand, Nagaland, and UP (Rural Electrification Corporation of India,
2017). Distribution exhibits income bias with nearly 70% of rural unelectrified populations
residing in the lowest 40% of income groups (Banerjee, 2015).
Since the start of India’s first Five Year Plan in the 1950s, several regimes of the government
have attempted grid expansion and state-level offgrid rural electrification; however, these efforts
have faced both economic and technical challenges (Palit and Chaurey, 2011; Krithika, 2015).
The low population density in off-grid areas makes the expansion of physical infrastructure
uneconomical, and technical challenges, such as poor quality of service due to high transmission
and distribution losses, prevent some consumers from taking up a connection (Palit and Chaurey,
2011; Bhattacharyya, 2016). Therefore, despite grid expansion attempts, the challenge of
electrifying remote locations continues to exist in India (Rural Electrification Corporation of
India, 2016).
electricity is provided to public places like schools, panchayat offices, health centers, dispensaries, community centers etc.; and (3) the number of households electrified is at least 10% of the total number of households in the village

7
Electricity distribution companies also face financial difficulties. They are rarely able to recover
the cost of supply through nationally regulated tariffs, and the gap between average cost of
supply and average revenue widened from INR 0.76 per kWh in 1998-99 to 1.45 in 2009-10
(Maithani and Gupta, 2015). The cost of supply has increased because of rising trends in
generation, operation and maintenance, and interest expenses, whereas the tariff has not
increased commensurately. Political cycles aggravate financial difficulties in many cases, and
tariff rationalization has become a major challenge for electricity regulators (Min, 2014).
Consequently, most of the utilities have become financially unviable2. Min, et al. observe that
line losses vary according to the election cycle, correlating positively with incumbent re-
elections and indicating that payments are less strictly enforced during re-election periods (2014).
This finding corroborates stakeholder complaints of insufficient payments to sustain the grid.
Despite challenges to the electricity sector, the Indian Prime Minister announced in August 2015
the intention to “electrify every village within the next 1000 days” and provide each household
with an electricity connection by 2019 (Prime Minister’s Office, 2015). Studies indicate that the
population without electricity access in India consists of mainly three groups of consumers: those
residing in remote, inaccessible villages where extending the central grid may be technically or
economically infeasible; those residing in unconnected hamlets of grid connected villages; and
non-electrified households in villages where the grid has reached (Palit, 2015). Most
unelectrified households and habitations are located in the states of Assam, Bihar, Jharkhand,
Odisha and UP (Perwez, 2016; Rural Electrification Corporation of India, 2016). In the case of
UP specifically, rural household electricity connection was reported at 28% in May 2016, as
2 The aggregate book losses (on accrual basis) of all the utilities increased to INR 625,810 million in 2011–12. Further, the aggregate book loss for all the utilities was 23.31% in 2011–12. The aggregate loss on a subsidy-received basis was 24.96% in 2011–12 (PFC, 2013). The utilities collectively owe INR 4300 billion to the financial institutions.

8
compared to 36.8% of all households and 23.8% of rural households in the state that were
electrified when reported by the 2011 Census of India (Rural Electrification Corporation of India,
2016). These statistics indicate an increase in rural household electrification rates of only 4.2%
over five years.
The challenges faced by the grid electrification sector in India raise questions of whether the grid
can connect to all households and whether such an option will provide a reliable and sustainable
supply of electricity to rural areas. A lack of confidence in this likelihood has led to the
emergence of renewable energy-based distributed generation or microgrid3 solutions as an
alternative in India. States in the eastern region of the country have led efforts for off-grid
electrification, and numerous service providers run microgrids based on renewable energy, such
as solar, biomass, and small hydropower (GNSED, 2014).
Microgrids have been accepted as a viable alternative to the grid for connecting unelectrified
populations and providing supply on a sustainable basis (GNSED, 2014; Bushan, 2016;
Urpelainen, 2015; Cust, 2007). Several international development organizations, such as the
World Bank, now promote microgrids as an integral off-grid development tool (Banerjee, 2015).
1.2 Micro-grids in India
The interest of international agencies in renewables integration has increased the focus on
microgrids, and the potential of stand-alone renewable off-grid systems in developing countries
3 Microgrids are small, self-contained electricity grids with a dedicated generator and load. In this study, the term ‘microgrid’ is used to refer to all systems with generating capacity less than 1MW, although these systems can be broken into subcategories such as microgrid, minigrid, picogrid, and nanogrid. The state and national policies in India use the term ‘minigrid’.
9
to create economic, development, and environmental advantages has been discussed extensively
in previous literature (Martinot, 2002; Reiche, 2000; GNESD, 2014).
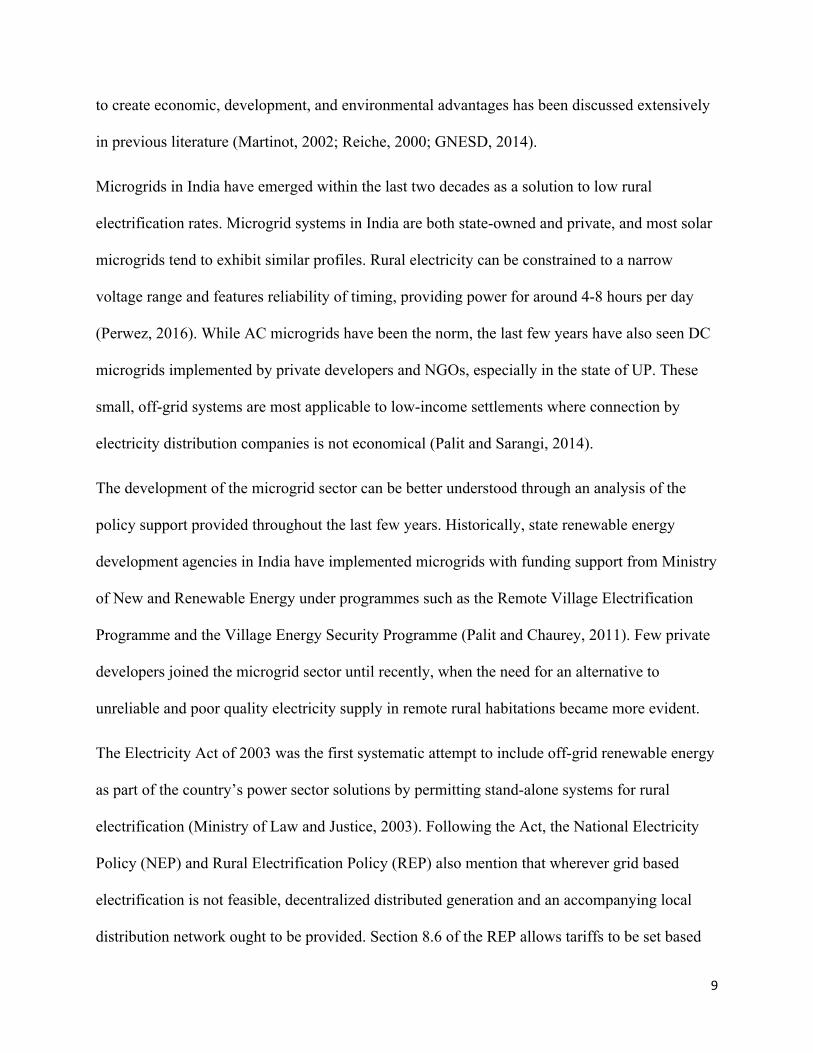
Microgrids in India have emerged within the last two decades as a solution to low rural
electrification rates. Microgrid systems in India are both state-owned and private, and most solar
microgrids tend to exhibit similar profiles. Rural electricity can be constrained to a narrow
voltage range and features reliability of timing, providing power for around 4-8 hours per day
(Perwez, 2016). While AC microgrids have been the norm, the last few years have also seen DC
microgrids implemented by private developers and NGOs, especially in the state of UP. These
small, off-grid systems are most applicable to low-income settlements where connection by
electricity distribution companies is not economical (Palit and Sarangi, 2014).
The development of the microgrid sector can be better understood through an analysis of the
policy support provided throughout the last few years. Historically, state renewable energy
development agencies in India have implemented microgrids with funding support from Ministry
of New and Renewable Energy under programmes such as the Remote Village Electrification
Programme and the Village Energy Security Programme (Palit and Chaurey, 2011). Few private
developers joined the microgrid sector until recently, when the need for an alternative to
unreliable and poor quality electricity supply in remote rural habitations became more evident.
The Electricity Act of 2003 was the first systematic attempt to include off-grid renewable energy
as part of the country’s power sector solutions by permitting stand-alone systems for rural
electrification (Ministry of Law and Justice, 2003). Following the Act, the National Electricity
Policy (NEP) and Rural Electrification Policy (REP) also mention that wherever grid based
electrification is not feasible, decentralized distributed generation and an accompanying local
distribution network ought to be provided. Section 8.6 of the REP allows tariffs to be set based
10
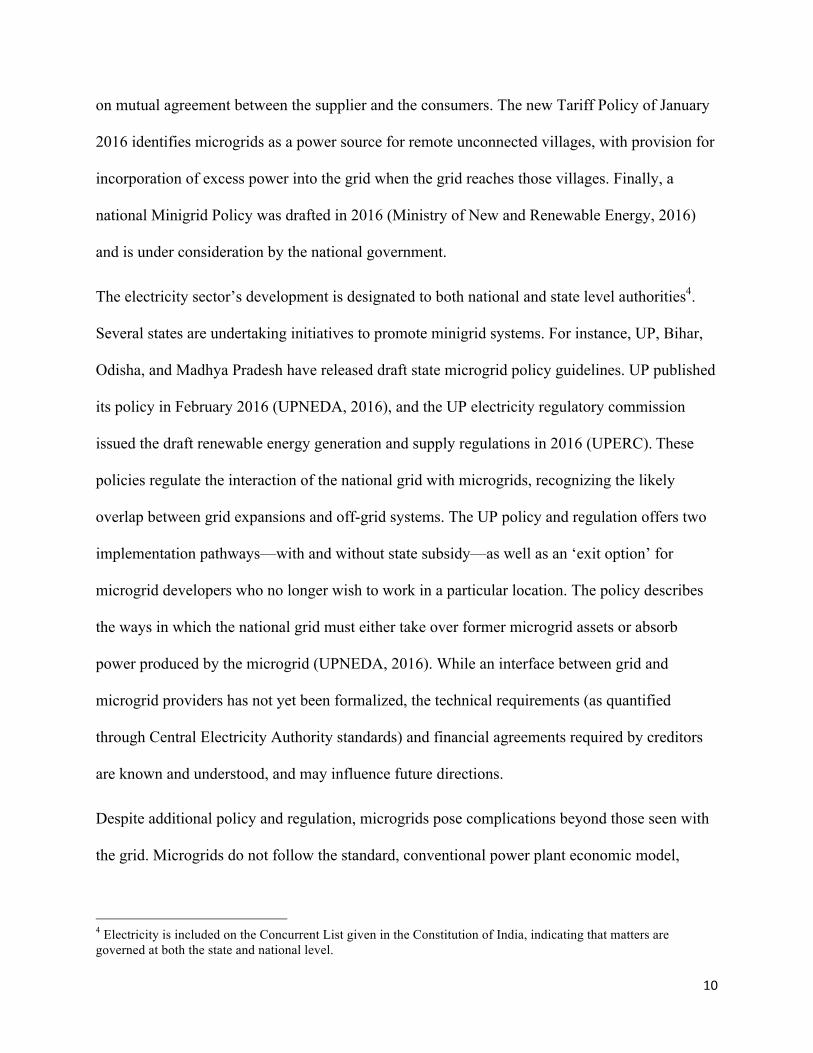
on mutual agreement between the supplier and the consumers. The new Tariff Policy of January
2016 identifies microgrids as a power source for remote unconnected villages, with provision for
incorporation of excess power into the grid when the grid reaches those villages. Finally, a
national Minigrid Policy was drafted in 2016 (Ministry of New and Renewable Energy, 2016)
and is under consideration by the national government.
The electricity sector’s development is designated to both national and state level authorities4.
Several states are undertaking initiatives to promote minigrid systems. For instance, UP, Bihar,
Odisha, and Madhya Pradesh have released draft state microgrid policy guidelines. UP published
its policy in February 2016 (UPNEDA, 2016), and the UP electricity regulatory commission
issued the draft renewable energy generation and supply regulations in 2016 (UPERC).These
policies regulate the interaction of the national grid with microgrids, recognizing the likely
overlap between grid expansions and off-grid systems. The UP policy and regulation offers two
implementation pathways—with and without state subsidy—as well as an ‘exit option’ for
microgrid developers who no longer wish to work in a particular location. The policy describes
the ways in which the national grid must either take over former microgrid assets or absorb
power produced by the microgrid (UPNEDA, 2016). While an interface between grid and
microgrid providers has not yet been formalized, the technical requirements (as quantified
through Central Electricity Authority standards) and financial agreements required by creditors
are known and understood, and may influence future directions.
Despite additional policy and regulation, microgrids pose complications beyond those seen with
the grid. Microgrids do not follow the standard, conventional power plant economic model,
4 Electricity is included on the Concurrent List given in the Constitution of India, indicating that matters are governed at both the state and national level.

11
because the risks associated with such isolated systems are high5. Due to various uncertainties
and policy ambiguities (Palit and Bandyopadhyay, 2015), investors are difficult to attract. Thus,
most implemented microgrids have received aid from external agencies, which provide necessary
funding and ‘de-risk’ investments by providing, for example, loan guarantees. The high need for
external funding, along with the perception that consumers may be unwilling or unable to pay
even a “mutually agreed upon price” (as prescribed by the REP), creates concerns about whether
microgrids will become self-sufficient in the long term.
On the positive side, the growth of both grid and microgrid options in India has led to an
unanticipated competition and an opportunity for consumers to make choices based on attribute
trade-offs. The national grid provides large quantities of power at low prices (per kWh), but is
plagued by irregularities in supply, technical losses, and general unreliability (Bhushan, 2016).
On the other hand, the microgrid appears to offer a reliable source of electricity, but operates for
fixed number of hours each day, and allows only low-wattage appliances to run at prices that are
high (per kWh) relative to the regulated grid electricity prices. A mismatch between supply
opportunities and consumer demand currently constrains the success of the energy sector.
At the same time, rural consumer demand is an important parameter. While consumers value
both electricity reliability and power, limited options and financial constraints force them to
choose among these attributes. An improved understanding of the trade-offs between more
reliable versus more powerful electricity can predict consumer behavior in the future, when the
Indian grid further expands and consumers are exposed to more choices in the electricity market.
Rural consumers may perceive higher utility of certain attributes as compared to their urban
counterparts, due to the relative absence of these attributes in their electricity supply as well as
5 Stakeholder interviews with microgrid developers allowed the development of such conclusions

12
different lifestyle and priorities. Low electricity reliability might lead consumers to value
reliability more (as they are not able to take it for granted), increasing their willingness to trade
other attributes (including lower price) for improved reliability. Therefore, an effort to
understand how various types of consumers exposed to microgrids value electricity and its
attributes is essential to expanding the discourse on grid and microgrid interaction to new policy
determinations.
2. Choice Experiments and Electricity studies
A vast body of literature exists on consumer WTP for electricity. Studies primarily focus on
consumer valuation of electricity as a service; and a small number have also utilized choice
experiments to assess the contribution of specific electricity attributes to overall WTP. While
such studies have mainly focused on electricity attributes relevant to developed countries, they
can provide insight to other cases.
Consumer WTP has generally been evaluated by the amount of electricity consumption at market
value, but market value does not match the inconsistent delivered electricity costs in India, which
range from INR 1.70 to 231.14/kWh, depending on terrain and distance from an urban center
(Indian Power Market, 2015; Nouni, 2008). These discrepancies stem from a shortage of
investment on the supply side, which leads to poor capacity and irregular performance; however,
poor service quality creates inadequate tariffs and low market prices for electricity on the
demand side, preventing suppliers from acquiring the resources to invest in improved
infrastructure (Bose, 2001). Additionally, WTP may depend on more than the quantity of
electricity consumed. It has been approached through analysis of household appliance use (Lee,

13
2016), which could determine differences between electricity usage and valuation in different
locations.
Consumer preferences and WTP for various attributes of electricity have been analyzed using
discrete choice studies in a variety of experiments. These generally have been conducted to yield
information regarding differential WTP as relevant attributes of electricity are changed. In
developed countries, studies focus mostly on WTP for ‘green’ or more environmentally-friendly
(and more expensive) electricity options. For instance, Hensher et al. (2014) cite as commonly
studied the attributes of service interruptions, voltage consistency, customer service
responsiveness, payment issues, time to connect to new consumers, and backup generation
during emergencies.
Goett, in one of the first studies using choice experiments to assess electricity preferences, uses
choice experiments to determine WTP for 40 attributes associated with electricity provision.
These attributes focused on pricing and contract terms such as green energy attributes, consumer
services, value-added services, and community presence. The authors identified consumer
preferences for the following attributes (Goett, 2000):
• Consumers prefer not to have a contract with their provider and will pay an additional 1
cent per kWh to avoid being locked into a contract;
• Fixed price rates are preferred. Hourly rates would need to be 3.91 cents per kWh less
than a fixed rate to compete;
• Renewables sourcing exhibits diminishing returns: consumers WTP is 1.46 cents per
kWh for a change from 0 to 25% hydropower, but only 0.18 cents for a change from 25
to 50%;

14
• Consumers will pay up to 2.77 cents per kWh to decrease the number of 30-s outages per
year from 4 to 2.
Longo et al. use a survey to determine preferred electricity sources by providing choices between
renewable electricity profiles with corresponding prices. From this choice experiment, they
estimate WTP for green electricity for residents of Bath, England. The WTP per ton CO2
emissions avoided is calculated to be $967 per year per country; however, this is an order of
magnitude greater than the results from several other studies conducted (Longo, 2008).
In Australia, the WTP for supply quality in residential electricity was analyzed using a choice
experiment. Hensher et al. determine average WTP for improved reliability of electricity. They
identify as indicators of this frequency of power outages, length of power outages, consistency of
electric voltage, warning before a power outage, and consumer services. The highest average
WTP identified was $43 to avoid a one-time, two-hour power outage (Hensher, 2014).
Similarly, Layton and Moeltner use choice experiments to assess WTP to avoid electricity
shortages in the US. They surveyed households, offering an option to pay a set price to avoid an
outage with specified duration and timing. The data were analyzed by grouping the number of
households who agreed to a certain bid range. The authors conclude that several household
identifiers affect WTP in this situation, including past outage experiences and the presence of an
existing generator. The authors find that households are willing to pay $13 (1998 dollars) to
avoid a one-hour outage, or $5.34/kWh unserved (Layton, 2005).
The increased value of reliable electricity carries over into studies done in developing countries.
Rural Kenyan households, offered a choice experiment on power alternatives, also indicated a
WTP of about KSh.50 to avoid electricity outages (Abdullah, 2010).
15
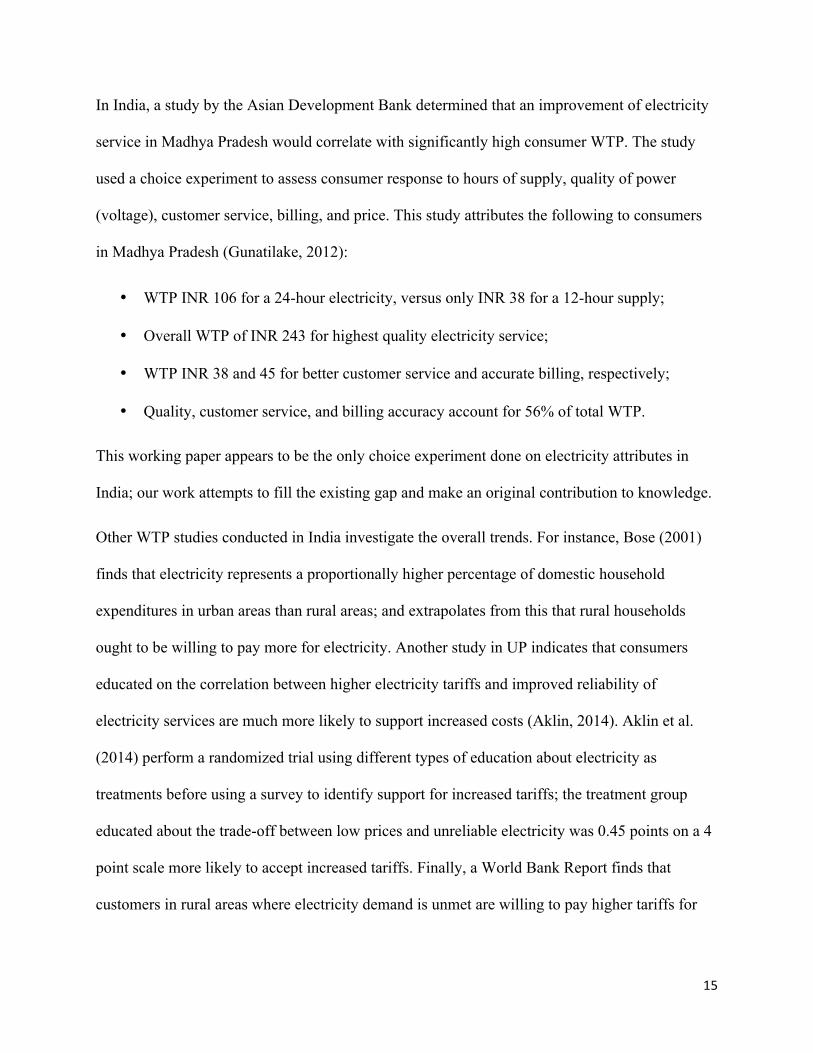
In India, a study by the Asian Development Bank determined that an improvement of electricity
service in Madhya Pradesh would correlate with significantly high consumer WTP. The study
used a choice experiment to assess consumer response to hours of supply, quality of power
(voltage), customer service, billing, and price. This study attributes the following to consumers
in Madhya Pradesh (Gunatilake, 2012):
• WTP INR 106 for a 24-hour electricity, versus only INR 38 for a 12-hour supply;
• Overall WTP of INR 243 for highest quality electricity service;
• WTP INR 38 and 45 for better customer service and accurate billing, respectively;
• Quality, customer service, and billing accuracy account for 56% of total WTP.
This working paper appears to be the only choice experiment done on electricity attributes in
India; our work attempts to fill the existing gap and make an original contribution to knowledge.
Other WTP studies conducted in India investigate the overall trends. For instance, Bose (2001)
finds that electricity represents a proportionally higher percentage of domestic household
expenditures in urban areas than rural areas; and extrapolates from this that rural households
ought to be willing to pay more for electricity. Another study in UP indicates that consumers
educated on the correlation between higher electricity tariffs and improved reliability of
electricity services are much more likely to support increased costs (Aklin, 2014). Aklin et al.
(2014) perform a randomized trial using different types of education about electricity as
treatments before using a survey to identify support for increased tariffs; the treatment group
educated about the trade-off between low prices and unreliable electricity was 0.45 points on a 4
point scale more likely to accept increased tariffs. Finally, a World Bank Report finds that
customers in rural areas where electricity demand is unmet are willing to pay higher tariffs for

16
short-term power purchases, and 80% of all households are willing to pay INR 300 extra per
month for improved power supply (The World Bank, 2010).
A recent meta-analysis of selected WTP studies by TERI (2017) indicates that, beyond the basic
level of services, WTP becomes a factor of income (in)elasticity (i.e. affordability). The same
analysis also observes that some consumers expressed lower willingness to pay for grid-
connected services even when affordability was not a factor. This may be because of the political
economy factors that dictate electricity pricing in India, creating a somewhat prevailing sense of
consumer entitlement, which are suggested to lead to an expectation of receiving electricity
services at a nominal cost (TERI, 2017).
3. Methods
This study utilized a choice experiment analyzed with a mixed logit model. The choice
experiment is unique in its ability to determine consumer WTP for electricity attributes. This
section is composed of two parts: the first discusses choice experiments and the particular survey
techniques used, and the second explains the analyses undertaken to identify consumer
preferences, especially WTP for electricity and its attributes, from survey results.
3.1 Village surveys and discrete choice experiment
Household surveys were carried out over 22 villages belonging to 4 districts of UP (Rae Bareli,
Hardoi, Sitapur, and Kannauj). The survey covered approximately 10 households in each village,
which represented users exposed to the microgrid either at their home or in their workplace. The
surveys collected information on household demographics as well as exposure to microgrid and

17
grid systems and satisfaction with both the price and reliability of each option, which were self-
reported.
The choice questions followed the techniques of Longo (2008) and Hensher (2014) in their
recent studies valuing electricity attributes. Choice experiments are studies involving consumer
considerations of multiple product plans or profiles, where the consumer choice is used to
indicate most preferred plans as identified by a series of product attributes or qualities. Choice
experiments can be used to assess consumer preferences, especially those preferences that would
be exposed when consumers choose between competing products in a market (Customer
Lifecycle, LLC, 2012). While choice experiments still provide a quick assessment, they include
more nuance than a directly stated preference.
In this study, choices concerning electricity plans were used to distinguish WTP for each
attribute. The attributes used were price per month, hours of electricity supply per day, quantity
(kWh) of available electricity per day, and hours of electricity supply provided during the peak
evening hours (a proxy for a reliability/time of use measure). These attributes were identified
through discussion among the authors and several Indian stakeholders6.
To create electricity plans (alternatives), a full factorial design including all combinations of
attribute levels was considered. Each attribute had four possible levels, as indicated in Table 1.
The total of 44 or 256 possible unique alternatives was reduced using a fractional factorial design
with discarded clear inferior and superior plans, as indicated by Longo (2008) and Ozbafli
(2014). Twelve possible alternatives were finally identified through this method, as visualized in
6 The setup of the choice experiment for this study was informed through interviews with stakeholders representing policymakers, microgrid developers, development organizations, and the national grid. Fifteen stakeholder interviews were conducted to gather key perspectives.

18
Figure 1. Alternatives were randomly combined into 12 choice experiments of three alternatives
each. Each survey respondent was asked three choice experiments (one choice set).
To make the attributes more relevant to the survey respondents, they were presented as price,
number of hours for which specific appliances would be available, and evening hours guaranteed,
as shown in Figure 2. The number of hours per day was represented by a proxy of lighting hours;
this caused the attribute levels of energy to be modified, slightly changing the experimental
design. While this has no impact on the randomization of the values or on the resulting logistic
model, it did modify the distribution of energy levels represented7.
3.2 Mixed Logit Analysis
Mixed logit and conditional logit are the predominant models used to analyze choice
experiments on electricity attributes (Longo, 2008; Hensher, 2014). Both are forms of logistic
regression used to analyze the influence of several categorical independent variables on a set of
dichotomous and discrete dependent variables. Conditional logits are a variation of logistic
regression allowing variation of attribute levels among alternatives. Mixed logit allow additional
variation by including random choice variation in the coefficient β for each attribute’s
contribution, and are used in this analysis.
The choices made by consumers were analyzed in a mixed logit regression, following the
methods presented by Train (2009). This analysis models the discrete choice made by consumers
(the preferred electricity plan) based on several independent variables. In this study, only
alternative-specific variables, representing those dependent on the electricity plan itself, were
7 More than 4 levels for the attribute energy were used in the final plans, so the distribution of choices among levels differed for this attribute when compared to others, all of which had exactly 4 levels.

19
considered in the logit. The mixed logit model allows a randomization of error terms that is used
to account for the distribution of individual preference towards each electricity attribute.
The mixed logit output yields a generalized equation:
C = α + β1P + β2H + β3R +β4E, (1)
where price P, hours electricity H, reliability R, and total energy E determine the plan chosen, C,
by a respondent. α represents a standard intercept. Coefficients βi from the mixed logit output
were normalized by dividing them over the price coefficient; yielding coefficients that measure
WTP for certain electricity attributes. For instance, the WTP coefficient for the ith term in
equation (1) can be calculated as:
β i’ = βi/ β1 (2)
The equivalent regression would be represented as
WTP = α’ + β2’H + β3’R + β4’E + Ɛ, (3)
where α and Ɛ are intercept and error terms, as in standard regressions.
4. Results and Discussion
The survey results provide significant conclusions, despite a heterogeneous sample of
households as indicated by a range of household demographics. Households’ satisfaction with
the electricity they receive is significantly correlated with their provider type (grid or microgrid).
Their willingness to pay for an electricity plan can be predicted using several main attributes of
electricity.

20
A total of 220 households from different districts of the state and served by five different
microgrid providers were surveyed and are enumerated in Table 2. Of these, data pertaining to
households who were unable to complete the entire survey were discarded, and the final analysis
was limited to 211 responses. Of these 211 households, 41% reported income below the national
poverty line for India8. The average respondent was 36 years old and had lived in their village for
31 years. 71% of respondents were male; the gender imbalance can be partially attributed to
cultural norms and reticence on the part of women to participate in a survey. Information
regarding the caste of respondents was also collected, but as this did not have a significant effect
on results, it is not reported.
Respondents surveyed had mixed exposure to electricity sources. While all households surveyed
had been exposed to microgrid systems, 82% had been exposed at the home level, and the
balance were exposed at their place of work. Of the total 211 respondents, 38% also had home
exposure to grid systems. The average household (of those with access to electricity) had access
to the grid for 9.4 hours per day, on average, and/or microgrid for an average of 7.2 hours per
day.9 Respondents indicated a typical preference for 13.8 hours of electricity access with power
equivalent to the grid. Respondents also indicated variable use of different appliances. While half
of households surveyed have and use a fan, 30% have a television and only 25% a refrigerator.
Many more households indicated the aspiration to use these and other additional appliances in
their homes, but they are currently not able to use them due to either inadequate electricity
supply (more frequently cited) or prohibitive appliance price.
8 Although the national poverty line of India has been reported at US$1.25 per day, development institutions consider US$1.90 per day to be a global standard. Therefore, for the purposes of this study, US$1.90 or about INR 3500/month was considered as the poverty line. 9 The average across majority of the systems observed is 6.3 hours. The overall average is skewed upwards due to the inclusion of an outlier, where the village receives 24 hours of power from the microgrid. This system is not the norm.

21
The grid and microgrid systems were also compared through self-assessed satisfaction levels,
which have been plotted in Figure 3. Respondents were categorized by exposure type, where
exposure to an electricity system indicated a connection either at their home or place of work.
Respondents who had been exposed to both the microgrid and the grid had higher microgrid
satisfaction levels than average, indicating that, once exposed to both options, users valued the
benefits of the microgrid more. Respondents exposed to both the grid and microgrid were almost
twice as satisfied with the microgrid’s reliability as with the grid’s, rating the microgrid 4.1 on a
5-point scale (higher than the 2.1 scored by the grid). Respondents were also marginally more
satisfied with the price of the microgrid, despite the fact that the average grid tariff in UP
(between INR. 5.16/kWh for all consumers and INR 3.20 /kWh for domestic consumers at the
lowest) is much lower than the microgrid tariff, which ranges from INR. 30/kWh to Rs 100/kWh
(The World Bank, 2010).
Respondents’ higher satisfaction with the microgrid systems over the grid is only statistically
significant for reliability satisfaction. A two-sample t-test was conducted to compare microgrid
satisfaction levels as reported by consumers who had been exposed only to the microgrid and
those who had been exposed to both the microgrid and the grid. There was a significant
difference in scores for reliability satisfaction; t=2.43, p=0.017. However, respondents’ higher
satisfaction with the price of electricity from microgrid systems than grid systems is not
statistically significant (p=0.18). The expectation was that higher cost would result in lower
satisfaction; but the reliability of the microgrid seems to have offset dissatisfaction created by
higher cost such that there is no statistical difference. However, because grid and microgrid
respondents tended to represent different types of households (based on location or ability to

22
pay), is difficult to speculate about the implications of price satisfaction. Further studies will be
necessary to expand on this topic.
These values are believed to reflect two main perceptions. First, the microgrid offers power
during peak hours of demand—in the evening and early morning. Since the microgrid hours
align with the consumers’ demand, they prefer the microgrid. Second, the microgrid, while
providing fewer total hours of electricity than the grid, does so according to a particular schedule,
which creates certainty. Consumers may perceive the microgrid as meeting its promised supply,
while the grid is seen to advertise 24-hour electricity but cannot provide this during the peak
hours of demand.
The mixed logit model of the choice experiment responses yields equation (4).
C = -0.004*P – 0.110*H + 0.286*K + 0.222*EH +ε (4)
Where C is the choice outcome as indicated by the attributes monthly price P, hours per day H,
kWh per month K, and evening hours guaranteed EH, and error term ε. Table 3 details the
coefficients that were output by the mixed logit, all of which are significant at the 0.001 level.
Coefficients indicate that, all else equal, a one-rupee decrease in price will cause a 0.004 increase
in the probability that a consumer will choose a plan. Correspondingly, a one-hour decrease will
increase probability by 0.110; a one-kWh increase will increase probability by 0.286; and a one-
hour increase in the supply guaranteed during evening hours will increase probability by 0.222.
The relationship between several of these coefficient-and-attribute pairs can be visualized in
Figure 4, which shows more attractive plans in a darker color. The strong positive coefficient
0.286 for energy provided corroborates findings by Perwez and Harinarayanan (2016) that power
supply correlates with the number of electrified households, where higher power levels lead to
higher electrification rates.

23
While the positive coefficients of evening reliability and energy provided show that higher
values are more attractive to consumers, the negative sign accompanying the price coefficient
indicates that consumers prefer plans with a lower price. The negative coefficient for hours
indicates that in general, households do not value additional hours of electricity during the day.
In other words, consumers do not prioritize continuous power provision unaccompanied with
corresponding reliability guarantees. Rather, rural consumers tend to value electricity reliability
specifically in the evening hours when they have returned from farming, school, work, or other
pastimes. One caveat to this can be derived from the fractional factorial design. Due to the
distribution of electricity plans among the 4^4 possible combinations of attributes, consumers
were always asked to trade off attributes in the choice experiment (to get more of one attribute,
they had to accept less of another). Because of this constraint, this study cannot truly claim that
consumers negatively value hours of electricity; rather, we can only state that they prefer other
attributes over this one. Another possible explanation for a very low coefficient for additional
hours is that consumers assume these hours will be available during the day, when they are
generally not using electricity for any livelihood purpose or are not in the house (since most
respondents were men) —indicating a low valuation of this attribute.
Small differences in preference are demonstrated among subgroups of the survey participants.
Consumers exposed to the grid and microgrid have the same type of demand for evening
reliability, but microgrid users value small changes in price and total energy more than grid users.
Men are more likely to switch plans in order to make small gains of evening hours guaranteed or
kWh/mo, but females are more likely to prioritize plans based on lower price. These differences
were identified using additional logistic models of the subsets and are reported in Table 4.

24
The choice coefficient magnitudes indicate that consumers value hours of reliability during peak
usage more than twice as much as general hours of electricity. In addition, while these variables
are difficult to compare, it can be derived that respondents value 1kWh of electricity about the
same as 2.6 hours of electricity or 1.3 hours of reliable evening electricity. A more useful
contortion of the data gives marginal willingness to pay (MWTP) values for non-price attributes,
as given in equation (5).
Co = β0 -26.4*H + 68.8*K + 53.5*EH + ε (5)
Where Co is the cost of a plan as defined by intercept β0, the three non-price attributes, and an
error term ε. Table 5 shows the MWTP values for hours, power, and reliability variables. The
average rural consumer exposed to the microgrid is willing to pay nearly INR 70 for an
additional kWh/month10 and INR 50 (per month) for one additional hour of electricity supply
guaranteed each evening. However, once again the signs of the coefficients indicate that
consumers will not pay for an increase in the raw number of hours of electricity offered per day.
Although all derived coefficients are highly significant, there are also limitations to the
applicability of this study. Our calculations assume linearity of all variables, while experience
indicates otherwise (willingness-to-pay, for instance, cannot be infinitely additive for households
with finite income). While this model is applicable to most current situations, since the plans
presented match the context experienced by households, future studies will be required to
consider further implications of nonlinear demand. The impacts of this work are also constrained
10 This finding is based on consumer response to additional appliance use, which we have equated to increased energy consumption in this study. Consumers are willing to pay more for additional energy over the course of the month. This metric—number of kWh per month—must be differentiated from the price per kWh. Direct discussions indicated that consumers will not switch plans to higher price per kWh.

25
by the maximum attribute levels offered by the different alternatives.11 While this study focused
on remote rural regions, where microgrids are operating successfully, future research will be
essential to understand the competition or complementarity between the grid and microgrid
services within a broader geographic scope once the grid becomes more reliable. Finally, this
analysis only considers the tradeoffs between different electricity plans, as would exist in the
case of future grid-microgrid competition. Further studies, building on this and the work of
Urpelain (2014), would be needed to assess whether either of these electrification options are
preferable to consumers who currently are not connected to any electricity source—in other
words, if microgrids are useful for ongoing electrification efforts or only as a complement to grid
connectivity.
5. Conclusions & policy implications
5.1 Summary of findings
India has made significant progress in rural electrification during the last decade, and nearly 98%
of villages now have access to grid electricity. Only about 5,600 villages remain to be electrified,
as of February 2017 (Rural Electrification Corporation of India, 2017). The national government
is actively pursuing the electrification of these villages through grid extension and microgrids
and hopes to achieve complete village electrification by May 2018. However, despite the
progress in village-level coverage, there remain more than 50 million Indian households without
access to electricity—many of which reside in electrified villages or even unelectrified hamlets
of electrified villages. The problem of electricity supply quality also persists, as many electrified
11 For instance, the results of this study should not be extrapolated beyond electricity service exhibiting 10 hours per day, 10 kWh per month, etc.

26
areas are still underserved and receive unreliable supply from the centralized grid. While
microgrids offer a viable electrification solution in many villages, the cost of their supply is
relatively high as compared to the regulated grid tariff.
The main conclusion of this paper is that when choices are available, consumers make
sophisticated decisions balancing different attributes of the service presented (not only price).
This observation can inform microgrid and grid operations as well as policy development and
implementation for future electrification efforts. Further, this understanding can inform the
future competition between grids and microgrids, in particularly helping investors when deciding
to take the risk of a microgrid investment.
The results provided indicate that grid and microgrid operators should focus not only on
providing minimum cost options to their customers, but also on the emphasis of reliability and
satisfaction of peak demand. In the case of future electrification efforts, these results support the
use of microgrids to increase electrification rather than relying only on central grid expansion.
Consumers are more satisfied with the services of the microgrid than the grid and are likely to
pay more for microgrid service. The central grid, while cheap, lacks other important attributes,
and its expansion would further stress its reliability and supply during peak hours. Due to this
finding, the government may do better with a focus on increasing electrification through
microgrids while devoting efforts in grid improvement to reliability rather than expansion. For
investors, understanding the way consumers make these decisions may alleviate the perceived
risk of a microgrid investment. Knowing that consumers, even in resource constrained
households in rural areas, are willing to pay for the attributes that their services provide shows
promise that the investment will be a financially viable enterprise.

27
More than one-third of respondents were found to have access to both microgrid and central grid
connections, either at home or at work. Since electricity from the grid is unreliable but has a
lower price due to regulation, households seem to be using microgrid connections as a coping
mechanism for the unreliability of the grid.
Although the households with access to the main grid get electricity for 9.4 hours per day, on
average, the microgrid supplies electricity for an average of 7.2 hours per day. In spite of the
lesser duration of supply hours from microgrid, the respondents exposed to both were almost
twice as satisfied with the microgrid’s reliability vis-à-vis the main grid. This suggests that
consumers place emphasis on having electricity at the promised and, more importantly, required
times instead of simply having higher amounts of electricity available with no understanding of
timing. Not only are they more satisfied, but results also show that consumers are willing to pay
higher prices for service with these attributes. Another key finding is that consumers do not
prioritize continuous power provision unaccompanied with corresponding reliability guarantees.
Rural consumers tend to value electricity reliability, specifically in the evening hours.
5.2 Policy Implications
Based on the above findings, we provide the following five recommendations for ensuring
growth in electricity access and sustainability of the sector, in order of importance:
1. The growth of electricity systems should focus on provision of electricity with high
power, high reliability, and focus on consumers’ desired timeframes or demand peaks,
whether the supply is provided through grid or mini-grid systems.
2. Tariffs and subsidies need to be rationalized, based on evidence, to allow electricity
service providers to charge cost-reflective tariffs. At the same time, subsidy benefits must
percolate to those who are unable to afford even basic electricity services. Subsidy

28
reforms that ensure the provision of basic services to even the poorest consumers without
creating perverse incentives should be promoted. The results of this study can be used to
inform properly scaled subsidies to match consumer demand with potential electricity
supply.
3. Electricity demand should be considered a service independent of its source, be it grid or
off-grid, and the best-suited infrastructure should be employed to provide reliable and
adequate electricity at an affordable price, for the same level of services. Where
sustainable electricity supply via the grid is not viable, a supportive mechanism must be
developed to make the technically feasible microgrid solutions more affordable. For
instance, the integration of microgrid systems with the central grid will be dependent on
the compatibility of distribution networks; and metered connections will prepare
consumers for future service opportunities. The inclusion of such components will
support the long-term sustainability of electricity systems as a whole.
4. Although the UP minigrid policy and the draft national minigrid policy in India specify
that microgrid developers can feed generated power to the grid at a feed-in tariff when
the grid is extended to areas where they operate, it is unclear whether the developer can
continue to serve locally while also incorporating grid-generated electricity into their
supply profile. We recommend that microgrid developers should also have the option to
uptake grid electricity at a bulk supply tariff from the distribution company. This would
allow microgrid developers to continue serving consumers using electricity from the local
renewable plant (relatively higher priced) while mixing in grid electricity (lower priced)
at a weighted average price to the consumers. This study indicates that consumers are
willing to pay a higher rate to ensure reliability in the evening and receive about 14 hours

29
of supply. Therefore, this arrangement would meet the aspirational demand of consumers
by allowing developers to supply electricity reliably and for longer hours at a more
affordable price.
5. Willingness to pay studies, although providing insights into the socio-economic and
geographical profiles of consumers and the factors affecting their decisions regarding
electricity service, are not necessarily included in tariff-setting procedures. It has been
observed from stakeholder consultations that even trusted WTP data might have a limited
influence on tariff-setting by electricity providers due to the many other concerns that
electricity providers must also take into account. It would be prudent to conduct a larger,
pan-India survey on WTP, in consultation with the Forum of Electricity Regulators, in
order to have more robust and representative data. Regulators would be more inclined to
set prices that can ensure the sustainability of the electricity sector when they have
representative data informing consumer choices.
These results support the formulation of policies that allow microgrids to function together with
the grid. They also support the idea that different policy avenues can be pursued, such that some
strengthen the centralized grid’s reliability while others protect and promote the ability of
microgrids to replicate. These two avenues may provide a more effective policy landscape to
reinforce the goal of universal electrification.
5.3 Conclusion
The policy recommendations were derived from the quantitative analysis of consumer
preferences based on hypothetical electricity plans. In summary, analysis of the choice
experiment described here shows that microgrids provide a significant service to rural

30
communities in India. They effectively complement the centralized grid and in many cases are
successful enough to coexist or compete with the grid. As development continues towards
universal electrification, electricity policy including regulations, tariff setting, and subsidies can
be used to improve the alignment of multiple electricity supplies with consumer demands. These
policies may take advantage of the complementarity and competition between the grid and
microgrid to accelerate the achievement of 100% electrification with increased reliability.
Acknowledgements
We would like to thank the following individuals who were essential to the completion of this
work:
Mr. Kishor, Mr. J. Tiwari, and Siddharth Mishra for their assistance with data collection and
adapting our survey to the populations of rural Uttar Pradesh.
Michael Clark at University of Michigan Consulting for Statistics, Computing & Analytics
Research for his invaluable help formulating our data for the mixed logit regression.
The professors at the University of Michigan School of Natural Resources and Sustainability
who provided additional consultations in the formulation of our research questions, methods, and
analyses, especially Avik Basu and Michael Moore.
The University of Michigan School of Natural Resources and Environment for providing funding
to make this research a reality.

31
References:
Abdullah, S. and Mariel, P. (2010). Choice experiments study on the willingness to pay improve
electricity services. Energy Policy 38: 4570-4581.
Aklin, M. et al. (2014). Information and energy policy preferences: a survey experiment on
public opinion about electricity pricing reform in rural India. Econ Gov 15: 305-327.
Banerjee, S.G. et al. (2015). Power for All: Electricity Access Challenge in India. World Bank
Studies. doi: 10.1596/978-1-4648-0341-3. Attribution CC BY 3.0 IGO
Bhattacharyya, S.C. and Palit, D. (2016). Microgrid based off-grid electrification to enhance
electricity access in developing countries: What policies may be required? Energy Policy
94: 166-178.
Bhushan, C. and Kumarankandath, A. (2016). Microgrids: Electricity for all. Centre for Science
and Environment, New Delhi.
Bose, R.K. and Shukla, M. (2001). Electricity tariffs in India: an assessment of consumers’
ability and willingness to pay in Gujarat. Energy Policy 29: 465-478.
Central Electricity Authority of India, (2016).All India Installed Capacity (In Mw) Of Power
Stations. Retrieved from
<http://www.cea.nic.in/reports/monthly/installedcapacity/2016/installed_capacity-03.pdf>
Cust, J. et al. (2007). Rural electrification in India: Economic and institutional aspects of
renewables.
Customer Lifecycle, LLC (2012). Conjoint or DCM? Choice model overview. Greenbook.
Retrieved from <https://www.greenbook.org/marketing-research/conjoint-or-dcm-choice-
models-overview-34754>

32
International Energy Agency (2012). World Energy Outlook 2012 – Energy Development Index
Database. Retrieved from
<http://www.iea.org/media/weowebsite/energydevelopment/2012updates/WEO2012EDI
database_WEB.xlsx>
GNESD. (2014) Renewable energy-based rural electrification: The Microgrid Experience from
India. New Delhi: Prepared by The Energy and Resources Institute (TERI) for the Global
Network on Energy for Sustainable Development (GNESD). ISBN: 978-87-93130-17-3
Goett, A.A. et al. (2000). Customers’ choice among retail energy suppliers: the willingness-to-
pay for service attributes. The Energy Journal 21(4).
Gunatilake H. et al. (2012) Valuing Electricity Service Attributes: A Choice Experiment Study in
Madhya Pradesh, India. ADB Economics Working Paper Series No. 316
Hensher, D.A. et al. (2014). Willingness to pay for residential electricity supply quality and
reliability. Applied Energy 115: 280-292.
Indian Power Market (2015). Electricity prices in different states of India. Indian Power Market.
Retrieved from <http://www.indianpowermarket.com>
Krithika, P.R. et al. (2015). Papers presented at OASYS SOUTH ASIA Research Project Papers:
Scale-up and Replication of Off-grid Projects. New Delhi, India: The Energy and
Resources Institute.
Layton, D.F. and Moeltner, K. (2005). The cost of power outages to heterogeneous households.
In R. Scarpa (Ed.), Applications of Simulation Methods in Environmental and Resource
Economics (pp 35-54). Springer, Netherlands.

33
Lee, K. et al. (2016). Appliance ownership and aspirations among electric grid and home solar
households in rural Kenya. NBER Working Paper Series. National Bureau of Economic
Research: Cambridge, MA.
Longo, A. et al. (2008). The internalization of externalities in the production of electricity:
Willingness to pay for the attributes of a policy for renewable energy. Ecological
Economics 67: 140-152.
Martinot, E. et al. (2002). Renewable Energy Markets in Developing Countries. Annual Review
of Energy and the Environment 27: 1-431
Min, B. and Golden, M. (2014). Electoral cycles in electricity losses in India. Energy Policy. 65:
619-625.
Ministry of Law and Justice (2003). The Electricity Act, 2003. New Delhi, India.
Ministry of New and Renewable Energy (2016). Draft National Policy on RE based Mini/Micro
grids. New Delhi, India.
Maithani, P. C., and Gupta, D. (2015). Achieving Universal Energy Access in India: Challenges
and the Way forward. New Delhi: Sage Publications
Nouni, M.R. et al. (2008). Providing electricity access to remote areas in India: An approach
towards identifying potential areas for decentralized electricity supply. Renewable and
Sustainable Energy Reviews 12(5): 1187-1220
Office of the Registrar General and Census Commissioner (2011). 2011 Census Data. Ministry
of Home Affairs, Government of India. Retrieved from http://censusindia.gov.in
Palit, D. (2015). Electricity for all - villages or households? Hindu Business Line; 15 September
2015.

34
Palit, D. and Chaurey, A. (2011). Off-grid rural electrification experiences from South Asia:
Status and best practices. Energy for Sustainable Development 15: 266–276
Palit, D. and Sarangi, G. (2014) Renewable Energy based mini-grids for enhancing electricity
access: Experiences and lessons from India. International Conference and Utility
Exhibition 2014 on Green Energy for Sustainable Development.
Perwez, A. and Harinarayanan, S. (2016). Power for all by 2022: reality or a dream. India
Strategy, JM Financial. Retrieved from <https://jmfl.com/docs/default-source/default-
document-library/rural_electrification.pdf?sfvrsn=0>
Prime Minister’s Office (2015). Prime Minister’s Independence Day Address. Prime Minister’s
Office Media Records. Retrieved from <http://www.pmindia.gov.in>
PFC (2013): Report on the Performance of State Power Utilities for the Years 2009–10 to 2011–
12, Power Finance Corporation Ltd., New Delhi
Reiche, K. et al. (2000). Expanding electricity access to remote areas: off-grid rural
electrification in developing countries. Fuel, 1(1.2), 1-4.
Rural Electrification Corporation of India (2016). GARV Dashboard. Governmnet of India.
Retrieved from <http://garv.gov.in/>
Rural Electrification Corporation of India (2017). Garv Dashboard. Government of India.
Retrieved from <http://garv.gov.in/garv2/dashboard>
TERI (2017). Understanding Electricity Pricing Willingness to Pay for Electricity in India (TERI
Project No 2015RA08); New Delhi: The Energy and Resources Institute.
The World Bank (2010). Empowering rural India: expanding electricity access by mobilizing
local resources. South Asia Energy Unit, The World Bank.

35
Urpelainen, J. (2016). Energy poverty and perceptions of solar power in marginalized
communities: Survey evidence from Uttar Pradesh, India. Renewable Energy 85, 534-539.
Uttar Pradesh Electricity Regulatory Commission (UPERC) (2016). Draft Minigrid Renewable
energy Generation and Supply. Lucknow, India.
Uttar Pradesh New and Renewable Energy Development Agency (UPNEDA) (2015) Minigrid
Policy, Lucknow, India
36
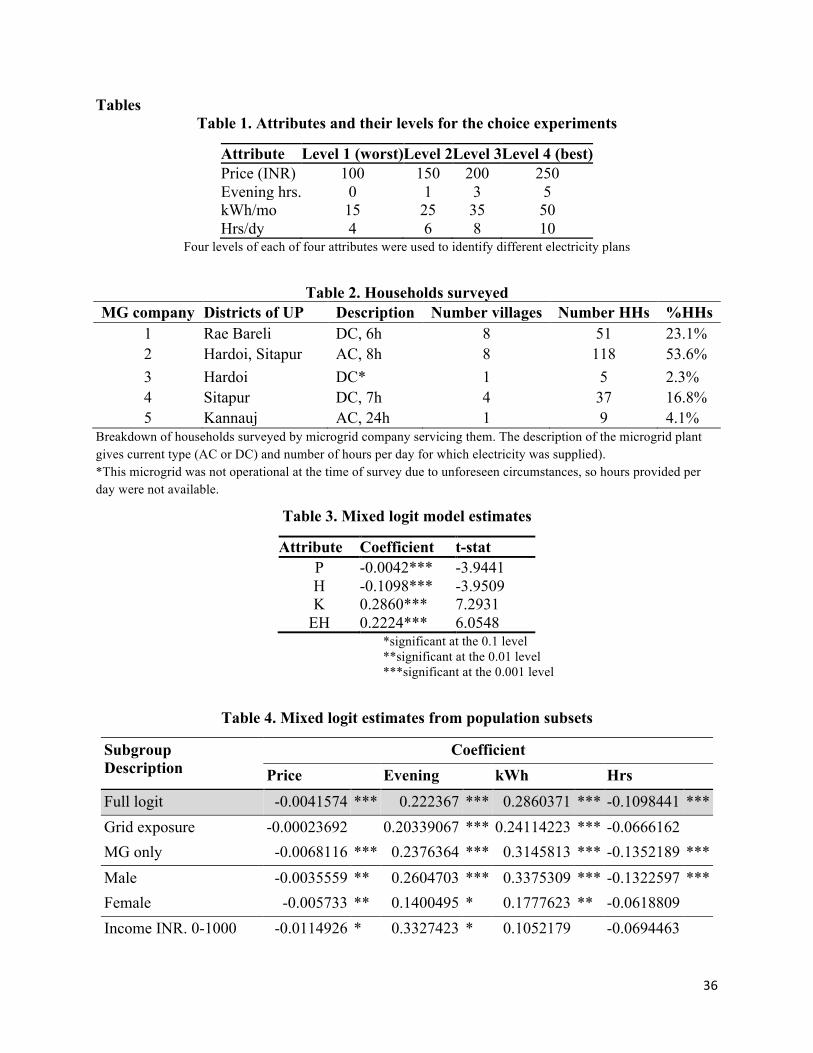
Tables Table 1. Attributes and their levels for the choice experiments
Attribute Level 1 (worst) Level 2 Level 3 Level 4 (best) Price (INR) 100 150 200 250 Evening hrs. 0 1 3 5 kWh/mo 15 25 35 50 Hrs/dy 4 6 8 10
Four levels of each of four attributes were used to identify different electricity plans
Table 2. Households surveyed MG company Districts of UP Description Number villages Number HHs %HHs
1 Rae Bareli DC, 6h 8 51 23.1% 2 Hardoi, Sitapur AC, 8h 8 118 53.6% 3 Hardoi DC* 1 5 2.3% 4 Sitapur DC, 7h 4 37 16.8% 5 Kannauj AC, 24h 1 9 4.1%
Breakdown of households surveyed by microgrid company servicing them. The description of the microgrid plant gives current type (AC or DC) and number of hours per day for which electricity was supplied). *This microgrid was not operational at the time of survey due to unforeseen circumstances, so hours provided per day were not available.
Table 3. Mixed logit model estimates
Attribute Coefficient t-stat P -0.0042*** -3.9441 H -0.1098*** -3.9509 K 0.2860*** 7.2931
EH 0.2224*** 6.0548 *significant at the 0.1 level **significant at the 0.01 level ***significant at the 0.001 level
Table 4. Mixed logit estimates from population subsets
Subgroup Description
Coefficient Price Evening kWh Hrs
Full logit -0.0041574 *** 0.222367 *** 0.2860371 *** -0.1098441 *** Grid exposure -0.00023692 0.20339067 *** 0.24114223 *** -0.0666162 MG only -0.0068116 *** 0.2376364 *** 0.3145813 *** -0.1352189 *** Male -0.0035559 ** 0.2604703 *** 0.3375309 *** -0.1322597 *** Female -0.005733 ** 0.1400495 * 0.1777623 ** -0.0618809 Income INR. 0-1000 -0.0114926 * 0.3327423 * 0.1052179 -0.0694463
37
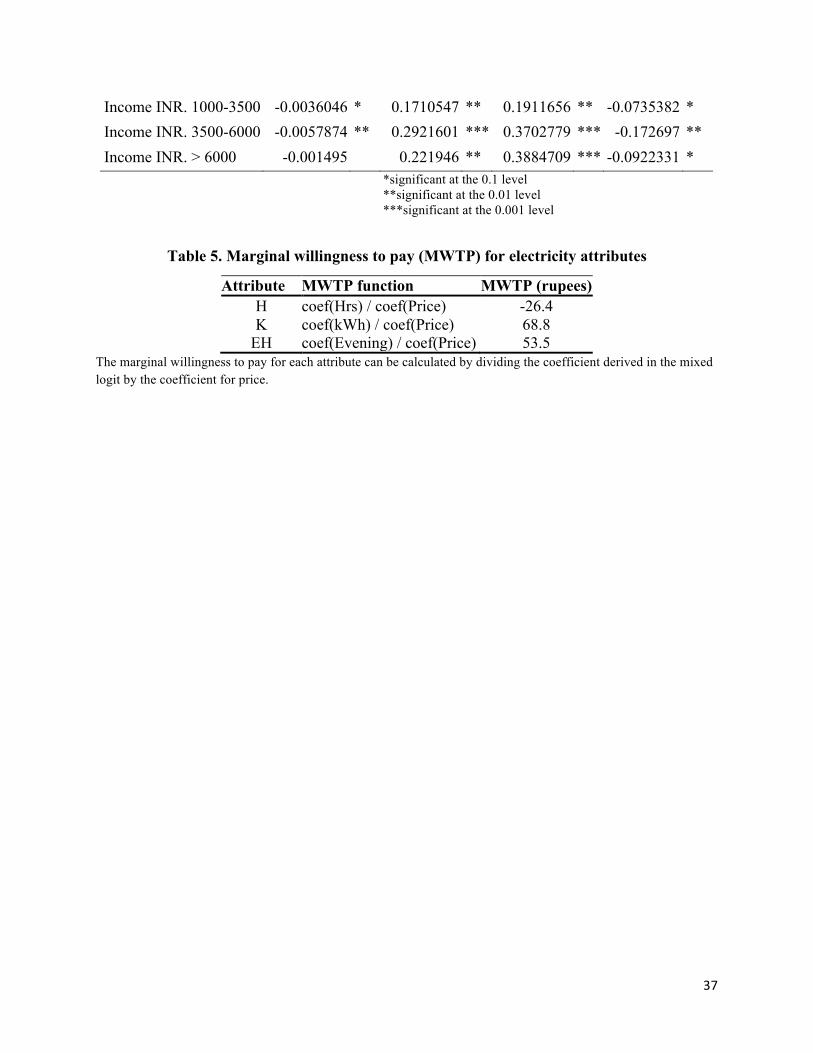
Income INR. 1000-3500 -0.0036046 * 0.1710547 ** 0.1911656 ** -0.0735382 * Income INR. 3500-6000 -0.0057874 ** 0.2921601 *** 0.3702779 *** -0.172697 ** Income INR. > 6000 -0.001495 0.221946 ** 0.3884709 *** -0.0922331 *
*significant at the 0.1 level **significant at the 0.01 level ***significant at the 0.001 level
Table 5. Marginal willingness to pay (MWTP) for electricity attributes
Attribute MWTP function MWTP (rupees) H coef(Hrs) / coef(Price) -26.4 K coef(kWh) / coef(Price) 68.8
EH coef(Evening) / coef(Price) 53.5 The marginal willingness to pay for each attribute can be calculated by dividing the coefficient derived in the mixed logit by the coefficient for price.

38
Figures Figure 1. Fractional Factorial
Visual representation of electricity alternatives, where the height of the bar represents the level of attribute chosen. For instance, a taller bar reflects an attractive attribute level (e.g. low price, high number of hours).
Figure 2. Sample Electricity Plan

39
Electricity plans shown to consumers used metrics such as “hours of fan” to approximate the attributes analyzed
(such as power level).
Figure 3. Exposure to and satisfaction of grid and microgrid systems
Satisfaction levels self-reported by respondents on a scale of 1-5, where 5 is the best
Figure 4. Heat maps of attribute pairs

40
Here, darker colors show more attractive plans (for which the logit model indicates a higher probability of being chosen). Non-displayed attributes are held constant for this approximation at Price=150, Evening=3, kWh=3, Hrs=8 units.
Related Documents