Solar gasification of sugarcane bagasse: thermogravimetric analysis of the kinetics of pyrolysis and steam gasification Master thesis in Chemical Engineering Elena Cândida dos Santos April 2012 Advisors: Prof. Maurizio Masi, Prof. Aldo Steinfeld Chemistry Materials and Chemical Engineering Department “Giulio Natta”, Politecnico di Milano, Milano, Italy in collaboration with Institute of Energy Technology Professorship of Renewable Energy Carriers ETH – Swiss Federal Institute of Technology Zurich

Welcome message from author
This document is posted to help you gain knowledge. Please leave a comment to let me know what you think about it! Share it to your friends and learn new things together.
Transcript
Solar gasification of sugarcane bagasse:
thermogravimetric analysis of the kinetics of
pyrolysis and steam gasification
Master thesis in Chemical Engineering
Elena Cândida dos Santos
April 2012
Advisors: Prof. Maurizio Masi, Prof. Aldo Steinfeld
Chemistry Materials and Chemical Engineering Department “Giulio Natta”, Politecnico di Milano, Milano, Italy
in collaboration with
Institute of Energy Technology Professorship of Renewable Energy Carriers
ETH – Swiss Federal Institute of Technology Zurich
ii
ii
Acknowledgements
This Master Thesis was written as the requirements for the MSc. degree in Chemical
Engineering at Politecnico di Milano - MI.
To Prof. Maurizio Masi, my advisor from my home university, who provided guidance,
suggestions and attention.
I would like to cordially thank the ETH Zürich (Swiss Federal Institute of Technology
Zurich), represented by Prof. Aldo Steinfeld, who hosted me in the group of Professorship of
Renewable Energy Carriers during my entire exchange period.
In special to:
· Michael Krüsi, my supervisor, for lessons, guidance, friendship, encouragement and
especially confidence
· Dr. Zoran Jovanovic for having passed his experience, support and friendship.
Special thanks to my mother, Maria Salete dos Santos, for her love, patience and
unconditional support in all the moments.
To everyone who contributed directly or indirectly to this work.
iii
iii
Abstract
Solar steam gasification offers an efficient and economic path to provide gaseous, liquid and
solid fuels, and prepare chemicals derived from biomass. The thermochemical conversion of the
Brazilian sugarcane bagasse in solar-driven gasifiers, can offer an alternative to the sugarcane
residue’s currently inefficient usage which is the electrical and thermal energy supply for the
sugar and ethanol production.
The steam gasification process encloses two consecutive reaction steps: Pyrolysis and steam
gasification. Both were experimentally studied by thermogravimetric analysis in order to model
their rate laws, which are of fundamental importance for the design of the solar reactor.
Kinetic parameters for pyrolysis and steam gasification have been numerically derived:
Pyrolysis reaction is modeled as a linear combination of three-pseudo-components following
first order decomposition reactions. The model for the steam gasification reaction is based upon
the “oxygen-exchange mechanism” type considering reversible sorption of gaseous species and
irreversible reactions among adsorbed species and with molecules from the gas phase. Further,
the grain distribution model represented by a linear dependency of the unreacted particles was
used to account for the structural changes during reaction.
Keywords: bagasse, pyrolysis, steam gasification, thermogravimetry, steam, kinetics
iv
iv
Table of Contents
Acknowledgements ii
Abstract iii
Table of Contents iv
1 Introduction 1
2 Background 3
2.1 Conventional gasification 3
2.2 Solar driven gasification 3
3 Pyrolysis 6
3.1 Models of reaction kinetics 7
3.2 Sample preparation and characterization 9
3.2.1 Bagasse characterization 9
3.3 Thermogravimetric analysis 11
3.4 Results and discussion 13
4 Steam gasification 16
4.1 Models of reaction kinetics 16
4.1.1 Structural models for the bagasse char particle 19
4.1.2 Reaction mechanism 25
4.2 Sample preparation and characterization 28
4.2.1 Sample preparation 28
4.2.2 Bagasse char characterization 30
4.3 Thermogravimetric analysis 33
4.4 Results and discussion 36

v
v
4.4.1 Structural term 37
4.4.2 Kinetic term 40
5 Conclusions 45
References 47
Nomenclature 49
Abbreviation 51
Introduction 1
1
1 Introduction
The sugar cane bagasse is a byproduct of the sugarcane industry, as well as sucrose and straw.
Bagasse is composed of cellulose, hemicellulose and lignin. Currently the bagasse generated in
sugar mills is used to produce energy through co-generation, making the plant self-sustained, and
in some cases, spare energy to electricity sales.
In the harvest season 08/09, Brazil processed about 570 million tons of sugarcane, producing
around 160 million tons of bagasse. Although it is used as fuel for boilers of the mills, there is
left an unused quantity that represents 20% of the total bagasse generation [1]. Hence, there is
still a great quantity of bagasse which is incinerated to reduce costs of transportation and
treatment. Bagasse is therefore the indicated biomass for further studies and new technologies,
such as gasification processes.
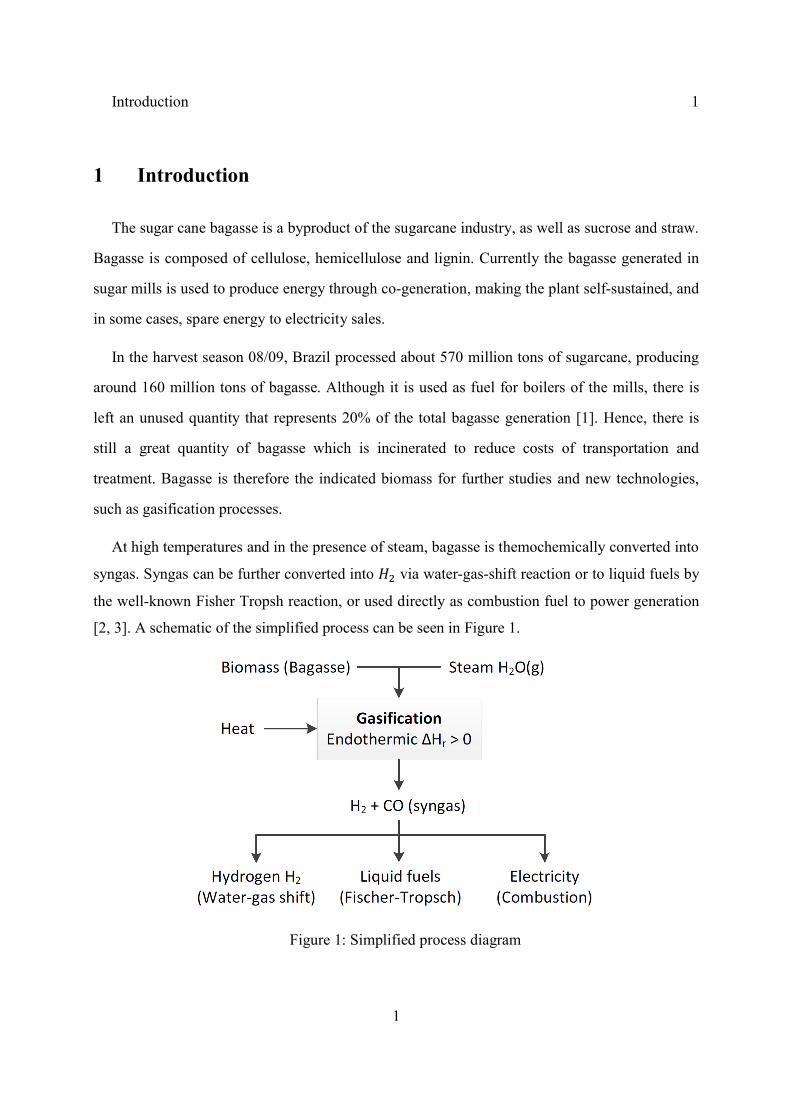
At high temperatures and in the presence of steam, bagasse is themochemically converted into
syngas. Syngas can be further converted into via water-gas-shift reaction or to liquid fuels by
the well-known Fisher Tropsh reaction, or used directly as combustion fuel to power generation
[2, 3]. A schematic of the simplified process can be seen in Figure 1.
Figure 1: Simplified process diagram
Introduction 2
2
The thermochemical conversion of bagasse occurs via highly endothermic reactions and
requires the supply of heat. In the conventional gasifiers, such as autothermal gasifiers, the heat
required for the gasification is supplied by the internal combustion of a significant amount of the
feedstock with air or pure oxygen [4]. The combustion reduces the utilization of the feedstock
and the quality of the syngas due to the increased amounts of CO2 produced. On the other hand
the solar-driven gasification supplies the required heat by concentrated solar energy, which
allows working temperatures up to 1500 K [5], moreover, solar energy is chemically stored in
the gas product, which leads to a syngas with higher energy content per unit of feedstock and as
no combustion occurs, the syngas produced by solar-driven gasifiers has higher quality with
lower CO2/CO and higher H2/CO ratios. However the challenge of the intermittent solar energy
needs to be considered together with the advantages of the solar-driven gasification.
The gasification of biomass is a process that occurs by the combination of two reactions. First,
it occurs by the pyrolysis reaction (a thermal decomposition and devolatilization) and
subsequently, by the heterogeneous gas-solid reaction of the pyrolysis residue (char) with steam,
the so called steam gasification.
Pyrolysis is essentially a devolatilization and decomposition of the organic matter under inert
atmosphere leading to the formation of a carbon rich material (char). The nature of pyrolysis is
related to the operation conditions. E.g. low or high heating rates applied to pyrolysis may result
in different pore structure of char and char yields, which leads to higher or lower reactivity in
gasification reactions [6]. The steam gasification is a complex gas-solid reaction of bagasse char
with steam because it involves a series of chemical reactions including adsorption and desorption
of gases on the solid surface, reactions among adsorbed species, and the release of carbon to gas
phase by the formation and desorption of surface oxygen complex.
In the present work, thermogravimetric analyses of pyrolysis and steam gasification were
carried out simulating the reactions taking place in the solar gasifier. Kinetic rate laws for both
cases were then formulated, as they have a fundamental importance on the understanding and
design of the solar reactor.
Background 3
3
2 Background
2.1 Conventional gasification
In conventional gasifiers, the heat required for the gasification is supplied by the combustion
of a significant amount of feedstock with air or pure oxygen. A simplified rate of reaction for the
conventional gasification is expressed in Eq. 1.
+ + ⎯⎯ + + (1)
From the heat transfer mode point of view, the conventional gasifiers can be classified as
autothermic or allothermic [5]. In an autothermic process internal combustion of an amount of
the solid feedstock with oxygen produces the heat required to run the gasification reaction inside
the reactor. In an allothermic process, the heat required is transferred by means of gaseous, liquid
(molten salts), or solid heat carrier brought into contact with the reactants or indirectly via heat
exchangers.
2.2 Solar driven gasification
In solar driven gasification solar energy is supplied as an external heat source to reach the
gasification reaction heat requirement. The solar energy is supplied in form of highly
concentrated solar-thermal energy which can reach temperatures up to roughly 1500 K, reported
somewhere else [5]. A simplified rate of reaction for the solar driven- gasification is expressed in
Eq. 2 as well as a schematic of the process is show in Figure 2.
+ + ⎯⎯ + (2)

Background 4
4
Figure 2: Schematic of the solar-thermals gasification of bagasse
Solar-driven gasification has many advantages compared to the conventional one. As it uses
highly concentrated solar-thermal energy to gasify the carbonaceous feedstock, there is no need
to combust part of it to produce the heat required by the gasification. Therefore, it does not
account for carbon dioxide realize into the atmosphere. Moreover, solar energy is chemically
stored in the gas product, which leads to a syngas with higher energy content per unit of
feedstock. Since no internal combustion contaminates the syngas, it is of higher quality with
lower CO2/CO and higher H2/CO ratios. This reduces the effort for separating CO2 when
producing Fischer-Tropsch liquid fuels, reducing investment costs of additional separation units.
These advantages of solar gasifiers over conventional ones are to be considered in
combination with the introduced challenges by the intermittent energy of the sun.
Solar gasification reactors may be classified as [5]:
· directly irradiated reactors: where the solid carbonaceous reactants are directly
exposed to the concentrated solar irradiation. E.g. a vortex-flow solar reactor
featuring a helical flow of carbonaceous particles and steam, where the heat transfer
is consider fast, meaning that pyrolysis is conducted with a high heating rate.
· indirectly irradiated reactors: where heat is transferred to the reaction site through an
opaque wall. E.g. solar-packed-bed reactor, in which the thermal dissipation is slow,
comparable to a slow heating rate.
Background 5
5
The present work studies the kinetics involving pyrolysis and steam gasification that take
place inside a solar gasifier. This is crucial for the understanding and design of a solar reactor.

Pyrolysis 6
6
3 Pyrolysis
Pyrolysis is a thermal decomposition of carbonaceous materials under inert atmospheric
conditions or in a limited supply of air [8], leading to the release of volatiles and formation of a
carbon rich solid (char). It is an endothermic process and requires the supply of heat.
Pyrolysis of biomass is typically initiated at 473 K and lasts until 623-723 K depending on the
species of biomass. The nature of pyrolysis and the evolving gases are related to the operation
conditions, such as particle size, heating rate and temperature.
Their influences are deepened in the following:
· Particle size: it is believed [9] that increasing the particle size will lead to higher
devolatilization times.
· Heating rate: influences the volatiles release behavior and may have a significant impact
on the reactivity of the char. It is believed [6] that rapid heating rates inhibits secondary
reactions and prevents the formation of tars. Moreover the latter produces chars with
strongly non-uniform distributed macro-pores leading higher reactivity in gasification.
· Temperature: impacts on the pyrolysis yields and its product properties. Pyrolysis at high
temperatures produces mainly gases while the low temperature pyrolysis produces tar and
liquid derivatives, such as tar and heavy oils [10].
Depending on the solar reactor design, shown in scetion 2.2, slow or rapid pyrolysis may take
place. As explained before, this can lead to chars with different properties, such as pore size and
reactivity in gasification. For this reason, in this work both pyrolysis treatments were studied by
the steam gasification reaction.
Furthermore, the determination of the kinetic parameters of pyrolysis allows the mathematical
modeling of the rate of chemical reactions taking place during the devolatilization of the
biomass. The kinetic parameters allow determining the time required for complete conversion of
the solid material [11]. Thus, the design of the solar reactor for the thermochemical conversion
of biomasses requires also the investigation of the pyrolysis reaction.

Pyrolysis 7
7
3.1 Models of reaction kinetics
Modeling of pyrolysis implies the representation of the chemical and physical phenomena in a
mathematical form. The basic equations are those of chemical kinetics, heat transfer and mass
transfer. The actual reaction scheme of pyrolysis of biomass is extremely complex because of the
formation of more than hundred intermediate products. Despite of the considerable number of
research works devoted to the kinetics of biomass pyrolysis, the definition of the right kinetic
model remains controversial [7].
As far as empirical modeling concerns, the main proposed kinetic mechanisms are based
either on a one step reaction (global decomposition) or on several competitive parallel reactions,
where all of them constitute derivations of a summative model for pyrolysis, called distribution
of activation energy model, originally developed by Pitt [12] and still widely accepted today.
The pyrolysis reaction can be described by means of the following scheme:
Figure 3: Pyrolysis mechanism
This scheme shown in Figure 3 indicates that the biomass decomposes to volatiles, gases and
char. The volatiles and gases may further react with char to produce different type of volatiles,
gases and char where the compositions are different. Therefore, the primary pyrolysis products
participate in secondary interaction (Reaction 3), resulting in a modified final product
distribution.
The present work aims to find a rather simple kinetic model that is suitable to the experiments
carried out. Therefore the rate of pyrolysis is calculated as a combination of first-order
decomposition rates of pseudo-components. The competitive outlines refer to parallel,
irreversible and first order reactions to get the different fractions of pyrolysis products associated
with activation energy with a characteristic decomposition temperature.

Pyrolysis 8
8
Based on the above assumptions, the rate of pyrolysis is calculated as:
= (1 − ) (3)
where,
, = , ( , )
, (4)
where ( , ) denotes the mass of the pseudo-component having reacted until temperature
and time while , is the total initial mass fraction of pseudo-component . ’is assumed
to follow Arrhenius law,
= , − (5)
The temperature rising is expressed as a function of time , the TG’s heating rate , and the
temperature at the starting point of the heating phase ,
( ) = + . (6)
Solving Eq. 3 for gives the conversion of pseudo-component up to a temperature
considering conversion achieved during the non-isothermal phase of duration (constant
heating).
= 1 − − , ∫ − , (7)
The total conversion (Eq. 8) and total conversion rate (Eq. 9) of all components of the
biomass sample are then calculated as:
= ∑ (8)
= ∑ (1 − ) (9)
According to Orfao et al. [13] the subscripts do not refer exactly to the natural polymers that
integrate the biomass but to the three any pseudo-components.

Pyrolysis 9
9
3.2 Sample preparation and characterization
The bagasse was received directly form a Brazilian sugar mill in the form of particles mixed
with long fibers containing still a lot of moisture. Prior to its use, the bagasse was sieved with a
1mm sieve and soon after oven dried for 16 hours at 376 K.
3.2.1 Bagasse characterization
The composition of bagasse, are expressed in terms of proximate and ultimate analyses, which
are generally used to characterize solid fuels. Data analyses are shown in Table 1.
Table 1:Ultimate analysis of bagasse (dry basis); C, H, N determined with CHN-900, O with
RO-478 and S with CHNS-932 (all LECO Corporation, St. Joseph, MI)
Carbon (C) [%wt] 42.51
Hydrogen (H) [%wt] 5.94
Oxygen (O) [%wt] 37.54
Nitrogen (N) [%wt] 0.41
Sulfur (S) [%wt] 0.09
Ash [%wt] 13.51
H/C = x [mol/mol] 1.665
O/C = y [mol/mol] 0.663
Table 2:Proximate analysis of bagasse (dry basis), determined by thermogravimetric analysis
(Netzsch STA 409 CD)
Volatiles [%wt] 77.3
Fixed carbon [%wt] 12.6
Ash [%wt] 10.2

Pyrolysis 10
10
A higher heating value (HHV) of 11.56 MJ/kg was determined by calorimetric analysis
(Calorimeter C7000, IKA-Werke). The lower heating value (LHV) of 8.97 MJ/kg was calculated
based on the HHV and the elemental composition of the bagasse on a moisture free basis. The
particle size distribution of the bagasse sample, measured by laser scattering (LA-950 analyzer;
HORIBA,) is shown in Figure 4, and indicates a mean particle size of 455 μm. The ultimate
analysis revealed an average chemical formula for bagasse of CH1.665O0.663N0.008S0.001 on a dry
and ash free (d.a.f.) basis. Nitrogen and sulfur were neglected and CH1.665O0.663 was assumed to
adequately represent the sample.
Figure 4: Volume based particle size distribution for bagasse sieved with 1mm sieve.

Pyrolysis 11
11
3.3 Thermogravimetric analysis
The experiments in this chapter were performed with a thermogravimeter system (Netzsch
STA 409 CD) equipped with a furnace that is a conventional high-temperature electric furnace
(Figure 5) with a maximum working temperature of 1823 K. This furnace is suitable for
experiments with controlled reactive gas atmospheres having a dew point below room
temperature.
Figure 5: Cross-sectional schematics of the Netzsch high-temperature furnace
The pyrolysis experiments were performed with dish shaped crucibles that are made of
aluminum oxide (Al2O3) and have an outer diameter of 17 mm. The sample carrier connecting
the crucible with the balance is equipped with a thermocouple type S and measures the
temperature directly at the sample crucible. Bagasse samples were mounted as a thin layer on the
flat sample crucibles and swept by the inert gas flowing through the furnace. This arrangement
avoids stagnant gas around the sample and minimizes mass and heat transfer resistances between
the bagasse sample and the bulk gas [14, 15].
The measuring part of the STA 409 thermogravimeter features a vacuum proof housing
suitable to realize controlled atmospheres such as reactive or inert. The experimental setup
Pyrolysis 12
12
includes a TASC 414 System Controller for temperature programming and data acquisition. The
weight signal from the digital balance and the temperature signal from the sample thermocouple
are recorded with a nominal accuracy of 5 · 10−3 mg and 0.1 K, respectively.
This setup has a single furnace wall and features a bottom up flow. The furnace chamber is
separated from the balance by means of a ceramic radiation shield, and the gas exit is located at
the top end.
The pyrolysis experiments were conducted allowing the investigation of the thermal
decomposition over the whole temperature range from room temperature up to 1473 K. A non-
isothermal (dynamic) temperature program was used starting at 298 K and ramping up with a
linear heating rate, HR = 10 to 30 K/min, to the final pyrolysis temperature of 1473 K.
Experiments are performed with inert sample atmospheres consisting of 100% argon at a flow
rate of 100 mLN/min and a total pressure of 1 bar.
An 8 mg bagasse sample, weighed on an external Mettler Toledo XS105 DualRange high
precision balance was placed as a thin layer on the flat sample crucible stored in the TG furnace.
The furnace chamber was purged for 30 minutes with argon to ensure an inert atmosphere at the
beginning of the experiment. Once this is done, the temperature program was started and
automatically completed by the control system.
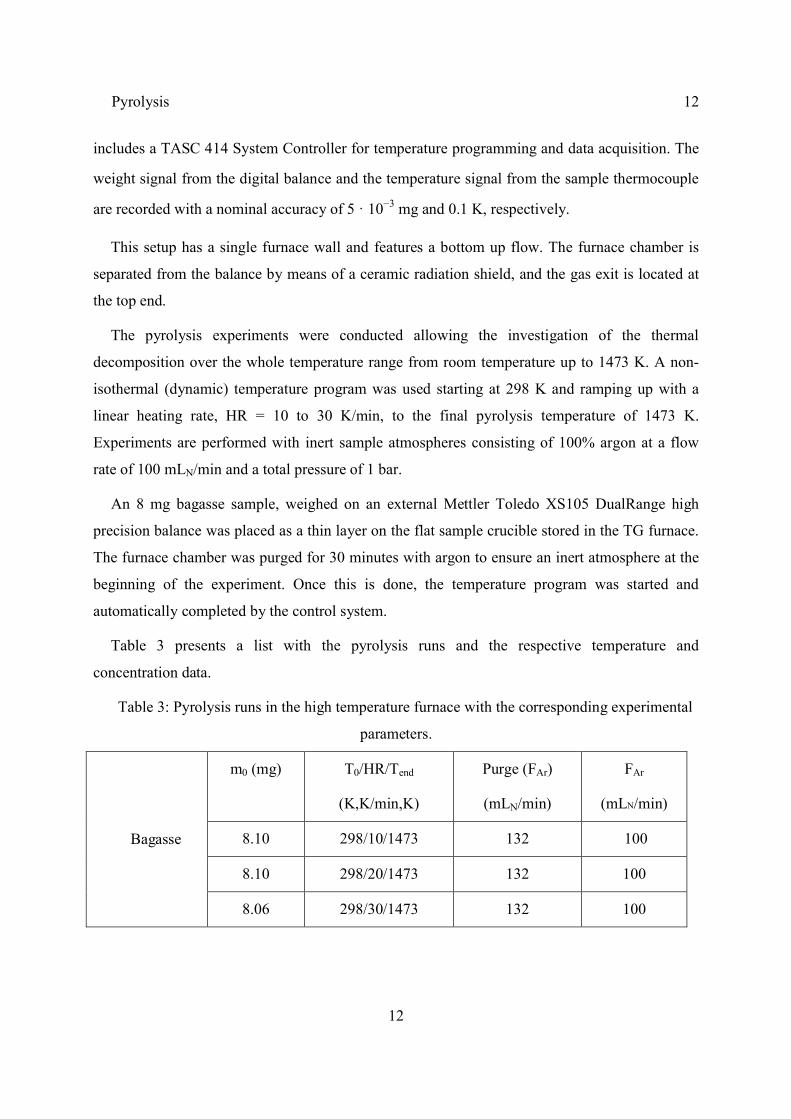
Table 3 presents a list with the pyrolysis runs and the respective temperature and
concentration data.
Table 3: Pyrolysis runs in the high temperature furnace with the corresponding experimental
parameters.
Bagasse
m0 (mg) T0/HR/Tend
(K,K/min,K)
Purge (FAr)
(mLN/min)
FAr
(mLN/min)
8.10 298/10/1473 132 100
8.10 298/20/1473 132 100
8.06 298/30/1473 132 100
Pyrolysis 13
13
3.4 Results and discussion
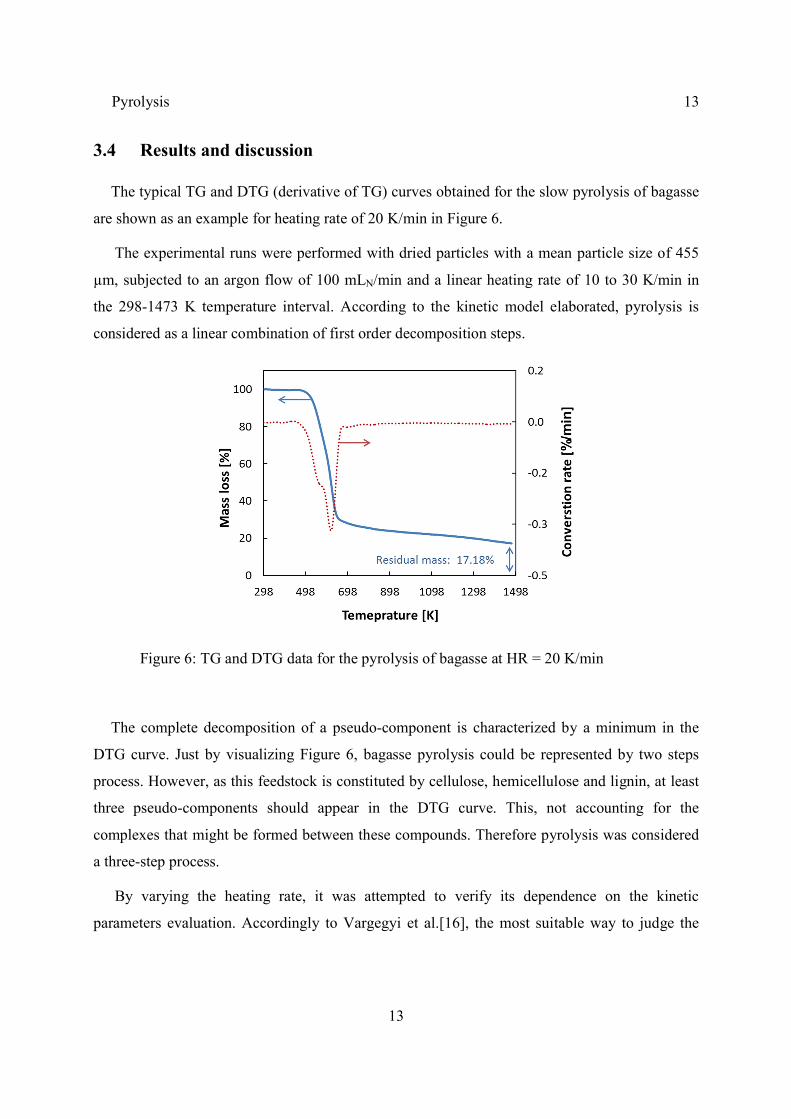
The typical TG and DTG (derivative of TG) curves obtained for the slow pyrolysis of bagasse
are shown as an example for heating rate of 20 K/min in Figure 6.
The experimental runs were performed with dried particles with a mean particle size of 455
µm, subjected to an argon flow of 100 mLN/min and a linear heating rate of 10 to 30 K/min in
the 298-1473 K temperature interval. According to the kinetic model elaborated, pyrolysis is
considered as a linear combination of first order decomposition steps.
Figure 6: TG and DTG data for the pyrolysis of bagasse at HR = 20 K/min
The complete decomposition of a pseudo-component is characterized by a minimum in the
DTG curve. Just by visualizing Figure 6, bagasse pyrolysis could be represented by two steps
process. However, as this feedstock is constituted by cellulose, hemicellulose and lignin, at least
three pseudo-components should appear in the DTG curve. This, not accounting for the
complexes that might be formed between these compounds. Therefore pyrolysis was considered
a three-step process.
By varying the heating rate, it was attempted to verify its dependence on the kinetic
parameters evaluation. Accordingly to Vargegyi et al.[16], the most suitable way to judge the
Pyrolysis 14
14
reliability of the parameters appears to be a comparison of the parameters obtained from
measurements at different heating rates.
The DTG curves of bagasse pyrolysis exhibit a first minimum at 566.6 K, a second, at 601.5
K, and a third at 618.6 K.
The total weight loss during pyrolysis of the bagasse up to 1473 K is around 83%. Figure 6
shows that a residual mass of around 17% is encountered. The latter accounts for the quantity of
char and ash.
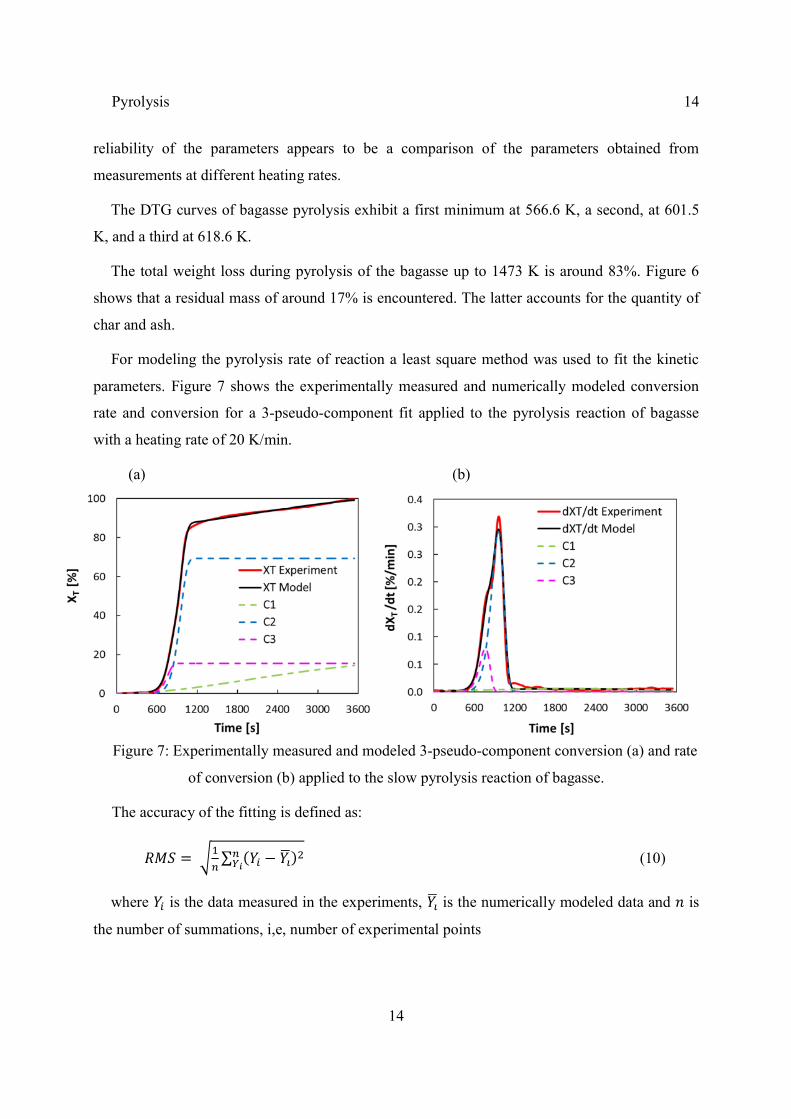
For modeling the pyrolysis rate of reaction a least square method was used to fit the kinetic
parameters. Figure 7 shows the experimentally measured and numerically modeled conversion
rate and conversion for a 3-pseudo-component fit applied to the pyrolysis reaction of bagasse
with a heating rate of 20 K/min.
(a) (b)
Figure 7: Experimentally measured and modeled 3-pseudo-component conversion (a) and rate
of conversion (b) applied to the slow pyrolysis reaction of bagasse.
The accuracy of the fitting is defined as:
= ∑ ( − ) (10)
where is the data measured in the experiments, is the numerically modeled data and is
the number of summations, i,e, number of experimental points
Pyrolysis 15
15
The agreement is reasonably good for the conversion rate and the conversion. The conversion
of pseudo-components C2 and C3 replicates satisfactorily their devolatilization reaction in the
423- 698 K rage. However, C1, which was expected to devolatilize at higher temperatures, did
not demonstrate the same behavior. As Roque-Diaz et al.[17] speculated in bagasse pyrolysis, for
a temperature range of 723-1173 K, the cracking reaction of C-C bonds occurred. The pyrolysis
of bagasse should be finished after that, but as one can see from Figure 6, the reaction continued
and did not finished up to 1473 K, explaining why the pseudo-component C1 did not fulfill the
expectations.
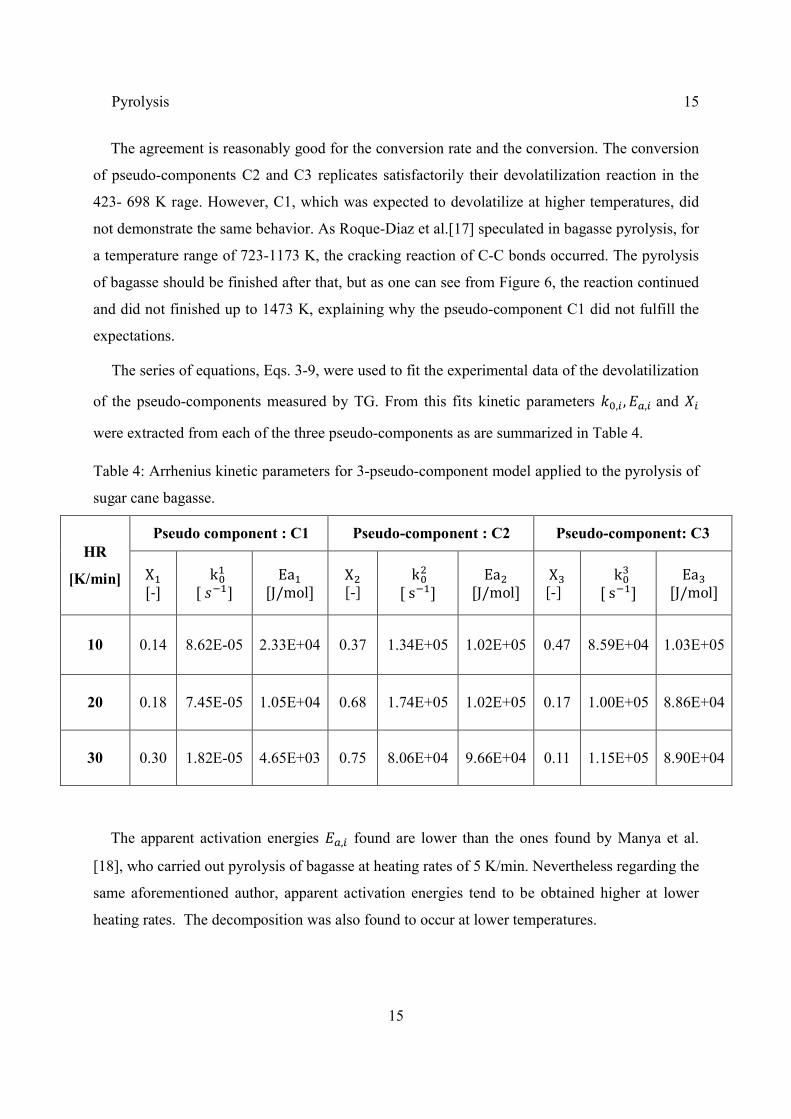
The series of equations, Eqs. 3-9, were used to fit the experimental data of the devolatilization
of the pseudo-components measured by TG. From this fits kinetic parameters , , , and
were extracted from each of the three pseudo-components as are summarized in Table 4.
Table 4: Arrhenius kinetic parameters for 3-pseudo-component model applied to the pyrolysis of
sugar cane bagasse.
HR
[K/min]
Pseudo component : C1 Pseudo-component : C2 Pseudo-component: C3
X [-]
k [ ]
Ea [J/mol]
X [-]
k [s ]
Ea [J/mol]
X [-]
k [s ]
Ea [J/mol]
10 0.14 8.62E-05 2.33E+04 0.37 1.34E+05 1.02E+05 0.47 8.59E+04 1.03E+05
20 0.18 7.45E-05 1.05E+04 0.68 1.74E+05 1.02E+05 0.17 1.00E+05 8.86E+04
30 0.30 1.82E-05 4.65E+03 0.75 8.06E+04 9.66E+04 0.11 1.15E+05 8.90E+04
The apparent activation energies , found are lower than the ones found by Manya et al.
[18], who carried out pyrolysis of bagasse at heating rates of 5 K/min. Nevertheless regarding the
same aforementioned author, apparent activation energies tend to be obtained higher at lower
heating rates. The decomposition was also found to occur at lower temperatures.
Steam gasification 16
16
4 Steam gasification
Gasification of lignocellulosic materials, such as sugar cane bagasse with steam, is a
heterogeneous gas-solid reaction of char, produced primarily by pyrolysis of the carbonaceous
material, and steam. A simplified reaction can be expressed as,
+ ↔ + ∆ = 131 / (11)
The net reaction of the steam gasification is strongly endothermic, thus heat needs to be
supplied. The product of the reaction is mainly hydrogen and carbon monoxide, the so called
syngas or synthesis.
The gasification rate is mainly dependent on temperature and partial pressure of the gaseous
reactants. Due to the exponential dependency of temperature, described by the Arrhenius law, the
influence of temperature is much more evident than the partial pressure of the reactants.
Even if the partial pressure influence is not very notable it is necessary to care about the
concentration and type of the gaseous reactants at the solid surface. Therefore, transport of
reactants from the bulk phase to the core of the solid particles and transport of products the way
back to bulk phase needs to be accounted.
Moreover it is also strongly dependent on the solid surface available for the gas-solid reaction.
As one can imagine the latter reaction may involve complex reactions such as adsorption of the
reactant at the solid surface, surface reaction though molecule complexes, and desorption of
products.
4.1 Models of reaction kinetics
The modeling of heterogeneous gas-solid chemical reactions is complicated by a series of
issues not encountered in homogeneous systems. Since more than one phase is present, rate
equations for heterogeneous reactions often incorporate mass transfer terms in addition to the
usual chemical kinetic term. The mass transfer terms may differ in type and number depending
Steam gasification 17
17
on the shape of the heterogeneous system. A general rate expression that holds for all reacting
system is not available.
It is evident that the gas-solid reaction taking place on a surface must depend on its chemical
adsorption of the fluid reactants. Many features of heterogeneous kinetics of solid-gas reactions
have been explained by this hypothesis and the application of Langmuir’s adsorption isotherm
[19]. For a gas-solid reaction as it is encountered in the steam gasification of bagasse, the
following set of consecutive reaction steps can be identified:
Step I Diffusion of the reactant from the bulk gas through the gas film to the external particle
surface.
Step II Diffusion of the reactant from the particle surface through the pores to a reaction site.
Step IIIA Reactant adsorbs on the surface and is attached to an active site.
Step IIIB Reaction with the solid or a molecule from the gas phase (single site mechanism) or
with an adjacent active site (dual site mechanism).
Step IIIC Desorption of the products from the solid surface.
Step IV Diffusion of the products from the reaction site across the pores to the particle
surface.
Step V Diffusion of the products from the external particle surface to the bulk gas.
Steps I and V describe the mass transfer of gaseous reactants and products across the fluid
film surrounding the bagasse char particle. The structural particle model in Chapter 4.1.1
considers the steps II and IV. Steps IIIA to IIIC are considered by the oxygen-exchange model
and treated in Chapter 4.1.2.
Depending on the physical and chemical boundary conditions of the system such as
temperature, pressure, stoichiometry of the reaction, and solid porosity, different steps from the
list above can become rate controlling since it is always the slowest step that controls the overall
rate of the process. For the measurement chemical, it is desirable to choose the experimental
conditions in order to obtain chemical reaction control, which is usually encountered at low
temperatures. If this is not feasible diffusion effects have to be considered in the model, leading
to undesired complication.
Steam gasification 18
18
It is essential to have a mathematical model that correctly reproduces the physical situation of
the reacting system. A mismatch in the controlled regime for example, can easily result in a
situation where the reaction kinetics have been simulated with an amazing degree of accuracy
and just the same the resulting equations fail to give a correct prediction of a scale-up [20].
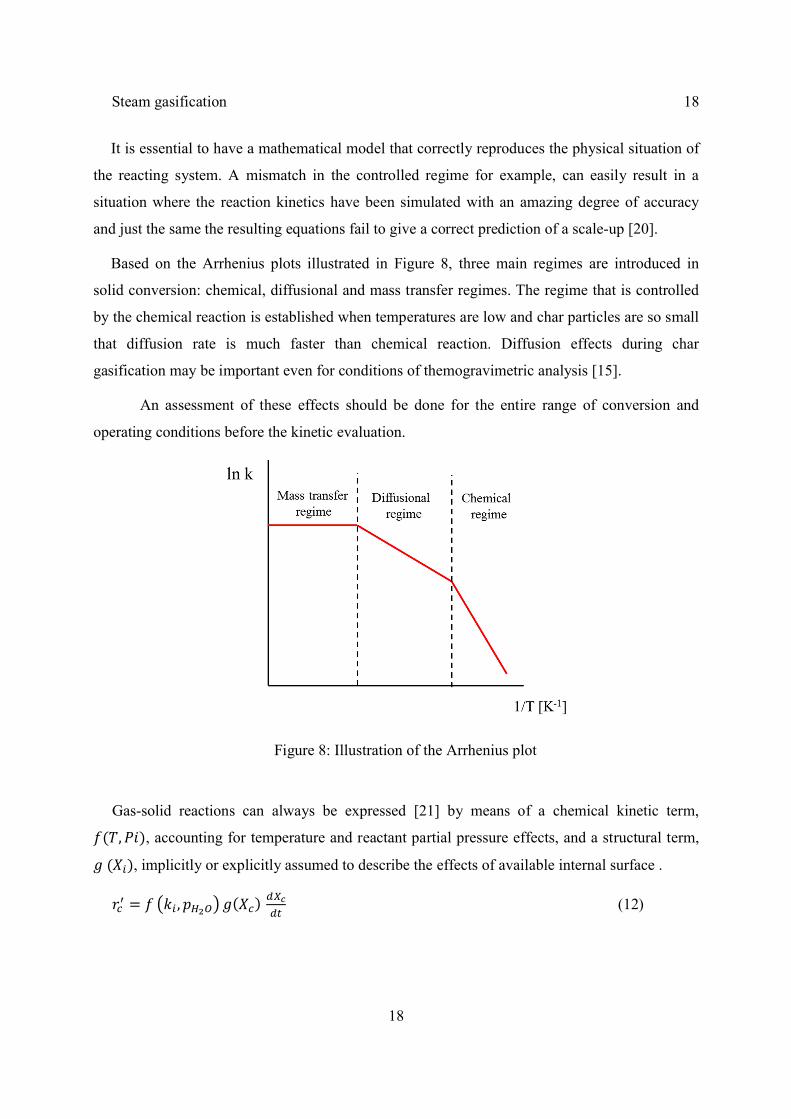
Based on the Arrhenius plots illustrated in Figure 8, three main regimes are introduced in
solid conversion: chemical, diffusional and mass transfer regimes. The regime that is controlled
by the chemical reaction is established when temperatures are low and char particles are so small
that diffusion rate is much faster than chemical reaction. Diffusion effects during char
gasification may be important even for conditions of themogravimetric analysis [15].
An assessment of these effects should be done for the entire range of conversion and
operating conditions before the kinetic evaluation.
Figure 8: Illustration of the Arrhenius plot
Gas-solid reactions can always be expressed [21] by means of a chemical kinetic term,
( , ), accounting for temperature and reactant partial pressure effects, and a structural term,
( ), implicitly or explicitly assumed to describe the effects of available internal surface .
= , ( ) (12)
Steam gasification 19
19
The latter observable reaction rate, Eq.12, for the heterogeneous steam gasification reaction
will be scrutinized in the following chapters concerning the theory of structural effects and
reaction mechanisms.
4.1.1 Structural models for the bagasse char particle
There are two widely applied concepts in modeling of non-catalytic gas-solid reactions: The
progressive-conversion model (PCM) and the shrinking unreacted core model (SCM). The PCM
and SCM models represent two idealizations that mark the extremes with respect to the reaction
behavior of a solid particle and delimit the burn-off characteristics of real particle reacting with a
surrounding fluid [20].
Lately, a significant effort has been put to model parameters to describe the internal solid
matrix (grain model distribution) and its modification taking place during the char conversion
[21], which represents more closely the reality.
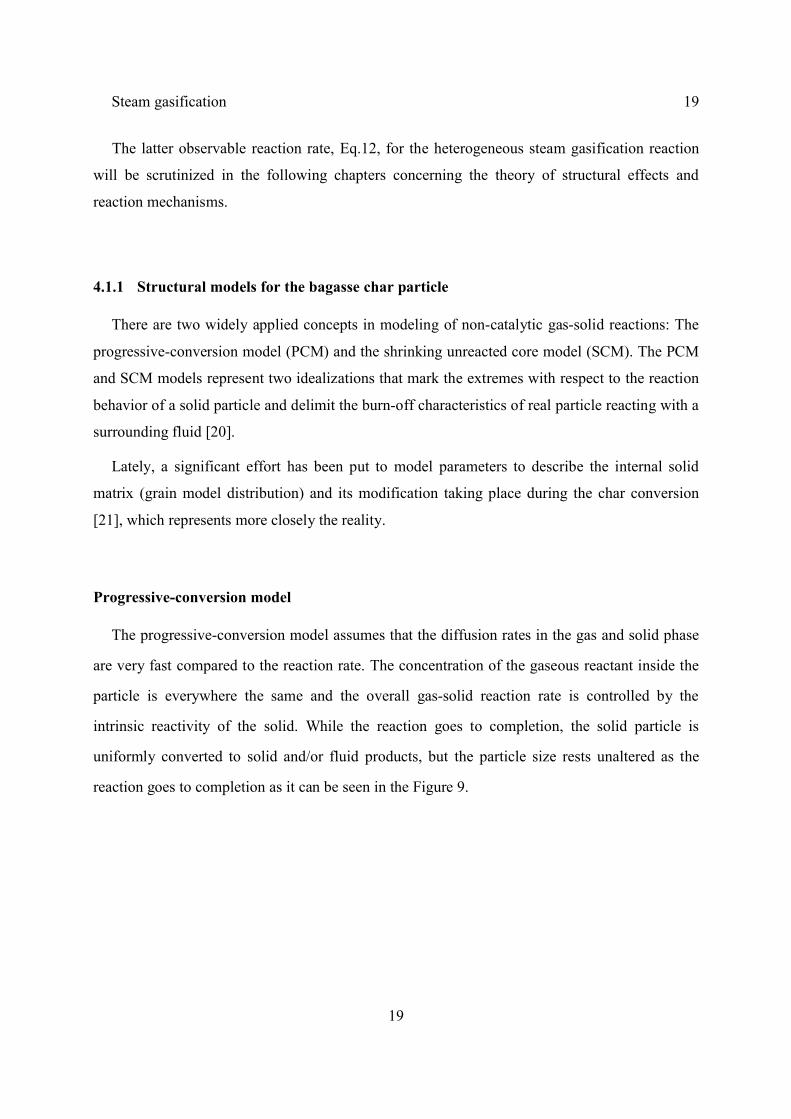
Progressive-conversion model
The progressive-conversion model assumes that the diffusion rates in the gas and solid phase
are very fast compared to the reaction rate. The concentration of the gaseous reactant inside the
particle is everywhere the same and the overall gas-solid reaction rate is controlled by the
intrinsic reactivity of the solid. While the reaction goes to completion, the solid particle is
uniformly converted to solid and/or fluid products, but the particle size rests unaltered as the
reaction goes to completion as it can be seen in the Figure 9.
Steam gasification 20
20
Figure 9: Progessive conversion model. [20].
Shrinking unreacted core model.
The shrinking core model (SCM) applies to non-porous particles and situations where the rate
of reaction is fast compared to the diffusion rate in the solid. The reaction occurs at the outer skin
of the unreacted particle. The reaction zone has the form of a sharp line moving into the solid
and leaving behind completely converted as well as inert material, we refer to these as “ash”.
Two cases are possible:
(1) Shrinking spherical particles: No inert material is present and the solid is converted to a
gas without the formation of residues. When chemical reaction controls, the behavior is
identical to that particles unchanged size.
(2) Spherical particles of unchanged size: For materials with a high content of inert material,
a solid ash layer is formed inhibiting further conversion due to diffusion limitation inside
the particle.
Steam gasification 21
21
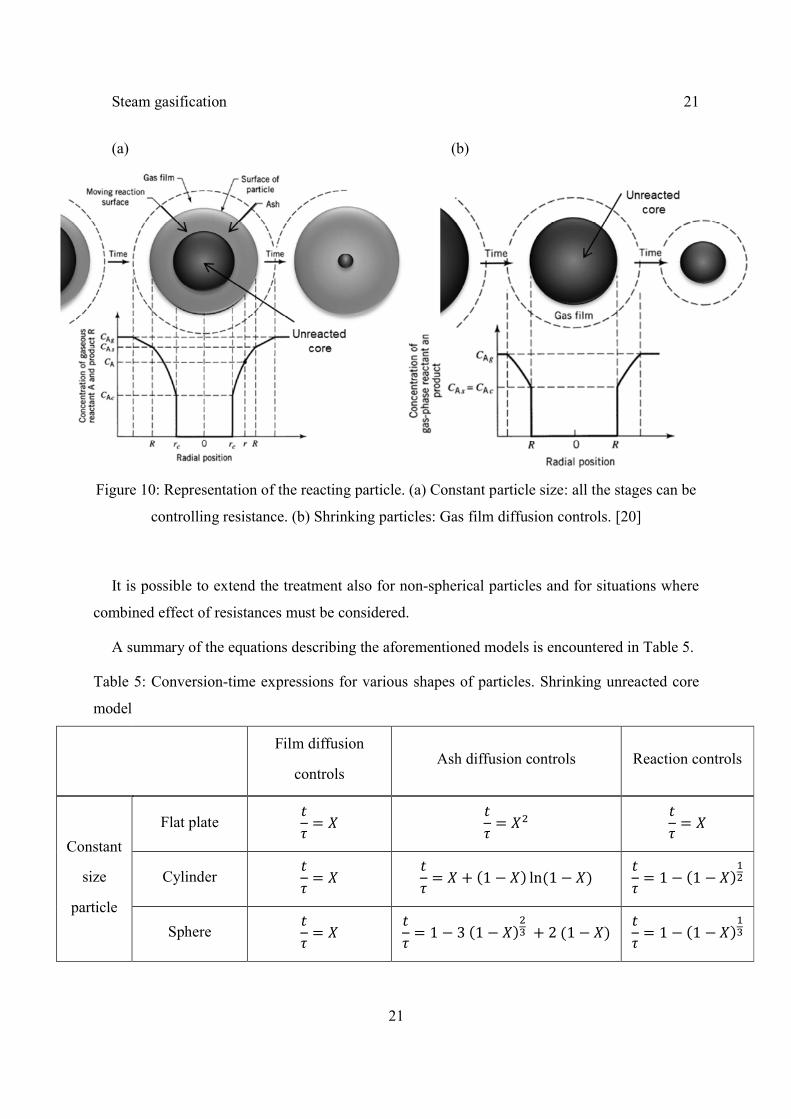
(a) (b)
Figure 10: Representation of the reacting particle. (a) Constant particle size: all the stages can be
controlling resistance. (b) Shrinking particles: Gas film diffusion controls. [20]
It is possible to extend the treatment also for non-spherical particles and for situations where
combined effect of resistances must be considered.
A summary of the equations describing the aforementioned models is encountered in Table 5.
Table 5: Conversion-time expressions for various shapes of particles. Shrinking unreacted core
model
Film diffusion
controls Ash diffusion controls Reaction controls
Constant
size
particle
Flat plate = = =
Cylinder = = + (1 − ) ln(1 − ) = 1 − (1 − )
Sphere = = 1 − 3(1 − ) + 2(1 − ) = 1 − (1 − )

Steam gasification 22
22
Shrinking
sphere
Small particles = 1 − (1 − ) Not applicable = 1 − (1 − )
Large particles = 1 − (1 − ) Not applicable = 1 − (1 − )
Grain model
The basic assumption of the grain model is that the solid behaves like an agglomeration of
smaller units, the so called grains. Figure 11 (a) is a schematic of generic bagasse char particle
considered as an agglomeration of smaller, randomly shaped grains. The individual grains are
modeled as non-porous spheres of uniform sizes (Figure 11 (b)) each of which reacts with the
surrounding accordingly with shrinking core model (Figure 11 (c)).
Figure 11: Schematic of the grain model. (a) Bagasse char particles are assumed to be an
agglomeration of smaller grains. (b) Grains are modeled as spheres. (c) Each of them reacts
individually with the surroundings (SCM).
The heterogeneous char gasification reaction taking place at the external surface of a single
grain unit can be defined as follows:
= − (13)
For a spherical grain, its surface area can be represented as:
= 4 (14)
Steam gasification 23
23
The carbon conversion, , of a single grain depend on the grain radius.
= , ( )
,= 1 − (15)
Rearranging Eq. 15 to isolate radius, the structural term can be expressed in function of the
conversion
= 4 (1 − ) (16)
And therefore, assuming SCM behavior, the gas-solid gasification reaction taking place at the
external surface of the bagasse char particle becomes
= − = ,
( ) (17)
Where is the initial surface area available when = 0(extend of conversion) and 2/3 is
the apparent reaction order.
Grain model distribution
This model presumes the porous particle to be a collection of grains of various sizes. And
therefore, the special case where in which the original grains forming a particle have uniform
size is not applicable, because in real life they consist of a mixture of different size grains. Small
grains react faster while large ones are slowly converted.
Kimura et al. [22] proposed a model where the mean conversion rate of the particles is
considered to have different dependence on the solid reactant in accordance with the magnitude
of the variance of particle size distribution
Assuming the resistance to product layer diffusion in the grain is neglected, the concentration
of the reactant throughout the particle is constant. And the progress of reaction in the grain is
= 1 − (1 − ) (18)
Where τ is the time required to complete the conversion of a grain. Then using a density
function of the size distribution f(τ), the average conversion of the particle can be represented,
= ∫ ( ) + ∫ ( ) (19)
Steam gasification 24
24
Being f(τ) a log-normal distribution expressed as,
( ) =√
− ln /2 (20)
Kimura et al. could develop a relation to the rate of conversion depending on the standard
deviation and the unconverted solid. This relation was made using dimensionless parameters.
=√
exp ∫ (1 − exp(− )) exp − ( )( / ) (21)
Where is the average conversion of the particle, is the dimensionless time / and
= ln( / ̅)/ .
As the average conversion is function of ( ), it is obviously that it also depends on the
standard deviation . Therefore, to better visualize the dependence of the reaction rate of the
solid, the rate of conversion (Eq. 21) was plotted against the unconverted solid, 1 − .
The rate of conversion may be correlated with the unconverted solid by a straight line for
each value of σ up to = 1. This suggested that a power law expression is suitable to represent
the rate of conversion as follows,
= 3 exp (1 − ) (22)
Where is the apparent reaction rate order with reference to the solid. From Eq. 22, it may
be possible to understand that varies accordingly to .
In fact, when = 0 where no deviation occurs, = 2/3, and we come back to the grain
model neglecting diffusional effects. When the standard deviation is around = 0.5, the
apparent reaction appears to be = 1, the same order as if the reaction would behave as
homogeneous one and if the solid would not have influence.
This can be explained by two different approaches, either the grain voids created by pyrolysis
are so big, that reactants can freely enter and react within the particle neglecting the existence of
a neighboring surface, or there is a compensation in rate of consumption between the small and
large grains that considering an overall effect, the outcome will be an apparent order of = 1,
as the small particle reacts faster than the large one.
Steam gasification 25
25
4.1.2 Reaction mechanism
The steam gasification of char takes place according to several steps as reported by Barrio et
al.[23]. They also point out that compared with CO2, H2O gasification is more complicated
because, in addition to the main gasifying agent, the effects of H2, CO2 and CO should also be
taken into account, owing to the equilibrium of the water gas shift reaction.
In the present work one mechanism is considered for the gasification of char with steam, the
so called “oxygen-exchange mechanism” firstly suggested by Ergun [24]. The oxygen-exchange
mechanism postulates the following series of equations:
⟨∗⟩ + ⎯⎯ ⟨ ⟩ + (23. a)
⟨ ⟩ + ⎯⎯⎯ ⟨∗⟩ + (23. b)
⟨ ⟩ ⎯⎯ ⟨∗⟩ + (24)
( , , are Arrhenius rate constants), ⟨∗⟩represents an active carbon site and ⟨ ⟩ a
carbon-oxygen complex. The oxygen-exchange mechanism consists of Eq. 23-24 . Eq. 24 takes
place at higher temperatures through the combination of oxygen and carbon atoms at the surface
of the solid to form CO in gas phase. The latter normally controls the movement towards the
equilibrium; therefore it may be taken as the rate determining step ( ).
The inhibition occurs by recombination of adsorbed oxygen with H2. The dissociative
chemisorption of H2 on the active sites occurs and in this way the active sites become not
accessible for the oxygen transfer with steam.
Assuming elementary reactions, their rates can be directly derived from their reaction
expressions, as functions of their partial pressure in the bulk phase and the fractions of total
number of sites that are vacant, or occupied by the reactants/products, ∗ :
= − ∗ + (25)
= ∗ − (26)
= (27)
Steam gasification 26
26
represents the total concentration of active sites. Conservation of total number of sites
leads to the site balance expression:
1 = + ∗ (28)
Under steady-state conditions, it can be considered sorption equilibrium, i.e, the
concentrations of the vacant sites do not change in time,
= ∗ − − = 0 (29)
From Eq. (24-25), the unknowns , ∗ can be expressed as functions of the rate constants
and partial pressures, resulting:
=
(30)
For steady state conditions the rate of each reaction step equals the overall rate . The
fraction of surface covered with adsorbed oxygen is then substituted in the overall net rate
equation, and dividing by gives the final rate law
= =
(31)
However, during the TG experiments, the gaseous products were constantly swept away from
the reaction site, justifying the simplification = 0 . Thus, the gasification rate depends only
on the steam partial pressure and temperature as follows
=
(32)
In order to describe the whole gas-solid reaction, Eq. 32 should be linked to the structural
model described by Eq.12. The latter equation is dependent on the number of moles of char rate,
and can be related to the char conversion , with respect to the initial number of moles of char
, as
= − = , (33)
The only information required to integrate Eq. 33 is the dependence of the effective char
surface area on the char conversion = ( ). As aforementioned by the “grain

Steam gasification 27
27
model distribution” the rate of char conversion may be correlated with the unconverted solid by
a straight line for each value of σ up to = 1. This suggested that a power law expression is
suitable to represent the effective surface area available with the progress of char conversion
= (1 − ) (34)
Furthermore, Jovanovic [25] has demonstrated that for wide grain size distribution, a linear fit
( = 1) may be a reasonable approximation. Without trustful information about the effective
grain size distribution of char particles, the latter was assumed as the initial guess. Combining
Eqs. (32-34) with = 1, the overall net gasification rate becomes,
=
= , (35)
According to the fact that ash is present and ash-carbon structure is an unknown, the initial
effective surface area participating in the gasification per mole of char remains also unknown.
Thus, , , and are lumped together into the apparent reaction rate with apparent rate
constants and as follows
= ,
=
= (36)
where,
=,
(37)
Where and in Eq. 36 are described by means of Arrhenius parameters, pre-exponential
factor and activation energy .
Steam gasification 28
28
4.2 Sample preparation and characterization
The bagasse passed through two different pyrolysis treatments before the steam gasification
experiments. The slow pyrolysis, where the heating rate was maintained constant to 30 K/min
and the rapid pyrolysis where the heating rate can reach up to 30’000 K/min.
The treatment conditions in pyrolysis determine the char yield and char reactivity. Those are
important for the capacity of the gasifier. Reaching the lowest char yield and the highest char
reactivity in pyrolysis is advantageous for gasification [26, 27]. It is believed that high heating
rates result in less char formation but also more reactive in gasification. Therefore, in order to
have more information about this behavior, bagasse was treated with high and low heating rates.
4.2.1 Sample preparation
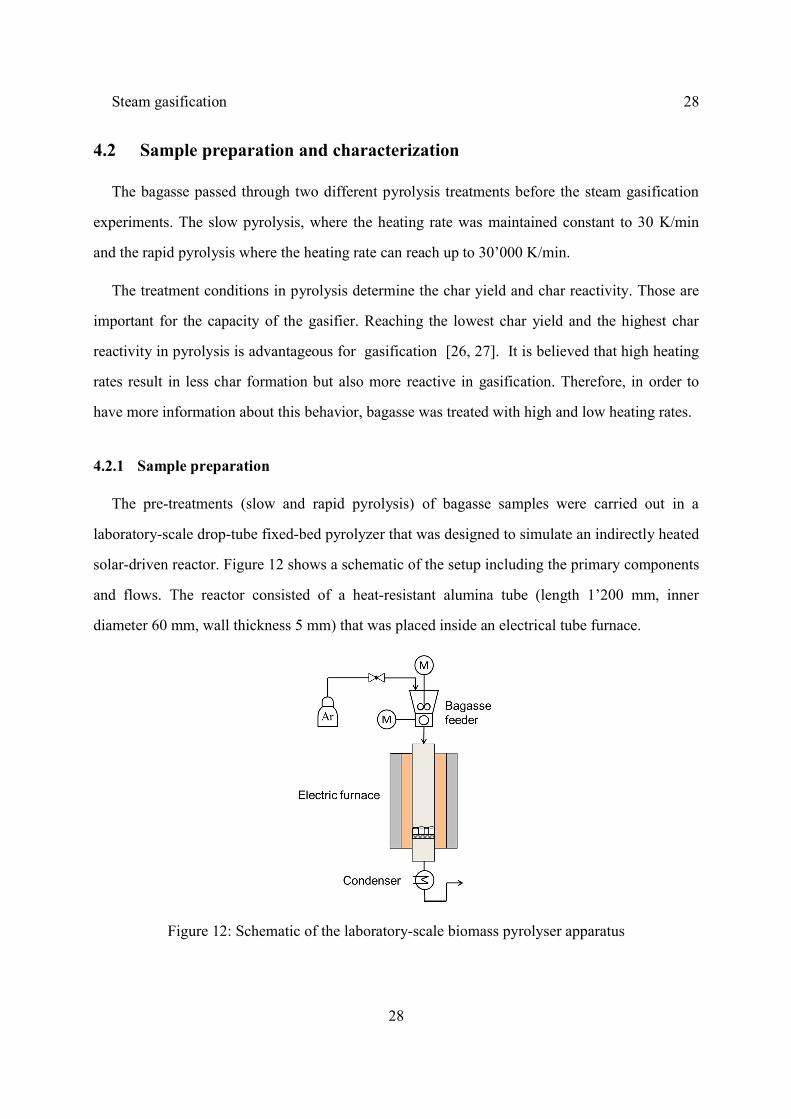
The pre-treatments (slow and rapid pyrolysis) of bagasse samples were carried out in a
laboratory-scale drop-tube fixed-bed pyrolyzer that was designed to simulate an indirectly heated
solar-driven reactor. Figure 12 shows a schematic of the setup including the primary components
and flows. The reactor consisted of a heat-resistant alumina tube (length 1’200 mm, inner
diameter 60 mm, wall thickness 5 mm) that was placed inside an electrical tube furnace.
Figure 12: Schematic of the laboratory-scale biomass pyrolyser apparatus
Steam gasification 29
29
A ceramic grate was placed at the hot zone of the tube to create a fixed bed where the char
particles were collected. The flow rates of the inlet gases were controlled with electronic mass
flow controllers (Bronkhorst). The product gas stream was cooled to remove condensable
components and particulate matter [28].
Prior to each experiment, the reactor was purged with argon to remove oxygen in order to
have an inert atmosphere.
Rapid pyrolysis
Both rapid and slow pyrolysis were performed in the electric furnace shown Figure 12. Empty
ceramic pans were placed over a grade in the hot zone of the reactor in order to collect the
reacted particles.
A screw feeder with a hopper filled with the dried bagasse was placed at the top of the reactor
tube. Argon was injected into the hopper to prevent backflow of gaseous products into the
feeding system.
After purging, 0.1 LN/min1 of argon was injected into the feeder and argon flow of 1 LN/min
was established inside of the reactor. The reactor was preheated to the desired temperature (1273
K). After 15 min of equilibration, bagasse was fed at an average rate of around 17 mg/s.
Finished the pyrolysis, the reactor was cooled down, and the pyrolyzed samples were
removed from the reactor. Even if the pyrolyzed sample theoretically became hydrophobic, they
were placed in an oven at 376 K, and kept there until the steam gasification experiment.
Slow pyrolysis
Ceramic pans were full filled with dried bagasse and placed over a grade inside of the reactor
hot zone. The reactor was closed and after the purge, argon flow of 1 LN/min was established.
1 standard pressure and temperature
Steam gasification 30
30
The reactor started to be heated up from 298 K with a constant heating rate of 30 K/min until
1273 K.
Finished the pyrolysis reaction, in both cases (rapid and slow pyrolysis), the reactor was
cooled down, and the pyrolyzed samples were removed from the reactor. The same procedure as
rapid pyrolysis pos-treatment was kept.
4.2.2 Bagasse char characterization
The composition of slow and rapid-pyrolyzed bagasse are also expressed in terms of ultimate
analyses. Data analyses are shown in Table 6.
Table 6: Ultimate analysis of bagasse char (dry basis); C, H, N determined with CHN-900, O
with RO-478 and S with CHNS-932 (all LECO Corporation, St. Joseph, MI)
Rapid pyrolyzed char Slow pyrolyzed char
Carbon (C) [%wt] 29.50 46.72
Hydrogen (H) [%wt] 0.60 0.10
Oxygen (O) [%wt] 5.53 5.96
Nitrogen (N) [%wt] 0.17 0.43
Sulfur (S) [%wt] 0.12 0.11
Ash [%wt] 64.08 46.70
With the information of ash content of both slow and rapid-pyrolyzed bagasse from the
ultimate analysis and their remaining volatile content after the pyrolysis realized in the electric
furnace setup, it was possible to calculate their char yield and total volatile production under
different treatment conditions in pyrolysis. This information is listed in Table 7.
Steam gasification 31
31
Table 7: Char yield for different treatments, rapid and slow pyrolysis (dry and ash free basis)
Rapid pyrolyzed char Slow pyrolyzed char
Volatiles [%wt] 93.71 90.16
Fixed carbon [%wt] 6.28 9.84
One can see from the table above that rapid pyrolysis produces less char than slow pyrolysis
Morphology
Figure 13 (a) and (b) shows a scanning electron micrograph (SEM) of bagasse char particles
which undertook slow pyrolysis, magnified 600 and 1000 times. At the former magnification,
pores are deceptively recognized, but at the latter magnification, it is possible to observe that the
surface of the particle is pretty flat, having very little porous, which is expected to decrease the
reactivity in the gasification
Figure 13 (c) and (d) shows a scanning electron micrograph (SEM) of bagasse char particles
which undertook rapid pyrolysis, magnified 600 and 1000 times. From both magnifications it is
possible to observe that rapid char particles have higher porosity compared to the ones in Figure
13 (a) and (b). These particles have low surface area, seen from the Table 8, and a non-uniform
porous structure with a large central void surrounded by a thin shell. These macro-porous
facilitate the reactants to reach the inner part of the grains and in consequence the reactivity in
gasification is increased.

Steam gasification 32
32
(a) (b)
(c) (d)
Figure 13: SEM micrographs of bagasse char particles. (a) and (b) bagasse particle that
suffered slow pyrolysis 600 and 1000 times magnified respectively, (c) and (d) bagasse particles
that suffered rapid pyrolysis 600 and 1000 times magnified respectively
Table 8: BET surface area report
Bagasse Rapid pyrolysed char Slow pyrolysed char
BET surface area [m2/g] 6.70 ± 0.17 20.40 ± 0.04 159.62 ± 2.08
Steam gasification 33
33
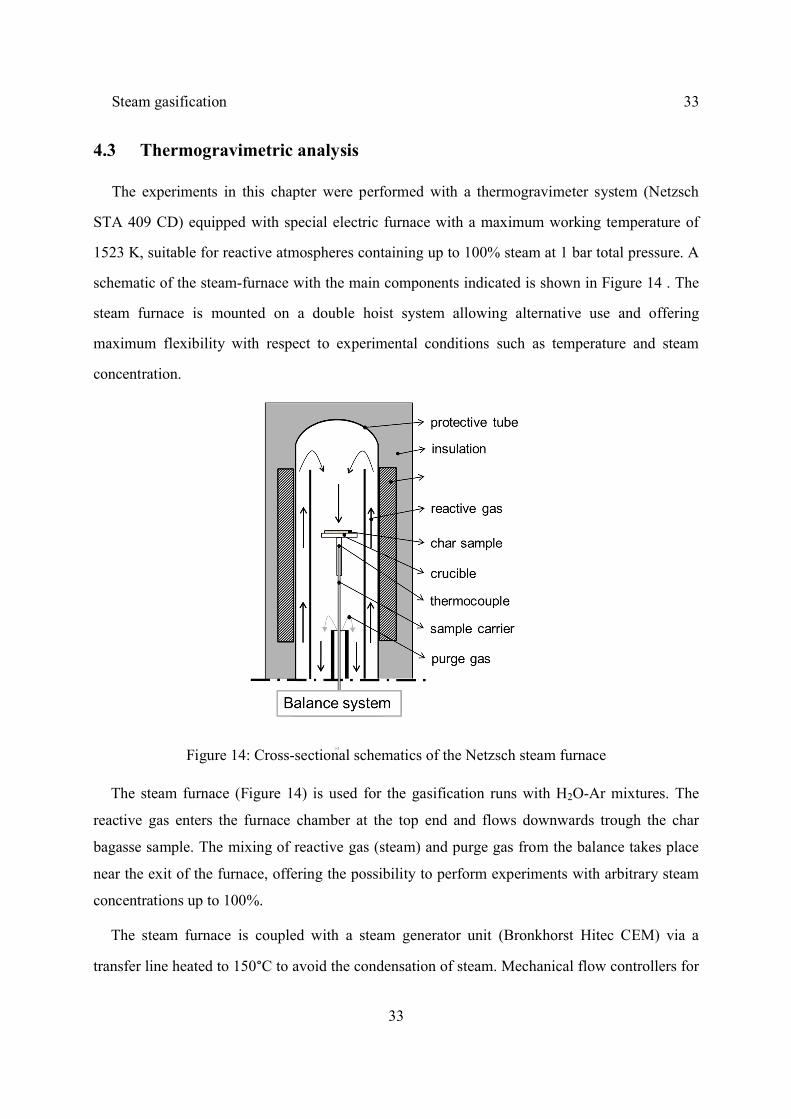
4.3 Thermogravimetric analysis
The experiments in this chapter were performed with a thermogravimeter system (Netzsch
STA 409 CD) equipped with special electric furnace with a maximum working temperature of
1523 K, suitable for reactive atmospheres containing up to 100% steam at 1 bar total pressure. A
schematic of the steam-furnace with the main components indicated is shown in Figure 14 . The
steam furnace is mounted on a double hoist system allowing alternative use and offering
maximum flexibility with respect to experimental conditions such as temperature and steam
concentration.
Figure 14: Cross-sectional schematics of the Netzsch steam furnace
The steam furnace (Figure 14) is used for the gasification runs with H2O-Ar mixtures. The
reactive gas enters the furnace chamber at the top end and flows downwards trough the char
bagasse sample. The mixing of reactive gas (steam) and purge gas from the balance takes place
near the exit of the furnace, offering the possibility to perform experiments with arbitrary steam
concentrations up to 100%.
The steam furnace is coupled with a steam generator unit (Bronkhorst Hitec CEM) via a
transfer line heated to 150°C to avoid the condensation of steam. Mechanical flow controllers for
Steam gasification 34
34
Ar (Vögtlin Q-FLOW) and electronic flow controllers for water (Bronkhorst LIQUI-FLOW) are
used to set the mass flow rates and the steam concentration in the reactive gas.
The experimental procedure of a gasification experiment with steam is rather similar to the
pyrolysis run described in Chapter 3.2. The main difference is that experiments with the steam
furnace have a bigger cycle time and are complicated by the operation of the steam generator and
additional heaters that take longer to reach thermal equilibrium.
For the latter reason a special temperature program was used. Primarily, as usual, a “dynamic”
pre-heating of the system is done with a constant heating rate of 30 K/min from room
temperature to the desired temperature of gasification. Before reaching the starting point of
gasification, the heating rate was gradually decreased from 30 to 1 K/min to reach faster the
thermal equilibrium and avoid temperature overshooting. As soon as the thermobalance finished
the automatic preheating sequence and equilibration, the steam valve was opened manually to
feed the reactant to the furnace. The temperature is then kept constant and instantaneously the
gasification reaction starts to take place. Isothermal data are thus used to evaluate the reaction
kinetics.
The steam flow was controlled by a temperature safety valve and started to be generated only
when the furnace reached a minimum temperature of 423 K.
To eliminate the buoyancy effect, all the experiments were repeated with the empty crucible
(correction) and a baseline was thus obtained for the TG–DTG analysis. Prior to all experiments
the crucible was oven dried in order not to have humidity of the air condensed over the pan
where the dried sample laid.
Since the off-gas contained a considerable amount of water depending on the chosen
composition of the reactive gas, a cooler was used after the thermobalance to condensate excess
steam. This had to be done to protect the micro GC from contamination with liquid water. The
water concentration in the off-gas could therefore not be measured.
The experiments of steam gasification were designed in the nearest way possible to what will
occur inside of the solar reactor in order to take advantage of the kinetic data here simulated.
Rapid and slow-pyrolyzed char were tested. Both experiments were carried out at a steam
Steam gasification 35
35
concentration of 75%-vol in the temperature range 1173-1473 K. To assess the dependency on
reactant concentration further experimental data just with rapid-pyrolyzed bagasse was collected
at steam concentrations between 25 to 75%-vol at a temperature of 1273 K.
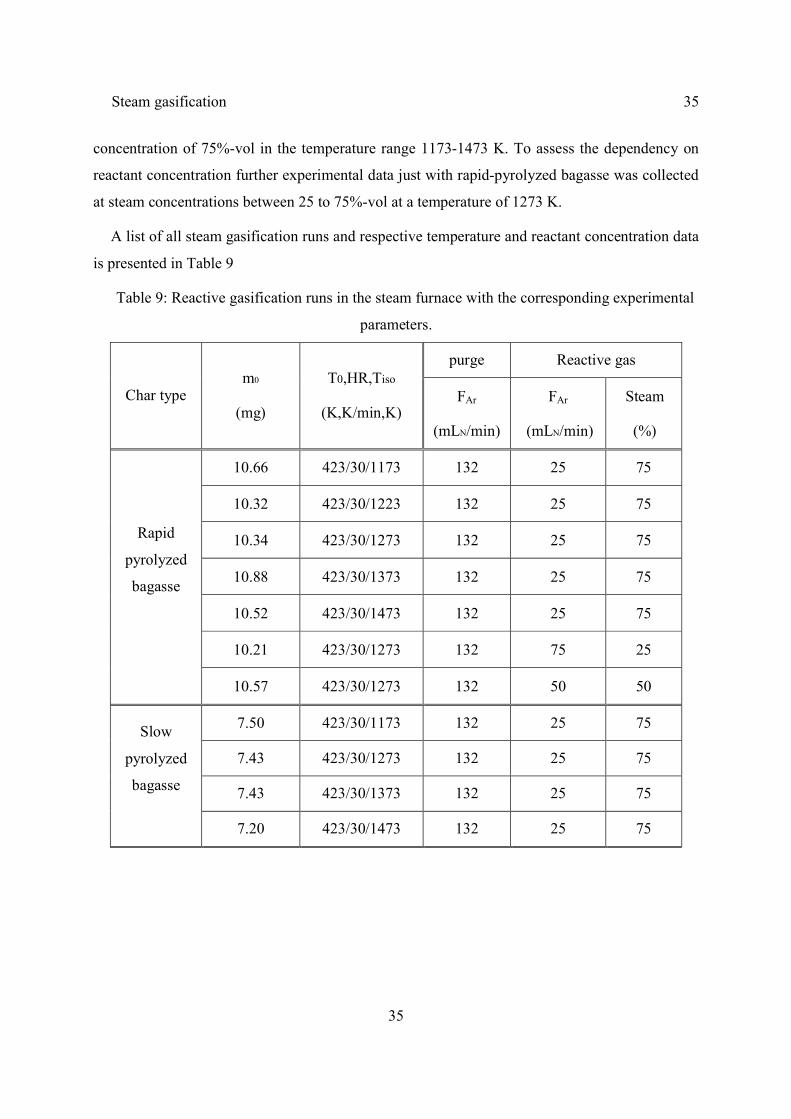
A list of all steam gasification runs and respective temperature and reactant concentration data
is presented in Table 9
Table 9: Reactive gasification runs in the steam furnace with the corresponding experimental
parameters.
Char type m0
(mg)
T0,HR,Tiso
(K,K/min,K)
purge Reactive gas
FAr
(mLN/min)
FAr
(mLN/min)
Steam
(%)
Rapid
pyrolyzed
bagasse
10.66 423/30/1173 132 25 75
10.32 423/30/1223 132 25 75
10.34 423/30/1273 132 25 75
10.88 423/30/1373 132 25 75
10.52 423/30/1473 132 25 75
10.21 423/30/1273 132 75 25
10.57 423/30/1273 132 50 50
Slow
pyrolyzed
bagasse
7.50 423/30/1173 132 25 75
7.43 423/30/1273 132 25 75
7.43 423/30/1373 132 25 75
7.20 423/30/1473 132 25 75
Steam gasification 36
36
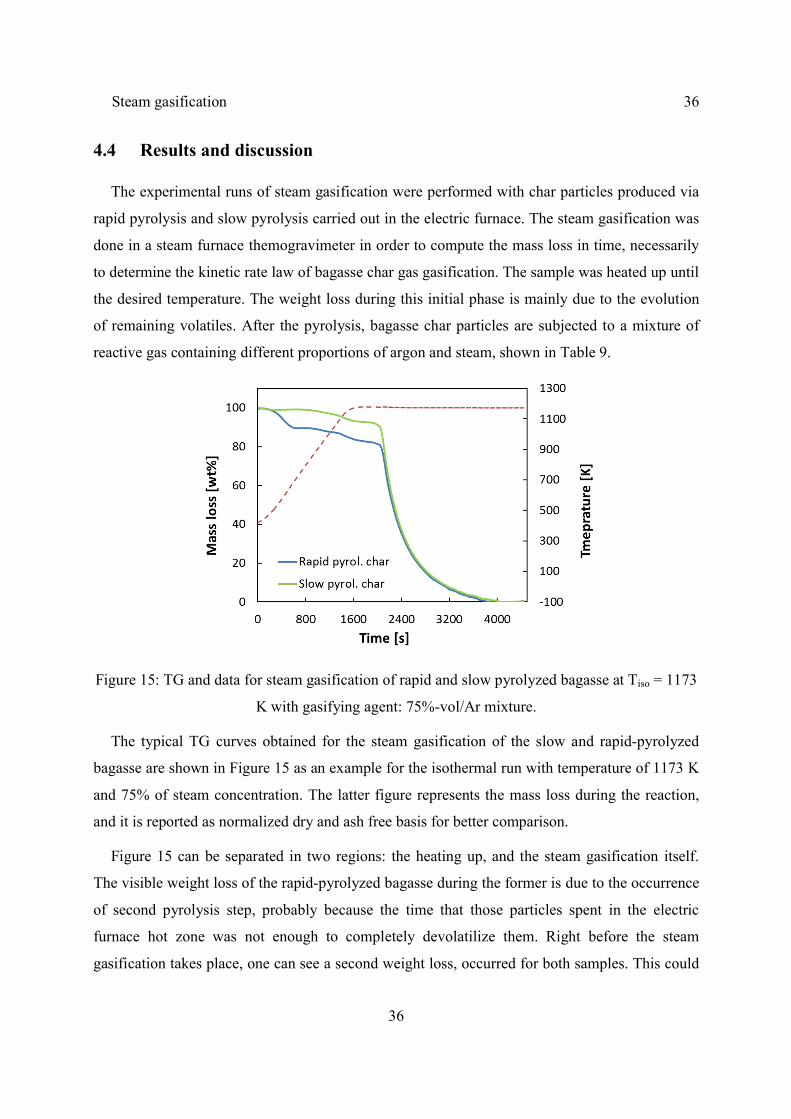
4.4 Results and discussion
The experimental runs of steam gasification were performed with char particles produced via
rapid pyrolysis and slow pyrolysis carried out in the electric furnace. The steam gasification was
done in a steam furnace themogravimeter in order to compute the mass loss in time, necessarily
to determine the kinetic rate law of bagasse char gas gasification. The sample was heated up until
the desired temperature. The weight loss during this initial phase is mainly due to the evolution
of remaining volatiles. After the pyrolysis, bagasse char particles are subjected to a mixture of
reactive gas containing different proportions of argon and steam, shown in Table 9.
Figure 15: TG and data for steam gasification of rapid and slow pyrolyzed bagasse at Tiso = 1173
K with gasifying agent: 75%-vol/Ar mixture.
The typical TG curves obtained for the steam gasification of the slow and rapid-pyrolyzed
bagasse are shown in Figure 15 as an example for the isothermal run with temperature of 1173 K
and 75% of steam concentration. The latter figure represents the mass loss during the reaction,
and it is reported as normalized dry and ash free basis for better comparison.
Figure 15 can be separated in two regions: the heating up, and the steam gasification itself.
The visible weight loss of the rapid-pyrolyzed bagasse during the former is due to the occurrence
of second pyrolysis step, probably because the time that those particles spent in the electric
furnace hot zone was not enough to completely devolatilize them. Right before the steam
gasification takes place, one can see a second weight loss, occurred for both samples. This could

Steam gasification 37
37
be explained by a probable leaking of oxygen inside of the steam furnace, originating a slightly
consumption of the solids by combustion. Steam was fed to the furnace after the equilibration of
the desired temperature was reached; instantaneously the steam gasification started and
converted the char into gases, leaving behind just an inert material called ash.
These experiments were used for modeling the steam gasification rate of reaction accounting
for a structural and a kinetic term dependent on temperature and reactants partial pressure.
4.4.1 Structural term
The structural term of the steam gasification rate law was modeled by the grain model. The
possibility of particles being represented as either spheres or flat plate and cylinder, as well as if
film diffusion, ash layer diffusion or reaction at the surface controlled the process was
investigated.
The assumption of having solid particles constituted of an agglomeration of smaller uniform
units called grains that behave as non-porous particles and reacts individually with its
surrounding following shrinking-core model (SCM) was kept as fundamental consideration.
In order to fit the equations from Table 5 to the experimental data collected by the
thermogravimetric runs a least square routine was done my minimizing the parameters τ and Δt.
τ is the time required for the full conversion of the char particles and Δt is the time elapsed to
reach the experimental starting point of the char conversion , since this did not began from a
time zero. Two minimization methods were used. Either the fit was minimized in or in
direction,
∑ ( . + ∆ ) − ∑ ∆ − (38)
Steam gasification 38
38
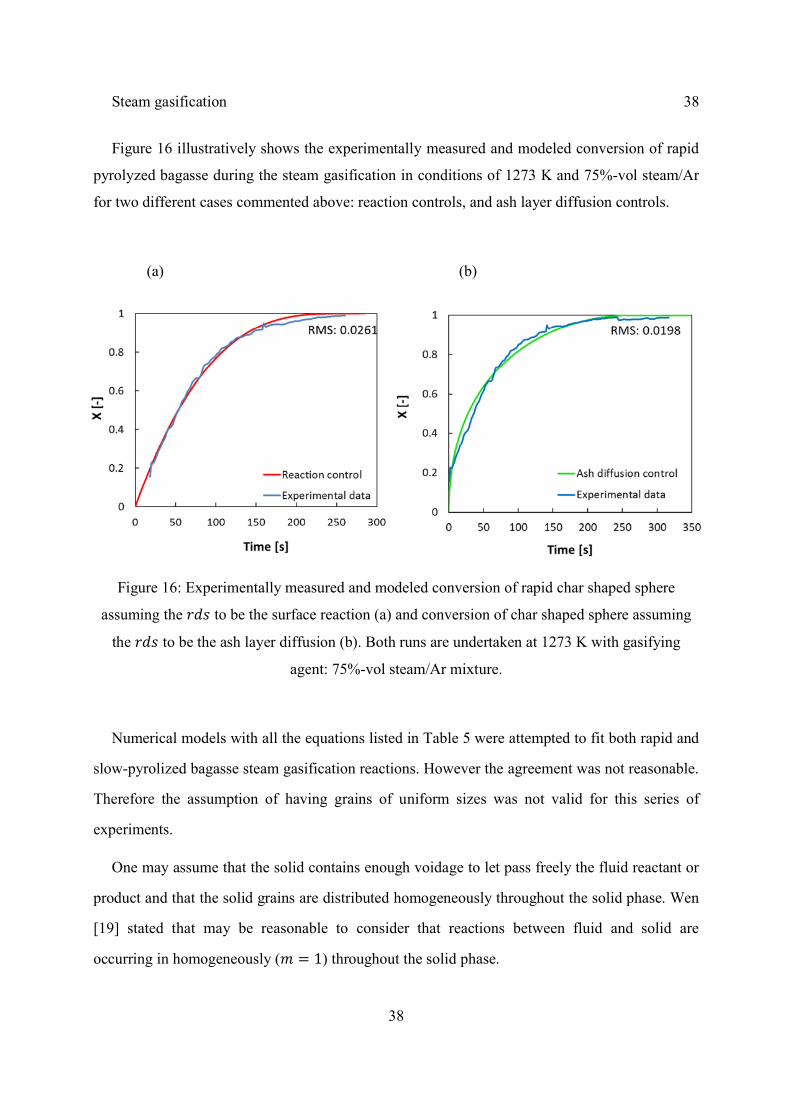
Figure 16 illustratively shows the experimentally measured and modeled conversion of rapid
pyrolyzed bagasse during the steam gasification in conditions of 1273 K and 75%-vol steam/Ar
for two different cases commented above: reaction controls, and ash layer diffusion controls.
(a) (b)
Figure 16: Experimentally measured and modeled conversion of rapid char shaped sphere
assuming the to be the surface reaction (a) and conversion of char shaped sphere assuming
the to be the ash layer diffusion (b). Both runs are undertaken at 1273 K with gasifying
agent: 75%-vol steam/Ar mixture.
Numerical models with all the equations listed in Table 5 were attempted to fit both rapid and
slow-pyrolized bagasse steam gasification reactions. However the agreement was not reasonable.
Therefore the assumption of having grains of uniform sizes was not valid for this series of
experiments.
One may assume that the solid contains enough voidage to let pass freely the fluid reactant or
product and that the solid grains are distributed homogeneously throughout the solid phase. Wen
[19] stated that may be reasonable to consider that reactions between fluid and solid are
occurring in homogeneously ( = 1) throughout the solid phase.
Steam gasification 39
39
On the other hand Kimura et al. [22] suggests a power law expression (Eq. 22) to represent
the conversion of particles consisted of grains with a distribution of sizes, this model is called
“grain model distribution”. The latter model was not applied to the experiments since no trustful
information about the effective grain size distribution of char particles were known. Nevertheless
Jovanovic [25] has demonstrated that for wide grain size distribution, a linear fit ( = 1) may be
a reasonable approximation.
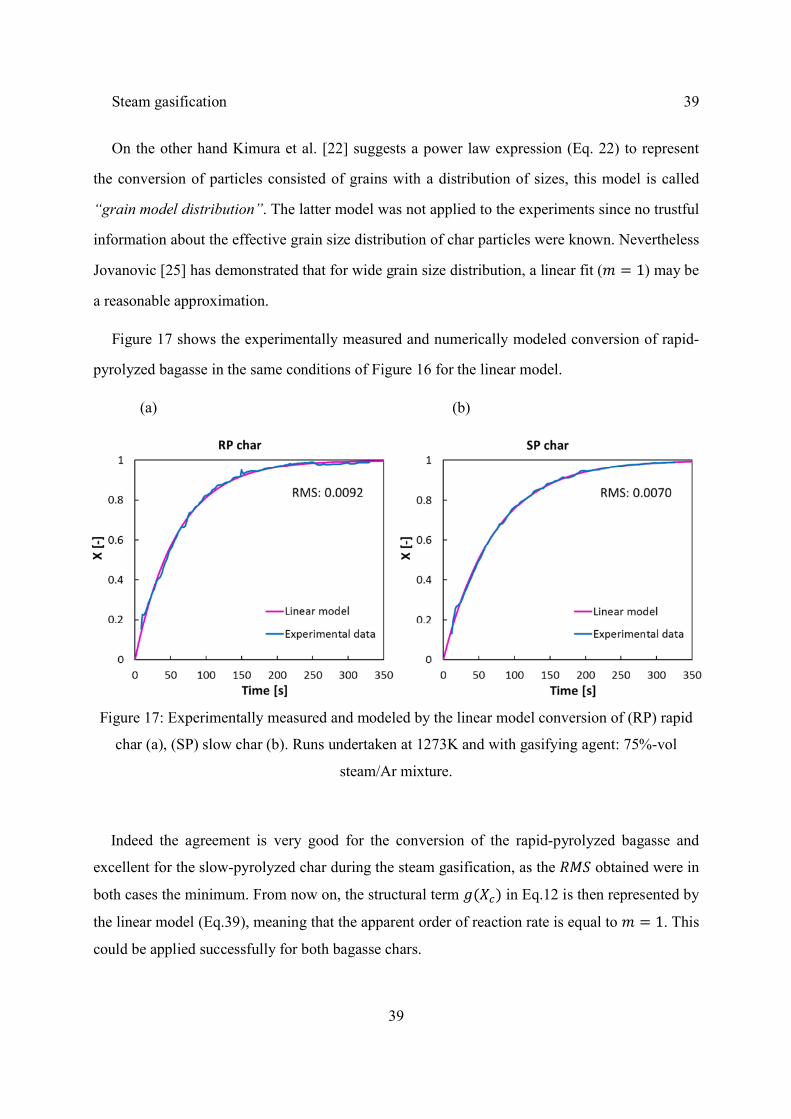
Figure 17 shows the experimentally measured and numerically modeled conversion of rapid-
pyrolyzed bagasse in the same conditions of Figure 16 for the linear model.
(a) (b)
Figure 17: Experimentally measured and modeled by the linear model conversion of (RP) rapid
char (a), (SP) slow char (b). Runs undertaken at 1273K and with gasifying agent: 75%-vol
steam/Ar mixture.
Indeed the agreement is very good for the conversion of the rapid-pyrolyzed bagasse and
excellent for the slow-pyrolyzed char during the steam gasification, as the obtained were in
both cases the minimum. From now on, the structural term ( ) in Eq.12 is then represented by
the linear model (Eq.39), meaning that the apparent order of reaction rate is equal to = 1. This
could be applied successfully for both bagasse chars.

Steam gasification 40
40
= , (1 − ) (39)
4.4.2 Kinetic term
Lastly, what is missing to complete the evaluation of the steam gasification rate of reaction is
the kinetic term, which depends on temperature and partial pressure of the reactants.
The temperature dependence is expressed by the activation energy, , and pre-exponential
factor, , of the apparent constant rate as it follows Arrhenius law a. By the least square routine
applied before, for each experiment with a different , it was possible to calculate their
reaction rate constants. Figure 18 illustrates the linearized Arrhenius plot and the experimental
determined apparent rate constants.
(a) (b)
Figure 18: Experimentally determined and modeled reaction rate constants for (RP) rapid char
(a), and (SP) slow char (b). Runs in the range of 1173 to 1473 K and with gasifying agent: 75%-
vol steam/Ar mixture.
Considering a linear contribution for the reactant partial pressure, the Arrhenius plot (Figure
18) shows that the rate constants are in agreement with the model for low temperatures.
Steam gasification 41
41
Comparing the latter figure with Figure 8 it is possible to claim that for temperatures up to 1273
K the regime controlling the reaction is the reaction at the surface (Regime I). However, when
increasing the temperature, the slope of the experimental data decreases and deviates from
Regime I. Thus the reaction appears to be influenced by diffusional effects. Accordingly to O.
Levenspiel [20], for catalytic solid reactions, if the curve slope is half of the value of the curve
slope at chemical controlling regime, strong pore resistance exists.
In any case, for the present analysis diffusion limitation was neglected since the deviation
reported in Figure 18 was not enough to make decisive conclusions. Besides, we are performing
non-catalytic solid reactions. Therefore, only data from Regime I was used to compute the
kinetics parameters, activation energy, , and pre-exponential factor, .
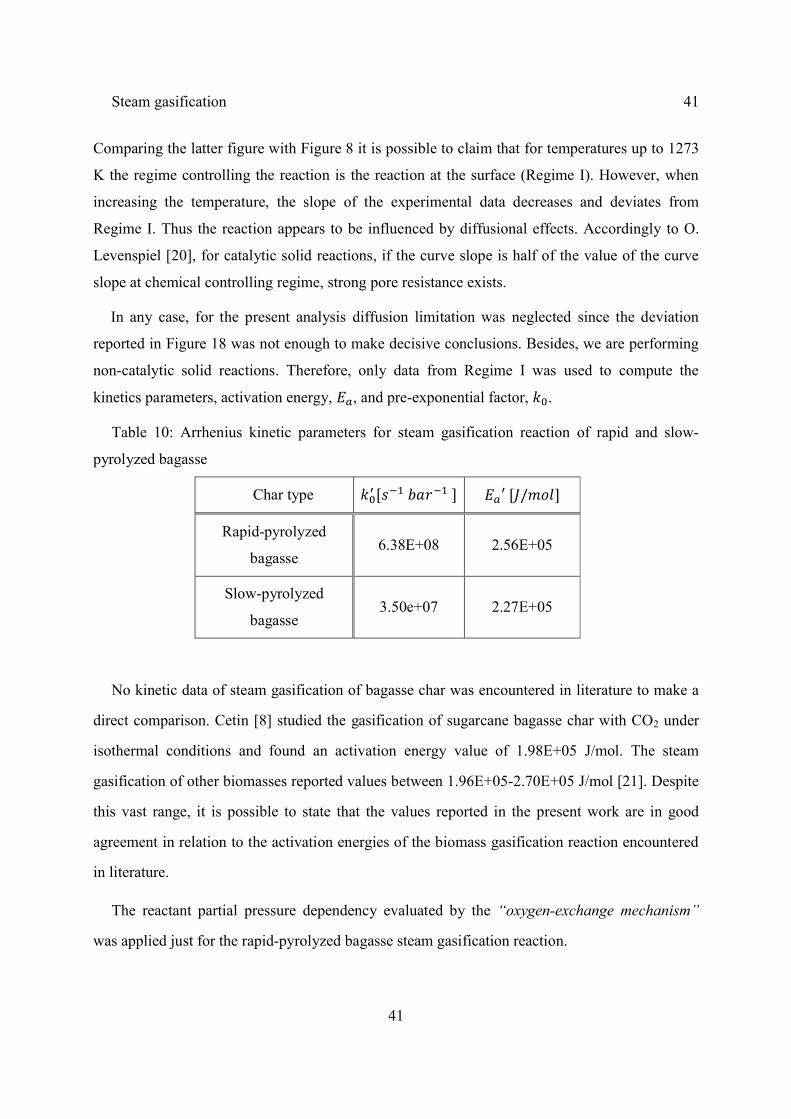
Table 10: Arrhenius kinetic parameters for steam gasification reaction of rapid and slow-
pyrolyzed bagasse
Char type [ ] ′[ / ]
Rapid-pyrolyzed
bagasse 6.38E+08 2.56E+05
Slow-pyrolyzed
bagasse 3.50e+07 2.27E+05
No kinetic data of steam gasification of bagasse char was encountered in literature to make a
direct comparison. Cetin [8] studied the gasification of sugarcane bagasse char with CO2 under
isothermal conditions and found an activation energy value of 1.98E+05 J/mol. The steam
gasification of other biomasses reported values between 1.96E+05-2.70E+05 J/mol [21]. Despite
this vast range, it is possible to state that the values reported in the present work are in good
agreement in relation to the activation energies of the biomass gasification reaction encountered
in literature.
The reactant partial pressure dependency evaluated by the “oxygen-exchange mechanism”
was applied just for the rapid-pyrolyzed bagasse steam gasification reaction.
Steam gasification 42
42
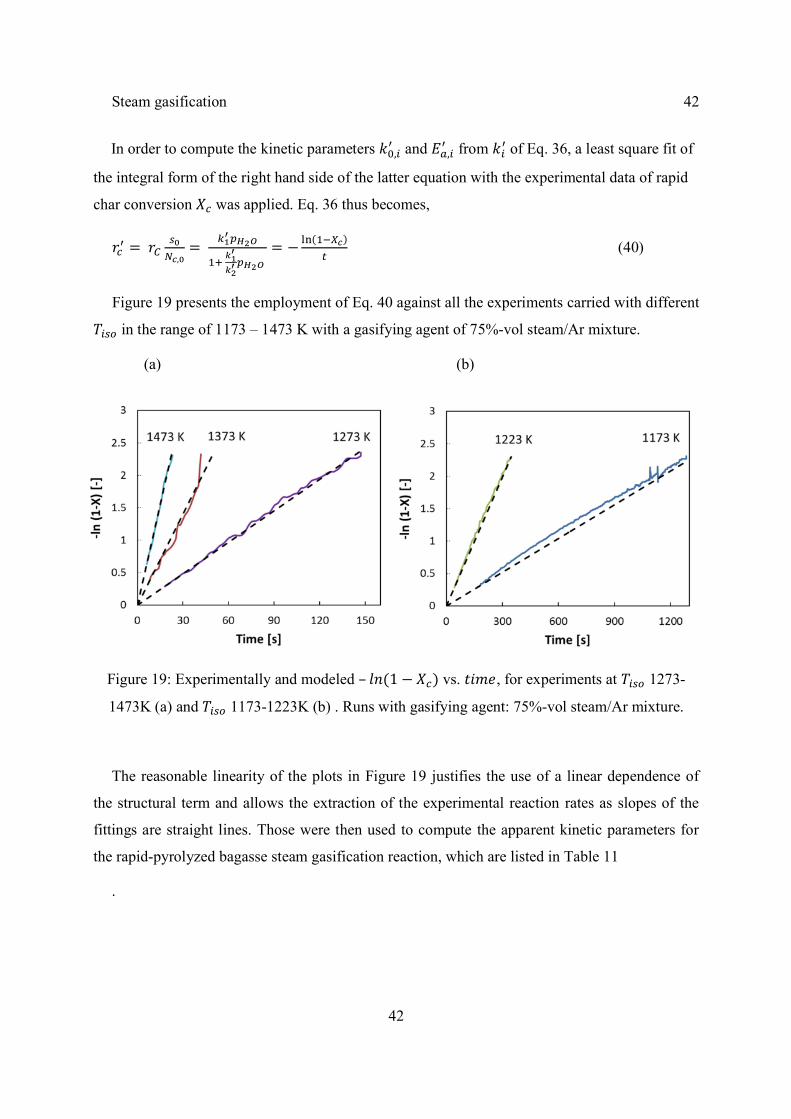
In order to compute the kinetic parameters , and , from of Eq. 36, a least square fit of
the integral form of the right hand side of the latter equation with the experimental data of rapid
char conversion was applied. Eq. 36 thus becomes,
= ,=
= − ( ) (40)
Figure 19 presents the employment of Eq. 40 against all the experiments carried with different
in the range of 1173 – 1473 K with a gasifying agent of 75%-vol steam/Ar mixture.
(a) (b)
Figure 19: Experimentally and modeled – (1 − ) vs. , for experiments at 1273-
1473K (a) and 1173-1223K (b) . Runs with gasifying agent: 75%-vol steam/Ar mixture.
The reasonable linearity of the plots in Figure 19 justifies the use of a linear dependence of
the structural term and allows the extraction of the experimental reaction rates as slopes of the
fittings are straight lines. Those were then used to compute the apparent kinetic parameters for
the rapid-pyrolyzed bagasse steam gasification reaction, which are listed in Table 11
.
Steam gasification 43
43
Table 11: Arrhenius kinetic parameters of “oxygen-exchange mechanism” applied to steam
gasification reaction of rapid pyrolysed bagasse
Kinetic parameters [ ] [ ]
( ) 55.8 4.27E+11
′[ / ] 7.37E+04 3.21E+05
Oxygen-exchange mechanism, reported in literature as Langmuir-Hinschelwood kinetics is
considered only in a few cases [21]. Some of them also considered the -inhibition effect [23,
29], neglected in the present work because was constantly swept away from the reaction
environment. Unfortunately no data of steam gasification of biomass that undertook the same
conditions as in this present work was found to make comparison.
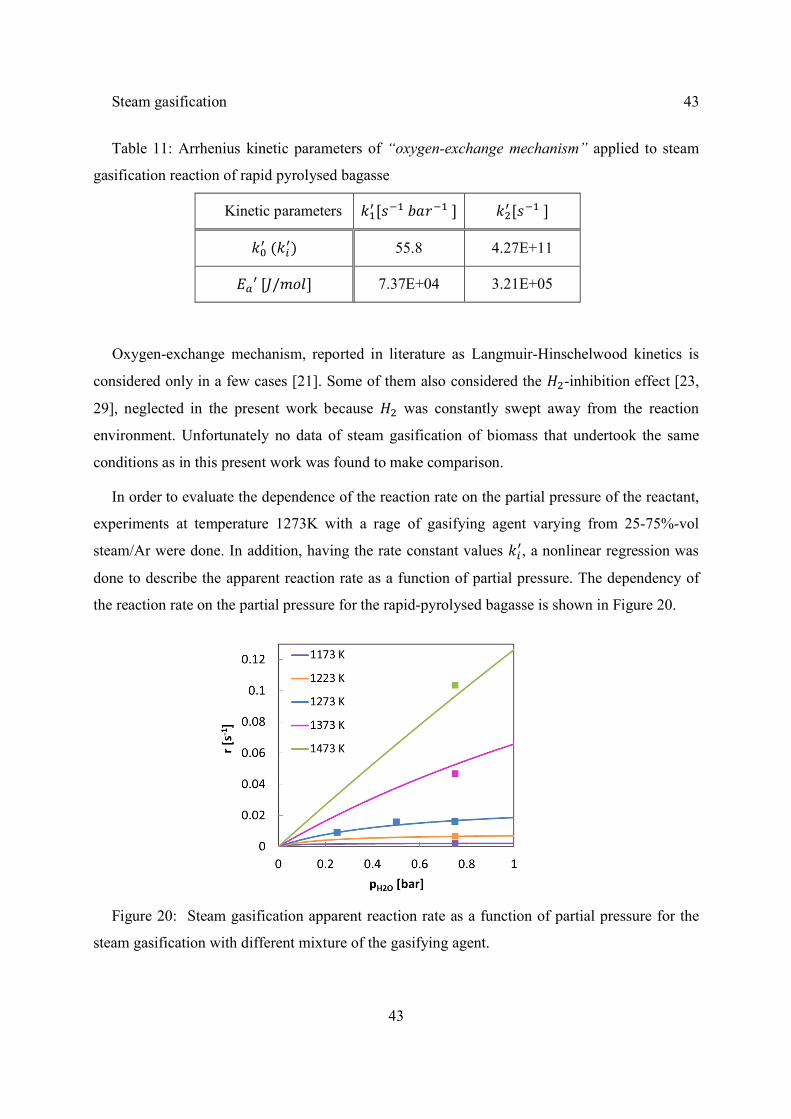
In order to evaluate the dependence of the reaction rate on the partial pressure of the reactant,
experiments at temperature 1273K with a rage of gasifying agent varying from 25-75%-vol
steam/Ar were done. In addition, having the rate constant values , a nonlinear regression was
done to describe the apparent reaction rate as a function of partial pressure. The dependency of
the reaction rate on the partial pressure for the rapid-pyrolysed bagasse is shown in Figure 20.
Figure 20: Steam gasification apparent reaction rate as a function of partial pressure for the
steam gasification with different mixture of the gasifying agent.
Steam gasification 44
44
The agreement of the curves is reasonably god with the experimental points at 1273 K. The
behavior at other temperatures are included just to illustrate that the same treatment would be
extensible to other temperatures, even if just one experimental point was produced.
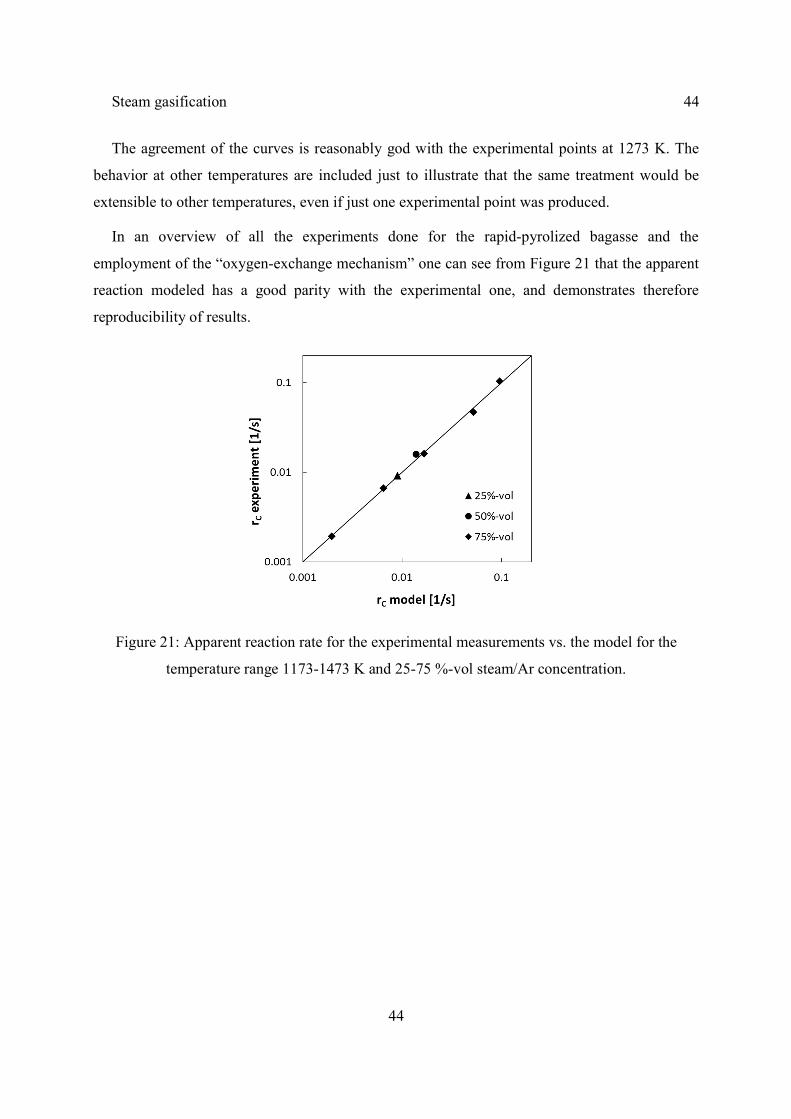
In an overview of all the experiments done for the rapid-pyrolized bagasse and the
employment of the “oxygen-exchange mechanism” one can see from Figure 21 that the apparent
reaction modeled has a good parity with the experimental one, and demonstrates therefore
reproducibility of results.
Figure 21: Apparent reaction rate for the experimental measurements vs. the model for the
temperature range 1173-1473 K and 25-75 %-vol steam/Ar concentration.
45
45
5 Conclusions
The Brazilian sugarcane bagasse turned out to be a very promising feedstock for the solar-
steam-gasification process, as it is very abundant by-product from the sugar industry and its
current use is very inefficient.
The steam gasification process encloses two consecutive reactions: Pyrolysis and steam
gasification. Both were experimentally studied by thermogravimetric analysis in order to model
their rate laws, which are of fundamental importance for the design of the solar reactor.
The pyrolysis experiments were carried at from room temperature until 1473 K, with constant
heating rates varying from 10-30 K/min.
Pyrolysis was successfully described as a linear combination of first order decomposition
steps. Predictions from the model proposed here (contemplating three-pseudo-components)
reproduce correctly the experimental TG curves during the pyrolysis of the bagasse in this study.
SEM images showed that chars produced by pyrolysis at high and slow heating rates have
very different pore-structure and available surface area. This may have an impact on the
reactivity in gasification.
The steam gasification of the slow and rapid-pyrolyzed bagasse were experimentally studied
in the temperature range of 1173 – 1473 K, with a gasifying agent mixture steam/Ar of 75%-vol.
In addition, the reactive gas composition was varied from 25-75% in experiments just with the
rapid-pyrolized bagasse at 1273 K.
A linear correlation was introduced to describe the structural effect based on a broad
distribution of effective particle size diameter. The structural term is well predicted as a linear
dependence of the unconverted char for both slow and rapid-pyrolyzed bagasse.
Oxygen-exchange mechanism could describe well the behavior of the steam-gasification as it
accounts for a reaction an adsorption terms in the surface. The oxygen-exchange mechanism
46
46
accounting for the temperature and partial pressure of the reactant represented the experiment
result with a good agreement for the temperature range of the experiments.
47
47
References
1. Teixeira, F., Bagaço de cana-de-açúcar na alimentação de bovinos. Revista eletrónica de veterinária, 2007. 8(6): p. 1695-1704.
2. Ulloa, C., A.L. Gordon, and X. Garcı́a, Distribution of activation energy model applied to the rapid pyrolysis of coal blends. Journal of Analytical and Applied Pyrolysis, 2004. 71(2): p. 465-483.
3. Piatkowski, N. and A. Steinfeld, Reaction kinetics of the combined pyrolysis and steam-gasification of carbonaceous waste materials. Fuel, 2010. 89(5): p. 1133-1140.
4. Taylor, R.W., R. Berjoan, and J.P. Coutures, SOLAR GASIFICATION OF CARBONACEOUS MATERIALS. Solar Energy, 1983. 30(6): p. 513-525.
5. Piatkowski, N., et al., Solar-driven gasification of carbonaceous feedstock—a review. Energy & Environmental Science, 2011. 4(1): p. 73.
6. Stubington, J.F. and S. Aiman, PYROLYSIS KINETICS OF BAGASSE AT HIGH HEATING RATES. Energy & Fuels, 1994. 8(1): p. 194-203.
7. Babu, B.V. and A.S. Chaurasia, Pyrolysis of biomass: improved models for simultaneous kinetics and transport of heat, mass and momentum. Energy Conversion and Management, 2004. 45(9-10): p. 1297-1327.
8. Cetin, E., et al., Biomass Gasification Kinetics: Influences of Pressure and Char Structure. Combustion Science and Technology, 2005. 177(4): p. 765-791.
9. Shen, J., et al., Effects of particle size on the fast pyrolysis of oil mallee woody biomass. Fuel, 2009. 88(10): p. 1810-1817.
10. Garcia-Perez, M., et al., Fast pyrolysis of oil mallee woody biomass: Effect of temperature on the yield and quality of pyrolysis products. Industrial & Engineering Chemistry Research, 2008. 47(6): p. 1846-1854.
11. Lakshmanan, C.C. and N. White, A NEW DISTRIBUTED ACTIVATION-ENERGY MODEL USING WEIBULL DISTRIBUTION FOR THE REPRESENTATION OF COMPLEX KINETICS. Energy & Fuels, 1994. 8(6): p. 1158-1167.
12. Pitt, G.J., THE KINETICS OF THE EVOLUTION OF VOLATILE PRODUCTS FROM COAL. Fuel, 1962. 41(3): p. 267-274.
13. Orfao, J.J.M., F.J.A. Antunes, and J.L. Figueiredo, Pyrolysis kinetics of lignocellulosic materials - three independent reactions model. Fuel, 1999. 78(3): p. 349-358.
14. Gomez-Barea, A., P. Ollero, and R. Arjona, Reaction-diffusion model of TGA gasification experiments for estimating diffusional effects. Fuel, 2005. 84(12-13): p. 1695-1704.
15. Ollero, P., et al., Diffusional effects in TGA gasification experiments for kinetic determination. Fuel, 2002. 81(15): p. 1989-2000.
48
48
16. Varhegyi, G., et al., KINETICS OF THE THERMAL-DECOMPOSITION OF CELLULOSE, HEMICELLULOSE, AND SUGAR-CANE BAGASSE. Energy & Fuels, 1989. 3(3): p. 329-335.
17. Roquediaz, P., et al., STUDIES ON THERMAL-DECOMPOSITION AND COMBUSTION MECHANISM OF BAGASSE UNDER NON-ISOTHERMAL CONDITIONS. Thermochimica Acta, 1985. 93(SEP): p. 349-352.
18. Manya, J.J., E. Velo, and L. Puigjaner, Kinetics of biomass pyrolysis: A reformulated three-parallel-reactions model. Industrial & Engineering Chemistry Research, 2003. 42(3): p. 434-441.
19. Ishida, M. and C.Y. Wen, COMPARISON OF KINETIC AND DIFFUSIONAL MODELS FOR SOLID-GAS REACTIONS. Aiche Journal, 1968. 14(2): p. 311-&.
20. Levenspiel, O., Chemical reaction engineering. 3rd ed1999, New York: Wiley. 668.
21. Di Blasi, C., Combustion and gasification rates of lignocellulosic chars. Progress in Energy and Combustion Science, 2009. 35(2): p. 121-140.
22. Kimura, S., S. Tone, and T. Otake, Reaction order in the grain model with grain size distribution. Chemical engineering of Japan, 1981. 14(6): p. 491 - 493.
23. Barrio, M., et al., Steam Gasification of Wood Char and the Effect of Hydrogen Inhibition on the Chemical Kinetics. Progress in Thermochemical Biomass Conversion, 2008.
24. Ergun , S., Kinetics of the reaction of carbon dioxide and steam with coke1962: US Bur Mines Bull.
25. Jovanovic, Z.R., Kinetics of direct nitridation of pelletized silicon grains in a fluidized bed: experiment, mechanism and modelling. Journal of Materials Science, 1998. 33(9): p. 2339-2355.
26. Liliedahl, T. and K. Sjostrom, Modelling of char-gas reaction kinetics. Fuel, 1997. 76(1): p. 29-37.
27. Zanzi, R., K. Sjostrom, and E. Bjornbom, Rapid pyrolysis of agricultural residues at high temperature. Biomass & Bioenergy, 2002. 23(5): p. 357-366.
28. Simell, P., et al., Provisional protocol for the sampling and anlaysis of tar and particulates in the gas from large-scale biomass gasifiers. Version 1998. Biomass & Bioenergy, 2000. 18(1): p. 19-38.
29. Bjerle, I., et al., THERMOGRAVIMETRIC ANALYSIS OF SWEDISH SHALE CHAR - KINETICS OF THE STEAM CARBON AND CARBON-DIOXIDE CARBON REACTIONS. Industrial & Engineering Chemistry Process Design and Development, 1982. 21(1): p. 141-149.
49
49
Nomenclature
E Activation energy [J/mol]
E Apparent activation energy [J/mol]
k Rate constant [ratedependent]
k Apparentrateconstant [ratedependent]
k , Pre-exponential factor [ratedependent]
k , Apparent pre-exponential factor [ratedependent]
X Total bagasse conversion [−]
X Char conversion [−]
X Char conversion [−]
p Partial pressure of steam [bar]
p Partial pressure of hydrogen [bar]
F Volumetric flow of argon [mLN/min]
r Rate of char conversion [ratedependent]
r Apparent rate of char conversion [ratedependent]
r Radius of the char particle consumed in time [m]
R Initial radius of char particle [m]
HR Heating rate [K/min]
HHV High heat value [MJ/kg]
LHV Low heat value [MJ/kg]
50
50
m Initial mass [mg]
m Apparent reaction order [−]
R Ideal gas constant [J/Kmol]
t Time [s]
t Experimental time [s]
τ Time for full conversion of the char particle [s]
θ Dimensionless time [−]
∆t Time elapsed to reach the experimental starting point [s]
∆H Enthalpy of reaction [KJ/mol]
σ Standard deviation [−]
f(τ) Log-normal distribution [−]
T Temperature [K]
T Initial temperature [K]
T Final temperature [K]
T Isothermal temperature [K]
N Number of moles of char [mol]
N , Initial number of moles of char [mol]
s Surface area of a grain [m ]
s Initial surface area of a grain [m ]
θ Fraction of surface covered with oxygen [−]
θ∗ Fraction of available surface [−]
51
51
Abbreviation
SP Rapid-pyrolyzed bagasse
RP Slow-pyrolyzed bagasse
TG Thermogravimetric analysis
DTG Differential thermogravimetric analysis
SCM Shrinking unreacted core model
PCM Progressive conversion model
rds Rate determining step
RMS Root mean square
daf Dry ash free basis
SEM Scanning electron microscopy
BET Brunauer - Emmett - Teller
Related Documents