Soil water balance and root development in Rooibos (Aspalathus linearis) plantations under Clanwilliam field conditions by Roeline van Schalkwyk Thesis presented in partial fulfilment of the requirements for the degree of Master of Soil Science in the Faculty of Agricultural Science at Stellenbosch University Supervisor: Dr. J.E. Hoffman Department of Soil Science Faculty of Agricultural Science Co-supervisor: Dr. A.G. Hardie Department of Soil Science Faculty of Agricultural Science March 2018

Welcome message from author
This document is posted to help you gain knowledge. Please leave a comment to let me know what you think about it! Share it to your friends and learn new things together.
Transcript
Soil water balance and root development in Rooibos (Aspalathus linearis) plantations under
Clanwilliam field conditions
by
Roeline van Schalkwyk
Thesis presented in partial fulfilment of the requirements for the degree of Master of Soil Science in the Faculty of Agricultural Science at Stellenbosch
University
Supervisor: Dr. J.E. Hoffman
Department of Soil Science
Faculty of Agricultural Science
Co-supervisor: Dr. A.G. Hardie
Department of Soil Science
Faculty of Agricultural Science
March 2018

i
Declaration
By submitting this thesis electronically, I declare that the entirety of the work contained therein is my
own, original work, that I am the sole author thereof (save to the extent explicitly otherwise stated),
that reproduction and publication thereof by Stellenbosch University will not infringe any third party
rights and that I have not previously in its entirety or in part submitted it for obtaining any qualification.
Date: March 2018
Copyright © 2018 Stellenbosch University
All rights reserved
Stellenbosch University https://scholar.sun.ac.za

ii
Abstract
Rooibos (Aspalathus linearis) can only grow in certain parts of the Western– and Northern Capes,
whereas the production declines every year. If the global demand trend continues to increase, the
production will be unable to meet the world demand. Currently, research of Rooibos is focused
mainly on its health benefits and not on the agricultural production aspects. The aim of this study
was to investigate the effect of fertilisation and soil depth on the soil water balance (SWB), root
development and biomass water use efficiency (WUEB) of Rooibos. The experimental trial was
conducted during 2016 and 2017 at Vaalkrans farm, Nardouwsberg, Clanwillliam in the Western
Cape. The following three treatments were evaluated on shallow (≤ 30 cm) and deep (≥ 80 cm) soils:
(1) unfertilised planted soil, (2) planted soil receiving moderate NPK fertiliser treatment (20 mg.kg-1
N, 30 mg.kg-1 P and 20 mg.kg-1 K) and (3) bare, unplanted soil.
The soil water content (SWC) was monitored at weekly intervals during the growing season (July
2016 until April 2017) and during the fallow periods (bare treatment) using a Diviner 2000 soil
moisture meter. The Diviner 2000 was used to record in 10 cm increments up to 30 and 80 cm soil
depths. At the end of the 2016/17 growing season, the SWB, the total biomass and biomass WUE
was determined. Volumetric water content and soil temperature at the deep site was monitored every
10 minutes using ECH2O sensors. Root growth, N-fixing nodules count, taproot length and root
system characteristics were measured on the plants at various growth stages.
The cumulative evapotranspiration (ET) of the unfertilised treatment was 110.4 and 121.2 mm, and
the fertilised treatment was 108.4 and 115.8 mm on shallow and deep soils, respectively. The
cumulative evaporation (E) of the bare treatment was 108.6 and 116.1 mm on shallow and deep
soils, respectively. The ET and E was lower at the shallow soil sites due to less soil water storage
(less water availability) compared to the deep soils. During the winter season, the SWC in the 10-20
cm soil layer of unfertilised and fertilised treatments was higher than the other soil layers. This is
likely due to higher soil organic carbon of 0.18–0.19%, low bulk density (1.45–1.54 g.cm-3) and high
root concentration in the 10-20 cm layer compared to the 20–40 cm soil layer. Fallow efficiency on
deeper soils was higher than the shallow soils due to higher SWC. Soil temperature fluctuations
were significant in the 0-10 cm soil layer of all treatments, but less so at the deeper soil layers. This
was due to poor energy transfer in the dry sandy soil. The diffusivity coefficient in the 10-20 cm soil
layer was exceptionally low due to the drought conditions and varied between ca. 0.072-0.090
mm2.day-1 over duration of the 2016/17 season.
Stellenbosch University https://scholar.sun.ac.za

iii
The deeper soils had higher shoot biomass compared to the shallow soils. The lower root biomass
and thinner taproot were caused by the P concentration. Cluster roots of Rooibos was found in the
10–20 cm soil layer which were where nutrient acquisition mainly occurred. The growth of the cluster
roots in the 10–20 cm soil layer was due to low bulk density, low soil temperature and high SWC.
Plants of the unfertilised treatment at the shallow site did has a high WUEB, but the water usage was
higher than at the deep site. Overall, the WUEB was found to be inconclusive due to the stoppage of
the SWB on April 2017 whilst the plants were still immature. The study indicates that young Rooibos
plants growing in deeper soils with higher soil water storage will result in higher yields.
Stellenbosch University https://scholar.sun.ac.za

iv
Uittreksel
Die globale aanvraag vir Rooibos (Aspalathus linearis) het in die afgelope paar jare verhoog danksy
die gesondheidsvoordele van die tee, maar die produksie van Rooibos verminder elke jaar. Rooibos
groei net in sekere areas in Wes en Noord-Kaap en indien die aanvraag verhoog, sal die produksie
nie by die aanvraag volhou nie. Daar word meer gefokus op die aspek van Rooibos se gesondheid
en min aandag word aan landbouproduksie aspekte gegee. Die doelwitte van hierdie studie handel
oor hoe die kunsmis en gronddiepte die grondwaterbalans, biomassa waterverbruikdoeltreffenheid
en wortelontwikkeling van Rooibos beïnvloed. Die proef is by Vaalkrans plaas, Nardouwsberg,
Clanwilliam in Wes-Kaap gedoen in die tydperk vanaf 2016 tot 2017. Drie verskillende behandelings
op vlak (≤ 30 cm) en diep (≥ 80 cm) gronde geëvalueer: (1) onbemeste grond met plante, (2) bemeste
grond (20 mg.kg-1 N, 30 mg.kg-1 P en 20 mg.kg-1 K) met plante en (3) braak sonder met plante.
Die grondwaterinhoud van al drie behandelings is weekliks met behulp van ‘n kapasitansie apparaat
(Diviner 2000) bepaal gedurende die 2016/17 groeiseisoen (Julie 2016 tot April 2017). Die bepalings
is by die vlak gronde tot by 30 cm gronddiepte in 10 cm inkremente geneem en by die diep gronde
tot by 80 cm gronddiepte. Aan die einde van die 2016/17 groeiseisoen is die grondwaterbalans, die
totale biomassa en biomassa waterverbruikdoeltreffenheid bepaal. Die EHC2O watermeters het die
volumetriese waterinhoud en die grondtemperatuur van die diep gronde gemeet. Na elke oes, is die
wortelgroei, N-fikserende nodules telling, penwortel se lengte en wortelsisteem eienskappe
bestudeer.
Die kumulatiewe evapotranspirasie van die onbemeste behandeling was 110.4 en 121.2 mm en vir
die bemeste behandeling was dit 108.4 en 115.8 mm van die vlak en diep gronde, respektiewelik.
Die braakbehandeling se kumulatiewe verdamping was 108.6 en 116.1 mm van die vlak en diep
gronde, respektiewelik. Die lae kumulatiewe evapotranspirasie en verdamping van die vlak gronde
was as gevolg van lae grondwaterstoring (dus minder waterbeskikbaarheid). Die grondwaterinhoud
in die 10–20 cm was hoër as die ander grondlae van die onbemes- en bemeste behandelings. Dit is
as gevolg van hoër grondorganiese koolstof (0.18–0.19%), lae bulkdigtheid (1.45–1.54 g.cm-3) en
hoër wortelkonsentrasie in die 10–20 cm grondlaag. Die diep gronde se braakeffektiwiteit was hoër
as van die vlak gronde as gevolg van die hoër grondwaterinhoud. Vir al die behandelings was die
grondtemperatuur fluktuasies in die 0-10 cm grondlaag baie prominent, maar laer in die dieper
grondlae. Dit was as gevolg van die droër grond se vertraagde energielading. Die
diffusiwiteitkoeffisiënt in die 10-20 cm grondlaag was besonders laag as gevolg van. die droë
toestande en het varieër tussen ca. 0.072-0.090 mm2.dag-1 gedurende die 2016/17 seisoen.
Stellenbosch University https://scholar.sun.ac.za

v
Die onbemeste gronde se loot biomassa was hoër as die bemeste gronde. Die P konsentrasie van
die bemeste plante in die grond het veroorsaak dat die wortelmassa laag was en ook dunner
penwortels. Die troswortels van die Rooibos groei hoofsaaklik in die 10-20cm grondlaag en dit is ook
waar die voedingstofverkryging meestal plaasvind. Die troswortels groei in die 10–20 cm grondlaag
omdat die bulkdigtheid is laer, die grondtemperatuur is laer en ook hoër grondwaterinhoud in daardie
grondlaag. Die onbemeste plante van die vlak gronde het die hoogste biomassa
waterverbruikdoeltreffenheid gehad, maar die waterverbruik was hoog. Oor die algemeen, is die
gevolgtrekking van die biomassa waterverbruikdoeltreffenheid nie geldig nie omdat die
grondwaterbalans het tot by April 2017 gestop terwyl die plante nog jonk was. Resultate uit die studie
dui aan dat dieper gronde met hoër grondwaterinhoud, ’n toename in produksie sal veroorsaak.
Stellenbosch University https://scholar.sun.ac.za

vi
Acknowledgements
“Grond is ’n sagmoedige ma wat na haar kinders omsien”
Roeline van Schalkwyk
First and foremost, I want to thank my Lord for giving me strength and walk with me through this
adventure of studying for my masters I also thank Him for His helping or otherwise I would not have
been able to finish it on my own.
I would like to express my gratitude to my parents, my family and my friends for their consistent
support during this thesis:
I humbly thanks to my parents, Iain and Irma van Schalkwyk, for believing in me, their
encouragement and love when I was down and at rock bottom;
my brother, Helgard van Schalkwyk, and sister-in-law, Dominique van Schalkwyk, for
supporting and helping me during the adventure;
aunt René van Schalkwyk for cheering me up, keeping me calm and believing in me;
Uncle André and aunt Eunice van Schalkwyk for their support and guidance;
my best friend, Marelize Brand, for listening to me, thanks for your positive words and that you
helped me to fulfil my dreams.
I sincerely thank Dr. Eduard Hoffman for all your effort, giving advices and guidance during this
thesis.
During 2016/17 several people were involved in the study. Therefore, I would like to thank:
Dr. Alisa Hardie for guidance and for chemical staff support.
Eugene Lategan and Naude Opperman for helping me with the soil water retention curve and
some of the other soil physical experiments.
All members at the Department of Soil Science, thanks for all the positive words. I spent a
great time with everybody. Tannie Annetjie, thanks for the beautiful words and always
enquiring how are you and putting a smile on my face.
Kalie Smith for guidance on the Vaalkrans farm and always checking if we not hungry or thirsty,
also for the use of the farm.
Naudé Smith for soil water content measurement every week and sampling the plants, you did
a great job.
Johan Stephan for installing the probes on the experimental trial for soil water content
measurements and for help in the laboratory.
For all the workers on the farm who helped me, thanks for the research assistances.
Marcello Louwrens for the ride to Clanwilliam, drawing the soil map and taking soil samples.
Stellenbosch University https://scholar.sun.ac.za

vii
Nigel for the help to taking soil samples.
Teneille Nel, another best friend of mine, for help taking photos of the plants and analysing the
root growth of Rooibos.
Rooibos Limited for funding the project.
Stellenbosch University https://scholar.sun.ac.za

viii
Table of Content
Declaration....................................................................................................................................... i
Abstract .......................................................................................................................................... ii
Uittreksel ........................................................................................................................................ iv
Acknowledgements ........................................................................................................................ vi
Table of Content ........................................................................................................................... viii
List of Abbreviations ....................................................................................................................... xii
List of Figures ............................................................................................................................... xiv
List of Tables ............................................................................................................................... xvii
Chapter 1: Introduction .................................................................................................................... 1
1.1 Overall overview of the research ................................................................................ 1
1.2 Research aims ........................................................................................................... 1
1.3 Chapter overview ....................................................................................................... 1
Chapter 2: Literature review of Rooibos cultivation and soil properties that affect soil water
dynamics ............................................................................................................................... 2
2.1 Introduction ................................................................................................................ 2
2.2 Background of Rooibos .............................................................................................. 3
2.2.1 Distribution and identification ...................................................................................... 3
2.2.2 Climate and soil conditions ......................................................................................... 3
2.2.3 Cultivation .................................................................................................................. 5
2.2.4 Production .................................................................................................................. 6
2.3 Soil chemical and physical properties that affects the soil water dynamic ................... 7
2.3.1 Soil chemical properties ............................................................................................. 7
2.3.1.1 Soil organic carbon ............................................................................................. 7
2.3.2 Soil physical properties ............................................................................................... 8
2.3.2.1 Soil texture.......................................................................................................... 8
2.3.2.2 Bulk density ........................................................................................................ 8
2.3.2.3 Soil water retention curve ................................................................................... 9
2.4 Soil water dynamics in arid and semi-arid areas ......................................................... 9
2.4.1 Calibration ................................................................................................................ 10
Stellenbosch University https://scholar.sun.ac.za

ix
2.4.1.1 Soil-specific calibration ..................................................................................... 10
2.4.1.2 Temperature sensitivity calibration .................................................................... 10
2.4.2 Soil water balance .................................................................................................... 11
2.4.3 Selected factors that affect the soil water content ..................................................... 12
2.4.3.1 Fertilisation and soil depth ................................................................................ 12
2.4.3.2 Soil temperature ............................................................................................... 12
2.4.3.3 Evapotranspiration/evaporation ........................................................................ 13
2.4.3.4 Drying front and diffusivity coefficient ................................................................ 14
2.5 The effect of fertilisation and soil depth on biomass production, root development and
water use efficiency ................................................................................................................... 15
2.5.1 Biomass production .................................................................................................. 16
2.5.2 Root development .................................................................................................... 16
2.5.3 Water use efficiency ................................................................................................. 17
2.6 Conclusion ............................................................................................................... 17
Chapter 3: Materials and methods ................................................................................................ 18
3.1 Introduction .............................................................................................................. 18
3.1.1 Experimental site and soil description ....................................................................... 18
3.1.2 Experimental layout .................................................................................................. 18
3.1.3 Soil chemical and physical properties ....................................................................... 21
3.1.4 Soil water content determined by the Diviner 2000 ................................................... 24
3.1.4.1 Calibration of the Diviner 2000 .......................................................................... 24
3.1.4.2 Soil water balance ............................................................................................ 26
3.1.5 Soil water content determined by the ECH2O soil moisture sensor ........................... 27
3.1.5.1 Calibration of the ECH2O sensors ..................................................................... 28
3.1.6 Biomass production, root system characteristics and biomass water use efficiency . 29
3.1.7 Statistical analysis .................................................................................................... 30
Chapter 4: Soil chemical and physical properties of the soil at the trail site ................................... 31
4.1 Introduction .............................................................................................................. 31
4.1.1 Soil chemical properties ........................................................................................... 31
4.1.1.1 Soil organic carbon ........................................................................................... 34
Stellenbosch University https://scholar.sun.ac.za

x
4.1.2 Soil physical properties ............................................................................................. 36
4.1.3 Soil texture ............................................................................................................... 36
4.1.4 Bulk density .............................................................................................................. 39
4.1.5 Soil water retention curve ......................................................................................... 41
Chapter 5: Soil water dynamics the during 2016/17 season .......................................................... 42
5.1 Introduction .............................................................................................................. 42
5.2 Soil water content determined by the Diviner 2000 ................................................... 43
5.2.1 Calibration of the Diviner 2000 ................................................................................. 43
5.2.1.1 Soil-specific calibration ..................................................................................... 43
5.2.1.2 Temperature sensitivity calibration .................................................................... 44
5.2.2 Growing season of 2016/17 ...................................................................................... 51
5.2.3 Soil water balances of unfertilised and fertilised treatments ...................................... 51
5.2.4 Soil water balances of the fallow periods .................................................................. 63
5.3 Soil water content determined by the ECH2O soil moisture sensor ........................... 68
5.3.1 Calibration of the ECH2O sensors............................................................................. 68
5.3.1.1 Soil-specific calibration ..................................................................................... 68
5.3.1.2 Temperature sensitivity calibration ....................... Error! Bookmark not defined.
5.3.2 Soil water content of the unfertilised and fertilised treatment .................................... 73
5.3.3 Soil water content of the bare treatment ................................................................... 74
5.3.4 Evaporation rate .......................................................... Error! Bookmark not defined.
5.3.1 Drying front and diffusivity ........................................................................................ 80
5.4 Conclusion ............................................................................................................... 92
Chapter 6: Effect of fertilisation and soil depth on biomass production, root development and
biomass water use efficiency ............................................................................................... 93
6.1 Introduction .............................................................................................................. 93
6.2 Biomass production .................................................................................................. 93
6.3 Root development .................................................................................................... 94
6.3.1.1 N-fixing nodules ................................................................................................ 94
6.3.1.2 Root system characteristics .............................................................................. 95
6.4 Biomass water use efficiency ................................................................................. 100
Stellenbosch University https://scholar.sun.ac.za

xi
6.5 Conclusion ............................................................................................................. 101
Chapter 7: Conclusions ............................................................................................................... 102
7.1 Soil water dynamic during 2016/17 ......................................................................... 102
7.2 The effect of fertilisation and soil depth on biomass production, root development and
biomass water use efficiency ................................................................................................... 102
7.3 Recommendations.................................................................................................. 103
7.4 Future research ...................................................................................................... 103
Reference ................................................................................................................................... 104
Appendix A: Climatic data ........................................................................................................... 125
Appendix B: Diffusivity coefficients .............................................................................................. 126
Stellenbosch University https://scholar.sun.ac.za

xii
List of Abbreviations
AM Arbuscular mycorrhizae
BD Bare treatment on deep soils
BS Bare treatment on shallow soils
Ca Calcium
Cu Copper
E Evaporation
E Cumulative evaporation
ET Cumulative evapotranspiration
EC Electrical conductivity
ECEC Effective cation exchange capacitive
FC Field capacity
FD Fertilised treatment on deep soils
FE Fallow efficiency
FS Fertilised treatment on shallow soils
GWC Gravimetric water content
K Potassium
KCl Potassium chloride
mhasl mean height above sea level
Mg Magnesium
Mn Manganese
Na Sodium
P Phosphorus
PVC Polyvinyl chloride
PWP Permanent wilting point
R2 Coefficient of determination
Stellenbosch University https://scholar.sun.ac.za

xiii
RMSE Root mean square error
SOC Soil organic carbon
SWB Soil water balance
SWC Soil water content
SWD Soil water dynamics
SWRC Soil water retention curve
SWS Soil water storage
UD Unfertilised treatment on deep soils
US Unfertilised treatment on shallow soils
UCB USB Cable Adapter
VWC Volumetric water content
WHC Water holding capacity
WU Water usage
WUE Water use efficiency
WUEB Biomass water use efficiency
Zn Zinc
Stellenbosch University https://scholar.sun.ac.za

xiv
List of Figures
Figure 2.1: Map indicating Rooibos production areas in South Africa (A) and the Western Cape (B),
respectively (map was supplied by Rooibos Ltd., Clanwilliam). ....................................................... 4
Figure 3.1: Aerial photo showing the position of the Vaalkrans farm north of Clanwilliam (A) and the
trial site on the farm Vaalkrans, southeast below the homestead (B) taken on 27 February 2017
(Google Earth, 2016). ................................................................................................................... 19
Figure 3.2: A soil depth map (10 × 10 m grid) generated by QGIS program at Vaalkrans farm. ..... 20
Figure 3.3: Trial experiment plot layout at Vaalkrans farm. US (unfertilised shallow), FS (fertilised
shallow) and BS (bare shallow) selected on the shallow soils. UD (unfertilised deep), FD (fertilised
deep) and BD (bare deep) selected on the deep soils. .................................................................. 22
Figure 3.4: Tube sampler being used to determine the gravimetric water content and bulk density for
calibration of Diviner 2000 on the left-hand site. Soil samples determined using the electronic
balance on the right-hand site. ...................................................................................................... 25
Figure 3.5: Installation of the ECH2O sensors at the BD 3 block (bare treatment of deep soil) to
measure the volumetric water content and soil temperature on the lefthand side. On the righthand
side is an ECH2O data logger ca. 15 cm to a PVC access tube. ................................................... 28
Figure 4.1: Average particle size distribution of all treatments (Refer to Table 3.4 for texture
descriptions). ................................................................................................................................ 36
Figure 4.2: Soil water characteristic curve of the medium sandy soil. FC is field capacity. ............ 41
Figure 5.1: Average total profile soil water content for the unfertilised and fertilised treatments on
shallow and deep soils during the 2016/17 growing season. ......................................................... 60
Figure 5.2: Average cumulative evaporation for the unfertilised and fertilised treatments on shallow
and deep soils during the 2016/17 growing season. ...................................................................... 60
Figure 5.3: Average cumulative evaporation for the bare treatments on the shallow and deep soils
during the 2016/17 growing season. ............................................................................................. 66
Figure 5.4: Hourly average soil temperature of the fertilised treatment at 5 and 15 cm soil layers on
11 January 2017, 13 June 2017 and 1 September 2017 at the deep site. No rain occurred during
these three 24-hour periods. ......................................................................................................... 71
Figure 5.5: Hourly average soil temperature of the unfertilised treatment at 5, 15 and 25 cm soil
layers on 11 January 2017, 13 June 2017 and 1 September 2017 at the deep site. No rain occurred
during these three 24-hour periods. .............................................................................................. 71
Figure 5.6: Hourly average soil temperature of the bare treatment at 5, 15, 25 and 45 cm soil layers
on 11 January 2017, 13 June 2017 and 1 September 2017 at the deep site. No rain occurred during
these three 24-hour periods. ......................................................................................................... 72
Figure 5.7: Daily average soil temperature at 5, 15 and 25 cm soil layers with daily air temperature
(A), daily average soil water content at 5, 15, 25 and 45 cm soil layers (B) and total rainfall per day
Stellenbosch University https://scholar.sun.ac.za
xv
with light intensity (C) for the unfertilised treatment at the deep site from 1 November 2016 to 2017.
..................................................................................................................................................... 76
Figure 5.8: Daily average soil temperature at 5 25 cm soil layers with daily air temperature (A), daily
average soil water content at 5, 15, 25 and 45 cm soil layers (B) and total rainfall per day with light
intensity (C) for the fertilised treatment at the deep site from 1 November 2016 to 2017. .............. 77
Figure 5.9: Daily average soil temperature at 5 and 25 cm soil layers with daily air temperature (A),
daily average soil temperature at 25 and 45 cm soil layers with daily air temperature (B), daily
average soil water content at 5, 15, 25, 45 and 65 cm soil layers (C) and total rainfall per day with
light intensity (D) for the bare treatment at the deep site from 5 July 2016 to 2017. ...................... 78
Figure 5.10: The hourly average soil temperature of the bare treatment on the deep soil at 5, 15, 25
and 45 cm soil layers on 19 August 2016 (A) and 20 August 2016 (B), and 21 August 2017 (C) and
22 August 2017 (D). The total rainfall per day (mm) on 20 August 2016 and 22 August 2017 was 4.8
and 12.3 mm, respectively. Light intensity was 413.52 and 445.29 W.m-1, and 274.74 and 296.23
W.m-1 for 19 and 20 August 2016, and 21 and 22 August 2017, respectively. ............................... 79
Figure 5.11: Average evaporation rate of the bare treatment between 6–19 July 2016 (A) and 5–15
August 2016 (B). ........................................................................................................................... 82
Figure 5.12: Average evaporation rate of the bare treatment between 14–23 August 2016 (A) and
22–30 August 2016 (B). ................................................................................................................ 83
Figure 5.13: Development of a drying front over time after a rainfall event and its movement into the
medium sandy soil of the bare treatment on 8–12 July 2016 (A) and 5–12 August 2016 (B). ........ 84
Figure 5.14: Development of a drying front over time after a rainfall event and its movement into the
medium sandy soil of the bare treatment on 14–19 August 2016 (A) and 2 –29 August 2016 (B). 85
Figure 5.15: Development of a drying front over time after a rainfall event and its movement into the
medium sandy soil of the bare treatment on 17–25 September 2016 (A) and 27 – 31 July 2017 (B).
..................................................................................................................................................... 86
Figure 5.16: Average diffusivity coefficients of the bare treatment at 5, 15 and 25 cm soil depths on
8–12 July 2016. ............................................................................................................................ 87
Figure 5.17: Average diffusivity coefficients of the bare treatment at 5, 15 and 25 cm soil depths on
9–12 August 2016. ........................................................................................................................ 88
Figure 5.18: Average diffusivity coefficients of the bare treatment at 5, 15 and 25 cm soil depths
on14-19 August 2016. ................................................................................................................... 89
Figure 5.19: Average diffusivity coefficients of the bare treatment at 5, 15 and 25 cm soil depths on
22-29 August 2016. ....................................................................................................................... 90
Figure 5.20: Average diffusivity coefficients of the bare treatment at 5, 15 and 25 cm soil depths on
17–25 September 2016................................................................................................................. 91
Stellenbosch University https://scholar.sun.ac.za

xvi
Figure 6.1: Photos of the root nodulations of the Rooibos plants of the unfertilised treatment on the
deep soils taken by the digital microscope. The scale in photo A was 10 times and in photo B it was
100 times ...................................................................................................................................... 96
Figure 6.2: Photos of the root nodulations of the Rooibos plants of the unfertilised treatment on the
deep soils taken by the digital microscope. The scale of both photos was 100 times. ................... 97
Figure 6.3: Root morphology of Rooibos plants of the unfertilised (A) and fertilised (B) treatments at
the shallow site. C and D are unfertilised and fertilised treatments at the deep site, respectively. . 99
Stellenbosch University https://scholar.sun.ac.za

xvii
List of Tables
Table 2.1: List of studies of soils of different textures and their water holding capacity (WHC) in the
0-60 cm soil layer. ........................................................................................................................... 9
Table 2.2: The effect of soil depth on cumulative evaporation (E) of a bare field under semi-arid
conditions located near Ames, IA (41.98° N, 93.68° W) (Xiao et al., 2011). .................................. 14
Table 2.3: List of thickness of drying-front under different climatic conditions with different sand
fraction. ......................................................................................................................................... 15
Table 3.1: Soil classification of the Cartref soil at the field trial at Vaalkrans farm (Smith, 2014) ... 18
Table 3.2: Treatments and soil depths of the experimental trial with four replications. .................. 21
Table 3.3: The dates when soil samples were collected for analysis of soil chemical and physical
properties. ..................................................................................................................................... 23
Table 3.4: The specific ranges of textural fractions (United States Department of Agriculture, 1987).
..................................................................................................................................................... 23
Table 3.5: Method of measurement of the relevant parameters of the soil water balance equation.
..................................................................................................................................................... 26
Table 3.6: Soil temperatures (°C) measured at different soil depth of the relevant treatments. ..... 28
Table 3.7: The dates of measurements of plant analysis of Rooibos plants growing in shallow and
deep soils...................................................................................................................................... 29
Table 4.1: The mean soil chemical status of the experimental trial of unfertilised and fertilised
treatment on shallow and deep soils. ............................................................................................ 32
Table 4.2: Average soil organic carbon (SOC) of unfertilised and bare treatment in 0–50 cm soil
depth at the deep site. .................................................................................................................. 35
Table 4.3: Average soil particle-size distribution (%) of the unfertilised, fertilised and bare treatment
at the shallow site. ........................................................................................................................ 37
Table 4.4: Average soil particle-size distribution (%) of the unfertilised, fertilised and bare treatments
at the deep site. ............................................................................................................................ 38
Table 4.5: Average bulk density of unfertilised, fertilised and bare treatments in the 0–30 cm soil
depth (shallow site). ...................................................................................................................... 39
Table 4.6: Average bulk density of unfertilised, fertilised and bare treatments in the 0–80 cm soil
depth (deep site). .......................................................................................................................... 40
Table 5.1: Soil texture, coefficients of determination (R2) and root mean square errors (RMSE) from
different calibrations developed for Diviner 2000 under several conditions.................................... 43
Table 5.2: Soil water content (SWC) of each soil depth (mm/100 mm) and components of the soil
water balance of unfertilised treatment (UD 4.1) during the 2016/17 growing season. .................. 45
Table 5.3: Soil water content of each soil depth (mm/100 mm) and components of the soil water
balance of fertilised treatment (FD 2.2) during the 2016/17 growing season. ................................ 46
Stellenbosch University https://scholar.sun.ac.za
xviii
Table 5.4: Soil water content of each soil depth (mm/100 mm) and components of the soil water
balance of bare treatment (BD 3) during the 2016/17 growing season .......................................... 47
Table 5.5: Non-calibrated ECH2O data at different dates of the unfertilised treatment (UD 4.1)
volumetric soil water content (VWC in mm), soil temperature (Tsoil in °C) in and air temperature (Tair
in °C) at the deep site. .................................................................................................................. 48
Table 5.6: Non-calibrated ECH2O data at different dates of fertilised treatment (FD 2.2) volumetric
soil water content (VWC in mm), soil temperature (Tsoil in °C) in and air temperature (Tair in °C) at the
deep site ....................................................................................................................................... 49
Table 5.7: Non-calibrated ECH2O data at different dates of bare treatment (BD 3) volumetric soil
water content (VWC in mm), soil temperature (Tsoil in °C) in and air temperature (Tair in °C) at the
deep site. ...................................................................................................................................... 50
Table 5.8: Temperature corrected soil water content of each soil depth (mm/100 mm) and
components of the soil water balance of unfertilised treatment in the 0–30 cm soil depth during the
2016/17 growing season. .............................................................................................................. 52
Table 5.9: Temperature corrected soil water content of each soil depth (mm/100 mm) and
components of the soil water balance of fertilised treatment in the 0–30 cm soil depth during the
2016/17 growing season. .............................................................................................................. 53
Table 5.10: Temperature corrected soil water content of each soil depth (mm/100 mm) and
components of the soil water balance of unfertilised treatment in the 0–80 cm soil depth during the
2016/17 growing season. .............................................................................................................. 54
Table 5.11: Temperature corrected soil water content of each soil depth (mm/100 mm) and
components of the soil water balance of fertilised treatment in the 0–80 cm soil depth during the
2016/17 growing season. .............................................................................................................. 55
Table 5.12: Maximum and difference of soil temperature (Tsoil in °C) between the unfertilised and
fertilised treatment of the deep soils at 5 and 15 cm soil depths. ................................................... 56
Table 5.13: Air temperature (Tair in °C) of the soil water balance of all treatments on shallow and
deep soils during the 2016/17 growing season. ............................................................................ 60
Table 5.14: Summary of the soil water balances (mm) for all both treatments of the shallow soils (0–
30 cm) and deep soils (0–80 cm) during the 2016/2017 growing season. ..................................... 62
Table 5.15: Temperature corrected soil water content of each soil depth (mm/100 mm) and
components of the soil water balance of the bare treatment in the 0–30 cm soil depth during the
2016/17 growing season. .............................................................................................................. 64
Table 5.16: Temperature corrected soil water content of each soil depth (mm/100 mm) and
components of the soil water balance of the bare treatment in the 0–80 cm soil depth during the
2016/17 growing season. .............................................................................................................. 65
Stellenbosch University https://scholar.sun.ac.za

xix
Table 5.17: Summary of soil water balances (mm) and the fallow efficiency (FE in %) of the bare
treatments at shallow and deep sites during 2016/17. The difference between cumulative
evaporation and rainfall indicated the water losses. ...................................................................... 67
Table 5.18: Linear regression equations, coefficients of determinations (R2) and root mean square
error (RMSE in m3.m-3) in the medium sandy soil for the different ECH2O sensors. ...................... 69
Table 5.19: Soil water content linear response to temperature and coefficient of determinations (R2)
of all treatments at the deep site. .................................................................................................. 70
Table 5.20: Temperature sensitivity correction models and coefficients of determinations (R2) of all
treatments at the deep site. ........................................................................................................... 70
Table 6.1: Shoot and root biomass of the unfertilised and fertilised treatments at shallow and deep
sites. ............................................................................................................................................. 94
Table 6.2: N-fixing nodules of the unfertilised and fertilised treatments at the deep site. ............... 95
Table 6.3: Length of the taproots of the unfertilised and fertilised treatments at the shallow and deep
sites. ............................................................................................................................................. 95
Table 6.4: Average length (cm) of Rooibos at different soil depths for the different root size classes
for the unfertilised and fertilised treatments at the shallow and deep sites .................................... 98
Table 6.5: Average biomass (g) of Rooibos at different soil depths for the different root size classes
for the unfertilised and fertilised treatments at the shallow and deep sites. ................................. 100
Table 6.6: Average biomass water use efficiency (WUEB in kg.ha-1.mm-1) of the unfertilised and
fertilised treatments at the shallow and deep sites at the end of February 2017. ......................... 101
Table A.1: Climate data of air temperature and rainfall for the 2016/17 growing season. ............ 125
Table B.1: Average volumetric water content and average diffusivity coefficients for July 2016 for the
bare treatment on the deep soils. ................................................................................................ 126
Table B.2: Average volumetric water content and average diffusivity coefficients for August 2016 for
the bare treatment on the deep soils. .......................................................................................... 127
Table B.3: Average volumetric water content and average diffusivity coefficients for September 2016
for the bare treatment on the deep soils. ..................................................................................... 128
Table B.4: Average volumetric water content and average diffusivity coefficients for October 2016
for the bare treatment on the deep soils. ..................................................................................... 129
Table B.5: Average volumetric water content and average diffusivity coefficients for November 2016
for the bare treatment on the deep soils. ..................................................................................... 130
Table B.6: Average volumetric water content and average diffusivity coefficients for December 2016
for the bare treatment on the deep soils. ..................................................................................... 131
Table B.7: Average volumetric water content and average diffusivity coefficients for January 2017
for the bare treatment on the deep soils. ..................................................................................... 132
Stellenbosch University https://scholar.sun.ac.za

xx
Table B.8: Average volumetric water content and average diffusivity coefficients for February 2017
for the bare treatment on the deep soils. ..................................................................................... 133
Table B.9: Average volumetric water content and average diffusivity coefficients for March 2017 for
the bare treatment on the deep soils. .......................................................................................... 134
Table B.10: Average volumetric water content and average diffusivity coefficients for April 2017 for
the bare treatment on the deep soils. .......................................................................................... 135
Table B.11: Average volumetric water content and average diffusivity coefficients for May 2017 for
the bare treatment on the deep soils. .......................................................................................... 136
Table B.12: Average volumetric water content and average diffusivity coefficients for June 2017 for
the bare treatment on the deep soils. .......................................................................................... 137
Table B.13: Average volumetric water content and average diffusivity coefficients for July 2017 for
the bare treatment on the deep soils. .......................................................................................... 138
Table B.14: Average volumetric water content and average diffusivity coefficients for August 2017
for the bare treatment on the deep soils. ..................................................................................... 139
Table B.15: Average volumetric water content and average diffusivity coefficients for September
2017 for the bare treatment on the deep soils. ............................................................................ 140
Stellenbosch University https://scholar.sun.ac.za

1
Chapter 1: Introduction
1.1 Overall overview of the research
Currently limited knowledge exists about the soil water dynamics of Rooibos tea production, or the
water-use of Rooibos. Soil water availability is closely linked to nutrient acquisition and productivity
of the plants. A two-year research project was undertaken to investigate the soil water balance (flow
of water in and out of soil profile) of Rooibos tea production. The study was conducted over a few
growing seasons under field conditions in the Clanwilliam area on shallow (≤ 30 cm) and deep (≥ 80
cm) soils. Closely coupled with the soil water balance is the extent of root development. The
proposed field trial will monitor soil and plant properties from the seedling through to mature one-
year-old plants. This study will provide critical insights into water storage and water usage.
In the past decade, the international demand of Rooibos tea has increased, whereas Rooibos
production has decreased, mainly due to declining yields on old lands, drought and environmental
legislation hampering the establishment of new Rooibos lands in pristine fynbos area. Therefore, it
is imperative to manage the soil carefully for improving tea yields. Attempts to cultivate Rooibos tea
in other countries failed because Rooibos tea only grows in specific climatic and soil conditions.
1.2 Research aims
The first aim of this project was to determine the soil water balance of selected unfertilised and
fertilised Rooibos tea plants from seedling to one-year mature plant on shallow and deep soils and
how soil depth and fertilisers influence the soil water dynamic in soils. Soil temperature, water
redistribution, evaporation rate, drying-front and hydraulic diffusivity were also determined on the
deep soils. The second aim of the study was to investigated root development throughout the season
and correlate this with the soil water availability. Furthermore, the biomass water use efficiency was
determined of the unfertilised and fertilised Rooibos plants on shallow and deep soils.
1.3 Chapter overview
Chapter two is a literature review of Rooibos plants and the soil physical properties which is needed
to understand the soil water dynamics. Chapter three is a description of the materials and methods
used in this study. Results and discussion of the general chemical and physical properties are
covered in Chapter four. Chapter five comprises all the soil water balance tables of the unfertilised
and fertilised treatment with fallow periods on shallow and deep soils. Soil temperature, evaporation
rate, drying-front and hydraulic diffusivity of the bare treatment on the deep soils are also discussed
in chapter five. Chapter six reports all the biomass production, root development and biomass water
use efficiency of the Rooibos plants on deep and shallow soils. Chapter seven is a conclusion of
Chapters four, five and six, followed with some recommendations and future research.
Stellenbosch University https://scholar.sun.ac.za
2
Chapter 2: Literature review of Rooibos cultivation and soil
properties that affect soil water dynamics
2.1 Introduction
Rooibos plants (Aspalathus linearis) is a leguminous shrub (Morton, 1983), derived from the
Fabaceae family (Joubert & de Beer, 2011), which grows in the Mediterranean climate (Kanu et al.,
2013) of the Cape Floristic Region of the Western and Northern Cape provinces of South Africa
(Malgas et al., 2010). Although, this special plant had no commercial interest at the beginning of the
20th century, but according to Joubert and Schultz (2006), today it is well known for its health benefits.
Since its commercialisation, there has been more focus on the health benefits and quality of Rooibos
tea rather than research focussed on the specific soils where Rooibos likes to grow. It was reported
by Stassen (1987), who did focus on research of soil properties related to Rooibos cultivation, that
Rooibos prefer soils which are deep and cooler with higher soil water storage (SWS).
Drought is a recurring phenomenon in dryland farming, and particularly in Western Cape, South
Africa. While drought is defined in many ways, drought in dryland farming is constant and varies from
year to year. Drought in dryland farming links various meteorological characteristics to agricultural
impacts: soil water deficits, evapotranspiration higher than rainfall and rainfall shortages (Arshad et
al., 2013). Evaporation (E) in semi-arid or arid regions is the greatest loss of water (van Keulen &
Hillel, 1974; Bach, 1984) and the demand of E is usually greater than the ability of soil to conduct
water in liquid phase (Rose et al., 2005; Unger, 1976). Jalota and Prihar (1990) and Hide (1954)
noted that the loss of water due to soil bare evaporation is between 50 to 70% of the annual rainfall.
According to Unger and Phillips (1973) ca. 70% of annual rainfall is lost due to from bare soil
evaporation. Therefore, the soil water content (SWC) decreases because of the evapotranspiration
and drainage, and increases by rainfall (Remson et al., 1960). According to Lötter (2015), the
Rooibos production decreased significantly with reduced rainfall. Smith (2014) reported that the
average Rooibos yield per hectare has decreased up to 45% over the last five years. Given climate
change, decline in production and concern about water availability, emphasis must be placed on
understanding the soil water balance and dynamics to optimise the Rooibos production.
Van Duivenbooden et al. (2000) reported that improvement of SWS and its availability to plants at
critical growth stages increases water use efficiency. Soil organic carbon (SOC) plays a crucial role
in soil fertility. It modifies the pH(H2O), reduces the bulk density and increases the SWC as well as
water holding capacity (WHC) (Tester, 1990). Fertilisation improves yield in dryland farming areas
but the amount of a fertiliser must be in balance (Liu et al., 2013) Fallowing can improve the SWS
(Verburg et al., 2012), whereas soil depth can influence the fallow efficiency (FE). Deep soils with
Stellenbosch University https://scholar.sun.ac.za

3
higher SWS are therefore critical reservoirs regulating water supply to plants (Berenguer & Faci,
2001; Zhang et al., 2013).
2.2 Background of Rooibos
2.2.1 Distribution and identification
Rooibos has a limited geographic range and grows in the Cederberg region of the Western Cape
(Joubert et al., 2008) as well as in the Northern Cape province of South Africa (Lötter, 2015). There
are four types of Rooibos tea namely, “Rooi” Tea, “Vaal” Tea, “Swart” Tea and “Rooibruin” Tea
(Morton, 1983). The Rooi Tea is further divided into the Nortier type (cultivated) and the Cederberg
type (wild growing). Cheney and Scholtz (1963) reported that the Nortier type, A. linearis, is an erect,
straggling, slender-stemmed shrub of 1.35 to 2 m in height. The taproot of A. linearis can descend
to 2 m in depth (Morton, 1983). Furthermore, its 60 cm long branches are fragile and red-brown in
colour, with 2-6 cm long linear needle-like leaves According to SARC (2016), the small needle-like
leaves have very limited surface area, which prevent significant moisture loss on hot days. Rooibos
grows actively from September to May and during the winter, it grows slower while it experiences a
period of dormancy or “rest period”. The prime flowering stage of Rooibos is during September and
November (Malgas & Oettle, 2007).
Joubert andSchultz (2006) and Joubert and de Beer (2011) reported that the “Vaal” Tea, “Swart”
Tea and “Rooibruin” Tea were harvested prior to 1966, but due to their poor quality, marketing and
production were discontinued. A. linearis is commercially cultivated in Piketberg, Clanwilliam, Van
Rhynsdorp, Wuppertal and Nieuwoudtville (Joubert & Schultz, 2006). The distribution of the
commercially cultivated A. linearis types are shown in Figure 2.1. The commercially cultivated
cultivar requires specific soil conditions for optimum production.
2.2.2 Climate and soil conditions
The Cederberg area falls within the Mediterranean-climate region. This climate is characterised by
warm, dry summers and mild, wet and cold winters (Cowling et al., 1996). In this climatic region,
90% of the annual rainfall occurs during winter (June to August) (Rundel & Cowling, 2013; Lötter et
al., 2014a). There are many limiting factors for plant growth and yield in the Mediterranean-climatic
region. The major limiting factors are: water-deficiency in the summer period (December to February)
(Lötter, Valentine, et al., 2014), highly acidic soils and nutrient-poor soils (Lötter & le Maitre, 2014).
Lötter (2015) reported that additional limiting factors are: a decrease in winter rainfall, more erratic
distribution of rainfall and an increase in the maximum temperature of up to 0.027°C per year. These
factors can constrain crop production as Mediterranean-type ecosystems are threatened by climate
change (Engelbrecht et al., 2009; Lötter et al., 2014b).
Stellenbosch University https://scholar.sun.ac.za

4
Figure 2.1: Map indicating Rooibos production areas in South Africa (A) and the Western Cape (B), respectively (map was supplied by Rooibos Ltd., Clanwilliam).
A
B
Stellenbosch University https://scholar.sun.ac.za

5
The optimum annual rainfall for Rooibos production is at least 300-350 mm (Lötter & le Maitre, 2014),
but global climatic models estimate that the total winter rainfall will decrease to below 165 mm
annually (Nakicenovic & Swart, 2000). Rooibos grows in fynbos soils that are sandstone- derived
(Rundel & Cowling, 2013; Bradshaw & Cowling, 2014), sandy, well-drained, nutrient-poor and highly
acidic (pH range of 3-3.5) (Muofhe & Dakora, 2000). According to Muofhe and Dakora (2000), these
infertile soils have a low level of nitrogen (N), phosphorus (P) and calcium (Ca) elements. Due to the
restrictive environment, fynbos plants have developed several specialised mechanisms, which help
with nutrient uptake necessary for survival. These specialised mechanisms are: cluster roots
(Hawkins et al., 2011; Lambers et al., 2006), arbuscular mycorrhizae (AM) (Chimphango et al., 2015)
and rhizobial symbiosis (Muofhe & Dakora, 1999; Sprent et al., 2010). The acidic soils in the
Cederberg region have a high concentration of aluminium (Al) ranging from 110 to 275 μg.g-1 (Kanu
et al., 2013). The cluster roots immobilise Al to protect against Al toxicity (Lambers et al., 2006;
Lamont, 2003). Furthermore, the cluster roots also mobilise the poorly available P (Lambers &
Shane, 2007). The AM is capable of enhancing uptake of poorly available P (Lambers et al., 2006)
and transporting it throughout the plant (Hawkins et al., 2011). Nodulating legumes, such as Rooibos,
have a pH raising mechanism to overcome the adverse effect of the low pH in the soil, which
promotes a symbiotic relationship with rhizobial bacteria, specifically the Bradyrhizobium species
(Hassen et al., 2012). Rooibos is also able to fix its own N at concentrations of 105-128 kg.ha-1
according to Dakora et al. (2000) and Chimphango et al. (2015).
2.2.3 Cultivation
The Nortier type of Rooibos is known to be a “seeder” (van der Bank et al., 1999), which cannot re-
sprout after a fire. A. linearis can only regrow after a fire from a soil-stored seed bank (Lötter, 2015).
Le Roux et al. (1992) invented micro propagation as an alternative to planting seeds, but most of the
Rooibos died shortly after planting. Joubert and Schultz (2006) attempted cuttings but the result was
unsuccessful. The hard-shelled seeds are dispersed by ants. Seeds can be collected from: (1) ant
hills, (2) green pods (pods are harvested, placed into bags to ripen and dried before ejecting seeds),
or (3) laboriously working the soil (Cheney & Scholtz, 1963). The germination of the seeds is
increased by special smoke treatment and acid scarification (Lötter, 2015). The seeds are planted
between February and March on well prepared seed beds (Lötter, 2015). Between June and August,
after the first winter rainfall, seedlings ranging between 100 to 150 mm in height are transplanted to
plantations in rows approximately 1 m apart. According to Chimphango et al. (2015) the plant spacing
can vary among farmers.
Stellenbosch University https://scholar.sun.ac.za

6
After eight to ten months, branching is stimulated by topping the plants to a height of 30 to 45 cm,
depending on the height of the plants. The first harvest takes place in the late summer months and
produces a low yield. After three years, the plants can be seen as a full production (Cheney &
Schotlz, 1963). Highest harvest occurs once the plant has reached the age of four or five years.
Commercial Rooibos has an average lifespan of seven years (Cheney & Scholtz, 1963).In 1977 it
became evident that Rooibos was susceptible to diseases and this affect the average lifespan of the
plants. Smit and Know-Davies (1989) diagnosed an outbreak of a die-back disease of Rooibos in
1977, caused by the fungal pathogen, Diaporthe phaseolorum. Other fungal diseases are sudden
death (the pathogen is still unknown) and black-tip caused by Colletotrichum acutatum (Spies, 2005).
The damage caused by these diseases resulted in the death of the Rooibos plant after the first
harvest. Registered fungicides are used to control the diseases on the fully-grown Rooibos plant and
seedlings, but most Rooibos farmers use crop rotation to reduce these pathogens. The cover crops:
oats, wheat or lupin (depending on weather and soil conditions) are planted over a period of one or
two years in between the Rooibos tea plant cycles (Pretorius et al., 2011). The pests that cause
damage to the Rooibos plant are clearwing moth, leafhopper and looper (Hatting et al., 2011). The
cover crops also prevent wind erosion. The insects are controlled by some chemical spraying or
biological control mechanisms, such as pheromone traps (Joubert & Schultz, 2006).
Before planting, the field is prepared by ripping, disking or mouldboard ploughing to loosen the soil
and remove the old Rooibos plants (Smith, 2014). Sometimes the Rooibos plants are sliced into
smaller pieces by using a ‘straight blade cutter’ or ‘slasher’ before the soil can be ploughed.
Fertilisers are used sparingly within the industry since most of the cultivation of Rooibos is done
organically, but there are some farmers who fertilise their soils. Smith (2014) noted that only a small
amount of fertiliser is sufficient, and the most common fertiliser used among farmers is phosphate
viz. rock phosphate.
2.2.4 Production
Currently, 99.5% of Rooibos is cultivated and the remainder (wild-growing) is mostly produced by
non-commercial farmers (SARC, 2016). The cultivated area is about 95 000 ha (SARC, 2016). There
are approximately 580 Rooibos farmers in South Africa. Secondary processing of Rooibos is done
by eight large processers that are responsible for about 90% of the market (DAFF, 2015). Over the
last 18 years, the production of Rooibos has varied between 10 000 and 18 000 tons per year. All of
this was under a dryland production (Rooibos Ltd, 2016). According to Kruger (2014), the world
demand for Rooibos tea increased while the supply decreased. The available Rooibos production
area is limited by environmental protection laws and therefore it is important to produce as much
quality tea as possible in the cultivated area that is already in use.
Stellenbosch University https://scholar.sun.ac.za

7
2.3 Soil chemical and physical properties that affects the soil water dynamic
2.3.1 Soil chemical properties
Soil water content can influence the soil chemical properties where higher SWC increases nutrient
acquisitions (Brunel et al., 2013). Misra and Tyler (1999) showed that if the SCW increased, the soil
solution bicarbonate (HCO3), P and manganese (Mn) concentrations and pH(H2O) increased.
Furthermore, the calcium (Ca), magnesium (Mg) and zinc (Zn) concentrations decreased. However,
Metwally and Pollard (1959) found that the nutrient uptake with higher SWC increased in the general
order Ca > K, Mg > P > N, where K = potassium. In a series of pot experiments conducted with
summer wheat growing in sandy soils at the Institute for Cereal Production, Martin-Luther University
of Halle-Wittenberg, Germany showed that increased SWC improved the contents of N, K and P
only during the early stages of growth. However, nutrient uptake was not reduced until maturity of
the summer wheat.
Parwada and van Tol (2017) reported that the effect of SWC on SOC was significant, where wet
sandy soils promoted rapid loss of SOC compared to alternating wet-dry soils. Soil organic carbon
is not necessarily influenced by the SWC, but SOC can have an impact on SWC.
2.3.1.1 Soil organic carbon
Several researchers have studied the relationship between SOC and SWC. Rawls et al. (2003)
reported that at low SOC, only sandy soils had the best positive correlation with SWC. All three soils,
namely sandy, silty and clayey ones, had a positive correlation with SWC at high SOC, whereas the
positive correlation of SWC and SOC of sandy and silty soils were the highest. However,
approximately 30% SOC is stored in the top 20 cm soil layer (Bai et al., 2016). Soil organic carbon
can also reduce the bulk density (Morlat & Chaussod, 2008).
The effect of fertilisers on SOC are significant. In a dryland maize study in China, the application of
N and P increased the shoot and root biomass and increased the SOC in the 0-60 cm soil layer
compared to the control which was not fertilised (Liu et al., 2013). Gong et al. (2012) reported similar
results for dryland maize but the chemical application of NPK in a 150:60:150 ratio produced the
best results. Plant roots can make a significant contribution to SOC. Where the root mass 30% in a
particular soil profile, the SOC was approximately 50% (Dietzel et al., 2017). The roots of prairie and
maize were also examined to quantify where SOC increased in shallow and deep soils. Due to the
difference in root systems, the roots of prairie contribute more SOC in the shallow soils and root of
maize contributed more to SOC in the deeper soils. Lajtha et al. (2014) reported a sharp decrease
in SOC if there were no roots present in the soil. The effects of root exudations are not well
documented. However, Luo et al. (2014) reported that root exudation is one of the major sources of
SOC.
Stellenbosch University https://scholar.sun.ac.za
8
2.3.2 Soil physical properties
2.3.2.1 Soil texture
Soil texture is one of the most fundamental soil physical properties and can be defined as the
different range of particle sizes in a soil, soil texture consists of coarse fragments, sand, silt and clay
(Fernandez-illescas et al., 2001). The sand fraction can increase or decrease in soil depth. Adugna
and Abegaz (2015) found that the sand fraction decreased with soil depth. The sand fraction in the
topsoil (0–15 cm) was 73.6% and in the subsoil (15–30 cm) it was 62.8%. In some cases, sand
fraction increases with soil depth. Wang et al. (2008) reported that the sand fraction in the topsoil (0-
10 cm) was 94.4% and beneath 10 cm, the sand fraction ranged between 95 to 97%, depending of
the slope. Sometimes the soil texture can be homogenous in soil depth. Liang et al. (2009) found
that on non-cultivated soils, the sand fraction was homogenous throughout the soil depth but the
sand fraction of cultivated soils decreased with soil depth.
The arrangement of particle sizes influences the porosity of the soil. The porosity of sandy soils
(30%) is less than clayey soils (50%), since sandy soils have larger particle sizes than clayey soils
(Hacke et al., 2000). Therefore, soil texture influences the water movement. Hultine et al. (2005)
found that water infiltrates faster in sandy soils than clayey soils. After the infiltration of water into
the soil, the soil water moves further downward which is redistribution. The change of water content
over time in sandy soils is faster due to larger and fewer pores, and only a small amount of the water
is retained in the pores (Dodd & Lauenroth, 1997).
2.3.2.2 Bulk density
Bulk density is another important soil physical property because of the wide impact on numerous soil
processes. Sandy soils have a higher bulk density than clayey soils (USDA, 1998). Chaudhari et al.
(2013) found that sandy soils had a bulk density range between 1.25 and 1.57 g.cm-3, whereas the
bulk density of typical clayey soils reported by Neves et al. (2003) ranged between 1.04 and 1.62
g.cm-3.
A long-term (1996–2008) field experiment under semi-arid conditions in Turkey was carried out to
investigate the effect of mineral fertilisers on bulk density and showed no significant difference
compared to the control which receiving no mineral fertiliser in the 0–15 cm soil layer (Celik et al.,
2010). However, in the 15–30 cm soil layer, there was a significantly difference in the bulk density
between the mineral fertiliser and control treatments. Similar findings were reported by Intrawech et
al. (1982).
Tillage can decrease the bulk density due to loosening effect (Hoffman, 1990). The bulk density on
soils which received minimum tillage was significant lower in the topsoil (0–18 cm) compared to the
Stellenbosch University https://scholar.sun.ac.za

9
non-till soils (Fabrizzi et al., 2005). Ferreras et al. (2000) reported that there was no significant
difference in soil bulk density between non-tillage and conventional till. The bulk density increases
with soil depth due to changes in compaction. The bulk density of a sandy soil in the top soil (0–15
cm) was 1.58 g.cm-3 and 1.64 g.cm-3 in the subsoil (15–30 cm) (Fernández-Ugalde et al., 2009). If
the soil has some compaction, the root growth decreased. On compacted soils, the root volume was
27.8% lesser than on non-compacted soils reported by Tracy et al. (2012). Moreover, lower bulk
density does increases the soil water content (van Wesenbeeck & Kachanoski, 1988). Therefore, a
favourable bulk density for farming ranges between 1.4 to 1.6 g.cm-3 (Hazelton & Murphy, 2007).
2.3.2.3 Soil water retention curve
Soil organic carbon can influence the soil water retention curve (SWRC), where increases in SOC
led to an increase in WHC in sandy soils (Rawls et al., 2003). Since soil texture influences the SWRC,
Chestworth (2008) stated that at field capacity (FC) sandy soils retain less than 10% water by mass
and clayey soils retain more than 40% water by mass. Therefore, it is expected that the permanent
wilting point (PWP) and WHC of sandy soils are lower than for clayey soils (Bandaranayake et al.,
2007). Table 2.1 illustrates that soils with a high sand fraction have lower WHC compared to the
soils with a high clay fraction. Morgan et al. (2001) found that the FC (at -5 kPa), PWP (at -1 500
kPa) and WHC was 85 mm.m-1, 20 mm.m-1 and 65 mm.m-1 for Apopka fine sand (> 95% sand),
respectively. Bulk density can influence the WHC and Abu-Hamdeh (2004) reported that the WHC
decreased by 10% from non-compacted soil to compacted soil.
Table 2.1: List of studies of soils of different textures and their water holding capacity (WHC) in the 0-60 cm soil layer.
Clay
(%)
Silt
(%)
Sand
(%)
Soil texture WHC
(%)
Author(s)
4.8 18.1 76.8 Loamy sand 14 Mohamed et al.
(2016)
6.7 25.1 68.2 Sandy loam 16 Basso et al.
(2013)
22.0 33.0 45.0 Loam 23 Akhter et al.
(2004)
2.4 Soil water dynamics in arid and semi-arid areas
In arid and semi-arid areas, the SWC is dependent on rainfall (De Vita et al., 2007). In Namibia under
arid conditions, the SWC in a bare sandy soil increased by 6 mm when it rained by 7 mm (Li et al.
2016). Moreover, the SWC in a soil covered with vegetation increased more by 9 mm. Also fallowing
Stellenbosch University https://scholar.sun.ac.za

10
with higher FE produced higher crop production in the following year, though the rainfall was lower
than 100 mm (Smika, 1970). During a summer fallow period, if the FE increased by 32%, the crop
yield increased by 50% (Greb et al., 1967). Therefore, dryland crops are dependent on the amount
of water stored in the root zone during rainfall (Hoffman, 1997) and in the soil after a fallow period
(Feng et al., 2015).
2.4.1 Calibration
2.4.1.1 Soil-specific calibration
Measurement of SWC is of major importance when evaluating soil water dynamics (SWD) in soils.
To validate the SWD, it is necessary to install soil-moisture sensors is to determine the SWC. In
previous research, it was reported that capacitance sensors often require soil-specific calibration.
Nemali et al. (2007) found that calibration was necessary because the output was significantly
affected by the electrical conductivity (EC) of the soil. Several researchers found that soil-specific
calibration is necessary for mineral soils (Paige & Keefer, 2008; Kinzli et al., 2012). Sakaki et al.
(2010) suggested that soil-specific calibration is also important for varying soil types. Moreover, Saito
et al. (2008) obtained similar results showing that the accuracy of the volumetric water content
(VWC) had been improved when soil-specific calibration was applied. Analysis of the accuracy of
the calibration are widely determined by root mean square error (RMSE) (Qin et al., 2013). Ventura
et al. (2010) demonstrated that the factory calibration of a ECH2O sensor underestimated or
overestimated the VWC (RMSE = 15.78%), whereas, the soil-specific calibration improved the
accuracy of RMSE = 3.58%. Similar results were obtained by Varble and Chávez (2011).
2.4.1.2 Temperature sensitivity calibration
The effect of temperature fluctuations on capacitance sensors are significant under field conditions
especially in the top soil of 15 cm (Cobos & Campbell, 2007). Below the 15 cm soil layer, the effect
of soil temperature fluctuations are negligible (Jones et al., 2005). Or & Wraith (1999) studied the
effect of soil texture and soil temperature on time-domain reflectometry (TDR) having lengths from
0.15 to 0.30 m in sealed soil columns placed in a temperature-controlled environment. They reported
that the sandy loam soil showed that SWC decreased with increasing soil temperature. Silt loam soil
showed an increase in SWC with increasing soil temperature. Gong et al. (2003) also found that the
SWC decreased with increased soil temperature of sandy loam soil when the volumetric water
content was above 0.30 m3.m-3. However, Peterson et al. (1995) reported that in dry sandy soils, the
SWC increased with increasing soil temperature. In contrast, Fares et al. (2007) demonstrated that
the SWC decreased with increasing soil temperature of dry sandy soils at 0 and 0.02 m3.m-3 water
content. According to Rosenbaum et al. (2011), the sensors underestimated the SWC under low
Stellenbosch University https://scholar.sun.ac.za

11
temperature of 5-25°C and overestimated under high temperature of 25-40°C. After the temperature
correction, the accuracy of soil water measurements had improved.
2.4.2 Soil water balance
Monitoring of the soil water balance is necessary for seasonally dry climates (Feng et al., 2015;
Fernandez-illescas et al., 2001) to manage unwanted water losses and maximise water storage. If
the water added exceeds the water withdrawn, the water content change is positive and vice versa.
Equation 2.1 can be expressed in integral form according Hillel (2004):
(∆S + ∆V) = (P + I + U) − (R + D + E + T ) [Eq. 2.1]
where (expressed in terms of volume of water per unit land area):
ΔS = change in root-zone soil-moisture storage
ΔV = amount of water incorporated in vegetative biomass
P = precipitation
I = irrigation
U = upward capillary flow into the root-zone
R = runoff
D = downward drainage out of the root-zone
E = direct evaporation from the soil surface
Tr = transpiration by crops
The parameters, E and Tr, can be combined as evapotranspiration, ET, since surface evaporation
and plant transpiration processes are continuously (Allen et al., 1998). Evapotranspiration is the
largest loss parameter of the SWB (Porporato et al., 2004) in the Mediterranean region (Lazzara &
Rana, 2010).
Stellenbosch University https://scholar.sun.ac.za

12
2.4.3 Selected factors that affect the soil water content
2.4.3.1 Fertilisation and soil depth
A three-year study in China showed that fertilisation had a significant effect on SWC for sandy soils.
(Song et al., 2010). Where the application of fertiliser (30 kg.ha-1 N; 45 kg.ha-1 P2O5) with manure
had higher SWC in the 10 cm soil layer compared to the no fertiliser treatment. Brar et al., (2015)
demonstrated that inorganic fertilisers resulted in higher SOC and, in turn, increased SWC and yield
of wheat and maize in India.
The water available at the end of the wet season and SWC during the summer appear responsible
in soil depth. Tromp-van Meerveld and McDonnell (2006) found a correlation between soil depth and
SWC, where deeper soils had higher SWC in wet and dry seasons.
2.4.3.2 Soil temperature
Soil temperature is one of the primary factors in determining the rates and directions of soil physical
processes. Temperature governs evaporation and plays an important role in water loss. The only
way that fertilisers affect the soil temperature is by improving plant growth. If there are more plants
on a field, the following will happen: greater amount of crops increased the shading with decreasing
the solar radiation on the soil surface (Díaz-Pérez, 2013). Increased shading, decreased the soil
temperature at the root zone (Díaz-Pérez et al., 2005; Power et al., 1986). Decreasing the soil
temperature caused higher SWC (Gauer et al., 1982; Carter & Rennie, 1985). The high soil
temperature over 25°C in the root zone can inhibit the root growth as Wort (1940) found on dryland
wheat.
Sriboon et al. (2017) reported that the soil temperature in the 0–20 cm layer was high in the day and
lower at night compared to the 20–40 cm layer. On rainy days, the night temperatures are higher
than on sunny days (Manrique, 1988). The day temperature of the rainy days is only 1–2°C higher
than the night temperatures reported by Manrique (1988). van Gestel et al. (2013) demonstrated that
the temperature fluctuations under arid condition were larger in the 0–5 cm layer than deeper in the
soil profile. Similar observations were made by Cahill and Parlange (1998) and Pedram et al. (2017)
where they reported that the soil temperature fluctuations were larger in the 0–5 cm layer.
Stellenbosch University https://scholar.sun.ac.za

13
2.4.3.3 Evapotranspiration/evaporation
Evaporation occurs in three stages and water loss from the soil is a result of drying (Hillel, 1980).
The first stage (initial constant-rate stage) of E only lasts for few hours in a dry climate (Hillel, 1980).
The second stage (intermediate falling-rate) persists longer than the first stage (Rose, 1968). The
third stage (residual slow-rate stage) persists for days or even for weeks at a nearly steady rate (Idso
et al., 1974). Gardner and Hillel (1962) used an equation to predict the evaporation rate during the
falling- and slow-rate:
e= -dW
dt=
D(θave)Wπ2
4L2 [Eq. 2.2]
where: D(θave) = diffusivity at the average water content of a soil
profile (mm2.day-1)
θave = average volumetric water content of the soil profile (W/L)
W = total amount of water in the soil profile (mm)
L = length of the soil profile (mm)
In 2007, Jovanovic et al. (2011) investigated of dryland wheat in Voëlvlei Nature Reverse, South
Africa. They reported that the ET rate of the dryland wheat was higher during winter than in summer.
In summer, the ET rate was limited by water supply and the crops were under stress. In an unplanted
and two planted plots study, the unplanted plots had lower evapotranspiration rate compared to the
two planted plots (Chazarenc et al., 2010). Furthermore, between the two planted plots, the one with
the highest biomass had the highest ET rate. The effect of fertilisers on ET can be important. A six-
year field experiment of dryland wheat at the Station of the Agricultural Technology Demonstration
Center of Changwu County, China showed that N-fertiliser (162 kg.ha-1 N) increased the yield,
moreover the ET increased (Zhang, Yao, et al., 2016). Ren et al. (2016) demonstrated that the crop
growth under semi-arid conditions in China did not have a high ET in extremely dry years, but in
normal and extremely wet years the ET was high. Furthermore, the crops reduced the E rate in
extremely dry years. A study of Rooibos on a farm in Bloemfontein demonstrated that the Tr and
hydraulic redistribution during the summer season facilitated nutrient acquisition by releasing the
water in the shallow soil to enable acquisitions (Matimati et al., 2014). Furthermore, the Tr and
hydraulic redistribution also drove the water fluxes from deep to shallow soils to power the mass-
flow nutrient acquisitions.
The cumulative evaporation (E) is the highest in the top layer and decreases deeper down in the
soil (Table 2.2). An experiment at Akron, Colodra, Great Plains showed that the water loss from bare
Stellenbosch University https://scholar.sun.ac.za

14
soil was 1.5 times greater compared to the soils with surface cover or straw (Croissant et al., 2007).
Furthermore, if the wind speed was at 8.05 kph and temperature at 26°C, the E rate was 2.54
mm.day-1. If the temperature continued to increase, the E rate exceeded 7.26 mm.day-1. In contrast,
Hanks et al. (1961) indicated that there was no direct relationship between temperature and
evaporation. Under field conditions, E is rather limited by the water content in the soil. After rainfall,
the E rate increases but will decrease after 2–10 days as the water availability decreases (Klaassen
et al., 1998). A 51–day experiment conducted in northern Colorado piedmont (semi-arid field
conditions) to examine the effect of soil texture on bare soil E rate showed that sandy loam soils
have higher E rate than clayey loam soils in the top 3.8 cm soil layer after six days (Wythers et al.,
1999). After 30 days, the E rate of both soils was practically zero. However, Poulovassilis and
Psychoyou (1985) found that sandy soils had lower E rate than clayey soils due to lower SWC in
sandy soils.
Table 2.2: The effect of soil depth on cumulative evaporation of a bare field under semi-arid conditions located near Ames, IA (41.98° N, 93.68° W) (Xiao et al., 2011).
Soil depth
(cm)
Cumulative evaporation
(mm)
21-day period in 2007 16-day period in 2008
0 60 32
3 44 25
9 29 16
15 13 10
21 8 5
2.4.3.4 Drying front and diffusivity coefficient
A drying front is an interesting phenomenon which develops after the bare soil surface reach an air-
dry value. This drying-front moves deeper downward in the soil as a soil layer dries out. The vapour
diffusion or the hydraulic diffusivity is influenced by the initial- as well as the falling-rate stage of
evaporation (Hillel, 1980). The drying-front can vary due to different soil texture. A bare surface field
located near Ames, Iowa (41°N, 93°W) where the soil was silty, it shown that within six days the
drying-front proceeded greater than 13 mm in to the soil profile (Heitman et al., 2008). Higuchi (1985)
reported that the drying-front of a Kanto loam soil in Tokyo, Japan shifted down to the 100 cm soil
depth In a bare field study, it was reported that sandy soils can have a drying-front in the top 12 or
60 cm soil depth (Zeng et al., 2009). The thickness of the drying-front can vary although all the soils
are high in sand fraction (Table 2.3). In some cases of sandy soils, the drying-front can be 10–20 cm
thick (Wang, 2015).
Stellenbosch University https://scholar.sun.ac.za

15
Table 2.3: List of thickness of drying-front under different climatic conditions with different sand fraction.
Sand
Soil texture Conditions Thickness of
drying-front
Author(s)
(%) (cm)
91 Sandy Semi-arid < 0.3 Daamen and
Simmonds (1996)
96 Sandy Semi-arid 2-9 Yamanaka and
Yonetani (1999)
98 Dune sand Arid 10-18 Wang and
Melesse (2006)
The hydraulic diffusivity is known as the ratio of the flux to the soil water content (Hillel, 2004).
Doering (1965) developed an equation where the diffusivity is measured directly:
D(θ)=4L2 dθ/dt
π2(θ-θf) [Eq. 2.3]
where: L = length of soil profile (mm)
dθ/dt = instantaneous rate of water loss (mm3.mm-3)
θ = instantaneous volumetric water content (mm3.mm-3)
θf = final volumetric water content (mm3.mm-3)
Unfortunately, not a lot studies have been done in hydraulic diffusivity. Despite this, three
researchers (Brutsaert, 2014; Inkoom et al., 2015; Wang et al., 2004) found that the diffusivity
coefficient decreased from sandy soils to clayey soils.
2.5 The effect of fertilisation and soil depth on biomass production, root
development and water use efficiency
The application of fertilisers can either increase or decrease biomass production. In general, the
biomass production will be higher on a soil which has high SWC and also higher SWS. Root
development also depends on the fertiliser applied and soil depth. The application of fertilisers may
accelerate or reduce the root growth, whereas soil depth can restrict the root growth. Fine roots grow
mostly in the 0–20 cm soil layer (Hillel, 2004) and it is here where the nutrient acquisition occurs
(Hawkins & Cramer, 2013). The long roots in the deeper soil layer can also take up water (Hillel,
2004). The WUE is highly dependent on the SWS.
Stellenbosch University https://scholar.sun.ac.za

16
2.5.1 Biomass production
Since the application of fertiliser and soil depth affects the soil properties, it is expected that biomass
production may also be affected. Unfortunately, there is no publishes literature on the effect of
fertiliser and soil depth on Rooibos biomass production. Despite this, some general assumptions can
be made. After one year of the fertiliser (5 mg.kg-1 P [Ca3(PO4)2], 50 mg.kg-1 N [NH4NO3]) application,
the shoot biomass of fynbos shrubs of sand-plain lowland fynbos at Pella, in the South-Western
Cape increased compared to the unfertilised plots reported by Witkowski and Mitchell (1989).
Inorganic fertiliser containing low levels of 20 mg.kg-1 N and 2 mg.kg-1 P increased the shoot and
root biomass of five-year fynbos shrubs Protea repens in Sosyskloof situated in the Jonkershoek
State Forest, South Africa as reported by Lamb and Klaussner (1988). However, high level of P (10
mg.kg-1 up to 50 mg.kg-1) reduced the shoot biomass production (Hawkins et al., 2008). Hawkins
and Cramer (2013) reported that one fynbos shrub experienced a decrease in shoot biomass at P
concentration of 10 mg.kg-1 P, whereas an adjacent shrub did not show a reduction in shoot biomass
product, even when P was as high as 250 mg kg-1. Similarly, high P concentration suppressed the
root growth and therefore, reduced the root biomass (Lambers & Shane, 2007).
Deeper soils have more SWC and higher WHC than shallow soils (Yang et al., 2012). Calvino et al.
(2003) examined the effect of soil depth on dryland maize in Argentine Pampas. It was concluded
that shallow soils presented lower biomass than deep soils. The higher biomass in response to
deeper soil depth was related to higher SWC with higher water availability.
2.5.2 Root development
Since fynbos is sensitive to fertiliser, it is expected that the roots will also be sensitive. The P uptake
capacities and tolerance to high P can vary between fynbos species. Harris (2006) analysed the P-
toxicity on three Proteaceae species, where the cluster-root forming species was more sensitive to
higher P levels compared to species without cluster roots. A study investigating the use of different
compost for Rooibos production in the Clanwilliam region, South Africa, showed that Rooibos is not
adapted for normal to high P levels (Smith, 2014). Furthermore, the P level of 18 mg.kg-1 lead to P
toxicity, suppressed the root development and the plants died.
Deep soils provide an ideal opportunity for deep rooting depth (Lopes & Reynolds, 2010). Shallow
soils are often restricted by underlining stones of rock (Bengough et al., 2006) which can be a
problem for deeper rooting. Another problem is that White and Kirkegaard (2010) showed that deep
roots were found where bulk density throughout in the soil profile is uniform. Though, Cairns et al.
(2011) demonstrated that effective rooting in sandy soils is deep.
Stellenbosch University https://scholar.sun.ac.za

17
2.5.3 Water use efficiency
Subhan et al. (2017) demonstrated that the WUE of winter wheat increased with 150 kg.ha-1 N,120
kg.ha-1 P and 90 kg.ha-1 K fertiliser under arid conditions in Pakistan. Results from a 39-year long-
term study in semi-arid southwestern Saskatchewan showed that the application of 65 kg.ha-1 N and
9–10 kg.ha-1 P fertiliser of spring wheat increased the WUE (Kröbel et al., 2012). The application of
high amount of N fertiliser can be risky, and can lead to inefficient water use. Increasing the N status
in plants often reduces the soluble carbohydrate reserves (Angus & Van Herwaarden, 2001). Deep
soils had higher SWC and are beneficial for deep vertical roots distribution which can improve the
WUE under drought conditions (Feng et al., 2017).
2.6 Conclusion
Where dryland farming depends on rainfall and water stored in a fallow season, the importance of to
solve the problem in a sustainable way needs to be considered. Not only the limited water access
and threats of economic pressure but global warming on Rooibos production are also a problem.
Rooibos only grows in the Western- and Northern Cape provinces with low erratic rainfall patterns.
For effective Rooibos production, knowledge of SWD is important for biomass WUE.
The only way that fertiliser can influence the SWD is through plant and root growth. If root growth
increases, they contribute more SOC to the soil. Furthermore, higher SOC improves WHC. Recent
studies showed the effect of soil depth on SWD under semi-arid conditions. Where deep-stored
water needs to be considered for optimum yield during drought seasons.
Information regarding to the effect of fertilisation and soil depth on biomass production, root
development and WUE of Rooibos is very limited. However, the use of inorganic fertilisers are not a
common practice in Rooibos production. To place hope on inorganic fertilisers, the correct mixture
of fertiliser needs to determine for Rooibos, however, this is beyond the scope of the current study.
The application of fertilisers may improve the root growth but high P concentration should be to
avoid. Deep soils in dryland farming are necessary for deep rooting, so that plants van survive a
drought season.
The effect of NPK fertiliser on the WUE seems to be in question, with several studies indicating that
the fynbos shrubs are sensitive to inorganic fertilisers. This implies that under conditions of limited
rainfall, the amount of fertiliser must treat causality for effective WUE. Nevertheless, there are
reported benefits of inorganic fertiliser on fynbos growth and biomass. A few studies reports that
higher SWC and deep rooting in deep soils can increase the WUE.
Stellenbosch University https://scholar.sun.ac.za

18
Chapter 3: Materials and methods
3.1 Introduction
The soil water content under semi-arid and arid conditions is an important source for any dryland
crop (Yang et al., 2012). So far, little is known about how the fertiliser and soil depth affect the water
movement in Rooibos soil and the soil water balance. Rooibos farmers are worried because the
Rooibos production decreases every year. Therefore, to improve Rooibos production, understanding
the soil water balance, evaporation and water use efficiency of Rooibos tea, is important.
3.1.1 Experimental site and soil description
The field trial was conducted on Vaalkrans farm (32°00'38.2"S, 18°55'19.0"E) in the Clanwilliam
district, Western Cape (Fig. 3.1) with a mean height above sea level of ca. 570 m. Most of the soils
where Rooibos is produced in the Clanwilliam region occur on sandstone (parent material)
(Bradshaw & Cowling, 2014; Lötter & le Maitre, 2014), or are sometimes interrupted by relic hard or
soft plinthite material commonly referred as “kaiingsklip” (Smith, 2014). The soil form and family of
the soil in at the field trial was previously describe by Smith (2014) using the South African Soil
Taxonomy System (Soil Classification Working Group, 1991). The soil was classified as a Cartref,
Witzenberg (transition Wasbank) (Table 3.1).
Table 3.1: Soil classification of the Cartref soil at the field trial at Vaalkrans farm (Smith, 2014)
Soil depth
(cm)
Description Diagnostic horizon
20 Dry colour: 10YR7/4 in dry states; plant roots observed Orthic A
60 Dry colour: yellow 10YR 7/4 E-horizon
>60 Rock colour: 10YR 4/8; relic plinthic rock Litocutanic B
3.1.2 Experimental layout
At the chosen study site, the underlying material was fractured sandstone bedrock associated with
hard plinthite material. Prior to establishment of the field trials at the chosen 3 ha fallow site, a soil
depth map was generated by surveying the site on a 10 × 10 m grid using an auger and a GPS
device to a map plots using the commercial QGIS software (Quantum GIS Development Team,
2017) (Fig. 3.2). Areas of similar, moderate soil depth (30–80 cm) were selected to design the field
trial. The soil water balance field trial was conducted on similar shallower (30 cm) soils and deeper
soils (80 cm) (Table 3.2).
Stellenbosch University https://scholar.sun.ac.za

19
Figure 3.1: Aerial photo showing the position of the Vaalkrans farm north of Clanwilliam (A) and the trial site on the farm Vaalkrans, southeast below the homestead (B) taken on 27 February 2017 (Google Earth, 2016).
A
B
Stellenbosch University https://scholar.sun.ac.za

20
Figure 3.2: A soil depth map (10 × 10 m grid) generated by QGIS program at Vaalkrans farm.
Stellenbosch University https://scholar.sun.ac.za

21
Table 3.2: Treatments and soil depths of the experimental trial with four replications.
Treatment Soil depth (cm)
Shallow soil Deep soil
Unfertilised 30 80
Fertilised 30 80
Bare 30 80
Three treatments were applied to each of two soil depths, so there were six treatments in total. The
effect of fertiliser (20 mg.kg-1 N, 30 mg.kg-1 P and 20 mg.kg-1 K) on soil water use and plant root
physiology was compared to an unfertilised treatment at both sites (Table 3.2). The selected N
fertiliser was Yara VeraTM AmiPLUS which is a coated urea product containing urease enzyme
inhibitor called NBPT. This inhibitor helps the urea to be converted into mineral ammonium ion more
slowly in soils, greatly reducing volatilisation losses and improving N use efficiency by plants. The P
fertiliser used was Yara Maxiphos 20 P (double superphosphate Ca(H2PO4)2), while the K fertiliser
was Yara potassium chloride. The combination of the fertiliser was 30 kg urea ha-1, 104 kg TSP
ha-1 and 27.7 kg KCl ha-1. The total plot area was 81.0 m2. Each block of the four treatments consisted
of 6 rows of 12 Rooibos plants (bushes planted 0.75 m apart) with a row spacing of 1.5 m wide and
8.25 m in length. The total plot area was 81 m2. A bare soil treatment was included to be compare
for its evaporation and soil water storage with the shallow and deep soils (Table 3.2). All treatments
were replicated four times in a randomised block design (Fig. 3.3).
The field trial was initiated on 16 June 2016 when the fertilisers were applied by hand to the planting
rows and then the five-month-old rooibos seedlings (sown in February 2016) were planted. Before
planting, the soils were ploughed to a depth of 20 cm using a shallow tine implement and subsequent
mixing by large tractor wheels that passed over the soil twice going in opposite directions each time.
3.1.3 Soil chemical and physical properties
The soil samples to quantify chemical status were collected after the fertilisers were applied (Table
3.3). The soil chemical status of the unfertilised and fertilised treatment of shallow and deep soils
were determined at 0–20 and 20–40 cm soil depths. The SOC of the unfertilised and bare treatment
at the deep site were measured in 10 cm increments to 50 cm soil depth. Before the soil samples
were analysed by Analytical laboratories of the Western Cape Department of Agriculture, Elsenburg,
the soil samples were air dried, crushed and sieved through a 2 mm mesh sieve.
Stellenbosch University https://scholar.sun.ac.za

22
Figure 3.3: Trial experiment plot layout at Vaalkrans farm. US (unfertilised shallow), FS (fertilised shallow) and BS (bare shallow) selected on the shallow soils. UD (unfertilised deep), FD (fertilised deep) and BD (bare deep) selected on the deep soils.
Stellenbosch University https://scholar.sun.ac.za

23
Table 3.3: The dates when soil samples were collected for analysis of soil chemical and physical properties.
Type of soil analysis Collection dates
Soil chemical properties
pH(H2O) 16 June 2016
pH(KCl) 16 June 2016
Exchangeable cations (calcium, magnesium, sodium and potassium) 16 June 2016
Exchangeable anions (copper, zinc and manganese) 16 June 2016
Trace elements 16 June 2016
Soil organic carbon 4 July 2016
Soil physical properties
Texture 25 May 2016
Bulk density 25 May and 2 June 2016
Water retention curve 26 May 2017
Prior to fertiliser application and planting, the soil texture and bulk density in 10 cm increments were
determined on four representative samples from each of shallow soils (30 cm) and deep soils (80
cm) (Table 3.3). The sand fraction of the soil samples was determined by different size sieves (ASTM
D6913-04R2009, 2004), where the silt was divided into coarse and fine silt, clay fractions were
determined by pipet method as described by Gee and Or (2002) and using the specific ranges of the
textural fractions (Table 3.4). Only the organic materials were removed in the pre-treating. The
textural class was classified according to a textural triangle (United States Department of Agriculture,
1987). Bulk density was determined as described by Blake and Hartge (1986). The soil water
retention curve was determined at laboratory of the Department of Soil Science of Stellenbosch
University as described by Klute (1986).
Table 3.4: The specific ranges of textural fractions (United States Department of Agriculture, 1987).
Name of textural fraction Diameter limits
(mm)
Clay <0.002
Fine silt 0.002-0.0063
Coarse silt 0.0063-0.053
Very fine sand 0.053-0.10
Fine sand 0.10-0.25
Medium sand 0.25-0.50
Coarse sand 0.50-1.00
Very coarse sand 1.00-2.00
Stellenbosch University https://scholar.sun.ac.za

24
3.1.4 Soil water content determined by the Diviner 2000
The SWC was measured with a capacitance probe (Diviner 2000, Sentek Sensor Technologies Inc,
Stepney, Australia). A polyvinyl chloride (PVC) access tube was installed ca. 15 cm from a Rooibos
plant of each unfertilised and fertilised block. For each bare treatment block, the PVC access tube
was installed in the middle between the third and fourth row. The deep soils were drilled to the rock
at 105 cm and the shallow soils to 50 cm using an auger. Briefly, the PVC access tubes were driven
into the soil using a wooden plank and rubber hammer. Approximately 10 cm of the access tubes
remained above ground. For each PVC access tube, a plastic top cap was firmly fitted to the upper
end to prevent water entrance. The SWC was measured at 0–30 cm soil depth for the shallow soils
and 0–80 cm soil depth for the deep soils in 10 cm increments. Measurements were taken during
the growing season from July 2016 to April 2017 and were measured in volumetric units (mm/100
mm).
3.1.4.1 Calibration of the Diviner 2000
Soil-specific calibration of the Diviner 2000 was done on the 4th July 2016. The gravimetric water
content (GWC) was determined by collecting soil samples at 0-80 cm in 10 cm increments using a
tube sampler close to the PVC access tube (Fig. 3.4). The volume of samples was 10 cm3 to
determine the bulk density. The samples were collected in small plastic bags, sealed and were
weighed on an electronic balance in the field (Fig. 3.4). The electronic balance was placed on a
wood plank to ensure an accurate weighing. In the laboratory the samples were transferred to 250
mL glass beakers and placed in an oven to dry at 105°C for 24 hours (Hillel, 1980). Thereafter, the
samples were cooled off for a day in a desiccator containing CuSO4 to reach a constant mass.
Following this, the samples were weighed and the GWC, i.e. Pw, was determined as the percentage
in the sample of water as follows (Hillel, 1980):
Pw (%)=(wet sample mass - dry sample mass)
dry sample mass×100 [Eq. 3.1]
Volumetric water content was determined as m water per m soil depth as follows (Hillel, 1980):
θV(m3.m-3)=PW
100×
ρb
ρw [Eq. 3.2]
where: θV = volumetric water content (m3.m-3)
Pw = gravimetric water content (%)
ρb = bulk density (kg.m-3)
ρw = density of water (kg.m-3)
Stellenbosch University https://scholar.sun.ac.za

25
The linear regression was generated by plotting the field readings at a specific soil depth against the
calculated VWC as follows (Cobos & Chambers, 2010):
VWC = A1 × VWCfield + A2 [Eq. 3.3]
where VWC = volumetric water content (m3.m-3)
VWCfield = volumetric water content in the field (m3.m-3)
A1 and A2 = empirical coefficients
Thereafter, the root mean square error (RMSE) was used to qualify the calibration function as follows (Rowlandson et al., 2013; Parvin & Degré, 2016):
RMSE = 1
n∑ (VWC - VWCp)2n
i=0 [Eq. 3.4]
where RMSE = root mean square error
VWC = actual volumetric water content (m3.m-3)
VWCp = predicted volumetric water content (m3.m-3)
n = number of volumetric water content measurements
Figure 3.4: Tube sampler being used to determine the gravimetric water content and bulk density for calibration of Diviner 2000 on the left-hand site. Soil samples determined using the electronic balance on the right-hand site.
Stellenbosch University https://scholar.sun.ac.za
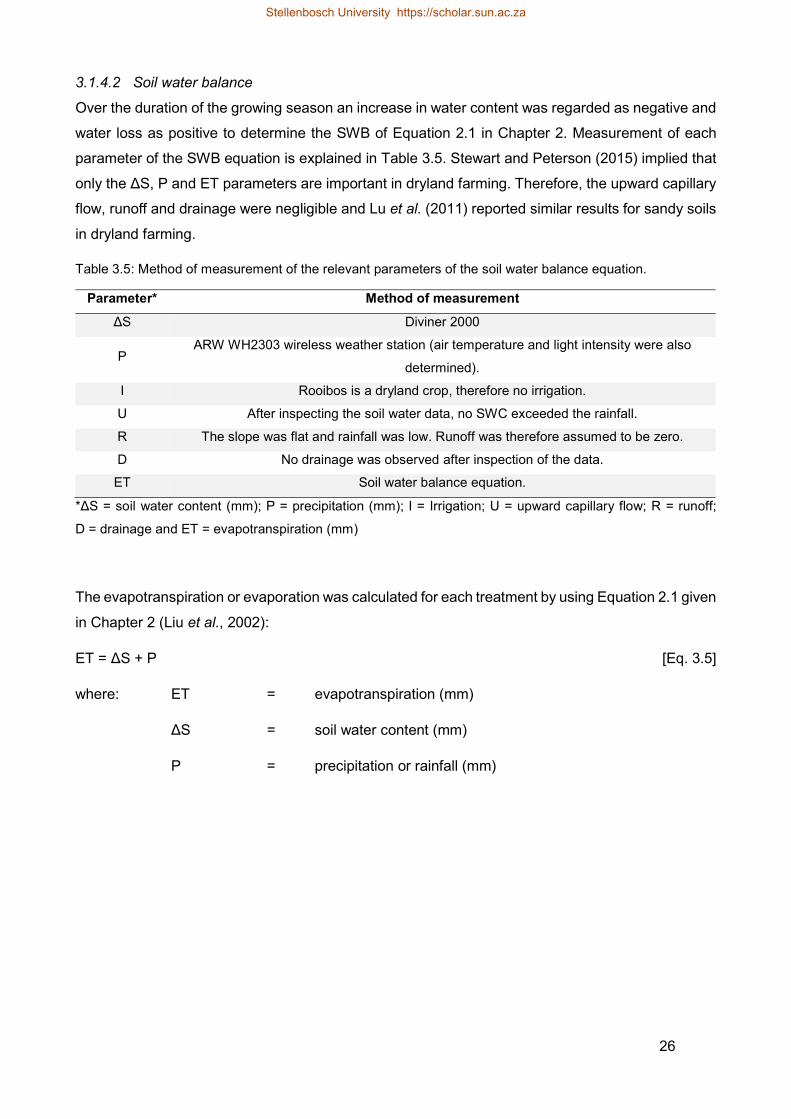
26
3.1.4.2 Soil water balance
Over the duration of the growing season an increase in water content was regarded as negative and
water loss as positive to determine the SWB of Equation 2.1 in Chapter 2. Measurement of each
parameter of the SWB equation is explained in Table 3.5. Stewart and Peterson (2015) implied that
only the ΔS, P and ET parameters are important in dryland farming. Therefore, the upward capillary
flow, runoff and drainage were negligible and Lu et al. (2011) reported similar results for sandy soils
in dryland farming.
Table 3.5: Method of measurement of the relevant parameters of the soil water balance equation.
Parameter* Method of measurement
ΔS Diviner 2000
P ARW WH2303 wireless weather station (air temperature and light intensity were also
determined).
I Rooibos is a dryland crop, therefore no irrigation.
U After inspecting the soil water data, no SWC exceeded the rainfall.
R The slope was flat and rainfall was low. Runoff was therefore assumed to be zero.
D No drainage was observed after inspection of the data.
ET Soil water balance equation.
*ΔS = soil water content (mm); P = precipitation (mm); I = Irrigation; U = upward capillary flow; R = runoff;
D = drainage and ET = evapotranspiration (mm)
The evapotranspiration or evaporation was calculated for each treatment by using Equation 2.1 given
in Chapter 2 (Liu et al., 2002):
ET = ΔS + P [Eq. 3.5]
where: ET = evapotranspiration (mm)
ΔS = soil water content (mm)
P = precipitation or rainfall (mm)
Stellenbosch University https://scholar.sun.ac.za

27
The cumulative evapotranspiration was also calculated by adding the weekly evapotranspiration
over the duration of the growing season as follows (Breña Naranjo et al., 2011):
ΣET= ETi+ ETi+1+….+ ETn [Eq. 3.6]
where: ET = cumulative evapotranspiration (mm)
ETi = evapotranspiration of week i (mm)
ETi+1 = evapotranspiration of the following week (mm)
ETn = evapotranspiration of the nth week (mm)
The fallow efficiency during the fallow periods (or the bare treatment) at shallow and deep sites was
determined as follows (Bennie & Hensley, 2001):
FE= ΔS
P×100 [Eq. 3.7]
where: FE = fallow efficiency (%)
ΔS = soil water content (mm)
P = cumulative precipitation or rainfall (mm)
3.1.5 Soil water content determined by the ECH2O soil moisture sensor
Continuously ECH2O sensors were installed in three experimental blocks (unfertilised = UD 4.1,
fertilised = FD 2.2, bare = BD 3) at the deep site to measure the redistribution of water and soil
temperature. Five ECH2O sensors were installed vertically in the soil profile ca. 15 cm from the PVC
access tubes of the Diviner 2000 and experimental plant at 5, 15, 25, 45 and 65 cm soil depths (Fig,
5.3). A sharp metal blade was used to make an incision wide enough to insert the sensors. The five
sensors from each treatment were directly connected to an ECH2O datalogger (Decagon Devices)
(Fig. 5.3). The datalogger was programmed to measure the VWC and soil temperature every 10
minutes. Measurements of the VWC (in raw counts) and soil temperature (Table 3.6) was conducted
from July 2016 to September 2017. Raw measurements of the ECH2O were downloaded by
connecting the sensors through the USB Cable Adapter (UCA) using the ECH2O Utility (Decagon
Devices, 2016). The UCA was provided in the package together with a ECH2O System Software
CD. The driver for the UCA was installed on the laptop before it could be used to communicate with
the ECH2O sensors. The raw measurements of the ECH2O output were downloaded to a .xls file
format (Microsoft Excel 2016). During the downloading, all raw counts were converted into the
volumetric units by factory calibration for each type ECH2O sensor.
Stellenbosch University https://scholar.sun.ac.za

28
Table 3.6: Soil temperatures (°C) measured at different soil depth of the relevant treatments.
Treatment Soil depth
(cm)
Unfertilised 5, 15 and 25
Fertilised 5 and 15
Bare 5, 15, 25 and 45
3.1.5.1 Calibration of the ECH2O sensors
Soil-specific calibration of the ECH2O sensors were done in the laboratory on 16 and 17 July 2017
as described by Cobos and Chambers (2010). The top horizon of the disturbed soil in Vaalkrans
farm were collected and were oven-dried at 105°C. The soils were packed in five containers (5 L) an
approximate bulk density of 1.56 g.cm-3. Volumes of water of 20%, 40%, 60%, 80% and 100% were
added to bring the water content to the desired water content levels. No water was added for the 0%
water content treatment. The ECH2O sensors were fully inserted in the soil which included the black
or white plastic base of the sensor. A handheld ProCheck meter was used to determine the VWC
(was measured in m3.m-3) of the ECH2O sensors. Raw counts of all water content treatments were
also determined.
Figure 3.5: Installation of the ECH2O sensors at the BD 3 block (bare treatment of deep soil) to measure the volumetric water content and soil temperature on the lefthand side. On the righthand side is an ECH2O data logger ca. 15 cm to a PVC access tube.
Stellenbosch University https://scholar.sun.ac.za

29
A linear regression was generated by plotting the raw counts of the ECH2O against the estimated
VWC as follows (Cobos & Chambers, 2010):
VWC = B1 × raw counts + B2 [Eq. 3.8]
where VWC = volumetric water content (m3.m-3)
mV = the ECH2O sensor output in raw counts
B1 and B2 = empirical coefficients
The raw counts of the field readings were inserted in the calibration equation to determine the actual
calibrated VWC for each treatment of the deep soil at the selected soil depths.
3.1.6 Biomass production, root system characteristics and biomass water use efficiency
Three Rooibos tea plants were destructively harvested by hand for each of the four treatments on
20 October 2016, 22 February 2017, 26 May 2017 and 25 September 2017. Harvesting was done
by hand using a pruner and shovel. Firstly, the shoots were cut off by the pruner and thereafter, the
roots were dig out with the shovel. All the dates of measurement of each specific plant analysis are
shown in Table 3.7. The plants on 20 October 2016 were still too immature for plant analysis and,
therefore this date was excluded of the investigation. Shoot and root biomass was determined, where
the roots were washed out with potable water on top of a 0.053 mm sieve to prevent fine roots from
being lost.
Table 3.7: The dates of measurements of plant analysis of Rooibos plants growing in shallow and deep soils.
Following this, the shoots and roots were oven dried at 60°C until no mass losses occur. Shoot and
root biomass were expressed as total mass (g) per plant. Thereafter, root studies were conducted
to determine the effect of fertilisation and soil depth on Rooibos root development. The N-fixing
Plant analysis Soil depth(s) Dates of measurement
Shoot and root biomass Shallow and deep
22 February 2017
26 May 2017
25 September 2017
N-fixing nodules Deep 22 February 2017
26 May 2017
Root length Shallow and deep 22 February 2017
26 May 2017
Root system characteristics Shallow and deep 26 May 2017
Stellenbosch University https://scholar.sun.ac.za

30
nodules of the roots were counted and length was measured with a digital microscope (Celestron
44302-B Deluxe Handheld Digital Microscope). Photos were also taken with the digital microscope.
The length of the taproots was measured using a cotton rope (4 mm thick) and a metal ruler (Foska®
Art No. SG030). The cotton rope was placed alongside the taproot and the length of the rope was
measured with the metal ruler in centimetres. Some of the taproots were divided and only the longest
root was measured.
Photos were taken to study the root system characteristics. The roots were classified into six classes
according to their diameter (Ø), namely very fine (Ø ≤ 1 mm), fine (1 mm < Ø ≤ 2 mm), medium
(2 mm < Ø ≤ 5 mm), coarse (5 mm < Ø ≤ 10 mm), thick (10 mm < Ø ≤ 20 mm) and very thick
(Ø > 20 mm) (Böhm, 1979). The biomass (g) and length (cm) of each root classification were
determined at 0–10, 10–20, 20–30, 30–40 and > 40 cm soil depths. The last step was to determine
the biomass water use efficiency at the end of February 2017 as follows (Clifton-Brown &
Lewandowski, 2000):
WUEB= DM
ΣET [Eq. 3.9]
where WUEB = biomass water use efficiency (kg.ha-1.mm-1)
DM = dry mass of the vegetative growth which forms the
harvestable biomass (kg.ha-1)
ET = cumulative evapotranspiration (mm)
3.1.7 Statistical analysis
An appropriate analysis of variance (ANOVA) was performed, using Rstudio version 1.0.153
(RStudio Team, 2017), and SigmaPlot version 12.5 (SigmaPlot Team, 2014). The data was tested
for significant statistical differences with 95% confidence interval. Microsoft Excel 2016 was used to
fit linear regression models.
Stellenbosch University https://scholar.sun.ac.za

31
Chapter 4: Soil chemical and physical properties of the soil
at the trail site
4.1 Introduction
This chapter consists of all the soil chemical and physical properties of the selected study are of
Vaalkrans farm. Chemical results are first presented and discussed following with the physical
results. The results are discussed in terms of statistical effects and differences. Understanding the
chemical and physical properties in terms of fertiliser and soil depth can help explain the soil water
dynamics.
Rooibos is adapted to survive in acidic soils that are low in nutrients. The acidity and low nutrients
in soils are due to sandy texture and low soil organic matter (or refer to soil organic carbon). Sandy
soils have higher bulk density than clayey soils and low water holding capacity. It can be expected
that the soil water content (SWC) of sandy soils will be low. Furthermore, the infiltration rate will be
high. The chemical properties include pH(H2O), pH(KCl), electrical conductivity (EC), total nitrogen (N),
available phosphorous (P), exchangeable basic cations and anions, trace elements and soil organic
carbon (SOC). The physical properties include soil texture, bulk density and soil water retention
curve (SWRC).
4.1.1 Soil chemical properties
The selected soil chemical properties are given in Table 4.1. The soil pH(H2O) ranged between 4.81
and 5.51. Unfertilised and fertilised treatment shallow and deep soils did not differ significantly in the
0–20 cm (p = 0.611) and the 20–40 cm (p = 0.127) soil layers. The pH(H2O) in the topsoil of the four
treatments was slightly higher than in the subsoil. Higher pH(H2O) in the topsoil can be attributed to
the roots taking up all the basic cations and transferring it to plant leaves (McBride, 1994). After
plants died and decomposed, the basic cations were returned to the topsoil. The second reason is
that the soil organic carbon (SOC) was higher in the topsoil (Table 4.2), with lower exchangeable
acidity (Table 4.1) and SWC (Refer to Section 5.2.3 in Chapter 5) than the subsoil. Smith (2014)
found similar results where the pH(H2O) of 5.09 in the topsoil (0–20 cm soil layer) was higher compared
to that in the subsoil (20–40 cm soil layer) of 4.86 for soils done in the same farm. Despite the low
SOC (Table 4.2), the four treatments contained considerable amount of exchangeable acidity since
the pH(H2O) and pH(KCl) differed by approximately 0.5 pH unit. The pH(KCl) of the four treatments did
not differ significantly in the 0–20 cm (p = 0.337) and 20–40 cm (p =0.862) soil layer. The pH(KCl)
significantly decreased (p = 0.0003) from the 0–20 cm to 20–40 cm soil layers of each treatment.
The pH(KCl) correlated well with the pH(KCl) of 4.4 in Honeybush soils reported by Joubert et al. (2007).
Stellenbosch University https://scholar.sun.ac.za

32
Table 4.1: The mean soil chemical status of the experimental trial of unfertilised and fertilised treatment on shallow and deep soils.
(1) EC Electrical conductivity of the saturated soil extract (2) ECEC Effective cation exchange capacity (3) In each column, values with different letters (a, b, c and d) indicate significant differences (p < 0.05).
Treatment Site Soil
depth
pH(H20) pH(KCl) EC(1) N Bray II
P
Ca Mg Na K Total KCl
Exch.
Acidity
ECEC(2) Cu Zn Mn
(cm) (μS/m) (%) (mg/kg) (cmolc/kg) (cmolc/kg) (cmolc/kg) (cmolc/kg) (cmolc/kg) (cmolc/kg) (mg/kg) (mg/kg) (mg/kg)
Unfertilised
Shallow
0–20 5.15a(3) 4.84a 12.84a 0.028a 1.16b 0.60a 0.10a 0.11a 0.23a 0.20b 1.24a 0.27a 0.60a 3.72a
20–40 4.82a 4.36b 9.39b 0.013b 0.66c 0.20b 0.05b 0.02c 0.01b 0.30a 0.58b 0.60a 0.90a 1.75a
Fertilised 0–20 5.08a 4.63a 13.55a 0.027a 5.48a 0.45a 0.15a 0.04b 0.31a 0.10c 1.05a 0.30a 0.30a 3.15a
20–40 4.81a 4.30b 10.60b 0.014b 1.49b 0.15b 0.05b 0.02b 0.01b 0.39a 0.62b 0.72a 1.17a 1.87a
Unfertilised
Deep
0–20 5.51a 4.55a 11.49a 0.021a 7.13a 0.15b 0.05b 0.04b 0.14a 0.19b 0.59b 0.30a 0.57a 1.66a
20–40 5.15a 4.33b 9.01b 0.011b 4.81b 0.10c 0.05b 0.02c 0.01b 0.33a 0.51b 0.96a 1.50a 2.12a
Fertilised 0–20 5.39a 4.75a 12.54a 0.028a 6.14a 0.20b 0.05b 0.07a 0.20b 0.17b 0.69b 0.36a 0.51a 1.94a
20–40 5.33a 4.35b 9.70b 0.016b 2.65b 0.20b 0.05b 0.02c 0.05b 0.23b 0.55b 0.45a 0.69a 1.79a
Stellenbosch University https://scholar.sun.ac.za

33
The average results of the EC ranged between 9.01 and 13.55 μS.m-1 (Table 4.1). The EC decreased
significantly with soil depth (p = 0.0006), but the four treatments did not differ in the 0–20 cm (p =
0.705) and 20–40 cm (p = 0.626) soil layers. These soils were highly leached soils because the EC
values were far below the threshold values of the salt concentration (2–4 dS.m-1) for saline soils (The
Fertiliser Association of South Africa, 2007). The soils had become more leached because the EC
values correlated well with the low pH(H2O) and pH(KCl) values.
The total soil N ranged between 0.013 and 0.028%. All treatments were the same in both soil depths.
The total N decreased significantly (p = 0.002) with soil layer for all treatments at both sites. Higher
soil N in the 0–20 cm soil layer was due to the N-fixing nodules (Refer to Section 6.3.1.1 in Chapter
6). The plant-available phosphorus (P) had low values ranging between 0.66–7.13 mg.kg-1. These
values were lower than the values of 12.4–17.0 mg.kg-1 reported for Vaalkrans’s soils (Smith, 2014).
Results from the current study were similar to 0.8–8.0 mg.kg-1 found in nutrient low fynbos soils
(Witkowski & Mitchell, 1989). Rooibos is adapted to grow in acidic, low P soils since the Bray II P
values were lower than the threshold critical level of 30–50 mg.kg-1 for healthy crops (Meek et al.,
1982). Furthermore, the plant-available soil P is soluble at a pH(H2O) of 5.5–5.6 (McBride, 1994).
Muofhe and Dakora (1999) found a low P value of 5.0 mg.kg-1 of a two-year old Rooibos and
furthermore, the Rooibos did show a remarkable growth in their natural setting. Higher P level in the
top soil was attributed to the cluster roots and arbuscular mycorrhiza mechanisms.
The exchangeable Ca decreased with soil depth of all treatments in the shallow soils but not the
fertilised treatment for the deep soils. The Ca values of the shallow soils were similar to the value of
0.45 cmolc.kg-1 reported for Honeybush soil by Joubert et al. (2008). At the deep site, the Ca values
were similar to the value of 0.25 cmolc.kg-1 of the soil at the same farm (Smith, 2014). At the shallow
site, the exchangeable Mg decreased significant but not at the deep site. The Mg values at the
shallow soils correlated well with the values of 0.10 (0–20 cm soil layer) and 0.05 cmolc.kg-1 (20–40
cm soil layer) reported by Smith (2014). Moreover, the Mg values of the topsoil and subsoil at the
deep site correlated well with 0.05 cmolc.kg-1 (Smith, 2014). The exchangeable Na of the two
treatments differed in the 0–20 cm soil layer for the shallow soils but not the deep soils. Sodium
tended to decrease with soil depth. The Na values correlated well with Na values of 0.05 (0–20 cm
soil layer) and 0.03 cmolc.kg-1 (20–40 cm soil layer) reported by Smith (2014) for similar soils. It
should be noted that the Na value in the topsoil of the unfertilised treatment at the shallow site was
much higher than reported values. All treatments showed a significantly decreased exchangeable K
with soil depth. The K values in the topsoil were higher than the value of 0.07 cmolc.kg-1 (0–20 cm
soil layer) reported by Smith (2014). This may be due to the fact that the samples of the current study
were took immediately after fertilisation and while Smith (2014) sampled at a later stage. The
decrease of all exchangeable cations implies the nutrient mining and loss of soil organic matter
according to Smith (2014).
Stellenbosch University https://scholar.sun.ac.za

34
There was a negative correlation between the exchangeable acidity and pH(KCl) in the 0–20 (R2 =
0.12) and 20–40 cm (R2 = 0.68) soil layers (data not shown). Since the basic cations were replaced
from the exchange sites and leached out of the soil (McBride, 1994), the exchangeable acidity
increased with increased soil depth and decreased pH(KCl) of each treatment. The exchangeable
acidity did not correlate well with the values of 1.70 (0–20 cm soil layer) and 2.50 (20–40 cm soil
layer) of the same farm (Smith, 2014). This may be due to the fact that experimental site of the Smith
(2014) study was older than this particular experimental site. It has been that the exchangeable
acidity increases with the age of the site (Smith, 2014). The effective cation exchange capacity
(ECEC) ranged between 0.51 and 1.24 cmolc.kg-1, whereas the ECEC of the deep soils ranged
between 0.51 and 0.69 cmolc.kg-1. The low ECEC was attributed to the high sand fraction and low
clay content (Tables 4.3 & 4.4). Effective cation exchange capacity was lower in the 20–40 cm soil
layer compared to the 0–20 cm soil layer due to low SOC (Table 4.2) below the 20 cm soil layer.
The trace elements of exchangeable copper (Cu), Zinc (Zn) and manganese (Mn) did not differ in
0–10 cm and 10–20 cm soil layers of all treatments. However, there was a decreased of the trace
elements with increasing soil depth. Trace elements are comparable to values of 0.10 mg.kg-1 Cu
and 1.3 mg.kg-1 Mn reported by Joubert et al. (2008) of the Honeybush soils. The Zn values were
higher compared to the values of 0.36–0.44 mg.kg-1 reported by Smith (2014). Although, the Zn
values were similar to the value of 0.71 mg.kg-1 of a Clanwilliam soil (two-year old field), South Africa
reported by Muofhe and Dakora (1999).
4.1.1.1 Soil organic carbon
The average SOC ranged between 0.09 and 0.19% of the unfertilised and bare treatments on deep
soils (Table 4.2). In the study of Smith (2014), the SOC values ranged between 0.06 and 0.08% and
were lower compared to the values of the current study. This is due to the fact that the plants of this
study were younger (one-year old) compared to the plants (> six-year old) of Smith (2014) study.
The SOC (p = 0.02) decreased significantly with soil depth until 20–30 cm soil layer of the bare
treatment. For the unfertilised treatment, the first two top soil layers remained the same (p = 0.60)
and decreased further deeper down in the soil. The 0–10 cm soil layer of both treatments was high
due to plant residue (there was Rooibos plants on the bare treatment before the trial). In the 10–20
cm and 20–30 cm soil layers, the SOC of the unfertilised treatment was significantly higher compared
to that of the bare treatment. Higher SOC in the 0–30 cm layer of the unfertilised treatment was due
to roots and exudation. Results from Johnson et al. (2006) showed the same trend where the SOC
increased by 15% when root concentration increased by 50%. The active roots secreted defences
to protect intrusion by pathogenic microorganisms. These exudations stimulate the soil microbes
with acceleration of soil organic carbon mineralization and increases the organic carbon availability
in soil (Baetz & Martinoia, 2014).
Stellenbosch University https://scholar.sun.ac.za

35
Table 4.2: Average soil organic carbon (SOC) of unfertilised and bare treatment in 0–50 cm soil depth at the deep site.
Treatment Soil depth
(cm)
SOC
(%)
Unfertilised 0–10
0.19a(1)
Bare 0.19a
Unfertilised 10–20
0.18a
Bare 0.15b
Unfertilised 20–30
0.15b
Bare 0.10c
Unfertilised 30–40
0.10c
Bare 0.11c
Unfertilised 40–50
0.10c
Bare 0.09c
(1) Values with different letters (a, b and c) indicate significant differences (p < 0.05).
Stellenbosch University https://scholar.sun.ac.za

36
4.1.2 Soil physical properties
4.1.3 Soil texture
The average particle size distribution for the unfertilised, fertilised and bare soils at the shallow and
deep sites is shown in Tables 4.3 and 4.4. There was no significant difference for the clay fraction
between the treatments or between shallow and deep soils or treatment per soil depth. Silt had the
same observations between the treatments or between shallow and deep or treatment per soil depth.
There was no significant difference between the three treatments with regard to the different sand
fractions of the shallow and deep soils. There was also no difference in the sand fraction of each
treatment per soil depth. Results indicate that the soil texture across the experimental trial was
reasonably homogenous.
Since the soils were homogenous, the average particle size distributions of all treatments at the
shallow and deep sites had a bell-shaped curve (Fig. 4.1). The distributions were normal and were
well sorted according to Hartge and Horn (2016). The particle size distribution skewed to the left with
high sand content sand values between 91–98% and very low clay content of between 0.10–2.20%.
Due to the high medium sand fraction of all treatments (Fig. 4.1), the experimental trial was classified
as medium sandy soil. This data correlates well with sand of 89–92%, silt of 4.4–7.4 and clay of 2.9–
3.2% reported by Smith (2014) on research done on the same farm.
Figure 4.1: Average particle size distribution of all treatments (Refer to Table 3.4 for texture descriptions).
Particle size (mm)
<0.002 0.002-0.0063 0.0063-0.053 0.053-0.10 0.10-0.25 0.25-0.50 0.50-1.00 1.00-2.00
Mass
fract
ion
(%)
0
5
10
15
20
25
30
35
Stellenbosch University https://scholar.sun.ac.za
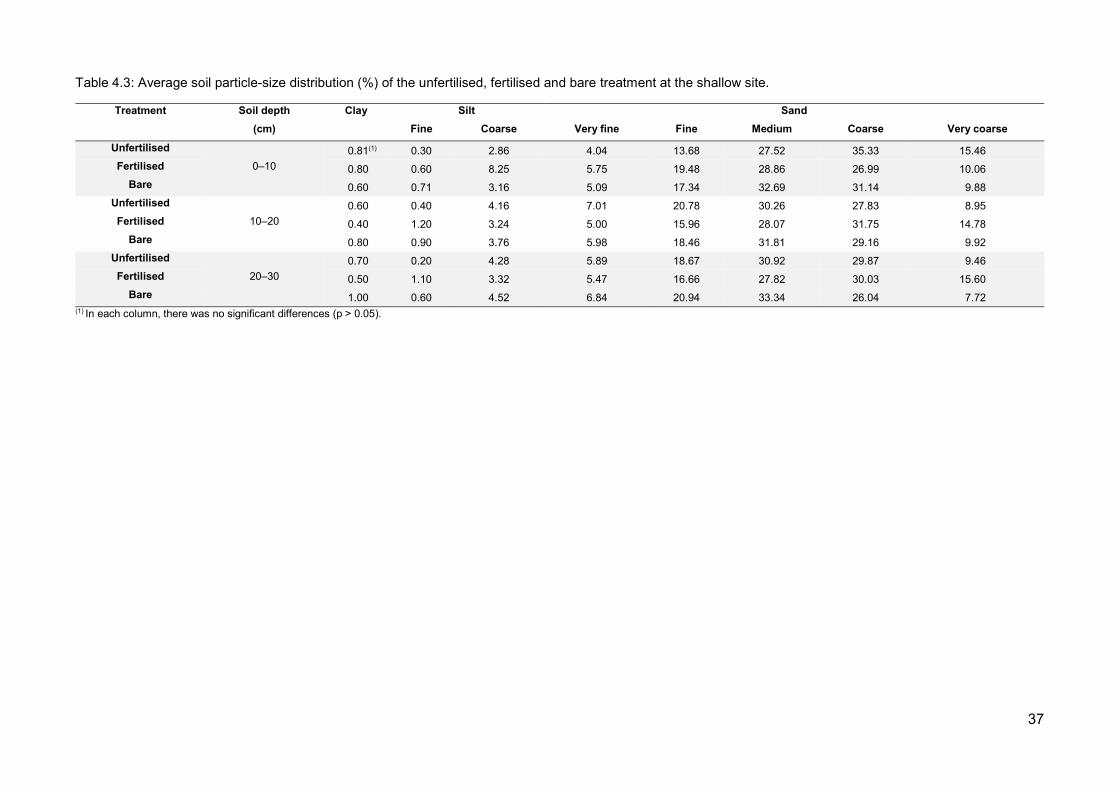
37
Table 4.3: Average soil particle-size distribution (%) of the unfertilised, fertilised and bare treatment at the shallow site.
Treatment Soil depth
(cm)
Clay Silt Sand
Fine Coarse Very fine Fine Medium Coarse Very coarse
Unfertilised
0–10
0.81(1) 0.30 2.86 4.04 13.68 27.52 35.33 15.46
Fertilised 0.80 0.60 8.25 5.75 19.48 28.86 26.99 10.06
Bare 0.60 0.71 3.16 5.09 17.34 32.69 31.14 9.88
Unfertilised
10–20
0.60 0.40 4.16 7.01 20.78 30.26 27.83 8.95
Fertilised 0.40 1.20 3.24 5.00 15.96 28.07 31.75 14.78
Bare 0.80 0.90 3.76 5.98 18.46 31.81 29.16 9.92
Unfertilised
20–30
0.70 0.20 4.28 5.89 18.67 30.92 29.87 9.46
Fertilised 0.50 1.10 3.32 5.47 16.66 27.82 30.03 15.60
Bare 1.00 0.60 4.52 6.84 20.94 33.34 26.04 7.72 (1) In each column, there was no significant differences (p > 0.05).
Stellenbosch University https://scholar.sun.ac.za

38
Table 4.4: Average soil particle-size distribution (%) of the unfertilised, fertilised and bare treatments at the deep site.
Treatment Soil depth
(cm)
Clay Silt Sand
Fine Coarse Very fine Fine Medium Coarse Very coarse
Unfertilised
0–10
0.20(1) 0.90 1.13 4.53 16.48 33.24 30.39 13.13
Fertilised 0.80 0.30 3.02 6.55 20.18 32.63 26.55 9.97
Bare 0.90 0.30 3.31 6.60 19.43 32.93 26.07 10.47
Unfertilised
10–20
0.80 1.00 0.17 4.16 13.45 29.77 33.77 16.88
Fertilised 1.03 0.82 0.07 7.39 22.32 34.64 24.68 9.05
Bare 0.80 0.90 2.42 6.46 19.76 32.82 25.69 11.15
Unfertilised
20–30
0.70 0.60 2.14 4.98 16.14 30.10 29.93 15.41
Fertilised 1.00 0.50 2.91 6.38 20.53 35.03 25.55 8.09
Bare 0.90 1.00 1.33 5.37 16.76 32.08 28.92 13.64
Unfertilised
30–40
0.40 1.10 2.53 5.86 19.48 32.74 27.39 10.51
Fertilised 0.80 1.00 2.07 5.65 18.75 32.87 27.38 11.49
Bare 0.80 1.01 2.54 6.04 19.03 31.84 25.63 13.11
Unfertilised
40–50
1.40 0.30 1.69 6.97 23.46 32.05 22.49 11.65
Fertilised 1.30 0.70 2.95 6.52 19.48 30.42 25.23 13.71
Bare 1.00 0.90 2.66 7.11 21.56 32.34 25.82 8.60
Unfertilised
50–60
0.70 1.00 0.55 6.96 21.03 31.19 26.26 12.32
Fertilised 0.90 0.40 2.41 5.49 17.69 31.73 28.27 12.82
Bare 1.10 2.71 0.40 5.42 17.53 31.42 27.92 13.49
Unfertilised
60–70
0.10 1.50 2.54 7.15 21.31 31.05 25.86 10.50
Fertilised 1.31 0.80 2.26 6.10 19.68 32.27 26.80 10.78
Bare 2.20 0.70 1.24 6.96 19.94 31.29 26.79 10.87
Unfertilised
70–80
0.50 0.70 2.69 6.48 20.10 31.66 26.88 10.99
Fertilised 1.41 0.80 2.07 6.00 18.41 28.11 26.01 17.20
Bare 1.20 0.50 2.49 6.02 19.34 32.12 28.12 10.20 (1) In each column, there was no significant differences (p > 0.05).
Stellenbosch University https://scholar.sun.ac.za

39
4.1.4 Bulk density
Bulk density (g.cm-3) of the shallow soils at 0–30 cm soil depth and of the deep soils at 0–80 cm soil
depth is presented in Tables 4.5 and 4.6, respectively. For the shallow soils, there was no differences
per soil depth of the unfertilised (p = 0.24), fertilised (p = 0.57) and bare (p = 0.12). treatments
Between the three treatments, there were no differences (p = 0.72). For the deep soils, there was
no significant differences in per soil depth of unfertilised (p = 0.64), fertilised treatment (p = 0.97) and
bare (p = 0.81) treatments. Between the three treatments, there were no differences (p = 0.65). The
bulk density between all treatments did not differ (p = 0.93) The lower bulk density in the 10–20 cm
soil layer was most likely due to tillage which loosen the soil (Hoffman, 1990) and higher SOC in the
10–20 cm soil layer (Table 4.2).
Therefore, it can be assumed that the bulk density across the experimental trial was homogenous
per soil depth. The average bulk density ranged between 1.45 to 1.60 g.cm-3 and correlated well with
the range reported for sandy soils, which varied between 1.40 and 1.60 g.cm-3 (AgriInfo.in, 2015).
The shallow and deep soils were not compacted since the mean bulk densities were below
1.8 g.cm-3, therefore it was expected that there would be no soil physical restrictions for root growth
(USDA, 1998).
Table 4.5: Average bulk density of unfertilised, fertilised and bare treatments in the 0–30 cm soil depth (shallow site).
Treatment Soil depth
(cm)
Bulk density
(g.cm-3)
Unfertilised
0–10
1.53(1)
Fertilised 1.51
Bare 1.54
Unfertilised
10–20
1.45
Fertilised 1.49
Bare 1.50
Unfertilised
20–30
1.55
Fertilised 1.59
Bare 1.53
(1) There were no significant differences (p > 0.05).
Stellenbosch University https://scholar.sun.ac.za

40
Table 4.6: Average bulk density of unfertilised, fertilised and bare treatments in the 0–80 cm soil depth (deep site).
Treatment Soil depth
(cm)
Bulk density
(g.cm-3)
Unfertilised
0–10
1.55(1)
Fertilised 1.56
Bare 1.57
Unfertilised
10–20
1.51
Fertilised 1.50
Bare 1.54
Unfertilised
20–30
1.57
Fertilised 1.57
Bare 1.58
Unfertilised
30–40
1.55
Fertilised 1.55
Bare 1.54
Unfertilised
40–50
1.56
Fertilised 1.56
Bare 1.57
Unfertilised
50–60
1.56
Fertilised 1.56
Bare 1.52
Unfertilised
60–70
1.53
Fertilised 1.56
Bare 1.55
Unfertilised
70–80
1.56
Fertilised 1.57
Bare 1.57
(1) There were no significant differences (p > 0.05).
Stellenbosch University https://scholar.sun.ac.za

41
4.1.5 Soil water retention curve
The non-linear regression equations and coefficients of determination of the soil water characteristic
curve and field capacity (FC) of medium sandy soil was estimated and is presented in Figure 4.2.
Kern (1995) stated that the FC of sandy soils occurs between -5 kPa and -10 kPa. The matric
potential for permanent wilting point (PWP) is at -1 500 kPa according to Rawls et al. (1982).
Therefore, the estimated FC was ca. 92 mm.m-1 volumetric at -9 kPa and the PWP was 17 mm.m-1
(data not shown). The water holding capacity (WHC) was ca. 75 mm.m-1.
The FC was relatively higher compared to the 87.6 mm.m-1 FC of -3 kPa for a soil containing 94.4%
sand (Volschenk, 2017). The higher soil matric potential at FC in that particular study was due to the
high coarse sand fraction (50.7%), whereas in the current study, the coarse sand content ranged
from 22.49–35.33% (Tables 4.3 & 4.4). The WHC was also lower than the 126.8 mm.m-1 reported
by Volschenk (2017)for coarse sandy soil due to its higher clay content. Similar results were obtained
where FC was 90 mm.m-1, PWP was 20 mm.m-1 and WHC was 70 mm.m-1 for sandy soils (Atwell et
al., 1999). This was expected as during the aforementioned study medium sandy soils with clay
contents of less than ca. 1.5% was present (Tables 4.3 & 4.4) have large pores and release more
water readily in the -5 to -40 kPa soil matric potential range than clayey soils (Hall et al., 1977; Hultine
et al., 2005). However, more water is available for the plants (Hillel, 2004). Moreover, the infiltration
rates are high, whereas drainage and evaporation occur easily.
0.00
0.05
0.10
0.15
0.20
0.25
0.30
0.35
0 10 20 30 40 50 60 70 80 90 100
Vo
lum
etr
ic w
ate
r co
nten
t (m
m/m
m)
Matric potential (-kPa)
FC
1
2
3
45
1: y = -0.0021x2 - 0.0089x + 0.2877R² = 1
2: y = 0.0031x2 - 0.0677x + 0.4502R² = 1
3: y = 7E-05x2 - 0.0049x + 0.1296R² = 1
4: y = 5E-06x2 - 0.0009x + 0.0678R² = 1
5: y = 8E-09x2 - 2E-05x + 0.0277R² = 0.8517
Figure 4.2: Soil water characteristic curve of the medium sandy soil. FC is field capacity.
Stellenbosch University https://scholar.sun.ac.za

42
Chapter 5: Soil water dynamics the during 2016/17 season
5.1 Introduction
Rooibos is a rain fed plant, therefore plant production is strongly linked to soil water content (SWC)
(Wang et al., 2016) as well as to meteorological characteristics (Haghighi Fashi et al., 2017). Low
rainfall and higher air and soil temperature in dryland farming areas leads to low SWC. Gupta (1986)
found that the deficiency of SWC and the soil temperature fluctuations influenced the availability and
absorption of water as well as nutrients. Therefore, farmers producing Rooibos under dryland
conditions must avoid high soil water depletion and water stress. In some cases, the application of
fertilisers can improve the SWC through increasing the soil organic carbon (SOC). Nevertheless,
Huang et al. (2003a) concluded that high fertiliser applications for dryland wheat tended to decrease
the SWC (-12.6 mm) during the growing season. The soil depth can influence the SWS and the
amount of water stored during fallowing can improve the SWS. However, fallow efficiency (FE) can
be low because the evaporation (E) is high when the air and soil temperature are high (Latta &
O’Leary, 2003). Thus, most of the SWS in bare soils is lost through evaporation. Frequently,
evapotranspiration (ET) is a major parameter of the soil water balance (SWB) in the ecosystem
(Gentine et al., 2007). Liu et al. (2010) reported that the yields of most crops have a linear relationship
with total ET.
Evaporation from bare sandy soils is the core component of the hydrologic cycle in arid or semi-arid
regions (Daamen et al., 1993). Such bare sandy soils are covered by a thin (5 to 30 cm) drying front
most of the time (Duan et al., 2011), within which soil water is predominantly in the vapour phase
(Goss & Madliger, 2007). Such a drying front can have an effect on the E rate and soil water dynamic
processes. The unsaturated soil water diffusivity is an important parameter for the study of soil water
dynamics. Soil water diffusivity often affect the water flow and solute transported in unsaturated soils.
The aim of this chapter was to determine the soil water dynamics of the Rooibos soils. In addition,
also the effect of fertilisation and soil depth on the soil water dynamics was investigated. Soil water
balances were calculated for unfertilised and fertilised treatments of shallow and deep soils as well
as the bare treatment (fallow period) during the 2016/17 growing season. The ECH2O soil moisture
results were also during the 2016/17 growing season.
Stellenbosch University https://scholar.sun.ac.za

43
5.2 Soil water content determined by the Diviner 2000
5.2.1 Calibration of the Diviner 2000
5.2.1.1 Soil-specific calibration
The Diviner 2000 capacitance probe was calibrated using the field volumetric water content against
the calculated water content of the medium sandy soil. The linear regression equation was VWC =
1.043×VWCfield – 0.038 with coefficient of determination (R2) = 0.76 and root mean square error
(RMSE) = 0.0025 m3.m-3. Several studies with Diviner 2000 under field conditions using the
gravimetric method have found calibration equations with higher R2 for sandy soils than the one
observed in this study (Table 5.1). Lower R2 may be due to the fact that the calibration was done
under field conditions (Hu et al., 2008). Haberland et al. (2014) found that the R2 = 0.97 of the
EnviroSCAN® under laboratory conditions (controlled environment) was higher than the R2 = 0.77
under field conditions of loamy soils. Provenzano et al. (2016) reported higher R2 = 0.94 under
laboratory conditions but also higher RMSE of 0.049 m3.m-3 compared to the values under field
conditions (Table 5.1). However, the RMSE was lower than that obtained in the several studies
(Table 5.1), reflecting the small scatter in the data. RoTimi Ojo et al. (2015) found the accuracy of
the soil water measurement using a Diviner 2000 increased, with lower RMSE value from 0.080 to
0.040 m3.m-3 with low R2 = 0.64. The accuracy of the Diviner 2000 improved if the RMSE
<0.040 m3.m-3 with R2 <0.85 (Tedeschi et al., 2014). Furthermore, the RMSE of the current study
was far below the threshold value of 0.040 m3.m-3 (Tedeschi et al., 2014).
Table 5.1: Soil texture, coefficients of determination (R2) and root mean square errors (RMSE) from different calibrations developed for Diviner 2000 under several conditions.
Clay
(%)
Silt
(%)
Sand
(%)
Soil
texture
Bulk
density
(g.cm-3)
R2 RMSE
(m3.m-3)
Conditions Author(s)
- - - Sandy
loam - 0.81 0.047 Field
Haberland et al.
(2015)
9.1 5.1 85.8 Sandy
loam 1.51 0.84 0.029 Field
Provenzano et
al. (2016)
9.0 5.4 85.6 Sandy
loam 1.30 0.97 0.010 Field
de Andrade et
al. (2010)
5.0 4.0 91.0 Sand 1.58 0.97 - Laboratory Groves and
Rose (2004)
- - - Sand - 0.99 - Field Manufacturer
(Sentek, 2007)
Stellenbosch University https://scholar.sun.ac.za
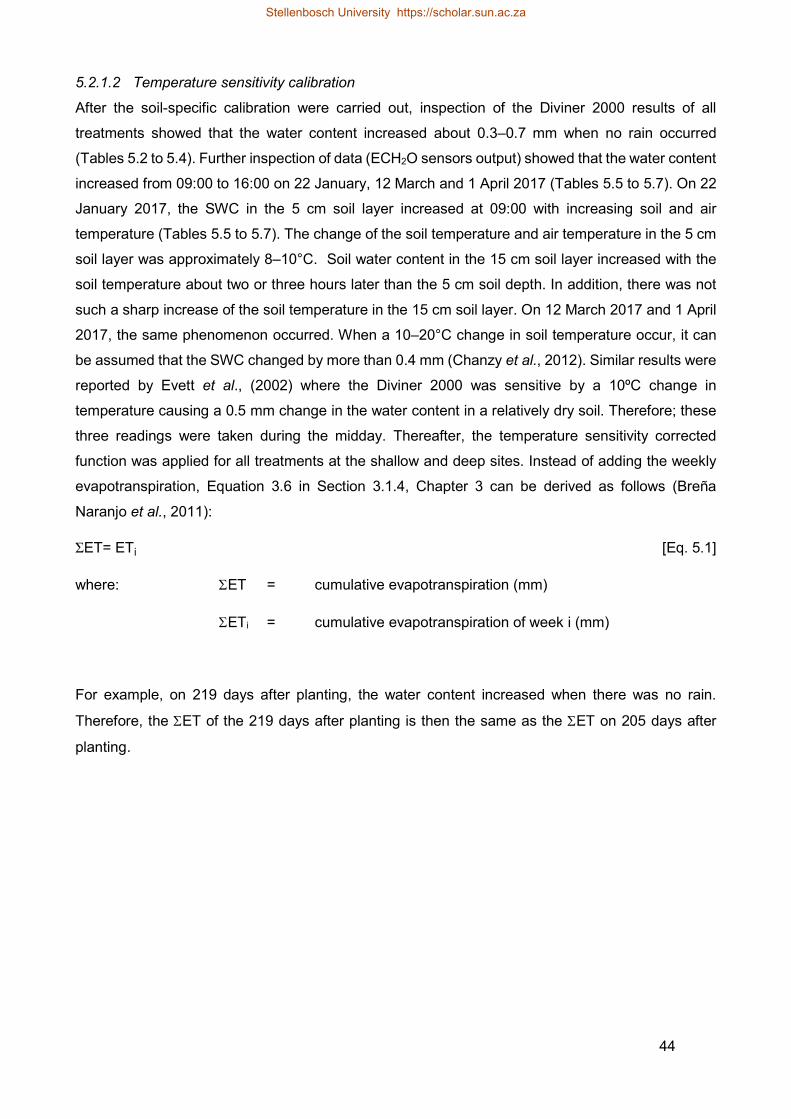
44
5.2.1.2 Temperature sensitivity calibration
After the soil-specific calibration were carried out, inspection of the Diviner 2000 results of all
treatments showed that the water content increased about 0.3–0.7 mm when no rain occurred
(Tables 5.2 to 5.4). Further inspection of data (ECH2O sensors output) showed that the water content
increased from 09:00 to 16:00 on 22 January, 12 March and 1 April 2017 (Tables 5.5 to 5.7). On 22
January 2017, the SWC in the 5 cm soil layer increased at 09:00 with increasing soil and air
temperature (Tables 5.5 to 5.7). The change of the soil temperature and air temperature in the 5 cm
soil layer was approximately 8–10°C. Soil water content in the 15 cm soil layer increased with the
soil temperature about two or three hours later than the 5 cm soil depth. In addition, there was not
such a sharp increase of the soil temperature in the 15 cm soil layer. On 12 March 2017 and 1 April
2017, the same phenomenon occurred. When a 10–20°C change in soil temperature occur, it can
be assumed that the SWC changed by more than 0.4 mm (Chanzy et al., 2012). Similar results were
reported by Evett et al., (2002) where the Diviner 2000 was sensitive by a 10ºC change in
temperature causing a 0.5 mm change in the water content in a relatively dry soil. Therefore; these
three readings were taken during the midday. Thereafter, the temperature sensitivity corrected
function was applied for all treatments at the shallow and deep sites. Instead of adding the weekly
evapotranspiration, Equation 3.6 in Section 3.1.4, Chapter 3 can be derived as follows (Breña
Naranjo et al., 2011):
ΣET= ETi [Eq. 5.1]
where: ET = cumulative evapotranspiration (mm)
ETi = cumulative evapotranspiration of week i (mm)
For example, on 219 days after planting, the water content increased when there was no rain.
Therefore, the ET of the 219 days after planting is then the same as the ET on 205 days after
planting.
Stellenbosch University https://scholar.sun.ac.za

45
Table 5.2: Soil water content of each soil depth (mm/100 mm) and components of the soil water balance of unfertilised treatment (UD 4.1) during the 2016/17 growing season.
Days after planting 18 26 33 39 47 55 61 68 77 83 91 97 106 149 161 168 174 181 189 197 205 219 225 243 251 259 268 278 288 297
Date 04
/07/
2016
12/0
7/20
16
19/0
7/20
16
25/0
7/20
16
02/0
8/20
16
10/0
8/20
16
16/0
8/20
16
23/0
8/20
16
01/0
9/20
16
07/0
9/20
16
15/0
9/20
16
21/0
9/20
16
30/0
9/20
16
11/1
1/20
16
23/1
1/20
16
30/1
1/20
16
07/1
2/20
16
15/1
2/20
16
23/1
2/20
16
31/1
2/20
16
08/0
1/20
17
22/0
1/20
17
28/0
1/20
17
15/0
2/20
17
23/0
2/20
17
03/0
3/20
17
12/0
3/20
17
22/0
3/20
17
01/0
4/20
17
11/0
4/20
17
Soil depth
0–10 cm 2.4 1.8 2.0 3.2 3.5 2.0 3.6 6.4 5.1 2.5 1.3 1.5 2.6 2.0 1.4 0.5 1.0 0.7 2.1 1.0 1.0 1.0 1.0 0.4 1.0 1.1 1.2 1.0 1.1 0.5
10–20 cm 6.7 5.2 4.7 6.4 6.3 5.5 5.8 7.5 5.4 4.1 4.4 3.5 6.2 4.8 3.8 3.3 3.1 2.1 3.4 2.6 2.4 2.7 2.4 1.6 1.0 1.0 1.6 1.5 1.8 1.5
20–30 cm 4.4 3.9 3.4 4.2 4.2 3.7 3.6 4.1 3.0 3.2 3.3 2.3 4.4 3.6 3.0 2.8 2.6 2.7 2.5 2.2 2.1 2.2 2.1 1.8 1.1 1.1 1.5 1.5 1.5 1.5
30–40 cm 3.0 2.7 2.5 2.8 3.1 2.7 2.6 2.5 2.3 2.4 2.3 1.6 3.0 2.6 2.3 2.1 2.0 2.1 1.9 1.7 1.6 1.6 1.6 1.4 1.4 1.3 1.2 1.2 1.2 1.1
40–50 cm 3.4 3.0 2.9 3.0 3.6 3.2 3.0 2.8 2.8 2.8 2.6 1.9 3.1 3.0 2.7 2.5 2.5 2.6 2.3 2.2 2.1 2.1 2.1 1.8 2.0 1.8 1.6 1.6 1.6 1.5
50–60 cm 3.6 3.3 3.2 3.2 4.2 3.7 3.4 3.0 3.3 3.0 2.9 3.0 2.9 3.1 2.9 2.7 2.8 2.9 2.5 2.3 2.3 2.3 2.3 2.0 2.1 2.0 1.8 1.7 1.8 1.6
60–70 cm 3.4 3.2 3.2 3.1 4.1 3.9 3.4 3.0 3.4 3.0 2.8 3.0 2.7 2.9 2.9 2.7 2.9 2.9 2.6 2.4 2.5 2.5 2.4 2.2 1.2 1.2 2.0 1.9 1.9 1.8
70–80 cm 3.3 3.2 3.1 3.1 3.8 3.6 3.4 3.1 3.3 3.0 2.9 2.9 2.7 2.8 2.8 2.7 2.8 2.8 2.6 2.5 2.5 2.5 2.4 2.3 1.0 0.9 2.0 2.0 2.0 1.9
Total SWC(1) 30.3 26.3 24.8 29.0 32.8 28.4 28.7 32.4 28.7 23.9 22.7 19.8 27.7 24.7 21.7 19.4 19.7 18.7 19.9 16.9 16.6 16.9 16.3 13.5 10.9 10.5 13.0 12.4 12.9 11.5
ΔS(2) 4.0 1.5 -4.2 -3.8 4.5 -0.3 -3.7 3.7 4.8 1.3 2.9 -7.9 3.0 3.0 2.4 -0.3 1.0 -1.2 3.1 0.3 -0.3 0.6 2.8 2.6 0.4 -2.5 0.6 -0.5 1.4
P(3) 0.0 5.1 0.3 10.5 19.2 7.5 3.6 5.7 3.0 2.4 3.1 6.0 12.3 0.0 3.0 0.0 0.0 5.4 7.8 0.3 0.9 0.0 0.0 0.3 0.0 0.0 0.0 0.0 0.0 2.4
ΣP(4) 5.1 5.4 15.9 35.1 42.6 46.2 51.9 54.9 57.3 60.4 66.4 78.7 78.7 81.7 81.7 81.7 87.1 94.9 95.2 96.1 96.1 96.1 96.4 96.4 96.4 96.4 96.4 96.4 98.8
ET(5) 9.1 1.8 6.3 15.4 12.0 3.3 2.0 6.7 7.2 4.4 8.9 4.4 3.0 6.0 2.4 -0.3 6.4 6.6 3.4 1.2 -0.3 0.6 3.1 2.6 0.4 -2.5 0.6 -0.5 3.8
Average ET/day(6) 1.1 0.3 1.0 1.9 1.5 0.5 0.3 0.7 1.2 0.5 1.5 0.1 0.4 0.5 0.3 -0.1 0.9 0.8 0.4 0.1 0.0 0.1 0.2 0.3 0.1 -0.3 0.1 -0.1 0.4
ΣET(7) 9.1 10.9 17.2 32.6 44.5 47.8 49.8 56.5 63.7 68.0 77.0 81.3 84.3 90.3 92.7 92.4 98.7 105.3 108.7 109.8 109.5(8) 110.1 113.2 115.8 116.2 113.7(8 114.3 113.8(8 110.0
(1) Total SWC Total soil water content (mm) (2) ΔS Change in soil water content (mm) (3) P Rainfall occurring between readings (mm) (4) ET Evapotranspiration (mm) (5) Average ET/day Evapotranspiration in (mm/day) (6) ΣP Cumulative rainfall (mm) (7) ΣET Cumulative evapotranspiration (mm) (8) The red line indicates that the soil water increased but no rain occurred between 205 and 219, 259 and 286, and 278 and 288 days after planting. These readings were taken in the midday according to the ECH2O soil moisture results of the fertilised treatment.
Stellenbosch University https://scholar.sun.ac.za

46
Table 5.3: Soil water content of each soil depth (mm/100 mm) and components of the soil water balance of fertilised treatment (FD 2.2) during the 2016/17 growing season.
Days after planting 18 26 33 39 47 55 61 68 77 83 91 97 106 149 161 168 174 181 189 197 205 219 225 243 251 259 268 278 288 297
Date 04
/07/
2016
12/0
7/20
16
19/0
7/20
16
25/0
7/20
16
02/0
8/20
16
10/0
8/20
16
16/0
8/20
16
23/0
8/20
16
01/0
9/20
16
07/0
9/20
16
15/0
9/20
16
21/0
9/20
16
30/0
9/20
16
11/1
1/20
16
23/1
1/20
16
30/1
1/20
16
07/1
2/20
16
15/1
2/20
16
23/1
2/20
16
31/1
2/20
16
08/0
1/20
17
22/0
1/20
17
28/0
1/20
17
15/0
2/20
17
23/0
2/20
17
03/0
3/20
17
12/0
3/20
17
22/0
3/20
17
01/0
4/20
17
11/0
4/20
17
Soil depth
0–10 cm 1.4 0.9 0.7 1.1 1.1 1.0 1.5 2.5 1.2 1.5 0.3 0.8 1.1 0.8 0.7 0.5 0.5 0.8 1.6 0.7 0.7 0.7 0.7 0.6 0.7 0.7 0.8 0.8 0.7 0.3
10–20 cm 4.3 3.5 3.0 4.3 4.5 3.8 3.3 3.6 1.9 2.1 1.9 2.3 3.5 2.2 1.5 1.2 1.3 1.2 1.4 1.1 1.1 1.8 1.3 1.1 1.1 1.0 1.2 1.1 1.1 1.0
20–30 cm 3.6 3.1 2.9 3.6 4.2 3.8 3.5 3.0 1.6 1.8 1.7 1.8 3.1 2.1 1.6 1.4 1.4 1.2 1.2 1.1 1.1 1.7 1.5 1.0 1.0 1.0 1.0 1.0 1.0 1.0
30–40 cm 3.7 3.1 2.9 3.3 3.8 3.5 3.2 3.0 1.8 2.0 1.7 1.7 2.5 2.0 1.6 1.4 1.5 1.4 1.3 1.2 1.2 1.4 1.4 1.1 1.0 1.0 1.0 1.0 1.1 1.0
40–50 cm 3.3 2.9 2.7 3.0 3.5 3.1 2.9 2.7 2.0 2.2 2.0 1.8 1.7 1.7 1.5 1.4 1.4 1.3 1.3 1.2 1.2 1.2 1.2 1.1 1.0 1.0 1.1 1.0 1.1 1.0
50–60 cm 3.0 2.6 2.6 2.7 3.2 3.1 3.0 2.8 2.2 2.6 2.3 2.2 1.9 1.9 1.6 1.5 1.5 1.5 1.4 1.4 1.5 1.5 1.5 1.4 1.4 1.3 1.4 1.4 1.4 1.3
60–70 cm 2.7 2.5 2.5 2.6 3.0 2.8 2.8 2.8 2.6 3.0 2.7 2.4 2.3 2.2 2.0 1.8 1.8 1.7 1.6 1.6 1.7 1.7 1.8 1.9 1.8 1.8 1.9 1.7 1.7 1.6
70–80 cm 3.4 3.2 3.2 3.1 3.6 3.4 3.3 3.4 3.2 3.2 3.0 2.7 2.7 2.6 2.4 2.3 2.4 2.2 2.1 2.0 2.2 2.1 2.1 2.0 2.0 2.0 2.0 1.9 1.9 1.8
Total SWC(1) 27.5 23.9 22.6 25.7 29.2 26.6 25.5 26.0 18.8 20.6 17.5 17.7 20.5 17.3 14.5 13.2 13.5 12.9 13.7 11.9 12.3 13.6 13.0 11.8 11.6 11.2 11.9 11.3 11.4 10.5
ΔS(2) 3.7 1.3 -3.1 -3.6 2.6 1.1 -0.4 7.2 -1.8 3.0 -0.1 -2.9 3.2 2.8 1.4 -0.3 0.6 -0.8 1.8 -0.4 -1.2 0.5 1.3 0.2 0.4 -0.7 0.6 -0.1 0.9
P(3) 0.0 5.1 0.3 10.5 19.2 7.5 3.6 5.7 3.0 2.4 3.1 6.0 12.3 0.0 3.0 0.0 0.0 5.4 7.8 0.3 0.9 0.0 0.0 0.3 0.0 0.0 0.0 0.0 0.0 2.4
ΣP(4) 5.1 5.4 15.9 35.1 42.6 46.2 51.9 54.9 57.3 60.4 66.4 78.7 78.7 81.7 81.7 81.7 87.1 94.9 95.2 96.1 96.1 96.1 96.4 96.4 96.4 96.4 96.4 96.4 98.8
ET(5) 8.8 1.6 7.4 15.6 10.1 4.7 5.3 10.2 0.6 6.1 5.9 9.4 3.2 5.8 1.4 -0.3 6.0 7.0 2.1 0.5 -1.2 0.5 1.6 0.2 0.4 -0.7 0.6 -0.1 3.3
Average ET/day(6) 1.1 0.2 1.2 2.0 1.3 0.8 0.8 1.1 0.1 0.8 1.0 0.2 0.5 0.5 0.2 -0.1 0.9 0.9 0.3 0.1 -0.1 0.1 0.1 0.0 0.0 -0.1 0.1 0.0 0.4
ΣET(7) 8.8 10.3 17.8 33.4 43.5 48.2 53.5 63.7 64.3 70.4 76.3 85.7 88.9 94.7 96.1 95.8 101.7 108.7 110.8 111.3 110.1(8) 110.6 112.2 112.4 112.8 112.1(8 112.7 112.6(8 115.9
(1) Total SWC Total soil water content (mm) (2) ΔS Change in soil water content (mm) (3) P Rainfall occurring between readings (mm) (4) ET Evapotranspiration (mm) (5) Average ET/day Evapotranspiration in (mm/day) (6) ΣP Cumulative rainfall (mm) (7) ΣET Cumulative evapotranspiration (mm) (8) The red line indicates that the soil water increased but no rain occurred between 205 and 219, 259 and 286, and 278 and 288 days after planting. These readings were taken in the midday according to the ECH2O soil moisture results of the fertilised treatment.
Stellenbosch University https://scholar.sun.ac.za

47
Table 5.4: Soil water content of each soil depth (mm/100 mm) and components of the soil water balance of bare treatment (BD 3) during the 2016/17 growing season
Days after fallow started 18 26 33 39 47 55 61 68 77 83 91 97 106 149 161 168 174 181 189 197 205 219 225 243 251 259 268 278 288 297
Date
04/0
7/20
16
12/0
7/20
16
19/0
7/20
16
25/0
7/20
16
02/0
8/20
16
10/0
8/20
16
16/0
8/20
16
23/0
8/20
16
01/0
9/20
16
07/0
9/20
16
15/0
9/20
16
21/0
9/20
16
30/0
9/20
16
11/1
1/20
16
23/1
1/20
16
30/1
1/20
16
07/1
2/20
16
15/1
2/20
16
23/1
2/20
16
31/1
2/20
16
08/0
1/20
17
22/0
1/20
17
28/0
1/20
17
15/0
2/20
17
23/0
2/20
17
03/0
3/20
17
12/0
3/20
17
22/0
3/20
17
01/0
4/20
17
11/0
4/20
17
Soil depth
0–10 cm 4.7 2.9 2.5 4.4 4.7 3.1 3.1 5.5 2.8 2.0 1.9 2.8 3.6 2.2 1.7 1.1 1.1 1.1 2.4 1.0 1.0 1.3 1.1 1.0 0.9 0.9 1.4 1.0 1.1 1.0
10–20 cm 4.4 3.8 3.5 4.5 4.4 3.9 3.7 4.3 2.9 2.1 2.4 2.9 4.7 3.4 2.6 2.3 1.9 1.8 1.9 1.5 1.3 2.0 1.8 1.1 1.0 1.0 1.1 1.0 1.1 1.0
20–30 cm 4.1 3.5 3.3 3.8 4.1 3.6 3.4 3.4 2.8 2.8 2.4 2.4 4.1 3.2 2.7 2.3 2.1 2.0 1.9 1.7 1.6 2.1 2.0 1.4 1.2 1.1 1.2 1.2 1.2 1.2
30–40 cm 4.1 3.6 3.3 3.6 4.2 3.7 3.4 3.4 2.9 3.0 2.7 2.5 3.2 3.0 2.6 2.4 2.1 2.1 1.9 1.6 1.6 1.7 1.6 1.6 1.3 1.2 1.3 1.3 1.3 1.2
40–50 cm 4.0 3.7 3.4 3.5 4.3 3.9 3.6 3.5 3.2 3.2 2.9 2.7 2.6 2.6 2.6 2.4 2.3 2.3 2.1 1.8 1.8 1.7 1.7 1.7 1.6 1.6 1.6 1.6 1.6 1.5
50–60 cm 3.1 2.9 2.7 2.7 3.5 3.2 2.9 2.7 2.8 2.6 2.6 2.3 2.1 2.1 2.2 2.0 2.0 2.1 1.8 1.6 1.6 1.5 1.5 1.5 1.4 1.3 1.2 1.2 1.2 1.2
60–70 cm 1.7 1.7 1.6 1.7 2.0 1.9 1.8 1.6 2.0 1.6 1.8 1.6 1.5 1.5 1.5 1.4 1.5 1.5 1.3 1.2 1.2 1.2 1.2 1.2 1.0 1.0 0.9 0.9 0.8 0.9
70–80 cm 1.5 1.5 1.5 1.5 1.7 1.6 1.5 1.4 1.8 1.5 1.6 1.6 1.4 1.4 1.4 1.3 1.4 1.4 1.3 1.2 1.2 1.1 1.2 1.1 1.0 1.0 0.9 0.9 0.8 0.9
Total SWC(1) 27.7 23.6 21.8 25.8 28.9 25.0 23.3 25.9 21.1 18.8 18.3 18.8 23.2 19.5 17.2 15.2 14.5 14.3 14.7 11.7 11.3 12.7 12.1 10.7 9.3 9.2 9.6 9.1 9.2 8.8
ΔS(2) 4.1 1.8 -4.0 -3.1 3.9 1.6 -2.5 4.7 2.3 0.6 -0.5 -4.4 3.6 2.3 2.0 0.7 0.3 -0.5 3.0 0.4 -1.4 0.6 1.4 1.4 0.1 -0.4 0.5 -0.1 0.4
P(3) 0.0 5.1 0.3 10.5 19.2 7.5 3.6 5.7 3.0 2.4 3.1 6.0 12.3 0.0 3.0 0.0 0.0 5.4 7.8 0.3 0.9 0.0 0.0 0.3 0.0 0.0 0.0 0.0 0.0 2.4
ΣP(4) 5.1 5.4 15.9 35.1 42.6 46.2 51.9 54.9 57.3 60.4 66.4 78.7 78.7 81.7 81.7 81.7 87.1 94.9 95.2 96.1 96.1 96.1 96.4 96.4 96.4 96.4 96.4 96.4 98.8
E(5) 9.2 2.1 6.5 16.1 11.4 5.2 3.2 7.7 4.7 3.7 5.5 7.9 3.6 5.3 2.0 0.7 5.7 7.3 3.3 1.3 -1.4 0.6 1.7 1.4 0.1 -0.4 0.5 -0.1 2.8
Average E/day(6) 1.1 0.3 1.1 2.0 1.4 0.9 0.5 0.9 0.8 0.5 0.9 0.9 0.1 0.4 0.3 0.1 0.8 0.9 0.4 0.2 -0.1 0.1 0.1 0.2 0.0 0.0 0.1 0.0 0.3
ΣE(7) 9.2 11.3 17.8 33.9 45.3 50.5 53.7 61.4 66.1 69.8 75.3 83.2 86.9 92.2 94.2 94.9 100.5 107.9 111.2 112.5 111.1(8) 111.7 113.4 114.8 114.9 114.5(8) 115 114.9(8) 117.7
(1) Total SWC Total soil water content (mm) (2) ΔS Change in soil water content (mm) (3) P Rainfall occurring between readings (mm) (4) E Evaporation (mm) (5) Average E/day Evaporation in (mm/day) (6) ΣP Cumulative rainfall (mm) (7) ΣE Cumulative evaporation (mm) (8) The red line indicates that the soil water increased but no rain occurred between 205 and 219, 259 and 286, and 278 and 288 days after planting. These readings were taken in the midday according to the ECH2O soil moisture results of the fertilised treatment.
Stellenbosch University https://scholar.sun.ac.za
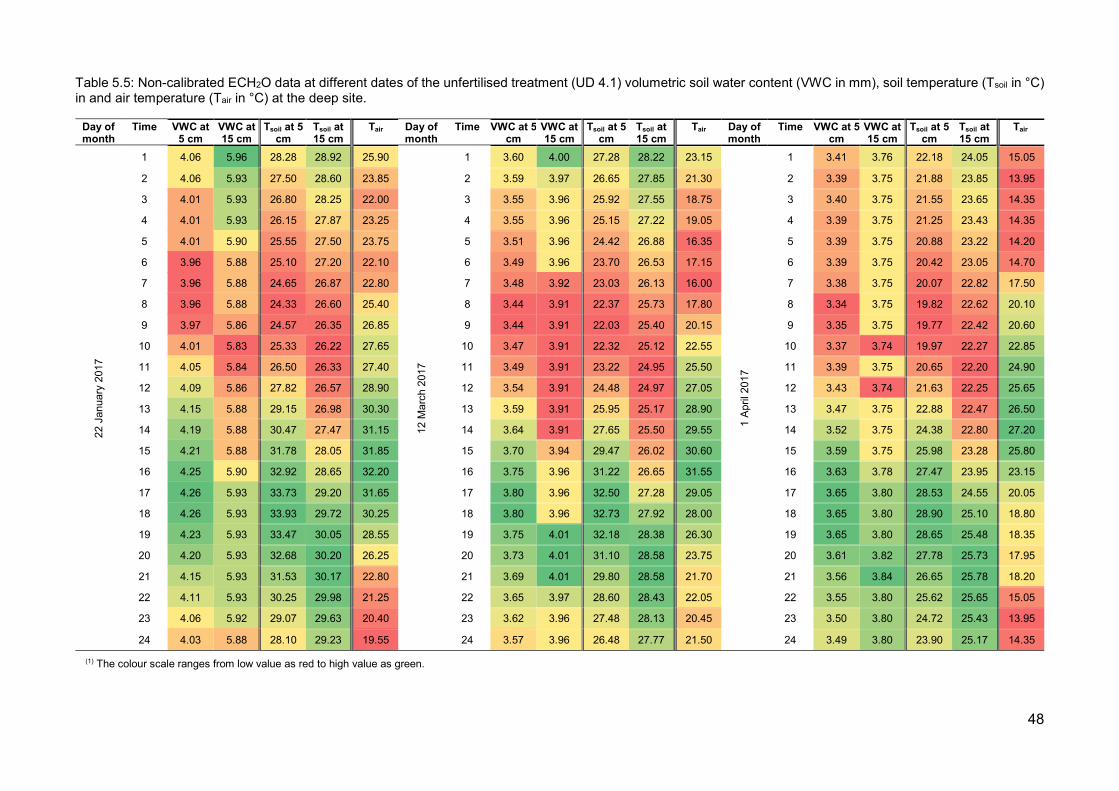
48
Table 5.5: Non-calibrated ECH2O data at different dates of the unfertilised treatment (UD 4.1) volumetric soil water content (VWC in mm), soil temperature (Tsoil in °C) in and air temperature (Tair in °C) at the deep site.
Day of month
Time VWC at 5 cm
VWC at 15 cm
Tsoil at 5 cm
Tsoil at 15 cm
Tair Day of month
Time VWC at 5 cm
VWC at 15 cm
Tsoil at 5 cm
Tsoil at 15 cm
Tair Day of month
Time VWC at 5 cm
VWC at 15 cm
Tsoil at 5 cm
Tsoil at 15 cm
Tair
22 J
anua
ry 2
017
1 4.06 5.96 28.28 28.92 25.90
12 M
arc
h 2
017
1 3.60 4.00 27.28 28.22 23.15
1 A
pril
201
7
1 3.41 3.76 22.18 24.05 15.05
2 4.06 5.93 27.50 28.60 23.85 2 3.59 3.97 26.65 27.85 21.30 2 3.39 3.75 21.88 23.85 13.95
3 4.01 5.93 26.80 28.25 22.00 3 3.55 3.96 25.92 27.55 18.75 3 3.40 3.75 21.55 23.65 14.35
4 4.01 5.93 26.15 27.87 23.25 4 3.55 3.96 25.15 27.22 19.05 4 3.39 3.75 21.25 23.43 14.35
5 4.01 5.90 25.55 27.50 23.75 5 3.51 3.96 24.42 26.88 16.35 5 3.39 3.75 20.88 23.22 14.20
6 3.96 5.88 25.10 27.20 22.10 6 3.49 3.96 23.70 26.53 17.15 6 3.39 3.75 20.42 23.05 14.70
7 3.96 5.88 24.65 26.87 22.80 7 3.48 3.92 23.03 26.13 16.00 7 3.38 3.75 20.07 22.82 17.50
8 3.96 5.88 24.33 26.60 25.40 8 3.44 3.91 22.37 25.73 17.80 8 3.34 3.75 19.82 22.62 20.10
9 3.97 5.86 24.57 26.35 26.85 9 3.44 3.91 22.03 25.40 20.15 9 3.35 3.75 19.77 22.42 20.60
10 4.01 5.83 25.33 26.22 27.65 10 3.47 3.91 22.32 25.12 22.55 10 3.37 3.74 19.97 22.27 22.85
11 4.05 5.84 26.50 26.33 27.40 11 3.49 3.91 23.22 24.95 25.50 11 3.39 3.75 20.65 22.20 24.90
12 4.09 5.86 27.82 26.57 28.90 12 3.54 3.91 24.48 24.97 27.05 12 3.43 3.74 21.63 22.25 25.65
13 4.15 5.88 29.15 26.98 30.30 13 3.59 3.91 25.95 25.17 28.90 13 3.47 3.75 22.88 22.47 26.50
14 4.19 5.88 30.47 27.47 31.15 14 3.64 3.91 27.65 25.50 29.55 14 3.52 3.75 24.38 22.80 27.20
15 4.21 5.88 31.78 28.05 31.85 15 3.70 3.94 29.47 26.02 30.60 15 3.59 3.75 25.98 23.28 25.80
16 4.25 5.90 32.92 28.65 32.20 16 3.75 3.96 31.22 26.65 31.55 16 3.63 3.78 27.47 23.95 23.15
17 4.26 5.93 33.73 29.20 31.65 17 3.80 3.96 32.50 27.28 29.05 17 3.65 3.80 28.53 24.55 20.05
18 4.26 5.93 33.93 29.72 30.25 18 3.80 3.96 32.73 27.92 28.00 18 3.65 3.80 28.90 25.10 18.80
19 4.23 5.93 33.47 30.05 28.55 19 3.75 4.01 32.18 28.38 26.30 19 3.65 3.80 28.65 25.48 18.35
20 4.20 5.93 32.68 30.20 26.25 20 3.73 4.01 31.10 28.58 23.75 20 3.61 3.82 27.78 25.73 17.95
21 4.15 5.93 31.53 30.17 22.80 21 3.69 4.01 29.80 28.58 21.70 21 3.56 3.84 26.65 25.78 18.20
22 4.11 5.93 30.25 29.98 21.25 22 3.65 3.97 28.60 28.43 22.05 22 3.55 3.80 25.62 25.65 15.05
23 4.06 5.92 29.07 29.63 20.40 23 3.62 3.96 27.48 28.13 20.45 23 3.50 3.80 24.72 25.43 13.95
24 4.03 5.88 28.10 29.23 19.55 24 3.57 3.96 26.48 27.77 21.50 24 3.49 3.80 23.90 25.17 14.35
(1) The colour scale ranges from low value as red to high value as green.
Stellenbosch University https://scholar.sun.ac.za

49
Table 5.6: Non-calibrated ECH2O data at different dates of fertilised treatment (FD 2.2) volumetric soil water content (VWC in mm), soil temperature (Tsoil in °C) in and air temperature (Tair in °C) at the deep site
Day of month
Time VWC at 5 cm
VWC at 15 cm
Tsoil at 5 cm
Tsoil at 15 cm
Tair Day of month
Time VWC at 5 cm
VWC at 15 cm
Tsoil at 5 cm
Tsoil at 15 cm
Tair Day of month
Time VWC at 5 cm
VWC at 15 cm
Tsoil at 5 cm
Tsoil at 15 cm
Tair
22 J
anua
ry 2
017
1 3.68 4.10 28.50 30.10 25.90
12 M
arc
h 2
017
1 3.52 3.58 27.05 29.25 23.15
1 A
pril
201
7
1 3.38 3.32 21.42 23.95 15.05
2 3.68 4.10 27.35 29.58 23.85 2 3.50 3.56 26.23 28.75 21.30 2 3.37 3.32 21.05 23.65 13.95
3 3.62 4.07 26.32 29.08 22.00 3 3.49 3.56 25.33 28.25 18.75 3 3.36 3.32 20.63 23.38 14.35
4 3.62 4.04 25.40 28.58 23.25 4 3.46 3.51 24.38 27.75 19.05 4 3.33 3.32 20.23 23.13 14.35
5 3.60 4.03 24.58 28.10 23.75 5 3.43 3.50 23.45 27.23 16.35 5 3.32 3.32 19.65 22.85 14.20
6 3.58 3.98 23.95 27.62 22.10 6 3.41 3.50 22.55 26.68 17.15 6 3.32 3.28 19.05 22.55 14.70
7 3.56 3.93 23.35 27.20 22.80 7 3.38 3.47 21.73 26.15 16.00 7 3.27 3.26 18.65 22.25 17.50
8 3.56 3.92 22.95 26.80 25.40 8 3.37 3.44 21.05 25.65 17.80 8 3.30 3.26 18.47 21.95 20.10
9 3.57 3.92 23.35 26.45 26.85 9 3.37 3.44 20.85 25.13 20.15 9 3.29 3.26 18.62 21.68 20.60
10 3.62 3.92 24.70 26.30 27.65 10 3.38 3.44 21.62 24.77 22.55 10 3.35 3.26 19.35 21.52 22.85
11 3.66 3.92 26.92 26.38 27.40 11 3.45 3.44 23.37 24.62 25.50 11 3.38 3.26 20.88 21.53 24.90
12 3.72 3.93 29.45 26.77 28.90 12 3.49 3.44 25.75 24.80 27.05 12 3.45 3.26 22.77 21.77 25.65
13 3.79 3.96 31.98 27.37 30.30 13 3.58 3.44 28.43 25.25 28.90 13 3.50 3.27 24.83 22.25 26.50
14 3.84 4.03 34.02 28.12 31.15 14 3.62 3.47 30.67 25.97 29.55 14 3.54 3.32 26.55 22.92 27.20
15 3.86 4.05 35.45 28.93 31.85 15 3.67 3.50 32.72 26.83 30.60 15 3.58 3.32 28.35 23.73 25.80
16 3.92 4.10 37.23 29.73 32.20 16 3.72 3.55 34.97 27.82 31.55 16 3.62 3.39 30.32 24.65 23.15
17 3.92 4.10 38.48 30.53 31.65 17 3.74 3.57 36.20 28.82 29.05 17 3.66 3.44 31.53 25.55 20.05
18 3.92 4.12 38.48 31.25 30.25 18 3.74 3.62 35.85 29.68 28.00 18 3.64 3.44 31.70 26.32 18.80
19 3.90 4.16 37.22 31.72 28.55 19 3.70 3.62 34.52 30.20 26.30 19 3.62 3.45 30.75 26.87 18.35
20 3.86 4.15 35.55 31.90 26.25 20 3.65 3.62 32.52 30.40 23.75 20 3.59 3.48 28.92 27.10 17.95
21 3.80 4.15 33.40 31.82 22.80 21 3.60 3.62 30.47 30.25 21.70 21 3.54 3.46 27.05 27.00 18.20
22 3.74 4.11 31.22 31.45 21.25 22 3.56 3.62 28.73 29.85 22.05 22 3.49 3.44 25.48 26.67 15.05
23 3.69 4.10 29.42 30.95 20.40 23 3.54 3.59 27.32 29.35 20.45 23 3.48 3.44 24.25 26.22 13.95
24 3.68 4.08 27.97 30.35 19.55 24 3.50 3.56 26.48 27.77 21.50 24 3.44 3.44 23.20 25.73 14.35
(1) The colour scale ranges from low value as red to high value as green.
Stellenbosch University https://scholar.sun.ac.za

50
Table 5.7: Non-calibrated ECH2O data at different dates of bare treatment (BD 3) volumetric soil water content (VWC in mm), soil temperature (Tsoil in °C) in and air temperature (Tair in °C) at the deep site.
Day of month
Time VWC at 5 cm
VWC at 15 cm
Tsoil at 5 cm
Tsoil at 15 cm
Tair Day of month
Time VWC at 5 cm
VWC at 15 cm
Tsoil at 5 cm
Tsoil at 15 cm
Tair Day of month
Time VWC at 5 cm
VWC at 15 cm
Tsoil at 5 cm
Tsoil at 15 cm
Tair
22 J
anua
ry 2
017
1 2.66 5.27 27.23 29.18 25.90
12 M
arc
h 2
017
1 2.45 3.94 25.85 28.90 23.15
1 A
pril
201
7
1 2.30 3.75 20.83 24.13 15.05
2 2.62 5.24 26.27 28.83 23.85 2 2.42 3.91 25.18 28.48 21.30 2 2.30 3.74 20.50 23.88 13.95
3 2.61 5.23 25.37 28.47 22.00 3 2.40 3.91 24.25 28.02 18.75 3 2.30 3.72 20.10 23.63 14.35
4 2.60 5.23 24.63 28.12 23.25 4 2.39 3.91 23.20 27.57 19.05 4 2.30 3.70 19.65 23.37 14.35
5 2.56 5.23 23.95 27.72 23.75 5 2.35 3.90 22.33 27.13 16.35 5 2.27 3.70 19.03 23.12 14.20
6 2.56 5.23 23.42 27.37 22.10 6 2.35 3.86 21.48 26.68 17.15 6 2.24 3.70 18.47 22.85 14.70
7 2.56 5.23 22.88 27.05 22.80 7 2.31 3.86 20.75 26.20 16.00 7 2.24 3.70 18.20 22.60 17.50
8 2.56 5.22 22.92 26.75 25.40 8 2.30 3.86 20.20 25.70 17.80 8 2.24 3.70 18.15 22.32 20.10
9 2.60 5.22 24.32 26.53 26.85 9 2.33 3.86 20.63 25.32 20.15 9 2.27 3.70 18.48 22.12 20.60
10 2.68 5.23 26.67 26.50 27.65 10 2.38 3.86 22.28 25.05 22.55 10 2.31 3.70 19.68 22.00 22.85
11 2.74 5.23 29.12 26.65 27.40 11 2.44 3.86 24.57 24.93 25.50 11 2.37 3.70 21.68 22.00 24.90
12 2.78 5.23 30.97 26.98 28.90 12 2.50 3.86 27.00 25.10 27.05 12 2.42 3.70 23.72 22.22 25.65
13 2.83 5.23 32.70 27.45 30.30 13 2.57 3.86 29.38 25.47 28.90 13 2.48 3.70 25.68 22.60 26.50
14 2.87 5.23 33.93 28.02 31.15 14 2.62 3.87 31.48 26.08 29.55 14 2.52 3.75 27.62 23.18 27.20
15 2.87 5.24 34.68 28.58 31.85 15 2.67 3.91 33.75 26.88 30.60 15 2.59 3.75 29.75 23.95 25.80
16 2.90 5.24 35.90 29.15 32.20 16 2.72 3.92 35.92 27.70 31.55 16 2.61 3.77 31.37 24.73 23.15
17 2.92 5.23 36.63 29.72 31.65 17 2.73 3.96 36.53 28.57 29.05 17 2.61 3.80 31.98 25.45 20.05
18 2.87 5.23 35.95 30.17 30.25 18 2.69 3.96 35.28 29.25 28.00 18 2.59 3.80 31.50 26.15 18.80
19 2.86 5.23 34.85 30.45 28.55 19 2.63 3.96 33.17 29.72 26.30 19 2.54 3.81 29.87 26.62 18.35
20 2.80 5.18 33.32 30.58 26.25 20 2.58 3.96 30.90 29.83 23.75 20 2.48 3.81 27.65 26.80 17.95
21 2.74 5.18 31.25 30.47 22.80 21 2.52 3.96 28.77 29.68 21.70 21 2.43 3.80 25.68 26.68 18.20
22 2.70 5.18 29.23 30.25 21.25 22 2.47 3.96 27.12 29.30 22.05 22 2.40 3.80 24.23 26.40 15.05
23 2.66 5.18 27.62 29.90 20.40 23 2.45 3.94 25.73 28.88 20.45 23 2.36 3.80 23.05 25.97 13.95
24 2.62 5.13 26.45 29.47 19.55 24 2.40 3.91 24.60 28.42 21.50 24 2.35 3.79 22.12 25.57 14.35
(1) The colour scale ranges from low value as red to high value as green.
Stellenbosch University https://scholar.sun.ac.za

51
5.2.2 Growing season of 2016/17
The SWB started on 4 July 2016 and ended on 11 April 2017. The Diviner 2000 broke down after 11
April 2017, therefore it is regarded as the end of the season. The total rainfall was 98.8 mm during
the 2016/17 growing season. A significant amount of rainfall for dryland farming under semi-arid
conditions is considered to be above 10 mm according to Hoffman (1993). Therefore, July 2016
(34.2 mm), August 2016 (20.7 mm), September 2016 (24.6 mm) and December 2016 (13.5 mm)
received rain above the average significant rainfall (> 10 mm). October 2016 (3 mm), November
2016 (3 mm) and April 2017 (2.4 mm) received below the average significant rainfall. The rainfall of
January 2017 (0.9 mm) and February (0.3 mm) was far below the average significant rainfall. There
was no rainfall in March 2017. The climatic data is presented in Table A.1 in Appendix A.
5.2.3 Soil water balances of unfertilised and fertilised treatments
The SWB in the 0–30 cm soil depth of the unfertilised and fertilised treatments on the shallow soils
are presented in Tables 5.8 and 5.9, respectively. The SWB in the 0–80 cm soil depth of the
unfertilised and fertilised treatments on the deep soils are presented in Tables 5.10 and 5.11,
respectively. The following dates were selected to examine the difference between the growing
season i.e. around 39, 47, 77, 106 and 278 days after planting. The first two dates were selected
because the most significant rainfall occurred 39 and 47 days after planting. Rooibos grows actively
during September to May and, in this case, 77 days after planting to the harvesting were the
respective dates. The prime flower stadium occurred from September to November, therefore the
end of September i.e. day 106 was chosen. The red value indicated that the total SWC had
increased. Evaluation of the SWC for all treatments showed at the shallow and deep sites that there
was no water table presence since the field capacity was 9.2 mm. In the shallow soils, the unfertilised
treatment had higher total SWC from planting to 297 days after planting by 3.4–16.2 mm compared
to the fertilised treatment which total SWC ranged from 2.7–13.1 mm. The largest difference between
the two treatments was 3.9 mm at 83 days after planting. This only lasted for 14 days before the
smallest difference. The smallest difference of 0.1 mm between the two treatments was recorded at
97 and 255 days after planting. At the end of the season, the unfertilised treatment stored 1 mm
more (p = 0.03) water than the fertilised treatment. At the deep sites, the total SWC of the unfertilised
treatment ranged from 7.9–30 mm over the duration of the growing season, and ranged from 11.3–
29.0 mm for the fertilised treatment (Tables 5.10 & 5.11). The smallest difference of 0.2 mm between
the two treatments was recorded at 197 days after planting, whereas the largest difference of 3.7
mm was at 106 days after planting. At the end of the season the fertilised treatment stored 1.4 mm
more water than the unfertilised treatment but this difference was not significant (p = 0.16).
Stellenbosch University https://scholar.sun.ac.za

52
Table 5.8: Temperature corrected soil water content of each soil depth (mm/100 mm) and components of the soil water balance of unfertilised treatment in the 0–30 cm soil depth during the 2016/17 growing season.
Days after planting
18 26 33 39 47 55 61 68 77 83 91 97 106 149 161 168 174 181 189 197 205 219 225 243 251 259 268 278 288 297
Date 04
/07/
2016
12/0
7/20
16
19/0
7/20
16
25/0
7/20
16
02/0
8/20
16
10/0
8/20
16
16/0
8/20
16
23/0
8/20
16
01/0
9/20
16
07/0
9/20
16
15/0
9/20
16
21/0
9/20
16
30/0
9/20
16
11/1
1/20
16
23/1
1/20
16
30/1
1/20
16
07/1
2/20
16
15/1
2/20
16
23/1
2/20
16
31/1
2/20
16
08/0
1/20
17
22/0
1/20
17
28/0
1/20
17
15/0
2/20
17
23/0
2/20
17
03/0
3/20
17
12/0
3/20
17
22/0
3/20
17
01/0
4/20
17
11/0
4/20
17
Soil depth
0–10 cm 2.5 1.6 2.4 3.1 2.9 2 2.8 4.7 3.4 2.4 1 1 1.4 1.3 0.2 0.3 0.7 0.7 1.7 0.8 0.7 0.8 0.2 1 1.1 0.9 1.3 1.1 1.1 1.1
10–20 cm 6.7 5.5 4.4 6.7 6.8 5.6 5.9 7.2 4.4 4.2 3.7 4.6 6 4.6 2.6 3 2.5 2.2 3.6 2.1 1.8 2.6 1.6 1.4 1.2 1.3 1.3 1.2 1.4 1.3
20–30 cm 4.6 4.1 3.4 4.5 4.8 4.1 4 4.3 2.7 3 2.7 3.2 4.2 3.5 3.2 2.5 2.3 2 2.3 1.9 1.8 2.3 2.2 1.5 1.2 1.2 1.1 1.3 1.2 1.3
Total SWC(1) 13.8 11.2 10.2 14.3 14.5 11.7 12.7 16.2 10.5 9.6 7.4 8.8 11.6 9.4 6.0 5.8 5.5 4.9 7.6 4.8 4.3 5.7 4.0 3.9 3.5 3.4 3.7 3.6 3.7 3.7
ΔS(2) 2.6 1.0 -4.1 -0.2 2.8 -1.0 -3.5 5.7 0.9 2.2 -1.4 -2.8 2.2 3.4 0.2 0.3 0.6 -2.7 2.8 0.5 -1.4 1.7 0.1 0.4 0.1 -0.3 0.1 -0.1 0.0
P(3) 0.0 5.1 0.3 10.5 19.2 7.5 3.6 5.7 3.0 2.4 3.1 6.0 12.3 0.0 3.0 0.0 0.0 5.4 7.8 0.3 0.9 0.0 0.0 0.3 0.0 0.0 0.0 0.0 0.0 2.4
ΣP(4) 5.1 5.4 15.9 35.1 42.6 46.2 51.9 54.9 57.3 60.4 66.4 78.7 78.7 81.7 81.7 81.7 87.1 94.9 95.2 96.1 96.1 96.1 96.4 96.4 96.4 96.4 96.4 96.4 98.8
ET(5) 7.7 1.3 6.4 19.0 10.3 2.6 2.2 8.7 3.3 5.3 4.6 9.5 2.2 6.4 0.2 0.3 6.0 5.1 3.1 1.4 -1.4 1.7 0.4 0.4 0.1 -0.3 0.1 -0.1 2.4
Average ET/day(6) 1.0 0.2 1.1 2.4 1.3 0.4 0.3 1.0 0.6 0.7 0.8 1.1 0.1 0.5 0.0 0.1 0.9 0.6 0.4 0.2 -0.1 0.3 0.0 0.1 0.0 0.0 0.0 0.0 0.3
ΣET(7) 7.7 9.0 15.4 34.4 44.7 47.3 49.5 58.2 61.5 66.8 71.4 80.9 83.1 89.5 89.7 90.0 96.0 101.1 104.2 105.6 105.6(8) 107.3 107.7 108.1 108.2 108.2(8)108.3 108.3(8)110.7
(1) Total SWC Total soil water content (mm) (2) ΔS Change in soil water content (mm) (3) P Rainfall occurring between readings (mm) (4) ET Evapotranspiration (mm) (5) Average ET/day Evapotranspiration in (mm/day) (6) ΣP Cumulative rainfall (mm) (7) ΣET Cumulative evapotranspiration (mm) (8) These readings were taken during the midday and was corrected by the temperature sensitivity correction function.
Stellenbosch University https://scholar.sun.ac.za

53
Table 5.9: Temperature corrected soil water content of each soil depth (mm/100 mm) and components of the soil water balance of fertilised treatment in the 0–30 cm soil depth during the 2016/17 growing season.
Days after planting
18 26 33 39 47 55 61 68 77 83 91 97 106 149 161 168 174 181 189 197 205 219 225 243 251 259 268 278 288 297
Date
04/0
7/20
16
12/0
7/20
16
19/0
7/20
16
25/0
7/20
16
02/0
8/20
16
10/0
8/20
16
16/0
8/20
16
23/0
8/20
16
01/0
9/20
16
07/0
9/20
16
15/0
9/20
16
21/0
9/20
16
30/0
9/20
16
11/1
1/20
16
23/1
1/20
16
30/1
1/20
16
07/1
2/20
16
15/1
2/20
16
23/1
2/20
16
31/1
2/20
16
08/0
1/20
17
22/0
1/20
17
28/0
1/20
17
15/0
2/20
17
23/0
2/20
17
03/0
3/20
17
12/0
3/20
17
22/0
3/20
17
01/0
4/20
17
11/0
4/20
17
Soil depth
0–10 cm 2.5 2.1 2.1 3.1 3.0 2.5 2.8 4.3 2.8 1.5 1.5 2.2 3.2 2.0 1.2 0.9 0.9 0.9 1.7 0.8 0.8 1.1 0.9 0.8 0.7 0.9 1.0 0.7 0.9 0.7
10–20 cm 5.2 4.7 4.2 5.6 5.8 4.8 4.9 5.8 2.6 2.7 3.0 4.2 5.5 3.9 2.5 2.1 1.9 1.8 2.6 1.6 1.4 2.3 1.8 1.3 1.2 1.2 1.3 1.2 1.4 1.2
20–30 cm 2.7 2.5 2.3 2.9 3.0 2.6 2.6 3.0 1.3 1.5 1.6 2.5 2.1 2.5 2.1 1.5 1.3 1.2 1.2 1.0 1.0 1.3 1.2 0.9 0.9 0.8 0.8 1.0 0.9 0.8
Total SWC(1) 10.3 9.4 8.6 11.6 11.8 10.0 10.3 13.1 6.7 5.7 6.1 8.9 10.8 8.4 5.8 4.5 4.1 3.8 5.5 3.4 3.3 4.7 3.8 3.0 2.8 2.8 3.1 2.9 3.2 2.7
ΔS(2) 0.9 0.8 -2.9 -0.3 1.9 -0.3 -2.8 6.4 1.0 -0.4 -2.8 -1.9 2.4 2.6 1.3 0.3 0.4 -1.8 2.1 0.2 -1.4 0.8 0.8 0.2 0.0 -0.2 0.2 -0.3 0.5
P(3) 0.0 5.1 0.3 10.5 19.2 7.5 3.6 5.7 3.0 2.4 3.1 6.0 12.3 0.0 3.0 0.0 0.0 5.4 7.8 0.3 0.9 0.0 0.0 0.3 0.0 0.0 0.0 0.0 0.0 2.4
ΣP(4) 5.1 5.4 15.9 35.1 42.6 46.2 51.9 54.9 57.3 60.4 66.4 78.7 78.7 81.7 81.7 81.7 87.1 94.9 95.2 96.1 96.1 96.1 96.4 96.4 96.4 96.4 96.4 96.4 98.8
ET(5) 6.0 1.1 7.6 18.9 9.4 3.3 2.9 9.4 3.4 2.7 3.2 10.4 2.4 5.6 1.3 0.3 5.8 6.0 2.4 1.1 -1.4 0.8 1.1 0.2 0.0 -0.2 0.2 -0.3 2.9
Average ET/day(6) 0.8 0.2 1.3 2.4 1.2 0.5 0.4 1.0 0.6 0.3 0.5 1.2 0.1 0.5 0.2 0.1 0.8 0.8 0.3 0.1 -0.1 0.1 0.1 0.0 0.0 0.0 0.0 0.0 0.3
ΣET(7) 6.0 7.1 14.7 33.6 43.0 46.2 49.1 58.5 61.9 64.6 67.8 78.3 80.6 86.3 87.6 87.9 93.6 99.7 102.1 103.2 103.2(8) 104.0 105.1 105.3 105.3 105.3 (8)105.5105.5 (8)108.4
(1) Total SWC Total soil water content (mm) (2) ΔS Change in soil water content (mm) (3) P Rainfall occurring between readings (mm) (4) ET Evapotranspiration (mm) (5) Average ET/day Evapotranspiration in (mm/day) (6) ΣP Cumulative rainfall (mm) (7) ΣET Cumulative evapotranspiration (mm) (8) These readings were taken during the midday and was corrected by the temperature sensitivity correction function.
Stellenbosch University https://scholar.sun.ac.za

54
Table 5.10: Temperature corrected soil water content of each soil depth (mm/100 mm) and components of the soil water balance of unfertilised treatment in the 0–80 cm soil depth during the 2016/17 growing season.
Days after planting
18 26 33 39 47 55 61 68 77 83 91 97 106 149 161 168 174 181 189 197 205 219 225 243 251 259 268 278 288 297
Date 04
/07/
2016
12/0
7/20
16
19/0
7/20
16
25/0
7/20
16
02/0
8/20
16
10/0
8/20
16
16/0
8/20
16
23/0
8/20
16
01/0
9/20
16
07/0
9/20
16
15/0
9/20
16
21/0
9/20
16
30/0
9/20
16
11/1
1/20
16
23/1
1/20
16
30/1
1/20
16
07/1
2/20
16
15/1
2/20
16
23/1
2/20
16
31/1
2/20
16
08/0
1/20
17
22/0
1/20
17
28/0
1/20
17
15/0
2/20
17
23/0
2/20
17
03/0
3/20
17
12/0
3/20
17
22/0
3/20
17
01/0
4/20
17
11/0
4/20
17
Soil depth
0–10 cm 1.9 1.3 1.4 2.4 2.6 1.9 2.5 4.7 2.6 2.0 1.0 1.5 1.9 1.3 1.0 0.5 0.9 0.7 1.8 0.7 0.8 0.9 0.9 0.8 0.4 0.6 1.1 0.9 0.9 0.6
10–20 cm 6.1 4.8 4.1 5.8 5.9 5.1 5.3 6.7 4.6 3.8 3.8 4.1 5.8 4.3 3.4 2.9 2.7 2.1 3.3 2.0 1.8 2.5 2.1 1.4 1.1 0.7 1.4 1.3 1.4 1.2
20–30 cm 4.2 3.6 3.3 3.9 4.1 3.7 3.5 3.8 2.6 2.9 2.8 2.6 4.2 3.4 2.6 2.5 2.2 2.1 2.1 1.8 1.7 2.0 1.8 1.1 0.8 0.7 0.9 1.0 1.0 1.0
30–40 cm 3.4 2.9 2.7 3.0 3.5 3.0 2.8 2.7 2.2 2.3 2.2 2.0 3.3 2.8 2.2 2.0 1.9 1.7 1.6 1.5 1.4 1.5 1.4 1.2 0.9 0.9 1.0 1.0 1.1 1.0
40–50 cm 3.7 3.2 3.0 3.1 3.9 3.4 3.1 2.9 2.6 2.7 2.5 2.2 2.9 2.8 2.4 2.2 2.2 2.1 1.9 1.8 1.7 1.7 1.7 1.5 1.4 1.3 1.4 1.4 1.5 1.4
50–60 cm 3.4 3.1 3.0 3.1 3.8 3.4 3.3 3.0 2.9 2.9 2.7 2.6 2.6 2.7 2.5 2.4 2.4 2.2 2.0 1.9 1.8 1.8 1.8 1.5 1.5 1.3 1.4 1.4 1.4 1.5
60–70 cm 3.1 2.9 2.9 2.9 3.6 3.3 3.2 2.8 2.8 2.8 2.6 2.6 2.5 2.5 2.4 2.3 2.4 2.3 2.1 2.0 2.0 1.9 1.9 1.8 1.9 1.2 1.8 1.8 1.8 1.7
70–80 cm 2.7 2.6 2.6 2.6 3.0 2.8 2.7 2.5 2.6 2.5 2.4 2.3 2.2 2.2 2.2 2.1 2.1 2.0 1.9 1.8 1.7 1.7 1.7 1.4 1.5 1.3 1.3 1.3 1.3 1.4
Total SWC(1) 28.5 24.3 23.0 26.9 30.4 26.6 26.3 29.1 22.9 21.8 20.0 20.0 25.4 22.0 18.7 17.0 16.7 15.2 16.8 13.3 13.1 14.0 13.3 10.7 9.5 7.9 10.3 10.2 10.5 9.9
ΔS(2) 4.2 1.3 -3.9 -3.6 3.8 0.4 -2.8 6.2 1.0 1.8 0.0 -5.4 3.4 3.3 1.7 0.3 1.4 -1.6 3.5 0.2 -1.0 0.7 2.6 1.3 1.6 -2.5 0.1 -0.3 0.7
P(3) 0.0 5.1 0.3 10.5 19.2 7.5 3.6 5.7 3.0 2.4 3.1 6.0 12.3 0.0 3.0 0.0 0.0 5.4 7.8 0.3 0.9 0.0 0.0 0.3 0.0 0.0 0.0 0.0 0.0 2.4
ΣP(4) 5.1 5.4 15.9 35.1 42.6 46.2 51.9 54.9 57.3 60.4 66.4 78.7 78.7 81.7 81.7 81.7 87.1 94.9 95.2 96.1 96.1 96.1 96.4 96.4 96.4 96.4 96.4 96.4 98.8
ET(5) 9.3 1.6 6.6 15.6 11.3 4.0 2.9 9.2 3.4 4.9 6.0 6.9 3.4 6.3 1.7 0.3 6.8 6.2 3.8 1.1 -1.0 0.7 2.9 1.3 1.6 -2.5 0.1 -0.3 3.1
Average ET/day(6) 1.2 0.2 1.1 2.0 1.4 0.7 0.4 1.0 0.6 0.6 1.0 0.8 0.1 0.5 0.2 0.0 1.0 0.8 0.5 0.1 -0.1 0.1 0.2 0.2 0.2 -0.3 0.0 0.0 0.3
ΣET(7) 9.3 10.9 17.5 33.1 44.4 48.4 51.3 60.5 64.0 68.9 74.9 81.8 85.2 91.5 93.2 93.5 100.3 106.6 110.4 111.5 111.5(8) 112.2 115.2 116.4 118.0 118.0 (8)118.1 118.1 (8)121.2
(1) Total SWC Total soil water content (mm) (2) ΔS Change in soil water content (mm) (3) P Rainfall occurring between readings (mm) (4) ET Evapotranspiration (mm) (5) Average ET/day Evapotranspiration in (mm/day) (6) ΣP Cumulative rainfall (mm) (7) ΣET Cumulative evapotranspiration (mm) (8) These readings were taken during the midday and was corrected by the temperature sensitivity correction function.
Stellenbosch University https://scholar.sun.ac.za

55
Table 5.11: Temperature corrected soil water content of each soil depth (mm/100 mm) and components of the soil water balance of fertilised treatment in the 0–80 cm soil depth during the 2016/17 growing season.
Days after planting
18 26 33 39 47 55 61 68 77 83 91 97 106 149 161 168 174 181 189 197 205 219 225 243 251 259 268 278 288 297
Date 04
/07/
2016
12/0
7/20
16
19/0
7/20
16
25/0
7/20
16
02/0
8/20
16
10/0
8/20
16
16/0
8/20
16
23/0
8/20
16
01/0
9/20
16
07/0
9/20
16
15/0
9/20
16
21/0
9/20
16
30/0
9/20
16
11/1
1/20
16
23/1
1/20
16
30/1
1/20
16
07/1
2/20
16
15/1
2/20
16
23/1
2/20
16
31/1
2/20
16
08/0
1/20
17
22/0
1/20
17
28/0
1/20
17
15/0
2/20
17
23/0
2/20
17
03/0
3/20
17
12/0
3/20
17
22/0
3/20
17
01/0
4/20
17
11/0
4/20
17
Soil depth
0–10 cm 1.3 0.6 0.7 1.4 1.3 1.0 1.4 2.0 1.5 1.4 0.5 0.7 1.2 0.7 0.4 0.5 0.5 0.6 1.3 0.5 0.7 0.6 0.6 0.5 0.7 0.8 1.1 0.9 0.9 0.7
10–20 cm 4.4 3.6 3.2 4.4 4.4 3.9 3.8 4.4 2.4 2.5 2.1 2.5 3.9 2.7 2.2 1.8 1.6 1.5 1.9 1.3 1.4 1.9 1.5 1.1 1.2 1.2 1.3 1.2 1.3 1.2
20–30 cm 3.9 3.4 3.2 3.8 4.2 3.8 3.5 3.6 2.3 2.3 2.0 2.1 3.6 2.8 2.3 2.0 1.9 1.8 1.7 1.6 1.6 1.8 1.7 1.4 1.3 1.3 1.3 1.3 1.4 1.3
30–40 cm 3.6 3.1 3.0 3.3 3.8 3.4 3.2 3.1 2.3 2.3 2.0 1.9 2.9 2.5 2.1 1.9 1.9 1.8 1.7 1.6 1.6 1.6 1.6 1.4 1.2 1.2 1.2 1.2 1.3 1.2
40–50 cm 3.8 3.3 3.2 3.4 4.1 3.7 3.5 3.3 2.8 2.8 2.4 2.3 2.5 2.6 2.2 2.2 2.1 2.1 2.0 1.9 2.0 1.9 1.9 1.6 1.5 1.5 1.6 1.5 1.6 1.5
50–60 cm 3.3 3.0 2.9 3.0 3.7 3.5 3.3 3.0 2.8 2.8 2.5 2.4 2.3 2.4 2.4 2.1 2.2 2.2 2.0 1.9 2.0 1.9 1.9 1.8 1.7 1.7 1.7 1.7 1.7 1.6
60–70 cm 3.3 3.0 3.0 3.1 3.8 3.5 3.4 3.1 3.1 3.1 2.8 2.7 2.6 2.6 2.4 2.4 2.5 2.5 2.3 2.2 2.3 2.2 2.2 2.1 2.1 2.0 2.0 1.9 1.9 1.9
70–80 cm 3.3 3.1 3.1 3.1 3.6 3.4 3.3 3.1 3.2 3.0 2.9 2.8 2.7 2.7 2.4 2.5 2.6 2.6 2.4 2.3 2.4 2.3 2.2 2.1 2.0 2.0 2.0 1.9 1.9 1.8
Total SWC(1) 26.9 23.1 22.4 25.5 29.0 26.3 25.5 25.7 20.3 20.2 17.1 17.5 21.7 19.0 16.5 15.4 15.1 14.9 15.3 13.4 13.8 14.4 13.7 12.0 11.8 11.7 12.1 11.6 12.0 11.3
ΔS(2) 3.8 0.7 -3.1 -3.5 2.7 0.8 -0.2 5.3 0.2 3.1 -0.4 -4.2 2.6 2.5 1.1 0.2 0.2 -0.3 1.8 -0.3 -0.6 0.7 1.6 0.2 0.1 -0.4 0.5 -0.4 0.7
P(3) 0.0 5.1 0.3 10.5 19.2 7.5 3.6 5.7 3.0 2.4 3.1 6.0 12.3 0.0 3.0 0.0 0.0 5.4 7.8 0.3 0.9 0.0 0.0 0.3 0.0 0.0 0.0 0.0 0.0 2.4
ΣP(4) 5.1 5.4 15.9 35.1 42.6 46.2 51.9 54.9 57.3 60.4 66.4 78.7 78.7 81.7 81.7 81.7 87.1 94.9 95.2 96.1 96.1 96.1 96.4 96.4 96.4 96.4 96.4 96.4 98.8
ET(5) 8.9 1.0 7.4 15.7 10.2 4.4 5.5 8.3 2.6 6.2 5.6 8.1 2.6 5.5 1.1 0.2 5.6 7.5 2.1 0.6 -0.6 0.7 1.9 0.2 0.1 -0.4 0.5 -0.4 3.1
Average ET/day(6) 1.1 0.1 1.2 2.0 1.3 0.7 0.8 0.9 0.4 0.8 0.9 0.9 0.1 0.5 0.2 0.0 0.8 0.9 0.3 0.1 0.0 0.1 0.1 0.0 0.0 0.0 0.0 0.0 0.3
ΣET(7) 8.9 9.9 17.3 33.1 43.2 47.7 53.2 61.5 64.0 70.3 75.8 84.0 86.6 92.1 93.2 93.5 99.1 106.5 108.7 109.2 109.2(8) 109.9 111.9 112.1 112.2 112.2 (8)112.7 112.7(8) 115.8
(1) Total SWC Total soil water content (mm) (2) ΔS Change in soil water content (mm) (3) P Rainfall occurring between readings (mm) (4) ET Evapotranspiration (mm) (5) Average ET/day Evapotranspiration in (mm/day) (6) ΣP Cumulative rainfall (mm) (7) ΣET Cumulative evapotranspiration (mm) (8) These readings were taken during the midday and was corrected by the temperature sensitivity correction function.
Stellenbosch University https://scholar.sun.ac.za

56
The higher SWC of the unfertilised treatment at both sites may be due to (1) higher percentage
surface cover and (2) lower soil temperature (Table 5.12) compared to the fertilised treatment. The
percentage surface of the unfertilised treatment was 25–36% compared to the percentage surface
of the fertilised treatment of 2–8% at both sites. Rooibos did not have a positive relationship with P
concentration in the soil, but rather a negative relationship (personal observation) and most of the
Rooibos plants died. Similar results were found by Harris (2006) where the growth of Protea
obtusifolia decreased from 8.1 to 7.8 cm when P increased from 1 to 10 mg.kg-1 in the Cape Floristic
Region, respectively. Corbella-Tena et al. (2015) reported that the different growth stages (6, 9 & 12
months) of Leucospermum cordifolium ‘Flame Spike’ decreased if the P concentration increased.
The growth decreased from 2.0 to 1.6 g (6 month), 3.1 to 2.0 g (9 month) and 4.4 to 3.7 g (12 month)
with increased P concentration of 5 to 10 mg.kg-1. Moreover, the P toxicity effect was found on the
young plants if the concentration was higher than 5 mg.kg-1. Therefore, smaller percentage surface
of the fertilised treatment caused more direct contact with the sunlight and the soil temperature
increased (Power et al., 1986). In Table 5.12, the average maximum soil temperature of the fertilised
treatment in the 0–10 cm soil layer was 3.86°C significant (p < 0.05) higher than the unfertilised
treatment. In the 10–20 cm soil layer, the average maximum soil temperature of the fertilised
treatment was 1.5°C greater than the unfertilised treatment. This was not significant enough (p =
0.08) due to delayed energy transfer (Refer to Section 5.2.1). In a study of temperature effects it was
shown that the SWC decreased by 0.2 mm (soil with 30 mm SWC), and 0.6 mm (soil with 306 mm
SWC) when soil temperature increased from 25 to 45°C reported by Gong et al. (2003).
Table 5.12: Maximum and difference of soil temperature (Tsoil in °C) between the unfertilised and fertilised
treatment of the deep soils at 5 and 15 cm soil depths.
Days after
planting
Unfertilised Fertilised Average
difference of
maximum Tsoil
Unfertilised Fertilised Average
difference of
maximum Tsoil
Maximum Tsoil
at 5 cm
Maximum Tsoil
at 5 cm
Maximum Tsoil
at 15 cm
Maximum Tsoil
at 15 cm
149 28.9 34.6 5.7 26.8 28.2 1.4
161 25.4 28.5 3.1 24.7 25.9 1.2
168 30.2 34.7 4.5 28.4 29.8 1.4
174 30.7 36.7 6.0 28.4 29.7 1.3
181 30.6 35.2 4.6 28.9 30.0 1.1
189 27.2 29.9 2.7 25.9 26.4 0.5
197 33.5 36.3 2.8 31.7 33.3 1.6
205 34.2 39.7 5.5 31.6 33.2 1.6
219 34.0 38.7 4.7 30.2 31.9 1.7
225 31.2 35.6 4.4 27.7 29.3 1.6
243 34.6 38.5 3.9 29.8 32.0 2.2
251 35.1 38.4 3.3 30.6 32.9 2.3
259 29.0 30.8 1.8 27.8 28.3 0.5
268 32.8 36.3 3.5 28.6 30.4 1.8
278 34.7 37.9 3.2 30.1 32.2 2.1
288 29.9 31.8 2.9 25.8 27.1 1.3
279 27.6 30.7 3.1 24.7 25.9 1.2
Stellenbosch University https://scholar.sun.ac.za

57
In each soil layer, the 0–10 cm soil layer of the unfertilised and fertilised treatment was the lowest
with a maximum of 4.7 and 4.3 mm at the shallow site, respectively. The SWC in the 10–20 cm soil
layer of the unfertilised treatment at the shallow site had the highest maximum SWC of 6.8 mm and
the fertilised treatment of 5.8 mm. In the 20–30 cm soil layer of the unfertilised treatment, the SWC
was significantly (p < 0.05) higher compared to the fertilised treatment. At the deep site, the SWC of
the unfertilised treatment in the 0–10 cm soil layer was a maximum of 4.7 mm and for the fertilised,
it was 1.4 mm. The 10–20 cm soil layer of the unfertilised treatment had the highest SWC from
planting to the end of the season of 6.7 mm. For the fertilised treatment, the SWC was 4.4 mm. In
the 70–80 cm soil layer, the SWC of the fertilised treatment was significantly (p < 0.05) higher than
that of the unfertilised treatment. The reason for the higher water content of the fertilised treatment
in the 60-80 cm soil layer from 197 days after planting to the end of the season was the shorter
taproots (Refer to Section 6.3.1.2 in Chapter 6). Thus, lower SWC in the 60-80 cm soil layer was
most likely due to water withdrawal by longer taproots in the unfertilised soils (Refer to Section
6.3.1.2 in Chapter 6).
In the winter season (July–August 2016), the total SWC in the shallow soils of the two treatments
ranged between 8.6–14.5 mm (Tables 5.8 & 5.9). During the summer season, the total SWC ranged
between 2.8–5.7 mm. In the deep soils, the SWC ranged from 22.4–30.4 mm and 11.7–16.8 mm in
the winter and summer, respectively. As expected, the deeper soils had higher SWC than the shallow
soils. Therefore, deeper soils stored significantly more water. Results of Myburgh and Conradie
(1996) showed that deeper soils (120 cm) had a higher SWC of 614 mm compared to shallow soils
(40 cm) of 387 mm under semi-arid conditions.
Soil water content in the 0–10 cm soil layer of the shallow and deep soils did not differ, however the
SWC was lower compared to the other soil layers (Tables 5.8 to 5.11). The 0–10 cm soil layer was
more directly exposed to environmental factors such as sunlight and wind speed. This is the most
likely explanation for the lower SWC. A study in southeast of Niamey, Niger under semi-arid
conditions showed that the 0–0.3 cm soil layer had lower SWC of 0.3–12 mm compared to the 0.3–
5 cm soil layer which had SWC of 5.9–12 mm of sandy soil (91% sand). The high SWC in the 10–
20 cm soil layer during the winter season (July–August 2016) at both sites did not differ significant.
Results from Hudson's (1994) study showed that in sandy soil, as the SOC increased from 0.5 to
3%, the SWC doubled. Lower bulk density (Tables 4.5 & 4.6) due to tillage in the 10–20 cm soil layer
of both treatments at both sites could also be associated with higher SWC. In contrast, Matimati et.
al. (2014) reported that transpiration and redistribution will increase the SWS and nutrient acquisition.
However, in the current study showed that higher SWC in the 10–20 cm soil layer was due to the
higher root concentration (Refer to Chapter 6) which correlated with higher SOC content (Table 4.2),
low bulk density, low soil temperature and could increase the nutrient acquisitions. Another reason
for the high SWC in the 10–20 cm soil layer can be provided but the analysis of the air pore relative
humidity beyond the scope of the study. The air pore relative humidity with soil temperature per soil
Stellenbosch University https://scholar.sun.ac.za

58
depth will show when the vapour phase from the deeper soil layer will condenses in the 10–20 cm
soil layer.
From 33 to 39 days after planting of the Rooibos plants on the shallow soils, the total SWC increased
by 4.1 mm for unfertilised treatment compared to the fertilised treatment of 2.9 mm (Tables 5.8 &
5.9). The SWC of unfertilised and unfertilised treatments during the second significant rainfall in
August 2016 increased approximately the same by 0.3 mm and 0.2 mm, respectively. The SWC of
all the layers showed an increase down to 30 cm soil depth during the first and second significant
rainfall events. During the third significant rainfall event, the total SWC increased by 2.8 and 1.9 mm
for the unfertilised and fertilised treatments, respectively. In the deep soils, the total SWC increased
by 3.9 mm for the unfertilised treatment and 3.1 mm for the fertilised treatment during the first
significant rainfall in July 2016 (Tables 5.10 & 5.11). Soil water content increased in the upper 0 to
50 cm soil layer. The total SWC of unfertilised and unfertilised treatments during the second
significant rainfall in August 2016 increased by 3.6 and 3.5 mm, respectively. The SWC of all the soil
layers showed an increase down to 80 cm soil layer. In September 2016 when the third significant
rainfall event took place, the total SWC increased by 5.4 and 4.2 mm for the unfertilised and fertilised
treatments, respectively. The SWC increased between 20–40 cm soil layer by 3.8–5.8 mm
(unfertilised treatment) and 2.9–3.9 mm (fertilised treatment).
During the period from 39 to 47 days after planting when it rained 19.2 mm, the total SWC of all the
treatments at both sites remained more or less the same. Lu et al. (2011) reported similar
observations where the SWC minimally of 10 mm increased in the upper 0 to 50 cm soil layer with a
rainfall of 25.7 mm under semi-arid conditions. The second significant rain event did not have the
same effect on the shallow soils as it did on the deeper soils. This is due to the higher
evapotranspiration (ET) rate of 2.4 mm.day-1 at the shallow site compared to the 2.0 mm.day-1.
During the third significant rainfall event, the same results occurred as during the second significant
rainfall.
At the shallow site, the maximum ET during the winter was 19 and 18.9 mm for the unfertilised and
fertilised treatments, respectively (Tables 5.8 & 5.9). In the dry season, the maximum ET was 0.1
and 0.0 mm, respectively. The ET at the deep site during the winter was 15.6 and 15.7 mm for the
unfertilised and fertilised treatments, respectively. During the summer, the ET was 0.1 mm for both
treatments. The ET of both sites was higher during in winter season (July–August 2016) compared
to the summer season (December 2016–February 2017) due to higher rainfall in the winter. Whereas
the cumulative evapotranspiration (ET) of unfertilised and fertilised treatment at the shallow sites
was higher in the winter of 49.5 and 49.1 mm compared to the summer of 18.1 and 17.7 mm,
respectively. In the deep soils, ET during the winter was 51.3 (unfertilised treatment) and 53.2 mm
(fertilised treatment), whereas, during the summer, the ET was 23.1 and 18.8 mm, respectively.
These results are in contrast where the ET of 191 mm was higher during the summer than during
Stellenbosch University https://scholar.sun.ac.za

59
the winter of 176 mm in dryland farming under semi-arid conditions in China (Zhang, Yao, et al.,
2016). However, Garbrecht et al. (2004) reported if the annual rainfall is under 900 mm, the ET
increased by the increase in rainfall of dryland farming in the Great Plain, United States. Unland et
al. (1996) demonstrated that the ET during July–August 1993 was 63.6 (115.6 mm rainfall) and
during December–February 1993, the ET was 37.4 mm (44.7 mm rainfall) in the southwestern
Plains. In South Africa, the Renosterveld surface in Voëlvlei Nature Reserve, the ET of 682 mm
was higher in the winter season than in the summer season of 620 mm (Jovanovic et al., 2011).
Thus, the limited ET in the summer season is linked to reduced SWC and lower rainfall (D’Odorico
& Porporato, 2004; Maliva & Missimer, 2012). Similar observations can be carried out by analysing
the SWC and ET between the shallow and deep soils in Figures 5.1 and 5.2. Deeper soils had
higher ET due to higher total SWC.
In Figure 5.1, the rainfall was only sufficient at 47 days after planting while it was higher than the
ET for the two treatments on both soils. According to Gardner (1958) and Gardner et al. (1999),
the ET rate is higher from a wetted rather than a drier soil. Therefore, there was a sharp increase in
ET after rainfall events (Fig. 5.1). A second statement of the increase in ET rate calculated by the
Gardner and Hillel (1962) model is explained in section 5.3.4. For dryland farming in Italy
(Mediterranean region), the daily ET showed an increase from 2.1 mm.day-1 to a value ranging
between 2.39 and 2.87 mm.day-1after a rainfall event above 10 mm (Cammalleri et al., 2012). In the
current study, there was a decrease in the SWC after 106 days after planting, indicating that the
Rooibos plants used water for flowering and vegetative growth (Fig. 5.2). To support this statement,
there was a sharp increase in ET at that stage (Fig. 5.1) with increasing air temperature and enough
rainfall. The average air temperature increased from 91 to 106 days after planting by 3.2°C and the
maximum air temperature was 21.3°C (Table 5.13). The reduced SWC led to the ET reaching a
nearly steady rate until enough rainfall occurred from 161 to 189 days after planting. After 189 days
after planting, the ET reached again a nearly steady rate and this continued until a significant rainfall
occurred to have enough water supply for the evaporative demand.
Stellenbosch University https://scholar.sun.ac.za

60
Days after planting
24 32 40 48 56 64 72 80 88 9610411
212
012
813
614
415
216
016
817
618
419
220
020
821
622
423
224
024
825
626
427
228
028
829
6
Tota
l pro
file
soil
wat
er c
onte
nt (
mm
)
0
19
38
57
76
95
114
133
Tota
l rai
nfal
l dur
ing
perio
d (m
m)
0
5
10
15
20
25
30
35Unfertilised deep
RainfallFertilised deepUnfertilised shallow Fertilised shallow
Days after planting
24 32 40 48 56 64 72 80 88 9610411
212
012
813
614
415
216
016
817
618
419
220
020
821
622
423
224
024
825
626
427
228
028
829
6
Tota
l pro
file
soil
wat
er c
onte
nt (
mm
)
0
5
10
15
20
25
30
35
Tota
l rai
nfal
l dur
ing
perio
d (m
m)
0
5
10
15
20
25
30
35
Unfertilised deep RainfallFertilised deepUnfertilised shallow Fertilised shallow
Figure 5.2: Average cumulative evaporation for the unfertilised and fertilised treatments on shallow and deep soils during the 2016/17 growing season.
Figure 5.1: Average total profile soil water content for the unfertilised and fertilised treatments on shallow and deep soils during the 2016/17 growing season.
Stellenbosch University https://scholar.sun.ac.za

61
Table 5.13: Air temperature (Tair in °C) of the soil water balance of all treatments on shallow and deep soils during the 2016/17 growing season.
Days after planting Average Tair Maximum Tair
18 13.2 20.1
26 16.2 21.5
33 11.6 16.2
39 9.3 14.6
47 13.7 22.1
55 19.7 27.4
61 15.7 23.6
68 12.7 20.3
77 11.6 15.3
83 12.3 18.7
91 11.9 16.6
97 15.1 21.3
106 15.0 21.9
149 22.6 30.1
161 18.3 22.4
168 21.8 29.9
174 21.1 30.1
181 20.8 29.5
189 16.3 22.5
197 27.8 33.9
205 27.6 34.8
219 26.1 32.3
225 19.6 26.4
243 24.4 33.5
251 28.0 34.7
259 17.2 24.3
268 23.3 32.7
278 29.5 37.1
288 19.2 27.5
297 20.3 29.7
Stellenbosch University https://scholar.sun.ac.za

62
A summary of the SWB for the two treatments of the shallow and deep soils of the 2016/17 growing
season is presented in Table 5.14. As expected, the soils were drier at the end of the season than
at the first day of planting. Water usage (WU) of the unfertilised treatment was 85.5 mm (shallow
soils) and 57.6 mm (deep soils) during the active growth of Rooibos. The WU of the fertilised
treatment at both sites was lower by 85.2 and 52.2 mm, respectively. This explains why the
unfertilised treatment on both soils lost more water. The ET of 108.4–121.2 mm for these medium
sandy soils was very low compared to ET values for 403.8–513.2 mm found of the clay loamy soils
at Tygerhoek farm, Riviersonderend, Western Cape (Vorster, 2015). This was expected because
sandy soils have a lower ET rate (Hillel, 2004). Turner (2004) reported that the deep sandy soils in
Mediterranean dryland farming systems in Australia had a lower annual ET of 214 mm compared to
269 mm for clayey soils.
Table 5.14: Summary of the soil water balances (mm) for all both treatments of the shallow soils (0–30 cm) and deep soils (0–80 cm) during the 2016/17 growing season.
Treatment Soil depth SWC–start SWC–end ΔSWC P ET
Unfertilised Shallow
13.8 3.7 -11.1 98.8
115.8
Fertilised 10.3 2.7 -7.6 108.4
Unfertilised Deep
28.5 9.9 -18.6 98.8
121.2
Fertilised 26.9 11.3 -15.6 110.7
Stellenbosch University https://scholar.sun.ac.za

63
5.2.4 Soil water balances of the fallow periods
The SWB in 0–30 cm soil depths of the bare treatment on the shallow soils is presented in Table
5.15. The SWB in 0–80 cm soil depth of the bare treatment on the deep soils is presented in Table
5.16. The fallow periods (also referred to as bare treatments) were started and ended on the same
dates as the unfertilised and fertilised treatments on the shallow and deep soils. The same
measurements were done for the fallow periods with the same total amount of rainfall. The SWB for
the bare treatments on the shallow and deep soils are discussed first, following the discussion of the
SWC and the E. The SWC for each SWB discussion is covered in the first three paragraphs while
the second last paragraph deals the E for the bare treatments on the shallow and deep soils. The
last paragraph deals with the cumulative evaporation. In the discussion, the “days after planting” are
replaced by “days after fallow started”. There was no water table present for the bare treatments in
the shallow and deep soils.
The bare treatment on the shallow soils had a total SWC varying between 2.4 and 12.7 mm (Table
5.15). On the deep soils, the SWC ranged between 9.2–24.9 mm (Table 5.16). The deep soil stored
6.8 mm more water than the shallow soils (p < 0.05) and this is critical for the production of Rooibos
for the following growing season. Similar study was done on dryland wheat and it was shown that
the SWS in the 0–20 cm soil depth (140 mm) was higher compared to 125 mm in the 0–10 cm soil
depth (Zhang, Yao, et al., 2016).
The SWC in the 0–10 cm soil layer was always the lowest at both sites. Soil water content in the
shallow soils was the highest in the 20–30 cm soil layer from the start of fallow until 297 days after
fallow began. Expect 18, 61, 68, 91 and 198 days after fallow started where the water content was
highest in the 10–20 cm soil layer. The SWC in the deep soils in the 10–20 cm soil layer of the soil
profile was the highest from fallow started to 68, and 91 to 161 days after fallow began. In the 60
and 80 cm soil layer, the SWC was low and changed minimally over time from started to the end of
the fallow period. Because there were no Rooibos roots in the bare soils, the SWC in the 10–20 cm
soil layer was lower compared to the unfertilised treatment at both sites.
At the shallow site, during the first significant rainfall event, the SWC increased by 3.2 mm (Table
5.15). The SWC during the second and third significant rainfall did not increase but decreased by
0.4 mm and 2.5 mm, respectively. The SWC did not increase down the soil profile at 47 and 106
days after fallow began. This indicated the high E rate in the shallow soils. The soil water depletion
started after 97 days after fallow began. After the first significant rainfall event in July 2016, the SWC
increased by 3.4 mm at the deep site. After the second significant rainfall event in August 2016, the
SWC increased by 0.5 mm. After the third significant rainfall in September, the SWC increased by
4.2 mm. Due to the rain event of 19.2 mm between 39 and 47 days after fallow began, the SWC of
all the layers showed an increase down to 80 cm layer. These results were similar to the response
of the SWC to rainfall events of the unfertilised and fertilised treatment at both sites.
Stellenbosch University https://scholar.sun.ac.za

64
Table 5.15: Temperature corrected soil water content of each soil depth (mm/100 mm) and components of the soil water balance of the bare treatment in the 0–30 cm soil depth during the 2016/17 growing season.
Days after fallow started
18 26 33 39 47 55 61 68 77 83 91 97 106 149 161 168 174 181 189 197 205 219 225 243 251 259 268 278 288 297
Date 04
/07/
2016
12/0
7/20
16
19/0
7/20
16
25/0
7/20
16
02/0
8/20
16
10/0
8/20
16
16/0
8/20
16
23/0
8/20
16
01/0
9/20
16
07/0
9/20
16
15/0
9/20
16
21/0
9/20
16
30/0
9/20
16
11/1
1/20
16
23/1
1/20
16
30/1
1/20
16
07/1
2/20
16
15/1
2/20
16
23/1
2/20
16
31/1
2/20
16
08/0
1/20
17
22/0
1/20
17
28/0
1/20
17
15/0
2/20
17
23/0
2/20
17
03/0
3/20
17
12/0
3/20
17
22/0
3/20
17
01/0
4/20
17
11/0
4/20
17
Soil depth
0–10 cm 2.0 1.5 1.4 2.4 2.2 1.9 2.2 3.4 2.4 1.2 1.6 2.3 1.6 1.5 1.0 0.7 0.7 0.7 1.6 0.6 0.6 0.7 0.6 0.6 0.5 0.5 0.7 0.5 0.5 0.4
10–20 cm 4.1 3.3 3.1 4.3 4.2 3.8 4.0 5.0 2.7 2.7 3.4 4.3 3.2 3.4 2.6 2.0 1.9 1.5 2.5 1.3 1.2 1.7 1.4 1.0 0.9 0.8 1.0 0.9 1.1 0.9
20–30 cm 4.0 3.5 3.4 4.3 4.4 3.8 3.8 4.3 2.8 2.8 3.3 4.5 3.8 3.5 2.8 2.6 2.3 2.1 2.3 1.7 1.6 2.2 1.9 1.3 1.0 1.0 1.2 1.2 1.3 1.1
Total SWC(1) 10.1 8.4 7.9 11.1 10.7 9.6 10.0 12.7 7.9 6.8 8.4 11.0 8.5 8.4 6.4 5.3 4.9 4.3 6.3 3.6 3.3 4.6 3.9 2.9 2.4 2.4 2.8 2.6 3.0 2.4
ΔS(2) 1.8 0.4 -3.2 0.4 1.1 -0.5 -2.6 4.8 1.1 -1.6 -2.6 2.5 0.1 2.0 1.1 0.4 0.6 -2.0 2.6 0.3 -1.3 0.7 1.1 0.5 0.0 -0.4 0.2 -0.4 0.6
P(3) 0.0 5.1 0.3 10.5 19.2 7.5 3.6 5.7 3.0 2.4 3.1 6.0 12.3 0.0 3.0 0.0 0.0 5.4 7.8 0.3 0.9 0.0 0.0 0.3 0.0 0.0 0.0 0.0 0.0 2.4
ΣP(4) 5.1 5.4 15.9 35.1 42.6 46.2 51.9 54.9 57.3 60.4 66.4 78.7 78.7 81.7 81.7 81.7 87.1 94.9 95.2 96.1 96.1 96.1 96.4 96.4 96.4 96.4 96.4 96.4 98.8
E(5) 6.9 0.7 7.3 19.6 8.6 3.1 3.1 7.8 3.5 1.5 3.4 14.8 0.1 5.0 1.1 0.4 6.0 5.8 2.9 1.2 -1.3 0.7 1.4 0.5 0.0 -0.4 0.2 -0.4 3.0
Average E/day(6) 0.9 0.1 1.2 2.4 1.1 0.5 0.4 0.9 0.6 0.2 0.6 1.6 0.0 0.4 0.2 0.1 0.9 0.7 0.4 0.1 -0.1 0.1 0.1 0.1 0.0 0.0 0.0 0.0 0.3
ΣE(7) 6.9 7.6 14.9 34.5 43.1 46.3 49.4 57.2 60.7 62.1 65.5 80.3 80.4 85.4 86.6 87.0 93.0 98.8 101.7 102.9 102.9(8) 103.6 104.9 105.5105.4105.4 (8)105.7105.7(8)108.6
(1) Total SWC Total soil water content (mm) (2) ΔS Change in soil water content (mm) (3) P Rainfall occurring between readings (mm) (4) E Evaporation (mm) (5) Average E/day Evaporation in (mm/day) (6) P Cumulative rainfall (mm) (7) E Cumulative evaporation (mm)
(8) These readings were taken during the midday and was corrected by the temperature sensitivity correction function.
Stellenbosch University https://scholar.sun.ac.za

65
Table 5.16: Temperature corrected soil water content of each soil depth (mm/100 mm) and components of the soil water balance of the bare treatment in the 0–80 cm soil depth during the 2016/17 growing season.
Days after fallow started
18 26 33 39 47 55 61 68 77 83 91 97 106 149 161 168 174 181 189 197 205 219 225 243 251 259 268 278 288 297
Date 04
/07/
2016
12/0
7/20
16
19/0
7/20
16
25/0
7/20
16
02/0
8/20
16
10/0
8/20
16
16/0
8/20
16
23/0
8/20
16
01/0
9/20
16
07/0
9/20
16
15/0
9/20
16
21/0
9/20
16
30/0
9/20
16
11/1
1/20
16
23/1
1/20
16
30/1
1/20
16
07/1
2/20
16
15/1
2/20
16
23/1
2/20
16
31/1
2/20
16
08/0
1/20
17
22/0
1/20
17
28/0
1/20
17
15/0
2/20
17
23/0
2/20
17
03/0
3/20
17
12/0
3/20
17
22/0
3/20
17
01/0
4/20
17
11/0
4/20
17
Soil depth
0–10 cm 2.6 1.4 1.4 2.8 2.4 1.9 2.7 3.9 2.3 0.9 1.2 2.0 3.7 1.4 1.1 0.5 0.6 0.7 1.6 0.6 0.8 0.9 0.9 0.6 0.7 0.8 1.0 0.7 0.9 0.5
10–20 cm 4.4 3.5 3.7 4.4 3.8 3.7 3.8 3.7 2.7 2.1 2.7 3.1 4.8 3.2 2.5 2.0 1.7 1.6 2.1 1.3 1.3 1.8 1.5 1.1 1.0 1.0 1.2 1.1 1.2 1.0
20–30 cm 3.2 2.8 2.8 3.2 3.1 2.9 2.8 2.7 2.2 2.1 2.1 2.8 4.2 2.4 1.9 1.9 1.8 1.6 1.6 1.2 1.3 1.6 1.4 1.1 0.9 0.9 1.0 0.9 1.0 1.0
30–40 cm 2.7 2.4 2.3 2.6 2.8 2.5 2.3 2.2 2.0 2.0 1.9 2.2 3.3 2.0 1.7 1.8 1.6 1.5 1.4 1.1 1.2 1.2 1.2 1.1 1.0 0.9 1.0 0.9 1.0 0.9
40–50 cm 3.2 2.8 2.8 3.0 3.4 3.1 2.8 2.7 2.5 2.4 2.4 2.6 2.6 2.4 2.2 2.0 2.1 2.0 1.9 1.6 1.6 1.6 1.6 1.5 1.4 1.4 1.4 1.4 1.5 1.2
50–60 cm 3.0 2.7 2.7 2.9 3.3 3.0 2.8 2.7 2.7 2.5 2.4 2.3 2.1 2.5 2.4 2.1 2.2 2.1 2.0 1.8 1.8 1.8 1.7 1.6 1.5 1.4 1.4 1.4 1.4 1.3
60–70 cm 2.5 2.4 2.4 2.5 2.8 2.7 2.5 2.5 2.6 2.2 2.2 2.1 1.5 2.3 2.2 2.0 2.1 2.0 1.9 1.9 1.9 1.9 1.8 1.7 1.6 1.5 1.5 1.5 1.5 1.4
70–80 cm 3.1 2.8 2.8 3.0 3.3 3.1 2.9 2.9 3.1 2.6 2.6 2.5 1.5 2.4 2.3 2.4 2.5 2.5 2.3 2.1 2.3 2.0 2.0 2.1 2.0 1.9 1.9 1.8 1.8 1.7
Total SWC(1) 24.7 20.8 20.9 24.4 24.9 22.9 22.6 23.3 20.2 16.9 17.7 19.6 23.8 18.6 16.4 14.8 14.5 14.0 14.8 11.6 12.1 12.9 12.1 10.7 10.2 9.9 10.3 9.7 10.3 9.2
ΔS(2) 3.9 -0.1 -3.4 -0.5 1.9 0.3 -0.6 3.0 3.4 -0.8 -1.9 -4.2 5.2 2.3 1.6 0.2 0.6 -0.8 3.2 -0.5 -0.8 0.8 1.4 0.6 0.3 -0.4 0.6 -0.6 1.1
P(3) 0.0 5.1 0.3 10.5 19.2 7.5 3.6 5.7 3.0 2.4 3.1 6.0 12.3 0.0 3.0 0.0 0.0 5.4 7.8 0.3 0.9 0.0 0.0 0.3 0.0 0.0 0.0 0.0 0.0 2.4
ΣP(4) 5.1 5.4 15.9 35.1 42.6 46.2 51.9 54.9 57.3 60.4 66.4 78.7 78.7 81.7 81.7 81.7 87.1 94.9 95.2 96.1 96.1 96.1 96.4 96.4 96.4 96.4 96.4 96.4 98.8
E(5) 9.0 0.2 7.1 18.7 9.4 3.9 5.1 6.0 5.8 2.3 4.1 8.1 5.2 5.3 1.6 0.2 6.0 7.0 3.5 0.4 -0.8 0.8 1.7 0.6 0.3 -0.4 0.6 -0.6 3.5
Average E/day(6) 1.1 0.0 1.2 2.3 1.2 0.7 0.7 0.7 1.0 0.3 0.7 0.9 0.1 0.4 0.2 0.0 0.9 0.9 0.4 0.1 -0.1 0.1 0.1 0.1 0.0 0.0 0.1 -0.1 0.4
ΣE(7) 9.0 9.2 16.3 35.0 44.4 48.3 53.4 59.4 65.2 67.4 71.5 79.6 84.8 90.1 91.7 91.9 97.9 104.9 108.3 108.8 108.8(8) 109.5 111.2 111.7 112.1 112.1(8)112.7 112.7(8) 116.1
(1) Total SWC Total soil water content (mm) (2) ΔS Change in soil water content (mm) (3) P Rainfall occurring between readings (mm) (4) E Evaporation (mm) (5) Average E/day Evaporation in (mm/day) (6) P Cumulative rainfall (mm) (7) E Cumulative evaporation (mm)
(8) These readings were taken during the midday and was corrected by the temperature sensitivity correction function.
Stellenbosch University https://scholar.sun.ac.za

66
The E of the shallow soils from when fallow began to 297 days after fallow varied between 0–19.6
mm. The highest E was during 47 days after fallow began 19.6 mm and this was most likely due to
the second significant rainfall. The second highest evaporation of 14.8 mm was during 106 days
after planting. Maximum average E rate of the shallow soils was 2.4 mm.day-1. The E of the deep
soils during the fallow period varied between 0.2 and 18.7 mm. The highest E of 16 mm was at 47
days after planting due to the second significant rainfall. The second highest E of 11.6 mm was at
55 days after fallow began. Maximum average E rate of the deep soils was 2.3 mm.day-1. There was
a significant difference between the E of the shallow and deep soils.
Soil water content in both soils was high at the start of fallow and progressively decreased over time
(Tables 5.15 & 5.16). Due to the higher SWC in the deep soils, the E of the deep soils was higher
than in the shallow soils (Fig. 5.3). This observation was similar to the ET between the shallow and
deep soils. The soil-drying stages were recognizable in Figure 5.3, where the evident of stage I of
the E increased rapidly due to rainfall from the first days to 112 after fallow began. In the second
stage from 112 to 152 days after fallow began, the E of the shallow soils started to reach a constant
rate, whereas the E of deep soils still slowly increased due to SWC in the deeper soil layers.
Between 152 and 192 days after fallow began for stage III, the E increased again but not as high
as stage I due to lesser rainfall. Due to higher E rate after rain, the soil dried quickly and did not hold
water for long as the case of in clayey soils. The E rate dropped quickly and reached stage IV very
quickly. Stage IV persisted for a very long period until a significant rainfall event occurred, almost at
the end of the fallow period.
Days after planting
24 32 40 48 56 64 72 80 88 9610411
212
012
813
614
415
216
016
817
618
419
220
020
821
622
423
224
024
825
626
427
228
028
829
6
Ave
rgae
cum
ulat
ive
evpo
ratio
n (m
m)
0
15
30
45
60
75
90
105
120
135
Rai
nfal
l dur
ing
perio
d (m
m)
0
5
10
15
20
25Bare deepBare shallow Rainfall
Figure 5.3: Average cumulative evaporation for the bare treatments on the shallow and deep soils during the 2016/17 growing season.
Stage I Stage II Stage III Stage IV
Stellenbosch University https://scholar.sun.ac.za

67
A summary of the SWB for the two bare treatments of the shallow and deep soils of the 2016/17
fallow period is presented in Table 5.17. Although the E rate of the shallow and deep soils was almost
the same, the deep soils lost 17.3 mm more water than the shallow soils (p < 0.05) with higher E.
This is closely linked to the higher SWC in the deep soils. It should be noted that the E of the bare
treatment was almost the same as the fertilised treatment at the shallow and deep sites. This
confirms the low surface cover on the fertilised soils. The FE values correlated well with the threshold
value range between 2 and 37% in semi-arid areas in South Africa (Bennie et al., 1994). Deeper
soils had higher FE than the shallow soils due to higher SWS in the deeper soils. Similar results
were reported by Zhang et al. (2016a) where higher SWS resulted in higher FE of a dryland soil
during a fallow period on the Loess Plateau of China. In 2002, the SWS and FE was 39 mm and
18.9% and in 2003, SWS was higher by 45 mm which resulted in higher FE by 39.8%.
Table 5.17: Summary of soil water balances (mm) and the fallow efficiency (FE in %) of the bare treatments at shallow and deep sites during 2016/17. The difference between cumulative evaporation and rainfall indicated the water losses.
Soil
depth
SWC–start SWC–end ΔSWC P E E – P FE
Shallow 10.1 2.4 -7.7 98.8 108.6 9.8 7.79
Deep 24.7 9.2 -13.5 98.8 116.1 17.3 15.69
Stellenbosch University https://scholar.sun.ac.za

68
5.3 Soil water content determined by the ECH2O soil moisture sensor
The daily average soil temperature and daily average volumetric water content (VWC) were
measured for unfertilised and fertilised treatment from 1 November 2016 to 24 September 2017 for
the deep soils. For the bare treatment, the VWC measurement started on 5 July 2017 and ended 24
September 2017. The VWC measurement of the unfertilised and fertilised treatments started on 1
November 2016 because the cables were not connected correctly. Daily average VWC of unfertilised
and fertilised treatment was only measured to the 45 cm soil depth since the ECH2O sensors in the
65 cm soil depth recorded error measurements (the cables broke). The total rainfall is the same as
given previously for the growing season 2016/17 (Refer to Section 5.2.2). Thereafter, the total rainfall
for May, June, July, August and September 2017 is as follows: 3.5, 18.4, 18.7, 25.2, 0 mm,
respectively.
5.3.1 Calibration of the ECH2O sensors
5.3.1.1 Soil-specific calibration
The four different ECH2O sensors were calibrated using the raw counts against the VWC which were
determined in the laboratory of the medium sandy soil. The linear regression equation of the four
different ECH2O sensors is presented in Table 5.18. The linear regression equation of the EC-20
sensor was similar to the laboratory calibration of EC-20 conducted by Fares et al. (2011) generated
a linear regression equation of VWCcal = 0.0005 × raw counts – 0.2858, R2 = 0.97 and RMSE = 0.04
m3.m-3. The calibration of the EC-TM was better compared to RMSE = 0.06 reported by Dente et al.
(2009). The 5TM calibration values were the same as R2 = 0.96 and RMSE = 0.01 reported by
Benninga et al. (2017). The GS1 is produced by Decagon Devices, Inc (Kodešová et al., 2011) and
determined the VWC by measuring the dielectric constant like the other four ECH2O sensors
(Decagon Devices, 2015). It can be concluded that the R2 and RMSE of GS1 will be similar to the
other ECH2O sensors.
Stellenbosch University https://scholar.sun.ac.za

69
Table 5.18: Linear regression equations, coefficients of determinations (R2) and root mean square error (RMSE in m3.m-3) in the medium sandy soil for the different ECH2O sensors.
Type of ECH2O soil
moisture sensor
Linear regression
equations
R2 RMSE
5TM VWC = 0.001 × raw
counts – 1.0212 0.95 0.015
EC-20 VWC = 0.0006 × raw
counts – 0.2878 0.99 0.031
EC-TM VWC = 0.0007 × raw
counts – 0.7498 0.98 0.027
GS1 VWC = 0.0005 × raw
counts – 0.7530 0.99 0.011
5.3.1.2 Temperature sensitivity calibration
The SWC in the 5 and 15 cm soil layer’s linear response to temperature increases are presented in
Table 5.19. The temperature sensitivity correction models determined for the 0-5 cm soil layer for
the three treatments are presented in Table 5.20. These models were determined according to
Cobos and Campbell (2007). The soil temperature of the three selected 24 hour periods of all
treatments were on 11 January 2017, 13 June 2017 and 1 September 2017 (Figs. 5.4 to 5.6).
Soil water content in the 5 cm soil layer showed a positive linear response (R2 = 0.78–0.98) with
increased soil temperature (Table 5.19). In the 15 cm soil layer, the positive linear response was not
significant (R2 = 0.11–0.67). Fares et al. (2016) reported a positive linear response by increasing the
soil temperature in a relative dry soil of 0.02–0.11 m3.m-3. In Figures 5.4 to 5.6, the first 24 hour
period, as expected the 5 cm soil layer heated up faster with a maximum of 35.03°C at 16:00 and
cooled down faster with a minimum of 24.12°C at 07:00. In the 15 cm soil layer, the soil heated up
with a maximum of 30.83°C at 18:00 and cooled down three hours later with a minimum of 27.12°C
at 10:00 than the 5 cm soil layer. The difference between the maximum and minimum (diurnal
variation) for the three 24 hour periods in the 5 cm soil layer was 7.6–10.92°C greater than in the 15
cm soil layer, where the fluctuation ranged from of 3.71–5.95°C. The temperature fluctuations in the
15 cm soil layer of all three treatments (Figs. 5.4 to 5.6) were not significant (p = 0.65) compared to
the 5 cm soil layer (p < 0.05). Parton and Logan (1981) reported similar observations where the
temperature fluctuations of less than 2°C which were not significant in the 15 cm soil layer.
After inspection of the temperature fluctuations, the temperature sensitivity correction was only
applied for the 5 cm soil layer (Table 5.20). The R2 of all treatments ranged between 0.85–0.88.
These R2 of the temperature sensitivity corrections models correlated well with R2 = 0.80–0.86
reported by Fares et al. (2016).
Stellenbosch University https://scholar.sun.ac.za

70
Table 5.19: Soil water content linear response to temperature and coefficient of determinations (R2) of all treatments at the deep site.
Treatment Date Soil depth
(cm)
R2
Unfertilised
11 January 2017 5 0.98
15 0.67
13 June 2017 5 0.82
15 0.27
1 September 2017 5 0.78
15 0.21
Fertilised
11 January 2017 5 0.85
15 0.11
13 June 2017 5 0.93
15 0.17
1 September 2017 5 0.90
15 0.15
Bare
11 January 2017 5 0.81
15 0.29
13 June 2017 5 0.90
15 0.09
1 September 2017 5 0.91
15 0.43
Table 5.20: Temperature sensitivity correction models and coefficients of determinations (R2) of all treatments at the deep site.
Treatment Correction models R2
Unfertilised 1VWCcor = -4.81E-5 × VWCmeas – 0.0016 × Tsoil + 0.094 0.88
Fertilised VWCcor = -1.14E-4 × VWCmeas – 0.0011 × Tsoil + 0.065 0.85
Bare VWCcor = -7.11E-4 × VWCmeas – 0.0014 × Tsoil + 0.073 0.80
Stellenbosch University https://scholar.sun.ac.za

71
Time on 11 January 2017
2 4 6 8 10 12 14 16 18 20 22 24
Aver
age
soil
tem
pera
ture
(°C
)
6
9
12
15
18
21
24
27
30
33
36
Time on 13 June 2017
2 4 6 8 10 12 14 16 18 20 22 24
Time on 1 September 2017
2 4 6 8 10 12 14 16 18 20 22 24
5 cm 15 cm 25 cm
Time on 11 January 2017
2 4 6 8 10 12 14 16 18 20 22 24
Ave
rage
soi
l tem
pera
ture
(°C
)
6
9
12
15
18
21
24
27
30
33
36
Time on 13 June 2017
2 4 6 8 10 12 14 16 18 20 22 24
Time on 1 September 2017
2 4 6 8 10 12 14 16 18 20 22 24
5 cm 15 cm
Figure 5.5: Hourly average soil temperature of the unfertilised treatment at 5, 15 and 25 cm soil layers on 11 January 2017, 13 June 2017 and 1 September 2017 at the deep site. No rain occurred during these three 24-hour periods.
Figure 5.4: Hourly average soil temperature of the fertilised treatment at 5 and 15 cm soil layers on 11 January 2017, 13 June 2017 and 1 September 2017 at the deep site. No rain occurred during these three 24-hour periods.
Stellenbosch University https://scholar.sun.ac.za

72
Figure 5.6: Hourly average soil temperature of the bare treatment at 5, 15, 25 and 45 cm soil layers on 11 January 2017, 13 June 2017 and 1 September 2017 at the deep site. No rain occurred during these three 24-hour periods.
Time on 11 January 2017
2 4 6 8 10 12 14 16 18 20 22 24
Ave
rage
soi
l tem
pera
ture
(°C
)
6
9
12
15
18
21
24
27
30
33
36
5 cm
15 cm
25 cm
45 cm
Time on 13 June 2017
2 4 6 8 10 12 14 16 18 20 22 24
Time on 1 September 2017
2 4 6 8 10 12 14 16 18 20 22 24
Stellenbosch University https://scholar.sun.ac.za

73
5.3.2 Soil water content of the unfertilised and fertilised treatment
Figures 5.7 and 5.8 show the daily average soil temperature with daily average air temperature, daily
average VWC and the total rainfall per day with light intensity. The total rainfall (Figs. 5.7C & 5.8C)
was very low compared to the rainfall of above 300 mm at Tygerhoek farm, Riviersonderend,
Western Cape reported by Vorster (2015), though the rainfall was similar to the rainfall lower than
100 mm reported for the arid rangelands in the Riemvasmaak Rural Area, Northern Cape, South
Africa (Palmer & Yunusa, 2011). The most significant rainfall event occurred on 4 June 2017 of 15.8
mm, 9 July 2017 of 10 mm and on 22 August 2017 of 12.3 mm. The maximum daily value of the light
intensity was 718.25 W.m-2. The light intensity was high in November 2016 and decreased
progressively to the end of July 2017. After July 2017, the light intensity started to increase slowly
up to September 2017. The low light intensity on non-rainy day indicated it was a cloudy day.
Average daily air temperature varied from 29.00°C in November 2016 to 21.63°C in September 2017,
but the maximum daily air temperature was high of 47.49°C in the summer and the minimum was
6.44°C in winter. Similar average air temperature in the summer and winter were obtained in the
Riemvasmaak Rural Area, Northern Cape, South Africa (Palmer & Yunusa, 2011). Daily soil
temperature ranged between 7.22° and 30.01°C for unfertilised treatment and 7.11° and 31.47°C for
the fertilised treatment in the 5 cm soil layer (Figs. 5.7A & 5.8A). At the 15 cm soil layer below the
soil surface, the daily soil temperature ranged between 8.24° and 29.53°C for the unfertilised
treatment and 8.64°, and 30.40°C for the fertilised treatment. In the 25 cm soil layer of the unfertilised
treatment, the soil temperature ranged between 13.15° and 30.03°C. The daily average soil
temperature was highest started in the summer and progressively decreased in the winter. After a
rainfall event, the soil temperature increased, consequently the soil evaporation rate increased.
Temperature fluctuations are significant in the 5 cm soil layer of the two treatments as it was
discussed previously in Section 5.2.1. The average soil temperature of the fertilised treatment in the
5 cm and 15 cm soil layers were warmer than the unfertilised treatment. Similar results were obtained
for the unfertilised and fertilised treatment of the soil temperature at the deep site, as discussed in
Section 5.2.3.
Due to the medium sandy soils of the site, the VWC at 5 cm soil layer fluctuates greatly compared
to the deeper soil depths, as it drained and dried out easily (Figs. 5.7B & 5.8B). Immediately following
a significant rainfall event, when the VWC was enough, the ET rate increased in the 5 to 45 cm soil
layers. This caused a decrease in VWC until the ET rate is limited by reduced VWC. After heavier
rainfall on 23 December 2016, 4 June 2017, and 22 August 2017, the 25 cm soil layer had a higher
average VWC than the 5 and 15 cm soil layer, indicating rapid drainage and saturation of the subsoil.
These observations were significant for the fertilised treatment. Furthermore, the redistribution of
water was very slow, but slower in the unfertilised soils. This implies that the ET of the plants reduced
the redistribution. Similar results were obtained by Tromp-van Meerveld and McDonnell (2006). In
the 45 cm soil layer of unfertilised and fertilised treatment, the VWC only increased after the heavier
Stellenbosch University https://scholar.sun.ac.za

74
rainfall on 4 June 2017. After the heavier rain on 22 August 2017, the VWC started decreasing in all
four soil layers due to warmer temperature. Average VWC in all soil layers of the unfertilised
treatment was higher compared to unfertilised treatment due higher surface cover as explained in
Section 5.2.3.
5.3.3 Soil water content of the bare treatment
Figures 5.9A and B shows the daily average soil temperature with daily average air temperature,
daily average VWC (Fig. 5.9C) and total rainfall per day with light intensity (Fig. 5.9D). The most
rainfall occurred on 28 July 2016 (9.9 mm), 3 August 2016 (7.2 mm), 26 August 2016 (10.8 mm), 4
June 2017 (15.8 mm), 9 July 2017 (10 mm) and 22 August 2017 (12.3 mm). The winter in this study
was July to August because the measurements of the VWC only started on July 2016. In the first
winter (5 July–30 August 2016), the rainfall was more consecutive (54.9 mm) than in the second
winter (July–August 2017) of 43.9 mm. The total rainfall in spring (September–November 2016) was
30.6 mm and 14.7 mm in the summer (December–February 2016). It should be noted that the rainfall
in September 2016 was 24.6 mm and that no rain occurred in September 2017. These values are
significantly (p < 0.05) less than the rainfall values for winter and summer of 318 mm (July–August
2012), 95 mm (September to November 2012) and 33.5 mm (December to February 2012) reported
by Lötter (2015) for studies on Rooibos in Skimmelberg which is between Clanwilliam and Citrusdal.
The maximum daily values of the light intensity were the same at the peak of summer for the
unfertilised and fertilised treatment of 718.25 W.m-2. The light intensity in the second winter was
lower (min. 108.36 W.m-2) compared to the first winter (min. 110.48 W.m-2), but was not significant
(p = 0.17). During September, the light intensity was lower (p = 0.024) in 2017 (104.07 W.m-2)
compared to that in 2016 (177.01 W.m-2) which indicating more cloudy days in September 2017.
Maximum daily average air temperature was the same as for the unfertilised and fertilised treatment.
In the first winter, the daily average air temperature was warmer (max. 24.14°C) compared to the
second winter (max. 22.12°C). In contrast, for September, the average air temperature was warmer
(p= 0.011) in 2017 (21.63°C) compared to 2016 (20.74°C). Soil temperature ranged between 7.05°
and 30.78°C in the 5 cm soil layer. While the soil temperature of the 15 cm soil layer ranged between
8.38° and 29.89°C. In the 25 cm soil layer, the soil temperature ranged between 8.62° and 29.16°C
and in the 45 cm soil layer, it ranged between 10.47° and 28.17°C. The soil temperatures of the bare
soils were similar to the values of the soil temperature in the fertilised soils, as it was expected.
Daily average VWC ranged between 0.023 and 0.171 m3.m-3. On 5 July 2016 for the 5, 15, 25, 45
and 65 cm soil depths, the VWC was 0.091, 0.08, 0.094, 0.110 and 0.119 m3.m-3, respectively. On
5 July 2017, the VWC was 0.056, 0.077, 0.066, 0.092 and 0.12 m3.m-3 for 5, 15, 25, 45 and 65 cm
soil depths, respectively and the VWC was lower compared to July 2016. This indicated that the
rainfall was lower. The daily average VWC was 0.0332, 0.059, 0.036, 0.08 and 0.09 m3.m-3 for 5, 15,
Stellenbosch University https://scholar.sun.ac.za

75
25, 45 and 65 cm soil depths, respectively, on September 2016. The VWC started decreasing in
October 2016, however in 2017, the VWC already started decreasing after August. According to
Lötter (2015), the SWC started decreasing in October 2012, which in this case is the same for year
2016 but not for year 2017. This implies a lower rainfall in 2017 and lower SWC as the soil gets drier.
It should be noted that the daily average VWC increased after a rainfall event as it previously
explained in section 5.2.3. The 5 cm soil layer got wetter first and after the rain, very slow
redistribution of water occurred in the deeper layers due low water content (Hillel, 2004). An increase
in VWC in the 5 cm soil layer caused an increase in the evaporation rate (Refer to Section 5.3.4). As
the soil dried out, the atmospheric demand-controlled shifted to soil-limited evaporation (Heitman et
al., 2008). Two or three days after a rainfall event, the VWC decreased in the 5 cm soil layer.
Thereafter, evaporation occurred deeper in the soil and the evaporation rate started increased,
resulting in decreased VWC in the 15, 25, 45 and 65 cm soil layers. Similar detailed experimental
observations were reported by Heitman et al. (2008). Only on heavier rainfall days (>10 mm), the
VWC of the 25 cm soil layer was higher than the 5 cm soil layer.
Figure 5.10 shows the hourly average soil temperature of the bare treatment of the deep soil
recorded on 19 and 20 August 2016, and 21 and 22 August 2017. The detailed analysis of the
temperature data showed that on 19 August 2016, the air temperature at sunrise and the minimum
soil temperature differed minimally (~1.5°C). On the rainy day (20 August 2016), the difference
between the air temperature at sunrise and the minimum soil temperature was 4°C. Minimum
temperature in the soil occurred 1 hour later than in the air on 19 August 2019. On 20 August 2016,
minimum air and soil temperature occurred at approximately the same time. The maximum air
temperature on19 August 2016 occurred two hours before the maximum soil temperature but on the
rainy day, it occurred two hours later. Also, the air temperature was higher from midnight to 14:00
than the soil temperature on 19 August 2019. However, on 20 August 2016, the air temperature was
higher from 8:15 to midnight. Similar observations of hourly air and soil temperature were reported
by Parton and Logan (1981). The lower air temperature on 21 and 22 August 2017 can be explained
by lower light intensity and heavier rainfall. The shape of the curves reflected the indirect effect of
rainfall on soil temperature (Fig. 5.10). For example, in the 5 cm soil layer on 19 August 2016, the
minimum temperature was 10.92°C at 09:00, whereas the maximum temperature was 21.17°C at
17:00. For the same soil layer, however, the minimum and maximum temperature for 20 August
2016 showed little change and was 9.07°C and 15.18°C, respectively. It can be seen that the soil
temperature fluctuations in the 5 cm soil were not significant. Similar observation between the dry
and wet day of 21 and 22 August 2017 was made. During a rainy day, a large portion of solar
radiation evaporates the water and heats the air rather on the soil surface (Manrique, 1988). Thus,
the soil temperature in the 5 cm soil layer is not greatly increased and, consequently, the soil
temperature fluctuations were reduced. Cloudy days had the same effect in the 5 cm layer (data not
shown). The 15, 25 and 45 cm soil layer were not affected by rainy days due to slow energy transfer
Stellenbosch University https://scholar.sun.ac.za

76
Day of months
01/11/20
16
08/11/20
16
15/11/20
16
22/11/20
16
29/11/20
16
06/12/20
16
13/12/20
16
20/12/20
16
27/12/20
16
03/01/20
17
10/01/20
17
17/01/20
17
24/01/20
17
31/01/20
17
07/02/20
17
14/02/20
17
21/02/20
17
28/02/20
17
07/03/20
17
14/03/20
17
21/03/20
17
28/03/20
17
04/04/20
17
11/04/20
17
18/04/20
17
25/04/20
17
02/05/20
17
09/05/20
17
16/05/20
17
23/05/20
17
30/05/20
17
06/06/20
17
13/06/20
17
20/06/20
17
27/06/20
17
04/07/20
17
11/07/20
17
18/07/20
17
25/07/20
17
01/08/20
17
08/08/20
17
15/08/20
17
22/08/20
17
29/08/20
17
05/09/20
17
12/09/20
17
19/09/20
17
Aver
age
soi
l tem
pera
ture
(°C
)
10
20
30
40
50
Ave
rage
air te
mpe
ratu
re (°C
)
10
20
30
40
50
Day of months
01/11/20
16
08/11/20
16
15/11/20
16
22/11/20
16
29/11/20
16
06/12/20
16
13/12/20
16
20/12/20
16
27/12/20
16
03/01/20
17
10/01/20
17
17/01/20
17
24/01/20
17
31/01/20
17
07/02/20
17
14/02/20
17
21/02/20
17
28/02/20
17
07/03/20
17
14/03/20
17
21/03/20
17
28/03/20
17
04/04/20
17
11/04/20
17
18/04/20
17
25/04/20
17
02/05/20
17
09/05/20
17
16/05/20
17
23/05/20
17
30/05/20
17
06/06/20
17
13/06/20
17
20/06/20
17
27/06/20
17
04/07/20
17
11/07/20
17
18/07/20
17
25/07/20
17
01/08/20
17
08/08/20
17
15/08/20
17
22/08/20
17
29/08/20
17
05/09/20
17
12/09/20
17
19/09/20
17
Tota
l rain
fall per
day
(m
m)
0
2
4
6
8
10
12
14
16
18
Ligh
t in
tens
ity (W
/m2 )
0
100
200
300
400
500
600
700
800Avera
ge
volu
met
ric w
ate
r co
nte
nt (m
3 /m3 )
0.02
0.04
0.06
0.08
0.10
0.12
0.14
0.165 cm 15 cm 25 cm 45 cm
15 cm 25 cm Air temperature5 cm
A
B
C
Rainfall Light intensity
Figure 5.7: Daily average soil temperature at 5, 15 and 25 cm soil layers with daily air temperature (A), daily average soil water content at 5, 15, 25 and 45 cm soil layers (B) and total rainfall per day with light intensity (C) for the unfertilised treatment at the deep site from 1 November 2016 to 2017.
A
B
C
Stellenbosch University https://scholar.sun.ac.za

77
Day of months
01/11/20
16
08/11/20
16
15/11/20
16
22/11/20
16
29/11/20
16
06/12/20
16
13/12/20
16
20/12/20
16
27/12/20
16
03/01/20
17
10/01/20
17
17/01/20
17
24/01/20
17
31/01/20
17
07/02/20
17
14/02/20
17
21/02/20
17
28/02/20
17
07/03/20
17
14/03/20
17
21/03/20
17
28/03/20
17
04/04/20
17
11/04/20
17
18/04/20
17
25/04/20
17
02/05/20
17
09/05/20
17
16/05/20
17
23/05/20
17
30/05/20
17
06/06/20
17
13/06/20
17
20/06/20
17
27/06/20
17
04/07/20
17
11/07/20
17
18/07/20
17
25/07/20
17
01/08/20
17
08/08/20
17
15/08/20
17
22/08/20
17
29/08/20
17
05/09/20
17
12/09/20
17
19/09/20
17
Ave
rage s
oil te
mper
atu
re (°C
)
10
20
30
40
50
Avera
ge a
ir tem
pera
ture
(°C
)
10
20
30
40
50
Day of months
01/11/2016
08/11/2016
15/11/2016
22/11/2016
29/11/2016
06/12/2016
13/12/2016
20/12/2016
27/12/2016
03/01/2017
10/01/2017
17/01/2017
24/01/2017
31/01/2017
07/02/2017
14/02/2017
21/02/2017
28/02/2017
07/03/2017
14/03/2017
21/03/2017
28/03/2017
04/04/2017
11/04/2017
18/04/2017
25/04/2017
02/05/2017
09/05/2017
16/05/2017
23/05/2017
30/05/2017
06/06/2017
13/06/2017
20/06/2017
27/06/2017
04/07/2017
11/07/2017
18/07/2017
25/07/2017
01/08/2017
08/08/2017
15/08/2017
22/08/2017
29/08/2017
05/09/2017
12/09/2017
19/09/2017
Tot
al r
ain
fall pe
r day
(m
m)
0
2
4
6
8
10
12
14
16
18
Lig
ht in
tensi
ty (W
/m2)
0
100
200
300
400
500
600
700
800Ave
rage v
olu
metric
wate
r co
nte
nt (m
3/m
3)
0.02
0.04
0.06
0.08
0.10
0.12
0.14
0.16A
B
C
15 cm Air temperature5 cm
5 cm 15 cm 25 cm 45 cm
Rainfall Light intensity
Figure 5.8: Daily average soil temperature at 5 25 cm soil layers with daily air temperature (A), daily average soil water content at 5, 15, 25 and 45 cm soil layers (B) and total rainfall per day with light intensity (C) for the fertilised treatment at the deep site from 1 November 2016 to 2017.
A
B
C
Stellenbosch University https://scholar.sun.ac.za

78
A
B
C
D
Day of months
05/0
7/20
16
12/0
7/20
16
19/0
7/20
16
26/0
7/20
16
02/0
8/20
16
09/0
8/20
16
16/0
8/20
16
23/0
8/20
16
30/0
8/20
16
06/0
9/20
16
13/0
9/20
16
20/0
9/20
16
27/0
9/20
16
04/1
0/20
16
11/1
0/20
16
18/1
0/20
16
25/1
0/20
16
01/1
1/20
16
08/1
1/20
16
15/1
1/20
16
22/1
1/20
16
29/1
1/20
16
06/1
2/20
16
13/1
2/20
16
20/1
2/20
16
27/1
2/20
16
03/0
1/20
17
10/0
1/20
17
17/0
1/20
17
24/0
1/20
17
31/0
1/20
17
07/0
2/20
17
14/0
2/20
17
21/0
2/20
17
28/0
2/20
17
07/0
3/20
17
14/0
3/20
17
21/0
3/20
17
28/0
3/20
17
04/0
4/20
17
11/0
4/20
17
18/0
4/20
17
25/0
4/20
17
02/0
5/20
17
09/0
5/20
17
16/0
5/20
17
23/0
5/20
17
30/0
5/20
17
06/0
6/20
17
13/0
6/20
17
20/0
6/20
17
27/0
6/20
17
04/0
7/20
17
11/0
7/20
17
18/0
7/20
17
25/0
7/20
17
01/0
8/20
17
08/0
8/20
17
15/0
8/20
17
22/0
8/20
17
29/0
8/20
17
05/0
9/20
17
12/0
9/20
17
19/0
9/20
17
Avera
ge s
oil te
mper
atur
e (°C
)
10
20
30
40
50
Aver
age a
ir tem
pera
ture
(°C
)
10
20
30
40
50
Day of months
05/0
7/20
16
12/0
7/20
16
19/0
7/20
16
26/0
7/20
16
02/0
8/20
16
09/0
8/20
16
16/0
8/20
16
23/0
8/20
16
30/0
8/20
16
06/0
9/20
16
13/0
9/20
16
20/0
9/20
16
27/0
9/20
16
04/1
0/20
16
11/1
0/20
16
18/1
0/20
16
25/1
0/20
16
01/1
1/20
16
08/1
1/20
16
15/1
1/20
16
22/1
1/20
16
29/1
1/20
16
06/1
2/20
16
13/1
2/20
16
20/1
2/20
16
27/1
2/20
16
03/0
1/20
17
10/0
1/20
17
17/0
1/20
17
24/0
1/20
17
31/0
1/20
17
07/0
2/20
17
14/0
2/20
17
21/0
2/20
17
28/0
2/20
17
07/0
3/20
17
14/0
3/20
17
21/0
3/20
17
28/0
3/20
17
04/0
4/20
17
11/0
4/20
17
18/0
4/20
17
25/0
4/20
17
02/0
5/20
17
09/0
5/20
17
16/0
5/20
17
23/0
5/20
17
30/0
5/20
17
06/0
6/20
17
13/0
6/20
17
20/0
6/20
17
27/0
6/20
17
04/0
7/20
17
11/0
7/20
17
18/0
7/20
17
25/0
7/20
17
01/0
8/20
17
08/0
8/20
17
15/0
8/20
17
22/0
8/20
17
29/0
8/20
17
05/0
9/20
17
12/0
9/20
17
19/0
9/20
17
Tota
l rai
nfa
ll pe
r da
y (m
m)
0
2
4
6
8
10
12
14
16
18
Lig
ht i
nte
nsity
(W
/m2 )
0
100
200
300
400
500
600
700
800
900
Ave
rage
volu
met
ric w
ater con
tent (
m3/m
3 )
0.02
0.04
0.06
0.08
0.10
0.12
0.14
0.16
10
20
30
40
50
10
20
30
40
50
5 cm 15 cm 25 cm 45 cm 65 cm
25 cm 45 cm Air temperature
15 cm Air temperature5 cm
Rainfall Light intensity
Figure 5.9: Daily average soil temperature at 5 and 25 cm soil layers with daily air temperature (A), daily average soil temperature at 25 and 45 cm soil layers with daily air temperature (B), daily average soil water content at 5, 15, 25, 45 and 65 cm soil layers (C) and total rainfall per day with light intensity (D) for the bare treatment at the deep site from 5 July 2016 to 2017.
A
B
C
D
Stellenbosch University https://scholar.sun.ac.za

79
Figure 5.10: The hourly average soil temperature of the bare treatment on the deep soil at 5, 15, 25 and 45 cm soil layers on 19 August 2016 (A) and 20 August 2016 (B), and 21 August 2017 (C) and 22 August 2017 (D). The total rainfall per day (mm) on 20 August 2016 and 22 August 2017 was 4.8 and 12.3 mm, respectively. Light intensity was 413.52 and 445.29 W.m-1, and 274.74 and 296.23 W.m-1 for 19 and 20 August 2016, and 21 and 22 August 2017, respectively.
22 August 2016
2 4 6 8 10 12 14 16 18 20 22 24
Av
erag
e a
ir t
empe
ratu
re (
°C)
2
4
6
8
10
12
14
16
18
20
22
21 August 2017
2 4 6 8 10 12 14 16 18 20 22 24
Ave
rag
e s
oil t
em
pera
ture
(°C
)
2
4
6
8
10
12
14
16
18
20
22
20 August 2016
2 4 6 8 10 12 14 16 18 20 22 24
Av
era
ge a
ir t
em
per
atu
re (
°C)
2
4
6
8
10
12
14
16
18
20
22
19 August 2016
2 4 6 8 10 12 14 16 18 20 22 24
Av
era
ge s
oil
tem
per
atu
re (
°C)
2
4
6
8
10
12
14
16
18
20
225 cm 15 cm
25 cm 45 cm
Air temperature
5 cm 15 cm
25 cm 45 cm
Air temperature
A B
C D
Stellenbosch University https://scholar.sun.ac.za

80
of the dry soil (Refer to Section 5.2.1 for an explanation of the time-lag and soil temperature
fluctuations).
5.3.4 Evaporation rate
The difference in water content for each soil layer was used to determine the diffusivity coefficients
and to determine the evaporation rate calculated by using Equation 2.2 in Section 2.4.3.3, Chapter
2 (Gardner & Hillel, 1962) for selected evaporation periods. The evaporation rate was calculated
between successive rainfall events in the 2016 winter. The evaporation rates of the bare treatment
are presented in Figures 5.11 and 5.12.
In Figure 5.11A, the evaporation rate of the 5 cm soil layer was the highest after rain in July 2016.
After the second day, the water loss of all three soil layers was the same at low evaporation rates.
In August 2016 (Figs. 5.11B & 5.12B), the evaporation rate was the highest in the 25 cm soil layer
after the rain due to more water availability. For all intervals in August, falling-rate of the three stages
of the evaporation only held for 2–3 days and constant-rate intervened for a long period. The
evaporation rates were low (0.01–1.3 mm.day-1) because the soil texture was a sandy soil. Similar
low values were observed by Poulovassilis and Psychoyou (1985) and Wang (2015) who reported
low values of <2.5 mm.day-1 for sandy soils under arid conditions.
5.3.1 Drying front and diffusivity
Drying front and diffusivity were only determined for the bare soil. Drying front is presented as the
average volumetric water content per depth of the different soil layers in Figures 5.13, 5.14 and 5.15.
Diffusivity coefficients of each soil layer of the data were calculated by using Equation 2.3 in Section
2.4.3.4, Chapter 2 (Tables B.1 to B.15 in Appendix B). Note that the negative diffusivity coefficients
occurred when it had rained. The relationship between the diffusivity coefficients against the VWC
of the bare treatment are presented in Figures 5.16 to 5.20. Drying-front were significant after rainfall
during 2016 and 2017, and after inspection of data in Tables B.1 to B.15; the selected intervals were
8–12 July 2016, 5–12 August 2016, 14–19 August 2016, 22–29 August 2016, 17–25 September
2016 and 27–31 July 2017. Diffusivity coefficients have the same intervals but 27–31 July 2017 is
excluded. The depth intervals for drying front are 5, 15, 25, 45 and 65 cm soil depths. The depth
intervals for diffusivity coefficients are only to 25 cm soil depth because deeper in the soil profile did
not show a significant diffusivity curves.
Figure 5.13B had the highest total SWC due to higher rainfall (8.4 mm) before the soil dried out.
From Figures 5.13B to 5.15A, the total SWC depleted due to warmer air temperature or slower
redistribution of water. It is significant that the days with the most water loss occurred in the 5 cm
soil layer as explained in Section 5.2.3. The 65 cm soil layer lost almost no water from the start to
Stellenbosch University https://scholar.sun.ac.za
81
the last day of this study. A drying-front was observed between 25 and 45 cm in Figures 5.13B to
5.15B by 0.08 and 0.10 m3.m-3. Therefore, the drying-front was 20 cm thick. Reasons why Figure
5.12A did not show a drying front was: (1) drying out process occurred only for five days, and (2)
lower air and soil temperatures (Refer to Fig 5.9 in Section 5.3.3).
Figures 5.17 to 5.20 clearly showed a bend. The curve started with high VWC and high diffusivity
coefficient (liquid phase) and as the VWC decreased, the diffusivity coefficient decreased
exponentially. At some point, the diffusivity coefficient increased while the VWC still decreased. This
bend shows the phase shift from liquid to vapour phase. Thereafter, the diffusivity coefficient and
VWC decreased further. The same curve was obtained by Laroussi et al. (1975) and Hoffman (1997).
The 5 cm soil layer in Figure 5.20 had the lowest VWC with approximately the same diffusivity
coefficients. Diffusivity coefficients of the 15 cm soil layer occurred roughly as the VWC ranged
between 0.072–0.090 m3.m-3 and the bend occurred at an average VWC of 0080 m3.m-3. The
average diffusivity coefficients for 0–25 cm soil layer was approximately the same over the same
amount of water content in Figures 5.17 to 5.20. Overall, the diffusivity coefficient (35.02–236.11
mm2.day-1) is lower compared to 961 mm2.day-1 reported by Black et al. (1969) for sandy soils. This
may be due to the fact that the soils were dry and similar to the results of 45–432 mm2.day-1 for
sandy loam soils in the Free State Province, South Africa reported by Hoffman (1997).
Stellenbosch University https://scholar.sun.ac.za

82
Days after rain event
0 2 4 6 8 10 12 14 16
Eva
pora
tion
rate
(m
m.d
ay-1
)
0.0
0.3
0.6
0.9
1.2
1.55 cm
15 cm
25 cm
Days after rain event
0 2 4 6 8 10 12 14 16
0.0
0.3
0.6
0.9
1.2
1.5
A
B
Figure 5.11: Average evaporation rate of the bare treatment between 6–19 July 2016 (A) and 5–15 August 2016 (B).
Stellenbosch University https://scholar.sun.ac.za

83
A
B
Days after rain event
0 2 4 6 8 10 12 14 16
Eva
pora
tion
rate
(m
m.d
ay-1
)
0.0
0.3
0.6
0.9
1.2
1.5
Days after rain event
0 2 4 6 8 10 12 14 16
0.0
0.3
0.6
0.9
1.2
1.5
5 cm
15 cm
25 cm
5 cm
15 cm
25 cm
A
B
Figure 5.12: Average evaporation rate of the bare treatment between 14–23 August 2016 (A) and 22–30 August 2016 (B).
Stellenbosch University https://scholar.sun.ac.za

84
Soi
l dep
th (
cm)
Average volumetric water content (m3.m-3)
Average volumetric water content (m3.m
-3)
0.04 0.05 0.06 0.07 0.08 0.09 0.10 0.11 0.12 0.13 0.140
15
30
45
60
0.04 0.05 0.06 0.07 0.08 0.09 0.10 0.11 0.12 0.13 0.14
0
15
30
45
60
Figure 5.13: Development of a drying front over time after a rainfall event and its movement into the medium sandy soil of the bare treatment on 8–12 July 2016 (A) and 5–12 August 2016 (B).
A
B
Stellenbosch University https://scholar.sun.ac.za

85
0.04 0.05 0.06 0.07 0.08 0.09 0.10 0.11 0.12 0.13 0.140
15
30
45
60
0.04 0.05 0.06 0.07 0.08 0.09 0.10 0.11 0.12 0.13 0.14
Soi
l dep
th (
cm)
0
15
30
45
60
Average volumetric water content (m3.m-3)
Average volumetric water content (m3.m-3)
A
B
Figure 5.14: Development of a drying front over time after a rainfall event and its movement into the medium sandy soil of the bare treatment on 14–19 August 2016 (A) and 2 –29 August 2016 (B).
Stellenbosch University https://scholar.sun.ac.za

86
0.04 0.05 0.06 0.07 0.08 0.09 0.10 0.11 0.12 0.13 0.140
15
30
45
60
Average volumetric water content (m3.m-3)
0.04 0.05 0.06 0.07 0.08 0.09 0.10 0.11 0.12 0.13 0.14
0
15
30
45
60
Soi
l dep
th (
cm
)Average volumetric w ater content (m3.m-3)
A
B
Figure 5.15: Development of a drying front over time after a rainfall event and its movement into the medium sandy soil of the bare treatment on 17–25 September 2016 (A) and 27 – 31 July 2017 (B).
Stellenbosch University https://scholar.sun.ac.za

87
0.05 0.06 0.07 0.08 0.09 0.10 0.11
Volumetric water content (mm3.mm-3)
0.05 0.06 0.07 0.08 0.09 0.10 0.11
30
60
90
120
150
180
210
2405 cm15 cm25 cm5 - 25 cm
Diff
usiv
ity (
mm
2 .day
-1)
Figure 5.16: Average diffusivity coefficients of the bare treatment at 5, 15 and 25 cm soil depths on 8–12 July 2016.
Stellenbosch University https://scholar.sun.ac.za

88
0.05 0.06 0.07 0.08 0.09 0.10 0.11
0.05 0.06 0.07 0.08 0.09 0.10 0.11
30
60
90
120
150
180
210
240
Diff
usiv
ity (
mm
2 .day
-1)Volumetric water content (mm3.mm-3)
Volumetric water content (mm3.mm-3)
Figure 5.17: Average diffusivity coefficients of the bare treatment at 5, 15 and 25 cm soil depths on 9–12 August 2016.
Stellenbosch University https://scholar.sun.ac.za

89
0.05 0.06 0.07 0.08 0.09 0.10 0.11
0.05 0.06 0.07 0.08 0.09 0.10 0.11
30
60
90
120
150
180
210
240
Diff
usiv
ity (
mm
2 .day
-1)Volumetric water content (mm3.mm-3)
Volumetric water content (mm3.mm-3)
Figure 5.18: Average diffusivity coefficients of the bare treatment at 5, 15 and 25 cm soil depths on14-19 August 2016.
Stellenbosch University https://scholar.sun.ac.za

90
0.05 0.06 0.07 0.08 0.09 0.10 0.11
0.05 0.06 0.07 0.08 0.09 0.10 0.11
30
60
90
120
150
180
210
240
Diff
usiv
ity (
mm
2 .day
-1)
Volumetric water content (mm3.mm-3)
Volumetric water content (mm3.mm-3)
Figure 5.19: Average diffusivity coefficients of the bare treatment at 5, 15 and 25 cm soil depths on 22-29 August 2016.
Stellenbosch University https://scholar.sun.ac.za

91
0.05 0.06 0.07 0.08 0.09 0.10 0.11
0.05 0.06 0.07 0.08 0.09 0.10 0.11
30
60
90
120
150
180
210
240
Volumetric water content (mm3.mm-3)
Volumetric water content (mm3.mm-3)
Diff
usiv
ity (
mm
2 .day
-1)
Figure 5.20: Average diffusivity coefficients of the bare treatment at 5, 15 and 25 cm soil depths on 17–25 September 2016.
Stellenbosch University https://scholar.sun.ac.za
92
5.4 Conclusion
The fertilisation seems to have an indirectly effect on the soil water dynamics. Since most of the
plants died on the fertilised soils, the SWC was lower than the unfertilised treatment. Direct contact
with solar radiation caused the soil temperature to be increased, thereby decreasing SWC. The ET
of the fertilised soils is lower compared to the unfertilised soils due to less water availability. Due to
this indirect negative effect of fertilisation, soil water storage in the soil was minimal.
Soil depth has a notable effect on the soil water dynamics. Higher SWC in the 10–20 cm soil layer
during winter 2016 was observed due to higher SOC. Of all the treatments, the ET and E were
higher in winter 2016 compared to summer 2017 due to higher water availability. Also, the ET was
lower in the shallow soils due to lower SWC compared to the deep soils. Since Rooibos is a rainfed
plant, more water stored in the soil profile is needed for the next growing season for it to survive and
grow. Therefore, deeper soils with higher FE is more beneficial.
The rainfall pattern showed dry, hot summers and wet winters and the rainfall in 2017 was less than
in 2016. The higher evapotranspiration of the unfertilised treatment reduced the redistribution of
water, whereas ET and its rate increased after a rainfall event. Notwithstanding, these high
evapotranspiration or evaporation rates only lasted for a few hours and after 2-3 days most of the
water had evaporated and reached a constant-rate. Also, the low ET and E rate was due to low SWC
in the medium sand soils. Clearly, the 5 cm soil layer of all treatments is influenced by external
factors, i.e. mainly rainfall and light intensity. On rainy and cloudy days, the top layer cooled down
faster than the other soil layers deeper down in the soil. Therefore, it can be concluded that the
fluctuations in the 5 cm soil layer are noticeable. Deeper down in the soil, the fluctuations are not
noticeable due to delayed energy transfer. Drying-front occurred in the 25–45 cm layer with a
thickness of 20 cm. The low diffusivity coefficients (35.02–236.11 mm2.day-1) was due to the drought.
Stellenbosch University https://scholar.sun.ac.za

93
Chapter 6: Effect of fertilisation and soil depth on biomass
production, root development and biomass water use
efficiency
6.1 Introduction
High evaporative demand and limited rainfall can restrict the yield of Rooibos. Management practices
such as increasing the soil water storage (SWS) can limit the stress effects. Musick et al. (1994)
found that dryland wheat yields were linearly related to SWS. A study by Li and Shu (1991) on the
Loess Plateau of China showed that wheat yield is dependent upon the SWS at harvesting. The
improvement of the SWS will not only optimise the yield but will also improve the water use efficiency
(WUE). Huang et al. (2003) evaluated the relationship between SWS and WUE, where high SWS in
a soil often had a high WUE. The low cost and accessibility of inorganic fertilisers are beneficial and
can also improve the WUE. Hence, maintaining high yields and improving WUE can be a challenge.
Rooibos takes up water and nutrients mainly through the cluster roots via the soil-plant-atmosphere
continuum. These cluster roots play an important role in plant functioning. However, very little is
known about the complex response of the Rooibos root systems and various root types to the
application of inorganic fertilisers.
The effect of the unfertilised and fertilised treatment on shallow and deep soils on Rooibos plants
responses are presented and discussed in this chapter in terms of biomass, root growth, root
nodulation and WUE. The conclusions are linked to the findings presented for soil water content in
Chapter 5 and Chapter 6. This study gives an insight into how fertilisation, and soil depth can
influence Rooibos biomass production, root development and biomass WUE.
6.2 Biomass production
The biomass production for unfertilised and fertilised treatment shallow and deep soils is presented
in Table 6.1. Fertilisation and soil depth influenced the shoot and root biomass from 22 February to
25 September 2017. On 22 February 2017, the shoot biomass of the unfertilised treatment on the
shallow soils was significantly (p < 0.015) higher than the other three treatments. The root biomass
of all treatments did not differ because the plants were still very immature. The shoot and root
biomass of all treatments increased from 22 February 2017 to 26 May 2017 due to the active growth
of the Rooibos plants (Malgas & Oettle, 2007). On 26 May 2017, the shoot biomass of the unfertilised
treatment on the shallow soil was still significantly higher than the other three treatments (Table 6.1)
despite the lower SWC when compared to the deep site. Root biomass of all treatments differ
Stellenbosch University https://scholar.sun.ac.za

94
Table 6.1: Shoot and root biomass of the unfertilised and fertilised treatments at shallow and deep sites.
Treatment Site Date Shoots mass
(g)
Roots mass
(g)
Unfertilised Shallow
22 February 2017
45.09e(1) 8.26c
Fertilised 17.46f 4.52d
Unfertilised Deep
15.49f 3.58d
Fertilised 10.94f 2.49d
Unfertilised Shallow
26 May 2017
111.30b 34.88b
Fertilised 20.50f 11.20c
Unfertilised Deep
83.20c 49.17a
Fertilised 37.43e 12.03c
Unfertilised Shallow
25 September 2017
147.47b 49.03a
Fertilised 17.57f 17.87c
Unfertilised Deep
173.85a 45.88a
Fertilised 56.60d 14.67c
(1) In each column, values with different letters (a, b, c, d and f) indicate significant differences (p < 0.05).
significantly from one another, with the unfertilised treatment on the deep soils having the highest
root mass.
The higher root biomass can be attributed to the longer taproots which were thicker and heavier
(Refer to Table 6.5 in Section 6.3). From 26 May 2017 to 25 September 2017, only the shoot biomass
of the fertilised treatment on the shallow soil did not increase. On 25 September 2017, the shoot
biomass of the unfertilised treatment was the highest due to higher SWC as discussed in Chapter 5.
These results indicate that the ability of plants to produce shoot growth on shallow soils is greatly
reduced by soil depth (Hagan et al., 1967). The low shoot and root biomass of the fertilised treatment
from 22 February 2017 to 25 September 2017 at both sites was due to the high P concentration in
the soil (Lambers et al., 2006)
6.3 Root development
6.3.1.1 N-fixing nodules
There were no significant differences in the number of N-fixing nodules on the roots of all treatments
at the deep site on 22 February 2017 and on 26 May 2017 (Table 6.2). Visual observation showed
that most of the N-fixing nodules occurred in the 0–20 cm soil layer. In Figures 6.1 and 6.2, the sizes
of the nodules of the two treatments were approximately the same (data not shown). In contrast,
Eaglesham et al. (1983) reported that the amount of N-fixing of each legume responded differently
to various N application. Furthermore, the strongest effect occurred in soybean with urea applied at
30 mg N per plant and cowpea where 36 and 72 mg N per plant was applied. It should be noted that
both plants are legume plants.
Stellenbosch University https://scholar.sun.ac.za

95
Table 6.2: N-fixing nodules of the unfertilised and fertilised treatments at the deep site.
Treatment Date Number of nodulations
Unfertilised 22 February 2017 11.75(1)
26 May 2017 14.33
Fertilised 22 February 2017 10.80
26 May 2017 13.33
(1) In each column, there was no significant differences (p > 0.05).
6.3.1.2 Root system characteristics
The SWC did not any have an effect on the root growth and distribution of all treatments (data not
shown). The taproots of all treatments were similar on 22 February 2017 (Table 6.3). This implied
that the Rooibos plants were still immature. From 22 February to 25 May, the taproots extended by
28.55, 19.27, 37.35 and 36.34 cm for the unfertilised and fertilised treatments on the shallow and
deep soils, respectively. These results clearly illustrate the benefits of having a deeper soil, rather
than shallow soil for the production of Rooibos plants in terms of the taproot penetration into the soil.
It was expected that the taproots would be longer in the deeper soils since the soil texture was
homogenous and had no compaction (Refer to soil texture in Section 4.1.3 and bulk density in
Section 4.1.4, Chapter 4). The taproots of the shallow soils were short due to restriction of the red
rock below 40 cm in the soil (Smith, 2014) and this red rock caused distortions of the taproot which
was visually observed. Similar results were reported by Richards (1993) where the taproot of Protea
compacta (fynbos plant) extended from 0.4–0.6 m and 1.0 m in the shallow and deep soils,
respectively. Moreover, the roots in the shallow soils were restricted by stones deeper down in the
soil profile.
Table 6.3: Length of the taproots of the unfertilised and fertilised treatments at the shallow and deep sites.
Treatment Site Date Root length
(cm)
Unfertilised
Shallow
22 February 2017 36.58d(1)
26 May 2017 65.13b
Fertilised 22 February 2017 35.78d
26 May 2017 55.05c
Unfertilised
Deep
22 February 2017 33.32d
26 May 2017 70.67a
Fertilised 22 February 2017 27.49d
26 May 2017 63.83b
(1) Values with different letters (a, b, c and d) indicate significant differences (p < 0.05).
Stellenbosch University https://scholar.sun.ac.za

96
Figure 6.1: Photos of the root nodulations of the Rooibos plants of the unfertilised treatment on the deep soils taken by the digital microscope. The scale in photo A was 10 times and in photo B it was 100 times
0.2 mm
A
B
0
0
2.5 mm
Stellenbosch University https://scholar.sun.ac.za

97
Figure 6.2: Photos of the root nodulations of the Rooibos plants of the unfertilised treatment on the deep soils taken by the digital microscope. The scale of both photos was 100 times.0 0.2 mm
0.2 mm 0
Stellenbosch University https://scholar.sun.ac.za

98
There were no taproots thicker than 20 mm in the 0–10 cm soil layer but roots of 10–20 mm diameter
in the 10–20 cm soil layer of the fertilised treatment was observed at both sites (Table 6.4). Thus,
the application of fertiliser did not only suppress the root growth but also caused thinner taproots.
The Rooibos plants tended to have a high root concentration in the 10–20 cm soil layer (Fig. 6.3).
One reason that can be given for the higher root concentration in the 10–20 cm soil layer, is due to
the lower bulk density in this particular soil layer (Refer to Table 4.5 in Chapter 4) and lower soil
temperature (Refer to Table 5.12 in Section 5.3.2). The fynbos plant, Warsonia pyramidata, growing
in Jonkershoek, South Africa showed similar root system characteristics as reported by Higgins et
al. (1987). The results from the current studies showed that high root concentration of 50 and 75%
were found in the 10–20 cm soil layer. The average biomass of the fine roots (smaller than 1 mm) in
the 10–20 cm soil layer was also higher of the unfertilised treatment compared to the fertilised
treatment at both sites (Table 6.5). Keerthisinghe et al. (1998) found the percentage of dry mass of
cluster roots of Lupinus albus L. decreased from 76.6 to 6.5% when the P concentration increased
from 0.3 to 1 mg.kg-1.
Table 6.4: Average length (cm) of Rooibos at different soil depths for the different root size classes for the unfertilised and fertilised treatments at the shallow and deep sites
Treatment Site Soil depth (cm) Root diameter (mm)
<1 1-2 2-5 5-10 10-20 >20
Unfertilised
Shallow
0–10 ---(1) ---(1) ---(1) ---(1) 10.00 10.00
10–20 182.50(1) 24.00 45.50 ---(1) 10.00 ---(1)
20–30 77.83 65.00 30.50 12.00 10.00 ---(1)
30–40 9.50 ---(1) ---(1) 10.00 ---(1) ---(1)
>40 86.75 79.50 30.33 2.82 ---(1) ---(1)
Fertilised
0–10 8.00 ---(1) 7.50 7.86 8.50 ---(1)
10–20 148.67 79.00 14.50 8.83 ---(1) ---(1)
20–30 1.00 ---(1) 10.00 ---(1) ---(1) ---(1)
30–40 ---(1) 10.50 12.00 ---(1) ---(1) ---(1)
>40 28.00 13.50 40.00 ---(1) ---(1) ---(1)
Unfertilised
Deep
0–10 29.00 4.00 ---(1) 3.50 7.00 9.00
10–20 137.17 6.00 117.50 7.50 6.67 ---(1)
20–30 36.50 50.00 13.00 7.50 ---(1) ---(1)
30–40 12.50 ---(1) 18.17 7.00 ---(1) ---(1)
>40 61.33 68.67 141.00 12.00 ---(1) ---(1)
Fertilised
0–10 14.00 14.00 5.00 6.75 8.75 ---(1)
10–20 125.17 45.00 9.00 8.25 ---(1) ---(1)
20–30 39.75 7.50 13.33 10.00 ---(1) ---(1)
30–40 12.50 10.00 20.00 4.00 ---(1) ---(1)
>40 66.50 42.50 36.00 ---(1) ---(1) ---(1) (1) No roots of mention class present at specific soil depth (2) Significant differences are not calculated due lack of enough replications
Stellenbosch University https://scholar.sun.ac.za

99
A B
C D
Figure 6.3: Root morphology of Rooibos plants of the unfertilised (A) and fertilised (B) treatments at the shallow site. C and D are unfertilised and fertilised treatments at the deep site, respectively.
Stellenbosch University https://scholar.sun.ac.za

100
Watt and Evans, (1999) reported that in many legume species, the cluster roots will form in P
concentrations of 3 mg.kg-1. The cluster roots increased the contact with the soil and increased the
nutrient extraction in the surrounding soil (Lamont, 2003). Similar results by Lampurlanes et al.
(2001) found that higher root concentration in the 10–20 cm soil layer is a favourable characteristic
under the semi- or arid regions. Furthermore, it allows a greater absorption of water after a rainfall
event.
Table 6.5: Average biomass (g) of Rooibos at different soil depths for the different root size classes for the unfertilised and fertilised treatments at the shallow and deep sites.
Treatment Site Soil depth
(cm)
Root diameter (mm)
<1 1-2 2-5 5-10 10-20 >20
Unfertilised
Shallow
0–10 ---(1) ---(1) ---(1) ---(1) 14.30 15.98
10–20 1.28(2) 0.46 0.80 ---(1) 9.29 ---(1)
20–30 0.27 0.86 1.88 4.24 5.33 ---(1)
30–40 0.03 2.91 ---(1) ---(1)
>40 0.25 1.36 1.35 2.82 ---(1) ---(1)
Fertilised
0–10 0.09 ---(1) 0.11 1.81 4.64 ---(1)
10–20 0.59 1.02 0.75 2.08 ---(1) ---(1)
20–30 ---(1) ---(1) 0.79 ---(1) ---(1) ---(1)
30–40 ---(1) 0.24 0.66 ---(1) ---(1) ---(1)
>40 0.05 1.56 1.25 ---(1) ---(1) ---(1)
Unfertilised
Deep
0–10 0.04 0.01 ---(1) 1.33 6.75 13.36
10–20 1.46 0.06 5.42 1.72 3.79 ---(1) 20–30 0.07 0.37 1.05 0.98 ---(1) ---(1) 30–40 0.02 ---(1) 1.10 1.87 ---(1) ---(1) >40 0.22 0.36 5.08 2.11 ---(1) ---(1)
Fertilised
0–10 0.27 0.18 0.34 1.57 5.61 ---(1) 10–20 0.94 0.14 0.82 1.78 ---(1) ---(1) 20–30 0.21 0.03 0.93 1.21 ---(1) ---(1) 30–40 0.01 0.33 0.87 0.42 ---(1) ---(1) >40 0.16 0.63 1.67 ---(1) ---(1) ---(1)
(1) No roots of mention class present at specific soil depth (2) Significant differences are not calculated due lack of enough replications
6.4 Biomass water use efficiency
Average biomass water use efficiency (WUEB) of both treatments at both sites on 27 February 2017
is presented in Table 6.6. The unfertilised treatment on the shallow soils had the highest WUEB
compared to the other treatments. The high WUEB of shallow soils is due to higher biomass of the
Rooibos plants (Table 6.1) even though the SWC on shallow soils was lower compared to the deep
soils. In contrast, Boutraa et al. (2010) reported that the yield and WUE of wheat declined at low
water content (30%) under semi-arid conditions. This may due to that the plants on 27 February
2017 were still immature for comparison. The low WUEB of the fertilised treatment on both soils is
likely due to lower biomass production (Table 6.1).
Stellenbosch University https://scholar.sun.ac.za

101
Table 6.6: Average biomass water use efficiency (WUEB in kg.ha-1.mm-1) of the unfertilised and fertilised treatments at the shallow and deep sites at the end of February 2017.
Treatment Site WUEB
Unfertilised Shallow
27.6a(1)
Fertilised 12.8b
Unfertilised Deep
13.3b
Fertilised 9.8c
(1) Values with different letters (a, b, c and d) indicate significant differences (p < 0.05).
6.5 Conclusion
The application of fertiliser had a noticeable negative effect on biomass production and root
distribution of Rooibos plants. The high phosphorous content in the soil solution caused by the
application of the NPK fertiliser reduced the biomass production and thinner taproots. Fertiliser
application did not increase the number of N-fixing nodules of Rooibos plants.
Soil depth had a noticeable effect on biomass production and root growth of Rooibos. Although the
biomass production of the unfertilised treatment on the shallow soils was substantially higher than
the unfertilised treatment on the deeper soils on 27 February 2017. The higher shoot biomass of the
unfertilised treatment on the deep soils compared to the unfertilised treatment on the shallow soils
on 25 September 2017 was due to more water availability. It was evident that the shallow soils
restricted root growth and decreased the shoot biomass over a prolonged period. Therefore, results
have shown that deeper soils are more favourable for Rooibos plants in terms of root growth and
better production. Unfertilised plants at the shallow site had higher WUEB on 27 February 2017, but
the water use was higher compared to the unfertilised plants at the deep site. This implies that the
plants were still immature.
Stellenbosch University https://scholar.sun.ac.za

102
Chapter 7: Conclusions
7.1 Soil water dynamic during 2016/17
The water holding capacity was low due the sandy texture of the soil, therefore the soil water content
(SWC) was low. Most of the rainfall occurred during the winter and became lower at the end of
August. In 2017, the SWC was lower compared to 2016 due to higher air temperature and lower
rainfall. Soil water content of the fertilised treatment was lower compared to the unfertilised treatment
on shallow and deep soils. The cumulative evaporation (ET) of the unfertilised treatment on deep
soils was higher compared to all the treatments on shallow and deep soils. The high ET was caused
by higher SWC and plants. However, the ET rate on the shallow soils was high and SWC was low.
Furthermore, the deeper soils had better fallow efficiency (FE). During the winter, the roots, high soil
organic carbon (SOC) and low bulk density in the 10 – 20 cm soil layer increased the SWC of the
unfertilised and fertilised treatment compared to the bare treatment.
External factors such as rainfall, sunlight and wind speed directly influenced the 5 cm soil layer.
Water loss was high in the 5 cm soil layer but low in the 65 cm soil layer. Of the dry soils, the following
observations were expected. The temperature fluctuations deeper down in the soil profile was not
significant due to poor energy transfer. The redistribution of water in the sandy soil was slow and
most water loss occurred in the 5 cm soil layer, whereas the ET of plants reduced the redistribution.
Evaporation rate was low because of the sandy texture and low SWC in the soil. The diffusivity
coefficients were only significant during the winter with a 20 cm drying-front.
7.2 The effect of fertilisation and soil depth on biomass production, root
development and biomass water use efficiency
Notwithstanding the low acidity and low effective cation exchange capacitive (ECEC) of the soil, it
seemed that the roots of Rooibos grew well. Bulk density of the medium sandy soils had no effect
on root development. However, fertilisation and soil depth seems to have played an important role
in root growth. Shoot biomass of the unfertilised treatment on deep soils was the highest on 25
September 2017 compared to other treatments on shallow and deep soils. Root biomass of the
fertilised treatment was lower than the unfertilised treatment due to high P concentrations which
reduced the root growth. However, the root growth in the deep soils was better compared to the
shallow soils. This was expected because shallow soils restricted the root growth and caused
distortion. Fertilisation and soil depth did not influence the number of root nodulations.
Since the soil water balance only stopped on April 2017 and not on September 2017, the biomass
water use efficiency (WUEB) of the unfertilised treatment on the shallow soils was the highest. In
Stellenbosch University https://scholar.sun.ac.za

103
contrast, Rooibos used more water in the shallow soils compared to the deeper soils. The WUEB
was thus inconclusive because the plants were still immature on 27 February 2017. Given that the
SWC was during in two growing seasons, the WUEB on deeper soils may be the highest due to the
likelihood of higher water storage and biomass production at the deep site.
7.3 Recommendations
This study was the first project of its kind to investigate the effects of fertiliser and soil depth on soil
water balance and Rooibos production. Results showed that fertilisation and soil depth influence
Rooibos production. Where the inorganic fertiliser of 20 mg.kg-1 N, 30 mg.kg-1 P and 20 mg.kg-1 K
killed most of the Rooibos, this combination is not recommended. Particular during drought
conditions, it is often very important to consider where to plant the Rooibos for higher production.
Rooibos likes deep, cooler soils with higher SWC. Farmers must try to plant the Rooibos in deeper
soils rather than on shallow soils for optimum Rooibos production.
7.4 Future research
Further research of inorganic fertiliser is required to establish the best inorganic NPK fertiliser to
increase the Rooibos production. If the correct balance of NPK fertiliser is known, the same aims of
this study must be done over again. However, it will even be better if two growing seasons are
compared to each other for better observations. The FE also needs to be considered, where deeper
soils have higher FE. A combination with mulch or straw or which type of tillage need to be
investigated to improve the FE. Not only which type of cover but also the timing of fallow period
(June-August) compared to a longer fallow period during May to September needs to be
investigated.
Another good subject is to determine how Rooibos can survive in drought conditions. Since there
are only a few studies done on diffusivity coefficients, pedo-transfer function, evaporative demand
and pore air relative humidity, these factors may help to solve the problem. Most of the SWC is
stored in the 10–20 cm soil layer. It can be assumed that the vapour phase condenses into liquid
phase during the earlier morning but air pore relative humidity and soil temperature at the root zones
is needed. Pedram et al. (2017) examined the liquid-heat-vapour processes under semi-arid
conditions and found that the vapour from deeper soil depth condenses in the 5–10 cm soil layer
during the morning.
Closer quantity root studies need to be done. Since the root system characteristics were done in the
laboratory, a field study will be better to understand the root system characteristics of Rooibos
because some of the roots were cut off during harvesting and the roots shrink during the dried-out
process.
Stellenbosch University https://scholar.sun.ac.za

104
Reference
Abu-Hamdeh, N.H. 2004. The effect of tillage treatments on soil water holding capacity and on soil
physical properties. 13th International Soil Conservation Organisation Conference. (669):1–6.
Adugna, A. & Abegaz, A. 2015. Effects of soil depth on the dynamics of selected soil properties
among the higlands resources of Northeast Wollega, Ethiopia: are these sign of degradation?
Solid Earth Discussions. 7:2011–2035.
AgriInfo.in. 2015. Density of soil: Bulk density and particle density. [Online], Available:
http://www.agriinfo.in/?page=topic&superid=4&topicid=273 [2017, June 30].
Akhter, J., Mahmood, K., Malik, K.A., Mardan, A., Ahmad, M. & Iqbal, M.M. 2004. Effects of hydrogel
amendment on water storage of sandy loam and loam soils and seedling growth of barley,
wheat and chickpea. Plant, Soil and Environment. 50(10):463–469.
Allen, R.G., Pereira, L.S., Raes, D. & Smith, M. 1998. Crop evapotranspiration: Guidelines for
computing crop requirements. Irrigation and Drainage Paper No. 56, FAO. (56):300.
Angus, J.F. & Van Herwaarden, A.F. 2001. Increasing water use and water use efficiency in dryland
wheat. Agronomy Journal. 93(2):290–298.
Arshad, S., Morid, S., Mobasheri, M.R., Alikhani, M.A. & Arshad, S. 2013. Monitoring and forecasting
drought impact on dryland farming areas. International Journal of Climatology. 33(8):2068–
2081.
ASTM D6913-04R2009. 2004. Standard test methods for particle-size distribution (gradation) of soils
using sieve analysis. ASTM International, West Conshohocken, PA,. 4(Reapproved 2009):1–
35.
Atwell, B.J., Kriedemann, P.E. & Turnbull, C.G.N. 1999. Water in soils. In G. Farquhar (ed.). Sydney,
Australia: Australian Society of Plant Scientists Plants in Action: Adaptation in NAture,
Performance in Cultivation. 211–212.
Bach, L.B. 1984. Soil water movement in response to temperature gradients: Experimental
measurements and model evaluation. Soil Science Society of America Journal. 56(1):37–46.
Baetz, U. & Martinoia, E. 2014. Root exudates : the hidden part of plant defense. Trends in Plant
Science. 19(2):90–98.
Bai, J., Zhang, G., Zhao, Q., Lu, Q., Jia, J., Cui, B. & Liu, X. 2016. Depth-distribution patterns and
control of soil organic carbon in coastal salt marshes with different plant covers. Scientific
Reports. 6(October).
Stellenbosch University https://scholar.sun.ac.za

105
Bandaranayake, W.M., Parsons, L.R., Borhan, M.S. & Holeton, J.D. 2007. Performance of a
capacitance-type soil water probe in a well-drained sandy soil. Soil Science Society of America
Journal. 71(3):993–1002.
Basso, A.S., Miguez, F.E., Laird, D.A., Horton, R. & Westgate, M. 2013. Assessing potential of
biochar for increasing water-holding capacity of sandy soils. Global Change Biology Bioenergy.
5(2):132–143.
Bengough, A.G., Bransby, M.F., Hans, J., McKenna, S.J., Roberts, T.J. & Valentine, T.A. 2006. Root
responses to soil physical conditions; growth dynamics from field to cell. Journal of
Experimental Botany. 57(2 SPEC. ISS.):437–447.
Bennie, A.T.P. & Hensley, M. 2001. Maximizing precipitation utilization in dryland agriculture in South
Africa - A review. Journal of Hydrology. 241(1–2):124–139.
Bennie, A.T.P., Hoffman, J.E., Coetzee, M.J. & Vrey, H.S. 1994. Storage and utilization of rain water
in soils for stabilizing crop production in semi-arid ares [Afr.]. Water Research Commission.
227/1/94:31–110.
Benninga, H.F., Carranza, C.D.U., Pezij, M., Santen, P. Van, Augustijn, D.C.M. & Velde, R. Van Der.
2017. Regional soil moisture monitoring network in the Raam catchment in the Netherlands.
Earth System Science Data Discussions. (July):1–31.
Berenguer, M.J. & Faci, J.M. 2001. Sorghum (Sorghum Bicolor L-Moench) yield compensation
processes under different plant densities and variable water supply. European Journal of
Agronomy. 15(1):43–55.
Black, T.A., Gardner, G.R. & Thurtell, G.W. 1969. The prediction of evaporation, drainage, and soil
water storage for a bare soil. Soil Science Society of America Journal. 33(5):655–660.
Blake, G.R. & Hartge, K.H. 1986. Bulk density. In A. Klute (ed.). Madison, WI: American Society of
Agronomy/Soil Science Society of America Methods of soil analysis: Part 1 – Physical and
mineralogical methods. 364--367.
Böhm, W. 1979. Methods of studying root systems. Berlin: Springer.
Bradshaw, P.L. & Cowling, R.M. 2014. Landscapes, rock types, and climate of the Greater Cape
Floristic Region. In N. Allsopp, J.F. Colville, & G.A. Verbook (eds.). United Kingdom: Oxford
University Press Fynbos: Ecology, Evolution and Conservation of a Megadiverse Region. 26–
46.
Brar, B., Singh, J., Singh, G. & Kaur, G. 2015. Effects of long term application of inorganic and
organic fertilizers on soil organic carbon and physical properties in maize-wheat rotation.
Agronomy. 5(2):220–238.
Stellenbosch University https://scholar.sun.ac.za
106
Breña Naranjo, J.A., Weiler, M. & Stahl, K. 2011. Sensitivity of a data-driven soil water balance
model to estimate summer evapotranspiration along a forest chronosequence. Hydrology and
Earth System Sciences. 15(11):3461–3473.
Brunel, N., Seguel, O. & Acevedo, E. 2013. Conservation tillage and water availability for wheat in
the dryland of central Chile. Journal of soil science and plant nutrition. 13(ahead):0–0.
Brutsaert, W. 2014. Daily evaporation from drying soil: Universal parameterization with similarity.
Water Resources Research. 50(4):3206–3215.
Cahill, A.T. & Parlange, M.B. 1998. On water vapor transport in field soils. Water Resources
Research. 34(4):731–739.
Cairns, J.E., Impa, S.M., O’Toole, J.C., Jagadish, S.V.K. & Price, A.H. 2011. Influence of the soil
physical environment on rice (Oryza sativa L.) response to drought stress and its implications
for drought research. Field Crops Research. 121(3):303–310.
Calvino, P.A., Andrade, F.H. & Sadras, V.O. 2003. Maize yeild as affected by water availability, soil
depth, and crop management. Agronomy Journal. 95(2):275–281.
Cammalleri, C., Ciraolo, G., La Loggia, G. & Maltese, A. 2012. Daily evapotranspiration assessment
by means of residual surface energy balance modeling: A critical analysis under a wide range
of water availability. Journal of Hydrology. 452–453:119–129.
Carter, M.R. & Rennie, D.A. 1985. Soil temperature under zero tillage systems for wheat in
Saskatchewan. Canadian Journal of Soil Science. 338(May):329–338.
Celik, I., Gunal, H., Budak, M. & Akpinar, C. 2010. Effects of long-term organic and mineral fertilizers
on bulk density and penetration resistance in semi-arid Mediterranean soil conditions.
Geoderma. 160(2):236–243.
Chanzy, A., Gaudu, J.-C. & Marloie, O. 2012. Correcting the temperature influence on soil
capacitance sensors using diurnal temperature and water content cycles. Sensors.
12(12):9773–9790.
Chaudhari, P.R., Ahire, D.V, Ahire, V.D., Chkravarty, M. & Maity, S. 2013. Soil bulk density as related
to soil texture, organic matter content and available total nutrients of Coimbatore soil.
International Journal of Scientific and Research Publications. 3(1):2250–3153.
Chazarenc, F., Naylor, S., Comeau, Y., Merlin, G. & Brisson, J. 2010. Modeling the effect of plants
and peat on evapotranspiration in constructed wetlands. International Journal of Chemical
Engineering. 2010:1–6
Stellenbosch University https://scholar.sun.ac.za

107
Cheney, R.H. & Scholtz, E. 1963. Rooibos tea , a South African contribution to world beverages.
Economic Botany. 17(3):186–194. [Online], Available: http://www.jstor.org/stable/4252443
Rooibos Tea , A South African Contribution to , World Beverages1.
Chestworth, W. 2008. Encyclopedia of soil science. Dordrecht: The Netherlands: Springer.
Chimphango, S.B.M., Hattas, D. & Oettlé, N. 2015. Effect of organic cultivation of rooibos tea plants
(Aspalathus linearis) on soil nutrient status in Nieuwoudtville, South Africa. South African
Journal of Plant and Soil. 1862(September):1–9.
Clifton-Brown, J.C. & Lewandowski, I. 2000. Water use efficiency and biomass partitioning of three
different Miscanthus genotypes with limited and unlimited water supply. Annals of Botany.
86(1):191–200.
Cobos, D.R. & Chambers, C. 2010. Calibrating ECH2O Soil Moisture Sensors. Available:
http://www.Decagon.Com/Education/Calibrating-Ech2O-Soil-Moisture-Sensors-13393-04-an/.
1–7.
Cobos, D. & Campbell, C.S. 2007. Correcting temperature sensitivity of EC2HO soil moisture sensors
Strategy. (1):7. [Online], Available: www.decagon.com.
Corbella-Tena, M., Fernández-Falcón, M. & Rodríguez-Pérez, J.A. 2015. Effect of the concentration
of phosphorus on growth and nutrition of Leucospermum cordifolium “Flame Spike”. Journal of
Plant Nutrition. 38(5):712–727.
Cowling, R.M., Rundel, P.W., Lamont, B.B., Arroyo, M.K. & Arianoutsou, M. 1996. Plant diversity in
mediterranean-climate regions. TREE. 11(9):362–366.
Croissant, R.L., Peterson, G.A. & Westfall, D.G. 2007. Dryland cropping systems. Crop Series
Production. 0.516:237–241.
Daamen, C.C. & Simmonds, L.P. 1996. Measurement of evaporation from bare soil and its
estimation using surface resistance. Water Resources Research. 32(5):1393–1402.
Daamen, C.C., Simmonds, L.P., Wallace, J.S. & Laryea, K.B. 1993. Use of microlysimeters to
measure evaporation from sandy soils. Agricultural and Forest Meteorology. 65:159–173.
DAFF. 2015. A profile of the South African rooibos tea market value chain. Department: Agriculture,
Foresty and Fisheries, Pretoria.
Dakora, F.D., Spriggs, A., Nyemba, R.C. & Chimphango, S.B.M. 2000. Host-plant factors in the
adaptation of indigenous African legumes to low pH soils. In F.O. Pedrosa, M. Hungria, M.G.
Yates, & W.E. Newton (eds.). Netherlands: Kluwer Academia Publishers Nitrogen fixation: From
molecules to crop productivity. 579–580.
Stellenbosch University https://scholar.sun.ac.za

108
de Andrade, A.S., da Silva, C.R. & Souza, C.F. 2010. Calibration of Diviner 2000 capacitance probe
in two soils of Piaui State , Brazil. The Third International Symposium on Soil Water
Measurement Using Capacitance, Impedance and TDT. Paper 1.5:1–10.
Decagon Devices. 2015. GS1: Soil moisture sensor. Vol. Novemeber. Pullman, WA: Decagon
Devices, Inc.
Decagon Devices. 2016. [Online], Available: https://en.freedownloadmanager.org/Windows-
PC/ECH2O-Utility-FREE.html.
Dente, L., Vekerdy, Z., Su, Z. & Wen, J. 2009. Continuous in situ soil moisture measurements at
Maqu site, Strasbourg, France. [Online], Available: ftp://ftp.itc.nl/ext/smapcalval/for Aquarius
CalVal/Maqu/ReportMaquMonitoringNetwork.pdf.
De Vita, P., Di Paolo, E., Fecondo, G., Di Fonzo, N. & Pisante, M. 2007. No-tillage and conventional
tillage effects on durum wheat yield, grain quality and soil moisture content in southern Italy.
Soil and Tillage Research. 92(1–2):69–78.
Díaz-Pérez, J.C. 2013. Bell pepper (Capsicum annum L.) crop as affected by Shade level:
Microenvironment, plant growth, leaf gas exchange, and leaf mineral nutrient concentration.
HortScience. 48(2):175–182.
Díaz-Pérez, J.C., Phatak, S.C., Giddings, D., Bertrand, D. & Mills, H.A. 2005. Root zone
temperature, plant growth, and fruit yield of tomatillo as affected by plastic film mulch.
HortScience. 40(5):1312–1319.
Dietzel, R., Liebman, M. & Archontoulis, S. 2017. A deeper look at the relationship between root
carbon pools and the vertical distribution of the soil carbon pool. SOIL Discussions.
(February):1–20.
Dodd, M.B. & Lauenroth, W.K. 1997. The influence of soil texture on the soil water dynamics and
vegetation structure of a shortgrass steppe ecosystem. Plant Ecology. 133(1):13–28.
D’Odorico, P. & Porporato, A. 2004. Preferential states in soil moisture and climate dynamics.
Proceedings of the National Academy of Sciences . 101(24):8848–8851.
Doering, E.J. 1965. Soil-water diffusivity by one-step method. Soil Science. 99(5):322–326.
Duan, L., Liu, T., Wang, X., Wang, G., Ma, L. & Luo, Y. 2011. Spatio-temporal variations in soil
moisture and physicochemical properties of a typical semiarid sand-meadow-desert landscape
as influenced by land use. Hydrology and Earth System Sciences. 15(6):1865–1877.
Stellenbosch University https://scholar.sun.ac.za
109
Engelbrecht, F.A., McGregor, J.L. & Engelbrecht, C.J. 2009. Dynamics of the conformal-cubic
atmospheric model projected climate-change signal over southern Africa. International Journal
of Climatology. 29:1013–1033.
Evett, S.R., Ruthardt, B.B., Kottkamp, S.T., Howell, T. A, Schneider, A.D. & Tolk, J.A. 2002. Accuracy
and precision of soil water measurements by neutron, capacitance, and TDR methods. 17th
World Congress of Soil ScienceTransactions. (59):318–1–318–8.
Fabrizzi, K.P., García, F.O., Costa, J.L. & Picone, L.I. 2005. Soil water dynamics, physical properties
and corn and wheat responses to minimum and no-tillage systems in the southern Pampas of
Argentina. Soil and Tillage Research. 81(1):57–69.
Fares, A., Hamdhni, H. & Jenkins, D.M. 2007. Temperature-dependent scaled frequency: Improved
accuracy of multisensor capacitance probes. Soil Science Society of America Journal.
71(3):894.
Fares, A., Abbas, F., Maria, D. & Mair, A. 2011. Improved calibration functions of three capacitance
probes for the measurement of soil moisture in tropical soils. Sensors. 11(5):4858–4874.
Fares, A., Safeeq, M., Awal, R., Fares, S. & Dogan, A. 2016. Temperature and probe-to-probe
variability effects on the performance of capacitance soil moisture sensors in a oxisol. Vadose
Zone Journal. 15(3):0.
Feng, S., Gu, S., Zhang, H. & Wang, D. 2017. Root vertical distribution is important to improve water
use efficiency and grain yield of wheat. Field Crops Research. 214(August):131–141.
Feng, X., Porporato, A. & Rodriguez-Iturbe, I. 2015. Stochastic soil water balance under seasonal
climates. Proceedings. Mathematical, physical, and engineering sciences / the Royal Society.
471(2174):20140623.
Fernandez-illescas, C.P., Porporato, A. & Rodriguez-iturbe, I. 2001. The ecohydrological role of soil
texture in a water-limited ecosystem. Water Resources Research. 37(12):2863–2872.
Fernández-Ugalde, O., Virto, I., Bescansa, P., Imaz, M.J., Enrique, A. & Karlen, D.L. 2009. No-tillage
improvement of soil physical quality in calcareous, degradation-prone, semiarid soils. Soil and
Tillage Research. 106(1):29–35.
Ferreras, L.A., Costa, J.L., Garcia, F.O. & Pecorari, C. 2000. Effect of no-tillage on some soil physical
properties of a structural degraded Petrocalcic Paleudoll of the southern “Pampa” of Argentina.
Soil and Tillage Research. 54(1–2):31–39.
Garbrecht, J., van Liew, M. & Brown, G.O. 2004. Trends in precipitation, streamflow, and
evapotranspiration in the Great Plains of the United States. Journal of Hydrologic Engineering.
9(5):360–367.
Stellenbosch University https://scholar.sun.ac.za

110
Gardner, W.R. 1958. Some steady-state solutions of the unsaturated moisture flow equation with
application to evaporation from a water table. Soil Science. 85(4):228–232.
Gardner, W.R. & Hillel, D.I. 1962. The relation of external evaporation conditions to the drying of soil.
Journal of Geophysics Research. 67:4319–4325.
Gardner, C.M.K., Laryea, K.B. & Unger, P.W. 1999. Soil physical constraints to plant growth and
crop production. Rome.
Gauer, E., Shaykewich, C.F. & Stobbe, E.H. 1982. Soil temperature and soil water under zero tillage
in Mantibo. Canadian Journal of Soil Science. 62:311–325.
Gee, G.W. & Or, D. 2002. 2.4 Particle-size analysis. In J.H. Dane & C.G. Topp (eds.). Madison, WI:
SSSA Book Ser. 5.4. SSSA Methods of soil analysis: Part 4 – Physical methods. 255–293.
Gentine, P., Entekhabi, D., Chehbouni, A., Boulet, G. & Duchemin, B. 2007. Analysis of evaporative
fraction diurnal behaviour. Agricultural and Forest Meteorology. 143(1–2):13–29.
Gong, W., Yan, X. & Wang, J. 2012. The effect of chemical fertilizer on soil organic carbon renewal
and CO2 emission-a pot experiment with maize. Plant and Soil. 353(1–2):85–94.
Gong, Y., Cao, Q. & Sun, Z. 2003. The effects of soil bulk density, clay content and temperature on
soil water content measurement using time-domain reflectometry. Hydrological Processes.
17(18):3601–6314.
Google Earth 2.7. 2016. [Online], Available: http://www.google.com/earth/index.html.
Goss, K.-U. & Madliger, M. 2007. Estimation of water transport based on in situ measurements of
relative humidity and temperature in a dry Tanzanian soil. Water Resources Research.
43(5):W05433.
Greb, B.W., Smika, D.E. & Black, A.L. 1967. Effect of straw mulch rates on soil water storage during
summer fallow in the Great Plains1. Soil Science Society of America Journal. 31(4):556.
Groves, S.J. & Rose, S.C. 2004. Calibration equations for Diviner 2000 capacitance measurements
of volumetric soil water content of six soils. Soil Use and Management. 20(1):96–97.
Gupta, J.P. 1986. Moisture and thermal regimes of the desert soils of Rajasthan, India, and their
management for higher plant production. Hydrological Sciences Journal. 31(3):347–359.
Haberland, J., Gálvez, R., Kremer, C. & Carter, C. 2014. Laboratory and field calibration of the
Diviner 2000 probe in two types of soil. Journal of Irrigation and Drainage Engineering.
140(4):4014004.
Stellenbosch University https://scholar.sun.ac.za

111
Haberland, J., Gálvez, R., Kremer, C., Zuñiga, C. & Rudolffi, Y. 2015. Accurate soil water content
monitoring in real time with approciate field calibration of the FDR device “Diviner 2000” in a
commercial table grape vineyard. International Journal of Science Environment and
Technology. 4(2):273–284.
Hacke, U.G., Sperry, J.S., Ewers, B.E., Ellsworth, D.S., Schäfer, K.V.R. & Oren, R. 2000. Influence
of soil porosity on water use in Pinus taeda. Oecologia. 124(4):495–505.
Hagan, R.M., Haise, T.W. & Edminster, T.W. 1967. Irrigation of agricultural lands. Madison, WI:
Agronomy Monography 11.
Haghighi Fashi, F., Gorji, M. & Sharifi, F. 2017. Least limiting water range for different soil
management practices in dryland farming in Iran. Archives of Agronomy and Soil Science.
63(13):1814–1822.
Hall, D.G.M., Reeve, M.J., Thomasson, A.J. & Wright, V.F. 1977. Water retention, porosity and
density of field soils. Dorking, Engalnd: Bartholomew Press.
Hanks, R.J., Bowers, S.A. & Bark, L.D. 1961. Influence of soil surface conditions on net radiation,
soil temperature, and evaporation. Soil Science. 91(4):233–238.
Harris, S.-R. 2006. Phosphorus sensitivity in species of Proteaceae (Protea obtusifolia;
Leucadendron coniferum; and Leucadendron salignum) from different soil habitats: Possible
candidates for growth on former agricultural soils high in P. M.Sc. thesis, University of Cape
Town, South Africa.
Hartge, K.-H. & Horn, R. 2016. Essential soil physics: an introduction to soil processes, functions,
structure and mechanics. 1st ed. R. Horton, R. Horn, J. Bachmann, & S. Peth (eds.). Stuttgart,
Germany: Schweizerbart Science Publishers.
Hassen, A.I., Bopape, F.L., Habig, J. & Lamprecht, S.C. 2012. Nodulation of rooibos (Aspalathus
linearis Burm. f.), an indigenous South African legume, by members of both the α-
Proteobacteria and β-Proteobacteria. Biology and Fertility of Soils. 48(3):295–303.
Hatting, A.J.L., Brand, J. & Thiebaut, N.M. 2011. Control of the clearwing moth, Monopetalotaxis
cadescens (Lepidoptera: Sessidae), on cultivated “rooibos”, Aspalathus linearis (Fabaceae), in
South Africa. African Entomology. 19(1):1–10.
Hawkins, H. & Cramer, M. 2013. Phosphorus toxicity in proteas: Symptoms and amelioration. Cape
Town.
Hawkins, H.J., Hettasch, H., Mesjasz-Przybylowicz, J., Przybylowicz, W. & Cramer, M.D. 2008.
Phosphorus toxicity in the Proteaceae: A problem in post-agricultural lands. Scientia
Horticulturae. 117(4):357–365.
Stellenbosch University https://scholar.sun.ac.za
112
Hawkins, H.J., Malgas, R. & Bienabe, E. 2011. Ecotypes of wild rooibos (Aspalathus linearis (Burm.
F) Dahlg., Fabaceae) are ecologically distinct. South African Journal of Botany. 77(2):360–370.
Hazelton, P. & Murphy, B. 2007. Interpreting Soil Test Results: What do all the Numbers mean?
European Journal of Soil Science. 58:1219–1220.
Hide, J.C. 1954. Observations of factors influencing the evaporation of soil moisture. Soil Science
Society of America Journal. 18(3):234–239.
Higuchi, M. 1985. Field observations and numerical experiments on a drying front in a volcanic ash
soil called Kanto loam. Journal of Hydrology. 77(3):253–262.
Hillel, D. 1980. Applications of soil physics. New York: Academic Press.
Hillel, D. 2004. Introduction to environmental soil physics. New York: Academic Press.
Hoffman, J.E. 1990. The influence of soil tillage practices on the soil water balance of an Avalon
Series soil under wheat production at Bethlehem [Afr]. M.Sc. thesis, Free Sate Unversity, South
Africa.
Hoffman, J.E. 1997. Quantification and prediction of soil water evaporation under dryland crop
production [Afr]. PhD thesis, Free State University, South Africa.
Hu, W., Shao, M.A., Wang, Q.J. & Reichardt, K. 2008. Soil water content temporal-spatial variability
of the surface layer of a Loess Plateau hillside in China. Scientia Agricola. 65(3):277–289.
Huang, M., Dang, T., Gallichand, J. & Goulet, M. 2003. Effect of increased fertilizer applications to
wheat crop on soil-water depletion in the Loess Plateau, China. Agricultural Water
Management. 58(3):267–278.
Huang, M., Shao, M., Zhang, L. & Li, Y. 2003. Water use efficiency and sustainability of different
long-term crop rotation systems in the Loess Plateau of China. Soil and Tillage Research.
72(1):95–104.
Hudson, B.D. 1994. Soil organic matter and available water capacity. Journal of Soil and Water
Conservation. 49(2):189–194.
Hultine, K.. R., Koepke, D.F., Pockman, W.T., Fravolini, A., Sperry, J.S. & Williams, D.G. 2005.
Influence of soil texture on hydraulic properties and water relations of a dominant warm-desert
phreatophyte. Tree Physiology. 26:313–323.
Idso, S.B., Reginato, R.J., Jackson, R.D., Kimball, B.A. & Nakayama, F.S. 1974. The three stages
of drying of a field soil. Soil Science Society of America Journal. 38(5):831–837.
Stellenbosch University https://scholar.sun.ac.za

113
Inkoom, S., Bonsu, M., Tuffour, H.O., Abubakari, A. & Aryee, D. 2015. Relantionship between soil
water diffusivity and evaporation: A study under different agricultural land use systems. Applied
Research Journal. 1(2):327–333.
Intrawech, A., Stone, L.R., Ellis, R. & Whitney, D.A. 1982. Influence of fertilizer nitrogen source on
soil physical and chemical properties1. Soil Science Society of America Journal. (46):832–836.
Jalota, S.K. & Prihar, S.S. 1990. Bare soil evaporation in relation to tillage. Advances in Soil Science.
12:187–216.
Johnson, J.M.F., Allmaras, R.R. & Reicosky, D.C. 2006. Estimating source carbon from crop
residues, roots and rhizodeposits using the national grain-yield database. Agronomy Journal.
98(3):622–636.
Jones, S.B., Blonquist, J.M., Robinson, D.A., Rasmussen, V.P. & Or, D. 2005. Standardizing
characterization of electromagnetic water content sensors. Vadose Zone Journal. 4(4):1059.
Joubert, E. & de Beer, D. 2011. Rooibos (Aspalathus linearis) beyond the farm gate: From herbal
tea to potential phytopharmaceutical. South African Journal of Botany. 77(4):869–886.
Joubert, E. & Schultz, H. 2006. Production and quality aspects of rooibos tea and related products.
A review. Journal of Applied Botany and Food Quality. 80:138–144. [Online], Available:
http://pub.jki.bund.de/index.php/JABFQ/article/view/2173.
Joubert, E., Gelderblom, W.C.A., Louw, A. & de Beer, D. 2008. South African herbal teas: Aspalathus
linearis, Cyclopia spp. and Athrixia phylicoides - A review. Journal of Ethnopharmacology.
119(3):376–412.
Joubert, M.E., Kotzé, W.A.G. & Wooldridge, J. 2007. Effect of liming and mineral nutrition on growth
of honeybush (Cyclopia spp.) plants. South African Journal of Plant and Soil. 24(3):161–165.
Jovanovic, N.Z., Jarmain, C., de Clercq, W.P., Vermeulen, T. & Fey, M. V. 2011. Total evaporation
estimates from a renosterveld and dryland wheat/fallow surface at the Voëlvlei nature reserve
(South Africa). Water SA. 37(4):471–482.
Kanu, S.A., Okonkwo, J.O. & Dakora, F.D. 2013. Aspalathus linearis (Rooibos tea) as potential
phytoremediation agent: A review on tolerance mechanisms for aluminum uptake.
Environmental Reviews. 21(2):85–92.
Kern, J.S. 1995. Geographic patterns of soil water-holding capacity in the contiguous United States.
Soil Science Society of America Journal. 59(4):1126.
Stellenbosch University https://scholar.sun.ac.za

114
Kinzli, K.-D., Manana, N. & Oad, R. 2012. Comparison of laboratory and field calibration of a soil-
moisture capacitance probe for various soils. Journal of Irrigation and Drainage Engineering.
138(4):310–321.
Klaassen, W., Bosveld, F. & de Water, E. 1998. Water storage and evaporation as constituents of
rainfall interception. Journal of Hydrology. 212–213(1–4):36–50.
Klute, A. 1986. Water retention: laboratory methods. In SSSA Book ed. A. Klute (ed.). Madison, WI
Methods of soil analysis: Part 1 – Physical and mineralogical methods. 635–662.
Kodešová, R., Kodeš, V. & Mráz, A. 2011. Comparison of two sensors ECH2O, EC-5 and SM200 for
measuring soil water content. Soil and Water Research. 6(2):102–110.
Kröbel, R., Campbell, C.A., Zentner, R.P., Lemke, R., Steppuhn, H., Desjardins, R.L. & De Jong, R.
2012. Nitrogen and phosphorus effects on water use efficiency of spring wheat grown in a semi-
arid region of the Canadian prairies. Canadian Journal of Soil Science. 92(4):573–587.
Kruger, S. 2014. Case Study : UTZ Certified Rooibos Farms in South Africa.
Lajtha, K., Bowden, R.D. & Nadelhoffer, K. 2014. Litter and Root Manipulations Provide Insights into
Soil Organic Matter Dynamics and Stability. Soil Science Society of America Journal.
78(S1):S261.
Lamb, A.J. & Klaussner, E. 1988. Response of the fynbos shrubs Protea repens and Erica plukenetii
to low levels of nitrogen and phosphorus applications. Suid-Afrikaanse Tydskrif vir Plantkunde.
54(6):558–564.
Lambers, H. & Shane, M.W. 2007. Role of root clusters in phosphorus acquisition and iIncreasing
biological diversity in agriculture. In J.H.J. Spiertz, P.C. Struik, & H.H. van Laar (eds.). Springer
Scale and Complexity in Plant Systems Research: Gene-Plant-Crop Relations. 237–250.
Lambers, H., Shane, M.W., Cramer, M.D., Pearse, S.J. & Veneklaas, E.J. 2006. Root structure and
functioning for efficient acquisition of phosphorus: Matching morphological and physiological
traits. Annals of Botany. 98(4):693–713.
Lamont, B.B. 2003. Structure, ecology and physiology of root clusters – A review. Plant & Soil.
248(1):1–19.
Lampurlanes, J., Angas, P. & Cantero-Martinez, C. 2001. Root growth, soil water content and yield
of barley under different tillage systems on two soils in semiarid conditions. Field Crops
Research. 69(1):27–40.
Laroussi, C., van der Voorde, G. & de Backer, L. 1975. Experimental investigation of the minimum.
Soil Science. 120(4):249–255.
Stellenbosch University https://scholar.sun.ac.za

115
Latta, J. & O’Leary, G.J. 2003. Long-term comparison of rotation and fallow tillage systems of wheat
in Australia. Field Crops Research. 83(2):173–190.
Lazzara, P. & Rana, G. 2010. The crop coefficient (Kc) values of the major crops grown under
Mediterranean climate. Italian Journal of Agrometeorology. 15(2):25–40.
Le Roux, J.J., Brown, N.A.C. & Leivers, S. 1992. Micropropagation of Aspalathus linearis through
bud multiplication. Plant Cell, Tissue and Organ Culture. 28(2):225–227.
Li, Y. & Shu, S. 1991. A comprehensive research on high efficient eco-economic system in
Wangdonggou watershed of Changwu county. Sci-Tech Document Press, Beijing, China. 1991.
Li, B., Wang, L., Kaseke, K.F., Li, L. & Seely, M.K. 2016. The impact of rainfall on soil moisture
dynamics in a foggy desert. PLoS ONE. 11(10).
Liang, A., Yang, X., Zhang, X., McLaughlin, N., Shen, Y. & Li, W. 2009. Soil organic carbon changes
in particle-size fractions following cultivation of Black soils in China. Soil and Tillage Research.
105(1):21–26.
Liu, C., Zhang, X. & Zhang, Y. 2002. Determination of daily evaporation and evapotranspiration of
winter wheat and maize by large-scale weighing lysimeter and micro-lysimeter. Agricultural and
Forest Meteorology. 111:109–120.
Liu, E., Yan, C., Mei, X., Zhang, Y. & Fan, T. 2013. Long-Term effect of manure and fertilizer on soil
organic carbon pools in dryland farming in Northwest China. PLoS ONE. 8(2).
Liu, Y., Li, S., Chen, F., Yang, S. & Chen, X. 2010. Soil water dynamics and water use efficiency in
spring maize (Zea mays L.) fields subjected to different water management practices on the
Loess Plateau, China. Agricultural Water Management. 97(5):769–775.
Lopes, M.S. & Reynolds, M.P. 2010. Partitioning of assimilates to deeper roots is associated with
cooler canopies and increased yield under drought in wheat. Functional Plant Biology.
37(2):147–156.
Lötter, D. 2015. Potential implications of climate change for Rooibos (A. linearis) production and
distribution in the greater Cederberg region, South Africa. PhD thesis, University of Cape Town,
South Africa.
Lötter, D. & le Maitre, D. 2014. Modelling the distribution of Aspalathus linearis (Rooibos tea):
Implications of climate change for livelihoods dependent on both cultivation and harvesting from
the wild. Ecology and Evolution. 4(8):1209–1221.
Stellenbosch University https://scholar.sun.ac.za

116
Lötter, D., van Garderen, E.A., Tadross, M. & Valentine, A.J. 2014. Seasonal variation in the nitrogen
nutrition and carbon assimilation in wild and cultivated Aspalathus linearis (rooibos tea).
Australian Journal of Botany. 62(1):65–73.
Lötter, D., Valentine, A.J., Archer Van Garderen, E. & Tadross, M. 2014. Physiological responses of
a fynbos legume, Aspalathus linearis to drought stress. South African Journal of Botany.
94:218–223.
Lu, N., Chen, S., Wilske, B., Sun, G. & Chen, J. 2011. Evapotranspiration and soil water relationships
in a range of disturbed and undisturbed ecosystems in the semi-arid Inner Mongolia, China.
Journal of Plant Ecology. 4(1–2):49–60.
Luo, Y.Q., Zhao, X.Y., Andrén, O., Zhu, Y.C. & Huang, W.D. 2014. Artificial root exudates and soil
organic carbon mineralization in a degraded sandy grassland in northern China. Journal of Arid
Land. 6(4):423–431.
Malgas, R. & Oettle, N. 2007. The sustainable harvest of wild rooibos. Environmental Monitroing
Group Trust. 1–32.
Malgas, R.R., Potts, A.J., Oettle, N.M., Koelle, B., Todd, S.W., Verboom, G.A. & Hoffman, M.T. 2010.
Distribution, quantitative morphological variation and preliminary molecular analysis of different
growth forms of wild rooibos (Aspalathus linearis) in the northern Cederberg and on the
Bokkeveld Plateau. South African Journal of Botany. 76(1):72–81.
Maliva, R. & Missimer, T. 2012. Aridity and drought. In Berlin Heidelberg: Springer-Verlag Arid lands
water evaluation and management. 21–40.
Manrique, L.A. 1988. Effects of rainfall and cover on soil temperatures of an isohyperthermic
temperature regime, Panama. Geoderma. 42:129–146.
Matimati, I., Verboom, A.G. & Cramer, M.D. 2014. Do hydraulic redistribution and nocturnal
transpiration facilitate nutrient acquisition in Aspalathus linearis? Oecologia. 175(4):1129–1142.
McBride, M.B. 1994. Soil acidity. In New York: Oxford University Press, Inc. Environmental chemistry
of soils.
Meek, B., Graham, L. & Donovan, T. 1982. Long-term effects of manure on soil nitrogen,
phosphorus, potassium, sodium, organic matter, and water infiltration rate. Soil Science Society
of America Journal. 46:1014–1019.
Metwally, S.Y. & Pollard, A.G. 1959. Effects of soil moisture conditions on the uptake of plant
nutrients by barley and on the nutrient content of the soil solution. Journal of the Science of
Food and Agriculture. 10(11):632–636.
Stellenbosch University https://scholar.sun.ac.za

117
Misra, A. & Tyler, G. 1999. Influence of soil moisture on soil solution chemistry and concentrations
of minerals in the calcicoles Phleum phleoides and Veronica spicata grown on a limestone soil.
Annals of Botany. 84(3):401–410.
Mohamed, B.A., Ellis, N., Kim, C.S., Bi, X. & Emam, A.E. 2016. Engineered biochar from microwave-
assisted catalytic pyrolysis of switchgrass for increasing water-holding capacity and fertility of
sandy soil. Science of the Total Environment. 566–567:387–397.
Morgan, K.T., Parsons, L.R. & Adair Wheaton, T. 2001. Comparison of laboratory- and field-derived
soil water retention curves for a fine sand soil using tensiometric, resistance and capacitance
methods. Plant and Soil. 234(2):153–157.
Morlat, R. & Symoneaux, R. 2008. Long-term additions of organic amendments in a Loire Valley
vineyard on a calcareous sandy soil. III. Effects on fruit composition and chemical and sensory
characteristics of cabernet franc wine. American Journal of Enology and Viticulture. 59(4):375–
386.
Morton, J.F. 1983. Rooibos tea, Aspalathus linearis, a caffeineless, low-tannin beverage. Economic
Botany. 37(2):164–173.
Muofhe, M.L. & Dakora, F.D. 1999. Nitrogen nutrition in nodulated field plants of the shrub tea
legume Aspalathus linearis assessed using 15N natural abundance. Plant and Soil.
209(2):181–186.
Muofhe, M.L. & Dakora, F.D. 2000. Modification of rhizosphere pH by the symbiotic legume
Aspalathus linearis growing in a sandy acidic soil. Australian Journal of Plant Physiology.
27(12):1169.
Musick, J.T., Jones, O.R., Stewart, B.A. & Dusek, D.A. 1994. Water-yield relationships for irrigated
and dryland wheat in the U.S. Southern Plains. Agronomy Journal. 86(6):980.
Myburgh, P.A., van Zyl, J.L. & Conradie, W.J. 1996. Effect of soil depth on growth and water
consumption of young Vitis vinifera L. cv. Pinot noir. South African Journal of Enology and
Viticulture. 17(2):53–62.
Nakicenovic, N. & Swart, R. 2000. Special report on emissions scenarios: A special report of working
group III of the Intergovernmental Panel on Climate Change. Vol. 1. Cambrigde, U.K.:
Cambrigde University Press.
Nemali, K.S., Montesano, F., Dove, S.K. & van Iersel, M.W. 2007. Calibration and performance of
moisture sensors in soilless substrates: ECH2O and Theta probes. Scientia Horticulturae.
112(2):227–234.
Stellenbosch University https://scholar.sun.ac.za

118
Neves, C.S.V.J., Feller, C., Guimarães, M.F., Medina, C.C., Tavares Filho, J. & Fortier, M. 2003.
Soil bulk density and porosity of homogeneous morphological units identified by the Cropping
Profile Method in clayey Oxisols in Brazil. Soil and Tillage Research. 71(2):109–119.
Or, D. & Wraith, J.M. 1999. Temperature effects on soil bulk dielectric permittivity measured by time
domain reflectometry: A physical model. Water Resources Research. 35(2):371–383.
Paige, G.B. & Keefer, T.O. 2008. Comparison of field performance of multiple soil moisture sensors
in a semi-arid rangeland. Journal of the American Water Resources Association. 44(1):121–
135.
Palmer, A.R. & Yunusa, I.A.M. 2011. Biomass production, evapotranspiration and water use
efficiency of arid rangelands in the Northern Cape, South Africa. Journal of Arid Environments.
75(11):1223–1227.
Parton, W.J. & Logan, J.A. 1981. A model for diurnal variation in soil and air temperature. Agricultural
Meteorology. 23(C):205–216.
Parvin, N. & Degré, A. 2016. Soil-specific calibration of capacitance sensors considering clay content
and bulk density. Soil Research. 54(1):111–119.
Parwada, C. & van Tol, J. 2017. Stability of soil organic matter and soil loss dynamics under short-
term soil moisture change regimes. Agrotechnology. 6(2).
Pedram, S., Wang, X., Liu, T. & Duan, L. 2017. Simulated dynamics of soil water and pore vapor in
a semiarid sandy ecosystem. Journal of Arid Environments. (February).
Peterson, L.W., Jacobsen, O.H., Plauborg, F., Anderson, M. & Rolston, D.E. 1995. The effects of
temperature on the determination of soil-water content by time-domain reflectometry. In St.
Louis: Soil Science Society of America Annual Meeting.
Porporato, A., Daly, E. & Rodriguez-Iturbe, I. 2004. Soil water balance and ecosystem response to
climate change. The American Naturalist. 164(5):625–632.
Poulovassilis, A. & Psychoyou, M. (in press). Steady-state evaporation from layered soils. Soil
Science. 140(6). [Online] ,Available:
http://journals.lww.com/soilsci/Fulltext/1985/12000/Steady_State_Evaporation_From_Layered
_Soils.1.aspx.
Power, J.F., Wilhelm, W. & Doran, J.W. 1986. Crop residue effects on soil environment and dryland
maize and soya bean production. Soil & Tillage Research. 8:101–111. [Online], Available:
http://digitalcommons.unl.edu/usdaarsfacpub/115%0A.
Stellenbosch University https://scholar.sun.ac.za

119
Provenzano, G., Rallo, G. & Ghazouani, H. 2016. Assessing field and laboratory calibration protocols
for the Diviner 2000 probe in a range of soils with different textures. Journal of Irrigation and
Drainage Engineering. 142(2):4015040.
Qin, W., Chi, B. & Oenema, O. 2013. Long-term monitoring of rainfed wheat yield and soil water at
the loess plateau reveals low water use efficiency. PLoS ONE. 8(11).
Quantum GIS Development Team. 2017. [Online], Available: http://qgis.osgeo.org.
Rawls, W.J., Brakensiek, D.L. & Saxton, K.E. 1982. Estimation of soil water properties. Transactions
of the ASAE. 25(5):1316–1320 and 1328.
Rawls, W.J., Pachepsky, Y.A., Ritchie, J.C., Sobecki, T.M. & Bloodworth, H. 2003. Effect of soil
organic carbon on soil water retention. Geoderma. 116(1–2):61–76.
Remson, I., Randolph, J.R. & Barksdale, H.C. 1960. The zone of aeration and ground-water
recharge in sandy sediments at Soil Science. 89(3):145–156.
Ren, X., Sun, D. & Wang, Q. 2016. Modeling the effects of plant density on maize productivity and
water balance in the Loess Plateau of China. Agricultural Water Management. 171:40–48.
Richards, M.B. 1993. Soil factors and competition as determinants of fynbos plant species
distribution in the South-Western Cape. M.Sc. thesis, University of Cape Town, South Africa.
Rooibos Ltd. 2016. Production Process. [Online], Available: http://www.rooibosltd.co.za/Rooibos-
background- production-process.php.
Rose, D.A. 1968. Water movement in porous materials III. Evaporation of water from soil. Journal of
Physics D: Applied Physics. 1(12):1779–1791.
Rose, D.A., Konukcu, F. & Gowing, J.W. 2005. Effect of watertable depth on evaporation and salt
accumulation from saline groundwater. Australian Journal of Soil Research. 43(5):565–573.
Rosenbaum, U., Huisman, J.A., Vrba, J., Vereecken, H. & Bogena, H.R. 2011. Correction of
temperature and electrical conductivity effects on dielectric permittivity measurements with
ECH2O sensors. Vadose Zone Journal. 10(2):582.
RoTimi Ojo, E., Bullock, P.R. & Fitzmaurice, J. 2015. Field performance of five soil moisture
instruments in heavy clay soils. Soil Science Society of America Journal. 79(1):20.
Rowlandson, T.L., Berg, A.A., Bullock, P.R., Ojo, E.R.T., McNairn, H., Wiseman, G. & Cosh, M.H.
2013. Evaluation of several calibration procedures for a portable soil moisture sensor. Journal
of Hydrology. 498:335–344.
RStudio Team. 2017. [Online], Available: http://www.rstudio.com/.
Stellenbosch University https://scholar.sun.ac.za

120
Rundel, P.W. & Cowling, R.M. 2013. Mediterranean-climate ecosystems. Encyclopedia of
Biodiversity. (September 2016):212–222.
Saito, T., Fujimaki, H. & Inoue, M. 2008. Calibration and simultaneous monitoring of soil water
content and salinity with capacitance and four-electrode probes. American Journal of
Environmental Sciences. 4(6):683–692.
Sakaki, T., Limsuwat, A., Smits, K.M. & Illangasekare, T.H. 2010. Empirical two-point α-mixing model
for calibrating the ECH2O and EC-5 soil moisture sensor in sands. Water Resources Research.
46(4):1–8.
SARC. 2016. Rooibos industry fact sheet 2016. Clanwilliam. [Online], Available:
http://sarooibos.co.za/wp/wp-content/uploads/2016/10/20160930-SARC-Fact-Sheet-final.pdf.
Sentek. 2007. Sentek Diviner 2000 user guide version 2.1. Australia: Sentek Pty Ltd.
SigmaPlot Team. 2014. [Online], Available: www.systatsoftware.com%0Afrom.
Smika, D.E. 1970. Summer fallow for dryland winter wheat in the semiarid Great Plains1. Agronomy
Journal. 62(1):15.
Smit, W.A. & Know-Davies, P.S. 1989. Die-back of rooibos tea caused by Diaporthe phaseolorum.
Phytophylactica. 21:183–188.
Smith, J.F.N. 2014. Investigation of soil quality (health) in commercial production of rooibos tea
(Aspalathus linearis) in the Western Cape , South Africa. M.Sc. thesis, University of
Stellenbosch, South Africa.
Soil Classification Working Group. 1991. Soil classification - A taxonomic system for Sout Africa.
Pretoria: Department of Agricultural Development.
Song, C.Y., Zhang, X.Y., Liu, X.B., Sui, Y.Y. & Li, Z.L. 2010. Impact of long term fertilization on soil
water content in Haploborolls. 2010(2008):408–411.
Spies, C.F.J. 2005. The inoculum ecology of Botrytis cinerea in Rooibos nurseries. PhD thesis,
University of Stellenbosch, South Africa.
Sprent, J.I., Odee, D.W. & Dakora, F.D. 2010. African legumes: A vital but under-utilized resource.
Journal of Experimental Botany. 61(5):1257–1265.
Sriboon, W., Tuntiwaranuruk, U. & Sanoamuang, N. 2017. Hourly soil temperature and moisture
content variations within a concrete pipe container for planting lime trees in Eastern Thailand.
Case Studies in Thermal Engineering. 10(June):192–198.
Stellenbosch University https://scholar.sun.ac.za
121
Stassen, P.J.C. 1987. Aspalathus linearis (rooibostee): Die invloed van oespraktyke op sekere
vegetatiewe en fisiologiese aspekete. PhD thesis, University of Pretoria, South Africa.
Stewart, B.A. & Peterson, G.A. 2015. Managing green water in dryland agriculture. Agronomy
Journal. 107(4):1544–1553.
Subhan, A., Khan, Q.U., Mansoor, M. & Khan, M.J. 2017. Effect of organic and inorganic fertilizer
on the water use efficiency and yield atributes of wheat under heavy textured soil. Sarhad
Journal of Agriculture. 33(4):582–590.
Tedeschi, A., Huang, C.H., Zong, L., You, Q.G. & Xue, X. 2014. Calibration equations for Diviner
2000 capacitance measurements of volumetric soil water content in salt-affected soils. Soil
Research. 52(4):379–387.
Tester, C.F. 1990. Organic amendment effects on physical and chemical properties of a sandy soil.
Soil Science Society of America Journal. 54(3):827.
The Fertiliser Association of South Africa. 2007. Fertilisation manual. 7th ed. Lynnwoodrif: FSSA-
MVSA.
Tracy, S.R., Black, C.R., Roberts, J.A., Sturrock, C., Mairhofer, S., Craigon, J. & Mooney, S.J. 2012.
Quantifying the impact of soil compaction on root system architecture in tomato (Solanum
lycopersicum) by X-ray micro-computed tomography. Annals of Botany. 110(2):511–519.
Tromp-van Meerveld, H.J. & McDonnell, J.J. 2006. On the interrelations between topography, soil
depth, soil moisture, transpiration rates and species distribution at the hillslope scale. Advances
in Water Resources. 29(2):293–310.
Turner, N.C. 2004. Agronomic options for improving rainfall-use efficiency of crops in dryland farming
systems. Journal of Experimental Botany. 55(407):2413–2425.
Unger, P.W. 1976. Surface residue, water application, and soil texture effects on water accumulation.
Soil Science Society of America Journal. 40(2):298–300.
Unger, P.W. & Phillips, R.E. 1973. Soil water evaporation and storage. In Conservation Tillage
Conference. 42–54.
United States Department of Agriculture. 1987. USDA textural soil classification. Soil Mechanics
Level I Module 3 - USDA Textural Soil Classification. 1–53.
Unland, H.E., Houser, P.R., Shuttleworth, W.J. & Yang, Z.-L. 1996. Surface flux measurement and
modeling at a semi-arid Sonoran Desert site. Agricultural and Forest Meteorology. 82(1–
4):119–153.
Stellenbosch University https://scholar.sun.ac.za

122
USDA. 1998. Inherent factors affecting bulk density and available water capacity. [Online], Available:
https://www.nrcs.usda.gov/Internet/FSE_DOCUMENTS/nrcs142p2_053260.pdf.
van der Bank, M., van der Bank, F.H. & Wyk, B.E. 1999. Evolution of sprouting versus seeding in
Aspalathus linearis. Plant Systematics and Evolution. 219(1–2):27–38.
van Duivenbooden, N., Pala, M., Studer, C., Bielders, C.L. & Beukes, D.J. 2000. Cropping systems
and crop complementarity in dryland agriculture to increase soil water use efficiency: A review.
NJAS - Wageningen Journal of Life Sciences. 48(3):213–236.
van Gestel, N.C., Reischke, S. & Bååth, E. 2013. Temperature sensitivity of bacterial growth in a hot
desert soil with large temperature fluctuations. Soil Biology and Biochemistry. 65:180–185.
van Keulen, H. & Hillel, D. 1974. A simulation study of the drying-front phenomenon. Soil Science.
118(4):1974.
van Wesenbeeck, I.J. & Kachanoski, R.G. 1988. Spatial and temporal distribution of soil water in the
tilled layer under a corn crop. Soil Science Society of America Journal. 52:363–368.
Varble, J.L. & Chávez, J.L. 2011. Performance evaluation and calibration of soil water content and
potential sensors for agricultural soils in eastern Colorado. Agricultural Water Management.
101(1):93–106.
Ventura, F., Facini, O., Piana, S. & Rossi Pisa, P. 2010. Soil moisture measurements: A comparison
of instrumentation performances. Journal of Irrigation and Drainage Engineering.
136(FEBRUARY 2010):81–89.
Verburg, K., Bond, W.J. & Hunt, J.R. 2012. Fallow management in dryland agriculture: Explaining
soil water accumulation using a pulse paradigm. Field Crops Research. 130:68–79.
Volschenk, T. 2017. Evapotranspiration and crop coefficients of Golden Delicious/M793 apple trees
in the Koue Bokkeveld. Agricultural Water Management. 194:184–191.
Vorster, A.H. 2015. Influence of tillage and cropping sequence on the soil physical properties, water
balance and water use efficiency of wheat (Triticum aestivum L.) and canola (Brassica napus)
under rainfed-conditions in the Rȗens sub-region of the Western Cape. M.Sc. thesis,
Stellenbosch University, South Africa.
Wang, X. 2015. Vapor flow resistance of dry soil layer to soil water evaporation in arid environment:
An overview. Water (Switzerland). 7(8):4552–4574.
Wang, X. & Melesse, A.M. 2006. Effects of Statsgo and Ssurgo as inputs on Swat Model’S Snowmelt
Simulation 1. Journal of the American Water Resources Association. 42:1217–1236.
Stellenbosch University https://scholar.sun.ac.za

123
Wang, Q., Shao, M. & Horton, R. 2004. A simple method for estimating water diffusivity of
unsaturated soils. Soil Sci Soc Am J. 68(3):713–718. [Online], Available:
http://soil.scijournals.org/cgi/content/abstract/soilsci;68/3/713.
Wang, T., Zlotnik, V.A., Wedin, D. & Wally, K.D. 2008. Spatial trends in saturated hydraulic
conductivity of vegetated dunes in the Nebraska Sand Hills: Effects of depth and topography.
Journal of Hydrology. 349(1–2):88–97.
Wang, X., Jia, Z., Liang, L., Yang, B., Ding, R., Nie, J. & Wang, J. 2016. Impacts of manure
application on soil environment, rainfall use efficiency and crop biomass under dryland farming.
Scientific Reports. 6(April 2015):1–8.
Watt, M. & Evans, J.R. 1999. Proteoid roots. Physiology and development. Plant Physiology.
121(2):317–323.
White, R.G. & Kirkegaard, J.A. 2010. The distribution and abundance of wheat roots in a dense,
structured subsoil - Implications for water uptake. Plant, Cell and Environment. 33(2):133–148.
Witkowski, E.T.F. & Mitchell, D.T. (in press). The effects of nutrient additions on above-ground
phytomass and its phosphorus and nitrogen contents of sand-plain lowland fynbos. South
African Journal of Botany. 55(2):243 249.
Wort, D.J. 1940. Soil temperature and growth of marquis wheat. Plant Physiology. 15(2):335–342.
Wythers, K.R., Lauerroth, W.K. & Paruelo, J.M. 1999. Bare soil evaporation under semi-arid field
conditions. Soil Science Society of America Journal. 63(5):1341–1349.
Xiao, X., Horton, R., Sauer, T.J., Heitman, J.L. & Ren, T. 2011. Cumulative soil water evaporation
as a function of depth and time. Vadose Zone Journal. 10(3):1016.
Yamanaka, T. & Yonetani, T. 1999. Dynamics of the evaporation zone in dry sandy soils. Journal of
Hydrology. 217(1–2):135–148.
Yang, L., Wei, W., Chen, L., Jia, F. & Mo, B. 2012. Spatial variations of shallow and deep soil
moisture in the semi-arid Loess Plateau, China. Hydrology and Earth System Sciences.
16(9):3199–3217.
Zeng, Y., Su, Z., Wan, L., Yang, Z., Zhang, T., Tian, H., Shi, X., Wang, X. & Cao, W. 2009. Diurnal
pattern of the drying front in the desert and its application for determining the effective
infiltration. Hydrology and Earth System Sciences Discussions. 6(1):1021–1054.
Zhang, D., Yao, P., Na, Z., Cao, W., Zhang, S., Li, Y. & Gao, Y. 2016. Soil water balance and water
use efficiency of dryland wheat in different precipiration years in response te green manure
approach. Scientific Reports. 6(1):1–12.
Stellenbosch University https://scholar.sun.ac.za

124
Zhang, S., Sadras, V., Chen, X. & Zhang, F. 2013. Water use efficiency of dryland wheat in the
Loess Plateau in response to soil and crop management. Field Crops Research. 151:9–18.
Zhang, S., Yang, X. & Lovdahl, L. 2016. Soil management pratice effect on water balance of a
dryland soil during fallow period on the Loess Plateau of China. Soil and Water Research.
11(1):64–73.
Stellenbosch University https://scholar.sun.ac.za

125
Appendix A: Climatic data Table A.1: Climate data of air temperature and rainfall for the 2016/17 growing season.
Month Units Air temperature
(°C)
Rain
(mm)
July
Average 11.7 1.3
Total 316.5 34.2
Highest 18.1 9.9
Lowest 7.9 0.0
August
Average 15.4 0.7
Total 478.4 20.7
Highest 24.1 7.2
Lowest 8.0 0.0
September
Average 14.0 0.8
Total 418.8 24.6
Highest 20.7 10.8
Lowest 9.7 0.0
October
Average 16.9 0.1
Total 523.7 3.0
Highest 24.2 3.0
Lowest 10.1 0.0
November
Average 20.3 0.1
Total 610.2 3.0
Highest 29.0 3.0
Lowest 14.4 0.0
December
Average 33.9 0.4
Total 1051.9 13.5
Highest 47.9 7.8
Lowest 21.2 0.0
January
Average 23.3 0.0
Total 722.8 0.9
Highest 29.5 0.9
Lowest 17.2 0.0
February
Average 23.7 0.0
Total 663.8 0.3
Highest 28.9 0.3
Lowest 16.7 0.0
March
Average 22.8 0.0
Total 707.2 0.0
Highest 30.3 0.0
Lowest 16.5 0.0
April
Average 21.0 0.2
Total 628.9 2.4
Highest 26.8 2.4
Lowest 12.1 0.0
Stellenbosch University https://scholar.sun.ac.za

126
Appendix B: Diffusivity coefficients Table B.1: Average volumetric water content and average diffusivity coefficients for July 2016 for the bare treatment on the deep soils.
Days Rainfall (mm) Average volumetric water content (mm)
Average diffusivity coefficients (mm2.day-1)
5 cm
15 cm
25 cm
5 cm
15 cm
25 cm
5–25 cm
1 3 9.11 8.11 9.35 -887.79 -788.47 -805.23 -827.16 2 2.1 12.60 9.47 10.05 418.03 404.27 418.17 413.49 3 0 9.94 8.81 9.95 154.67 150.71 157.00 154.13 4 0 9.32 8.53 9.77 96.73 94.75 99.00 96.83 5 0 8.99 8.37 9.66 75.21 73.93 77.33 75.49 6 0 8.76 8.26 9.56 63.34 62.38 65.31 63.68 7 0 8.60 8.16 9.46 64.62 63.80 66.81 65.08 8 0 8.43 8.07 9.36 54.93 54.42 56.99 55.45 9 0 8.28 8.01 9.29 58.88 58.63 61.44 59.65
10 0 8.06 7.95 9.22 85.96 86.40 90.52 87.62 11 0.3 7.73 7.87 9.12 71.74 72.56 75.95 73.42 12 0 7.50 7.81 9.02 32.59 33.05 34.58 33.41 13 0 7.43 7.80 8.97 29.14 29.66 31.06 29.95 14 0 7.31 7.78 8.97 43.55 44.61 46.70 44.95 15 0 7.13 7.76 8.94 42.99 44.27 46.32 44.53 16 6.3 6.97 7.74 8.89 -1129.52 -1043.19 -1052.19 -1074.97 17 4.2 11.28 9.44 9.65 -268.19 -252.87 -259.97 -260.34 18 0 11.67 9.98 10.79 318.54 310.82 324.49 317.95 19 0 9.92 9.13 10.49 166.37 163.69 171.91 167.32 20 0 9.23 8.75 10.19 101.07 99.83 105.12 102.01 21 6.6 8.88 8.52 9.99 -37.93 -36.59 -38.44 -37.65 22 0.6 9.48 8.48 9.85 -668.68 -620.37 -643.63 -644.23 23 9.9 11.85 9.87 10.86 -688.55 -634.50 -678.42 -667.16 24 1.2 13.19 10.77 12.76 -321.72 -309.93 -342.00 -324.55 25 0 12.06 10.76 14.09 659.73 649.07 696.77 668.53 26 0 10.00 9.36 12.07 329.13 325.40 349.45 334.66
Stellenbosch University https://scholar.sun.ac.za

127
Table B.2: Average volumetric water content and average diffusivity coefficients for August 2016 for the bare treatment on the deep soils.
Days Rainfall (mm) Average volumetric water content (mm)
Average diffusivity coefficients (mm2.day-1)
5 cm
15 cm
25 cm
5 cm
15 cm
25 cm
5–25 cm
1 0 9.00 8.67 10.76 120.32 119.27 127.52 122.37 2 0.9 8.77 8.50 10.46 -1007.54 -933.69 -1007.77 -983.00 3 7.2 12.08 10.04 12.08 354.39 343.63 365.46 354.49 4 0.3 10.41 9.36 11.44 254.02 249.47 265.91 256.47 5 0 9.49 8.92 10.91 147.39 145.44 155.14 149.32 6 0 9.08 8.67 10.58 100.79 99.72 106.40 102.30 7 0 8.81 8.50 10.36 89.38 88.63 94.47 90.83 8 0 8.61 8.36 10.16 51.23 50.80 54.11 52.04 9 0 8.52 8.28 10.02 38.48 38.19 40.65 39.10
10 0 8.43 8.22 9.93 60.74 60.62 64.48 61.95 11 0 8.20 8.15 9.82 108.73 109.79 116.62 111.71 12 0 7.76 8.03 9.66 69.99 71.18 75.54 72.24 13 3.6 7.53 7.99 9.55 -403.53 -393.89 -415.14 -404.18 14 0 9.26 8.64 9.96 122.39 120.31 126.40 123.03 15 0 8.88 8.39 9.77 88.39 87.15 91.76 89.10 16 0 8.60 8.21 9.61 42.33 41.80 44.09 42.74 17 0 8.46 8.12 9.54 51.42 51.11 53.99 52.17 18 0 8.20 8.03 9.49 107.99 108.98 115.01 110.66 19 0 7.69 7.94 9.36 92.63 94.71 99.90 95.75 20 4.8 7.28 7.88 9.25 -192.09 -193.32 -203.19 -196.20 21 0.9 8.07 8.24 9.47 -489.19 -474.68 -498.94 -487.60 22 0 9.79 9.03 10.28 230.64 225.98 236.11 230.91 23 0 9.11 8.52 9.78 96.81 95.17 99.80 97.26 24 0 8.78 8.31 9.60 57.09 56.24 59.11 57.48 25 0 8.58 8.17 9.50 73.60 73.12 76.87 74.53 26 0 8.25 8.07 9.39 111.48 112.82 118.59 114.29 27 0 7.65 7.98 9.28 120.56 124.51 130.86 125.31 28 0 7.04 7.89 9.15 98.24 103.11 108.34 103.23 29 0 6.55 7.81 9.03 92.11 97.94 102.82 97.62 30 0 6.16 7.73 8.90 93.33 100.55 105.43 99.77
Stellenbosch University https://scholar.sun.ac.za

128
Table B.3: Average volumetric water content and average diffusivity coefficients for September 2016 for the bare treatment on the deep soils.
Days Rainfall (mm) Average volumetric water content (mm)
Average diffusivity coefficients (mm2.day-1)
5 cm
15 cm
25 cm
5 cm
15 cm
25 cm
5–25 cm
1 0.3 6.13 7.75 8.70 -80.18 -84.09 -87.26 -83.84 2 0 6.68 7.83 8.69 26.63 27.87 28.95 27.81 3 0 6.64 7.77 8.67 38.31 40.25 41.90 40.15 4 0 6.49 7.71 8.67 17.20 18.18 18.87 18.08 5 1.8 6.42 7.78 8.64 -72.60 -76.01 -78.50 -75.70 6 0.3 6.80 7.91 8.66 54.07 56.58 58.44 56.36 7 0 6.69 7.81 8.57 71.08 74.86 77.40 74.44 8 0 6.44 7.71 8.49 5.90 6.21 6.40 6.17 9 0 6.50 7.73 8.44 6.13 6.44 6.63 6.40
10 0 6.55 7.72 8.41 43.82 46.27 47.80 45.96 11 0.9 6.35 7.66 8.41 75.58 80.47 83.22 79.76 12 0 6.06 7.56 8.33 56.77 60.84 63.00 60.20 13 0 5.86 7.50 8.28 50.74 54.72 56.83 54.10 14 0 5.66 7.43 8.27 79.13 85.99 89.54 84.89 15 6 5.37 7.31 8.20 -701.00 -719.80 -768.75 -729.85 16 0 7.48 8.05 9.40 -125.24 -126.64 -132.61 -128.16 17 0 8.05 8.33 9.44 213.76 219.69 227.60 220.35 18 0 7.36 8.07 8.97 138.03 144.30 149.50 143.94 19 0 6.81 7.92 8.77 116.68 124.09 128.60 123.13 20 0 6.29 7.80 8.63 111.02 119.65 123.96 118.21 21 1.8 5.86 7.66 8.47 80.88 87.78 90.90 86.52 22 0 5.63 7.55 8.33 41.60 45.17 46.75 44.50 23 0 5.58 7.48 8.23 35.02 38.03 39.46 37.50 24 0 5.52 7.41 8.21 45.73 49.76 51.82 49.10 25 0.6 5.39 7.31 8.18 96.36 105.52 110.30 104.06 26 10.8 5.07 7.14 8.08 -2423.57 -2385.98 -2799.49 -2536.35 27 0 9.93 9.64 12.40 322.10 322.27 345.47 329.95 28 0 8.93 8.95 10.99 151.90 152.37 162.72 155.66 29 0 8.49 8.58 10.38 113.13 114.48 122.22 116.61
Stellenbosch University https://scholar.sun.ac.za
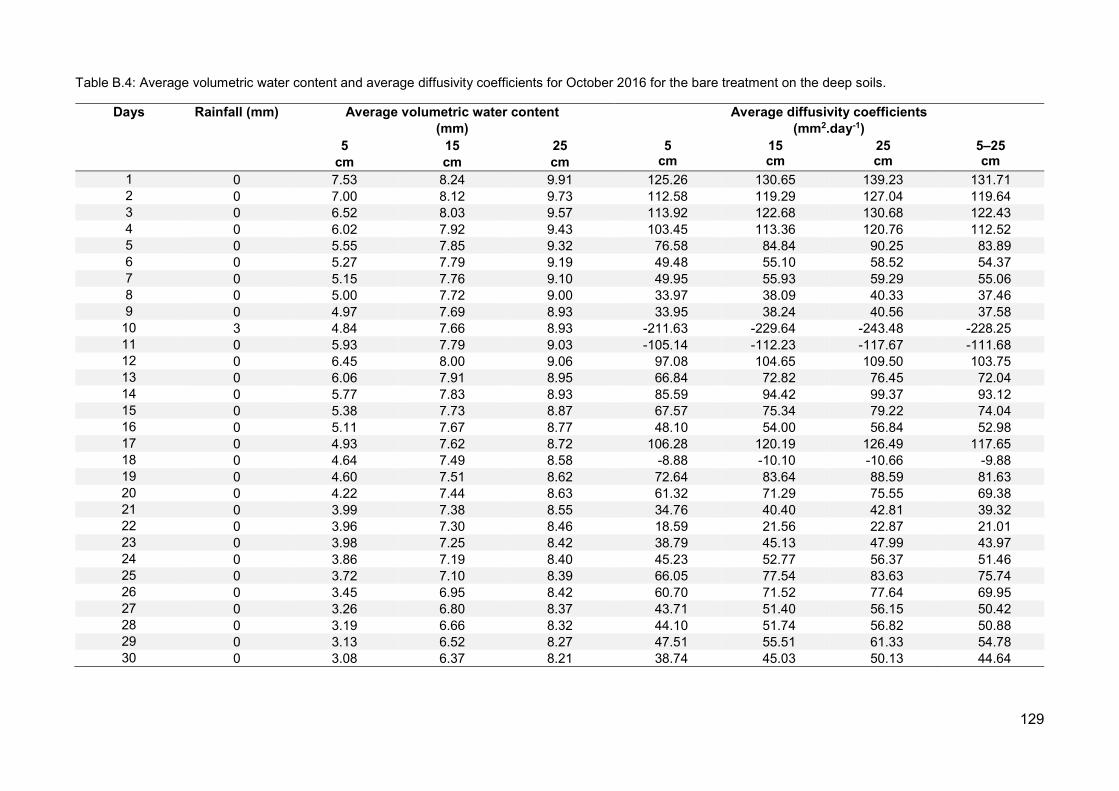
129
Table B.4: Average volumetric water content and average diffusivity coefficients for October 2016 for the bare treatment on the deep soils.
Days Rainfall (mm) Average volumetric water content (mm)
Average diffusivity coefficients (mm2.day-1)
5 cm
15 cm
25 cm
5 cm
15 cm
25 cm
5–25 cm
1 0 7.53 8.24 9.91 125.26 130.65 139.23 131.71 2 0 7.00 8.12 9.73 112.58 119.29 127.04 119.64 3 0 6.52 8.03 9.57 113.92 122.68 130.68 122.43 4 0 6.02 7.92 9.43 103.45 113.36 120.76 112.52 5 0 5.55 7.85 9.32 76.58 84.84 90.25 83.89 6 0 5.27 7.79 9.19 49.48 55.10 58.52 54.37 7 0 5.15 7.76 9.10 49.95 55.93 59.29 55.06 8 0 5.00 7.72 9.00 33.97 38.09 40.33 37.46 9 0 4.97 7.69 8.93 33.95 38.24 40.56 37.58
10 3 4.84 7.66 8.93 -211.63 -229.64 -243.48 -228.25 11 0 5.93 7.79 9.03 -105.14 -112.23 -117.67 -111.68 12 0 6.45 8.00 9.06 97.08 104.65 109.50 103.75 13 0 6.06 7.91 8.95 66.84 72.82 76.45 72.04 14 0 5.77 7.83 8.93 85.59 94.42 99.37 93.12 15 0 5.38 7.73 8.87 67.57 75.34 79.22 74.04 16 0 5.11 7.67 8.77 48.10 54.00 56.84 52.98 17 0 4.93 7.62 8.72 106.28 120.19 126.49 117.65 18 0 4.64 7.49 8.58 -8.88 -10.10 -10.66 -9.88 19 0 4.60 7.51 8.62 72.64 83.64 88.59 81.63 20 0 4.22 7.44 8.63 61.32 71.29 75.55 69.38 21 0 3.99 7.38 8.55 34.76 40.40 42.81 39.32 22 0 3.96 7.30 8.46 18.59 21.56 22.87 21.01 23 0 3.98 7.25 8.42 38.79 45.13 47.99 43.97 24 0 3.86 7.19 8.40 45.23 52.77 56.37 51.46 25 0 3.72 7.10 8.39 66.05 77.54 83.63 75.74 26 0 3.45 6.95 8.42 60.70 71.52 77.64 69.95 27 0 3.26 6.80 8.37 43.71 51.40 56.15 50.42 28 0 3.19 6.66 8.32 44.10 51.74 56.82 50.88 29 0 3.13 6.52 8.27 47.51 55.51 61.33 54.78 30 0 3.08 6.37 8.21 38.74 45.03 50.13 44.64
Stellenbosch University https://scholar.sun.ac.za

130
Table B.5: Average volumetric water content and average diffusivity coefficients for November 2016 for the bare treatment on the deep soils.
Days Rainfall (mm) Average volumetric water content (mm)
Average diffusivity coefficients (mm2.day-1)
5 cm
15 cm
25 cm
5 cm
15 cm
25 cm
5–25 cm
1 0 3.05 6.04 8.17 35.42 40.69 46.16 40.76 2 0 3.02 5.88 8.17 55.39 63.54 72.35 63.76 3 0 2.92 5.75 8.09 34.80 39.91 45.51 40.07 4 0 2.89 5.68 8.01 49.54 56.76 64.85 57.05 5 0 2.82 5.58 7.93 29.87 34.14 39.11 34.37 6 0 2.83 5.51 7.88 22.62 25.76 29.60 25.99 7 0 2.84 5.42 7.84 29.76 33.76 38.83 34.12 8 0 2.83 5.33 7.76 29.95 33.85 38.92 34.24 9 0 2.84 5.25 7.67 28.87 32.51 37.40 32.93
10 0 2.85 5.18 7.59 32.07 36.03 41.43 36.51 11 0 2.84 5.10 7.50 54.21 60.89 69.80 61.63 12 0 2.77 5.02 7.35 48.34 54.33 61.99 54.89 13 0 2.74 4.97 7.21 34.88 39.12 44.57 39.52 14 0 2.74 4.92 7.10 20.25 22.61 25.75 22.87 15 0 2.78 4.85 7.02 54.72 61.07 69.38 61.72 16 0 2.71 4.77 6.89 42.31 47.28 53.49 47.70 17 0 2.68 4.73 6.77 23.76 26.54 29.88 26.72 18 0 2.69 4.72 6.66 23.84 26.53 29.85 26.74 19 0 2.71 4.66 6.58 38.61 42.77 48.23 43.20 20 0 2.70 4.56 6.52 63.96 70.80 79.63 71.46 21 0 2.64 4.48 6.38 43.52 48.19 54.02 48.58 22 3 2.62 4.44 6.26 -422.18 -425.45 -473.07 -440.23 23 0 4.40 4.53 6.20 -64.30 -65.25 -71.00 -66.85 24 0 4.49 4.76 6.23 0.11 0.12 0.13 0.12 25 0 4.43 4.82 6.27 53.05 54.87 59.57 55.83 26 0 4.20 4.83 6.28 151.44 162.05 175.86 163.12 27 0 3.55 4.82 6.24 109.26 119.79 129.96 119.67 28 0 3.13 4.81 6.17 33.24 36.82 39.85 36.64 29 0 3.02 4.83 6.11 28.43 31.69 34.17 31.43
Stellenbosch University https://scholar.sun.ac.za

131
Table B.6: Average volumetric water content and average diffusivity coefficients for December 2016 for the bare treatment on the deep soils.
Days Rainfall (mm) Average volumetric water content (mm)
Average diffusivity coefficients (mm2.day-1)
5 cm
15 cm
25 cm
5 cm
15 cm
25 cm
5–25 cm
1 0 2.86 4.83 5.95 7.99 8.95 9.57 8.84 2 0 2.85 4.84 5.90 23.35 26.20 27.98 25.84 3 0 2.79 4.80 5.84 29.19 32.77 34.95 32.30 4 0 2.75 4.75 5.78 -2.99 -3.37 -3.56 -3.31 5 0 2.77 4.81 5.71 45.00 50.65 53.55 49.73 6 0 2.70 4.74 5.62 29.66 33.31 35.18 32.71 7 0 2.70 4.69 5.55 36.91 41.48 43.75 40.71 8 0 2.66 4.64 5.47 31.56 35.46 37.42 34.81 9 0 2.63 4.59 5.42 5.86 6.57 6.91 6.45
10 0 2.68 4.59 5.36 21.86 24.45 25.60 23.97 11 5.4 2.70 4.56 5.27 77.98 86.94 89.67 84.86 12 0 2.69 4.50 4.98 29.35 32.65 33.65 31.88 13 0 2.70 4.44 4.90 38.35 42.45 43.71 41.50 14 0 2.71 4.36 4.80 53.44 59.17 61.07 57.89 15 0 2.64 4.28 4.76 10.59 11.69 12.07 11.45 16 0 2.72 4.29 4.77 23.21 25.55 26.37 25.04 17 0 2.72 4.24 4.71 24.39 26.79 27.65 26.28 18 0 2.70 4.19 4.66 38.91 42.76 44.07 41.91 19 0 2.65 4.14 4.59 7.72 8.49 8.78 8.33 20 0 2.64 4.12 4.63 32.67 35.99 37.25 35.30 21 0 2.58 4.09 4.60 5.14 5.65 5.85 5.55 22 7.8 2.60 4.09 4.59 -210.83 -219.77 -227.70 -219.43 23 0.3 3.47 4.10 4.61 -1555.19 -1406.19 -1336.94 -1432.77 24 0 6.99 5.65 4.93 -42.58 -45.02 -42.13 -43.24 25 0 5.65 6.68 5.45 -16.64 -18.00 -16.95 -17.19 26 0 5.33 6.80 5.69 159.20 174.65 160.42 164.76 27 0 5.05 6.79 5.20 55.65 62.01 56.60 58.09 28 0 4.83 6.79 5.15 81.81 93.02 84.16 86.33 29 0 4.50 6.81 5.03 154.46 182.42 163.45 166.77 30 0 3.84 6.82 4.91 145.52 178.05 157.86 160.48
Stellenbosch University https://scholar.sun.ac.za

132
Table B.7: Average volumetric water content and average diffusivity coefficients for January 2017 for the bare treatment on the deep soils.
Days Rainfall (mm) Average volumetric water content (mm)
Average diffusivity coefficients (mm2.day-1)
5 cm
15 cm
25 cm
5 cm
15 cm
25 cm
5–25 cm
1 0 3.07 6.77 4.76 36.48 45.53 40.39 40.80 2 0.9 2.97 6.68 4.78 -2.30 -2.86 -2.56 -2.57 3 0 2.98 6.62 4.86 33.51 41.81 37.21 37.51 4 0 2.92 6.60 4.76 31.79 39.77 35.13 35.56 5 0 2.89 6.59 4.64 40.24 50.28 44.58 45.03 6 0 2.83 6.49 4.61 19.56 24.40 21.67 21.88 7 0 2.83 6.43 4.59 -4.95 -6.17 -5.52 -5.55 8 0 2.82 6.37 4.66 15.88 19.69 17.77 17.78 9 0 2.78 6.29 4.71 44.79 55.21 49.88 49.96
10 0 2.78 6.19 4.62 -9.84 -12.07 -11.10 -11.00 11 0 2.77 6.07 4.80 40.09 48.83 45.25 44.73 12 0 2.73 5.95 4.78 22.25 27.03 25.23 24.83 13 0 2.71 5.86 4.81 20.95 25.38 23.77 23.37 14 0 2.69 5.79 4.80 -3.47 -4.21 -3.93 -3.87 15 0 2.69 5.81 4.78 13.77 16.63 15.63 15.34 16 0 2.70 5.73 4.79 13.39 16.07 15.12 14.86 17 0 2.74 5.66 4.75 37.74 44.95 42.31 41.67 18 0 2.75 5.55 4.64 42.01 49.93 47.30 46.41 19 0 2.68 5.44 4.63 23.93 28.42 27.10 26.48 20 0 2.64 5.36 4.66 37.08 43.77 41.52 40.79 21 0 2.70 5.31 4.52 22.16 26.01 24.71 24.29 22 0 2.72 5.22 4.46 40.50 47.25 45.01 44.25 23 0 2.71 5.12 4.40 75.54 88.11 83.58 82.41 24 0 2.64 5.03 4.25 16.49 19.24 18.22 17.98 25 0 2.67 5.01 4.23 -11.50 -13.37 -12.78 -12.55 26 0 2.68 4.96 4.31 47.41 55.07 52.69 51.72 27 0 2.61 4.89 4.25 89.80 104.29 97.35 97.15 28 0 2.64 4.89 3.90 168.85 196.37 176.32 180.51 29 0 2.63 4.86 3.31 84.27 98.47 86.93 89.89 30 0 2.61 4.80 3.08 29.13 34.07 29.82 31.01
Stellenbosch University https://scholar.sun.ac.za

133
Table B.8: Average volumetric water content and average diffusivity coefficients for February 2017 for the bare treatment on the deep soils.
Days Rainfall (mm) Average volumetric water content (mm)
Average diffusivity coefficients (mm2.day-1)
5 cm
15 cm
25 cm
5 cm
15 cm
25 cm
5–25 cm
1 0 2.65 4.74 2.93 -22.32 -25.85 -22.86 -23.68 2 0 2.70 4.69 3.04 -29.75 -34.23 -30.84 -31.61 3 0 2.71 4.63 3.23 -11.95 -13.74 -12.69 -12.79 4 0 2.59 4.53 3.46 -29.99 -34.34 -32.15 -32.16 5 0 2.62 4.50 3.62 -6.82 -7.77 -7.30 -7.29 6 0 2.66 4.49 3.65 17.82 20.22 19.08 19.04 7 0 2.67 4.44 3.66 -10.03 -11.34 -10.90 -10.76 8 0 2.63 4.37 3.83 118.19 133.27 124.54 125.33 9 0 2.67 4.36 3.43 160.32 180.60 162.37 167.77
10 0 2.72 4.34 2.90 52.94 59.82 53.37 55.38 11 0.3 2.70 4.30 2.82 77.02 87.04 76.70 80.25 12 0 2.68 4.26 2.62 64.13 72.76 63.52 66.80 13 0 2.64 4.24 2.51 -43.84 -49.68 -44.01 -45.84 14 0 2.65 4.21 2.70 79.97 90.29 78.88 83.05 15 0 2.68 4.21 2.49 149.69 169.68 144.61 154.66 16 0 2.61 4.17 2.14 -1.68 -1.91 -1.62 -1.73 17 0 2.63 4.16 2.17 7.22 8.22 7.00 7.48 18 0 2.60 4.15 2.21 -59.40 -67.52 -58.40 -61.77 19 0 2.63 4.16 2.41 -73.42 -83.22 -73.39 -76.68 20 0 2.66 4.17 2.65 -64.27 -72.66 -65.75 -67.56 21 0 2.64 4.16 2.94 49.51 55.78 50.22 51.84 22 0 2.64 4.14 2.83 55.94 63.05 56.11 58.37 23 0 2.65 4.13 2.69 91.54 103.51 91.47 95.51 24 0 2.57 4.08 2.56 -3.43 -3.89 -3.47 -3.60 25 0 2.53 4.04 2.67 -9.45 -10.70 -9.62 -9.93 26 0 2.53 4.02 2.75 -14.34 -16.18 -14.54 -15.02 27 0 2.58 4.03 2.76 16.25 18.34 16.45 17.02
Stellenbosch University https://scholar.sun.ac.za
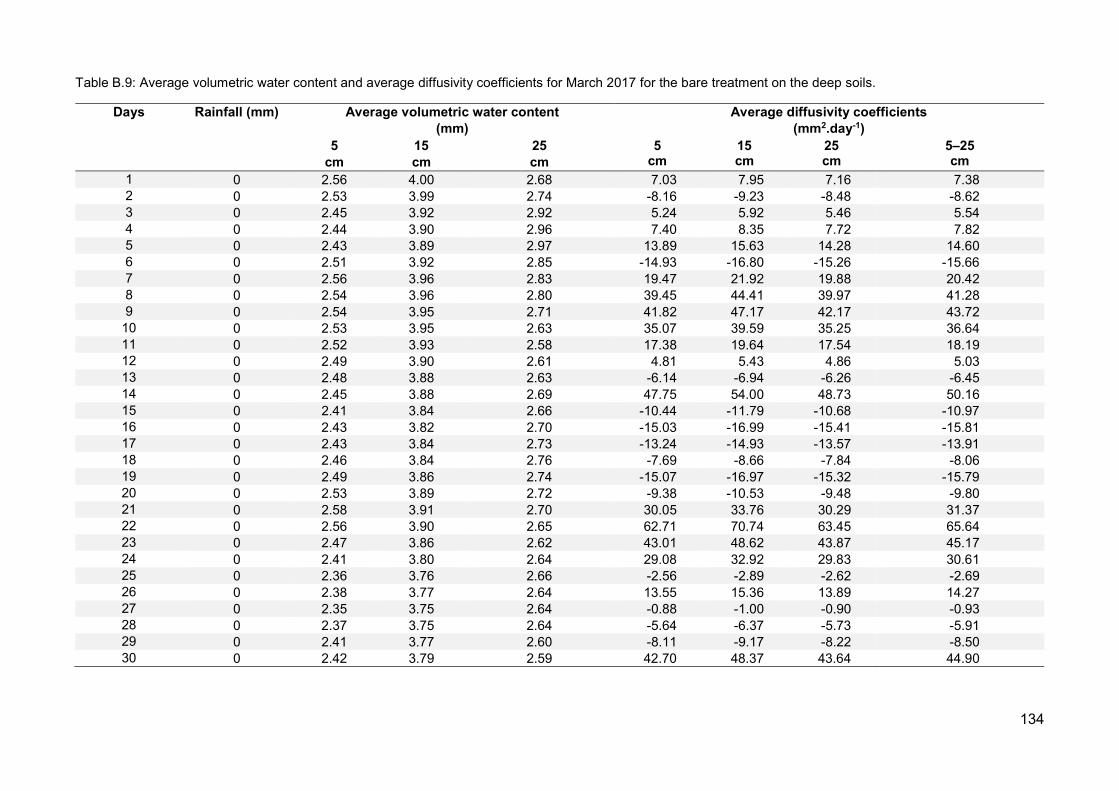
134
Table B.9: Average volumetric water content and average diffusivity coefficients for March 2017 for the bare treatment on the deep soils.
Days Rainfall (mm) Average volumetric water content (mm)
Average diffusivity coefficients (mm2.day-1)
5 cm
15 cm
25 cm
5 cm
15 cm
25 cm
5–25 cm
1 0 2.56 4.00 2.68 7.03 7.95 7.16 7.38 2 0 2.53 3.99 2.74 -8.16 -9.23 -8.48 -8.62 3 0 2.45 3.92 2.92 5.24 5.92 5.46 5.54 4 0 2.44 3.90 2.96 7.40 8.35 7.72 7.82 5 0 2.43 3.89 2.97 13.89 15.63 14.28 14.60 6 0 2.51 3.92 2.85 -14.93 -16.80 -15.26 -15.66 7 0 2.56 3.96 2.83 19.47 21.92 19.88 20.42 8 0 2.54 3.96 2.80 39.45 44.41 39.97 41.28 9 0 2.54 3.95 2.71 41.82 47.17 42.17 43.72
10 0 2.53 3.95 2.63 35.07 39.59 35.25 36.64 11 0 2.52 3.93 2.58 17.38 19.64 17.54 18.19 12 0 2.49 3.90 2.61 4.81 5.43 4.86 5.03 13 0 2.48 3.88 2.63 -6.14 -6.94 -6.26 -6.45 14 0 2.45 3.88 2.69 47.75 54.00 48.73 50.16 15 0 2.41 3.84 2.66 -10.44 -11.79 -10.68 -10.97 16 0 2.43 3.82 2.70 -15.03 -16.99 -15.41 -15.81 17 0 2.43 3.84 2.73 -13.24 -14.93 -13.57 -13.91 18 0 2.46 3.84 2.76 -7.69 -8.66 -7.84 -8.06 19 0 2.49 3.86 2.74 -15.07 -16.97 -15.32 -15.79 20 0 2.53 3.89 2.72 -9.38 -10.53 -9.48 -9.80 21 0 2.58 3.91 2.70 30.05 33.76 30.29 31.37 22 0 2.56 3.90 2.65 62.71 70.74 63.45 65.64 23 0 2.47 3.86 2.62 43.01 48.62 43.87 45.17 24 0 2.41 3.80 2.64 29.08 32.92 29.83 30.61 25 0 2.36 3.76 2.66 -2.56 -2.89 -2.62 -2.69 26 0 2.38 3.77 2.64 13.55 15.36 13.89 14.27 27 0 2.35 3.75 2.64 -0.88 -1.00 -0.90 -0.93 28 0 2.37 3.75 2.64 -5.64 -6.37 -5.73 -5.91 29 0 2.41 3.77 2.60 -8.11 -9.17 -8.22 -8.50 30 0 2.42 3.79 2.59 42.70 48.37 43.64 44.90
Stellenbosch University https://scholar.sun.ac.za
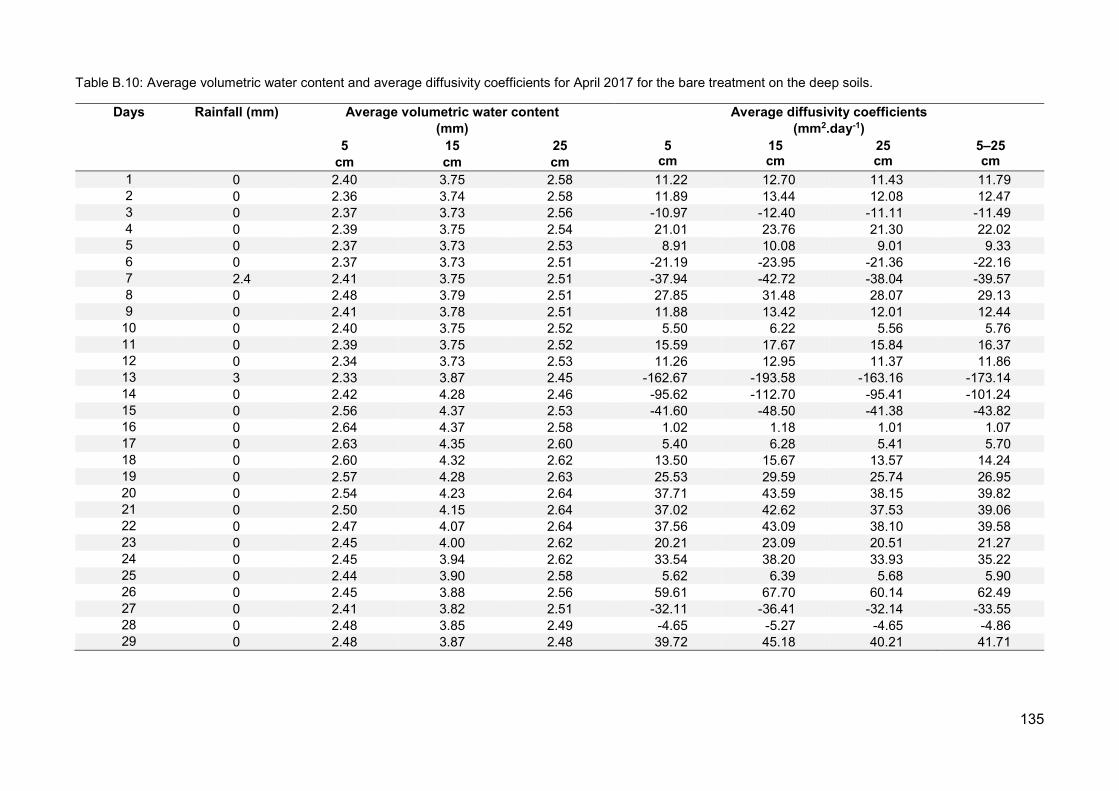
135
Table B.10: Average volumetric water content and average diffusivity coefficients for April 2017 for the bare treatment on the deep soils.
Days Rainfall (mm) Average volumetric water content (mm)
Average diffusivity coefficients (mm2.day-1)
5 cm
15 cm
25 cm
5 cm
15 cm
25 cm
5–25 cm
1 0 2.40 3.75 2.58 11.22 12.70 11.43 11.79 2 0 2.36 3.74 2.58 11.89 13.44 12.08 12.47 3 0 2.37 3.73 2.56 -10.97 -12.40 -11.11 -11.49 4 0 2.39 3.75 2.54 21.01 23.76 21.30 22.02 5 0 2.37 3.73 2.53 8.91 10.08 9.01 9.33 6 0 2.37 3.73 2.51 -21.19 -23.95 -21.36 -22.16 7 2.4 2.41 3.75 2.51 -37.94 -42.72 -38.04 -39.57 8 0 2.48 3.79 2.51 27.85 31.48 28.07 29.13 9 0 2.41 3.78 2.51 11.88 13.42 12.01 12.44
10 0 2.40 3.75 2.52 5.50 6.22 5.56 5.76 11 0 2.39 3.75 2.52 15.59 17.67 15.84 16.37 12 0 2.34 3.73 2.53 11.26 12.95 11.37 11.86 13 3 2.33 3.87 2.45 -162.67 -193.58 -163.16 -173.14 14 0 2.42 4.28 2.46 -95.62 -112.70 -95.41 -101.24 15 0 2.56 4.37 2.53 -41.60 -48.50 -41.38 -43.82 16 0 2.64 4.37 2.58 1.02 1.18 1.01 1.07 17 0 2.63 4.35 2.60 5.40 6.28 5.41 5.70 18 0 2.60 4.32 2.62 13.50 15.67 13.57 14.24 19 0 2.57 4.28 2.63 25.53 29.59 25.74 26.95 20 0 2.54 4.23 2.64 37.71 43.59 38.15 39.82 21 0 2.50 4.15 2.64 37.02 42.62 37.53 39.06 22 0 2.47 4.07 2.64 37.56 43.09 38.10 39.58 23 0 2.45 4.00 2.62 20.21 23.09 20.51 21.27 24 0 2.45 3.94 2.62 33.54 38.20 33.93 35.22 25 0 2.44 3.90 2.58 5.62 6.39 5.68 5.90 26 0 2.45 3.88 2.56 59.61 67.70 60.14 62.49 27 0 2.41 3.82 2.51 -32.11 -36.41 -32.14 -33.55 28 0 2.48 3.85 2.49 -4.65 -5.27 -4.65 -4.86 29 0 2.48 3.87 2.48 39.72 45.18 40.21 41.71
Stellenbosch University https://scholar.sun.ac.za

136
Table B.11: Average volumetric water content and average diffusivity coefficients for May 2017 for the bare treatment on the deep soils.
Days Rainfall (mm) Average volumetric water content (mm)
Average diffusivity coefficients (mm2.day-1)
5 cm
15 cm
25 cm
5 cm
15 cm
25 cm
5–25 cm
1 1.8 2.43 3.76 2.42 -32.37 -36.22 -31.81 -33.47 2 0 2.58 3.79 2.38 -75.79 -84.27 -73.40 -77.82 3 0 2.73 3.87 2.36 -10.04 -11.19 -9.73 -10.32 4 0 2.72 3.90 2.36 100.39 112.84 97.03 103.42 5 0 2.60 3.89 2.20 160.86 182.00 152.53 165.13 6 0 2.51 3.84 1.89 81.41 92.67 76.75 83.61 7 0 2.46 3.80 1.78 16.82 19.24 15.85 17.30 8 0 2.44 3.80 1.77 74.40 85.16 69.05 76.20 9 0 2.42 3.79 1.58 118.27 135.82 107.13 120.41
10 0 2.41 3.79 1.31 6.17 7.13 5.60 6.30 11 1.7 2.38 3.77 1.32 57.64 66.54 51.71 58.63 12 0 2.38 3.76 1.20 106.26 123.07 92.90 107.41 13 0 2.38 3.77 0.92 129.23 150.37 109.54 129.71 14 0 2.38 3.78 0.60 9.60 11.23 8.03 9.62 15 0 2.40 3.79 0.53 -126.26 -147.75 -108.22 -127.41 16 0 2.40 3.79 0.81 -35.92 -41.81 -31.37 -36.37 17 0 2.37 3.76 0.93 15.18 17.58 13.21 15.32 18 0 2.39 3.75 0.91 28.32 32.86 24.33 28.51 19 0 2.41 3.78 0.79 -51.30 -59.72 -44.51 -51.84 20 0 2.40 3.78 0.89 -138.24 -160.65 -123.78 -140.89 21 0 2.38 3.78 1.22 -91.32 -105.54 -84.16 -93.67 22 0 2.37 3.76 1.49 7.50 8.64 6.94 7.69 23 0 2.35 3.74 1.50 -2.25 -2.59 -2.10 -2.31 24 0 2.32 3.73 1.56 -229.20 -263.76 -226.88 -239.95 25 0 2.31 3.70 2.20 -68.21 -77.80 -69.01 -71.68 26 0 2.29 3.68 2.42 30.34 34.52 30.61 31.83 27 0 2.28 3.67 2.38 11.22 12.77 11.30 11.76 28 0 2.28 3.66 2.36 -15.07 -17.15 -15.14 -15.78 29 0 2.30 3.67 2.36 21.66 24.65 21.38 22.57 30 0 2.34 3.71 2.20 -80.58 -91.78 -81.17 -84.51
Stellenbosch University https://scholar.sun.ac.za

137
Table B.12: Average volumetric water content and average diffusivity coefficients for June 2017 for the bare treatment on the deep soils.
Days Rainfall (mm) Average volumetric water content (mm)
Average diffusivity coefficients (mm2.day-1)
5 cm
15 cm
25 cm
5 cm
15 cm
25 cm
5–25 cm
1 0 2.34 3.72 4.19 -18.85 -21.01 -21.94 -20.60 2 0 2.36 3.72 4.22 5.74 6.41 6.71 6.29 3 15.8 2.32 3.71 4.23 -1293.12 -1717.67 -1581.29 -1530.69 4 0 2.95 6.08 5.26 -785.43 -994.74 -968.61 -916.26 5 0 3.67 7.04 6.70 -57.77 -69.18 -67.84 -64.93 6 0 3.93 7.04 6.73 -3272.43 -3844.00 -5957.65 -4358.02 7 0.8 6.94 9.33 14.20 -1316.51 -1411.89 -1970.65 -1566.35 8 0 7.67 9.59 17.09 704.82 746.14 863.38 771.45 9 0 6.18 8.34 13.36 -770.90 -840.02 -1037.19 -882.70
10 0 7.53 10.08 15.47 -290.83 -314.31 -390.17 -331.77 11 0 7.40 10.16 16.81 662.50 703.11 809.98 725.20 12 0 6.42 8.76 13.81 289.63 310.64 359.29 319.86 13 0 6.05 8.37 12.70 177.51 191.36 219.93 196.27 14 0 5.86 8.18 12.04 114.12 123.36 141.39 126.29 15 0 5.74 8.05 11.68 99.39 107.43 122.10 109.64 16 0 5.71 7.95 11.28 66.79 72.50 82.47 73.92 17 0 5.57 7.88 11.15 52.62 57.01 64.52 58.05 18 0 5.61 7.83 10.92 83.44 90.80 101.82 92.02 19 0 5.47 7.79 10.63 14.89 16.24 18.34 16.49 20 0 5.42 7.75 10.69 65.04 70.83 79.02 71.63 21 1.8 5.43 7.71 10.37 -655.99 -695.73 -809.51 -720.41 22 0 7.07 8.55 11.97 -201.60 -210.87 -249.57 -220.68 23 0 7.33 8.64 13.05 260.39 273.92 315.40 283.24 24 0 6.60 8.18 12.18 155.68 165.60 189.63 170.30 25 0 6.19 8.01 11.62 97.13 104.12 118.43 106.56 26 0 5.96 7.93 11.25 75.92 82.03 92.72 83.56 27 0 5.74 7.89 10.98 -306.70 -324.69 -376.64 -336.01 28 0 6.67 8.19 11.77 -90.26 -93.93 -109.61 -97.93 29 0 7.01 8.15 12.16 187.79 197.66 226.42 203.96
Stellenbosch University https://scholar.sun.ac.za

138
Table B.13: Average volumetric water content and average diffusivity coefficients for July 2017 for the bare treatment on the deep soils.
Days Rainfall (mm) Average volumetric water content (mm)
Average diffusivity coefficients (mm2.day-1)
5 cm
15 cm
25 cm
5 cm
15 cm
25 cm
5–25 cm
1 0 6.35 7.86 11.42 81.43 86.09 97.81 88.45 2 0 6.24 7.80 11.06 86.94 92.53 104.33 94.60 3 0 6.03 7.75 10.77 92.05 98.80 110.28 100.38 4 0 5.80 7.72 10.44 93.67 101.39 111.72 102.26 5 0 5.59 7.70 10.06 62.71 68.54 75.15 68.80 6 0 5.37 7.68 9.87 62.42 68.83 75.17 68.81 7 0 5.14 7.66 9.73 72.82 80.94 88.03 80.59 8 10 4.92 7.61 9.56 -1092.48 -1203.08 -1405.63 -1233.73 9 0 6.91 9.15 12.33 -632.79 -666.23 -812.90 -703.97
10 0 7.99 9.49 14.60 313.26 327.62 379.78 340.22 11 0 7.20 8.75 13.38 213.20 225.17 260.17 232.85 12 0 6.67 8.43 12.64 175.82 187.61 215.21 192.88 13 0 6.23 8.23 12.05 142.25 153.17 174.63 156.68 14 1.5 5.89 8.08 11.59 101.38 109.87 124.70 111.98 15 4.8 5.67 7.98 11.26 -1075.06 -1125.99 -1340.42 -1180.49 16 0 8.45 9.64 13.67 256.71 265.71 308.68 277.03 17 0 7.55 8.71 13.32 212.37 222.14 256.46 230.32 18 0 6.95 8.39 12.57 172.57 182.95 209.88 188.47 19 0.3 6.41 8.20 12.01 148.34 158.77 179.96 162.36 20 0 6.07 8.07 11.43 100.25 108.09 122.06 110.13 21 0 5.82 7.97 11.12 108.21 117.79 132.23 119.41 22 0 5.51 7.89 10.82 100.69 110.64 123.55 111.63 23 0 5.23 7.81 10.54 94.76 105.42 117.34 105.84 24 0 4.89 7.76 10.34 35.43 39.79 44.84 40.02 25 2.1 4.62 7.69 10.49 -44.04 -49.19 -56.25 -49.83 26 0 4.78 7.66 10.76 48.32 53.44 59.83 53.86 27 0 4.99 7.64 10.31 58.00 64.57 71.84 64.80 28 0 4.83 7.62 10.12 115.66 130.81 144.59 130.35 29 0 4.38 7.57 9.89 106.59 122.17 134.41 121.06 30 0 4.04 7.49 9.64 79.87 92.46 101.39 91.24
Stellenbosch University https://scholar.sun.ac.za

139
Table B.14: Average volumetric water content and average diffusivity coefficients for August 2017 for the bare treatment on the deep soils.
Days Rainfall (mm) Average volumetric water content (mm)
Average diffusivity coefficients (mm2.day-1)
5 cm
15 cm
25 cm
5 cm
15 cm
25 cm
5–25 cm
1 0 3.65 7.35 9.20 40.44 47.16 51.14 46.25 2 1.2 3.67 7.32 9.04 47.57 55.43 59.69 54.23 3 0. 3.69 7.29 8.84 53.20 62.00 66.35 60.52 4 0 3.67 7.23 8.64 48.24 56.29 59.91 54.81 5 0 3.65 7.19 8.48 46.12 53.75 57.11 52.32 6 0 3.63 7.11 8.35 54.37 63.32 67.16 61.62 7 0 3.59 7.02 8.21 59.24 68.86 72.93 67.01 8 0 3.51 6.91 8.06 77.92 90.28 95.48 87.89 9 0 3.49 6.75 7.86 63.08 72.86 77.14 71.03
10 3.6 3.47 6.61 7.73 -82.50 -95.25 -104.70 -94.15 11 0 3.53 6.54 8.32 -38.74 -44.57 -49.21 -44.18 12 0 3.65 6.58 8.49 88.05 100.67 107.66 98.79 13 0 3.75 6.58 7.91 42.19 48.08 50.94 47.07 14 1.8 3.71 6.54 7.66 50.73 57.74 61.09 56.52 15 2.1 3.69 6.45 7.54 -23.55 -26.84 -28.81 -26.40 16 0 3.75 6.43 7.77 60.52 68.68 72.61 67.27 17 0 3.71 6.40 7.47 42.00 47.39 49.68 46.35 18 0 3.69 6.34 7.24 54.59 61.15 64.34 60.03 19 0 3.74 6.17 7.14 119.23 132.46 140.74 130.81 20 0 3.84 5.86 7.00 148.85 165.01 175.30 163.05 21 12.3 3.84 5.60 6.72 -4284.94 -5129.56 -7842.86 -5752.45 22 0.3 3.70 10.14 14.90 322.67 346.84 401.53 357.01 23 2.4 3.53 8.93 13.34 99.47 106.50 123.69 109.89 24 0 7.43 8.63 12.79 123.11 131.41 151.47 135.33 25 0 6.51 8.39 12.27 177.31 190.71 217.68 195.23 26 0 6.52 8.14 11.69 188.61 205.33 232.71 208.88 27 0 6.41 7.91 11.15 199.48 220.15 247.69 222.44 28 0.9 5.98 7.67 10.60 173.22 193.50 215.89 194.20 29 0 5.47 7.50 10.10 79.92 89.71 99.50 89.71 30 0 4.94 7.46 9.81 109.57 123.36 135.32 122.75
Stellenbosch University https://scholar.sun.ac.za

140
Table B.15: Average volumetric water content and average diffusivity coefficients for September 2017 for the bare treatment on the deep soils.
Days Rainfall (mm) Average volumetric water content (mm)
Average diffusivity coefficients (mm2.day-1)
5 cm
15 cm
25 cm
5 cm
15 cm
25 cm
5–25 cm
1 0 3.65 7.35 9.06 72.31 84.39 90.07 82.26 2 0 3.67 7.32 8.70 83.79 97.84 102.62 94.75 3 0 3.69 7.29 8.29 107.11 125.31 128.60 120.34 4 0 3.67 7.23 7.77 99.00 116.22 116.91 110.71 5 0 3.65 7.19 7.31 84.04 98.76 98.11 93.64 6 0 6.63 7.11 6.98 88.41 103.99 102.13 98.18 7 0 3.59 7.02 6.67 79.57 93.53 91.22 88.11 8 0 3.56 6.91 6.42 109.53 128.42 124.05 120.66 9 0 3.51 6.75 6.09 113.60 132.92 126.72 124.41
10 0 3.49 6.61 5.71 84.81 99.40 93.48 92.57 11 0 3.47 6.54 5.41 33.38 39.24 36.32 36.31 12 0 3.53 6.58 5.18 19.26 22.55 20.66 20.82 13 0 3.65 6.58 5.02 34.75 40.42 36.76 37.31 14 0 3.75 6.54 4.84 50.34 58.45 53.13 53.97 15 0 3.69 6.45 4.75 41.89 48.72 44.05 44.89 16 0 3.74 6.43 4.65 4.71 5.46 4.95 5.04 17 0 3.84 6.40 4.66 9.93 11.42 10.35 10.57 18 0 3.84 6.34 4.61 51.97 59.19 53.98 55.05 19 0 3.70 6.17 4.55 119.70 135.01 124.91 126.54 20 0 3.53 5.86 4.49 105.12 118.27 110.93 111.44 21 0 3.53 5.60 4.50 -289.39 -339.32 -304.25 -310.99 22 0 3.20 6.20 4.42 -91.64 -107.40 -97.46 -98.83 23 0 3.15 6.10 4.38 36.44 42.16 38.80 39.13
Stellenbosch University https://scholar.sun.ac.za

141
Stellenbosch University https://scholar.sun.ac.za
Related Documents