CERTIFICATE This is to certify that NEHA KAUSAL Student of B.Sc. Part III, Biotechnology Department,St. Columba’s College, Hazaribag. Session 2008-2011. Roll- 902700007 has completed the project , on the “entrepreneurship development program on MILK AND MILK PRODUCT”. (Dr. M. A. Mallick)

Welcome message from author
This document is posted to help you gain knowledge. Please leave a comment to let me know what you think about it! Share it to your friends and learn new things together.
Transcript
8/4/2019 Soil Test File
http://slidepdf.com/reader/full/soil-test-file 1/28
CERTIFICATE
This is to certify that NEHA KAUSAL
Student of B.Sc. Part III,
Biotechnology Department,St. Columba’s College,
Hazaribag.
Session 2008-2011.
Roll- 902700007
has completed the project , on the “entrepreneurship
development program on MILK AND MILK PRODUCT”.
(Dr. M. A. Mallick)
8/4/2019 Soil Test File
http://slidepdf.com/reader/full/soil-test-file 2/28
Co-ordinator
Department Of biotechnology
St. Columba’s College, Hazaribagh
ACKNOWLEDGEMENT
The completion of the project and the successful drafting of its report has
been supported by many people whose advice and suggestion were very
important during the session ( 01.12.2010 to 31.03.101 ) at St.
Columba’s college , Hazaibagh.
I would like to thank Dr. M.A. Mallick , Co-ordinator, Department of
Biotechnology, St. Columba’s college , Hazaribagh for his helpful and
encouraging attitude towards the completion of the project.
I am also very thankful to Mr.Gautam kumar, our honourable teacher,
without whom this project would not have been in its present shape.
Submitted By
NEHA KAUSAL
ROLL: 902700007

8/4/2019 Soil Test File
http://slidepdf.com/reader/full/soil-test-file 3/28
B.Sc. Biotechnology DIII
Session 2008-2011

8/4/2019 Soil Test File
http://slidepdf.com/reader/full/soil-test-file 4/28
CONCLUSION
It was an interesting experience for me in doing this project work at
St.Columba’s College , Hazaribagh. I found it very beneficial and
satisfactory.
Finally, I can say that the training enriched my knowledge and was
informative about the concerned topics.
The knowledge I gained in the development of this project will surely help
us in the betterment of our future.
8/4/2019 Soil Test File
http://slidepdf.com/reader/full/soil-test-file 5/28
INTRODUCTION
In agriculture, a soil test is the analysis of a soil sample to determine nutrient
content, composition and other characteristics, including contaminants. Tests are
usually performed to measure fertility band indicate deficiencies that need to be
remedied.
Sample depth is also an important factor. It is recommended that you take the
samples from tillage depth, as this is where the majority of the nutrients and
elements are placed mechanically. The presence of various nutrients and othersoil components varies during the year, so sample timing may also be important.
A good time to take a sample for testing is in the fall after harvesting is finished,
but this isn't the only time it should be done.
Sampling and testing in the fall is beneficial because the producer will get the
results back in time to formulate the fertilizer plan for the following growing
season. Another time sampling and testing can be done is spring. This is a good
way to see what nutrients survive over winter when the soil freezes, as well as if
any leaches away from melting of snow and thawing of the soil. This way theproducer can know if more or less fertilizer needs to be purchased.
Tests include, but aren't limited to, major nutrients - nitrogen(N), phosphorus (P),
and potassium (K), secondary nutrients - sulphur, calcium, magnesium, minor
nutrients - iron, manganese, copper, zinc, boron, molybdenum, aluminum
8/4/2019 Soil Test File
http://slidepdf.com/reader/full/soil-test-file 6/28
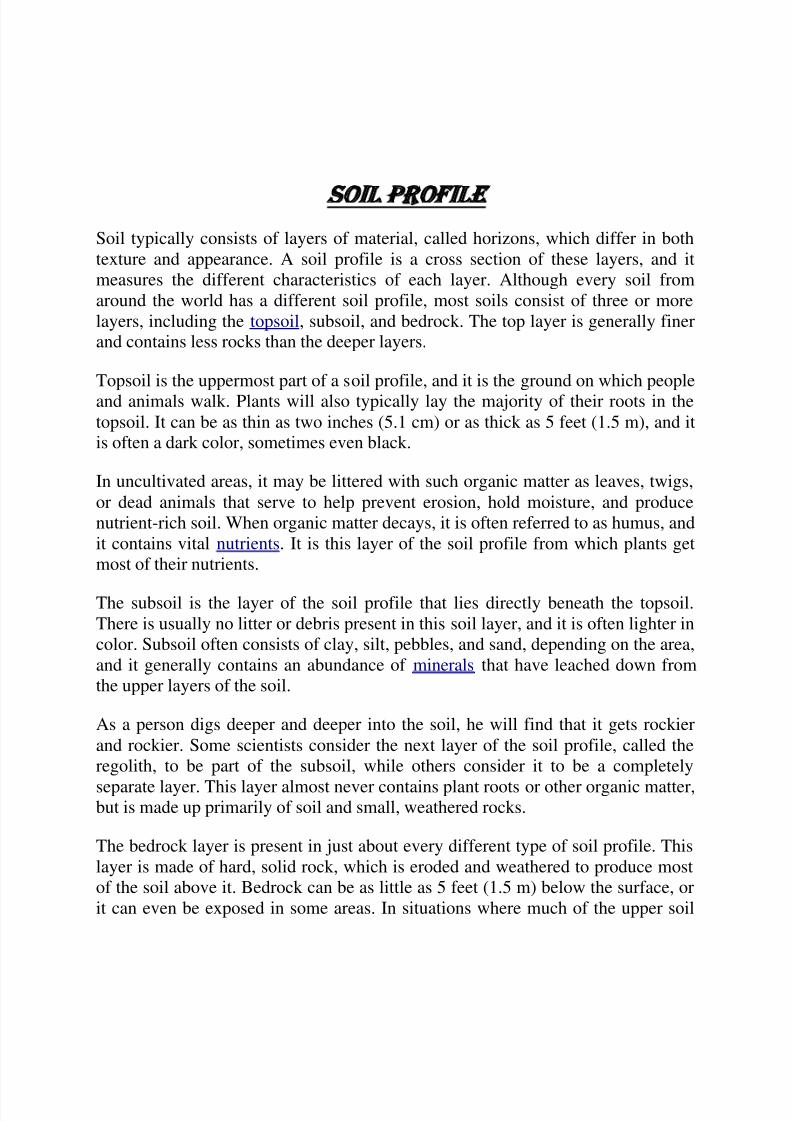
SOIL PROFILE
Soil typically consists of layers of material, called horizons, which differ in both
texture and appearance. A soil profile is a cross section of these layers, and it
measures the different characteristics of each layer. Although every soil from
around the world has a different soil profile, most soils consist of three or more
layers, including the topsoil, subsoil, and bedrock. The top layer is generally finerand contains less rocks than the deeper layers.
Topsoil is the uppermost part of a soil profile, and it is the ground on which people
and animals walk. Plants will also typically lay the majority of their roots in the
topsoil. It can be as thin as two inches (5.1 cm) or as thick as 5 feet (1.5 m), and itis often a dark color, sometimes even black.
In uncultivated areas, it may be littered with such organic matter as leaves, twigs,
or dead animals that serve to help prevent erosion, hold moisture, and produce
nutrient-rich soil. When organic matter decays, it is often referred to as humus, and
it contains vital nutrients. It is this layer of the soil profile from which plants get
most of their nutrients.
The subsoil is the layer of the soil profile that lies directly beneath the topsoil.
There is usually no litter or debris present in this soil layer, and it is often lighter in
color. Subsoil often consists of clay, silt, pebbles, and sand, depending on the area,
and it generally contains an abundance of minerals that have leached down from
the upper layers of the soil.
As a person digs deeper and deeper into the soil, he will find that it gets rockier
and rockier. Some scientists consider the next layer of the soil profile, called the
regolith, to be part of the subsoil, while others consider it to be a completely
separate layer. This layer almost never contains plant roots or other organic matter,but is made up primarily of soil and small, weathered rocks.
The bedrock layer is present in just about every different type of soil profile. This
layer is made of hard, solid rock, which is eroded and weathered to produce most
of the soil above it. Bedrock can be as little as 5 feet (1.5 m) below the surface, or
it can even be exposed in some areas. In situations where much of the upper soil
8/4/2019 Soil Test File
http://slidepdf.com/reader/full/soil-test-file 7/28
has been deposited from somewhere else, however, the bedrock can lay hundredsof feet beneath the surface.
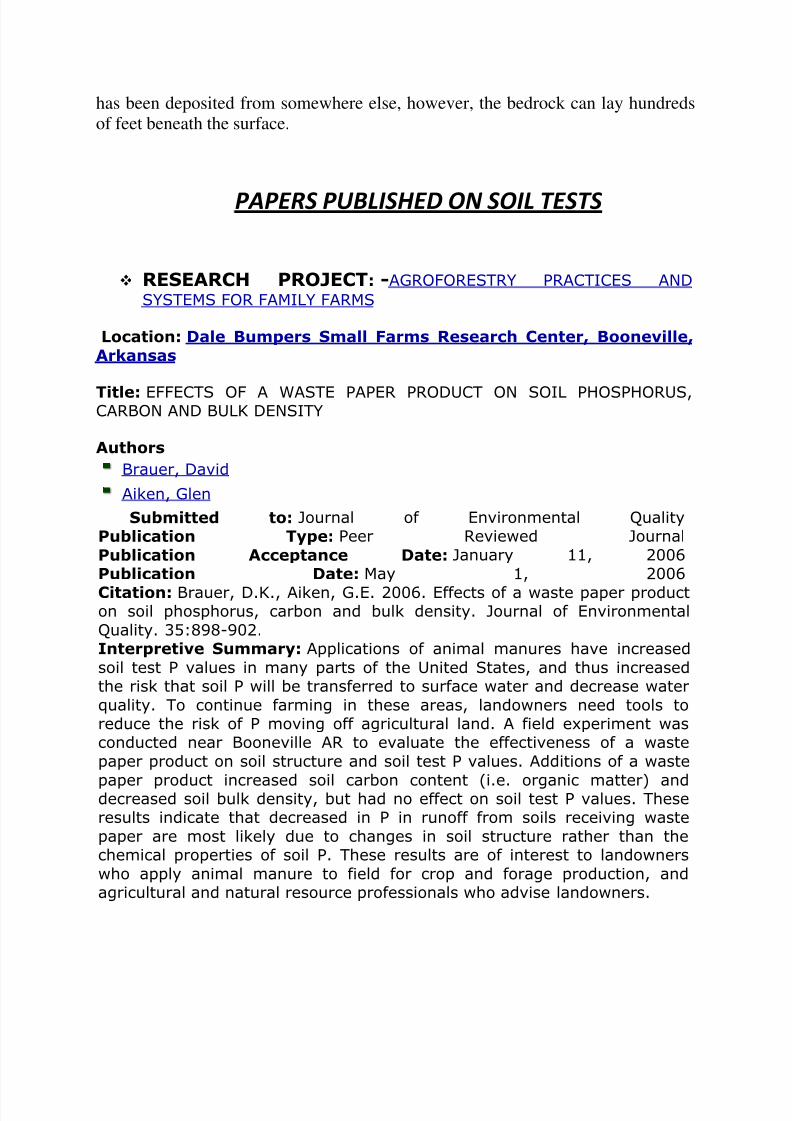
PAPERS PUBLISHED ON SOIL TESTS
RESEARCH PROJECT: -AGROFORESTRY PRACTICES AND
SYSTEMS FOR FAMILY FARMS
Location: Dale Bumpers Small Farms Research Center, Booneville,
Arkansas
Title: EFFECTS OF A WASTE PAPER PRODUCT ON SOIL PHOSPHORUS,CARBON AND BULK DENSITY
Authors
Brauer, David
Aiken, Glen
Submitted to: Journal of Environmental Quality
Publication Type: Peer Reviewed Journal
Publication Acceptance Date: January 11, 2006
Publication Date: May 1, 2006
Citation: Brauer, D.K., Aiken, G.E. 2006. Effects of a waste paper producton soil phosphorus, carbon and bulk density. Journal of Environmental
Quality. 35:898-902.Interpretive Summary: Applications of animal manures have increased
soil test P values in many parts of the United States, and thus increasedthe risk that soil P will be transferred to surface water and decrease water
quality. To continue farming in these areas, landowners need tools toreduce the risk of P moving off agricultural land. A field experiment wasconducted near Booneville AR to evaluate the effectiveness of a waste
paper product on soil structure and soil test P values. Additions of a waste
paper product increased soil carbon content (i.e. organic matter) anddecreased soil bulk density, but had no effect on soil test P values. Theseresults indicate that decreased in P in runoff from soils receiving waste
paper are most likely due to changes in soil structure rather than thechemical properties of soil P. These results are of interest to landowners
who apply animal manure to field for crop and forage production, andagricultural and natural resource professionals who advise landowners.
8/4/2019 Soil Test File
http://slidepdf.com/reader/full/soil-test-file 8/28
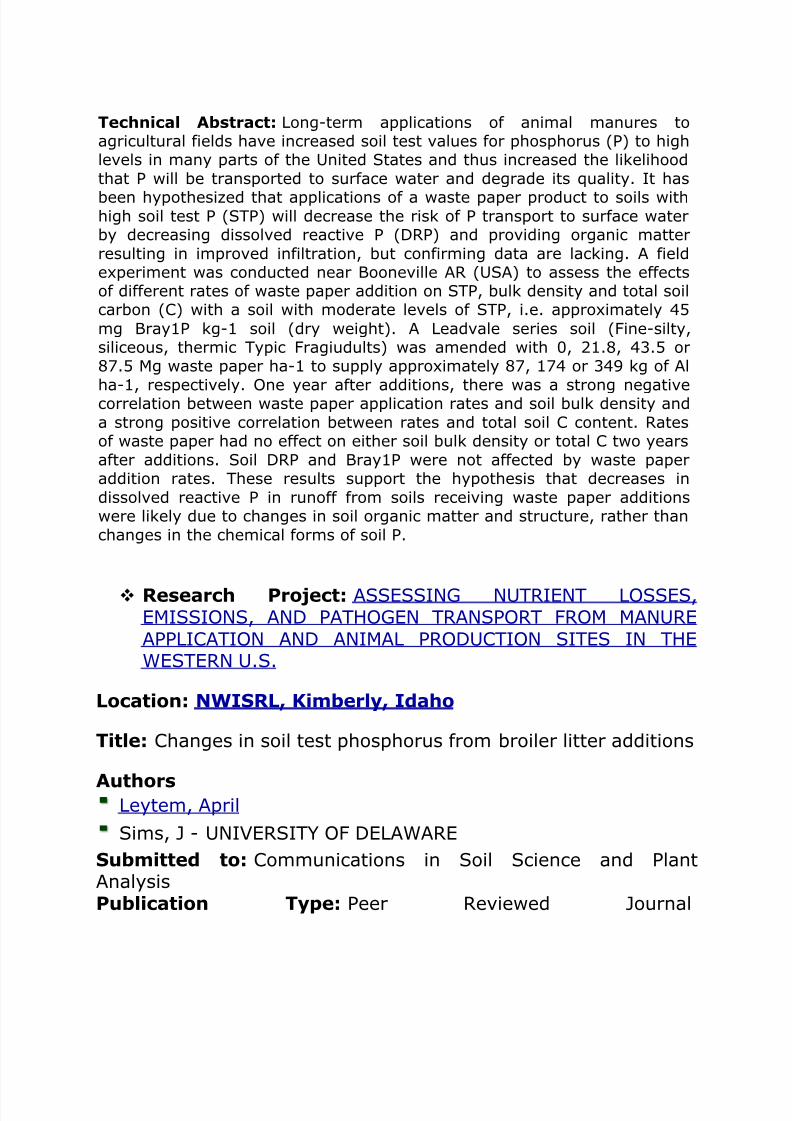
Technical Abstract: Long-term applications of animal manures toagricultural fields have increased soil test values for phosphorus (P) to highlevels in many parts of the United States and thus increased the likelihood
that P will be transported to surface water and degrade its quality. It has
been hypothesized that applications of a waste paper product to soils withhigh soil test P (STP) will decrease the risk of P transport to surface waterby decreasing dissolved reactive P (DRP) and providing organic matter
resulting in improved infiltration, but confirming data are lacking. A fieldexperiment was conducted near Booneville AR (USA) to assess the effectsof different rates of waste paper addition on STP, bulk density and total soilcarbon (C) with a soil with moderate levels of STP, i.e. approximately 45
mg Bray1P kg-1 soil (dry weight). A Leadvale series soil (Fine-silty,siliceous, thermic Typic Fragiudults) was amended with 0, 21.8, 43.5 or87.5 Mg waste paper ha-1 to supply approximately 87, 174 or 349 kg of Al
ha-1, respectively. One year after additions, there was a strong negativecorrelation between waste paper application rates and soil bulk density and
a strong positive correlation between rates and total soil C content. Ratesof waste paper had no effect on either soil bulk density or total C two years
after additions. Soil DRP and Bray1P were not affected by waste paperaddition rates. These results support the hypothesis that decreases in
dissolved reactive P in runoff from soils receiving waste paper additionswere likely due to changes in soil organic matter and structure, rather than
changes in the chemical forms of soil P.
Research Project: ASSESSING NUTRIENT LOSSES,EMISSIONS, AND PATHOGEN TRANSPORT FROM MANUREAPPLICATION AND ANIMAL PRODUCTION SITES IN THEWESTERN U.S.
Location: NWISRL, Kimberly, Idaho
Title: Changes in soil test phosphorus from broiler litter additions
AuthorsLeytem, April
Sims, J - UNIVERSITY OF DELAWARE
Submitted to: Communications in Soil Science and PlantAnalysisPublication Type: Peer Reviewed Journal
8/4/2019 Soil Test File
http://slidepdf.com/reader/full/soil-test-file 9/28
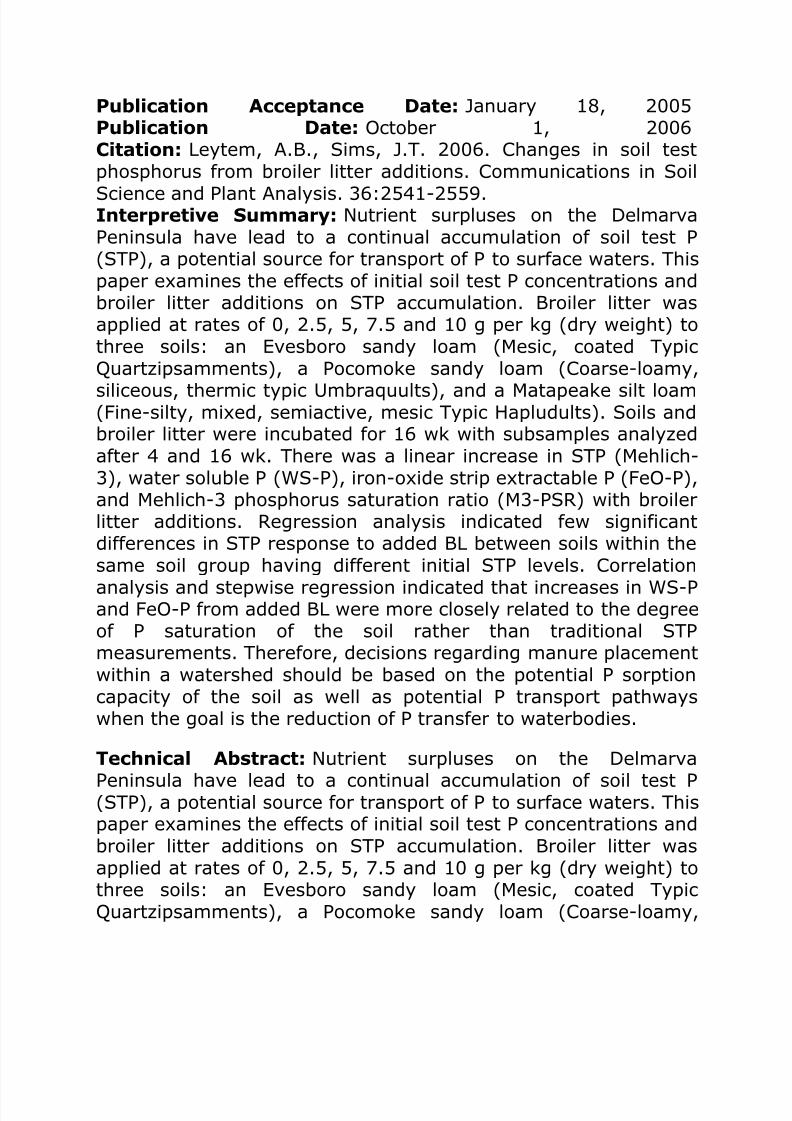
Publication Acceptance Date: January 18, 2005Publication Date: October 1, 2006Citation: Leytem, A.B., Sims, J.T. 2006. Changes in soil testphosphorus from broiler litter additions. Communications in Soil
Science and Plant Analysis. 36:2541-2559.Interpretive Summary: Nutrient surpluses on the DelmarvaPeninsula have lead to a continual accumulation of soil test P(STP), a potential source for transport of P to surface waters. Thispaper examines the effects of initial soil test P concentrations andbroiler litter additions on STP accumulation. Broiler litter wasapplied at rates of 0, 2.5, 5, 7.5 and 10 g per kg (dry weight) tothree soils: an Evesboro sandy loam (Mesic, coated TypicQuartzipsamments), a Pocomoke sandy loam (Coarse-loamy,
siliceous, thermic typic Umbraquults), and a Matapeake silt loam(Fine-silty, mixed, semiactive, mesic Typic Hapludults). Soils andbroiler litter were incubated for 16 wk with subsamples analyzedafter 4 and 16 wk. There was a linear increase in STP (Mehlich-3), water soluble P (WS-P), iron-oxide strip extractable P (FeO-P),and Mehlich-3 phosphorus saturation ratio (M3-PSR) with broilerlitter additions. Regression analysis indicated few significantdifferences in STP response to added BL between soils within thesame soil group having different initial STP levels. Correlation
analysis and stepwise regression indicated that increases in WS-Pand FeO-P from added BL were more closely related to the degreeof P saturation of the soil rather than traditional STPmeasurements. Therefore, decisions regarding manure placementwithin a watershed should be based on the potential P sorptioncapacity of the soil as well as potential P transport pathwayswhen the goal is the reduction of P transfer to waterbodies.
Technical Abstract: Nutrient surpluses on the Delmarva
Peninsula have lead to a continual accumulation of soil test P(STP), a potential source for transport of P to surface waters. Thispaper examines the effects of initial soil test P concentrations andbroiler litter additions on STP accumulation. Broiler litter wasapplied at rates of 0, 2.5, 5, 7.5 and 10 g per kg (dry weight) tothree soils: an Evesboro sandy loam (Mesic, coated TypicQuartzipsamments), a Pocomoke sandy loam (Coarse-loamy,
8/4/2019 Soil Test File
http://slidepdf.com/reader/full/soil-test-file 10/28
siliceous, thermic typic Umbraquults), and a Matapeake silt loam(Fine-silty, mixed, semiactive, mesic Typic Hapludults). Soils andbroiler litter were incubated for 16 wk with subsamples analyzedafter 4 and 16 wk. There was a linear increase in STP (Mehlich-
3), water soluble P (WS-P), iron-oxide strip extractable P (FeO-P),and Mehlich-3 phosphorus saturation ratio (M3-PSR) with broilerlitter additions. Regression analysis indicated few significantdifferences in STP response to added BL between soils within thesame soil group having different initial STP levels. Correlationanalysis and stepwise regression indicated that increases in WS-Pand FeO-P from added BL were more closely related to the degreeof P saturation of the soil rather than traditional STPmeasurements. Therefore, decisions regarding manure placement
within a watershed should be based on the potential P sorptioncapacity of the soil as well as potential P transport pathwayswhen the goal is the reduction of P transfer to waterbodies.
Journal of Soil Contamination
Title Journal of Soil Contamination3146
Editor [Editor in Chief] Dragun, James (Dragun Corporation,Farmington Hills, MI, US)
Publisher Chris Richardson - CRC Press LLC: Boca Raton, US(FL)
Language English
Keywords periodicals; pollution; soils
Description The Journal of Soil Contamination is a new journalconcerned with the technical, regulatory, and legal
challenges of contaminated soils
Derivedfrom
printed version: ISSN 1058-8337
Soil and Sediment Contamination: An International Journal
8/4/2019 Soil Test File
http://slidepdf.com/reader/full/soil-test-file 11/28
An Official Journal of The Association for Environmental Health andScience Increasing to 8 issues in 2011ISSN: 1549-7887 (electronic) 1532-0383 (paper)Publication Frequency: 6 issues per yearSubjects: Bioscience; Environmental Engineering; Environmental Studies& Management; Pollution; Sedimentology & Stratigraphy; Soil Science; Publisher: Taylor & Francis Previously published as: Journal of Soil Contamination (1058-8337) until2001
Status of work on soil test
Five soil testing centres planned Tamil NaduARIYALUR:Soil testing centres with farm laboratories would be set up in
five primary agricultural cooperative societies (PACS) soonin Ariyalur district under the National AgriculturalDevelopment Programme (NADP), said CollectorT.K.Ponnusamy, here on Friday.
Presiding over the 57 {+t} {+h} all India cooperative weekcelebrations here, the Collector said agriculture service centres
8/4/2019 Soil Test File
http://slidepdf.com/reader/full/soil-test-file 12/28
had been started in the PACS at Vadaveekam, Kallathoor,Keezhakaavattankurichi, Ponparapi, Tirumazhapadi,Keezhapazhur, Ambapur and Udayarpalayam.
The Agriculture Department has decided to establish agri clinicsand soil testing centres in all the 20 blocks in the district.
The objective of the initiative is to supplement the efforts of government extension system, make available supplementarysources of input supply and services to needy farmers andprovide gainful employment to agriculture graduates in newemerging areas in agricultural sector.
The department has invited agriculture graduates to submit
proposals for the establishment of the clinic.
Jharkhand to have 8 more soil testing labs
In its bid to boost crop productivity in the mineral- rich state of Jharkhand,the Government of India has sanctioned a Rs 1.21 crore project to set upeight more soil testing centres in areas where farm output is relatively low.
The project to set up soil testing centre is a part of the nationwide
campaign—National Soil Health Mission—that has been formulatedrecently by the Union Ministry of Agriculture to maximise crop output to tideover scarcity of foodgrains including pulses and oilseeds.
The strategy has been chalked out keeping in view stagnancy in cropproduction over the last one decade despite increased inputs like seeds,fertilisers, micronutrients, irrigation and pesticides.
Premier institute of farm technology in the State, Birsa AgricultureUniversity (BAU) has been tasked to establish new soil testing laboratories
(SLTs) at Godda, Bokaro, Garhwa, Chatra, Lohardaga, Seraikella, Pakurand Palamu under the public private partnership mode.
These centres would be located in the premises of Krishi Vigyan Kendras(KVKs).
8/4/2019 Soil Test File
http://slidepdf.com/reader/full/soil-test-file 13/28
Fifty per cent of the project cost in terms of building and infrastructurewould have to be borne by the KVKs, while testing equipment like atomicabsorption spectrophotometre, Ph metre, UV-visible spectrometre, flamephotometre, and technical training on handling soil samples would beprovided by the university, BAU Dean and eminent soil scientist, AK Sarkarsaid.
“All the laboratories will be asked to conduct as many as 10,000 soilsamples in a year, and dish out suitable recommendations for increasingmicronutrients for soils along with soil health cards to farmers in therespective districts. The laboratories also need to take follow up action tomake sure that the recommendations really benefited the farmers,” Sarkar stressed.
In addition to the new ones, the existing eight SLTs at Ranchi,Chakradhapur, Dumka, Sahebganj, Hazaribag, Giridih, Gumla and Latehar,are working under the control of the Agriculture Department, will bestrengthened under the guidance of qualified scientists of the BAU.
The project also envisages establishing a new quality control laboratory(QCL) at Dumka besides refurbishing the existing QCL at Ranchi to test theefficacy and quality of nutrients and pesticides and also to check the supplyof fake fertilisers and seeds in the market.
a few days ago the Delhi Metro Rail Corporation (DMRC) hasengaged a Delhi based contractor to conduct soil testing at 47locations on the 43.55Km Ahmedabad--Gandinagar link which is theNorth South corridor. While the East-west corridor includes theKalupur railway junction and Thaltej link which is 9.83 Km. Since theentire metro project is an elevated system the soil testing becomesimportant.
"Most of the soils here are sandy silt with a little amount of gravel and are
non-plastic' in nature. Chemical analysis of sulphates, chlorides andorganic matter are being analysed in the soil.
Causes of soil degradation
8/4/2019 Soil Test File
http://slidepdf.com/reader/full/soil-test-file 14/28
Soil pollution, also commonly known as soil contamination, is a conditionthat occurs when soil loses its structure, biological properties and chemicalproperties due to the use of various man-made chemicals and other naturalchanges in the soil environment. This form of pollution is generally morecommon in developed countries, such as the USA and the United Kingdom,as compared to developing countries. Factors often believed to contributeto soil pollution include the use of chemicals such as fertilizers, the salinityof the soil and environmental changes. Some of the most common factorscausing soil pollution are
Erosion
Soil erosion can be defined as the movement of surface litter and topsoil
from one place to another. While erosion is a natural process, often caused
by wind and flowing water, it is greatly accelerated by human activities such
as farming, construction, overgrazing by livestock, burning of grass cover,and deforestation.
The loss of the topsoil makes a soilless fertile and reduces its water-holding
capacity. The topsoil, which is washed away, also contributes to water
pollution by clogging lakes and increasing the turbidity of the water,
ultimately leading to the loss of aquatic life
Excess use of fertilizers
Approximately 25% of the world's crop yield is estimated to be directly
attributed to the use of chemical fertilizers. The use of chemical fertilizers
has increased significantly over the last few decades and is expected to
rise even higher. Fertilizers are very valuable, as they replace the soil
nutrients used up by plants. The three primary soil nutrients often in short
supply are potassium, phosphorus and nitrogen compounds. These are
commonly referred to as macronutrients. Certain other elements like boron,
zinc and manganese are necessary in extremely small amounts and are
known as micronutrients. When crops are harvested, a large amount of
macronutrients and a small amount of micronutrients are removed with thecrops. If the same crop is grown again, depleted levels of thee nutrients
can result in decreased yields. These necessary nutrients can be returned
to the soil through the application of fertilizers. In addition to fertilizers, a
large amount of pesticides (chemicals used to kill or control populations of
unwanted fungi, animals or plants often called pests) are also used to
8/4/2019 Soil Test File
http://slidepdf.com/reader/full/soil-test-file 15/28
ensure a good yield. Pesticides can be subdivided into several categories,
based on the kinds of organisms they are used to control. Insecticides are
used to control insect populations, while fungicides are used to control
unwanted fungal growth. Mice and rats are killed by rodenticides, while
plant pests are controlled by herbicides.
Problems with pesticide use
Pesticides not only kill the pests but also a large variety of living things,
including humans. They may be persistent or non-persistent. Persistent
pesticides, once applied, are effective for a long time. However, as they do
not break down easily they tend to accumulate in the soil and in the bodies
of animals in the food chain.
For example, DDT, one of the first synthetic organic insecticides to be
used, was thought to be the perfect insecticide. During the first ten years of
its use (1942-1952), DDT is estimated to have saved about five million lives
primarily because of its use to control disease-carrying mosquitoes.
However, after a period of use, many mosquitoes and insects became
tolerant to DDT, thus making it lose its effectiveness.
Persistent pesticides become attached to small soil particles which are
easily moved by wind and water to different parts thus affecting soilselsewhere. Persistent pesticides may also accumulate in the bodies of
animals, and over a period of time increase in concentration if the animal is
unable to flush them out of its system, thus leading to the phenomenon
called bioaccumulation. When an affected animal is eaten by another
carnivore, these pesticides are further concentrated in the body of the
carnivore. This phenomenon of acquiring increasing levels of a substance
in the bodies of higher trophic level organisms is known as
'biomagnification'
Other problems associated with insecticides are the ability of insect
populations to become resistant to them, thus rendering them useless in a
couple of generations. Most pesticides kill beneficial as well as pest
species. They kill the predator as well as the parasitic insects that control
the pests. Thus, the pest species increase rapidly following the use of a
8/4/2019 Soil Test File
http://slidepdf.com/reader/full/soil-test-file 16/28
pesticide, as there are no natural checks to their population growth. The
short-term and the long-term health effects to the persons using the
pesticide and the public that consumes the food grown by using the
pesticides are also major concerns. Exposure to small quantities of
pesticides over several years can cause mutations, produce cancers, etc.
Excess salts and water
Irrigated lands can produce higher crop yields than those that only use
rainwater. However, this has its own set of ill effects. Irrigation water
contains dissolved salts and in dry climates much of the water in the saline
solution evaporates leaving its salts, such as sodium chloride in the topsoil.
The accumulation of these salts 15 called salinization, which can stuntplant growth, lower yields and eventually kill the crop and render the land
useless for agriculture. These salts can be flushed out of the soil by using
more water. This practice, however, increases the -cost of crop production
and also wastes enormous amounts of water.. Flushing out salts can also
make the downstream irrigation water saltier.
Another problem with irrigation is waterlogging. This occurs when large
amounts of water are used to leach the salts deeper into the soil. However,
jf the drainage is poor this water accumulates underground graduallyraising the water table. The roots of the plants then get enveloped in this
saline water and eventually die.
Thus, in the long run it is better for us to adopt sustainable farming
practices to prevent the degradation of soil.
Health effects
Contaminated or polluted soil directly affects human health through direct
contact with soil or via inhalation of soil contaminants which have
vaporized; potentially greater threats are posed by the infiltration of soil
contamination into groundwater aquifers used for human consumption,
sometimes in areas apparently far removed from any apparent source of
above ground contamination.
8/4/2019 Soil Test File
http://slidepdf.com/reader/full/soil-test-file 17/28
Health consequences from exposure to soil contamination vary greatly
depending on pollutant type, pathway of attack and vulnerability of the
exposed population. Chronic exposure to chromium, lead and other metals,
petroleum, solvents, and many pesticide and herbicide formulations can be
carcinogenic, can cause congenital disorders, or can cause other chronichealth conditions. Industrial or man-made concentrations of naturally-
occurring substances, such as nitrate and ammonia associated with
livestock manure from agricultural operations, have also been identified as
health hazards in soil and groundwater.[5]
Chronic exposure to benzene at sufficient concentrations is known to be
associated with higher incidence of leukemia. Mercury and cyclodienes are
known to induce higher incidences of kidney damage, some irreversible.
PCBs and cyclodienes are linked to liver toxicity. Organophosphates andcarbamates can induce a chain of responses leading to neuromuscular
blockage. Many chlorinated solvents induce liver changes, kidney changes
and depression of the central nervous system. There is an entire spectrum
of further health effects such as headache, nausea, fatigue, eye irritation
and skin rash for the above cited and other chemicals. At sufficient
dosages a large number of soil contaminants can cause death by exposure
via direct contact, inhalation or ingestion of contaminants in groundwater
contaminated through soil.Ecosystem effects
Not unexpectedly, soil contaminants can have significant deleterious
consequences for ecosystems[7]. There are radical soil chemistry changes
which can arise from the presence of many hazardous chemicals even at
low concentration of the contaminant species. These changes can manifest
in the alteration of metabolism of
endemic microorganisms and arthropods resident in a given soil
environment. The result can be virtual eradication of some of the primary
food chain, which in turn have major consequences for predator or
consumer species. Even if the chemical effect on lower life forms is small,
the lower pyramid levels of the food chain may ingest alien chemicals,
which normally become more concentrated for each consuming rung of the
food chain. Many of these effects are now well known, such as the
8/4/2019 Soil Test File
http://slidepdf.com/reader/full/soil-test-file 18/28
concentration of persistent DDT materials for avian consumers, leading to
weakening of egg shells, increased chick mortality and potential extinction
of species.
Effects occur to agricultural lands which have certain types of soil
contamination. Contaminants typically alter plant metabolism, most
commonly to reduce crop yields. This has a secondary effect upon soil
conservation, since the languishing crops cannot shield the Earth's soil
mantle from erosion phenomena. Some of these chemical contaminants
have long half-lives and in other cases derivative chemicals are formed
from decay of primary soil contaminants.
Environmental remediation
Clean up or environmental remediation is analyzed by environmental
scientists who utilize field measurement of soil chemicals and also
apply computer models (GIS in Environmental Contamination) for analyzing
transport[8] and fate of soil chemicals. There are several principal strategies
for remediation:
Excavate soil and take it to a disposal site away from ready pathways for
human or sensitive ecosystem contact. This technique also applies to
dredging of bay mudscontaining toxins.
Aeration of soils at the contaminated site (with attendant risk of
creating air pollution)
Thermal remediation by introduction of heat to raise subsurface
temperatures sufficiently high to volatize chemical contaminants out of
the soil for vapour extraction. Technologies include ISTD, electrical
resistance heating (ERH), and ET-DSPtm
. Bioremediation, involving microbial digestion of certain organic
chemicals. Techniques used in bioremediation
include landfarming, biostimulation and bioaugmentatingsoil biota with
commercially available microflora.
8/4/2019 Soil Test File
http://slidepdf.com/reader/full/soil-test-file 19/28
Extraction of groundwater or soil vapor with an
active electromechanical system, with subsequent stripping of the
contaminants from the extract.
Containment of the soil contaminants (such as by capping or paving
over in place). Phytoremediation, or using plants (such as willow) to extract heavy
metals
Soil types of Jharkhand & hazaribagh
Soil content of Jharkhand state mainly consist of soil formed from disintegration of rocks and stones, and
soil composition is further divided into:
1. Red soil, found mostly in the Damodar valley, and Rajmahal area
2. Micacious soil (containing particles of mica), found in Koderma, Jhumeritilaiya, Barkagaon, and
areas around the Mandar hill
3. Sandy soil, generally found in Hazaribagh and Dhanbad
4. Black soil, found in Rajmahal area
5. Laterite soil, found in western part of Ranchi, Palamu, and parts of Santhal
Parganas and Singhbhum
Many Kinds of soil, namely, gravely soils, sans loam, red ferruginous loam, rive alluvium
and even black sticky clay are found, which show on the average 0.05 percent Nitrogen,
0.001 per cent Phosphate, 0.010 per cnt Potash and 5.5 to 6.8 per cent, the maxium value
of Nitrogen being 0.106 per cent and the minimum 0.027 per cent. According to the commonly
accepted terminology the soild of the district can roughly
be classified into three categories, namely (1) kewal, (2) lalki matti, (3) daudhiya matti.
Kewal soil is dark grey in olour and is the most fertilie in the district. With the help of the
common manure of cowdung or cmjpost and chemical fertilizers it has yielded up to 120
maunds of paddy per care. The red soil is more common in the district and grow maize,
bajra and arhar during kharif season and surgujiya (oil-seed) during rabi season. If irrigational
8/4/2019 Soil Test File
http://slidepdf.com/reader/full/soil-test-file 20/28
facilities are available paddy could also be grown and red soil. Durdhiya matti or calcareous
soil has an excess of lime and could only be cultivable with the help of a profuse quantity
of cowdung and other organic materials.
Soil Sample Preparation
Ideally, a soil should be tested without disturbing or altering it chemically or mechanically in the
process of sample preparation.
soil samples are usually dried and pulverized.
Subsamples of the dry,pulverized soils are either weighed or measured byvolume.
Galvanized containers, cast iron mortars,rubber stoppers, brass screens and a variety of othertools can contribute to contamination with iron, zinc and other micronutrients, and
should not be used.
dryingcan result in increased release of exchangeable potassium(K) in many soils and infixation in others.
(The fixation tends to occur in recently fertilized soils at higher test levels.)
Increased temperature can also increase the exchangeable K levels
Early studies in Iowa (11) showed that the results from field-moist samples were better
correlated with the potassium uptake by plants than the results from air-dried soils. Highercorrelations with field-moist samples were also found in the regional K studies in the late 1950s
and early 1960s .
The K release on drying and the reversion on rewetting can be controlled with organicadditives (12), but this procedure has not been evaluated in practical soil testing.
Drying and method of drying may also affect the results of the tests for mineralizablenitrogen (10), phosphorous (13), sulfur (3, 13, 16), zinc (7) and perhaps other
micronutrients, but the correlations between the test results and the uptake of nutrients by
plants have not been shown to be significantly affected by drying.Primarily because of the effect of drying on potassium results, a method of testing undried soil
samples was developed and put into use in the Iowa State University Soil Testing Laboratory
until 1990. Because of the difficulties of analyzing moist samples and because most correlation
and calibration studies have been done on air dried soils, the undried soil analysis method has notbeen adopted widely.
The traditional method of preparing dry samples is presented here.
Recommended Procedure for Handling Dry Soil Samples
Traditionally, most soil analysts have considered dry soil as the convenient state from which to
start chemical tests. Because soil samples are received in a wide range of physical conditions, a
common denominator in preparation is required to alleviate these problems and expediteprocessing.
8/4/2019 Soil Test File
http://slidepdf.com/reader/full/soil-test-file 21/28
Drying
Moist, well-mixed samples may be transferred to paper bags, cardboard boxes or
aluminum trays of convenient size. The open sample container is then placed in a drying rack or cabinet equipped with
exhaust fans to expedite air movement and moisture loss.
If heat is necessary, the temperature of the cabinet should not exceed 40°C (104°F). This
is especially critical for potassium analysis, which can be significantly influenced bydrying temperatures.
If nitrate analyses are involved, the soil should be dried or frozen within 12 hours of
sampling. Such samples can be dried by spreading them out on a clean paper or cloth and
blow drying them with a fan.
Where sample volume is not adequate to justify artificial drying, samples may be spreadon clean surfaces,such as paper plates. Initial crushing of soil clods will decrease the time
required for drying at room temperatures.Microwave drying is a relatively rapid methodto dry a few soil samples. For moisture determination,the method worked well .
However, microwavedrying appears to change many nutrient analyses as compared to
air-drying , and is not recommended.
Crushing and Sieving
The nature of analyses to be conducted, plus presence of rocks or limestone concretions, dictateinitial steps to crushing.
Crush samples designated for mechanical analyses with a wooden rolling pin afterremoving all stony material from the soil
Crush other samples with a flail-type grinder, a power-driven mortar and pestle, or some
other
crusher which is designed to minimize contamination through carryover from one sampleto another
If micronutrient analyses are to be performed, it is essential that all surfaces coming into
contact with the soil be stainless steel, plastic or wooden, preferably in the order listed. Crushing to pass a finer mesh sieve may be desirable for analysis utilizing less than one
gram of soil.
pH and Lime Requirement
In most soils, the soil pH is buffered by several components of the solid phase, including
hydroxyl aluminum monomers and polymers,
soil organic matter, and
undissolved carbonates in soils.
8/4/2019 Soil Test File
http://slidepdf.com/reader/full/soil-test-file 22/28
Lime requirement tests, which generate recommendations for effecting relatively long-term
changes in soil pH, are designed to account for soil buffering capacity.
Soil pH Determination
Several precautions should be taken when measuring pH of a soil/liquid slurry.
Electrodes should be checked and maintained frequently to prevent surface residue
buildup, which may affect the measurement.
Rinsing between each soil sample, however, is not usually necessary. Electrodes should be protected to prevent insertion to the very bottom of the slurry-
containing vessel. If this is not done, abrasion of the sensing surfaces will occur,
decreasing the life of the electrode and leading to inaccurate pH readings.
All meters should be calibrated routinely at two points with buffer solutions of known
pH before measuring the pH of a soil sample.
use a set of reference soil samples of known pH to evaluate the performance of electrodes
Soil pH is normally measured in a soil/water slurry. The presence of soluble salts in a soil sample
will affect pH. For that reason, some analysts prefer to measure pH in a mixture of soil and 0.01
M CaCl2 . The excess salt in this solution masks the effects of differential soluble saltconcentrations in individual samples. Below are procedures
Equipment and Reagents
1. 5 g soil
2. pH meter with appropriate electrode(s)
3. Paper cups or equivalent4. Distilled or deionized water
5. 0.01 or 1.0 M CaCl2
6. Appropriate buffer solutions for calibrating the pH meter
Procedure
1. Add 5 mL distilled or deionized water to the 5 g soil sample2. Stir vigorously for 5 seconds and let stand for 10 minutes.
3. Place electrodes in the slurry, swirl carefully and read the pH immediately. Ensure that
the electrode tips are in the swirled slurry and not in the overlying solution.
For the CaCl2 measurement,
I. add one drop of 1.0 M CaCl2 solution to the previous sample, or prepare a sample as inSteps 2 and 3, using 0.01 M CaCl2 instead of water.
II. Stir vigorously and let stand 30 minutes, with occasional stirring.
III. Read the pH as in Step 3.
8/4/2019 Soil Test File
http://slidepdf.com/reader/full/soil-test-file 23/28
SOIL ORGANIC MATTER
Equipment:1. Standard 1 g scoop.
2. Glass marbles with a diameter slightly larger than the mouth of a 50 mL Erlenmeyer flask.
3. 50 mL Erlenmeyer flasks.4. Digestion oven, capable of temperatures to 90oC, with air circulation fan and fume exhaust.
5. 10 and 25 mL pipettes or dispensers.
6. Standard organic matter samples.
Reagents:
1. Digestion solution: (0.5 M Na2Cr2O7 •2H2O in 5 M H2SO4):Dissolve 140 g Na2Cr2O7•2H2O in 600 mL of distilled water. Slowly add 278 mL of concentrated
H2SO4. Allow to cool and dilute to 1 L with deionized water.
Procedure:
1. Scoop 1 g of soil into a 50 mL Erlenmeyer flask.2. Pipette 10 mL of dichromate-sulfuric acid digestion solution. Include a reagent blank without
soil.3. Cover the Erlenmeyer flasks with glass marbles, which act as reflux condensers, to minimize
loss of chromic acid.
4. Place in the digestion oven and heat to 90oC for 90 minutes.5. Remove samples from the oven, let cool 5 to 10 minutes, remove the glass marble caps, and
add 25 mL of water.
6. Mix the suspension thoroughly by blowing air through the suspension via the 25-mL pipettes
used to add water or by mechanical shaking.7. Allow to stand three hours or overnight.
8. Transfer 10 mL (or other suitable volume of clear supernatant into a colorimeter tube. This can
be accomplished conveniently by use of a pipette bank set to dip a suitable distance into the
supernatant solutions. Care must be taken not to disturb the sediment on the bottom of the flasks.9. The blue color intensity of the supernatant is read on a colorimeter at 645 nm with the reagent
blank set to give 100% transmittance (or 0 absorbance). The instrument is calibrated to read
percent organic matter from a standard curve prepared from soils of known organic mattercontent.
Soil Inorganic Nitrogen
Nitrate Nitrogen
In this procedure, nitrogen in the form of the nitrate ion (NO3 — N) is extracted from the soil with
water and measured colorimetrically after reaction with phenoldisulphonic acid.Water is used to extract NO3 — N, using 1 part soil to 5 parts water. Colloids are precipitated with
Ca++, and soluble organics are removed with activated charcoal. After filtration, an aliquot of
extract is reacted with phenoldisulphonic acid. The NO3 — N forms a blue-colored complex,
8/4/2019 Soil Test File
http://slidepdf.com/reader/full/soil-test-file 24/28
which is analyzed with a colorimeter.
Interferences
Principles interferences are chloride and soluble organic compounds. Chloride is precipitated
with Ag2SO4. Colored organic compounds are co-precipitated with Cu(OH)2 by the addition of
CuSO4, followed by Ca(OH)2.
Apparatus and Materials
1 Soil 10 g2 Erlenmeyer flask, 125- ml
3 Graduate cylinder, 50-ml, 100-ml
4 Oscillating shaker
5 Measuring scoop, ½ tsp6 Beaker, 150-ml
7 Funnel tubes
8 Hotplate
9 Pipette, 10-ml10 Medicine dropper, 3-ml
11 Burette, 50-ml
12 Colorimeter or spectrophotometer13 Colorimeter tubes, matched
6. Reagents.
1.CuSO4 solution, saturated: Add 210 g of CuSO4 .5H2O to 100 ml of water.2. Ag2SO4 solution, saturated: Add 10 g of Ag2SO4 to 100 ml of water.
3 Ca(OH)2: finely ground powder
4 MgCO3: finely ground powder
5 Activated charcoal: Heat in a muffle furnace at 500 oC for 1 hour to remove NO3 -.6 Phenoldisulphonic acid: Dissolve 83 g pure phenol in 500 ml of concentrated H2SO4.
Dissolve until clear. (Check the H2SO4 for NO3 - contamination by dropping several
crystals of phenol in several ml of the acid. The solution must remain clear.) Add a 1-pintbottle of fuming H2SO4. (Use the fume hood!) Place in a boiling water bath for two
hours. Store in an amber bottle in a dark cabinet. This reagent is extremely corrosive.
7 NH4OH, 1:1: Mix equal volumes of concentrated NH4OH and distilled water.8 Stock standard nitrate solution, 500 ppm N: Dissolve 3.60 g KNO3, dried at 105 °C, in
water and dilute to 1 liter with water.
9 Dilute standard nitrate solution, 20 ppm N: Dilute 20 ml of 500 ppm N to 500 ml with
water.
Methods
1. Place 10-g of soil into a 125- ml Erlenmeyer flask.
2. Add 50 ml of water by means of a graduate cylinder.3. Add 2 drops of Ag2SO4 and 3 drops of CuSO4.
4. Shake 10 min on an oscillating shaker (or 30 min intermittently by hand).
5. Add ½ tsp of Ca(OH)2; shake thoroughly by hand and let stand 10 minutes.6 . Decant about 30 ml of the suspension into a 150- ml beaker.
8/4/2019 Soil Test File
http://slidepdf.com/reader/full/soil-test-file 25/28
7. Add ½ tsp of MgCO3 and swirl.
8. Add ½ tsp of activated charcoal; shake by hand and let stand 2 to 3 minutes.9 . Filter into funnel tubes.
10 . Wash the 150- ml beakers employed in steps 6 – 9.
11. Pipette 10 ml of filtrate into the same 150-ml beaker, and evaporate to dryness on a
hotplate. The temperature of the hotplate should not be high enough to permit spatteringas the solution approaches dryness. The sample must be completely dry.
12. Cool; then add 3 ml of phenoldisulphonic acid rapidly to the residue in the beaker. Use a
rapid delivery medicine dropper calibrated to deliver 3 ml. The reagent should flood thebottom of the beaker rapidly to prevent formation and loss of volatile nitrogen oxides.
13. Swirl; let stand until the residue is dissolved and the solution is clear.
14. Carefully add approximately 20 ml of distilled water.15. Cool.
16. With a 50- ml burette in a fume hood, carefully add 1:1 NH4OH until full yellow color
develops and then 3 ml in excess (approximately 15 ml total).
17. Transfer the sample to a 100-ml graduate cylinder and dilute to 99 ml with water. Mix the
solution by pouring back-and-forth from cylinder to beaker several times. (A smallamount of solution will remain as a film in the beaker. Also, a graduate cylinder is
calibrated ―to deliver‖ rather than ―to contain‖ a given volume. A 100-ml graduatecylinder will contain slightly more than 100 ml, the excess being retained as a film on the
cylinder walls when the cylinder is emptied. To compensate, the cylinder is filled to only
99 ml. A volumetric flask should be used for precise work.)18. Determine the NO3 — N using a colorimeter at 420 nm. Zero the colorimeter with a
reagent blank.
Phosphorus
The Bray and Kurtz P-1 Test results are well-correlated with yield response on most acid and
neutral soils in the region. This test is used for soils that contain small amounts (less than 2
percent) of dolomite or calcium carbonate . It should not be used for soilscontaining large amounts of lime. Since the phosphorus may be precipitated during extraction,
the result is very low test values .
The Sodium Bicarbonate (Olsen) test for P is preferred for highly calcareous soils. The test
results are well-correlated with crop response to P fertilization on both calcareous andnoncalcareous soils. The Sodium Bicarbonate (Olsen) Test values are more highly
correlated with yield response on calcareous soils than the Bray and Kurtz P-1 (1:10 ratio).
Bray and Kurtz P-1 Test for Phosphorus
8/4/2019 Soil Test File
http://slidepdf.com/reader/full/soil-test-file 26/28
The method detection limit is approximately 1.0 mg kg-1 (dry soil basis) and can be reproduced
plus or minus 10 percent. The color development procedure can be accomplished manually or byautomated techniques
Equipment
1. No. 10 (2 mm opening) sieve2. 2 g soil scoop
3. Automatic extractant dispenser, 25 mL capacity.(If preferred, pipettes are acceptable.)
4. 50 mL Erlenmeyer extraction flasks5. Rotating or reciprocating shaker with a capability of 200 excursions per minute (epm)
6. Filter funnels, 9 to 11 cm
7. Whatman No. 42 or No. 2 (or equivalent) filter paper, 9 to 11 cm. (Acid resistant filter papermay be needed if using automated method of determining concentration by intensity of color.
Bits of filter paper may cause an obstruction in the injection valves.)
8. Funnel rack
9. Appropriate vials for color development
10. Volumetric flasks and pipettes required for preparation of reagents and standard solutions;pipettes or a dilutor used for color development
11. Photometric colorimeter (manual or automated) suitable for measurement in the 882 nmrange (610 to 660 for Fiske-Subbarrow)
12. A computer or calculator, used for calculation of the concentrations of phosphorus in the soil
Extractant: 0.025 M HCl in 0.03 M NH4F
1. Dissolve 11.11 g of reagent-grade ammonium fluoride (NH4F) in about 9 L of distilled water.
2. Add 250 mL of 1.00 M HCl (previously standardized) and make to 10 L volume with distilled
water.3. Mix thoroughly.
4. The pH of the resulting solution should be 2.6 plus or minus .05. The adjustments to pH are
made using HCl or ammonium hydroxide (NH4OH).
5. Store in polyethylene.
Phosphorus Standards1. Stock Standard Phosphorus Solution (50 ppm P)
a. Dissolve 0.2197 g of oven-dried, reagentgrade potassium dihydrogen phosphate (KH2PO4) in
about 25 mL of distilled water.b. Dilute to a final volume of 1,000 mL with extracting solution. (If this solution is stored at
40°F, its shelf life should be approximately 6 months.)
2. Working Standard Solutions
a. Using the information in Table 1 for Bray and Kurtz P-1, pipette appropriate volumes of 50ppm stock standard P solution into proper volumetric flasks.
b. Use the extracting solution to bring each standard to the proper volume.
Potassium
8/4/2019 Soil Test File
http://slidepdf.com/reader/full/soil-test-file 27/28
Potassium (K) in soil is generally estimated by measurement of the water soluble and exchangeable forms. The
amounts of K in the soil solution are quite small relative to the amounts in the exchangeable form.
Estimate of Available PotassiumEquipment1. Standard NCR-13, 1 or 2 g scoop
2. Automatic or semi-automatic extracting solution dispenser (10 or 20 mL)3. Extracting flasks (50 mL Erlenmeyer or conical flasks)
4. Funnels (or filter holding devices) and filter Paper
5. Receiving receptacle (20 to 30 mL beakers or test tubes)
6. Rotating or reciprocating shaker capable of 200 excursions per minute (epm)
7. Atomic absorption/emission spectrometer (set in the emission mode for K)
Reagents1. Extracting Solution (1 M NH4OAc at pH 7.0)
a. Place approximately 500 mL of distilled water into the mixing vessel. Add 57 mL of glacial acetic acid (99.5
percent) then add 69 mL of concentrated ammonium hydroxide (MIX IN THE FUME HOOD). Bring the volume to
about 900 mL with distilled water. Adjust to pH 7.0 with 3 M NH4OH or 3M acetic acid. After cooling to room
temperature, bring the solution to a volume of 1 L and recheck the pH.
b. Alternative: Reagent grade ammonium acetate may be used. Add 77.1 g of NH4OAc to 900 mL of distilled water.
After dissolution of the salt, adjust the pH to 7.0 as above. Dilute to a final volume of 1 L. (Check this solution for
potassium contamination from the salt.)
2. Extracting Solution (Mehlich-3)
0.2 N Ch3COOH (acetic acid, glacial: 99.5 percent, fw 60.04, 17.4 N), 0.25 N NH4NO3 (ammonium nitrate: fw
80.05), 0.015 N NH4F (ammonium fluoride: fw 37.4), 0.013 N HNO3 (nitric acid:68 to 70 percent, fw 63.02, 15.5
N), 0.001 M EDTA [(HOOCH2)2NCH2NCCH2COOH)2, ethylenediaminetretraacetic acid: fw 292.24].
a. Add 8 L of distilled water to a 10 L carboy.
b. Dissolve 200 g of ammonium nitrate in the distilled water.
c. Add 40 mL NH4F-EDTA stock solution and mix.
d. Add 11.5 mL acetic acid.
e. Add 8.2 mL of nitric acid.
f. Add distilled water to bring volume to 10 L. Mix throroughly (provides enough extractant for 400 samples).
3. Standardsa. Stock solution (1,000 ppm K)
Dissolve 1.9073 g oven dry, reagent grade KCl in 1 M NH 4OAc at pH 7.0. Bring to a volume of 1,000 mL with the
extracting solution and mix well.
b. Prepare a 100 ppm standard by diluting 100 mL of the 1,000 ppm K stock solution to 1 L with extracting solution.
Pipette 10, 20, 30, 40 and 50 mL of the 100 ppm K solution into 100 mL volumetric flasks and bring each to volume
with extracting solution. These solutions will contain 10, 20, 30, 40 and 50 ppm K, respectively. The extracting
solution serves as the 0 ppm standard.
4. Reference Soil
One or more reference soil samples of medium to low levels of exchangeable K should be available to carry through
each run of unknowns. These reference samples should be prepared in bulk by regular sample preparation methods
and stored in sealed containers at cool temperatures (4 to 20°C).
Procedure1. Scoop 2 g of prepared soil into an extraction flask. (See Chapter 2 for scooping techniques. Use the appropriate
number of blanks and reference samples per laboratory quality assurance/ quality control procedures.)
2. Add 20 mL of extracting solution to the extraction flask. ( Note: The quantity of soil and extracting solution may
be varied as long as the 1:10 ratio is maintained.)
3. Shake for 5 minutes on the shaker at 200 epm. Recheck speed weekly.
4. Filter the suspensions through Whatman No. 2 or equivalent filter paper. Refilter or repeat if the extract is cloudy.
5. Set up the atomic adsorption/emission spectrometer for K by emission. After warmup, determine the standard
curve using the standards and obtain the concentrations of K in the soil extracts.

8/4/2019 Soil Test File
http://slidepdf.com/reader/full/soil-test-file 28/28
6. To convert K concentration (ppm) in the soil extract solution to ppm in a soil (mg K/kg), multiply by 10. To
convert to pounds of K per acre, multiply by 20.
Related Documents