Europ. J. Agronomy 23 (2005) 254–264 Soil salinization affects growth, yield and mineral composition of cauliflower and broccoli Stefania De Pascale, Albino Maggio ∗ , Giancarlo Barbieri Department of Agricultural Engineering and Agronomy, University of Naples Federico II, Via Universit` a 100, 80055 Portici, NA, Italy Received 13 January 2004; received in revised form 20 September 2004; accepted 29 November 2004 Abstract In coastal regions of Mediterranean areas, summer crops are often irrigated with saline water. As a consequence, salts may accumulate in the root zone, damaging the following winter crops if the rainfall is insufficient to leach them. In 1994 and 1996 we investigated the effect of residual salts from the previous summer irrigations on plant growth, yield and mineral composition of cauliflower and broccoli, two non-irrigated winter crops. The salt treatments for the irrigated summer crops were four concentrations of commercial sea salt, corresponding to EC w of 2.3 (S1), 4.4 (S2), 8.5 (S3) and 15.7 dS m −1 (S4), plus a non-salinized control (NSC 0.5 dS m −1 ). An increase of the electrical conductivity of the saturated-soil extract (EC e ) from 2.0 dS m −1 (NSC) to 6.0 dS m −1 (S4) caused a decrease in the marketable yield from 26.9 to 9.6 t ha −1 and from 15.8 to 4.9 t ha −1 in cauliflower and broccoli, respectively. A 55 and 57% salt induced leaf area reduction was observed in cauliflower and broccoli, respectively. Leaf dry matter concentration and specific leaf weight were positively correlated with EC e . In contrast, head weight and diameter were negatively correlated with EC e . Based on the Maas and Hoffman bi-linear model we ranked cauliflower and broccoli as moderately tolerant crops. The EC e thresholds were 1.52 and 1.28 dS m −1 and the relative yield reductions per unit increase in EC e above the threshold were 14.4 and 15.8% for cauliflower and broccoli, respectively. Assessment of the relative yield as a function of soil pH revealed an 80 and 119% yield reduction per pH unit increase above a 7.2 and 7.12 threshold for cauliflower and broccoli, respectively. Head concentration of Na, Cl, S and Fe increased with soil EC e whereas N, P and K decreased. Overall, residual soil salinity and salt-induced permanent modifications of the soil physical–chemical properties affected both growth and yield of non-irrigated cauliflower and broccoli crops. © 2004 Elsevier B.V. All rights reserved. Keywords: Brassica oleracea L. Botrytis Group; Brassica oleracea L. Italica Group; EC e ; Long-term saline irrigation; Salt tolerance; Soil pH ∗ Corresponding author. Tel.: +39 081 2539133; fax: +39 081 7755129. E-mail address: [email protected] (A. Maggio). 1. Introduction Soil salinity is a serious problem in arid and semi- arid zones of the world where poor-quality water is of- ten the only available for irrigation (Tanji, 1990; Maas and Grattan, 1999). Salts tend to accumulate in the 1161-0301/$ – see front matter © 2004 Elsevier B.V. All rights reserved. doi:10.1016/j.eja.2004.11.007

Welcome message from author
This document is posted to help you gain knowledge. Please leave a comment to let me know what you think about it! Share it to your friends and learn new things together.
Transcript
Europ. J. Agronomy 23 (2005) 254–264
Soil salinization affects growth, yield and mineralcomposition of cauliflower and broccoli
Stefania De Pascale, Albino Maggio∗, Giancarlo Barbieri
Department of Agricultural Engineering and Agronomy, University of Naples Federico II, Via Universita 100, 80055 Portici, NA, Italy
Received 13 January 2004; received in revised form 20 September 2004; accepted 29 November 2004
Abstract
In coastal regions of Mediterranean areas, summer crops are often irrigated with saline water. As a consequence, salts mayaccumulate in the root zone, damaging the following winter crops if the rainfall is insufficient to leach them. In 1994 and1996 we investigated the effect of residual salts from the previous summer irrigations on plant growth, yield and mineralcomposition of cauliflower and broccoli, two non-irrigated winter crops. The salt treatments for the irrigated summer crops werefour concentrations of commercial sea salt, corresponding to ECw of 2.3 (S1), 4.4 (S2), 8.5 (S3) and 15.7 dS m−1 (S4), plusa non-salinized control (NSC 0.5 dS m−1). An increase of the electrical conductivity of the saturated-soil extract (ECe) from2.0 dS m−1 (NSC) to 6.0 dS m−1 (S4) caused a decrease in the marketable yield from 26.9 to 9.6 t ha−1 and from 15.8 to 4.9 t ha−1
in cauliflower and broccoli, respectively. A 55 and 57% salt induced leaf area reduction was observed in cauliflower and broccoli,respectively. Leaf dry matter concentration and specific leaf weight were positively correlated with ECe. In contrast, head weightand diameter were negatively correlated with ECe. Based on the Maas and Hoffman bi-linear model we ranked cauliflower andb niti e relativey thresholdf dK ropertiesa©
K pH
f
mi-of-
she
1d
roccoli as moderately tolerant crops. The ECe thresholds were 1.52 and 1.28 dS m−1 and the relative yield reductions per uncrease in ECe above the threshold were 14.4 and 15.8% for cauliflower and broccoli, respectively. Assessment of thield as a function of soil pH revealed an 80 and 119% yield reduction per pH unit increase above a 7.2 and 7.12or cauliflower and broccoli, respectively. Head concentration of Na, Cl, S and Fe increased with soil ECe whereas N, P an
decreased. Overall, residual soil salinity and salt-induced permanent modifications of the soil physical–chemical pffected both growth and yield of non-irrigated cauliflower and broccoli crops.2004 Elsevier B.V. All rights reserved.
eywords: Brassica oleracea L. Botrytis Group;Brassica oleracea L. Italica Group; ECe; Long-term saline irrigation; Salt tolerance; Soil
∗ Corresponding author. Tel.: +39 081 2539133;ax: +39 081 7755129.
E-mail address: [email protected] (A. Maggio).
1. Introduction
Soil salinity is a serious problem in arid and searid zones of the world where poor-quality water isten the only available for irrigation (Tanji, 1990; Maaand Grattan, 1999). Salts tend to accumulate in t
161-0301/$ – see front matter © 2004 Elsevier B.V. All rights reserved.oi:10.1016/j.eja.2004.11.007
S. De Pascale et al. / Europ. J. Agronomy 23 (2005) 254–264 255
upper soil profile, especially when an intense evapo-transpiration is associated to an insufficient leaching(Rhoades et al., 1992; De Pascale and Barbieri, 1997).The addition of salts to the soil alters its physical andchemical properties, including soil structure and hy-draulic conductivity. Excessive exchangeable sodiumand high pH decrease the soil permeability and infiltra-tion capacity through swelling and dispersion of claysas well as slaking of aggregates (Lauchli and Epstein,1990). These modifications may further compromisethe yield of salinized crops.
An abundant literature on crop salt tolerance is avail-able (Maas and Grattan, 1999; Munns, 2002; Maggioet al., 2002a), but only few studies have analysed theeffects of repeated use of saline water on both irrigatedand non-irrigated crops in a field context (Rains andGoyal, 2003). The maintenance of adequate soil phys-ical properties in saline environments may be achievedby using water and soil amendments and proper culturalpractices (Grattan and Oster, 2003). In this respect, thechoice of the most suitable combination of crops maybe critical to optimize farm management in saline agri-culture. The objective of this research was to examinethe influence of residual soil salinity on growth, yieldand mineral composition of rain fedBrassica speciesafter irrigation with saline water on summer crops.
2. Materials and methods
outa ti-t si um-m 7%s nicm ntsa %( za-t coli( dedc andc reat-m iga-t nd1 ingc0
tion water (Na+ 0.53, K+ 0.05, Ca2+ 1.55, Mg2+ 0.84,Cl− 0.38, SO4
2− 0.15, HCO3− 4.73 mol m−3). Fur-
thermore, a non-salinized control (NSC, 0.5 dS m−1)was included. In 1988, when we began a project aimedat evaluating the long-term effect of soil salinizationon plant response to saline irrigation, the salinity treat-ments and relative controls were arranged in a random-ized block design with three replications. Since the ob-jective of that study was to investigate long-term effectsof salinization, the salinity treatments, randomly as-signed within each block in 1988, had to be reassignedto the same experimental field plots in the followingyears. Therefore, from 1988 each 100 m2 experimentalplot had received the same EC irrigation water.
In the fall of 1994, the effect of residual soil salin-ity was investigated on cauliflower (Brassica oleraceaL. Botrytis Group cv. Snow Prince). Seedlings weretransplanted on September 1, in rows 1 m apart withan intra-row spacing of 0.55 m. Prior to transplanting,90 kg N ha−1 (as ammonium sulphate), 100 kg P ha−1
(as superphosphate) and 200 kg K ha−1 (as potassiumsulphate) were applied. Subsequently, plants were fer-tilized with two additional applications of 55 kg N ha−1
(as ammonium nitrate) (2 and 6 weeks after transplant-ing). Harvest begun on December 22 and ended onJanuary 4 (1995). Plants were harvested at the com-mercial head size. At harvest, plants were cut at thesoil surface, counted and weighted. The heads werethen trimmed by removing the leaves. Then num-ber and weight of marketable (diameter≥11 cm) andn gin-n d tom 000a ndd sa lcu-l leafsm Mg,N ei-t y ac romy andh con-c hod.S ma( ,1
In 1994 and 1996 two experiments were carriedt the University of Naples experimental farm (la
ude 40◦31′N; longitude 14◦58′E) on a field that warrigated since 1988 with saline water during the s
er. The soil was clay loam with 42% sand, 2ilt, 31% clay, trace amounts of lime, 1.57% orgaatter, 0.09% N, pH of 7.1, and soil water contet field capacity and at−1.5 MPa of 34.5 and 17.5v/v), respectively. The effects of residual soil saliniion were evaluated on cauliflower (1994) and broc1996). The irrigated summer crops, which preceauliflower and broccoli were watermelon (1994)abbage (1996). For these crops, the salinization tents consisted of four salt concentrations of the irr
ion water with ECw of 2.3 (S1), 4.4 (S2), 8.5 (S3) a5.7 (S4) dS m−1. Saline water was obtained by addommercial sea salt (Na+ 12.3, K+ 3.8, Ca2+ 0.02, Mg2+
.04, Cl− 14.4, SO42− 0.03 mol kg−1) to the irriga-
on-marketable heads were determined. At the being of harvest, 10 plants per plot were sampleeasure leaf number, leaf area (using a Li-Cor 3rea meter, Li-Cor – Lincoln, NE, USA), fresh ary weight (after drying at 60◦C) of leaves, stemnd heads. Specific leaf weight (SLW) was ca
ated as the ratio leaf dry mass/leaf area anducculence (LS) as the ratio leaf× [fresh mass− dryass]/leaf area. Concentrations of P, K, Ca,a, Cl, Fe, Mn, B, Cu and Zn were measured
her by atomic absorption spectrophotometry or bolorimetric assay on dried and ground tissue foung (internal) leaves, mature (external) leaveseads of the NSC, S3 and S4 plants. Nitrogenentration was measured using the Kjeldhal metulfur was analyzed by inductively coupled plas
ICP) atomic emission spectrometry (Walinga et al.995).
256 S. De Pascale et al. / Europ. J. Agronomy 23 (2005) 254–264
During the fall/winter of 1996–1997, the effect ofresidual soil salinity was studied on broccoli (Bras-sica oleracea L. Italica Group cv. Marathon). Seedlingswere transplanted on November 8 (1996) in rows 0.5 mapart with an intra-row spacing of 0.4 m. The ini-tial fertilization consisted of 120 kg N ha−1 (as am-monium sulphate), 150 kg P ha−1 (as superphosphate)and 200 kg K ha−1 (as potassium sulphate). In addi-tion, ammonium nitrate (50 kg N ha−1) was appliedafter 4 and 8 weeks from transplanting. Plants wereharvested at commercial maturity of the terminal andlateral heads on February 2 and April 9 (1997).At harvest, number of plants, marketable and non-marketable heads, and their weight and number weremeasured from each whole experimental plot. Max-imum head diameter and dry matter (after dryingat 60◦C) were measured on 10 plants from eachplot. Leaf number, leaf area, dry matter, specific leafweight (SLW) and leaf succulence (LS) were quan-tified on 10 plants from each plot. Heads mineralcomposition was measured in all the salinity treat-ments.
Prior to transplanting, and subsequently at 1-monthintervals, soil samples were taken in each individ-ual plot at 0.3 m depth increments along the 0–1.2 msoil profile for electrical conductivity (ECe) and pHmeasurements of the saturated-soil extract (Kalra andMaynard, 1991). For each treatment, 12 individualsoil samples [one per each soil depth (0–0.3, 0.3–0.6,0.6–0.9 and 0.9–1.2 m) per three replications)] weret thsf
answ
ord-i delY ;s ins c-t enft oesn linecu s soilp( oilp
3. Results
3.1. Meteorological conditions, soil salinity andpH
Total rainfall during the 1994 was 253 mm, whereasin 1996–1997 growing seasons it reached 608 mm. Av-erage daily temperatures were 17 and 12◦C in 1994 and1996–1997, respectively.
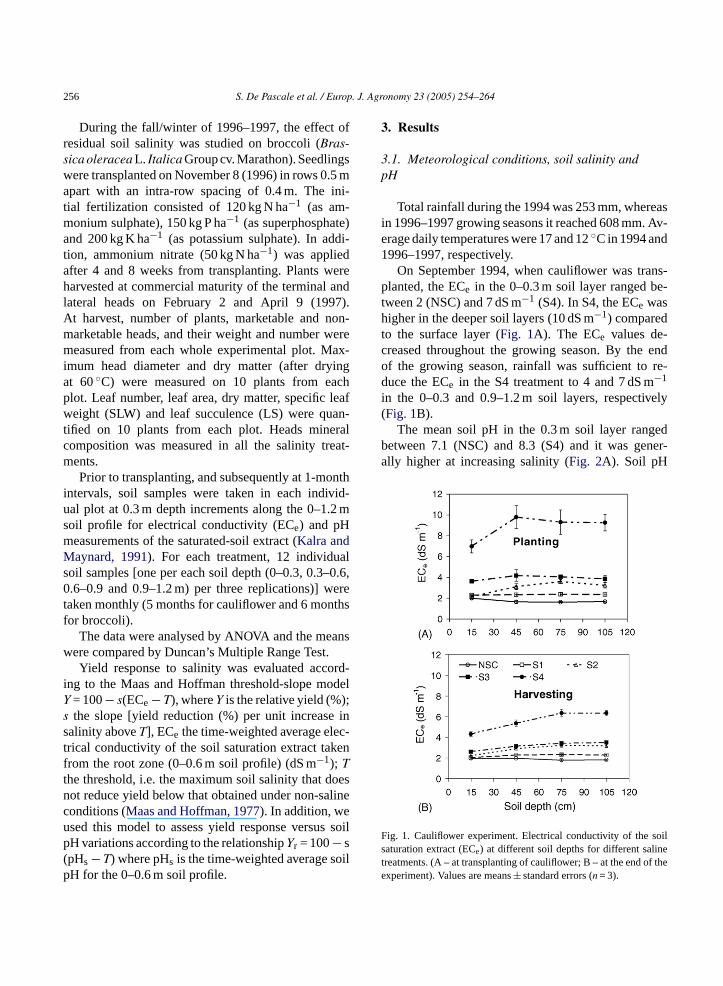
On September 1994, when cauliflower was trans-planted, the ECe in the 0–0.3 m soil layer ranged be-tween 2 (NSC) and 7 dS m−1 (S4). In S4, the ECe washigher in the deeper soil layers (10 dS m−1) comparedto the surface layer (Fig. 1A). The ECe values de-creased throughout the growing season. By the endof the growing season, rainfall was sufficient to re-duce the ECe in the S4 treatment to 4 and 7 dS m−1
in the 0–0.3 and 0.9–1.2 m soil layers, respectively(Fig. 1B).
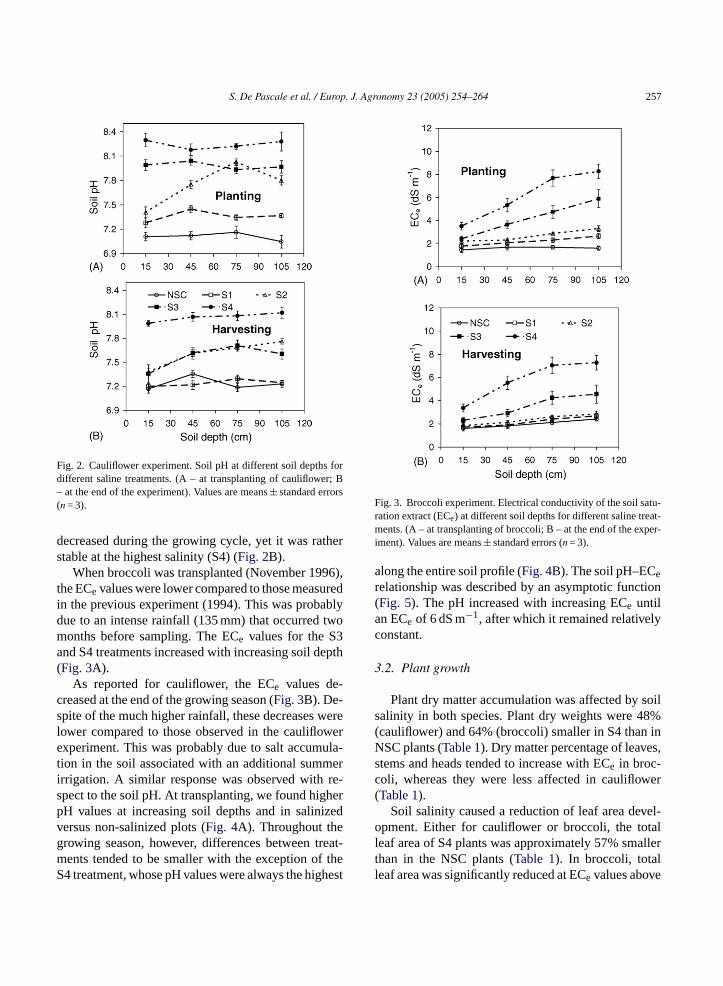
The mean soil pH in the 0.3 m soil layer rangedbetween 7.1 (NSC) and 8.3 (S4) and it was gener-ally higher at increasing salinity (Fig. 2A). Soil pH
F soils net ee
aken monthly (5 months for cauliflower and 6 monor broccoli).
The data were analysed by ANOVA and the meere compared by Duncan’s Multiple Range Test.Yield response to salinity was evaluated acc
ng to the Maas and Hoffman threshold-slope mo= 100− s(ECe− T), whereY is the relative yield (%)the slope [yield reduction (%) per unit increasealinity aboveT], ECe the time-weighted average elerical conductivity of the soil saturation extract takrom the root zone (0–0.6 m soil profile) (dS m−1); The threshold, i.e. the maximum soil salinity that dot reduce yield below that obtained under non-saonditions (Maas and Hoffman, 1977). In addition, wesed this model to assess yield response versuH variations according to the relationshipYr = 100− spHs− T) where pHs is the time-weighted average sH for the 0–0.6 m soil profile.
ig. 1. Cauliflower experiment. Electrical conductivity of theaturation extract (ECe) at different soil depths for different salireatments. (A – at transplanting of cauliflower; B – at the end of thxperiment). Values are means± standard errors (n = 3).
S. De Pascale et al. / Europ. J. Agronomy 23 (2005) 254–264 257
Fig. 2. Cauliflower experiment. Soil pH at different soil depths fordifferent saline treatments. (A – at transplanting of cauliflower; B– at the end of the experiment). Values are means± standard errors(n = 3).
decreased during the growing cycle, yet it was ratherstable at the highest salinity (S4) (Fig. 2B).
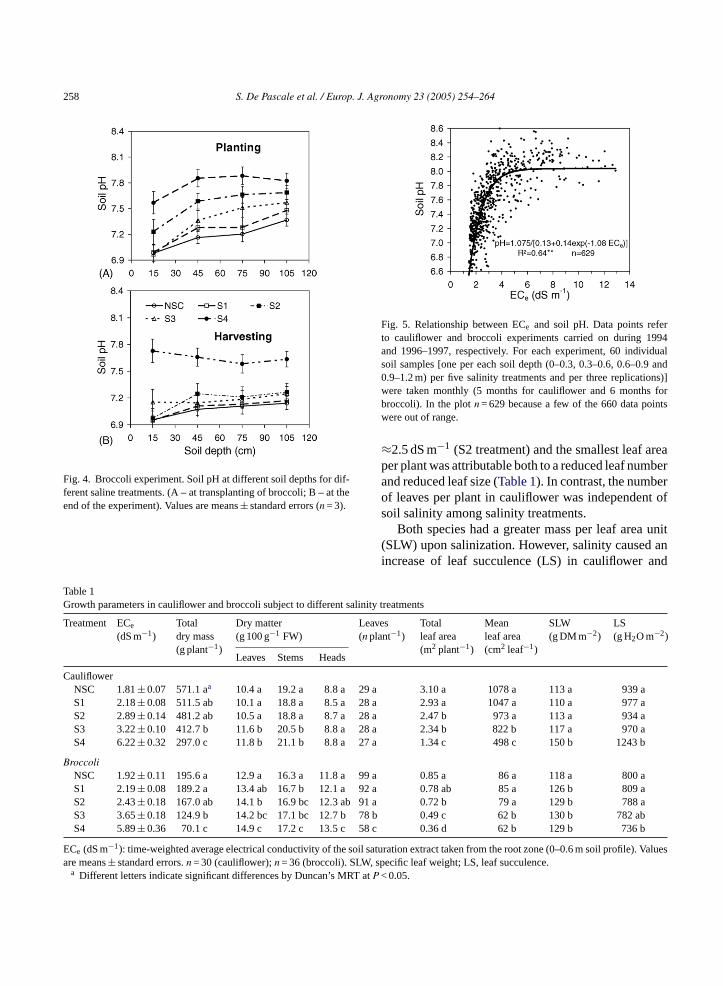
When broccoli was transplanted (November 1996),the ECe values were lower compared to those measuredin the previous experiment (1994). This was probablydue to an intense rainfall (135 mm) that occurred twomonths before sampling. The ECe values for the S3and S4 treatments increased with increasing soil depth(Fig. 3A).
As reported for cauliflower, the ECe values de-creased at the end of the growing season (Fig. 3B). De-spite of the much higher rainfall, these decreases werelower compared to those observed in the cauliflowerexperiment. This was probably due to salt accumula-tion in the soil associated with an additional summerirrigation. A similar response was observed with re-spect to the soil pH. At transplanting, we found higherpH values at increasing soil depths and in salinizedversus non-salinized plots (Fig. 4A). Throughout thegrowing season, however, differences between treat-ments tended to be smaller with the exception of theS4 treatment, whose pH values were always the highest
Fig. 3. Broccoli experiment. Electrical conductivity of the soil satu-ration extract (ECe) at different soil depths for different saline treat-ments. (A – at transplanting of broccoli; B – at the end of the exper-iment). Values are means± standard errors (n = 3).
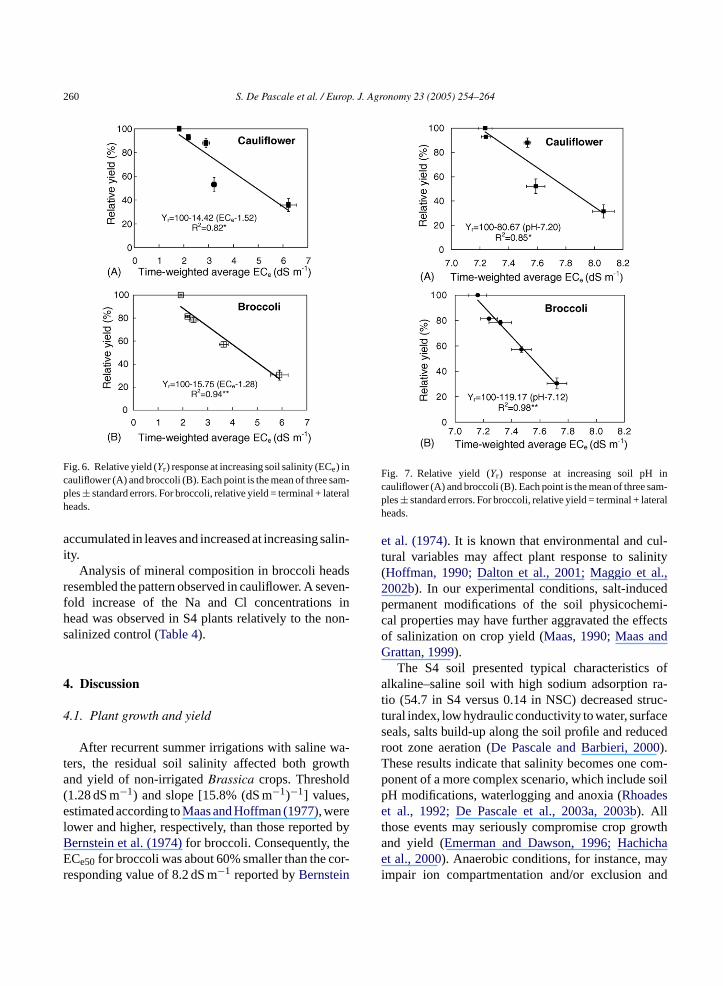
along the entire soil profile (Fig. 4B). The soil pH–ECerelationship was described by an asymptotic function(Fig. 5). The pH increased with increasing ECe untilan ECe of 6 dS m−1, after which it remained relativelyconstant.
3.2. Plant growth
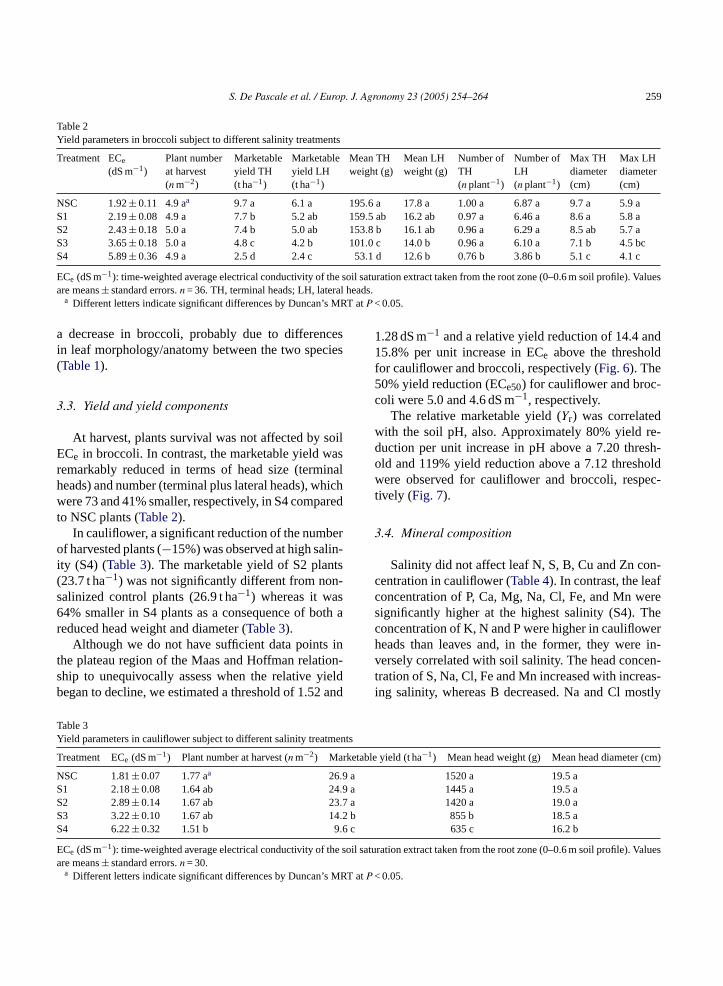
Plant dry matter accumulation was affected by soilsalinity in both species. Plant dry weights were 48%(cauliflower) and 64% (broccoli) smaller in S4 than inNSC plants (Table 1). Dry matter percentage of leaves,stems and heads tended to increase with ECe in broc-coli, whereas they were less affected in cauliflower(Table 1).
Soil salinity caused a reduction of leaf area devel-opment. Either for cauliflower or broccoli, the totalleaf area of S4 plants was approximately 57% smallerthan in the NSC plants (Table 1). In broccoli, totalleaf area was significantly reduced at ECe values above
258 S. De Pascale et al. / Europ. J. Agronomy 23 (2005) 254–264
Fig. 4. Broccoli experiment. Soil pH at different soil depths for dif-ferent saline treatments. (A – at transplanting of broccoli; B – at theend of the experiment). Values are means± standard errors (n = 3).
Fig. 5. Relationship between ECe and soil pH. Data points referto cauliflower and broccoli experiments carried on during 1994and 1996–1997, respectively. For each experiment, 60 individualsoil samples [one per each soil depth (0–0.3, 0.3–0.6, 0.6–0.9 and0.9–1.2 m) per five salinity treatments and per three replications)]were taken monthly (5 months for cauliflower and 6 months forbroccoli). In the plotn = 629 because a few of the 660 data pointswere out of range.
≈2.5 dS m−1 (S2 treatment) and the smallest leaf areaper plant was attributable both to a reduced leaf numberand reduced leaf size (Table 1). In contrast, the numberof leaves per plant in cauliflower was independent ofsoil salinity among salinity treatments.
Both species had a greater mass per leaf area unit(SLW) upon salinization. However, salinity caused anincrease of leaf succulence (LS) in cauliflower and
Table 1Growth parameters in cauliflower and broccoli subject to different salinity treatments
Treatment ECe(dS m−1)
Totaldry mass(g plant−1)
Dry matter(g 100 g−1 FW)
Leaves(n plant−1)
Totalleaf area(m2 plant−1)
Meanleaf area(cm2 leaf−1)
SLW(g DM m−2)
LS(g H2O m−2)
Leaves Stems Heads
CauliflowerNSC 1.81± 0.07 571.1 aa 10.4 a 19.2 a 8.8 a 29 a 3.10 a 1078 a 113 a 939 aS1 2.18± 0.08 511.5 ab 10.1 a 18.8 a 8.5 a 28 a 2.93 a 1047 a 110 a 977 aS2 2.89± 0.14 481.2 ab 10.5 a 18.8 a 8.7 a 28 a 2.47 b 973 a 113 a 934 aS3 3.22± 0.10 412.7 b 11.6 b 20.5 b 8.8 a 28 a 2.34 b 822 b 117 a 970 aS4 6.22± 0.32 297.0 c 11.8 b 21.1 b 8.8 a 27 a 1.34 c 498 c 150 b 1243 b
BroccoliNSC 1.92± 0.11 195.6 a 12.9 a 16.3 a 11.8 a 99 a 0.85 a 86 a 118 a 800 aS1 2.19± 0.08 189.2 a 13.4 ab 16.7 b 12.1 a 92 a 0.78 ab 85 a 126 b 809 aS2 2.43± 0.18 167.0 ab 14.1 b 16.9 bc 12.3 ab 91 a 0.72 b 79 a 129 b 788 aS3 3.65± 0.18 124.9 b 14.2 bc 17.1 bc 12.7 b 78 b 0.49 c 62 b 130 b 782 abS4 5.89± 0.36 70.1 c 14.9 c 17.2 c 13.5 c 58 c 0.36 d 62 b 129 b 736 b
ECe (dS m−1): time-weighted average electrical conductivity of the soil saturation extract taken from the root zone (0–0.6 m soil profile). Valuesare means± standard errors.n = 30 (cauliflower);n = 36 (broccoli). SLW, specific leaf weight; LS, leaf succulence.
a Different letters indicate significant differences by Duncan’s MRT atP < 0.05.
S. De Pascale et al. / Europ. J. Agronomy 23 (2005) 254–264 259
Table 2Yield parameters in broccoli subject to different salinity treatments
Treatment ECe(dS m−1)
Plant numberat harvest(n m−2)
Marketableyield TH(t ha−1)
Marketableyield LH(t ha−1)
Mean THweight (g)
Mean LHweight (g)
Number ofTH(n plant−1)
Number ofLH(n plant−1)
Max THdiameter(cm)
Max LHdiameter(cm)
NSC 1.92± 0.11 4.9 aa 9.7 a 6.1 a 195.6 a 17.8 a 1.00 a 6.87 a 9.7 a 5.9 aS1 2.19± 0.08 4.9 a 7.7 b 5.2 ab 159.5 ab 16.2 ab 0.97 a 6.46 a 8.6 a 5.8 aS2 2.43± 0.18 5.0 a 7.4 b 5.0 ab 153.8 b 16.1 ab 0.96 a 6.29 a 8.5 ab 5.7 aS3 3.65± 0.18 5.0 a 4.8 c 4.2 b 101.0 c 14.0 b 0.96 a 6.10 a 7.1 b 4.5 bcS4 5.89± 0.36 4.9 a 2.5 d 2.4 c 53.1 d 12.6 b 0.76 b 3.86 b 5.1 c 4.1 c
ECe (dS m−1): time-weighted average electrical conductivity of the soil saturation extract taken from the root zone (0–0.6 m soil profile). Valuesare means± standard errors.n = 36. TH, terminal heads; LH, lateral heads.
a Different letters indicate significant differences by Duncan’s MRT atP < 0.05.
a decrease in broccoli, probably due to differencesin leaf morphology/anatomy between the two species(Table 1).
3.3. Yield and yield components
At harvest, plants survival was not affected by soilECe in broccoli. In contrast, the marketable yield wasremarkably reduced in terms of head size (terminalheads) and number (terminal plus lateral heads), whichwere 73 and 41% smaller, respectively, in S4 comparedto NSC plants (Table 2).
In cauliflower, a significant reduction of the numberof harvested plants (−15%) was observed at high salin-ity (S4) (Table 3). The marketable yield of S2 plants(23.7 t ha−1) was not significantly different from non-salinized control plants (26.9 t ha−1) whereas it was64% smaller in S4 plants as a consequence of both areduced head weight and diameter (Table 3).
Although we do not have sufficient data points inthe plateau region of the Maas and Hoffman relation-ship to unequivocally assess when the relative yieldbegan to decline, we estimated a threshold of 1.52 and
1.28 dS m−1 and a relative yield reduction of 14.4 and15.8% per unit increase in ECe above the thresholdfor cauliflower and broccoli, respectively (Fig. 6). The50% yield reduction (ECe50) for cauliflower and broc-coli were 5.0 and 4.6 dS m−1, respectively.
The relative marketable yield (Yr) was correlatedwith the soil pH, also. Approximately 80% yield re-duction per unit increase in pH above a 7.20 thresh-old and 119% yield reduction above a 7.12 thresholdwere observed for cauliflower and broccoli, respec-tively (Fig. 7).
3.4. Mineral composition
Salinity did not affect leaf N, S, B, Cu and Zn con-centration in cauliflower (Table 4). In contrast, the leafconcentration of P, Ca, Mg, Na, Cl, Fe, and Mn weresignificantly higher at the highest salinity (S4). Theconcentration of K, N and P were higher in cauliflowerheads than leaves and, in the former, they were in-versely correlated with soil salinity. The head concen-tration of S, Na, Cl, Fe and Mn increased with increas-ing salinity, whereas B decreased. Na and Cl mostly
Table 3Yield parameters in cauliflower subject to different salinity treatments
Treatment ECe (dS m−1) Plant number at harvest (n m−2) Marketable yield (t ha−1) Mean head weight (g) Mean head diameter (cm)
NSC 1.81± 0.07 1.77 aa 26.9 a 1520 a 19.5 aS1 2.18± 0.08 1.64 ab 24.9 a 1445 a 19.5 aS aS bS c
E he soil ). Valuesa
MRT aP <
2 2.89± 0.14 1.67 ab 23.73 3.22± 0.10 1.67 ab 14.24 6.22± 0.32 1.51 b 9.6
Ce (dS m−1): time-weighted average electrical conductivity of tre means± standard errors.n = 30.a Different letters indicate significant differences by Duncan’s
1420 a 19.0 a855 b 18.5 a635 c 16.2 b
saturation extract taken from the root zone (0–0.6 m soil profile
t0.05.
260 S. De Pascale et al. / Europ. J. Agronomy 23 (2005) 254–264
Fig. 6. Relative yield (Yr) response at increasing soil salinity (ECe) incauliflower (A) and broccoli (B). Each point is the mean of three sam-ples± standard errors. For broccoli, relative yield = terminal + lateralheads.
accumulated in leaves and increased at increasing salin-ity.
Analysis of mineral composition in broccoli headsresembled the pattern observed in cauliflower. A seven-fold increase of the Na and Cl concentrations inhead was observed in S4 plants relatively to the non-salinized control (Table 4).
4. Discussion
4.1. Plant growth and yield
After recurrent summer irrigations with saline wa-ters, the residual soil salinity affected both growthand yield of non-irrigatedBrassica crops. Threshold(1.28 dS m−1) and slope [15.8% (dS m−1)−1] values,estimated according toMaas and Hoffman (1977), werelower and higher, respectively, than those reported byBernstein et al. (1974)for broccoli. Consequently, theECe50for broccoli was about 60% smaller than the cor-responding value of 8.2 dS m−1 reported byBernstein
Fig. 7. Relative yield (Yr) response at increasing soil pH incauliflower (A) and broccoli (B). Each point is the mean of three sam-ples± standard errors. For broccoli, relative yield = terminal + lateralheads.
et al. (1974). It is known that environmental and cul-tural variables may affect plant response to salinity(Hoffman, 1990; Dalton et al., 2001; Maggio et al.,2002b). In our experimental conditions, salt-inducedpermanent modifications of the soil physicochemi-cal properties may have further aggravated the effectsof salinization on crop yield (Maas, 1990; Maas andGrattan, 1999).
The S4 soil presented typical characteristics ofalkaline–saline soil with high sodium adsorption ra-tio (54.7 in S4 versus 0.14 in NSC) decreased struc-tural index, low hydraulic conductivity to water, surfaceseals, salts build-up along the soil profile and reducedroot zone aeration (De Pascale and Barbieri, 2000).These results indicate that salinity becomes one com-ponent of a more complex scenario, which include soilpH modifications, waterlogging and anoxia (Rhoadeset al., 1992; De Pascale et al., 2003a, 2003b). Allthose events may seriously compromise crop growthand yield (Emerman and Dawson, 1996; Hachichaet al., 2000). Anaerobic conditions, for instance, mayimpair ion compartmentation and/or exclusion and
S. De Pascale et al. / Europ. J. Agronomy 23 (2005) 254–264 261
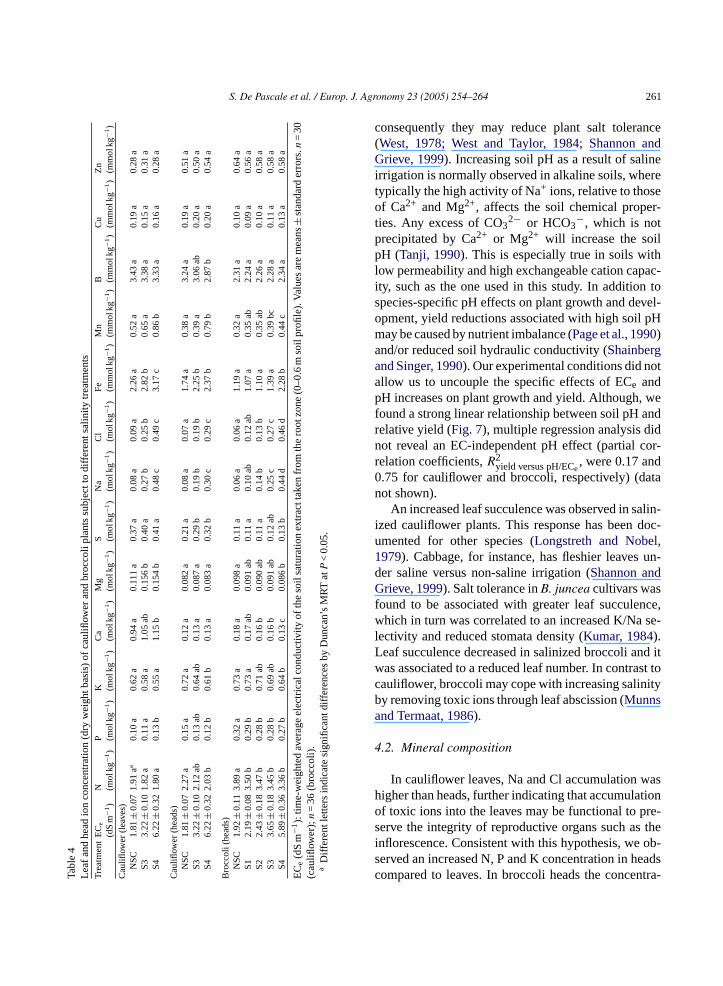
Tabl
e4
Leaf
and
head
ion
conc
entr
atio
n(d
ryw
eigh
tbas
is)
ofca
ulifl
ower
and
broc
coli
plan
tssu
bjec
tto
diffe
rent
salin
itytr
eatm
ents
Tre
atm
ent
EC e
(dS
m−1
)N (m
olkg
−1)
P (mol
kg−1
)K (m
olkg
−1)
Ca
(mol
kg−1
)M
g(m
olkg
−1)
S (mol
kg−1
)N
a(m
olkg
−1)
Cl
(mol
kg−1
)F
e(m
mol
kg−1
)M
n(m
mol
kg−1
)B (m
mol
kg−1
)C
u(m
mol
kg−1
)Z
n(m
mol
kg−1
)C
aulifl
ower
(leav
es)
NS
C1.
81±
0.07
1.91
aa0.
10a
0.62
a0.
94a
0.11
1a
0.37
a0.
08a
0.09
a2.
26a
0.52
a3.
43a
0.19
a0.
28a
S3
3.22
±0.
101.
82a
0.11
a0.
58a
1.05
ab0.
156
b0.
40a
0.27
b0.
25b
2.82
b0.
65a
3.38
a0.
15a
0.31
aS
46.
22±
0.32
1.80
a0.
13b
0.55
a1.
15b
0.15
4b
0.41
a0.
48c
0.49
c3.
17c
0.86
b3.
33a
0.16
a0.
28a
Cau
liflow
er(h
eads
)N
SC
1.81
±0.
072.
27a
0.15
a0.
72a
0.12
a0.
082
a0.
21a
0.08
a0.
07a
1.74
a0.
38a
3.24
a0.
19a
0.51
aS
33.
22±
0.10
2.12
ab0.
13ab
0.64
ab0.
13a
0.08
7a
0.29
b0.
19b
0.19
b2.
25b
0.39
a3.
06ab
0.20
a0.
50a
S4
6.22
±0.
322.
03b
0.12
b0.
61b
0.13
a0.
083
a0.
32b
0.30
c0.
29c
2.37
b0.
79b
2.87
b0.
20a
0.54
a
Bro
ccol
i(he
ads)
NS
C1.
92±
0.11
3.89
a0.
32a
0.73
a0.
18a
0.09
8a
0.11
a0.
06a
0.06
a1.
19a
0.32
a2.
31a
0.10
a0.
64a
S1
2.19
±0.
083.
50b
0.29
b0.
73a
0.17
ab0.
091
ab0.
11a
0.10
ab0.
12ab
1.07
a0.
35ab
2.24
a0.
09a
0.56
aS
22.
43±
0.18
3.47
b0.
28b
0.71
ab0.
16b
0.09
0ab
0.11
a0.
14b
0.13
b1.
10a
0.35
ab2.
26a
0.10
a0.
58a
S3
3.65
±0.
183.
45b
0.28
b0.
69ab
0.16
b0.
091
ab0.
12ab
0.25
c0.
27c
1.39
a0.
39bc
2.28
a0.
11a
0.58
aS
45.
89±
0.36
3.36
b0.
27b
0.64
b0.
13c
0.08
6b
0.13
b0.
44d
0.46
d2.
28b
0.44
c2.
34a
0.13
a0.
58a
EC
e(d
Sm
−1):
time-
wei
ghte
dav
erag
eel
ectr
ical
cond
uctiv
ityof
the
soil
satu
ratio
nex
trac
ttak
enfr
omth
ero
otzo
ne(0
–0.6
mso
ilpr
ofile
).Va
lues
are
mea
ns±
stan
dard
erro
rs.n=
30(c
aulifl
ower
);n
=36
(bro
ccol
i).a
Diff
eren
tlet
ters
indi
cate
sign
ifica
ntdi
ffere
nces
byD
unca
n’s
MR
Tat
P<
0.05
.
consequently they may reduce plant salt tolerance(West, 1978; West and Taylor, 1984; Shannon andGrieve, 1999). Increasing soil pH as a result of salineirrigation is normally observed in alkaline soils, wheretypically the high activity of Na+ ions, relative to thoseof Ca2+ and Mg2+, affects the soil chemical proper-ties. Any excess of CO32− or HCO3
−, which is notprecipitated by Ca2+ or Mg2+ will increase the soilpH (Tanji, 1990). This is especially true in soils withlow permeability and high exchangeable cation capac-ity, such as the one used in this study. In addition tospecies-specific pH effects on plant growth and devel-opment, yield reductions associated with high soil pHmay be caused by nutrient imbalance (Page et al., 1990)and/or reduced soil hydraulic conductivity (Shainbergand Singer, 1990). Our experimental conditions did notallow us to uncouple the specific effects of ECe andpH increases on plant growth and yield. Although, wefound a strong linear relationship between soil pH andrelative yield (Fig. 7), multiple regression analysis didnot reveal an EC-independent pH effect (partial cor-relation coefficients,R2
yield versus pH/ECe, were 0.17 and
0.75 for cauliflower and broccoli, respectively) (datanot shown).
An increased leaf succulence was observed in salin-ized cauliflower plants. This response has been doc-umented for other species (Longstreth and Nobel,1979). Cabbage, for instance, has fleshier leaves un-der saline versus non-saline irrigation (Shannon andGrieve, 1999). Salt tolerance inB. juncea cultivars wasf nce,w se-lL nd itw ast toc ityba
4
ash tiono re-s thei ob-s eadsc ntra-
ound to be associated with greater leaf succulehich in turn was correlated to an increased K/Na
ectivity and reduced stomata density (Kumar, 1984).eaf succulence decreased in salinized broccoli aas associated to a reduced leaf number. In contrauliflower, broccoli may cope with increasing saliny removing toxic ions through leaf abscission (Munnsnd Termaat, 1986).
.2. Mineral composition
In cauliflower leaves, Na and Cl accumulation wigher than heads, further indicating that accumulaf toxic ions into the leaves may be functional to perve the integrity of reproductive organs such as
nflorescence. Consistent with this hypothesis, weerved an increased N, P and K concentration in hompared to leaves. In broccoli heads the conce
262 S. De Pascale et al. / Europ. J. Agronomy 23 (2005) 254–264
tions of Na and Cl were higher compared to cauliflower.This difference may be associated to different mor-phology of the edible plant organs in these two speciesand/or alternatively to different ion translocation sys-tems (Hasegawa et al., 2000).
Competition effects between different anions (Baret al., 1997; Feigin et al., 1987; Kafkafi et al., 1982)and different cations (Subbarao et al., 1990; Izzo et al.,1991; Perez-Alfocea et al., 1996) are known to occur insaline environment and they may result deleterious fornormal plant growth (Grattan and Grieve, 1999). Theaccumulation of Cl was inversely correlated to nitro-gen concentration. In contrast to other reports (Gomezet al., 1996; Gunes et al., 1996), the presence of Na andCl in the solution in contact with the roots did not affectthe foliar concentration of K, whose uptake is typicallyhindered by high concentrations of Na (Hasegawa et al.,2000), and it moderately inhibited the head K concen-tration only at high salinity. Although under saline con-ditions the K content in many glycophytes is severelyreduced (Song and Fujiyama, 1996; Lopez and Satti,1996), in our experimental conditions the K concen-tration in cauliflower leaves was not significantly af-fected by salinity, whereas a K decrease in heads wasobserved only at high ECe (7 dS m−1). High K accumu-lation in plant tissues under moderate/high soil salinitysuggest thatBrassica species may possess a more ef-ficient K uptake system compared to other plants. Inmost cases, salinity decreases the concentration of P inleaves (Sharpley et al., 1992). Nevertheless, we founda highs t ofs nt,s alin-i d inl
le Caive ilei ncen-t toa ylemt if-f al.,2 ciesw ismo ave
important implications in terms of nutritional value ofsalinizedBrassica species, which may have altered val-ues of their mineral composition. In addition, the higherefficiency in Ca uptake in cauliflower versus broccoliplants might have prevented the appearance of tipburnand leaf drop in the former (Adams and Ho, 1995).
The effects of salinity on sulphur uptake and accu-mulation in plants has not been documented in greatdetail (Grattan and Grieve, 1999). Our results demon-strate that salinity may actually enhance plant sulphurconcentration.Mor and Manchanda (1992)found thatchloride-salinity reduced the sulphur concentration ofpea straw, whereas it increased the root concentration.
Reports on the effects of salinity on micronutrientsconcentration in plants are often contrasting. Salinitywas found to increase Mn concentration in sugarbeetshoot (Khattak and Jarrell, 1989). Zinc concentrationin shoot tissue was found to decrease with increas-ing soil sodicity (Mehrota et al., 1986; Shukla andMukhi, 1985). Similarly, plant Cu concentration wasfound to decrease in salt-stressed maize grown in bothsoil (Rahman et al., 1993) and nutrient solutions (Izzoet al., 1991). As reported for pea (Dahiya and Singh,1976), tomato, soybean and squash (Maas et al., 1972),salinity increased the shoot Fe concentration in bothcauliflower and broccoli.
Overall, in Mediterranean areas exposed to salin-ization, although rainfall may mitigate the deleteriouseffects of salinity on crop yield by leaching the excessof salts from the root zone, residual salts from the sum-m ca-t otha tedw
R
A tri-4–
B hipmin-r. 20,
B ectsron.
D ndos-
n increased leaf P concentration in cauliflower atalinity. This increase could result from the effecalinity on P transport and partitioning within the plaince the head P concentration was reduced by sty. Also the concentrations of Ca and Mg increaseeaves of salt treated cauliflower.
Despite a remarkable decrease in exchangeabn salinized field plots (6.13 mequiv. 100 g−1 soil in S4ersus 12.58 in NSC) (De Pascale et al., 2003a), the lev-ls of Ca and Mg did not change in cauliflower, wh
t decreased in broccoli heads. A decreased Ca coration in different plant organs may be attributed
reduced rate of calcium uptake, a decreased xransport or to a different partitioning of cations in derent plant tissues (Liu and Zhu, 1998; Hasegawa et000). The observed differences suggest that speithin the same gender may have different mechanf adaptation to salt stress. Moreover this may h
er irrigations and salt-induced permanent modifiions of the soil physical–chemical properties may bffect yield and mineral composition of non-irrigainter crops such as cauliflower and broccoli.
eferences
dams, P., Ho, L.C., 1995. Uptake and distribution of nuents in relation to tomato fruit quality. Acta Hort. 412, 37387.
ar, Y., Apelbaum, A., Kafkafi, U., Goren, R., 1997. Relationsbetween chloride and nitrate and its effect on growth anderal composition of avocado and citrus plants. J. Plant Nut715–731.
ernstein, L., Francois, L.E., Clark, R.A., 1974. Interactive effof salinity and fertility on yields of grains and vegetables. AgJ. 66, 412–421.
ahiya, S.S., Singh, M., 1976. Effect of salinity, alkalinity airon application on the availability of iron, manganese, ph
S. De Pascale et al. / Europ. J. Agronomy 23 (2005) 254–264 263
phorus and sodium in pea (Pisum sativum L.) crop. Plant Soil44, 697–702.
Dalton, F.N., Maggio, A., Piccinni, G., 2001. Assessing the affectsof solar radiation on plant salt tolerance as defined by the staticand dynamic indices. Plant Soil 229, 189–195.
De Pascale, S., Barbieri, G., 1997. Effect of soil salinity and topremoval on growth and yield of broadbean as green vegetable.Scientia Hort. 71, 147–165.
De Pascale, S., Barbieri, G., 2000. Yield and quality of carrot asaffected by soil salinity from long-term irrigation with salinewater. Acta Hort. 537, 621–628.
De Pascale, S., Maggio, A., Ruggiero, C., Barbieri, G., 2003a. Phys-iological responses of pepper to salinity and drought. J. Am. Soc.Hort. Sci. 128 (1), 48–54.
De Pascale, S., Maggio, A., Ruggiero, C., Barbieri, G., 2003b.Growth, water relations, and ion content of field-grown celery[Apium graveolens L. var. dulce (Mill.) Pers.] under saline irri-gation. J. Am. Soc. Hort. Sci. 128 (1), 128–135.
Emerman, S.H., Dawson, T.E., 1996. The role of macropores inthe cultivation of bell pepper in salinized soils. Plant Soil 181,241–249.
Feigin, A., Rylski, I., Meiri, A., Shalhevet, J., 1987. Response ofmelon and tomato plants to chloride–nitrate ratios in saline nu-trient solutions. J. Plant Nutr. 10, 1787–1794.
Gomez, I., Pedreno, J.N., Moral, L., Iborra, M.R., Palacios, G.,Mataix, J., 1996. Salinity and nitrogen fertilization affecting themacronutrient content and yield of sweet pepper plants. J. PlantNutr. 19, 353–359.
Grattan, S.R., Grieve, C.M., 1999. Salinity-mineral nutrient relationsin horticultural crops. Scientia Hort. 78, 127–157.
Grattan, S.R., Oster, J.D., 2003. Use and reuse of saline-sodic wa-ter for irrigation of crops. In: Goyal, S.S., Sharma, S.K., Rains,D.W. (Eds.), Crop Production in Saline Environments: Globaland Integrative Perspectives. Haworth Press, New York, pp.131–162.
G atalPlant
H ng-inity
H Plantlant
H con-ndork,
I eralNaCl
K ith
K l and-X-
Khattak, R.A., Jarrell, W.M., 1989. Effect of saline irrigation waterson soil manganese leaching and bioavailability to sugar beet. SoilSci. Soc. Am. J. 53, 142–146.
Kumar, D., 1984. The value of certain plant parameters as an indexfor salt tolerance in Indian mustard (Brassica juncea L.). PlantSoil 79, 261–272.
Lauchli, A., Epstein, E., 1990. Plant response to salinity andsodic conditions. In: Tanji, K.K. (Ed.), Agricultural Salinity As-sessment and Management. American Society of Civil Engi-neers, New York, Manual and Report Engineering Practice 71,113–137.
Liu, J., Zhu, J.K., 1998. A calcium sensor homologue required forplant salt tolerance. Science 280, 1934–1945.
Longstreth, D.J., Nobel, P.S., 1979. Salinity effects on leaf anatomy.Plant Physiol. 63, 700–703.
Lopez, M.V., Satti, S.M.E., 1996. Calcium and potassium-enhancedgrowth and yield of tomato under sodium chloride stress. PlantSci. 114, 19–27.
Maas, E.V., Ogata, G., Garber, M.J., 1972. Influence of salinity onFe, Mn, and Zn uptake by plants. Agron. J. 64, 793–795.
Maas, E.V., Hoffman, G.J., 1977. Crop salt tolerance. Current assess-ment. American Society of Civil Engineers. J. Irrig. DrainageDiv. 103, 115–134.
Maas, E.V., 1990. Crop salt tolerance. In: Tanji, K.K. (Ed.), Agricul-tural Salinity Assessment and Management. American Societyof Civil Engineers, New York, Manual and Report EngineeringPractice 71, 262–305.
Maas, E.V., Grattan, S.R., 1999. Crop yields as affected by salin-ity. In: Skaggs, R.W., van Schilfgaarde, J. (Eds.), Agron.Monogr. No. 38. Am. Soc. Agron, Madison, WI, pp. 55–108.
Maggio, A., Matsumoto, T., Hasegawa, P.M., Pardo, J.M., Bres-san, R.A., 2002a. The long and winding road to halotolerancegenes. In: Lauchli, A., Luttge, U. (Eds.), Salinity: Environment– Plants – Molecules. Kluwer Academic Publisher, Dordrecht,
M atedsalt
M ity-
M n theandy
M Aust.
M tress.
P tox-lin-l En-e 71,
P .tol-51–
unes, A., Inal, A., Alpaslan, A., 1996. Effect of salinity on stomresistance, proline, and mineral composition of pepper. J.Nutr. 19, 389–396.
achicha, M., Cheverry, C., Mhiri, A., 2000. The impact of loterm irrigation on changes of ground water level and soil salin northern Tunisia. Arid Soil Res. Rehab. 14, 175–182.
asegawa, P.M., Bressan, R.A., Zhu, J.K., Bohnert, H.J., 2000.cellular and molecular responses to high salinity. Ann. Rev. PPhysiol. Plant Mol. Biol. 51, 463–499.
offman, G.J., 1990. Leaching fraction and root zone salinitytrol. In: Tanji, K.K. (Ed.), Agricultural salinity assessment amanagement. American Society of Civil Engineers, New YManual and Report Engineering Practice 71, 237–261.
zzo, R., Navari-Izzo, F., Quartacci, M.F., 1991. Growth and minabsorption in maize seedlings as affected by increasingconcentrations. J. Plant Nutr. 14, 687–699.
afkafi, U., Valoras, N., Letey, J., 1982. Chloride interaction wnitrate and phosphate nutrition in tomato (Lycopersicon esculen-tum L.). J. Plant Nutr. 5, 1369–1385.
alra, Y.P., Maynard, D.G., 1991. Methods manual for forest soiplant analysis. Northwest Region- Information Report NOR319, Forestry Canada, Edmonton, AB.
pp. 505–533.aggio, A., Dalton, F.N., Piccinni, G., 2002b. The effects of elev
carbon dioxide on static and dynamic indices for tomatotolerance. Eur. J. Agron. 16, 197–206.
ehrota, N.K., Khanna, V.K., Agarwala, S.C., 1986. Soil-sodicinduced zinc deficiency in maize. Plant Soil 92, 63–71.
or, R.P., Manchanda, H.R., 1992. Influence of phosphorus otolerance of table pea to chloride and sulfate salinity in a ssoil. Arid Soil Res. Rehab. 6, 41–52.
unns, R., Termaat, A., 1986. Whole-plant response to salinity.J. Plant Physiol. 13, 143–160.
unns, R., 2002. Comparative physiology of salt and water sPlant Cell Environ. 25, 239–250.
age, A.L., Chang, A.C., Adriano, D.C., 1990. Deficiencies andicities of trace elements. In: Tanji, K.K. (Ed.), Agricultural Saity Assessment and Management. American Society of Civigineers, New York, Manual and Report Engineering Practic138–160.
erez-Alfocea, F., Balibrea, M.E., Santa Cruz, A., Estan, M.T., 1996Agronomical and physiological characterization of salinityerance in a commercial tomato hybrid. Plant Soil 180, 2257.
264 S. De Pascale et al. / Europ. J. Agronomy 23 (2005) 254–264
Rahman, S., Vance, G.F., Munn, L.C., 1993. Salinity induced effectson the nutrient status of soil, corn leaves and kernels. Commun.Soil Sci. Plant Anal. 24, 2251–2269.
Rains, D.W., Goyal, S.S., 2003. Strategies for managing crop pro-duction in saline environments: an overview. In: Goyal, S.S.,Sharma, S.K., Rains, D.W. (Eds.), Crop Production in Saline En-vironments: Global and Integrative Perspectives. Haworth Press,New York, pp. 1–10.
Rhoades, J.D., Kandiah, A., Mashali, A.M., 1992. The use of salinewaters for crop production. FAO, Rome, Irrigation and DrainagePaper No. 48.
Shainberg, I., Singer, M.J., 1990. Soil response to saline and sodicconditions. In: Tanji, K.K. (Ed.), Agricultural Salinity Assess-ment and Management. American Society of Civil Engineers,New York, Manual and Report Engineering Practice 71, 91–112.
Shannon, M.C., Grieve, C.M., 1999. Tolerance of vegetable crops tosalinity. Scientia Hort. 78, 5–38.
Sharpley, A.N., Meisinger, J.J., Power, J.F., Suarez, D.L., 1992.Root extraction of nutrients associated with long-term soil man-agement. In: Stewart, B. (Ed.), Advances in Soil Science 19,151–217.
Shukla, U.C., Mukhi, A.K., 1985. Ameliorative role of zinc on maizegrowth (Zea mays L.) under salt-affected soil conditions. PlantSoil 87, 423–432.
Song, J.Q., Fujiyama, H., 1996. Difference in response of rice andtomato subjected to sodium salinization to the addition of cal-cium. Soil Sci. Plant Nutr. 42, 503–510.
Subbarao, G.V., Johansen, C., Jana, M.K., Kumar Rao, J.V.D.K.,1990. Effects of the sodium/calcium ratio in modifying salinityresponse of pigeonpea (Cajanus cajan). J. Plant Physiol. 136,439–443.
Tanji, K.K., 1990. Nature and extent of agricultural salinity. In: Tanji,K.K. (Ed.), Agricultural Salinity Assessment and Management.American Society of Civil Engineers, New York, Manual andReport Engineering Practice 71, 71–92.
Walinga, I., van der Lee, J.J., Houba, V.J.G, van Vark F.W., No-vazamsky, I., 1995. Plant Analysis Manual. Kluwer AcademicPublishers, Dordrecht.
West, D.W., 1978. Water use and sodium chloride uptake by appletrees. II. The response to soil oxygen deficiency. Plant Soil 50,51–56.
West, D.W., Taylor, J.A., 1984. Response of six grape cultivars tothe combined effects of high salinity and rootzone waterlogging.J. Am. Soc. Hort. Sci. 109, 844–851.
Related Documents