SOIL-RESOURCE DATA FOR AGRICULTURAL DEVELOPMENT Edited by Leslie D. Swindak Hawaii Agricultural Experiment Station College of Tropical Agriculture University of Hawaii

Welcome message from author
This document is posted to help you gain knowledge. Please leave a comment to let me know what you think about it! Share it to your friends and learn new things together.
Transcript
SOIL-RESOURCE DATA FORAGRICULTURAL DEVELOPMENT
Edited by Leslie D. Swindak
Hawaii Agricultural Experiment StationCollege of Tropical Agriculture
University of Hawaii
SOIL-RESOURCE DATA FORAGRICULTURAL DEVELOPMENT
Scanned from original by ISRIC - World Soil Information, as ICSUWorld Data Centre for Soils. The purpose is to make a safedepository for endangered documents and to make the accruedinformation available for consultation, following Fair UseGuidelines. Every effort is taken to respect Copyright of thematerials within the archives where the identification of theCopyright holder is clear and, where feasible, to contact theoriginators. For questions please contact soil.isricOwur.nlindicating the item reference number concerned.
SOIL-RESOURCE DATA FORAGRICULTURAL DEVELOPMENT
Edited by Leslie D. Swindale
Hawaii Agricultural Experiment StationCollege of Tropical Agriculture
University of Hawaii
Funding for publication of this book was provided by'the United StatesAgency for International Development (USAID), contract ta-C-l 108. through
the Benchmark Soils Project, Department of Agronomy and Soil Science,Hawaii Agricultural Experiment Station, College of Tropical Agriculture,
University of Hawaii. Honolulu. HI.
Hawaii Agricultural Experiment StationCollege of Tropical Agriculture
University of Hawaii3190 M aile Way
Honolulu. HI 96822
Library of Congress Cataloging in Publication Data
Main entry under title:
Soil-resource data for agricultural development.
Papers presented at a seminar held at Hyderabad, India, January 18-23, 1976and sponsored bv the University of Hawaii, the International Crops Research
Institute for the Semi-Arid Tropics, and the U.S. Universities Consortiumon Tropical Soils.
Includes bibliographies and index.I. Soil science—Congresses. 2. Soil science—Documentation—Congresses.
3. Communication in soil science—Congresses. 4. Land use—Planning—Congresses. 5. Soil-surveys—Congresses. 6. Soils—Classification—
Congresses. 7. Agriculture—Tropics—Congresses.
I. Swindale. Leslie Denis, 1928- II. Hawaii. University, Honolulu.III. International Crops Research Institute for the Semi-A rid Tropics.
IV. U.S. Universities Consortium on Tropical Soils.S590.2.S63 63I.4'9I3 78-9338
Typesetting and layout by Innovative Media, Inc.Printed in the United States of A merica.
2M—June 1978
Acknowledgments
The assistance of staff members from theInternational Crops Research Institute for theSemi-Arid Tropics (ICRISAT) in the conductof the seminar entitled "The Uses of SoilSurvey and Classification in Planning andImplementing Agricultural Development"and the field visit to the ICRISAT farm isgratefully acknowledged, particularly S. Mo-han for handling the finances of participants;S.B.C.M. Rao for arranging travel and localaccommodations; B.L. Seetharam for arrang-ing transportation; P. Subrahmanyam, S.Nakra, and S. Sunetra for providing secre-tarial services; A.D. Leach for providing andoperating the sound and visual equipment;and S. Singh, P. Singh, and T. Rego for ar-ranging the farm visit. J.S. Kanwar and B.A.Krantz are commended for the overall plan-ning of the seminar at the Ritz Hotel and ofthe field visit to accommodate such a largeinternational gathering of soil scientists andplanners.
The successful post-seminar tour from
Hyderabad to Bangalore was expertly plannedand conducted jointly by N. K. Barde and R.S.Murthy of the All India Soil and Land UseSurvey in Bangalore and New Delhi, respec-tively.
Special appreciation and gratitude are ex-tended to the following members of the Uni-versity of Hawaii's Benchmark Soils Project:Annette E. Chang and Susan H. Hashimotofor typing the manuscripts of the seminar pro-ceedings; Keith A. Sakata for the graphicalartwork and reproductions; Cynthia L. Gar-ver for her editorial supervision of the copy-editing by Wake Fujioka and the indexing byElaine Ho and for her expertise in schedulingthe production and printing of this book; andGordon Y. Tsuji for implementing plans andactivities culminating in the successful con-duct of the seminar and for overseeing opera-tions to produce this important book on soilresources classification and agricultural de-velopment.

Contents
Pag*
Part I. Classification and Collection of Soil-Resource Data 1Soil Classification and the Design of Soil Surveys W. M. Johnson 3Some Fundamentals of Soil Classification F. H. Beinroth 12Occurrence and Significance of Climatic Parameters in the Soil Taxonomy
v H. Ikawa 20\ . Soils and Land-Resource Mapping in Iran M. Vakilian 28
Part II. Interpretation of Soil-Resource Data 39Soil-Survey Interpretations for Improved Rubber Production in
Peninsular Malaysia H. Y. Chan 41Use of Soil-Survey Data in Korea: Land Selection for 'Tongil'
Y. H. Shin 67Soil-Survey Interpretations for Watershed Development
Y. P. Bali and R.L. Karale 73Contribution of Soil-Survey Interpretation in Land Appraisal A.J. Smyth 85
Part III. Use of Soil-Resource Data in Land-Use Planning 93Techniques for Displaying Soils Data G. A. Nielsen 95Land-Use Planning in Karnataka, India R. S. Murthy 104Interpretation of Small- and Large-Scale Soil Maps for Arid and Semiarid
North Indian Plains H. S. Shankaranarayana and L. R. Hirekerur 117Land Evaluation for Agricultural Land-Use Planning J. Bennema 130
Part IV. Use of Soil-Resource Data in Regional and National Development 141Soils Data for Agricultural Development in Ghana H. B. Obeng 143A Case Study of Tropical Alfisols in Sri Lanka C. R. Panabokke 155Soils and Institutional Requirements for Regional Planning
and Development M. L. Dewan 163Agricultural Land Utilization and Land Quality F. R. Moormann 177
Part V. Use of Soil-Resource Data in Transferring Agricultural Technology 183Need for an International Research and Technology Transfer Network
in Tropical Soils G. B. Baird 185Soil Survey, Soil Classification, and Agricultural Information Transfer
A. W. Moore 193Agrotechnology Transfer and the Soil Family G. Uehara 204A Soil Research Network through Tropical Soil Families L. D. Swindale 210
VUl CONTENTS
Pag*
Part VI. Special Problems of the Semiarid Tropics 219Use of Soils Information in Planning Agricultural Development
in the Semiarid Tropics S. M. Virmani, S. Singh, and B.A. Krantz 221Soil and Water Management in the Semiarid Tropics \
B. A. Krantz and J. Kampen 228Management of Rain-fed Agriculture in Semiarid India
Ch. Krishnamoorthy 243
Appendixes: Proceedings of the Seminar 2531. Welcoming Address Ralph W. Cummings 2552. Inaugural Address The Honorable Shri Shah Nawaz Khan 2573. Keynote Address William P. Panton 260 ,4. Program 2665. Summary of Discussions and Recommendations 2706. List of Participants 281
Indexes 289 'Author Index 291Subject Index 295 I
Preface
Central planning and the issuance of reg-ular multiyear plans are normal proceduresfor most tropical countries. Much of the plan-ning deals with agriculture because in thesecountries about 65 percent of the people aredirectly involved with agricultural produc-tion. A need to know about soils is usuallyassumed in preparing the plans, but soils in-formation is seldom used effectively.
There are several reasons. Often the nec-essary data do not exist. When they do, theirvalue becomes greatly diluted by the timethey are incorporated into the planning pro-cess. The farmers who know the most are notconsulted. Soil scientists who know a lot pre-sent the information qualitatively and in ajargon all their own. Planners far removedfrom the soils and under pressures of timequietly ignore the qualitative data phrasedin language they do not understand or usetheir own best judgment about what thescientists mean.
This book is an attempt to change thiscourse. It provides a state-of-the-art compi-lation of the classification, collection, inter-pretation, and presentation of soil-resourcedata for land-use planning in tropical agri-culture, and it gives some illustrative exam-ples of effective use of soils data for agricul-tural development mainly in the tropics. Itpresents some recommendations for changesin current methods of obtaining and present-ing soils data made by a joint seminar ofnatural resource planners and soil scientistsfrom 19 tropical and 9 temperate countries.
The seminar entitled "The Uses of SoilSurvey and Classification in Planning and
Implementing Agricultural Development"was held at Hyderabad, India from 18 to 23January 1976. It was jointly sponsored by theUniversity of Hawaii, the InternationalCrops Research Institute for the Semi-AridTropics (ICRISAT), and the U.S. Universi-ties' Consortium on Tropical Soils and waslargely financed by the U.S. Agency for In-ternational Development. It was attended bysenior natural resource planners and soilscientists from Australia, Bangladesh, theCentral African Empire, Ethiopia, France,Ghana, India, Indonesia, Iran, Italy, theIvory Coast, Kenya, Malawi, Malaysia,Nepal, the Netherlands, New Zealand, Ni-geria, the Philippines, Rwanda, South Ko-rea, Sri Lanka, Sudan, Tanzania, Thailand,the United Kingdom, the United States,Western Samoa, and Zaire.
The papers in this book were presentedat the seminar, but they have been rear-ranged, revised, and edited for more effec-tive presentation in written form.
Part I deals with the classification andcollection of soil surveys. W. M. Johnson de-scribes the philosophical background to thesystematic collection of soil-resource data,how soil surveys of different scales are de-signed to serve different purposes, and howand why the data collected need to be classi-fied systematically. His paper and the twosubsequent papers by F. H. Beinroth and H.Ikawa outline technical details of Soil Tax-onomy, a system of soil classification recent-ly published by the U.S. Department of Agri-culture. This system, which was developedover 25 years by the U.S. Soil Conservation
IX
PREFACE
Service and which has many collaborators inother lands, is the most precise and com-prehensive classification of soils yet devised.The fifth level in the Taxonomy, the soilfamily, is designed to group the soils thathave similar responses to management andmanipulation for use. The three papers per-taining to Soil Taxonomy provide a tech-nical introduction to subsequent papers inthe book, many of which use Soil Taxonomyand its terminology to relate soil-resourcedata to soil uses in agriculture. In the lastpaper in Part I, M. Vakilian describes thesoil- and land-appraisal programs of Iran.
Part II deals with soil-survey interpreta-tion. The first paper by H.Y. Chan givesquantitative and practical examples of theinterpretations of surveyed and classifiedsoils for a specific agricultural crop, in thiscase, rubber. The second paper by Y. H. Shindescribes how soil-survey interpretation wasused to determine which lands should be se-lected for the production of a new high-yield-ing crop, in this case, rice. These two papersare impressive examples of the value of soil-survey interpretations in agriculture and ofhow to combine agronomic experimentationwith soil-survey data to achieve sound andpractical predictions about crop yield.
The third paper by Y.P. Bali and R.L.Karale describes procedures for developingqualitative ratings of soils for irrigated riceproduction; it provides a theoretical exampleof how these ratings could be used to deter-mine the comparative advantages of two de-velopment areas. The final paper in Part IIby A.J. Smyth explains the relationshipbetween soil-survey interpretation and landevaluation and describes the strength andthe all-too-apparent weaknesses of manycurrent forms of soil-survey interpretation.In anticipation of the conclusions of theseminar, he states that there is a "growingconviction that interpretations must be spe-cific as to purpose and to site if they are toprovide the needed basis for immediatedevelopment."
Part III contains four papers about theuse of soil-resource data in land-use plan-ning. G. A. Nielsen describes many effectivetechniques, most of them simple and inex-
pensive, for displaying soils data. R. S. Mur-thy, H. S. Shankaranarayana, and L. R. Hire-kerur give case studies, from two differentregions of India, about the use of soils datato maximize land use for agricultural pur-poses. J. Bennema provides theoretical andprocedural frameworks for combining physi-cal and socioeconomic data into decision-making packages for land-use planning. Ben-nema emphasizes, as Shankaranarayana's andHirekerur's study demonstrates, that thesame area of land may need to be evaluatedat different scales for different purposes.
Part IV contains several case studies ofthe use of soil-resource data for agriculturaldevelopment. H. B. Obeng illustrates howthe same soils data is used to serve severalnational development goals in Ghana; C. R.Panabokke describes how a combination ofsoil investigation and agricultural research isbeing used to transform a virtually uninhab-ited region of problem soils in Sri Lanka intoa major development area. M. L. Dewan ex-amines the successes and failures of fourcase studies from FAO programs to extractsome principles for the future. Among thecontributors, he alone discusses the impor-tance of legislation to the effective use ofresource data in development. In the finalpaper of Part IV, F. R. Moormann provides aconceptual model linking agricultural landutilization and land quality. He maintainsthat land quality is changed by land improve-ment and by crop adaptation.
Part V contains four papers dealing withagrotechnology transfer. G. B. Baird calls foran agrotechnology transfer network focusedon soils. He proposes the establishment of aresearch and transfer network in tropicalsoils and illustrates how similar networkshave been established for major agriculturalcommodities, having the International Agri-cultural Research Centers as their foci. A. W.Moore, using experience gained in Australia,illustrates how the lack of a common meth-odology in gathering soils data and the lackof a common system of soil classification caneffectively prevent the transfer of soil-man-agement information. G. Uehara discussesin general and L. D. Swindale describes inspecific how the soil family of the Soil Tax-
PREFACE XI
onomy can be used for agrotechnology trans-fer and as the basis for a research and tech-nology network. Both advocate classifyingthe soils of all agricultural research stationsin the tropics at the family level.
Part VI, in recognition of the host institu-tion for the seminar, deals with soils and soilmanagement in the semiarid tropics. Twopapers from ICRISAT, one by S. M. Virmani,S. Singh, and B.A. Krantz and another byB. A. Krantz and J. Kampen, discuss the typeof soil information needed for successfulagricultural development in this region. Ch.Krishnamoorthy describes how this informa-tion is being collected and applied in semi-arid India. Past approaches to soil and watermanagement and conservation have not pro-vided the basis for increased food produc-tion in the semiarid tropics, but the new tech-nologies these authors describe appear tohave the potential to succeed.
The Appendixes contain the proceedingsof the seminar: the welcome, inaugural andkeynote speeches; the program; a summaryof the discussions and recommendations; thelist of participants; and the organization of
the seminar. The seminar agreed with thekeynote speaker, W. P. Panton, that soil sur-veys can be designed to produce the types ofdata that planners can best use, that is,single-factor interpretations of soil units,arranged either quantitatively in tables orspatially in maps. Yield predictions at de-fined levels of management are the most use-ful forms of quantitative data. Soil-databanks to store data in computer-retrievableform are seen as useful facilities becausethey can provide several alternative interpre-tations for the same soil units, and these al-ternatives can be displayed quantitatively orspatially. It was agreed that the Soil Taxon-omy provides a basis for agrotechnologytransfer and for the effective communicationof the results of site-specific research on soiland water management.
The capacity and ability to collect soil-resource data for agricultural developmentnow exist in tropical countries. The papersin this book describe in principle and prac-tice how these data can be and are beingused.
L. D. SWINDALE
PART I:CLASSIFICATION AND
COLLECTION OFSOIL-RESOURCE DATA
Soil Classification and the Design of Soil Surveys
W.M. JOHNSON
Soil Conservation ServiceUnited States Department of Agriculture, Washington, D.C., U.S.A.
The origins and the philosophy behind the recently published Soil Taxonomy are traced.This new system of classification has been designed with the particular requirements of soil sur-vey and interpretations of soil survey in view. It attempts to consider all the soil properties thataffect soil use; it considers soil genesis, because surveyors make much use of the knowledge ofsoil genesis in mapping soils; it can be uniformly applied by soil scientists whatever their back-ground and training; it proceeds from the properties of the soils themselves; and it classifies allknown kinds of soils. The fifth level in the Taxonomy, the soil family, is the level that groupssoils with similar use potentials and thus relates directly to the interpretations of soil surveys.
A scientifically sound and practical soil survey can be interpreted in many useful ways. Inthe United States the useful life of a modern soil survey is considered to be 25 to 30 years. Dif-ferent intensities of soil use require different intensities of soil survey. Broad-scale exploratorysurveys can provide much of the earth-resource information needed for national and regionalplanning. They have mapping units based on great groups or subgroups. Intermediate-scalesurveys are useful in semiarid grazing land. They are based on subgroups or families. Highlydetailed surveys are used for specific agricultural and engineering applications. They have map-ping units of narrowly defined phases of soil series.
Ali soil surveys, whatever the intensity, must be designed according to the purposes forwhich they are to be interpreted, and experts in those interpretations are required as part ofthe soil-survey planning team to ensure a sound product result.
The trouble with soil classification is that ferences ever since they became conscious ofno one knows much about it except pedolo- any features of their surroundings and cer-gists. Yet people who make plans and deci- tainly since they began harvesting roots andsions about land-resource use ought to searching for other natural foods. They prob-understand soil classification and how to use ably gave names to different kinds of soilsit. The aim of this paper is to describe a mod- as soon as they had a spoken language,ern soil classification scheme and to suggest The first soil classification reported in thehow pedologists and resource-development literature is that of the Chinese engineer Yuplanners should work together to communi- about 4,000 years ago (Thorp, 1936). Yucate more effectively. grouped soils according to color and struc-
ture and made practical interpretationsbased on these criteria.
Soil Classification in the Past In the latter part of the 12th century, aMoorish scholar, Yahya Ibn Muhammad,
Men have probably recognized soil dif- called Ibn al Awam, wrote The Book ofAg-
CLASSIFICATION AND COLLECTION
riculture, a compendium of knowledgeabout farming, engineering, plant growth,and livestock, derived partly from his ownknowledge, observation, and experience andpartly from the manuscripts of many otherMoorish, Persian, Spanish, African, Roman,and Greek writers.
It is a remarkable book that must havehad a great influence on farming practices,for several centuries at least, in parts of theworld where Arabic was spoken. Until re-cently, The Book of Agriculture existed inthe form of old manuscripts, in a Spanishtranslation (1802) and in a French translation(1864-1867). Now the book is being trans-lated into English for the first time, and itshould soon be available for purchase.
Yahya Ibn Muhammad's discourse onsoils emphasized practical matters, such asproductivity of the principal food crops,suitability for growing specific grains, fruits,and vegetables, need for irrigation, and thelike. He also explained the formation of clayby weathering of rocks. He called attentionto the difficulty of growing crops on soils thatcrack when dry, and of the crop-growingsoils, he awarded first place to the black,friable, porous soils. Moreover, although hedid not present an orderly scheme of soilclassification, he wrote of soil color in rela-tion to soil temperature and recognized theimportance of differences in soil texture, soilmoisture regimes, soil acidity, and salt con-tent. One of Yahya Ibn Muhammad's favor-ite sources, the Sheikh Abu Omar Ben Hag-gag, is quoted as writing, " . . . the first stepin agriculture is recognizing the soil andknowing how to differentiate between thegood and the poor one." This principle, sosimply stated about 1,500 years ago, is equal-ly valid today.
In the 18th and 19th centuries, geologistsand geographers proposed classifications ofsoils based on the presumed rock source ofsoil material. Among these, the classificationof the German professor Fallou (1862) andthose of the Americans, Shaler (1891) andMerrill (1906), are well known. Althoughthese attempts at soil classification missedthe point that dynamic processes of soil gen-esis, controlled by climatic and biological
forces, are more powerful in synthesizingsoils than the hardness, mineralogy, andchemistry of the parent rocks, we see andhear even today references to "graniticsoils," "shale soils," and "glacial soils."
The Start of ModernSoil Classification
Modern soil classification had its begin-ning in the latter half of the 19th century.Separately, and at about the same time, V. V. \Dokuchaiev (Glinka, 1927) in Russia andE. W. Hilgard (1906) in the United States ex-pressed the concept that soils are indepen-dent natural bodies, each kind having a'unique morphology resulting from a uniquecombination of the five soil-forming factors: Iclimate, living organisms, relief, parent ma-terial, and age of land surface. According tothis concept, or model, the kind, thickness,and arrangement of horizons or soil layers in,the profile are the result of interaction of thespecific temperature, moisture, vegetation,animals, and microorganisms on the parentmaterial of the soil over time in the particularbody of soil. This principle of soil genesis ledto the concept of three-dimensional, identifi-able bodies of soil at the earth's surface. Be-cause these kinds of soils could be definedand thus identified in the field, identificationof their boundaries and their delineation onbase maps became possible. The basic modelthus makes possible rational, comprehensive,and reliable soil classification. Consistentand reliable soil classification, in turn, makessoil surveys possible; that is, it makes possi-ble consistent mapping of soils and accurateinterpretations of surveys for specific soiluses.
The importance of this soil model to soilresearch and to the extension of knowledgeabout soil behavior can hardly be overem-phasized, for without the powerful tools ofmodern soil classification and soil surveys,we should all be forced to depend on-trialand error in selecting soils for new develop-ments and in programming soil treatmentand management systems. Cultivators wouldhave to use empirical techniques for guiding
JOHNSON
the use of improved crop varieties, applica-tion of fertilizers and lime, and irrigation anddrainage measures. Engineers and develop-ers could only hope that new structureswould be stable and function properly in newlocations. Resource planners could havelittle confidence that their plans would resultin effective resource development and man-agement.
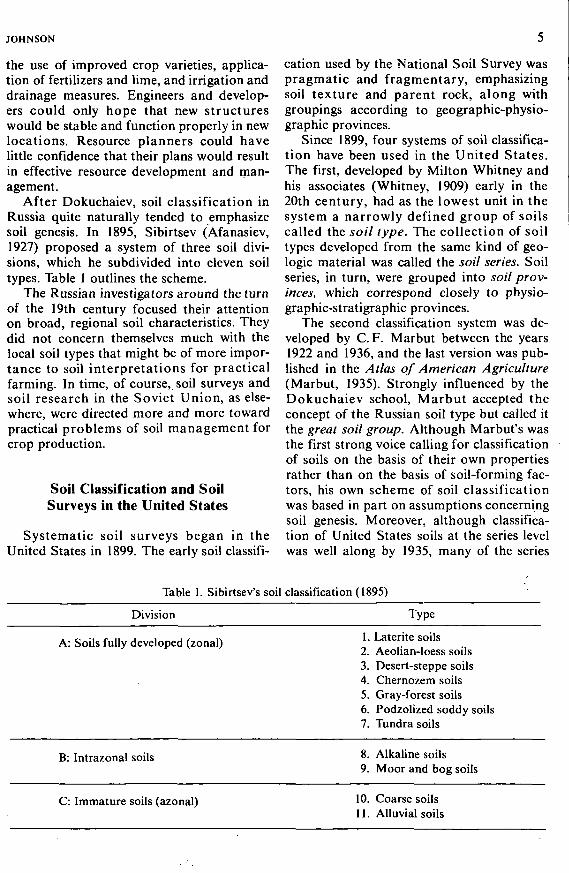
After Dokuchaiev, soil classification inRussia quite naturally tended to emphasizesoil genesis. In 1895, Sibirtsev (Afanasiev,1927) proposed a system of three soil divi-sions, which he subdivided into eleven soiltypes. Table 1 outlines the scheme.
The Russian investigators around the turnof the 19th century focused their attentionon broad, regional soil characteristics. Theydid not concern themselves much with thelocal soil types that might be of more impor-tance to soil interpretations for practicalfarming. In time, of course, soil surveys andsoil research in the Soviet Union, as else-where, were directed more and more towardpractical problems of soil management forcrop production.
Soil Classification and SoilSurveys in the United States
Systematic soil surveys began in theUnited States in 1899. The early soil classifi-
cation used by the National Soil Survey waspragmatic and fragmentary, emphasizingsoil texture and parent rock, along withgroupings according to geographic-physio-graphic provinces.
Since 1899, four systems of soil classifica-tion have been used in the United States.The first, developed by Milton Whitney andhis associates (Whitney, 1909) early in the20th century, had as the lowest unit in thesystem a narrowly defined group of soilscalled the soil type. The collection of soiltypes developed from the same kind of geo-logic material was called the soil series. Soilseries, in turn, were grouped into soil prov-inces, which correspond closely to physio-graphic-stratigraphic provinces.
The second classification system was de-veloped by C. F. Marbut between the years1922 and 1936, and the last version was pub-lished in the Atlas of American Agriculture(Marbut, 1935). Strongly influenced by theDokuchaiev school, Marbut accepted theconcept of the Russian soil type but called itthe great soil group. Although Marbut's wasthe first strong voice calling for classificationof soils on the basis of their own propertiesrather than on the basis of soil-forming fac-tors, his own scheme of soil classificationwas based in part on assumptions concerningsoil genesis. Moreover, although classifica-tion of United States soils at the series levelwas well along by 1935, many of the series
Table 1. Sibirtsev's soil classification (1895)
Division Type
A: Soils fully developed (zonal) 1. Latente soils2. Aeolian-loess soils3. Desert-steppe soils4. Chernozem soils5. Gray-forest soils6. Podzolized soddy soils7. Tundra soils
B: Intrazonal soils 8. Alkaline soils9. Moor and bog soils
C: Immature soils (azonal) 10. Coarse soils11. Alluvial soils
CLASSIFICATION AND COLLECTION
could not be placed in Marbut's system be-cause the scheme did not recognize imma-ture soils, such as Rendzinas, organic soils,and hydromorphic soils.
The classification system of Baldwin, Kel-logg, and Thorp was published in the Year-book of Agriculture in 1938 (Baldwin et al.,1938). Based mainly on Marbut's scheme,but more comprehensive and better docu-mented, this classification had 6 categories.The highest category, soil orders, comprisedzonal, intrazonal, and azonal soils (like Si-birtsev's system). There were 10 suborders,described but mostly unnamed, and 37 greatsoil groups. A family category was proposedbetween the great soil group and series, butneither the category nor any of the familiesthemselves was defined. By 1938, some 2,000soil series and 6,000 soil types had been rec-ognized in the United States.
In 1946, as the Soil Survey Staff started toarrange soil series into families and great soilgroups, serious problems arose. Some seriesseemed not to fit in any of the existing greatsoil groups, whereas others could be placedequally well in two great soil groups. Butthere were no guidelines for grouping seriesinto families. As a kind of stopgap strategy,in 1949 a somewhat revised classificationwas offered (Thorp and Smith, 1949) whichdefined three new great soil groups andwhich combined three others with existinggreat soil groups.
Still it was apparent that the classificationsystem was unequal to the task of reflectingthe great advances in soil science that hadbeen made during the preceding decade anda half. Also, at this time, just after WorldWar II, there was a growing demand for acomprehensive soil taxonomy that wouldhelp to evaluate the soils in developing coun-tries, especially with regard to their potentialfor food production. For these reasons andalso because the old system had so manytroublesome defects, a decision was made in1951 to devise a new soil classification. Thiswas the beginning of the 20-year effort, car-ried through a series of "approximations,"that led to Soil Taxonomy. Besides theUnited States Soil Survey Staff, assistancecame from cooperators in many institutions
and in many countries. Ideas were borrowedfrom other classifications, and each approxi-mation was tested by trial placements of dif-ferent kinds of soils around the world. In1960, the 7th Approximation (USDA, 1960)was published and presented at the 7thInternational Congress of Soil Science inMadison to widen the scope of testing andcriticism. Then a supplement to the 7th Ap-proximation was prepared in 1964, andlater, a second supplement. The system wasput into official use in the United States SoilSurvey in 1965. By that time, some 8,000 soilseries had been recognized, which had allbeen tentatively grouped into families. It isessentially that system that has been pub-lished (USDA, 1975). It is being used dailyin the United States Soil Survey and in soilsurvey organizations and institutes in manyother countries of the world. From its incep-tion, Soil Taxonomy was designed to servesoil-survey needs.
Philosophy of Classification
Cline (1949) emphasized three importantprinciples of classification:
1. Classification should deal with theknowledge existing at the time. Asknowledge changes, the classifica-tion must also change.
2. Classification is a creation of manfor a specific purpose, and the clas-sification should be designed toserve that purpose.
3. Classification consists of creatingclasses by grouping objects on thebasis of their common properties.
Soil classification is an essential operationof soil surveys. Soil taxa are the conceptualbuilding blocks for the mapping units thatare delineated on soil maps (Johnson, 1963a).They enable pedologists to maintain consis-tency in soil surveys from place to place.And, perhaps most important of all, soil taxaare the vehicles for transfer of technologyfrom research stations and farms to new anduntried areas of like soils. In the United
JOHNSON
States, the requirements of the Soil Surveyhave had a profound influence on the con-cept and design of Soil Taxonomy (Smith,1965).
Soil-Survey Requirements inSoil Classification
Certain characteristics of a soil classifica-tion system are needed specifically to servethe objectives of soil surveys. First, the clas-sification must consider all the soil proper-ties that affect soil use. It must also considersoil genesis, because the pedologist uses hisknowledge of the genetic factors to make hismaps and interpretations more accurate. Theclassification should be usable and applica-ble uniformly by competent soil scientistsworking independently but having diversekinds of education and experience. This uni-formity can be had only if the application isobjective rather than subjective; that is, ob-jective in the sense that classification pro-ceeds from the properties of the soils them-selves and not from the beliefs of thepedologist about soils in general.
To be useful, the classification must em-brace all the soils that are known. In particu-lar, it must include cultivated soils and otherdisturbed soils, as well as the virgin ones.
The system should be multicategoric, withfew taxa in the highest category and many inthe lowest. This permits the arrangementand comprehension of soil information byclasses at different levels of generalizationand provides an orderly scheme for remem-bering what is known about soils without anundue burden on human memory. And itprovides convenient bases for the design ofmapping units for soil surveys and soil mapsof different scales and different degrees ofdetail.
Soil taxa are conceptual; they are not thereal soils that are classified. The taxonomyshould provide a linkage, a concept for relat-ing to the conceptual taxa the real soils beingclassified and the real soil bodies delineatedon maps.
The building blocks of soil taxonomieclasses and soil-mapping units are called
pedons. Pedons are real, natural soil volumesjust large enough to show all the soil layerspresent and their relationships (Johnson,19636).
Soil individuals, called polypedons, arethe real objects that are classified (Johnson,19636). They are collections of contiguouspedons all of which have characteristics lyingwithin the defined limits of a single soil se-ries. They are comparable to individual pinetrees, individual fish, and individual men.
Finally, it is helpful if the nomenclature ofthe taxonomy is phonetic, distinctive, andeasily remembered, with names that indicatesomething about the properties of the soilsand their places in the system.
Structure of Soil Taxonomy
Soil Taxonomy (USDA, 1975) satisfies toa great degree the requirements discussedabove. It has six categories and includes allthe currently recognized soil series of theUnited States as well as soils in other partsof the world that have been sufficiently de-scribed and characterized. The six categoriesare discussed briefly below.
Orders
There are 10 soil orders, with differentsets of diagnostic horizons representing dif-ferences both in kind and degree of horizondevelopment.
Entisols and Inceptisols show minimumdegrees of development of horizons.
Vertisols, Aridisols, Mollisols, Spodosols,Alfisols, Ultisols, and Histosols representdifferences in the dominant kinds of genetichorizons.
Oxisols represent a combination of boththe kind and degree of weathering and soilformation.
Halomorphic and hydromorphic soils arenot classified in separate orders but are dis-tributed according to other characteristicsthought to be more important in a compre-hensive scheme. The hydromorphic soils canbe drawn out of the various orders andgrouped as aquic soils if one wants to discussand interpret them separately.
CLASSIFICATION AND COLLECTION
Suborders
There are 47 suborders, from a maximumof 7 in the Mollisols to only 2 in the Aridisols.The differentiae vary, but most tend to em-phasize similar moisture and temperatureregimes, with closely associated naturalvegetation. Suborders are about comparableto the old Great Soil Groups in degree ofabstraction.
Great Groups
Some 227 great groups are defined in thesystem, of which about 185 are known to oc-cur in the United States. The major empha-sis is on the kinds and arrangement of diag-nostic horizons, except in Entisols, whichhave no distinctive horizons.
An attempt was made to select soil char-acteristics to define groups that have had adifferent genesis from the others.
Subgroups
There are more than 1,000 subgroups,about 970 of which are recognized in theUnited States. Three kinds of subgroups aredefined.
There is a typical, central concept foreach group. This is the typic subgroup. It isnot the most extensive subgroup of all greatgroups.
Intergrade subgroups are transitional toother orders, suborders, or great groups.
Extragrade subgroups have propertiesthat are not representative of the great groupbut that do not indicate transition to anyother known kind of soil.
Families
Some 4,500 soil families are currentlyrecognized in the United States alone. Theintent here is to group the soils within eachsubgroup that have similar chemical andphysical properties that affect their re-sponses to management and manipulationfor use. It is expected that the responses ofcomparable phases of all the soils in a fami-ly are nearly enough the same to meet mostof our needs for practical predictions of suchresponses. Thus, the family occupies the
critical position in the Taxonomy betweenthe heterogeneity of the subgroup and thehomogeneity of the series. In many parts ofthe world, the family embraces the most nar-rowly defined classes in the Taxonomy.
Families are defined by a number of prop-erties, the most common of which are:
1. particle-size distribution in the hori-zons of major biologic activity belowplow depth (the "family control sec-tion");
2. mineralogy of the same horizons thatare considered in naming particle-size classes; and
3. soil temperature regime.
Other characteristics, such as soil depth,content of polysulfides, and the like are ap-plied if they are important in the particularsubgroup. Soil family properties are particu-larly significant to the movement and reten-tion of water and to aeration and so affectthe use of soils for growing plants and forengineering purposes.
Series
About 10,500 soil series are now used inthe United States. In this, the lowest cate-gory in the system, the differentiae are main-ly the same properties used to define classesin higher categories, but with much narrowerranges. Soil series, like soil families, are usedmainly for practical purposes, and the taxa inboth of these categories are closely related tointerpretive applications of the system.
Soil series are conceptual. The soil bodiesdelineated on detailed soil survey maps arereal things, and in the United States we givethem the name of the series that is areallypredominant in their composition. In coun-tries where soil series are not uniformly de-fined, phases of soil families may be used togive names to soil-mapping units.
Soil Classification and Designof Soil Surveys
Soil surveys are more than just maps withcolored-block legends. Surveying of soils
JOHNSON 9
entails the following: studying and describe!' nature of the soil landscapes and the differ-ing soils in the field; identifying soil taxo/£*\ent intensities of projected land use or differ-nomic units and naming them; classifying-'ent objectives of the survey,kinds of soils into units that can be shown or(î) These different intensities of soil surveyssoil maps; locating and plotting soil boun-^) require different sorts of mapping units todaries on base maps; studying the behavior^ display spatial soil data in ways that are use-of soils when used for crop production, for- ful for different purposes. The mapping unitsestry, grazing, and a variety of non-farm uses;~ of broad-scale exploratory soil surveys gen-and synthesizing interpretations of the sur(^erally are based on soil subgroups or evenvey that predict the behavior of differentkinds of soils used in different ways. Soil sur-veys are expensive to make and to publish,and they must serve a useful purpose if theyare to gain the support of taxpayers and gov-ernments. Soil properties that are importantfor plant growth are the same propertiesthat affect the behavior of soils for engineer-ing and other non-farm uses. A good soil sur-vey, a scientifically sound and practical soilsurvey, can be interpreted in many usefulways for a long time. In the United Stateswe estimate the useful life of a modern soilsurvey to be at least 25 to 30 years.
Soil surveys of different scales and dif-ferent degrees of detail are needed. In Alas-ka a broad reconnaissance survey at a scaleof 1:500,000 was recently completed. Thiskind of generalized survey uses phases of as-sociations of subgroups as building blocks forthe mapping units. It provides an overview ofthe important soil-resource regions of the en-tire state and identifies areas that have po-tential for different kinds of development:farming, grazing, forestry, and recreation(Kellogg, 1975). It does not provide enoughdetailed soil information for either feasibilitystudies or design and construction of devel-opment projects.
After selecting an area for future farmingdevelopment or other use, a more detailedsoil survey is needed to guide and design thedevelopment. In most rain-fed farming areas,a detailed survey having a scale of about1:20,000, with mapping units designed withphases of soil series or soil families, providesthe detail and refinement of soil informationrequired to support precise interpretationsfor alternative cropping and soil-managementsystems.
In the United States, we use five differentintensities of soil surveys, depending on the
great groups. Intermediate-scale surveys,such as those for semiarid grazing regions,commonly have mapping units based onphases of subgroups or families. The map-ping units of highly detailed surveys areusually refined, narrowly defined phases ofsoil series. In countries where soils are notclassified in series and in areas where theseries classification is incomplete, narrowlydefined phases of soil families serve as con-venient bases for soil-mapping units.
Agencies of government all over the worldare making more use of soil surveys for avariety of purposes generally grouped underthe heading resource-use planning. Planningagencies have learned that soil surveys oflow intensity will provide a large part of theearth-resource information they require formaking country-wide or region-wide alloca-tions of resources for new development proj-ects. Then, when areas proposed for irri-gated farming development or for urban andrecreation development have been delineat-ed with the aid of the soil survey, more in-tensive surveys can provide the detailed in-formation needed for design, construction,and management of the projects.
Soil-survey interpretations, traditionallymade principally for agricultural operations,now cover a wide spectrum of soil uses—solid- and liquid-waste recycling, highwayconstruction, water supply, recreation, wild-life, urban and industrial structures, andmany more specialized activities. The samesoil survey, if correctly carried out accordingto scientific principles, guided by the practi-cal objectives of the survey, can provide thebase for all these sorts of interpretations,because the same soil properties determinethe behavior of a soil used for a variety ofdifferent purposes. The content of clay, silt,and sand, the shrinking and swelling beha-
10 CLASSIFICATION AND COLLECTION
vior, the permeability to water and air, andthe depth to rock are examples of soil prop-erties important to plant growth that are alsoimportant in the strong influence they haveupon matters of non-farm uses. Soil surveyscarry this kind of information; we are re-quired only to make the correct interpreta-tions accurately. For example, a claypan orother slowly permeable layer in a soil re-stricts the movement of air and water. It hasan adverse effect on root growth, and thus onthe plant's ability to grow vigorously, to re-sist drought, and to yield a good harvest.Such a layer also limits the soil's suitabilityfor septic tanks and other on-site waste dis-posal, and it makes a poor subgrade for high-ways. Similarly, a soil high in soluble salts isa poor medium for plant growth, and it alsois corrosive to iron and steel structures, suchas pipelines and fences, leading to highmaintenance and repair costs. High organicmatter content is generally favorable to plantgrowth, but it detracts from a soil's useful-ness for road construction. Many other ex-amples could be given. If we learn how to 'make the correct interpretations of soil sur-veys, we can use them to guide site selectionand to choose the practices for soil manage-ment and manipulation to achieve our re-source-use objectives.
Teamwork in Designing Soil Surveys
Soil surveys are made for a number ofpractical purposes. Among the common ob-jectives are rural land classification for rain-fed and irrigated crop production; land ap-
praisal; selection of new lands for settle-ment; land-use planning at local, regional,and country levels; assessment of potentiali-ties for special crops; forest management;and designing and constructing airports,highways, urban and industrial structures,waste-disposal facilities, and recreationaldevelopments.
An effective and useful soil survey is de-signed to meet the specific objective forwhich it is organized and funded. The basisfor design is the list of soil interpretationsand their refinement or precision requiredto satisfy the survey objective. In the jargonof modern managers, w; list the survey-output needs, and, working backward, weselect and define the inputs that will resultin the output required.
fThe pedologist is skilled in soil classifica-
tion and in designing surveys for differentpurposes. He cannot be knowledgeable inall the various uses of soils for which surveyinterpretations may be wanted. Other spe-cialists (engineers, sanitarians, resourceplanners, landscape architects, and so forth)are needed to specify which kinds of soil in-terpretations will be made and in what detailand precision. And these same specialistsare needed to help evaluate the survey de-sign as mapping progresses, to guide the pe-dologist to the most effective and usefulmapping units.
By the teamwork of interdisciplinarygroups of scientists and engineers, and byscientific soil classification guided by prac-tical objectives, soil surveys can be designedand carried out that will be sought aftereagerly by all who plan the use and manage-ment of the earth's soil resources.
Literature Cited
AFANASIEV, J. N. 1927. The classification problem in Russian soil science. In Russian Pedol. Invest. 5.Acad. Sei., USSR, Leningrad.
BALDWIN, M., C. E. KELLOGG, and J. THORP. 1938. Soil classification, pp. 979-1001. In Soils and men.Yearb. Agric, USDA, Washington, D.C.
CLINE, M.G. 1949. Basic principles of soil classification. Soil Sei. 67:81-91.FALLOU, F.A. 1862. Pédologie oder allgemeine und besondere Bodenkunde. (Publisher not given.)
Dresden.
JOHNSON 1 ]
GLINKA, K. D. 1927. Dokuchaiev's ideas in the development of pedology and cognate sciences. In Rus-sian Pedol. Invest. 1. Acad. Sei., USSR, Leningrad.
HILGARD, E. W. 1906. Soils: their formation, properties, composition, and relation to climate and plantgrowth in the humid and arid regions. Macmillan, New York.
JOHNSON, W. M. 1963a. Relation of the new comprehensive soil classification system to soil mapping.Soil Sei. 96:31-34.
JOHNSON, W. M. 19636. The pedon and the polypedon. In The 7th approximation—a symposium. SoilSei. Soc. Am. Proc. 27:212-215.
KELLOGG, C. E. 1975. Agricultural development: soil, food, people, work. SSSA, Madison, Wis.MARBUT, C. F. 1935. Soils of the United States. In Atlas of American agriculture, pt. 3, advance sheets
no. 8. USDA, U.S. Government Printing Office, Washington, D.C.MERRILL, G. P. 1906. A treatise of rocks, rock-weathering, and soils. New ed. Macmillan, New York.SHALER, N.S. 1891. The origin and nature of soils. U.S. Geol. Survey Annual Report 12:213-345.SMITH, G.D. 1965. Lectures on soil classification. In Pédologie, Special no. 4. Belgian Soil Sei. Soc,
Ghent.THORP, JAMES. 1936. Geography of the soils of China. (Publisher not given.) Nanking.THORP, JAMES, and G.D. SMITH. 1949. Higher categories of soil classification: order, suborder, and
great groups. Soil Sei. 67: 117-126.USDA, SCS, Soil Survey Staff. 1960. Soil classification. A comprehensive system, 7th approximation. U.S.
Government Printing Office, Washington, D.C.USDA, SCS, Soil Survey Staff. 1975. Soil taxonomy: a basic system of soil classification for making
and interpreting soil surveys. Agric. Handb. no. 436. U.S. Government Printing Office, Washing-ton, D.C.
WHITNEY, MILTON. 1909. Soils of the United States. U.S. Dept. Agric. Bull. 55.
Some Fundamentals of Soil Classification
F. H. BEINROTH
Department of Agronomy, College of Agricultural SciencesUniversity of Puerto Rico, Mayaguez, Puerto Rico
The objective of taxonomie soil classifications is to provide a conceptual framework to accom-modate the current knowledge of soils and concepts of soils derived from this knowledge in anorganized manner. Taxonomie classifications show the relationships inherent in the populationof soils and allow comparisons of soils for both similarities and differences. The principal prac-tical application of soil classification lies in soil surveys, which can be interpreted for a varietyof technical uses, including the transfer of agrotechnology. If the experiences of the United IStates, the Soviet Union, and other countries are a guide, it is clear that taxonomie systems ofsoil classification that have a large number of precisely defined taxa in the lower categories arerequired. Soil-survey interpretations for crop production provide qualitative groupings and donot circumvent the need for agronomic soil testing.
The recognition of soils as independentnatural bodies possessing various kinds anddegrees of internal organization that reflectthe integrated effect of the factors of soilformation provided the first model for thescientific study of soils. This perception, de-veloped some hundred years ago in Russiaunder the leadership of V.V. Dokuchaiev,marked the most fundamental change in theconcept of soil and subsequently led to theestablishment of soil science as a separatediscipline. Like most scientific models, theRussian concept underwent considerablechange with time as the knowledge aboutsoils increased. One significant change hasoccurred in the quantitative aspects of themodel. The present concept is, therefore,more nearly a quantitative representation ofour knowledge, since most soil propertiescan now be characterized in terms that havequantitative meaning at some level of pre-cision (Cline, 1961). This has had great im-pact on the development of soil science. For,
to quote Lord Kevin, " . . . when you cannotmeasure what you are speaking about, whenyou cannot express it in numbers, yourknowledge is of a meagre and unsatisfac-tory k ind ; . . . scarcely advanced to the stageof science . . . . "
Since soils, then, are objects whose in-herent properties can be quantified, theymay also be classified on the basis of theseproperties. As a consequence, many systemsof soil classification have been proposed andmany more are possible. Soils as they occurin nature, however, may not in all instancesconform to the theories and schemes pro-pounded by pedologists. Yet, we should notblame the soils for this predicament since, asBertrand Russell put it, "nature herself can-not err because she makes no statements. Itis men who may fall into error when theyformulate propositions."
The intent of this paper is to examinesome rationales and practical aspects of soil
12
lEINROTH 13
Classification and to describe briefly SoilTaxonomy, the U.S. system.
Purpose of Soil Classification
In "Basic Principles of Soil Classifica-ion," Cline (1949) stated: "The purpose ofiny classification is so to organize our knowl-:dge that the properties of objects may beemembered and their relationships may beinderstood most easily for a specific objec-ive. The process involves formation of classes>y grouping the objects on the basis of their:ommon properties. In any system of classifi-:ation, groups about which the greatest num->er, most precise, and most important state-nents can be made for the objective servehe purpose best."
Logic of Soil Classification
In most existing systems of soil classifica-:ion, it is assumed implicitly that there arendividual soils, just as there are individualinimals or plants, and that these small, dis-:rete units can be treated as a population.The aggregate of an almost infinite numberjf these individuals constitutes the soils of:he world. Whereas former concepts would•egard the pedosphere not as a universe ofndividuals but as a kind of continuum vary-ng from place to place in reflection of chang-ng soil-forming conditions, the present viewconsiders the pedosphere as a "collection ofjodies" (USDA, 1960). Cline (1961) pointedaut that "the perspective in which we viewsur model has changed from one in which:he whole is emphasized and its parts areoosely defined and indistinct to one in which:he parts are sharply in focus and the wholeis an organized collection of parts."
The pedon is the smallest entity one may;all "a soil," but it would be impractical toieal with all of these units in any system of»oil classification. However, the individualpedons are the sampling units used to definethe lowest category of most soil classifica-tion systems, the soil series. Moreover, pe-dons are the only entities that can be mea-sured and analyzed, whereas the categories
of soil classification systems are conceptualabstractions of these particulars made atdifferent levels of generalization.
I may note parenthetically that this kindof reasoning conforms to the theories ofRealism, originally postulated by Plato andlater moderated by Aristotle, according towhich universals exist and are implicit inparticular instances. Reasoning that cate-gories of soil classification may not exist in-dependently of our mental constructions,Robinson (1949) prefers to regard these cate-gories as "constructed universals," followingthe philosophy of the Representationists.
Also of interest in this context are Kant's(1781) ideas about knowledge and experi-ence as presented in his Critique of PureReason. On the assumption that experienceis necessary but not sufficient for knowledge,he set out to explain experience in terms ofconcepts rather than vice versa. Knowledgethat is in principle independent of experienceis termed "a priori," and whatever is derivedfrom experience is described as "a posteri-ori." As will be shown, both of these con-cepts have been used in developing systemsof soil classification.
Principles of Soil Classification
The population of soils can be groupedin segments that are similar in selected prop-erties and distinguished from other segmentsof the population by differences in theseproperties. Such classes, or taxa, can be con-ceived at various levels of abstraction. Forthe diverse population of soils, several levelsare required to evince the relationships de-sired. In the resulting multicategoric systems,the detail of definition and consequently thehomogeneity of classes increase with de-creasing levels of abstraction or categoricalrank. Therefore, the greatest number ofstatements can be made about classes of thelowest category and the least about the high-est category (Cline, 1949).
Classes are concepts of real bodies of soiland comprise individuals related in varyingdegrees to a hypothetical modal individual.They are defined on the basis of differentiat-

14 CLASSIFICATION AND COLLECTIO!•N
ing characteristics, which should be soilproperties that can be quantitatively deter-mined in the field or in the laboratory. Well-conceived differentiae are associated with anumber of covarying properties thus permit-ting statements about "accessory character-istics." By contrast, properties varyingindependently of the differentiae are "acci-dental characteristics," which cannot be in-ferred from the definition of a class.
There is considerable divergence amongpedologists regarding the choice of differen-tiating criteria. Thus, the Russian classifica-tion gives prominence to climatic and eco-logical factors, whereas the French systememphasizes pedogenetic processes. Althoughthe ensuing classes of both systems may bewell suited to show known relationships ofsoil genesis, such criteria have serious limita-tions for application in a taxonomie classifi-cation because they would conceal relation-ships yet unknown and do not conform to theprinciples of differentiation formulated byCline (1949). The American approach hasbeen to use quantifiable soil properties re-sulting from pedogenetic processes as con-trolled by the factors of soil formation ratherthan by theories of pedogenesis per se.
Elaboration of SoilClassification Systems
There are basically two methods of set-ting up classification systems. In the a priorior descending method, the higher categoriesare conceived in terms of hypotheses andprinciples of generally pedogenetic nature,and more detailed categories are added asobservation proceeds. Many of the soil clas-sification systems developed in Europe areexamples of this kind. Although such sys-tems are the only possible ones when notmuch accurate data are available, they havethe inherent defect of all preestablishedschemes used to accommodate factual knowl-edge. Bridgeman (1927) has pointed out thatthe scientist "recognizes no a priori princi-ples which determine or limit the possibili-ties of new experience."
The second method is a posteriori or as-
cending, where the reasoning is from fact!to concepts. This approach requires, olcourse, a great amount of data about recog-nizable bodies of soil, especially those iden-tified as soil series. The U.S. Soil Taxonomjis essentially of this type. It should be noted,however, that the organization of categoriesand classes of this system is a direct conse-quence of theories of pedogenesis and cur-rent concepts of soil science (Cline, 1961).
Kinds of SoilClassification Systems
Because soils may be classified for a greaivariety of specific objectives, there are a;many systems of soil classification conceiv-able as there are objectives for groupingsoils. Each of these systems may be the besifor the particular purpose for which it wa;designed. Yet, as the means for attaining on<objective are seldom suitable for attaininganother, a single system will rarely serve tweobjectives equally well (Cline, 1949). For example, a system developed for classifyingsoils in terms of their suitability for septi<tanks will not be very useful for determiningtheir lime requirement.
Systems limited by the special bias dietated by their purpose are called technicaclassifications. They are opposed to naturaor taxonomie classifications, where the objective is to show relationships amongst th<greatest number of properties and most important properties without reference to ispecific practical purpose (Cline, 1949). Ataxonomie classification recognizes that soil:have many properties, some of which anassociated in an apparently causal relationship. These attributes of the population anconsidered and those having the greatesnumber of covariant or accessory characteristics are selected to define and separate th<various classes and categories (Mill, 1925)To quote Cline (1949) again, "the naturaclassification, therefore, performs the extremely important function of organizingnaming, and defining the classes that are thibasic units used (1) to identify the sampliindividuals that are the objects of research
lEINROTH 15
2) to organize the data of research for dis-:overing relationships within the popula-ion, (3) to formulate generalizations abouthe population from these relationships, and[4) to apply these generalizations to specificbases that have not been studied directly."I The issue of technical versus taxonomiesystems has been the subject of frequent ar-juments among pedologists. Those morepragmatically inclined, on the one hand,end to regard taxonomie classifications as3urely academic labor, eminently respect-ible perhaps, but without practical meaning.Faxonomists, on the other hand, are temptedo consider technical systems a more or lessncoherent juxtaposition of facts (Manil,1959). However, there appears to be no ra-ional base for such discrepancies. The funda-mental differences in the two kinds of sys-'ems merely reflect the different purposes'or which the systems have been devised.
Soil Taxonomy, an Exampleof a Modern System
Soil Taxonomy, the new U.S. system ofoil classification, is an attempt at a compre-ïensive classification of soils. It represents anodern effort to tackle the three main prob-ems encountered in setting up a taxonomieystem: the selection of differentiating cri-eria, the definition of classes and their;rouping in categories, and the nomenclature)f taxa.
In recognition of the real need for anntirely new system, Soil Taxonomy has»een developed over the past 20 years in the»oil Conservation Service of the Uniteditates Department of Agriculture, under theeadership of G. D. Smith, with the coopera-ion of soil scientists of U.S. universities andertain pedologists from other countries. Theystem went through a series of approxi-nations of which the 7th Approximationvas published in 1960 (USDA). After sub-tantial revisions, it has now been publisheds a book entitled Soil Taxonomy: A Basic>ystem of Soil Classification for Making andnterpreting Soil Surveys (USDA, 1975).
In developing the basic rationales of thesystem, the authors of Soil Taxonomy wereinfluenced by Bridgeman's Logic of ModernPhysics (1927). They also drew on WesternEuropean experience, particularly on thedefinitions of concepts basic to the Frenchclassification (Smith, 1965). More than 70years of soil survey provided the detailedinformation without which the developmentof the system would have been impossible.
Like most taxonomie systems, Soil Tax-onomy is a multicategoric system. Each cate-gory is an aggregate of taxa, defined atabout the same level of abstraction, withthe smallest number of classes in the highestcategory and the largest number in the low-est category. In order of decreasing rank,these categories are order, suborder, greatgroup, subgroup, family, and series.
Applying the concepts of pedogenic pro-cesses, the authors of Soil Taxonomy differ-entiate orders, suborders, and great groupson the basis of presence or absence of avariety of combinations of diagnostic hori-zons and soil properties. Three levels ofsuch sets are used in the three categories,each set of properties marking pedogenicprocesses that operate within the sets char-acterizing the higher category or categories.Examples of differentiae used at the orderlevel are diagnostic horizons, such as theoxic and spodic horizons or the mollic epi-pedon. Soil moisture regime and extremechemical or mineralogical properties, suchas the presence of large amounts of allo-phane, are examples of criteria for differen-tiating suborders. Properties that appear tobe superimposed on the diagnostic featuresof the orders and suborders, such as variouskinds of pans or the presence of plinthite,are used to differentiate great groups.
Subgroups are subdivisions of greatgroups, representing either the central con-cept of the category, the intergrades to othergroups, or the extragrades that have addi-tional aberrant properties. Families andseries are distinguished on the basis ofproperties selected to create taxa that aresuccessively more homogeneous for practicaluses of soils. Thus, families are intended toprovide classes having relative homogene-
16 CLASSIFICATION AND COLLECTION
ity in properties important to plant growth,and series are subdivisions of families in-tended to give the greatest homogeneity ofproperties in the rooting zone, consistentwith the occurrence of mappable areas atscales of detailed soil surveys.
The classes of Soil Taxonomy have beenformed in consideration of concepts of pedo-genic processes. However, as these causesare not fit as diagnostic criteria, some oftheir more prominent effects were selectedas differentiae. So far as possible, propertiesthat are the result of soil genesis werechosen as differentiae because they carry themaximum number of accessory propertiesand have geographic implications of sus-ceptibility to mapping. As a basic principle,these differentiae are soil properties, andthere are defined operations to identify them(Smith, 1965). The Soil Survey Manual(USDA, 1951) and the Soil Survey Labora-tory Methods (USDA, 1967) provide thedefinitions and procedures for these opera-tions.
The nomenclature of Soil Taxonomymarks a complete departure from past prac-tice. It was not conceived to mystify theoutsider, as some might think. But becausethe old names were ambiguous, of diverselinguistic provenance, difficult to redefine,and generally unsuited for use in a systemat-ic taxonomy, new names were coined, large-ly from Greek and Latin roots, that fit anymodern European language without trans-lation. The name of each taxon clearly indi-cates the place of the taxon in the systemand connotes some of its most importantproperties.
Soil Taxonomy is not a perfect system.It is an organized abstract of current knowl-edge of soils and of concepts derived fromthis knowledge and can, therefore, be nobetter than the state of that knowledge. Yetour knowledge of soils is still incomplete,and this is particularly true for many soilsof the tropics. The classification of Oxisols,for example, has been based on a limitedamount of factual data, hence, has laggedbehind that of other orders of mineral soils,and thus is certain to have many shortcom-ings (USDA, 1975). However, the Soil Con-
servation Service is now beginning to direciefforts toward more meaningful methods oassessing organic soil materials and towarccharacterization of relevant properties o!soils of the tropics (Flach, 1973). In alprobability, this will lead to additional dif-ferentiae for classifying Oxisols and willentail changes in the present system.
The definition of criteria, classes, ancategories of Soil Taxonomy is factual andleaves no scope for subjective speculation.However, the guiding rationales underlyingthe development of the framework of SoilTaxonomy are provided by concepts of soilgenesis. This genetic bias is also reflectedin the choice of differentiae and class limits.As many pedogenetically significant proicesses take place in the subsoil, criteria re-lating to subsoil properties tend to be usedmore frequently as differentiae than thoserelating to surface-soil properties. Even acasual analysis of the key to Soil Taxonomyreveals that diagnostic subsoil propertiescommonly take precedence over surface-soilcriteria. This controls the kind and amouniof information a taxon contains by virtue oiits definition. With few exceptions, a greateinumber of quantitative statements can bemade about the subsoil than the surface soilHowever, because the criteria of Soil Tax-onomy have many covariant properties andaccessory characteristics, qualitative infer-ences of reasonable accuracy can be madeabout the surface soil.
Soil Taxonomy is the official system oithe National Cooperative Soil Survey of theUnited States, but it is also used in someother countries, particularly South Americî(Costa de Lemos, 1971). Of the numerousclassifications used in tropical areas, SoiTaxonomy is among the most importamones (Aubert and Tavernier, 1972). Al-though it has not been accepted unanimous-ly outside the United States, Soil Taxonomyis likely to be adopted as a system of reference for international communication, espedaily in technical papers.
Use of Soil Classification
Natural or taxonomie soil classificatioi
lEINROTH 17
las two basic functions. First, as pointedjut earlier, it identifies, organizes, andlames soils in an orderly fashion and stimu-ates the revelation and formulation of rela-ionships within the soil population. Second,t serves as a base for the application of soilsechnology, for the interpretation of soils as:lassified and delineated on soil maps, andor the transfer of experience.
The principal practical application of soil:lassification lies in soil survey and its inter->retation. Soil-survey interpretations pro-vide predictions about the behavior of a'defined kind of soil" under stated condi-ions, especially systems of soil use andnethods of manipulation, which indicateeasonable alternatives and the expectedesults (Kellogg, 1961). Such interpretations:an be, and have been, made for a variety ofmrposes including land-use planning, foun-lation and highway engineering, recreation,ax assessment, effluent disposal, and arche-)logy. These applications are the subject ofwo recent publications by Bartelli et al.1966) and Simonson (1974) and are exclud-d from the discussion below that centers>n some aspects of agricultural interpreta-ions and agrotechnology transfer in theropics.
Agricultural interpretations and extrapo-ations obviously have technical purposes,md thus an argument could be made inavor of using some kind of technical sys-em of soil classification for these processes,fet, while this may be a reasonable state-nent of principle, it appears that interpre-ations and transfers have to be made on thelasis of the existing soil maps and the classi-ication systems employed in their construc-ion. The systems most widely used in tropi-al areas are the FAO/UNESCO LegendDudal, 1968; FAO, 1970), the French SoilClassification (Aubert, 1965; Commissionle Pédologie, 1967), the Classification ofBrazilian Soils (Bennema, 1966), and theJ.S. Soil Taxonomy (USDA, 1975). Taxaif these systems can be correlated at variousategoric levels and, in most cases, withome degree of accuracy (Beinroth, in press;teinroth et al., 1974).
All of the mentioned systems are, in prin-
ciple, taxonomie classifications. Their appli-cation in soil surveys alludes to the rationalethat these, although practical in purpose,must also have reasonable scientific stan-dards to be useful. In particular, a soil sur-vey should not become obsolete with chang-ing agricultural technology, and a soil surveyshould further facilitate the interpretationfor a variety of uses, some of which mightnot have been anticipated at the time thatthe survey was made. It is evident that theserequirements can only be met if a taxonomiesystem is used (Smith, 1965). Although tax-onomie systems have some inherent limita-tions for agricultural interpretations becauseof their emphasis on subsoil properties,there are compelling reasons for their usein soil surveys. In cultivated soils, the sur-face is also the main management zone and,as such, is affected by frequent changes inphysical and chemical properties. If theseproperties were selected as differentiae, theclassification and the soil maps of cultivatedareas would also be subject to change withequal frequency.
Whereas classifying and mapping soilsare analytical processes that involve definedor specified measurable soil characteristicsand differentiae, the interpretation of soilsurveys requires a careful synthesis of manydata in relation to less tangible soil quali-ties resulting from the interaction betweensoil characteristics and superimposed prac-tices (Kellogg, 1961). Soil productivity, forexample, is that quality of a soil that sum-marizes its potential for producing plants orsequences of plants under defined sets ofmanagement practices; it is also a synthesisof conditions of soil fertility, water control,plant species, soil tilth, pest control, andphysical environment. Soil survey interpreta-tion, therefore, should be a team effortamong pedologists and competent scientistsfrom the relevant disciplines.
The precision and detail of agriculturalpredictions resulting from soil survey inter-pretation depend on (1) the knowledge of theinteractions involved between soil charac-teristics, crop requirements, and manage-ment practices, and (2) the degree of gener-alization and homogeneity of the mapping
18 CLASSIFICATION AND COLLECTION
unit interpreted. Reliable interpretations arepossible only if there is inductive and empiri-cal knowledge of the behavior of the soilsunder consideration relative to various agro-nomic and cultural practices. This is not al-ways the case, particularly in the tropics.Also, interpretations of the broad units ofsmall-scale soil maps, usually associationsclassified at high categoric levels, must bynecessity be more general than those formapping units of high-intensity surveysshowing phases of series. We should furthernote that taxonomie units are not to be con-fused with mapping units because the lattermay include quite contrasting soils. There-fore, interpretations made for the dominantsoil of a mapping unit do not necessarilyapply to all soils of that unit.
About transfer of agrotechnology, Smith(1965) contended that to be useful, the soilclassification used "should be a multi-cate-goric system with a large number of taxa inthe lower categories.... [These] must beas specific as possible about a great manysoil properties.... Higher categories areessential for comparisons of the soils oflarge areas, but are of limited value for thetransfer of experience." Classes are definedin terms of soil properties which correlatewith patterns of soil management knowledge.In the U.S. Soil Taxonomy, soil families are,within a given subgroup, differentiated pri-marily on the basis of soil properties impor-tant to plant growth and indicative of soil-water-root relationships. Soils classified intothe same soil families should, therefore,have nearly the same management require-ments and similar potentials for crop pro-
duction. This assumption was recently substantiated in a study of soils of the southenUnited States (DeMent et al., 1971). Th<study further showed that only general kindof soil behavior can be predicted withiiclasses of the more broadly defined highecategories.
The systems of soil classification used ithe tropics need to be evaluated relative ttheir usefulness for soil-survey interprétations and knowledge transfers. To be usefuin this respect, they must allow interpretivgroupings that are meaningful for agricultural purposes. If the systems fail to meethis requirement, they should be modifiéeAlthough taxonomie classifications shoulnot be biased by practical concerns, more oless arbitrary divisions among taxonomiunits can be redefined in consideration cpractical needs. It should be realized, however, that soil classification cannot generatall of the information required for crop prcduction and, in particular, cannot substitutfor on-site soil testing for agronomic puiposes. On the basis of taxonomie classification, one can group soils according to thlikelihood and degree of nutrient deficiencies under specific assumptions of past maragement and their probable response tfertilizers, but not according to specific arnual applications needed.
Finally, it should be emphasized that soilsurvey interpretations provide predictionsnot recommendations. Decisions must depend partly on economic characteristics, nosimply on the physical and biological environment.
Literature Cited
AUBERT, G. 1965. Classification des sols utilisée par la Section de Pédologie de l'ORSTOM. CahORSTOM, Sér. Pédol. 3:269-288.
AUBERT, G., and R. TA VERNIER. 1972. Soil survey, pp. 17-44. In Soils of the humid tropics. Natl. AcadSei., Washington, D.C.
BARTELLI, L.J., A.A. KLINGEBIEL, J.V. BAIRD, and M.R. HEDDLESON. 1966. Soil surveys and land usplanning. SSSA and ASA, Madison, Wis.
BEINROTH, F. H. (In press.) Relationships between U.S. soil taxonomy, the Brazilian soil classificatioisystem, and FAO/UNESCO soil units. Proc. of the Seminar on Soil Management and the Development Process in Tropical America, Cali, Columbia.
•INROTH 19
EINROTH, F. H., H. IKAWA, and G. UEHARA. 1974. Classification of the soil series of the State ofHawaii in different systems. Agriculture Technology for Developing Countries, Tech. Ser. Bull.no. 10.
ENNEMA, JAKOB. 1966. Classification of Brazilian soils. Report to the Government of Brazil. UNDPProject BRA/TE/LA, Report no. 2197.
'RIDGEMAN, P. W. 1927. The logic of modern physics. Macmillan, New York.LINE, M.G. 1949. Basic principles of soil classification. Soil Sei. 67:81-91.LINE, M.G. 1961. The changing model of soil. Soil Sei. Soc. Am. Proc. 25(6):442^46.OMMissiON DE PÉDOLOGIE ET DE CARTOGRAPHIE DES SOLS. 1967. Classification des sols. Comm. Péd.Cart. Sols, Paris. (Mimeographed.)OSTA DE LEMOS, R. 1971. Progress in soil survey and its application in Latin America, pp. 102-112.In Systematic land and water resources appraisal. Latin America Land and Water Bull. no. 1.
EMENT, J. A., K.K. YOUNG, and L.J. BARTELLI. 1971. Soil taxonomy and soil survey interpretations.ASA, Agron. Abstracts, p. 101.UDAL, R. 1968. Definitions of soil units for the soil map of the world. World Soil Res. Report no. 33.AO. 1970. Key to soil units for the soil map of the world. AGL:SM/70/2, WS/A7460.[LACH, K.W. 1973. Soil characterization in the soil survey program. ASA, Agron. Abstracts, p. 113.[ANT, I. 1781. Kritik der reinen Vernunft. J.F. Hartknecht, Riga.[ELLOGG, C.E. 1961. Soil interpretations in the soil survey. USDA, SCS, U.S. Government PrintingOffice, Washington, D.C.ANIL, G. 1959. General considerations on the problem of soil classification. J. Soil Sei. 10:5-13.ILL, J.S. 1925. A system of logic. 8th ed. Longmans, Green and Co., London.OBiNSON, G. W. 1949. Some considerations on soil classification. J. Soil Sei. 1(2): 150-155.MONSON, R.W. (ed.) 1974. Nonagricultural applications of soil surveys. Developments in soil science.vol. 4. Elsvier, Amsterdam.
MITH, G.D. 1965. Lectures on soil classification. In Pédologie, Special no. 4. Belgian Soil Sei.Soc, Ghent.SDA, SCS, Soil Survey Staff. 1960. Soil classification. A comprehensive system, 7th approximation.U.S. Government Printing Office, Washington, D.C.SDA, SCS, Soil Survey Staff. 1967. Soil survey laboratory methods and procedures for collectingsoil samples. Soil Survey Inv. Report no. 1.SDA, SCS, Soil Survey Staff. 1975. Soil taxonomy; a basic system of soil classification for makingand interpreting soil surveys. Agric. Handb. no. 436. U.S. Government Printing Office, Washing-ton, D.C.SDA, Soil Survey Staff. 1951. Soil survey manual. Agric. Handb. no. 18. U.S. Government PrintingOffice, Washington, D.C.
Occurrence and Significance of Climatic Parametersin the Soil Taxonomy
H. IKAWA
Department of Agronomy and Soil Science, College of Tropical AgricultureUniversity of Hawaii, Honolulu, Hawaii, U.S.A.
Climatic parameters influence the properties of soils and ultimately the utilization of soilBecause these parameters are so important, they themselves have been included as soil propeties, that is, as soil moisture and soil temperature, in the Soil Taxonomy (USDA, 1975). The;parameters, expressed to a different degree at the various categorical levels in the Soil Taxoiomy, are important because the soil classification names can denote the different environmenjassociated with the soils themselves. In other words, the different taxa can express the différerecosystems. By knowing the system of soil classification, one can know whether a soil is moilor dry or of a cool or warm area. Furthermore, other properties, such as organic matter, soil pKand base saturation, can be associated with the climatic parameters. The objectives of this paptare (1) to describe or define these climatic parameters as soil properties, (2) to indicate where ithe Soil Taxonomy the climatic parameters are expressed and what significance these padmeters have in making soil classification useful in technology transfer and in land-use planninand development, and (3) to present some examples of how the different soil moisture or sdtemperature regimes are associated with different crops.
Soil Moisture Regimes
Climatic parameters such as soil moistureand soil temperature regimes are preciselydefined in the Soil Taxonomy. Quotationsused in this paper are from various sectionsof this document.
The soil moisture regime refers to thepresence or absence of water in the soil atdifferent times of the year. A soil is consid-ered to be dry when the moisture tension is15 bars or more and moist when the mois-ture tension is less than 15 bars. "A soil maybe continuously moist in some or all horizonsthroughout the year or for some part of theyear. It may be moist in winter and dry insummer or the reverse. In the northernhemisphere, summer refers to the months of
June, July, and August, and winter meanDecember, January, and February. A soil ca horizon is considered to be saturated witwater when water stands in an unlined bonhole close enough to the soil surface or tthe horizon in question that the capillarfringe reaches the surface or the top of thhorizon."
Soil Moisture Control Section
To estimate the soil moisture regirmfrom climatic data, it is necessary to hfamiliar with the term soil moisture contnsection. The soil moisture control sectionthat portion of the soil in which the uppsboundary is the depth to which a dry sowill be moistened by 2.5 cm (1 inch) of wat<
20
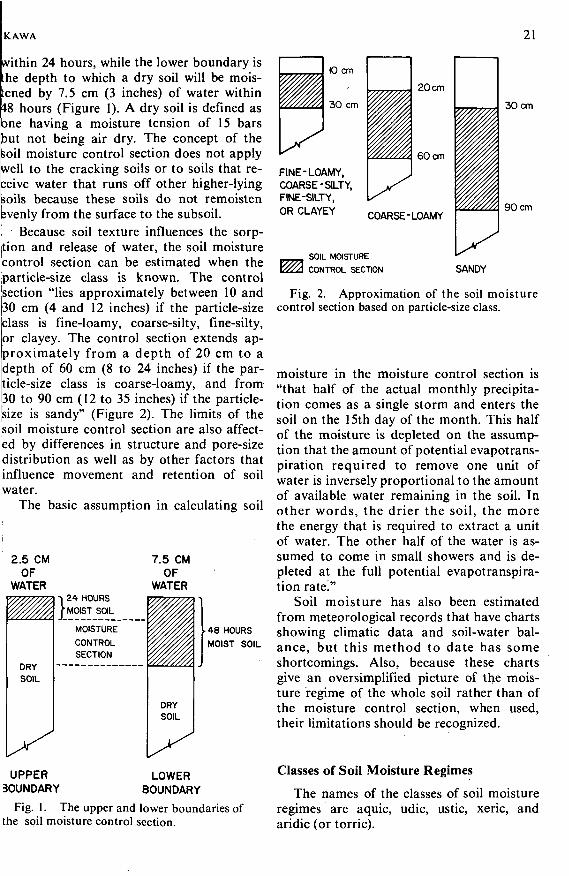
KA WA 21
within 24 hours, while the lower boundary isthe depth to which a dry soil will be mois-tened by 7.5 cm (3 inches) of water within48 hours (Figure 1). A dry soil is defined asone having a moisture tension of 15 barsbut not being air dry. The concept of thesoil moisture control section does not applywell to the cracking soils or to soils that re-ceive water that runs off other higher-lyingsoils because these soils do not remoistensvenly from the surface to the subsoil.
Because soil texture influences the sorp-tion and release of water, the soil moisturecontrol section can be estimated when the[particle-size class is known. The control[section "lies approximately between 10 andpO cm (4 and 12 inches) if the particle-sizeclass is fine-loamy, coarse-silty, fine-silty,or clayey. The control section extends ap-proximately from a depth of 20 cm to adepth of 60 cm (8 to 24 inches) if the par-ticle-size class is coarse-loamy, and from30 to 90 cm (12 to 35 inches) if the particle-[size is sandy" (Figure 2). The limits of thesoil moisture control section are also affect-ed by differences in structure and pore-sizedistribution as well as by other factors thatinfluence movement and retention of soil
ater.The basic assumption in calculating soil
2.5 CMOF
WATER
7.5 CMOF
WATER
üi
DRYSOIL
-I 24 HOURSf MOIST SOIL
MOISTURE
CONTROL
SECTION
'WDRYSOIL
48 HOURSMOIST SOIL
UPPER LOWER3OUNDARY BOUNDARY
Fig. 1. The upper and lower boundaries ofthe soil moisture control section.
10 cm
30 cm
FINE-LOAMY,COARSE-SILTY,FINE-SILTY,OR CLAYEY
20 cm
60 cm
COARSE-LOAMY
SOIL MOISTURE
CONTROL SECTION
3 0 cm
90 cm
SANDY
Fig. 2. Approximation of the soil moisturecontrol section based on particle-size class.
moisture in the moisture control section is"that half of the actual monthly precipita-tion comes as a single storm and enters thesoil on the 15th day of the month. This halfof the moisture is depleted on the assump-tion that the amount of potential evapotrans-piration required to remove one unit ofwater is inversely proportional to the amountof available water remaining in the soil. Inother words, the drier the soil, the morethe energy that is required to extract a unitof water. The other half of the water is as-sumed to come in small showers and is de-pleted at the full potential evapotranspira-tion rate."
Soil moisture has also been estimatedfrom meteorological records that have chartsshowing climatic data and soil-water bal-ance, but this method to date has someshortcomings. Also, because these chartsgive an oversimplified picture of the mois-ture regime of the whole soil rather than ofthe moisture control section, when used,their limitations should be recognized.
Classes of Soil Moisture Regimes
The names of the classes of soil moistureregimes are aquic, udic, ustic, xeric, andaridic (or torric).
22 CLASSIFICATION AND COLLECTION
Aquic soils
Aquic soils are saturated by ground wateror by water of the capillary fringe and arein a reduced state because of the lack of dis-solved oxygen. The whole soil must be satu-rated in the highest categories of soils, butonly the lower horizons are saturated in thesubgroups. The removal of dissolved oxygenfrom the ground water by biological activi-ties makes it "implicit in the concept thatthe soil temperature is above biologic zero(5° C) at some time while the soil or thehorizon is saturated." Although the groundwater level can fluctuate with the season,being highest in the rainy season or duringtime of almost no evapotranspiration, theground water can be at, or very close to, thesurface of the soils, such as in a tidal marshor a closed, landlocked depression withperennial streams. Under such conditions,these soils have a peraquic moisture regime.
Udic soils
Udic soils are moist soils. "In most yearsthe soil moisture control section is notdry in any part for as long as 90 days (cumu-lative). If the mean annual soil temperatureis lower than 22° C and if the mean winterand mean summer soil temperatures at adepth of 50 cm differ by 5° C or more, thesoil moisture control section is not dry in allparts for as long as 45 consecutive days inthe 4 months that follow the summer solsticein 6 or more years out of 10. In addition,the udic moisture regime requires, except forshort periods, a three-phase system, solid-liquid-gas, in part, but not necessarily in all,of the soil when the soil temperature isabove 5° C." These soils are common inhumid climates with well-distributed rain-fall or with enough rain in summer "that theamount of stored moisture plus rainfall isapproximately equal to or exceeds theamount of evapotranspiration. Water movesdown through the soil at some time in mostyears. If precipitation exceeds evapotrans-piration in all months of most years, thereare occasional brief periods when somestored moisture is used, but the moisture
tension rarely becomes as great as 1 bar inthe soil moisture control section. The watermoves through the soil in all months that itis not frozen." Under such conditions, thesesoils have a perudic moisture regime. Thelatter regime, however, is not used to defineany taxa but is implied in some (Tavernier,1971).
Ustic soils
Ustic soils are those of limited moisture,but this moisture is present at a time whenneeded for plant growth. "If the mean an-nual soil temperature is 22° C or higher orif the mean summer and winter soil tempera-tures differ by less than 5° C at a depth of50 cm, the soil moisture control section inthe ustic moisture regime is dry in some orall parts for 90 or more cumulative days inmost years. But the moisture control sectionis moist in some part for more than 180cumulative days, or it is continuously moistin some part for at least 90 consecutive days.If the mean annual soil temperature is lowerthan 22°C and if the mean summer andwinter soil temperatures differ by 5° C ormore at a depth of 50 cm, the soil moisturecontrol section in the ustic regime is dry insome or all parts for 90 or more cumulativedays in most years. But it is not dry in allparts for more than half the time that thesoil temperature is higher than 5° C at adepth of 50 cm (the aridic and torric re-gimes). Also, it is not dry in all parts for aslong as 45 consecutive days in the 4 monthsthat follow the summer solstice in 6 or moreyears out of 10 if the moisture control sectionis moist in all parts for 45 or more consecu-tive days in the 4 months that follow the win-ter solstice in 6 or more years out of 10 (xericregime)." In tropical and subtropical regionswith either one or two dry seasons, summerand winter have little meaning, and "theustic regime is that typified in a monsoonclimate that has at least one rainy season of3 months or more." In temperate regionswith subhumid or semiarid climate, the rainyseasons are usually spring and summer orspring and fall, but never winter.
[KAWA
Xeric soils
Xeric soils are those associated with theMediterranean climate—moist and cool win-ters and warm and dry summers. "The mois-ture, coming in winter when potential evapo-transpira'tion is at a minimum, is particularlyeffective for leaching. In a xeric moistureregime, the soil moisture control section isdry in all parts for 45 or more consecutivedays within the 4 months that follow thesummer solstice in 6 or more years out of10. It is moist in all parts for 45 or moreconsecutive days within the 4 months thatfollow the winter solstice in 6 or more yearsout of 10. The moisture control section ismoist in some part more than half the time,cumulative, that the soil temperature at adepth of 50 cm is higher than 5° C, or in 6or more years out of 10 it is moist in somepart for at least 90 consecutive days whenthe soil temperature at a depth of 50 cm iscontinuously higher than 8° C. In addition,the mean annual soil temperature is lowerthan 22° C, and mean summer and meanwinter soil temperatures differ by 5° C ormore at a depth of 50 cm or at a lithic orparalithic contact, whichever is shallower."
Aridic soils
Aridic (or torric) soils are hot and drysoils. The former term is used at the ordercategory, while the latter term is used withinthe other categories of the taxonomy. In mostyears, the moisture control section is (1)"dry in all parts more than half the time(cumulative) that the soil temperature at adepth of 50 cm is above 5° C"; and (2)"never moist in some or all parts for as longas 90 consecutive days when the soil temper-ature at a depth of 50 cm is above 8° C."These soils are normally in arid climates,although "a few are in semiarid climates andeither have physical properties that keepthem dry, such as a crusty surface that virtu-ally precludes infiltration of water, or theyare very shallow over bedrock. There is littleor no leaching in these moisture regimes,and soluble salts accumulate in the soil ifthere is a source of them."
23
Soil Temperature Regimes
The soil temperature regime is the actualtemperature reading at a given soil depthor is a temperature that is estimated fromclimatological data. The temperature regime,furthermore, consists of "the mean annualtemperature, the average seasonal fluctua-tions from that mean, and the mean warm orcold seasonal soil-temperature gradientwithin the main root zone, which is the zonefrom a depth of 5 to 100 cm."
Because soil temperature, especially nearthe soil surface, is greatly affected by dailychanges in air temperature, a measurementat some depth is necessary. Based on thefindings of various investigations (USDA,1975), a measurement at a depth of 50 cm atregular time intervals throughout the yearappears to be satisfactory. Where necessary,however, soil temperature can be estimatedfrom climatological data. In the continentalUnited States, the mean annual soil temper-ature for most areas can be estimated byadding 1° C to the mean annual air tempera-ture. The mean summer temperature, on theother hand, of most areas can be estimatedby subtracting 0.6° C from the mean summerair temperature.
Classes of Soil Temperature Regimes
The names of the classes of soil tempera-ture regimes are pergelic, cryic, frigid, mesic,thermic, and hyperthermic.
Pergelic soils
Pergelic soils have mean annual temper-atures lower than 0° C (32° F), and theyhave either permafrost if they are moist ordry frost if they do not have excess water.
Cryic soils
Cryic soils have mean annual tempera-tures higher than 0° C but lower than 8° C(47° F). According to Soil Taxonomy:
"1 . In mineral soils, the mean summertemperature for June, July, and Au-gust at a depth of 50 cm or at a lithic
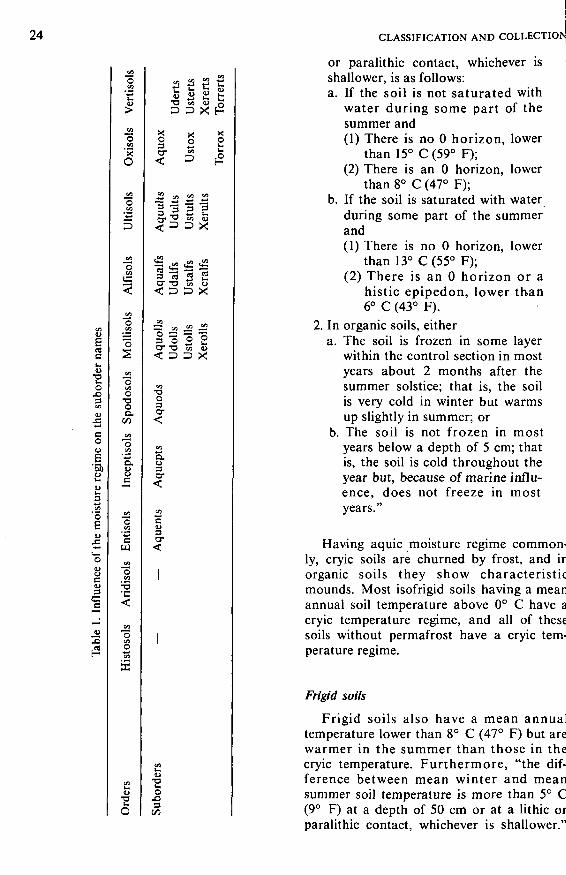
24 CLASSIFICATION AND COLLECTION
CA0 )
Bae
der
o3CA
the
cou
•Sb
u3
•3
u
0
nee
3
—
[S
CA
"3
Ber
tisis
ols
1
O
CA
"oCA
5
CA
\lfi
s
CA
"oCA
'SsCA
"0CA
O
10 0
CA
"3CA
O .
c
CA
"oCA'S
W
CA
sol
T3
•c
CA
"oCA
Oto
s
CA
Ui
O
X0
CT
CA
3
erts
• 0
CA
3
terts
CA
D
0CA
CAtu
lre
rts
uX
CA
rul
•rer
ts
f-
X0
3 X
3 13 2 Scr"O »1 u< 3 D X
O" "U CA 4>
< 3 D X
o3O"
o.<u3O"
cu3
o-
tu•o
or paralithic contact, whichever isshallower, is as follows:a. If the soil is not saturated with
water during some part of thesummer and(1) There is no 0 horizon, lower
than 15° C (59° F); j(2) There is an 0 horizon, lower
than 8° C (47° F);b. If the soil is saturated with water
during some part of the summerand(1) There is no 0 horizon, lower ,
than 13° C (55° F);(2) There is an 0 horizon or a
histic epipedon, lower than6° C (43° F). i
2. In organic soils, eithera. The soil is frozen in some layer ,
within the control section in mostyears about 2 months after thesummer solstice; that is, the soilis very cold in winter but warmsup slightly in summer; or
b. The soil is not frozen in mostyears below a depth of 5 cm; thatis, the soil is cold throughout theyear but, because of marine influ-ence, does not freeze in mostyears."
Having aquic moisture regime common-ly, cryic soils are churned by frost, and irorganic soils they show characteristicmounds. Most isofrigid soils having a meanannual soil temperature above 0° C have acryic temperature regime, and all of thesesoils without permafrost have a cryic tem-perature regime.
Frigid soils
Frigid soils also have a mean annualtemperature lower than 8° C (47° F) but arewarmer in the summer than those in thecryic temperature. Furthermore, "the dif-ference between mean winter and meansummer soil temperature is more than 5° C(9° F) at a depth of 50 cm or at a lithic orparalithic contact, whichever is shallower."
[KAWA 25
Mesic soils
Mesic soils have a mean annual tempera-ture of 8° C or higher but lower than 15° C(59° F), and "the difference between meansummer and mean winter soil temperature ismore than 5° C at a depth of 50 cm or at alithic or paralithic contact, whichever isshallower."
Thermic soils
Thermic soils have a mean annual tem-perature of 15° C or higher but lower than22° C (72° F) and "the difference betweenmean summer and mean winter soil temper-ature is more than 5° C at a depth of 50 cmor at a lithic or paralithic contact, whicheveris shallower."
Hyperthermic soils
Hyperthermic soils have a mean annualtemperature of 22° C (72° F) or higher and"the difference between mean summer andmean winter soil temperature is more than5° C at a depth of 50 cm or at a lithic orparalithic contact, whichever is shallower."
Isofrigid, isomesiç,isothermic and isohyperthermic soils
The difference between the mean sum-mer and mean winter soil temperatures ismore than 5° C (9° F) at a depth of 50 cmor at a lithic or paralithic contact, which-ever is shallower, for the frigid, mesic,thermic, and hyperthermic soils. If this dif-ference is less than 5° C at the same depthor subsurface contact, as in most parts of thetropics, the temperature regimes of the re-spective soils are named isofrigid, isomesic,isothermic, and isohyperthermic.
Climatic Parameters and theSoil Taxonomy
It must be emphasized that in many casesthe moisture and temperature regimes mustbe considered together because of the influ-ence of one on the other.
The Soil Taxonomy is composed of sixcategories: order, suborder, great group,
subgroup, family, and series. The orderis the highest category; the series is the low-est category. Climatic parameters are ex-pressed at the various categorical levelsabove the series level. When the moistureand temperature regimes are associated withsoil genesis and with soil properties thatserve as differentiating characteristics, theyare expressed in the higher categories. Whenthe climatic parameter, for example, thesoil temperature class, is more related toplant growth, it is expressed specifically inthe lower category, the family.
Expression of the climatic parameterscan be either (1) defined within a categoryor of the class within a category. An exampleof the former is the differentiation of theHistosols and the Aridisols at the highestcategory from the other orders. The amountof organic material in Histosols is in generalrelated to saturation with water. Likewise,the Aridisols have in general an aridic mois-ture regime. When using the key to the soilorders, the temperature regime is also usedto distinguish certain orders such as the Ver-tisols and the Ultisols.
The climatic parameters can also be spec-ified by the name of the order, an examplebeing the Oxisols. The order Oxisols is limit-ed to climatic conditions, which are typicalof the tropics.
It is in the suborder category, however,that the moisture regime is specifically rec-ognized for most soils as shown in Table 1.The temperature regime, on the other hand,is limited to only a few suborders—the Tro-pepts (Inceptisols), Boralls (Mollisols), andBoralfs (Alfisols).
Although not expressed precisely, tem-perature regimes are implied in the subordercategory for five of the orders—Mollisols,Alfisols, Ultisols, Oxisols, and Vertisols. Ingeneral, udic soils are warm, ustic soils arewarm or hot, and xeric soils are cool in win-ter and warm in summer (USDA, 1975).Similar relationships are expressed byTavernier (1971): that the cold ustic regimesare associated with the steppes, the hot usticwith intertropical, the xeric with Mediter-ranean, and the aridic with desertie and sub-desertic. However, he mentions that in boreal
26 CLASSIFICATION AND COLLECTION
temperature regimes only the udic and aridicmoisture regimes are considered at the sub-group level. Thus, the suborder category,with some limitations, can be used to showthe influence of climatic parameters in soilclassification and interpretation.
Because there is a hierarchy of classes inthe Soil Taxonomy, climatic parameters ex-pressed at the higher categories are also em-phasized at the lower categories. When thegreat group category is considered, the mois-ture and temperature regimes are definitelyemphasized. These regimes are not only thecauses of soil properties but also the proper-ties of the whole soil. In a few taxa, moistureand temperature regimes may not be defined,but in most cases the accessory propertiesare defined (USDA, 1975).
If, however, the climatic parameters werenot emphasized at the order or suborder, asin the case of the Entisols or Inceptisols,these parameters would be used to differ-entiate these particular orders at the greatgroup category. The great group category,therefore, considers not only soils similar inthe kind, arrangement, degree of expressionof horizon, base status, and other properties,but also those similar in soil moisture andthose with very broad grouping of tempera-ture regimes. At this categoric level, the cli-matic parameters have been expressed foralmost all, if not all, of the soils, and similarbehaviors are expected for similar soils.
The significance of the expression of theclimatic parameters at the suborder categoryis that a small-scale map can be preparedshowing the distribution of the various soils.An example is a map prepared by the SoilGeography Unit of the Soil ConservationService, USDA, and presented by Aubertand Ta vernier (1972). Taking into considera-tion that altitude as well as latitude can in-fluence temperature, one can quickly obtaina general idea of soil distribution.
An excellent illustration of such use on asmall-scale map is offered by Orvedal andAckerson (1972), who used both the mois-ture and temperature regimes to show theagricultural soil resources of the world interms of soils that were ( 1) potentially arable,(2) nonarable but potentially grazeable, and
(3) nonarable and nongrazeable. Their pre-sentation about the distribution of soils thathave a udic moisture regime, for example,shows that these soils occur in regions hav-ing (1) cool (boreal), (2) temperate-to-warm,and (3) warm-to-hot (mainly isohyperther-mic) climates. The number of crops per yearand the growing season are dependent onthe temperature regime. These authors at-tribute 47, 52, and 49% of the respectivesoils in the different temperature regimes asbeing arable, and 36, 33, and 36% of the re-spective soils as being nonarable but poten-tially grazeable. The distribution of soilshaving other moisture regimes and modifiedby the temperature regimes are similarlypresented. Approximately one-half of theseareas are now under cultivation. A presenta-tion such as that by Orvedal and Ackerson,using climatic parameters, emphasizes theavailability of soils that are potentially avail-able for food production, and this kind ofinformation can be used to plan and imple-ment food production on a broad basis.
Soil classification, as with soil surveys,soil maps, and their interpretation, can beeither generalized or detailed for land-useplanning and development. When a plannerdesires an overview, generalized informationmay be sufficient. However, if he is in opera-tion planning, more detailed informationis necessary. Obviously, a soil map on a1:125,000 scale showing the great groupswould have a higher precision and predicta-bility than one showing only the soil ordersor suborders. However, as pointed out byNichols and Bartelli (1972), the objective ofinterpretative soil maps is "to furnish infor-mation needed on soils without clutter of ir-relevant information." Therefore, the mini-mum size delineation of a soil map should beconsistent with the decision-making unit ofthe user.
The great group level, therefore, can beused not only for making appropriate soilmaps for land-use planning and developmentbut also for technology transfer. Soils pos-sessing common propert ies and similarmoisture and temperature regimes shouldshow similar behavior. Hydrandepts in Ha-waii, for example, occur in areas of very
IKAWA 27
high, well-distributed rainfall (perudic mois-ture regime) and, by definition, have a soiltemperature warmer than cryic. In Hawaii,furthermore, they are used for sugarcane,pasture, woodland, wildlife habitat, andwatershed and could be used for similarpurposes elsewhere. As mentioned previous-ly, soil temperature classes are expressed atthe family category, and if this category isused for technology transfer, the reliabilityfor prediction becomes quite high. For ex-ample, the thixotropic isohyperthermic fam-ily of Typic Hydrandepts is better suited forsugarcane production than the thixotropic,isomesic family of the same subgroup. Thecrop is harvested in approximately 2 yearsinstead of 3, and the yield in terms of tons ofsugar per acre is much higher in the iso-hyperthermic soils. Management techniquestransferred to other areas of the world hav-
ing similar soil are expected to give similarresponse.
Regardless of the categoric level, how-ever, the information of soil moisture andsoil temperature regimes plays an importantrole in agriculture, and additional examplesare presented to illustrate this importance.Certainly, aquic soils with warm tempera-ture are better suited for paddy rice produc-tion than other soils. In Hawaii, under non-irrigation management, ustic soils can beutilized efficiently for pineapple but not sofor sugarcane. The isothermic soils are bet-ter suited for coffee as well as for manyvegetables, such as cabbage and celery, thanthe isohyperthermic soils. The isohyperther-mic soils are better suited for macadamiaand papaya than the isothermic or isomesicsoils.
Literature Cited
AUBERT, G., and R. TAVERNIER. 1972. Soil survey, pp. 17-44. In Soils of the humid tropics. Natl. Acad.Sei., Washington, D.C.
NICHOLS, J.D., and L.J. BARTELLI. 1972. Computer-generated interpretative soil maps. pp. 20-24.In The earth around us. Proc. of the 27th Annual Meeting of the Soil Conserv. Soc. of Amer.,Ankeny, Iowa.
ORVEDAL, A.C., and K..T. ACKERSON. 1972. Agricultural soil resources of the world. Prepared for theASA Symposium, Our Land and How We Use It. 25th Annual Meeting of the Amer. Inst, of Bio-logical Sciences, Univ. of Minnesota.
TAVERNIER, R. 1971. Temperature and moisture regimes with respect to soil classification, pp. 42-53.In H. Eswaran (ed.) Selected lectures in soil science. International Training Centre for PostgraduateSoil Scientists, Rijksuniversiteit, Ghent.
USDA, SCS, Soil Survey Staff. 1975. Soil taxonomy: a basic system of soil classification for makingand interpreting soil surveys. Agric. Handb. no. 436. U.S. Government Printing Office, Washing-ton, D.C.
Soils and Land-Resource Mapping in Iran
M. VAKILIAN
Soil and Land Evaluation SectionSoil Institute of Iran, Teheran, Iran
Iran has a total land surface of about 165 million hectares, nearly 50% of which are moun-tains, rocky land, or desert. Wheat and barley are the dominant agricultural crops. A generalizedsoil map and a map grouping the soils in relation to their general potential for agriculture havebeen published.
The major soil groupings are described in relation to the four physiographic zones of thecountry: the plains and valleys, the high plateau, the Caspian piedmont, and the dissected slopesand mountains. A correlation table relating the national soil groups to the legend of the FAO-UNESCO Soil Map of the World and to the Soil Taxonomy is given.
Detailed and semidetailed soil surveys are used in Iran to provide the basis for developmentprojects, which are usually associated with irrigated agriculture. Regional land-resources inven-tories, which include land evaluations, are used as general guides for regional developmentplanning and are much in demand.
Iran's total land surface is about 165 mil-lion hectares, over 50% of which are moun-tainous and rough rocky lands, or desert,containing only small pockets of land suit-able for agricultural production. There arefour main physiographic areas in Iran, eachwith its distinctive character:
1. the Zagros and Elburz Mountainsin the form of a great V;
2. the area within the V, which beginsas a high plateau with its own sec-ondary ranges and gradually de-scends into deserts;
3. the region of Khuzestan, a low-lyingplain and a continuation of theMesopotamian plain; and
4. the Caspian seacoast, which is be-low sea level and forms a separateclimatic zone.
Apart from the related factors of soil
depth and slope, the main limiting factorto agricultural development is lack of mois-ture and adequate rainfall or water for irri-gation.
In the last few years, steps were taken toconserve and protect water supplies andensure the correct use of natural resources.These measures are of vital importance toIran, whose major part receives less than 250mm of rain per year and can be classified asarid or semiarid, except on the northernparts of the Elburz mountains, where rainfallvaries from 1,000 to 2,000 mm per year.
Vegetation varies with climate, the na-tural vegetation in humid regions consistingof oak and beech forests. A thin cover oigrasses and shrubs is natural to the semi-arid and arid regions. Wheat and barley arethe dominant agricultural crops here becausethey are best suited to dry conditions. Re-garding present land use in Iran, no exact
28
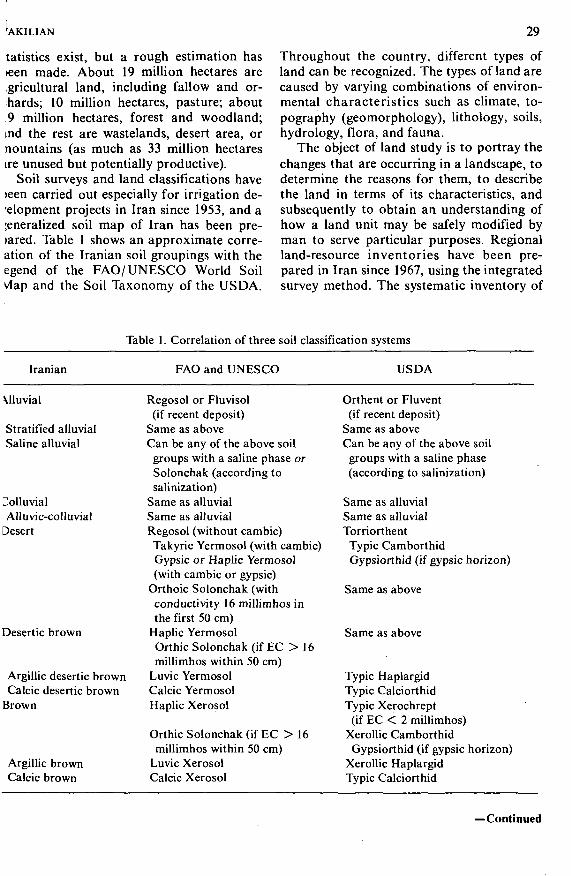
'AKILIAN 29
tatistics exist, but a rough estimation hasteen made. About 19 million hectares areigricultural land, including fallow and or-hards; 10 million hectares, pasture; about9 million hectares, forest and woodland;ind the rest are wastelands, desert area, ornountains (as much as 33 million hectaresire unused but potentially productive).
Soil surveys and land classifications have>een carried out especially for irrigation de-'elopment projects in Iran since 1953, and a;eneralized soil map of Iran has been pre->ared. Table 1 shows an approximate corre-ation of the Iranian soil groupings with theegend of the FAO/ UNESCO World Soilvtap and the Soil Taxonomy of the USDA.
Throughout the country, different types ofland can be recognized. The types of land arecaused by varying combinations of environ-mental characteristics such as climate, to-pography (geomorphology), lithology, soils,hydrology, flora, and fauna.
The object of land study is to portray thechanges that are occurring in a landscape, todetermine the reasons for them, to describethe land in terms of its characteristics, andsubsequently to obtain an understanding ofhow a land unit may be safely modified byman to serve particular purposes. Regionalland-resource inventories have been pre-pared in Iran since 1967, using the integratedsurvey method. The systematic inventory of
Table 1. Correlation of three soil classification systems
Iranian FAO and UNESCO USDA
Mluvial
Stratified alluvialSaline alluvial
üolluvialAlluvic-colluvial
Desert
Desertie brown
Argillic desertie brownCalcic desertie brown
Brown
Argillic brownCalcic brown
Regosol or Fluvisol(if recent deposit)
Same as aboveCan be any of the above soilgroups with a saline phase orSolonchak (according tosalinization)
Same as alluvialSame as alluvialRegosol (without cambic)Takyric Yermosol (with cambic)Gypsic or Haplic Yermosol(with cambic or gypsic)
Orthoic Solonchak (withconductivity 16 millimhos inthe first 50 cm)
Haplic YermosolOrthic Solonchak (if EC > 16millimhos within 50 cm)
Luvic YermosolCalcic YermosolHaplic Xerosol
Orthic Solonchak (if EC > 16millimhos within 50 cm)
Luvic XerosolCalcic Xerosol
Orthent or Fluvent(if recent deposit)
Same as aboveCan be any of the above soilgroups with a saline phase(according to salinization)
Same as alluvialSame as alluvialTorriorthentTypic CamborthidGypsiorthid (if gypsic horizon)
Same as above
Same as above
Typic HaplargidTypic CalciorthidTypic Xerochrept
(if EC < 2 millimhos)Xerollic CamborthidGypsiorthid (if gypsic horizon)
Xerollic HaplargidTypic Calciorthid
—Continued
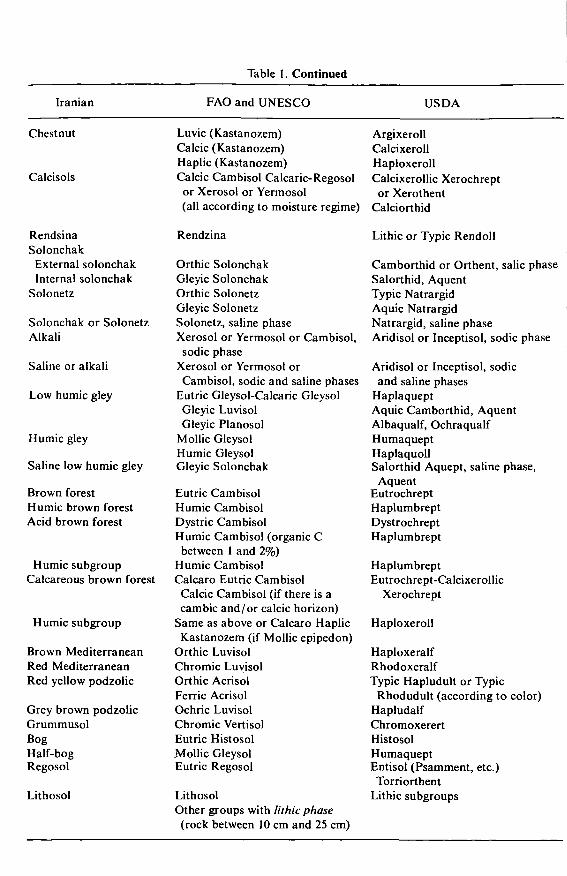
Table 1. Continued
Iranian FAO and UNESCO USDA
Chestnut
Calcisols
Luvic (Kastanozem)Calcic (Kastanozem)Haplic (Kastanozem)Calcic Cambisol Calcaric-Regosolor Xerosol or Yermosol
ArgixerollCalcixerollHaploxerollCalcixerollic Xerochreptor Xerothent
(all according to moisture regime) Calciorthid
RendsinaSolonchak
External solonchakInternal solonchak
Solonetz
Solonchak or SolonetzAlkali
Saline or alkali
Low humic gley
Humic gley
Saline low humic gley
Brown forestHumic brown forestAcid brown forest
Humic subgroupCalcareous brown forest
Humic subgroup
Brown MediterraneanRed MediterraneanRed yellow podzolic
Grey brown podzolicGrummusolBogHalf-bogRegosol
Lithosol
Rendzina
Orthic SolonchakGleyic SolonchakOrthic SolonetzGleyic SolonetzSolonetz, saline phaseXerosol or Yermosol or Cambisol,sodic phase
Xerosol or Yermosol orCambisol, sodic and saline phases
Eutric Gleysol-Calcaric GleysolGleyic LuvisolGleyic Planosol
Mollic GleysolHumic GleysolGleyic Solonchak
Eutric CambisolHumic CambisolDystric CambisolHumic Cambisol (organic Cbetween 1 and 2%)
Humic CambisolCalcaro Eutric CambisolCalcic Cambisol (if there is acambic and/or calcic horizon)
Same as above or Calcaro HaplicKastanozem (if Mollic epipedon)
Orthic LuvisolChromic LuvisolOrthic AcrisolFerric AcrisolOchric LuvisolChromic VertisolEutric HistosolMollic GleysolEutric Regosol
LithosolOther groups with lithic phase(rock between 10 cm and 25 cm)
Lithic or Typic Rendoll
Camborthid or Orthent, salic phaseSalorthid, AquentTypic NatrargidAquic NatrargidNatrargid, saline phaseAridisol or Inceptisol, sodic phase
Aridisol or Inceptisol, sodicand saline phases
HaplaqueptAquic Camborthid, AquentAlbaqualf, OchraqualfHumaqueptHaplaquollSalorthid Aquept, saline phase,Aquent
EutrochreptHaplumbreptDystrochreptHaplumbrept
HaplumbreptEutrochrept-Calcixerollic
Xerochrept
Haploxeroll
HaploxeralfRhodoxeralfTypic Hapludult or Typic
Rhodudult (according to color)HapludalfChromoxerertHistosolHumaqueptEntisol (Psamment, etc.)Torriorthent
Lithic subgroups
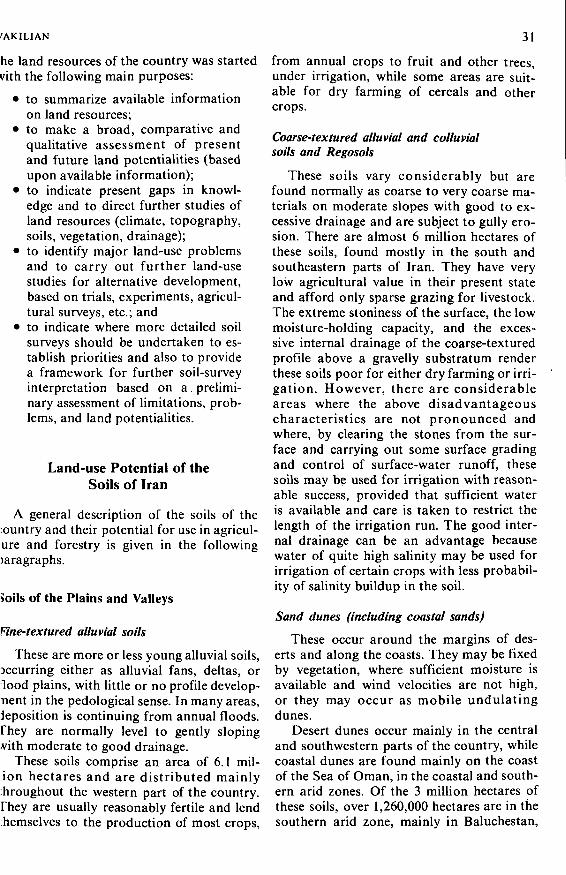
fAKILIAN
he land resources of the country was startedvith the following main purposes:
• to summarize available informationon land resources;
• to make a broad, comparative andqualitative assessment of presentand future land potentialities (basedupon available information);
• to indicate present gaps in knowl-edge and to direct further studies ofland resources (climate, topography,soils, vegetation, drainage);
• to identify major land-use problemsand to carry out further land-usestudies for alternative development,based on trials, experiments, agricul-tural surveys, etc.; and
• to indicate where more detailed soilsurveys should be undertaken to es-tablish priorities and also to providea framework for further soil-surveyinterpretation based on a prelimi-nary assessment of limitations, prob-lems, and land potentialities.
Land-use Potential of theSoils of Iran
A general description of the soils of the:ountry and their potential for use in agricul-ure and forestry is given in the followingjaragraphs.
»oils of the Plains and Valleys
Fine-textured alluvial soils
These are more or less young alluvial soils,accurring either as alluvial fans, deltas, orlood plains, with little or no profile develop-nent in the pedological sense. In many areas,deposition is continuing from annual floods.Fhey are normally level to gently slopingA'ith moderate to good drainage.
These soils comprise an area of 6.1 mil-ion hectares and are distributed mainlyhroughout the western part of the country.Fhey are usually reasonably fertile and lendhemselves to the production of most crops,
31
from annual crops to fruit and other trees,under irrigation, while some areas are suit-able for dry farming of cereals and othercrops.
Coarse-textured alluvial and colluvialsoils and Regosols
These soils vary considerably but arefound normally as coarse to very coarse ma-terials on moderate slopes with good to ex-cessive drainage and are subject to gully ero-sion. There are almost 6 million hectares ofthese soils, found mostly in the south andsoutheastern parts of Iran. They have verylow agricultural value in their present stateand afford only sparse grazing for livestock.The extreme stoniness of the surface, the lowmoisture-holding capacity, and the exces-sive internal drainage of the coarse-texturedprofile above a gravelly substratum renderthese soils poor for either dry farming or irri-gation. However, there are considerableareas where the above disadvantageouscharacteristics are not pronounced andwhere, by clearing the stones from the sur-face and carrying out some surface gradingand control of surface-water runoff, thesesoils may be used for irrigation with reason-able success, provided that sufficient wateris available and care is taken to restrict thelength of the irrigation run. The good inter-nal drainage can be an advantage becausewater of quite high salinity may be used forirrigation of certain crops with less probabil-ity of salinity buildup in the soil.
Sand dunes (including coastal sands)
These occur around the margins of des-erts and along the coasts. They may be fixedby vegetation, where sufficient moisture isavailable and wind velocities are not high,or they may occur as mobile undulatingdunes.
Desert dunes occur mainly in the centraland southwestern parts of the country, whilecoastal dunes are found mainly on the coastof the Sea of Oman, in the coastal and south-ern arid zones. Of the 3 million hectares ofthese soils, over 1,260,000 hectares are in thesouthern arid zone, mainly in Baluchestan,
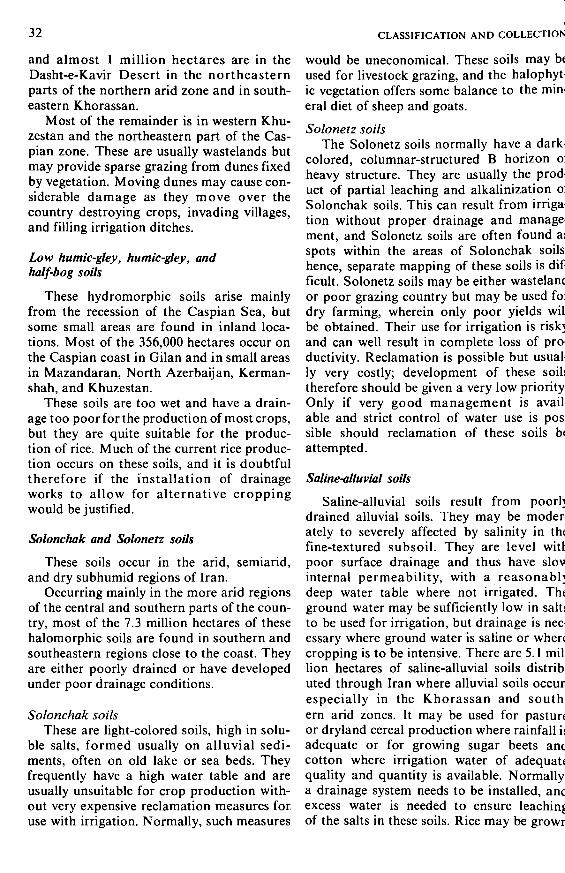
32 CLASSIFICATION AND COLLECTION
and almost 1 million hectares are in theDasht-e-Kavir Desert in the northeasternparts of the northern arid zone and in south-eastern Khorassan.
Most of the remainder is in western Khu-zestan and the northeastern part of the Cas-pian zone. These are usually wastelands butmay provide sparse grazing from dunes fixedby vegetation. Moving dunes may cause con-siderable damage as they move over thecountry destroying crops, invading villages,and filling irrigation ditches.
Low humic-gley, humic-gley, andhalf-bog soils
These hydromorphic soils arise mainlyfrom the recession of the Caspian Sea, butsome small areas are found in inland loca-tions. Most of the 356,000 hectares occur onthe Caspian coast in Gilan and in small areasin Mazandaran, North Azerbaijan, Kerman-shah, and Khuzestan.
These soils are too wet and have a drain-age too poor for the production of most crops,but they are quite suitable for the produc-tion of rice. Much of the current rice produc-tion occurs on these soils, and it is doubtfultherefore if the installation of drainageworks to allow for alternative croppingwould be justified.
Solonchak and Solonetz soils
These soils occur in the arid, semiarid,and dry subhumid regions of Iran.
Occurring mainly in the more arid regionsof the central and southern parts of the coun-try, most of the 7.3 million hectares of thesehalomorphic soils are found in southern andsoutheastern regions close to the coast. Theyare either poorly drained or have developedunder poor drainage conditions.
Solonchak soilsThese are light-colored soils, high in solu-
ble salts, formed usually on alluvial sedi-ments, often on old lake or sea beds. Theyfrequently have a high water table and areusually unsuitable for crop production with-out very expensive reclamation measures foruse with irrigation. Normally, such measures
would be uneconomical. These soils may b<used for livestock grazing, and the halophytic vegetation offers some balance to the minieral diet of sheep and goats.
Solonetz soilsThe Solonetz soils normally have a dark-
colored, columnar-structured B horizon oJheavy structure. They are usually the prod-uct of partial leaching and alkalinization o]Solonchak soils. This can result from irriga-tion without proper drainage and manage-ment, and Solonetz soils are often found a;spots within the areas of Solonchak soilshence, separate mapping of these soils is dif-ficult. Solonetz soils may be either wastelancor poor grazing country but may be used foidry farming, wherein only poor yields wilbe obtained. Their use for irrigation is risk}and can well result in complete loss of productivity. Reclamation is possible but usually very costly; development of these soil:therefore should be given a very low priorityOnly if very good management is available and strict control of water use is possible should reclamation of these soils b(attempted.
Saline-alluvial soils
Saline-alluvial soils result from poorhdrained alluvial soils. They may be moderately to severely affected by salinity in th<fine-textured subsoil. They are level wit!poor surface drainage and thus have slovinternal permeability, with a reasonablydeep water table where not irrigated. Theground water may be sufficiently low in salt!to be used for irrigation, but drainage is neeessary where ground water is saline or whencropping is to be intensive. There are 5.1 million hectares of saline-alluvial soils distributed through Iran where alluvial soils occurespecially in the Khorassan and southern arid zones. It may be used for pastureor dryland cereal production where rainfall iiadequate or for growing sugar beets anccotton where irrigation water of adequatequality and quantity is available. Normallya drainage system needs to be installed, ancexcess water is needed to ensure leachinjof the salts in these soils. Rice may be growr
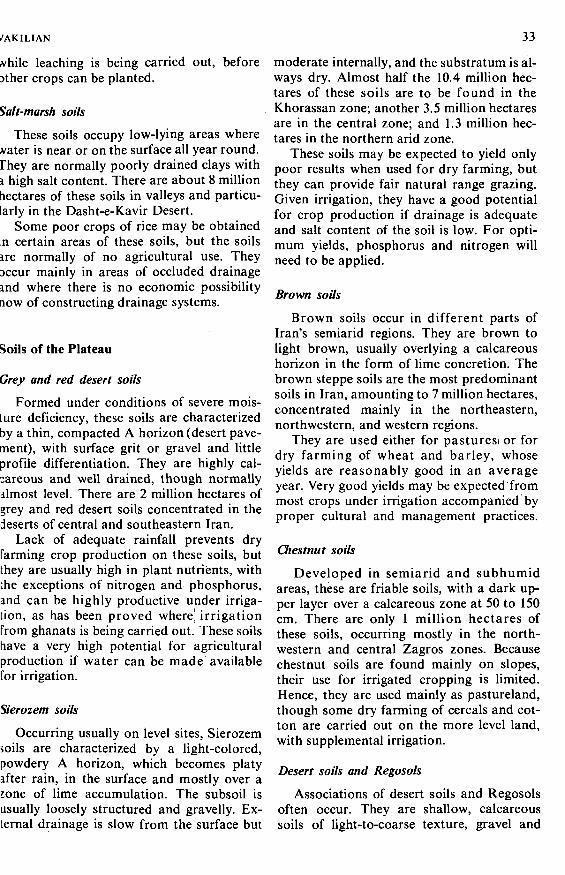
/AKILIAN
ivhile leaching is being carried out, beforeather crops can be planted.
Salt-marsh soils
These soils occupy low-lying areas where.vater is near or on the surface all year round.Fhey are normally poorly drained clays withi high salt content. There are about 8 millionhectares of these soils in valleys and particu-larly in the Dasht-e-Kavir Desert.
Some poor crops of rice may be obtainedn certain areas of these soils, but the soilsire normally of no agricultural use. Theyaccur mainly in areas of occluded drainageind where there is no economic possibilitytiow of constructing drainage systems.
Soils of the Plateau
Grey and red desert soils
Formed under conditions of severe mois-ture deficiency, these soils are characterizedby a thin, compacted A horizon (desert pave-ment), with surface grit or gravel and littleprofile differentiation. They are highly cal-careous and well drained, though normallyalmost level. There are 2 million hectares ofgrey and red desert soils concentrated in thedeserts of central and southeastern Iran.
Lack of adequate rainfall prevents dryfarming crop production on these soils, butthey are usually high in plant nutrients, withthe exceptions of nitrogen and phosphorus,and can be highly productive under irriga-tion, as has been proved where! irrigationfrom ghanats is being carried out. These soilshave a very high potential for agriculturalproduction if water can be made availablefor irrigation.
Sierozem soils
Occurring usually on ievel sites, Sierozemäoils are characterized by a light-colored,powdery A horizon, which becomes platyafter rain, in the surface and mostly over azone of lime accumulation. The subsoil isusually loosely structured and gravelly. Ex-ternal drainage is slow from the surface but
33
moderate internally, and the substratum is al-ways dry. Almost half the 10.4 million hec-tares of these soils are to be found in theKhorassan zone; another 3.5 million hectaresare in the central zone; and 1.3 million hec-tares in the northern arid zone.
These soils may be expected to yield onlypoor results when used for dry farming, butthey can provide fair natural range grazing.Given irrigation, they have a good potentialfor crop production if drainage is adequateand salt content of the soil is low. For opti-mum yields, phosphorus and nitrogen willneed to be applied.
Brown soils
Brown soils occur in different parts ofIran's semiarid regions. They are brown tolight brown, usually overlying a calcareoushorizon in the form of lime concretion. Thebrown steppe soils are the most predominantsoils in Iran, amounting to 7 million hectares,concentrated mainly in the northeastern,northwestern, and western regions.
They are used either for pasturesi or fordry farming of wheat and barley, whoseyields are reasonably good in an averageyear. Very good yields may be expected frommost crops under irrigation accompanied byproper cultural and management practices.
Chestnut soils
Developed in semiarid and subhumidareas, these are friable soils, with a dark up-per layer over a calcareous zone at 50 to 150cm. There are only 1 million hectares ofthese soils, occurring mostly in the north-western and central Zagros zones. Becausechestnut soils are found mainly on slopes,their use for irrigated cropping is limited.Hence, they are used mainly as pastureland,though some dry farming of cereals and cot-ton are carried out on the more level land,with supplemental irrigation.
Desert soils and Regosols
Associations of desert soils and Regosolsoften occur. They are shallow, calcareoussoils of light-to-coarse texture, gravel and
34 CLASSIFICATION AND COLLECTION
coarse sand usually predominating the pro-file. They may occur on level land or steepslopes and have good-to-excessive drainage.
There are 7.6 million hectares of thesesoils mainly concentrated in the southeast inthe Dasht-e-Lut Desert of the southern aridzone. Lack of rainfall inhibits the develop-ment of these soils for agricultural pro-duction, but irrigation would make themsuitable for many crops within the limits im-posed by temperatures.
Desert soils—sand dunes
Undulating and frequently moving, 5.6million hectares of sand dunes occur in theYazd province of the northern arid zone andin the Dasht-e-Lut Desert area of the south-ern arid zone.
Normally a wasteland, these desert soilssometimes are used as very poor range.
Desert soils—Sierozem andSolonchak soils
These are saline soils of the desert. Nor-mally fairly level with moderate-to-slow in-ternal and moderate external drainage, 3.5million hectares of these soils are foundmainly in the Dasht-e-Kavir Desert and onthe Sistan Plain; 1.4 million hectares in theKhorassan zone, in the Sistan Plain; and 0.8million hectares in eastern Baluchestan inthe southern arid zone. The remainder is inthe Dasht-e-Kavir Desert in the central andnorthern arid zones.
These soils are wastelands, and they serveat best as poor range, with poor potential forirrigation.
Sierozem soils-Regosols (includingsand dunes)
This complex of soils, which are normallycalcareous and only slightly saline, occurs onlevel to moderately sloping sites and hasgood-to-excessive drainage.
There are over 9 million hectares of thesesoils: 4.5 million in the Khorassan zone, 2.4million in the southern arid zone, and 1.2million in the northern arid zone. The re-mainder is in the southern and eastern parts
of the central zone and the extreme northerrsection of the southern Zagros zone.
These soils are useless and thus serv(only as very poor grazing in their naturalstate, but they do have good potential folproduction of orchard and vine crops if irri-gation could be made available.
Brown soils^ Lithosols
These are the brown soils of the undu-lating-to-steep slopes and are shallow todeep depending on their situation on theslopes. They have good-to-excessive drain-age.
There are 2.6 million hectares of thesesoils, mainly in western and northwesternIran in the northwestern and central Zagroszones.
They are usable only as poor-to-moder-ate grazing lands. But they will producegood crops of wheat where rainfall is ade-quate, and they are suitable for growing or-chards and vineyards where irrigation wateris available and correct terracing methodsare used to control water retention and pre-vent erosion.
Soils of the Caspian Piedmont
These are the soils of the sloping foothillsof the Alborz Mountains descending to theCaspian Sea. The climate of this area is hu-mid in the western part and subhumid tosemiarid in the east, making it a typical zonefor Iran.
Red and brown Mediterranean soils
Developed under reasonably high rain-fall conditions, these soils have derived fromeither limestones or basalts and sandstones.They have a well-developed profile with cal-careous inclusions, which is well structuredand has good-to-excessive drainage. Thesesoils occur on moderate-to-steep slopesand in spots rather than in large areas.
Red-yellow podzolic soils
These podzolized and developed acidsoils are formed on moderate-to-steep
VAKILIAN 35
slopes. They derive from a wide variety ofparent materials but rarely from limestones.Drainage also varies from poor to good ac-cording to the parent material. There areonly 20,000 hectares of these soils, all in theGilan Ostan, which are mostly pasture landand some forest lands on the steeper slopes.Although they are being used for tea produc-tion, they can be used for other crops whereslope permits. Without the installation ofadequate soil-conservation structures, thesesoils pose the danger of becoming unstableand slipping where forest cover is removedfrom slopes.
Brown forest soils (includinggrey-brown podzolic soils)
These are acid soils, developed in themore humid areas, mainly on steep slopes.They have medium-to-poor internal drain-age. There are 360,000 hectares of these soilsin the Caspian zone, 280,000 hectares inMazandaran Ostan, and the remainder inGilan.
The native vegetation is deciduous forestof beech, hornbeam, some Persian oak, andscattered conifers in places. Generally, theyare topographically unsuited to cultivationand are best retained as forests, but fruittrees could be planted on the lesser slopes.
The grey-brown and brown podzolic soilsfound in association with the brown forestsoils usually are on the more gentle slopesand are more acid. Their present and poten-tial land use is much the same as for thebrown forest soils.
Soils of the Dissected Slopesand Mountains
These are the soils of the steep hills andmountains of Iran, associated mainly withthe Elburz and Zagros mountain complex,though they are also found in the hills of theplateau and western parts of Iran. The betterclasses of soils associated with the Lithosolsoccur in small pockets, which can be impor-tant locally for annual cropping or fruit pro-duction, especially where spring waters areavailable, but they usually support forest
and pastures of variable quality. Overgrazingand deforestation are evident in most areas.Their greatest potential is for pastures undercontrolled grazing and, where possible, re-afforestation.
In general, because the different classesof soils found in these associations occur asvery shallow phases on excessive slopes,severe erosion takes place when cultivatedby traditional methods. Except where thereis sufficient depth of soil on less acute slopes,these soils are best used for grazing or, insome cases, afforestation. Estimation of thearea of soils that may be used for agricultureis impossible without intensive survey andstudy, but it is probable that much could beproductive as small pockets, especially wherewater is available for irrigation and providedthat more sophisticated cultural methods areadopted to prevent soil erosion and to con-serve soil moisture.
Brown soils-Rendzinas
These soils are limited to 720,000 hectaresand are not highly productive mainly be-cause of their shallow depth and low mois-ture retention. They could be used for short-season spring crops where the degree ofslope allows, but they are best used forgrazing.
Desert and Sierozem soils-calcareous Lithosols
Over 27.8 million hectares of these soilsnow provide only poor grazing but could bemore productive if proper range manage-ment practices were to be adopted. Somesmall areas could be cropped where irriga-tion water is available.
Desert and Sierozem soils (includingsalt plugs)-calcareous Lithosols(from saliferous and gypsyferous marls)
Together with sand dunes, these 14.8 mil-lion hectares of soils are probably the leastproductive in Iran. They usually occur aswastelands and are unsuitable for eithercropping or grazing.
36 CLASSIFICATION AND COLLECTION
Brown and chestnut soils-calcareous Lithosols
Over 21.3 million hectares of these soilsare used mainly for grazing but are badlyovergrazed and now have a very low carryingcapacity. A very extensive association, thesesoils in many small areas are used for dryfarming.
Brown and Sierozem soils-Lithosolsfrom igneous rocks
Over 10.6 million hectares of these soilsusually occur on very steep slopes, highlyvulnerable to erosion if disturbed. Althoughthey are now being used for grazing and areseverely overgrazed, proper range-manage-ment methods could turn these soils intosmall areas suitable for cropping.
Brown forest soils and Rendzinas—Lithosols
Many of the over 2.3 million hectares ofthese soils carry good natural forest. But se-vere erosion has taken place where the for-ests were cleared and bad farming practiceswere adopted. These soils could become avaluable forest resource and produce somefruit and other tree crops if correct soil con-servation practices are adopted and morediscrimination is shown in the degree andmethod of forest clearing.
Regosols—red-yellow podzolics
These soils also carry forest in their nat-ural state, but they have eroded badly whereforest has been cleared. They are best usedfor reafforestation, but parts could be usedfor tea plantations. There are 16,000 hectaresof these soils.
Brown forest and podzolic soils—Lithosols (mainly from igneous rocks)
These soils are very shallow and occur onsteep slopes. As is the case with the previoustwo soils mentioned, 20,000 hectares of thesesoils are found on the northern slopes of theElburz Mountains, where a reasonably highrainfall renders them able to support natural
forests. They are best used as natural forest:but they can also be used, under careful man-agement, for reafforestation where clearingof forests has led to soil depletion.
Agricultural Potential of theSoils of Iran
The soil map produced by the Soil Insti-tute of Iran provides a valuable basis for theplanning of agricultural development in IranBut because this is a broad-scale map basedon a combination of field studies and inter-polation from aerial photographs, it needs tcbe refined. Although studies of semidetailecand detailed soil surveys have been in prog-ress for many years, they have been confinéelargely to specific areas to provide a basis foiplanned or proposed development projectsusually associated with irrigated agricultureThe Soil and Land Evaluation Section olthe Soil Institute of Iran is now carrying ouia systematic study of the country, coveringsuch natural resources as soils, climate, vege-tation, and topography. This is being domon a priority basis to cover those parts of thfcountry where land-use potential is expectecto be highest. Studies have been complétéeand maps are now being compiled and reports published for an area of about 50 million hectares, or approximately 30% of th<total land surface area of Iran.
The regional land-resources inventorieswhich include land-evaluation assessmentsare used as a general guide for regional development planning. These inventories annot a substitute for soil surveys but rather ifirst approximation to a quick and broacassessment of the available land resource:and their capabilities on the basis of whiclsuitable areas can be selected for furthe:study. Examples are a semidetailed soil survey and land classification. The system o:classification used provides a comprehensiv<picture of the whole spectrum of land-us«potential. Cropping land is shown by variouiclasses of suitability for either dry farming oiirrigation, while land unsuitable for arabl«cropping is shown by separate categories osuitability such as pasture and forestry. Thesi
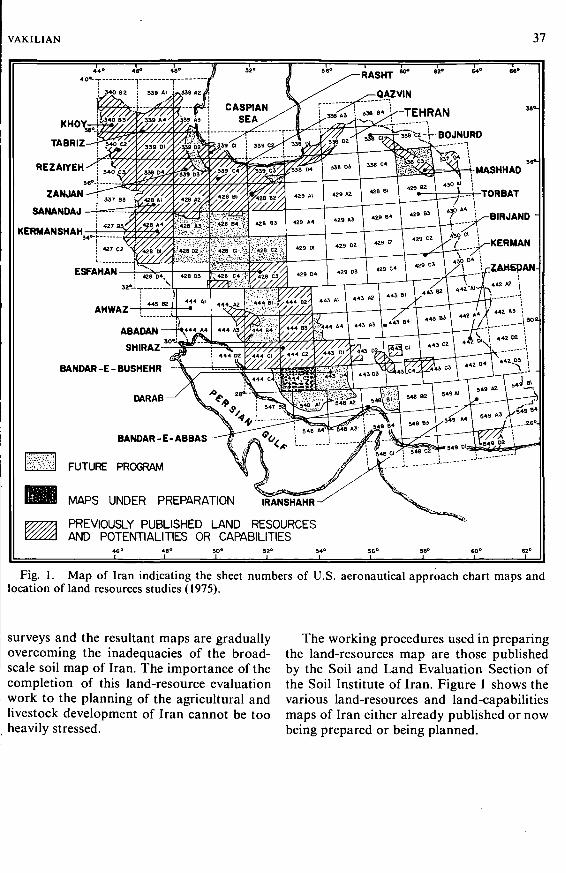
VAKILIAN 37
REZAIYEH'
SANANDAJ
KERMANSHAH — i -
BANDAR-E-BUSHEHR
DARAB
BANDAR-E-ABBAS
FUTURE PROGRAM
MASHHAD
[-TORBATi
BIRJAND
MAPS UNDER PREPARATION IRANSHAHR
PREVIOUSLY PUBLISHED LAND RESOURCESAND POTENTIALITIES OR CAPABILITIES
Fig. 1. Map of Iran indicating the sheet numbers of U.S. aeronautical approach chart maps andlocation of land resources studies (1975).
surveys and the resultant maps are graduallyovercoming the inadequacies of the broad-scale soil map of Iran. The importance of thecompletion of this land-resource evaluationwork to the planning of the agricultural andlivestock development of Iran cannot be tooheavily stressed.
The working procedures used in preparingthe land-resources map are those publishedby the Soil and Land Evaluation Section ofthe Soil Institute of Iran. Figure 1 shows thevarious land-resources and land-capabilitiesmaps of Iran either already published or nowbeing prepared or being planned.
PART II:INTERPRETATION OF
SOIL-RESOURCE DATA
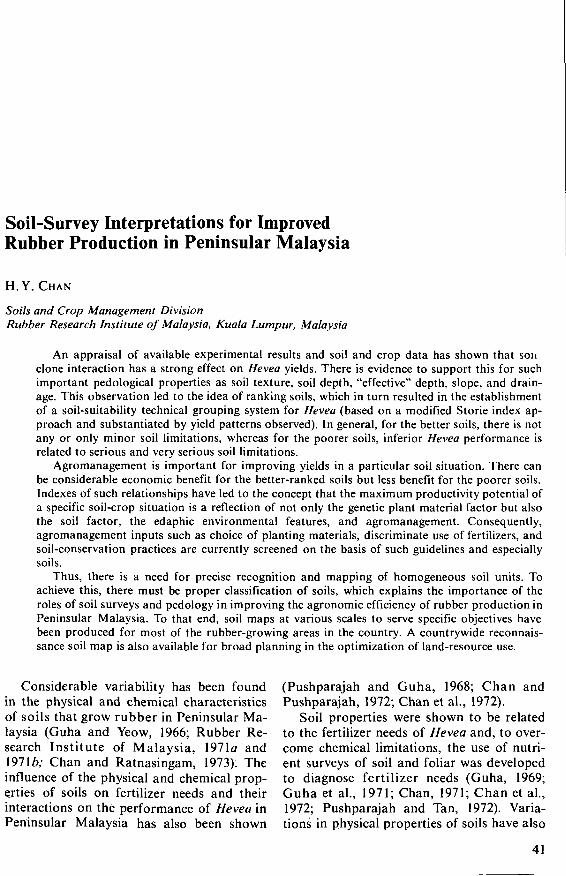
Soil-Survey Interpretations for ImprovedRubber Production in Peninsular Malaysia
H.Y.CHAN
Soils and Crop Management DivisionRubber Research Institute of Malaysia, Kuala Lumpur, Malaysia
An appraisal of available experimental results and soil and crop data has shown that sonclone interaction has a strong effect on Hevea yields. There is evidence to support this for suchimportant pedological properties as soil texture, soil depth, "effective" depth, slope, and drain-age. This observation led to the idea of ranking soils, which in turn resulted in the establishmentof a soil-suitability technical grouping system for Hevea (based on a modified Storie index ap-proach and substantiated by yield patterns observed). In general, for the better soils, there is notany or only minor soil limitations, whereas for the poorer soils, inferior Hevea performance isrelated to serious and very serious soil limitations.
Agromanagement is important for improving yields in a particular soil situation. There canbe considerable economic benefit for the better-ranked soils but less benefit for the poorer soils.Indexes of such relationships have led to the concept that the maximum productivity potential ofa specific soil-crop situation is a reflection of not only the genetic plant material factor but alsothe soil factor, the edaphic environmental features, and agromanagement. Consequently,agromanagement inputs such as choice of planting materials, discriminate use of fertilizers, andsoil-conservation practices are currently screened on the basis of such guidelines and especiallysoils.
Thus, there is a need for precise recognition and mapping of homogeneous soil units. Toachieve this, there must be proper classification of soils, which explains the importance of theroles of soil surveys and pedology in improving the agronomic efficiency of rubber production inPeninsular Malaysia. To that end, soil maps at various scales to serve specific objectives havebeen produced for most of the rubber-growing areas in the country. A countrywide reconnais-sance soil map is also available for broad planning in the optimization of land-resource use.
Considerable variability has been found (Pushparajah and Guha, 1968; Chan andin the physical and chemical characteristics Pushparajah, 1972; Chan et al., 1972).of soils that grow rubber in Peninsular Ma- Soil properties were shown to be relatedlaysia (Guha and Yeow, 1966; Rubber Re- to the fertilizer needs of Hevea and, to over-search Institute of Malaysia, 1971a and come chemical limitations, the use of nutri-19716; Chan and Ratnasingam, 1973). The ent surveys of soil and foliar was developedinfluence of the physical and chemical prop- to diagnose fertilizer needs (Guha, 1969;erties of soils on fertilizer needs and their Guha et al., 1971; Chan, 1971; Chan et al.,interactions on thé performance of Hevea in 1972; Pushparajah and Tan, 1972). Varia-Peninsular Malaysia has also been shown tions in physical properties of soils have also
41
42 INTERPRETATION
been shown to be strongly related to the yieldpatterns of Hevea (Chan and Pushparajah,1972; Chan et al., 1974). There was alsostrong evidence of a clonal selectivity of soilseries. This led to the crystallization of the"environment" concept about choice of plant-ing materials, wherein clonal recommenda-tions are provided not only according tofeatures of genetic material, disease, andwind-damage susceptibilities but also accord-ing to adaptability to a specific soil type.Subsequently, information and a pooled col-lation of available agronomic data enabledthe identification of major physical limita-tions of the poorer soils so that appropriateagromanagement practices could be em-ployed to improve yields (Chan et al., 1973).
Additionally, Chan and Pushparajah(1972) showed further proof of the impor-tance of discriminating agromanagement in-puts according to soil type to achieve opti-mum yields and maximum profits fromhigh-yielding clones.
These findings emphasize the importantrole soil surveys and pedology play in the ad-vances being made towards increasing theagronomic efficiency of rubber production inMalaysia. This paper summarizes the prin-ciples and recent approach adopted by theInstitute concerning soil surveys.
History and Nature of RubberProduction in Peninsular Malaysia
The first seeds of Hevea brasiliensis thatformed the genesis of the now 1.7 million-hectare (4.2 million acres) industry werebrought to Malaysia about 100 years ago.However, it was only at the turn of the cen-tury that the industry as it is today began totake shape and grow in pace with the de-mands of the motor and related industriesthroughout the world. By 1925, the worldrubber production was 530,000 tons, tentimes more than that of 1905; by 1940, it hadgrown to 1.5 million tons, with the Malaysianproduction alone accounting for one-third ofthe world supply.
During World War II, the invention ofsynthetic rubber and its commercial availa-
bility resulted in a different turn for the in-dustry, since warring countries needed to beindependent of the traditional natural sourceof rubber as their need for rubber for warmachinery grew. When the war ended, theposition and future of synthetic rubber ap-peared well established to the loss of naturalrubber's position of being the sole elastomerin demand.
However, by the mid-sixties, confidencerevived in the future of natural rubber be-cause of the leading role Malaysia played inthe modernization of the product. Intenseefforts of research and development enabledhigher productivity, more rapid turnover ofproduction, enhanced technological bene-fits of the product, and improved grading,,quality control, and marketing. Concertedefforts were aimed at increasing productivityand reducing production costs through the 'following: optimum utilization of land re-sources; proper use of agronomic practices;earlier tapping and the use of clonal stimu-lants; intercropping and integrated areadevelopment; and improved processingmethods. All of these had in common a cost- ;benefit objective. These efforts, the fruit of50 years of intense research by the RubberResearch Institute of Malaysia, provided thenecessary economic base for the rubber in-dustry to compete against synthetic rubberand swung the world demand back in favorof natural rubber.
Today, because of proven technologicaland cost benefits of natural rubber comparedwith synthetic rubber, there is no longer anydoubt that the natural rubber industry is hereto stay. Moreover, the world's present con-cern for a healthier environment and itsenergy crisis gives greater credence to thefuture of natural rubber. The process of pro-ducing natural rubber using natural inputs ofsunlight, water, and soil hardly pollutes theenvironment; where energy is concerned,increasing production costs of synthetic rub-ber using fast depleting resources have raiseddoubts about its continued availability. Con-tinual research and development will nodoubt establish further dependence of manon natural rubber.
As a result of intensive research and de-
CHAN 43
Fig. 1. Reconnaissance map of rubber-grow-ing areas in Peninsular Malaysia. (Courtesy TheDirector, Department of Agriculture, PeninsularMalaysia, and The Director of National Mapping,Malaysia)
velopment efforts, Malaysia today enjoys theposition of being the largest rubber producerin the world; rubber production totaled 1.6million tons in 1974 and is expected to reach2 million tons by 1980. The rubber industrytoday retains its role as the mainstay of theMalaysian economy in terms of land use foragriculture (66%), employment (33%), for-eign exchange earnings (30%), and grossnational product (15%). This reflects the sig-nificant contribution of research and devel-opment and has made the Institute's role allthe more significant. The rubber-growingareas of Peninsular Malaysia are shown inFigure 1.
Relationship between SoilCharacteristics and Rubber Production
Influence of Morphology
The performance of Hevea in relation tothe soil-texture variation on the Rasau series
(Tropudult) and Jerangau series (Paleudult)is shown in Table 1. The performance ofclone PB 5/51 (Experiment SE. 108) im-proved as clay content increased from a tex-tural range of sandy clay loam to sandy clayin the topsoil and sandy clay to clay in thesubsoil. The mean girth increased by 3% andthe yield by 18%. The better performancemay be traced to the higher clay content,which stores more moisture (Soong, 1971)and nutrients (Rubber Research Institute ofMalaysia, 19716). The better performance ofHevea was also reflected in the leaf nutri-tional status, which showed comparativelyhigh levels of nitrogen, phosphorus, potassi-um, and magnesium. Similar patterns werealso observed in Experiment SE. 107 (2% in-crease in girth and 9% increase in yield) andin Experiment SE. 62 (5% increase in girthand 12% increase in yield).
Influence of Physiography
Soil depth to parent material layer
Table 2 shows the mean girth and yieldmeasurements in relation to the soil depthto parent material layer on Serdang series(Tropudult). Both mean girth and yield arerelatively higher, by 3 and 4%, respectively,for PB 5/51 (Experiment SE. 90) in the deep-er soil ( > 125 cm), which also recordedhigher leaf nitrogen, phosphorus, and potas-sium.
Soil depth to an impenetrable layer
Table 2 also shows the mean girth andyield in relation to the depth of soil to thecompact impenetrable ironstone or lateritelayer found in the Malacca series (Petro-plinthic Haplorthox). The growth and yieldof PB 5/51 (Experiment SE. 102), growingon soil 25 to 50 cm deep (depth from surfaceto latérite pan), were improved by 4 and24%, respectively, compared with those oftrees on shallower soil (0 to 25 cm). Leaf-nutrient status was also better for phospho-rus, potassium, and magnesium.
A similar pattern was obtained for thesame clone on the same soil but with a steep-er slope of 12 to 26%. Girth and yield on the
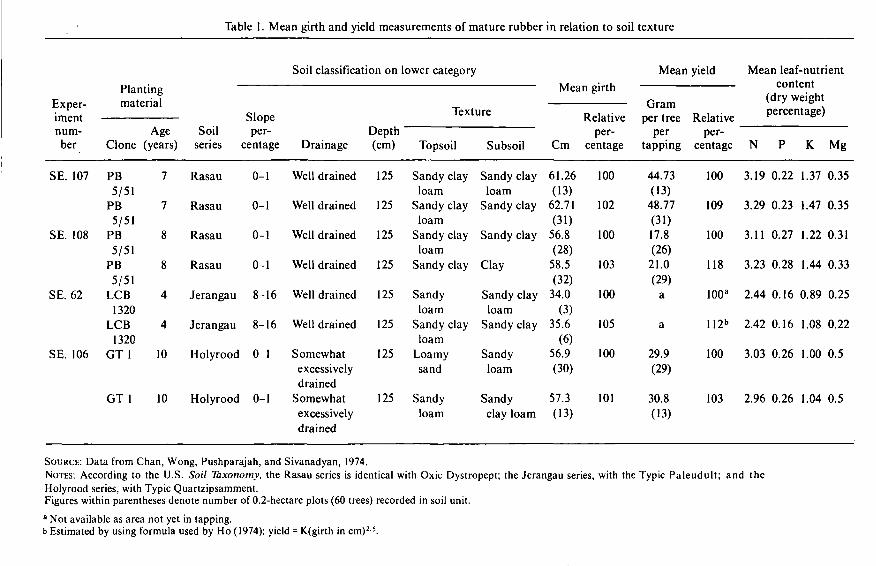
Table 1. Mean girth and yield measurements of mature rubber in relation to soil texture
Soil classification on lower category Mean yield Mean leaf-nutrient
Planting Mean girth / Jc o n t e î l t
1 .Exper- material T Gram (dry we.ghtiment Slope T e x t u r e Relative per tree Relative Pontage)num- Age Soil per- Depth per- per per-ber Clone (years) series centage Drainage (cm) Topsoil Subsoil Cm centage tapping centage N P K. Mg
SE. 107 PB 7 Rasau 0-1 Well drained 125 Sandy clay Sandy clay 61.265/51 loam loam (13)
PB 7 Rasau 0-1 Well drained 125 Sandy clay Sandy clay 62.715/51 loam (31)
SE. 108 PB 8 Rasau 0-1 Well drained 125 Sandy clay Sandy clay 56.85/51 loam (28)
PB 8 Rasau 0-1 Well drained 125 Sandy clay Clay 58.55/51 (32)
SE. 62 LCB 4 Jerangau 8-16 Well drained 125 Sandy Sandy clay 34.01320 loam loam (3)
LCB 4 Jerangau 8-16 Well drained 125 Sandy clay Sandy clay 35.61320 loam (6)
SE. 106 GT 1 10 Holyrood 0-1 Somewhat 125 Loamy Sandy 56.9excessively sand loam (30)drained
GT 1 10 Holyrood 0-1 Somewhat 125 Sandy Sandy 57.3excessively loam clay loam (13)drained
SOURCE: Data from Chan, Wong, Pushparajah, and Sivanadyan, 1974.NOTES: According to the U.S. Soil Taxonomy, the Rasau series is identical with Oxic Dystropept; the Jerangau series, with the Typic Paleudult; and theHolyrood series, with Typic Quartzipsamment.Figures within parentheses denote number of 0.2-hectare plots (60 trees) recorded in soil unit.a Not available as area not yet in tapping.b Estimated by using formula used by Ho (1974): yield = K(girth in cm)2-5.
100
102
100
103
100
105
100
101
44.73(13)48.77(31)17.8(26)21.0(29)a
a
29.9(29)
30.8(13)
100
109
100
118
100a
112»
100
103
3.19
3.29
3.11
3.23
2.44
2.42
3.03
2.96
0.22
0.23
0.27
0.28
0.16
0.16
0.26
0.26
1.37
1.47
1.22
1.44
0.89
1.08
1.00
1.04
0.35
0.35
0.31
0.33
0.25
0.22
0.5
0.5

CHAN 45
soil property of 50 cm deep were higher by2% and that of 75 cm by 19%, with appreci-able increases in leaf potassium and magne-sium compared with an area that has a soil-depth to laterite-phase relation of 0 to 25 cm.
Even for immature rubber (stumped bud-dings) of RRIM 600 on the Malacca seriessoil (Experiment SE. 117) of 25 to 50 cmdeep, there was a girth increase of 8% com-pared with that of the same soil of 0 to 25cm. Though the comparison is based on oneplot for the deeper soil phase, the value ob-tained (15.26 cm) was generally well abovethat for a shallower soil phase (14.11 cm).Since all other relevant soil and edaphicconditions were similar, the effect of soildepth or effective depth (to impenetrablelayer) is apparent and is consistent with soil-to-crop behavior; that is, deeper soil pro-vides greater soil volume for better develop-ment of main and lateral roots (Soong, 1971).As the soil surface area increases, exploita-tion of moisture and nutrients also increasesin both the top and subsoils, resulting inmore efficient nutrient uptake. This is re-flected by the generally higher leaf-nutrientlevels of nitrogen, phosphorus, potassium,and magnesium observed for the deepersoils. A reduction in yield has been shown tooccur by the lowering of tree density causedby losses from the uprooting of poorly an-chored roots in shallow soils (Chan andPushparajah, 1972).
Slope
Table 3 compares the mean girth andyield of four clones in relation to slope. Inthe cases considered, both girth and yield in-creased as slopes increased (not exceeding26%). For clone LCB 1320 on the Jerangauseries (Paleudult) in Experiment SE. 62, thegirth increased by 2% and the yield by 2%when the slope increased from 3 to 8% to3 to 16%. For PB 5/51 on the Malacca series[Petroplinthic Haplorthox) in ExperimentSE. 102, in addition to increases of 2% for*irth and 6.5% for yield, slightly higher leafpotassium (1.46%) and magnesium (0.19%)levels were obtained for the higher slope of5 to 8%. Further, for the highest slope of 12to 26%, increases of about 3% for girth and
13% for yield were obtained. There were alsoappreciable increases in leaf nitrogen andphosphorus and a marked increase in potas-sium. For PB 5/51 (Experiment SE. 101) onthe Durian series (Plinthudult), the meangirth was increased by 4% and the meanyield by 10% when the slope increased from3 to 8% to 8 to 16%. Higher leaf nitrogen(3.0%) and potassium (1.63%) levels werealso recorded. For immature rubber (RRIM600) on the Malacca series (PetroplinthicHaplorthox), there was a relative increase of15% for girth when the slope increased from3 to 8% to 8 to 16%.
The above observations are consistentwith the basics of soil-to-crop behavior, withparticular reference to the modifying influ-ence of topography on soil properties such asinternal and external drainage, surface run-off, infiltration, and soil structure. It is likelythat an increasing soil slope, up to a point(benchmark slope?), leads to better drainedsoils and hence better Hevea performance. Ifthe elevation is slight, water stagnation canoccur, resulting in poor drainage conditions.An example is the Durian series (Plinthu-dult), which are clay-textured, derived fromfiner-grained parent material. Such condi-tions limit good aeration and penetration ofroots and can have detrimental effects on theHevea performance.
If the slopes are steeper (e.g., above 26%),more surface runoff can occur and, as shal-lower soils are usually the genetic result onsoil tops, the cumulative effects of these twofactors can be limiting to optimum perfor-mance.
Effective soil depth to water table
Based on soil survey and agronomic dataobtained, Table 4 shows the yield behavior ofPB 86 on the Selangor series (Sulfaquept)under the influence of the water table at 50cm and 100 cm from the soil surface. Table 4clearly demonstrates an additional yield ofabout 222 kg per hectare, or an additionalcumulative yield of 1,333 kg per hectare overa period of 6 years, obtained where thewater table was deeper, that is, at 100 cm.
This phenomenon is consistent with thelogistics of soil-to-crop behavior, where the
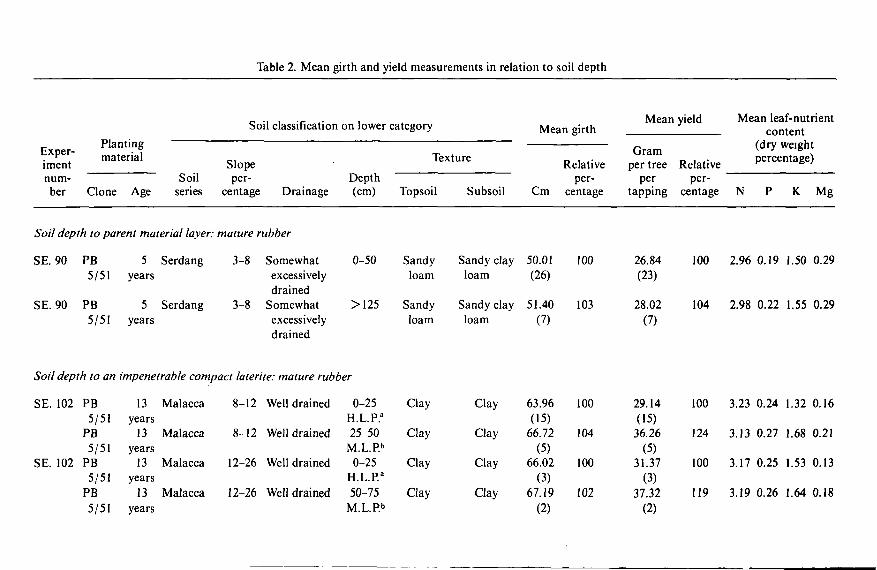
Table 2. Mean girth and yield measurements in relation to soil depth
Soil classification on lower category
_ PlantingE x P e r - materialîmentnum-ber Clone Age
SlopeSoil per-
series centage
Texture
DrainageDepth(cm) Topsoil Subsoil
Mean girth
Relativeper-
Cm centage
Mean
Gramper tree
pertapping
yield
Relativeper-
centage
Mean leaf-nutrientcontent
(dry weightpercentage)
N P K Mg
Soil depth to parent material layer: mature rubber
SE. 90 PB 5 Serdang5/51 years
SE. 90 PB 5 Serdang5/51 years
3-8
3-8
Somewhatexcessivelydrained
Somewhatexcessivelydrained
0-50
>125
Sandyloam
Sandyloam
Sandy clayloam
Sandy clayloam
50.01(26)
51.40(7)
100
103
26.84(23)
28.02(7)
100
104
2.96
2.98
0.19
0.22
1.50
1.55
0.29
0.29
Soil depth to an impenetrable compact latérite: mature rubber
SE. 102 PB5/51
PB5/51
SE. 102 PB5/51
PB5/51
13years
13years
13years
13years
Malacca
Malacca
Malacca
Malacca
8-12
8-12
12-26
12-26
Well drained
Well drained
Well drained
Well drained
0-25H.L.P."25-50
M.L.P.b
0-25H.L.P.a
50-75M.L.P.b
Clay
Clay
Clay
Clay
Clay
Clay
Clay
Clay
63.96(15)
66.72(5)
66.02(3)
67.19(2)
100
104
100
102
29.14(15)
36.26(5)
31.37(3)
37.32(2)
100 3.23 0.24 1.32 0.16
124 3.13 0.27 1.68 0.21
100 3.17 0.25 1.53 0.13
119 3.19 0.26 1.64 0.18
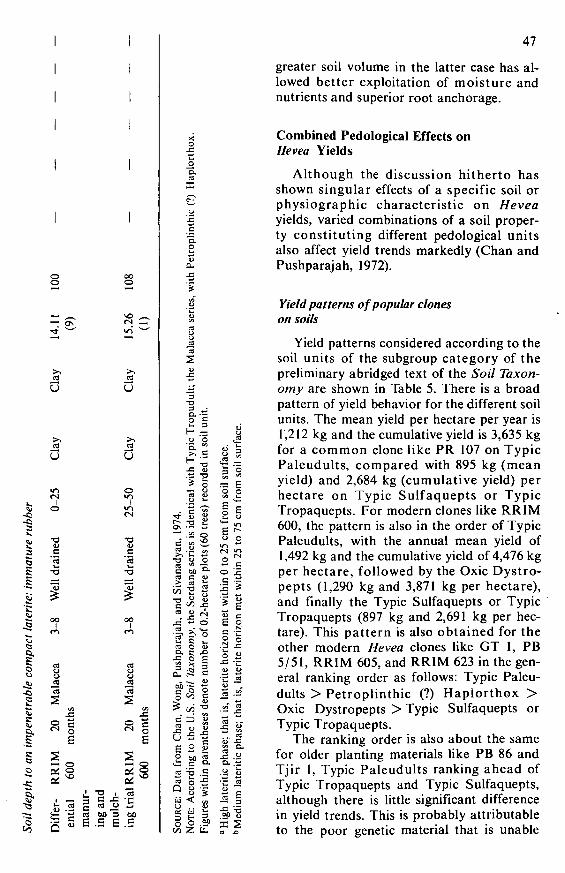
>>ca
U
U
-o3
aaS
io
'Sc
'3•o
I
I2 ai
to O
co
OOO
ca
ö
_caU
oin
Iu~i<N
caT3
1
.S E .S
"5.X
o 'S
.E °
11cd u
O\ -•= S- .a o
lit•U u o
1E 2 |
o - S
l *
IlI S
So «x: -'C M
S — u
g S 3 «> Bo o .2» x S
47
greater soil volume in the latter case has al-lowed better exploitation of moisture andnutrients and superior root anchorage.
Combined Pedological Effects onHevea Yields
Although the discussion hitherto hasshown singular effects of a specific soil orphysiographic characteristic on Heveayields, varied combinations of a soil proper-ty constituting different pedological unitsalso affect yield trends markedly (Chan andPushparajah, 1972).
Yield patterns of popular cloneson soils
Yield patterns considered according to thesoil units of the subgroup category of thepreliminary abridged text of the Soil Taxon-omy are shown in Table 5. There is a broadpattern of yield behavior for the different soilunits. The mean yield per hectare per year is1,212 kg and the cumulative yield is 3,635 kgfor a common clone like PR 107 on TypicPaleudults, compared with 895 kg (meanyield) and 2,684 kg (cumulative yield) perhectare on Typic Sulfaquepts or TypicTropaquepts. For modern clones like RRIM600, the pattern is also in the order of TypicPaleudults, with the annual mean yield of1,492 kg and the cumulative yield of 4,476 kgper hectare, followed by the Oxic Dystro-pepts (1,290 kg and 3,871 kg per hectare),and finally the Typic Sulfaquepts or TypicTropaquepts (897 kg and 2,691 kg per hec-tare). This pattern is also obtained for theother modern Hevea clones like GT 1, PB5/51, RRIM 605, and RRIM 623 in the gen-eral ranking order as follows: Typic Paleu-dults > Petroplinthic (?) Hapiorthox >Oxic Dystropepts > Typic Sulfaquepts orTypic Tropaquepts.
The ranking order is also about the samefor older planting materials like PB 86 andTjir 1, Typic Paleudults ranking ahead ofTypic Tropaquepts and Typic Sulfaquepts,although there is little significant differencein yield trends. This is probably attributableto the poor genetic material that is unable
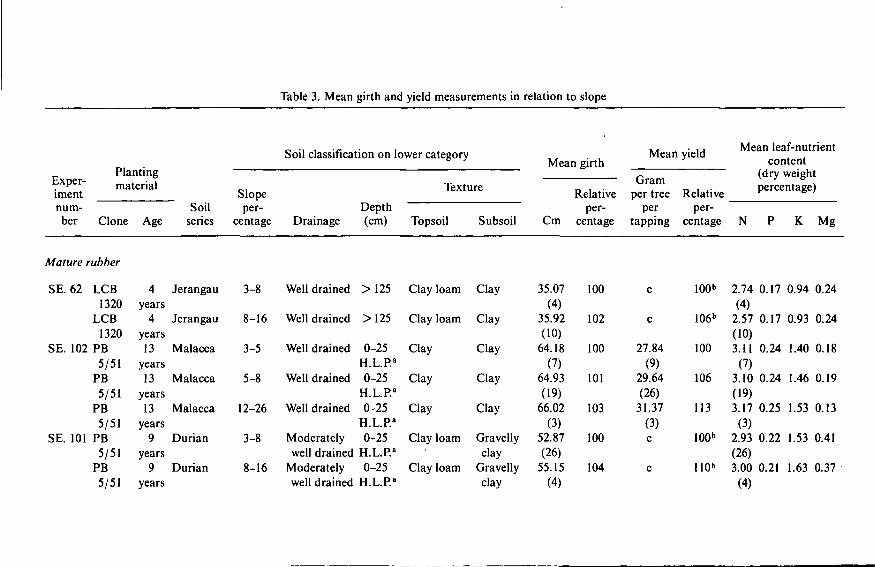
Table 3. Mean girth and yield measurements in relation to slope
PlantingE x P e r " materialîmentnum-ber Clone Age
Slopeper-
series centage
Soil classification on lower category
Texture
Soil DepthDrainage (cm) Topsoil Subsoil
Mean girthMean yield
GramRelative per tree Relative
per- per per-Cm centage tapping centage N
Mean leaf-nutrientcontent
(dry weightpercentage)
P K Mg
Mature rubber
SE. 62 LCB1320
LCB1320
SE. 102 PB5/51
PB5/51
PB5/51
SE. 101 PB5/51
PB5/51
4years
4years13
years13
years13
years9
years9
years
Jerangau 3-8 Well drained > 125 Clay loam
Jerangau 8-16 Well drained > 125 Clay loam
Malacca 3-5 Well drained 0-25 Clay
H.L.P."Malacca 5-8 Well drained 0-25 Clay
H.L.P."Malacca 12-26 Well drained 0-25 Clay
H.L.P."Durian 3-8 Moderately 0-25 Clay loam
well drained H.L.P.a
Durian 8-16 Moderately 0-25 Clay loamwell drained H.L.P."
Clay
Clay
Clay
Clay
Clay
Gravellyclay
Gravellyclay
35.07(4)
35.92(10)
64.18(7)
64.93(19)
66.02(3)
52.87(26)
55.15(4)
100
102
100
101
103
100
104
c
c
27.84(9)
29.64(26)
31.37(3)c
c
100"
106b
100
106
113
100"
110"
2.74(4)
2.57(10)3.11
(7)3.10(19)3.17
(3)2.93(26)3.00
(4)
0.17
0.17
0.24
0.24
0.25
0.22
0.21
0.94
0.93
1.40
1.46
1.53
1.53
1.63
0.24
0.24
0.18
0.19
0.13
0.41
0.37
oo
caÖ
u
U
es
Ö
o;
xJX
1'3•o
•o«c
't3
13
e*
o c<N O
e
fil il «Ica ou "3 eoE .S E .S
o
CL
s-o3
H
•g1 Sg 3Ë I
og
i•o
8
I_o"E.
f — O
o. § ^ S•5 g a Ë3 S -C 3
ft- O
g o S o
2 -ö S .S« £ •» J=
Q S c -s
§ s°
.S Ê
o ^S
'-5 M
8 .S
CO 3 „
•" ° S2 c es5 'S Ma 3 es
« a 5
•x w z
49
to exploit the differences in soil pedologicalproperties.
Climate has a relatively smaller influencethan soil pedological properties on yieldtrends (Chan and Pushparajah, 1972), whereexperience in Peninsular Malaysia is con-cerned, and the above-observed yield pat-terns are therefore considered attributable todifferences in soil pedological properties.
Yield patterns consistent with soilpedological properties
In terms of soil properties, the yield pat-terns discussed are found to be consistentwith the soil pedological characteristics. Ac-cording to agronomic interpretations andfield experience, desirable soil properties re-quired for optimum growth of rubber aregiven (Chan et al., 1975) as follows:
Soil depth up to 100 cm free of hard-pan and rock-outcrop hindrance thathas homogenous pedological prop-erties
Well drainedGood soil aerationGood soil structure (strong, moderate-
ly strong, and moderate-medium,and fine subangular blocky struc-ture)
Friable to firm in consistencyGood water-holding capacityNo peat or acid peatSoil texture with sufficient clay (prefer-
ably a minimum amount of 35% clayto retain moisture and nutrients welland also about 30% sand to allowgood pedological soil properties likeaeration and drainage).
The desirable environmental physio-graphic features are (1) gently sloping orrolling terrain with minimum soil erosionand surface runoff (slopes of 2° to 9° with anupper limit of 16°) and (2) water table deep-er than 100 cm.
The desirable chemical properties shouldbe such that the soil has at least medium lev-els of total nutrient content of nitrogen,phosphorus, potassium, and magnesium(Pushparajah and Guha, 1968) and no defi-
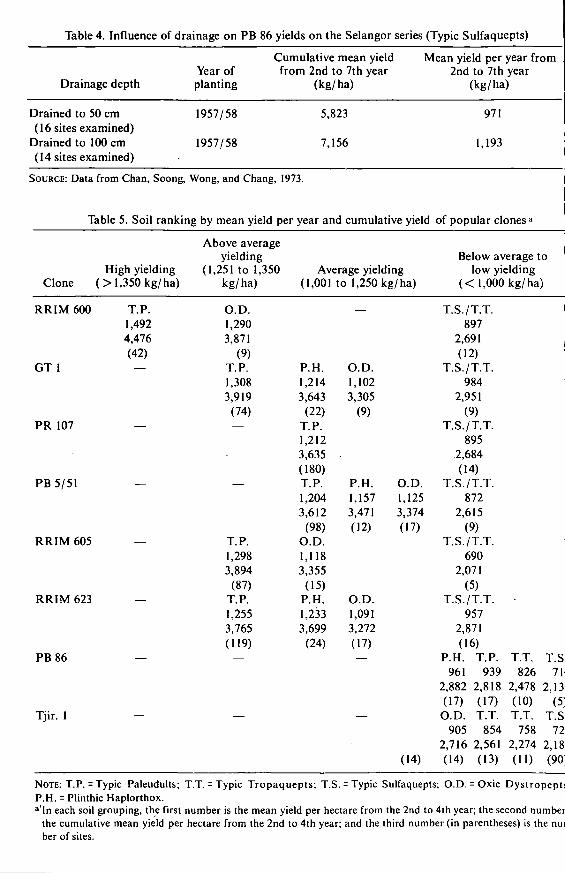
Table 4. Influence of drainage on PB 86 yields on the Selangor series (Typic Sulfaquepts)
Drainage depth
Drained to 50 cm(16 sites examined)
Drained to 100 cm(14 sites examined)
Year ofplanting
1957/58
1957/58
Cumulative meanfrom 2nd to 7th
(kg/ha)
5,823
7,156
yieldyear
Mean yield per year from2nd to 7th year
(kg/ha)
971
1,193
SOURCE: Data from Chan, Soong, Wong, and Chang, 1973.
Table 5. Soil ranking by mean yield per year and cumulative yield of popular clones2
Clone
RRIM 600
GT 1
PR 107
PB 5/51
RRIM 605
RRIM 623
PB 86
Tjir. 1
High yielding( > 1,350 kg/ha)
T.P.1,4924,476(42)
—
—
—
—
—
—
—
Above averageyielding
(1,251 to 1,350kg/ha)
O.D.1,2903,871
(9)T.P.1,3083,919
(74)—
—
T.P.1,2983,894
(87)T.P.1,2553,765(119)
—
—
Average yielding(1,001
P H .1,2143,643
(22)T.P.1,2123,635(180)T.P.1,2043,612
(98)O.D.1,1183,355
(15)P.H.1,2333,699
(24)
to 1,250 kg/ha)
O.D.1,1023,305
(9)
P.H.1,1573,471(12)
O.D.1,0913,272(17)—
—
O.D.1,1253,374(17)
(14)
Below average tlow yielding
( < 1,000
T.S./T.T.897
2,691(12)
T.S./T.T.984
2,951(9)
T.S./T.T.895
2,684(14)
T.S./T.T.872
2,615(9)
T.S./T.T.690
2,071(5)
T.S./T.T.957
2,871(16)
P.H. T.P.961 939
2,882 2,818(17) (17)
O.D. T.T.905 854
2,716 2,561(14) (13)
0
kg/ha)
T.T.826
2,478(10)T.T.
7582,274(11)
T.S71
2,13(5;
T.S72
2,18(90'
NOTE: T.P. = Typic Paleudults; T.T. = Typic Tropaquepts; T.S. = Typic Sulfaquepts; O.D. = Oxic Dystropept«P.H. = Plinthic Haplorthox.a ln each soil grouping, the first number is the mean yield per hectare from the 2nd to 4th year; the second number
the cumulative mean yield per hectare from the 2nd to 4th year; and the third number (in parentheses) is the nuiber of sites.
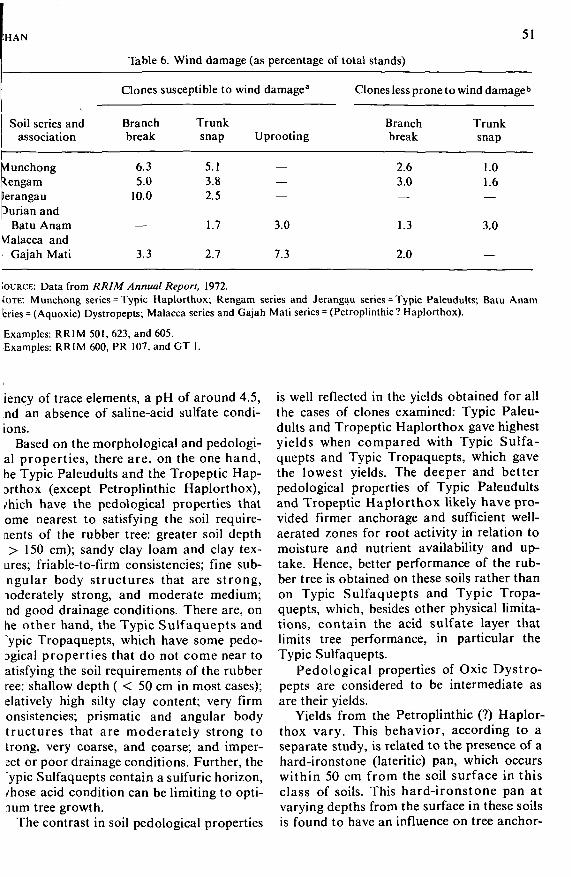
:HAN 51
Table 6. Wind damage (as percentage of total stands)
Soil series andassociation
Munchonglengamlerangaupurian and
Batu AnamVlalacca and
Gajah Mati
Clones
Branchbreak
6.35.0
10.0
—
3.3
susceptible to
Trunksnap
5.13.82.5
1.7
2.7
wind damage3
Uprooting
———
3.0
7.3
Clones less prone to wind damageb
Branchbreak
2.63.0—
1.3
2.0
Trunksnap
1.01.6—
3.0
—
IOURCE: Data from RRIM Annual Report, 1972.JOTE: Munchong series = Typic Haplorthox; Rengam series and Jerangau series = Typic Paleudults; Batu Anambries = (Aquoxic) Dystropepts; Malacca series and Gajah Mati series = (Petroplinthic ? Haplorthox).
Examples: RRIM 501, 623, and 605.(Examples: RRIM 600, PR 107, and GT 1.
iency of trace elements, a pH of around 4.5,nd an absence of saline-acid sulfate condi-ions.
Based on the morphological and pedologi-al properties, there are, on the one hand,he Typic Paleudults and the Tropeptic Hap-arthox (except Petroplinthic Haplorthox),/hich have the pedological properties thatome nearest to satisfying the soil require-ments of the rubber tree: greater soil depth> 150 cm); sandy clay loam and clay tex-
ures; friable-to-firm consistencies; fine sub-ngular body structures that are strong,moderately strong, and moderate medium;nd good drainage conditions. There are, onlie other hand, the Typic Sulfaquepts and"ypic Tropaquepts, which have some pedo-Dgical properties that do not come near toatisfying the soil requirements of the rubberree: shallow depth ( < 50 cm in most cases);datively high silty clay content; very firmonsistencies; prismatic and angular bodytructures that are moderately strong totrong, very coarse, and coarse; and imper-;ct or poor drainage conditions. Further, the"ypic Sulfaquepts contain a sulfuric horizon,/hose acid condition can be limiting to opti-"ium tree growth.
The contrast in soil pedological properties
is well reflected in the yields obtained for allthe cases of clones examined: Typic Paleu-dults and Tropeptic Haplorthox gave highestyields when compared with Typic Sulfa-quepts and Typic Tropaquepts, which gavethe lowest yields. The deeper and betterpedological properties of Typic Paleudultsand Tropeptic Haplorthox likely have pro-vided firmer anchorage and sufficient well-aerated zones for root activity in relation tomoisture and nutrient availability and up-take. Hence, better performance of the rub-ber tree is obtained on these soils rather thanon Typic Sulfaquepts and Typic Tropa-quepts, which, besides other physical limita-tions, contain the acid sulfate layer thatlimits tree performance, in particular theTypic Sulfaquepts.
Pedological properties of Oxic Dystro-pepts are considered to be intermediate asare their yields.
Yields from the Petroplinthic (?) Haplor-thox vary. This behavior, according to aseparate study, is related to the presence of ahard-ironstone (lateritic) pan, which occurswithin 50 cm from the soil surface in thisclass of soils. This hard-ironstone pan atvarying depths from the surface in these soilsis found to have an influence on tree anchor-

Table 7. Classification of soils under rubber cultivation in Peninsular Malaysia
Order Suborder Great group Subgroup Family Series
Entisols
Inceptisols
Ultisols
Oxisols
PsammentsAquents
Aquepts
Tropepts
HumultsUdults
Orthox
Quartzi psammentsFluvaquents
Tropaquepts
SulfaqueptsDystropepts
PalehumultsPlinthudults
TropudultsPaleudults
Haplorthox
Acrorthox
Orthoxic QuartzipsammentsTropic Fluvaquents
Typic Tropaquepts
Oxic Humitropepts
Aerie Tropaquepts
Typic Sulfaquepts(Aquoxic) DystropeptsOxic Dystropepts
(Orthoxic) Palehumults(Typic) Plinthudults(Oxic) Plinthudults
Orthoxic TropudultsTypic Paleudults
Tropeptic HaplorthoxTypic HaplorthoxPlinthic Haplorthox
Typic Acrorthox
•
Acidic, isohyperthermicFine, mixed, acid, isohyperthermic
Fine loamy, siliceous or mixed,acid, isohyperthermic
Coarse loamy, siliceous, acid,isohyperthermic
Fine, kaolinitic, acid, isohyperthermicVery fine, kaolinitic, acid,
isohyperthermicFine, mixed, acid, isohyperthermicVery fine, mixed, isohyperthermicFine loamy, siliceous,
isohyperthermicFine, kaolinitic, isohyperthermic
Clayey, kaolinitic, isohyperthermicClayey, mixed, isohyperthermicClayey-skeletal, mixed, isohyperthermicClayey, kaolinitic, isohyperthermicFine loamy, siliceous, isohyperthermicClayey, kaolinitic, isohyperthermic
Fine loamy, siliceous, isohyperthermic
Clayey, kaolinitic, isohyperthermicClayey, kaolinitic, isohyperthermicClayey-skeletal, kaolinitic,
isohyperthermicFine loamy, mineralogy
uncertain, isohyperthermic
Sungei Buloh, HolyroodBriah
Sogomana
Subang
Pasir PutehSitiawan
Linau, Selangor"Batu AnamRasau, Lunas, Ulu
Tiram, Kuala BrangKampong Chempaka,
Tok Yong
SenaiDurianJeramPohoi, KulaiBatang MerbauRengam, Jerangau,
Bungor, HarimauSerdang
Segamat, KuantanMunchongMalacca
Tampoi
SOURCE: Data from Chan, 1975.NOTE: Soil classification is according to U.S. Soil Taxonomy. Terms within parentheses suggest new subgroups.
aTKÎp noAr\n ic nnl a f»Ptllr!t] CfinCPnt r*f thp. Cphnnnr rpripc iwhtz-Vi r h n n U R*» mnrp nf a T\>^i^ 1
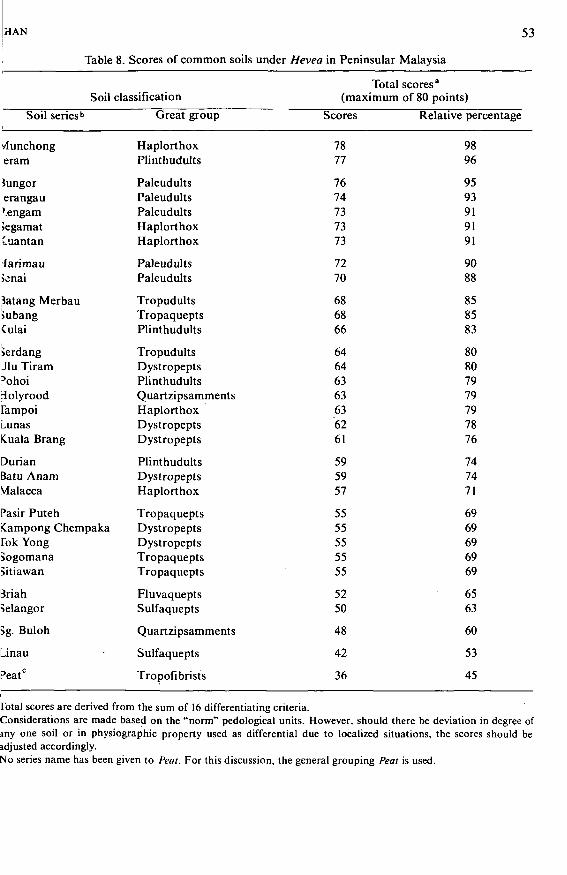
HAN 53
Table 8. Scores of common soils under Hevea in Peninsular Malaysia
Soil
Soil series'"
tfunchongeram
iungorerangau'engamiegamatCuantan
larimau>enai
iatang Merbau>ubangCulai
»erdangJlu TiramDohoirlolyroodFampoiLunasiCuala Brang
OurianBatu AnamMalacca
Pasir PutehfCampong Chempakafok YongSogomanasitiawan
BrianSelangor
5g. Buloh
Linau
Peatc
classification
Great group
HaplorthoxPlinthudults
PaleudultsPaleudultsPaleudultsHaplorthoxHaplorthox
PaleudultsPaleudults
TropudultsTropaqueptsPlinthudults
TropudultsDystropeptsPlinthudultsQuart zipsammentsHaplorthoxDystropeptsDystropepts
PlinthudultsDystropeptsHaplorthox
TropaqueptsDystropeptsDystropeptsTropaqueptsTropaquepts
FluvaqueptsSulfaquepts
Quart zipsamments
Sulfaquepts
Tropofibrists
Total(maximum
Scores
7877
7674737373
7270
686866
64646363636261
595957
5555555555
5250
48
42
36
scores a
of 80 points)
Relative percentage
9896
9593919191
9088
858583
80807979797876
747471
6969696969
6563
60
53
45
Total scores are derived from the sum of 16 differentiating criteria.Considerations are made based on the "norm" pedological units. However, should there be deviation in degree ofiny one soil or in physiographic property used as differential due to localized situations, the scores should beadjusted accordingly.No series name has been given to Peat. For this discussion, the general grouping Peat is used.
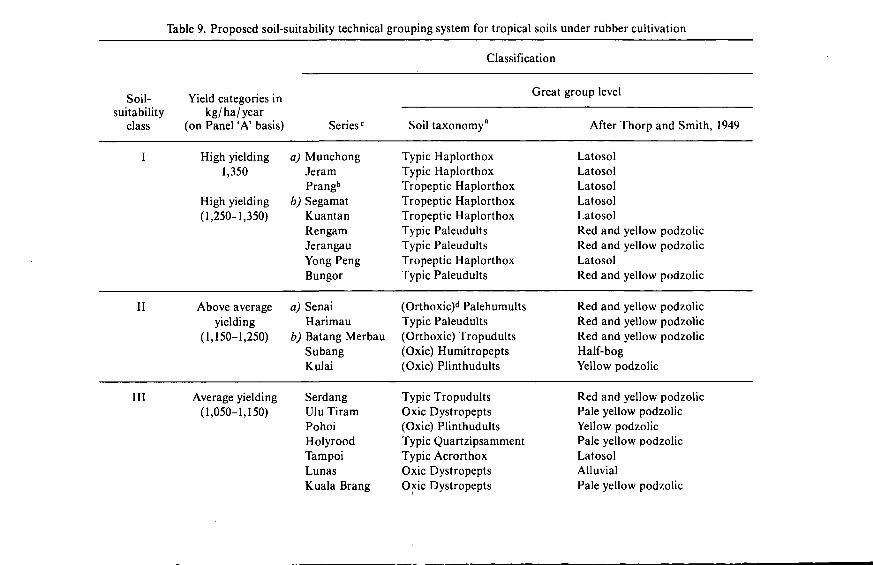
Table 9. Proposed soil-suitability technical grouping system for tropical soils under rubber cultivation
Soil-suitability
class
I
II
III
Yield categories inkg/ha/year
(on Panel 'A' basis)
High yielding1,350
High yielding(1,250-1,350)
Above averageyielding
(1,150-1,250)
Average yielding(1,050-1,150)
Seriesc
a) MunchongJeramPrangb
b) SegamatKuantanRengamJerangauYong PengBungor
a) SenaiHarimau
b) Batang MerbauSubangKulai
SerdangUlu TiramPohoiHolyroodTampoiLunasKuala Brang
Classification
Great
Soil taxonomy11
Typic HaplorthoxTypic HaplorthoxTropeptic HaplorthoxTropeptic HaplorthoxTropeptic HaplorthoxTypic PaleudultsTypic PaleudultsTropeptic HaplorthoxTypic Paleudults
(Orthoxic)d PalehumultsTypic Paleudults(Orthoxic) Tropudults(Oxic) Humitropepts(Oxic) Plinthudults
Typic TropudultsOxic Dystropepts(Oxic) PlinthudultsTypic QuartzipsammentTypic AcrorthoxOxic DystropeptsOxic Dystropepts
group level
After Thorp and Smith, 1949
LatosolLatosolLatosolLatosolLatosolRed and yellow podzolicRed and yellow podzolicLatosolRed and yellow podzolic
Red and yellow podzolicRed and yellow podzolicRed and yellow podzolicHalf-bogYellow podzolic
Red and yellow podzolicPale yellow podzolicYellow podzolicPale yellow podzolicLatosolAlluvialPale yellow podzolic
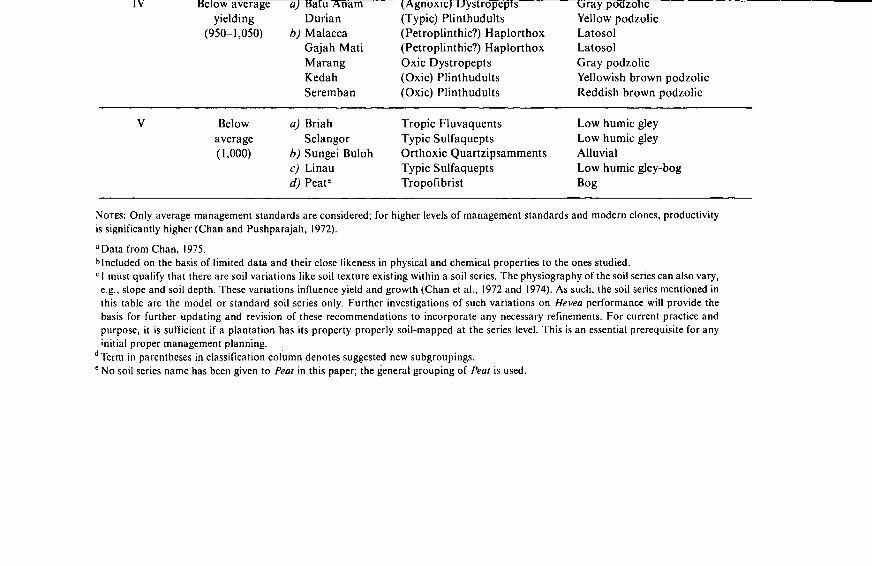
IV Deiow averageyielding
(950-1,050)
Belowaverage(1,000)
u) natu /\namDurian
b) MalaccaGajah MatiMarangKedahSeremban
a) BriahSelangor
b) Sungei Bulohc) Linaudj Peate
V/\gnoxic; uysiropepis(Typic) Plinthudults(Petroplinthic?) Haplorthox(Petroplinthic?) HaplorthoxOxic Dystropepts(Oxic) Plinthudults(Oxic) Plinthudults
Tropic FluvaquentsTypic SulfaqueptsOrthoxic QuartzipsammentsTypic SulfaqueptsTropofibrist
uray pouzoncYellow podzolicLatosolLatosolGray podzolicYellowish brown podzolicReddish brown podzolic
Low humic gleyLow humic gleyAlluvialLow humic gley-bogBog
NOTES: Only average management standards are considered; for higher levels of management standards and modern clones, productivityis significantly higher (Chan and Pushparajah, 1972).
aData from Chan, 1975.•> Included on the basis of limited data and their close likeness in physical and chemical properties to the ones studied.c I must qualify that there are soil variations like soil texture existing within a soil series. The physiography of the soil series can also vary,e.g., slope and soil depth. These variations influence yield and growth (Chan et al., 1972 and 1974). As such, the soil series mentioned inthis table are the model or standard soil series only. Further investigations of such variations on Hevea performance will provide thebasis for further updating and revision of these recommendations to incorporate any necessary refinements. For current practice andpurpose, it is sufficient if a plantation has its property properly soil-mapped at the series level. This is an essential prerequisite for anyinitial proper management planning.
dTerm in parentheses in classification column denotes suggested new subgroupings.e No soil series name has been given to Peat in this paper; the general grouping of Peat is used.

56 INTERPRETATION
age and wind damage (Table 6), hence, anindirect effect on yield (Chan and Pushpara-jah, 1972).
Productivity Potentials of Soils
A Proposal for a Technical GroupingSystem of Soil Suitability andProductivity
Soil limitations
The profile characteristics, chemical prop-erties, and physiographic features of the soilsstudied are discussed elsewhere (Chan,1975); their classification according to theU.S. Soil Taxonomy is shown in Table 7. Astudy of the soil data shows that some soilshave properties in the desirable range indi-cated earlier and many in the intermediaterange; and that a few have properties thatare not suitable for rubber at all. The greaterthe limitations hindering optimal growth andperformance of rubber, the less suited arethe soils for rubber. Further, the limitationsvary in intensities of hindrance and, throughquantitative and semiquantitative assess-ments of available soil and agronomic data,can be graded (minor, serious, and very seri-ous) and scored (arrive at the total pointscores of each pedological soil unit, based onthe sum total of scores of sixteen principalsoil criteria) (Table 8).
Table 8 shows that soil units that are deephave: a balanced composition of particle-sizedistribution; friable consistencies; mediumand fine subangular blocky structures thatare strong and moderately strong; and gooddrainage features. To wit: Paleudults andHaplorthox (excepting the Petroplinthic?subgroup) score the highest (70 to 78 out of80). Soil units that have a shallow "effec-tive" depth, an unbalanced composition ofparticle-size distribution, and poor drainageconditions and are very firm or very loose inconsistency and are compact or structure-less in structure score the lowest, namely,Sulfaquepts and Tropaquepts (42 to 55 outof 80). The rest of the soil units, whose prop-erties are in the intermediate range, are in-termediate in score.
Yield substantivity and the proposal
The above approach and principle;towards developing an appropriate soil-suitability technical grouping system for rubbeiconcur with field experience and the yiekpatterns obtained, as shown in Table 5 ancdiscussed earlier. Consequently, a "First Approximation" soil-suitability and productivetechnical grouping system for Hevea wasproposed (Chan et al., 1975) (see Table 9).
Scope for Agromanagement toImprove Yields i
The yields discussed hitherto are themean yields of a particular clone on a particiular soil given comparable husbandry. Charand Pushparajah (1972) found, however, thaiwhen the sampled population is re-sorted tcinclude different levels of agromanagemenlstandards, it improves the yield significantlyTable 10, which summarizes their findingsshows the ranges in mean yield per year (av-eraged over the second to fourth year oitapping) for the recommended modernHevea clones, as well as older materials likeRR1M 623 and Tjir 1 on contrasting soilsThe national mean yields obtained are alscincluded for comparison.
Large differences in minimum and maxi-mum yields can be observed for the Class Itechnically grouped soils (Haplorthox andPaleudults). In all instances, the difference;exceeded 1,000 kg per hectare per yearand the maximum yields were traced to goodupkeep and a high agromanagement stan-dard, whereas the minimum yield pointswere traced to poor upkeep and a low man-agement standard. The data clearly demon-strate that, for maximum exploitation of aplanting material on a soil, the best agro-management inputs are essential.
However, although there are considerableeconomic benefits for the Class I technicallygrouped soils, the investment of agroman-agement inputs for poorer soils may have todepend on the economic returns, as shownin Table 10, where increases ranging fromabout 200 to 500 kg per hectare per year areexperienced between the lowest and highest
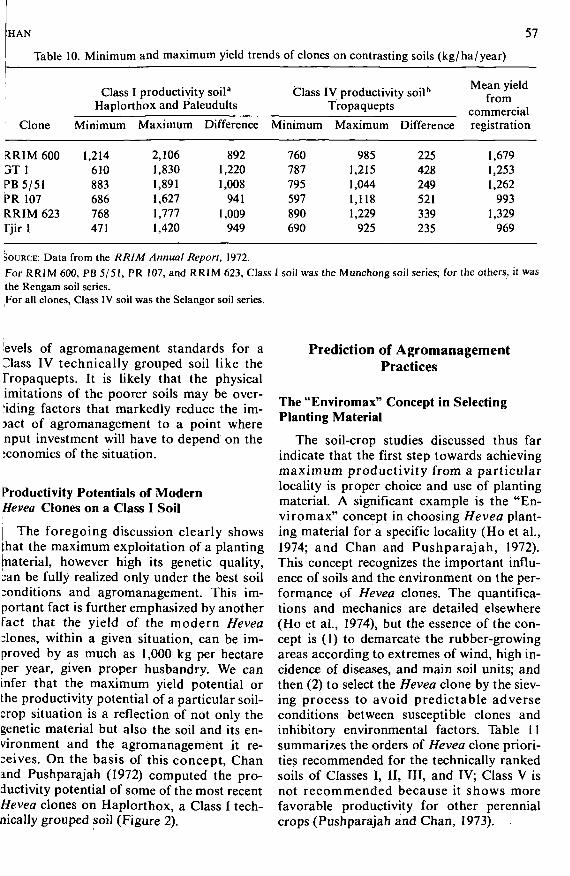
HAN 57
Table 10. Minimum and maximum yield trends of clones on contrasting soils (kg/ha/year)
Clone
RRIM 6003T 1PB 5/51PR 107RRIM 623rjir 1
Class [ productivity soil"Haplorthox and Paleudults
Minimum
1,214610883686768471
Maximum
2,1061,8301,8911,6271,7771,420
Difference
8921,2201,008
9411,009
949
Class
Minimum
760787795597890690
IV productivityTropaquepts
Maximum
9851,2151,0441,1181,229
925
soilb
Difference
225428249521339235
Mean yield
commercialregistration
1,6791,2531,262
9931,329
969
SOURCE: Data from the RRIM Annual Report, 1972.For RRIM 600, PB 5/51, PR 107, and RRIM 623, Class I soil was the Munchong soil series; for the others, it wasthe Rengam soil series.For all clones, Class IV soil was the Selangor soil series.
evels of agromanagement standards for aIlass IV technically grouped soil like theFropaquepts. It is likely that the physicalimitations of the poorer soils may be over-riding factors that markedly reduce the im-jact of agromanagement to a point wherenput investment will have to depend on theeconomics of the situation.
Productivity Potentials of ModernHevea Clones on a Class I Soil
The foregoing discussion clearly showsthat the maximum exploitation of a planting[naterial, however high its genetic quality,pan be fully realized only under the best soilconditions and agromanagement. This im-portant fact is further emphasized by anotherfact that the yield of the modern Heveaclones, within a given situation, can be im-proved by as much as 1,000 kg per hectareper year, given proper husbandry. We caninfer that the maximum yield potential orthe productivity potential of a particular soil-crop situation is a reflection of not only thegenetic material but also the soil and its en-vironment and the agromanagement it re-ceives. On the basis of this concept, Chanand Pushparajah (1972) computed the pro-ductivity potential of some of the most recentHevea clones on Haplorthox, a Class 1 tech-nically grouped soil (Figure 2).
Prediction of AgromanagementPractices
The "Enviromax" Concept in SelectingPlanting Material
The soil-crop studies discussed thus farindicate that the first step towards achievingmaximum productivity from a particularlocality is proper choice and use of plantingmaterial. A significant example is the "En-viromax" concept in choosing Hevea plant-ing material for a specific locality (Ho et al.,1974; and Chan and Pushparajah, 1972).This concept recognizes the important influ-ence of soils and the environment on the per-formance of Hevea clones. The quantifica-tions and mechanics are detailed elsewhere(Ho et al., 1974), but the essence of the con-cept is (1) to demarcate the rubber-growingareas according to extremes of wind, high in-cidence of diseases, and main soil units; andthen (2) to select the Hevea clone by the siev-ing process to avoid predictable adverseconditions between susceptible clones andinhibitory environmental factors. Table 11summarizes the orders of Hevea clone priori-ties recommended for the technically rankedsoils of Classes I, II, III, and IV; Class V isnot recommended because it shows morefavorable productivity for other perennialcrops (Pushparajah and Chan, 1973).
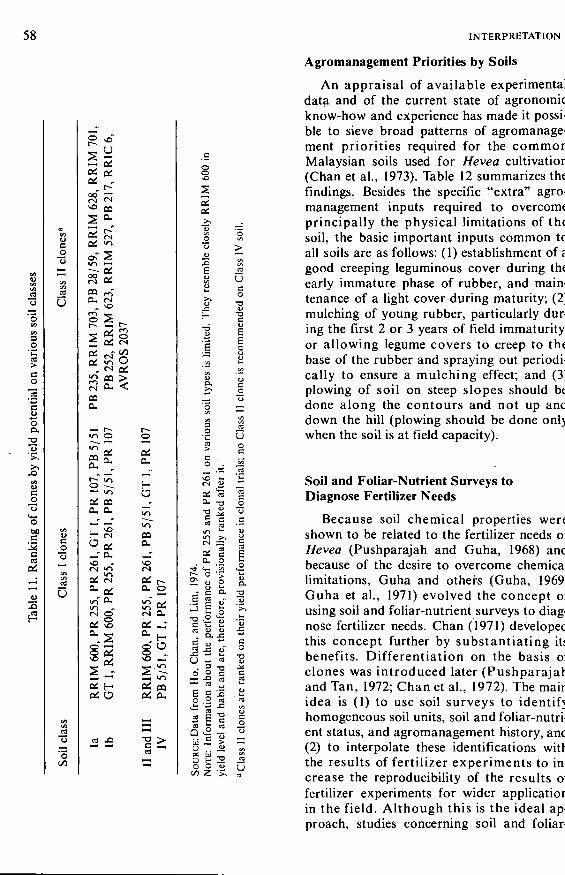
58 INTERPRETATION
_o•(J
ca
U
o
BO
OO.
."5
co
oBO
cecaoi
(S
II
5 5öS «">
os" S
oa m"CL, <N
2 ofai uiS «<N CL
03
oi OQ0 . CL
ëo
U
I!2 Hou O
r—o
oiCL
a
CQCu
0i r-0, ou-, 05<N CL
oi _r
8°o
sûi mOi CL
J2~3
•0,JSuco"Sa
Öoc
Ou O £
« C O,
c u " c
5 Ü 2
|
s - sg SaO O u
se u
Agromanagement Priorities by Soils
An appraisal of available expérimentadata and of the current state of agronomicknow-how and experience has made it possi-ble to sieve broad patterns of agromanage-ment priorities required for the commorMalaysian soils used for Hevea eultivatior(Chan et al., 1973). Table 12 summarizes thefindings. Besides the specific "extra" agro-management inputs required to overcomeprincipally the physical limitations of thesoil, the basic important inputs common tcall soils are as follows: (1) establishment of £good creeping leguminous cover during theearly immature phase of rubber, and main-tenance of a light cover during maturity; (2;mulching of young rubber, particularly dur-ing the first 2 or 3 years of field immaturityor allowing legume covers to creep to thebase of the rubber and spraying out periodi-cally to ensure a mulching effect; and (3)plowing of soil on steep slopes should bedone along the contours and not up anddown the hill (plowing should be done onl>when the soil is at field capacity).
Soil and Foliar-Nutrient Surveys toDiagnose Fertilizer Needs
Because soil chemical properties wereshown to be related to the fertilizer needs ojHevea (Pushparajah and Guha, 1968) andbecause of the desire to overcome chemicallimitations, Guha and others (Guha, 1969:Guha et al., 1971) evolved the concept olusing soil and foliar-nutrient surveys to diag-nose fertilizer needs. Chan (1971) developedthis concept further by substantiating itsbenefits. Differentiation on the basis oiclones was introduced later (Pushparajahand Tan, 1972; Chan et al., 1972). The mainidea is (1) to use soil surveys to identifyhomogeneous soil units, soil and foliar-nutri-ent status, and agromanagement history, anc(2) to interpolate these identifications withthe results of fertilizer experiments to in-crease the reproducibility of the results olfertilizer experiments for wider applicatiorin the field. Although this is the ideal ap-proach, studies concerning soil and foliar-
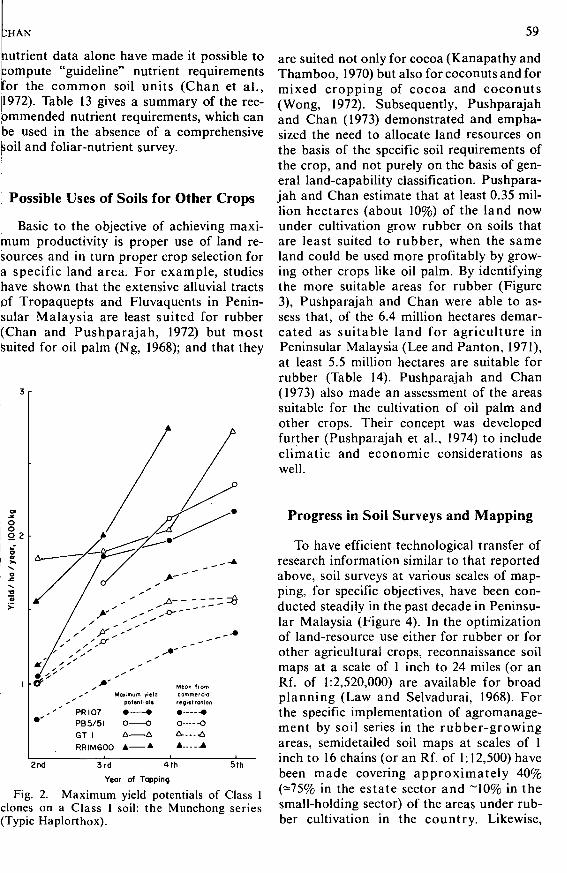
;HAN 59
lutrient data alone have made it possible topompute "guideline" nutrient requirementsfor the common soil units (Chan et al.,1972). Table 13 gives a summary of the rec-ommended nutrient requirements, which canbe used in the absence of a comprehensivesoil and foliar-nutrient survey.
Possible Uses of Soils for Other Crops
Basic to the objective of achieving maxi-mum productivity is proper use of land re-sources and in turn proper crop selection fora specific land area. For example, studieshave shown that the extensive alluvial tractspf Tropaquepts and Fluvaquents in Penin-sular Malaysia are least suited for rubber(Chan and Pushparajah, 1972) but mostsuited for oil palm (Ng, 1968); and that they
3 r
ooo 2
2nd 5th3rd 4 th
Year of Tapping
Fig. 2. Maximum yield potentials of Class 1clones on a Class I soil: the Munchong series(Typic Haplorthox).
are suited not only for cocoa (Kanapathy andThamboo, 1970) but also for coconuts and formixed cropping of cocoa and coconuts(Wong, 1972). Subsequently, Pushparajahand Chan (1973) demonstrated and empha-sized the need to allocate land resources onthe basis of the specific soil requirements ofthe crop, and not purely on the basis of gen-eral land-capability classification. Pushpara-jah and Chan estimate that at least 0.35 mil-lion hectares (about 10%) of the land nowunder cultivation grow rubber on soils thatare least suited to rubber, when the sameland could be used more profitably by grow-ing other crops like oil palm. By identifyingthe more suitable areas for rubber (Figure3), Pushparajah and Chan were able to as-sess that, of the 6.4 million hectares demar-cated as suitable land for agriculture inPeninsular Malaysia (Lee and Panton, 1971),at least 5.5 million hectares are suitable forrubber (Table 14). Pushparajah and Chan(1973) also made an assessment of the areassuitable for the cultivation of oil palm andother crops. Their concept was developedfurther (Pushparajah et al., 1974) to includeclimatic and economic considerations aswell.
Progress in Soil Surveys and Mapping
To have efficient technological transfer ofresearch information similar to that reportedabove, soil surveys at various scales of map-ping, for specific objectives, have been con-ducted steadily in the past decade in Peninsu-lar Malaysia (Figure 4). In the optimizationof land-resource use either for rubber or forother agricultural crops, reconnaissance soilmaps at a scale of 1 inch to 24 miles (or anRf. of 1:2,520,000) are available for broadplanning (Law and Selvadurai, 1968). Forthe specific implementation of agromanage-ment by soil series in the rubber-growingareas, semidetailed soil maps at scales of 1inch to 16 chains (or an Rf. of 1:12,500) havebeen made covering approximately 40%(-75% in the estate sector and -10% in thesmall-holding sector) of the areas under rub-ber cultivation in the country. Likewise,
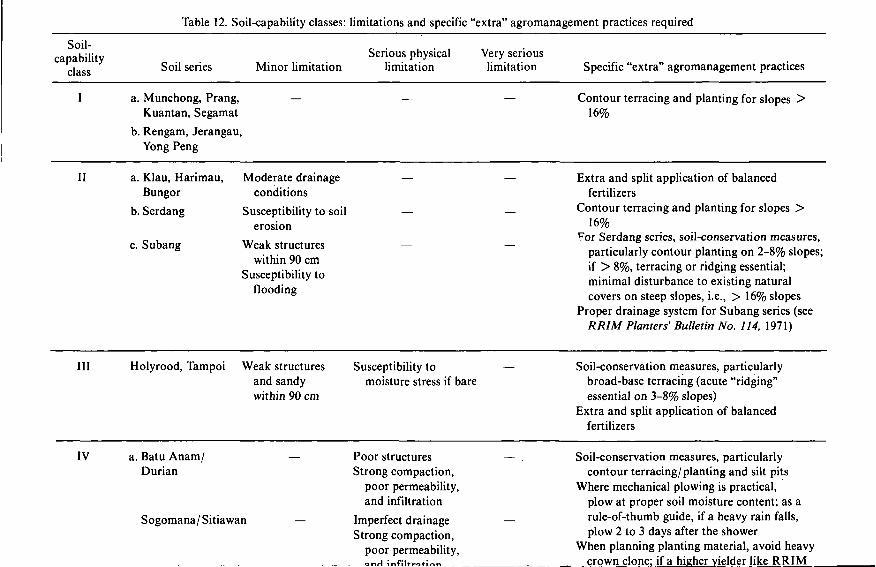
Table 12. Soil-capability classes: limitations and specific "extra" agromanagement practices required
Soil-capability
class
Serious physical Very seriousSoil series Minor limitation limitation limitation Specific "extra" agromanagement practices
I a. Munchong, Prang,Kuantan, Segamat
b. Rengam, Jerangau,Yong Peng
Contour terracing and planting for slopes >16%
II a. Klau, Harimau,Bungor
b. Serdang
c. Subang
Moderate drainageconditions
Susceptibility to soilerosion
Weak structureswithin 90 cm
Susceptibility toflooding
Extra and split application of balancedfertilizers
Contour terracing and planting for slopes >16%
^or Serdang series, soil-conservation measures,particularly contour planting on 2-8% slopes;if > 8%, terracing or ridging essential;minimal disturbance to existing naturalcovers on steep slopes, i.e., > 16% slopes
Proper drainage system for Subang series (seeRRIM Planters' Bulletin No. 114, 1971)
III Holyrood, Tampoi Weak structuresand sandywithin 90 cm
Susceptibility tomoisture stress if bare
Soil-conservation measures, particularlybroad-base terracing (acute "ridging"essential on 3-8% slopes)
Extra and split application of balancedfertilizers
IV a. Batu Anam/Durian
Sogomana/ Sitiawan
Poor structuresStrong compaction,
poor permeability,and infiltration
Imperfect drainageStrong compaction,
poor permeability,QnH infiltration
Soil-conservation measures, particularlycontour terracing/ planting and silt pits
Where mechanical plowing is practical,plow at proper soil moisture content; as arule-of-thumb guide, if a heavy rain falls,plow 2 to 3 days after the shower
When planning planting material, avoid heavycrown clone; if a higher vielder like RRIM
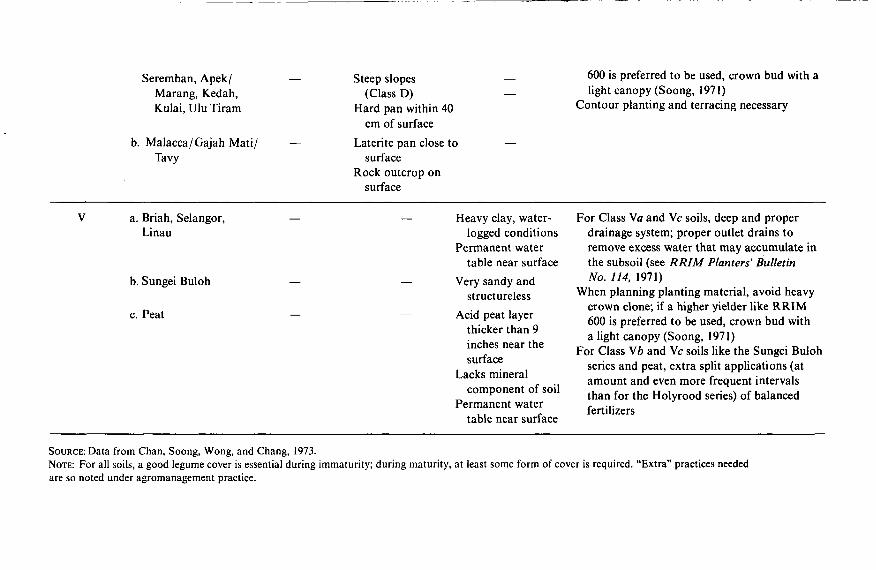
Seremban, Apek/Marang, Kedah,Kulai, Ulu Tiram
b. Malacca/Gajah Mati/Tavy
Steep slopes(Class D)
Hard pan within 40cm of surface
Laterite pan close tosurface
Rock outcrop onsurface
600 is preferred to be used, crown bud with alight canopy (Soong, 1971)
Contour planting and terracing necessary
a. Briah, Selangor,Linau
b. Sungei Buloh
c. Peat
Heavy clay, water-logged conditions
Permanent watertable near surface
Very sandy andstructureless
Acid peat layerthicker than 9inches near thesurface
Lacks mineralcomponent of soil
Permanent watertable near surface
For Class Va and Vc soils, deep and properdrainage system; proper outlet drains toremove excess water that may accumulate inthe subsoil (see RRIM Planters' BulletinNo. 114, 1971)
When planning planting material, avoid heavycrown clone; if a higher yielder like RRIM600 is preferred to be used, crown bud witha light canopy (Soong, 1971)
For Class Vb and Vc soils like the Sungei Bulohseries and peat, extra split applications (atamount and even more frequent intervalsthan for the Holyrood series) of balancedfertilizers
SOURCE: Data from Chan, Soong, Wong, and Chang, 1973.NOTE: For all soils, a good legume cover is essential during immaturity; during maturity, at least some form of cover is required. "Extra" practices neededare so noted under agromanagement practice.
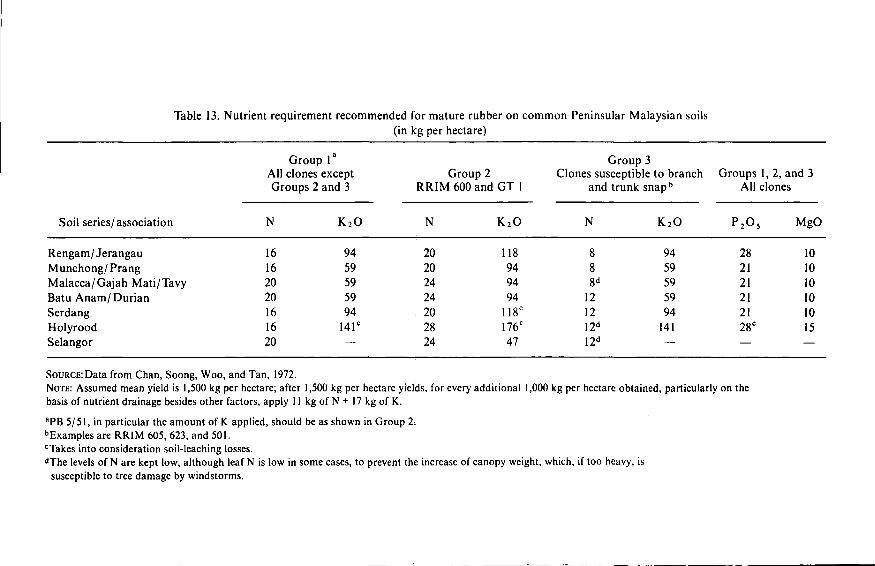
Table 13. Nutrient requirement recommended for mature rubber on common Peninsular Malaysian soils
(in kg per hectare)
Soil series/association
Rengam/ JerangauMunchong /Prang
Malacca/Gajah Mati /TavyBatu A n a m / D u r i a nSerdang
HolyroodSelangor
AllGroup l a
clones exceptGroups 2 and 3
N
16162020161620
K2O
9459595994
141C
—
Group 2R R I M 600 and
N
20202424202824
GT 1
K2O
118949494
118C
176C
47
Group 3Clones susceptible to branch
and trunk s n a p b
N
888d
121212"
K2O
9459595994
141—
GroupsAll
P 2 O :
282121212128C
—
1,2, and 3clones
, MgO
101010101015—
SOURCE: Data from Chan, Soong, Woo, and Tan, 1972.NOTE: Assumed mean yield is 1,500 kg per hectare; after 1,500 kg per hectare yields, for every additional 1,000 kg per hectare obtained, particularly on thebasis of nutrient drainage besides other factors, apply 11 kg of N + 17 kg of K.
aPB 5/51, in particular the amount of K. applied, should be as shown in Group 2.•"Examples are RRIM 605, 623, and 501.cTakes into consideration soil-leaching losses.dThe levels of N are kept low, although leaf N is low in some cases, to prevent the increase of canopy weight, which, if too heavy, is
susceptible to tree damage by windstorms.

63
40 80
l£?5%££] Class V
Fig. 3. Reconnaissance map of soil suitability for rubber in Peninsular Malaysia. Excludes areaslow under rice cultivation. (Source: Pushparajah and Chan, 1973)
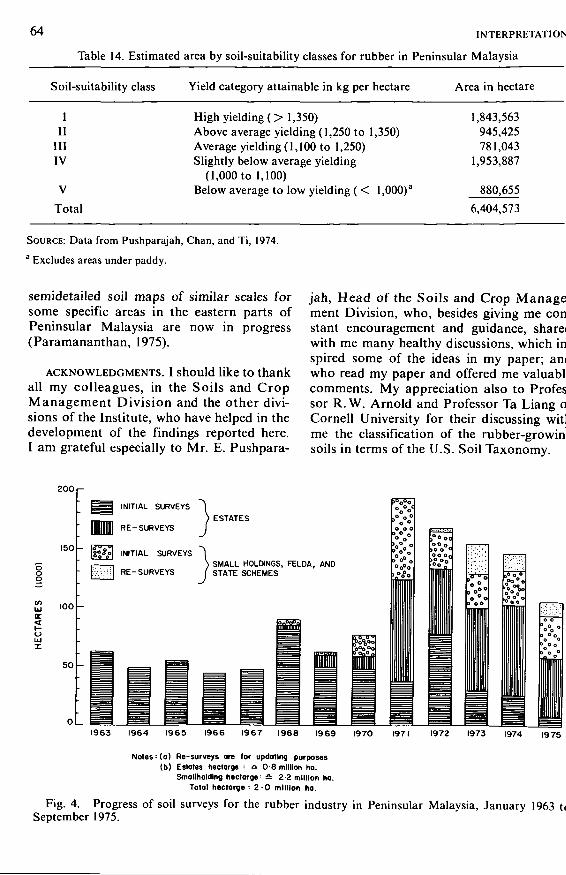
64 INTERPRETATION
Table 14. Estimated area by soil-suitability classes for rubber in Peninsular Malaysia
Soil-suitability class Yield category attainable in kg per hectare Area in hectare
III
IIIIV
V
Total
High yielding ( > 1,350)Above average yielding (1,250 to 1,350)Average yielding (1,100 to 1,250)Slightly below average yielding
(1,000 to 1,100)Below average to low yielding ( < l,000)a
1,843,563945,425781,043
1,953,887
880,6556,404,573
SOURCE: Data from Pushparajah, Chan, and Ti, 1974.a Excludes areas under paddy.
semidetailed soil maps of similar scales forsome specific areas in the eastern parts ofPeninsular Malaysia are now in progress(Paramananthan, 1975).
ACKNOWLEDGMENTS. I should like to thankall my colleagues, in the Soils and CropManagement Division and the other divi-sions of the Institute, who have helped in thedevelopment of the findings reported here.I am grateful especially to Mr. E. Pushpara-
jah, Head of the Soils and Crop Management Division, who, besides giving me con'stant encouragement and guidance, share(with me many healthy discussions, which inispired some of the ideas in my paper; amwho read my paper and offered me valuablcomments. My appreciation also to Professor R.W. Arnold and Professor Ta Liang oCornell University for their discussing wit!me the classification of the rubber-growinjsoils in terms of the U.S. Soil Taxonomy.
o
8muirr
oUJI
200
150
100
50
O L
INITIAL SURVEYS
RE-SURVEYS
%Sc\ INITIAL SURVEYS
p ï ï l RE-SURVEYS
I ESTATES
> SMALL HOLDINGS, FELDA, ANDSTATE SCHEMES
1963 1964 1965 1966 1967 1968 1969 1970 1972 1973 1974 1975
Notes: (o) Re-surveys ore for updotlng. purposes(b) Estates hectarge : ^ 0 8 million ho.
Smallholding hectorge: £ 2 2 million ha.Total hectarge • 2 0 million ha.
Fig. 4. Progress of soil surveys for the rubber industry in Peninsular Malaysia, January 1963 t(September 1975.
;HAN 65
The valuable comments of Dr. E. K. Ng, Board of the Rubber Research Institute ofDeputy Director of the Rubber Research In- Malaysia for giving me permission to presentstitute of Malaysia, are also gratefully ac- this paper and for the constant encourage-knowledged. ment I received from the Director.
Finally, I wish to thank the Director and
Literature Cited
CHAN, H. Y. 1971. Soil and leaf nutrient surveys for discriminatory fertilizer use in West Malaysianrubber holdings. Proc. Rubb. Res. Inst. Malaysia, Plrs' Conf., Kuala Lumpur, p. 201.
CHAN, H.Y. 1975. Soil taxonomy and soils under Hevea in Peninsular Malaysia. Master's Thesis.Cornell University.
CHAN, H. Y., and E. PUSHPARAJAH. 1972. Productivity potentials of mature Hevea on West Malaysiansoils. Proc. Rubb. Res. Inst. Malaysia, Plrs' Conf., Kuala Lumpur, p. 97.
CHAN, H.Y., Ë. PUSHPARAJAH, F. K. YEW, and ZAINOL EUSOF. 1975. A soil suitability technical group-ing system for Hevea. Paper presented at the Third ASEAN Soils Conference, Kuala Lumpur, Ma-
I laysia, on 1-5 December 1975.CHAN, H.Y., and K. RATNASINGAM. 1973. Use of chemical indices for classification of soils under
Hevea in Peninsular Malaysia. Proc. Malaysian Soc. Soil Sei. Conf. on Fertility and Chemistry ofTropical Soils, Kuala Lumpur, p. 172.
CHAN, H.Y., N.K. SOONG, C.B. WONG, and A.K. CHANG. 1973. Management of soils under Hevea inWest Malaysia. Proc. Rubb. Res. Inst. Malaysia, Plrs' Conf., Kuala Lumpur, p. 243.
CHAN, H. Y., N. K. SOONG, Y. K. WOO, and K. H. TAN. 1972. Manuring in relation to soil series in Westt Malaysian mature rubber growing plantations. Proc. Rubb. Res. Inst. Malaysia, Plrs' Conf., Kuala• Lumpur, p. 127.CHAN, H.Y., C.B. WONG, E. PUSHPARAJAH, and K. SIVANADYAN. 1974. The influence of soil morphol-
ogy and physiography in the leaf nutrient status and performance of Hevea. Proc. Rubb. Res. Inst.Malaysia, Plrs' Conf., Kuala Lumpur, p. 115.
GUHA, M.M. 1969. Recent advances in fertilizer usage for rubber in Malaya. J. Rubb. Res. Inst.Malaysia 21(2): 207-216.
GUHA, M.M., N.K. SOONG, and H.Y. CHAN. 1971. Soil survey for assessing fertilizer requirement forrubber (Hevea brasiliensis). Proc. of the International Symposium on Soil Fertility Evaluation, NewDelhi, vol. l ,p. 427.
GUHA, M.M., and K. H. YEOW. 1966. Content of major nutrients in rubber-growing soils of Malaya.Proc. of the 2nd Malay. Soil Conf., Kuala Lumpur, p. 171.
Ho, C. Y. 1974. Private communication. Rubb. Res. Inst. Malaysia.Ho, C. Y., H.Y. CHAN, and T. M. LIM. 1974. Enviromax planting recommendations—a new concept in
choice of clones. Proc. Rubb. Res. Inst. Malaysia, Plrs' Conf., Kuala Lumpur, p. 293.KANAPATHY, K., and S. THAMBOO. 1970. West Malaysian soils in relation to cocoa. In E.G. Blencowe,
and J.W. Blencowe (ed.) Crop diversification in Malaysia. The Incorporated Society of Planters,Kuala Lumpur.
LAW, W. M., and K. SELVADURAI. 1968. The 1968 reconnaissance soil map of Malaya. Proc. 3rd Malay-sian Soil Conf., p. 229.
LEE, P.C., and W.P. PANTON. 1971. First Malaysia plan land capability classification report, WestMalaysia, Kuala Lumpur. Economic Planning Unit, Prime Minister's Department.
NG, S. K. 1968. Soil suitability for oil palm. p. 11. In P.D. Turner (ed.) Oil palm developments in Malay-sia. The Incorporated Society of Planters, Kuala Lumpur.
NG, S.K., and W.M. LAW. 1971. Pedogenesis and soil fertility in West Malaysia. Proc. Bandung Symp.Soils and Tropical Weathering, UNESCO, Paris, p. 129.
PARAMANANTHAN, S. 1975. Private communication.PUSHPARAJAH, E., and H.Y. CHAN. 1973. Optimization of land use for perennial crops in West Malay-
sia. Proc. Symp. Natl. Utiliz. Land Resour. Malaysia, p. 7.PUSHPARAJAH, E., H.Y. CHAN, and T.C. Ti. 1974. Optimization of land use for rubber and oil palm.
Proc. Rubb. Res. Inst. Malaysia, Plrs' Conf., Kuala Lumpur, p. 72.
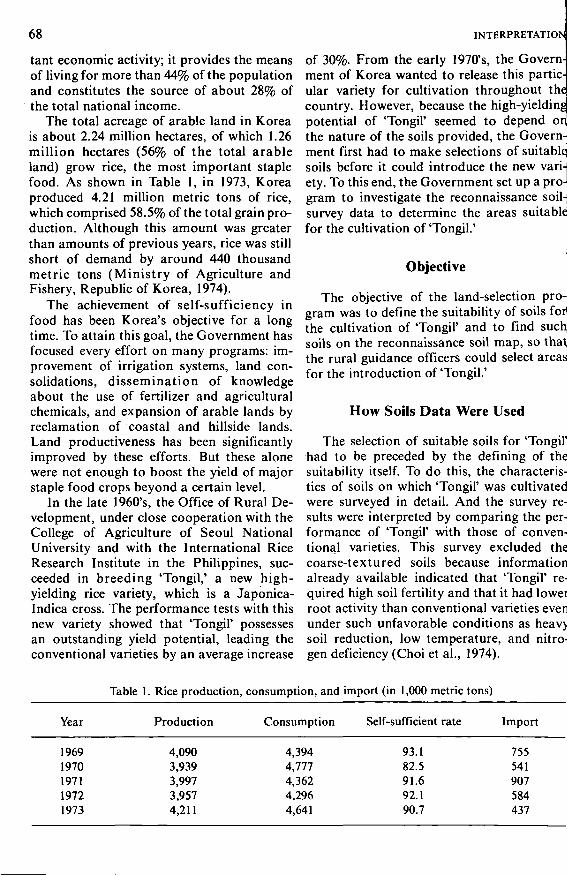
68 INTERPRETATION
tant economic activity; it provides the meansof living for more than 44% of the populationand constitutes the source of about 28% ofthe total national income.
The total acreage of arable land in Koreais about 2.24 million hectares, of which 1.26million hectares (56% of the total arableland) grow rice, the most important staplefood. As shown in Table 1, in 1973, Koreaproduced 4.21 million metric tons of rice,which comprised 58.5% of the total grain pro-duction. Although this amount was greaterthan amounts of previous years, rice was stillshort of demand by around 440 thousandmetric tons (Ministry of Agriculture andFishery, Republic of Korea, 1974).
The achievement of self-sufficiency infood has been Korea's objective for a longtime. To attain this goal, the Government hasfocused every effort on many programs: im-provement of irrigation systems, land con-solidations, dissemination of knowledgeabout the use of fertilizer and agriculturalchemicals, and expansion of arable lands byreclamation of coastal and hillside lands.Land productiveness has been significantlyimproved by these efforts. But these alonewere not enough to boost the yield of majorstaple food crops beyond a certain level.
In the late 1960's, the Office of Rural De-velopment, under close cooperation with theCollege of Agriculture of Seoul NationalUniversity and with the International RiceResearch Institute in the Philippines, suc-ceeded in breeding 'Tongil,' a new high-yielding rice variety, which is a Japonica-Indica cross. The performance tests with thisnew variety showed that 'Tongil' possessesan outstanding yield potential, leading theconventional varieties by an average increase
of 30%. From the early 1970's, the Govern-ment of Korea wanted to release this partic-ular variety for cultivation throughout thecountry. However, because the high-yieldingpotential of 'Tongil' seemed to depend on]the nature of the soils provided, the Governnment first had to make selections of suitable]soils before it could introduce the new vari-jety. To this end, the Government set up a pro-lgram to investigate the reconnaissance soil-jsurvey data to determine the areas suitable]for the cultivation of'Tongil.'
Objective
The objective of the land-selection pro-gram was to define the suitability of soils for!the cultivation of 'Tongil' and to find suchsoils on the reconnaissance soil map, so thatthe rural guidance officers could select areasfor the introduction of 'Tongil.'
How Soils Data Were Used i
The selection of suitable soils for 'Tongil'had to be preceded by the defining of thesuitability itself. To do this, the characteris-tics of soils on which 'Tongil' was cultivatedwere surveyed in detail. And the survey re-sults were interpreted by comparing the per-formance of 'Tongil' with those of conven-tional varieties. This survey excluded thecoarse-textured soils because informationalready available indicated that 'Tongil' re-quired high soil fertility and that it had lowerroot activity than conventional varieties everunder such unfavorable conditions as heavjsoil reduction, low temperature, and nitro-gen deficiency (Choi et al., 1974).
Table 1. Rice production, consumption, and import (in 1,000 metric tons)
Year
19691970197119721973
Production
4,0903,9393,9973,9574,211
Consumption
4,3944,7774,3624,2964,641
Self-sufficient rate
93.182.591.692.190.7
Import
755541907584437
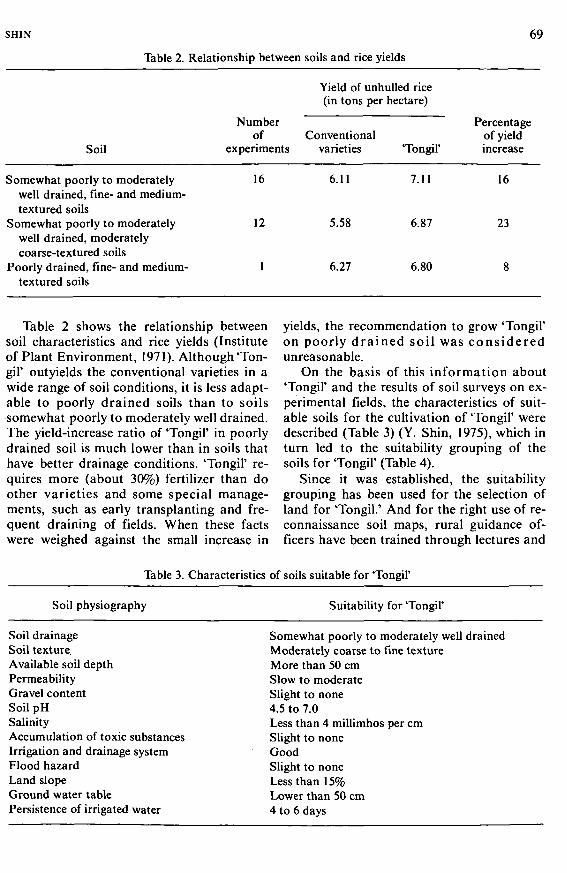
SHIN 69
Table 2. Relationship between soils and rice yields
Soil
Yield of unhulled rice(in tons per hectare)
Number Percentageof Conventional of yield
experiments varieties 'Tongil' increase
Somewhat poorly to moderatelywell drained, fine- and medium-textured soils
Somewhat poorly to moderatelywell drained, moderatelycoarse-textured soils
Poorly drained, fine- and medium-textured soils
16
12
6.11
5.58
6.27
7.11
6.87
6.80
16
23
Table 2 shows the relationship betweensoil characteristics and rice yields (Instituteof Plant Environment, 1971). Although'Ton-gil' outyields the conventional varieties in awide range of soil conditions, it is less adapt-able to poorly drained soils than to soilssomewhat poorly to moderately well drained.The yield-increase ratio of 'Tongil' in poorlydrained soil is much lower than in soils thathave better drainage conditions. 'Tongil' re-quires more (about 30%) fertilizer than doother varieties and some special manage-ments, such as early transplanting and fre-quent draining of fields. When these factswere weighed against the small increase in
yields, the recommendation to grow 'Tongil'on poorly drained soil was consideredunreasonable.
On the basis of this information about'Tongil' and the results of soil surveys on ex-perimental fields, the characteristics of suit-able soils for the cultivation of 'Tongil' weredescribed (Table 3) (Y. Shin, 1975), which inturn led to the suitability grouping of thesoils for 'Tongil' (Table 4).
Since it was established, the suitabilitygrouping has been used for the selection ofland for 'Tongil.' And for the right use of re-connaissance soil maps, rural guidance of-ficers have been trained through lectures and
Table 3. Characteristics of soils suitable for 'Tongil'
Soil physiography Suitability for 'Tongil'
Soil drainageSoil texture.Available soil depthPermeabilityGravel contentSoil pHSalinityAccumulation of toxic substancesIrrigation and drainage systemFlood hazardLand slopeGround water tablePersistence of irrigated water
Somewhat poorly to moderately well drainedModerately coarse to fine textureMore than 50 cmSlow to moderateSlight to none4.5 to 7.0Less than 4 millimhos per cmSlight to noneGoodSlight to noneLess than 15%Lower than 50 cm4 to 6 days
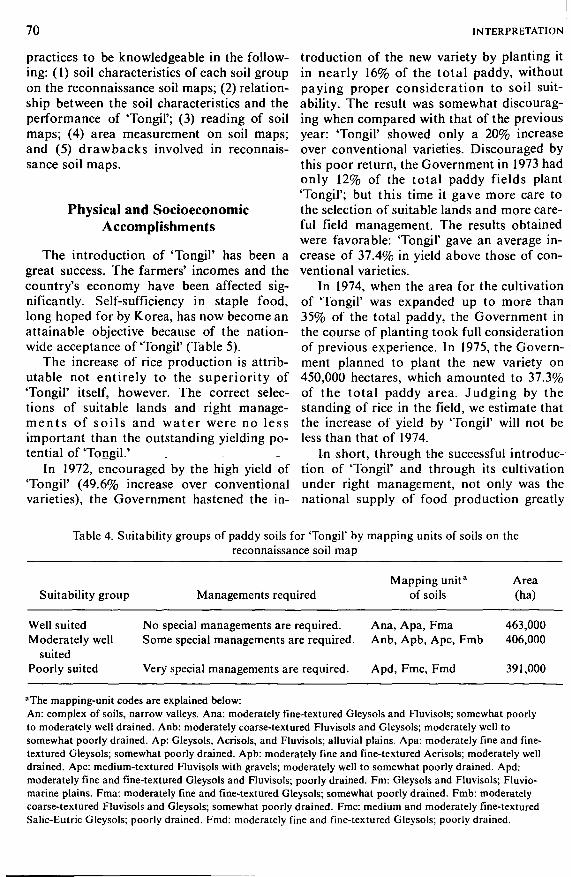
70 INTERPRETATION
practices to be knowledgeable in the follow-ing: (1) soil characteristics of each soil groupon the reconnaissance soil maps; (2) relation-ship between the soil characteristics and theperformance of 'Tongil'; (3) reading of soilmaps; (4) area measurement on soil maps;and (5) drawbacks involved in reconnais-sance soil maps.
Physical and SocioeconomicAccomplishments
The introduction of 'Tongil' has been agreat success. The farmers' incomes and thecountry's economy have been affected sig-nificantly. Self-sufficiency in staple food,long hoped for by Korea, has now become anattainable objective because of the nation-wide acceptance of 'Tongil' (Table 5).
The increase of rice production is attrib-utable not entirely to the superiority of'Tongil' itself, however. The correct selec-tions of suitable lands and right manage-ments of soils and water were no lessimportant than the outstanding yielding po-tential of 'Tongil.'
In 1972, encouraged by the high yield of'Tongil' (49.6% increase over conventionalvarieties), the Government hastened the in-
troduction of the new variety by planting itin nearly 16% of the total paddy, withoutpaying proper consideration to soil suit-ability. The result was somewhat discourag-ing when compared with that of the previousyear: 'Tongil' showed only a 20% increaseover conventional varieties. Discouraged bythis poor return, the Government in 1973 hadonly 12% of the total paddy fields plant'Tongil'; but this time it gave more care tothe selection of suitable lands and more care-ful field management. The results obtainedwere favorable: 'Tongil' gave an average in-crease of 37.4% in yield above those of con-ventional varieties.
In 1974, when the area for the cultivationof 'Tongil' was expanded up to more than35% of the total paddy, the Government inthe course of planting took full considerationof previous experience. In 1975, the Govern-ment planned to plant the new variety on450,000 hectares, which amounted to 37.3%of the total paddy area. Judging by thestanding of rice in the field, we estimate thatthe increase of yield by 'Tongil' will not beless than that of 1974.
In short, through the successful introduc-tion of 'Tongil' and through its cultivationunder right management, not only was thenational supply of food production greatly
Table 4. Suitability groups of paddy soils for 'Tongil' by mapping units of soils on thereconnaissance soil map
Suitability group Managements requiredMapping unit"
of soilsArea(ha)
Well suitedModerately well
suitedPoorly suited
No special managements are required. Ana, Apa, Fma 463,000Some special managements are required. Anb, Apb, Ape, Fmb 406,000
Very special managements are required. Apd, Fmc, Fmd 391,000
aThe mapping-unit codes are explained below:An: complex of soils, narrow valleys. Ana: moderately fine-textured Gleysols and Fluvisols; somewhat poorlyto moderately well drained. Anb: moderately coarse-textured Fluvisols and Gleysols; moderately well tosomewhat poorly drained. Ap: Gleysols, Acrisols, and Fluvisols; alluvial plains. Apa: moderately fine and fine-textured Gleysols; somewhat poorly drained. Apb: moderately fine and fine-textured Acrisols; moderately welldrained. Ape: medium-textured Fluvisols with gravels; moderately well to somewhat poorly drained. Apd:moderately fine and fine-textured Gleysols and Fluvisols; poorly drained. Fm: Gleysols and Fluvisols; Fluvio-marine plains. Fma: moderately fine and fine-textured Gleysols; somewhat poorly drained. Fmb: moderatelycoarse-textured Fluvisols and Gleysols; somewhat poorly drained. Fmc: medium and moderately fine-texturedSalic-Eutric Gleysols; poorly drained. Fmd: moderately fine and fine-textured Gleysols; poorly drained.
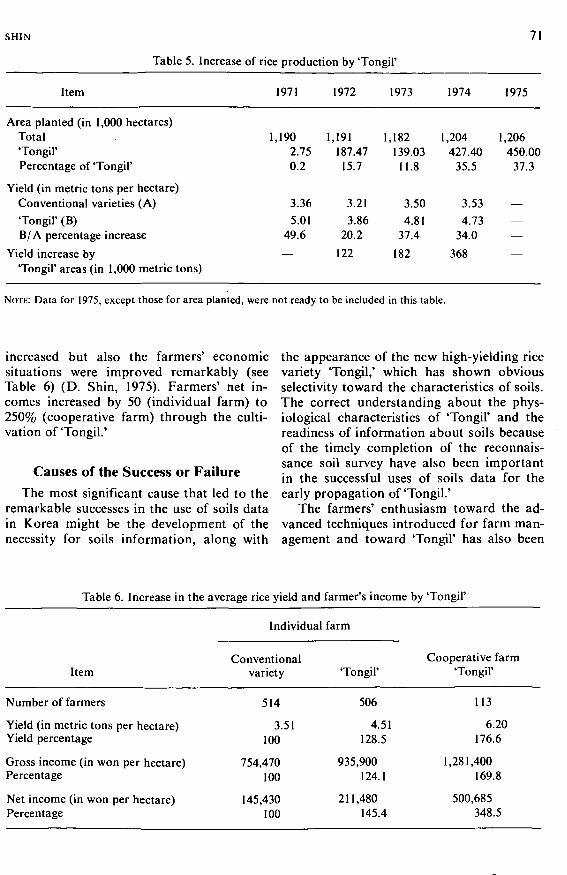
SHIN 71
Table 5. Increase of rice production by 'Tongil'
Item
Area planted (in 1,000 hectares)Total'Tongil'Percentage of 'Tongil'
Yield (in metric tons per hectare)Conventional varieties (A)
'Tongil' (B)B/A percentage increase
Yield increase by'Tongil' areas (in 1,000 metric tons)
1971
1,1902.750.2
3.36
5.0149.6
—
1972
1,191187.47
15.7
3.21
3.8620.2
122
1973
1,182139.03
11.8
3.50
4.8137.4
182
1974
1,204427.40
35.5
3.53
4.7334.0
368
1975
1,206450.00
37.3
————
NOTE: Data for 1975, except those for area planted, were not ready to be included in this table.
increased but also the farmers' economic the appearance of the new high-yielding ricesituations were improved remarkably (seeTable 6) (D. Shin, 1975). Farmers' net in-comes increased by 50 (individual farm) to250% (cooperative farm) through the culti-vation of 'Tongil.'
Causes of the Success or FailureThe most significant cause that led to the
remarkable successes in the use of soils datain Korea might be the development of thenecessity for soils information, along with
variety 'Tongil,' which has shown obviousselectivity toward the characteristics of soils.The correct understanding about the phys-iological characteristics of 'Tongil' and thereadiness of information about soils becauseof the timely completion of the reconnais-sance soil survey have also been importantin the successful uses of soils data for theearly propagation of 'Tongil.'
The farmers' enthusiasm toward the ad-vanced techniques introduced for farm man-agement and toward 'Tongil' has also been
Table 6. Increase in the average rice yield and farmer's income by 'Tongil'
Item
Number of farmers
Yield (in metric tons per hectare)Yield percentage
Gross income (in won per hectare)Percentage
Net income (in won per hectare)Percentage
Individual
Conventionalvariety
514
3.51100
754,470100
145,430100
farm
'Tongil'
506
4.51128.5
935,900124.1
211,480145.4
Cooperative farm'Tongil'
113
6.20176.6
1,281,400169.8
500,685348.5
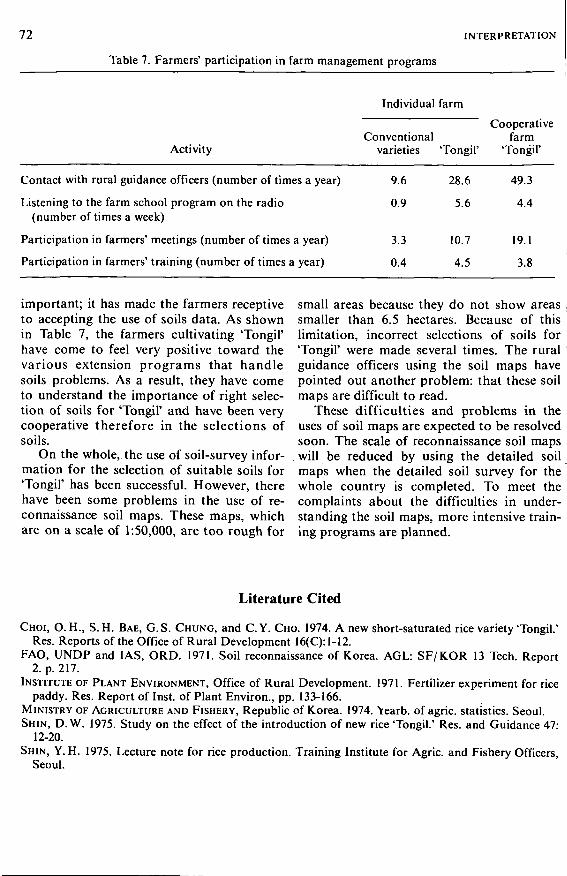
72 INTERPRETATION
Table 7. Farmers' participation in farm management programs
Individual farm
9.6
0.9
3.3
0.4
28.6
5.6
10.7
4.5
49.3
4.4
19.1
3.8
CooperativeConventional farm
Activity varieties 'Tongil' 'Tongil'
Contact with rural guidance officers (number of times a year)
Listening to the farm school program on the radio(number of times a week)
Participation in farmers' meetings (number of times a year)
Participation in farmers' training (number of times a year)
important; it has made the farmers receptive small areas because they do not show areasto accepting the use of soils data. As shown smaller than 6.5 hectares. Because of thisin Table 7, the farmers cultivating 'Tongil' limitation, incorrect selections of soils forhave come to feel very positive toward the 'Tongil' were made several times. The ruralvarious extension programs that handle guidance officers using the soil maps havesoils problems. As a result, they have come pointed out another problem: that these soilto understand the importance of right selec- maps are difficult to read,tion of soils for 'Tongil' and have been very These difficulties and problems in thecooperative therefore in the selections of uses of soil maps are expected to be resolvedsoils. soon. The scale of reconnaissance soil maps
On the whole,.the use of soil-survey infor- will be reduced by using the detailed soilmation for the selection of suitable soils for maps when the detailed soil survey for the'Tongil' has been successful. However, there whole country is completed. To meet thehave been some problems in the use of re- complaints about the difficulties in under-connaissance soil maps. These maps, which standing the soil maps, more intensive train-are on a scale of 1:50,000, are too rough for ing programs are planned.
Literature Cited
CHOI, O. H., S. H. BAE, G.S. CHUNG, and C. Y. CHO. 1974. A new short-saturated rice variety 'Tongil.'Res. Reports of the Office of Rural Development 16(C): 1-12.
FAO, UNDP and IAS, ORD. 1971. Soil reconnaissance of Korea. AGL: SF/KOR 13 Tech. Report2. p. 217.
INSTITUTE OF PLANT ENVIRONMENT, Office of Rural Development. 1971. Fertilizer experiment for ricepaddy. Res. Report of Inst. of Plant Environ., pp. 133-166.
MINISTRY OF AGRICULTURE AND FISHERY, Republic of Korea. 1974. \earb. of agric. statistics. Seoul.SHIN, D.W. 1975. Study on the effect of the introduction of new rice 'Tongil.' Res. and Guidance 47:
12-20.SHIN, Y. H. 1975. Lecture note for rice production. Training Institute for Agric. and Fishery Officers,
Seoul.
Soil-Survey Interpretations forWatershed Development
Y.P. BALI and R.L. KARALE
National Bureau of Soil Survey and Land Use PlanningMinistry of Agriculture and Irrigation, New Delhi, India.
Purposeful and practical interpretations are most important in the utilization of soil-surveydata. An attempt has been made to present efforts made in developing interpretations for land-capability units, hydrologie soil groups, paddy soil groups, and irrigation-suitability classes. Theprocedure developed for the delineation of priority watersheds, on the basis of relative erodibilityof different mapping units and their delivery ratios, has also been described. Supporting exam-ples have been given from the work carried out in the Matatilla catchment in Madhya Pradesh.Illustrations indicating the utility of basic soil-survey data in determining cost-benefit ratios ofdifferent development efforts have also been given for two areas, "A" and "B," in north centralIndia. Having an overall cost-benefit ratio of 3.5, Area B has greater potential for developmentthan Area A, which has an overall cost-benefit ratio of 2.7.
Modern soil surveys are designed to pro-vide scientific information about soils: theircharacteristics, classifications and delinea-tions of location, and extent on suitablemaps. Each kind of soil is defined in terms ofa specific set of characteristics and qualitiesthat can be observed, measured, and esti-mated. But the ultimate objective of anysoil-survey program is utilitarian; the practi-cal and purposeful application or interpreta-tion of soil-survey data is for a specific useor for a number of varied uses. Aandahl(1958) defined soil-survey interpretations as"the organisation and presentation of knowl-edge about characteristics, qualities andbehaviour of soils as they are classified andoutlined on maps."
Basis for Interpretation
The use potential of a soil is governed bya unique set of characteristics and qualities.
Soil characteristics refer to such directly ob-servable features as soil color, texture, struc-ture, and the like, whereas soil qualitiesimply such properties as fertility, erosionhazard, permeability, and the like that areestimated or inferred.
A particular soil property or quality maybe desirable for a specific purpose that mayprove deterrent for another purpose. Forexample, somewhat excessively or excessive-ly drained soils are rated very low in theirsuitability for paddy cultivation but are ratedbest suited for having untreated steel pipeslaid out or for filter fields for septic tanks.Soil-survey interpretations, thus, are basedon the knowledge of soil properties stemmingfrom experience and research findings.
The data of research findings from labo-ratories, from greenhouse trials, or fromfield plots on a particular soil, qualified un-der an accepted system of classification, canbe successfully extended for similar soils
73
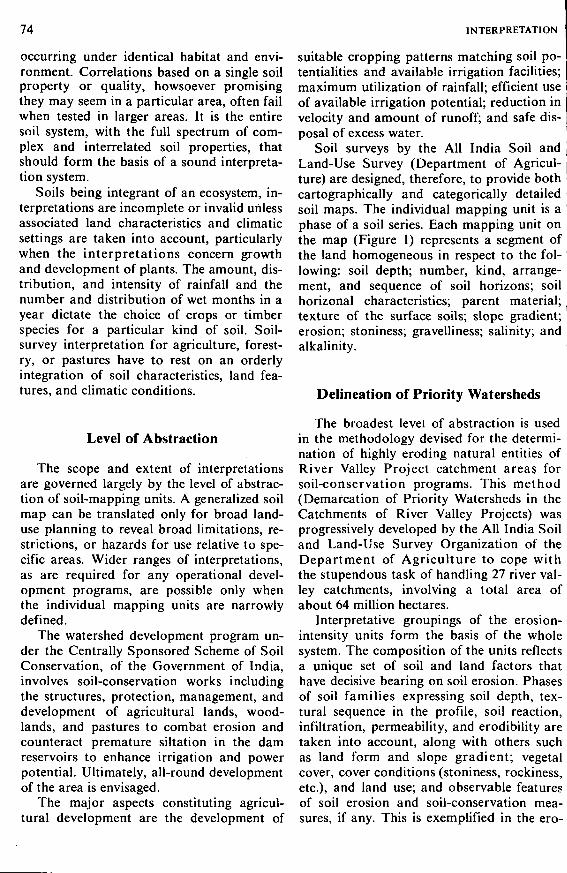
74 INTERPRETATION
occurring under identical habitat and envi-ronment. Correlations based on a single soilproperty or quality, howsoever promisingthey may seem in a particular area, often failwhen tested in larger areas. It is the entiresoil system, with the full spectrum of com-plex and interrelated soil properties, thatshould form the basis of a sound interpreta-tion system.
Soils being integrant of an ecosystem, in-terpretations are incomplete or invalid unlessassociated land characteristics and climaticsettings are taken into account, particularlywhen the interpretations concern growthand development of plants. The amount, dis-tribution, and intensity of rainfall and thenumber and distribution of wet months in ayear dictate the choice of crops or timberspecies for a particular kind of soil. Soil-survey interpretation for agriculture, forest-ry, or pastures have to rest on an orderlyintegration of soil characteristics, land fea-tures, and climatic conditions.
Level of Abstraction
The scope and extent of interpretationsare governed largely by the level of abstrac-tion of soil-mapping units. A generalized soilmap can be translated only for broad land-use planning to reveal broad limitations, re-strictions, or hazards for use relative to spe-cific areas. Wider ranges of interpretations,as are required for any operational devel-opment programs, are possible only whenthe individual mapping units are narrowlydefined.
The watershed development program un-der the Centrally Sponsored Scheme of SoilConservation, of the Government of India,involves soil-conservation works includingthe structures, protection, management, anddevelopment of agricultural lands, wood-lands, and pastures to combat erosion andcounteract premature siltation in the damreservoirs to enhance irrigation and powerpotential. Ultimately, all-round developmentof the area is envisaged.
The major aspects constituting agricul-tural development are the development of
suitable cropping patterns matching soil po-tentialities and available irrigation facilities;maximum utilization of rainfall; efficient useof available irrigation potential; reduction invelocity and amount of runoff; and safe dis-posal of excess water.
Soil surveys by the All India Soil andLand-Use Survey (Department of Agricul-ture) are designed, therefore, to provide bothcartographically and categorically detailedsoil maps. The individual mapping unit is aphase of a soil series. Each mapping unit onthe map (Figure 1) represents a segment ofthe land homogeneous in respect to the fol-lowing: soil depth; number, kind, arrange-ment, and sequence of soil horizons; soilhorizonal characteristics; parent material;texture of the surface soils; slope gradient;erosion; stoniness; gravelliness; salinity; andalkalinity.
Delineation of Priority Watersheds
The broadest level of abstraction is usedin the methodology devised for the determi-nation of highly eroding natural entities ofRiver Valley Project catchment areas forsoil-conservation programs. This method(Demarcation of Priority Watersheds in theCatchments of River Valley Projects) wasprogressively developed by the All India Soiland Land-Use Survey Organization of theDepartment of Agriculture to cope withthe stupendous task of handling 27 river val-ley catchments, involving a total area ofabout 64 million hectares.
Interpretative groupings of the erosion-intensity units form the basis of the wholesystem. The composition of the units reflectsa unique set of soil and land factors thathave decisive bearing on soil erosion. Phasesof soil families expressing soil depth, tex-tural sequence in the profile, soil reaction,infiltration, permeability, and erodibility aretaken into account, along with others suchas land form and slope gradient; vegetalcover, cover conditions (stoniness, rockiness,etc.), and land use; and observable featuresof soil erosion and soil-conservation mea-sures, if any. This is exemplified in the ero-
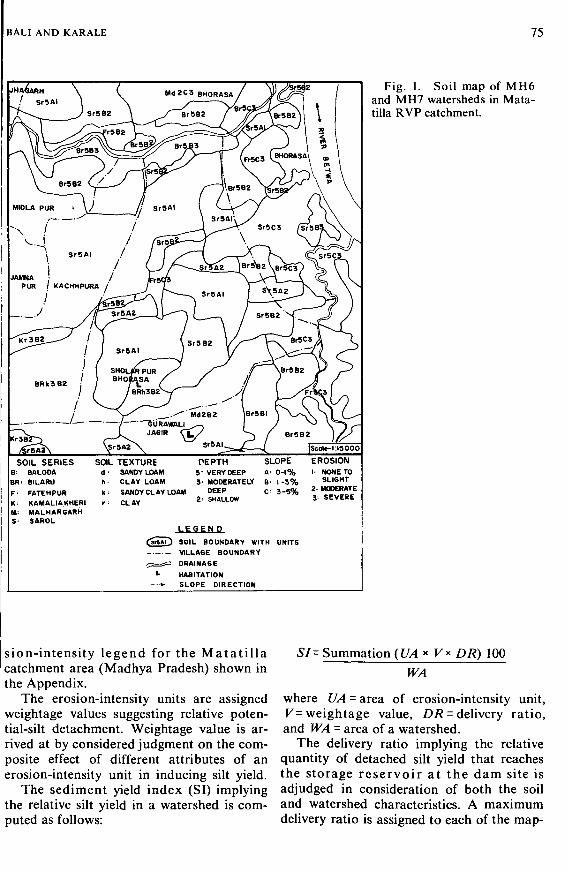
BALI AND KARALE 75
JHA4ARH
SOIL SERIES SOL TEXTURE DEPTH SLOPE EROSIONBALODA d SANDY LOAM 5 VERY DEEP A' 0 - 1 % I' NONE TO
BR< BILARU h: CLAY LOAM 3- MODERATELY B' 1 -3% Shl?ÜT.F- FATEHPUR It- SANDY CLAY LOAM DEEP Q. 3 - 5 %
K KAMALI A KHERI t- CLAYM- MALHARGARHS SAROL
LEGEN D
2 SHALLOW
SOIL BOUNDARY WITH UNITS
VILLAGE BOUNDARY
^ = s = DRAINAGE
•• HABITATION
• SLOPE DIRECTION
Z- MODERATE3. SEVERE
Fig. 1. Soil map of MH6and MH7 watersheds in Mata-tilla RVP catchment.
sion-intensity legend for the Matati l lacatchment area (Madhya Pradesh) shown inthe Appendix.
The erosion-intensity units are assignedweightage values suggesting relative poten-tial-silt detachment. Weightage value is ar-rived at by considered judgment on the com-posite effect of different attributes of anerosion-intensity unit in inducing silt yield.
The sediment yield index (SI) implyingthe relative silt yield in a watershed is com-puted as follows:
SI- Summation {UA * F* PR) 100WA
where UA - area of erosion-intensity unit,V- weightage value, DR = delivery ratio,and WA = area of a watershed.
The delivery ratio implying the relativequantity of detached silt yield that reachesthe storage reservoir at the dam site isadjudged in consideration of both the soiland watershed characteristics. A maximumdelivery ratio is assigned to each of the map-
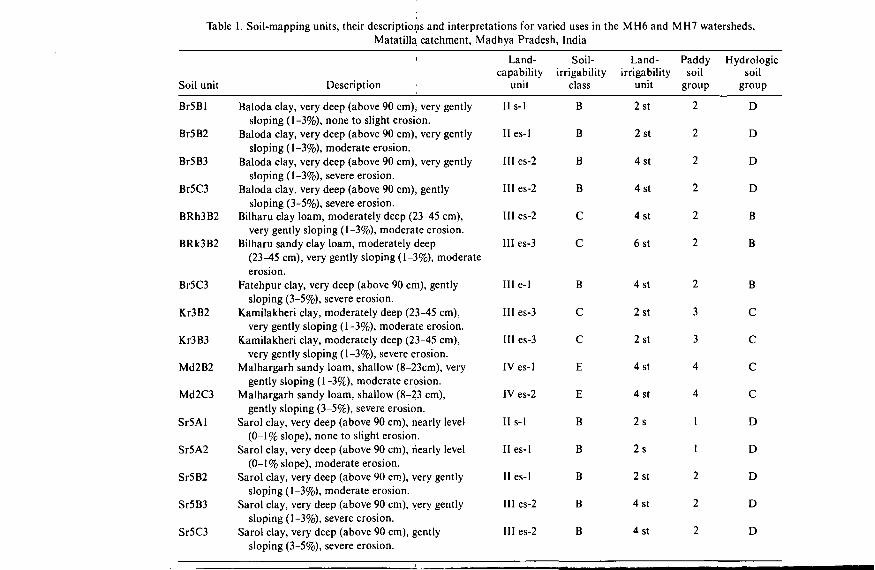
Table 1. Soil-mapping units, their descriptions and interpretations for varied uses in the MH6 and MH7 watersheds,Matatilla catchment, Madhya Pradesh, India
Soil unit Description
Land- Soil-capability irrigability
unit class
Land- Paddyirrigability soil
unit group
Hydrologiesoil
group
Br5Bl Baloda clay, very deep (above 90 cm); very gentlysloping (1-3%), none to slight erosion.
Br5B2 Baloda clay, very deep (above 90 cm), very gentlysloping (1-3%), moderate erosion.
Br5B3 Baloda clay, very deep (above 90 cm), very gentlysloping (1-3%), severe erosion.
Br5C3 Baloda clay, very deep (above 90 cm), gentlysloping (3-5%), severe erosion.
BRh3B2 Bilharu clay loam, moderately deep (23-45 cm),very gently sloping (1-3%), moderate erosion.
BRk3B2 Bilharu sandy clay loam, moderately deep(23-45 cm), very gently sloping (1-3%), moderateerosion.
Br5C3 Fatehpur clay, very deep (above 90 cm), gentlysloping (3-5%), severe erosion.
Kr3B2 Kamilakheri clay, moderately deep (23-45 cm),very gently sloping (1-3%), moderate erosion.
Kr3B3 Kamilakheri clay, moderately deep (23-45 cm),very gently sloping (1-3%), severe erosion.
Md2B2 Malhargarh sandy loam, shallow (8-23cm), verygently sloping (1-3%), moderate erosion.
Md2C3 Malhargarh sandy loam, shallow (8-23 cm),gently sloping (3-5%), severe erosion.
Sr5Al Sarol clay, very deep (above 90 cm), nearly level(0-1% slope), none to slight erosion.
Sr5A2 Sarol clay, very deep (above 90 cm), nearly level(0-1% slope), moderate erosion.
Sr5B2 Sarol clay, very deep (above 90 cm), very gentlysloping (1-3%), moderate erosion.
Sr5B3 Sarol clay, very deep (above 90 cm), very gentlysloping (1-3%), severe erosion.
Sr5C3 Sarol clay, very deep (above 90 cm), gentlysloping (3-5%), severe erosion.
IIs-1
II es-1
III es-2
III es-2
III es-2
III es-3
III e l
III es-3
III es-3
IV es-1
IV es-2
IIs-1
II es-1
II es-1
III es-2
III es-2
B
B
B
B
C
C
B
C
C
E
E
B
B
B
B
B
2 st
2st
4st
4st
4st
6 st
4st
2 st
2st
4st
4st
2s
2s
2st
4st
4st
2
2
2
2
2
2
2
3
3
4
4
1
1
2
2
2
D
D
D
D
B
B
B
C
C
C
C
D
D
D
D
D
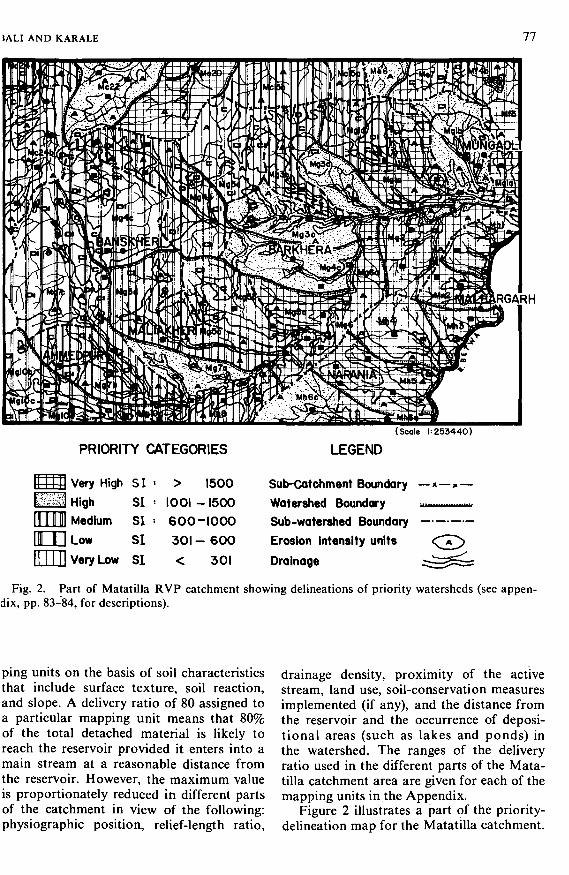
IALI AND KARALE 77
RGARH
(Scale 1=253440)
PRIORITY CATEGORIES
Very High SI •• > 1500
I High SI = 1001 -1500
Medium SI •• 600-1000
II II I Low SI 301 - 600
II 1 I II Very Low SI < 301
LEGEND
Sub-Catchment Boundary —*
Watershed Boundary -,.,
Sub-watershed Boundary
Erosion intensity units
Drainage
Fig. 2. Part of Matatilla RVP catchment showing delineations of priority watersheds (see appen-dix, pp. 83-84, for descriptions).
ping units on the basis of soil characteristicsthat include surface texture, soil reaction,and slope. A delivery ratio of 80 assigned toa particular mapping unit means that 80%of the total detached material is likely toreach the reservoir provided it enters into amain stream at a reasonable distance fromthe reservoir. However, the maximum valueis proportionately reduced in different partsof the catchment in view of the following:physiographic position, relief-length ratio,
drainage density, proximity of the activestream, land use, soil-conservation measuresimplemented (if any), and the distance fromthe reservoir and the occurrence of deposi-tional areas (such as lakes and ponds) inthe watershed. The ranges of the deliveryratio used in the different parts of the Mata-tilla catchment area are given for each of themapping units in the Appendix.
Figure 2 illustrates a part of the priority-delineation map for the Matatilla catchment.
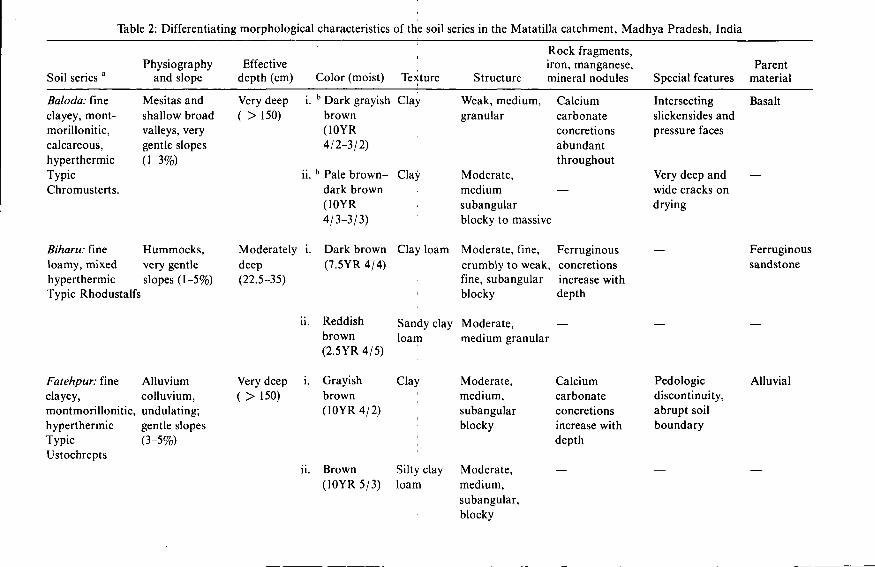
Table 2: Differentiating morphological characteristics of the soil series in the Matatilla catchment, Madhya Pradesh, India
Soil series a
Baloda: fineclayey, mont-morillonitic,calcareous,hyperthermicTypicChromusterts.
Biharu: fineloamy, mixedhyperthermicTypic Rhodustalfs
Fatehpur: fineclayey,montmorillonitic,hyperthermicTypicUstochrepts
Physiographyand slope
Mesitas andshallow broadvalleys, verygentle slopes(1-3%)
Hummocks,very gentleslopes (1-5%)
Alluviumcolluvium,undulating;gentle slopes(3-5%)
Effectivedepth (cm)
Very deep( > 150)
Moderatelydeep(22.5-35)
Very deep( > 150)
i.
ii.
i.
ii.
i.
ii.
Color (moist)b Dark grayish
brown(10YR4/2-3/2)
b Pale brown-dark brown(10YR4/3-3/3)
Dark brown(7.5YR4/4)
Reddishbrown(2.5YR4/5)
Grayishbrown(10YR4/2)
Brown(10YR5/3)
Texture
Clay
Clay
Clay loam
1
Sandy clayloam
Clay
Silty clayloam
Structure
Weak, medium,granular
Moderate,mediumsubangular
Rock fragments,iron, manganese,mineral nodules
Calciumcarbonateconcretionsabundantthroughout
—
blocky to massive
Moderate, fine, Ferruginouscrumbly to weak, concretionsfine, subangularblocky
Moderate,
increase withdepth
medium granular
Moderate,medium,subangularblocky
Moderate,medium,subangular,blocky
Calciumcarbonateconcretionsincrease withdepth
—
Special features
Intersectingslickensides andpressure faces
Very deep andwide cracks ondrying
Pédologiediscontinuity,abrupt soilboundary
—
Parentmaterial
Basalt
—
Ferruginoussandstone
Alluvial
—
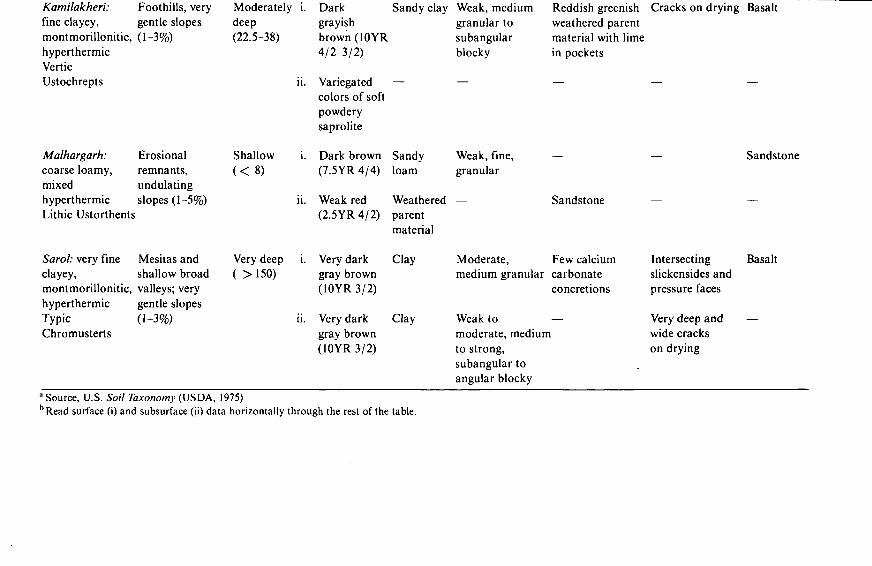
Kamilakheri:fine clayey,montmorillonitic,hyperthermicVerticUstochrepts
Malhargarh:coarse loamy,mixedhyperthermicLithic Ustorthents
Sarol: very fineclayey,montmorillonitic,hyperthermicTypicChromusterts
Foothills, verygentle slopes(1-3%)
Erosionalremnants,undulatingslopes (1-5%)
Mesitas andshallow broadvalleys; verygentle slopes(1-3%)
Moderatelydeep(22.5-38)
Shallow( < 8)
Very deep( > 150)
i.
ii.
i.
ii.
,.
ii.
Darkgrayishbrown (10YR4/2-3/2)
Variegatedcolors of softpowderysaprolite
Dark brown(7.5YR 4/4)
Weak red(2.5YR4/2)
Very darkgray brown(10YR3/2)
Very darkgray brown(10YR3/2)
Sandy clay
—
Sandyloam
Weatheredparentmaterial
Clay
Clay
Weak, mediumgranular tosubangularblocky
—
Weak, fine,granular
—
Moderate,medium granular
Weak tomoderate, mediumto strong,subangular toangular blocky
Reddish greenishweathered parentmaterial with limein pockets
—
Sandstone
Few calciumcarbonateconcretions
—
Cracks on drying Basalt
— —
— Sandstone
— —
Intersecting Basaltslickensides andpressure faces
Very deep and —wide crackson drying
a Source, U.S. Soil Taxonomy (USDA, 1975)bRead surface (i) and subsurface (ii) data horizontally through the rest of the table.
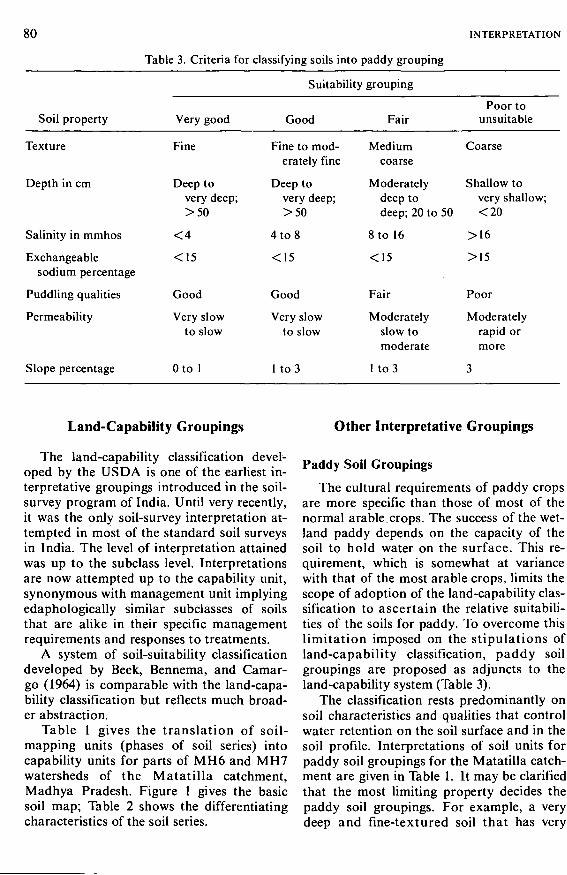
80 INTERPRETATION
Table 3. Criteria for classifying soils into paddy grouping
Soil property
Texture
Depth in cm
Salinity in tnmhos
Exchangeablesodium percentage
Puddling qualities
Permeability
Slope percentage
Very good
Fine
Deep tovery deep;>50
< 4
<15
Good
Very slowto slow
Oto 1
Suitability
Good
Fine to mod-erately fine
Deep tovery deep;>50
4 to 8
<15
Good
Very slowto slow
1 to 3
grouping
Fair
Mediumcoarse
Moderatelydeep todeep; 20 to 50
8 to 16
<15
Fair
Moderatelyslow tomoderate
1 to 3
Poor tounsuitable
Coarse
Shallow tovery shallow;<20
>16
>15
Poor
Moderatelyrapid ormore
3
Land-Capability Groupings
The land-capability classification devel-oped by the USDA is one of the earliest in-terpretative groupings introduced in the soil-survey program of India. Until very recently,it was the only soil-survey interpretation at-tempted in most of the standard soil surveysin India. The level of interpretation attainedwas up to the subclass level. Interpretationsare now attempted up to the capability unit,synonymous with management unit implyingedaphologically similar subclasses of soilsthat are alike in their specific managementrequirements and responses to treatments.
A system of soil-suitability classificationdeveloped by Beek, Bennema, and Camar-go (1964) is comparable with the land-capa-bility classification but reflects much broad-er abstraction.
Table 1 gives the translation of soil-mapping units (phases of soil series) intocapability units for parts of MH6 and MH7watersheds of the Matatilla catchment,Madhya Pradesh. Figure 1 gives the basicsoil map; Table 2 shows the differentiatingcharacteristics of the soil series.
Other Interpretative Groupings
Paddy Soil Groupings
The cultural requirements of paddy cropsare more specific than those of most of thenormal arable crops. The success of the wet-land paddy depends on the capacity of thesoil to hold water on the surface. This re-quirement, which is somewhat at variancewith that of the most arable crops, limits thescope of adoption of the land-capability clas-sification to ascertain the relative suitabili-ties of the soils for paddy. To overcome thislimitation imposed on the stipulations ofland-capability classification, paddy soilgroupings are proposed as adjuncts to theland-capability system (Table 3).
The classification rests predominantly onsoil characteristics and qualities that controlwater retention on the soil surface and in thesoil profile. Interpretations of soil units forpaddy soil groupings for the Matatilla catch-ment are given in Table 1. It may be clarifiedthat the most limiting property decides thepaddy soil groupings. For example, a verydeep and fine-textured soil that has very
BALI AND KARALE 81
slow permeability on a 4% slope would beconsidered poor for paddy cultivation be-cause of the limitation imposed by the slope.Four classes are being used in India. Furtherrefinements on the basis of new findings arepossible.
Hydrologie Soil Groups
Hydrologie soil groups are developed toestimate runoff potential of the differentsoils on the basis of properties that are di-rectly or indirectly related to soil-waterrelationships. Such properties include soildepth; number, characteristics, and thick-ness of different horizons in a profile; con-tent and type of clay; the infiltration rate;and permeability. The methodology is fullyjdescribed in an earlier publication (Ministryof Agriculture, Soil Conservation Division,1972), wherein hydrologie groupings for over200 important soil series of India are fur-nished. This information is an importantparameter in hydrologie and sedimentationstudies of watersheds.
There are four hydrologie soil groups: (1)hydrologie soil group A, characterized bylow runoff potential; (2) hydrologie soilgroup B, by moderately low runoff poten-tial; (3) hydrologie soil group C, by moder-ately high runoff potential; and (4) hydro-logic soil group D, by high runoff potential.Interpretations of taxonomie units of theMatatilla catchment into hydrologie soilgroupings are given in Table 1.
Irrigability Classification
The irrigability classification makes pos-sible the prediction of soil behavior underirrigated conditions and the estimation ofland suitability for irrigation. This classifi-cation system adopted for India has beendescribed and discussed in the Soil SurveyManual (Soil Survey Staff, 1970). Furtherelaborations of class criteria are made byRege, Bali, and Karale (1974). Following thecriteria proposed by Rege and coworkers,Table 1 shows the soil-irrigability and land-irrigability classes, as estimated from the
soil map (Figure 1) for parts of the MH6 andMH7 watersheds in the Matatilla catchment,Madhya Pradesh.
Soil Surveys in the Planning andImplementation Processes
In addition to proper utilization of a par-ticular piece of soil and land according to itscapabilities and needs, the basic facts ob-tained from different types of soil and land-use surveys provide an authentic and sci-entific inventory for decision-making byplanners and program implementers, whokeep in view other parameters of agriculturaldevelopment, such as technical, financial,and socioeconomic aspects. The basic soildata are important specifically in selectingland areas according to their responsivenessto different development programs, to theeffectiveness of alternative treatments, andto possible cost-benefit ratios.
The delineation of priority watersheds foreffective minimization of silt yield has al-ready been illustrated. Further deductionsare possible from various interpretation unitsto compute cost-benefit ratios in executingprojects. In watershed treatment and in ef-fective control of damage or deterioration,reduction in unit silt yield per unit area perunit of investment could be suitably deter-mined. For example, two identical silt-yield-ing watersheds may need different magni-tudes of costly structural treatments andcheaper vegetative measures or their combi-nations. Watersheds having a more promis-ing cost-benefit ratio could merit preferentialimplementation of the program.
For agricultural development programs,basic soils and land data could be processedto determine quantitatively the problemareas, treatment needs, costs of implement-ing treatments on various soil and land types,additional production benefits, and otheradvantages. Examples given in Table 4 arefrom a report by Coover, Roberts, and Bali(1970); they relate to Area A and Area B innorth central India, each having an annualrainfall of about 750 mm. The physical data
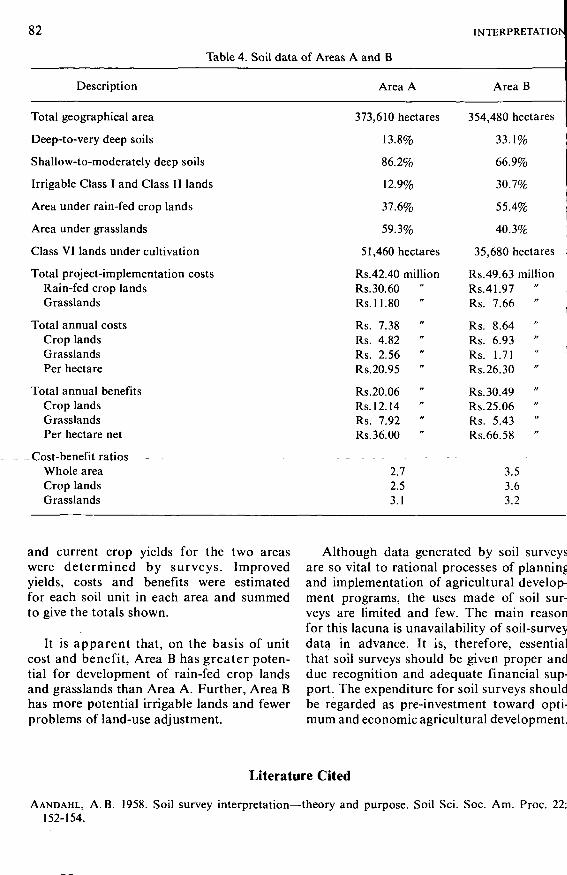
82 INTERPRETATION
Table 4.
Description
Soil data ot Areas A and B
Area A Area B
Total geographical area
Deep-to-very deep soils
Shallow-to-moderately deep soils
Irrigable Class I and Class II lands
Area under rain-fed crop lands
Area under grasslands
Class VI lands under cultivation
Total project-implementation costsRain-fed crop landsGrasslands
Total annual costsCrop landsGrasslandsPer hectare
Total annual benefitsCrop landsGrasslandsPer hectare net
- Cost-benefit ratiosWhole areaCrop landsGrasslands
373,610 hectares
13.8%
86.2%
12.9%
37.6%
59.3%
51,460 hectares
Rs.42.40 millionRs.30.60 "Rs. 11.80 "
Rs. 7.38 "Rs. 4.82 "Rs. 2.56 "Rs.20.95
Rs.20.06 "Rs.12.14Rs. 7.92 "Rs.36.00
2.72.53.1
354,480 hectares
33.1%
66.9%
30.7%
55.4%
40.3%
35,680 hectares
Rs.49.63 millionRs.41.97Rs. 7.66
Rs. 8.64Rs. 6.93 "Rs. 1.71Rs.26.30 "
Rs. 30.49 "Rs.25.06Rs. 5.43 "Rs.66.58
3.53.63.2
and current crop yields for the two areaswere determined by surveys. Improvedyields, costs and benefits were estimatedfor each soil unit in each area and summedto give the totals shown.
It is apparent that, on the basis of unitcost and benefit, Area B has greater poten-tial for development of rain-fed crop landsand grasslands than Area A. Further, Area Bhas more potential irrigable lands and fewerproblems of land-use adjustment.
Although data generated by soil surveysare so vital to rational processes of planningand implementation of agricultural develop-ment programs, the uses made of soil sur-veys are limited and few. The main reasonfor this lacuna is unavailability of soil-surveydata in advance. It is, therefore, essentialthat soil surveys should be given proper anddue recognition and adequate financial sup-port. The expenditure for soil surveys shouldbe regarded as pre-investment toward opti-mum and economic agricultural development.
Literature Cited
AANDAHL, A.B. 1958. Soil survey interpretation—theory and purpose. Soil Sei. Soc. Am. Proc. 22:152-154.
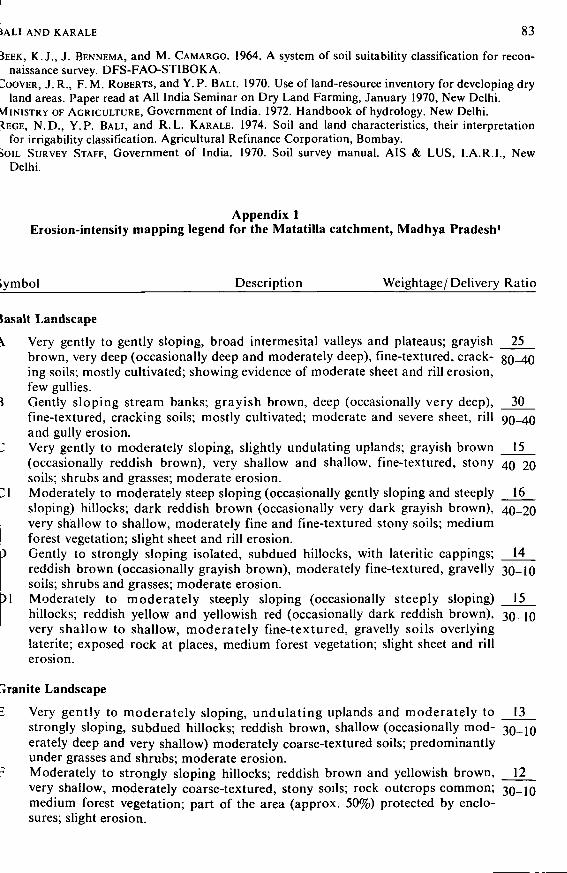
(ALI AND KARALE 83
SEEK, K.J., J. BENNEMA, and M. CAMARGO. 1964. A system of soil suitability classification for recon-naissance survey. DFS-FAO-STIBOKA.
ZOOVER, J. R., F. M. ROBERTS, and Y. P. BALI. 1970. Use of land-resource inventory for developing dryland areas. Paper read at All India Seminar on Dry Land Farming, January 1970, New Delhi.
MINISTRY OF AGRICULTURE, Government of India. 1972. Handbook of hydrology. New Delhi.iEGE, N.D., Y.P. BALI, and R. L. KARALE. 1974. Soil and land characteristics, their interpretation
for irrigability classification. Agricultural Refinance Corporation, Bombay.SOIL SURVEY STAFF, Government of India. 1970. Soil survey manual. AÏS & LUS, I.A.R.I., New
Delhi.
Appendix 1Erosion-intensity mapping legend for the Matatilla catchment, Madhya Pradesh'
lymbol Description Weightage/ Delivery Ratio
tasalt Landscape
V Very gently to gently sloping, broad intermesital valleys and plateaus; grayish 25brown, very deep (occasionally deep and moderately deep), fine-textured, crack- 80-40ing soils; mostly cultivated; showing evidence of moderate sheet and rill erosion,few gullies.
i Gently sloping stream banks; grayish brown, deep (occasionally very deep), 30fine-textured, cracking soils; mostly cultivated; moderate and severe sheet, rill 90-40and gully erosion.
Z Very gently to moderately sloping, slightly undulating uplands; grayish brown 15(occasionally reddish brown), very shallow and shallow, fine-textured, stony 40-20soils; shrubs and grasses; moderate erosion.
1 Moderately to moderately steep sloping (occasionally gently sloping and steeply 16sloping) hillocks; dark reddish brown (occasionally very dark grayish brown), 40-20very shallow to shallow, moderately fine and fine-textured stony soils; mediumforest vegetation; slight sheet and rill erosion.Gently to strongly sloping isolated, subdued hillocks, with lateritic cappings; 14reddish brown (occasionally grayish brown), moderately fine-textured, gravelly 30-10soils; shrubs and grasses; moderate erosion.
)1 Moderately to moderately steeply sloping (occasionally steeply sloping) 15hillocks; reddish yellow and yellowish red (occasionally dark reddish brown), 30-10very shallow to shallow, moderately fine-textured, gravelly soils overlyinglaterite; exposed rock at places, medium forest vegetation; slight sheet and rillerosion.
Granite Landscape
I Very gently to moderately sloping, undulating uplands and moderately to 13strongly sloping, subdued hillocks; reddish brown, shallow (occasionally mod- 3o_ioerately deep and very shallow) moderately coarse-textured soils; predominantlyunder grasses and shrubs; moderate erosion.
7 Moderately to strongly sloping hillocks; reddish brown and yellowish brown, 12very shallow, moderately coarse-textured, stony soils; rock outcrops common; 30_l0medium forest vegetation; part of the area (approx. 50%) protected by enclo-sures; slight erosion.
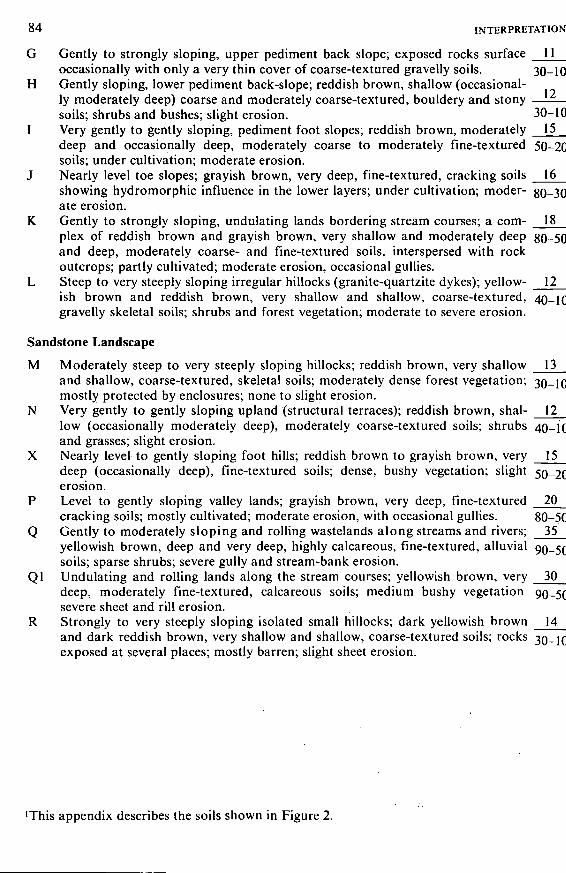
8 4 INTERPRETATION
G Gently to strongly sloping, upper pediment back slope; exposed rocks surface 11occasionally with only a very thin cover of coarse-textured gravelly soils.
H Gently sloping, lower pediment back-slope; reddish brown, shallow (occasional-ly moderately deep) coarse and moderately coarse-textured, bouldery and stonysoils; shrubs and bushes; slight erosion.
I Very gently to gently sloping, pediment foot slopes; reddish brown, moderatelydeep and occasionally deep, moderately coarse to moderately fine-textured 50-20!soils; under cultivation; moderate erosion.
J Nearly level toe slopes; grayish brown, very deep, fine-textured, cracking soils 16showing hydromorphic influence in the lower layers; under cultivation; moder- 80-30ate erosion. i
K Gently to strongly sloping, undulating lands bordering stream courses; a com- 18plex of reddish brown and grayish brown, very shallow and moderately deep 80-50and deep, moderately coarse- and fine-textured soils, interspersed with rock ioutcrops; partly cultivated; moderate erosion, occasional gullies.
L Steep to very steeply sloping irregular hillocks (granite-quartzite dykes); yellow- 12ish brown and reddish brown, very shallow and shallow, coarse-textured, 40-I0gravelly skeletal soils; shrubs and forest vegetation; moderate to severe erosion. '
Sandstone Landscape
M Moderately steep to very steeply sloping hillocks; reddish brown, very shallow 13and shallow, coarse-textured, skeletal soils; moderately dense forest vegetation; 3010mostly protected by enclosures; none to slight erosion.
N Very gently to gently sloping upland (structural terraces); reddish brown, shal- 12low (occasionally moderately deep), moderately coarse-textured soils; shrubs 40-10and grasses; slight erosion.
X Nearly level to gently sloping foot hills; reddish brown to grayish brown, very 15deep (occasionally deep), fine-textured soils; dense, bushy vegetation; slight 5Q_20
erosion.P Level to gently sloping valley lands; grayish brown, very deep, fine-textured 20
cracking soils; mostly cultivated; moderate erosion, with occasional gullies. 80-50Q Gently to moderately sloping and rolling wastelands along streams and rivers; 35
yellowish brown, deep and very deep, highly calcareous, fine-textured, alluvial 90_5(]soils; sparse shrubs; severe gully and stream-bank erosion.
Ql Undulating and rolling lands along the stream courses; yellowish brown, very 30deep, moderately fine-textured, calcareous soils; medium bushy vegetation 90-5Csevere sheet and rill erosion.
R Strongly to very steeply sloping isolated small hillocks; dark yellowish brown 14and dark reddish brown, very shallow and shallow, coarse-textured soils; rocks 3o_ioexposed at several places; mostly barren; slight sheet erosion.
'This appendix describes the soils shown in Figure 2.
Contribution of Soil-Survey Interpretation inLand Appraisal
A.J. SMYTH
Land Resources DivisionMinistry of Overseas Development, Surbiton, Surrey, England
Soil-survey interpretation is concerned with understanding and explaining the practical sig-nificance of soil differences recognized and mapped by a soil survey. It is not land classificationsince this includes other environmental and socioeconomic factors.
Most soil-survey interpretations are made in terms of general capability classifications, whichhave several weaknesses including their nonspecificity regarding crops and the absence of levelsof management information. Interpretations that are expressed as soil suitabilities for specificforms of agriculture are more useful, but the specific agronomic information that should formtheir basis is often lacking and they can serve only the broadest planning purposes. Where theseare combined with adequate agronomic information, they are of great value. The same can besaid for engineering interpretations of soils that have reached a high level of accuracy and useful-ness in the United States.
There is a growing conviction that interpretations need to be specific about purpose and siteto provide the needed basis for immediate development. Limitations of soil units for specific pur-poses based upon soil characteristics that are spatially uniform within the unit may be the mostuseful form of soil-survey interpretation for the future. The soil characteristics selected as diag-nostic should be reasonably stable unless deliberately modified by man. When they have beenwell selected, they can provide the basis for single-factor maps. A wide variety of such maps canbe invaluable to the planner.
The environmentalists, hysterical and how inadequate it may sometimes seem. Thisotherwise, have created awareness of the is what soil-survey interpretation is all aboutneed to husband the earth's land resources. —the application of existing knowledge toA need for conservation in the wisest sense, guide the acquisition of soils data and to gaininvolving maximum effective use of land and an understanding of these data for the wisea slowing—if not even a reversal—of the use of soils.trend of deteriorating land qualities. The ur- More prosaically, soil-survey interpreta-gency of this need, which we now appreciate, tion is concerned with understanding andfocuses attention on our capacity to apply ex- explaining the practical significance of soilisting scientific knowledge. Many problems differences recognized and mapped by a soilremain, and the purer forms of research must survey. Vink (1960) pointed out that soil iscontinue, but there is immediate necessity to the one environmental factor that is both sta-make use of what we already know no matter ble enough to form a base for land classifica-
85
86 INTERPRETATION
tion and, at the same time, flexible to man'sinfluence. More recently, however, Vink(1975) has also stressed that, although it isoccasionally acceptable to regard the resultsof soil surveys as the most essential part rep-resenting all other land resources, the ap-
^proach is one-sided and in several instanceshas proved disappointing because data onother aspects of land and human resourceswere lacking. In 1962, Kellogg wrote " . . . itis highly important to distinguish clearly be-tween soil-survey interpretations and landclassification." Since then other authors(Mahler et al, 1970; Maletic and Hutchings,1967; Smyth, 1972) have stressed the essen-tially contributory role of soil-survey inter-pretation in land classification, and thegreater complexity of the land concept hasbeen fully recognized in an international dis-cussion of the FAO Framework for LandEvaluation (Brinkman and Smyth, 1973).
To date, however, although conscious ef-fort seems to have been made in many coun-tries, it seems insufficient to interpret soilsurveys in ways specifically suited to integra-tion with other environmental studies. Tradi-tionally, soil-survey interpretation has beenseen as a source of planning advice in its ownright. To achieve this aim, it is usual for as-sumptions to be made regarding the follow-ing: the uniformity of other environmentalfactors, the feasibility of inputs, the expectedlevels of management, and the availability ofmarkets, access, and other factors that a soilsurvey would not normally explore. Theseassumptions seriously prejudice the practicalvalue of the interpretations since they relateto variables of great significance in land-useplanning.
It might be thought that the presenttrends towards interpretative land classifica-tion (land evaluation) by multidisciplinaryteams would eventually overtake soil-surveyinterpretation, leaving the latter with no roleto play. This does not seem likely becausethe validity of land classifications relating tovery precisely defined objectives is short-lived, especially the land classifications thathave quantitative economic bases, whichwere advocated by the international discus-sions reported by Brinkman and Smyth,
1973. Continual effort would be necessary tokeep these classifications up-to-date; there-fore, and from time to time, new use optionswould doubtless require evaluation. In eithercase, there would be a need to reexamine thebasic environmental data, and this would bemuch assisted by the availability of inter-preted information on the more stable soilcharacteristics.
It is in this context that this paper at-tempts a brief review of the art and the direc-tions in which soil-survey interpretationmight desirably go.
Soil-Survey Interpretation Today
FAO (1974) and Vink (1975) provide re-cent and fairly comprehensive and interna-tionally oriented accounts of land-appraisalmethodology including aspects of soil-surveyinterpretation. Here only a superficial andsubjective view can be given.
Much of the world's effort in soil-surveyinterpretation finds expression in some formof capability classification, and the doyen ofthese is, of course, the Land Capability Clas-sification of the Soil Conservation Service ofthe U.S. Department of Agriculture (Klinge-biel and Montgomery, 1961). This eight-classsystem is too well known to require descrip-tion. Despite its name, it is a classification ofsoils rather than land, for, by assumption,only permanent soil characteristics and cli-mate are taken as determinants. Variants ofthis U.S. system have appeared in nearly allcountries, and have been adapted to a great-er or lesser extent to meet local conditions,particularly in respect to the limitations diag-nostic of subclasses. These classificationshave proved their worth in contexts of broadplanning, particularly in making broad as-sessments of the usefulness of land in termsof agricultural versatility. The full potentialof the system has scarcely been exploitedoutside the United States, however, where,on the one hand, classification at the capa-bility-unit level (rarely used elsewhere) as-sists preparation of individual farm plansand, at the other extreme, the system hasbeen used as a basis for a national conserva-tion-needs inventory.
SMYTH
Shortcomings common to the various gen-eral capability classifications include:
1. A confusion of interpretative ob-jectives, some of which may be inconflict (e.g., relative suitability forcultivated crops; decreasing choiceof crops; increasing limitations tocultivation, especially erosion haz-ards; increasing input requirements;and actual recommendations forkinds of use). Frequently, it is impos-sible to identify which considerationshave contributed to the class desig-nations.
2. No clear indication of the specificcrops or management inputs that arethe principal concern of the classifi-cation. Increasing limitations areunderstood to narrow the range ofsuitable crops, but the crops ex-cluded are rarely stated.
3. No adequate provision for locally im-portant crops, such as wet-land riceor pasture, that differ in their opti-mum requirements from wheat,maize, and other row crops, whichusually, but not necessarily appro-priately, constitute the norm.
In some countries, development of morespecific capability classifications has beenattempted. For example, in Canada the soil-capability classification relates solely to agri-culture (McCormack, 1971). Forestry hasalso been excluded from consideration inGhana, where the capability classificationfocuses on mechanized and hand cultivationfor crop and livestock production (Obeng,1968). In Ireland, in addition to a generalsoil-suitability classification that has only sixclasses but is otherwise similar in principle tothe U.S. system, a separate classification isused, which groups soils into five use ranges.These ranges refer to the uses to which thesoils are suited under normal managementand fertilizer practice and extend from wideto extremely limited (Gardiner in FAO,1974). This extract from the general systemis of considerable interest since its meaningis unencumbered by other ideas. The userange could be especially valuable in plan-ning situations that involve competition for
87
the use of agricultural land.Another major form of interpretative ex-
pression is the suitability assessment of soilsfor specific crops or for specific kinds of agri-cultural enterprise, such as mechanized ara-ble farming or market gardening. Quiteoften these assessments are the outcome ofsoil surveys undertaken for a specific pur-pose; examples are the various surveys toidentify soils suited for cocoa in West Africaand Latin America, for coconuts on Christ-mas Island (Jenkin and Foale, 1968), or foroil palm in Gambia (Hill, 1969). At othertimes, the assessments are included in thefindings of surveys having a more generalpurpose, a notable example being the widerange of crop-suitability interpretations de-veloped in the FAO-assisted soil surveys inPakistan and Bangladesh (FAO, 1971).
Commonly, these soil-suitability assess-ments are expressed in simple three- or four-class classifications, and, in theory, the soilsare rated in terms of limitations specific tothe enterprise in question. In practice, sub-jective observation and experience play animportant part because, as Vink (1975)points out, specific information about soilrequirements of crops still tends to be vagueand difficult to find. Understandably, thesuitability interpretations themselves areoften vague and so lacking in informationabout the farming context to which they areintended to apply that they can serve onlythe broadest of planning purposes.
In the United States, the Soil Conserva-tion Service has developed a standard formatfor the computer storage of soil-survey inter-pretation data relating to each establishedsoil series. These data include predictions ofyield (under a high level of management) foreach of the more important crops grown oneach major phase of the series. These predic-tions may be thought of as a form of quanti-tative suitability assessment. The data sheetsalso include detailed interpretations, phaseby phase, of woodland suitability and recrea-tional possibilities. These interpretations, re-lating as they do to central concepts of soilsat the phase level, are well suited to contri-bute to true interpretative land classificationon specific sites, despite the assumptions
88 INTERPRETATION
about management that are at the base of thesurveys themselves. Unfortunately, the de-velopment of survey interpretations calls fora highly developed soil taxonomy and a fundof other environmental information, to whichmost other countries can now only aspire.
Another area of soil-survey interpretationin which the U.S. Soil Conservation Servicehas taken giant strides relates to engineeringuses (USDA, 1971). The data sheets for es-tablished soil series, referred to earlier, in-clude assessments of soil limitations (slight,moderate, severe) for five aspects of sanitaryfacilities (septic tanks, lagoons, and variousland-fills); for five aspects of community de-velopment (excavations, various buildings,and streets); and for lawns, landscaping, andfairways. Comments on seven aspects ofwater management are provided, and theseparate phases of the series are also evalu-ated in four classes (good, fair, poor, un-suited) as source material for road-fill, sand,gravel, and topsoil.
Evaluations of soil as source materials forconstruction have special significance in thatthey represent perhaps the only aspect of soilinterpretation that is truly independent-ofother environmental factors—at least at thesite where they are mined. At the same time,it is worth noting that the engineering char-acter, even more perhaps than the agricul-tural character, of a specific site may becritically dependent on the nature of adja-cent sites, particularly with regard to mois-ture properties.
Recognition of hazards associated withspecific soils is an especially valuable formof interpretation. The hazards might be of aphysical nature (instability, slumping, etc.)or connected with soil pests (such as nema-todes), diseases (notably root rots), or pollu-tion. The immediate and obvious value ofthese interpretations, in common with engi-neering interpretations, has the very practi-cal advantage of attracting interest andfinancing for soil surveys.
Some soil surveys in France are presentedin terms of maps designed to give a visualimpression of some of the most significant,partially interpreted characteristics of thesoils (e.g., slope, shallowness, waterlogging,
and salinity). The aim is to produce a rela-tively long-lasting document that will be in-formative to a wide range of people havingdifferent interests, although the needs ofagriculture remain in the fore (Boyer inFAO, 1974). This approach clearly has possi-bilities for contribution to the interpretationof land.
Finally, but by no means least important,reference must be made to parametric meth-ods of soil-survey interpretation. Thesemethods involve assigning numerical valuesto soil (and sometimes site) variables andmanipulating these values mathematically toderive a predictive index of productivity, of-ten expressed as a percentage of an optimumyield. The principles, advantages, and draw-backs of the major parametric methods havebeen summarized recently by Riquier (inFAO, 1974). The methods have been partic-ularly favored in the Eastern European coun-tries (Teaci and Burt, FAO, 1974). Althoughit is questionable whether these methods aremuch less subjective than traditional com-parisons, with further development, they dooffer possibilities of assisting the injection ofsoil and other -environmental data into theinterpretation of land.
More Effective Use of Soil Survey
Planning the ObjectivesConcern for the practical application of
soil-survey findings demands that we exam-ine more closely the requirements of the ulti-mate users—the farmers, land planners, en-gineers, and others. Recent attempts to do solead to the growing conviction that interpre-tations must be specific as to purpose andsite if they are to provide the needed basisfor immediate development (Brinkman andSmyth, 1973). This implies a clear departurefrom the vague and sometimes confused in-terpretations discussed in the previous sec-tion. Indeed, there is already impatience,especially amongst investment agencies andaid donors, for information that will serveimplementation rather than further broadplanning.
Broad land-resource knowledge is, never-theless, a most desirable background for in-
SMYTH 89
tensive, specific studies. How else can one besure that the most appropriate area has beenchosen for costly intensive work? How elsecan one hope to extend with confidence theexperience of the pilot area to the surround-ing country—surely the very essence ofdevelopment work? The solution to this di-lemma would seem to lie in ensuring that areconnaissance survey is performed to clearcut objectives and that it gives way to moreintensive phases of study, each with carefullyrefined objectives, as soon as the most appro-priate areas can be identified. There is noreason in principle why the various phases ofsurvey should not overlap. Thus, semide-tailed studies may have identified projectareas and given way to various intensive pre-implementation studies before the reconnais-sance is completed.
What is most important, however, is thesound development of objectives before andduring each phase of survey. To quote oncemore from Kellogg (1962): "Planning goodsoil survey interpretations, like planninggood research, depends first of all on a clearstatement of the critical questions." If theright questions are to be asked and answeredin the final stages of the study, they must bedeveloped through formulation and refine-ment and, if need be, through change of ob-jectives brought about by close and continu-ing consultation with all parties concerned inthe development.
The formulation of objectives involvesmuch more than soil-survey interpretation.Indeed, in most instances, it is to be hopedthat soil survey itself will form only part ofan integrated study. Nevertheless, soil-survey interpretation is certainly involved,and this implies that, in a survey, it is nevertoo early for interpretation to begin.
The Choice of Interpretative Criteria
Every young soil surveyor is told that heshould gather every scrap of information thathe can while in the field because it costs somuch to put him there and he may never passthat way again. Within reason this is soundadvice, but the volume of data collected canbe suffocating, especially when it is aug-
mented by laboratory analysis and theresults of field tests. The selection and sim-plification of these data for practical presen-tation have always been important aspects ofsoil-survey interpretation. They seem likelyto become more important if soil surveys areto be interpreted to provide specific, andpreferably quantitative, inputs to land classi-fication, rather than generalized capabilityor suitability groupings that can conceal awealth of unexplained complexity.
Present evidence suggests that the inter-pretative inputs that soil survey can best pro-vide will be expressed in terms of limitationsfor a given objective associated with classi-fied kinds of soil (recognizing, of course, thatwhat is a limitation for one use can be a posi-tive advantage for a different use). The limi-tations might be single soil characteristics(e.g., content of stones) or interpreted com-binations of soil characteristics (e.g., se-quence of textural horizonation), but theycould not, in themselves, have the complex-ity of land qualities (e.g., availability of soilwater, hazard of salinity), as described byBeek and Bennema (1972), since many landqualities are influenced by the character ofadjacent lands and depend, therefore, uponunique location. An understanding of thecharacteristics of the soil (or soils) involved isessential, of course, for the assessment ofland qualities, and this could well be themain contribution of soil-survey interpreta-tion in the future—a tool of the land-evalua-tion specialist rather than of the land-useplanner.
In the selection and rating of significantsoil limitations, many questions still remainunanswered. The problems involved havebeen closely studied by the authors of para-metric interpretative classifications, but theirinterest has been directed primarily to therelation between measurable soil character-istics and crop performance. Mathematicalmethods of principal component analysisshow excellent promise of being able to es-tablish these relationships objectively and ofindicating in a given instance which charac-teristics are most significant.
This is only part of the problem, however.To contribute to land evaluation, the soil
90 INTERPRETATION
characteristics selected as diagnostic must bereasonably stable unless deliberately modi-fied by man. Furthermore, if we are to usesoil maps as a basis for interpretation, thedistribution of the chosen diagnostic charac-teristics must be reasonably uniform withineach mappable unit. In fact, in an agricultur-
a l context, in choosing diagnostic soil char-acteristics, one must consider each charac-t e r i s t i c in terms of relevance to cropperformance, susceptibility to quantificationand rating, stability with time, uniformity ofdistribution in relation to mappable units,and response to improvement.
The last consideration may have littlebearing on assessing the present status ofsoil and land, but it is vital to assessment ofland potential and the prospects of change,with which land evaluation must be increas-ingly concerned.
This list of considerations strengthens theview that the best choice of diagnostic soilcharacteristics must be decided locally, forthe best choice depends not only on the de-velopment objectives in view and on thephysical characteristics of the area but alsoon the intensity of the study. For example,average values for characteristics that havevery high spatial variability (e.g., manychemical characteristics) may be diagnosti-cally useful in interpreting reconnaissancesurveys but could be highly misleading if ap-plied to soil units in a detailed study. Charac-teristics of moderate spatial variability (e.g.,microtopography), on the other hand, arelikely to be diagnostically more useful in de-tailed than in small-scale studies.
The apparent need for a fresh choice ofdiagnostic criteria in each new situation castsdoubt on the possibilities of complete successfor any universal parametric system.
Having selected the diagnostic criteriathat appear to have relevance to a number ofinterpretative purposes, I feel that there
could be merit in presenting these individual-ly in the form of single-factor maps. Compu-ter mapping can reduce to reasonable pro-portions the time and cost of producing awide variety of such maps, which would thenbe basic tools of the land classifier.
These single-factor maps would differfrom those that were made in the infancy ofsoil survey in that they would normally bederived from, and would remain equatableto, basic soil maps depicting units classifiedin a taxonomie classification and possessing,therefore, all the potential advantages of cor-relation. Occasionally, of course, single fac-tors of high practical significance can andshould be mapped separately if their distri-bution appears unrelated to the boundariesof taxonomie units (Hansell and Wall, 1974).
As a final point, I might mention that theemphasis placed on single soil characteris-tics, or simple combinations of soil charac-teristics as diagnostic in interpretation hasimplications for the requirements of soildescription. If an interpretation is to haverelevance to a soil unit as a whole, it must bebased on characteristics that pertain to all, ornearly all, parts öf that unit. We are all con-scious that the "typical" profile of a soil rare-ly occurs—the "type" profile tends to be theone that departs least seriously from the the-oretical norm. This places great importanceon preparing a summary description of themodal profile, which includes reference toall characteristics believed to typify the soilunit as a whole. Emphasis must also beplaced on describing the range of character-istics, especially in terms of horizon thick-ness, that are anticipated within the unit.Both of these provisions are foreseen in thewidely used methods advocated by the U.S.Soil Survey Manual and by the FA O Guide-lines for Soil Description, but they are gen-erally accorded lesser importance than thedetailed description of a type profile; andthey are sometimes even omitted.
Literature CitedBEEK, K.J., and J. BENNEMA. 1972. Land evaluation for agricultural land use planning: an ecological
methodology. Agric. Univ., Wageningen, The Netherlands.BRINKMAN, R., and A. J. SMYTH (ed.). 1973. Land evaluation for rural purposes. Int. ïnst. for Land Rec-
lamation and Improvement, Publication no. 17, Wageningen, The Netherlands.
SMYTH 91
FAO. 1971. Report of the FAO/UNDP soil survey project in Pakistan and Bangladesh. AGL:SF/ PAK 6Tech. Reports 1 and 2. Rome. ,
FAO. 1974. Approaches to land classification. Soils Bull. no. ,22. Rome. ^ z ' 'HANSELL, J. R. F., and J. R. D. WALL. 1974. Guadalcanal and the Florida Islands, vol. 2. Land Resource
Study no. 18. Land Resources Division, Ministry of Overseas Development, London.HILL, I. D. 1969. An assessment of the possibilities of oil palm cultivation in Western Division, the Gam-
bia. Land Resource Study no. 6. Land Resources Division, Ministry of Overseas Development,London.
JENKIN, R. N., and M. A. FOALE. 1968. An investigation of the coconut growing potential of ChristmasIsland. Land Resource Study no. 4. Land Resources Division, Ministry of Overseas Development,London.
KELLOGG, C. E. 1962. Soil surveys for use. Proc. of Commissions IV and V, Int. Soc. Soil Sei. NewZealand.
KLINGEBIEL, A.A., and P. H. MONTGOMERY. 1961. Land capability classification. Agric. Handb. no. 210.USDA, U.S. Government Printing Office, Washington, D.C.
MAHLER, P. J. (ed.) 1970. Manual of land classification for irrigation. Publ. no. 205. Soil Inst. of Iran,Teheran.
MALETIC, J .T. , and T.B. HUTCHINGS. 1967. Selection and classification of irrigable lands, pp. 125-173.In R. M. Hagan (ed.) Irrigation of agricultural lands. Agron. Monogr. 11 ASA, Madison, Wis.
MCCORMACK, R.J. 1971. The Canada land use inventory: a basis for land use planning. J. Soil WaterConserv., July-Aug., pp. 141-146.
OBENG, H.B. 1968. Land capability classification of the soils of Ghana. Trans. 9th Int. Congr. of SoilSei. vol. 4: 23.
SMYTH, A.J. 1972. Interpretative classifications of land and soil in land development. Int. Geography1972. 22nd Int. Geographical Congr., Univ. of Toronto Press, Montreal.
USDA, SCS, Soil Survey Staff. 1971. Guide for interpreting engineering uses of soils. U.S. GovernmentPrinting Office, Washington, D.C.
VINK, A. P. A. 1960. Quantitative aspects of land classification. Trans. 7th Int. Congr. of Soil Sei., vol. 4:371-378.
VINK, A. P. A. 1975. Land use in advancing agriculture. Springer-Verlag, Berlin.
PART III:USE OF SOIL-RESOURCE DATA
IN LAND-USE PLANNING
Techniques for Displaying Soils Data
G.A. NIELSEN
Department of Plant and Soil ScienceMontana State University, Bozeman, Montana, U.S.A.
Soil-survey reports are the most useful source of land-resource information available. Com-plete land-resource inventories, which might contain several hundred data, are usually too time-consuming to compile, and experience shows that much of the information gathered is neverused. Land-use planning is an interactive process that benefits from the early display of existingdata.
Methods of displaying land-resource data have a strong influence on the acceptance of thedata. Interpretative overlay maps are effective, inexpensive, and easy to prepare using resourcemaps and criteria tables developed by professionals. Electronic computer displays can be veryeffective, but they are expensive to develop and certainly not essential to good land-use planning.
A soil map of Gallatin County published in 1931 provided a satisfactory base for soil-surveyinterpretations and land classification 40 years later. Methods used in displaying the interpreta-tive data include color-coded soil-limitation maps; overlay maps showing composite soil limita-tions for several complementary uses; black-and-white maps for newspaper use; interactiveoverlay techniques integrating soil, geological, climatic, land-use, and social and economic fac-tors; the shaded-window technique; three-dimensional models; and computer graphics. Thedetermination of the costs required to overcome soil limitations is a highly effective type of soil-survey interpretation.
These interpretations can be made for, and used by, planning commissions, state and localauthorities and agencies, citizen and community associations, realtors and other land-relatedbusinesses, professional groups, schools and universities, recreational groups, and the generalpublic through the news media.
The effectiveness of these interpretations can be judged from their application, by the level ofuser interest as determined by surveys, and by the demand generated for the basic soil-surveyreports from which the interpretations were made.
Every nation, region, state, and farm has McHarg, 1969). Base-line data describe whata unique assemblage of natural resources: is, and they are used to predict what can be.soil and rocks, water and air, plants and ani- Results are displayed so audiences visualizemals. These together with social, economic, the distribution of resources and sense theand human resources determine current and land's potential.potential land use. Every land area has com- Planning goals should be based upon in-parative strengths and weaknesses. Land ventories of resources and upon economicplanners seek information on land capabili- analysis of the production potential forties and limitations (Bartelli et al., 1966; scarce commodities. Reports in which the
95
96
soils are classified, mapped, and evaluatedaccording to standard procedures are indis-pensable inventories.
This paper, based on our experiences inMontana, describes techniques used to de-liver soil-survey data to land planners, deci-sion makers, and the general public.
Background
The need for land planning is felt at alllevels from individual farmers to the authorsof national land-use policies. In the UnitedStates, federal and state laws require impactstatements for public review before majorchanges are made in the use of public lands.Land-use plans and impact statements areprepared prior to many developments rang-ing from highways and airports to dams andhousing projects. Most laws require somekind of land-resource inventory to establishconditions before development. The inven-tories are interpreted to answer questionsabout management alternatives, develop-ment consequences, social, economic, andcultural benefits and costs, and preservationof unique land areas.
World food shortages have brought re-newed commitments to all-out food produc-tion and to agricultural development. Anational assessment of prime farm lands isbeing conducted under the land-inventoryand land-monitoring program of the U.S.Soil Conservation Service. Elsewhere ques-tions are asked about land potential for cropvarieties, cropping systems, and alternativeurban land uses. Basic land-resource inven-tory data are needed to deal with all of thesequestions.
Conflicting land uses, especially in urbanareas and their rural fringes, have increasedthe demand for land-use plans. Ian McHargand Phillip Lewis, renowned planners, agreethat few, if any, inputs to a plan are moreimportant than a soil-resource inventory. Achecklist developed at Montana State Uni-versity lists 1,400 particulars that might beincluded in a land-resource inventory (Plan-tenberg et al., 1974). Nearly one-fourth (330)of these are given or can be estimated from
LAND-USE PLANNING
soil-survey reports. No other commonly avail-able source of information is as useful.
Need for Soil Data inLand-Use Planning
In response to demands for soils- andland-use information, agricultural experi-ment stations and cooperating federal agen-cies in the USDA have initiated regionalresearch projects. Ten western states arestudying Soil Interpretations and Socio-economic Criteria for Land-Use Planning.The investigators recognize the need to:(1) document impacts of urban encroach-ment on rural lands, (2) identify and organizesoil data and interpretations for present andpotential clientele, and (3) evaluate the ade-quacy of present data and develop new data;interpretations, and procedures to over-come soil limitations. General soil maps(1:1,000,000 and 1:250,000) have been devel-oped by several states as part of this effort.Hawaii is evaluating soils for specific croprequirements to rate land for agriculturalpotential. Colorado is developing land-oppor-tunity and land-limitation maps.
Ten north central states are cooperatingin a research project, called Soil Landscape^Characteristics Affecting Land-Use Planningand Rural Development. General soil maps(1:250,000) are being prepared. Additionaland-resource information (geology, topog-raphy, ground water) has been added tosoil-survey information for better soil-land-scape interpretations. Computer graphicdisplay systems for developing interpretativedata and maps are being examined as areremote sensing techniques for characterizingsoil-landscape units and for detecting soillimitations. Developing more effective meth-ods of disseminating data and interpreta-tions is a major goal of these projects.
The American Society of Agronomy(ASA) will publish a monograph to meetdemands for soil data in land-use planning.Topics considered include principles ofland-use planning; data bases (emphasis onsoils, plants, and water); modern mappingand reporting methods; remote sensing; data
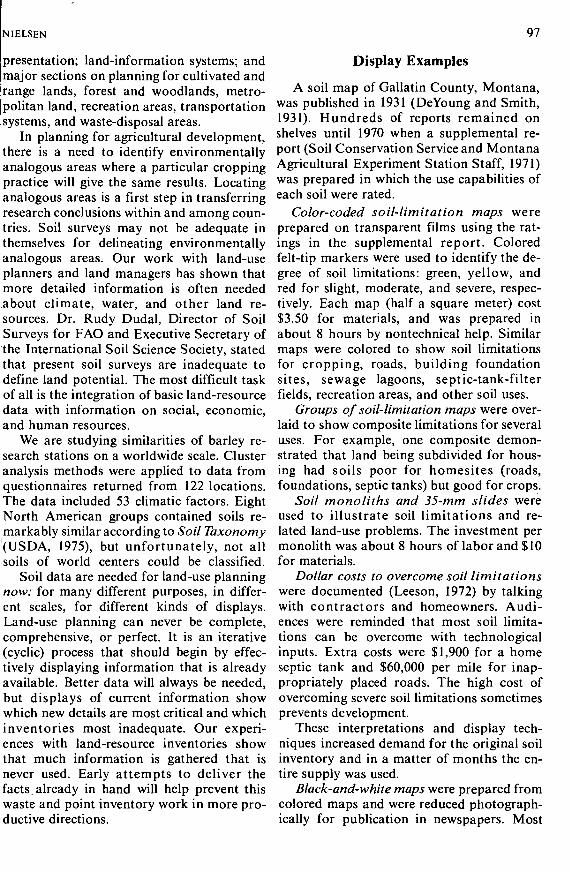
NIELSEN 97
presentation; land-information systems; andmajor sections on planning for cultivated andrange lands, forest and woodlands, metro-politan land, recreation areas, transportationsystems, and waste-disposal areas.
In planning for agricultural development,there is a need to identify environmentallyanalogous areas where a particular croppingpractice will give the same results. Locatinganalogous areas is a first step in transferringresearch conclusions within and among coun-tries. Soil surveys may not be adequate inthemselves for delineating environmentallyanalogous areas. Our work with land-useplanners and land managers has shown thatmore detailed information is often neededabout climate, water, and other land re-sources. Dr. Rudy Dudal, Director of SoilSurveys for FAO and Executive Secretary ofthe International Soil Science Society, statedthat present soil surveys are inadequate todefine land potential. The most difficult taskof all is the integration of basic land-resourcedata with information on social, economic,and human resources.
We are studying similarities of barley re-search stations on a worldwide scale. Clusteranalysis methods were applied to data fromquestionnaires returned from 122 locations.The data included 53 climatic factors. EightNorth American groups contained soils re-markably similar according to Soil Taxonomy(USDA, 1975), but unfortunately, not allsoils of world centers could be classified.
Soil data are needed for land-use planningnow: for many different purposes, in differ-ent scales, for different kinds of displays.Land-use planning can never be complete,comprehensive, or perfect. It is an iterative(cyclic) process that should begin by effec-tively displaying information that is alreadyavailable. Better data will always be needed,but displays of current information showwhich new details are most critical and whichinventories most inadequate. Our experi-ences with land-resource inventories showthat much information is gathered that isnever used. Early attempts to deliver thefacts. already in hand will help prevent thiswaste and point inventory work in more pro-ductive directions.
Display Examples
A soil map of Gallatin County, Montana,was published in 1931 (DeYoung and Smith,1931). Hundreds of reports remained onshelves until 1970 when a supplemental re-port (Soil Conservation Service and MontanaAgricultural Experiment Station Staff, 1971)was prepared in which the use capabilities ofeach soil were rated.
Color-coded soil-limitation maps wereprepared on transparent films using the rat-ings in the supplemental report. Coloredfelt-tip markers were used to identify the de-gree of soil limitations: green, yellow, andred for slight, moderate, and severe, respec-tively. Each map (half a square meter) cost$3.50 for materials, and was prepared inabout 8 hours by nontechnical help. Similarmaps were colored to show soil limitationsfor cropping, roads, building foundationsites, sewage lagoons, septic-tank-filterfields, recreation areas, and other soil uses.
Groups of soil-limitation maps were over-laid to show composite limitations for severaluses. For example, one composite demon-strated that land being subdivided for hous-ing had soils poor for homesites (roads,foundations, septic tanks) but good for crops.
Soil monoliths and 35-mm slides wereused to illustrate soil limitations and re-lated land-use problems. The investment permonolith was about 8 hours of labor and $10for materials.
Dollar costs to overcome soil limitationswere documented (Leeson, 1972) by talkingwith contractors and homeowners. Audi-ences were reminded that most soil limita-tions can be overcome with technologicalinputs. Extra costs were $1,900 for a homeseptic tank and $60,000 per mile for inap-propriately placed roads. The high cost ofovercoming severe soil limitations sometimesprevents development.
These interpretations and display tech-niques increased demand for the original soilinventory and in a matter of months the en-tire supply was used.
Black-and-white maps were prepared fromcolored maps and were reduced photograph-ically for publication in newspapers. Most
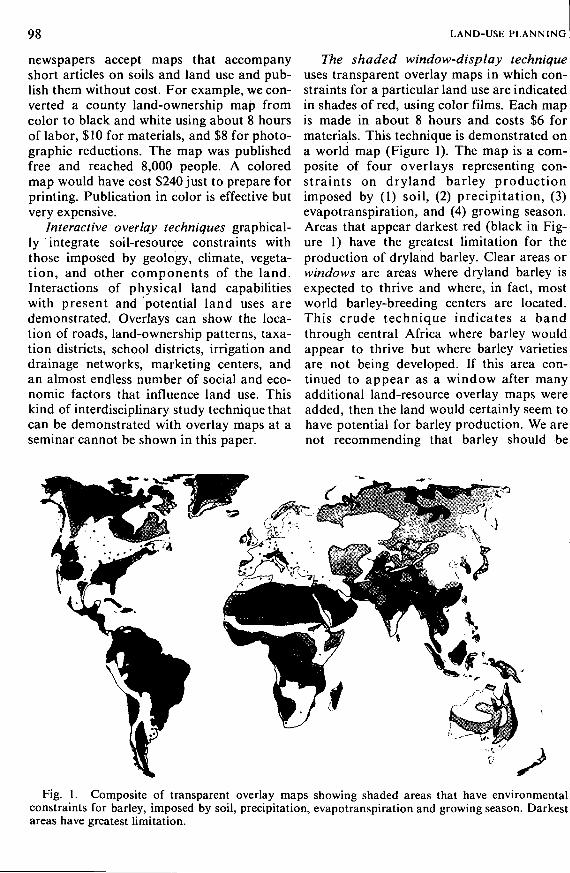
98 LAND-USE PLANNING
newspapers accept maps that accompanyshort articles on soils and land use and pub-lish them without cost. For example, we con-verted a county land-ownership map fromcolor to black and white using about 8 hoursof labor, $10 for materials, and $8 for photo-graphic reductions. The map was publishedfree and reached 8,000 people. A coloredmap would have cost $240 just to prepare forprinting. Publication in color is effective butvery expensive.
Interactive overlay techniques graphical-ly integrate soil-resource constraints withthose imposed by geology, climate, vegeta-tion, and other components of the land.Interactions of physical land capabilitieswith present and potential land uses aredemonstrated. Overlays can show the loca-tion of roads, land-ownership patterns, taxa-tion districts, school districts, irrigation anddrainage networks, marketing centers, andan almost endless number of social and eco-nomic factors that influence land use. Thiskind of interdisciplinary study technique thatcan be demonstrated with overlay maps at aseminar cannot be shown in this paper.
The shaded window-display techniqueuses transparent overlay maps in which con-straints for a particular land use are indicatedin shades of red, using color films. Each mapis made in about 8 hours and costs $6 formaterials. This technique is demonstrated ona world map (Figure 1). The map is a com-posite of four overlays representing con-straints on dryland barley productionimposed by (1) soil, (2) precipitation, (3)evapotranspiration, and (4) growing season.Areas that appear darkest red (black in Fig-ure 1) have the greatest limitation for theproduction of dryland barley. Clear areas orwindows are areas where dryland barley isexpected to thrive and where, in fact, mostworld barley-breeding centers are located.This crude technique indicates a bandthrough central Africa where barley wouldappear to thrive but where barley varietiesare not being developed. If this area con-tinued to appear as a window after manyadditional land-resource overlay maps wereadded, then the land would certainly seem tohave potential for barley production. We arenot recommending that barley should be
Fig. 1. Composite of transparent overlay maps showing shaded areas that have environmentalconstraints for barley, imposed by soil, precipitation, evapotranspiration and growing season. Darkestareas have greatest limitation.
NIELSEN 99
Fig. 2. Model of environmental differencesamong Montana Agricultural Experiment Sta-tions.
produced in this area, however, becausesocial, economic, and human considerationssuch as capital requirements, markets ,health, transportation, education, and own-ership were not evaluated. These constraintsare more difficult to evaluate than land-resource constraints.
Three-dimensional models can also beconstructed to demonstrate environmentaldifferences between land areas. Figure 2, aphotograph of such a model, shows environ-mental differences among agriculturalexperiment stations in Montana. The balllabeled Hu represents the site that is environ-mentally the most different from other sites.It would be risky to extend experimental re-sults from here to other stations withoutfurther testing. Two sites that appear nearthe same point in the model could exchangeresearch results with some confidence thattheir environments are alike. Materials inthe model cost less than a dollar.
Electronic computers can save time whenhelp is scarce. We record data in the field onmark-sense forms. Computers write descrip-tions of soil pedons and mapping units andrate soil limitations as slight, moderate, orsevere for many potential uses (Decker et al.,
1975). The ratings are based upon criteriapreviously developed by the Soil Conserva-tion Service and others. The results appearas typewritten descriptions and tables, notas computer graphic displays and maps. (Areport on this automated data-processingsystem was given to participants in the sem-inar.) Those who wish may have a smallpacket of trial mark-sense forms processedat cost (about $2 per pedon) at MontanaState University. Note, however, that the in-terpretative criteria are developed for Mon-tana and cannot be applied directly to land inother areas.
Future efforts to communicate ideasabout land potential to decision makers willcertainly use more composite constraint-overlay maps. But overlays have some limit-ations. Eventually, computers may be usedto make individual soil-constraint maps aswell as composite maps printed by the com-puter in which each component map is, in asense, weighted according to its importance.The importance of each map (soil, climate,present land use, etc.) would be previouslyassigned by experts.
Land information systems will eventuallyincorporate computer graphic displays, re-mote-sensing from high-elevation aircraftand satellites, computer data-processing sys-tems, and systems-analysis techniques. In-tegrated land-capability maps will appear ontelevision monitors. Planners will simulatefuture land uses for decision makers. Theaudience will participate by changing thecriteria used for evaluating the land resourceor by changing any assumptions about futureprices, populations, and the like. Effects ofthese changes will be displayed immediately.Although these advanced systems will un-doubtedly be common in the future, they areexpensive, and examples of useful outputsare rare.
Audiences
The following list of audiences illustratesthe range of public interests in soil-resourcedata for land-use planning. No overt effortswere made to call a t tent ion to the data

RANCH-LANDSUBDIVISIONS
MONTANA
MOUNTAIN-VALLEY SUBDIVISIONS
— one subdivision
— five subdivisions
— good farm land
FARM-LANDSUBDIVISIONS
Fig. 3. Land subdivision in Gallatin County, Montana. Farm-land subdivisions take more than 2,000 acres of good soilsout of production; single-ranch subdivisions cut 13,000 acres into 950 lots, with little consideration for land capabilities; andmountain-valley subdivisions use land for recreation and retirement homes. (Source: Gallatin Canyon Study Team, 1974)
NIELSEN 101
and interpretative maps. One presentationseemed to lead to another. During the past 3years, over 150 presentations were given bystaff of Montana State University's Plant andSoil Science Department, the AgriculturalEconomics Department, the Cooperative Ex-tension Service, and the Soil ConservationService.
University classes in Soil Science, Ar-chitecture, Real Estate, Economics,Earth Science, Geography, Recrea-tion Area Management and Plan-ning—Montana, Idaho, and Wash-ington
Soil Science Society of America—Lara-mie, Wyoming
Planning Division, Canadian NationalPark Service—Calgary
Interregional Resource EconomicsCommittee—Chicago
Citizens Conference on Taxes—Man-hattan, Kansas
Division of Agriculture Institute ofCanada—Calgary
Planning associations—three Mon-tana counties and Tucson, Arizona
Montana State Cooperative ExtensionStaff—Bozeman
Private land resource consultantsCounty commissioners and city-county
planning boards—six countiesRealtors Association—Gallatin CountySoil Conservation Service training
meetings—six Montana citiesKellogg Extension Education Program
—Cooperative Extension Service,Montana
American Institute of Industrial Engi-neers—Western Student Conference
Statewide County Planning Workshop—Montana
Center for Industrial Development—Montana State University
Environmental Quality Workshop—Montana College of Mines andGeology, Butte
New Mexico Chapter of SCSA—LasCruces
National meetings SCSA — HotSprings, Arkansas
Western Regional Planning Associa-tion of Montana and Department ofNatural Resources and Conservation—Missoula, Montana
Gallatin Sportsman's Association—Bozeman, Montana
Farm Bureau—Wheatland and ParkCounties, Montana
Montana Art Education AssociationState Rural Areas Development Com-
mittee—MontanaState Departments of Natural Re-
sources, Lands, and Fish and Game—Montana
Montana Soil Scientist Workshop forFederal and State Agencies
Montana Wilderness AssociationDepartment of Film and Television—
Montana State UniversityForest Service—Gallatin National
ForestGallatin County Fire CouncilCrow Indian Reservation—Bighorn
County, Montana
Presentations were directed toward offi-cials at the county level and to the generalpublic. Most audiences were unaware of thecomparative advantages and disadvantagesthat are characteristic of their land resources.They could not clearly visualize the geo-graphic distribution of resources and werenot fully aware of current land-use changesand their implications. Many oppose land-use planning by state and federal agencies.
A pictorial bulletin was published to in-crease public awareness of developmentimpacts upon land resources, land use, andthe future of Gallatin County in southwesternMontana (Gallatin Canyon Study Team,1974). Figure 3 is from that bulletin.
A 35-mm slide series and narrative enti-tled "Land Use and Abuse in Montana" wasproduced for the Cooperative Extension Ser-vice. This was used as lead-off material fornine regional land-use conferences spon-sored by a broad spectrum of interest groupsboth private and public, rural and urban.
A workshop on county resource inven-
102 LAND-USE PLANNING
tories and land-use problems was conductedat Montana State University for county com-missioners and planning board membersfrom throughout the state. This workshopreaffirmed the conviction that much usefulinformation about county resources remainsunused because (1) potential users are notaware of its existence and (2) the informationis in relatively unusable form.
Workshop participants and others haveurged the preparation of a County ResourceInventory Handbook that (1) gives sourcesof information, (2) suggests common mapscales and inexpensive techniques that citi-zen groups can use to display resource datain local newspapers, (3) tells how to interpretcounty resource data for selected uses (i.e.,roads, schools, waste disposal, agriculture),and (4) explains how overlay maps can beprepared for public meetings. The handbookwill have sections on geology, topography,climate, soils, water, vegetation, wildlife,land ownership, land use, population charac-teristics, business levels, taxes, and publicservices. It will not tell how to do land-useplanning. The handbook will describe howgeneral land-resource information that isalready available in files can be assembledfor county-resource analysis.
Further soil-resource interpretations areneeded in Montana in the following areas:fertilizer recommendations, outdoor recrea-tion activities, nutrient and microbiologicalproblems of waste disposal, taxation, zoning,definition of prime agricultural land, arche-ological studies, habitat identification forgrizzly bears and other endangered wildlifespecies, livestock range potential, wildernessprotection, barley and alfalfa production,definition of carrying capacity for land, routeselection for transportation systems and util-ity corridors, planning of and implementingstrip mine reclamation, home-site selection,ground truth for remote sensing, and saline-seep identification.
Each audience representing a specificinterest needs specific interpretative criteriaand specific maps showing soil-resource ca-pability. All can rely upon the same basicsoil data if standard methods of classifica-tion and mapping are used.
Effects on Decision-Making
Maps of soil-resource capabilities andconstraints influence land-use decisions.However, this is hard to document becausedecisions are seldom made on the basis of asingle factor. To identify the most influentialfactor is often impossible.
Few, if any, regional planning efforts inthe United States have been as successful asthat in southeastern Wisconsin. Much of thelatter's success has been attributed to thestandard soil-survey and land-use interpreta-tions that were made available before land-use plans were developed.
A few Montana counties have preventedsubdivision of agricultural land of highquality. The influence of soil-resource mapspresented at public meetings and in news-papers is hard to measure.
In a formal evaluation of statewide countyworkshops on planning and regulation ofland use, presentations about the use of soilsinformation in planning were ranked by par-ticipants as 6.38 on a scale of 1 to 7 (7 indi-cates information "very much worth mytime"). The soils information received thehighest mean rating and the highest numberof positive open-ended comments on 12presentations about various aspects of land-use planning. A total of 107 requests havebeen received for information about methodsof producing overlay maps that show con-straints of soils and other natural resources.
Suggestions to Increase Useof Soil Inventories
1. Recognize that land planning is an iter-ative (cyclic) process that is never completeand is always tentative; more accurate infor-mation will always be needed. Do not delaythe first attempt.
2. Select a base map scale that fits theneeds of the user. Large-scale maps, de-tailed enough for farm planning, are toolarge for county or regional land-resourceevaluations.
3. Deliver soil maps in terms of the user'sneeds. For example, soil names like Quartz-
NIELSEN 103
ipsammentic Haplorthox mean much tosome soil scientists, but cotton growers aremore interested in overlay maps showing thepotential of this soil for cotton production.
4. List the criteria used to evaluate re-sources and explain them to the audience.
5. Display soil-resource information re-quired by land-use laws. Audience interest isautomatic, and use of the data is assured.Some states require soils maps showing suit-ability for proposed residential areas.
6. Deliver soil-resource information ontime. Development projects frequently pro-ceed through the planning stages on a stricttime schedule. Decisions are made on thebasis of the information in hand.
7. Make maps that are colorful, easy tounderstand, and hold audience attention.
8. Include key reference points on allmaps. Familiar roads, rivers, and towns givea feeling of being present on the land.
9. Be willing to take a leading role. Manysoil scientists have multidisci pli nary trainingand experience in the interpretation of soil-resource data for agricultural developmentand other purposes.
10. Be ready to share maps and other dis-plays once they are prepared. Move on toinventory new areas, reevaluate interpreta-tion criteria, and develop even better datadisplays.
Literature Cited
BARTELLI, L.J., A.A. KLINGEBIEL, J.V. BAIRD, and M.R. HEDDLESON. 1966. Soil surveys and land useplanning. SSSA and ASA, Madison, Wis.
DECKER, G.L., G.A. NIELSEN, and J.W. ROGERS. 1975. The Montana automated data-processing sys-tem for soil inventories. Montana Agric. Exp. Stn. Res. Report no. 89.
DE YOUNG, W., and L. H. SMITH. 1931. Soil survey of the Gallatin Valley area, Montana. Montana Agric.Exp. Stn., Bozeman, Mont.
GALLATIN CANYON STUDY TEAM. 1974. The Gallatin area. Montana State Univ. and Cooperative Exten-sion Service, Bull. 344.
LEESON, B. F. 1972. Soils and associated natural resource decision parameters in the regional planningprocess._Ph.D. Thesis. Montana State Univ.
MCHARG, J. L. 1969. Design with nature. American Museum, Natural History Press, Garden City, N.Y.PLANTENBERG, P.L., C. MONTAGNE, and G.A. NIELSEN. 1974. Natural resource inventory checklist. Mon-
tana Agric. Exp. Stn., Capsule Information Ser. no. 2.SOIL CONSERVATION SERVICE and Montana Agric. Exp. Stn. Staff. 1971. Soil interpretations for land
use planning and development in the Gallatin Valley area. Montana Agric. Exp. Stn., Bozeman,Montana.
USDA, SCS, Soil Survey Staff. 1975. Soil taxonomy: a basic system of soil classification for makingand interpreting soil surveys. Agric. Handb. no. 436. U.S. Government Printing Office, Washing-ton, D.C.
Land-Use Planning in Karnataka, India
R.S. MURTHY
National Bureau of Soil Survey and Land Use PlanningIndian Council of Agricultural Research, New Delhi, India
The use of soils data in land-use planning for Bangalore, Karnataka, is discussed: ageneral background of its soils; the recommended land-use practices for the Bangalore district;and the two specific sites chosen, one for transferring agricultural technology to dryland farm-ing regions and the other for testing the validity of the land-use plan's recommendations forhorticultural crops. Also discussed are the usefulness of land-use plans; the main objectives,use, and interpretation of soils data; the cooperation between soils and planning agencies; andfactors responsible for success or failure. The case study is illustrated with appropriate soilmaps and !and-use plans to substantiate the results achieved.
Food needs of the world in general andany country in particular cannot be metsuccessfully unless adequate efforts are putforward tn increase the productivity per unitof land. Whereas a high level of productivityhas been achieved in temperate regions, abreakthrough is yet lacking in tropical re-gions despite the report of the green revolu-tion for crops like wheat and rice in certainparts of Asia and a few other countries.Such advances are possible provided propertechnology is developed and made available.It is in this regard that soil classification andland-use planning play vital roles; they pro-vide the basic data for planning and trans-ferring agricultural technology to achievesatisfactory results of development. Theyshould, therefore, receive immediate atten-tion in the tropical countries.
The tremendous potential inherent intropical soils is well known: it may be pos-sible to double or triple the crop yields ofthese soils without causing deterioration tothem. But socioeconomical and technical
104
problems pose certain difficulties in the im-plementation of the agricultural develop-ment program. It is not only the soil scien-tists who are involved in such an effort butalso those holding responsibility for nationalresource planning and development.
It is, therefore, very appropriate that op-portunities are provided for soil scientists,agronomists, technologists, program plan-ners, and the like from different parts of theworld to pursue the following objectives: todiscuss the various problems about land; toreport their experiences; to contribute to theexchange of new thoughts and ideas; and tolearn about the practical usefulness of soilmaps and soil-survey interpretations in inter-relating research studies on soil, water andcrop management in tropical areas, prepara-tion of land-use plans, and implementationof large-scale development programs for ag-ricultural production.
Keeping the above objectives in view, Iwill describe a case study from India, takingtwo specific examples from Bangalore, lo-
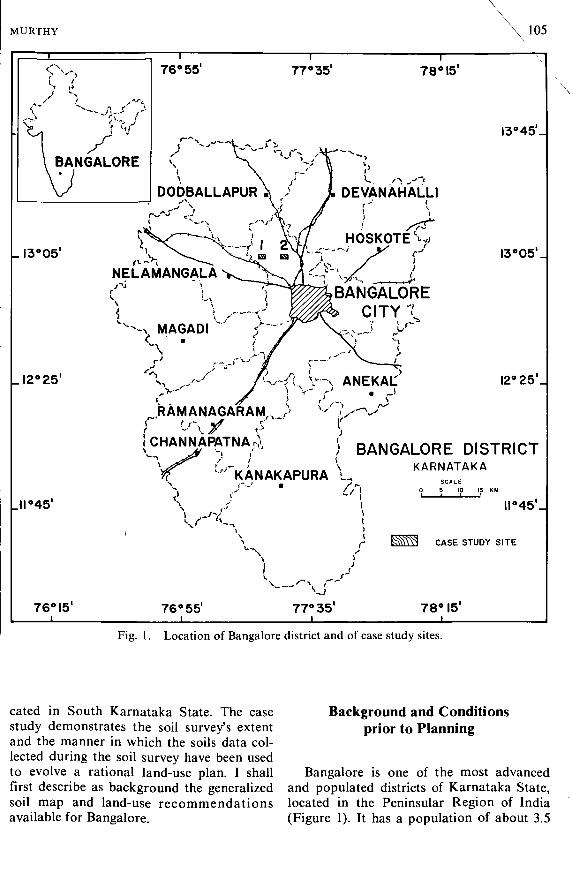
MURTHY 105
_I3°O5'
_I2°25'
•45'
76° 15'
76° 55' 77° 35'
BANGALORECITY "?.
i u
78° 15'
s r'
RAMANAGARAM >
f 'A/ /'"•iCHANNAPATNAri
I3°45'_
I3°O5 _
12° 25 _
; BANGALORE DISTRICT
KANAKAPURA UKARNATAKA
SCALEO 5 10 IS KM
CASE STUDY SITE
76° 55' 77° 35' 78° 15'
Fig. 1. Location of Bangalore district and of case study sites.
cated in South Karnataka State. The casestudy demonstrates the soil survey's extentand the manner in which the soils data col-lected during the soil survey have been usedto evolve a rational land-use plan. I shallfirst describe as background the generalizedsoil map and land-use recommendationsavailable for Bangalore.
Background and Conditionsprior to Planning
Bangalore is one of the most advancedand populated districts of Karnataka State,located in the Peninsular Region of India(Figure 1). It has a population of about 3.5
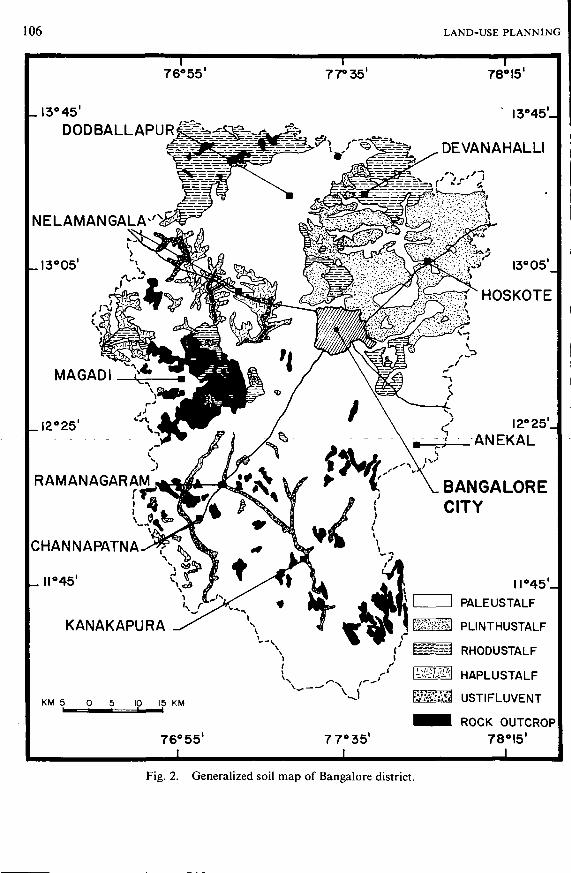
106 LAND-USE PLANNING
76°55' 7 7° 35'
_I3°45'
^ j ^ ^
78° 15'
I3°45'_
DEVANAHALLI
I3°O5'.
HOSKOTE
I2°25'_ANEKAL
BANGALORECITY
KANAKAPURA
KM 5 0 5 10 15 KM
76°55'I
7 7° 35I
PALEUSTALF
PLINTHUSTALF
RHODUSTALF
HAPLUSTALF
USTIFLUVENT
ROCK OUTCROP78° I5 '
|
Fig. 2. Generalized soil map of Bangalore district.
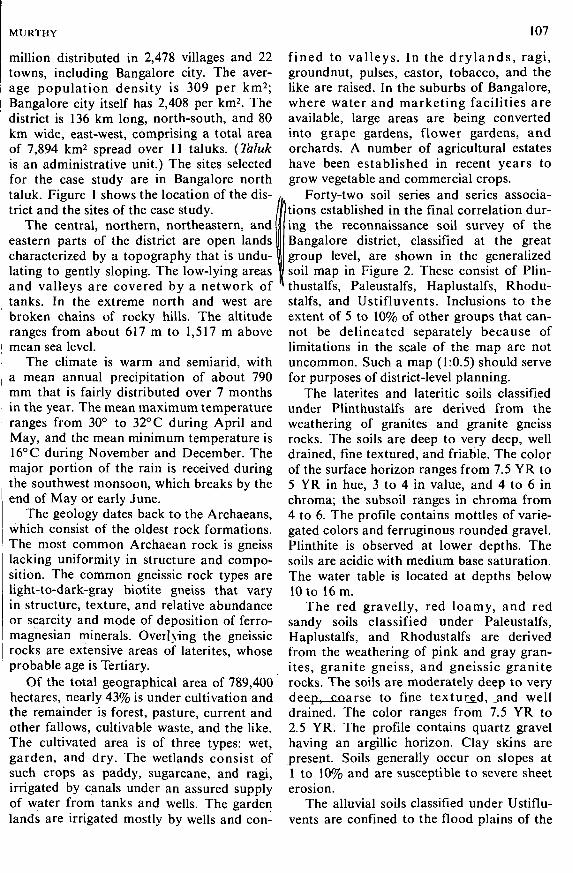
MURTHY 107
million distributed in 2,478 villages and 22towns, including Bangalore city. The aver-age population density is 309 per km2;Bangalore city itself has 2,408 per km2. Thedistrict is 136 km long, north-south, and 80km wide, east-west, comprising a total areaof 7,894 km2 spread over 11 taluks. (Talukis an administrative unit.) The sites selectedfor the case study are in Bangalore northtaluk. Figure 1 shows the location of the dis-trict and the sites of the case study.
The central, northern, northeastern, andeastern parts of the district are open lands 1characterized by a topography that is undu-lating to gently sloping. The low-lying areasand valleys are covered by a network oftanks. In the extreme north and west arebroken chains of rocky hills. The altituderanges from about 617 m to 1,517 m abovemean sea level.
The climate is warm and semiarid, witha mean annual precipitation of about 790mm that is fairly distributed over 7 monthsin the year. The mean maximum temperatureranges from 30° to 32° C during April andMay, and the mean minimum temperature is16°C during November and December. Themajor portion of the rain is received duringthe southwest monsoon, which breaks by theend of May or early June.
The geology dates back to the Archaeans,which consist of the oldest rock formations.The most common Archaean rock is gneisslacking uniformity in structure and compo-sition. The common gneissic rock types arelight-to-dark-gray biotite gneiss that varyin structure, texture, and relative abundanceor scarcity and mode of deposition of ferro-magnesian minerals. Oveihing the gneissicrocks are extensive areas of latentes, whoseprobable age is Tertiary.
Of the total geographical area of 789,400hectares, nearly 43% is under cultivation andthe remainder is forest, pasture, current andother fallows, cultivable waste, and the like.The cultivated area is of three types: wet,garden, and dry. The wetlands consist ofsuch crops as paddy, sugarcane, and ragi,irrigated by canals under an assured supplyof water from tanks and wells. The gardenlands are irrigated mostly by wells and con-
fined to valleys. In the drylands, ragi,groundnut, pulses, castor, tobacco, and thelike are raised. In the suburbs of Bangalore,where water and marketing facilities areavailable, large areas are being convertedinto grape gardens, flower gardens, andorchards. A number of agricultural estateshave been established in recent years togrow vegetable and commercial crops.
Forty-two soil series and series associa-tions established in the final correlation dur-ing the reconnaissance soil survey of theBangalore district, classified at the great
I group level, are shown in the generalized' soil map in Figure 2. These consist of Plin-thustalfs, Paleustalfs, Haplustalfs, Rhodu-stalfs, and Ustifluvents. Inclusions to theextent of 5 to 10% of other groups that can-not be delineated separately because oflimitations in the scale of the map are notuncommon. Such a map (1:0.5) should servefor purposes of district-level planning.
The latentes and lateritic soils classifiedunder Plinthustalfs are derived from theweathering of granites and granite gneissrocks. The soils are deep to very deep, welldrained, fine textured, and friable. The colorof the surface horizon ranges from 7.5 YR to5 YR in hue, 3 to 4 in value, and 4 to 6 inchroma; the subsoil ranges in chroma from4 to 6. The profile contains mottles of varie-gated colors and ferruginous rounded gravel.Plinthite is observed at lower depths. Thesoils are acidic with medium base saturation.The water table is located at depths below10 to 16 m.
The red gravelly, red loamy, and redsandy soils classified under Paleustalfs,Haplustalfs, and Rhodustalfs are derivedfrom the weathering of pink and gray gran-ites, granite gneiss, and gneissic graniterocks. The soils are moderately deep to veryde.e>.pl coarse to fine textured, _and welldrained. The color ranges from 7.5 YR to2.5 YR. The profile contains quartz gravelhaving an argillic horizon. Clay skins arepresent. Soils generally occur on slopes at1 to 10% and are susceptible to severe sheeterosion.
The alluvial soils classified under Ustiflu-vents are confined to the flood plains of the
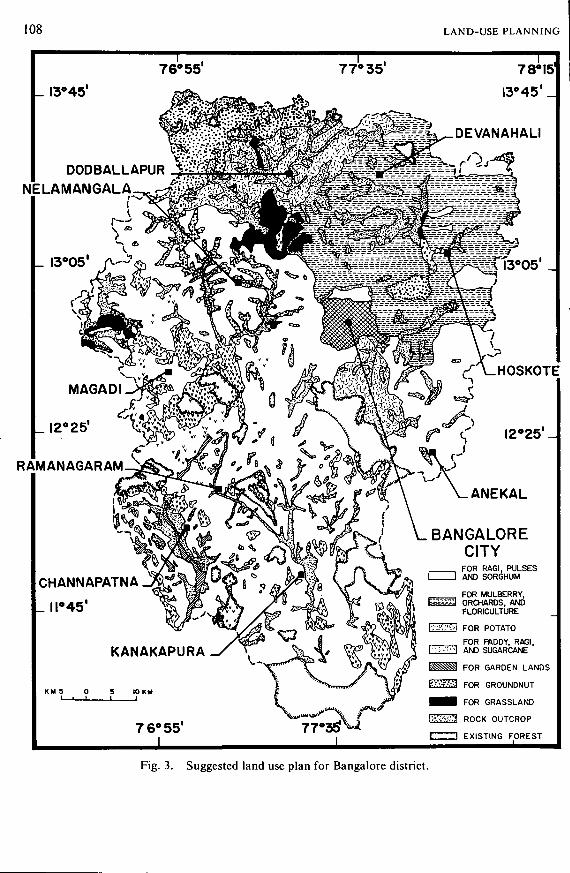
108 LAND-USE PLANNING
_ I3°45'
DODBALLAPUR _£&NELAMANGALA
_ I3°O5'
BANGALORECITY
_ 12° 25'
RAMANAGARAM
CHANNAPATNA
7 6° 55'
FOR RAGI, PULSESAND SORGHUM
FOR MULBERRY,ORCHARDS, ANDFLORICULTURE
FOR PADDY, RAGI,AND SUGARCANE
FOR GARDEN LANOS
FOR GROUNDNUT
FOR GRASSLAND
ROCK OUTCROP
EXISTING FOREST
Fig. 3. Suggested land use plan for Bangalore district.
MURTHY 109
rivers. The soils are deep to very deep,coarse-to-medium-textured, and stratified.The color of the surface and subsoils rangesfrom 7.5 YR to 10 YR in hue, 4 to 5 in value,and 4 to 6 in chroma. The water table is metat depths below 5 to 10 m.
Objectives of the Land-Use Plan
The purpose of soil survey is not attainedunless a suitable land-use plan is projectedon the soil map. Such a plan for the districtas a whole is illustrated in Figure 3. Becausequite a vast area in the district is suitablefor dry crops only, land use cannot bechanged drastically in such areas. Intensifi-cation of agriculture by a proper selection ofcrops, varieties, supply of inputs like goodseeds, application of fertilizers, adoption ofplant-protection measures, dry-farming tech-niques, and soil- and water-conservationpractices will go a long way in increasingcrop yields. Soils that qualify for the aboveland use as well as those that are recom-mended for irrigation farming, garden lands,orchards, flowers and vegetables, and com-mercial crops like potato and mulberry aredelineated in the land-use plan.
The objectives in site 1 of the case studyare to investigate and map the land-formunits and their associated soils, to assessthe potential for dryland farming, and tosuggest ways and means of developing im-proved agricultural technology for the rain-fed areas with special reference to the soilsexisting in the farm and those representativeof the soils occupying extensive areas in thedistrict.
Site 2 is mainly concerned with the in-tensification of research for the improvementof horticultural crops like fruits, vegetables,and ornamental plants. In the land-use plan,therefore, suitability of soils for horticulturalcrops and all management needs are high-lighted. The land-use plans based on land-capability classification indicating the suita-bility of different soils units under high,medium, and low levels of inputs thus pro-vide a sound basis for the establishment ofcropping systems, irrigation systems, and
major engineering and agricultural develop-ments.
How Soils Data Were Used
A detailed soil survey of site 1 comprisingabout 33 hectares was carried out by usinga base map on a scale of 1:500. The soil se-ries mapped is correlated with the seriesestablished in the reconnaissance survey ofthe district. The Hoskote series consists ofreddish brown laterite soils and of very deep,moderately well-drained, fine loamy soilsoccurring on lands nearly level to gentlysloping. The texture of these soils rangesfrom an Ap horizon, 7 to 15 cm thick andsandy loam to sandy clay loam, to a B hori-zon, 83 to 112 cm thick, becoming finer withdepth. The subsoil, which becomes hardwhen dry, acts as a hardpan and restrictsroot penetration and water infiltration. Rootpenetration is limited to 30 to 35 cm and atplaces only 15 to 20 cm. The soil reaction isstrongly acidic along the profile depth.
The mapping units are as follows:
1. Hoskote sandyloam, very deep on0-to-l% slope,moderately eroded. 0.51 hectare
2. Hoskote sandyclay loam, verydeep on 0-to-l%slope, moderatelyeroded. 9.78 hectares
3. Hoskote sandyloam, very deepon l-to-3% slope,slightly eroded. 6.59 hectares
4. Hoskote sandyclay loam, verydeep on l-to-3%slope, moderatelyeroded. 10.12 hectares
5. Hoskote clayloam, very deepon l-to-3% slope,moderately eroded. 4.92 hectares
6. Miscellaneous (rockoutcrops, etc.). 1.00 hectare
110 LAND-USE PLANNING
In soils of the above type, the main prob-lem is how best to maximize the soil mois-ture storage under dryland farming condi-tions. The amount of water entering the soilis a function of the rate of infiltration, soil-surface conditions, vegetative cover, andland slope, all of which can be modified toretain most of the rainfall on the ground sur-face for long periods. All cultural practicesthat reduce runoff and erosion result in theincreased storage of soil moisture.
The crops proposed for the soils men-tioned above (site 1) are mainly ragi, minormillets, pulses like Dolichos lablab, horsegram, cowpea, and soybean, and oilseedslike groundnut, sesamum, niger, and castor.The limitations for growing crops include thefollowing: lack of assured and proper distri-bution of rainfall during the growth cycle;moderate-to-severe susceptibility of the soilto erosion; shallowness of the rooting zone;the soils' tendency to form a hard crust onthe surface; hard, compact subsoil; low fer-tility status; and poor soil structure.
Soils data have thus been useful in under-standing the real problems and in planningthe following appropriate management prac-tices for the aforementioned mapping units:
1. Shifting sowing to the first week ofJuly or a little later by utilizing thefirst peak of showers during May forpreparatory cultivation. The dura-tion of crop varieties should not ex-ceed 120 days. This will cut short theincidence of drought considerably.
2. Contour bunding, about 90 m aparton a 1% slope and 75 m apart on al-to-3% slope.
3. Deep plowing at least once in 3 yearsto disturb not only the crust on thesurface that obstructs the intake ofwater but also the subsoil that ishard and compact; and applicationof liberal doses of farmyard manureto improve soil structure.
4. Stubble mulching to leave the fieldin a rough condition immediatelyafter harvest and to reduce evapora-tion.
5. Collecting runoff in farm ponds and
utilizing the water for one or twolight irrigations for limited areasduring the drought period.
6. Liming of soils in view of their be-ing strongly to moderately acidic.
A detailed soil survey of site 2 (about 25hectares) for the case study was carried out|by using a base map on a 1:600 scale. Threelsoil series were mapped. The Tyamagondalulseries consists of soils reddish brown to yel-lowish red derived from fine-to-coarse-|grained granites; very deep, loamy soils inthe surface, moderately well drained to welldrained, with a good argillic horizon havingabundant clay skins. The Mutkur series com-prise soils reddish brown to yellowish red,and deep to very deep soils of fine clayey(texture, somewhat poorly drained. TheArkavati series consists of stratified reddishbrown and noncalcareous alluvium, veryjdeep, well drained, and textured coarseloamy to fine loamy.
Mapping units indicate that about 11.4hectares consist of lands level or nearly level1
whose soils are of the Tyamagondalu andArkavati series. They are very deep soils,textured sandy loamy to sandy clay loamy,slightly to moderately eroded, and slightlyacidic to neutral. Their clay content increaseswith depth, and they are low in organic mat-ter, the available P2O5 and K2O being lowto medium. Given proper application of fer-tilizers, the soils are best suited for vege-tables, banana, papaya, and grapes.
A small area of 0.64 hectare consists oflands nearly level to gently sloping whosesoils are also of the Tyamagondalu andArkavati series. They are very deep soils,sandy loamy to sandy clay loamy and areslightly to moderately eroded. They areneutral in reaction. A part of this area isalready under mango cultivation and can beextended to the adjoining area also. Appli-cations of farmyard manure and suitablefertilizer mixtures are recommended.
Another area of 2.53 hectares consists ofnearly level to gently sloping lands of verydeep, sandy loam soils of the Arkavati series,slightly eroded. The soil conditions are suit-ed for banana cultivation and for other fruit-plant collection.
MURTHY
The remaining 4.37 hectares consist ofgently sloping lands having very deep, sandyloam soils of the Mutkur series, slightly tomoderately eroded. The soils' pH is on theacidic range and their clay content increaseswith depth. The soils are low in organicmatter, the available P2O5 and K2O beingvery low to low. These soils are recommendedfor fruit trees like guava, banana, litchi, andpineapple. Application of liberal doses oforganic manure and suitable fertilizer mix-tures is recommended in addition to 2,500kg per hectare of dolomite or CaCO3 as asoil-amelioration measure to raise the soilpH.
The soil map has thus been used to de-marcate areas for different fruit crops, vege-tables, and the like and to define the man-agement practices for them.
Cooperation between Soils andPlanning Agencies
The soil survey of sites 1 and 2 describedabove was carried out by the National Bureauof Soil Survey and Land Use Planning, Re-gional Centre, Bangalore. Site 1 is one of thefifteen main centers in operation under theAll India Coordinated Project for Dry LandFarming, selected on the basis of agrocli-matic and soil conditions and availability ofresearch facilities. The layout, designing ofexperiments, follow-up of the land-use plan,and the like have been done in mutual con-sultation by taking advantage of the soilmap. The Regional Soil Correlator, as one ofthe members of the Coordination Commit-tee, discusses program implementation,progress of work, and results achieved. TheChief Scientist acts as coordinator.
Site 2 is the headquarters of the All IndiaCoordinated Research Project for grapes,banana, mango, pineapple, papaya, andguava. Moreover, it is the main center forvegetable crops and floriculture. The Direc-tor of the Institute of Horticultural Researchand other scientists concerned with the aboveprojects have planned the experiments ac-cording to the land-use plan supplied. Theyconsult the Regional Soil Correlator during
111
different stages of experiments for samplingof soils, their analysis, and interpretationof data.
Examples of the Plan
The soil- and land-use plans of sites 1 and2 selected for the case study are given inFigures 4 and 5.
Case study site 1 is situated 8 km north ofthe University of Agricultural Sciences, Heb-bal Campus, near the village of Tinnalu. Thephysiography consists of lands nearly levelto gently sloping, with slope gradients rang-ing from 1 to 3%. Relief is subnormal. Ele-vation ranges from 920 to 931 m above meansea level. The drainage pattern, is dendritic:the north and extreme northwest parts havean eastward drainage, whereas the southcentral portion drains toward the pond. Thesoils are moderately well drained, runoffduring the rainy season being quite appre-ciable. The mapping units of the Hoskoteseries delineated on the basis of variationsin texture, slope, and erosion are indicatedin the plan.
Case study site 2 is located about 26 kmnorth of Bangalore within the revenue limitsof the village of Aivarakhandapura. Thephysiography consists of lands nearly level tovery gently sloping, with slope gradientsranging from 1 to 3%. The relief is subnor-mal, and approximate elevation is 863 mabove mean sea level. The site is drained bythe Arkavati river, which flows along thewestern boundary. The uplands of the north-ern and northeastern portion are excessivelydrained to well drained. Lowlands in thesouthern portion are nearly level to gentlysloping, moderately well drained, and imper-fectly drained.
Three soil series are mapped showingvariations in soil type, soil depth, slope, anderosion. The suitability of the soils for grow-ing various horticultural crops is also pro-jected in the plan.
Usefulness of the PlanThe usefulness of the land-use plan,
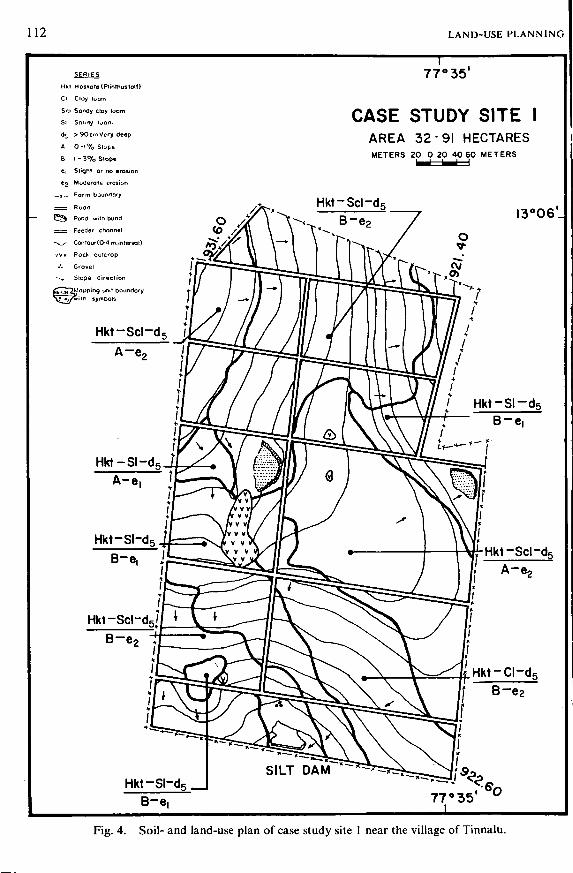
112 LAND-USE PLANNING
SERIES
Hkt HOSkote(Plinttiustolf)
Cl Cloy loofr,
Sol Sondy cloy loom
Si Sniifiy ijort.
dr > 9OcoVery deep
A 0 - 1 % Slyf,e
B I - 3 % Slope
e, Slight or no erosion
*2 Moderate erosion
- x— Farm bCiunrtnrjf
Ruaä
Ç*|^ Pond with bund
Feeder channel
->^y- Contour(0'4m.intervol)
.*. Grovel
--» Slope direction
g wn'f boundofy7 Ï i I n symbols
77°35'
CASE STUDY SITE IAREA 32-91 HECTARESMETERS 20 0 20 40 60 METERS
Hkt-Scl-d5I3°O6'_
Hkt-Scl-d5
Hkt-Scl-d5j
Hkt-SI-d5 _B-e, 77°35
I
Fig. 4. Soil- and land-use plan of case study site 1 near the village of Tinnalu.
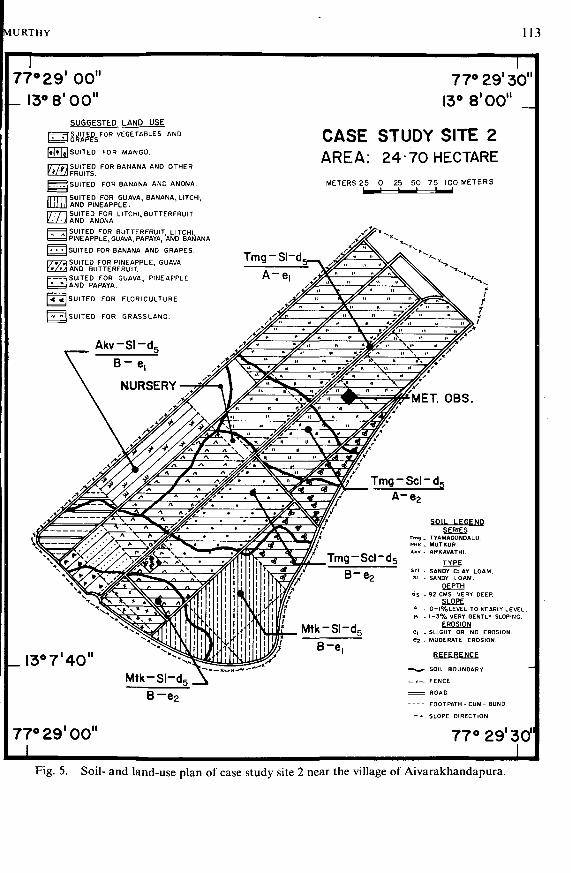
vlURTHY 113
77° 29' 00"13° 8'00"
r77° 29' 30"
13° 8' 00"SUGGESTED LAND USE
SUITED FÜR VEGETABLES AND
|<|< | ; | SUITED FOR MANGO.
\l /jl SUITED FOR BANANA AND OTHERlilZA FRUITS.
| | SUITED FOR BANANA AND ANONA.
II I ill SUITED FOR GUAVA, BANANA, LITCHI,LLLLLU AND PINEAPPLE.
SUITED FOR LITCHI, BUTTERFRUITA N D ANONA
I (SUITED FOR BUTTERFRUIT LITCHI1 = 1 PINEAPPLE, GUAVA, PAPAYA, AND BANANA
|- • • | SUITED FOR BANANA AND GRAPES.
| / > /J SUITED FOR PINEAPPLE, GUAVAY'/'A AND BUTTERFRUIT.I I SUITED FOR GUAVA, PINEAPPLEI» " I A N D PAPAYA.
| « «|SUITEO FOR FLORICULTURE.
I " " ISU ITED FOR GRASSLANO.
CASE STUDY SITE 2AREA: 24-70 HECTARE
METERS 25 0 25 50 75 100 METERS
Tmg-SI-d5
Tmg ~ Sel ~ d5
A - e 2
_I3°7'4O"
77° 29'00"I
Mtk-SI-dB—e2
SOIL LEGENDSERIES
rm^ . TYAMAGONDALU.M+K . MUTKUR.Ahv . ARKAVATHI.
TYPEScl . SANDY CLAY LOAM.SI - SANOY LOAM.
DEPTH
SLOPEA - O-I%LEVEL TO NEARLY LEVEL.B - 1-3% VERY GENTLY SLOPING.
EROSION€j . SLIGHT OR NO EROSION.C2 - MODERATE EROSION.
REFERENCE
- ^ ^ SOIL BOUNDARY
_ . _ FENCE
= ROAD
FOOTPATH - CUM- BUND
— SLOPE DIRECTION
77° 29'30"I
Fig. 5. Soil- and land-use plan of case study site 2 near the village of Aivarakhandapura.
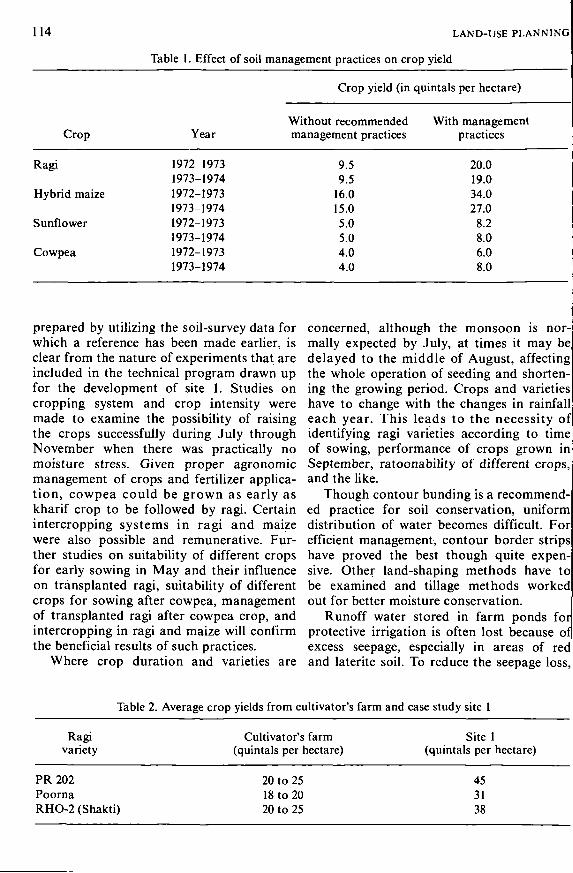
114 LAND-USE PLANNING
Table 1. Effect of soil management practices on crop yield
Crop
Ragi
Hybrid maize
Sunflower
Cowpea
Year
1972-19731973-19741972-19731973-19741972-19731973-19741972-19731973-1974
Crop yield (in
Without recommendedmanagement practices
9.59.5
16.015.05.05.04.04.0
quintals per hectare)
With managementpractices
20.019.034.027.0
8.28.06.08.0
prepared by utilizing the soil-survey data forwhich a reference has been made earlier, isclear from the nature of experiments that areincluded in the technical program drawn upfor the development of site 1. Studies oncropping system and crop intensity weremade to examine the possibility of raisingthe crops successfully during July throughNovember when there was practically nomoisture stress. Given proper agronomicmanagement of crops and fertilizer applica-tion, cowpea could be grown as early askharif crop to be followed by ragi. Certainintercropping systems in ragi and maizewere also possible and remunerative. Fur-ther studies on suitability of different cropsfor early sowing in May and their influenceon transplanted ragi, suitability of differentcrops for sowing after cowpea, managementof transplanted ragi after cowpea crop, andintercropping in ragi and maize will confirmthe beneficial results of such practices.
Where crop duration and varieties are
concerned, although the monsoon is nor-mally expected by July, at times it may bedelayed to the middle of August, affectingthe whole operation of seeding and shorten-ing the growing period. Crops and varietieshave to change with the changes in rainfalleach year. This leads to the necessity ofidentifying ragi varieties according to timeof sowing, performance of crops grown in'September, ratoonability of different crops,and the like.
Though contour bunding is a recommend-ed practice for soil conservation, uniformdistribution of water becomes difficult. Forefficient management, contour border stripshave proved the best though quite expen-sive. Other land-shaping methods have tobe examined and tillage methods workedout for better moisture conservation.
Runoff water stored in farm ponds forprotective irrigation is often lost because ofexcess seepage, especially in areas of redand latente soil. To reduce the seepage loss,
Table 2. Average crop yields from cultivator's farm and case study site 1
Ragivariety
Cultivator's farm(quintals per hectare)
Site 1(quintals per hectare)
PR 202PoornaRHO-2 (Shakti)
20 to 2518 to 2020 to 25
453138
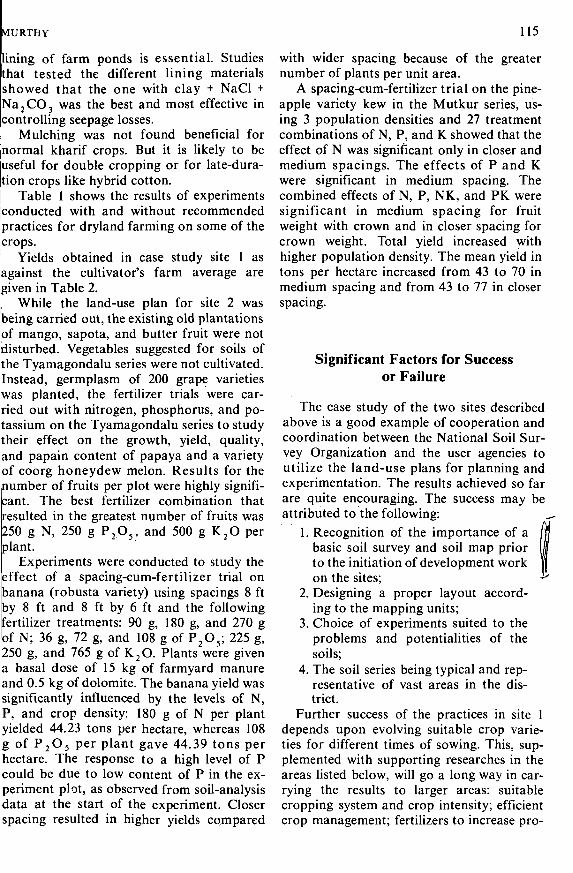
VIURTHY 115
lining of farm ponds is essential. Studiesthat tested the different lining materialsshowed that the one with clay + NaCl +Na2CO3 was the best and most effective incontrolling seepage losses.
Mulching was not found beneficial for[normal kharif crops. But it is likely to beuseful for double cropping or for late-dura-tion crops like hybrid cotton.
Table 1 shows the results of experiments[conducted with and without recommendedpractices for dryland farming on some of thecrops.
Yields obtained in case study site 1 asagainst the cultivator's farm average aregiven in Table 2.
While the land-use plan for site 2 wasbeing carried out, the existing old plantationsof mango, sapota, and butter fruit were notdisturbed. Vegetables suggested for soils ofp e Tyamagondalu series were not cultivated.Instead, germplasm of 200 grape varietieswas planted, the fertilizer trials were car-ried out with nitrogen, phosphorus, and po-tassium on the Tyamagondalu series to studytheir effect on the growth, yield, quality,and papain content of papaya and a varietyof coorg honeydew melon. Results for thenumber of fruits per plot were highly signifi-cant. The best fertilizer combination thatresulted in the greatest number of fruits was250 g N, 250 g P2O5 , and 500 g K2O perplant.
Experiments were conducted to study theeffect of a spacing-cum-fertilizer trial onbanana (robusta variety) using spacings 8 ftby 8 ft and 8 ft by 6 ft and the followingfertilizer treatments: 90 g, 180 g, and 270 gof N; 36 g, 72 g, and 108 g of P2O5; 225 g,250 g, and 765 g of K2O. Plants were givena basal dose of 15 kg of farmyard manureand 0.5 kg of dolomite. The banana yield wassignificantly influenced by the levels of N,P, and crop density: 180 g of N per plantyielded 44.23 tons per hectare, whereas 108g of P 2 O 5 per plant gave 44.39 tons perhectare. The response to a high level of Pcould be due to low content of P in the ex-periment plot, as observed from soil-analysisdata at the start of the experiment. Closerspacing resulted in higher yields compared
with wider spacing because of the greaternumber of plants per unit area.
A spacing-cum-fertilizer trial on the pine-apple variety kew in the Mutkur series, us-ing 3 population densities and 27 treatmentcombinations of N, P, and K showed that theeffect of N was significant only in closer andmedium spacings. The effects of P and Kwere significant in medium spacing. Thecombined effects of N, P, NK, and PK weresignificant in medium spacing for fruitweight with crown and in closer spacing forcrown weight. Total yield increased withhigher population density. The mean yield intons per hectare increased from 43 to 70 inmedium spacing and from 43 to 77 in closerspacing.
Significant Factors for Successor Failure
The case study of the two sites describedabove is a good example of cooperation andcoordination between the National Soil Sur-vey Organization and the user agencies toutilize the land-use plans for planning andexperimentation. The results achieved so farare quite encouraging. The success may beattributed to the following:
1. Recognition of the importance of abasic soil survey and soil map priorto the initiation of development workon the sites;
2. Designing a proper layout accord-ing to the mapping units;
3. Choice of experiments suited to theproblems and potentialities of thesoils;
4. The soil series being typical and rep-resentative of vast areas in the dis-trict.
Further success of the practices in site 1depends upon evolving suitable crop varie-ties for different times of sowing. This, sup-plemented with supporting researches in theareas listed below, will go a long way in car-rying the results to larger areas: suitablecropping system and crop intensity; efficientcrop management; fertilizers to increase pro-
116 LAND-USE PLANNING
duction; and evaluation of crop varieties.Where site 2 is concerned, although our
experiments were limited to only some horti-cultural crops, broad recommendations indi-cated in the land-use plan regarding choiceof crops on specific soil types based on thesoil map have yielded some promising re-sults. But there are some obstacles withhorticultural crops, which, unlike other agri-cultural crops, present difficulties wherelarge-scale testing is concerned. Fruit trees,unlike other agricultural crops, take time toestablish and produce the desired yields.Until the orchards reach an advanced stage,proper attention needs to be paid towardmanagement. Hence, although good results
are expected to be achieved from the land-use plan's recommendations, their applica-tion on a wider scale might not be easy andrequire more time. These are some of thelimiting factors.
ACKNOWLEDGMENTS. The experimental |data relating to case study site 1 were sup-plied by the Chief Scientist of the All IndiaCoordinated Project for Dry Land Farming,Hebbal (Bangalore) main center. Data con-cerning the horticultural crops in case studysite 2 were supplied by the Director of theInstitute of Horticultural Research, Banga-lore. Their assistance is gratefully acknowl-edged.
Interpretation of Small- and Large-Scale Soil Mapsfor Arid and Semiarid North Indian Plains
H.S. SHANKARANARAYANA and L. R. HIREKERUR
National Bureau of Soil Survey and Land Use PlanningIndian Council of Agricultural Research, New Delhi, India
Small-scale (1:250,000 to 1:63,000) and large-scale (1:13,500 and 1:7,920) soil maps can beused for land-use planning in the arid and semiarid regions of the north Indian plain. To be use-ful, small-scale maps need to include indications of soil textural variations. Large-scale soilmaps are necessary to show what crops can be grown in different subdistricts of the regions, andhow many irrigations are needed during the cropping cycle. In rain-fed farming in the driestparts of the region, crop growth is possible only on sandy soils because of the rapid infiltrationof rainfall, without subsequent evaporation loss caused by upward capillary movement. Underirrigation, textural differences are important because of their influence on available moisturecapacity and on the number of irrigations needed during the cropping cycle. In wetter areas,the moisture-holding capacity determines what crops can be grown in rain-fed farming. Finer-textured soils, which have generally higher moisture-holding capacities, can be used for longer-duration crops like sorghum and maize in the wettest areas and pearl millet and oilseed in theintermediate rainfall areas. Coarse-textured soils in the same circumstances can only be usedfor short-duration, drought-tolerant crops like kidney beans.
Crop yields are influenced by soil proper-ties, weather conditions during the growingseason, and management practices. In anygiven area, soils vary in their characteristics,even though weather conditions remain thesame. Since soil moisture regimes are onlypartial functions of climate, and thus in anygiven landscape with the same climate, adja-cent soils may have different moistureregimes (USDA, 1970), efficient crop pro-duction calls for the application of agro-technology based on the productive capacityof the soils of an area. That is, the suitabilityof a particular crop to a particular soil andthe adaptability of a soil to a crop becomeimportant. Many low-yield environments forrice or wheat may const i tute high-yieldenvironments for pulse or oilseed crops
(Swaminathan, 1973).As Robertson et al. (1968) have stated,
if one looks for primary production, oneshould ask about water resources. But in aridand semiarid agriculture, scanty rainfall isimplied. For India, agricultural land use ofarid and semiarid soils holds a special signifi-cance for primary production, though thismay not be so for countries where conceptson interpretation of soil maps are developedand used on the assumption that there areadequate resources. Thus an appraisal ofwater resource in relation to soil is neces-sary for India. Obviously, rational interpre-tations of soil maps and statements on thesuitability of named soils for agriculturaluse assume considerable importance. In thispaper, we will present the interpretation of
117
118
500-
450-
LAND-USE PLANNING
S 250-
2
200-
P PRECIPITATION
Ep POTENTIAL EVAPORATION
EVAPOTRANSPIRATION
Jan. Feb. Mar. Apr. May June July Aug. Sept. Oct. Nov. Dec
M O N T H S
- Eig. 1.- Monthly distribution-of precipitation,-potential evaporation, and evapotranspiration inthe Ganganagar-Rajasthan Canal area.
- O - Ep=POTENTIAL EVAPORATION
-X- P = PRECIPITATION
Jen. Feb. Mar. Apr. May June July Aug Sept. Oct. Nov. Dec.
MONTHS
Fig. 2. Monthly distribution of precipitationand potential evaporation in Hissar.
small-scale and large-scale soil maps ofparts of the arid and semiarid north Indianplains for agricultural use.
Small-Scale and Large-Scale Maps
The utility of a soil map is based on theprinciples that (1) soils differ in their be-havior to use; (2) soils differ in their charac-teristics within a given subclimatic environ-ment; (3) the crop yield depends on theinteraction between soil characteristics andthe combination of management practices;and (4) although soil characteristics remainrelatively stable, management practices aresubject to change with technological devel-opment. Soil maps, thus, will be the basis forinterpretation of soil behavior. Requier et al.(1970) have stated that the maps may be ona small scale, sometimes covering an entirecontinent, or on a large scale, intended, say,for a particular farm. Their opinion is toobroad to enable one to comprehend an ap-praisal of an interpretation of a small-scalemap. The taxonomie level of mapping deter-mines the precision of a description of soils,and a less precise statement of a great soilgroup than of a soil series is possible. Theprecision about soils that a soil map and amemoir can provide decreases with the in-clusiveness of the profile classes defined andwith the complexity of the mapping units(Bie and Beckett, 1970).
Information about present land use willbe important, since it can identify specificcrop areas and yield potentials of soils inrelation to immediate and future projectionsof the soil maps. Land use in the arid andsemiarid plains is more intensive in Indiathan in many other countries. Certain rela-tionships between land use and soil unitsmay thus be expected for India. The small-scale maps used in this paper are reconnais-sance soil maps on a scale of 1:50,000 or1:63,000, giving descriptions of named taxo-nomie units at the series level or associationof soil series. They were prepared throughreconnaissance soil surveys using air photo-graphs or topographic maps as the base.They indicate inclusions and identify phases
SHANKARANARAYANA AND HIREKERUR 119
of surface texture, erosion, slope, and thelike. These maps may be generalized and ab-stracted to produce maps for the district,state, and country levels for their planning.
Large-scale maps were prepared by usinga 1:8000 scale or larger-scale cadestral mapsas the base and by having observations atregular intervals to separate phases of soilseries so necessary for village- and farm-level planning, reclamation, and the like.
General Information of the Areaunder Study
The area under study may be definedbroadly as the arid and semiarid parts of thenorth Indian Indo-Gangetic plains lying be-tween the Iso-hyet lines 20 and 80 cm, fallingwithin 27 to 32° latitude N and 72 to 80°longitude E. During the upheaval of theHimalayas, a syncline was formed betweenthe Peninsula of India and the Siwalik hills.The alluvium filling of this depression,dating back to the Pleistocene age, is esti-mated at 90 to 400 meters; and the sedimen-tation is still going on. much of the alluvialsediments has originated from the Siwaliksand consists of clays, silts, and sands. Thispart of the alluvial plain appears to havebeen built up by the activities of the riversGhaggar, Saraswati, Chautang, Sutlej, andan eastern branch of the Indus, all of whichpreviously drained into Rann of Kutch.There are obvious differences in the age ofthe deposits, the younger being mainly con-fined to the vicinity of the channels of today.The occurrence of sand dunes and sandyplains is due to the advancement of the des-ert sands of the Thar, as the rivers filled upor shifted their course in the recent past(FAO/UNDP, 1971).
Climate is arid and semiarid in the south-western limit of the old flood plains of Ghag-gar and its tributaries (Anupgarh Shakha ofthe Rajasthan Canal area); semiarid in thealluvial plains and mid-southeastern part(Hissar tehsil); and semiarid and subhumidin the central part of the alluvial plains (Pa-tiala tehsil). (Tehsil is an administrative sub-unit of a district; a district is an administra-
300-
P = PRECIPITATION
Ep = POTENTIAL EVAPORATION
Eo - EVAPOTRANSPIRATION
Jan. Feb. Mar Apr. May June Jury Aug. Sept. Oct Nov. Dec
M O N T H S
Fig. 3. Monthly distribution of precipitation,potential evaporation, and evapotranspiration inPatiala.
- X - P - PRECIPITATION
- O — Ep-POTENTIAL EVAPORATION7Oi
Eo - EVAPOTRANSPIRATION6 5-
60-
55
50
26
(JULY )
30 32
STANDARD
34
WEEKS
36 38 40
(OCT.!
Fig. 4. Weekly distribution (in kharif) of pre-cipitation, potential evaporation, and evapotrans-piration in Hissar.
DETAILED MAP I : 792073°ll6-5'
Symbol Description
aF Dominantly fine sand to loamy fine sand to 150 cm mixedTypic Torripsamments.
BaF Same as aF except a fine sandy loam to silt loam surfacetexture.
bF Dominantly fine sandy loam to silt loam to 150 cm coarseloamy, mixed Typic Torrifluvents.
AbF Same as bF except with a fine sand to loamy fine sand sur-face texture.
bF, Same as bF except with a clay loam to clay strata below75 cm depth; coarse loamy over fine loamy, mixed TypicTorrifluvents.
lbF | Same as bF{ with sand to loamy fine sand over a burden15 to 45 cm.
bF2 Same as bF except with a clay loam to clay strata below 75cm depth; coarse loamy over fine loamy, mixed TypicTorrifluvents.
AbF2 Same as bFï except with a fine sand to loamy fine sandsurface texture.
Dominantly clay loam to clay to 150 cm clayey, illitic,Typic Torrifluvents.Same as cF except with fine sand to loamy fine sand sur-face texture.
cF
AcF
BcF
DA
DC
Same as cF except with a fine sandy loam to silt loam sur-face texture.
73 iIS
Undifferentiated sand dunes of fine sand to loamy finesands < 1 m in height over flood plain units.Fine sand to loamy fine sand to 150 cm mixed Torripsam-ments.
NOTE: Soils of the flood plain are highly stratified, calcareous, and variablesaline-sodic. All the soils are hyperthermic.
Fig. 5. Soil maps of a part of the Anupgarh Shakha area, Rajasthan Canal Project. (Source: FAO and UNDP, 1971)
SHANKARANARAYANA AND HIREKERUR 121
tive unit of a State comparable to a county inthe United States.) Figures 1, 2, and 3 showthe monthly distribution of relative climaticdata in these three areas; Figure 4 shows theweekly data for Hissar tehsil.
The soils of the tract are developed overalluvium. They vary in their texture fromfine sand to clays and are generally calcare-ous, though noncalcareous soils are alsomapped, especially in the Patiala area. Ver-tical and horizontal textural variations arecommon. The whole of these plains needsmore intensive field observation in terms ofmapping, both small-scale and large-scale,than is commonly recognized.
In the agricultural use of these lands,there is variation in both the intensity andselection of crops. In the arid part, most ofthe land is used for grazing, especially thelow and medium dunes and coarse-texturedflood-plain soils, which have thin grass veg-etation. Small areas of less undulating sandysoils are used to cultivate rain-fed kharifseason crops. (Kharif refers to the seasonfrom June through October.) They are bajra(Pennisetum typhoideum), or pearl millet;moth (Phaseolus conitifolius), or kidneybeans; and til (Sesamum orientale), or gin-gelly. In winter, taramira (Eruca sativa), orrocket salad, is grown. In the Hissar tehsil,87% of the area is cultivated, 45% of which isunder canal and tubewell irrigation. A vari-ety of kharif crops like bajra, paddy (Oryzasativa), maize (Zea mays), cotton (Gossyp-ium sppj, and pulses is grown. Gram (Cicerarietinum), wheat (Triticum aestivum), andmustard (Brassica sppj are important rabicrops. {Rabi refers to the season from No-vember through March.) In the Patialatehsil, more than 88% of the area is undercultivation, of which about 55% is under irri-gation and about 38% is double-cropped.Important kharif crops are paddy, maize,and fodder jowar (Sorghum vulgäre). Wheataccounts for about 82% of the rabi crops;gram, barley, and lentil, for 13 to 14%.
Soil MapsFigures 5, 6, 7, and 8 represent the recon-
naissance and detailed soil maps of repre-
sentative areas. Figure 5 refers to a part ofthe old flood-plain soils of the RajasthanCanal area (FAO/UNDP, 1971). The mapcarries essential descriptions and soil classi-fication of the different units; the semi-detailed soil map delineation of such unitson the map includes 50 to 70% of the indi-cated taxonomie units. The rest are inclu-sions of other flood-plain mapping units.Consequently, the mapping-unit symbolsused for these flood-plain soils approximatethe soil conditions indicating the irrigation-development problems of the delineatedarea. Note, however, that although the map-ping units only approximate the soil condi-tions, the identification of units is specificand the recommendations on the basis ofpresent knowledge are also specific. Thedelineation of mapping units shown in thedetailed soil map is estimated to be 90%accurate.
Figure 6 is a reconnaissance soil map ofthe Hissar tehsil; its mapped units includeup to 20 to 30% of other taxonomie units.Figure 7 is a part of the reconnaissance soilmap of the Patiala tehsil in Punjab, and Fig-ure 8 refers to a part of the detailed soil mapof the Sanaur Village in the Patiala tehsil.
The monthly rainfall and potential evap-oration distribution in the Ganganagar-Rajasthan Canal area (Figure 1) clearly in-dicates large moisture deficits in all themonths. However, even under such moisturedeficits, crops like bajra and moth are grownon the sandy soils, even though their yieldsare low. It is obvious, then, that soil texturegreatly influences crop growth. Of the tex-tural variations shown in Figure 5, the sig-nificant ones are as follows:
aF: Dominantly fine sand to loamy finesand, with available moisture ca-pacity of about 35 mm per 60-cmprofile. (Available soil moisturewas estimated according to themethod given in Report of Coor-dinated Scheme for Irrigation Re-search, Haryana Agric. Univ.,1970.)
bF: Dominantly fine sandy loam to siltloam, with available moisture ca-
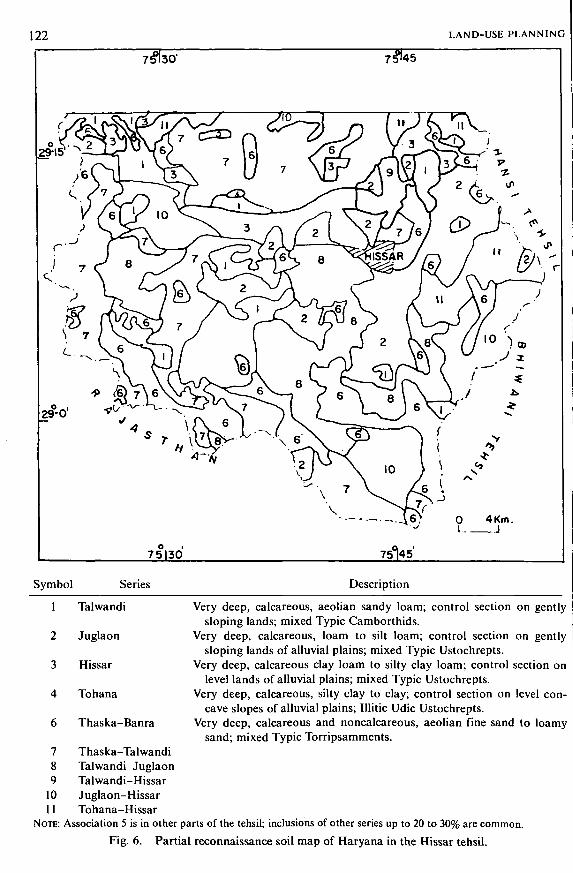
122 LAND-USE PLANNING
29-0'
75130 75°|45'
Symbol Series Description
Very deep, calcareous, aeolian sandy loam; control section on gentlysloping lands; mixed Typic Camborthids.
Very deep, calcareous, loam to silt loam; control section on gentlysloping lands of alluvial plains; mixed Typic Ustochrepts.
Very deep, calcareous clay loam to silty clay loam; control section onlevel lands of alluvial plains; mixed Typic Ustochrepts.
Very deep, calcareous, silty clay to clay; control section on level con-cave slopes of alluvial plains; Illitic Udic Ustochrepts.
Very deep, calcareous and noncalcareous, aeolian fine sand to loamysand; mixed Typic Torripsamments.
1 Talwandi
2 Juglaon
3 Hissar
4 Tohana
6 Thaska-Banra
7 Thaska-Talwandi8 Talwandi-Juglaon9 Talwandi-Hissar
10 Juglaon-Hissar11 Tohana-Hissar
NOTE: Association 5 is in other parts of the tehsil; inclusions of other series up to 20 to 30% are common.Fig. 6. Partial reconnaissance soil map of Haryana in the Hissar tehsil.
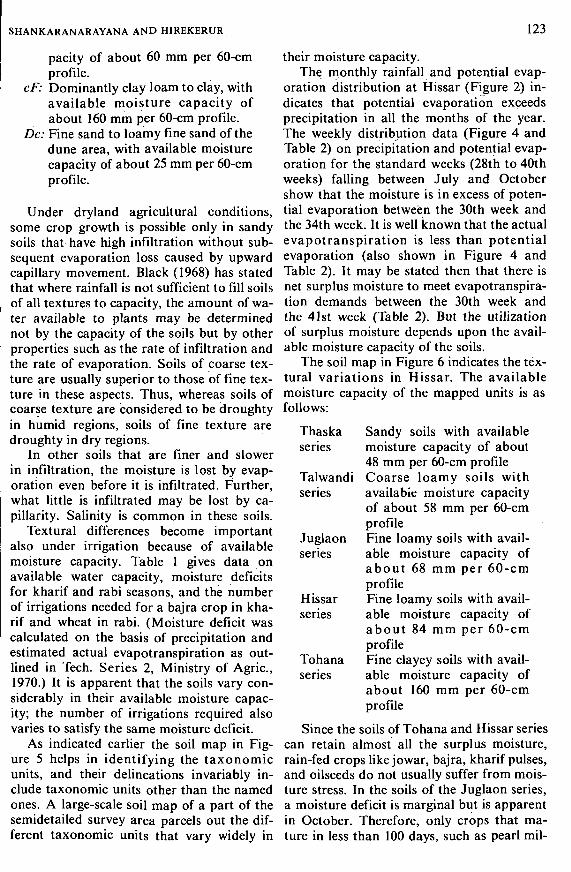
SHANKARANARAYANA AND HIREKERUR 123
pacity of about 60 mm per 60-cmprofile.
cF: Dominantly clay loam to clay, withavailable moisture capacity ofabout 160 mm per 60-cm profile.
Dc: Fine sand to loamy fine sand of thedune area, with available moisturecapacity of about 25 mm per 60-cmprofile.
Under dryland agricultural conditions,some crop growth is possible only in sandysoils that have high infiltration without sub-sequent evaporation loss caused by upwardcapillary movement. Black (1968) has statedthat where rainfall is not sufficient to fill soilsof all textures to capacity, the amount of wa-ter available to plants may be determinednot by the capacity of the soils but by otherproperties such as the rate of infiltration andthe rate of evaporation. Soils of coarse tex-ture are usually superior to those of fine tex-ture in these aspects. Thus, whereas soils ofcoarse texture are considered to be droughtyin humid regions, soils of fine texture aredroughty in dry regions.
In other soils that are finer and slowerin infiltration, the moisture is lost by evap-oration even before it is infiltrated. Further,what little is infiltrated may be lost by ca-pillarity. Salinity is common in these soils.
Textural differences become importantalso under irrigation because of availablemoisture capacity. Table 1 gives data onavailable water capacity, moisture deficitsfor kharif and rabi seasons, and the numberof irrigations needed for a bajra crop in kha-rif and wheat in rabi. (Moisture deficit wascalculated on the basis of precipitation andestimated actual evapotranspiration as out-lined in Tech. Series 2, Ministry of Agric,1970.) It is apparent that the soils vary con-siderably in their available moisture capac-ity; the number of irrigations required alsovaries to satisfy the same moisture deficit.
As indicated earlier the soil map in Fig-ure 5 helps in identifying the taxonomieunits, and their delineations invariably in-clude taxonomie units other than the namedones. A large-scale soil map of a part of thesemidetailed survey area parcels out the dif-ferent taxonomie units that vary widely in
their moisture capacity.The monthly rainfall and potential evap-
oration distribution at Hissar (Figure 2) in-dicates that potential evaporation exceedsprecipitation in all the months of the year.The weekly distribution data (Figure 4 andTable 2) on precipitation and potential evap-oration for the standard weeks (28th to 40thweeks) falling between July and Octobershow that the moisture is in excess of poten-tial evaporation between the 30th week andthe 34th week. It is well known that the actualevapotranspiration is less than potentialevaporation (also shown in Figure 4 andTable 2). It may be stated then that there isnet surplus moisture to meet evapotranspira-tion demands between the 30th week andthe 41st week (Table 2). But the utilizationof surplus moisture depends upon the avail-able moisture capacity of the soils.
The soil map in Figure 6 indicates the tex-tural variations in Hissar. The availablemoisture capacity of the mapped units is asfollows:
Thaska Sandy soils with availableseries moisture capacity of about
48 mm per 60-cm profileTalwandi Coarse loamy soils withseries available moisture capacity
of about 58 mm per 60-cmprofile
Juglaon Fine loamy soils with avail-series able moisture capacity of
about 68 mm per 60-cmprofile
Hissar Fine loamy soils with avail-series able moisture capacity of
about 84 mm per 60-cmprofile
Tohana Fine clayey soils with avail-series able moisture capacity of
about 160 mm per 60-cmprofile
Since the soils of Tohana and Hissar seriescan retain almost all the surplus moisture,rain-fed crops likejowar, bajra, kharif pulses,and oilseeds do not usually suffer from mois-ture stress. In the soils of the Juglaon series,a moisture deficit is marginal but is apparentin October. Therefore, only crops that ma-ture in less than 100 days, such as pearl mil-
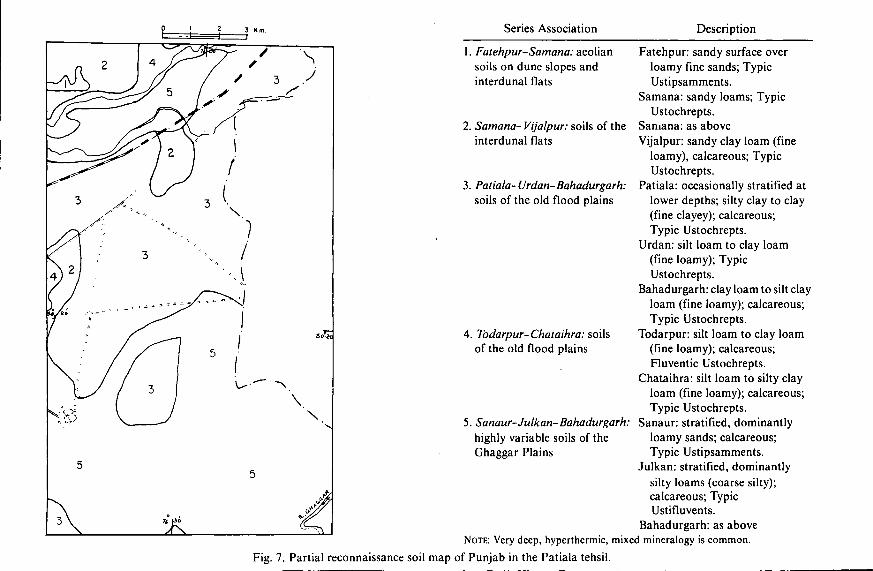
Series Association Description
1. Fatehpur-Samana: aeoliansoils on dune slopes andinterdunal flats
2. Samana- Vijalpur: soils of theinterdunal flats
3. Patiala-Urdan-Bahadurgarh:soils of the old flood plains
Fatehpur: sandy surface overloamy fine sands; TypicUstipsamments.
Samana: sandy loams; TypicUstochrepts.
Samana: as aboveVijalpur: sandy clay loam (fine
loamy), calcareous; TypicUstochrepts.
Patiala: occasionally stratified atlower depths; silty clay to clay(fine clayey); calcareous;Typic Ustochrepts.
Urdan: silt loam to clay loam(fine loamy); TypicUstochrepts.
Bahadurgarh: clay loam to silt clayloam (fine loamy); calcareous;Typic Ustochrepts.
Todarpur: silt loam to clay loam(fine loamy); calcareous;Fluventic Ustochrepts.
Chataihra: silt loam to silty clayloam (fine loamy); calcareous;Typic Ustochrepts.
Sanaur: stratified, dominantlyloamy sands; calcareous;Typic Ustipsamments.
Julkan: stratified, dominantlysilty loams (coarse silty);calcareous; TypicUstifluvents.
Bahadurgarh: as aboveNOTE: Very deep, hyperthermic, mixed mineralogy is common.
4. Todarpur-Chataihra: soilsof the old flood plains
5. Sanaur-Julkan-Bahadurgarh:highly variable soils of theGhaggar Plains
Fig. 7. Partial reconnaissance soil map of Punjab in the Patiala tehsil.
SHANKARANARAYANA AND HIREKERUR
let, sesamum, and legumes, are grown.Because the soils of Talwandi and Thaskacannot hold surplus moisture and start show-ing a deficit from September, they supportonly short-duration and drought-resistantcrops like moth (kidney beans). For a cropunder irrigation like bajra, the Juglaon, Tal-wandi, and Thaska soils may need 1 to 2 irri-gations (Table 1).
The rabi season's moisture deficit is esti-mated as 150 mm. Hence no crop is grownin the rabi season without irrigation. Be-cause of the differing available moisture ca-pacities of the soil series, the frequency ofirrigation also varies: the Thaska soils need3 to 4 irrigations for a crop like wheat,whereas the Tohana soils need only 1; theother soils need 2 to 3.
The monthly rainfall and the potentialand actual evapotranspiration distributionat Patiala (Figure 3) clearly indicate thatthere is a moisture surplus between July andSeptember. The moisture stored during thesemonths can be utilized in subsequentmonths, but this depends on the taxonomieunits (Figures 7 and 8). Below are three rep-resentative taxonomie units mapped in thearea; they illustrate the differences in tex-ture and available moisture capacity (Table1).
Sanaur Dominantly loamy sandseries with available moisture ca-
pacity of about 20 mm per60-cm profile
Daun Dominantly sandy loam toseries loam with available mois-
ture capacity of about 71mm per 60-cm profile
Baha- Dominantly silty clay loamdurgarh with available moistureseries capacity of about 130 mm
per 60-cm profile
The soils of the Daun and Bahadurgarhseries retain enough moisture to supportmost of the kharif crops without irrigation.The light-textured Sanaur soils show a mar-ginal deficit of about 24 mm; hence thesesoils are used for growing crops like bajra,pulses, and oilseeds. In the rabi season, themoisture deficit for a crop like wheat is esti-mated to be about 158 mm; hence irrigation
125
is necessary. The frequency of irrigation,however, depends on the taxonomie unit.Thus the Sanaur soils need as many as 7 to 8irrigations, whereas the other soils requireonly 1 to 2.
The Reconnaissance Soil Map (Figure 7)shows the distribution of soils as series asso-ciations. Association No. 5 represents thehighly variable soils of the Ghaggar plains.The detailed soil map of Sanaur, represent-ing Association 5 (Figure 8), parcels out tax-onomie units varying widely in textural fami-lies and available moisture capacity. Othersoil units consisting of the Fatehpur and Sa-mana series are expected to behave like Sa-naur in moisture characteristics. Soils of thePatiala, Urdan, and Todarpur series wouldbe similar to the Bahadurgarh series, where-as the Vijalpur series is similar to the Daunseries in moisture characteristics.
General Discussion
There is wide variation in rainfall in thethree areas of the plains under study. Soilswithin the different areas vary in texture andavailable moisture capacity. Naturally, agri-cultural use of the soils also differs. In thearid part of the plain in Rajasthan under dry-land conditions, agriculture is practiced to asmall extent and is confined to sandy orcoarse-textured flood-plain soils. Cropsgrown are drought-resistant, and their yieldsare low. Gupta and Prakash (1975) have alsoobserved that in this part of Rajasthan, thesandy soils alone are used for crop produc-tion under rain-fed conditions. Under dry-land agriculture in semiarid Hissar, a varietyof crops are grown, bajra being a dominantkharif crop. In Patiala, where rainfall is high-er, more crops are grown: maize; bajra, asa minor kharif crop; and paddy, under irri-gation. In rabi, although under-irrigationwheat is the important crop in all the areas,gram takes a dominant place in Hissar,though wheat predominates in Patiala.
In Hissar, the rainfall data taken on thebasis of weekly distribution show surplusmoisture periods in the kharif period. Soilsvary in their capacity to sustain crops be-cause of the variable available moisture ca-pacities. Weekly distribution data of rainfall
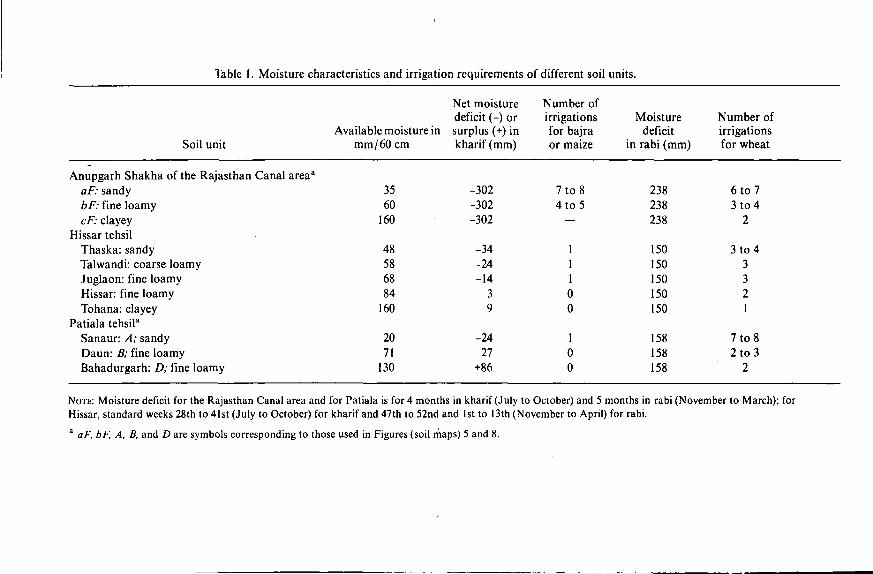
Table 1. Moisture characteristics and irrigation requirements of different soil units.
Soil unit
Anupgarh Shakha of the Rajasthan Canal areaa
aF: sandybF: fine loamycF: clayey
Hissar tehsilThaska: sandyTalwandi: coarse loamyJuglaon: fine loamyHissar: fine loamyTohana: clayey
Patiala tehsiPSanaur: A; sandyDaun: B; fine loamyBahadurgarh: D; fine loamy
Available moisture inmm/60 cm
3560
160
48586884
160
2071
130
Net moisturedeficit (-) orsurplus (+) inkharif (mm)
-302-302-302
-34-24-14
39
-2427
+86
Number ofirrigationsfor bajraor maize
7 to 84 to 5
—
11100
100
Moisturedeficit
in rabi (mm)
238238238
150150150150150
158158158
Number ofirrigationsfor wheat
6 to 73 to 4
2
3 to 43321
7 to 82 to 3
2
NOTE: Moisture deficit for the Rajasthan Canal area and for Patiala is for 4 months in kharif (July to October) and 5 months in rabi (November to March); forHissar, standard weeks 28th to 41st (July to October) for kharif and 47th to 52nd and 1st to 13th (November to April) for rabi.a aF, bF, A, B, and D are symbols corresponding to those used in Figures (soil maps) 5 and 8.
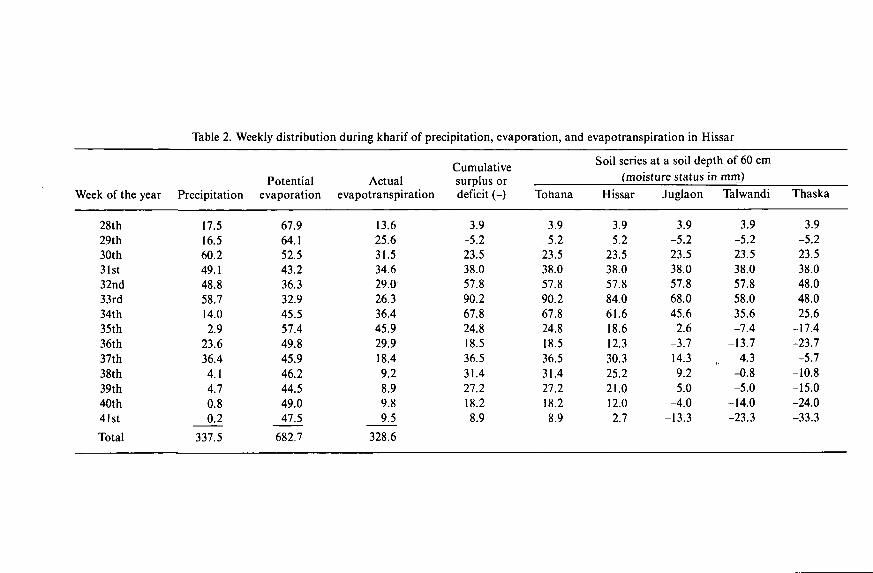
Table 2. Weekly distribution during kharif of precipitation, evaporation, and evapotranspiration in Hissar
Week of the year
28th29th30th31st32nd33rd34th35th36th37th38th39th40th41st
Total
Precipitation
17.516.560.249.148.858.714.02.9
23.636.44.14.70.80.2
337.5
Potentialevaporation
67.964.152.543.236.332.945.557.449.845.946.244.549.047.5
682.7
Actualevapotranspiration
13.625.631.534.629.026.336.445.929.918.49.28.99.89.5
328.6
Cumulativesurplus ordeficit (-)
3.9-5.223.538.057.890.267.824.818.536.531.427.218.28.9
Tohana
3.9-5.223.538.057.890.267.824.818.536.531.427.218.28.9
Soil series at a soil depth of 60 cm(moisture status in mm)
Hissar
3.9-5.223.538.057.884.061.618.612.330.325.221.012.02.7
Juglaon
3.9-5.223.538.057.868.045.6
2.6-3.714.39.25.0
-4.0-13.3
Talwandi
3.9-5.223.538.057.858.035.6-7.4
-13.74.3
-0.8-5.0
-14.0-23.3
Thaska
3.9-5.223.538.048.048.025.6
-17.4-23.7-5.7
-10.8-15.0-24.0-33.3
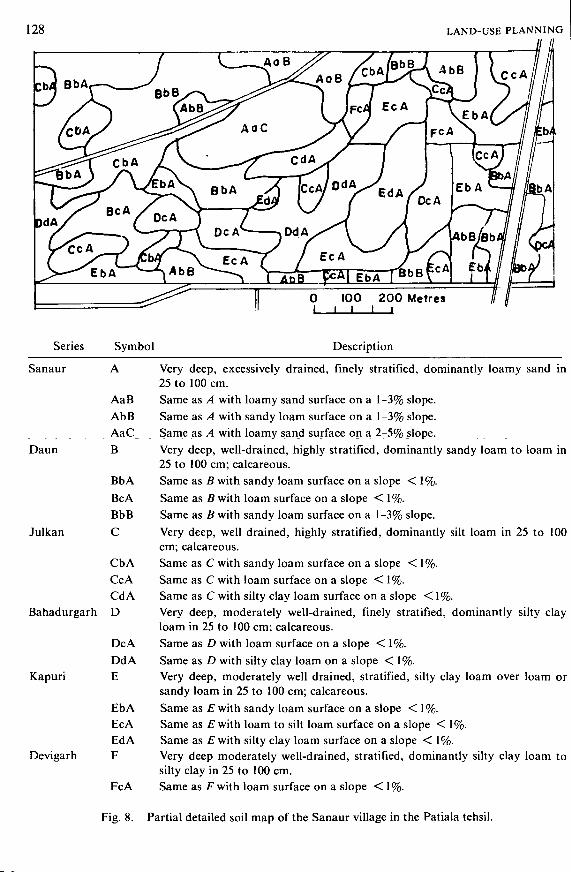
LAND-USE PLANNING
0 100 200 MetresI i i i i
Series Symbol Description
Sanaur A Very deep, excessively drained, finely stratified, dominantly loamy sand in25 to 100 cm.
AaB Same as A with loamy sand surface on a 1-3% slope.AbB Same as A with sandy loam surface on a 1-3% slope.AaC_ Same as A with loamy sand surface on a 2-5% slope.
Daun B Very deep, well-drained, highly stratified, dominantly sandy loam to loam in25 to 100 cm; calcareous.
BbA Same as B with sandy loam surface on a slope < 1%.Be A Same as B with loam surface on a slope < 1%.BbB Same as B with sandy loam surface on a 1-3% slope.
Julkan C Very deep, well drained, highly stratified, dominantly silt loam in 25 to 100cm; calcareous.Same as C with sandy loam surface on a slope < 1%.Same as C with loam surface on a slope < 1%.Same as C with silty clay loam surface on a slope < 1%.Very deep, moderately well-drained, finely stratified, dominantly silty clayloam in 25 to 100 cm; calcareous.
DcA Same as D with loam surface on a slope < 1%.DdA Same as D with silty clay loam on a slope < 1%.
Kapuri E Very deep, moderately well drained, stratified, silty clay loam over loam orsandy loam in 25 to 100 cm; calcareous.
EbA Same as £with sandy loam surface on a slope < 1%.EcA Same as E with loam to silt loam surface on a slope < 1%.Ed A Same as £ with silty clay loam surface on a slope < 1%.
Devigarh F Very deep moderately well-drained, stratified, dominantly silty clay loam tosilty clay in 25 to 100 cm.
FcA Same as F with loam surface on a slope < 1%.
CbACcACd A
Bahadurgarh D
Fig. 8. Partial detailed soil map of the Sanaur village in the Patiala tehsil.
SHANKARANARAYANA AND HIREKERUR 129
in similar areas will be useful in correlatingthe relationship existing amongst soil, mois-ture, and crop. The existing land use throwslight on the soil-moisture characteristics withreference to crop growth. Agricultural landuse gives a different picture for Patiala,where there is enough rainfall to producedifferent crops and where generally maize ispreferred to bajra.
The number of irrigations needed for soilsvaries according to the stored soil moistureand the available moisture capacity. Al-though the number of irrigations given in Ta-ble 1 is calculated on the basis of availablemoisture capacity, in practice more irriga-tions are needed because irrigation is givenbefore the crop reaches the wilting stage. Inthe case of reclamation again, soils vary intheir response to measures like time andamount of leaching required. It is commonknowledge, for example, that soil salinity ishighly variable in any given area; in theseplains, soil texture is also variable. Hence,tying salinity conditions to texture is veryimportant. Should soils be mapped with thispoint in mind, effective recommendations onreclamation would be possible.
In rabi season, crops like wheat, mus-tard, and gram are grown in the Tohana andHissar soils, though their moisture deficit is
apparent. This anomoly may be due to thecontribution of moisture from dew and frominternal condensation within the soil profileduring the growth period. It is also probablethat wheat may withstand greater stress thanis generally understood (Richards and Rich-ards, 1957). Gram and mustard are moretolerant of drought than is wheat.
Small-scale soil maps and the memoirsseparate soil series associations and providestatements on soil series phases; these canbe used for preparing large-scale maps. In agiven subclimate, textural variations need tobe separated out (soil series association) inthe small-scale maps so that interpretationcan be made for growing crops and for cul-tural practices. It is not adequate to consideronly the accessory characteristics, that is,organic matter, base status, and salinity ashas been mentioned in Soil Taxonomy(USDA, 1970). Small-scale maps should helpin delineating potential and problem areasfor broad-level planning and research needs,whereas large-scale maps should provide thebasis for the application of research findings.
It may be concluded that soil mapping forland evaluation in our country should takeinto account rain-fed agriculture, high-inten-sity land use, small holdings, and low to highlevel of management.
Literature Cited
BIE, S.W., and P. H.T. BECKETT. 1970. The costs of soil survey. Soils and Fertilizer, pp. 33-43.BLACK, C. A. 1968. Soil-plant relationships. John Wiley and Sons, N.Y.FAO and UNDP. 1971. Soil survey and soil and water management research and demonstration in
the Rajasthan Canal area, India. Tech. Reports 1 to 10.GUPTA, R. K.., and I. PRAKASH (ed.) 1975. Environmental analysis of Thar Desert. English Book Depot,
Dehradun, India.HARYANA AGRIC. UNIV. 1970. Progress report of coordinated scheme for irrigation research in the
River Valley Project. Haryana Agric. Univ., Hissar, India.MINISTRY OF AGRICULTURE, Government of India. 1970. A guide for estimating irrigation water require-
ments. Dept. of Agric. Tech. Series 2.REQUIER, J., D. LUIS BRAMAO, and J. P. CORNET. 1970. A new system of soil approach in terms of actual
and potential productivity. FAO AGL TES R/70/6.RICHARDS, L. A., and S.J. RICHARDS. 1957. Soils, Yearb. Agric, USDA, Washington, D.C.ROBERTSON, V. C, T. N. JEWITT, A. P. S. FORBES, and R. LAW. 1968. The assessment of land quality for
primary production. Land evaluation paper of CSIRO organized in cooperation with UNESCO.Macmillan of Australia, Melbourne.
SWAMINATHAN, M.S. 1973. Our agricultural future. Sardar Patel memorial lectures. All India Radio,New Delhi.
USDA, SCS, Soil Survey Staff. 1970. Soil taxonomy. U.S. Government Printing Office, Washington,DC.
Land Evaluation for Agricultural Land-Use Planning
J. BENNEMA
Department of Soil Science and GeologyAgricultural University, Wageningen, The Netherlands
The principles of modern land evaluation are described in terms of land utilization types, suchas maize or timber production; land attributes, such as the nature of the soil and vegetation; qual-ities of land attributes, such as soil response to fertilizer or the yearly production of natural vege-tation; and the land characteristics upon which these qualities depend, such as the organic matterof the topsoil or the dominant species in the vegetation. The interaction between one land utiliza-tion type and others in the surrounding areas is emphasized. The interaction between a landutilization type and the land unit is also emphasized, because permanent reconstruction of theland unit may occur.
Physical land evaluation is seen as a multidisciplinary exercise involving many types of spe-cialists. In any final report on physical land evaluation, it is almost always necessary to specify indetail the management levels assumed in the study. In fact in all physical land evaluations, cost-benefit ratios of the recommended land evaluation types or improvements are always implied.Socioeconomic studies can follow a physical land evaluation, but much can be gained by havingthe two sets of studies operate simultaneously. They can assist each other in adjusting to therealistic possibilities of a particular situation.
Procedures for carrying out physical land evaluations with and without major improvementssuch as irrigation and with and without accompanying socioeconomic studies are described andpresented in diagnostic form.
Land evaluation is as old as man choosing ceived greater impetus of late, because it hasparts of the land for his private purposes. Al- become increasingly clearer that an efficientthough land evaluation as a systematic ap- land use that does not degrade the land re-proach is younger, it already has a long his- sources can be obtained only when the landtory, especially in relation to taxation, a conditions or ecosystems with all the detailsubject that today interests different govern- germane to the use in question are wellments. known.
However, the interest of those who study Different disciplines in the field of natur-natural resources and soils is directed strong- al-resource investigations have developedly towards land evaluation for better land systems for physical land evaluations, anduse, that is, agricultural land use or other two such disciplines have already estab-uses (Bartelli et al., 1966). This paper will lished a certain tradition namely, the forest-focus on land evaluation for agricultural land ers and the pedologists. The foresters, deal-use, which can serve as a tool for agricultural ing with wood production, nature preserva-development. The importance of land evalu- tion, and environmental control, may chooseation for better agricultural land use has re- land units on the basis of geographical nat-
130
BENNEMA 131
ural vegetation units (if present) (see alsoBennema and van Goor, 1975); the pedolo-gists will choose land units on the basis ofsoil units with phases.
Although land evaluation based on soilunits is sometimes known as soil-suitabilityclassification, I do not see any principal dif-ference between a soil-suitability classifica-tion and a physical land evaluation, at leastnot for areas in which the main differencesfor physical land evaluation can be con-nected with the soil units and their phases.
Steele (1967) has reviewed the system ofsoil-suitability classification and also soil-survey interpretation in general. There aretwo internationally known systems of soil-suitability classification; both were devel-oped in the United States where they havebeen used extensively: (1) the capabilityclassification of the USD A, ConservationService (Klingebiel and Montgomery, 1961);and (2) the land evaluation of the Bureau ofReclamation (U.S. Dept. of Interior, 1953;Maletic and Hutchings, 1967). The latter, acomplete system or approach to land evalua-tion, has been developed principally to eval-uate the irrigation possibilities of develop-ment projects in the United States. The soilcapability system was designed initially as atool to curb the spreading soil erosion in theUnited States, but it has had a wider appli-cation. Both systems have been used outsidethe United States with many adaptions (seeexample in Olson, 1974).
Another approach, based on the conceptof Storie indexes (Storie, 1937), is nowknown as the parametric system (see exam-ples in Riquier, 1974; Boyer, 1974; Teaci andBurt, 1974; Garbrouchev et ai., 1974; Sys.1975; Soepraptohardjo and Driessen, 1975).The parametric system has a direct bearingon a part of land evaluation, namely, the de-termination of yield potentials. The contribu-tion of Wishmeyer and Smith (1965) for thedetermination of erosion susceptibility ofland is of the same kind.
The question may arise why renewed at-tention, time, and effort are now given to theprinciples of land evaluation. Are the exist-ing systems inadequate to serve the differentpurposes of any land evaluation? Most land-
evaluation systems in use now serve theirpurpose well, at least the purpose for whichthey were designed initially. However, thepurposes are, as noted earlier, always lim-ited. Meantime, we have become more andmore aware that land evaluation, were it tosee world-wide use, has to deal with manydifferent situations (purposes).
Purposes may vary greatly, or the utiliza-tion types for which the land evaluationshave to be made may be quite different ones.For example, to sort out broad land-use pos-sibilities may be one purpose; to obtaindetailed information needed for land-usepossibilities and for possible adaptions of theutilization types to local land conditions maybe another purpose.
Many land evaluations have to be madefor utilization types not only because somany different products are involved—prod-ucts often having different ecological re-quirements—but also because the level ofagricultural management varies so muchthroughout the world.
Till a short time ago, land evaluation wasmuch more concerned with the development 'jof modern medium- to large-scale agricul-rture than with the development possibilitiesof the traditional farming of the small hold-ers in tropical countries. Land evaluationwas also not well equipped to deal with thedevelopment possibilities of agriculture ofthe small holders, because only very little ofthe agricultural research done then was ori-ented toward this problem. Moreover, landevaluation itself was often concerned morewith obtaining information about land suit-ability than with obtaining information aboutthe possibilities of adjusting present landuses to land conditions (land-condition in-formation is of special interest to the smallholder).
Specialists dealing with land evaluationsare much concerned that planning of ruralland use often proceeds without enough in-formation and that when information isavailable it is not fully used. There are manyexamples of agricultural development plan-ning that went wrong because basic dataabout the environment were either missingor wrongly interpreted. It is disappointing to
132
see how planners often give thoughts to de-signing development plans for lands on thebasis of very little information, whereas agood integration of natural-resource datacould have resulted in a valuable plan.
That this integration is sometimes lack-ing is not only the planners' fault; it is alsothe fault of the specialists dealing with thenatural resources. The environment is verycomplex, but the numerous data of many dif-ferent characteristics the specialists collectmay have meaning for the specialists but notfor the planners. The planners must be pre-sented with data that can be readily under-stood and used. Unfortunately, however, inthe past, data were presented in forms un-intelligible to the planners, who consequent-ly often made their own simplified model ofthe environment without using the data pro-vided by the specialists about all the intricateconditions of the environment.
Models of the environment to be usedhave to be simplifications, but the simplifica-tion should be sought more in a synthesis ofthe relevant data than in a suppression ofbasic data. Thus, the construction of suchmodels can be seen as one aim of land evalu-ation.
The new attention to land evaluation isgiven not so much to design a fixed systembut more to study the principles and conceptson which any system can be based, or, inother words, to construct a general frame-work. The procedures and concepts of soilsurveys and soil classification have been sub-jects of thought and discussion for a longtime, and they are becoming better under-stood. However, until recently, little atten-tion was given to the principles of land clas-sification. If the general principles are betterunderstood, it will be easier to generate ade-quate systems for any situation.
I was confronted with these general prin-ciples for the first time while designing, to-gether with Mr. Beek and Mr. Camargo, asoil-suitability classification for Brazil, tak-ing into account different management lev-els. The documents by Beek et al. (1964) andBeek and Bennema (1972) and that edited byMahler (1970), dealing with the suitabilityfor irrigation in Iran, together with the al-
LAND-USE PLANNING
ready widely used systems of land evalua-tion, formed the main basic material for theexperts' consultation organized by the FAOin Wageningen (Oct., 1972), which dealtwith the principles of land evaluation. Con-sensus on these principles among the partici-pants was wider than expected (see the sum-mary of the meeting "Land evaluation forrural purposes," Brinkman and Smyth, ed.,1973). The main documents were publishedby the FAO (Approaches to land classifica-tion, Soils Bulletin 22, 1974; see also FAO1975, 1976; Vink, 1975; and Beek, 19756).
General
The subject of this paper is land evalua-tion for agricultural use, agricultural usebeing understood in its broadest sense to in-clude cropping, horticulture, forestry, rang-ing, and the like.
Land offers different possibilities for dif-ferent kinds of land-utilization types, and it isnecessary to start a land evaluation withbroad definitionsof the relevant land-utiliza-tion types for which the suitability is beingestimated. Land-utilization types can be de-fined in terms of the so-called key attributes,that is, the diagnostic criteria important forthe land evaluation. Examples of such keyattributes are type of produce, labor intensi-ty, capital intensity, farm power, farm size,and farmer's level of know-how.
The use of the land may change the con-ditions of the tract of land being used, and itmay lead to degradation of that tract. Itmight also have an impact on a wider area.But since a marked degradation of the en-vironment is unacceptable, land evaluationmust take environmental control into ac-count.
Land suitabilities for defined uses and theimpact of the uses on the environment aredetermined by land conditions—in otherwords, by the qualities of the attributes ofthe land (not to be confused with key attri-butes of land-use types) (see Kellogg, 1953and 1961). Vegetation and soil are examplesof land attributes. Yearly production andfood value are qualities of the natural grass
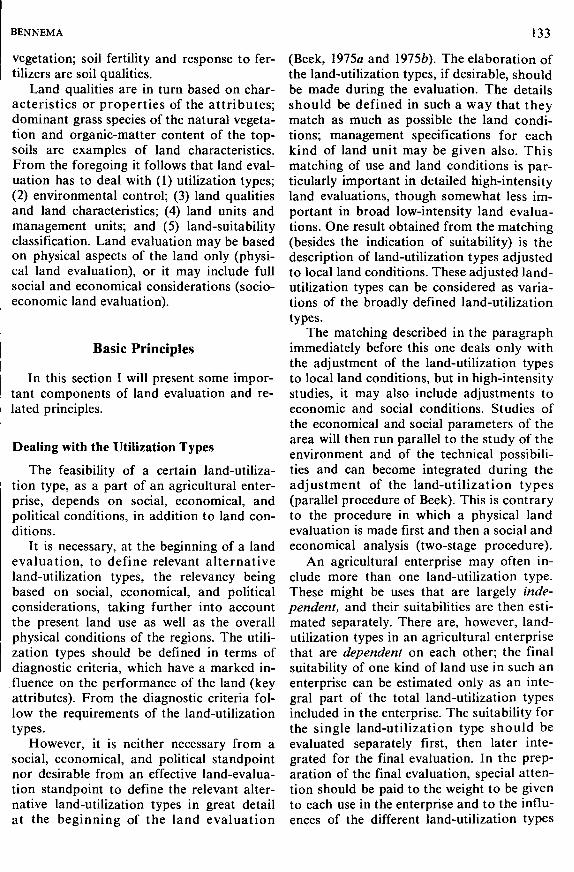
BENNEMA 133
vegetation; soil fertility and response to fer-tilizers are soil qualities.
Land qualities are in turn based on char-acteristics or properties of the attributes;dominant grass species of the natural vegeta-tion and organic-matter content of the top-soils are examples of land characteristics.From the foregoing it follows that land eval-uation has to deal with (1) utilization types;(2) environmental control; (3) land qualitiesand land characteristics; (4) land units andmanagement units; and (5) land-suitabilityclassification. Land evaluation may be basedon physical aspects of the land only (physi-cal land evaluation), or it may include fullsocial and economical considerations (socio-economic land evaluation).
Basic Principles
In this section I will present some impor-tant components of land evaluation and re-lated principles.
Dealing with the Utilization Types
The feasibility of a certain land-utiliza-tion type, as a part of an agricultural enter-prise, depends on social, economical, andpolitical conditions, in addition to land con-ditions.
It is necessary, at the beginning of a landevaluation, to define relevant alternativeland-utilization types, the relevancy beingbased on social, economical, and politicalconsiderations, taking further into accountthe present land use as well as the overallphysical conditions of the regions. The utili-zation types should be defined in terms ofdiagnostic criteria, which have a marked in-fluence on the performance of the land (keyattributes). From the diagnostic criteria fol-low the requirements of the land-utilizationtypes.
However, it is neither necessary from asocial, economical, and political standpointnor desirable from an effective land-evalua-tion standpoint to define the relevant alter-native land-utilization types in great detailat the beginning of the land evaluation
(Beek, 1975a and 19756). The elaboration ofthe land-utilization types, if desirable, shouldbe made during the evaluation. The detailsshould be defined in such a way that theymatch as much as possible the land condi-tions; management specifications for eachkind of land unit may be given also. Thismatching of use and land conditions is par-ticularly important in detailed high-intensityland evaluations, though somewhat less im-portant in broad low-intensity land evalua-tions. One result obtained from the matching(besides the indication of suitability) is thedescription of land-utilization types adjustedto local land conditions. These adjusted land-utilization types can be considered as varia-tions of the broadly defined land-utilizationtypes.
The matching described in the paragraphimmediately before this one deals only withthe adjustment of the land-utilization typesto local land conditions, but in high-intensitystudies, it may also include adjustments toeconomic and social conditions. Studies ofthe economical and social parameters of thearea will then run parallel to the study of theenvironment and of the technical possibili-ties and can become integrated during theadjustment of the land-utilization types(parallel procedure of Beek). This is contraryto the procedure in which a physical landevaluation is made first and then a social andeconomical analysis (two-stage procedure).
An agricultural enterprise may often in-clude more than one land-utilization type.These might be uses that are largely inde-pendent, and their suitabilities are then esti-mated separately. There are, however, land-utilization types in an agricultural enterprisethat are dependent on each other; the finalsuitability of one kind of land use in such anenterprise can be estimated only as an inte-gral part of the total land-utilization typesincluded in the enterprise. The suitability forthe single land-utilization type should beevaluated separately first, then later inte-grated for the final evaluation. In the prep-aration of the final evaluation, special atten-tion should be paid to the weight to be givento each use in the enterprise and to the influ-ences of the different land-utilization types
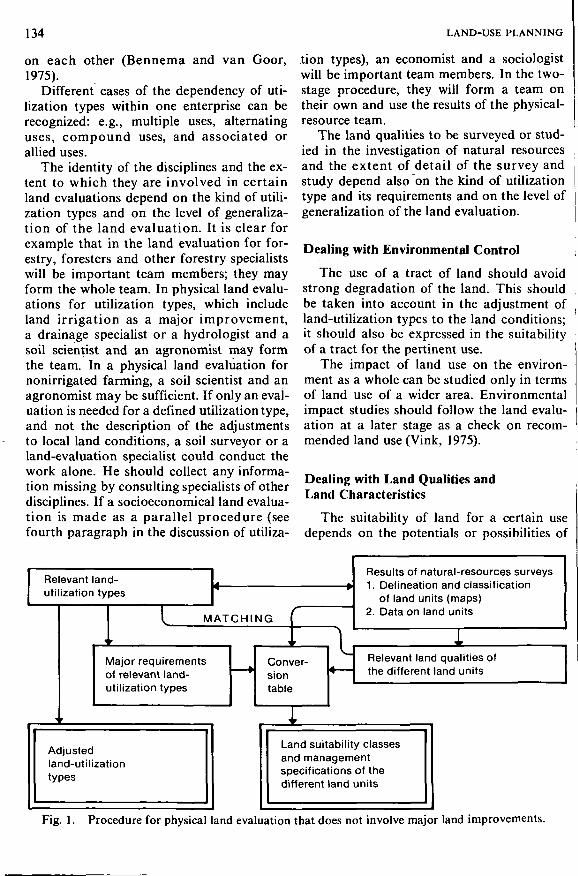
134 LAND-USE PLANNING
on each other (Bennema and van Goor,1975).
Different cases of the dependency of uti-lization types within one enterprise can berecognized: e.g., multiple uses, alternatinguses, compound uses, and associated orallied uses.
The identity of the disciplines and the ex-tent to which they are involved in certainland evaluations depend on the kind of utili-zation types and on the level of generaliza-tion of the land evaluation. It is clear forexample that in the land evaluation for for-estry, foresters and other forestry specialistswill be important team members; they mayform the whole team. In physical land evalu-ations for utilization types, which includeland irrigation as a major improvement,a drainage specialist or a hydrologist and asoil scientist and an agronomist may formthe team. In a physical land evaluation fornonirrigated farming, a soil scientist and anagronomist may be sufficient. If only an eval-uation is needed for a defined utilization type,and not the description of the adjustmentsto local land conditions, a soil surveyor or aland-evaluation specialist could conduct thework alone. He should collect any informa-tion missing by consulting specialists of otherdisciplines. If a socioeconomical land evalua-tion is made as a parallel procedure (seefourth paragraph in the discussion of utiliza-
tion types), an economist and a sociologistwill be important team members. In the two-stage procedure, they will form a team ontheir own and use the results of the physical-resource team.
The land qualities to be surveyed or stud-ied in the investigation of natural resourcesand the extent of detail of the survey andstudy depend also on the kind of utilizationtype and its requirements and on the level ofgeneralization of the land evaluation.
Dealing with Environmental Control
The use of a tract of land should avoidstrong degradation of the land. This shouldbe taken into account in the adjustment ofland-utilization types to the land conditions;it should also be expressed in the suitabilityof a tract for the pertinent use.
The impact of land use on the environ-ment as a whole can be studied only in termsof land use of a wider area. Environmentalimpact studies should follow the land evalu-ation at a later stage as a check on recom-mended land use (Vink, 1975).
Dealing with Land Qualities andLand Characteristics
The suitability of land for a certain usedepends on the potentials or possibilities of
Reuti
evant land-ization types
4
t MATCHING [t
Major requirementsof relevant land-utilization types
Adjustedland-utilizationtypes
iConver-siontable
i
Results of natural-resources surveys1. Delineation and classification
of land units (maps)2. Data on land units
Relevant land qualities ofthe different land units
Land suitability classesand managementspecifications of thedifferent land units
Fig. 1. Procedure for physical land evaluation that does not involve major land improvements.
BENNEMA 135
Relevant land-utilization types
MATCHING
Results of natural-resources surveys1. Delineation and classification
of land units2. Data of land units
Possibilities ofimprovement1. Input2. Know-how
Major requirementsof land-utilization types
Conver-siontable
Relevant land qualitiesof the different land unitsbefore improvement
Improvement capacities1. Feasibility of improvement2. Required inputs
Relevant land qualitiesof the different land unitsafter improvement
Adjusted land-utilization types Land-suitability classesof the different land units,improvement specifications, andmanagement specifications
Fig. 2. Procedure for physical land evaluation that involves major land improvements.
the land in relation to management, conser-vation, production, and major improvements.These potentials can be estimated only in re-lation to defined utilization types. They de-pend on the so-called land qualities.
Land qualities clearly distinct from mostother land qualities in their influence on landsuitability for a specific land-utilization typecan be used as diagnostic criteria (assess-ment factors in land evaluation). Land quali-ties can be related to either the direct use ofthe land or the possibilities of major im-provement of the land conditions (improve-ment qualities). The land qualities related tothe direct use include ecological qualitiespertinent to plant and animal growth andmanagement qualities. Examples of ecolog-ical qualities for crop growth are availability
of nutrients, oxygen (for roots), water, andradiation energy; risks of damage by hail,storm, and inundations; and temperature re-gime. Important management qualities in-clude possibility of mechanization; accessi-bility of different parts of the farm; and thepossibilities of successful conservation meth-ods. The values for the qualities are inde-pendent of the use.
Normally, a different set of qualities isrelevant for different broad uses. However,being important for more than one use, aquality may be a member of different sets.It is said then to have different critical valuesfor different uses. Thus the same value has adifferent meaning for different uses.
It is not necessary to use land qualities ifonly the production levels Have to be deter-
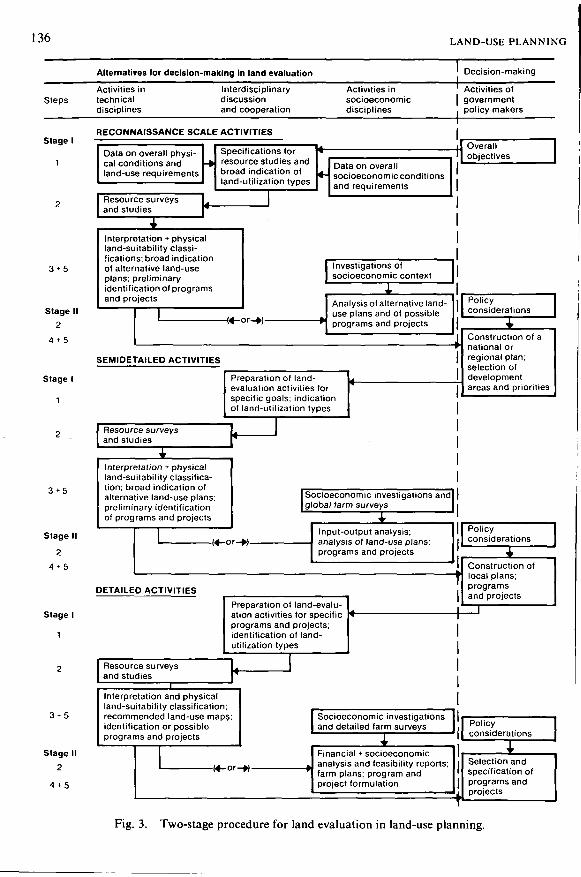
136 LAND-USE PLANNING
Alternatives lor decision-making in land evaluation Decision-making
StepsActivities intechnicaldisciplines
Interdisciplinarydiscussionand cooperation
Activities insocioeconomicdisciplines
Activities ofgovernmentpolicy makers
Stage I
1
3 + 5
Stage II2
4 * 5
Stage I
1
3 + 5
Stage II
2
4 + 5
Stage I
1
3 + 5
Stage II2
4 + 5
RECONNAISSANCE SCALE ACTIVITIES
Data on overall physi-cal conditions andland-use requirements
Specifications forresource studies andbroad indication ofland-utilization types
Resource surveysand studies
Data on overallsocioeconomic conditionsand requirements
Overallobjectives
Interpretation + physicalland-suitability classi-fications; broad indicationof alternative land-useplans; preliminaryidentification of programsand projects
L
Investigations ofsocioeconomic context
Analysis of alternative land-use plans and of possibleprograms and projects
Policyconsiderations
SEMIDETAILED ACTIVITIES
Preparation of land-evaluation activities forspecific goals; indicationof land-utilization types
Construction of anational orregional plan;selection ofdevelopmentareas and priorities
Resource surveysand studies
Interpretation + physicalland-suitability classifica-tion; broad indication ofalternative land-use plans;preliminary identificationof programs and projects
Socioeconomic investigations andglobal farm surveys
- (« -o r -« .Input-output analysis;analysis of land-use plans;programs and projects
Policyconsiderations
DETAILED ACTIVITIES
Preparation of land-evalu-ation activities for specificprograms and projects;identification of land-utilization types
Resource surveysand studies
Construction oflocal plans;programsand projects
J
Interpretation and physicalland-suitability classification;recommended land-use maps;identification or possibleprograms and projects
Socioeconomic investigationsand detailed farm surveys Policy
considerations
-(4-or-W-Financial + socioeconomicanalysis and feasibility reports;farm plans; program andproject formulation
Selection andspecification ofprograms andprojects
Fig. 3. Two-stage procedure for land evaluation in land-use planning.

BENNEMA 137
mined for specific produce and specific utili-zation types. These production levels canbe found by direct measurements of pro-duction potentials or by use of the rela-tion of yield and local land characteristicsfor regionalization. Values are thus assignedto the land characteristics after an empiricalassessment is made on the basis of assumedcorrelations between measured yields andrelevant land (soil) characteristics.
Land qualities must be used, however,when, in addition to the expected yield, theadjustments of the land-utilization types tothe land conditions and to the managementspecification have to be described. Here val-ues are assigned to the land qualities on thebasis of the expression of these qualities bythe natural vegetation, indicator plants, landuse, crop growth (during the whole growingperiod), crop yields, and known crop haz-ards. From the underlying land character-istics, models (e.g., for water availabilityshowing water balance) can be used. Notethat the influence of a particular land char-acteristic on the value of a land quality de-pends on the whole set of land characteris-tics. The meaning of soil depth, for example,in a climate without a dry period is quitedifferent from that in a climate with a dryperiod (this also holds for parametr icmethods, which should therefore be appliedto smaller regions).
In sets of qualities related to agriculture,characteristics and qualities of soil and ofclimate always play a role. Characteristicsand qualities related to other land attributesare important (sometimes all important) insome, but not all, agricultural land use.
There are many different soil qualitiesand soil characteristics: some are related tothe performance of plant and animal; othersare related to the management of soils; andthere are those relevant to the resistance ofland to degradations and those relevant topossibilities of improvement. Soil qualitiesand soil characteristics often show a strongvariability within a short distance. Many ofthese qualities are surveyed especially for aspecific land evaluation.
Dealing with Land Units andManagement Units
Values of pertinent land qualities andcharacteristics are assigned normally to landunits. For forestry and for grazing, geo-graphical vegetation units may be used asland units, whereas in land evaluation for ag-ricultural use in a strict sense, geographicalsoil units with phases are used as the base forland units.
Soil units are classified mostly by theirdominant soil profiles or pedons, based onthe inherent characteristics of the pedons.Soil classification on a world-wide base (SoilTaxonomy, 1975) makes it possible to orga-nize the knowledge about soils in an orderlymanner also on a world-wide base. The studyof benchmark soils is hence a powerful tool.It is possible to use this increasing pool ofknowledge for land evaluation. For the clas-sification of the soil units, the Soil Taxon-omy or another system is used to the extentthat it can be easily translated in the classifi-cation of Soil Taxonomy for higher levels ofclassification (see for example the legend inthe Soil Map of the World by FAO/UNES-CO). It should be realized, however, that soilunits belonging to the same class of a classi-fication system do not necessarily have thesame qualities in relation to a projected use.It is often necessary to add phases to theseclassification units, the most importantphases in tropical areas being those relatedto topography, ecological zone, and land-usehistory.
Land units having values of land qualitiesthat result in about the same performance fora pertinent use may be grouped together.Such technical groups are called manage-ment units, a name used by the USDA SoilConservation Service in their land-capabilityclassification. The constraints in one man-agement unit are caused by the same quali-ties, and the suitability class for all themembers (land units) of this group is also thesame. Beek ( 1915b) points out also that a con-venient grouping can be made of land unitsfor which the main constraints are due to thesame qualities and for which the same kind
138 LAND-USE PLANNING
of management is foreseen without havingnecessarily the same suitability (due to loweryields). These groups could be used to ad-vantage in describing management specifica-tions.
Land units belonging to one managementunit have much in common for a specific use;this does not mean that all these land unitsare exactly the same in their performances.They are considered to act the same on a cer-tain (relatively low) level of generalization.General management specifications can bemade for management units, but the prac-tical elaboration of these specifications oftenhas to be based on the land units and evenon the individual tracts of lands. The same,but to a lesser extent, holds for the detailedadjustment of the land-utilization types.
For certain uses, a combination of landunits sometimes can be handled as if it wereone unit (compound land unit). This meansthat a management unit may consist of com-pound land units. Such is the case with graz-ing, which uses wet bottomlands in the dryseason and uplands in the wet season.
Management units are always made for aspecific kind of use. Different uses may needdifferent groupings. This applies also to themanagement units of the capability classifi-cation of the USDA Soil Conservation Ser-vices. These management units are validonly for uses that are in accordance with theassumptions on which the capability classifi-cation is based; therefore, they should not beapplied to uses different from those meant inthe assumptions. The management units ofthis system are sometimes misused.
The Land-Suitability Classification
The land suitability for a utilization typeis determined by a specific set of land quali-ties. The important influence of a land quali-ty on the suitability for a specific land-uti-lization type is the influence on cost and onbenefits in particular, the cost/benefit ratio;next in importance, negatively or positively,is the influence on environmental control.
The influence of land quality on the cost/benefit ratio is only implied in the physicalland evaluation; it is made explicit in the
socioeconomic land evaluation. The influ-ence of a land quality on the cost/benefitratio depends on the value ofthat quality andon the kind of utilization type. The same val-ues of one quality therefore normally haveother meanings for different uses.
Land evaluations or land-suitability clas-sifications can be made on different levels ofgeneralization:
1. Physical land evaluations that indi-cate land suitability for broadly de-fined land-utilization types.
2. Physical land evaluations that, inaddition to indicating land suitabili-ty, describe the adjustments to localland conditions and the managementspecifications.
3. Socioeconomic land evaluations re-sulting from an integrated parallelprocess or from a second stage fol-lowing a physical land evaluation.The socioeconomic land evaluationtakes into account not only the localland conditions but also the localeconomical and social conditions.
Land evaluations for utilization types forwhich major improvements play a role willhave as extra output the description of: (1)the relative cost or costs of the improvementworks; (2) the improvement specification;and (3) the expected success of the improve-ment in terms of the values of the land quali-ties after the improvement. It should benoted that improvement may have a positiveeffect as well as a negative effect on certainland qualities (e.g., with irrigation, the posi-tive effect is the better availability of water;the negative effect is the increase in saliniza-tion hazard).
Procedure
Land-evaluation procedures depend onthe purpose of the evaluation. Figures 1 and2 show the broad outline of a procedure forphysical land evaluations where adjustmentsare made of the land-utilization types to thelocal land conditions. Figure 1 refers to aprocedure that does not involve major land
BENNEMA 139
improvements; Figure 2, to one that does in-volve major improvements. The procedure isas follows:
1. Define the socioeconomic and politi-cally relevant land uses, taking intoaccount present land use and theoverall land conditions.
2. Indicate for which areas, regions, orsubregions these utilization typesare relevant and for which they areirrelevant. This is to reduce subse-quent work load; that is, investigateonly those suitabilities of certainland-utilization types that are of in-terest for the specific area.
3. The kind of land qualities, majorcharacteristics, and improvementpossibilities to investigate followfrom the second step.
4. If major improvement is foreseen, aspecial study about the improvementpossibilities is needed, which, in cer-tain cases, may be the most impor-tant and most time-consuming partof the evaluation. The study will re-sult in a description of the easiness(or costs) of the improvement works,specifications about the way itshould be carried out, and the ex-pected values of the land qualitiesaffected.
5. Use the values of the ecological andmanagement qualities to adjust landuses to land conditions. This may af-fect, for example, the kind of ma-chinery to be used and the percent-ages of rotat ional crops to beplanted.
6. The values of the qualities relevantto the efficiency (costs) of manage-ment and those related to the yieldpotentials or the yield potentialsthemselves will be the base for thesuitability classification.
7. The study should be completed witha description of management speci-fications.
A full socioeconomic study could followthese physical land evaluations, which wouldshow the suitability for alternative land-utili-zation types. A simpler economic study ispossible by using some simple parameters:price of products, price of labor, and esti-mated investment without optimalizations(Vink, 1960; for practical application see alsoFAO, 1971).
The procedure described is the two-stageprocedure. In a parallel procedure, the socio-economic data are used together with thedata about the environment for the adjust-ment of the utilization types, both to the landconditions and to the socioeconomic condi-tions. Examples of socioeconomic conditionsare land-tenure conditions, labor shortages,marketing possibilities, and credit.
Figure 3 shows the role of land evaluationas a two-stage procedure in land-use plan-ning (see also Beek, 1975e). The activitiesare divided into three phases: the reconnais-sance scale, the semidetailed, and the de-tailed. The land evaluation in the first phaseis the physical land evaluation mentionedearlier that does not involve adjustment tolocal land conditions; the evaluations in thesecond and third phases do involve adjust-ments to the land conditions.
Literature Cited
AGRICULTURE MINISTRY AND MINISTRY OF INTERIOR, Government of Thailand. 1974. Outline for landsuitability classification support of integrated rural development in North Thailand.
BARTELLI, L.J., A.A. KLINGEBIEL, J.V. BAIRD, and M.R. HEDDLESON. 1966. Soil surveys and land useplanning. SSSA and ASA, Madison, Wis.
BEEK, K.J. 1975a. Identification of land utilization types. FAO World Soil Resources Report no. 45,pp. 89-102.
BEEK, K.J. 1975ft. Land utilization types in land evaluation (reports tech. consultation about land eval-uation for Europe, Nitra, Czechoslovakia, 1-6 September, 1975). FAO, Rome.
140 LAND-USE PLANNING
BEEK, K.J., and J. BENNEMA. 1972. Land evaluation for agricultural land use planning: an ecologicalmethodology. Agric. Univ., Wageningen, The Netherlands.
BEEK, K.J., J. BENNEMA, and M. CAMARGO. 1964. Soil survey interpretation in Brazil. A system of soilsurvey interpretation for reconnaissance surveys. Soil Survey Institute, Wageningen, The Nether-lands. (Mimeographed.)
BENNEMA, J., and C. P. VAN GOOR. 1975. Physical land evaluation for forestry. FAO World Soil Re-sources Report no. 45, pp. 103-119.
BOYER, M.J. 1974. Interpretative land classification in French-speaking countries. Approaches to landclassification. FAO Soils Bull. no. 22, pp. 26-34.
BRINKMAN, R., and A. J. SMYTH (ed.) 1973. Land evaluation for rural purposes. Int. Inst. for Land Rec-lamation and Improvement, Publication no. 17, Wageningen, The Netherlands.
FAO. 1971. Soil survey project Pakistan. AGL: SF/DAK 6, Tech. Report 1.FAO. 1974a. Approaches to land classification. Soils Bull. no. 22.FAO. 19746. A land capability appraisal. Indonesia Interim Report, AGL/1NS/72/011.FAO. 1975. Report on the ad hoc expert consultation on land evaluation. FAO World Soil Resources
Report no. 45.FAO. 1976. A framework for land evaluation. Soils Bull. no. 32.GARBROUCHEV, J., H. TRASLIEV, and S. KRASTANOV. 1974. Land productivity evaluation in Bulgaria.
Approaches to land classification. FAO Soils Bull. no. 22, pp. 83-95.KELLOGG, C. E. 1953. Potentialities and problems of arid soils. Desert Research, Jerusalem.KELLOGG, C. E. 1961. Soil interpretation in the soil survey. USDA, SCS, U.S. Government Printing
Office, Washington, D.C.KLINGEBIEL, A.A., and P. H. MONTGOMERY. 1961. Land capability classification. Agric. Handb. no. 210.
USDA, U.S. Government Printing Office, Washington, D.C.MAHLER, P. J. (ed.) 1970. Manual of land classification for irrigation. Publ. no. 205. Soil Inst. of Iran,
Teheran.MALETIC, J.T., and T.B. HUTCHINGS. 1967. Selection and classification of irrigable lands, pp. 125-173.
In R.M. Hagan (ed.) Irrigation of agricultural lands. Agron. Monogr. 11. ASA, Madison, Wis.OLSON," G.W. 1974."Intèfpretative land classification in English-speaking countries. Approaches to land
classification. FAO Soils Bull. no. 22, pp. 1-26.RIQUIER, J. 1974. A summary of parametric methods of soil and land evaluation. Approaches to land
classification. FAO Soils Bull. no. 22.SOEPRAPTOHARDJO, M., and P.M. DRIESSEN. 1975. Soil appraisal systems in Indonesia. Soil Res. Inst.
Bogor, Indonesia.STEELE, J.G. 1967. Soil survey interpretation and its use. FAO Soils Bull. no. 8.STORIE, E. R. 1937. An index for rating the agricultural value of soils. Bull. 556. Berkeley, Ca.SYS, C. 1975. The pedology of rubber. FAO World Soil Resources Report no. 45, pp. 59-81.TEACI, D., and M. BURT. 1974. Land evaluation and classification in East European countries. Ap-
proaches to land classification. FAO Soils Bull. no. 22, pp. 35-47.USDA, SCS, Soil Survey Staff. 1975. Soil taxonomy: a basic system of soil classification for making
and interpreting soil surveys. Agric. Handb. no. 436. U.S. Government Printing Office, Washing-ton, D.C.
U.S. DEPARTMENT OF INTERIOR. 1953. Bureau of Reclamation manual, vol. 5, Irrigated land use, part 2:land classification.
VINK, A. P. A. 1960. Quantitative aspects of land classification. Trans. 7th Int. Congr. of Soil Sei., vol.4: 371-378.
VINK, A. P.A. 1975. Land use in advancing agriculture. Springer-Verlag, Berlin.WISHMEYER, W. H., and D. D. SMITH. 1965. Predicting rainfall-erosion losses from cropland east of the
Rocky Mountains. Agric. Handb. no. 282. USDA, U.S. Government Printing Office, Washington,D.C.
PART IV:USE OF SOIL-RESOURCE DATA
IN REGIONAL ANDNATIONAL DEVELOPMENT
Soils Data for Agricultural Development in Ghana
H.B. OBENG
Soil Research InstituteCouncil for Scientific and Industrial Research, Kwadaso-Kumasi, Ghana
A soil map of Ghana on a scale of 1:1,500,000 has recently been completed with a legendinterpreted in terms of the U.S.-French classifications and the FAO/UNESCO soil map units.The intention is to help Ghana draw upon overseas experiences in soil use. Soil-suitability mapshave also been compiled for mechanized and nonmechanized agriculture, food crops, import-substitution crops, export crops, and livestock development. These maps and subsequent detailedsurveys greatly help in the efficient and rapid selection of areas for agriculture. The soils workhas assisted in a 36% increase in maize production and a 44% increase in rice production in theOperation Feed Yourself and Industries programs. Soils data have also been successfully appliedto agricultural development by regional development corporations in the Central, Ashanti,Volta, and Brong-Ahafo regions. The development of soil science extension services within theNational Soil Research Institute has increased the use of soils data by private industry and small-scale indigenous farmers.
Agriculture plays a very important role inthe economic development of Ghana. It is,therefore, essential for the country to developa sound program to ensure continuous highproduction of arable, pasture, and tree cropson existing small cooperative and state farmsand to develop virgin lands capable of eco-nomic production.
Such a sustained and increased agricul-tural production effort, however, cannot beachieved without a nationwide program ofmapping and classifying the soils of thecountry as rapidly and as cheaply as possibleto obtain needed information about potentialarable, irrigable, pasture, and forestry lands.
The development of a soil survey in Ghanabegan some 30 years ago, when the cocoaindustry was first threatened by swollenshoot disease and capsid attack, whereby itbecame necessary to find out whether soilfactors were responsible for such virus and
pest infestations. Although no useful conclu-sions about these infestations could be drawnfrom the soil surveys of cocoa-growing areas,valuable data were obtained on general soil-crop relationships. The project was expand-ed, therefore, to cover the whole country andentrusted to an independent soil and land-use survey organization, which has grown tobecome the Soil Research Institute of Ghana.
The Insti tute as now consti tuted ischarged by the Government: (1) to take aninventory of the soil resources of the nationthrough organized Regional Detailed-Recon-naissance Soil Surveys to delineate on mapsof suitable scale broad areas considered suit-able for agricultural development; (2) to con-duct ad hoc Detailed and Semidetailed SoilSurveys of areas earmarked for immediateagricultural development by the Govern-ment, quasi-government, large agriculturalconcerns, and indigenous small-scale farm-
143
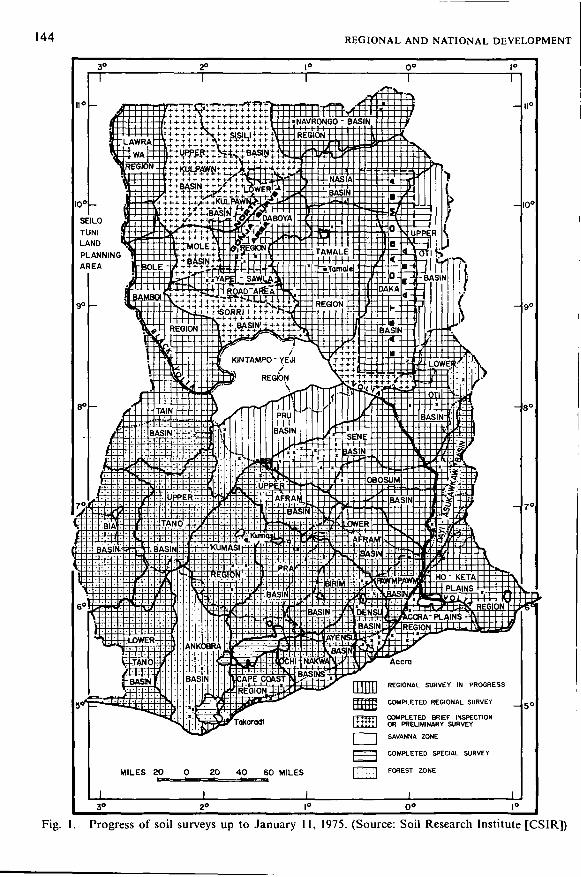
144 REGIONAL AND NATIONAL DEVELOPMENT
REGIONAL SURVEY IN PROGRESS
COMPLETED REGIONAL SURVEY
Fig. 1. Progress of soil surveys up to January 11, 1975. (Source: Soil Research Institute [CSIR])
OBENG 145
ers; and to evaluate such areas in terms ofthe suitability of existing soils for the type ofagriculture envisaged; (3) to advise waysand means of improving the fertility status ofindigenous soils to increase substantiallycrop and livestock production in the country;and (4) to recommend effective measures tobe undertaken to control erosion and con-serve the soil resources of the nation.
In pursuance of the above objectives, theInstitute has established, aside from its ad-ministrative division, six main specializedresearch divisions not only to be able, as soonas practicable, to compile the necessary soilresources data but also to recommend effec-tive measures necessary for the efficient man-agement of indigenous soils, to make themas productive as possible. These divisionsare: (1) Soil Genesis, Survey, and Classifi-cation; (2) Soil Chemistry and Mineralogy;(3) Soil Fertility; (4) Soil Conservation andErosion Control; (5) Soil Microbiology; and(6) Soil Physics.
Application of Soils Data to theDevelopment of Agriculture in Ghana
General
The divisions of the Soil Research Insti-tute whose results have been successfullyused in the national and regional agriculturaldevelopment of Ghana are the Soil Genesis,Survey and Classification Division, the SoilFertility Division, and the Soil Conservationand Erosion Control Division.
The programs in the Division of Soil Gen-esis, Survey, and Classification have had,and continue to have, by far the greatest im-pact on the improvement of crop and live-stock production in the country. These pro-grams are executed under two major typesof soil surveys, namely, regional and specialproject soil surveys. For the regional soilsurveys, the country has been divided into 37soil survey regions, the boundaries of whichmore or less coincide with the differentdrainage basins (see Figure 1). For these sur-veys, the detailed-reconnaissance and thephotoanalysis and interpretation methods
(Obeng et al., 1962) are employed. The map-ping unit for the regional soil surveys is thesoil association. Aside from the soil-associa-tion map, maps dealing with relief and drain-age, vegetation and present land use, mis-cellaneous information, and generalized landcapability (Obeng, 1972) are produced on ascale of 1:250,000. To date, 33 maps havebeen completed of the 37 soil survey regions.
For the special project soil surveys, smallerareas earmarked for immediate agriculturaldevelopment are surveyed in detail; the soilseries is the mapping unit on a scale of either1:7,920 or 1:6,250. Since the establishmentof the Institute some 30 years ago, surveys ofover 500 of such project areas have beencompleted and the results have been pub-lished in the form of technical reports andmiscellaneous papers.
Application of Soils Data in NationalAgricultural Development
From the enormous data accumulatedfrom the regional and special project soilsurveys, it has been possible to compile anup-to-date soil map of Ghana on a scale of1:1,500,000 with a legend in which equivalentsoil groups in the USDA, French, and FAOsystems have been included. It is hoped thatsuch a comprehensive legend will facilitatethe correlation of indigenous soil groups andthose similarly developed in other tropicalareas so that Ghana can readily draw fromexperiences elsewhere in the practical utili-zation of existing soils.
In addition to the current soil map ofGhana, series of soil-suitability maps havebeen compiled showing areas consideredsuitable or unsuitable in terms of the follow-ing: mechanized or other cultivation prac-tices, or both; food crops; import substitutioncrops; export crops; and livestock develop-ment. These maps, along with further de-tailed ground investigations, have greatlyhelped in the efficient and rapid selection ofareas across the country for large-scale andsmall-scale efficient cultivation of a widevariety of climatically suited cash and foodcrops under the Government's current"Operation Feed Yourself and Industries"
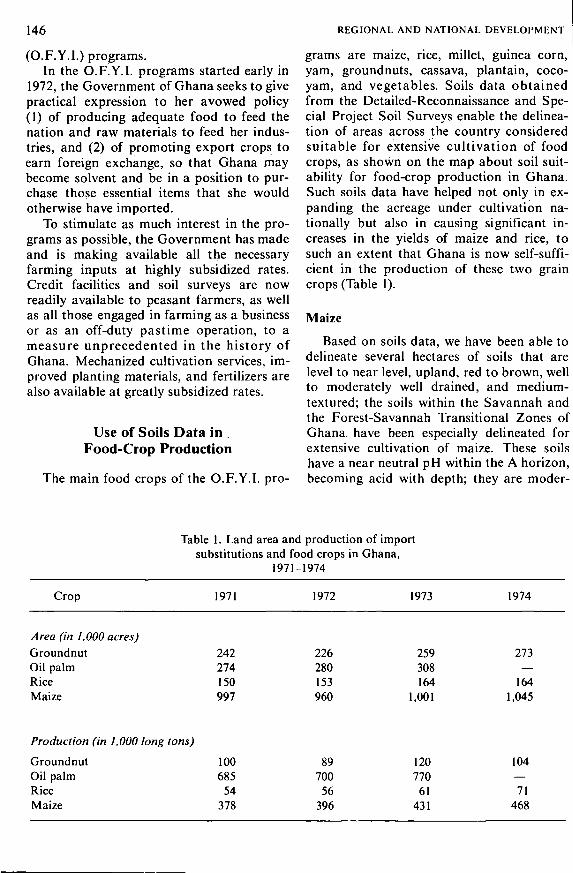
146 REGIONAL AND NATIONAL DEVELOPMENT
(O.F.Y.I.) programs.In the O.F.Y.I. programs started early in
1972, the Government of Ghana seeks to givepractical expression to her avowed policy(1) of producing adequate food to feed thenation and raw materials to feed her indus-tries, and (2) of promoting export crops toearn foreign exchange, so that Ghana maybecome solvent and be in a position to pur-chase those essential items that she wouldotherwise have imported.
To stimulate as much interest in the pro-grams as possible, the Government has madeand is making available all the necessaryfarming inputs at highly subsidized rates.Credit facilities and soil surveys are nowreadily available to peasant farmers, as wellas all those engaged in farming as a businessor as an off-duty pastime operation, to ameasure unprecedented in the history ofGhana. Mechanized cultivation services, im-proved planting materials, and fertilizers arealso available at greatly subsidized rates.
Use of Soils Data in .Food-Crop Production
The main food crops of the O.F.Y.I. pro-
grams are maize, rice, millet, guinea corn,yam, groundnuts, cassava, plantain, coco-yam, and vegetables. Soils data obtainedfrom the Detailed-Reconnaissance and Spe-cial Project Soil Surveys enable the delinea-tion of areas across the country consideredsuitable for extensive cultivation of foodcrops, as shown on the map about soil suit-ability for food-crop production in Ghana.Such soils data have helped not only in ex-panding the acreage under cultivation na-tionally but also in causing significant in-creases in the yields of maize and rice, tosuch an extent that Ghana is now self-suffi-cient in the production of these two graincrops (Table 1).
Maize
Based on soils data, we have been able todelineate several hectares of soils that arelevel to near level, upland, red to brown, wellto moderately well drained, and medium-textured; the soils within the Savannah andthe Forest-Savannah Transitional Zones ofGhana have been especially delineated forextensive cultivation of maize. These soilshave a near neutral pH within the A horizon,becoming acid with depth; they are moder-
Table 1. Land area and production of importsubstitutions and food crops in Ghana,
1971-1974
Crop
Area (in 1,000 acres)GroundnutOil palmRiceMaize
Production (in 1,000 long ions)
GroundnutOil palmRiceMaize
1971
242274150997
100685
54378
1972
226280153960
89700
56396
1973
259308164
1,001
120770
61431
1974
273—
1641,045
104—71
468
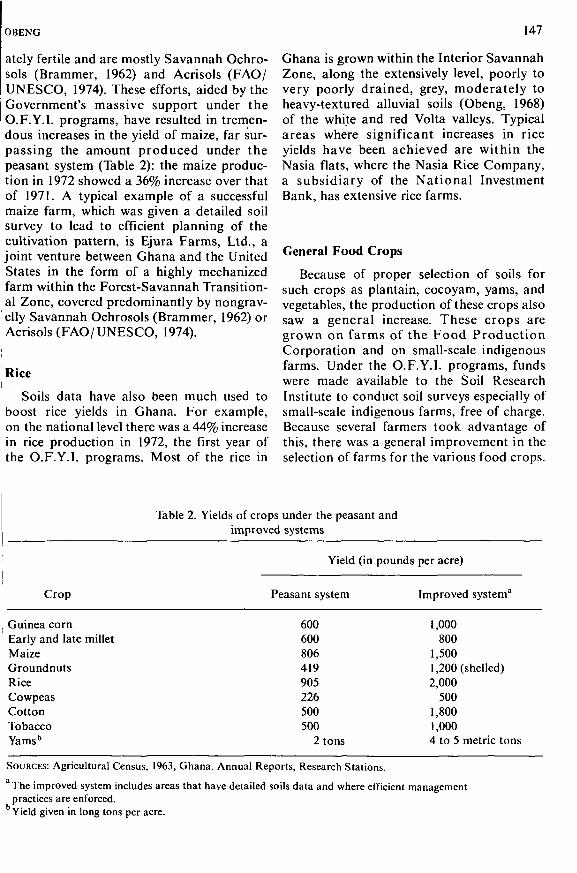
OBENG 147
ately fertile and are mostly Savannah Ochro-sols (Brammer, 1962) and Acrisols (FAO/UNESCO, 1974). These efforts, aided by theGovernment's massive support under theO.F.Y.I. programs, have resulted in tremen-dous increases in the yield of maize, far sur-passing the amount produced under thepeasant system (Table 2): the maize produc-tion in 1972 showed a 36% increase over thatof 1971. A typical example of a successfulmaize farm, which was given a detailed soilsurvey to lead to efficient planning of thecultivation pattern, is Ejura Farms, Ltd., ajoint venture between Ghana and the UnitedStates in the form of a highly mechanizedfarm within the Forest-Savannah Transition-al Zone, covered predominantly by nongrav-elly Savannah Ochrosols (Brammer, 1962) orAcrisols (FAO/UNESCO, 1974).
Rice
Soils data have also been much used toboost rice yields in Ghana. For example,on the national level there was a 44% increasein rice production in 1972, the first year ofthe O.F.Y.I. programs. Most of the rice in
Ghana is grown within the Interior SavannahZone, along the extensively level, poorly tovery poorly drained, grey, moderately toheavy-textured alluvial soils (Obeng, 1968)of the white and red Volta valleys. Typicalareas where significant increases in riceyields have been achieved are within theNasia flats, where the Nasia Rice Company,a subsidiary of the National InvestmentBank, has extensive rice farms.
General Food Crops
Because of proper selection of soils forsuch crops as plantain, cocoyam, yams, andvegetables, the production of these crops alsosaw a general increase. These crops aregrown on farms of the Food ProductionCorporation and on small-scale indigenousfarms. Under the O.F.Y.I. programs, fundswere made available to the Soil ResearchInstitute to conduct soil surveys especially ofsmall-scale indigenous farms, free of charge.Because several farmers took advantage ofthis, there was a general improvement in theselection of farms for the various food crops.
Table 2. Yields of crops under the peasant andimproved systems
Yield (in pounds per acre)
Crop Peasant system
600600806419905226500500
2 tons
Improved systema
1,000800
1,5001,200 (shelled)2,000
5001,8001,0004 to 5 metric tons
Guinea cornEarly and late milletMaizeGroundnutsRiceCowpeasCottonTobaccoYarns"
SOURCES: Agricultural Census, 1963, Ghana. Annual Reports, Research Stations.
The improved system includes areas that have detailed soils data and where efficient managementpractices are enforced.Yield given in long tons per acre.
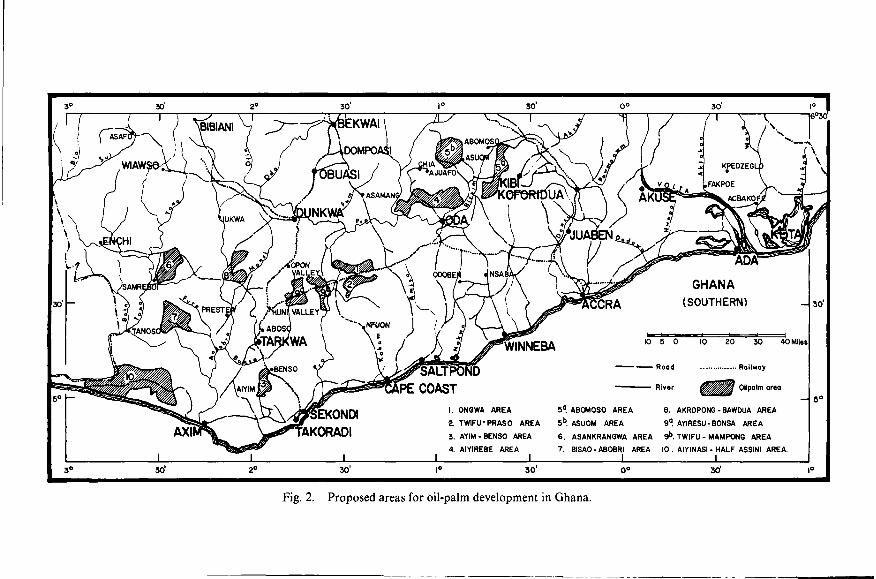
GHANA
(SOUTHERN)
5°. ABOMOSO AREA 8. AKROPONG - BAWDUA AREA
9°. AYIRESU - BONSA AREAEKONDI
AKORADI2. TWIFU- PR AS 0 AREA S°. ASUOM AREA
3. AYIM-BENSO AREA 6. ASANKRANGWA AREA . TWIFU - MAMPONS AREA
4. AIYIREBE AREAI I
7. BISAO-ABOBRI AREA 10 . AIYINASI - HALF ASSINI AREA.
Fig. 2. Proposed areas for pil-palm development in Ghana.
OBENG 149
Use of Soils Data in the Production ofImport Substitution Crops
Of the import substitution crops in Ghana,the ones that soils data have greatly helpedin acreage expansion and tremendous yieldincreases are oil palm, cotton, and ground-nuts.
Oil Palm
Data from the completed Regional andSpecial Project Soil Surveys, in addition totopographic and climatological data, havebeen utilized in delineating areas in Ghanaconsidered best suited to extensive oil-palmdevelopment (Figure 2).
With the aid of the map (Figure 2) and af-ter further detailed soil surveys (Asamoa andTenadu, 1972; and Asiedu and Adu, 1975),large-scale farms have been establishedwithin areas 3 and 4 for the extensive culti-vation of oil palm. Several other oil-palmfarms have been sited within areas 9A, 9B,and 1 and 2 since the launching of theO.F.Y.I. programs in 1972. The data pro-vided in Table 1 show significant increasesin the acreage and the production of oil palmfrom 1971 to 1973.
Cotton
Several cotton farms have also been es-tablished mainly by the Cotton ProductionCompany, a subsidiary of the National In-vestment Bank (Ansah and Adu, 1975), andby textile companies in Ghana, with as-sistance from the Soil Research Institute.Some of the companies are Akosombo Tex-tiles, Ltd., Juapong Textiles, Ltd., and TemaTextiles, Ltd. These farms have adoptedimproved systems of cultivating cottonthrough detailed soil surveys to select suit-able soils for the crop and suitable manage-ment practices aimed at improving the fer-t.ility'*status of the soils, controlling erosion,and eradicating weeds and pests. As shownclearly in Table 2, these improved systemshave more than doubled the yields of cottonover and above those of the peasant farms,
where traditional agricultural systems arestill enforced.
Groundnuts
The production of groundnuts has alsoincreased as a result of an increase in hec-tares of land devoted to the crop and the in-stitution of better farming systems helped bythe Soil Research Institute and the Grainsand Legumes Development Board. Detailedand semidetailed soil surveys have been un-dertaken not only on farms belonging to theVegetable Oil Mills Division of the GhanaIndustrial Holding Corporation but also onsmall-scale indigenous farms. A typical ex-ample is the semidetailed soil survey of theVegetable Oil Mills' groundnut project farmat Patuda in the Brong-Ahafo region ofGhana (Adu and Ansah, 1974). This surveyhas enabled the planting of the crop on soilsconsidered suitable; as a result, significantincreases in crop yield have been achieved.Vegetable oil mills across the country arenow in a position, therefore, to obtain rawmaterials locally without resorting to impor-tation from neighboring countries.
Use of Soils Data in the Productionof Export Crops
Cocoa
The economy of Ghana is almost whollydependent on agriculture from which it de-rives much of its foreign exchange earnings,mainly through exports. The crop contribut-ing the most foreign exchange earnings forthe country is cocoa.
In the period from 1939 through 1959,Ghana's cocoa production ranged between200,000 and 250,000 tons annually (IDA,IBRD, 1970). In the 1960's, as shown in Table3, production began to climb rapidly, culmi-nating in a 1964/65 season crop of 557,000long tons. Since 1964/65, however, the crophas declined and in recent years yields haveaveraged about 400,000 long tons annually(Table 3). Since 1966, steps have been takento resuscitate the industry, but progress has

150 REGIONAL AND NATIONAL DEVELOPMENT
Table 3. Cocoa production, 1947/48-1974/75 (in thousand metric tons)
Year
1947/481948/491949/501950/511951/521952/531953/541954/551955/561956/571957/581958/591959/601960/611961/621962/631963/641964/651965/661966/671967/681968/691969/701970/711971/721972/731973/74Estimate:1974/75
Eastern
6567545648504041384035394764548282106716875566873857465
—
Ashanti
108272786178606968787085105148134149154187153128139107124128143124105
—
Brong-Ahafo
3644434537414343515535707496858189121100861079211411011711177
—
Region
Western
1115141712121011121510814232123243424" -2528213186504341
—
Volta
202624252428222228322221233129212827
- 20"19241421151022—
—
Central
254439423038363432443533537187666074
- 4-j- - -
4951405459574347
—
Ghana i
208278248262211247211220229264207256317432409421436557
- 410376415334409386457411344
370
»Vorld
580591753799635784759788823881764891,024,156,124,155,216,482,205,333,333,221,418,480,557,377,418
,495
SOURCES: Cocoa Statistics Bulletin, FAO, various issues; Cocoa Annex to Economic Report of March 9, 1972and Cocoa Marketing Board, Ghana; Gill and Duffus, 1975, Cocoa Market Report, No. 265.
been slow, inhibited both by Ghana's weakfinancial situation and by the major task in-volved in rebuilding the industry's institu-tions.
Although there have been improvements,Ghana's cocoa industry is in a serious situa-tion. Capsid pests, and to a lesser extent avirus disease (swollen shoot), are reducingyields seriously, and the output of olderfarms is declining and tending to outweighthat of new or replanted farms. Because of
the deterioration of the cocoa industry,though Ghana still remains the world's larg-est single producer of cocoa, its share ofworld cocoa production has declined fromabout 37% in the early 1960's to about 30%today. Since Ghana's ability to raise re-sources for development is critically depen-dent upon cocoa exports, the decline in pro-duction must be reversed to allow the countryto maintain its share of the world supply ofcocoa, the demand for which, in the past
OBENG 151
decade, has been increasing at an averageannual rate of 4.5% (IDA, IBRD, 1970).
Ghana has recognized the need forstrengthening its cocoa industry and hasrightly decided to rehabilitate and replantthe crop within the Eastern and the AshantiRegions of the country. In order to select themost suitable soils for the projects, prelim-inary and semidetailed soil surveys wereorganized by the Soil Research Institutewithin the Eastern and Ashanti regions ofGhana.
The Eastern Regional Cocoa Rehabilita-tion project soil survey was undertaken dur-ing the 1968/69 fiscal year. Of the total areaof 63,375.62 hectares, 38,786.48 were foundto be suitable for extensive cultivation ofcocoa; the rest consisted of soils too shallow,too gravelly, too poorly drained, or occurringover too steep a slope to be considered suit-able for the crop. Of the approximately 38,787hectares selected, 14,580 are to be replantedand 20,655 hectares of cocoa are to be reha-bilitated through provision of credit to farm-ers for the procurement of the necessaryfarming inputs. The project that should havebeen completed in the 1975/76 financial yearis being extended to the 1976/77 financialyear because of the drought of 1973, whichslowed down progress (Whyte, 1974).
With such good prospects of success forreplanting and rehabilitation of cocoa in theEastern region, a more massive scheme hasjust been started in the Ashanti region, tra-ditionally the best region for extensive cocoacultivation in Ghana. A preliminary soil andland-use survey of the region organized bythe Soil Research Institute has revealed thatout of a total area of 810,000 hectares in-spected, 607,500 were found suitable for theextensive cultivation of cocoa (Adu et al.,1974).
Ginger and Black Pepper
To avoid overdependence on one cashcrop for export purposes, Ghana has em-barked on the diversification of her agricul-ture. Several cash crops are being considered,the major ones being ginger and black pep-per. Soil survey investigations are being
undertaken to select the most suitable areasacross the country for the extensive cultiva-tion of these crops. Efforts are also beingmade to extend through soil surveys the areaunder the cultivation of coffee.
Use of Soils Data forIrrigation Development
Various semidetailed and detailed soilsurveys have been conducted across thecountry especially in the Coastal and InteriorSavannah Zones to evaluate soils in terms oftheir suitability for extensive irrigated agri-cultural development. Areas where such val-uable soils data have been provided includethe Accra Plains (Ministry of Agriculture,1972), with detailed information availablefor Ashaiman, Dawhenya (Obeng and Ap-piah, 1963), the Asuatuare irrigation projectareas, and the Vea and Nasia Valley flats inthe Interior Savannah Zone. These data haveenabled several hectares of land to be exten-sively cultivated for rice, sugarcane, and veg-etables to such an extent that Ghana is pres-ently self-sufficient in the production of riceand vegetables.
Application of Soils Data inRegional Agricultural Development
Aside from drawing on the immense soilsdata available for national development ofagriculture in Ghana, several Regional De-velopment Corporations have been estab-lished whose main purpose is to see to theregional development of agriculture. Hereagain, the Soil Genesis, Survey, and Classi-fication Division of the Soil Research Insti-tute has played and is playing a vital role inthe initial selection of suitable areas, withinthe nine political regions of Ghana, for ex-tensive cultivation of climatically suitedcrops. Few of the projects that have benefitedfrom soils data provided are being success-fully implemented for citrus or pineapple ineither the Central Region (Asamoa, 1973),the Ashanti Regional Corporation's citrusproject (Mensah-Ansah and Adu, 1975), the
152
Volta Regional Development Corporation'sNorth Tongu cattle ranch project (Adu et al.,1973), or the Vegetable Oil Mills groundnutproject in the Brong-Ahafo region (Adu andAnsah, 1974).
Socioeconomic Accomplishments
The overall success of the O.F.Y.I. pro-grams of the Government of Ghana hascaused tremendous increases in both foodand cash crops to an extent unprecedented inthe agricultural history of the country. As aresult, Ghana is self-sufficient in rice andmaize production, and it is likely that withinthe next few years cotton and sugarcane pro-duction will rise to an extent where completecurtailment of imports will be possible.
During the 10 years from 1964 to 1973,Ghana's GNP increased by only 1.3% annual-ly while its population increased by 2.6%.Thus the GNP per capital declined but at$242 in 1973, it still remained quite high bystandards of West Africa. Ghana's popula-tion was about 9.5 million in 1974, the sec-ond largest in West Africa. Of the total GDPin 1973, agriculture (including forestry andfishing) accounted for 49%, and cocoa, 7%,while manufacturing and mining made up11%. The share of cocoa rose sharply in the1974 financial year, with the higher price ac-counting for 29% of the total public revenuesand 21% of the GDP.
Ghana's population is projected to in-crease continually at 2.6% a year reachingabout 11 million by 1980. The country's prin-cipal economic objectives are (1) to raise theoverall GDP growth rate to reverse the de-cline in real per capita income; (2) to increasedomestic production of food and raw mate-rials; (3) to rehabilitate and expand vital sec-tors of the economy, such as cocoa; (4) toachieve a more equitable distribution of in-come; (5) to increase government budgetsavings; and (6) to increase export earningsfrom nontraditional and traditional activities.
Because of the current significant increasein agricultural production the overall GDP isexpected to grow at an average rate of 5% ayear from 1976 to 1979, reaching 7% by 1979.
REGIONAL AND NATIONAL DEVELOPMENT
The main impetus to growth will come fromagriculture for which Ghana's basic resourcesare good, affording the potential for greatlyincreased output of nontraditional crops(such as livestock, cotton, coconuts, and palmoil) as well as traditional crops includingcocoa (Whyte, 1974).
Significant Factors for Successor Failure
As aforementioned, the O.F.Y.I. pro-grams of the Government of Ghana have ac-celerated agricultural growth to such anextent that the country is on the verge of be-coming self-sufficient in the production ofseveral climatically suited crops.
In the field of livestock development formeat and dairy production, however, the pic-ture is not so promising. The foot-slope col-luvial and low-level ironpan soils (for groundwater laterites, see Brammer, 1962; for pe-trosols, see Obeng, 1975c) developed exten-sively in the Interior Savannah Zone areconsidered to be well suited to pasturedevelopment for large-scale livestock pro-duction. It is necessary, therefore, for Ghanaand other developing countries that haveextensive development of such soils, normal-ly considered unsuitable for arable cropping,not only to find ways and means of utilizingcurrent technological innovations to improveindigenous forage crops and breeds of live-stock and to introduce promising new ones,but also to find effective and ready remediesto the menacing effects of the tsetse fly. Inthis respect, it is very encouraging that theNortheast Savannah Research Project, ajoint venture between Ghana and the UnitedStates, which includes interdisciplinary,socioeconomic, and other studies involvingcultivation practices, water availability,burning, overgrazing, and deafforestation hasbeen started under the aegis of the Councilfor Scientific and Industrial Research. Thepurposes of these studies are (1) to find solu-tions to the multiple problems hindering theefficient economic development of the vastInterior Savannah Zone of the country; (2) tobring about significant increases in crop and
OBENG 153
livestock production; and (3) to improve data are transmitted effectively to user agen-upon the health and the economic well-being cies, the Soil Research Institute, in additionof the indigenous people (Obeng, 19756). to supplying such data to government agen-
Another hindrance to rapid achievement cies, especially the Ministries of Agriculture,of the goal of self-sufficiency in Ghana's Economic Planning, Industry, and Cocoaagricultural production is the apparent lack Affairs, is engaged in direct project execu-of effective agricultural extension services tion and advisory services to private organi-capable of transmitting soils data efficiently zations and small-scale indigenous farmersin simple terms that can be easily understood (Obeng, 1975a). The Institute's efforts haveand applied by indigenous farmers. This lack resulted in general improvement of the ap-is caused mainly by the absence of soil- plication of soils data in the development ofscience specialists to complete the ideal ef- agriculture in Ghana, especially on the partfective three-way system of a well-trained, of the small-scale indigenous farmers, whoexperienced, and disciplined cadre of re- are responsible for almost 90% of the totalsearch scientists, subject-matter specialists, agricultural production of the country. Givenand agricultural extension officers. Ironical- the firm establishment of a soil science exten-ly, the main reasons for this major setback sion service attached to the Soil Manage-are the inadequacy of trained personnel and ment Section of the Soil Research Institute,the unattractive conditions of service. it is hoped that soils data will be fully utilized
In the absence of the ideal three-way to increase substantially crop and livestocksystem that would see to it that soil research production in Ghana.
Literature Cited
ADU, S.V., and J.O. ANSAH. 1974. Report on the semidetailed soil survey of the Vegetable Oil MillsGroundnut Project Farm at Patuda, near Atebubu, Brong-Ahafo Region. Soil Res. Inst, CSIR, Tech.Report no. 92.
ADU, S. V., J. A. MENSAH-ANSAH, J. T. AMA, and G. W. ACQUAAH. 1974. A preliminary soil and land-use survey of the Ashanti Cocoa Rehabilitation Project areas. Soil Res. Inst., CS1R, Tech. Reportno. 91.
ADU, S. V., I. MENSAH-TEI, and A. K. GALLEY. 1973. Report on the preliminary soil survey of the NorthTongu cattle ranch area, Volta region. Soil Res. Inst., CSIR, Tech. Report no. 90.
ANSAH, J.O., and S.V. ADU. 1975. Report on the detailed soil survey of a proposed farm owned by theCotton Production Company, Limited, at Amantin, Brong-Ahafo. Soil Res. Inst., CSIR, Tech. Reportno. 95.
ASAMOA, G. K. 1973. Areas for the cultivation of citrus and pineapples in the central region of Ghana.Soil Res. Inst., CSIR, Misc. Paper no. 163.
ASAMOA, G. K.., and D.O. TENADU. 1972. Report on the semidetailed soil survey of the World Bank OilPalm Project area at Kwae, near Kade, eastern region. Soil Res. Inst., CSIR, Tech. Report no. 85.
ASIEDU, K.A., and S.V. ADU. 1975. Report on the preliminary soil survey of the extension to theproposed oil palm survey area at Adum-Banso, western region. Soil Res. Inst., CSIR, Tech. Reportno. 96.
BRAMMER, H. 1962. Soils of Ghana, pp. 88-126. In Brian Wills (ed.) Agriculture and land-use in Ghana.Oxford University Press, London.
FAO and UNESCO. 1974. Soil map of the world. Vol. 1: Legend. Rome.INTERNATIONAL DEVELOPMENT ASSOCIATION, IBRD. 1970. Eastern Region Cocoa Project, Ghana. Report
no. PA-43a, Washington, D.C.MENSAH-ANSAH, J. A., and S.V. ADU. 1975. Soils of the proposed regional development corporation's
citrus plantation at Akrokerri, Ashanti region. Soil Res. Inst., CSIR, Tech. Report no. 93.MINISTRY OF AGRICULTURE, Government of Ghana. 1972. Irrigation in Ghana with particular reference
to the Accra Plains. A report submitted by the Subcommittee on Irrigation of the Agricultural Re-search Advisory Committee, Accra, Ghana. (Unpublished)
154 REGIONAL AND NATIONAL DEVELOPMENT
MINISTRY OF AGRICULTURE, Government of Ghana. 1973. Operation feed yourself—regional and nation-al targets, Accra, Ghana.
OBENG, H.B. 1968. Areas suitable for large-scale rice production in Ghana. Soil Res. Inst., G.A.S.,Conference Paper no. 38.
OBENG, H.B. 1972. Soil evaluation for mechanized and other cultivation practices in Ghana. Soil Res.Inst., CSIR, Conference Paper no. 40.
OBENG, H.B. 1975a. Soil research—organization and application to the development of agriculture inGhana. Soil Res. Inst., CSIR, Conference Paper no. 52.
OBENG, H.B. 1975Z». Soils of the Savannah Zones of Ghana, their physicochemical characteristics,classification, and management. Keynote paper read at the Joint Commissions 1, IV, V, and VI ofthe ISSS Meeting on Savannah Soils of Africa and Their Management, November-December, 1975,Ghana. (Unpublished)
OBENG, H.B. 1975c. Ironpan soils of Ghana—their physicochemical and mineralogical characteristics,classification, and problems associated with their management. Soil Res. Inst., CSIR, Bull. no. 6.
OBENG, H.B., S.V. ADU, and G.K. ASAMOA. 1962. Methods of soil survey for land development inGhana. Scient. Serv. Division, Ministry of Agriculture, Conference Paper no. 33.
OBENG, H.B., and H.A. APPIAH. 1963. Report on the capability of the soils of the Dawhenya PilotProject area for irrigation purposes. Soil Res. Unit, A.R.I., G.A.S., Tech. Report no. 50.
OBENG, H.B., T. B. BINNEY, and J. A. OTOO. 1973. Shifting cultivation and soil conservation in Ghanaand measures for their improvement. Paper presented at the FAO/SI DA Seminar on Shifting Culti-vation and Soil Conservation, Ibadan, Nigeria, 2-21 July, 1973. Summary published on pp. 94-95 ofFAO Report no. FAO/SIDA/TF 109 of 1974.
WHYTE, A. R. 1974. Preappraisal of the Ashanti Region Cocoa Project, Ghana. IBRD, Washington,D.C. (Unpublished)
A Case Study of Tropical Alfisols in Sri Lanka
C.R. PANABOKKE
Office of the Deputy Director of Agriculture (Research)Department of Agriculture, Peradeniya, Sri Lanka
Soil-survey data have been a useful instrument in formulating a national plan of prioritiesfor the agricultural development of the Alfisol region in Sri Lanka. The different categories ofsoil-survey data have enabled the drawing up of long-term proposals for a balanced develop-ment of the soil and water resources of the Alfisol region within the framework of three broadsystems of land use: irrigated farming, semi-irrigated farming, and rain-fed farming.
Soil-survey data are now being used at every stage in the planning and execution of irrigationprojects. However, soil-survey and soil-classification data per se do not provide all the informa-tion that is necessary for efficient microplanning at the farm level.
There is yet a dearth of meaningful management experiences for tropical Alfisols even atthe suborder and great group level. Moreover, some basic soil management problems thatrelate to the high bulk-density of the Rhodustalfs, their poor aeration porosity, and their veryhard consistency in the dry state have yet to be satisfactorily solved.
Transfer of experience within the Alfisols could be rendered more effective by improveddefinition and specification of parameters such as landscape morphology, hydrology, andrainfall variability.
The socioeconomic framework within which a soil region is to be developed has importantimplications for the kind of soil information that might prove useful or not. Effective farmplanning at the microlevel requires a close interaction among a number of related disciplines,both agrotecnical and socioeconomic.
Before World War II, Sri Lanka's economy local food production. To meet this demand,was based primarily on an export-oriented Sri Lanka attempted in the late forties toplantation agriculture, notably tea, rubber, develop rapidly the hitherto underutilizedand coconut. These plantation crops had land resources in the Alfisol region in thebeen successfully grown in the Ultisol re- drier zone of the country,gions in the wet zone of the country over a At first sight, the solution to agriculturalperiod of 75 years. However, demand for development in the Alfisol region was en-food increased, and this was met by cheap visaged in terms of intensification of riceimports from neighboring Asian countries, production on the irrigable lands, chiefly theThis resulted in the stagnation of domestic Tropaqualfs; while in the unirrigable Rhodu-food production. stalfs and Haplustalfs, it was thought that a
The consequence of World War II, com- replacement of shifting cultivation by mod-bined with an increase in population growth, ern methods of rain-fed arable farming wouldresulted in a sudden demand for accelerated solve the problem. Although rice yields in
155
156 REGIONAL AND NATIONAL DEVELOPMENT
the Tropaqualfs under an assured irrigationsupply have increased to an average level of4 tons per hectare, the alternatives originallyenvisaged for rain-fed arable fanning on thenonirrigated lands have yet to bear out theinitial hopes.
The lack of adequate management infor-mation about tropical Alfisols in the early1950's compelled Sri Lanka to embark on itsown program of research investigations,especially in the hope of developing eco-nomic systems of settled arable rain-fedfarming on land that was hitherto subject toshifting cultivation.
Present Status of Soil Survey andClassification in Sri Lanka
Systematic soil surveys of the countrywere started in 1959 under the auspices ofthe National Soil Survey Project. The classi-fication of the soils of Sri Lanka into thegreat soil groups and subgroups was pre-sented by Moormann and Panabokke (1961).
Soil maps on a scale of 1:60,000 are avail-able for the whole country, covering an areaof approximately 25,000 square miles. Thesemaps correspond to the low-intensity soilsurveys, which show association of the greatsoil groups or subgroups, phases of the greatsoil groups where significant, and land unitsof various kinds including identified greatsoil groups.
Medium-intensity soil surveys have beencompleted for approximately 4,300 squaremiles, and high-intensity soil surveys havebeen completed for approximately 410 squaremiles.
A 1968 soil map of Ceylon containedcartographic units that could be correlatedwith internationally accepted systems; the1972 soil map of Sri Lanka (scale 1:500,000)contains 31 map units, which show the arealdistribution of the more important great soilgroups and subgroups of the country andalso the types of terrain on which they occur.De Alwis and Panabokke (1972) prepared asupporting text for this map, which alsogives the classification of Sri Lanka's soilsaccording to the comprehensive American(7th Approximation) system.
General Characteristics of the AlfisolRegion and Its Resource Base
The Alfisol region of Sri Lanka is con-fined to the drier zone of the island and islocated within the lowest peneplain that isfloored by crystalline metamorphic basementrocks of the pre-Cambrian era. In the gentlyundulating mantled plain of this peneplain,a typical catenary sequence of soils can beobserved. The Rhodustalfs and Haplustalfsoccupy the well-drained parts of the gentlyconvex landscape, and the Tropaqualfs occu-py the imperfectly and poorly drained partsof the slightly concave and flat landscape.
Dry weather flow in the second-orderstreams in this region usually ceases afterabout 45 cumulative dry days. Very limitedquantities of ground water are availableonly where the basement is highly fracturedand weathered. Surface water storage inlow-head reservoirs is the traditional meth-od of water conservation for domestic re-quirements and for supplementary irrigation.
The meteorological data given in Table 1are for the Maha Illuppallama AgriculturalResearch Institute, which is the central re-search station for the Alfisol region in SriLanka. The modal soil member at the re-search station is a Typic Rhodustalf, loamy,kaolinitic, isohyperthermic.
There are no serious limitations in thechemical fertility of the soils except for theirlow phosphorus status. The more seriouslimitations of their physical properties arethe high bulk-density values, low macro-aggregate stability, and the very hard con-sistency of the soils in the dry state. A spe-cial feature of the soils is the soil-waterenergy relationship, where nearly 85% of theavailable moisture is lost at a tension of 1atmosphere or pF 3. As a result, the soilsdry out very early and also tend to get satu-rated very quickly after rainfall.
The total area of the Alfisol region isclose to 10,000 square miles. Present landuse in this region is as follows:
Irrigated rice 650,000 acresRain-fed rice 150,000 "Homestead gardens and
other uses 400,000 "
Total 1,200,000 acres
PANABOKKE 157
Soil-survey data indicate that approxi-mately 1,250,000 acres are marginal or un-suited for agriculture. Of the remaining4,000,000 acres that are suitable for agricul-ture, approximately 350,000 are subject tovarying degrees of shifting cultivation. Fu-ture development of transbasin and localwater resources could render irrigable ap-proximately 900,000 acres. This leaves about3,100,000 acres that will have to be de-veloped in systems of rain-fed arable agri-culture.
Settlement Objectives, Past and Present
The chief objective of the settlement poli-cies of successive governments since the1930's has been to encourage and developsettled, arable small-holder farmsteads inthe less populated Alfisol region. Induce-ments in the form of various subsidies, of-fered by the Government, had attracted set-tlers in sufficient numbers from the highlypopulated Ultisol region of Sri Lanka.
Up to the mid-sixties, the size of an irri-gated farmstead was 4 acres, and the size ofa rain-fed farm was 10 to 15 acres. The in-creasing demand for irrigated land and the
rapidly increasing capital costs of irrigationworks have reduced the size of an irrigatedfarmstead now to 2 acres.
In 1970, the Government declared thatthe size of an agriculture holding should beone that would generate an income not lessthan that earned by a white-collar urbanworker. This has resulted in an unprecedent-ed demand for land by youth and also in amarked reversal in the rural-urban immigra-tion patterns of the past. Youth cooperativesand group farming are now rapidly gainingground both in irrigated and rain-fed agricul-ture.
Soil Management Problems in Alfisols
Organized interdisciplinary research onsoil and water management problems in rain-fed agriculture in the Alfisols started in 1950.Abeyratne (1956) reported the results of thefirst phase of these investigations. Based onresults of subsequent research, Abeyratne(1962) and Panabokke (1967) have discussedgeneral conclusions about the prospects foragricultural development in the Alfisols.
The more important conclusions thatstem from the foregoing studies and that
Table 1. Meteorological data for agricultural research institute, Maha Illuppallama
Month
Jan.Feb.Mar.Apr.MayJuneJulyAug.Sept.Oct.Nov.Dec.
Total
Meanrainfall
(cm)(65 years)
13.54.89.9
18.89.92.83.84.37.6
25.126.720.3
147.5
MeanevaporationV* V t l U U l Q11U1I
open pan(cm)
(20 years)
13.214.218.017.317.818.319.020.320.815.011.711.4
197.0
Mean temperature
Maximum( ° Q
(25 years)
28.230.232.532.832.331.932.332.732.931.329.628.1
Minimum( ° Q
(25 years)
20.420.621.823.324.424.424.223.923.622.821.720.9
Meanrelative
humidity(25 years)
817473767671706868778183
M canpercentagesunshine
(25 years)
657585827775737874645658
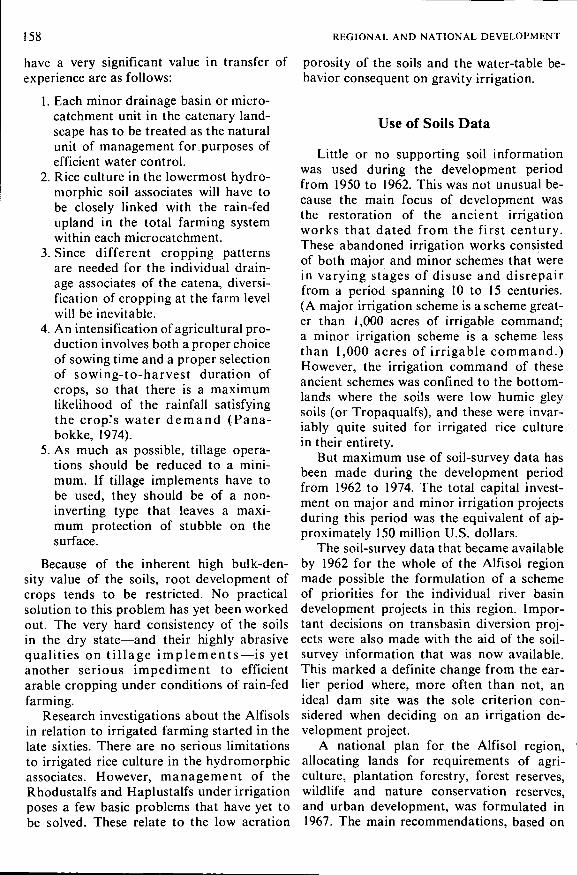
158 REGIONAL AND NATIONAL DEVELOPMENT
have a very significant value in transfer of porosity of the soils and the water-table be-experience are as follows: havior consequent on gravity irrigation.
1. Each minor drainage basin or micro-catchment unit in the catenary land-scape has to be treated as the naturalunit of management for.purposes ofefficient water control.
2. Rice culture in the lowermost hydro-morphic soil associates will have tobe closely linked with the rain-fedupland in the total farming systemwithin each microcatchment.
3. Since different cropping patternsare needed for the individual drain-age associates of the catena, diversi-fication of cropping at the farm levelwill be inevitable.
4. An intensification of agricultural pro-duction involves both a proper choiceof sowing time and a proper selectionof sowing-to-harvest duration ofcrops, so that there is a maximumlikelihood of the rainfall satisfyingthe crop's water demand (Pana-bokke, 1974).
5. As much as possible, tillage opera-tions should be reduced to a mini-mum. If tillage implements have tobe used, they should be of a non-inverting type that leaves a maxi-mum protection of stubble on thesurface.
Because of the inherent high bulk-den-sity value of the soils, root development ofcrops tends to be restricted. No practicalsolution to this problem has yet been workedout. The very hard consistency of the soilsin the dry state—and their highly abrasivequalities on tillage implements—is yetanother serious impediment to efficientarable cropping under conditions of rain-fedfarming.
Research investigations about the Alfisolsin relation to irrigated farming started in thelate sixties. There are no serious limitationsto irrigated rice culture in the hydromorphicassociates. However, management of theRhodustalfs and Haplustalfs under irrigationposes a few basic problems that have yet tobe solved. These relate to the low aeration
Use of Soils Data
Little or no supporting soil informationwas used during the development periodfrom 1950 to 1962. This was not unusual be-cause the main focus of development wasthe restoration of the ancient irrigationworks that dated from the first century.These abandoned irrigation works consistedof both major and minor schemes that werein varying stages of disuse and disrepairfrom a period spanning 10 to 15 centuries.(A major irrigation scheme is a scheme great-er than 1,000 acres of irrigable command;a minor irrigation scheme is a scheme lessthan 1,000 acres of irrigable command.)However, the irrigation command of theseancient schemes was confined to the bottom-lands where the soils were low humic gleysoils (or Tropaqualfs), and these were invar-iably quite suited for irrigated rice culturein their entirety.
But maximum use of soil-survey data hasbeen made during the development periodfrom 1962 to 1974. The total capital invest-ment on major and minor irrigation projectsduring this period was the equivalent of ap-proximately 150 million U.S. dollars.
The soil-survey data that became availableby 1962 for the whole of the Alfisol regionmade possible the formulation of a schemeof priorities for the individual river basindevelopment projects in this region. Impor-tant decisions on transbasin diversion proj-ects were also made with the aid of the soil-survey information that was now available.This marked a definite change from the ear-lier period where, more often than not, anideal dam site was the sole criterion con-sidered when deciding on an irrigation de-velopment project.
A national plan for the Alfisol region,allocating lands for requirements of agri-culture, plantation forestry, forest reserves,wildlife and nature conservation reserves,and urban development, was formulated in1967. The main recommendations, based on
PANABOKKE 159
soil-survey data, were presented in the Re-port of the Land Utilization Committee(Government of Sri Lanka, 19686) and arenow being carried out by the various stateagencies responsible for the respective areasof development.
By 1965, soil-survey data were being usedin almost every stage in the planning andexecution of irrigation projects. The siting ofthe project, the initial feasibility investiga-tion, detailed economic appraisal, selectionof lands for irrigation, selection of suitablecropping patterns, and calculation of irriga-tion needs were all based on soil-survey andsupporting soils data. The first example ofcomprehensive planning and design of alarge multipurpose irrigation project basedon soil survey was the Uda-Walawe project,in southern Sri Lanka, whose constructionwork started in 1964. The soil-survey reporton this development area of 60,000 acreswas prepared by de Alwis (1963) and formedthe basis for most aspects of the design andlayout of this project.
The Mahaweli transbasin diversion proj-ect was by far the most ambitious of themultipurpose irrigation development proj-ects that were launched in early 1970. In themultidisciplinary feasibility studies conduct-ed from 1965 through 1968 in collaborationwith a UNDP team, medium-intensity soilsurveys covering 947,000 acres were carriedout, and the results have been reported inthe Mahaweli Ganga Irrigation and HydroPower Survey Report, vol. 3 (Government ofSri Lanka, 1968a). The repartition of thetotal project into its individual phases andstages was also determined primarily by thesoil-survey data. In the second developmentstage of this project, high-intensity soil sur-veys covering 250,000 acres were carried out,and the results have been reported in thefeasibility study for this stage (Governmentof Sri Lanka, 1973).
Soil surveys have their maximum appli-cation now in the irrigation developmentprojects where each year between 10,000and 15,000 acres of new land are brought un-der irrigation in the Alfisol region. This in-cludes both gravity and lift irrigation.
Medium-intensity and occasionally high-
intensity soil maps are used in the planningand layout of state farms for rain-fed agri-culture, and more recently in cooperativeyouth settlement projects. These maps showphases of soil series because they are impor-tant to rain-fed agriculture.
It should be borne in mind, however, thatthe soil-survey maps by themselves do notadequately provide all the information re-quired for efficient microplanning at thefarm level. Despite the availability of aconsiderable body of data on soil physicalcharacteristics, irrigation engineers and irri-gation agronomists have yet to work outmore efficient design criteria for the on-farmirrigation layouts that are best adapted tothe conditions of soil and terrain that obtainin the Alfisol region.
Results of soil-management experiencesfrom the Maha Illuppallama Research Sta-tion are directly applicable to the Alfisolregions as a whole. A package of soil-man-agement practices, in both irrigated farmingand rain-fed farming, have been evolved atthe research station, and these have beeneffectively translated by the extension staffto farmers' fields. For extension require-ments, the field identification of the drain-age associates of the soil catena in terms ofthe well-drained member, the imperfectlydrained member, and the poorly drainedmember has gained rapid and easy accep-tance by the farming community. This is tobe expected in this soil-climate environmentwhere the drainage class of the soil is ob-served to be the most important single soilparameter that influences crop adaptabilityand cropping potential in irrigated and rain-fed agriculture. Furthermore, in this Alfisollandscape, where the distance from the crestof the ridge to the floor of the adjacent val-ley in the catenary sequence is never greaterthan three-fourths of a mile, a readily under-stood demarcation of the individual drainageassociates is especially important.
In the fertilizer recommendations for ricein the different Tropaqualfs in the Alfisolregion, soil texture and the soil-drainageclass have an important bearing on the opti-mum levels and frequency of application ofnitrogen fertilizer. On the basis of the work

160 REGIONAL AND NATIONAL DEVELOPMENT
reported about the fertility characteristics ofthe rice-growing soils by Panabokke andNagarajah (1964) and subsequent studiesabout the capability classification of the rice-growing soils by Panabokke (1968), yield-potential benchmarks have been specifiedas the very high potential, high-potential,and medium-potential rice-growing areas.The allocation of fertilizer and other re-sources inputs for each year's national agri-cultural production programs are now basedon the foregoing information.
Physical Accomplishments
The total acreage of agriculturally goodsoil in the Alfisol region far exceeds that ofthe total area that could be served by irriga-tion, even after the complete exploitation ofall water resources, including transbasin di-version from the wet zone of the country.This would naturally imply that a balancedagricultural development within the Alfisolregion would have to be conceived withinthree broad categories of land use: (1) irri-gated farming, (2) semi-irrigated farming,and (3) pure rain-fed farming. The informa-tion made available by the soil surveys hasmade possible the formulation of a schemeof priorities whereby a rational allocationcould be made of available water resourcesin the future. Accordingly, by 1970, a masterplan was formulated for the soil and waterresources development of this region.
Recent developments in crop diversifica-tion on irrigated land have been made possi-ble by identifying and demarcating the indi-vidual soil-drainage associates, and workingout management practices for growing crops(other than rice) on the well-drained and im-perfectly drained soils. Extension of sugar-cane into the imperfectly drained and a partof the poorly drained soils has been madepossible by improved drainage and on-farmirrigation layout.
In rain-fed agriculture, the sowing-to-harvest duration of crops for the differentagroecological regions has been specifiedby matching the physical properties of waterin the soils with the rainfall-confidence limits
and the crop-water requirements.
Socioeconomic Accomplishments
In the last 15 years, somewhat more than85,000 families have settled on approximate-ly 300,000 acres of irrigated land in the Alfi-sol region. Because of recent fiscal policiesby the state, there has been a definite swingtoward growing high-value import substitutecrops in place of rice op the well-drained ir-rigated land. Farmer incomes and employ-ment opportunities have thereby been en-hanced.
Expansion in the rain-fed agriculturalacreage has been mainly confined to thenonirrigated highland near village settle-ments and, to a small extent, in state farms.Here again, the pricing policies of the statthave made the cultivation of some rain-fedcrops an economically attractive enterprise
It is now clearly evident that small-holder farmsteads cannot be completely in-dependent of each other. They have to bandinto some kind of unit for services and or-ganization. Farm planning is now carriedout by an interdisciplinary team consistingof agronomists, soil scientists, sociologists,economists, and farm management special-ists. Its main aim is to create economicallyviable, market-oriented farmsteads and effectchanges in cropping patterns, through plan-ning at the individual farm level on the basisof soils and terrain.
Significant Factors for Successor Failure
Within the limits of the scientific infor-mation that has been available about Rhodu-stalfs and Haplustalfs, it has been possibleto make a significant measure of progress inthe development and management of thehitherto unutilized soil resources of the Alfi- isol region. It should be noted, however, thatthe soil-survey and soil-classification infor-mation per se has not been the sole con-tributory factor in achieving these develop-ment goals. The supporting research and
PANABOKKE 161
management experiences, which, at a cer-tain period, had to be gathered independent-ly of the soil-survey and classification data,have certainly played an equally importantrole.
As indicated earlier, the dearth of mean-ingful scientific information on the manage-ment parameters of tropical Alfisols hadcompelled de novo research investigationsto be initiated around 1950 at the MahaIlluppallama Research Station. Up to theearly sixties, soils that were broadly similarto Sri Lanka's Alfisols had been groupedunder the general category of nonlaterizedred earths of the tropics. Little or no specifictransfer of management experience was pos-sible under these circumstances.
The new classification concepts thatevolved in the early sixties, especially thatof the 7th Approximation, made it possibleto locate and define accurately the positionof Sri Lanka's Alfisols in relation to the restof the tropical world. But this still did notenable any direct practical transfer of man-agement experiences, largely because of thelack of controlled experimental data fromsoils belonging to similar great soil groups.At best, it made it possible to infer selectivestrategies by an intelligent interpretation ofa broad range of data then available forvarious kinds of Latosols.
Only by the early seventies did the inter-national soil literature begin reporting dataspecific to various lower categories in thetropical Alfisols. More recently, experiencesfrom the Oxic Paleustalfs from UTA (Ni-geria) have shown that, for tropical Alfisols,a significant measure of interchange andtransfer of results is possible, even at thesuborder level.
That a clearer specification of the totalenvironment is essential for selective identi-
fication of transferable experience is evident.Apart from the modern nomenclatures ofsoil survey and classification, there is anurgently felt need for more precise defini-tion and description of the landscape mor-phology, hydrology, and rainfall variabilityto ensure a satisfactory transfer of informa-tion. For example, the nature of microvaria-bility in small areas will have a profoundbearing on the total agricultural system thatwill be best suited for a particular soil-land-scape-environment complex. Farm planningand layout, optimum size of economic hold-ing, and proper settlement planning are allgoverned by the nature of the aforementionedparameters.
Furthermore, the socioeconomic frame-work within which a soil region is to be de-veloped has important implications for thekind of soil information that may or may notprove useful. The scope of information that isgenerally used for capital-intensive, large-scale, and mechanized agriculture does notadequately fulfill the requirements for labor-intensive, small-scale development planningin most of the Asian regions.
In conclusion: soil-survey and soil-classi-fication data do provide a reliable guide forselecting the more efficient paths that leadto certain goals of development, especiallyin developing countries whose capital re-sources are scarce and whose planners anddecision makers often have to choose fromamong many possible alternatives. To whatextent contemporary soil-survey and soil-classification knowledge could really activatethe whole complex of agricultural develop-ment would be determined largely by howimaginatively their selective functions couldbe harmonized at the respective level of theplanner, the research worker, the extensionworker, and the fanner.
Literature Cited
ABEYRATNE, E. 1956. Dryland farming in Ceylon. Trop. Agric. 62:191-229.ABEYRATNE, E. 1962. Prospects for agricultural development in the dry zone. Proc. Ceylon Assoc.
Advmt. Sei. 18(2):58-72.DE ALWIS, K.A. 1963. Soil survey of the Uda-Walawe Project. Land Use Division, Irrigation Depart-
ment, Colombo.
162 REGIONAL AND NATIONAL DEVELOPMENT
DE ALWIS, K. A., and C. R. PANABOKKE. 1972. Handbook of soils of Sri Lanka. J. Soil Sei. Sol. Ceylon2:1-97.
GOVERNMENT OF SRI LANKA. 1968a. Mahaweli Ganga irrigation and hydro power survey report. Vol. 3.Soils. Land Use Division, Irrigation Department, Colombo.
GOVERNMENT OF SRI LANKA. 19686. Report of the Land Utilization Committee. Sessional Paper no. 11,Colombo.
GOVERNMENT OF SRI LANKA. 1973. Mahaweli Ganga Development Project I, feasibility study for stageII. Vol. 3. Soils and land classification. Mahaweli Development Board, Colombo.
MOORMANN, F. R., and C. R. PANABOKKE. 1961. A new approach to the identification and classificationof the soil groups of Ceylon. Trop. Agric. 67:3-67.
PANABOKKE, C. R. 1967. Soils and land-use patterns in dry-zone agriculture. Proc. Symp. Agric. inDry Zone. Ceylon Assoc. Advmt. Sei., Colombo.
PANABOKKE, C. R. 1968. Soil science and agricultural development in Ceylon. Proc. Ceylon Assoc.Advmt. Sei. 25(2): 124-144.
PANABOKKE, C. R. 1974. The application of rainfall confidence limits to crop-water requirements indry-zone agriculture. J. Natl. Sei. Coun. Sri Lanka 2(2):95-l 13.
PANABOKKE, C. R., and S. NAGARAJAH. 1964. The fertility characteristics of the rice-growing soils ofCeylon. Trop. Agric. 70:3-30.

Soils and Institutional Requirements for RegionalPlanning and Development
M.L. DEWAN
Regional Bureau for Asia and the Far EastFood and Agriculture Organization of the United Nations, Rome, Italy
The use of soils data in regional and national development has been gaining more and moreimportance as a means of making the most efficient use of natural resources, especially land re-sources. The importance of such data stems from the need to feed rapidly expanding populationsin the face of diminishing or deteriorating land resources in the tropics. Therefore, clear recogni-tion of the need for planning optimum land use as an aid in regional and national development isimperative.
Four case studies are presented in this paper as examples: of Iran (region of Khuzestan);Pakistan; India (region of Rajasthan); and Bangladesh. Attention is focused on the fact that con-siderable efforts have been and are being made in the utilization of soils data and the results ofsoil surveys and soil and land classification for agricultural development in these countries. How-ever, there is much scope for further improvement.
A review is presented of the dynamics of development and the interaction of factors involvedin agricultural development planning, the causes for variability in agriculture, and the majorpolicies concerning the place of soils data in planning of development. Reference is made tosome sociopolitical factors, and examples of the People's Republic of China are cited. A proposalfor legislation for natural resources conservation and utilization is mentioned also.
Finally a review is given of the FAO programs and policies in using soils data; of the FAO'srole in land evaluation, in the preparation of the Country Perspective studies, and in the agri-cultural development programming. Assistance is being given to countries in the execution oftheir programs through technical assistance measures as well as through some programs ofaction for development.
Regional and national development is a urban development; this in turn leads tophrase much used now, justified usually by regional and national agricultural planningthe closely associated factors of rapidly ex- and development.panding populations and diminishing rural The range of possible interpretations ofland resources in the tropics. Recognition of soils data is vast; hence, it is impossible eventhe need for planning optimum land use in- to describe all applications in this paper, letevitably leads to the demand for an inventory alone give examples of the main interpreta-of soils and land resources and to the inter- tions. Therefore, I will describe in this paperpretation of these data into appropriate for- four general examples in Asian countriesmats for, among other things, tax assessment, where soils data have been used in formu-individual farm planning, and rural and lating policies for regional and national agri-
163
164 REGIONAL AND NATIONAL DEVELOPMENT
cultural development: (1) the Khuzestan de-velopment in Iran; (2) the soil survey ofPakistan and its effects on agricultural devel-opment in Pakistan; (3) the Rajasthan Canalsurvey and the Chambal soil survey and re-gional development of Rajasthan, India; and(4) the soil survey and agricultural develop-ment of Bangladesh, with special regard todrainage, irrigation, and land development.
Four Case Studies
The Khuzestan Development in Iran
The Khuzestan plain in Iran, which coversabout 3 million hectares in the southwestof the country, is a continuation of the Meso-potamia plain in Iraq. Its northern boundaryis formed by the Zagros Mountains, whichare characterized by successive mountainranges; its southern boundary, by the Per-sian Gulf. The plain is level to gently sloping,its rivers flowing in a braidlike manner,forming a wide flat plain interwoven inter-mittently by channels.
The soil survey conducted in the Khuzes-tan plain and a more detailed one in the Dez-ful area revealed a variety of soils developedpartly under different climatic conditions inthe past. Through the interpretation of indi-cations given by the traces of old irrigationsystems in the area, information has becomeavailable about agriculture in different peri-ods. The soil mapping done has divided thesoils into the following groups, which are allessentially alluvial: (1) soils of the olderlandscapes, without irrigation cover; (2) soilsof the older landscapes, with thick irrigationcover; (3) soils of the young landscapes, withthick irrigation cover; (4) soils of the younglandscapes, with thin or no irrigation cover;and (5) miscellaneous soils including gravel-ly and hilly soils.
The studies done and the soils and land-classification and land-use maps preparedhave had a great influence on the planning ofagricultural development in this region. Firstof all, it became clear that in this plain theglory of the past could be revived, providedsoil and associated water-development prob-
lems were taken care of (this region was thecenter of Susa and the great empire of Persiaabout 3,000 years ago). This important con-clusion enabled the Government of Iran toinvite a group of consulting engineers, head-ed by Messrs. David Lilienthal and GordonClapp, who formed the Khuzestan Develop-ment Service and assisted the Government inpreparing plans and programs for a speedydevelopment of the region. Detailed survey,soil fertility, and other related studies werecarried out with the FAO's technical assis-tance. All these activities resulted in plan-ning, which established various agencies,starting with a newly established agencycalled the Khuzestan Water and PowerAuthority. Finally, the Agriculture Depart-ment and other departments in Khuzestanjoined the effort and worked out a blueprint:(1) that permitted a large-scale investment inthe Khuzestan area for agricultural and wa-ter-resource development; (2) that promotedin the region the development of agro-indus-tries, including the sugarcane and paper in-dustries; (3) that permitted the consolidationof agriculture into large-scale agro-industrialenterprises concentrating on such industrialcommodities as sugarcane, animal products,vegetables and fruits, cotton, sunflower, andthe like; and (4) that introduced, from 1957to 1958, the use of fertilizers and promotedtheir efficient use (Table 1).
The program in Khuzestan served as atraining ground for many Iranians in effec-tive agricultural development programs, in-cluding efficient use of fertilizers, soils andwater management, drainage and reclama-tion, and multiple cropping enterprises.
Although in the beginning the develop-ment of the Khuzestan region was the re-sponsibility of the Khuzestan DevelopmentService, an agency working under the Plan-ning Organization of the Government ofIran, the task has been delegated recently, by jsubject, to the technical ministries con-cerned. 4
The impact of agricultural developmentin Khuzestan is shown in Table 2 in ratherapproximate data that areas that have ahigh development potential have received—and will be receiving—a much higher invest-
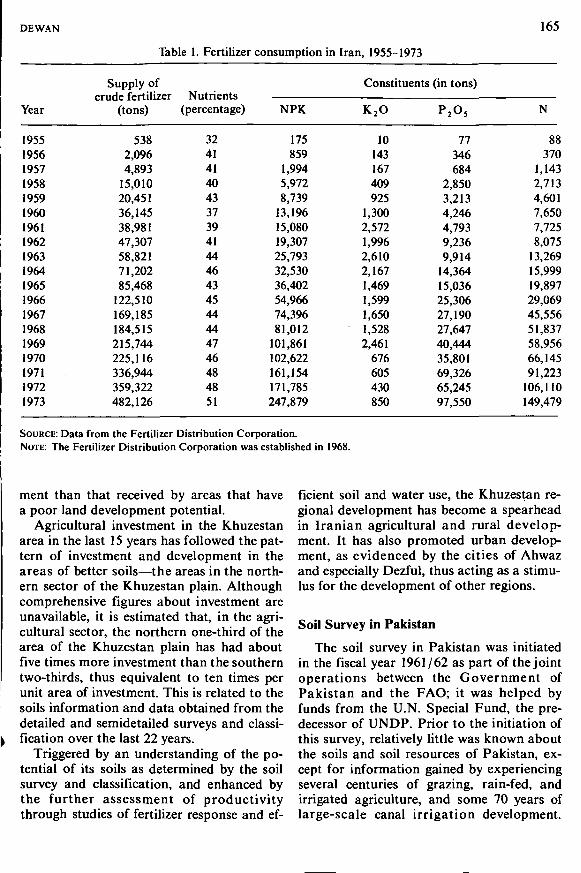
DEWAN 165
Table 1. Fertilizer consumption in Iran, 1955-1973
Year
1955195619571958195919601961196219631964196519661967196819691970197119721973
Supply ofrrnde fertilizer1 UUv Ivl Ulltvi
(tons)
5382,0964,893
15,01020,45136,14538,98147,30758,82171,20285,468
122,510169,185184,515215,744225,116336,944359,322482,126
Nutrients(percentage)
32414140433739414446434544444746484851
NPK
175859
1,9945,9728,739
13,19615,08019,30725,79332,53036,40254,96674,39681,012
101,861102,622161,154171,785247,879
Constituents (in tons)
K2O
10143167409925
1,3002,5721,9962,6102,1671,4691,5991,6501,5282,461
676605430850
P 2 O 5
77346684
2,8503,2134,2464,7939,2369,914
14,36415,03625,30627,19027,64740,44435,80169,32665,24597,550
N
88370
1,1432,7134,6017,6507,7258,075
13,26915,99919,89729,06945,55651,83758,95666,14591,223
106,110149,479
SOURCE: Data from the Fertilizer Distribution Corporation.NOTE: The Fertilizer Distribution Corporation was established in 1968.
ment than that received by areas that havea poor land development potential.
Agricultural investment in the Khuzestanarea in the last 15 years has followed the pat-tern of investment and development in theareas of better soils—the areas in the north-ern sector of the Khuzestan plain. Althoughcomprehensive figures about investment areunavailable, it is estimated that, in the agri-cultural sector, the northern one-third of thearea of the Khuzestan plain has had aboutfive times more investment than the southerntwo-thirds, thus equivalent to ten times perunit area of investment. This is related to thesoils information and data obtained from thedetailed and semidetailed surveys and classi-fication over the last 22 years.
Triggered by an understanding of the po-tential of its soils as determined by the soilsurvey and classification, and enhanced bythe further assessment of productivitythrough studies of fertilizer response and ef-
ficient soil and water use, the Khuzestan re-gional development has become a spearheadin Iranian agricultural and rural develop-ment. It has also promoted urban develop-ment, as evidenced by the cities of Ahwazand especially Dezful, thus acting as a stimu-lus for the development of other regions.
Soil Survey in Pakistan
The soil survey in Pakistan was initiatedin the fiscal year 1961/62 as part of the jointoperations between the Government ofPakistan and the FAO; it was helped byfunds from the U.N. Special Fund, the pre-decessor of UNDP. Prior to the initiation ofthis survey, relatively little was known aboutthe soils and soil resources of Pakistan, ex-cept for information gained by experiencingseveral centuries of grazing, rain-fed, andirrigated agriculture, and some 70 years oflarge-scale canal irrigation development.
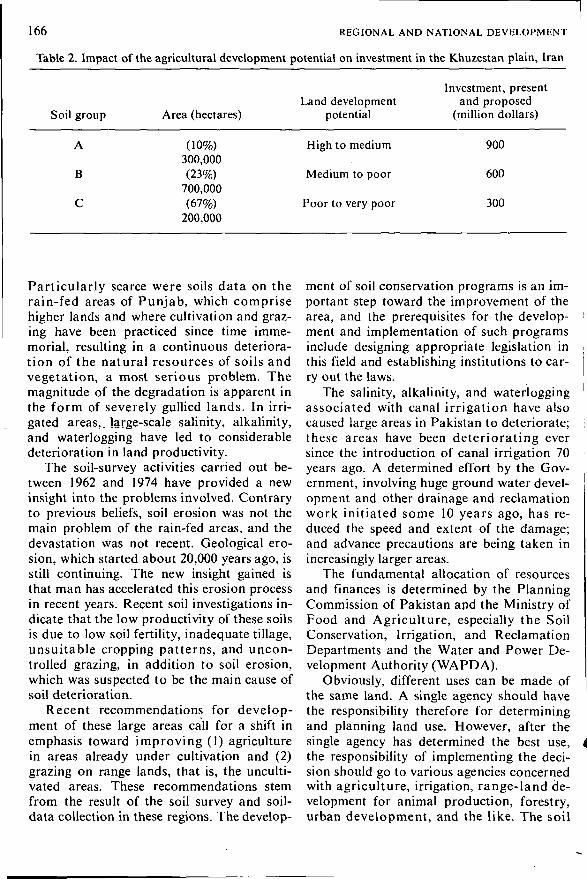
166 REGIONAL AND NATIONAL DEVELOPMENT
Table 2. Impact of the agricultural development potential on investment in the Khuzestan plain, Iran
Soil group
A
B
C
Area (hectares)
(10%)300,000(23%)
700,000(67%)
200,000
Land developmentpotential
High to medium
Medium to poor
Poor to very poor
Investment, presentand proposed
(million dollars)
900
600
300
Particularly scarce were soils data on therain-fed areas of Punjab, which comprisehigher lands and where cultivation and graz-ing have been practiced since time imme-morial, resulting in a continuous deteriora-tion of the natural resources of soils andvegetation, a most serious problem. Themagnitude of the degradation is apparent inthe form of severely gullied lands. In irri-gated areas,, large-scale salinity, alkalinity,and waterlogging have led to considerabledeterioration in land productivity.
The soil-survey activities carried out be-tween 1962 and 1974 have provided a newinsight into the problems involved. Contraryto previous beliefs, soil erosion was not themain problem of the rain-fed areas, and thedevastation was not recent. Geological ero-sion, which started about 20,000 years ago, isstill continuing. The new insight gained isthat man has accelerated this erosion processin recent years. Recent soil investigations in-dicate that the low productivity of these soilsis due to low soil fertility, inadequate tillage,unsuitable cropping patterns, and uncon-trolled grazing, in addition to soil erosion,which was suspected to be the main cause ofsoil deterioration.
Recent recommendations for develop-ment of these large areas call for a shift inemphasis toward improving (1) agriculturein areas already under cultivation and (2)grazing on range lands, that is, the unculti-vated areas. These recommendations stemfrom the result of the soil survey and soil-data collection in these regions. The develop-
ment of soil conservation programs is an im-portant step toward the improvement of thearea, and the prerequisites for the develop-ment and implementation of such programsinclude designing appropriate legislation inthis field and establishing institutions to car-ry out the laws.
The salinity, alkalinity, and waterloggingassociated with canal irrigation have alsocaused large areas in Pakistan to deteriorate;these areas have been deteriorating eversince the introduction of canal irrigation 70years ago. A determined effort by the Gov-ernment, involving huge ground water devel-opment and other drainage and reclamationwork initiated some 10 years ago, has re-duced the speed and extent of the damage;and advance precautions are being taken inincreasingly larger areas.
The fundamental allocation of resourcesand finances is determined by the PlanningCommission of Pakistan and the Ministry ofFood and Agriculture, especially the SoilConservation, Irrigation, and ReclamationDepartments and the Water and Power De-velopment Authority (WAPDA).
Obviously, different uses can be made ofthe same land. A single agency should havethe responsibility therefore for determiningand planning land use. However, after thesingle agency has determined the best use,the responsibility of implementing the deci-sion should go to various agencies concernedwith agriculture, irrigation, range-land de-velopment for animal production, forestry,urban development, and the like. The soil
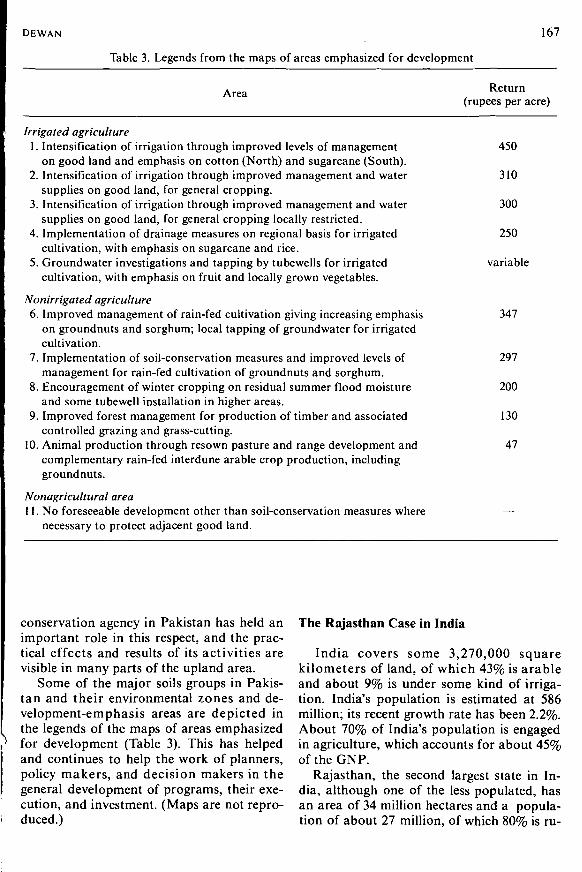
DEWAN 167
Table 3. Legends from the maps of areas emphasized for development
Area
Nonirrigated agriculture6. Improved management of rain-fed cultivation giving increasing emphasis
on groundnuts and sorghum; local tapping of groundwater for irrigatedcultivation.
7. Implementation of soil-conservation measures and improved levels ofmanagement for rain-fed cultivation of groundnuts and sorghum.
8. Encouragement of winter cropping on residual summer flood moistureand some tubewell installation in higher areas.
9. Improved forest management for production of timber and associatedcontrolled grazing and grass-cutting.
10. Animal production through resown pasture and range development andcomplementary rain-fed interdune arable crop production, includinggroundnuts.
Nonagricultural area11. No foreseeable development other than soil-conservation measures where
necessary to protect adjacent good land.
Return(rupees per acre)
Irrigated agriculture1. Intensification of irrigation through improved levels of management
on good land and emphasis on cotton (North) and sugarcane (South).2. Intensification of irrigation through improved management and water
supplies on good land, for general cropping.3. Intensification of irrigation through improved management and water
supplies on good land, for general cropping locally restricted.4. Implementation of drainage measures on regional basis for irrigated
cultivation, with emphasis on sugarcane and rice.5. Groundwater investigations and tapping by tubewells for irrigated
cultivation, with emphasis on fruit and locally grown vegetables.
450
310
300
250
variable
347
297
200
130
47
conservation agency in Pakistan has held animportant role in this respect, and the prac-tical effects and results of its activities arevisible in many parts of the upland area.
Some of the major soils groups in Pakis-tan and their environmental zones and de-velopment-emphasis areas are depicted inthe legends of the maps of areas emphasizedfor development (Table 3). This has helpedand continues to help the work of planners,policy makers, and decision makers in thegeneral development of programs, their exe-cution, and investment. (Maps are not repro-duced.)
The Rajasthan Case in India
India covers some 3,270,000 squarekilometers of land, of which 43% is arableand about 9% is under some kind of irriga-tion. India's population is estimated at 586million; its recent growth rate has been 2.2%.About 70% of India's population is engagedin agriculture, which accounts for about 45%of the GNP.
Rajasthan, the second largest state in In-dia, although one of the less populated, hasan area of 34 million hectares and a popula-tion of about 27 million, of which 80% is ru-
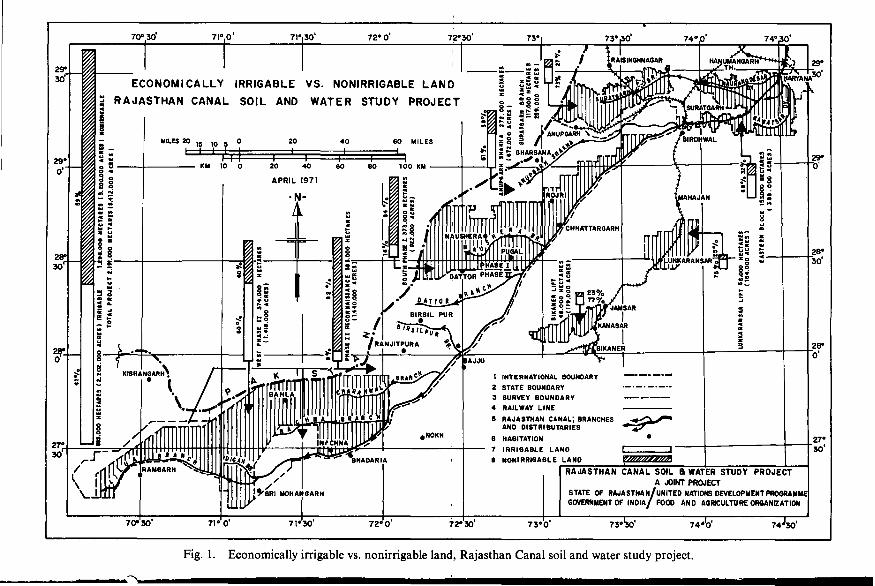
70-30' 71" 0 71° SO' 72° O' 72*30 74*0' 74" O'
ECONOMICALLY IRRIGABLE VS. NONIRRIGABLE LAND
RAJASTHAN CANAL SOIL AND WATER STUDY PROJECT
1 INTERNATIONAL BOUNDARY
2 STATE BOUNDARY
3 SURVEY BOUNOARY
4 RAILWAY LINE
R A J A S T H A N C A N A L SOIL 8 WATER STUDY PROJECT
A JOINT PROJECT
STATE OF R A J A S T M A N / U N I T E D NATIONS DEVELOPMENT PROGRAMME
GOVERNMENT OF INDIA/ FOOD AND AGRICULTURE ORGANIZATION
70*30' 71° 0' 74J30'
Fig. 1. Economically irrigable vs. nonirrigable land, Rajasthan Canal soil and water study project.
DEWAN 169
ral. The northwestern part of Rajasthan isarid; its rainfall is less than 300 mm anddrains toward the Indus River. The south-western part can be called semiarid since ithas rainfalls of 800 to 950 mm, which drainmostly to the Chambal River and thence tothe Ganga system.
About 13 million hectares in Rajasthanconstitute a largely uncultivated desert; 1million hectares are forests; and 14.3 millionhectares grow rain-fed crops, mainly millet,sorghum, and chickpeas. About 2.1 millionhectares are irrigated: 55% by dug wells; 35%by public canal systems; and 10% by tanks.Irrigated crops include cotton, wheat, paddy,sugarcane, millet, pulses, oilseeds, fruits,and vegetables.
Concern has been growing in India forthe last several years over the inadequateutilization of irrigation systems. In response,India's development program for the next 5years emphasizes the command-area devel-opment, and thus the Rajasthan Canal proj-ect and the Chambal irrigation project, bothin Rajasthan, will play a great role in the ag-ricultural development plans of Rajasthanand India. In general, the approach is toachieve integrated development of the land,water, and human resources in irrigatedareas through unified project management.
The first step, initiated in the mid-sixtiesfor the Rajasthan Canal area and later forthe Chambal project, was to carry out a soilsurvey and land classification of the projectareas. The map (Figure 1) of economicallyirrigable versus nonirrigable lands in theRajasthan Canal area, based on detailed soilstudies of this area of over 2 million hectares,is the basis of a large-scale development pro-gram for the region. This development pro-gram, also applying to the Chambal projectarea where again detailed studies were car-ried out and soil maps were prepared, hashad several important results for the devel-opment of Rajasthan.
A Rajasthan Land Development Corpo-ration (RLDC) is being established as astatutory body to be set up under an act.Legislation would empower the RLDC tocarry out on-farm development on a compul-sory basis. The RLDC will have a board of
directors, chaired by a very senior officer ofthe Government of India, joined by the offi-cers of the Agricultural Refinance Corpora-tion, the Command Area Authority Commis-sioner, the Managing Director of the RLDC,and the like. The purpose of the RLDCwould be to act as a financial intermediaryfor the on-farm development that would belargely financed by credit to the farmers. TheRLDC would have an authorized shared cap-ital of 100 million rupees. The Governmentof India would subsidize certain categories ofdisadvantaged farmers, including marginalfarmers (owning less than 1 hectare) at asubsidy rate of 33% of the costs of develop-ment, and small farmers (owning less than2 hectares) at a subsidy rate of 25%. Forfarmers who have excessive land-shapingcosts and for farmers whose land has beenseriously damaged by salinity, the subsidywould equal those costs determined to bebeyond the farmers' capacity to pay. Othercategories of farmers would also be eligiblefor special loans from the RLDC.
Thus, the Rajasthan Canal and Chambalprojects in Rajasthan are two projects wherethe soil survey has paved the way for dataevaluation for specific agricultural planningand has led to both institutional and financ-ing changes.
The projects are now under execution,assisted by a World Bank loan. Their activi-ties are summarized as follows: (1) land de-velopment including reclamation; (2) liningof the irrigation system; (3) afforestation; (4)road construction; (5) domestic water sup-ply; (6) use of fertilizers; and (7) other proj-ect components such as agricultural supportservices.
Total project costs are estimated at 174.0million U.S. dollars, and the foreign ex-change component is 27% of the total projectcost, based on the December 1973 pricelevel, which includes a sharp increase in fuelcost.
The result of the above project tasks hasbeen to focus the attention of the govern-ments of India and Rajasthan on measures toensure prompt and full utilization of the cre-ated irrigation potential. These measures,identified by a Committee of State Ministers
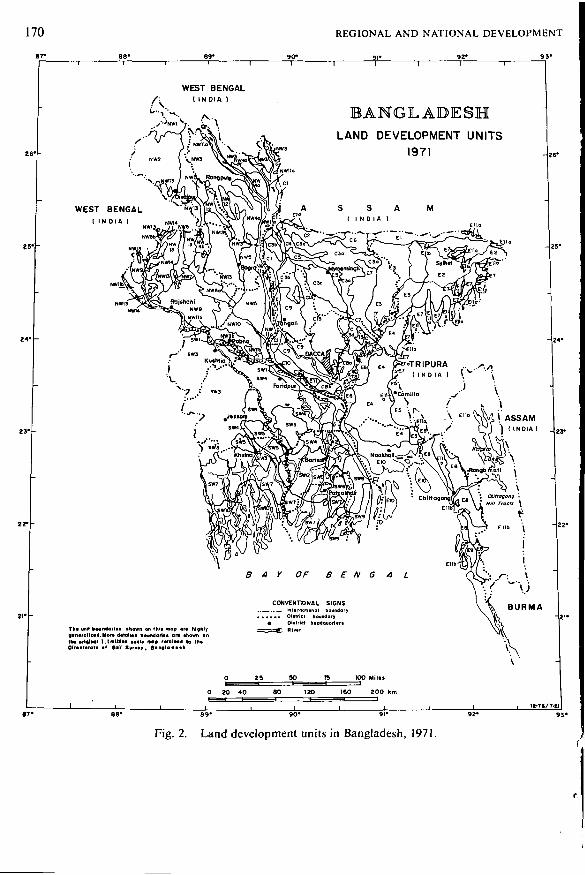
170 REGIONAL AND NATIONAL DEVELOPMENT
90*—i r
BANGLADESHLAND DEVELOPMENT UNITS
1971
WEST BENGAL( I N D I A )
ASSAM{ I N D I A )
Tha unit boundoria* thown on ihl» nop ara highlygartarel.iad.Mor* data! tad bmintfort«! or* ttiomn ontha original l:tminioa tcala map ratainad bj lhaDiraeterota af Soil Survoy, Bonf lodath
CONVENTIONAL SIGNS. . . — In ta motional boundaryi > • • Dittrici boundary• Ohtriet haadquanar«
BURMA
Ri
0 20 40 SO 120 160 200 km
Fig. 2. Land development units in Bangladesh, 1971.
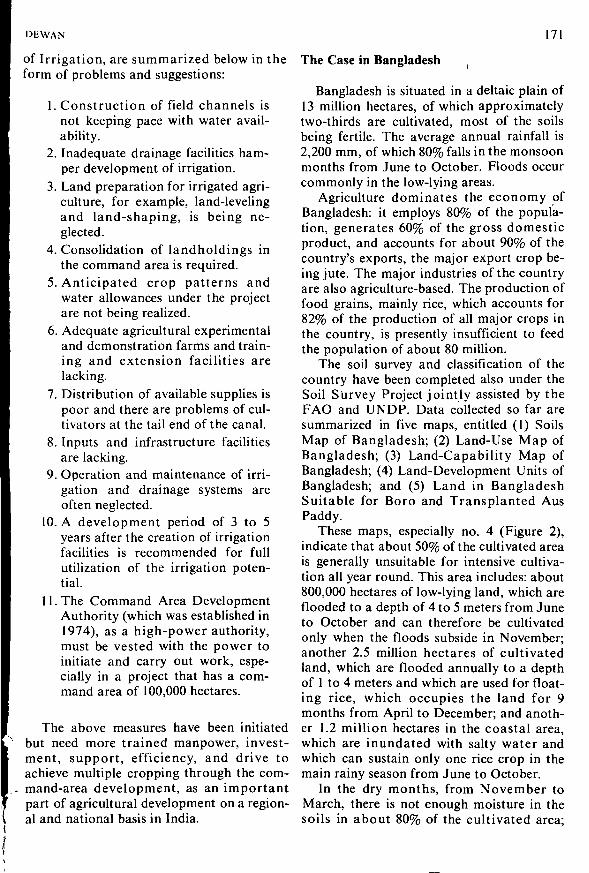
DE WAN 171
of Irrigation, are summarized below in theform of problems and suggestions:
1. Construction of field channels isnot keeping pace with water avail-ability.
2. Inadequate drainage facilities ham-per development of irrigation.
3. Land preparation for irrigated agri-culture, for example, land-levelingand land-shaping, is being ne-glected.
4. Consolidation of landholdings inthe command area is required.
5. Anticipated crop patterns andwater allowances under the projectare not being realized.
6. Adequate agricultural experimentaland demonstration farms and train-ing and extension facilities arelacking.
7. Distribution of available supplies ispoor and there are problems of cul-tivators at the tail end of the canal.
8. Inputs and infrastructure facilitiesare lacking.
9. Operation and maintenance of irri-gation and drainage systems areoften neglected.
10. A development period of 3 to 5years after the creation of irrigationfacilities is recommended for fullutilization of the irrigation poten-tial.
11. The Command Area DevelopmentAuthority (which was established in1974), as a high-power authority,must be vested with the power toinitiate and carry out work, espe-cially in a project that has a com-mand area of 100,000 hectares.
The above measures have been initiatedbut need more trained manpower, invest-ment, support, efficiency, and drive toachieve multiple cropping through the com-
,- mand-area development, as an importantpart of agricultural development on a region-al and national basis in India.
The Case in Bangladesh
Bangladesh is situated in a deltaic plain of13 million hectares, of which approximatelytwo-thirds are cultivated, most of the soilsbeing fertile. The average annual rainfall is2,200 mm, of which 80% falls in the monsoonmonths from June to October. Floods occurcommonly in the low-lying areas.
Agriculture dominates the economy ofBangladesh: it employs 80% of the popula-tion, generates 60% of the gross domesticproduct, and accounts for about 90% of thecountry's exports, the major export crop be-ing jute. The major industries of the countryare also agriculture-based. The production offood grains, mainly rice, which accounts for82% of the production of all major crops inthe country, is presently insufficient to feedthe population of about 80 million.
The soil survey and classification of thecountry have been completed also under theSoil Survey Project jointly assisted by theFAO and UNDP. Data collected so far aresummarized in five maps, entitled (1) SoilsMap of Bangladesh; (2) Land-Use Map ofBangladesh; (3) Land-Capability Map ofBangladesh; (4) Land-Development Units ofBangladesh; and (5) Land in BangladeshSuitable for Boro and Transplanted AusPaddy.
These maps, especially no. 4 (Figure 2),indicate that about 50% of the cultivated areais generally unsuitable for intensive cultiva-tion all year round. This area includes: about800,000 hectares of low-lying land, which areflooded to a depth of 4 to 5 meters from Juneto October and can therefore be cultivatedonly when the floods subside in November;another 2.5 million hectares of cultivatedland, which are flooded annually to a depthof 1 to 4 meters and which are used for float-ing rice, which occupies the land for 9months from April to December; and anoth-er 1.2 million hectares in the coastal area,which are inundated with salty water andwhich can sustain only one rice crop in themain rainy season from June to October.
In the dry months, from November toMarch, there is not enough moisture in thesoils in about 80% of the cultivated area;
172 REGIONAL AND NATIONAL DEVELOPMENT
hence irrigation is essential if multiple crop-ping is to be practiced. Irrigation is beingprovided therefore through deep tubewells,shallow tubewells, and low-lift pumps; theyare being given priority by the Government.There are also abnormal floods and droughtsand threats of cyclones from the Bay of Ben-gal, all of which impede agricultural devel-opment considerably.
The use of the major soils of the area forcrop production is very much governed bytheir nature and their location in respect tothe flood level. Crop diversification is alsobeing practiced, and animal husbandry,forestry, and fisheries are included in the ag-ricultural development programs.
There are large bodies of water in Bang-ladesh—lakes, rivers, small and big ponds—which are often covered by water hyacinthand other aquatic weeds that do not permitthe efficient use of these water bodies forfish culture.
The soil-survey information and soilsdata collected in Bangladesh make it pos-sible not only to identify the various types ofland use that can be planned and pro-grammed, but also to contribute vitally to theagricultural development planning and pro-gramming for the whole of Bangladesh. Thisagricultural development planning will in-clude not only multiple cropping in the culti-vated areas but also pasture development innoncultivated areas and forestry and fisher-ies development.
Many agencies are involved in the agri-cultural development process: the Ministryof Agriculture, the Ministry of Food, theMinistry of Flood Control and Water Devel-opment, the Ministry of Rural Affairs, andthe Planning Commission, which is the co-ordinating ministry, and the President'sSecretariat, which plays a major role in pro-gram approval. Because of the overlappingof responsibilities amongst these multiplegovernmental bodies, the practical effectsand results achieved are slowed down. Thesecond impediment adversely influencing ef-fective application is the lack of supportingcapital required for (1) major flood-controlstructures, a good number of which are to bebuilt outside the country, namely, in India;
and (2) low-lift pumps for the second andthird crops in the dry zones, and the hoped-for development of appropriate technologyin the use of solar pumps. The third hin-drance to effective program application islack of trained manpower.
The Dynamics of Development andInteraction of Factors
Agricultural Development Planning:Basis for Decisions
Decisions are made normally on the fol-lowing bases: (1) allocation of resources toagriculture versus nonagriculture; (2) allo-cation to various inputs and institutions inthe field of agriculture; (3) allocation amongcrops and regions, both of which depend onsoils, water, and people; and (4) optimal al-location demanding concentration of inputsin the more responsive situations (the opti-mal allocation formula is often changed forpolitical or social reasons).
Variability in Agriculture
Variability in agriculture is caused by (1)physical conditions, including soils, water,and other natural resources; (2) cultural fac-tors; (3) institutional variation; (4) economicvariability, including price of inputs and out-puts; and (5) geographic variability.
Major Soils-Data Policies in Planningand Development
Soils-data policies should be such thattheir scope and functions include the follow-ing: (1) an efficient organization for carryingout soil surveys and soil and land classifica-tion, including a land-evaluation system; (2)acceptance and utilization by the planningauthorities of the soil and land data base fordevelopment; (3) the right to refuse sanc-tioning a project and providing investmentand capital when there is no data base; (4)the consideration of enacting legislation ifsoil and land resources are endangered, suchas a soil conservation act, or soil salinity or
DEWAN 173
alkalinity removal, or a land reclamationact, and consideration of establishing meansand measures to enforce such acts; and (5)an integrated approach through develop-ment of physical and human resources.
Significant Factors InfluencingEffective Application
Sociopolitical factors
Although sociopolitical factors are notthe primary subject of this paper, the pro-cess of agricultural development and itsdynamics cannot be evaluated properly with-out reference to social and even to politicalfactors. For example, as more soils data andagricultural development data of the Peo-ple's Republic of China become available,some important matters are coming to light,especially about communes and land produc-tivity in the People's Republic of China.Great emphasis is being given to develop-ment of areas of really good soils, but at thesame time, it is being established that thereare no really bad soils, because all soils canbe improved by human and common efforts.The People's Republic of China mentionseight agrotechnical regimes or measures asbeing essential for improving its agriculturalyield and productivity: (1) extensive irriga-tion construction and water conservation; (2)extensive utilization of fertilizers and organicmanure; (3) reworking and improvement ofsoils, including an increase in depth of plow-ing; (4) more dense sowing of crops; (5) useof improved varieties of seeds; (6) plant pro-tection against damage and diseases; (7) im-provement of agricultural equipment; and(8) care for all plants.
Soils information is being used in theoverall agricultural development programs,but great decentralization is achievedthrough the commune system. Averageyields of crops have risen considerably, andpeople's participation is the theme of thelarge action programs indicated in the eightpoints above.
Participation of people
People's participation is illustrated by
several programs in the People's Republic ofChina, such as the Red Flag Canal, 120 kmlong and built in 80 days by 1.2 million peo-ple, and the Yellow River Flood ControlProject. Some community development proj-ects in India, Pakistan, and Bangladesh arealso indicative of people's participation, butmore education, training, and extension arerequired in these countries when comparedwith those of the People's Republic of China.The monsoon lands of Asia have large popu-lations that can be a great resource if proper-ly utilized.
Investment possibilities
Investment possibilities are provided byinternal or external funding, including inter-national or regional banks, bilateral agen-cies, and donor countries, which have some-times formed a consortium for developmentaid.
Legislation
The many problems raised by the re-quirements for optimum management ofnatural resources necessitate ever greaterattention from governments and internation-al organizations. Concern stems from variouscauses, principally from the fact that somenatural resources are limited quantitativelyand qualitatively. But, because of technolog-ical progress, there are increasing opportuni-ties for these limited resources to be ex-ploited. There is a growing awareness oftheir interdependency and of the need toadopt an interdisciplinary approach in theirregard. This problem is further deepened bypopulation growth, leading, on the one hand,to increased demand for resources and, onthe other, to concern for the protection of en-vironment.
The time has come for the entire complexof natural resources to be treated as a com-mon and integrated whole and as a constitu-ent element, along with others, of the humanenvironment. Such a unified approach ap-plies not only to the management of re-sources but also to the relevant legislationand to the organization of those institutionswhose task it should be to administer them.
174 REGIONAL AND NATIONAL DEVELOPMENT
In this connection, the FAO LegislativeStudy No. 9, A Legal and InstitutionalFramework for Natural Resources Manage-ment (Cano, 1975), is relevant. Special ref-erence is made to this work because soils arean important—together with water probablythe most important—natural resource man-kind has at its disposal.
Review of FAO Policies in UsingSoils Data
Land Evaluation
Since 1970, the FAO Soils Service(AGLS) has given increasing priority to thedevelopment of a Framework of Land Evalu-ation, which would be widely acceptable tosurvey and evaluation organizations andmeet the needs of the widest range of pos-sible users. (Land evaluation as defined bythe FAO is "the process of collating and in-terpreting basic inventories of soil, vegeta-tion, climate and other aspects of land inorder to identify and make a comparison ofpromising land use alternatives, in terms ap-plicable to the objectives of the evaluation.")Preparatory work was undertaken in 1971and 1972 by two multidisciplinary commit-tees, one in the Netherlands and one withinthe FAO. These activities resulted in thejoint preparation of a background document(FAO/ UNDP, 1972), which formed the basisfor an international consultation on the sub-ject, held at the International AgriculturalCenter, Wageningen, October 1972, and at-tended by 44 internationally recognized re-source appraisal experts from 22 countries.Papers describing various land classificationsystems used throughout the world formedpart of the background document and werepublished by the FAO (1974a).
A summary of the discussions of the con-sultation and the recommendations agreedupon was published by the ILRI (1973).General agreement was reached on most ofthe questions discussed, and a major stepforward was taken when a Framework forLand Evaluation was devised, into whichnational systems could fit. This Framework
was later published by the FAO (1974a)and given wide distribution, with a requestfor comment. Comments received were con-sidered at a small ad hoc expert consultationin Rome; 10 major subject areas for improve-ment were identified; and an account of theproceedings was published by the FAO(FAO/ UNDP 1975). A revised Framework isto be produced incorporating changes agreedupon at the consultation. The concepts anddevelopment of the Framework were thesubject of the Tenth Session of the ECAWorking Party on Soil Classification andSurvey held in Czechoslovakia in September1975.
In essence, the Framework recommendsqualitative or quantitative classification ofland for well-defined utilization types, underunimproved and improved conditions, bysuitability orders, classes, subclasses, andunits. A single-stage (physical and socioeco-nomic studies combined) approach or a two-stage (physical studies followed by socioeco-nomic studies) approach is allowed for, asappropriate to the requirements of a partic-ular evaluation. The latter point is the es-sence of the Framework, which, as its nameimplies, is intended to provide merely an out-line of principles and terminology withinwhich local systems of land evaluation maybe formulated.
At first sight, the concepts proposed donot seem unprecedented, but in practice theycall for considerable change in traditionalresource-interpretation thinking. A multi-disciplinary approach is required that uses aphysical basis, in a social and economic con-text, for comparing land suitability. Basic tothis approach is the concept that land evalua-tion is meaningful only in relation to a clear-ly defined use.
The Framework is rapidly gaining inter-national acceptance and is already beingused by several countries and in many proj-ects.
Future activities of AGLS involve furtherrefinement of the Framework through expertconsultations (Rome, 1976) and promotionof its international use through regional sem-inars and conferences on land evaluation
DEWAN 175
(Asia and the Far East, 1976, in cooperationwith ESCAP and UNEP; Africa, 1976).
Country Perspective Studies
A perspective study of the agriculturaldevelopment for Pakistan was prepared(FAO, 1974b). This study was launched pri-marily because of the increasingly felt needfor the country's focus on agriculture. TheCountry Perspective Studies (CPS) supplyan analysis not only of major developmentobjectives but also of mobilization of re-sources, income distribution, unemployment,foreign exchange earnings, and moderniza-tion of agriculture. The core of the CPS re-lates to the exploration of alternative agri-cultural development strategies within thebroad framework of the total economy andits overall development alternatives, in thecontext of a time horizon extending to theperiod from 1985 to 1990. The Country Per-spective Studies are essentially economicstudies, but they also take into considerationthe physical base of the resources, includingland and water. Similar studies have beenmade for regions in Indonesia, Nepal, Ma-laysia, and Bangladesh.
Agricultural DevelopmentProgramming
Programming miss ions have beenlaunched for Nepal and Pakistan and are be-ing established for Indonesia and Bangla-desh. The purpose of these programmingmissions is to assist the national govern-
ments in the preparation of developmentprograms, to identify areas for project devel-opment, and, where required, to assist inidentifying technical assistance requirementsin the food, agricultural, and rural sectors.The missions focus their attention on theimprovement of living standards and publicservices; equity of income distribution; gen-eration of productive employment; regionaldevelopment and integration; self-sufficien-cy; import substitution; and strengthening ofthe economic structure.
Assistance in Execution
Assistance is being given to developingcountries by the FAO under what is termedits Regular Program: through field pro-grams, which are financed mainly by theUnited Nations Development Program;through the Freedom from Hunger Cam-paign Action for Development; and throughthe so-called Government Cooperative Pro-gram, where the assistance is financed bydonor governments and executed by theFAO (many Scandinavian countries are pro-viding aid in this way, under programs suchas the FAO/ SIDA and the FAO/DANIDA).Some countries provide "Funds-in-Trust" tothe FAO for the execution of projects, whichare sometimes financed fully by these gov-ernments and sometimes on a cost-sharingbasis between the government and the FAO/UNDP. The FAO also plays a role in identi-fying projects and in analyzing or proposingthem for investment by the World Bank and,probably in the future, by the InternationalFund for Agricultural Development.
References
CANO, G.J. 1975. A legal and institutional framework for natural resources management. LegislativeStudy no. 9. FAO, Rome.
CHRISTY, L.C. 1971. Legislative principles of soil conservation. FAO. Soils Bull. no. 15. Rome.DEWAN, M. L., and J. FAMOURI. 1964. The soils of Iran. FAO, Rome.FAO. 1973. Country development brief for Bangladesh—food and agriculture sector. Food and Agri-
culture Sector, Country Development Brief Series, DDA/CDB, no. 2.FAO. 1974a. A framework for land evaluation. Soil Resources Development and Conservation Service,
Land and Water Development Division. FAO/AGL/Misc./73/ 14.FAO. \974b. Perspective study of agricultural development for Pakistan. Country Perspective Study
Team, Central Policy Paper, ESP/ PS/ PAK/ 74/1.
176 REGIONAL AND NATIONAL DEVELOPMENT
FAO and UNDP. 1971. Agricultural development possibilities. Soil Survey Project, Bangladesh, Tech.Report no. 2 AGL:SF/PAK 6.
FAO and UNDP. 1972. Report of project results: conclusions and recommendations. Soil Survey andSoil and Water Management, Research and Demonstration in the Rajasthan Canal Area, India,Terminal Report, AGL:SF/IND 24.
FAO and UNDP. 1975. Report of the FAO Programming Mission to Pakistan, February-March, 1975.Food and Agriculture Sector, Programming Mission Series no. 6.
GOVERNMENT OF INDIA. 1973. Report of the Committee of Ministers on Underutilization of Created Irri-gation Potential. Ministry of Irrigation and Power, New Delhi.
GURLEY, J.G. 1973. Rural development in China, 1949-1972, and the lessons to be learned from it.World Development, vol. 3, nos. 7-8.
KAPP, K.W. 1975. Recycling in contemporary China. World Development, vol. 3, nos. 7-8.KOVDA, V.A. 1960. Soils and natural environment of China. U.S. Joint Publications Res. Service,
IPRS:5967.MELLOR, J. W. 1970. The economics of agricultural development. Cornell Univ. Press, Ithaca, N.Y.MYRDAL, GUNNAR. 1968. Asian drama, vol. 1. Pantheon, New York.RAFIQ, M., and M. A. MIAN. 1975. Soil conservation and agricultural development in the Barani areas
of the Punjab. Government of Pakistan, Ministry of Food and Agriculture, Soil Survey of Pakistan,Lahore.
STAVIS, B. 1974. China's green revolution. China-Japan Programme, East Asia Papers no. 2. CornellUniv., Ithaca, N.Y.
VEENENBOS, J.S. 1968. Reprint of unified soils report, Dezful Project, Khuzestan, Iran. Ministry ofAgriculture, Soil Institute of Iran. Joint project with FAO/ UNDP.
VOHRA, B. B. 1975. Land and water management problems in India. Training vol. 8. Training Division,Department of Personnel and Administrative Reforms, Cabinet Secretariat, New Delhi.
ZAYCHIKOV, V. I. 1960. The geography of agriculture in communist China. U.S. Joint Publications Res.Service, JPRS:3401.
Agricultural Land Utilization and Land Quality
F . R . MOORMANN
Farming Systems ProgramInternational Institute for Tropical Agriculture, Ibadan, Nigeria
The quality of land determines both its present and its potential use under improved crop, soil,and water management. This relationship can be expressed in a graphic model in which the rela-tive proportion of land in use at a given time for a specific land-utilization type is shown on oneaxis and the quality of land in use is shown on the other. Four land categories of decreasing suita-bility for the specific purpose are delineated in the model.
A high proportion of category-I land is always in use. As limitations to use increase and landquality decreases, the proportion of land in use decreases, although in areas of high populationpressures, even unsuited land is used to some extent. Only category-I and part of category-Illands give returns to the use of recurrent inputs, but the quality of land can be improved toincrease productivity.
Basic land ameliorations, such as irrigation development or land reclamation, increase landquality, but not always to a sufficient extent to ensure returns to recurrent inputs and to capitalcosts. Such partial improvements can lead to disastrous consequences when other circumstances,such as a drought, expose other severe defects in land quality. The recent failures in the Sahelzone are ascribed to partial amelioration, which appeared to, but did not, in fact, lead to suffi-cient improvement in land quality to support intensive grazing.
Basic plant amelioration also increases land quality when crops are made less susceptible toexisting land limitations. The earliest work of the International Agricultural Research Centersbenefited farmers on category-I and II lands, but attention is now being given to crop improve-ments that will cause improvements in quality for category-Ill and IV lands.
Improper land use can lead to a decrease in land quality. In severe cases, good land maybecome entirely unsuitable and "leave the model." Modern mechanized agriculture can aggra-vate this trend.
The relationship between agricultural lated disciplines, the most important prog-production and physical environment both in ress has been made by the genetic manipu-its natural condition and as influenced by lation of major food crops, leading to a greenmankind is well documented. The relation- revolution in various areas of the tropicalship has been studied by a range of disci- and subtropical zone. Relating crop produc-plines: soil science, plant science, geography, tion to important attributes of the environ-economy, sociology, and others. Recently, ment in which those crops are grown hasmuch emphasis has been given to the in- been and is the subject of international dis-crease of crop production, more in particular eussions, stimulated to a large extent by theto food crops in the so-called developing FAO and the University of Wageningenworld. From the point of view of plant-re- (Brinkman and Smyth, 1973). The main pur-
177
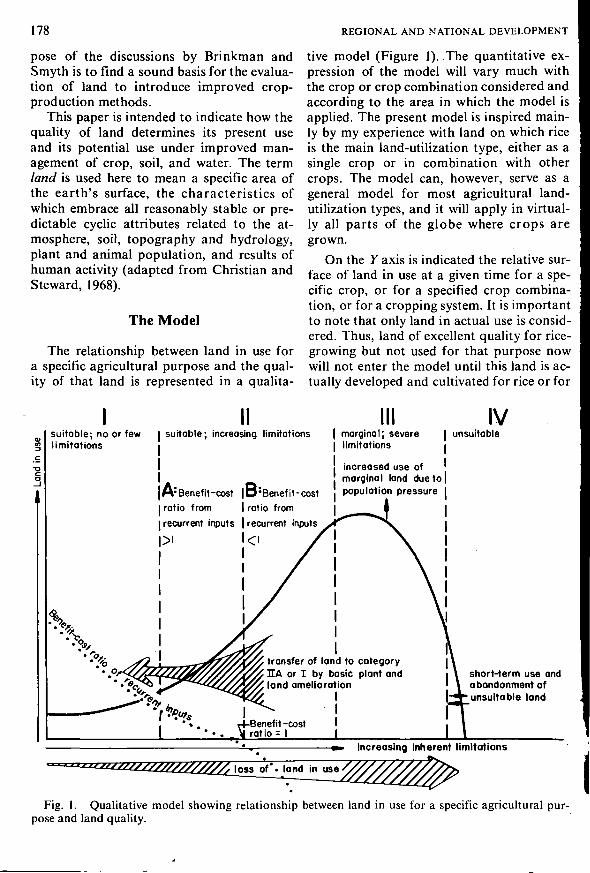
178 REGIONAL AND NATIONAL DEVELOPMENT
pose of the discussions by Brinkman andSmyth is to find a sound basis for the evalua-tion of land to introduce improved crop-production methods.
This paper is intended to indicate how thequality of land determines its present useand its potential use under improved man-agement of crop, soil, and water. The termland is used here to mean a specific area ofthe earth's surface, the characteristics ofwhich embrace all reasonably stable or pre-dictable cyclic attributes related to the at-mosphere, soil, topography and hydrology,plant and animal population, and results ofhuman activity (adapted from Christian andSteward, 1968).
The Model
The relationship between land in use fora specific agricultural purpose and the qual-ity of that land is represented in a qualita-
tive model (Figure 1). The quantitative ex-pression of the model will vary much withthe crop or crop combination considered andaccording to the area in which the model isapplied. The present model is inspired main-ly by my experience with land on which riceis the main land-utilization type, either as asingle crop or in combination with othercrops. The model can, however, serve as ageneral model for most agricultural land-utilization types, and it will apply in virtual-ly all parts of the globe where crops aregrown.
On the Y axis is indicated the relative sur-face of land in use at a given time for a spe-cific crop, or for a specified crop combina-tion, or for a cropping system. It is importantto note that only land in actual use is consid-ered. Thus, land of excellent quality for rice-growing but not used for that purpose nowwill not enter the model until this land is ac-tually developed and cultivated for rice or for
Isuitoble-, no or fewlimitations
I suitoble; increasing limitations
I
|A :Benefit-cost |B :Benefit-cost
| ratio from I ratio from
[recurrent inputs | recurrent inputs
pi k
transfer of land to categoryHA or I by basic plant andland amelioration
II
marginal; severelimitations
increased use ofmarginal land due to |population pressure
IVunsuitable
short-term use andabandonment ofunsuitable land
Increasing inherent limitations
Fig. 1. Qualitative model showing relationship between land in use for a specific agricultural pur-pose and land quality.
MOORMANN 179
a crop combination that includes rice.On the X axis is indicated the quality of
land for the specified use, as determined byenvironmental factors that limit productivity(soil, topography, hydrology, climate, etc.).In the model, land quality decreases fromleft to right, but inherent limitations increase.Although only limitations imposed by thephysical environment are considered in somedetail in this paper, it is clear that socioeco-norhic parameters that limit productivitycould and should also be integrated in thistype of study. Four major suitability cate-gories are introduced in the model, whichare at present arbitrarily chosen but whichcan be based on existing systems of land-suitability classification.
Category I stands for land of excellentinherent quality without productivity limita-tions or with only such limitations that canbe corrected easily and economically.
Category II is for land suitable for thespecific land utilization under consideration,but whose limitations are increasingly se-vere and thus are more costly to correct.
Category III is for marginal land of whichthe returns under any form of managementare barely sufficient to cover input costs; inmany cases, the returns are insufficient. Onmarginal land, for instance, a severe droughtin the growing season will lead to failure ofthe crop or crops under consideration.
Category IV is for land unsuitable for thespecified land-utilization type. Such land,because of population pressure or poor tech-nical planning, may be developed for a spe-cific land-utilization type. As indicated inthe model, it will be abandoned again veryrapidly if the crop fails through inherent lim-itations or through rapid land deteriorationthat reduces productivity after a short periodof use.
For most land-utilization types that in-clude food-crop production as a major use,fhe form of the function would be compar-ible with the one given in the graph (Figure) if larger land surfaces are considered. Theunction in Figure 1 is believed to be repre-entative of rice-growing lands in the tropicsnd the subtropics.
Categories I and IV are restricted in ex-
tent for reasons already mentioned. The ma-jority of the land in the tropical and subtrop-ical regions falls in the intermediate cate-gories. Evaluation of these regions by usingthe available data on land and agriculturaluse makes it clear that most actual and po-tential category-I land for any agriculturalpurpose is already in use, certainly in Asiawhere it forms the backbone of agriculturalproduction.
So far, restricted areas of the potentialcategory-I land remain unused or underusedin other continents. Examples of such poten-tial category-I land are lands whose soils de-rive from basalt in Papua New Guinea andin Eastern Zaire. Major alluvial areas largelycomposed of potential category-I land forrice, like the middle and upper parts of theNiger Delta in Nigeria, remain much unusedbecause of a lack of adequate rice-grow-ing technology. For certain crops, especiallytree crops, there is still a vast potential in thetropics, though such lands would fall in a low-er category if they were to be used for pro-ducing annual food crops.
The larger portion of the potential cate-gory-II land in the tropical and subtropicalregions is also in actual use. Where there isa high and increasing population .density,much marginal land is being utilized and thisuse is increasing, as indicated in the model.Such a situation has developed in large partsof South and Southeast Asia, but it occursalso in pockets in the other continents. Over-utilization for grazing, for instance, has de-veloped in parts of the Sahel zone in Africa.The restraints imposed by climate on thiscategory-Ill land have inevitably led to a ca-tastrophe when, during a series of dry years,the carrying capacity of the marginal rangeland has dropped dramatically.
The trend now in tropical and subtropicalagriculture to increase agricultural produc-tion by improved technology has been con-sidered in the model. Such improved tech-nology requires recurrent purchased inputsnot only for improved seeds, fertilizers, andpest and disease controls but also for laborand mechanization, as well as amortizationof nonrecurrent capital inputs. The benefit-cost ratio of such inputs will be well over 1 in
180 REGIONAL AND NATIONAL DEVELOPMENT
the category-I land, but may be expected todrop below 1 in the lower-category lands ifthe whole package of inputs is considered.Therefore, the category-II land has been ar-bitrarily subdivided into two: a subcategoryIIA, where the benefit-cost ratio for recur-rent inputs, required for improved agricul-ture, is greater than 1; and a subcategoryIIB, where this ratio drops below 1. Thisbenefit-cost line is, of course, variable de-pending on the kind and cost of the recurrentinputs; hence, it is subject to change withtime. For instance, the present higher pricesfor fertilizers and petrochemical productswill tend to displace the benefit-cost ratioline to the left. As a consequence, much landwhere fertilizers could be used profitably fora specific crop or a crop combination nowfalls in category IIB. Subsidies on recurrentinputs will tend to move the benefit-costratio line to the right, as will higher returnsfrom the agricultural produce.
Judicious application of recurrent inputswill increase the productivity of land wheresuch inputs are economically viable, with orwithout little capital, investment. Anotherapproach to increasing productivity is thetransfer of land from a lower to a highercategory where recurrent inputs would beeconomic.
Modifying Land Quality
Basic Land Amelioration
Improving the land is the first and mostobvious step to increasing productivity; it isapplied globally, for example, in irrigation-and land-reclamation projects. The greatdanger in this approach is that the basic landamelioration will not transfer the land toeither category I or even to subcategory IIA.
It should be borne in mind that the recur-rent costs in such projects will increase sharp-ly if the capital inputs required for basic landamelioration have to be amortized. In proj-ects where amelioration costs are considered
xa fonds perdu, the farmer will not be bur-dened by this particular increase in recur-rent costs and his land will be more easily
transferred to an economically remunerativecategory.
There are examples of such develop-ments, wherein the capital inputs need not orneed only partly be amortized. A most strik-ing example in modern times is the irriga-tion development in the Negev desert in Is-rael, drawing water from the Jordan River,where the initial investment was madewithout regard to amortization of the capitalcosts for development. Unfortunately, suchexamples are few. More numerous are theextremely expensive development projectsthat failed because inherent limitations re-mained so severe that the sharply increasedrecurrent costs were not compensated by theimproved productivity of the land.
There is a general tendency to explainsuch total or partial failures in terms of so-cioeconomic constraints: lack of the farmer'stechnological know-how, lack of a sound in-frastructure in the project area, lack of acredit structure, lack of marketing facilities,etc. It is my contention, however, that inmost cases where basic land ameliorationcreated category-I land for the chosen land-utilization type or types, the project was suc-cessful irrespective of the socioeconomicand technological difficulties encountered inthe beginning. One of the most successfulprojects in the tropical and subtropical areaswas and is the Gezirah project in the Sudan,where a large surface of category-I land wascreated for land-utilization types including,among others, irrigated cotton. It should bepointed out that this project became a suc-cess against tremendous socioeconomicodds, including the fact that the majorityof the farming population of the area con-sisted of nomadic or seminomadic livestockproducers.
A recent issue of Science has a referenceto a recent example of a project failurewhere an investment in category-Ill land didnot result in the transfer of this land to amore remunerative category. The provisionof water supply to nomadic herds in the WestAfrican Sahel zone did not diminish in an>way the inherent limitations of the land foigrazing. On the contrary, as was pointed outthe solution to only one of several problem!
MOORMANN 181
of this land resulted in increased pressure forland by the animal population, which provedfatal when the rains failed for several con-secutive years.
Basic Plant Amelioration
Crops, and certainly the annual foodcrops, produce well only in a well-definedrange of land conditions. Beyond this range,constraints on productivity are such thatcommon recurrent inputs such as fertilizersare no longer remunerative; hence, produc-tion remains on a low subsistence-type level.Much of the rice land in Asia can be cited asan example. Because of inherent land limita-tions, such as salinity, acidity, or their combi-nations, the "package deals" of the greenrevolution, which include improved seed,better plant nutrition, and improved produc-tion and cultural practices, do not work onthis land. One inherent limitation can causethe increased inputs to be uneconomic sincethe land remains in the same category IIB orIII of the model. When, however, crop vari-eties less susceptible to the existing limita-tions are selected or bred, the land for whichsuch varieties are developed will movetowards a better category in the model. Thisidea of breeding varieties to suit specificproblem soils, at least for the tropics, wasformulated by the International Rice Re-search Institute (IRRI).
Up to now, breeding work, both in otherinternational institutes and in nationalbreeding programs in the developing world,
has benefited mainly the farmers on cate-gory-I and category-IIA lands. Even so, va-rieties of a number of crops better adapted tolower land categories have been developedalmost unwittingly; this is because breedersare not as conversant with productivity-limiting factors as they should be. The IRRIapproach is a promising possibility for im-proved production of a number of foodcrops, especially if such an approach is com-bined with judicious basic land amelioration.
Improper Land Use
The last element of the model to be dis-cussed is the effect of improper land use. De-terioration of land by man-induced erosion,salinization, acidification, and other causesis all too well known and has assumed trulycatastrophic proportions in many projectareas. The progressive salinization of mil-lions of hectares of the category-I irrigatedland in the lower Indus basin is an example.Such land rapidly loses its category-I statusand is abandoned when salinization becomessevere, thus "leaving the model" altogether.
Land deterioration by erosion in tropicalareas is very severe globally and is frequent-ly aggravated by the introduction of modernmechanized agriculture. Much category-I Iland, and even more category-Ill land in thetropics, is rapidly losing most of its inherentqualities as a result and is becoming unsuit-able for any of the major current land-utiliza-tion types.
Literature Cited
BEEK, K.J., and J. BENNEMA. 1972. Land evaluation for agricultural land use planning: an ecologicalmethodology. Agric. Univ., Wageningen, The Netherlands.
BRINKMAN, R., and A. J. SMYTH (ed.) 1973. Land evaluation for rural purposes. Int. Inst. for Land Rec-lamation and Improvement, Publication no. 17, Wageningen, The Netherlands.
CHRISTIAN, C.S., and G. A. STEWARD. 1968. Methodology of integrated surveys. Proc. of the UNESCOConference on Aerial Surveys and Integrated Studies.
PART V:USE OF SOIL-RESOURCE DATA
IN TRANSFERRINGAGRICULTURAL TECHNOLOGY
Need for an International Research and TechnologyTransfer Network in Tropical Soils
G.B. BAIRD
Office of Agriculture, Technical Assistance BureauAgency for International Development, Washington, D.C., U.S.A.
The green revolution has stimulated a growing number of international transfer networks ofagricultural research and technology. Among the best known are those for wheat, maize, and ricethat find their anchor in the international agricultural research centers of CIMMYT and IRRI.The nine centers now under the aegis of the CGIAR, while largely crop- or livestock-centered,have interdisciplinary teams, and several have substantive research programs in soils of thetropics.
There is no single center of the CGIAR-supported type exclusively focused on soils of thetropics. Nonetheless, there is a widely recognized need for increased research on tropical soils todevelop the technology required for increased production of food in the countries of the tropics.Some mechanism is needed to promote linkages (1) between soil scientists in the countries of thetropics, (2) between these soil scientists and concerned institutions in the temperate zones, and(3) between these scientists and institutions and the international centers already established.Because of the great range in soils of the tropics, reservation is expressed as to whether an IRRI-or CIMMYT-type center is called for to form the nerve center of an international network.
An analysis of successful international networks in agricultural research and technologytransfer indicates that there are at least three requirements for success: assumption of regionalor international responsibility for networking by one or more participating institutions; commit-ment of financial support to these institutions for the networking activity; and willingness ofconcerned scientists in the network to participate effectively.
Before visiting the tropics in the early my country (United States) for work in1950s, I had a very simplistic impression of Colombia, South America. Certainly Colom-the soil and vegetation in that part of the bia is in the tropics, but somehow I was notworld. The word tropics itself conjured up prepared for the great range in climate, veg-visions of lush tropical rainforests growing etation, and soils there. To be sure, thereon highly leached, red, infertile soils. This were the red, highly leached, infertile soils ofseemingly incongruous combination of vege- the Llanos Orientales, but there were alsotation and soil undoubtedly contributed to the dark, neutral, and highly fertile soils ofthe feeling that soils of the tropics were mys- the Cauca Valley. There was a host of otherterious and poorly understood. kinds also. Through the experience of 7 years
In 1952, after completing my academic in Colombia, I learned that the variation instudies and being ready to start a career as a soils of the tropics is as great as that in thosesoil scientist, I left the temperate climate of of the temperate zones.
185
186 TRANSFERRING AGRICULTURAL TECHNOLOGY
My experience in Colombia was followedby 12 years of corresponding work in India,where I served as a member of a team in acooperative agricultural research program. Iwas a soil scientist, or perhaps more correct-ly, an agronomist in a cooperative programwhose focus was on the important food cropsin the countries of concern to the program.Also while in India, I had the good fortune ofbeing involved in the now widely known All-India Coordinated Crop Improvement Proj-ects, which involve national research net-works built around individual major crops.One, among many, is the All-India Coordi-nated Wheat Improvement Project. Thislinks wheat workers in each concerned stateinto an effective network of collaborative re-search, which, in turn and importantly, islinked to an international network on wheat,with the International Center for the Im-provement of Maize and Wheat (CIMMYT)in Mexico as its focal point.
Thus as soil scientists concerned withsoils of the tropics and subtropics, my Co-lombian and Indian colleagues and I wereworking in support of these crop-orientedresearch networks, but we did not have thefeeling of there being a comparable nationalor international research network on soils ofthe tropics.
The purpose of my paper is to look at thegrowth of international research networks,particularly in relation to the roles of soil sci-entists and agronomists, and to examine theneed for and feasibility of one or more inter-national research and technology transfernetworks focusing on tropical soils.
Growth of International AgriculturalResearch Networks
Since I was in India during the wheat rev-olution, it seems appropriate to start by re-ferring again to the international wheatresearch network that has developed withinthe last decade. High-yielding varieties ofsemidwarf wheats developed in Mexicowere introduced to India in the mid-1960s. Through the link with Mexico andCIMMYT, India rapidly embarked on a tech-
nology transfer and research program thatfacilitated a veritable wheat revolution.National production was doubled within5 to 7 years (from around 12 million to about25 million tons), an unprecedented increasein such a short time.
The linkages in wheat research betweenCIMMYT and India are part of what is nowa worldwide network of research and tech-nology transfer. The overall goal is to devel-op the technology needed to permit partici-pating countries to meet their productiontargets of wheat. In a real sense, wheat sci-entists, especially those working on thespring bread wheats, are linked in a world-wide cooperative effort.
The CIMMYT-centered internationalwheat research network has its counterpartsin maize and rice. The maize network has itshub at CIMMYT, while that for rice is at theInternational Research Rice Institute (IRRI).Results from these two centers, primarily inthe form of widely adapted, high-yieldingvarieties of wheat and rice, led to the greenrevolution and gave great impetus to thefeasibility and utility of worldwide researchnetworks focused on important food cropsof the tropics and subtropics.
Before going further, it is important tomake clear that plant breeders are not theonly people involved in the maize, rice, andwheat networks. The green revolution tech-nology was the product of scientists fromseveral disciplines working cooperatively—among them, soil scientists, pathologists,entomologists, and agricultural economists,whose work was as important as that of theplant breeders (although the terminology ofthe resulting crop-oriented research net-works tends to gloss over this importantpoint).
The simple diagram in Figure 1 shows thestructure of the international research net-works centered around CIMMYT and IRRI.To keep before us the real customer of anynew production-oriented technology, thefarmer has been given pride of place at thetop of the figure. Unless our research hassome meaning for him, we need to takeanother look at what we are doing. And, toavoid too great a simplification, the block
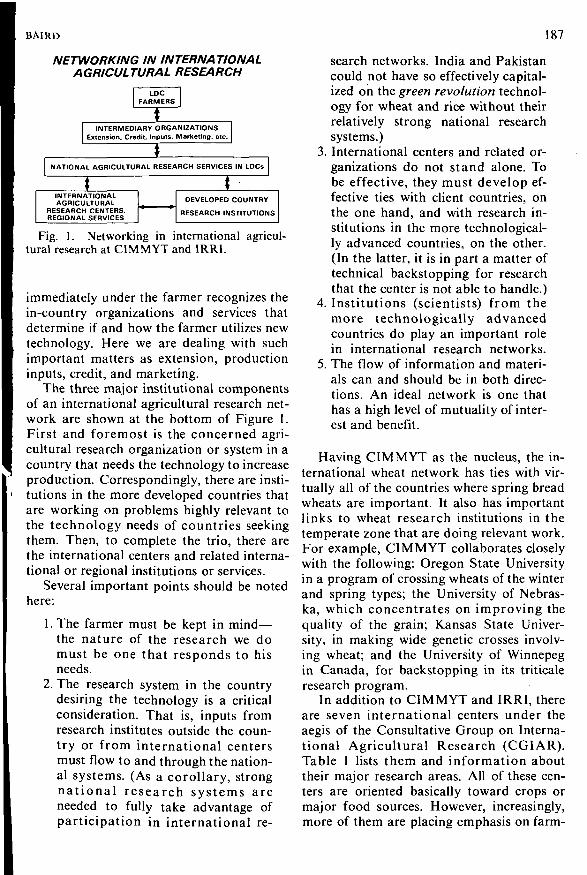
BAIRD 187
NETWORKING IN INTERNATIONALAGRICULTURAL RESEARCH
LDCFARMERS
INTERMEDIARY ORGANIZATIONSExtension. Credit. Inputs. Marketing, etc.
tNATIONAL AGRICULTURAL RESEARCH SERVICES IN LOCs
tINTERNATIONALAGRICULTURAL
RESEARCH CENTERS.REGIONAL SERVICES
tDEVELOPED COUNTRY
RESEARCH INSTITUTIONS
Fig. I. Networking in international agricul-tural research at CIMMYT and IRRI.
immediately under the farmer recognizes thein-country organizations and services thatdetermine if and how the farmer utilizes newtechnology. Here we are dealing with suchimportant matters as extension, productioninputs, credit, and marketing.
The three major institutional componentsof an international agricultural research net-work are shown at the bottom of Figure 1.First and foremost is the concerned agri-cultural research organization or system in acountry that needs the technology to increaseproduction. Correspondingly, there are insti-tutions in the more developed countries thatare working on problems highly relevant tothe technology needs of countries seekingthem. Then, to complete the trio, there arethe international centers and related interna-tional or regional institutions or services.
Several important points should be notedhere:
1. The farmer must be kept in mind—the nature of the research we domust be one that responds to hisneeds.
2. The research system in the countrydesiring the technology is a criticalconsideration. That is, inputs fromresearch institutes outside the coun-try or from international centersmust flow to and through the nation-al systems. (As a corollary, strongnational research systems areneeded to fully take advantage ofparticipation in international re-
search networks. India and Pakistancould not have so effectively capital-ized on the green revolution technol-ogy for wheat and rice without theirrelatively strong national researchsystems.)
3. International centers and related or-ganizations do not stand alone. Tobe effective, they must develop ef-fective ties with client countries, onthe one hand, and with research in-stitutions in the more technological-ly advanced countries, on the other.(In the latter, it is in part a matter oftechnical backstopping for researchthat the center is not able to handle.)
4. Institutions (scientists) from themore technologically advancedcountries do play an important rolein international research networks.
5. The flow of information and materi-als can and should be in both direc-tions. An ideal network is one thathas a high level of mutuality of inter-est and benefit.
Having CIMMYT as the nucleus, the in-ternational wheat network has ties with vir-tually all of the countries where spring breadwheats are important. It also has importantlinks to wheat research institutions in thetemperate zone that are doing relevant work.For example, CIMMYT collaborates closelywith the following: Oregon State Universityin a program of crossing wheats of the winterand spring types; the University of Nebras-ka, which concentrates on improving thequality of the grain; Kansas State Univer-sity, in making wide genetic crosses involv-ing wheat; and the University of Winnepegin Canada, for backstopping in its triticaleresearch program.
In addition to CIMMYT and IRRI, thereare seven international centers under theaegis of the Consultative Group on Interna-tional Agricultural Research (CGIAR).Table 1 lists them and information abouttheir major research areas. All of these cen-ters are oriented basically toward crops ormajor food sources. However, increasingly,more of them are placing emphasis on farm-
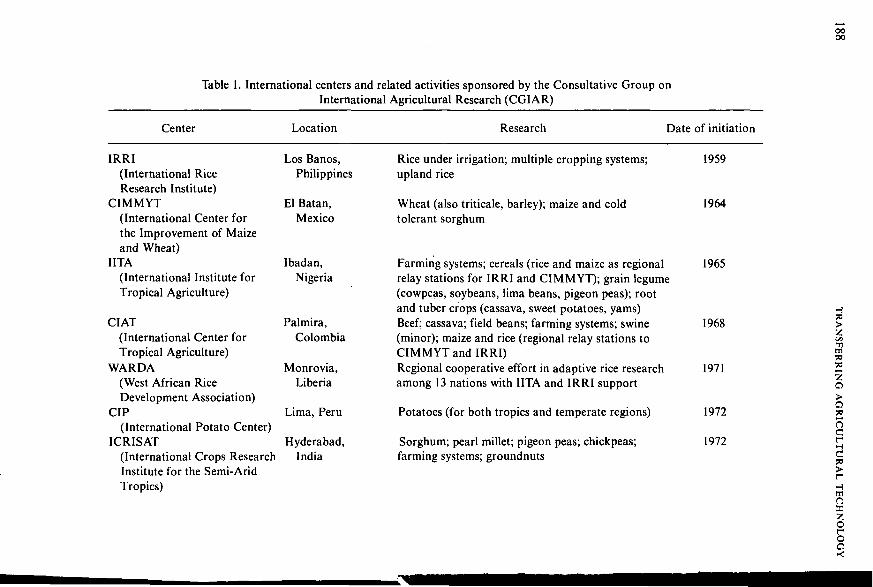
0000
Table 1. International centers and related activities sponsored by the Consultative Group onInternational Agricultural Research (CGIAR)
Center Location Research Date of initiation
IRRI(International RiceResearch Institute)
CIMMYT(International Center forthe Improvement of Maizeand Wheat)
UTA(International Institute forTropical Agriculture)
CIAT(International Center forTropical Agriculture)
WARDA(West African RiceDevelopment Association)
CIP(International Potato Center)
ICRISAT(International Crops ResearchInstitute for the Semi-AridTropics)
Los Banos,Philippines
El Batan,Mexico
Ibadan,Nigeria
Palmira,Colombia
Monrovia,Liberia
Lima, Peru
Hyderabad,India
Rice under irrigation; multiple cropping systems;upland rice
Wheat (also triticale, barley); maize and coldtolerant sorghum
Farming systems; cereals (rice and maize as regionalrelay stations for IRRI and CIMMYT); grain legume(cowpeas, soybeans, lima beans, pigeon peas); rootand tuber crops (cassava, sweet potatoes, yams)Beef; cassava; field beans; farming systems; swine(minor); maize and rice (regional relay stations toCIMMYT and IRRI)Regional cooperative effort in adaptive rice researchamong 13 nations with UTA and IRRI support
Potatoes (for both tropics and temperate regions)
Sorghum; pearl millet; pigeon peas; chickpeas;farming systems; groundnuts
1959
1964
1965
1968
1971
1972
1972
50
in•flm90
2O>oSO
nrC50
mOX
zooo•<
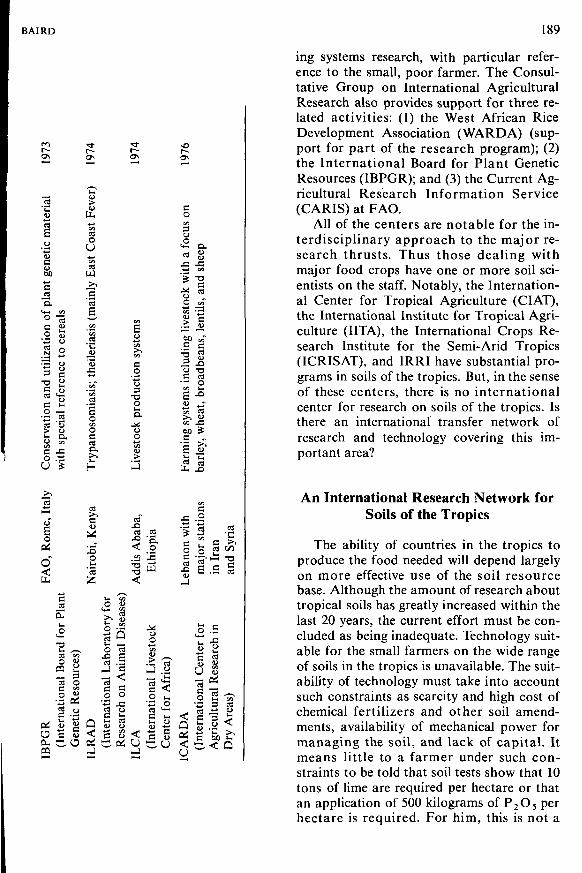
BAIRD 189
mON
13'Gtu
etic
mat
t gen
s
"o.'Sco
izal
util
n an
d
_oesu
SOU
aly
• ^
Lom
e, 1
«
o"PL,
QiO0-09
real
s
8o
nee
réfè
re
TäCJCJQ.CA
-*-•
lant
1 fo
r PI
CJUi
iona
l B
oaer
nat
B
Res
ourc
es'
o
'•§
o
O N
ver)
ü-
t C
oast
1 Eas
'S'3
is (
m
CA
ca
led
thei
liasi
s;
oCA
OsCBC L> ^
H
ca
, K
eny
•g
airo
Z
Q<;
cS
•ato
ry '
o
iona
l L
ab'
f"g
ses)
Dis
ea
ta
on A
nim
earc
h
CACJ
Oi
ON
CA
CJ
sys
ion
oduc
t
h*CL.
MU
o
est
>
ibab
a,dd
is
<
U
pia
o
w
ock
CA
iona
l L
ive
erna
ti
'S
r A
fric
a)
U i
BU
•oON
BO
a fo
cus
wit
h
CJ
o
lives
tid
in
?"oc
;em
s i:
CA
cmB'Sv-cd
U H
I w
ith
o
:ban
<
r i
das
CA
T3BcaCA
lent
il
CA
Bes
,£>
O
taCJ
ley.
5
CA
B
stat
io
o
maj
r for
CJ
onal
Cen
tsr
nati
•g^ ,
B2c
B
O
rai
Res
eai
icul
tu
UiOJO
.2>
and
Are
a
> i
Q
ing systems research, with particular refer-ence to the small, poor farmer. The Consul-tative Group on International AgriculturalResearch also provides support for three re-lated activities: (1) the West African RiceDevelopment Association (WARDA) (sup-port for part of the research program); (2)the International Board for Plant GeneticResources (IBPGR); and (3) the Current Ag-ricultural Research Information Service(CARIS) at FAO.
All of the centers are notable for the in-terdisciplinary approach to the major re-search thrusts. Thus those dealing withmajor food crops have one or more soil sci-entists on the staff. Notably, the Internation-al Center for Tropical Agriculture (CIAT),the International Institute for Tropical Agri-culture (UTA), the International Crops Re-search Institute for the Semi-Arid Tropics(ICRISAT), and IRRI have substantial pro-grams in soils of the tropics. But, in the senseof these centers, there is no internationalcenter for research on soils of the tropics. Isthere an international transfer network ofresearch and technology covering this im-portant area?
An International Research Network forSoils of the Tropics
The ability of countries in the tropics toproduce the food needed will depend largelyon more effective use of the soil resourcebase. Although the amount of research abouttropical soils has greatly increased within thelast 20 years, the current effort must be con-cluded as being inadequate. Technology suit-able for the small farmers on the wide rangeof soils in the tropics is unavailable. The suit-ability of technology must take into accountsuch constraints as scarcity and high cost ofchemical fertilizers and other soil amend-ments, availability of mechanical power formanaging the soil, and lack of capital. Itmeans little to a farmer under such con-straints to be told that soil tests show that 10tons of lime are required per hectare or thatan application of 500 kilograms of P2O5 perhectare is required. For him, this is not a
190 TRANSFERRING AGRICULTURAL TECHNOLOGY
relevant or suitable technology.Suffice it to say that there is an increasing
need for research on tropical soils orientedtoward increased crop production. And, forthe same reasons that international network-ing makes sense for rice, wheat, and maize,there is need for international networking inresearch and technology transfer for soils ofthe tropics.
The examples of worldwide networkscited above involved an IRRI or CIMMYTtype center as the hub and an integral com-ponent. Does this mean that to have an inter-national network on soils of the tropics, aninternational center must be establishedfirst?
The Technical Advisory Committee(TAC) of the CGIAR has devoted much timeto the so-called factor research that includeswork on soils and water. Thus far TAC hasconcluded that, within the context of the in-ternational center, factor research should beintegrated into the commodity-oriented cen-ter, and that if research on soils of the trop-ics needs to be strengthened under theCGIAR, it should be done by strengtheningsuch work at, say, CIAT, UTA, or ICRISAT.This is fine as far as it goes, but it leaves un-answered the mechanism to develop a stronginternational network of scientists workingon tropical soils.
I do not believe an international center isthe answer. Because of the tremendousrange of the soils in the tropics, to argue foran international center would be tantamountto arguing for one international center fortropical crops. TAC once debated at lengtha proposal for an international center forfood legumes, but because of the diversity ofthis rather circumscribed group of food cropsand because of their geographic distributionin the tropics, it concluded that one centerwas not feasible. I find it relevant to mentionthat international research networks willlikely develop around major food legumes(e.g., soybeans or field beans) or clusters ofthem that have similar characteristics anddistribution in the tropics. Does this suggesta corresponding approach for soils?
TAC and the CGIAR recognize that newinternational centers cannot be set up for
each new crop or problem area that needs aninternational research focus for which there-fore a need for an international research net-work is indicated. Thus other mechanismshave been and are being explored.
For the food legumes, it was agreed that,within the framework of the internationalcenter, certain centers would have an inter-national responsibility for specific food le-gumes. Thus ICRISAT has such a responsi-bility for chickpeas, pigeon peas, andgroundnuts; CIAT for field beans; and UTAfor cowpeas. Could or should this approachbe applied to soils of the tropics?
The International Board for Plant Genet-ic Resources (IBPGR) under the CGIAR isan interesting example of giving an interna-tional focus to an important problem in agri-culture without setting up a research centerof the conventional type. Instead, the plantgenetic resources network has an interna-tional board as its hub. The IBPGR is not setup to do research; rather it is designed to as-sist in focusing attention on priority needs,to foster links between international and na-tional plant germplasm centers, and to seeksupport for meeting identified needs. Corres-pondingly, the budget of IBPGR is quitemodest in comparison with that of, say, IRRIor ICRISAT. Nonetheless, IBPGR is amechanism that is beginning to play an ef-fective role in the worldwide linking of scien-tists concerned with collection, preservation,and utilization of plant germplasm. DoesIBPGR suggest a mechanism for an im-proved international network on soils of thetropics?
The International Soybean ResourceBase (INTSOY), headquartered at the Uni-versity of Illinois, is another mechanism thatis proving effective in developing interna-tional networking in soybean research. Al-though Illinois is in the temperate zone, anintegral part of INTSOY is an arm based inthe subtropics at the University of PuertoRico. Of course, in many ways, INTSOYoperates as if it were one of the internationalcenters under the CGIAR. Is there somestrong focal point of research on soils of thetropics that could serve as a headquarters foran international network?
BAIRD 191
Finally, it may be useful to look at the ap-proach that TAC has taken in considering apossible recommendation for internationalcooperation in aquaculture research. Therehas been an agreement, apparently, that aconventional international center is not theappropriate mechanism to foster an interna-tional aquacultural research network. Whatis needed perhaps is something like an inter-national board that would look at the overallsituation, identify gaps in on-going research,promote linkages among workers, and seeksupport to meet needs. In essence, the mech-anism might be somewhat like the one forplant genetic resources, namely, the IBPGR.
Where from Here?
In view of the foregoing, what is reason-able in moving toward a more effectivemechanism, or mechanisms, for an interna-tional research and technology transfernetwork in tropical soils? First, let us con-sider briefly what appear to be some of theimportant requirements.
A review of the most successful interna-tional research networks in agricultureseems to point to at least three common req-uisites: responsibility, financial support, andcooperation.
If a transfer network of research andtechnology is to be effective, some person orpersons must assume a regional or interna-tional responsibility to serve as a coordinat-ing or nerve center of the network. This cen-ter, which may be quite modest in size, hasthe role of fostering links between cooper-ating scientists. It consciously and deliber-ately encourages interchange of ideas,information, materials, and even scientiststhemselves. The center of the network per sedoes not require an integrated research pro-gram about soils of the tropics, although thiswould be a distinct advantage. For example,in theory the center of such a network couldbe at FAO or the World Bank. However, Ibelieve we would agree that it would bemore effective and more credible if it werein some institution that has a strong commit-ment to research on tropical soils.
Next, a coordinating or nerve center re-quires financial support. The job envisagedcannot be done on a continuing basis as anextra responsibility to a central responsibilityor on a purely voluntary basis. The crop-ori-ented international centers budget specifical-ly for these networking activities such asexchange of information, materials, and sci-entists. Thus if a network or several inter-related subnetworks on tropical soils are tobe established and kept viable, there must bea financial commitment. Clearly, the level offunding would depend on the nature andscope of the network under consideration.
Third, for a successful international re-search and technology network on soils ofthe tropics, there must be a desire for it onthe part of those who would be involved.There must be a willingness to really partici-pate. I am assuming that this requirementwould not be difficult to meet.
Now, what would be the options in mov-ing ahead on this tropical soils network? Isit reasonable to identify one institution—anexisting one since it seems unreasonable tocontemplate establishing a center exclusive-ly dedicated to an international network ofresearch and technology transfer in tropicalsoils—that could be the coordinating or nervecenter of the network? Or do we envisage anetwork with a number of institutions serv-ing as focal points? If the latter seems moreattractive, what would be the rationale fordetermining the particular role of each focal-point institution?
Let me make clear that I do not have apreconceived detailed idea or plan for thisnetwork. But assume that we conclude that anetwork with several focal-point institutionsis most reasonable. I can see several ap-proaches to determining who does what toinsure that these key coordinating institutesplay complementary roles.
One approach could be to have an institu-tion play a coordinating role for a region. Forexample, IITA or some institution in the highrainfall tropics of Africa could be the nervecenter of the network for that specific geo-graphic area.
Or an institution might be selected thatwould have primary responsibility in the net-
192 TRANSFERRING AGRICULTURAL TECHNOLOGY
work for developing linkages among cooper-ators working on similar soils. For example,would it be appropriate to have a specific co-ordinating center concerned with the Oxi-sols? This approach through soil groupings—such as families—may offer an attractiveoption. Certainly the current work along thisapproach by the University of Hawaii andthe University of Puerto Rico suggests care-ful examination.
Another possibility would be to apportionresponsibilities to the coordinating institu-tions on the basis of the major subdisciplines
within soil science. Thus one institution inthe network may have primary responsibilityfor fostering cooperation in soil fertility,another in soil microbiology, etc.
My intent in attempting to identify thebasic requirements for a network of tropicalsoils, and to discuss some of the options inrealizing it, is to encourage serious discus-sion about the actual development of a net-work. I am convinced it is highly desirableto have a more effective international re-search and technology network on tropicalsoils.
Soil Survey, Soil Classification, and AgriculturalInformation Transfer
A.W. MOORE
Division of SoilsCommonwealth Scientific and Industrial Research Organization, St. Lucia,Queensland, Australia
There has been little formal transfer of agricultural information based on soil classificationeither within Australia or between Australia and other countries. In both cases there arepolitically based impediments to information flow because of the diversity of organizationsinvolved in soil survey and because of incompatibilities in data and classification. However, aconsiderable amount of information transfer undoubtedly has occurred informally through themovements of soil scientists and agriculturalists.
Analogous transfer, i.e., transfer of information, between two entities having a high degreeof similarity, is dependent on classification. This is true whether the entities be soils in thelandscape or taxonomie abstractions. More, not less, research will need to be done in soiltaxonomy in the future to ensure that this transfer is not based on false premises.
Classification also has a major role to play in site-specific methods of assessment of biologi-cal productivity because it enables the delineation of reasonably homogeneous areas or groupsof soils within which current statistical models, mostly linear and additive, can be expectedto be predictive.
Computer assistance can now result in increased accuracy, easier manipulation of data,and lower costs in individual surveys. But integration by computer of information from dif-ferent surveys will remain virtually impossible until problems of data incompatibility anddata-base incompatibility are overcome by interorganizational and international agreement.
Multivariate techniques feasible only since the advent of computers are now available toassist the soil taxonomist. The use of informal classifications on an ad hoc basis are probablyworth exploring in the future, but this would also be dependent on data from different sourcesbeing compatible.
I propose that greater use of soil classifi- for example, Australia is now taking an m-cation and soil survey could improve the creasing interest in grain legumes and lookstransfer of agricultural information. Perhaps to countries such as India for informationexchange would be a better term because about them and their culture.transfer tends to imply a one-way process. The principles underlying such informa-Information flow should be thought of as a tion transfer are probably the same whetherreversible reaction, to use a chemical analo- we are considering a farm-to-farm or agy. Information flow in agriculture is not al- country-to-country relationship. The differ-ways from developed to developing areas; ence lies in implementation—as we move up
193
194
the scale, the complexity and number ofpossible impediments to flow increase.
Australian Background
In many ways Australia is a microcosmof the world as far as soil survey and its po-tential usefulness are concerned. Australiais a large land mass, whose climates varyfrom temperate to tropical and whose soilsare diverse. Superimposed upon this is afederal political system, in which the statesare largely responsible for those areas ofeconomic activity most likely to benefit fromsoil surveys. Although soil (and land) sur-veys have been conducted by many unitswithin both the federal and state spheres,there has never been anything remotelyresembling a unified national soil survey,such as that of the United States.
History of Soil Survey in Australia
Prior to 1927, there was little in Australiathat could be called soil survey (Taylor,1970). As is so often the case in other parts ofthe world also, the first 100 to 150 years ofagricultural and pastoral development inAustralia were built on trial and error. The"soil surveyors," or more precisely "landsurveyors," were the farmers and grazierswho settled the land, and in later years thesurveyors of the Lands Departments of thestates.
The establishment of the CSIRO Divi-sion of Soils in 1926 saw the beginning ofdetailed soil surveys (based on the seriesconcept) in southern Australia, initially inpotential irrigation areas of the valley ofthe River Murray and extending later torain-fed areas. Surveys in this prewar periodwere largely the province of the Division ofSoils, and as a result reasonably standard-ized classification and survey procedureswere used across the continent.
The second period (1940-1955) was thegolden age of soil survey in Australia, partlyas a result of the demand for surveys arisingfrom postwar land-development schemes.This era saw not only many surveys being
TRANSFERRING AGRICULTURAL TECHNOLOGY
conducted but also many different ap-proaches to soil survey, caused largely by theinvolvement of an increasing number of un-coordinated state and federal organizations.Soil-association mapping tended to replacedetailed soil mapping, and land-system map-ping developed rapidly.
In the mid-fifties, soil surveys began todecline for a number of reasons—a decreasein demand for surveys by government agen-cies, an increase in criticism of the soil clas-sification in use, a deflection of surveyors toother tasks, and a swing to land surveys. It isinteresting to note about land survey that theland-system survey by CSIRO has now vir-tually ceased in Australia (and Papua NewGuinea). I mention this because, coinciden-tally, this type of survey has become popularin a number of other countries around theworld.
In Australia today, there are over a dozendifferent governmental groups, both federaland state, carrying out soil and land surveysof various kinds. In December, 1975, a work-ing group met in Canberra to discuss thepossibility of setting up a national soil sur-vey. I hope that more will result from itsdeliberations than did from deliberations ofa similar committee that met in 1922.
Information Transfer
All the activity in Australia over the last50 years or so would lead one to concludethat a very large amount of information musthave accumulated. Because of the relativelysmall number of surveyors involved and theirperipatetic nature, there can be little doubtthat there has also been a lot of transfer ofinformation between one part of the countryand another. The key to this transfer hasbeen people, moving physically from placeto place and carrying information with them,often in their heads. But there has been littleattempt either to formalize this process orto publish information transferred informally.
Conversely, there have been many in-stances of technology transfer without thebenefit of soil and other environmental in-formation to provide guidelines. As a con-sequence, many such instances have not
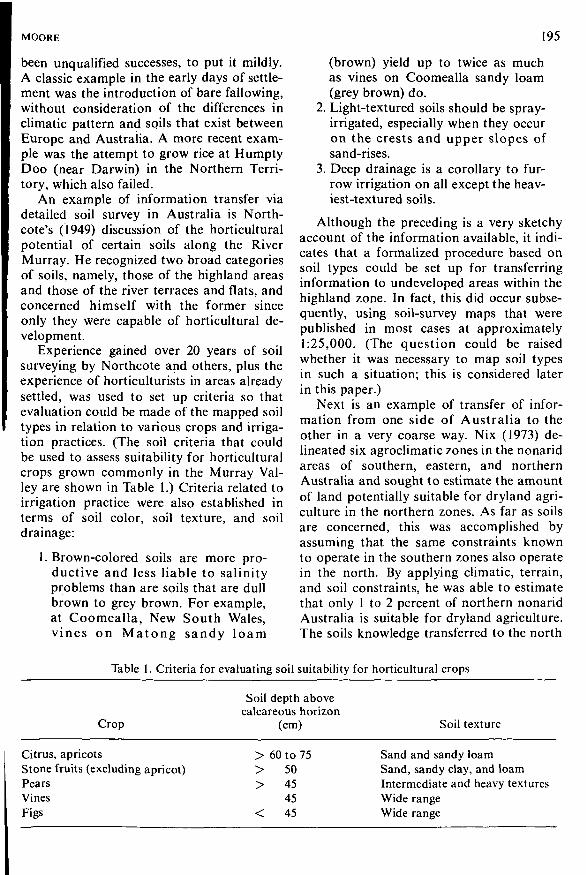
MOORE 195
been unqualified successes, to put it mildly.A classic example in the early days of settle-ment was the introduction of bare fallowing,without consideration of the differences inclimatic pattern and soils that exist betweenEurope and Australia. A more recent exam-ple was the attempt to grow rice at HumptyDoo (near Darwin) in the Northern Terri-tory, which also failed.
An example of information transfer viadetailed soil survey in Australia is North-cote's (1949) discussion of the horticulturalpotential of certain soils along the RiverMurray. He recognized two broad categoriesof soils, namely, those of the highland areasand those of the river terraces and flats, andconcerned himself with the former sinceonly they were capable of horticultural de-velopment.
Experience gained over 20 years of soilsurveying by Northcote and others, plus theexperience of horticulturists in areas alreadysettled, was used to set up criteria so thatevaluation could be made of the mapped soiltypes in relation to various crops and irriga-tion practices. (The soil criteria that couldbe used to assess suitability for horticulturalcrops grown commonly in the Murray Val-ley are shown in Table 1.) Criteria related toirrigation practice were also established interms of soil color, soil texture, and soildrainage:
1. Brown-colored soils are more pro-ductive and less liable to salinityproblems than are soils that are dullbrown to grey brown. For example,at Coomealla, New South Wales,vines on Matong sandy loam
(brown) yield up to twice as muchas vines on Coomealla sandy loam(grey brown) do.
2. Light-textured soils should be spray-irrigated, especially when they occuron the crests and upper slopes ofsand-rises.
3. Deep drainage is a corollary to fur-row irrigation on all except the heav-iest-textured soils.
Although the preceding is a very sketchyaccount of the information available, it indi-cates that a formalized procedure based onsoil types could be set up for transferringinformation to undeveloped areas within thehighland zone. In fact, this did occur subse-quently, using soil-survey maps that werepublished in most cases at approximately1:25,000. (The question could be raisedwhether it was necessary to map soil typesin such a situation; this is considered laterin this paper.)
Next is an example of transfer of infor-mation from one side of Australia to theother in a very coarse way. Nix (1973) de-lineated six agroclimatic zones in the nonaridareas of southern, eastern, and northernAustralia and sought to estimate the amountof land potentially suitable for dryland agri-culture in the northern zones. As far as soilsare concerned, this was accomplished byassuming that the same constraints knownto operate in the southern zones also operatein the north. By applying climatic, terrain,and soil constraints, he was able to estimatethat only 1 to 2 percent of northern nonaridAustralia is suitable for dryland agriculture.The soils knowledge transferred to the north
Table 1. Criteria for evaluating soil suitability for horticultural crops
CitrusStonePearsVinesFigs
Crop
, apricotsfruits (excluding apricot)
Soil depth abovecalcareous horizon
(cm)
> 60 to 75> 50> 45
45< 45
Soil texture
Sand and sandy loamSand, sandy clay, and loamIntermediate and heavy texturesWide rangeWide range
196 TRANSFERRING AGRICULTURAL TECHNOLOGY
was that appropriate technology had notbeen developed to enable the full use of sod-ic duplex (texture-contrast) soils for crop-ping in the south and east; and that struc-tured and massive earths and some crackingclays and alluvial soils can be used satisfac-torily for arable cropping (but subject to thepreviously recognized climatic and terrainconstraints). Nix did not delineate these soilareas specifically, but this could be done byinterpreting the Atlas of Australian Soils(Northcote et al., 1960-1968).
I am not aware of an example of formaltransfer of agricultural information, basedon soil survey, from Australia to a develop-ing country. However, there has undoubtedlybeen some informal information transfer,just as has happened within Australia. An ex-ample is perhaps the survey of Brunei car-ried out by two Australian surveyors (Black-burn and Baker, 1958). The soil classificationused in their survey was a local system de-veloped by the Kedayan people, which hadpossibly been in use for hundreds of years.They did not try to relate this system to anyother classification, from either Australiaor elsewhere, so obviously formal informationtransfer on this basis was not possible.Nevertheless, they must have drawn on theirexperience with analogous soils in Australiain making their recommendations about po-tential land use in Brunei. As a sidelight, itis of interest to note that a Malay translationof the summary, conclusions, and recom-mendations was published, along with theEnglish text, in the survey bulletin; in otherwords, some attempt was made to communi-cate with the local agricultural officers andfarmers by vertical transfer of information.
Factors that have contributed to the dearthof formal transfer of agricultural informationfrom Australia to developing countries in-clude (1) the generally low level of overseasaid provided by Australia (with the exceptionof that to Papua New Guinea); (2) the em-phasis on animal-based systems in primaryindustry; and (3) the divergence, over thelast decade particularly, of soil classificationin Australia from classifications in otherparts of the world. The last is discussedfurther below.
What Is Involved inInformation Transfer?
In this section I shall try to analyze, in ageneral way, what is involved in informationtransfer. This is necessary to provide a basisfor considering whether and how computerscan help in this process. We can instruct thecomputers only if we can define explicitlywhat we want done, and it is evident that ourthinking is still rather fuzzy about how wego about transferring information from oneplace to another.
Assessment of Biological Productivity
The ultimate goal of soil classificationand soil survey in the agricultural domainis the assessment of biological productivity.Nix (1968) suggests that there are three dif-ferent, but not mutually exclusive, ap-proaches to the problem of assessing bio-logical productivity on any given parcel ofland: (1) analogue methods, (2) site-factormethods, and (3) simulation methods. Hefurther suggests that these represent somesort of evolutionary sequence in our "under-standing of functional relationships betweensite parameters and biological productionsystems." The third approach is now in suchan elementary state of development (exceptperhaps in the case of water-balance models)that we may ignore it for our present pur-pose.
The other two approaches, transfer byanalogy and site-factor methods, are to mymind not related in an evolutionary fashionas suggested by Nix (1968) but are quitedifferent, strongly complementary compo-nents of prediction of biological productivity.The first is concerned primarily with infor-mation transfer, the second with informationgeneration.
In analogous transfer, information istransferred from farms or experimental sitesto analogous areas as defined by soil (orland) classification. Theoretically, no a prioriknowledge of functional relationships be-tween site parameters and crops is requiredfor this transfer to be possible. The tech-nique is based on the simple hypothesis that
MOORE 197
if two occurrences of soil (or land) are simi-lar, they will respond in a similar way toprescribed uses (crop type, management,etc.)- The problem lies in the concept ofsimilarity. Similar does not mean identical;it does mean approaching identity to somedegree. Unfortunately, the degree variesfrom case to case, and usually it is just notknown at all. Obviously, classification, whoserole is to put similar things together, lies atthe heart of the matter.
"Site-factor methods seek to relate keyparameters to biological productivity withina given environment" (Nix, 1968), and themost widely known and used of such methodsis multiple linear regression. Although Ishall not discuss this particular techniquefurther in this paper, I should point out thatimplicit in the idea of a "given environment"is the drawing of a boundary around a rea-sonably homogeneous piece of soil or land(in a geographical sense) or the groupingtogether of similar environmental entities(in a conceptual sense). Again, classificationis of crucial importance.
Analogous Transfer
There are three steps in any analogoustransfer process: (1) definition of a universewithin which to operate, (2) classification ofthe entities within that universe, and (3)transfer of information from one entity toanother within a class. These are often notrecognized explicitly, but it becomes in-creasingly necessary to do so as electronicdata processing begins to play a role. I shallnot discuss the third step further here, exceptto mention that it may be mediated via elec-tronic communication systems; by the print-ed page; or by microfilm, magnetic tape, orinformation in people's heads as they movefrom place to place.
A universe within which to operate isperhaps most commonly defined, on the onehand, in a geographical sense, as the soilswithin an area of the earth's surface deline-ated by geographic coordinates or by physio-graphic or similar boundaries. For example,in the detailed survey mentioned earlier,the universe within which information trans-
fer was attempted was the Murray Valleyhighlands, which could have been (but wasnot) delineated on a map.
On the other hand, a conceptual universemay be defined by taxonomie criteria, as wasthe case in the FAO publication aboutdark clay soils. Overlap of geographical andconceptual universes can occur to varyingdegrees, but complete coincidence can occuronly when all soils on the whole of theearth's surface are considered. The onlyinstance of this being approached is theWorld Soil Map (FAO/UNESCO, 1974).
A universe within which to operate hav-ing been defined, the next step is to group orclassify the entities embraced in it. These en-tities may be geographical units (such asmapping units or map faces) or taxonomieunits (such as soil series, soil family, andgreat soil group). The importance of soiltaxonomy has been discounted increasinglyin recent years, a trend to be deplored sinceclassification provides the essential basis onwhich analogous transfer can be made.
Although I may be stating the obvious,let me point out that in any particular in-stance the classification used needs to be (1)related to the objective or objectives set bythe user and (2) applied consistently acrossthe whole universe under consideration.About the latter, I have already mentionedcertain problems becoming increasingly evi-dent in Australia, where a variety of organi-zations doing survey work exist within andacross political boundaries.
The analogous situation on a worldwidescale is familiar to everyone. As mentionedearlier, the only classification that hasachieved worldwide coverage is that of theWorld Soil Map. Unfortunately, however,this is too coarse a classification for mostagricultural purposes. The Soil Taxonomy(USDA, 1975) includes categories much low-er in the taxonomie hierarchy and conse-quently is much more useful potentially.Moreover, although it has not been applieduniversally, it seems to be gaining increasingacceptance, particularly in developing coun-tries.
Australia is now in a difficult situation vis-à-vis other countries, because over the past
198 TRANSFERRING AGRICULTURAL TECHNOLOGY
decade classification in Australia has di-verged widely from classifications used inthe rest of the world. Most commonly usedare an Australian version of the great soilgroup genetic classification (Stace et al.,1968), the monothetic bifurcating classifi-cation of Northcote (1971), or a combinationof the two. An attempt has been made re-cently (Northcote et al., 1975) to correlatethe great soil groups and the classes knownas principal profile forms in Northcote's"Factual Key" classification (Northcote,1971) with classes of the World Soil Map,but overall there is not particularly goodconcordance between them. Soil Taxonomy(USDA, 1975) has not been used seriously inAustralia. Haantjens et al. (1972) have usedit in land system surveys in Papua NewGuinea, but because little or no use has beenmade of these surveys, the usefulness of theSoil Taxonomy in-this instance has not beentested. The import of this situation for possi-ble transfer of information from Australia toareas outside it or vice versa should be fairlyevident. Any transfer that has occurred or islikely to occur in the near future must of ne-cessity be informal.
Problems of Scale and Distance
The major obstacles to information trans-fer on a global basis relate to scale and dis-tance. There is a crude correlation betweenscale of survey and level of classification; inother words, the number of units dealt withper job tends to remain about the same, nomatter what scale is used. This is primarilya psychological matter—the human brain cancomprehend only up to a certain number ofentities at any one time, and this number isdisconcertingly low. Consequently, there isa need to break up the earth's surface intoareas of appropriate size for mapping pur-poses and, likewise, a need for classificationhierarchies.
To go back to earlier examples men-tioned in this paper, the surveys of potentialhorticultural areas in the Murray Valleywere carried out at a scale (1:25,000) thatenabled soil types to be mapped; and it wasat this level that agricultural information,
such as type of horticultural crop and irriga-tion practices, could be transferred. In thesecond example using information from theAtlas of Australian Soils (1:2,000,000), itwas not possible to transfer informationmuch finer than that which said whether anarea was potentially arable. At the far endof the spectrum—the World Soil Map (1:5,000,000)—it is virtually impossible to trans-fer any agricultural information. Obviously,in the transfer of information from one con-tinent to another, we commonly have to con-tend with problems of scale and fineness ofclassification.
A related but different problem is thatarising from spatial separation of occurrencesof soils placed together in the same class.Intuitively, a soil surveyor takes contiguityinto account when he draws boundariesaround parcels of soil distributed over thelandscape. Further^ many soil scientists havehad experience with the dangers of trying toextrapolate map legends (i.e., classifications)beyond the boundaries of a mapped area(i.e., the universe originally defined). Thesurveyor's intuition is probably right thatthe greater the distance between two points,the less likelihood there is of discoveringsoils having a high degree of similarity atthose two points.
An example from southern Australia illus-trates this point. Some time ago, Oertel(1961) carried out discriminant functionanalyses on terra rossas and rendzinas inSouth Australia on the basis of chemicaldata alone. Nineteen soils representing thesetwo soil groups were sampled from twoareas that are about 300 km apart. Using fiveattributes singly or in various combinations,he showed that it was possible to discrimi-nate between the two groups satisfactorily.
Nevertheless, a second question poses it-self: with what confidence is it possible totransfer agricultural information from onearea to the other within a particular soilgroup? The five attributes used by Oertel(1961) were deliberately chosen because theywere related to field morphological attributesused as criteria in classification. If we take awider set of 18 chemical attributes (includ-ing the original five), which have some rele-
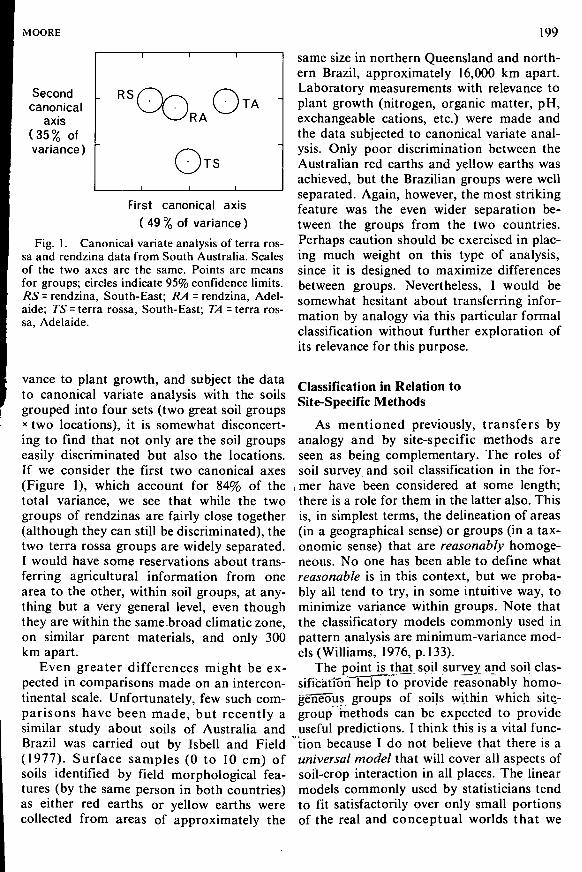
MOORE 199
Secondcanonical
axis(35% ofvariance)
1 1 1
— K o / \s" >v / 1 T A
V-xRA
OTS
First canonical axis( 49 % of variance )
Fig. 1. Canonical variate analysis of terra ros-sa and rendzina data from South Australia. Scalesof the two axes are the same. Points are meansfor groups; circles indicate 95% confidence limits.RS - rendzina, South-East; RA - rendzina, Adel-aide; TS - terra rossa, South-East; TA = terra ros-sa, Adelaide.
vance to plant growth, and subject the datato canonical variate analysis with the soilsgrouped into four sets (two great soil groupsx two locations), it is somewhat disconcert-ing to find that not only are the soil groupseasily discriminated but also the locations.If we consider the first two canonical axes(Figure 1), which account for 84% of thetotal variance, we see that while the twogroups of rendzinas are fairly close together(although they can still be discriminated), thetwo terra rossa groups are widely separated.I would have some reservations about trans-ferring agricultural information from onearea to the other, within soil groups, at any-thing but a very general level, even thoughthey are within the same broad climatic zone,on similar parent materials, and only 300km apart.
Even greater differences might be ex-pected in comparisons made on an intercon-tinental scale. Unfortunately, few such com-parisons have been made, but recently asimilar study about soils of Australia andBrazil was carried out by Isbell and Field(1977). Surface samples (0 to 10 cm) ofsoils identified by field morphological fea-tures (by the same person in both countries)as either red earths or yellow earths werecollected from areas of approximately the
same size in northern Queensland and north-ern Brazil, approximately 16,000 km apart.Laboratory measurements with relevance toplant growth (nitrogen, organic matter, pH,exchangeable cations, etc.) were made andthe data subjected to canonical variate anal-ysis. Only poor discrimination between theAustralian red earths and yellow earths wasachieved, but the Brazilian groups were wellseparated. Again, however, the most strikingfeature was the even wider separation be-tween the groups from the two countries.Perhaps caution should be exercised in plac-ing much weight on this type of analysis,since it is designed to maximize differencesbetween groups. Nevertheless, I would besomewhat hesitant about transferring infor-mation by analogy via this particular formalclassification without further exploration ofits relevance for this purpose.
Classification in Relation toSite-Specific Methods
As mentioned previously, transfers byanalogy and by site-specific methods areseen as being complementary. The roles ofsoil survey and soil classification in the for-
, mer have been considered at some length;there is a role for them in the latter also. Thisis, in simplest terms, the delineation of areas(in a geographical sense) or groups (in a tax-onomie sense) that are reasonably homoge-neous. No one has been able to define whatreasonable is in this context, but we proba-bly all tend to try, in some intuitive way, tominimize variance within groups. Note thatthe classificatory models commonly used inpattern analysis are minimum-variance mod-els (Williams, 1976, p. 133).
The pointis_that soil survey and soil clas-sificätionTielp to provide reasonably homo-geneous groups of soils within which site-group methods can be expected to provideuseful predictions. I think this is a vital func-tion because I do not believe that there is auniversal model that will cover all aspects ofsoil-crop interaction in all places. The linearmodels commonly used by statisticians tendto fit satisfactorily over only small portionsof the real and conceptual worlds that we
200 TRANSFERRING AGRICULTURAL TECHNOLOGY
have to deal with, and for the foreseeablefuture there will be a continuing need todivide our worlds into these portions bymeans of soil survey and soil classification.
Is Mapping Necessary?
My according the conceptual world anequal place alongside the real world is de-liberate. Assuming that transfer of detailedagricultural information can be carried outonly at the series (or perhaps family) level,and with increasing use of soil association,land system, and similar surveys, it is obvi-ous that soil classification must assume in-creasing importance in the future. Soil classesmust be erected and be capable of use forinformation transfer independent of indica-tions of specific occurrences of those classeson a map. Under these circumstances, it isdesirable that a taxonomy allow accurateidentification of a soil observed in the field,either in isolation or in the context of, say,a soil association. This has not been a notablefeature of most soil taxonomies in the past.
Thus mapping is not necessary for trans-fer of information, although classification is.This does not mean that soil mapping shouldbe discontinued; it definitely has evolved insoil survey as a very convenient way of sum-marizing and presenting data and can helpin the transfer of information. It does seem,however, that in the future more attentionshould be paid to soil systematics. Formalclassification may not always be necessary,and in some circumstances, it may be possi-ble to get by with informal, ad hoc classifica-tions, which are probably more feasible nowthat computer assistance is available.
Can Computers Help?
The answer is yes, but a yes hedged byconditions. It has become fashionable of lateto disparage the use of computers as glori-fied calculators or quick, accurate clerks.The direct transliteration of manual data-handling to electronic data-processing hasbeen, nevertheless, the only really successfularea of computing to date, in the sense that,
sooner or later, electronic data-processingalmost invariably proves cheaper. It is truethat often insufficient thought is given towhat is being attempted in a particular job,but introducing a computer does not makethat job any more meaningful.
There are two phases involved in whatwe might call, broadly, information systems.The first defines the way in which a system isstructured and the procedures that shouldbe carried out (modeling and programming);the second is the execution of these proce-dures. Computers nowadays may be involvedto varying degrees in the execution phase.Although the two phases are independenttheoretically, there is some interaction be-tween them, for there is no point in settingup a system that obviously will not work.The computer certainly brings into relief thisrelationship: knowing what the computercan do may have a profound effect on how asystem is structured.
A point to keep in mind when considering 1the role of computers in the survey-interpre-tation-transfer process is that although com-puting facilities are now widely availablearound the world, people who have the skillsto use them tend to be scarce outside NorthAmerica and northern Europe.
The Computer as Clerk
There is no doubt that much of the rou-tine work associated with soil survey, in par-ticular the storage, retrieval, and display ofdata collected in the course of a survey, canbe done by a computer. In my experience,computer assistance results in increased ac-curacy, easier manipulation of data (sorting,tabulation, correlation, etc.), and lower costs,and I believe that many other people havehad similar experiences. But I am referringhere only to computer assistance in individu-al jobs of survey. For integrating informa-tion from a number of different surveys, thecomputer offers less promise because of twomain problems: (1) data incompatibility and(2) data-base incompatibility.
Data incompatibility is a problem of thesoil scientist. Do two surveyors mean thesame thing when they say, for instance,
MOORE 201
drainage is poor? This point has been elab-orated upon elsewhere (Moore, 1971). Thereis no possibility of direct interchange of databetween countries or transfer of informationvia soil classification (which is ultimatelybased on data) if the data from the two coun-tries are not compatible. Possibly the biggestsingle factor in making information transferpossible on a worldwide scale was the intro-duction of the USD A Soil Survey Manual(USDA, 1951), followed by its FAO equiva-lent (Anon., 1968) and their ultimate wide-spread adoption as de facto standards.
The problems of data compatibility arethe province of the soil scientist; those ofdata-base compatibility are the province ofthe computer scientist. Major areas of con-cern are the machine dependence of soft-ware, the variety of programming languagesused, trade-offs between specific and gener-alized data-base management systems, costsassociated with these systems, and the lackof communication between people develop-ing such systems. For generalized systems,the Association for Computing Machineryhas played a prominent role in setting upspecifications (e.g., CODASYL, 1969), butthese are only guidelines that have to be im-plemented by interested people around theworld. A Working Group of Commission Vof the International Soil Science Society hastaken the initiative in bringing together peo-ple working on soil information systems, whotend to be scattered and largely ignorant ofeach other's work. Its first workshop washeld in the Netherlands in September, 1975(Bie, 1975) and a second in Australia inMarch, 1976 (Moore and Bie, 1977). Furtherconsultations regarding these problem areasamong potential data gatherers, exhangers,and users could be a fruitful area for spon-sorship by international organizations suchas the FAO, UNESCO, International SoilScience Society, and the Consultative Groupon International Agricultural Research.
The Computer as Taxonomist's Assistant
I have emphasized that soil classificationis a prerequisite for analogous transfer ofinformation and that in spite of the current
unfashionableness of soil taxonomy, it willbe needing more emphasis in the future.Furthermore, the taxonomist will need allthe assistance he can get. If he avails himselfof the computer's help, he will tend to beinterested in a different type of computingfrom the data-base manipulator. He willwant, in general, large amounts of calcula-tions done on relatively small amounts ofdata.
Orthodox multivariate statistical tech-niques (such as the canonical variate anal-yses discussed earlier in this paper) andnewer pattern-analysis techniques (Williams,1976) have become increasingly available,not as replacements for conventional soiltaxonomy but as tools to assist in this area.They have only become possible with theadvent of computers.
Although the above remarks refer essen-tially to development and refinement of for-mal soil classifications, perhaps now there issome reason to hope that informal "throw-away" classifications may be feasible, usingthe facilities provided by computer storageand retrieval, plus comparisons of a pattern-analysis type based on degrees of similaritybetween pairs of entities. But because of theincompleteness and incompatibility of soildata, it is unlikely that this could" be donecurrently for soils on an intercontinentalscale. Obviously, before we can take advan-tage of this approach, it is necessary thatagreement be reached on what data shouldbe collected and how they should be classi-fied and measured. Until this is done, thelinks between countries must continue to behuman beings who, before making mentalcomparisons, are able to intuitively adjustand correct data, provided they know howthe data were generated. (If they do notknow this, they are going to draw unreliableconclusions.)
The use of informal classification can beillustrated in the area concerning climaticdata, which are reasonably compatibleworldwide (e.g., Anon., 1958). For example,Russell and Moore (1976) have comparedthe climates of Australasia and southernAfrica, using 16 attributes considered tohave some relevance to plant growth. Of
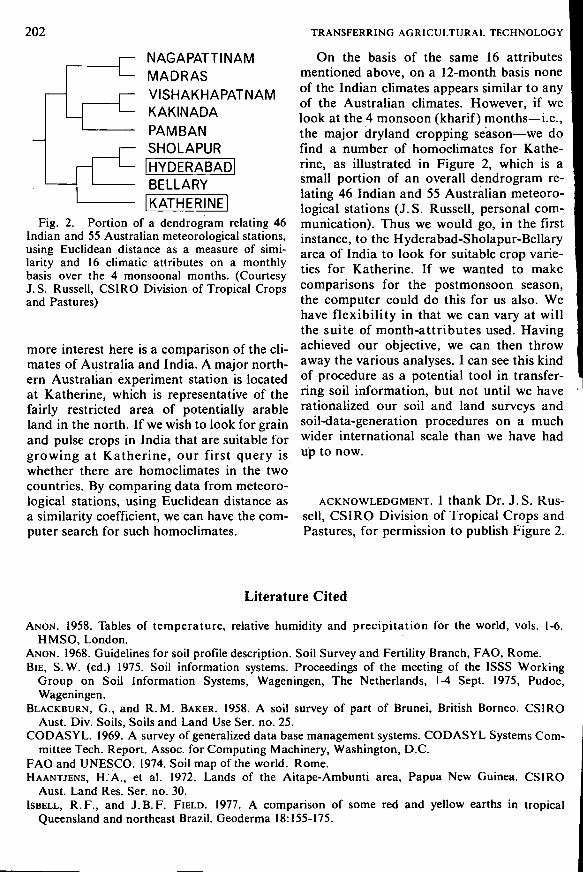
202 TRANSFERRING AGRICULTURAL TECHNOLOGY
•cNAGAPATTINAMMADRAS
r— VISHAKHAPATNAMI— KAKINADA
PAMBAN— SHOLAPUR
I— I HYDERABAD!- BELLARY- iKATHERINEl
Fig. 2. Portion of a dendrogram relating 46Indian and SS Australian meteorological stations,using Euclidean distance as a measure of simi-larity and 16 climatic attributes on a monthlybasis over the 4 monsoonal months. (CourtesyJ. S. Russell, CSIRO Division of Tropical Cropsand Pastures)
more interest here is a comparison of the cli-mates of Australia and India. A major north-ern Australian experiment station is locatedat Katherine, which is representative of thefairly restricted area of potentially arableland in the north. If we wish to look for grainand pulse crops in India that are suitable forgrowing at Katherine, our first query iswhether there are homoclimates in the twocountries. By comparing data from meteoro-logical stations, using Euclidean distance asa similarity coefficient, we can have the com-puter search for such homoclimates.
On the basis of the same 16 attributesmentioned above, on a 12-month basis noneof the Indian climates appears similar to anyof the Australian climates. However, if welook at the 4 monsoon (kharif) months—i.e.,the major dryland cropping season—we dofind a number of homoclimates for Kathe-rine, as illustrated in Figure 2, which is asmall portion of an overall dendrogram re-lating 46 Indian and 55 Australian meteoro-logical stations (J. S. Russell, personal com-munication). Thus we would go, in the firstinstance, to the Hyderabad-Sholapur-Bellaryarea of India to look for suitable crop varie-ties for Katherine. If we wanted to makecomparisons for the postmonsoon season,the computer could do this for us also. Wehave flexibility in that we can vary at willthe suite of month-attributes used. Havingachieved our objective, we can then throwaway the various analyses. I can see this kindof procedure as a potential tool in transfer-ring soil information, but not until we haverationalized our soil and land surveys andsoil-data-generation procedures on a muchwider international scale than we have hadup to now.
ACKNOWLEDGMENT. 1 thank Dr. J.S. Rus-sell, CSIRO Division of Tropical Crops andPastures, for permission to publish Figure 2.
Literature Cited
ANON. 1958. Tables of temperature, relative humidity and precipitation for the world, vols. 1-6.HMSO, London.
ANON. 1968. Guidelines for soil profile description. Soil Survey and Fertility Branch, FAO, Rome.BIE, S.W. (ed.) 1975. Soil information systems. Proceedings of the meeting of the ISSS Working
Group on Soil Information Systems, Wageningen, The Netherlands, 1-4 Sept. 1975, Pudoc,Wageningen.
BLACKBURN, G., and R. M. BAKER. 1958. A soil survey of part of Brunei, British Borneo. CSIROAust. Div. Soils, Soils and Land Use Ser. no. 25.
CODASYL. 1969. A survey of generalized data base management systems. CODASYL Systems Com-mittee Tech. Report. Assoc. for Computing Machinery, Washington, D.C.
FAO and UNESCO. 1974. Soil map of the world. Rome.HAANTJENS, H.A., et al. 1972. Lands of the Aitape-Ambunti area, Papua New Guinea. CSIRO
Aust. Land Res. Ser. no. 30.ISBELL, R.F., and J.B.F. FIELD. 1977. A comparison of some red and yellow earths in tropical
Queensland and northeast Brazil. Geoderma 18:155-175.
MOORE 203
MOORE, A.W. 1971. Regional soil data bank for future evaluation and projection. FÀO, Rome.World Soil Resources Report no. 41, pp. 185-198.
MOORE, A.W., and S.W. BIE (ed.) 1977. Using soil information systems. Proceedings of the meetingof the ISSS Working Group on Soil Information Systems, Canberra, Australia, 2-4 Mar. 1976. Pudoc,Wageningen.
Nix, H.A. 1968. The assessment of biological productivity. In G.À. Stewart (ed.) Land evaluation.Papers of a CS1RO symposium organized in cooperation with UNESCO. Macmillan of Australia,Melbourne.
Nix, H.A. 1973. Land use planning for commercial agriculture. Proceedings of a symposium on landuse planning in north Queensland with reference to agriculture and forestry. N. Qld Branch, Aust.Inst. Agric. Sei., Innisfail.
NORTHCOTE, K. H. 1949. The horticultural potential, under irrigation, of soils of the highland areas inthe mid-Murray River Valley. J. Aust. Inst. Agric. Sei. 15:122-127.
NORTHCOTE, K..H. 1971. A factual key for the recognition of Australian soils. 3rd ed. Rellim,Glenside, S. Australia.
NORTHCOTE, K.H., et al. 1960-68. Atlas of Australian soils. Sheets 1-10, with explanatory booklets.CSIRO and Melbourne Univ. Press, Melbourne.
NORTHCOTE, K. H., G. D. HUBBLE, R. F. ISBELL, C. H. THOMPSON, and E. BETTENAY. 1975. A description
of Australian soils. CSIRO, Melbourne.OERTEL, A.C. 1961. Chemical discrimination of terra rossas and rendzinas. J. Soil Sei. 12:111-118.RUSSELL, J .S. , and A.W. MOORE. 1976. Classification of climate by pattern analysis with Australasian
and southern African data as an example. Agr. Meteorol. 16:45-70.STACE, H.C.T., G.D. HUBBLE, R. BREWER, K.H. NORTHCOTE, J .R. SLEEMAN, M.J. MULCAHY, and
E.G. HALLSWORTH. 1968. A handbook of Australian soils. Rellim, Glenside, S. Australia.TAYLOR, J. K. 1970. The development of soil survey and field pedology in Australia, 1927-67. CSIRO,
Melbourne.USDA, SCS, Soil Survey Staff. 1975. Soil taxonomy: a basic system of soil classification for making
and interpreting soil surveys. Agric. Handb. no. 436. U.S. Government Printing Office, Washing-ton, D.C.
USDA, Soil Survey Staff. 1951. Soil survey manual. Agric. Handb. no. 18. U.S. Government PrintingOffice, Washington, D.C.
WILLIAMS, W.T. (ed.) 1976. Pattern analysis in agricultural science. CSIRO, Melbourne.
Agrotechnology Transfer and the Soil Family
G. UEHARA
Department of Agronomy and Soil Science, College of Tropical AgricultureUniversity of Hawaii, Honolulu, Hawaii, U.S.A.
Agricultural research and experience which are transferred to widely separated parts of theworld have a better chance of succeeding if the transfer is made to similar soils. Soils whichbelong to the same phase of a soil family according to criteria set forth in the U.S. Soil Tax-onomy are considered to be sufficiently similar to enable planners to transfer agrotechnologyfrom one region to another. To achieve this goal, a national soil survey based on a comprehendsive soil classification system is necessary. The soil survey can (1) be used to assess land usepotential and (2) serve as a basis for accelerated, low cost national development through trans-ferred technology.
A problem that emerging nations face inagricultural development is the need to ob-tain quick estimates of soil-use potential.Two things are needed for a proper evalua-tion of a country's soil resources. They are(1) a soil classification system that serves asa guide for making and interpreting soil sur-veys and (2) a soil survey of the area itself.To be effective, the classification systemmust be based on the best available knowl-edge and should be designed to accommo-date all soils occurring in the world. Classi-fication systems for a specific country orregion often do not meet this important re-quirement. International transfer of agrotech-nology requires the use of a comprehensiveclassification system that can accommodatesoils on an international scale; it also requiresa classification system that has sufficientdepth to enable the user to predict soil re-sponses to management and manipulation.
The Soil Taxonomy (USDA, 1975) pro-vides a comprehensive classification systemthat groups soils wich similar physical andchemical properties that affect their behavior
204
and use. In this classification system, thoseproperties that are useful in interpreting soilsurveys for agricultural and nonagriculturaluse are provided in the family category. Tomeet most of man's needs for practical inter-pretations, soils are grouped so that the re-sponses of comparable phases of all soils in afamily are nearly alike. Hence, this systemcan serve as the basis for transferring soiltechnology among widely separated partsof the world.
The purpose of this paper is to considerhow the technical information contained inthe family category of Soil Taxonomy can beused in planning and implementing agricul-tural development in the tropics.
The Soil Family
The soil family is a condensed statementof what we know about a soil. The name as aword (or set of words) serves as a doublemark to recall to ourselves the likeness of aformer thought or object and a sign to make
UEHARA 205
it known to others (Mill, 1965).It is immensely practical to call objects
that look and behave alike by a single name,for through that name we may recall all weknow about the objects that belong to thatgroup. It is unnecessary, for example, tostudy every individual in a group having thesame name. By definition, all objects thathave the same name behave alike; therefore,if the pattern of behavior of one individual isknown, the behavior pattern of all individ-uals with the same name is also known.
The soil family name may also be thoughtof as describing an ecological niche. Thename of a soil family should bring to mindnot only an image of a soil in a particular en-vironment but also a picture of a well-defined management system. This manage-ment system is unique to this family andapplies to all members of this family wher-ever they occur. Thus, soils that occur inwidely separated parts of the world but areall members of the same phases of a familyshould have similar management require-ments for any particular use.
As an example, the Black soils of the Red-and-Black complex that are found in 1CRI-SAT's experimental fields are, in terms ofmanagement, more closely related to theBlack soils of the same family that occur inother subtropical regions of the world thanto the Red soils that occur adjacent to them.One of the deep Black soils at the ICRISATfield station has the formidable family name"fine, clayey, montmorillonitic, isohyper-thermic, Typic Pellustert." Its red counter-part has been tentatively classified as"clayey, mixed, isohyperthermic, Udic Rho-dustalfs."
These soils have some features that arealike and others that are unlike. Two impor-tant common features indicated in theirnames are the soil moisture regime desig-nated by the letters us in Ustert and t/stalfand the soil temperature regime marked bythe term isohyperthermic. It is no accidentthat one of ICRISAT's main efforts is direct-ed towards optimizing water managementfor crop production. The pronounced dryspell, which stands as a major food-produc-tion constraint, is indicated at a very high
category in the classification scheme by theprefix ust, which is taken from the wordcombust (to burn).
There are soils at the ICRISAT fieldstation, however, that remain wet for longperiods during the year. These are the soilsoccurring in the low depressions. They aremembers of the fine loamy, mixed, isohyper-thermic family of Fluventic Haplaquepts.Their wetness is indicated by the letters aquin /Igwepts.
The results of ICRISAT's soil-water man-agement program, therefore, have wide ap-plication not only in the Indian subcontinentbut also in all semiarid regions of the tropicsand subtropics that have comparable soils.ICRISAT's niche is clearly defined in theSoil Taxonomy by the ustic moisture regime.Extensive areas in the tropics and the sub-tropics do have ustic moisture regimes andtherefore can benefit from the practical man-agement systems developed in ICRISAT.
The ustic ecological niche, however, isstill too broad to permit practical transfer oftechnology. There are, for example, soils inBrazil that are classified as Acrwstox. Unlikethe high-base soils of the ICRISAT field sta-tions, the Acrustox soils are weathered to theextreme (Acr means extreme). In Acrustox,fertility problems are as limiting as are thewater constraints. The fertilizer practicesused in ICRISAT unless modified would failif transferred to Acrustox. Even the soil-water management systems would need tobe modified to suit the conditions of Acrus-tox. A high clay Acrustox and a high clayChromustert would have very differentwater-holding and water-transmitting prop-erties. These differences among soils becomeincreasingly clear as one moves down thetaxonomie ladder.
The soil-water relations, or for that mat-ter many agronomically important soil prop-erties of Acrustox and Chromusterts, areimplicitly specified in the family category bytexture and mineralogy. In general, water-transmitting capacity decreases as clay con-tent increases, but for equal clay contents,the water permeability of Acrustox is mark-edly higher than that of Chromusterts.
Soil permeability is not explicitly given in
206 TRANSFERRING AGRICULTURAL TECHNOLOGY
the family category. As it is for the most im-portant soil parameters, soil permeabilitymust be interpreted from texture, mineral-ogy, and other diagnostic criteria used toclassify a soil at the higher categories. Parti-cle-size distribution and mineralogy are theprincipal causes of the physical and chemicalcharacteristics of a soil. The effects such assoil erosion, water-holding capacity, phos-phorus fixation, soil compactibility, nutrient-retention capacity, and a host of other acces-sory characteristics must be inferred fromthe causative and diagnostic features. Theability to extract as many useful accessorycharacteristics as possible from a classifica-tion system grows with experience. One pur-pose of soil classification is to systematizewhat is known about soils so that others mayuse this experience in the proper place, in aproper way, in any part of the world, and asoften as is necessary.
Although Soil Taxonomy is a natural orscientific system of classification, as opposedto a technical classification system designedto group soils for specific uses, it includesimportant technical descriptions to distin-guish families of soils within a subgroup. Formineral soils the family differentiae are:
1. Particle-size classes2. Mineralogy classes3. Calcareous reaction classes4. Soil temperature classes5. Soil depth classes6. Soil slope classes7. Soil consistency classes8. Classes of coatings on sand9. Classes of cracks
For organic soils they are:
1. Particle-size classes2. Mineralogy classes, including na-
ture of limnic deposits3. Reaction classes4. Soil temperature classes5. Soil depth classes
In mineral soils, the most frequently usedfamily differentiae are particle-size, mineral-ogy, and soil temperature classes. In organicsoils, reaction and soil temperature classesare most commonly used. The number of
combinations of particle-size, mineralogy,and soil temperature classes is not large, butwhen the combinations are further subdivid-ed according to subgroups, the number ofsoil families becomes large.
Soils within identical particle-size, min-eralogy, and soil temperature designationscan and generally do have very differentmanagement requirements if they belong todifferent taxa in higher categories. Thus thetechnical information used to differentiatefamilies within subgroups is useful only if itis used in conjunction with the higher cate-gories. The higher categories are separatedon the basis of properties that serve as marksof the causes of soil behavior. These marksused in combination with the added techni-cal description of the soil family enable theuser to make estimates of soil responses tomanagement and manipulation.
Figure 1 shows an example of climaticgradients one might encounter in the tropics.Warm temperature, even temperatures atsea level, turns to freezing conditions at highelevations over a distance of several miles.Although cloud cover, rainfall, and temper-ature vary over short distances, temperatureat any point on the landscape remains rela-tively constant and rainfall and cloudinessvary predictably for a given time of year.
If a soil classification system is to serve asa basis for agrotechnology transfer, the sys-tem must stratify climate, as well as othercrop production parameters, along the gra-dient illustrated in Figure 1. In Soil Taxon-omy, cloud cover and rainfall are related tothe soil moisture regime that appears at thesuborder category; soil temperature, whichis related to air temperature, appears at thefamily category.
Figure 2 illustrates the relation betweenlettuce yield and phosphorus in the soil solu-tion for several temperatures. Increasing lev-els of soil solution phosphorus were obtainedby increasing the application of phosphorusfertilizer. The results tell us that more phos-phorus is needed to obtain 95% of maximumyields as temperature decreases. The soiltemperatures are stratified into warm (hyper-"thermic), moderately warm (thermic), cool(mesic), and cold (frigid) for temperate cli-
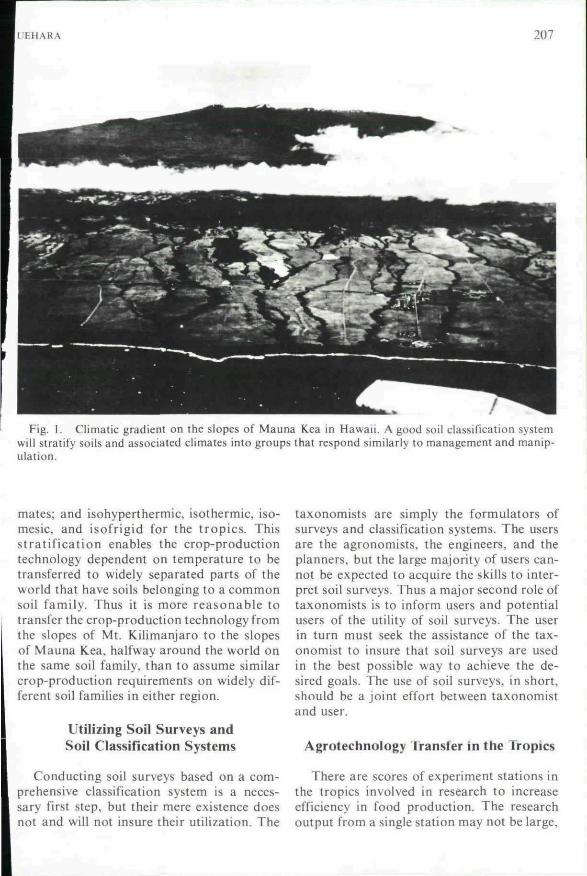
I:EHARA 207
Fig. 1. Climatic gradient on the slopes of Mauna Kea in Hawaii. A good soil classification systemwill stratify soils and associated climates into groups that respond similarly to management and manip-ulation.
mates; and isohyperthermic, isothermic, iso-mesic. and isofrigid for the tropics. Thisstratification enables the crop-productiontechnology dependent on temperature to betransferred to widely separated parts of theworld that have soils belonging to a commonsoil family. Thus it is more reasonable totransfer the crop-production technology fromthe slopes of Mt. Kilimanjaro to the slopesof Mauna Kea, halfway around the world onthe same soil family, than to assume similarcrop-production requirements on widely dif-ferent soil families in either region.
Utilizing Soil Surveys andSoil Classification Systems
Conducting soil surveys based on a com-prehensive classification system is a neces-sary first step, but their mere existence doesnot and will not insure their utilization. The
taxonomists are simply the formulators ofsurveys and classification systems. The usersare the agronomists, the engineers, and theplanners, but the large majority of users can-not be expected to acquire the skills to inter-pret soil surveys. Thus a major second role oftaxonomists is to inform users and potentialusers of the utility of soil surveys. The userin turn must seek the assistance of the tax-onomist to insure that soil surveys are usedin the best possible way to achieve the de-sired goals. The use of soil surveys, in short,should be a joint effort between taxonomistand user.
Agrotechnology Transfer in the Tropics
There are scores of experiment stations inthe tropics involved in research to increaseefficiency in food production. The researchoutput from a single station may not be large.
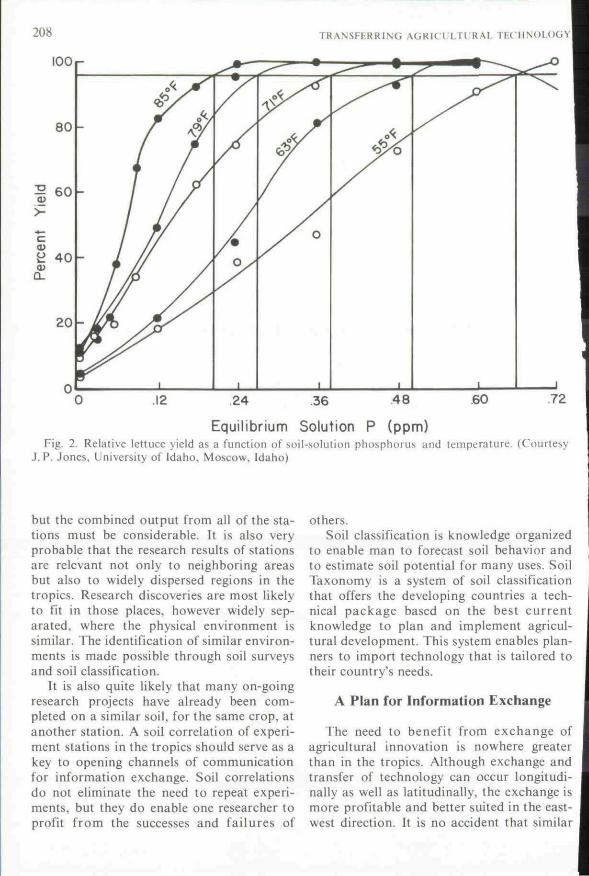
208 TRANSFERRING AGRICULTURAL TECHNOLOGY
lOOi-
Equilibrium Solution P (ppm)Fig. 2. Relative lettuce yield as a function of soil-solution phosphorus and temperature. (Courtesy
J. P. Jones, University of Idaho, Moscow, Idaho)
but the combined output from all of the sta-tions must be considerable. It is also veryprobable that the research results of stationsare relevant not only to neighboring areasbut also to widely dispersed regions in thetropics. Research discoveries are most likelyto fit in those places, however widely sep-arated, where the physical environment issimilar. The identification of similar environ-ments is made possible through soil surveysand soil classification.
It is also quite likely that many on-goingresearch projects have already been com-pleted on a similar soil, for the same crop, atanother station. A soil correlation of experi-ment stations in the tropics should serve as akey to opening channels of communicationfor information exchange. Soil correlationsdo not eliminate the need to repeat experi-ments, but they do enable one researcher toprofit from the successes and failures of
others.Soil classification is knowledge organized
to enable man to forecast soil behavior andto estimate soil potential for many uses. SoilTaxonomy is a system of soil classificationthat offers the developing countries a tech-nical package based on the best currentknowledge to plan and implement agricul-tural development. This system enables plan-ners to import technology that is tailored totheir country's needs.
A Plan for Information Exchange
The need to benefit from exchange ofagricultural innovation is nowhere greaterthan in the tropics. Although exchange andtransfer of technology can occur longitudi-nally as well as latitudinally, the exchange ismore profitable and better suited in the east-west direction. It is no accident that similar
UEHARA 209
soil families cannot occur over long distancesin a north-south direction. Technology trans-fer from the high-latitude countries of thenorth and south to the tropical belt will pre-dictably fail in some aspects unless appro-priate modifications are made in the tech-nology package. These modifications mustbe tailored for a particular environment,the soil family serving as the mark of thisenvironment.
The need to modify technology packagesis greatly reduced when the transfer occursin an east-west direction within the tropics.The probability of locating similar or closelyrelated families in an east-west directionwithin the tropical belt is high, and thisenables the transfer process within the trop-ics to become one of exchange among sister
tropical nations.A survey and classification of experiment
station soils in the tropics based on SoilTaxonomy could serve as the logical basisfor information exchange. A document con-taining, in addition to the soils inventory, abrief description, for each station, of its re-search emphasis and of its crop studieswould be desirable; such a document wouldstreamline the total research effort in thetropics by helping stations and scientists lo-cate others that have common interests andgoals. While the transfer of technology fromoutside the tropics must continue, it is theexchange of technology packages within thetropics that offers the greatest promise forachieving ends that suit the lifestyle of peo-ples firmly fixed to the tropical environment.
Literature Cited
MILL, J.S. 1965. A system of logic. Longmans, Green and Co., Ltd., London.USDA, SCS, Soil Survey Staff. 1975. Soil taxonomy: a basic system of soil classification for making
and interpreting soil surveys. Agric. Handb. no. 436. U.S. Government Printing Office, Washing-ton, D.C.
A Soil Research Network throughTropical Soil Families
L.D. SWINDALE
Hawaii Agricultural Experiment Station, College of Tropical AgricultureUniversity of Hawaii, Honolulu, Hawaii, U.S.A.
A proposal is made to establish a soil research network throughout the tropics based upon thesoil family classification of the U.S. Soil Taxonomy. The network would be voluntary, dependentupon the free association and contributions of cooperating institutions. The University of Hawaiiwould support the establishment and operation of the network through its Benchmark Soils Proj-ect and its Bibliographic Information Retrieval Service for Tropical Agriculture. The Universityof Puerto Rico through its Benchmark Soils Project would also provide support.
The network will improve communication and stimulate cooperative research and training.Its usefulness to any country will depend in large part on the contributions that country makesand the extent to which it tries to use the network to service its own needs. Mutual aid is the ori-entation and underlying philosophy.
The purpose of this paper is to describethe Benchmark Soils Project being con-ducted by the University of Hawaii in coop-eration with the U.S. Agency for Internation-al Development and to indicate how, by anextension of some of the work of this project,it should be possible to establish a networkof soil research stations throughout the trop-ical world. The basis of the project and of theproposed network of stations is the soil fami-ly as defined in the U.S. Soil Taxonomy(USDA, 1975).
The Benchmark Soils Project
The Benchmark Soils Project of the Uni-versity of Hawaii was initiated in 1974 undera contract with the U.S. Agency for Interna-tional Development. The purpose of the proj-ect is to correlate food yields with soil prop-erties and soil management practices on
210
deep upland soils. It is hoped that the projectwill assist the cooperating tropical countriesin Asia and Africa in improving the use ofsoils data in formulating agricultural devel-opment plans and will assist them in tappingthe potential of upland areas for intensivefood production. Immediate objectives are toestablish a network of benchmark soils andto determine scientifically the transferabilityof agroproduction technology among tropicalcountries.
A similar project is being undertaken bythe University of Puerto Rico for countriesin Latin America. Much of what is describedhere applies also to the Puerto Rico project.
Benchmark Soils in CommonSoil Families
The benchmark soils in the network be-long to common soil families as defined bythe U.S. Soil Taxonomy. The soil family is
SWINDALE 211
the fifth level of subdivision in the Taxono-my. To quote from the U.S. Soil Taxonomy," . . . the intent has been to group the soilswithin a subgroup having similar physicaland chemical properties that affect their re-sponses to management and manipulationfor use. The responses of comparable phasesof all soils in a family are nearly enough thesame to meet most of our needs for practicalinterpretations of such responses."
Families are defined primarily to providegroupings of soils having restricted rangesin:
1. Particle-size distribution in horizonsof major biologic activity below plowdepth.
2. Mineralogy of the same horizonsthat are considered in naming parti-cle-size classes.
3. Temperature regime.4. Thickness of the soil penetrable by
roots.5. A few other properties that are used
in defining some families to producethe needed homogeneity.
? To quote from the Soil Taxonomy, "Theseproperties are important to the movementand retention of water and to aeration, bothof which affect soil use for production ofplants or for engineering purposes."
The Soil Families in the Project
At this early stage in the project, one soilfamily has been selected for inclusion fromthe subgroups of Hydric Dystrandepts andTropeptic Eutrustox. Other families includ-ing a family from the great group of Tropo-humults may be added.
Hydric Dystrandepts
One family of soils derived from volcanicash, the thixotropic, isothermic family ofHydric Dystrandepts, will probably be usedin all countries participating in the Bench-mark Soils Project with the University ofHawaii. These are well-drained, upland soilsused for plantation crops and diversified ag-riculture by small farmers. Many are stillforested, particularly those on steeper slopes.
Although these soils are recognized gen-erally as desirable for agriculture in all coun-tries, they are not being fully utilized. Theycan be problem soils in engineering use, andmaintenance of roads in these areas is diffi-cult. They are easily located by experiencedsoil surveyors who have adequate localknowledge.
The soils have dark brown to dark red-dish brown surface layers that are moderate-ly to extremely acid, overlying dark brown toreddish brown subsoils that are silty clay toclay in texture, smeary, low in bulk density,and slightly to moderately acid. The miner-alogy is dominated by amorphous materials.Mean soil temperatures at a depth of 50 cmare higher than 15° C but lower than 22° C,and the mean summer and winter tempera-tures differ by less than 5° C.
Cation exchange capacities are high;base saturations low. The soils fix phospho-rus in forms that are available to plants onlyslowly.
The soils have good physical conditionsfor plant growth, though requiring largeamounts of phosphate fertilizers to makethem productive. Because of their permeablenature as well as their occurrence in loca-tions that have wet climates, they requirefrequent applications of nitrogen and potas-sium fertilizers to ensure high production.The soils also need calcium but seldom asmuch asi the low pH would suggest.
Tropeptic Eutrustox
The soils that will be used in Hawaii tolink with Puerto Rico are members of theclayey, kaolinitic, isohyperthermic family ofTropeptic Eutrustox. These are well-drained,red, upland soils of subhumid regions. Nat-ural vegetation is savanna, deciduous forestor semideciduous forest. In Hawaii they arehighly productive soils when properly man-aged and are used almost exclusively for theproduction of sugarcane under irrigation andpineapple.
These soils have not yet been found bythe project in Asia, but they are expected tobe common in Africa.
The soils are developed in residuum or
214 TRANSFERRING AGRICULTURAL TECHNOLOGY
for the Hawaiian Sugar Planters' Associa-tion. The wig-wag radiometer operates onsolar energy and has been in use for manyyears in Hawaii. A hygrothermograph, astandard, recording rain gauge, and a wig-wag radiometer will be installed at each sec-ondary site.
Land Capabilities
The soils data, soil characteristics, yielddata, and climatological data will be pro-cessed by methods of multivariate analysisto determine the desired land potential, landcapabilities, and transferability information.Local yield data and land-capability informa-tion where they exist will probably be in-cluded in the data base to improve the quali-ty of yield predictions at various levels of thesoil classification to cover a larger group ofsoils than will be represented by the bench-mark soils network.
Where similar soil indexes of productioncapabilities are determined by analysis, theinformation will be translated directlythrough the soil linkage, as a first approxi-mation to production targets for these soilsoccurring in other tropical and subtropicallands.
Expected Results
It is expected that the project will dem-onstrate that management systems imple-mented on one soil in one region can betransferred to the same soil in any otherregion.
The land-capability schemes developedfor the countries of the network should indi-cate suitabilities of different regions for de-velopment under high, medium, or low lev-els of input, and the probabilities for successof the information transfer from the network.This information will be available for incor-poration into the development plans of co-operating nations. The project expects towork closely with national planning staffs toinsure that they are able to communicate tothe project their needs for soils information.
The project will also be able to providesome training for cooperating professional
staffs and students. Annual meetings of theproject staff and counterpart staff will beheld to ensure uniformity of technique, todiscuss experimental results, and to planfuture experiments. Project workshops willalso be held to acquaint appropriate officialsof cooperating countries with the purposesand benefits of the project and the specificand generalized results.
Fellowships will be offered to studentsfrom cooperating countries. They will re-ceive academic training at the Universityof Hawaii and field experience on the exper-imental sites in their home country.
Probable Limitations
Soil surveys that have sufficient charac-terization information to allow classificationat the family level are not common in thetropics. The Hydric Dystrandepts are com-paratively easy to find in the field, and thecriteria for family classification are easy toobtain. But the Tropeptic Eutrustox and theTropohumults are more difficult to locate ac-curately and characterize. Only if cooper-ating countries are willing to provide thenecessary soil-survey inputs will it be possi-ble to include these important and oftendifficult-to-manage soils in the project.
The classification of tropical soils in theSoil Taxonomy is not as certain as the classi-fication of temperate soils. Early results ofthe project may provide more informationabout criteria for classification than abouttechnology transfer.
Although the experimental designs forthe transfer experiments are not complex,strict supervision of field plot work will beneeded to obtain sound scientific data. Thetotal number of experiments must be largeenough to reduce the errors to a manageablesize.
Experimental crop yields are likely to beseveral times more than local yields and re-lated to impressive amounts of agriculturalinputs including irrigation. Only more ad-vanced farmers will be prepared to make theefforts needed to achieve comparable results.Only the wisest of national planners will ap-preciate that experiments on a high-manage-
SWINDALE 215
ment level are necessary to prove the hypothesis and that such experiments do notimply that only high-management-level tech-nology is transferable.
It should be recognized that transferredtechnology can only relate to production tar-gets. Many social and economic questionswill need to be answered before productiontargets become production realities.
The Soil Research Network
The soil research network that AID sup-ports can be established through formal ad-ministrative structures and arrangements orthrough cooperative, technical linkagesbetween interested institutions using the soilfamily as the basis. Whatever merits theformer has, the latter is undoubtedly simpler,does not require intergovernmental agree-ments, and can be established almost imme-diately. It can be implemented by expandingthe network of benchmark soil locations orby classification, at the family level, of thesoils of existing agricultural researchstations.
Expanding the BenchmarkSoils Network
Project families in other countries
The three or more soil families that are orwill be part of the project undoubtedly existin more countries than the three that will becooperating fully with the project. Countrieswhere these soils are located and countriesthat have suitable sites established can beadded to the network. The Benchmark SoilsProject, to the extent allowed financially,will entertain requests for extending the net-work and will assist in equipping the sites, incarrying out transfer, variety, and manage-ment experiments, and in training cooper-ating staff.
Additional benchmark families
We feel that, as the value of the soil fam-ily concept becomes evident, the cooperatingcountries would wish to extend the approach
to other soils. The project will assist in de-signing and installing experiments on addi-tional closely related benchmark families,particularly in relation to soils that areimportant in the country's developmentplans but are not in the soil families receiv-ing initial attention.
It should be easy to add families that varyonly slightly from the project families and inwhich the cause of the variation has a pre-dictable effect upon crop production. Thiswould include, for example, the isohyper-thermic or isomesic families of Hydric Dys-trandepts, for which the effect of the varia-tion—in mean, annual soil temperature—oncrop production can be computed. It wouldalso include, in relation to the clayey, kaol-initic, isohyperthermic family of TropepticEutrustox, the parallel family of Eutrorthox,in which the variation from a seasonally dryto a usually moist climate is likely only to in-crease the reliability of good crop yieldswithout irrigation.
It would probably not include a changefrom Tropeptic to the parallel family of TypicEutrustox. Typic soils in this great grouphave deep oxic horizons that have a veryweak structure and generally occur on veryold surfaces. Tropeptic soils have shalloweroxic horizons that have a noticeable structureand occur on younger surfaces, usually overbasic or intermediate rocks. We do not knowenough about these variations to be able topredict satisfactorily what they mean to cropproduction. It is possible, at least in prin-ciple, to determine the effect experimentally,but this work would need to be undertakenseparately from the project.
Classifying Soils of ExistingAgricultural Research Stations
The soil scientists who participated in the1976 seminar in Hyderabad were requestedto bring with them information about thesoils of the main agricultural research sta-tions of their countries. We hope to use theinformation to classify the soils of the sta-tions at the family level. The family classifi-cations of the soils at the main research sta-tions in Hawaii and the soils at ICRISAT are
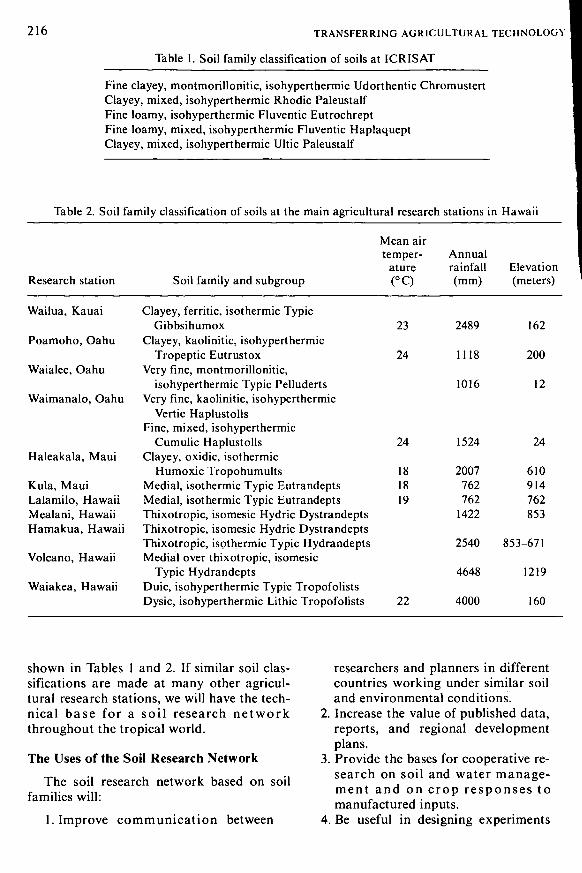
216 TRANSFERRING AGRICULTURAL TECHNOLOGY
Table 1. Soil family classification of soils at ICRISAT
Fine clayey, montmonllonitic, isohyperthermic Udorthentic ChromustertClayey, mixed, isohyperthermic Rhodic PaleustalfFine loamy, isohyperthermic Fluventic EutrochreptFine loamy, mixed, isohyperthermic Fluventic HaplaqueptClayey, mixed, isohyperthermic Ultic Paleustalf
Table 2. Soil family classification of soils at the main agricultural research stations in Hawaii
Research station Soil family and subgroup
Mean airtemper-
ature(°Q
23
24
Annualrainfall(mm)
2489
1118
1016
Elevation(meters)
162
200
12
Wailua, Kauai
Poamoho, Oahu
Waialee, Oahu
Waimanalo, Oahu
Haleakala, Maui
Kula, MauiLalamilo, HawaiiMealani, HawaiiHamakua, Hawaii
Volcano, Hawaii
Waiakea, Hawaii
Clayey, ferritic, isothermic TypicGibbsihumox
Clayey, kaolinitic, isohyperthermicTropeptic Eutrustox
Very fine, montmonllonitic,isohyperthermic Typic Pelluderts
Very fine, kaolinitic, isohyperthermicVertic Haplustolls
Fine, mixed, isohyperthermicCumulic Haplustolls
Clayey, oxidic, isothermicHumoxic Tropohumults
Medial, isothermic Typic EutrandeptsMedial, isothermic Typic EutrandeptsThixotropic, isomesic Hydric DystrandeptsThixotropic, isomesic Hydric DystrandeptsThixotropic, isothermic Typic HydrandeptsMedial over thixotropic, isomesic
Typic HydrandeptsDuic, isohyperthermic Typic TropofolistsDysic, isohyperthermic Lithic Tropofolists
24 1524 24
181819
22
2007762762
1422
2540
4648
4000
610914762853
853-671
1219
160
shown in Tables 1 and 2. If similar soil clas-sifications are made at many other agricul-tural research stations, we will have the tech-nical base for a soil research networkthroughout the tropical world.
The Uses of the Soil Research Network
The soil research network based on soilfamilies will:
1. Improve communication between
researchers and planners in differentcountries working under similar soiland environmental conditions.
2. Increase the value of published data,reports, and regional developmentplans.
3. Provide the bases for cooperative re-search on soil and water manage-ment and on crop responses tomanufactured inputs.
4. Be useful in designing experiments
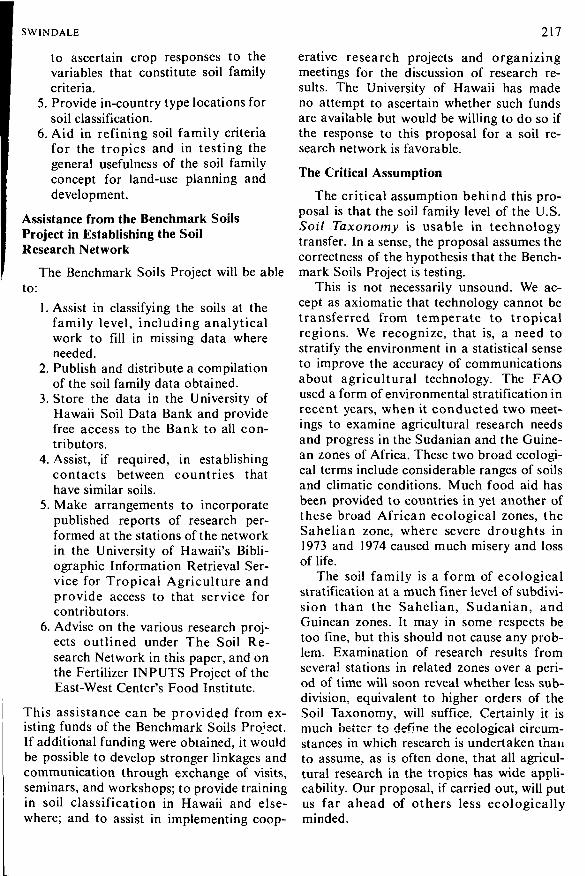
SWINDALE 217
to ascertain crop responses to thevariables that constitute soil familycriteria.
5. Provide in-country type locations forsoil classification.
6. Aid in refining soil family criteriafor the tropics and in testing thegeneral usefulness of the soil familyconcept for land-use planning anddevelopment.
Assistance from the Benchmark SoilsProject in Establishing the SoilResearch Network
The Benchmark Soils Project will be ableto:
1. Assist in classifying the soils at thefamily level, including analyticalwork to fill in missing data whereneeded.
2. Publish and distribute a compilationof the soil family data obtained.
3. Store the data in the University ofHawaii Soil Data Bank and providefree access to the Bank to all con-tributors.
4. Assist, if required, in establishingcontacts between countries thathave similar soils.
5. Make arrangements to incorporatepublished reports of research per-formed at the stations of the networkin the University of Hawaii's Bibli-ographic Information Retrieval Ser-vice for Tropical Agriculture andprovide access to that service forcontributors.
6. Advise on the various research proj-ects outlined under The Soil Re-search Network in this paper, and onthe Fertilizer INPUTS Project of theEast-West Center's Food Institute.
This assistance can be provided from ex-isting funds of the Benchmark Soils Project.If additional funding were obtained, it wouldbe possible to develop stronger linkages andcommunication through exchange of visits,seminars, and workshops; to provide trainingin soil classification in Hawaii and else-where; and to assist in implementing coop-
erative research projects and organizingmeetings for the discussion of research re-sults. The University of Hawaii has madeno attempt to ascertain whether such fundsare available but would be willing to do so ifthe response to this proposal for a soil re-search network is favorable.
The Critical Assumption
The critical assumption behind this pro-posal is that the soil family level of the U.S.Soil Taxonomy is usable in technologytransfer. In a sense, the proposal assumes thecorrectness of the hypothesis that the Bench-mark Soils Project is testing.
This is not necessarily unsound. We ac-cept as axiomatic that technology cannot betransferred from temperate to tropicalregions. We recognize, that is, a need tostratify the environment in a statistical senseto improve the accuracy of communicationsabout agricultural technology. The FAOused a form of environmental stratification inrecent years, when it conducted two meet-ings to examine agricultural research needsand progress in the Sudanian and the Guine-an zones of Africa. These two broad ecologi-cal terms include considerable ranges of soilsand climatic conditions. Much food aid hasbeen provided to countries in yet another ofthese broad African ecological zones, theSahelian zone, where severe droughts in1973 and 1974 caused much misery and lossof life.
The soil family is a form of ecologicalstratification at a much finer level of subdivi-sion than the Sahelian, Sudanian, andGuinean zones. It may in some respects betoo fine, but this should not cause any prob-lem. Examination of research results fromseveral stations in related zones over a peri-od of time will soon reveal whether less sub-division, equivalent to higher orders of theSoil Taxonomy, will suffice. Certainly it ismuch better to define the ecological circum-stances in which research is undertaken thanto assume, as is often done, that all agricul-tural research in the tropics has wide appli-cability. Our proposal, if carried out, will putus far ahead of others less ecologicallyminded.
218 TRANSFERRING AGRICULTURAL TECHNOLOGY
Literature Cited
SILVA, J. A., and F. H. BEINROTH. 1975. Report of the workshop on experimental designs for predictingcrop productivity with environmental and economic inputs. Hawaii Agric. Exp. Stn. Dept. Paperno. 26.
USDA, SCS, Soil Survey Staff. 1975. Soil taxonomy: a basic system of soil classification for makingand interpreting soil surveys. Agric. Handb. no. 436. U.S. Government Printing Office, Washing-ton, D.C.
PART VI:SPECIAL PROBLEMS OF
THE SEMIARID TROPICS
Use of Soils Information in Planning AgriculturalDevelopment in the Semiarid Tropics
S.M. VIRMANI, S. SINGH, and B.A. KRANTZ
Farming Systems ProgramInternational Crops Research Institute for the Semi-Arid Tropics, Hyderabad, India
The semiarid tropics (SAT), located in the seasonally dry tropical climates, are spread overfour continents occupying all or part of 48 countries. On an average, about 34% of the total landarea in 48 countries is in the SAT, the total area of which is estimated at about 19.6 million km2.
Alfisols, Vertisols, Entisols, Inceptisols, and Oxisols are most widespread in the SAT. Thesesoils are briefly described in the paper. Water is the most dominant natural constraint to increasedand stabilized agricultural production in these areas. The severity of this constraint is amplifiedby the great diversity in physicochemical and biological properties of the soils of the SAT. Twoexamples are given to illustrate the effect of soil-water storage capacities on soil moisture pro-files and estimated runoff amounts based on the long-term climatological data of Hyderabad(India). To stabilize production, particularly in low and medium moisture-storage-capacity soils,it may be necessary to collect and store runoff and to recycle the water at an appropriate time.The major goal of the ICRISAT research is to evolve land- and water-management techniques,which along with improved crop technology will increase and stabilize agricultural production.
Agricultural development planning sig-nifies the scientific improvement of theagricultural infrastructure of a locale in itsvarious facets. Of the many interacting fac-tors, the environment, soils, and socioeco-nomic situation play major roles in the agri-cultural development. The role of soils inagricultural development has been appre-ciated since time immemorial. This is evi-dent even today in the population concentra-tions in relatively agriculturally productiveareas of agrarian societies.
In appraising the productivity of the soilsof an area, one needs to have a fair knowl-edge of the kinds and distribution of the soils,their input requirements, and their relativeresponsiveness to the input applications.The prediction of the input needs and ex-pected output requires information on soil
properties and their relationship to the appli-cation of technology. The specificity of thepredictions depends upon the homogeneityof the soil unit that serves as a basis for suchprojections.
We now recognize that the more we baseour reasoning on accepted principles of thesoil's behavior in response to managementmanipulations, the more dependable are theresults likely to be. If the soil properties—physical, chemical, and biological—are ig-nored during either general or detailed planformulations, not only will obstacles arise inplan implementation but also irreparabledamage may be done to the land and waterresources. A fairly detailed operational soilsurvey, therefore, is one of the soundest in-vestments of public funds.
221
222
Soils of the Semiarid Tropics
The semiarid tropics (SAT) are the areaslocated in seasonally dry tropical climates,spread over four continents occupying all orpart of the land mass of 48 countries. Thetotal area of the SAT is estimated at about19.6 million km2. On an average about 34%of the total land area in these 48 countries issemiarid tropics (Ryan et al., 1974). Thesoils of the SAT show great diversity in phys-icochemical and biological properties.These variations have a significant effect ontheir soil-air-water relationships; water-holding movement, and release characteris-tics; drainage properties; and responsivenessto soil management and manipulation. It isnot feasible to describe all kinds of soils oc-curring in the SAT. However, some soil typesare more widely spread throughout and arebriefly summarized below.
The Red and Grey Soils
The red and grey soils (Alfisols) are mod-erately well drained and have a reasonablehydraulic conductivity. The texture of thesurface soil ranges from stony to sandy andloamy in the pale yellow and light red groupsand from loamy to clayey in the deep red andgrey groups (Rayachaudhuri et al., 1963).The clay in the red soils is predominantly ofthe kaolinitic, nonswelling type.
The depth of the surface soil may varyfrom 0 to 30 cm, often underlain by a moreclayey subsoil. This layer is in turn underlainby a gravelly disintegrated rock subsoil calledmurrum. The total depth of the profile mayvary notably, and this has a great impact onmoisture retention and other important cropproduction factors. In the dry season, thesesoils are difficult to cultivate because of sur-face hardness. These soils are susceptible tosheet erosion, particularly on the steeperslopes. The moisture-storage capacity of ared soil profile is generally less than 150 mmand may be sufficient to support a standingcrop for only 2 to 4 weeks, and normally onlya monsoon crop is grown (Swaminathan,1973).
The red soils are usually developed from
SPECIAL PROBLEMS OF THE SEMIARID TROPICS
ancient granites or gneisses. The soils areweathered and leached and thus low in allbases. Because of the type of parent materialand soil-formation processes under SATconditions, the soils are usually low in nitro-gen, phosphorus, and sometimes zinc. Thepotassium level is usually medium to high.The pH ranges from 5.5 to 7.0. These soilscover the largest area of the semiarid tropicsand are found extensively in India (72 millionhectares) and also in many other semiaridtropical regions: e.g., in Angola, northeastBrazil, north Cameroon, Chad, Dahomey,Ghana, Mali, northern Nigeria, Sudan,Togo, Upper Volta, and Zambia (Cochemeand Franquin, 1967; FAO, 1974).
The Black Soils
The black soils (Vertisols) are usuallypoorly drained and possess a low hydraulicconductivity. The texture of the topsoil isalways clayey (40 to 60%), the clay being ofthe montmorillonitic type characterized bypronounced shrinkage during drying, result-ing in extreme cracking and swelling duringwetting. The black soils are hard in the dryseason, muddy and sticky in the wet season,and difficult to cultivate without perfect wa-ter control. Erosion is a serious problem onthese soils, particularly under cultivatedfallow.
The profile of these soils is of varyingdepth (30 to 180 cm). The subsoils are mostlyclayey but sometimes sandy (Cocheme andFranquin, 1967). Lime is usually presenteither in a diffused form or as small concre-tions. The quantity of lime and lime concre-tions normally increases with depth in theprofile. Iron and magnesium concretions areoften also present. On shallow black soilsonly a monsoon crop is grown, whereas on adeep black soil a postmonsoon crop is usuallygrown.
The black soils are often referred to asself-mulching because repeated wetting anddrying cause clods to crumble into small ag-gregates forming a surface mulch. They arealso referred to as being self-swallowing be-cause the surface mulch falls into the deepcracks and becomes incorporated into the
VIRMANI, SINGH, AND KRANTZ 223
subsoil. After the soil is rewetted, the result-ing pressures cause the formation of slicken-sides and a heaving of the soil blocks be-tween the large cracks. Black soils (alsocalled black cotton soils) are formed from avariety of rocks that includes traps, granite,and gneiss, particularly those rich in limefeldspars. Thus they are usually rich in basesincluding potassium, calcium, and magne-sium. The pH ranges from 7.0 to 8.5, and thelime content from 1 to 10%. Because of theirformation under SAT conditions, the soilsare low in organic matter (0.4 to 0.8%) andare usually deficient in nitrogen, phosphorus,and sometimes zinc. About 64 million hec-tares of black soils are found in India; thesesoils also occur for example in the centraldelta of the Niger, and in Chad, Dahomey,Senegal, Upper Volta, and Sudan.
The Alluvial Soils
The alluvial soils (Entisols) are extremelyvariable in moisture-retention release anddrainage characteristics. They are found inexistent or former river valleys (the latterparticularly in the SAT of West Africa). Thetexture of the surface soils may range fromdrift sands to loams and from silts to heavyclays. These soils usually possess good phys-ical qualities, are easily tilled, and are mod-erately permeable. The water-holding capac-ity is relatively low compared with that ofthe black soils. These soils are usually lowin organic matter and are deficient in nitro-gen and sometimes low in phosphorus andzinc. Potash may also become deficient afterprolonged intensive cropping. Large-scalegravity irrigation and tubewells are oftenfound in the river valleys, and this has insome places resulted in problems of salinityand alkalinity. The areas with large irriga-tion projects are not within ICRISATs areaof concern.
The Sandy Soils
These soils (Inceptisols) are very sandy(otten drifting sands) and thus lack the water-holding capacity needed to support plant lifethrough prolonged dry periods. The sandy
soils are easily workable but subject to winderosion. These soils are found extensivelysouth of the Sahara in Mali, Mauritania. Ni-ger, Sudan and Chad; they also occur inSouth-West Africa and Botswana.
The Lateritic Soils
The lateritic soils (Oxisols) are welldrained with a satisfactory hydraulic con-ductivity. The texture of the topsoil is loamyor clayey with many concretions, and theclay is of the kaolinitic or illitic type. Thetopsoil is of varying depth underlain by latér-ite (ferruginous deposits, hardening on ex-posure). In some areas the topsoils have beeneroded leaving behind a slaglike mass. Treesand shrubs are often found on these soils; atlow elevations, however, monsoon food cropsare also grown. Lateritic soils are generallyassociated with undulating topography inregions that have a relatively high averageannual rainfall. They cover 13 million hec-tares in India and fairly extensive areas inChad, South Mali, Niger, Nigeria, UpperVolta, and other countries.
Water, the Major Physical Constraint
The basic characteristic of crop produc-tion in the SAT is that crop production iscarried out under a wide spectrum of soilmoisture regimes, ranging from seasons thathave below average conditions to those thathave an adequate moisture supply. Water isthe most dominant natural constraint to in-creased and stabilized agricultural productionin these areas. The severity of this constraintis amplified by the great variability of soils,which (as described earlier) range fromcoarse sandy soils, having limited water-holding capacity, to heavy clayey soils, hav-ing an appreciable water-holding capacity.The soils vary in depth from a few centi-meters to several meters.
In recognition of the fact that water is themajor natural constraint to increased andstabilized agricultural production in the SAT,the major goal of ICRISAT research is thedevelopment of land and water management
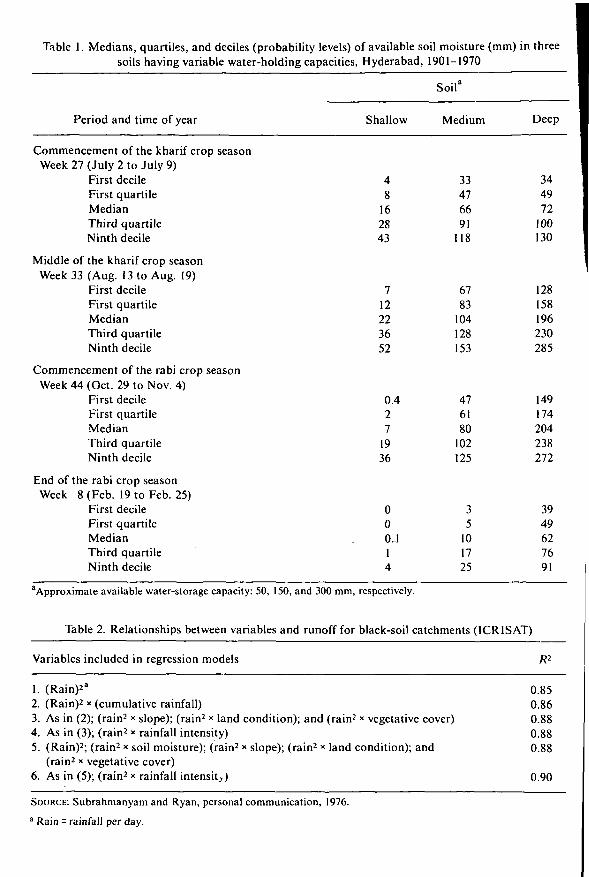
Table 1. Medians, quartiles, and deciles (probability levels) of available soil moisture (mm) in threesoils having variable water-holding capacities, Hyderabad, 1901-1970
Period and time of year
Soil
Shallow Medium Deep
Commencement of the kharif crop seasonWeek 27 (July 2 to July 9)
First decileFirst quartileMedianThird quartileNinth decile
Middle of the kharif crop seasonWeek 33 (Aug. 13 to Aug. 19)
First decileFirst quartileMedianThird quartileNinth decile
Commencement of the rabi crop seasonWeek 44 (Oct. 29 to Nov. 4)
First decileFirst quartileMedianThird quartileNinth decile
End of the rabi crop seasonWeek 8 (Feb. 19 to Feb. 25)
First decileFirst quartileMedianThird quartileNinth decile
4g162843
712223652
0.4271936
000.114
33476691118
6783104128153
476180102125
35101725
344972100130
128158196230285
149174204238272
3949627691
"Approximate available water-storage capacity: 50, 150, and 300 mm, respectively.
Table 2. Relationships between variables and runoff for black-soil catchments (ICRISAT)
Variables included in regression models 7?2
1. (Rain)23
2. (Rain)2 * (cumulative rainfall)3. As in (2); (rain2 x slope); (rain2 x land condition); and (rain2 x vegetative cover)4. As in (3); (rain2 x rainfall intensity)5. (Rain)2; (rain2 * soil moisture); (rain2 x slope); (rain2 * land condition); and
(rain2 » vegetative cover)6. As in (5); (rain2 x rainfall intensity)
0.850.860.880.880.88
0.90
SOURCE: Subrahmanyam and Ryan, personal communication, 1976.a Rain = rainfall per day.
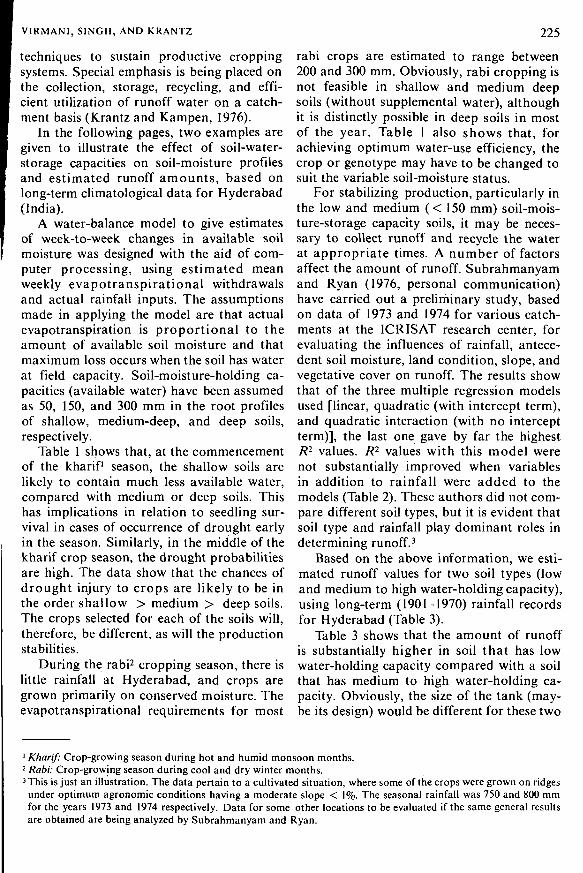
VIRMANI, SINGH, AND KRANTZ 225
techniques to sustain productive croppingsystems. Special emphasis is being placed onthe collection, storage, recycling, and effi-cient utilization of runoff water on a catch-ment basis (Krantz and Kampen, 1976).
In the following pages, two examples aregiven to illustrate the effect of soil-water-storage capacities on soil-moisture profilesand estimated runoff amounts, based onlong-term climatological data for Hyderabad(India).
A water-balance model to give estimatesof week-to-week changes in available soilmoisture was designed with the aid of com-puter processing, using estimated meanweekly evapotranspirational withdrawalsand actual rainfall inputs. The assumptionsmade in applying the model are that actualevapotranspiration is proportional to theamount of available soil moisture and thatmaximum loss occurs when the soil has waterat field capacity. Soil-moisture-holding ca-pacities (available water) have been assumedas 50, 150, and 300 mm in the root profilesof shallow, medium-deep, and deep soils,respectively.
Table 1 shows that, at the commencementof the kharif season, the shallow soils arelikely to contain much less available water,compared with medium or deep soils. Thishas implications in relation to seedling sur-vival in cases of occurrence of drought earlyin the season. Similarly, in the middle of thekharif crop season, the drought probabilitiesare high. The data show that the chances ofdrought injury to crops are likely to be inthe order shallow > medium > deep soils.The crops selected for each of the soils will,therefore, be different, as will the productionstabilities.
During the rabi2 cropping season, there islittle rainfall at Hyderabad, and crops aregrown primarily on conserved moisture. Theevapotranspirational requirements for most
rabi crops are estimated to range between200 and 300 mm. Obviously, rabi cropping isnot feasible in shallow and medium deepsoils (without supplemental water), althoughit is distinctly possible in deep soils in mostof the year. Table 1 also shows that, forachieving optimum water-use efficiency, thecrop or genotype may have to be changed tosuit the variable soil-moisture status.
For stabilizing production, particularly inthe low and medium (< 150 mm) soil-mois-ture-storage capacity soils, it may be neces-sary to collect runoff and recycle the waterat appropriate times. A number of factorsaffect the amount of runoff. Subrahmanyamand Ryan (1976, personal communication)have carried out a preliminary study, basedon data of 1973 and 1974 for various catch-ments at the ICRISAT research center, forevaluating the influences of rainfall, antece-dent soil moisture, land condition, slope, andvegetative cover on runoff. The results showthat of the three multiple regression modelsused [linear, quadratic (with intercept term),and quadratic interaction (with no interceptterm)], the last one gave by far the highestR2 values. R2 values with this model werenot substantially improved when variablesin addition to rainfall were added to themodels (Table 2). These authors did not com-pare different soil types, but it is evident thatsoil type and rainfall play dominant roles indetermining runoff.3
Based on the above information, we esti-mated runoff values for two soil types (lowand medium to high water-holding capacity),using long-term (1901-1970) rainfall recordsfor Hyderabad (Table 3).
Table 3 shows that the amount of runoffis substantially higher in soil that has lowwater-holding capacity compared with a soilthat has medium to high water-holding ca-pacity. Obviously, the size of the tank (may-be its design) would be different for these two
1 Kharif: Crop-growing season during hot and humid monsoon months.2 Rabi: Crop-growing season during cool and dry winter months.3 This is just an illustration. The data pertain to a cultivated situation, where some of the crops were grown on ridgesunder optimum agronomic conditions having a moderate slope < 1%. The seasonal rainfall was 750 and 800 mmfor the years 1973 and 1974 respectively. Data for some other locations to be evaluated if the same general resultsare obtained are being analyzed by Subrahmanyam and Ryan.
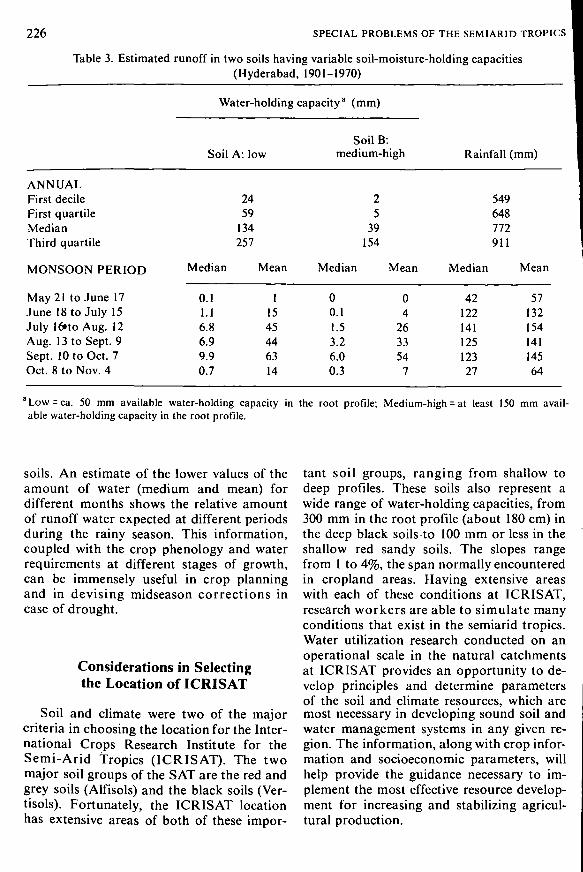
226 SPECIAL PROBLEMS OF THE SEMIARID TROPICS
Table 3. Estimated runoff in two soils having variable soil-moisture-holding capacities(Hyderabad, 1901-1970)
ANNUALFirst decileFirst quartileMedianThird quartile
MONSOON PERIOD
May 21 to June 17June 18 to July 15July 16»to Aug. 12Aug. 13 to Sept. 9Sept. 10 to Oct. 7Oct. 8 to Nov. 4
Water-holding capacity8 (mm)
Soil
Median
0.11.16.86.99.90.7
A: low
2459
134257
Mean
11545446314
Soil B:medium-high
25
39154
Median
00.11.53.26.00.3
Mean
04
263354
7
Rainfall (mm)
Median
4212214112512327
549648772911
Mean
5713215414114564
aLow=ca. 50 mm available water-holding capacity in the root profile; Medium-high = at least 150 mm avail-able water-holding capacity in the root profile.
soils. An estimate of the lower values of theamount of water (medium and mean) fordifferent months shows the relative amountof runoff water expected at different periodsduring the rainy season. This information,coupled with the crop phenology and waterrequirements at different stages of growth,can be immensely useful in crop planningand in devising midseason corrections incase of drought.
Considerations in Selectingthe Location of ICRISAT
Soil and climate were two of the majorcriteria in choosing the location for the Inter-national Crops Research Institute for theSemi-Arid Tropics (ICRISAT). The twomajor soil groups of the SAT are the red andgrey soils (Alfisols) and the black soils (Ver-tisols). Fortunately, the ICRISAT locationhas extensive areas of both of these impor-
tant soil groups, ranging from shallow todeep profiles. These soils also represent awide range of water-holding capacities, from300 mm in the root profile (about 180 cm) inthe deep black soils to 100 mm or less in theshallow red sandy soils. The slopes rangefrom 1 to 4%, the span normally encounteredin cropland areas. Having extensive areaswith each of these conditions at ICRISAT,research workers are able to simulate manyconditions that exist in the semiarid tropics.Water utilization research conducted on anoperational scale in the natural catchmentsat ICRISAT provides an opportunity to de-velop principles and determine parametersof the soil and climate resources, which aremost necessary in developing sound soil andwater management systems in any given re-gion. The information, along with crop infor-mation and socioeconomic parameters, willhelp provide the guidance necessary to im-plement the most effective resource develop-ment for increasing and stabilizing agricul-tural production.
VIRMANI, SINGH, AND KRANTZ 227
Need for Benchmark Locations
In the future, ICRISAT plans to establishresearch programs, in cooperation with na-tional institutions in various countries, torepresent SAT soils and rainfall patterns thatare distinctly different from those of theICRISAT center. These benchmark locationsare also essential to represent the wide di-versity of people and socioeconomic condi-tions. These locations will be chosen onlyafter thorough investigation of the various
factors involved to represent the SAT witha minimum of locations. As in the case of theICRISAT center, the basic principles of soiland water management will be emphasized.
Information on soils and their character-istics is essential to develop improved soil,water, and crop management systems. These,when integrated with improved varieties,fertilization, and plant protection, can aid indeveloping economically viable farming sys-tems, which can increase and stabilize agri-cultural production in the SAT.
Literature Cited
COCHEME, J., and P. FRANQUIN. 1967. A study of the agroclimatology of the semiarid area south of theSahara in West Africa. FAO, Rome.
FAO. 1974. Production yearbook for 1972. 26. FAO.KRANTZ, B. A., and J. KAMPEN. 1976. Soil and water management in the semiarid tropics. Paper read
at the International Soil Seminar, Hyderabad, India, January, 1976. (Unpublished.)RAYACHAUDHURI, S.P., R.R. AGARWAL, N.R. DATTA BISWAS, S. P. GUPTA, and P.K. THOMAS. 1963.
Soils of India. 1CAR, New Delhi.RYAN, J.G., M. VON OPPEN, K.V. SUBRAMANYAM, and M. ASOKAN. 1974. Socioeconomic aspects of
agricultural development in the semiarid tropics. Paper read at the International Workshop onFarming Systems, ICRISAT, Hyderabad, November 1974. (Unpublished.)
SUBRAHMANYAM, K.V., and J.G. RYAN. 1976. Modelling runoff of ICRISAT Research Center water-sheds (personal communication).
SWAMINATHAN, M.S. 1973. Our agricultural future. Sardar Patel Memorial Lecture, India InternationalCentre, New Delhi. November 1973.
Soil and Water Management in the Semiarid Tropics
B. A. KRANTZ and J. KAMPEN
Farming Systems ProgramInternational Crops Research Institute for the Semi-Arid Tropics, Hyderabad, India
Undependable rainfall is the major cause of low crop yields and unstable agricultural pro-duction in the semiarid tropics (SAT).
Population increases in recent years have caused expanded cropping into steep and unsuit-able land, overgrazing, and forest denudation. This has resulted in greatly increased runoff, soilerosion, downstream flooding of cities and agricultural lands, sedimentation of reservoirs, lowand unstable crop yields, domestic water shortages, scarcities, famines, and other forms ofhuman tragedy.
In the SAT, although enormous sums of money are being spent in various types of disasterrelief programs to reduce starvation and human tragedy during the recurring drought periods,research money spent per unit of production in the SAT is much less than that in any other agro-climatic region of the world.
Past approaches to improved soil and water management and conservation such as fallow-ing, mulching, traditional bunding, and projects for full irrigation of small land areas have notprovided the basis for increased food production in the vast areas of the SAT.
Preliminary results from national programs in the SAT and from ICRISAT indicate that im-proved resource utilization, along with improved technology applied to all phases of crop pro-duction, is a great potential for generating economically viable farming systems capable of in-creased and stabilized agricultural production.
Rain-fed agriculture has failed to provide sufficient for one, and in some cases two,even the minimum food requirements for the good crops per year. However, the rainfallrapidly increasing populations of many de- patterns are erratic and brief, or extendedveloping countries in the semiarid tropics droughts are frequent. Much of the rain oc-(SAT). Although the reasons for this are curs in high-intensity storms resulting inmany, a primary constraint to agricultural runoff. During the rainy season, the storagedevelopment in the seasonally dry tropics is capacity of the root profile is sometimes ex-the lack of suitable technology for soil and ceeded resulting in percolation of water towater management and crop production deeper layers or ground water,under the undependable rainfall conditions. This situation has resulted in unstableThe severity of the constraints is amplified food production and continually low yieldby the generally high evaporative demands levels in much of the SAT. Because of theand, in many areas, soils of shallow depth uncertainties and the ever-present risk ofthat have limited water-holding capacity. droughts, the farmers in the SAT have been
In many areas the total precipitation is reluctant to adopt the use of available high-
228
KRANTZ AND KAMPEN 229
yielding varieties, fertilizers, and other in-puts. Thus there is an urgent need for newtechniques of resource management that willeffectively conserve and utilize the soil andwater, along with the development of pro-duction systems that will increase yields andstabilize production.
Because the population of many areas inthe SAT doubled in the past 35 years, farm-ers have attempted to double agriculturalproduction. But because there has been noappreciable increase in per-hectare yieldsduring this period, near doubling of thecropped areas and livestock numbers hasresulted. Thus, steeper and more erodablelands are being overcropped and overgrazed,and forest lands are being denuded. Studiesin India show that a higher proportion ofland is cropped in the SAT than in the rest ofthe country (Anon., 1970). This situation,along with high rainfall intensities, has re-sulted in increased runoff and soil erosion,reduced groundwater recharge in the upperreaches of watersheds, downstream floodingof cities and agricultural land, greatly ac-celerated sedimentation of tanks and largereservoirs, and the loss of precious water tothe seas.
Approaches to Soil and WaterManagement in the SAT
Until recently, the research and extensionapproach in much of the SAT was patternedafter the "dryland agriculture" of the tem-perate climatic zones. At first glance thiswould seem logical; however, a careful in-vestigation reveals many differences andfew similarities between the two zones.Although it is recognized that the SAT isnot a homogeneous area as there are cli-matic, soil, and socioeconomic differences,there are also many characteristics that pre-vail throughout the area. These characteris-tics include the following:
Intensive rainfall interspersed with un-predictable droughts.
Relatively short rainy seasons.High evapotranspiration rates, partic-
ularly during dry periods.
Highly variable rainfall during the wetseason.
Low soil organic matter content.Low infiltration capacity of soils.Great water-erosion potential.Small farms having many small fields.Limited capital resources.Mainly animal or human labor-power
sources.
Scientists at ICRISAT and in some of thenational programs are studying these andother characteristics of the SAT as a basisfor developing improved resource manage-ment, conservation, and utilization for in-creased and more stable agricultural pro-duction.
Water is the major natural constraint toincreased and stabilized agricultural produc-tion in the SAT. Alleviation of the effects ofthis barrier is the ultimate aim of the Farm-ing Systems Research Program at ICRISATand has been the central focus for the initialactivities. This goal can be accomplished(1) by providing optimum conditions formonsoon and postmonsoon cropping throughproper management of the soil and of all theprecipitation that falls on the land and (2) bybetter utilizing the improved environmentthrough more productive cropping systems.In many areas this may require the collectionand storage of surface runoff and efficientutilization of runoff water and ground waterby means of a watershed.
The purpose of this paper is to describethe setting and present situation in the SATand to discuss approaches to developing sys-tems for improved management of the nat-ural human and capital resources of the SAT.Although we recognize the importance of thedevelopment of new high-yielding varietiesand a whole system of crop-production tech-nology for the SAT, we will not discuss it inthis paper. Likewise, there are many socio-economic problems that must be investi-gated and understood if technology is to beadapted to the farmers' situations. Improvedsoil and water technology can be of signifi-cance only through economically viable sys-tems of production. The problems faced byfarmers in the SAT are such that an interdis-
230 SPECIAL PROBLEMS OF THE SEMIARID TROPICS
ciplinary approach is absolutely essential forsecuring tangible results.
Preliminary observations indicate thatthe productive potential of land and waterresources can be raised substantially in manyregions of the SAT. This can provide thebasis for increased and more stable produc-tion and for a better life for the 400 to 500million people of the SAT. Since food short-ages are already being experienced in theseareas, the time required for research andimplementation must be minimized.
The Setting
The SAT is an extensive area and repre-sents considerable diversity. Below is ourpreliminary attempt at characterizing theenvironment of the SAT, so essential to con-ducting effective research. Much additionalwork will be necessary to arrive at moreprecise and specific delineations and de-scriptions of the major areas of concern.
Climate and Precipitation
Definition of the SAT
Semiaridity has been defined in variousterms. It is essential to realize that mostof the earlier definitions by Meigs (1953),Thornthwaite, etc. were derived with specificattention to the more temperate arid andsemiarid regions. The conventional, quanti-tative description of semiaridity is not validfor many tropical regions for the followingreasons:
1. The length of time that precipita-tion occurs is not considered."
2. The lower limit of the rainfall intropical semiarid areas becomes un-acceptably high.
3. An extreme discrepancy exists be-tween quantitative and qualitative
descriptions of semiaridity for trop-ical regions.
Troll (1966) more recently described semi-arid areas by a number of classes as follows:
V3: Wet and dry tropical climatest h a t have 4.5 to 7 " h u m i dmonths"1 (P > PE) and 5 to 7.5"arid months"2 (P < PE).
V4: Tropical dry climates that have 2to 4.5 humid months in the warmseason and 7.5 to 10 arid months.
V4a: Tropical dry climates that havethe humid months in the coolerseason.
Thus, Troll's classification, when summa-rized, defines the tropical semiarid regions asthose that have from 5 to 10 arid months andconversely from 2 to 7 humid months. Troll'sclassification has been accepted as the gen-eral climatic description of the world regionof concern in ICRISAT's Farming SystemsResearch Program. In certain areas of thisregion, sorghum and millets occupy a favor-able competitive position in present foodproduction systems, primarily because of thedistribution and amounts of precipitationand the evapotranspiration patterns. Theseareas will receive primary attention. Otherareas in which sorghum and millets havenot yet found an important place but areneeded and can be expected to competewell should also be examined. The SAT re-gions of the world according to the classifi-cation by Troll (1966) are shown in Figure 1.
Precipitation
When a world map of isohyets is studied,yearly precipitation in the regions classifiedas semiarid according to Troll (1966) appearsto vary from approximately 500 to 1,500 mm.Areas in the cooler tropical regions that havesomewhat less than 500 mm of precipitationwould probably still be considered semiarid.
Cocheme and Franquin (1967) published
1 "Humid months" are those in which precipitation equals or exceeds the potential evapotranspiration (P2 "Arid months" are those months in which potential evapotranspiration exceeds precipitation (P < PE).
PE).
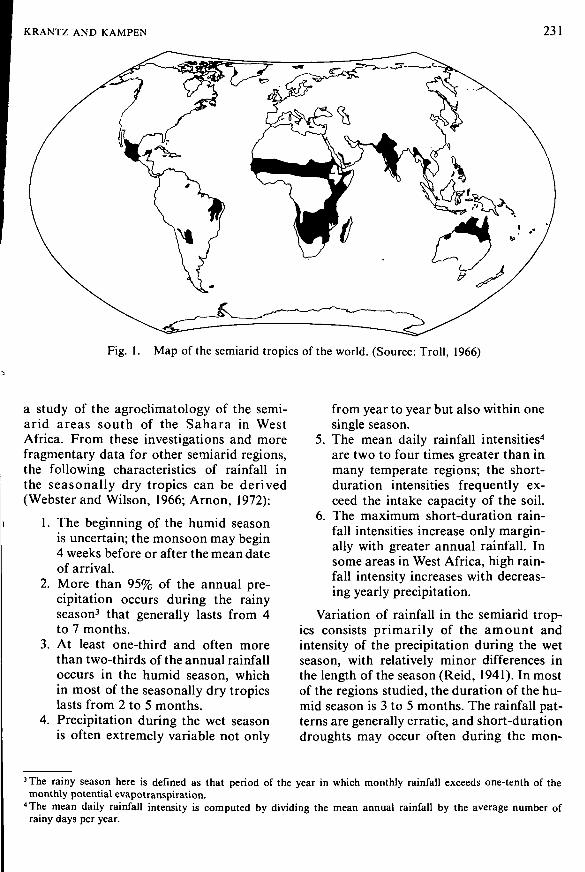
KRANTZ AND KAMPEN 231
Fig. 1. Map of the semiarid tropics of the world. (Source: Troll, 1966)
a study of the agroclimatology of the semi-arid areas south of the Sahara in WestAfrica. From these investigations and morefragmentary data for other semiarid regions,the following characteristics of rainfall inthe seasonally dry tropics can be derived(Webster and Wilson, 1966; Arnon, 1972):
1. The beginning of the humid seasonis uncertain; the monsoon may begin4 weeks before or after the mean dateof arrival.
2. More than 95% of the annual pre-cipitation occurs during the rainyseason3 that generally lasts from 4to 7 months.
3. At least one-third and often morethan two-thirds of the annual rainfalloccurs in the humid season, whichin most of the seasonally dry tropicslasts from 2 to 5 months.
4. Precipitation during the wet seasonis often extremely variable not only
from year to year but also within onesingle season.
5. The mean daily rainfall intensities4
are two to four times greater than inmany temperate regions; the short-duration intensities frequently ex-ceed the intake capacity of the soil.
6. The maximum short-duration rain-fall intensities increase only margin-ally with greater annual rainfall. Insome areas in West Africa, high rain-fall intensity increases with decreas-ing yearly precipitation.
Variation of rainfall in the semiarid trop-ics consists primarily of the amount andintensity of the precipitation during the wetseason, with relatively minor differences inthe length of the season (Reid, 1941). In mostof the regions studied, the duration of the hu-mid season is 3 to 5 months. The rainfall pat-terns are generally erratic, and short-durationdroughts may occur often during the mon-
3 The rainy season here is defined as that period of the year in which monthly rainfall exceeds one-tenth of themonthly potential evapotranspiration.
4 The mean daily rainfall intensity is computed by dividing the mean annual rainfall by the average number ofrainy days per year.
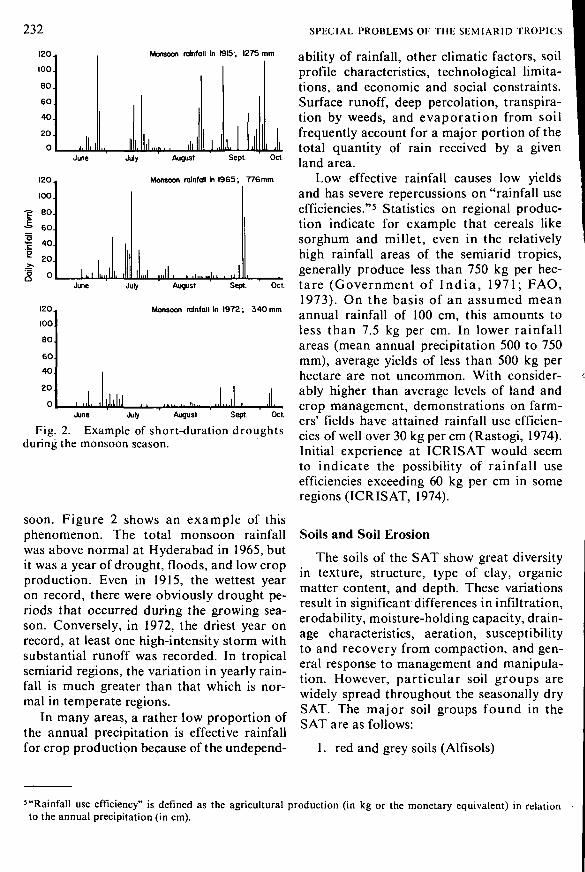
232 SPECIAL PROBLEMS OF THE SEMIARID TROPICS
120,
100.
80.
60.
40.
20.
0
120..
100.
-g 80.£ 60.
1 4°E 20.
î 0
120.,
100
80
60
40
20
0
Monsoon rainfall in 1915', 1275 mm
III. III....... L.LJune July August Sept.
L-iLOct.
Monsoon rainfall in 1 9 6 5 , 7 7 6 m m
i..i !...,11. i I JJune July August Sept. Oct.
Monsoon rainfall in 1 9 7 2 ; 3 4 0 mm
„I,„IJune July August Sept. Oct.
Fig. 2. Example of short-duration droughtsduring the monsoon season.
soon. Figure 2 shows an example of thisphenomenon. The total monsoon rainfallwas above normal at Hyderabad in 1965, butit was a year of drought, floods, and low cropproduction. Even in 1915, the wettest yearon record, there were obviously drought pe-riods that occurred during the growing sea-son. Conversely, in 1972, the driest year onrecord, at least one high-intensity storm withsubstantial runoff was recorded. In tropicalsemiarid regions, the variation in yearly rain-fall is much greater than that which is nor-mal in temperate regions.
In many areas, a rather low proportion ofthe annual precipitation is effective rainfallfor crop production because of the undepend-
ability of rainfall, other climatic factors, soilprofile characteristics, technological limita-tions, and economic and social constraints.Surface runoff, deep percolation, transpira-tion by weeds, and evaporation from soilfrequently account for a major portion of thetotal quantity of rain received by a givenland area.
Low effective rainfall causes low yieldsand has severe repercussions on "rainfall useefficiencies."5 Statistics on regional produc-tion indicate for example that cereals likesorghum and millet, even in the relativelyhigh rainfall areas of the semiarid tropics,generally produce less than 750 kg per hec-tare (Government of India, 1971; FAO,1973). On the basis of an assumed meanannual rainfall of 100 cm, this amounts toless than 7.5 kg per cm. In lower rainfallareas (mean annual precipitation 500 to 750mm), average yields of less than 500 kg perhectare are not uncommon. With consider-ably higher than average levels of land andcrop management, demonstrations on farm-ers' fields have attained rainfall use efficien-cies of well over 30 kg per cm (Rastogi, 1974).Initial experience at ICRISAT would seemto indicate the possibility of rainfall useefficiencies exceeding 60 kg per cm in someregions (ICRISAT, 1974).
Soils and Soil Erosion
The soils of the SAT show great diversityin texture, structure, type of clay, organicmatter content, and depth. These variationsresult in significant differences in infiltration,erodability, moisture-holding capacity, drain-age characteristics, aeration, susceptibilityto and recovery from compaction, and gen-eral response to management and manipula-tion. However, particular soil groups arewidely spread throughout the seasonally drySAT. The major soil groups found in theSAT are as follows:
1. red and grey soils (Alfisols)
'"Rainfall use efficiency" is defined as the agricultural production (in kg or the monetary equivalent) in relationto the annual precipitation (in cm).
KRANTZ AND KAMPEN 233
2. black soils (Vertisols)3. alluvial soils (Entisols)4. sandy soils (Inceptisols)5. lateritic soils (Oxisols)
The Alfisols and Vertisols, which are byfar the most extensive in the SAT, are thetwo major soils of ICRISAT. Krantz et al.(1976) described these five soil groups, alongwith their locations in the SAT.
Nutrient level in soils of the SAT
Under the continuous high temperaturesof the SAT areas, the crop residues andorganic wastes decompose rapidly, and thenative organic-matter content of the soils islow (usually about 0.5%, seldom exceeding1%). The levels of several important nutri-ents are also low. This is especially true oftotal and available nitrogen and availablephosphorus. In areas where the surface soilshave been removed by erosion, bund build-ing, or land shaping, zinc deficiency is oftenobserved in zinc-sensitive plants. The potas-sium level now is fairly adequate in mostSAT soils. In the black soils the level is usu-ally quite high. Experience in other areas ofthe world indicates that potassium deficiencywill become more evident as crop productionincreases. The rate at which this will occurwill depend upon the handling of crop resi-dues and organic waste. Most of the potas-sium uptake by the plant is contained in thecrop residues. If exploitive agriculture iscontinued whereby the crop residues are allremoved and most of the farmyard manureis burned for fuel, the time of occurrence ofseveral deficiencies will be hastened.
The nutrient level in any one field will ofcourse depend upon several factors includingthe native fertility level, the length of timeunder cultivation, and the management, par-ticularly the application of manures andfertilizers, in the system. The use of fertilizersin the SAT has been very limited because ofthe risk involved due to the uncertainty ofmonsoon rainfall. Residues and organicwastes such as farmyard manure are usuallyreturned to fields close to the village; thosefields are often somewhat higher in fertilitylevel.
Erosion and runoff
Anyone familiar with the landscape of thesemiarid tropics, particularly during the rainyseason, recognizes the vast damage and therapid decline in the productive potential ofthe land caused by soil erosion. Some au-thors indicate that deforestation and subse-quent poor management of the land mayreduce long-term precipitation averages andcause changes in climate (Krishnan, 1973).Heseltine (1961) points out a decrease inland and water resources in tropical Africadue to a lack of proper management. Kan-war (1972) reports that in India alone 6,000million tons of soil are lost annually, a signif-icant portion of this loss occurring in theSAT of India. As a result, in large areas soilshave become shallow and stony, and theland in such areas is cut by deep, meander-ing gullies. Vandersypen et al. (1972) esti-mated that under conditions of about 800 mmannual rainfall in India, between 100 and 300mm are lost annually as runoff.
A recent report (FAO, 1974) states that,in many developing countries, increasedpressure on the land in low rainfall areas hasresulted in expansion of cultivated agricul-ture into marginal areas and intensificationof agricultural activities on unsuitable lands.The result is increased exposure of land re-sources to the hazards of wind and watererosion. Overstocking and overgrazing, de-forestation, and the cultivation of steepslopes are causing permanent damage tovast areas. The land resource endowmentbase is shrinking and the productive capacity,diminishing. This in turn again increases thequest for more land. To break this viciouscircle, more stable forms of land use thatpreserve and maintain the productive capa-city are urgently needed.
Soil and Water Management andConservation in the SAT
Four conventional approaches to amelior-ating the problems faced by farmers in therain-fed SAT have been:
1. To fallow the land during the rainy
234 SPECIAL PROBLEMS OF THE SEMIARID TROPICS
season in an attempt to accumulatea moisture reserve in the profile.
2. To implement soil and water con-servation practices.
3. To meet droughts and food crisesby emergency programs.
4. To develop irrigation facilities.
Fallowing
In many of the temperate semiarid re-gions, the total moisture-storage capacity ofthe soil exceeds the normal annual rainfall.Under these conditions, clean cultivated fal-lowing during 1 or more years will often in-crease yields substantially because of thegreater quantity of moisture available to thecrop (Pengra, 1952). However, in the SATthe high-intensity rainfall often exceeds theinfiltration rate, and total seasonal rainfallis frequently much greater than the capacityof the root zone to store moisture.
In many deep black soils, especially in In-dia, cultivated fallow is practiced during themonsoon season, but not cropping, which isdone only during the postmonsoon season.The reasons for not cropping during the mon-soon season are many, including such factorsas poor drainage, difficulty in cultivation andweed control, undependability of monsoonrains, and inadequate soil and crop technol-ogy (Kampen et al., 1974). However, the con-sequences of this traditional fallowing sys-tem in these deep black soils are serious withregard to runoff and erosion. Jacks et al.(1955) noted that a few minutes of high-intensity rainfall on some bare soils are suf-ficient to cause surface sealing, which dras-tically reduces infiltration. Arnon (1972)stated that frequent cultivations to producea soil mulch often result in an impaired soilstructure, thus increasing runoff and soil ero-sion. Ellison (1944), Hudson (1973), andothers have pointed out the serious conse-quences of a clean-cultivated fallow systemon soil erosion and the critical importance ofvegetative cover during high-intensity rains.
Mulching
Much research has been done on the use
of mulches to reduce evaporation, to in-crease infiltration, to prevent the soil fromblowing and washing away, to controlweeds, to improve soil structure, and to in-crease crop yields. The effects of mulchingseem to depend upon climate, season, andsoil type and are not universally advanta-geous. The yield-increasing effects ofmulches from crop residues have not beenclearly established in the SAT (Kampen,1974). Also the feasibility of attempting toprovide large quantities of organic materialsas mulches is a questionable practice, sincethe fodder or straw is needed as cattle feedin much of the SAT.
Traditional Bunding
Contour bunds or graded bunds are usedto decrease soil erosion and to conserve wa-ter above the bunds by increasing infiltra- <tion into the soil. In the SAT environment,well-designed and well-maintained systemsof bunds have been found to decrease soilerosion on a watershed basis. However, sub-stantial erosion and sedimentation may oc-cur within the areas between the bunds. Thisphenomenon is demonstrated by the largeelevation differences frequently observedupslope and downslope from the bunds. Al-though large quantities of water are heldback by the bunds, the increased infiltrationoften affects only a small portion of the landin the watershed.
A study of the effect of bunding on theyields of monsoon crops was conducted atthe Bellary Soil Conservation Centre ondeep black soils during the seasons between1960 and 1967 (ICAR, 1970). The averageannual rainfall in this area is about 550 mm.It was found that contour bunding decreasedthe average yield of sorghum and cotton by25 and 30% respectively. The decrease inyields in these cases was explained by thedelay in cultural operations and the cropdamage caused by stagnant water above thebunds.
The effect of bunding on wheat yields fol-lowing monsoon fallowing on deep black soilin central India was studied in 1972 (Kam-
KRANTZ AND KAMPEN 235
pen, 1974). These data indicated no increasein wheat yields because of the water trappednear the bund. There was a decrease inwheat yields in the pit just above the bundcaused by removal of surface soil during theconstruction of the bund. This effect, plusthe area removed from cropping by the bund,shows that bunding under these conditionshas a negative effect on total production.
Emergency Measures
During droughts and the associated foodcrises, large sums of money are often spenton hastily conceived programs for varioustypes of famine relief. Food aid is often pro-vided and crash resource conservation anddevelopment schemes are designed and car-ried out. However, after the calamity is overand life returns to normal, the acute problemmay be forgotten till the next crisis occurs.
> Severe droughts in the Indian subcontinentfrom 1965 to 1967 and from 1972 to 1973 andthe recent drought in the Sahel region ofAfrica provide examples of this type of ef-fort. It is self-evident that these types of ac-tivities seldom result in improving the sta-bility and long-term productive potential ofthe environment. Only sustained programsof research and development, along withvigorous programs of extension and trainingfor implementation of improved technology,will produce lasting results.
Irrigation
To eliminate the basic cause of uncertain-ty in agriculture in the SAT, three types ofirrigation facilities have been developed insome areas. These include large irrigationprojects, small runoff-storage reservoirs(called tanks in India), and wells. Large irri-gation projects were initially envisioned assupplemental water facilities for uplandcrops. Experience over the last two decadeshas shown that these projects do not supple-ment variable rainfall because of lack offlexibility in the system, which is inherent inlarge irrigation schemes. Thus, irrigation inthe SAT from these projects most often con-sists of providing continuous water on a sea-
sonal basis. In many cases the added irriga-tion water, plus the rainfall, has resulted inwaterlogging and salinity problems, partic-ularly where drainage facilities wereinadequate.
Wells are owned mostly by individuals.Although water may be drawn from an areabeyond the individual property boundaries,the benefits of irrigation accrue exclusivelyto the well owner. Intensive irrigation of asmall area rather than supplemental irriga-tion of rain-fed crops over an extended areais frequently the result.
The small runoff-storage reservoirs arecharacterized by inefficient use of water andconsiderable loss of land. The shallownessof these storage facilities results in largeevaporation and seepage losses, while sub-stantial areas of otherwise productive landare occupied. Siltation caused by lack oferosion-control measures in the watershedhas significantly reduced the storage capaci-ty of many reservoirs.
Thus, it appears that present water-re-source development in the SAT often resultsin the creation of "islands of relative wealth"in "a sea of poverty." This situation maycontribute to social tension at a later stage.The fact that the total water resources areinsufficient to cover any substantial portionof the cultivated land through conventionalirrigation has been neglected. Few seriousefforts have been made to explore the ques-tion of how the limited water resources canbe used to stabilize and support large pro-portions of agriculture in the SAT for thebenefit of a greater number of farmers. Inother words, no clear answers are availableto the question of how all available groundand surface water can best be used to backup farming systems in the SAT rather thanreplace a small part of rain-fed agriculture.
Approaches to and Potentials forImproved Soil and Water Management
Until recently the major thrust of agricul-tural research and development in the lessdeveloped countries was aimed at increasing
236 SPECIAL PROBLEMS OF THE SEMIARID TROPICS
food production in the irrigated areas.6 Thesituation of limited resources and seriousfood shortages made this approach appearlogical. In recent years, however, there hasbeen an increasing concern about agricul-ture in the rain-fed (unirrigated) areas of theSAT. Fortunately, many countries arelaunching national research programs forrain-fed agriculture. In India, the All IndiaCoordinated Research Project for DrylandAgriculture, initiated in 1970, provides anexcellent example of an integrated approachtowards research and action on the problemsof SAT agriculture. On a global basis, theconcern about the SAT and the new confi-dence in the productive potential of theseareas resulted in the creation of ICRISAT in1972.
Strategy for Research and Development
The basic strategy for recent soil and wa-ter management research and developmentin national programs and at ICRISAT hasbeen to investigate the natural, human, ani-mal, and capital resources and to developprograms to optimize the utilization of theseresources on a sustained basis. This is in ac-cordance with the preamble to the interna-tional development strategy for the secondUnited Nations Development decade, whichstates: "The ultimate objective of develop-ment must be to bring about sustained im-provement in the well-being of the individualand bestow benefits to all" (FAO, 1974).
At ICRISAT the following immediate soiland water management research needs areenvisaged:
1. To decrease runoff and soil erosion.2. To develop effective surface drain-
age systems where needed.3. To increase the proportion of rainfall
used in crop production.4. To achieve higher rainfall-use effi-
ciencies.
5. To utilize available ground and sur-face water more effectively.
6. To generate appropriate technologyfor land and water development andmanagement.
Goals of the Farming SystemsResearch Program at ICRISAT
The goals of the Farming Systems Re-search Program are:
l.To generate economically viable,labor-intensive technology for im-proving and utilizing while conserv-ing the productive potential of nat-ural resources.
2. To develop technology for improvedland and water management systemsthat can be implemented and main-tained during the extended dry sea-sons, thus providing additionalemployment to people and betterutilization of available animal power.
3. To contribute to raising the econom-- ic status and the quality of life for
the people in the semiarid tropics bydeveloping farming systems that in-crease and stabilize agriculturaloutput.
The Farming Systems Research Pro-gram consists of the following four comple-mentary components:
1. Research on individual productionfactors.
2. Resource utilization research on anoperational scale.
3. Cooperative research with nationaland regional organizations.
4. Extension and" implementationthrough national programs.
All four components are interrelated, andsuccess is dependent upon continuous dis-semination and feedback between each of
6The limited research in rain-fed areas of the SAT was largely aimed at the adaptation of dryland agricultural prac-tices from the temperate regions of the world. As pointed out on page 228, the characteristics of the SAT aredistinctly different from those of the temperate dryland regions and thus require a problem-oriented approachrelated to the resources of the SAT.
KRANTZ AND KAMPEN 237
the components. Likewise, the realization ofthe agricultural potential of the SAT is criti-cally dependent upon the generation of suit-able high-yielding varieties. These varietiesshould represent a wide range of maturitydates and morphological characteristics tofit into various cropping systems necessaryto utilize the varied environments of the SAT.
Research on IndividualProduction Factors
Research on individual production fac-tors involves experiments, special investiga-tions, and development activities in the fol-lowing major program areas or disciplines:agroclimatology, hydrology, soil physics,land and water management, agronomy, soilfertility and chemistry, farm machinery andpower, plant protection, and economics andsociology.
The research on these program areas canbe carried out in experimental plots, screenhouses, growth chambers, laboratories,machine shops, markets, and villages. In-vestigational studies are being initiated toevaluate and understand the present circum-stances in the various regions and to helpdirect research toward priority problems ineach program area.
Resource Utilization Research onan Operational Scale
In the resource utilization research pro-gram, the central objective is to make thebest use of the rain that falls on a given area.To study water as an input, natural water-sheds (also called catchments) were chosenas the unit for research. Also, since water isthe major natural constraint to agriculturaldevelopment in the SAT, it is expected thatwatersheds will become the focus for re-source development and utilization in anygiven region.
At ICRISAT this component of researchis aimed at the development of "watershed-based resource utilization," which has beendescribed as follows:
Watershed-based resource utilization in-volves the optimum utilization of the water-
shed precipitation through improved wa-ter, soil and crop management for theimprovement and stabilization of agricul-ture in the watershed. Rainfall utilizationcan be attained in one or more of the fol-lowing ways:1. Directly through infiltration of monsoon
rainfall;2. After runoff collection, storage and util-
ization; or3. After deep percolation and recovery from
wells.
Briefly stated, the watershed-basedstudies encompass investigations of resourcedevelopment, management, and conserva-tion; water-balance studies; and research in-volving the integration of improved compo-nents of soil, water, and crop technology. Bythe integration of all of these components, itis possible to develop alternative farmingsystems that can be carefully monitored on afield scale to evaluate such factors as water-utilization patterns, production effects, re-source conservation, and economics. In otherwords, the watersheds serve not only as unitsfor conservation and water-balance studiesbut also as "pilot plant studies" for the inte-gration of a wide range of management tech-nologies on an operational scale.
Cooperative Research with Nationaland Regional Organizations
The agroclimatological environment atICRISAT is being used for the generationof principles, approaches, and methodolo-gies to arrive at improved farming systems.However, before application to the diverseregions of the SAT, these principles have tobe converted into applicable site-specifictechnology. Where areas characterized byvarious conditions are to be served, the firststep is to collect detailed quantitative in-formation about the physical and biologicalsettings in the different regions. Climate,soils, crops, and cropping systems are thebuilding blocks for improved farmingsystems.
Matching the need for sound physical andbiological technology is the requirement forsocioeconomic investigations involving hu-
238 SPECIAL PROBLEMS OF THE SEMIARID TROPICS
man and capital resources, basic needs, con-straints, market potentials for improvedtechnology, and mechanisms for group ac-tion in soil and water management. Severalapproaches will be used to develop the nec-essary information and methodologies.These will include the following:
1. Simulation techniques based onmathematical modeling.
2. Establishment of a limited numberof benchmark locations in coopera-tion with national programs to rep-resent distinctly different climatic,soil, and topographic conditions.
The objective would be to cover the spec-trum of conditions having a minimum oflocations. These benchmark locations willbe placed at strategic national research sta-tions, and the programs will be developedin cooperation with the national and stateinstitutions, with the aim of adaptingand developing information for the areasinvolved.
Extension and AgriculturalDevelopment throughNational Programs
The implementation of new systems offarming will require an effective extension-education program, along with developmen-tal action programs supported by the neces-sary technical assistance. Although nooperational responsibility is envisaged forICRISAT, ICRISAT scientists would expectto provide training and technical back-upwhere desired, particularly in the initialstages. It is visualized that benchmark loca-tions or other strong national research cen-ters having a farming-systems emphasiswould provide a focal point for initiatingtraining and improved agricultural develop-ment programs. The interaction with andthe feedback process from the national pro-grams would be extremely helpful in guidingthe focus of ICRISAT's research and train-ing programs.
Preliminary Observations on theManagement and Conservation of
Soil and Water
Preliminary observations and results ofstudies on the management and conserva-tion of soil and water done at ICRISAT havebeen discussed in several publications(ICRISAT, 1973-1974, 1974-1975, 1975-1976; Kampen et al., 1974; Krantz et al.,1974). Some of the highlights relating to soiland water management are given below.
Studies on Ridge andFurrow Systems
An effective soil and water managementsystem should reduce runoff and soil erosionwhile increasing infiltration of rainfall, with-out causing surface-drainage problems. Sys-tems involving graded, narrow, or broadridges or beds separated by furrows draininginto waterways appear to possess many ofthe essentials for fulfilling these require-ments. The surface-drainage function ofridges and furrows has been shown byChoudhury and Bhatia (1971) and Krantzand Kampen (1973). Preliminary research atICRISAT indicates that by altering theslopes of the ridges and furrows, the systemcan also be used, within limits, to manipulatethe amount of runoff and to reduce erosion(ICRISAT, 1974-1975).
During the 1975 season, a broad (150-cm)ridge and furrow system was compared withthe 75-cm ridge and furrow system on redsoil. In the 75-cm ridge and furrow system,cross flow and erosion had been encounteredespecially in slightly depressional areascaused by the instability of the narrowridges. This problem was overcome by theuse of a broad ridge and furrow system,which resulted in less runoff than either flat-or narrow-ridged cultivation. Also, the 75-cmridge and furrow system was found to havelimited flexibility for intercropping as wellas postmonsoon cropping at close spacing.Using broad ridges, it is possible to plant2, 3, or 4 rows per ridge at spacings of 75, 45,and 30 cm respectively. This also allows for
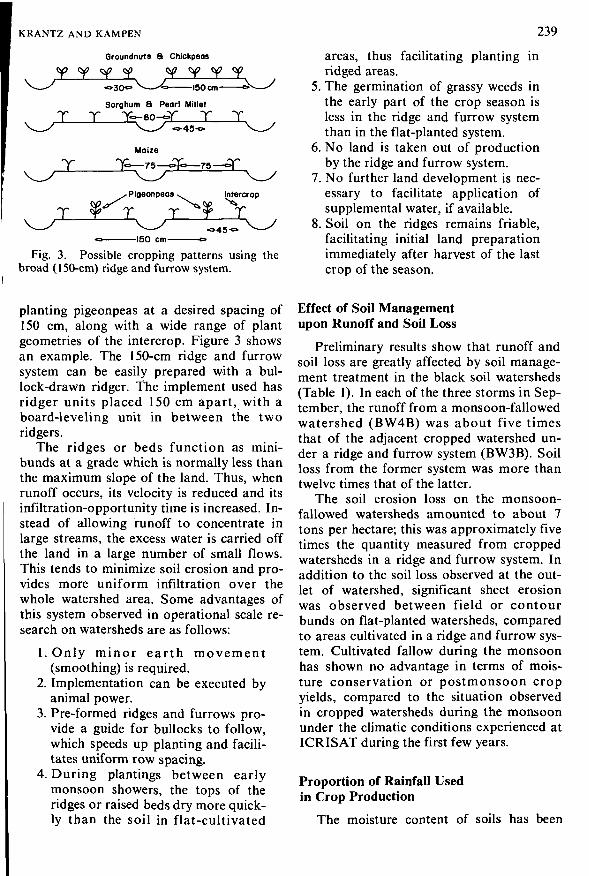
KRANTZ AND KAMPEN
Groundnuts 8 Chickpeas
239
T
30»^ <" 150cm
Sorghum 8 Pearl Milletf TT T
-45-
Fig. 3. Possible cropping patterns using thebroad (150-cm) ridge and furrow system.
areas, thus facilitating planting inridged areas.
5. The germination of grassy weeds inthe early part of the crop season isless in the ridge and furrow systemthan in the flat-planted system.
6. No land is taken out of productionby the ridge and furrow system.
7. No further land development is nec-essary to facilitate application ofsupplemental water, if available.
8. Soil on the ridges remains friable,facilitating initial land preparationimmediately after harvest of the lastcrop of the season.
planting pigeonpeas at a desired spacing of150 cm, along with a wide range of plantgeometries of the intercrop. Figure 3 showsan example. The 150-cm ridge and furrowsystem can be easily prepared with a bul-lock-drawn ridger. The implement used hasridger units placed 150 cm apart, with aboard-leveling unit in between the tworidgers.
The ridges or beds function as mini-bunds at a grade which is normally less thanthe maximum slope of the land. Thus, whenrunoff occurs, its velocity is reduced and itsinfiltration-opportunity time is increased. In-stead of allowing runoff to concentrate inlarge streams, the excess water is carried offthe land in a large number of small flows.This tends to minimize soil erosion and pro-vides more uniform infiltration over thewhole watershed area. Some advantages ofthis system observed in operational scale re-search on watersheds are as follows:
1. Only minor earth movement(smoothing) is required.
2. Implementation can be executed byanimal power.
3. Pre-formed ridges and furrows pro-vide a guide for bullocks to follow,which speeds up planting and facili-tates uniform row spacing.
4. During plantings between earlymonsoon showers, the tops of theridges or raised beds dry more quick-ly than the soil in flat-cultivated
Effect of Soil Managementupon Runoff and Soil Loss
Preliminary results show that runoff andsoil loss are greatly affected by soil manage-ment treatment in the black soil watersheds(Table 1). In each of the three storms in Sep-tember, the runoff from a monsoon-fallowedwatershed (BW4B) was about five timesthat of the adjacent cropped watershed un-der a ridge and furrow system (BW3B). Soilloss from the former system was more thantwelve times that of the latter.
The soil erosion loss on the monsoon-fallowed watersheds amounted to about 7tons per hectare; this was approximately fivetimes the quantity measured from croppedwatersheds in a ridge and furrow system. Inaddition to the soil loss observed at the out-let of watershed, significant sheet erosionwas observed between field or contourbunds on flat-planted watersheds, comparedto areas cultivated in a ridge and furrow sys-tem. Cultivated fallow during the monsoonhas shown no advantage in terms of mois-ture conservation or postmonsoon cropyields, compared to the situation observedin cropped watersheds during the monsoonunder the climatic conditions experienced atICRISAT during the first few years.
Proportion of Rainfall Usedin Crop Production
The moisture content of soils has been
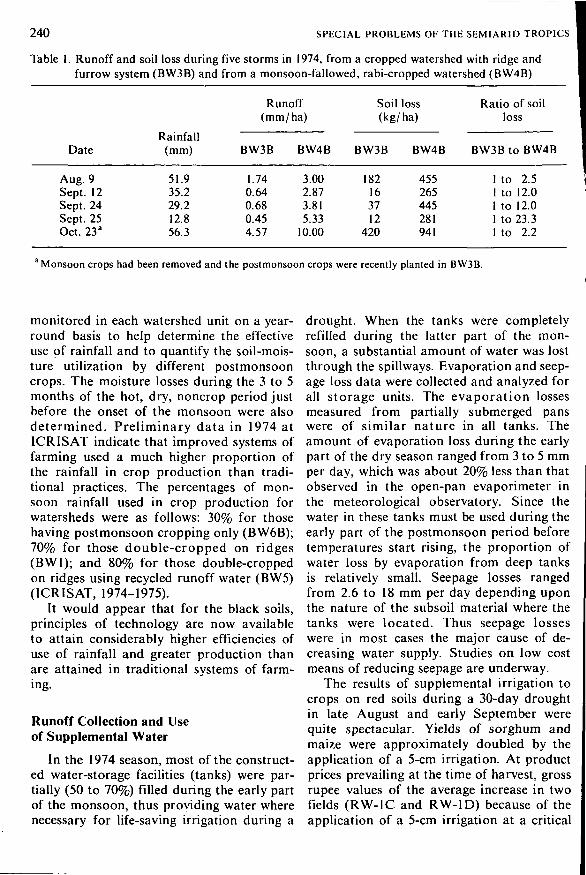
240 SPECIAL PROBLEMS OF THE SEMIARID TROPICS
Table 1. Runoff and soil loss during five storms in 1974, from a cropped watershed with ridge andfurrow system (BW3B) and from a monsoon-fallowed, rabi-cropped watershed (BW4B)
Date
Aug. 9Sept. 12Sept. 24Sept. 25Oct. 23a
Rainfall(mm)
51.935.229.212.856.3
Runoff(mm/ha)
BW3B
1.740.640.680.454.57
BW4B
3.002.873.815.33
10.00
Soil loss(kg/ha)
BW3B BW4B
182 45516 26537 44512 281
420 941
Ratio of soilloss
BW3B to BW4B
1 to 2.51 to 12.01 to 12.01 to 23.31 to 2.2
'Monsoon crops had been removed and the postmonsoon crops were recently planted in BW3B.
monitored in each watershed unit on a year-round basis to help determine the effectiveuse of rainfall and to quantify the soil-mois-ture utilization by different postmonsooncrops. The moisture losses during the 3 to 5months of the hot, dry, noncrop period justbefore the onset of the monsoon were alsodetermined. Preliminary data in 1974 atICRISAT indicate that improved systems offarming used a much higher proportion ofthe rainfall in crop production than tradi-tional practices. The percentages of mon-soon rainfall used in crop production forwatersheds were as follows: 30% for thosehaving postmonsoon cropping only (BW6B);70% for those double-cropped on ridges(BW1); and 80% for those double-croppedon ridges using recycled runoff water (BW5)(ICRISAT, 1974-1975).
It would appear that for the black soils,principles of technology are now availableto attain considerably higher efficiencies ofuse of rainfall and greater production thanare attained in traditional systems of farm-ing.
Runoff Collection and Useof Supplemental Water
In the 1974 season, most of the construct-ed water-storage facilities (tanks) were par-tially (50 to 70%) filled during the early partof the monsoon, thus providing water wherenecessary for life-saving irrigation during a
drought. When the tanks were completelyrefilled during the latter part of the mon-soon, a substantial amount of water was lostthrough the spillways. Evaporation and seep-age loss data were collected and analyzed forall storage units. The evaporation lossesmeasured from partially submerged panswere of similar nature in all tanks. Theamount of evaporation loss during the earlypart of the dry season ranged from 3 to 5 mmper day, which was about 20% less than thatobserved in the open-pan evaporimeter inthe meteorological observatory. Since thewater in these tanks must be used during theearly part of the postmonsoon period beforetemperatures start rising, the proportion ofwater loss by evaporation from deep tanksis relatively small. Seepage losses rangedfrom 2.6 to 18 mm per day depending uponthe nature of the subsoil material where thetanks were located. Thus seepage losseswere in most cases the major cause of de-creasing water supply. Studies on low costmeans of reducing seepage are underway.
The results of supplemental irrigation tocrops on red soils during a 30-day droughtin late August and early September werequite spectacular. Yields of sorghum andmaize were approximately doubled by theapplication of a 5-cm irrigation. At productprices prevailing at the time of harvest, grossrupee values of the average increase in twofields (RW-1C and RW-1D) because of theapplication of a 5-cm irrigation at a critical
KRANTZ AND KAMPEN 241
time of growth were 3,120, 2,780, 1,085, and650 rupees per hectare for maize, sorghum,pearl millet, and sunflower, respectively. Atthese values, the rupee value of a hectaremeter (8.1 acre feet) of water (neglectingapplication losses) would be 62,400, 55,600,21,700, and 13,000 rupees for maize, sor-ghum, pearl millet, and sunflower, respec-tively.
Effect of Soil Managementon Infiltration in Black Soils
Infiltrometer studies on black soils indi-cated substantial differences in the rates ofwater intake between soil managementtreatments. In initial observations, monsoon-fallowed land was found to have a low infil-tration rate of approximately 1 mm per hourafter 2 or more days of observation. Finalinfiltration rates on land that was croppedand cultivated in the ridge and furrow sys-tem were in the range of 6 mm per hour. Inthe cropped, flat-planted areas, the averageinfiltration rate was about 2.8 mm per hour.Monsoon rainfall is often characterized byextremely high intensities, and thereforehigher infiltration rates may increase mois-
ture availability for plant growth. Althoughthese results need further confirmation, theyseem to emphasize the importance of vege-tative cover and adequate drainage in landmanagement and cropping systems for blackclay soils during the monsoon.
Power- and Labor-Use Efficiency
Animals are used in all cultural operationsin the watersheds, and preliminary effortsare underway to adapt and develop moreeffective farm equipment to improve soil andwater management. The improved versustraditional watershed units provide an op-portunity to study the power- and labor-useefficiency as well as production, rainfall-useefficiency, and resource conservation. Pre-liminary observations indicate that improvedfarming systems including land developmentand double cropping make fuller and moretimely use of animal power than traditionalagriculture. Future research will be aimedat increased power-use efficiency and rain-fall-use efficiency involving studies of tim-ing of land preparation, minimum tillage,and zero tillage using herbicides.
Literature Cited
AICRPDA. 1973 and 1974. ICAR Annual Report. All India Coordinated Research Project for DrylandAgriculture, Hyderabad.
Anon. 1970. A new technology for dry farming. Indian Agric. Res. Inst., New Delhi.ARNON, I. 1972. Crop production in dry regions. Leonard Hill, London.CHOUDHURY, S.L., and P.C. BHATIA. 1971. Ridge planted kharif pulses yield high despite waterlog-
ging. Indian Farming, June, 1971.COCHEME, J., and P. FRANQUIN. 1967. A study of the agroclimatology of the semiarid area south of the
Sahara in West Africa. FAO, Rome.ELLISON, W.D. 1944. Studies on raindrop erosion. Agric. Eng. 25:131-136.FAO. 1973. Production yearbook for 1972, vol. 26. FAO, Rome.FAO. 1974. Improved productivity in low rainfall areas. Committee on Agriculture, New Delhi.GOVERNMENT OF INDIA. 1971. Indian agriculture in brief. Ministry of Agriculture, New Delhi.HESELTINE, NIGEL. 1961. Remaking Africa. Museum Press, London.HUDSON, N.W. 1973. Soil conservation. B.T. Batsford, London.ICAR. 1970. Soil and water conservation research, 1956 to 1958. Indian Council of Agric. Res., New
Delhi.1CRISAT. 1974. Annual Report 1973-1974, Hyderabad, India.JACKS, G.V., W.D. BRIND, and P. SMITH. 1955. Mulching. Tech. Commun. Commonw. Bur. Soil Sei.
no. 49.
242 SPECIAL PROBLEMS OF THE SEMIARID TROPICS
KAMPEN, J. 1974. Water conservation practices and their potential for stabilizing crop production in theSAT. Paper read at the FAO Conference on Food Production in Rain-fed Areas of Tropical Asia,Hyderabad, 1974. (Unpublished.)
KAMPEN, J., J. HARI KRISHNA, R.C. SACHAN, and P.N. SHARMA. 1974. Soil and water conservationand management in farming systems research for the semiarid tropics. Paper presented at the Inter-national Workshop on Farming Systems, ICRISAT, Hyderabad, November, 1974.
KANWAR, J.S. 1972. Soil and water—looking ahead. Presidential address delivered at the 37th AnnualGeneral Meeting of the Indian Society of Soil Science, July, 1972, P.A.U. Ludhiana, Punjab.
KRANTZ, B. A., and J. KAMPEN. 1973. The farming systems program. ICRISAT, Hyderabad.KRANTZ, B.A., J. KAMPEN, S.N. KAPOOR, J. HARI KRISHNA, H. LAL, R.C. SACHAN, P.N. SHARMA,
S.K. SHARMA, S. V.R. SHETTY, P. SINGH, and S. SINGH. 1976. Annual Report of Farming SystemsRes. Program, 1974-1975.
KRANTZ, B.A., S.K. SHARMA, P. SINGH, and S. SINGH. 1974. Cropping patterns for increasing andstabilizing agricultural production in the semiarid tropics. Paper read at the International Workshopon Farming Systems, ICRISAT, Hyderabad, November, 1974. (Unpublished.)
KRISHNAN, A. 1973. Why does it not rain in the Indian desert? Indian Farming, vol. 23, no. 3.MEIGS, P. 1953. World distribution of arid and semiarid homoclimates. Rev. Res. on Arid Zones Hy-
drology, UNESCO, Paris.PENGRA, R. F. 1952. Estimating crop yields at seeding time in the Great Plains. Agron. J. 44:271-274.RASTOGI, B.K. 1974. Income and employment raising potential of the new dryland agriculture tech-
nology. Paper read at Fifth Annual Workshop, All India Coordinated Research Project for DrylandAgriculture, Hyderabad, February, 1974. (Unpublished.)
REID, W. W. 1941. The climates of the world; climate and man. Yearb. Agric. USDA, Washington, D.C.TROLL, C. 1966. Seasonal climates of the earth; world maps of climatology. Springer-Verlag, Berlin.VANDERSYPEN, D. R., J. S. BALI, and Y. P. YADAV. 1972. Handbook of hydrology. Ministry of Agriculture,
Central Unit for Soil Conservation, New Delhi.WEBSTER, C. C, and P.N. WILSON. 1966. Agriculture in the tropics. Longmans, Green and Co., London.
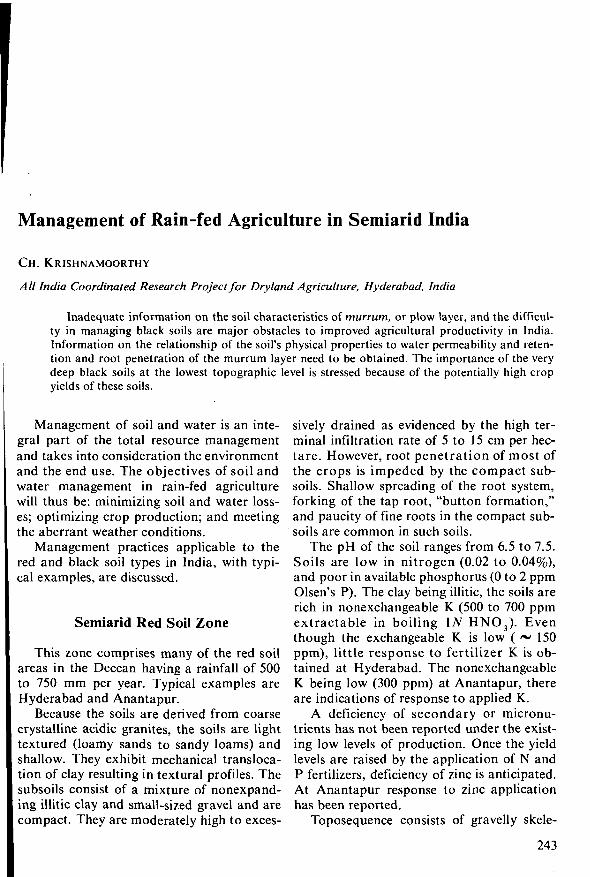
Management of Rain-fed Agriculture in Semiarid India
C H . KRISHNAMOORTHY
All India Coordinated Research Project for Dryland Agriculture, Hyderabad, India
Inadequate information on the soil characteristics of murrum, or plow layer, and the difficul-ty in managing black soils are major obstacles to improved agricultural productivity in India.Information on the relationship of the soil's physical properties to water permeability and reten-tion and root penetration of the murrum layer need to be obtained. The importance of the verydeep black soils at the lowest topographic level is stressed because of the potentially high cropyields of these soils.
Management of soil and water is an inte-gral part of the total resource managementand takes into consideration the environmentand the end use. The objectives of soil andwater management in rain-fed agriculturewill thus be: minimizing soil and water loss-es; optimizing crop production; and meetingthe aberrant weather conditions.
Management practices applicable to thered and black soil types in India, with typi-cal examples, are discussed.
Semiarid Red Soil Zone
This zone comprises many of the red soilareas in the Deccan having a rainfall of 500to 750 mm per year. Typical examples areHyderabad and Anantapur.
Because the soils are derived from coarsecrystalline acidic granites, the soils are lighttextured (loamy sands to sandy loams) andshallow. They exhibit mechanical transloca-tion of clay resulting in textural profiles. Thesubsoils consist of a mixture of nonexpand-ing illitic clay and small-sized gravel and arecompact. They are moderately high to exces-
sively drained as evidenced by the high ter-minal infiltration rate of 5 to 15 cm per hec-tare. However, root penetration of most ofthe crops is impeded by the compact sub-soils. Shallow spreading of the root system,forking of the tap root, "button formation,"and paucity of fine roots in the compact sub-soils are common in such soils.
The pH of the soil ranges from 6.5 to 7.5.Soils are low in nitrogen (0.02 to 0.04%),and poor in available phosphorus (0 to 2 ppmOlsen's P). The clay being illitic, the soils arerich in nonexchangeable K (500 to 700 ppmextractable in boiling IN HNO3). Eventhough the exchangeable K is low ( ~ 150ppm), little response to fertilizer K is ob-tained at Hyderabad. The nonexchangeableK being low (300 ppm) at Anantapur, thereare indications of response to applied K.
A deficiency of secondary or micronu-trients has not been reported under the exist-ing low levels of production. Once the yieldlevels are raised by the application of N andP fertilizers, deficiency of zinc is anticipated.At Anantapur response to zinc applicationhas been reported.
Toposequence consists of gravelly skele-
243
244 SPECIAL PROBLEMS OF THE SEMIARID TROPICS
tal soils at the highest level of topography,followed by loamy sands and sandy loams atintermediate levels and by sandy clays at thelowest elements. Of these, loamy sands andsandy loams occupy the largest area.
The soils are cropped only during therainy season. Sorghum and millet (pearl, fin-ger, and foxtail) are the important cereals;pigeon pea, cowpea, and Dolichos biflorus(horse gram), the important grain legumes;and castor and groundnut, the important oil-seed crops. The planting of the crops is doneearly with the first soaking showers in themonth of June. By the time intense showersoccur in the month of September, full cropcanopy is attained. Because of the high infil-tration rate and the crop-canopy develop-ment, the erosion hazards are less than 5 to6 tons per hectare. However, considering thelightness of the soil, even this loss cannot beignored.
The approved soil conservation practiceconsists of putting up contour bund of about0.8 m2 per section at vertical intervals of 1 to1.5 m on lands that have slopes exceeding 2to 3%. Because of the limited moisture-stor-age capacity (about 5 cm) in the profile andbecause of crusting, both surface runoff andsubsurface seepage are important. The run-off is collected in large reservoirs and tanks,which are used to irrigate lowland rice. Wellirrigation is also common. An irrigated areais usually not more than 10% of the total cul-tivated area.
Soil Management
The soil management practices are de-signed to: prepare a firm weed-free seedbed;avoid or overcome crust problems; improveroot penetration; and improve soil fertility.
Seedbed preparation
Year-round tillage practices have beendeveloped. They consist of (1) plowing orblading the soil immediately after the har-vest of the standing crop or whenever the soilis in condition by making use of rains in thenoncrop season; and (2) blading to make theseedbed firm and to remove recent weed
Table 1. Short-term carry-over of moisture
Soildepth
Treatment
No mulchingSoil mulchingOrganic mulching
moisture in 30-cm of soilafter a 60-mm rainfall (cm)
1 day after
2.222.583.06
10 days after
0.841.381.68
growth. After planting, blading is done tocontrol the weeds and keep the soil open andmoisture-retentive.
Crust problems
Crust problems are quite serious in thered soils of Hyderabad and Anantapur.When the crust is formed after seeding, it in-terferes with stand establishment of crops.The recommended practice to overcome thisproblem consists of working a spike toothharrow if the crust is formed within 1 to 2days after seeding; of seeding on the side ofa ridge, which is less prone to crust forma-tion; and of mulching the seedlines with or-ganic residues to minimize the beating actionof rain. If the crust formation occurs 3 to 4days after seeding, there is no practical wayof saving the stands, and the crops have to beresown. There are differences amongst cropsin their reaction towards crust formation.Crops like castor and pigeon pea are not af-fected severely by crust formation. Cropswhose seed rate is normally high are also lessaffected. The worst problems are in the caseof small-seeded crops such as finger millet,pearl millet, and sometimes sorghum.
Table 2. Profile modification in red soils
Treatment
Shallow plowingChisellingDeep plowing
CD. (0.05)= 1.63
Sunflower yield(q/ha)
9.9210.3612.37
KRISHNAMOORTHY
Crust formation seriously affects waterintake. For example, moisture penetrates upto 30 cm deep in soils kept open by blading,as compared with 10 cm in a crusted soil.At ICRISAT it was observed that runofffrom crusted red soils exceeded that fromblack soils in the early part of the monsoon.
Crust formation also indirectly affectsmoisture in the seed zone. That is, there isless moisture in the seed zone of crusted soils(Table 1). This, together with the hardeningof the crust, restricts the sowing time avail-able in terms of rain. Studies at Hyderabadindicate that even soil mulch makes it possi-ble to extend the sowing time by preservingthe moisture in the seed zone.
Improving root penetration
In the textural profiles of the red soils,root penetration is impeded by the subsoilcharacterized by rigid pores. Two ap-proaches have been developed for over-coming this limitation. The first one consistsof deep tillage, with or without inversion. Inan experiment using the red soils of Hydera-bad, profile modification was attempted withdeep plowing. Sunflower was the test crop.Table 2 gives the results.
This approach requires heavy machinery,which is not generally available. A practicalmodification of the principle consists of deeptillage in the seedlines, as against the entirefield. This work, initiated by the Indo-Frenchteam at Anantapur, is continuing. An indi-rect advantage of deep tillage whether in theentire field or in the seed furrow is that itmixes the heavy subsoil with the light sur-face soil thus minimizing the crust problem.
An entirely different approach is beingdeveloped at Hyderabad. Here advantage istaken of such crops as castor and pigeon pea,which are capable of penetrating and open-ing up the subsoil. Studies are underway toexamine the effect of such crops on succeed-ing crops that are incapable of penetratingthe subsoil.
Improving soil fertility
Nitrogen and phosphorus are the mostcommonly deficient nutrients, and the rec-
245
Table 3. Moisture-use efficiency
Moisture-use efficiencyCrop Variety (kg/ ha mm)
Sorghum
Pigeon pea
CSH-1CSH-6AgetiST-1
2.64.05.48.3
ommendation is to apply 30 to 40 kg of nitro-gen and 30 kg of P2O5 per hectare. It is rec-ommended that the entire phosphorus andone-third to one-fourth of the nitrogen beapplied along with the seed to promote earlyseedling vigor to overcome nonspecificstresses, particularly weed competition. Theremaining nitrogen should be applied in in-stallments depending upon the crop and theseason.
Improving efficiency of fertilizer use isachieved by the use of set furrows, in whichfarmyard manure and other fertilizers areincorporated. This practice is extensivelyused in the Saurashtra region of Gujarat.The furrows in which crops are sown arefixed and not changed from year to year. Thefurrows are opened with a country plowwell in advance of the monsoon; the fertilizerapplied in the furrows simulates placement.Farmyard manure keeps the soil open, im-proves water intake, and minimizes crusting.The land between furrows is bladed to re-
Table 4. Crop-weed competitionand yield of HB-3 pearl millet
Treatment
Weed-infested for 10 days20 days30 days40 days50 days
Unweeded check
Yield (q/ha)
14.1713.795.385.682.291.31
CD. (0.05) = 3.63
246 SPECIAL PROBLEMS OF THE SEMIARID TROPICS
Table 5. Effect of sowing dates on the yield of kharif crops, Hyderabad, 1973-1974
Date of sowing
June 8June 22July 7July 20August 3August 17
Sorghum(CSH-1)
54.146.117.20.90.90.7
Yield (q/ha)
Pearl millet(HB-3)
32.041.934.123.917.418.0
Finger millet(Sharada)
22.619.829.530.737.3
Failed
move weeds and is shaped to serve the pur-pose of interrow water harvesting.
Water Management
Water management practices fall intotwo groups, those designed to minimizelosses of moisture stored in the soil and thosedesigned to collect inevitable runoff for itsbest use.
The most efficient use of moisture storedin the soil is achieved by choosing crops thatpenetrate the subsoil and therefore are ableto tap moisture from deeper layers. An ex-ample is given in Table 3, which shows acomparative performance of sorghum withpigeon pea at Hyderabad in 1972 on a shal-low soil.
The need for keeping the soil surfaceopen by interculture has been emphasizedearlier. Timely and thorough weed control isessential, particularly in years of subnormalrainfall. Early weeding, usually within 3weeks of emergence, is critical (Table 4).
The other practices designed to improve
efficiency of moisture use are intercroppingsystems, dust mulching, and finally harvestat the physiological maturity stage.
Since aberrant weather is of common oc-currence in the semiarid red soils, watermanagement practices should indirectly re-late to the choice of crops according to theseason. The basic principle here is to chooseshorter-duration varieties of crops, since theonset of monsoon is delayed by a week to afortnight, and to change over to short-seasoncrops when the onset is further delayed. Thechoice of crops for the Hyderabad region isgiven in Tables 5 and 6.
Management of runoff stored in tanksand wells requires considerable improve-ment. First, except where it is impossible togrow other crops, rice cultivation should bediscouraged. Because of the riparian rights,it is very difficult to alter the existing prac-tice of growing rice under established tanks.However, it should be the policy that newtanks and reservoirs will be designed for pro-viding supplemental irrigation to the rain-fed crops. This will involve a change in de-
Table 6. Alternate crops in Hyderabad
Seeding time Crop
June to mid-July (normal) Sorghum and pearl millet having redgram as intercropJuly Castor and finger milletLate August and early September (late) Horse gram, cowpea, and safflower in deeper soils
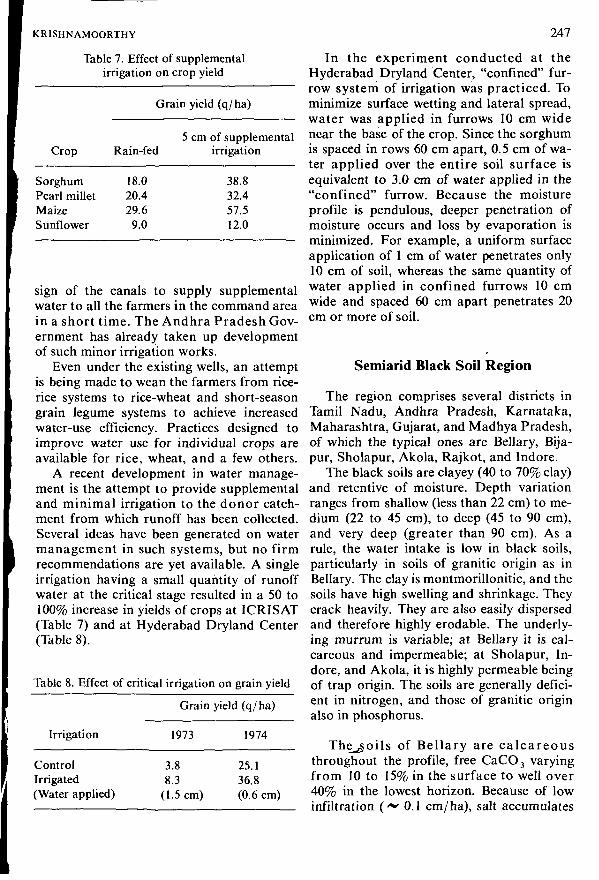
KRISHNAMOORTHY 247
Table 7. Effect of supplementalirrigation on crop yield
Crop
SorghumPearl milletMaizeSunflower
Grain yield (q/ha)
Rain-fed
18.020.429.6
9.0
5 cm of supplementalirrigation
38.832.457.512.0
sign of the canals to supply supplementalwater to all the farmers in the command areain a short time. The Andhra Pradesh Gov-ernment has already taken up developmentof such minor irrigation works.
Even under the existing wells, an attemptis being made to wean the farmers from rice-rice systems to rice-wheat and short-seasongrain legume systems to achieve increasedwater-use efficiency. Practices designed toimprove water use for individual crops areavailable for rice, wheat, and a few others.
A recent development in water manage-ment is the attempt to provide supplementaland minimal irrigation to the donor catch-ment from which runoff has been collected.Several ideas have been generated on watermanagement in such systems, but no firmrecommendations are yet available. A singleirrigation having a small quantity of runoffwater at the critical stage resulted in a 50 to100% increase in yields of crops at ICRISAT(Table 7) and at Hyderabad Dryland Center(Table 8).
Table 8. Effect of critical irrigation on grain yield
Irrigation
ControlIrrigated(Water applied)
38
(1
Grain
1973
.8
.3
.5 cm)
yield (q/ha)
1974
25.136.8(0.6 cm)
In the experiment conducted at theHyderabad Dryland Center, "confined" fur-row system of irrigation was practiced. Tominimize surface wetting and lateral spread,water was applied in furrows 10 cm widenear the base of the crop. Since the sorghumis spaced in rows 60 cm apart, 0.5 cm of wa-ter applied over the entire soil surface isequivalent to 3.0 cm of water applied in the"confined" furrow. Because the moistureprofile is pendulous, deeper penetration ofmoisture occurs and loss by evaporation isminimized. For example, a uniform surfaceapplication of 1 cm of water penetrates only10 cm of soil, whereas the same quantity ofwater applied in confined furrows 10 cmwide and spaced 60 cm apart penetrates 20cm or more of soil.
Semiarid Black Soil Region
The region comprises several districts inTamil Nadu, Andhra Pradesh, Karnataka,Maharashtra, Gujarat, and Madhya Pradesh,of which the typical ones are Bellary, Bija-pur, Sholapur, Akola, Rajkot, and Indore.
The black soils are clayey (40 to 70% clay)and retentive of moisture. Depth variationranges from shallow (less than 22 cm) to me-dium (22 to 45 cm), to deep (45 to 90 cm),and very deep (greater than 90 cm). As arule, the water intake is low in black soils,particularly in soils of granitic origin as inBellary. The clay is montmorillonitic, and thesoils have high swelling and shrinkage. Theycrack heavily. They are also easily dispersedand therefore highly erodable. The underly-ing murrum is variable; at Bellary it is cal-careous and impermeable; at Sholapur, In-dore, and Akola, it is highly permeable beingof trap origin. The soils are generally defici-ent in nitrogen, and those of granitic originalso in phosphorus.
The_^oils of Bellary are calcareousthroughout the profile, free CaCO3 varyingfrom 10 to 15% in the surface to well over40% in the lowest horizon. Because of lowinfiltration ( ~ 0.1 cm/ha), salt accumulates
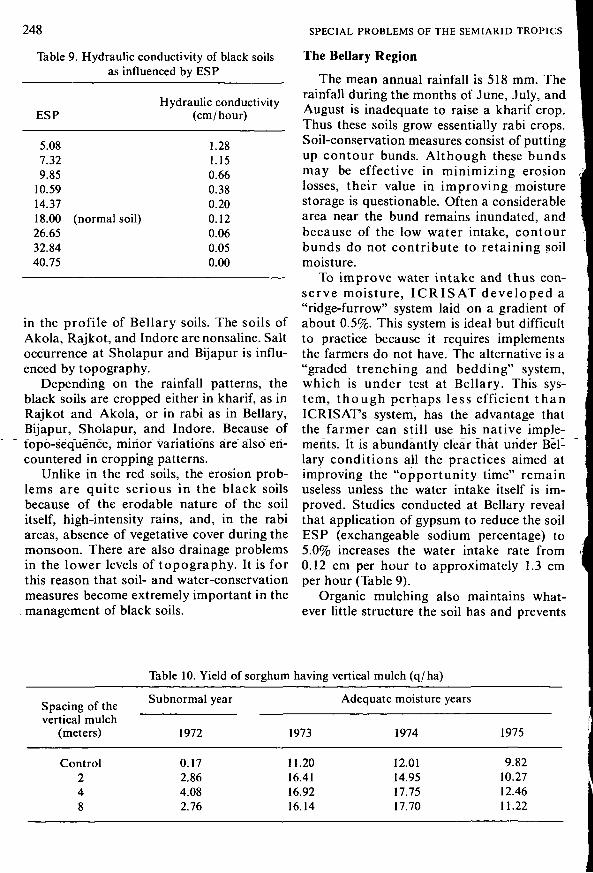
248 SPECIAL PROBLEMS OF THE SEMIARID TROPICS
Table 9. Hydraulic conductivity of black soilsas influenced by ESP
ESP
5.087.329.85
10.5914.3718.00 (normal soil)26.6532.8440.75
Hydraulic conductivity(cm/hour)
1.281.150.660.380.200.120.060.050.00
in the profile of Bellary soils. The soils ofAkola, Rajkot, and Indore are nonsaline. Saltoccurrence at Sholapur and Bijapur is influ-enced by topography.
Depending on the rainfall patterns, theblack soils are cropped either in kharif, as inRajkot and Akola, or in rabi as in Bellary,Bijapur, Sholapur, and Indore. Because oftopo-sequënce, minor variations are" also en-countered in cropping patterns.
Unlike in the red soils, the erosion prob-lems are quite serious in the black soilsbecause of the erodable nature of the soilitself, high-intensity rains, and, in the rabiareas, absence of vegetative cover during themonsoon. There are also drainage problemsin the lower levels of topography. It is forthis reason that soil- and water-conservationmeasures become extremely important in themanagement of black soils.
The Bellary Region
The mean annual rainfall is 518 mm. Therainfall during the months of June, July, andAugust is inadequate to raise a kharif crop.Thus these soils grow essentially rabi crops.Soil-conservation measures consist of puttingup contour bunds. Although these bundsmay be effective in minimizing erosionlosses, their value in improving moisturestorage is questionable. Often a considerablearea near the bund remains inundated, andbecause of the low water intake, contourbunds do not contribute to retaining soilmoisture.
To improve water intake and thus con-serve moisture, ICRISAT developed a"ridge-furrow" system laid on a gradient ofabout 0.5%. This system is ideal but difficultto practice because it requires implementsthe farmers do not have. The alternative is a"graded trenching and bedding" system,which is under test at Bellary. This sys-tem, though perhaps less efficient thanICRISAPs system, has the advantage thatthe farmer can still use his native imple-ments. It is abundantly clear that under Bel-lary conditions all the practices aimed atimproving the "opportunity time" remainuseless unless the water intake itself is im-proved. Studies conducted at Bellary revealthat application of gypsum to reduce the soilESP (exchangeable sodium percentage) to5.0% increases the water intake rate from0.12 cm per hour to approximately 1.3 cmper hour (Table 9).
Organic mulching also maintains what-ever little structure the soil has and prevents
Table 10. Yield of sorghum having vertical mulch (q/ha)
Spacing of the Subnormal year Adequate moisture years
vertical mulch(meters)
Control248
1972
0.172.864.082.76
1973
11.2016.4116.9216.14
1974
12.0114.9517.7517.70
1975
9.8210.2712.4611.22

KRISHNAMOORTHY 249
its deterioration by protecting it from thebeating action of rain. Vertical mulching hasbeen shown to be effective, particularly inyears of subnormal rainfall (Table 10).
Vertical mulching consists of diggingtrenches 15 to 20 cm wide and 30 to 45 cmdeep and loosely packing them with sorghumstalks so that they protrude 10 to 15 cmabove the ground level. Vertical mulching at4-meter intervals is most effective.
Improving soil fertility in the rabi blacksoils of Bellary region poses several prob-lems, since the crops are grown practicallyafter the cessation of the monsoon. Hence,to improve fertilizer efficiency, it is necessaryto advance the sowing of the rabi crops fromthe traditional October to as early as possiblein September. This practice results in twoadvantages. First, the crops benefit from oneor two showers before they become entirelydependent upon the stored moisture. Sec-ond, the one to two showers received duringthe early stages improve the uptake of nutri-ents. Data on sorghum are given in Table 11.
Recent studies indicate that phosphatecarriers such as ammonium phosphate aremuch more effective sources of phosphorusthan is superphosphate. The problem ofbuilding up soil phosphorus remains un-solved. Any phosphorus applied is washeddown the cracks, along with the soil by therains in the next season.
There are some indications, still to beproven, that nitrates are preferable to eitherammonia or urea.
Aberrant weather is extremely common.Practices available to overcome aberrantweather consist of changing from grain sor-ghum to fodder sorghum, and from sorghumto hardy crops such as safflower and chick-pea; and adjustment of the plant populationdepending upon the October rains and themoisture storage. Examples of crops foundsuitable for adequate (20 cm or more) andlimited (15 to 20 cm) stored moisture at Bel-lary are given in Table 12.
Starting with a plant population densityof 105/ha sown in the month of September,the full population density of sorghum is re-tained when there are at least 2 rains in Oc-tober and when the rainfall amounts to 10
Table 11. Effect of sowing dates on theyield of sorghum (M 35-1)
Yield (q/ha)
Year September October
197319741975
34.4410.7416.50
17.322.407.40
cm. If the rainfall in October is 5 cm, everythird row is bladed and the population den-sity is reduced to two-thirds; if the Octoberrains are 3 cm or less, only half the popula-tion density is retained.
Collection and storage of runoff pose noproblem since the seepage losses are verysmall. Utilization of the runoff needs to beworked out in detail (Table 13). It is clearthat minimal irrigation should be given onlyafter October rains and before the soils beginto crack. It is also clear that a single applica-tion over a large area is preferable to re-peated applications of water in a small area.
The Sholapur Region
The region receives a mean annual rain-fall of 742 mm. Rainfall is bimodal having a
Table 12. Crop and varietal choice fordifferent moisture conditions
Moisturecondition
Adequate
Limited
Crop
Sorghum
Sorghum
Safflower
Chickpea
Dolichos lablab
Variety
CSV7RM 35-136A X 148CSH-2CSH-37-13-3A-300A-lN-52, N-59CO-7
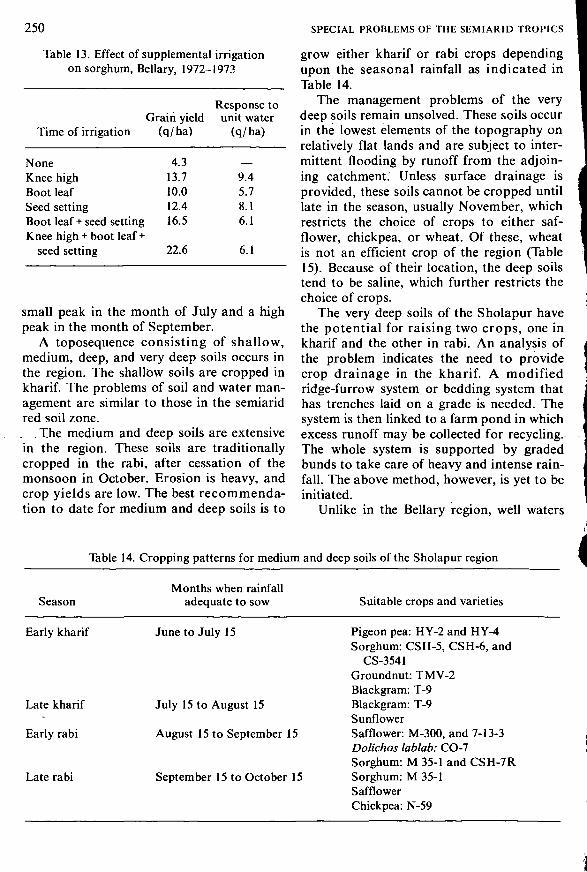
250 SPECIAL PROBLEMS OF THE SEMIARID TROPICS
Table 13. Effect of supplemental irrigationon sorghum, Bellary, 1972-1973
Time of irrigation
NoneKnee highBoot leafSeed settingBoot leaf + seed settingKnee high + boot leaf +
seed setting
Grain yield(q/ha)
4.313.710.012.416.5
22.6
Response tounit water
(q/ha)
9.45.78.16.1
6.1
small peak in the month of July and a highpeak in the month of September.
A toposequence consisting of shallow,medium, deep, and very deep soils occurs inthe region. The shallow soils are cropped inkharif. The problems of soil and water man-agement are similar to those in the semiaridred soil zone.
The medium and deep soils are extensivein the region. These soils are traditionallycropped in the rabi, after cessation of themonsoon in October. Erosion is heavy, andcrop yields are low. The best recommenda-tion to date for medium and deep soils is to
grow either kharif or rabi crops dependingupon the seasonal rainfall as indicated inTable 14.
The management problems of the verydeep soils remain unsolved. These soils occurin the lowest elements of the topography onrelatively flat lands and are subject to inter-mittent flooding by runoff from the adjoin-ing catchment. Unless surface drainage isprovided, these soils cannot be cropped untillate in the season, usually November, whichrestricts the choice of crops to either saf-flower, chickpea, or wheat. Of these, wheatis not an efficient crop of the region (Table15). Because of their location, the deep soilstend to be saline, which further restricts thechoice of crops.
The very deep soils of the Sholapur havethe potential for raising two crops, one inkharif and the other in rabi. An analysis ofthe problem indicates the need to providecrop drainage in the kharif. A modifiedridge-furrow system or bedding system thathas trenches laid on a grade is needed. Thesystem is then linked to a farm pond in whichexcess runoff may be collected for recycling.-The whole system is supported by gradedbunds to take care of heavy and intense rain-fall. The above method, however, is yet to beinitiated.
Unlike in the Bellary region, well waters
Table 14. Cropping patterns for medium and deep soils of the Sholapur region
SeasonMonths when rainfall
adequate to sow Suitable crops and varieties
Early kharif
Late kharif
Early rabi
Late rabi
June to July 15
July 15 to August 15
August 15 to September 15
September 15 to October 15
Pigeon pea: HY-2 and HY-4Sorghum: CSH-5, CSH-6, and
CS-3541Groundnut: TMV-2Blackgram: T-9Blackgram: T-9SunflowerSafflower: M-300, and 7-13-3Dolichos lablab: CO-7Sorghum: M 35-1 and CSH-7RSorghum: M 35-1SafflowerChickpea: N-59
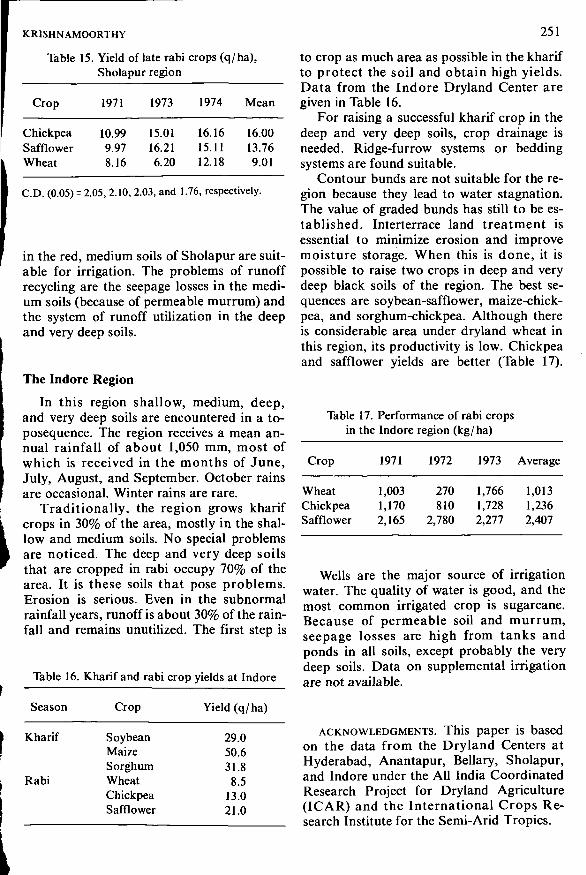
KRISHNAMOORTHY
Table 15.
Crop
ChickpeaSafflowerWheat
Yield of late rabiSholapur region
1971
10.999.978.16
1973
15.0116.216.20
crops (q/ha),
1974
16.1615.1112.18
Mean
16.0013.769.01
CD. (0.05) = 2.05, 2.10, 2.03, and 1.76, respectively.
in the red, medium soils of Sholapur are suit-able for irrigation. The problems of runoffrecycling are the seepage losses in the medi-um soils (because of permeable murrum) andthe system of runoff utilization in the deepand very deep soils.
The Indore Region
In this region shallow, medium, deep,and very deep soils are encountered in a to-posequence. The region receives a mean an-nual rainfall of about 1,050 mm, most ofwhich is received in the months of June,July, August, and September. October rainsare occasional. Winter rains are rare.
Traditionally, the region grows kharifcrops in 30% of the area, mostly in the shal-low and medium soils. No special problemsare noticed. The deep and very deep soilsthat are cropped in rabi occupy 70% of thearea. It is these soils that pose problems.Erosion is serious. Even in the subnormalrainfall years, runoff is about 30% of the rain-fall and remains unutilized. The first step is
Table 16. Kharif and rabi crop yields at Indore
Season
Kharif
Rabi
Crop
SoybeanMaizeSorghumWheatChickpeaSafflower
Yield (q/ha)
29.050.631.8
8.513.021.0
251
to crop as much area as possible in the kharifto protect the soil and obtain high yields.Data from the Indore Dryland Center aregiven in Table 16.
For raising a successful kharif crop in thedeep and very deep soils, crop drainage isneeded. Ridge-furrow systems or beddingsystems are found suitable.
Contour bunds are not suitable for the re-gion because they lead to water stagnation.The value of graded bunds has still to be es-tablished. Interterrace land treatment isessential to minimize erosion and improvemoisture storage. When this is done, it ispossible to raise two crops in deep and verydeep black soils of the region. The best se-quences are soybean-safflower, maize-chick-pea, and sorghum-chickpea. Although thereis considerable area under dryland wheat inthis region, its productivity is low. Chickpeaand safflower yields are better (Table 17).
Tablein
Crop
WheatChickpeaSafflower
17.the
Performance of rabi cropsIndore region (kg/ha)
1971
1,0031,1702,165
1972 1973
270 1,766810 1,728
2,780 2,277
Average
1,0131,2362,407
Wells are the major source of irrigationwater. The quality of water is good, and themost common irrigated crop is sugarcane.Because of permeable soil and murrum,seepage losses are high from tanks andponds in all soils, except probably the verydeep soils. Data on supplemental irrigationare not available.
ACKNOWLEDGMENTS. This paper is basedon the data from the Dryland Centers atHyderabad, Anantapur, Bellary, Sholapur,and Indore under the All India CoordinatedResearch Project for Dryland Agriculture(ICAR) and the International Crops Re-search Institute for the Semi-Arid Tropics.
APPENDIXES:PROCEEDINGS
OF THE SEMINAR
Appendix 1. Welcoming Address
RALPH W. CUMMINGS
Director, International Crops Research Institute for the Semi-Arid TropicsHyderabad, India
I Mr. Minister, Chairman, Ladies,land Gentlemen:
I am pleased to welcome you to Hydera-| bad on behalf of the International Crops Re-search Institute for the Semi-Arid Tropics.We had considerable reservations initiallyabout hosting this seminar at ICRISAT,which was to be planned with the Universityof Hawaii, the Consortium of U.S. univer-sities who are concerned with USAID-sup-ported programs in tropical soil science, andthe USAID. We welcomed very much theidea of the seminar, but we recognized thatat this stage of the Institute's developmentour facilities were quite limited for hostingthe seminar.
You can see that the room we have hereis full. We had to limit the number of parti-cipants. There are many others who wouldhave liked to participate in this meeting andwhom we would have liked to have partici-pate, but the limitation of space and facili-ties just did not permit a larger group. Butthe practice of moving ahead with our pro-gram development and with consultationwith our professional colleagues around theworld is something of a hallmark of our in-stitution. The Institute was formerly consti-tuted in 1972, on July 5 at the first meeting ofthe Board of Trustees. We got access to ourland site on April 22, and when the Trustees
first met, we had our first crops in the ground.We had our scientist, Bert Krantz, on loca-tion at that time. But we began to assembleour staff and develop our program of re-search at headquarters. Immediately wealso began our series of consultations withour colleagues with whom we expected towork out programs of cooperation aroundthe world. Recognizing that if we were goingto serve the segment of the agriculture inthe rain-fed semiarid tropics, a segment ofagriculture that had been left behind, weneeded from the outset to consult with ourcolleagues who are working with those prob-lems in the semiarid tropics, seek their coun-sel, and take into account their experience,as we were developing the program.
We have had several seminars and work-shops in the interim, and we are now in theprocess of trying to develop, consolidate,and work out appropriate working relation-ships with the organizations in all of thenations with whom we hope to develop co-operation and whom we hope to serve in thefuture. And it was in this spirit, and with theexpectation that you would appreciate thelimitations in our facilities and be tolerantof us, that we accepted with gladness theresponsibility of attempting to work with youin hosting this seminar. We welcome youmost heartily. We realize that if we are goingto serve the people of these regions, it is go-
255

256 PROCEEDINGS OF THE SEMIN/
ing to be essential that we understand morecompletely the resource base with which weare going to have to work and for which weare going to have to find ways of developingimprovements over the years. And obviouslythe soil base and the climatic conditions un-der which the soils are developed and inwhich the crops are grown on the soil mustbe understood in their various complexitiesif we are going to really serve these regionsadequately.
With the steering committee represent-ing the different agencies who are sponsor-ing this seminar, a very careful program hasbeen planned, and I am delighted to see thatpractically everyone, with very few excep-tions, who has accepted to participate in thisconference, has found it possible to comehere and to be present at the opening of this
session. I am sure that all of you will be paticipating most actively throughout,hope that as you see, in the course of tljweek, the present state of our facilities arthe program we have under way you wilshare with us your thoughts and your su|gestions about how we might improve ouprogram and our approach. We will watclwith very great interest and concern and at]tention the observations that will emerg|from this conference. Looking at the soil resources of the areas with which we are conlcerned, how might we go about managingthese resources or developing programs foqmanaging these resources more effectivelyin the years ahead?
We welcome you most heartily. We hopethat you will be reasonably comfortablewhile you are here and that the conference|will be most productive.

Appendix 2. Inaugural Address
THE HONORABLE SHRI SHAH NAWAZ KHAN
Union Minister of State for Agriculture and Irrigation and WAQFSGovernment of India
•Dr. Cummings, Distinguished Scientists,|Ladies, and Gentlemen:
At the outset, I wish to convey to you theIgood wishes of my senior colleague, ShrilJagjivan Ram, Union Minister for Agricul-I ture and Irrigation, who unfortunately is un-able to be here today because he has to be
I in Delhi for important Parliamentary work.He has asked me to convey to you his apolo-
J gies and also good wishes.I am happy to have the privilege of be-
ing with you today to inaugurate this inter-national seminar on problems relating to soilsurvey and land-use planning. I am particu-larly happy that so many distinguished soilscientists from different parts of the worldhave gathered together here. On behalf ofthe Government of India, I would like to ex-tend a very warm welcome to all of you whohave come here from other countries.
We are always happy to receive sugges-tions from all parts of the world and to ex-change our experience with others. We arealso happy that ICRISAT, within a span of4 years, has made a good start in improvingthe yield potential of sorghum, pearl millet,chickpea, and pigeon pea. More recently,groundnut has also been added to the scien-tific mandate of this Institute. What is evenmore important is the integration of cropimprovement work with research on soil and
water management. In most of the unirri-gated areas, a crop variety alone cannotwork wonders. What is important is to lookat the problems of soil and water conserva-tion in their totality and fit in a suitable cropand crop variety according to the moisture-holding capacity of the soil and the inter-spell duration of rainfall. Some very goodwork has been done in India on soil-crop-weather relationships; I hope you will havean opportunity to study it.
We in India have serious problems of soil-fertility management. At the suggestion ofShri Jagjivan Ram, Union Minister for Agri-culture and Irrigation, the Indian Council ofAgricultural Research therefore is planningto initiate a program of training Primary SoilHealth Workers. We feel that this is particu-larly important in view of the large irrigationprojects we are taking up. Prime MinisterShrimati Indira Gandhi has recently an-nounced, as part of a 20-Point EconomicProgram, the extension of the irrigated areaby another 5 million hectares during ourFifth Plan period. She has also proposed anational program for scientific ground-waterutilization. This brings me to the problemsof waterlogging, salinity, and alkalinity,which have appeared in some of the old irri-gated areas.
During the last 20 years, several reser-voirs were constructed to store water. At
257

258 PROCEEDINGS OF THE SEMIN/*
that time of construction, it was feared (andthose fears later were proven true) that un-less soil conservation measures were taken,these reservoirs may get silted resulting inlower storage capacity. But before any soilconservation measure could be taken, weneeded to know about the characteristics ofthe catchment. Hence, the Soil Conserva-tion Wing of the Department of Agricultureof the Government of India was given theresponsibility of surveying the soil in the riv-er catchment areas, during the Second Five-year Plan period. The organization of thesoil survey was strengthened by the head-quarters at the Indian Agricultural ResearchInstitute and by the four regional stations inDelhi (Northern Region), Calcutta (EasternRegion), Nagpur (Central Region), andBangalore (Southern Region). By the end of1971, 90 million hectares covering about27% of the country's area were covered byreconnaissance and detailed survey, and 16million hectares were covered by detailedsurvey. A total of Rs. 8 crores has been al-located for the Fifth Plan period, in additionto the allocation for soil survey in the irriga-tion project areas. It is hoped that a soil mapof India at 1:1 m (million) scale will be avail-able within the next 10 years. We are alsostrengthening the State organization for gen-eral survey and for development programs.
We are aware that to save time in soilsurvey, we need to have aerial photographs.These photographs are now available for amajor part of the country, and the SurveyorGeneral of India can now provide aerial pho-tographs of any particular area on request.To train the people in the use of aerial photo-graphs, an Aerial Photo Interpretation In-stitute has been established at Dehra Dun,which not only imparts training in basic pho-to-grammetry, but also trains the personnelworking in the Departments of Soil Survey,Hydrology, and Forestry.
Collaborative projects in the field of re-mote sensing of agricultural resources bycarrying out multispectral photographic aeri-al surveys and interpretations have been ini-tiated in the District of Anantapur in thisState of Andhra Pradesh. In this project, theIndian Space Research Organization and
the ICAR are cooperating. The objectiveto prepare a comprehensive agricultural rdsources inventory, crop identification, an|correlation with the data compiled by trDirectorate of Economics and Statistics; tlidentify and locate areas affected by different diseases; and to carry out soil classificaltion and mapping. Preliminary reports folsome parts of this district have already beenreleased. A similar experiment has beerstarted in the Patiala District of Punjab. Iranother pilot project for determining the fea-Jsibility of using multiband imageries for pre-|paring resource inventory, in cooperatiorwith the Space Application Center, Ahmeda-]bad have been undertaken. The studies indi-cate the possibility of preparing resourcelinventory maps from remotely sensed photolimageries. We have also completed rural]engineering surveys in about 8,500 villages Ispread over 24 drought-prone districts. The Imain purpose of these reports was to havedetailed information about the different en-gineering and agricultural problems in the |area.
I am happy to know that you will be dis-cussing in detail the usefulness of these sur-veys to the poor farmers. It has been my ex-perience that many times excellent reportsare prepared by spending huge amounts butseldom used by the planners or the executorsof the program. This may be either becausethe persons responsible for implementationof the programs are not conscious of the im-portance of the soil survey or because theymay find these reports too academic to beof any practical use. I am sure that, as aresult of your discussions, ways and meanswill be found that will have these reportswritten in such a manner that even personswho do not know much about soil sciencecould use them in the planning and imple-mentation of the programs.
I also notice from your program that prob-lems about classification will be discussed.In India, four broad soil groups have beenrecognized for centuries. These are black,red, latérite, and alluvial soils. Every one ofthese soils has its peculiar managementproblem. But even within each of these soilgroups, there are considerable variations.
lAUGURAL ADDRESS 259
example, we have three different typesblack soil, that is, shallow, medium, and
eep, and again management of the deepick soils is much more difficult than man-
iement of shallow soils. I understand thatie classifications used in the United States
lave not given adequate thought to thesellack soils developed under conditions of thelemiarid tropics where periods of excesslains are followed by very dry periods. Verylittle information about the effect of irriga-tion on these different types of soils is avail-ible. I am informed that the present inter-national classification does not give muchimportance to the salts in the black soil areas
the semiarid tropics. One of the majorjroblems in our deep black soils, however, isthe development of salinity, specially under
Iflat land topography. Even such simple prac-tices as contour bunding have resulted inI more problems in these soils. About 25 broad
soils groups are now recognized in India.But it is not always possible to use this infor-mation while planning on a microlevel. De-tailed soil survey may take considerabletime, and in the context of present-day agri-culture, it is not possible for us to wait thatlong. I would, therefore, urge this group todiscuss in detail how the information alreadyavailable could be applied at the microlevel.
I am happy to see from your program thaton the last day you will have a plenary ses-sion to formulate recommendations of soiland land data needed for national planning.I look forward to receiving these recom-mendations, and I assure you on behalf ofmy Ministry that we will take immediatesteps to implement any important recom-mendation that will emerge from thisseminar.
I wish the seminar all success.

Appendix 3. Keynote Address
WILLIAM P. PANTON
International Bank for Reconstruction and DevelopmentWashington, D.C., U.S.A.
Honorable Minister, Ladies,and Gentlemen:
From the moment I first learned of the in-tention to hold this seminar I have been anenthusiastic supporter of the proposal, and Iam therefore most pleased to see that pro-posal now become a reality.
I am sure I am speaking for all when 1commend the Governing Board of ICRISAT,the USAID, the University of Hawaii, andthe Consortium on Tropical Soils for theirinitiative in sponsoring such an innovativemeeting.
Innovative because it brings together rep-resentatives from two disciplines—soil sci-ence and planning—who are so vital to effec-tive programming of agricultural develop-ment in the tropics, but who generally workso far apart and seldom come together, evenin their working lives, much less at inter-national seminars such as this.
I feel sure that this seminar will revealthat these two groups, one of which usuallyworks in the higher reaches of the adminis-trative and planning firmament and theother at the grass roots or back-room level,have much in common and that each hassomething of value to learn from the other.And I say this with some conviction, becauseI have worked for many years in each ofthese fields.
The physical remoteness of the twolgroups is undoubtedly one of the impedi-|ments to communication between them, inspite of their common interests, upon which |I will say more in a few minutes.
But incomprehension, resulting from a ]language barrier, can be an even greater |hinderance to the development of the dia-logue and the closer understanding that arenecessary for effective planning and imple-mentation of agricultural development pro-grams. And I am not referring to the prob-lems of communication between persons ofdifferent mother-tongues or of dialects, butof jargon—of technical jargon.
Now what exactly is jargon? My diction-ary describes it rather slightingly as gibber-ish, or the twittering of birds! But more tothe point, it defines jargon as a "mode ofspeech full of unfamiliar terms."
And I think that summarizes rather wellthe situation that often exists when a soilscientist and a planner try to communicateeither orally or, worse still, in writing, whereit is impossible to ask a person what hemeans by a certain word.
Let us face it—our disciplines are amongthe worst in their addiction to long and pecu-liar words and phrases. How many plannerscan honestly say they know what a podzol is,much less a dystric podzoluvisol, and wheth-er these soils—which is what they are—are
260
CEYNOTE ADDRESS 261
pod or bad, fertile or infertile? Likewise,jiow. many soil scientists can claim an under-standing of marginal investment propensityV even know with any exactitude what agrowth pole is in physical-planning parlance?
The soil science terms mean little or noth-ing to the uninitiated; the planners' phrases,
•even those that are commonplace on televi-sion, often convey to the unacquainted a dif-ferent meaning from what is intended.
The lesson we should draw from these ex-amples and apply to our meeting is to curblour tendencies towards blinding one anoth-er with the terminologies of our respectivesciences, and instead to strive toward sim-
I plicity of expression.I understand that the basic objectives of
this seminar, besides increasing communi-cation between scientists and planners, areto bring out the practical usefulness of soilclassification in interrelating work done indifferent tropical areas and in physical andeconomic planning, especially in respect toagricultural sector programs. These objec-tives are highly commendable; at the same,time they are not very original, because theapplication of soil science towards the at-tainment of these objectives is already wellunderstood and practiced in many parts ofthe earth.
Unfortunately, however, this understand-ing is far from universal, and it is interestingto consider why this is so. In my view, thereare two basic reasons, both historic.
First, the study of soil is a new science, ayoung science, and a polyglot science at that.So far as the tropics are concerned, I wouldterm it a post-World War II science. Its prac-titioners are few and are concentrated in asmall number of countries, mostly those withtemperate climes. Its professional cadre isyoung as well as small, and in consequenceit has not yet established a secure or finalniche in scientific circles or in the institution-al structure of government and society. It isstill seeking its way, establishing its founda-tions, and gaining acceptability in fits andstarts; and the pattern, in terms of applica-tion, is in consequence very uneven.
Second, soil science is coming of age at atime of rapid sociopolitical change on the
world scene, and a feature of this changingscene is the increasing extent to which gov-ernments are taking an initiative in directlyfostering and controlling developments. Thisinitiative, which is also largely a post-WorldWar II phenomenon, is in marked contrast tothe preceding period, when laissez-faire atti-tudes towards development predominated.
In the absence of centralized governmentinitiative or control, profitable operation orimprovement of existing agricultural landsor new agricultural land development is theresponsibility of individuals or privategroups—if they succeed, the satisfaction andreward belong to them; if they fail, disap-pointment and loss are also theirs.
But when a government takes over thisdevelopment responsibility, which is in-creasingly the case in tropical, developingcountries, success is attributed by each in-dividual beneficiary to himself, while failuretends to be blamed on the government.
And the record shows that inadequateknowledge of the soil or insufficient under-standing of its capability, or both, are fre-quent causes of failure, whether throughpoor choice of site, inappropriate selectionof crop or cropping pattern, or inadequatemanagement.
Why do these things happen? If simplefarmers can cultivate their own land profit-ably, one may ask, why cannot a governmentagency, which has superior financial andtechnical resources, do likewise?
Some of the reasons are obvious—so ob-vious that I do not intend to dwell on them.But a few, which may not be so obvious, areof direct relevance to this seminar.
For one thing, as every soil scientistknows well, no two soils are ever alike. Theslightest change in only one of a wide rangeof factors, such as parent material, slope, ordrainage, or characteristics such as pH, or-ganic matter content, or soil consistency,can profoundly affect the suitability andhence the yield potentiality of the soil for aparticular crop.
But these important differences, whichcan be easily overlooked, occasionally evenby skilled and experienced soil surveyors inthe course of detailed surveys, are well ap-
262 PROCEEDINGS OF THE SEMINAI
preciated, although not necessarily under-stood, by the farmer who has long familiaritywith his land. In the case of those whose an-cestors have farmed the same land beforethem, I suspect that much of this awarenessis subconscious or conditioned by familycustom, habit, or superstition. They knowhow to give back to the soil what they havetaken from it.
Is it any wonder therefore that farmers,knowing the variability and unpredictabilityof their land, and with their sound ecologicalknowledge based on experience, are basical-ly conservative and suspicious of innova-tion? They have too much to lose by beingotherwise.
But what about government agencies thatcome in with the best intentions to help, oroccasionally to take over? Why, so often, dothey go astray? It is in large part becausethe people in charge dp not understand thenatural variability of the land in questionand consequently have great difficulty in ac-commodating the factor of variability to theinevitably large scale of their operations.
Put another way, because of the largerscale, the TLC—Tender Loving Care—ele-ment, whether it be of the soil or the plant,is often lost.
So here is a very fundamental area wherethe soil scientist can help, through his exactknowledge of the soil and of the response ofthe plant to changes in the soil, be they na-tural or artificially induced. Admittedly, hisidea of tender loving care may be differentfrom that of the farmer, for after all his fieldof operation is larger, and because he is ascientist, he applies scientific methods.
Essentially, however, he does the samethings as the farmer but in a different way.He first gets to know the peculiarities of hisland, by carrying out a survey, at a degree ofdetail and according to criteria of which heis, or should be, the best judge. He then re-lates his findings about the soil to the crop orcrops that will be grown, or, equally impor-tant, should not be grown if his findings arecontraindicative.
Or if he has reasonable doubts either way,he will be cautious and recommend experi-mentation or a pilot scheme.
But very frequently this judgment is nevelcalled for. Simply because of the lack of spe|cific land classification data and in the ahsence of a competent soil scientist, someondelse with a confidence granted only to thosewho lack the requisite knowledge makes thedecision. Very often it is a politician, or aradministrator, or—dare I say it?—evenplanner, who should know better.
Conducive to this attitude is the fact thatlthere are always plenty of excuses whenlthings go wrong—"no soil survey data werelavailable and a decision had to be made" orl"no professional advice could be found solwe had to make up our own minds." How-1ever, valid as these excuses may be, in reali-1ty, they are often just another way of saying,"We like to gamble, especially with some-one else's money, and professional opinionwould have been too cautious, which couldhave prevented us from going ahead withour pet scheme."
Why do government projects (and bigbusiness projects too) so often go wrongin this way? A few examples may prove in-structive, but it usually boils down to inade-quate project identification or preparation,where the importance of site suitability forcrop (or crop suitability for site) was insuffi-ciently appreciated.
Often, the very rationale for siting a proj-ect or selecting a crop may be at fault. Inrecent years I have seen enough examplesof overemphasis on border security, accessi-bility (present or potential), legalistic avail-ability, national or local crop self-sufficiency,excess processing, transporting or storagecapacity, diversification policy, political orpersonal preference, and occasionally andregrettably examples of just plain briberyand corruption or ineptitude governing thechoice of site or crop to the exclusion of sci-entific evidence concerning ecologie suitabil-ity to convince me of the dangers awaitingthose who do not take the trouble to checkthe natural resource conditions of their sitebefore they proceed with development.
This can result in such absurdities asgrowing moisture-loving crops in drought-prone areas without adequate irrigation,cultivating erosion-inducing crops on exces-
EYNOTE ADDRESS 263
vely steep slopes, planting deep-rootingtops intolerant of high water-table condi-Jons in flood-prone swamplands or next toJaddy fields, or even opening up land forIgriculture, like mountain sides or impossi-lly salt-toxic lands, which no local farmer inlis right mind would consider for the crop inquestion or for any crop.
Of course, a feasibility study is no guaran-tee that mistakes will be avoided, but ex-serience shows that a feasibility study, ifproperly done, is well worth the time andnoney spent and is of fundamental impor-
tance because the scientific basis it offersprovides adequate soil survey and land clas-
sification data and advice, from which sound(criteria for choice of site or crop can be(determined.
The World Bank, in common with otherI international and bilateral assistance agen-Icies, is becoming increasingly interested inseeing that these proven techniques for as-sessing the suitability of land for specific
[development projects are applied in theplanning process.
This is evidenced in recent years by theBank's cosponsorship, with the FAO andUNDP, of the Consultative Group on In-ternational Agricultural Research, whichthis year is contributing about 65 milliondollars in support of international agricul-tural research at 12 institutes, including ourhost institute here in Hyderabad.
The transfer of knowledge through link-ages with national and regional researchinstitutions throughout the world is an im-portant objective of the work at these insti-tutes, and fundamental to the success of thiswork is the strengthening of the soils re-search network, which will be discussed atour Session 5.
The Bank is complementing this interna-tional effort with support for national agri-cultural research that has similar objectivesof assisting the transfer of knowledge (Ma-laysia, Indonesia); it is also supportingnational mapping projects that have the ob-jective of accelerating the progress of inte-grated land-resource surveys (Indonesia).
In the processing of all Bank loans andcredits, evidence of the compatibility of a
project with the soil and other environmentalcircumstances of the area where it will besited is mandatory.
Remarkable strides have been made insurveying and classifying world soil re-sources, particularly those of the tropics, inthe last two decades. More extensive andlarger-scale base map coverage, improve-ments in remote sensing aides, includingfalse-color and infra-red aerial photography,and most recently the application of satellitetechnology to earth-resources inventorywork have proved particularly useful.
The adoption of a standardized nomen-clature and the gradual acceptance of onenatural or taxonomie system of soil classifi-cation have enormously facilitated the taskof correlating soils on a global scale and ofcomparing their suitability for specifiedcrops, their productivities, and their land-utilization potentials or capabilities.
In other words, the theoretical basis forsoil classification and the techniques andmethodology of soil survey are now wellunderstood. The stage is set for applying thisknowledge to the solution of practical prob-lems of site selection and crop choice—oftransferring the knowledge from site to site.
Undoubtedly, the constraint at this timecenters around the dearth of accurate soiland other relevant land-resource inventoryand the relatively small number of scientistsable to extend the survey coverage, carry outtrials, and make the necessary comparativejudgments whereby each country can learnfrom the successes and failures of anotherrather than duplicate the work, learn thehard way, or repeat the same mistakes.
From what I have said so far, some of youmay feel that I am overemphasizing the im-portance of the soil scientist in the decision-making or planning process. If so, let memake amends by addressing myself to thewider problems of national and regionaldevelopment-policy formulation and plan-ning and by viewing the soil scientist's con-tribution in that context.
It seems that the more we learn aboutplanning, the more we discover that no oneprofession has all the answers. Taken to ex-tremes, we might say that anyone can be a
264 PROCEEDINGS OF THE SEM1N/
planner, so long as he or she has commonsense, for planning is simply forward-lookingcommon sense.
But let us not go to extremes. I think it issufficient for us to recognize that there aremany types of planners—economic, fiscal,physical, urban, agricultural, manpower, in-frastructural, environmental, and so on.
I hope that we have at least one repre-sentative from each of these disciplines hereat this seminar to ensure a balanced discus-sion of the relevance of soil survey and clas-sification to the several aspects of planning.
We now know that effective national orregional policy-making and planning calls forcontributions from these several specialists,which can best be provided through multi-disciplinary teams responsible to a centralagency of government, and it is at this levelthat the soil scientist has a major role to playand a contribution to make which is not con-fined to planning in the agricultural sectoralone.
After all, the planners' grist is informa-tion—data—facts, about the three basic tan-gibles for development, namely, human, fi-nancial, and natural resources.
The soil scientist deals with the last ofthese resources, and his study of the soil em-braces the factors that condition the charac-ter of the soil, namely, climate, parent ma-terial, topography, vegetation, and time.
He is therefore particularly well equippedfor evaluating the potentials of land and itsresources through training and experienceand through his ability to visualize in threedimensions what he interprets from two di-mensional maps, which are the main vehi-cles for presenting land-resources data.
Which brings me to another point. Land-resource information, whether it concernssoil, mineral, vegetation, or water resources,or natural topography or climate, must besupplemented for planning purposes by in-formation about the present use of land, andit seems to me that the dearth of up-to-dateinformation on actual land use and owner-ship status is one of the greatest impedi-ments to comprehensive land-use planningin the tropics at this time.
The current trend towards more central-
ized planning and continuing improvement!in planning technique is likely to confirm thildeficiency, and I will be interested in dislcussing this problem with other planner^during our seminar.
There is a real danger, of course, that a\\this information—all these facts, figures, ancmaps that gradually accumulate as surveys,|census, experiments, and feasibility studiesare completed—can confuse rather than en-|lighten the conscientious planner.
Irrelevant data will only clog up the sys-ltern, and this can be worse than having noldata at all, which leads me to make an ap-|peal for relevance.
This appeal is directed particularly at the Isuppliers of the facts, in our case the soilscientists, who, if they believe that theirwork is relevant outside their own special-ized field, must take greater pains than hasusually been the case in the past to presenttheir results in a readily understandableform.
But my appeal is also directed toward theplanners, for they have a duty to expresstheir needs to the soil scientists. This canbe quite a problem, which can best be over-come if the planners will take a little effort tofind out something about soils. My adviceto them is to get themselves out into the fieldas often as they can, if possible with an artic-ulate soil scientist or otherwise with a gen-eral agriculturist, a farmer, or an ecologist,and then ask questions without embarrass-ment and press them for answers. And listen.
They should also learn how to read maps,visualize landscape in three dimensions froma contour pattern, and orient themselvesin the field. It is surprising in my experiencehow many people, even quite senior in plan-ning circles, have difficulty in doing thesesimple things.
They should also gain an understandingof the land-capability or soil-suitability clas-sification system in local usage. These areusually simple interpretations of the muchmore complex soil-classification systems,which fortunately, in view of their strange-ness and complexity, can generally be ig-nored by the nonspecialist. For purposes ofnational, sector, or regional planning, the
IEYNOTE ADDRESS 265
lore general or broader-scale information; usually the most relevant.
Disproportionate allocation of scarce staffhighly detailed surveys and classification
Jxercises of relatively small areas is unlikely|o be very cost-effective in a national-devel->pment context, except when related toIpecific research problems whose solutions^ e likely to have immediate practical impact.
A broad-scale national inventory of soilsjr of any other natural resource deservesligh priority in any country that has made astrong committment to central or regionalplanning, for the sensible identification of
Ipriority areas within a national boundary is•only possible when the facts are available. InJthe case of soils and the assessment of their(capabilities, this requires a survey coverageJ of a uniform scale and accuracy for all pres-lent or potential agricultural lands. This type[of inventory will also greatly facilitate thetransfer of information and technology and
will aid the development of cooperative in-ternational research programs betweencountries, which are among the basic objec-tives of this seminar.
Judging from the titles of the papers tobe presented at this seminar and knowingmany of the contributors as I do, I am con-fident that we shall all benefit substantiallyfrom our discussions in the next 4 days. AndI am also most optimistic that many of thelessons we shall learn can be immediatelyapplied with profit to the development plan-ning process.
Since national representation at thisseminar includes one soil scientist and oneplanner from each country, I would like toclose by expressing the hope that the dia-logues that will be established between usduring the next few days will continue longafter the seminar has ended. If they do, thisseminar will have succeeded.
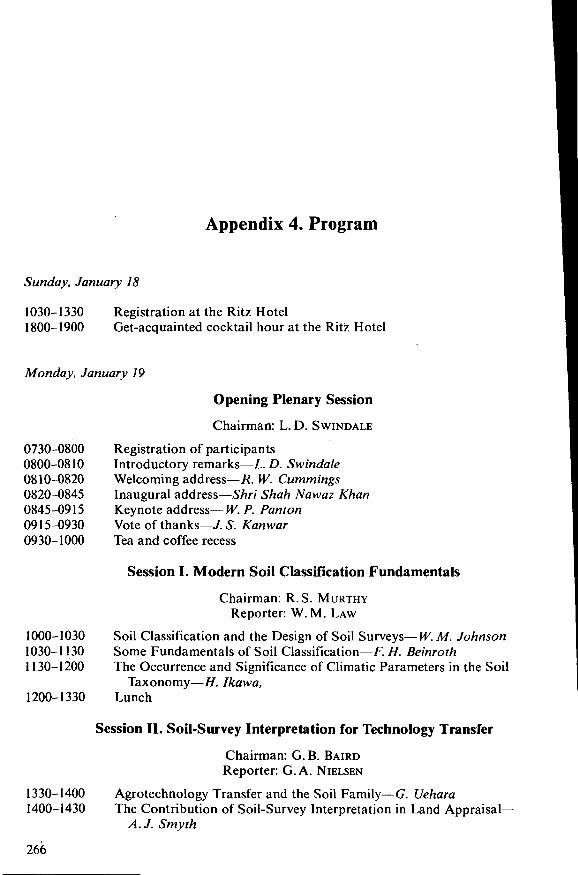
Appendix 4. Program
Sunday, January 18
1030-1330 Registration at the Ritz Hotel1800-1900 Get-acquainted cocktail hour at the Ritz Hotel
Monday, January 19
Opening Plenary Session
Chairman: L. D. SWINDALE
0730-0800 Registration of participants0800-0810 Introductory remarks—L. D. Swindale0810-0820 Welcoming address—R. W. Cummings0820-0845 Inaugural address—Shri Shah Nawaz Khan0845-0915 Keynote address— W. P. Panton0915-0930 Vote of thanks—J. S. Kanwar0930-1000 Tea and coffee recess
Session I. Modern Soil Classification Fundamentals
Chairman: R.S. MURTHYReporter: W. M. LAW
1000-1030 Soil Classification and the Design of Soil Surveys— W. M. Johnson1030-1130 Some Fundamentals of Soil Classification—F. H. Beinroth1130-1200 The Occurrence and Significance of Climatic Parameters in the Soil
Taxonomy—H. Ikawa,1200-1330 Lunch
Session II. Soil-Survey Interpretation for Technology Transfer
Chairman: G. B. BAIRDReporter: G.A. NIELSEN
1330-1400 Agrotechnology Transfer and the Soil Family—G. Uehara1400-1430 The Contribution of Soil-Survey Interpretation in Land Appraisal—
A.J. Smyth
266
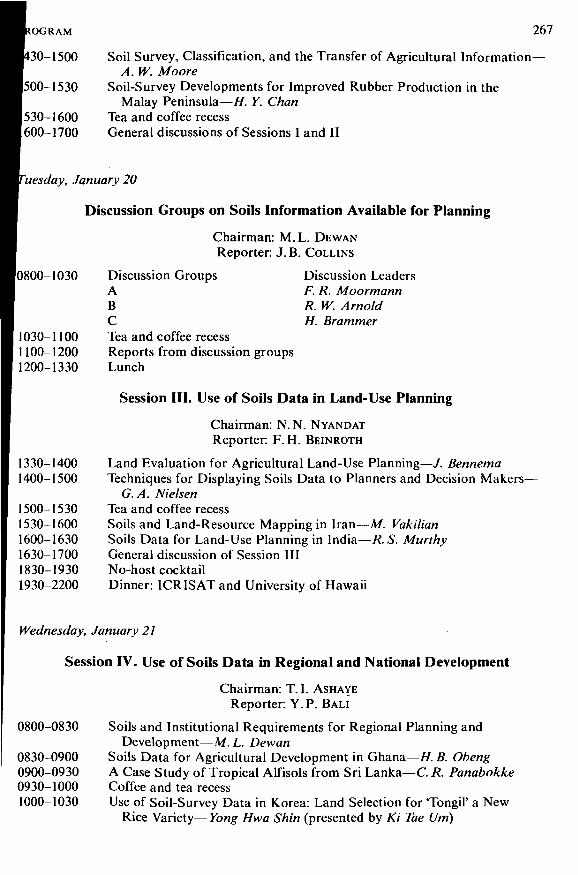
*OGRAM 267
130-1500 Soil Survey, Classification, and the Transfer of Agricultural Information—A. W. Moore
|500-1530 Soil-Survey Developments for Improved Rubber Production in theMalay Peninsula—H. Y. Chan
[530-1600 Tea and coffee recess1600-1700 General discussions of Sessions I and II
Tuesday, January 20
Discussion Groups on Soils Information Available for Planning
Chairman: M.L. DEWANReporter: J. B. COLLINS
|0800-1030 Discussion Groups Discussion LeadersA F. R. MoormannB R. W. ArnoldC H. Brammer
1030-1100 Tea and coffee recess1100-1200 Reports from discussion groups1200-1330 Lunch
Session HI. Use of Soils Data in Land-Use Planning
Chairman: N.N. NYANDATReporter: F. H. BEINROTH
1330-1400 Land Evaluation for Agricultural Land-Use Planning—J. Bennema1400-1500 Techniques for Displaying Soils Data to Planners and Decision Makers-
G. A. Nielsen1500-1530 Tea and coffee recess1530-1600 Soils and Land-Resource Mapping in Iran—M. Vakilian1600-1630 Soils Data for Land-Use Planning in India—R. S. Murthy1630-1700 General discussion of Session III1830-1930 No-host cocktail1930-2200 Dinner: ICRISAT and University of Hawaii
Wednesday, January 21
Session IV. Use of Soils Data in Regional and National Development
Chairman: T.I. ASHAYEReporter: Y. P. BALI
0800-0830 Soils and Institutional Requirements for Regional Planning andDevelopment—M. L. Dewan
0830-0900 Soils Data for Agricultural Development in Ghana—H. B. Obeng0900-0930 A Case Study of Tropical Alfisols from Sri Lanka—C. R. Panabokke0930-1000 Coffee and tea recess1000-1030 Use of Soil-Survey Data in Korea: Land Selection for Tongil' a New
Rice Variety— Yong Hwa Shin (presented by Ki Tae Urn)
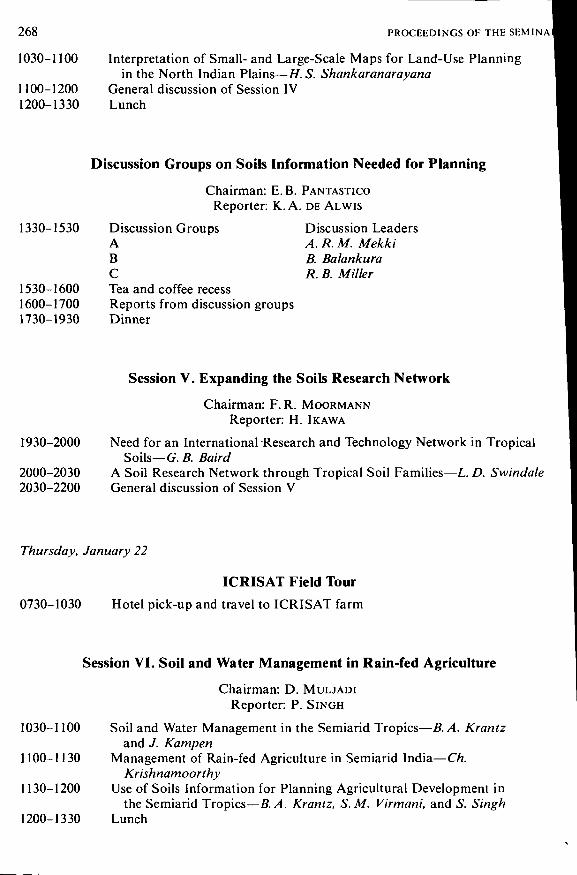
268 PROCEEDINGS OF THE SEMINAR
1030-1100 Interpretation of Small- and Large-Scale Maps for Land-Use Planningin the North Indian Plains—H. S. Shankaranarayana
1100-1200 General discussion of Session IV1200-1330 Lunch
Discussion Groups on Soils Information Needed for Planning
Chairman: E. B. PANTASTICOReporter: K. A. DE ALWIS
1330-1530 Discussion Groups Discussion LeadersA A. R. M. MekkiB B. BalankuraC R. B. Miller
1530-1600 Tea and coffee recess1600-1700 Reports from discussion groups1730-1930 Dinner
Session V. Expanding the Soils Research Network
Chairman: F. R. MOORMANNReporter: H. IKAWA
1930-2000 Need for an International Research and Technology Network in TropicalSoils—G. B. Baird
2000-2030 A Soil Research Network through Tropical Soil Families—L. D. Swindale2030-2200 General discussion of Session V
Thursday, January 22
ICRISAT Field Tour
0730-1030 Hotel pick-up and travel to ICRISAT farm
Session VI. Soil and Water Management in Rain-fed Agriculture
Chairman: D. MULJADIReporter: P. SINGH
1030-1100 Soil and Water Management in the Semiarid Tropics—B. A. Krantzand J. Kampen
1100-1130 Management of Rain-fed Agriculture in Semiarid India—Ch.Krishnamoorthy
1130-1200 Use of Soils Information for Planning Agricultural Development inthe Semiarid Tropics—B.A. Krantz, S.M. Virmani, and S. Singh
1200-1330 Lunch
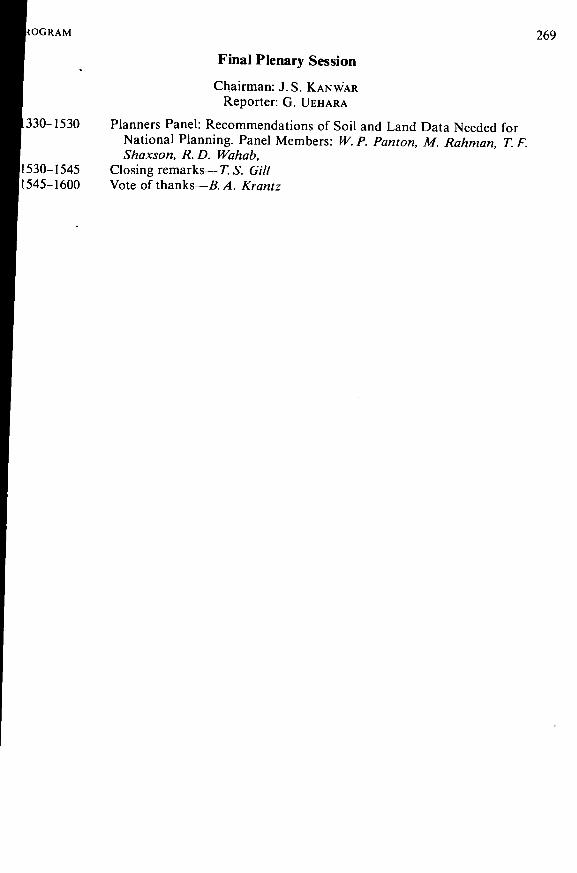
*OGRAM 269
Final Plenary Session
Chairman: J.S. KANW'ARReporter: G. UEHARA
\330-1530 Planners Panel: Recommendations of Soil and Land Data Needed forNational Planning. Panel Members: W. P. Panton, M. Rahman, T. F.Shaxson, R. D. Wahab,
II530-1545 Closing remarks— T. S. Gill1545-1600 Vote of thanks—B.A. Krantz
Appendix 5. Summary of Discussions and Recommendations
Summary of the Discussions of Sessions
Session I. Fundamentals of Modern Soil Classification
J.L. SEGHAL: Soils with Natric horizons may have considerable differences in soil struc-|tures; one soil may have a columnar structure, and another, a blocky structure. The man-agement of these two soils could be very different, but the classification might be the same.|
W. M. JOHNSON: The definition of the Natric horizon was written after intensive study ofthe importance of prismatic and columnar structure as related to exchangeable sodium Ipercentage and other characteristics of sodium-affected soils. Strict application of the dif-lferentiating criteria is absolutely essential to consistency of classification. Of course, the Idefinitions of horizons and of soil classes can be changed if there is sufficient positive evi-1dence to warrant change.
J.L. SEGHAL: There appears to be some confusion caused by using the same criterionat different categoric levels. For example, soil moisture regime is used at the suborder andgreat group levels, and base saturation is used at the order and great group levels. Examplesare Ustalfs and Ustochrepts; Ultisols and Eutrochrepts.
W.M. JOHNSON: Differentiating criteria are used at categorical levels appropriate to theirimportance at that level. To use a given criterion uniformly (at the same categorical levelthroughout the taxonomy) results in many "empty classes," that is, classes with no knownexamples in the universe of soils.
K. A. DE ALWIS: The phase was described as cutting right through all the categories of thesystem. How is this reconciled with the use of certain phase criteria, for example, soilslope at the family level?
W.M. JOHNSON: NO soil characteristic is used exclusively as a phase criterion. Any soil char-acteristic may be used as a phase differentia if not already used at some categorical levelin Soil Taxonomy. Soil slope may be used if necessary as a differentiating criterion at thefamily level (see chapter 18 in Soil Taxonomy). If it is used as a differentiating criterion,obviously it is not a phase but a criterion in the Taxonomy itself.
J.C. BHATTACHARJEE: What are the summer and winter months to be taken into con-sideration for defining the soil temperature regime? Should the summer dry months betaken into consideration or the summer wet months? In the eastern part of India, hot anddry months extend from March to May, while in Western India they are April to June. Airtemperature drops immediately after rain.
270
•MMARY 271
H. IKAWA: The 5° C difference or the "iso" temperature class refers to soil temperature,bt air temperature. Soil temperature at a depth of 50 cm tends to be constant throughout
|e summer or winter months prescribed in Soil Taxonomy.
H.Y. CHAN: In our experience of measuring temperatures for rubber-growing soils inJlalaysia, we find a regular pattern of correlation between air and soil temperatures in(laded conditions under mature rubber trees but no such pattern in unshaded open areas.
view of such fluctuations, it will be much more reliable to measure actual soil tempera-ares and not rely upon correlations with air-temperature measurements.
Session II. Soil-Survey Interpretation for Technology Transfer
W. M. LAW: Some of the comments indicate a need for clarification of the use of the2rm land capability in Malaysia. The term relates to classification of land for mining, agri-
culture, forestry, grazing, recreation, and other uses. Land-capability classifications aretiade by the Economic Planning Unit of the Prime Minister's Department. Soil suitability
|s a term used in Malaysia to rate soils for agricultural crops only.
K..A. DE ALWIS: HOW much information on day length and other features that affect)lant growth are included in Soil Taxonomy?
G. UEHARA: Many factors like the one you mention will not be predicted by the Taxon-amy.
E. B. PANTASTICO: What is the cost of conducting soil surveys with modern methods?
H.Y. CHAN: In rubber-growing areas of Malaysia, the cost is about 1.00 to 1.25 U.S. dol-lars per hectare. Mapping is on a scale of 1:50,000.
T. JEAN: DO termite activities have significant impact on soil genesis in soils under rub-Iber in Malaysia? Does this feature cause problems in classification using the Soil Taxon-| omy?
H.Y. CHAN: There is some influence, but it does not cause problems in classification.These features, if present and significant, can be accommodated at the subgroup levels.
Session III. Use of Soils Data in Land-Use Planning
T. F. SHAXSON: In addition to Dr. Murthy's statement, "The purpose of soil survey is notfulfilled unless a suitable land-use plan is projected on the soil map," I would add: "Thepurpose of planning is not fulfilled unless an acceptable, feasible, adequate, and appro-priate land-use plan can be put on the ground and remain there."
E. B. PANTASTICO: Much has been said about soil-survey interpretation for technologytransfer that should be useful for planners and ultimately farmers. All of this seems to indi-cate that we expect our soil surveyors to be extension workers or even businessmen sellinga product. Have you ever thought about what a soil surveyor really is? Is he merely aglorified laborer who can be pushed around at any time to any place as desired by theadministrator? Or is he a well-respected man who is trusted by the government planners?What is his standard of living compared with that of his fellow government employee?Unless this is known, it is difficult to impose on him many other activities that he has notbeen trained to do. Please give this some thought.
K. A. DE ALWIS: Dr. Murthy, were soil moisture properties, such as water-holding capa-city, determined before and after implementation of the improved management practicesat the two sites?
272 PROCEEDINGS OF THE SEMIN/
R. S. MURTHY: Further data including water-holding capacity are in the process of beirobtained. A follow-up of the initial experiments will be undertaken.
T. F. SHAXSON: When planning developments at farm and field scale, the use of trthird dimension—to show topography over two-dimension soils data—is an indispensabllrequirement. By use of contour and topographic maps and stereoscopic pairs of airphoto^the natural watershed and catchment of the land surface can be identified and then usedthe basic framework for effective conservation layouts, which are planned to be intégraparts of the proposed improved farming system on that particular and unique piece of lane
Session IV. Use of Soils Data in Regional and National Development
T. I. ASHAYE: These papers illustrate the use of soils data to increase development activitjand investment. The Sri Lanka experience with Alfisols is a good example of optimurutilization of known soils information. Korea has shown us how satisfactorily a demand foi]soils information for a new variety can be met. The presentation from India was a gocexample of the special needs of climatic regions having low moisture.
S.M. VIRMANI: Climatic data for narrow intervals of a week or less should be analyzed]with available refined methodology in place of monthly means, for which the coefficient ofvariation for arid and semiarid climates is very high.
T. F. SHAXSON: TO make soil-survey data usable to the field implementator as well as Ito the economic planner, I would like to encourage soil surveyors to consider themselves ascollectors of land-resource data, not just soils, and to present their soil-survey results on Itopographic base maps (e.g., contoured line maps or airphotos annotated to show crestsand drain lines). In this way, physical plans of development can be sketched immediately as |an overlay.
H.Y. CHAN: Information about soil slope can be derived directly from completed soilsurvey reports.
R. B. MILLER: The speakers have described scientific work and have shown how this hasled to increased crop production and land development. For these programs to succeed,there must have been linkages between the scientists, the farmers, and the developmentauthorities. We need to know more about the details of these planning and implementingmechanisms.
Session V. Expanding the Soils Research Network
M.J. KILIAN: Can the Benchmark Soils Project assist with technology transfer to smallfarmers? Can you in your experiments include studies of the use of different practices forpreparing the soils for crops?
L. D. SWINDALE: In principle, any level of technology is transferable if it is adequatelydefined. We could carry out experiments with hand tools in the Benchmark Soils Project ifour cooperators thought that was important. But I suggest that this would be better suitedto the network of agricultural research stations that we have also discussed.
T. F. SHAXSON: In addition to the development of a research network, we might alsoconsider an extension network through which a cadre of extension people could becomefamiliar with the characteristics of various soil families and assist the extension workers inspecific countries by bringing to their attention what has already been learned somewhereelse.

JMMARY 273
J.S. KANWAR: These proposals are very important for the future of agricultural research.\hey should help reduce greatly the amount of repetitive work that is done. 1 am particularlyWrested in the proposal to classify the soils of agricultural research stations. This will allowIs to try out crop production under different management systems in different places andIrovide us all with valuable information. It will save the developing countries and the inter-national agricultural centers a great deal of money.
J. BENNEMA: Although the soil characteristics of soil in a family may be the same, the|oil qualities of these soils may be different; that is, a soil family is not the same as an eco-Dgical niche. It is necessary to conduct basic soils research to determine the exact relation-hips between soils and agriculture.
T. S. GILL: AID is interested in the Benchmark Soils Project because it is hoped that the'roject will provide a shortcut to agricultural information for the developing countries. Ifhe concept works, and you can as easily prove it on soils covering only a few hundredïectares as you can on soils covering vast areas, the Project will provide us with a new and)owerful tool for bringing agricultural information to those who most need it.
R. B. MILLER: There are many small countries in the Pacific that do not have the resourcesthemselves to carry out the experiments of the Benchmark Soils Project. The Project couldbe of great value to them, and they might be able to obtain some assistance from the South
f 'acific Commission and the New Zealand aid program. How can such countries becomenvolved with the Project?
L. D. SWINDALE: I suggest that a proposal for a South Pacific Regional Benchmark SoilsProject be developed for consideration by the South Pacific Commission or other aid agen-cies. This would specify maybe six key sites of important regional extent for agriculturalexperimentation. Results from these sites could be used to provide the basis for extensionactivities throughout the region.
N. N. NYANDAT: In Kenya we have problems in extending information gained at researchstations to the farmers. We find it necessary to carry out simpler and more numerous trialsand demonstrations on farmers' fields. Does the Benchmark Soils Project have any relevanceto this important type of work?
F. R. MOORMANN: The task of the Benchmark Soils Project is to prove a widely appli-cable concept. It will be a national task to extend it further at the level of detail that you havereferred to.
D. MULJADI: We are pleased to be involved in this Project and hope that it will includefamilies of Tropudults because of their importance to future food production in this region.My own institute is already working on the problems of these soils. We believe this Projectcan provide valuable complementary assistance to our work.
K. A. DE ALWIS: Does the soil family concept work for agricultural transfer within theUnited States?
L. D. SWINDALE: Yes. Some soil families contain several series extending over severalstates. Experience does show similar agricultural practices and problems throughout therange.
F. R. MOORMANN: There has been evidenced in this discussion an enthusiastic acceptanceof the benchmark soils concept, and I hope that something good will come from this ses-sion. I believe we must accept the fact that the immediate results of the experiments of theBenchmark Soils Project cannot be directly applied to small farmers, but our future researchcan be developed in directions that will make technology transfer relevant to them.
274 PROCEEDINGS OF THE SEMINJ
Session VI. Soil and Water Management in Rain-fed Agriculture
G.H. CANNELL: In your approach using a .watershed-based farming system for the ser.arid tropics, do you visualize the small farms for the implementation of your technology?
B. A. KRANTZ: Definitely yes. For the implementation of watershed-based farming syIterns, there is a need to do research on socioeconomic aspects. Details are being worked oilto carry out this system on small farms.
H.W. CHAN: In the semiarid tropics of India where the availability of manual labor manot be a problem, you may be able to emphasize manual rather than chemical means t |control weeds. However, there may be situations where both ways are required and, in sorcases, even preemergent herbicides may be needed.
B. A. KRANTZ: We are definitely interested in the chemical control of weeds. Purely mechanical means are not possible when the soils are wet. Also, particularly in the early yearof cultivation of land, when the weeds are a real problem, some chemical control is essential]We will do benefit-cost analyses and decide how best to control weeds with a minimum olcost, particularly of inputs. We are also studying the ecology of weeds under different manlagement systems to understand the weed species involved and develop economically viabhsystems of weed management.
Y. P. BALI: It is encouraging to note the utilization of soils data in water harvesting t(assist in efficient design of small farm ponds and tanks. In trying to provide benefit-cosratios of soil surveys, it is often suggested that the cost of soil surveys be allocated to the on<specific program for which the project was initiated, whereas the soils data generatecthrough soil surveys are useful for other programs as well as for users outside the field olagriculture.
S.M. VIRMANI: My observations on benefit-cost ratios in dryland agriculture comparedto irrigated areas are based on current economic analysis. Dryland areas do need careful]assessment of soil resources, and these should be mapped and surveyed.
J.S. KAN WAR: I appeal to all the participants to classify the soils in their own countriesthat appear similar to those we have at ICRISAT. This will help us provide valuable infor-mation by extending our research projects to similar soils in different climatic environments.
Reports of the Discussion Groups on Soils Information Available for Planning
Summaries
F. R. MOORMANN summarized the discussions of Group A as follows:
1. Planners need information in addition to that contained in Soil Taxonomy. Thisadditional information includes cropping combinations, crop performance or cropecology data, alternative uses, specific recommendations, site-specific information,and climatic data.
2. The mechanism for proposing changes in Soil Taxonomy should be discussed andmade universally available; consideration should be given to standardizing per-manent phases (such as slope and previous land history). Additional categoriesshould be created for soils that at present cannot be placed in the system (suchas the epiaquic subgroups).
IlMMARY 275
3. A working commit tee on soil t a x o n o m y should be created to m a k e the T a x o n o m ymore useful for the tropics.
4. There is a need to bridge the communica t ion gap between soil scientists andplanners .
R . W . A R N O L D summarized the discussion of G r o u p B as follows:
1. Pedological da t a should be separated from the interpretat ions needed by planners .2. Interpreta t ions for use and management should be stated as simply and as accu-
rately as possible.3. Small-scale count ry soil maps are excellent for broad-scale planning.4. Since the numbers of soil surveyors are small in many countries, soil surveyors
should be involved in p lanning at an early stage to avoid t ime constraints on theirsurvey work.
5. There is a need to inventory the soils information that is currently available.6. Soil scientists need to bridge the communica t ion gap with o ther disciplines.7. The Benchmark Soils Project should be encouraged to make an inventory of the
soil information available in the tropics.
H. BRAMMER summarized the discussion in G r o u p C as follows:
1. There is a need to formalize the dialogue between pedologists and planners so thatit will cont inue when the par t ic ipants return home.
2. M o r e considerat ion should be given to those who will actually implement or usethe land-use plan.
3. Soil surveyors should be responsible for packaging the soils information in a use-ful and unders tandable form.
4. Soil surveyors should work with other specialists, extensionists, and planners ,and not in isolation.
5. S o m e countr ies have, but most countr ies d o not have, a successful model for theuse of soil survey and classification in p lanning and implementing agricul turaldevelopment.
6. Considerat ion should be given not only to the hor izonta l transfer of technologyto o ther subject mat te r specialists bu t also to the vertical transfer of technologyto the small farmer in the tropics.
M . L . D E W A N summarized the session as follows:
1. Improvements in soils information and soil interpretat ions are needed, and theinformation currently available should be assembled in the form of a da ta bank ,as is being done by F A O and in some countries.
2. There is a need to transfer technology horizontally as well as vertically to thesmall farmers in the tropics.
3. Soil scientists should interact with, and relate to , all o ther disciplines involved inagricultural development .
4. Soil surveyors should be exposed to or ientat ion and familiarization courses in plan-ning. P lanners and development economists in turn should be exposed to soilsurvey and classification and their field applicat ion in actual development .
5. P lann ing a t var ious levels has been a t tempted in some countr ies . In terchange ofinformation in this respect would be very helpful, and this seminar should st imu-late such exchange.
6. Since development and not p lanning is the u l t imate goal , considerat ion should begiven to the means available to execute a plan and the economic, social, political,and cultural implications of a land-use plan.
276 PROCEEDINGS OF THE SEMINA|
Discussion
A. J. SMYTH: I am happy to hear that the participants are interested in the team approachWho should lead the team should probably be determined on an ad hoc basis; it is not necessary for us to learn the language of each other's discipline.
N.N. NYANDAT: The real problem is not soil taxonomy or land-use planning, but impiementation. How do we implement land-use planning? Countries with successful model|should make them available to others.
M. VAKILIAN: In the arid and semiarid regions, much data is available but it is not coorjdinated. There is a need for an office to coordinate the data from different agencies ancmake it available in the form of a data bank; this would save time, money, and energy.
R. FEUER: An inventory of the kinds of soils and soils information available to the tropic^at each research or experimental station would be useful.
Reports of the Discussion Groups on Soils Information Needed for Planning
Summaries
A. R. M. MEKKI summarized the discussions of Group A as follows:
1. Further soils information is needed in planning.2. Closer cooperation should be established between soil scientists and agricultural
researchers in other disciplines to produce more integrated crop-soil informationfor planning. In particular, communication between soil scientists and plant breedersis necessary to determine what kinds of genetic manipulation might be necessaryfor different kinds of soil.
3. Subject matter specialists trained in soil-survey interpretation are needed to inter-pret soils reports for planners and extension agents.
B. BALANKURA summarized the discussions of Group B as follows:
1. Soil-suitability (capability) maps showing (a) quantification of the areas, (b) eco-nomic productivity of a specific crop, (c) the required scale and, (d) alternativeoptions are required.
2. Interpretative maps should be accompanied by written material, which should beunderstandable and accurate and which should state the implications of the optionsas well as the assumptions.
3. Early involvement and interaction of soil scientists with people in other disciplinessuch as agronomists and economists would improve the quality of the planning work.
4. There should be a review of the terms such as capability, suitability, planners, andpolicy makers to make them more consistent in national development.
R. B. MILLER summarized the discussions of Group C as follows:
1. Planners are considered as planners in agricultural development, not those in high-level national economic planning.
2. The planners feel they need: (a) interpretive maps, not soil maps showing soilterminology; (b) accurate maps; (c) maps understandable by planners and showingclear delineation of classes, quantitative data, areas estimated even if units are not
JMMARY 277
homogeneous, and caveats regarding use of the data; (d) scales suitable for theparticular objective; (e) flexibility so that alternative possibilities are shown; (f)data integrated for specific crops (or groups of crops having similar soil require-ments) with benefit-cost calculations; and (g) maps showing relative land potentialstaking account of the given level of inputs.
3. The soil surveyor is well equipped to coordinate the assembly of this physicaldata, including information about water, energy, climate, agronomy, and vegetation.
4. The soil surveyors need from the planners: (a) the right question; (b) resources—soil surveys cannot be done without staff, equipment, and transportation; (c) time—even if time is short, some data can be provided, but planners and politicians mustrealize that good planning needs good basic data and that the planning programshould allow time for it to be collected.
5. It is generally felt that soil surveyors and planners must work together. Interactionand consultation should take place at the project level right from the start. At thenational level, there should be planning teams with other specialists and soil sur-veyors should constantly plan ahead to foresee future requirements. A team ap-proach is essential.
6. It is necessary that relevant soil-survey information get to the land user or farmer.This is best done through an extension worker, who is often the planner at the fieldlevel. The soil surveyor must make his information available to the extension workerin terms the extension worker can understand and pass on to the farmer. Demon-stration and communication are key factors in extension. The relationship betweenthe soil surveyor and extension worker needs development.
Discussion
J. BENNEMA: The soil scientist may not have all the expertise required to integrate datafor land-use decisions. It depends on the work to be done. For example, in an irrigationproject the economist or agronomist may be the best person to integrate the informationfor planning. I would also like to comment about the flow of information to the planner. Ateam should synthesize the material before it goes to the planner. In other words, some ofthe planning should be done before the information flows to the planner.
R.B. MILLER: The conclusion was really that there should be continuous consultation ina team with planners.
A. J. SMYTH: In regard to the report from Group C, it appears that the aim is to produceinterpretative maps for specific purposes showing quantitative data useful to planners. Toreach this goal, we need to consider location economics also. The economics of each alter-native will depend on distance to markets, roads, etc. Are soil scientists willing to introducelocation economics in this way?
T. F. SHAXSON: The responsibility for location prospects should properly be that of thephysical planning specialist who should discuss, and draw final conclusions about, theeconomics of the proposals with an economic planning counterpart.
S.J. PANDEY: Soil survey should be followed by research that should flow to extensionand then to the farmer. Without communication with the farmer, soil survey is meaningless.Agronomic trials in India have often been done without regard to soil. The soil-test infer-ences should be superposed on soil-survey information. \
iR. W. ARNOLD: We speak a lot about the small land owner. Yet, soil surveys on a detailed
scale are very costly. I have very little idea of the risk factor that the small farmer has. So
278 PROCEEDINGS OF THE SEMIN/
without soil-survey information at the small farm level, how are we to implement th|recommendations without exposing the farmer to considerable risk?
R. FEUER: I am dealing with very small holders of rice. Our first consideration is to avoidrisk. When the farmer says he cannot afford the risk, we give him low cost credit facilities;The small-scale farmer likes to see new technology demonstrated before accepting it.
T. F. SHAXSON: Even reconnaissance-scale soil surveys can be used in the small-seal^farmer situation as a means of giving guidelines to field extension workers about croptypes, animal enterprises, etc. It is also feasible and possible to train extension worker^in simple techniques of soil survey and physical and economic planning for the individua]small farmer or cooperative groups of small farmers.
J. S. KANWAR: When we are thinking of agricultural technology based on soil surveyand selling it to planners, we have the feeling that the latter are reluctant to take it. Iimany cases, however, the information from the soil survey has not been utilized to indicatewhat can be produced from an area at a particular level of technology. For example, at!IRRI and other institutes, there is no information regarding soil benchmarks. Trials arelcarried out usually only in regard to the local situation. These benchmark experiments can|be made only in collaboration with national groups.
Summary of the Discussions of the Final Plenary Session
Summary
A panel of professional planners described their responsibilities and the need for soils in-formation. Planners can generally be subdivided into those who work at the macrolevel onnational plans and national sector analysis and those who work at the microlevel in planningspecific projects. Macroplanning is carried out in the context of predetermined nationalgoals. It is usually performed under considerable time pressure, and choices between differ-ent uses of physical, human, and financial resources must always be made.
Indicative macroplanning is normal in most developing countries. Local governmentsand the farmers themselves make the ultimate decisions. The planning agencies try to createconditions that will cause these decisions to contribute to the fulfillment of national goals.Macroanalysis is usually performed by economic sectors (e.g., the agricultural sector)and by subsectors (e.g., agricultural credit). Sectors and subsectors need to be carefullydefined, and the analyses to be performed in each case, carefully described.
The planning agency usually has some authority for implementation, normally throughbudgetary review and recommendations on funding for specific projects.
Soils and land-use data for macroplanning need to be in the form of interpretative small-scale maps, tables, and narratives. General suitabilities or capabilities were satisfactory atthis level, but alternatives and a range of options should be given. Relative land potentialsat different levels of defined inputs are valuable. Single factor or single commodity inter-pretations are very useful. Current land use and land-use trends over time should be re-lated to soil-suitability classes to indicate opportunities and hazards. Limitations to useshould be specified. They can be combined with suitabilities into categories of maximumpermissible intensities of use.
It is recommended that land-use surveys and soil surveys be conducted and interpretedby the same agency.
JMMARY 279
Because many interpretations and recommendations change with time, they should be|rought up-to-date regularly.
Planners often find that data are provided to them in unsatisfactory form, and are|oncerned about their quality and reliability. They do not believe they should be responsible
format and quality, and instead recognize a need for regular formal and informal con-acts with soil surveyors.
The panel recommends international standardization of the terms used in soils and landAppraisal.
Although much planning is at the macrolevel, there is recognition that this is too oftenansuccessful. There is a trend toward regional planning at county or district levels. In timelacroplanning might be usefully done by aggregating more detailed plans.
Detailed planning requires detailed soil surveys and detailed interpretations. Yieldîredictions are required at the levels of current practice and under high intensities ofîanagement.
Project analysis particularly by external leaders is very thorough, and tends to useill available information. It is most effective when incremental increases in rates of returnin be calculated for incremental increases in yields or management levels.
Discussion
M. RAHMAN: We have been asking for a great deal of information. Is it really the re-sponsibility of the soil surveyor to obtain so much information outside his immediate field?
W. P. PANTON: It certainly should not be left to the central planning agency to obtain it.But soil scientists, foresters, geologists, etc. might all come together into a single physicalplanning group to provide such information. More soil scientists should also become subjectmatter specialists in planning organizations.
T.F. SHAXSON: Because soil scientists are asked to do so much, they should be givenreasonable lead time, and planning agencies should ensure they be given adequate supportin terms of staff, operational funds, vehicles, and equipment. Only with adequate supportcan they provide the new information and regularly up-dated information that have beenrequested.
M. L. DEWAN: There is a trend in the developing world for soil-survey organizations tobecome soil- and land-research institutes incorporating scientists from other disciplines.Also the typical soil surveyor is broadening his perspectives and training throughout hiscareer so that his responsibilities will change towards more interpretative work as he be-comes more knowledgeable and more senior.
R. W. ARNOLD: Because planners wish to build such a large superstructure of interpreta-tions and plans on the basis of our soil surveys, we need to be very, sure that we have goodquality control in any survey at any scale. There is little research around the world intosoil-survey quality or in developing methods for quality control in soil surveys.
J. BENNEMA: FAO is preparing a framework for land evaluation. We hope that this willprovide an agreed approach to what goes into land evaluation and eventually to agreementon common terminology.
T.F. SHAXSON: HOW do we decide what information needs to be collected? There is adanger that these few soil surveyors we have will be asked to collect data, much of whichis never used.
280 PROCEEDINGS OF THE SEMIN/
W. M. JOHNSON: Most soil-survey organizations must serve the needs not only of planniragencies but also of other public agencies, engineering and development firms, and indjvidual land owners, and to meet all of these needs without producing excessive detailexcessive cost. In the United States, we hold an annual soil-survey work planning confei]ence in every state. The people who will do future surveys come together with those who wijuse them to discuss the priorities and the designs of the surveys. Also when a survey is aboito begin, another conference is held for similar purposes. In this way we try to learn al]about the needs before the job begins.
Appendix 6. List of Participants
AUSTRALIA
I Alan W. MooreThe Cunningham LaboratoryDivision of Soils
I Commonwealth Scientific and IndustrialResearch Organization (CSIRO)
Mill Road, St. LuciaQueensland, Australia 4067
BANGLADESH
Hugh BrammerFAO Senior Land Use AdviserUnited Nations Development ProgramP.O. Box 224Ramna, Dacca, Bangladesh
Arnold J. RadiAgricultural Development OfficeUSAID/DaccaAgency for International DevelopmentWashington, D.C. 20523 U.S.A.
Mujibur RahmanChiefEconomic Section, Agriculture DivisionPlanning Commission17/20, Sher-e-BanglanagarDacca, Bangladesh
Md. Rezaur RahmanDeputy DirectorDepartment of Soil SurveyDacca, Bangladesh
CENTRAL AFRICAN EMPIRE
M.A. RasheedDirectorInterafrican Bureau for SoilsOrganization of African UnityBIS/STRC/OAUB.P. 1352Bangui, Central African Empire
ETHIOPIA
Ato Berhanu DebeleResearch OfficerInstitute of Agricultural ResearchP.O. Box 2003Addis Ababa, Ethiopia
Gedion ShoneActing HeadSoil and Water Conservation SectionExtension and Cooperative Promotion
DepartmentMinistry of AgricultureP.O. Box 3824Addis Ababa, Ethiopia
FRANCE
M.J. KilianInstitut de Recherches Agronomiques
Tropicales et des Cultures Vivrieres(IRAT)
110, Rue de L'Université75340 Paris Cedex 07, France
281
282 PROCEEDINGS OF THE SEMINAi
GHANA
Andrew A. ArthurPrincipal Regional Planning OfficerMinistry of Economic PlanningRegional AdministrationP.O. Box 104Sunyani, Brong-Ahafo, Ghana
Henry B. ObengDirectorSoil Research InstituteCouncil for Scientific and Industrial
Research (CSIR)Academy Post OfficeKwadaso-Kumasi, Ghana
INDIA
Y.P. BaliJoint CommissionerNational Bureau of Soil Survey and Land
Use PlanningMinistry of Agriculture and IrrigationKrishi Bhavan, New Delhi, India 110012
N. K. BardeSoil CorrelatorNational Bureau of Soil Survey and Land
Use PlanningRegional CenterBangalore, India
J. C. BhattacharjeeSoil CorrelatorNational Bureau of Soil Survey and Land
Use PlanningRegional CenterNagpur, India
Shri S. DigarSoil CorrelatorNational Bureau of Soil Survey and Land
Use PlanningRegional CenterCalcutta, India
L.R. HirekerurSoil Conservation OfficerNational Bureau of Soil Survey and Land
Use PlanningIndian Council of Agricultural ResearchNew Delhi, India 110012
Shri Shah Nawaz KhanUnion Minister of State for Agriculture anc
Irrigation, WAQFSGovernment of IndiaNew Delhi, India 110001
Ch. KrishnamoorthyAssistant Director General cum Project
DirectorAll India Coordinated Research Project for
Dryland Agriculture"K" Block, College of AgricultureRajendranagar, Hyderabad, India 500030
P. KrishnamoorthyAgricultural ChemistOffice of the Agricultural ChemistAgricultural Research InstituteA. P. Agricultural UniversityRajendranagar, Hyderabad, India 500030R.S. MurthyChief Soil Survey OfficerNational Bureau of Soil Survey and Land
Use PlanningIndian Council of Agricultural ResearchNew Delhi, India 110012S. PandeyCartographerDirectorate of All India Soil and Land Use
SurveyIndian Council of Agricultural ResearchNew Delhi, India 110012C. RatnamSoil Survey OfficerTamil Nadu Agricultural UniversityCoimbatore, India
J.L. SehgalProfessor, Soil SurveyPunjab Agricultural UniversityLudhiana, India
H.S. ShankaranarayanaSoil Correlator, Delhi RegionNational Bureau of Soil Survey and Land
Use PlanningIndian Council of Agricultural ResearchNew Delhi, India 110012
T.R. SrinivasanHeadSoil Survey DivisionIndian Photo-Interpretation InstituteDehra Dun, India
lARTICIPANTS 283
*.B. Vohraidditional Secretary)epartment of Agriculturelinistry of Agriculture and Irrigation4ew Delhi, India
[INDONESIA
ID. MuljadiDirectorSoil Research Institute (SRI)
I Jalan Ir. H. Juanda No. 98Bogor, Indonesia
Ratna D. WahabAgricultural Planning StaffBureau of Agriculture and IrrigationNational Development Planning Agency
(BAPPENAS)Jalan Taman Surapati 2Jakarta, Indonesia
IRAN
Manouchehr VakilianHeadSoil and Land Evaluation SectionSoil Institute of IranNorth Amirabad AvenueTeheran, Iran
ITALY
Madan L. DewanChiefRegional Bureau for Asia and the Far EastFood and Agriculture Organization of the
United NationsViale Terme di CaracallaRome 00100 Italy
IVORY COAST
Bogui M. YessohIng. Agronome Co-DirecteurProjet De PédologieFAO/AVB BP 1395Bouake, Ivory Coast
KENYA
F.M. Kinoti M'mugambiAgricultural OfficerProvincial Agricultural OfficeP.O. Box 4Embu, Kenya
Nelson N. NyandatHeadKenya Soil SurveyNational Agricultural LaboratoriesP.O. Box 30028Nairobi, Kenya
MALAWI
E.J. MangameSenior Land Husbandry OfficerMinistry of Agriculture and Natural
ResourcesDepartment of Technical ServicesP.O. Box 30134Lilongwe-3, Malawi
T.F. ShaxsonPrincipal Land Husbandry OfficerMinistry of Agriculture and Natural
ResourcesDepartment of Technical ServicesP.O. Box 30134Lilongwe-3, Malawi
MALAYSIA
Heun Yin ChanSenior Research OfficerSoils and Crop Management DivisionRubber Research Institute of MalaysiaJalan Ampang, P.O. Box 150Kuala Lumpur, Malaysia
Wei Min LawChiefSoil Survey DivisionDepartment of AgricultureJalan SwettenhamKuala Lumpur, Malaysia
NEPAL
Manik Lai PradhanChief Soil ScientistDepartment of Agriculture, HMG/Nepal
284
Division of Soil Science and AgriculturalChemistry
Khumal Tar, LalitpurKathmandu, Nepal
NETHERLANDS
Jakob BennemaProfessor, Tropical Soil ScienceDepartment of Soil Science and GeologyAgricultural UniversityP.O. Box 37Wageningen, The Netherlands
PROCEEDINGS OF THE SEMINAR
P.O. Box 1848Manila, Philippines
Reeshon FeuerUS AID/ManilaAPO San Francisco, U.S.A. 96528
Eduvigis B. PantasticoActing DirectorSoil and Water Resources Research Division|Philippine Council for Agriculture and
Resources ResearchUniversity of the PhilippinesLos Banos, Laguna, Philippines
NEW ZEALAND
R.B.MillerDirectorSoil BureauP.B. Lower Hutt, New Zealand
NIGERIA
T.I. AshayeAgricultural DirectorInstitute of Agricultural Research and
TrainingUniversity of IFEP.M.B. 5029Moor Plantation, Ibadan, Nigeria
Frank R. MoormannPedologistInternational Institute of Tropical
Agriculture (IITA)P.M.B. 5320Ibadan, Nigeria
S.M.C. OparaugoAgricultural OfficerSoil Survey UnitFederal Department of AgricultureP.M.B. 2164Kaduna, Nigeria
PHILIPPINES
Godofredo N. Alcasid, Jr.Assistant DirectorBureau of SoilsDepartment of Agriculture
RWANDA
Henri NeelAgricultural Engineering, PedologistAgricultural Research Institute of RwandaISAR-RubonaB.P. 167Butare, Rwanda
SRI LANKA
Kingsley A. de AlwisActing HeadLand Use DivisionIrrigation Department of Sri Lanka28 Sudarshana MawathaNawala, Rajagiriya, Sri Lanka
Christopher R. PanabokkeDirectorOffice of the Deputy Director of Agriculture
(Research)Department of AgricultureNo. 1 Sarasawi MawathaPeradeniya, Sri Lanka
SOUTH KOREA
Ki Tae UrnDivision of Soil Survey and Soil PhysicsInstitute of Agricultural SciencesOffice of Rural Development34-5, Hwaseo-DongSuweon, 170 Korea
PARTICIPANTS 285
ÎUDAN•
iMohamed Abdalla AliÎDirector•Soil Survey AdministrationIWad MedaniIP.O. BOX 388I Khartoum, Sudan
Abdel Rahim Mohd MekkiDirector General
| Planning AdministrationMinistry of Agriculture, Food and Natural
ResourcesP.O. Box 285Khartoum, Sudan
TANZANIA
Andrew P. UriyoAssociate Professor in Soil ScienceUniversity of Dar Es SalaamFaculty of Agriculture and ForestryP.O. Box 643Morogoro, Tanzania
THAILAND
Bancherd BalankuraDirector GeneralLand Development DepartmentRajadamnern AvenueBangkok, Thailand
Chaleo ChangpraiAgronomistSoil Survey DivisionDepartment of Land DevelopmentRajadamnern AvenueBangkok, Thailand
UNITED KINGDOM
Anthony J. SmythDirectorLand Resources DivisionMinistry of Overseas Development8th Floor, Tolworth Tower, SurbitonSurrey KT 6, 7DY, United Kingdom
UNITED STATES
Richard W. ArnoldProfessor, Soil ScienceDepartment of Agronomy709 Bradfield HallCornell UniversityIthaca, New York 14853 U.S.A.
Guy B. BairdAssociate Director (Research)Office of Agriculture, Technical Assistance
BureauAgency for International DevelopmentState Department (N.S. 2243)Washington, D.C 20523 U.S.A.
Friedrich H. BeinrothAssociate ProfessorDepartment of Agronomy and SoilsCollege of Agricultural SciencesUniversity of Puerto RicoMayaguez, Puerto Rico 00708 U.S.A.
Glenn H. CannellSoil PhysicistConsortium for International Development
(CID)Department of Soil Science and Agricultural
EngineeringUniversity of California, RiversideRiverside, California 92502 U.S.A.
Johnny CollinsAssociate Professor, SoilsPrairie View A & M CollegeP.O. Box 2704Prairie View, Texas 77445 U.S.A.
Tejpal S. GillSenior Program ManagerTechnical Assistance BureauOffice of AgricultureU.S. Agency for International DevelopmentWashington, D.C. 20523 U.S.A.
Haruyoshi IkawaAssociate Soil ScientistDepartment of Agronomy and Soil ScienceUniversity of Hawaii3190 Maile WayHonolulu, Hawaii 96822 U.S.A.
William M. JohnsonDeputy Administrator for Soil Survey
286 PROCEEDINGS OF THE SEMINAl
Soil Conservation ServiceU.S. Department of AgricultureRoom 5004, South Agriculture BuildingWashington, D.C. 20250 U.S.A.
Gerald A. NielsenProfessor, Soil ScienceDepartment of Plant and Soil ScienceMontana State UniversityBozeman, Montana 59715 U.S.A.
William P. PantonInternational Bank for Reconstruction and
Development1818 H Street, N.W.Washington, D.C. 20433 U.S.A.
Leslie D. SwindaleAssociate DirectorHawaii Agricultural Experiment StationUniversity of Hawaii2545 The MallHonolulu, Hawaii 96822 U.S.A.
Gordon Y. TsujiProject AssociateBenchmark Soils ProjectDepartment of Agronomy and Soil ScienceUniversity of Hawaii3190 Maile WayHonolulu, Hawaii 96822 U.S.A.
Goro UeharaSoil ScientistDepartment of Agronomy and Soil ScienceUniversity of Hawaii3190 Maile WayHonolulu, Hawaii 96822 U.S.A.
WESTERN SAMOA
Nusi MaualaSoil Science LecturerFaculty of AgricultureUniversity of South PacificSouth Pacific Regional College of Tropical
AgricultureBox 890Apia, Western Samoa
ZAIRE
Talla JeanEngineer (Agronomy / Pedology)INERA/YANGAMBIO.P. No. 105Yangambi, Republic of Zaire
Kurayum-M'busINERA Direction SentrolYangambi, Republic of Zaire
M.N. MukumbiRepublic of Zaire
INTERNATIONAL CROPS RESEARCHINSTITUTE FOR THE SEMI-ARIDTROPICS (ICRISAT)
1-11-256, BegumpetHyderabad, India 500016 A.P.
R.W. CummingsDirector
J. KampenAgricultural EngineerSoil and Water Management
J.S. KanwarAssociate Director
B.A. KrantzAgronomist
T.J. RegoResearch Assistant
P. SinghResearch Assistant
S. SinghResearch Assistant
S.M. VirmaniResearch Fellow
OBSERVERS
Maurice G. CookProfessorDepartment of Soil ScienceNorth Carolina State Universityc/o Bangalore Baptist HospitalBellary RoadHebbal, Bangalore, India
\RTICIPANTS 287
LD. Dominguezpiiefrood and Agriculture DivisionJ.S. Agency for International Development'Jew Delhi, India
».R. NagabhushanaSoil Correlations Laboratoryîangalore, India
>heoji J. PandeyIIFCO»lew Delhi, India
K.C.C. RajuSenior GeologistGeological Survey of IndiaHyderabad, India
P. Prabhakar RaoSenior GeologistGeological Survey of IndiaHyderabad, India
K.R. VenugopalSoil Correlations LaboratoryBangalore, India

INDEXES
Author Index
Aandahl, A. B., 73, 82Abeyratne, E., 157, 161Abu Omar Ben Haggag, 4Ackerson, K. T., 26, 27Acquaah, G. W., 153Adu, S. V., 149, 151, 152, 153, 154Afanasiev, J. N., 5, 10Agarwal, R. R., 227Agriculture Ministry and Ministry of Interior,
Government of Thailand, 139All India Coordinated Research Project for Dryland
Agriculture (AICRPDA), 236, 241, 251Ama, J. T., 153American Society of Agronomy (ASA), 96Ansah, J. O., 149, 152, 153Appiah, H. A., 151, 154Arnon, I., 231, 234, 241Asamoa, G. K., 149, 151, 153, 154Asiedu, K. A., 149, 153Asokan, M., 227Aubert, G., 16, 17, 18, 26, 27Awam. See Ibn al A warn
Bae, S. H., 72Baird, G. B., 185-192, 285Baird, J. V., 18, 103, 139Baker, R. M., 196, 202Baldwin, M., 6, 10Bali, J. S., 242Bali, Y. P., 73-84, 282Bartelli, L. J., 17, 18, 19, 26, 27, 95, 103, 130, 139Beckett, P. H. T., 118, 129Beek, K. J., 80, 83, 89, 90, 132, 133, 137, 139, 140,
181Beinroth, F. H., 12-19, 212, 213, 218, 285Bennema, J., 17, 19, 80, 83, 89, 90, 130-140, 181, 284Bettenay, E., 203Bhatia, P. C , 238, 241Bie, S. W., 118, 129, 201, 202, 203Binney, T. B., 154Black, C. A., 123, 129Blackburn, G., 196, 202Boyer, M. J., 88, 131, 140
Bramao, L., 129Brammer, H., 147, 152, 153, 281Brewer, R., 203Bridgeman, P. W., 14, 15, 19Brind, W. D., 241Brinkman, R., 86, 88, 90, 132, 140, 177, 178, 181Burt, M., 88, 131, 140
Camargo, M., 80, 83, 140Cano, G. J., 174, 175Chan, H. Y., 41-66, 283Chang, A. K., 50, 61, 65Cho, C. Y., 72Choi, O. H., 68, 72Choudhury, S. L., 238, 241Christian, C. S., 178, 181Christy, L. C , 175Chung, G. S., 72Qine, M. G., 6, 10, 12, 13, 14-15, 19Cocheme J., 222, 227, 230, 241CODASYL, 201,202Commission de Pédologie et de Cartographie des Sols,
17, 19Coover, J. R., 81, 83Cornet, J. P., 129Costa de Lemos, R., 16, 19Cummings, R. W., 255-256, 286
Datta Biswas, N. R., 227de Alwis, K. A., 156, 159, 161, 162, 284Decker, G. L., 99, 103DeMent, J. A., 18, 19Dewan, M. L., 163-176, 283DeYoung, W., 97, 103Dokuchaiev, V. V., 4, 5, 11, 12Driessen, P. M., 131, 140Dudal, R., 17, 19
Ellison, W. D., 234, 241Eusof, Z., 65
Fallou, F. A., 4, 10Famouri, J., 175
291
292 AUTHOR INDE>
FAO, 17, 19, 86, 87, 88, 91, 132, 139, 140, 150, 174,175, 197, 201, 222, 227, 232, 233, 236, 241
FAO/UNDP, 67, 72, 91, 119, 120 (Fig. 5 n), 121,129, 174, 175, 176
FAO/UNESCO, 17, 28, 29-30, 137, 143, 147, 153,197,202
Field, J. B. F., 199, 202Flach, K. W., 16, 19Foale, M. A., 87, 91Forbes, A. P. S., 129Franquin, P., 222, 227, 230, 241
Gallatin Canyon Study Team, 100 (Fig. 3 n), 101, 103Galley, A. K., 153Garbrouchev, J., 131, 140Gardiner (in FAO), 87Glinka, K. D., 4, 11Goor, C. P. van. See van GoorGovernment of India, 176, 232, 241Government of Sri Lanka, 159, 162Guha, M. M., 41, 49, 58, 65, 66Gupta, R. K., 125, 129Gupta, S. P., 227Gurley, J. G., 176
Haantjens, H. A., 198, 202Hallsworth, E. G., 203Hansell, J. R. F., 90, 91Hari Krishna, J., 242Haryana Agricultural University, 121, 129Heddleson, M. R., 18, 103, 139Heseltine, N., 233, 241Hilgard, E. W., 4, 11Hill, I. D., 87, 91Hirekerur, L. R., 117-129, 282Ho, C. Y., 44 (Table 1 n), 49 (Table 3 n), 57, 58
(Table 11 n), 65Hubble, G. D., 203Hudson, N. W., 234, 241Hutchings, T. B., 86, 91, 131, 140
Ibn al Awam, 3Ibn Muhammad, Y., 3-4ICRISAT, 232, 238, 240, 241, 251Ikawa, H., 19, 20-27, 285H.RI, 174Indian Council of Agricultural Research (ICAR), 234,
241Institute of Agricultural Sciences (IAS) of the Office
of Rural Development (ORD), 67, 72Institute of Plant Environment, Office of Rural
Development (ORD), 69, 72International Crops Research Institute for the Semi-
Arid Tropics. See ICRISAT.International Development Association (IDA), IBRD,
149, 151, 153Isbell, R. F., 199, 202, 203
Jacks, G. V., 234, 241Jenkin, R. N., 87, 91Jewitt, T. N., 129Johnson, W. M., 3-11, 285
Kampen, J., 225, 227, 228-242, 286Kanapathy, K., 59, 65
Kant, I., 13, 19Kanwar, J. S., 233, 242, 286Kapoor, S. N., 242Kapp, K. W., 176Karale, R. L., 73-84KeUogg, C. E., 6, 9, 10, 11, 17, 19, 86, 89, 91, 132,
140Klingebiel, A. A., 18, 86, 91, 103, 131, 139, 140Kovda, V. A., 176Krantz, B. A., 221-227, 228-242, 286Krastanov, S., 140Krishnamoorthy, Ch., 243-251, 282Krishnan, A., 233, 242
Lal, H., 242Law, R., 129Law, W. M., 59, 65, 283Lee, P. C , 59, 65Leeson, B. F., 97, 103Um, T. M., 58 (Table 11 n), 65
Mahler, P. J., 86, 91, 132, 140Maletic, J. T., 86, 91, 131, 140Manil, G., 15, 19Marbut, C. F., 5-6, 11McCormack, R. J., 87, 91McHarg, J. L., 95, 103Meigs, P., 230, 242Mellor, J. W., 176Mensah-Ansah, J. A., 151, 153Mensah-Tei, L, 153Merrill, G. P., 4, 11Mian, M. A., 176Mill, J. S., 14, 19, 205, 209Ministry of Agriculture and Fishery, Republic of
Korea, 68, 72Ministry of Agriculture, Goverment of Ghana, 151,
153, 154Ministry of Agriculture, Government of India, 81, 83,
123, 129Montagne, C , 103Montana Agricultural Experiment Station Staff, 97,
103Montgomery, P. H., 86, 91, 131, 140Moore, A. W., 193-203, 281Moormann, F. R., 156, 162, 177-181, 284Muhammad. See Ibn Muhammad, Y.Mulcahy, M. J., 203Murthy, R. S., 104-116, 282Myrdal, G., 176
Nagarajah, S., 160, 162Nawaz Khan, Shri Shah, 257-259, 282Ng, S. K., 59, 65Nichols, J. D., 26, 27Nielsen, G. A., 95-103, 286Nix, H. A., 195, 196, 197, 203Northcote, K. H., 195, 196, 198, 203
Obeng, H. B., 87, 91, 143-154, 282Oertel, A. C , 198, 203Olson, G. W., 131, 140Omar. See Abu Omar Ben HaggagOrvedal, A. C , 26, 27Otoo, J. A., 154
MJTHORINDEX 293
Panabokke, C. R., 155-162Panton, W. P., 59, 65, 260-265, 286Paramananthan, S., 64, 65Pengra, R. F., 234, 242Plantenberg, P. L., 96, 103Prakash, I., 125, 129
[ Pushparajah, E., 41, 42, 44 (Table 1 n), 45, 47 (andTable 2 n), 49 (and Table 3 n), 55 (Table 9 n), 56,57, 58, 59, 63 (Fig. 3 n), 64 (Table 14 n), 65, 66
Rafiq, M., 176Rastogi, B. K., 232, 242Ratnasingam, K., 41, 65Rayachaudhuri, S. P., 222, 227Rege, N. D., 81, 83Reid, W. W., 231, 242Richards, L. A., 129Richards, S. J., 129Riquier, J. D., 88, 118, 129, 131, 140Roberts, F. M., 81, 83Robertson, V. C , 117, 129Robinson, G. W., 13, 19Rogers, J. W., 103Rubber Research Institute of Malaysia (RRIM), 41,
43, 57 (Table 10 n), 66Russell, J. S., 201, 202, 203Ryan, J. G., 222, 224 (Table 2 n), 225, 227
Sachan, R. C , 242SCS. See U.S. Soil Conservation ServiceSelvadurai, K., 59, 65Shaler, N. S., 4, 11Shankaranarayana, H. S., 117-129, 282Sharma, P. N., 242Sharma, S. K., 242Shetty, S. V. R., 242Shin, D. W., 71, 72Shin, Y. H., 67-72Shorrocks, V. M., 66Sibirtsev (Russian soil scientist), 5 (and Table 1), 6Silva, J. A., 212, 213, 218Simonson, R. W., 17, 19Singh, P., 242, 286Singh, S., 221-227, 242Sivanadyan, K., 44 (Table 1 n), 47 (Table 2 n), 49
(Table 3 n), 65Sleeman, J. R., 203Smith, D. D., 131, 140Smith, G. D., 6, 7, 11, 15, 16, 17, 18, 19, 54-55
(Table 9)Smith, L. H., 97, 103Smith, P., 241Smyth, A. J., 85-91, 132, 140, 177, 178, 181, 285Soepraptohardjo, M., 131, 140Soil Institute of Iran (Soil and Land Evaluation Sec-
tion), 36, 37Soil Survey Staff (Government of India), 81, 83. See
also U.S. Soil Survey StaffSoong, N. K., 43, 45, 50 (Table 4 n), 61 (Table 12 n),
62 (Table 13 n), 65, 66Stace, H. C. T., 198, 203Stavis, B., 176
Steele, J. G., 131, 140Steward, G. A., 178, 181Storie, E. R., 131, 140Subrahmanyam, K. V., 224 fTable 2 n), 225, 227Swaminathan, M. S., 117, 129, 222, 227Swindale, L. D., ix-xi, 210-218, 286Sys, C , 131, 140
Tan, K. H., 58, 62 (Table 13 n), 65, 66Tavernier, R., 16, 18, 22, 25-26, 27Taylor, J. K., 194, 203Teaci, D., 88, 131, 140Tenadu, D. O., 149, 153Thamboo, S., 59, 65Thomas, P. K., 227Thompson, C. H., 203Thorp, J., 3, 6, 10, 11, 54-55 (Table 9)Ti, T. C , 64 (Table 14 n), 65Trasliev, H., 140Troll, C , 230, 231 (Fig. 1 n), 242
Uehara, G., 19, 204-209, 286UNDP. See FAO/UNDPUSDA. See U.S. Department of AgricultureU.S. Department of Agriculture, 6, 7, 11, 13, 15, 16,
17, 19, 20, 23, 25, 26, 27, 66, 79 (Table 2 n), 88,91, 97, 103, 117, 129, 140, 197, 198, 201, 203, 204,209, 210, 218
U.S. Department of Interior, 131, 140U.S. Soil Conservation Service, 11, 19, 27, 66, 88, 91,
97, 103, 129, 140, 203, 209, 218U.S. Soil Survey Staff, 6, 11, 19, 27, 66, 91, 103, 129,
140, 203, 209, 218
Vakilian, M., 28-37, 283Vandersypen, D. R., 233, 242van Goor, C. P., 131, 134, 140Veenenbos, J. S., 176Vink, A. P. A., 85, 86, 87, 91, 132, 134, 139, 140Virmani, S. M., 221-227, 286Vohra, B. B., 176, 283Von Oppen, M., 227
Wall, J. R. D., 90, 91Webster, C . C . , 231,242Whitney, M., 5, 11Whyte, A. R., 151, 152, 154Williams, W. T., 199, 201, 203Wilson, P. N., 231, 242Wishmeyer, W. H., 131, 140Wong, C. B., 44, (Table 1 n), 47 (Table 2 n), 49
(Table 3 n), 50 (Table 4 n), 61 (Table 12 n), 65Wong, I. F. T., 59, 66Woo, Y. K., 62 (Table 13 n), 65
Yadav, Y. P., 242Yeow, K. H., 41, 65Yew, F. K., 65Young, K. K., 19Yu (Chinese engineer), 3
Zaychikov, V. I., 176
Subject Index
Acidity of soilseffect of, on rubber yields, 49, 51, 61 (Table 12)in Ghana, 146in India, 107, 109-111in Iran, 34-35in semiarid tropics, 211-212, 222, 243
Acrisols, 70 (Table 4), 147Agricultural potential. See Land potentialAgricultural research stations, 6, 99, 177, 202,
207-209, 215-216, 217. See also by specificname
Agrotechnology transfereffect of climatic parameters on, 20, 26-27, 206-207for Sri Lanka, 155, 158, 161growth of networks in, 186-189importance of soil classification and survey in, 137,
160-161, 193-202, 204-212, 215-217 (see alsoBenchmark Soils Project)
computer assistance in, 193, 196, 200-202methods of assessing biological productivity,
196-200in Australia, 193-202in Ghana, 145, 153in Peninsular Malaysia, 59research network in tropical soils
establishment of, 210, 215-217need for, 185-186, 189-191, 207-209requirements of, 191-192
role of agricultural research stations in, 6, 99, 202,207-209, 215-217
AID. See U.S. Agency for International DevelopmentAlaska, soil survey in, 9Alfisols, 7. See also Boralfs; Haplustalfs; Paleustalfs;
Plinthustalfs; Rhodustalfs; Tropaqualfscharacteristics of, in semiarid tropics, 222in Sri Lanka, 155-161
Alkalinity of soilsin India, 74in Pakistan, 166in semiarid tropics, 223
All India research projects, 74, 111, 116, 186, 236,241
Alluvial soils. See also Entisols, in semiarid tropics
for rice cultivation in Korea, 70 (Table 4)in Ghana, 147in India, 78 (Table 2), 107-109, 110, 119, 121, 122
(Fig. 6)in Iran, 29 (Table 1), 31, 32-33, 164in Peninsular Malaysia, 54-55 (Table 9), 59
American Society of Agronomy (ASA), 96-97Approximations. See also 7th Approximation
series of, in Soil Taxonomy, 6, 15"First Approximation" classification system pro-
posed for rubber, 54-55 (Table 9), 56Aquic soils, 7, 21-22, 27Aridic soils, 21, 23, 25Aridisols, 7, 8, 25. See also CamborthidsArid regions. See also Semiarid regions
aridic moisture regime in, 23in India, land use of, 117-125, 169in Iran, 28, 31-34
Atlas of American Agriculture (Marbut), 5Atlas of Australian Soils (Northcote), 196, 198Australia
agrotechnology transfer in, 193-202seminar participant, ix, 281
Bajra. See Millet, cultivation ofBangalore. See India, region of Karnataka State inBangladesh
agricultural development in, 171-172, 175seminar participant, ix, 281use of soil surveys in, 87, 164, 171-172
Barley, cultivation ofin India, 121in Iran, 28, 33worldwide research on, 97, 98-99, 188-189
(Table 1)Basic Principles of Soil Classification (Cline), 13Benchmark Soils Project, 210-217
establishment of research locations in semiaridtropics, 227, 238
establishment of tropical soils network in, 210,214-217
location of sites in, 213-214types of experiments in, 212-214
295
296 SUBJECT INDEX
research by Universities of Hawaii and Puerto Rico,192, 210
use of, in land evaluation, 137Book of Agriculture (Ibn Muhammad), 3-4Boralfs, 25Borolls, 25
Camborthids, 122 (Fig. 6)Canada, soil-capability classification in, 87Cassava production
in Ghana, 146research by IITA and CIAT in, 188 (Table 1)
Castor, cultivation of, in India, 107, 110, 244-245Central African Empire, seminar participant, ix, 281Cereal production. See also by specific name
in Iran, 31-33research by IITA in, 188 (Table 1)
CGIAR. See Consultative Group on InternationalAgricultural Research
Chickpeas, cultivation ofin India, 169, 249-251research by ICRISAT on, 188 (Table 1), 190
China. See People's Republic of ChinaChristmas Island, soil surveys on, 87Chromusterts, 78-79CIAT. See International Center for Tropical
AgricultureCIMMYT. See International Center for the Improve-
ment of Maize and WheatCIP. See International Potato CenterCitrus. See Orchard cultivationClassification. See Land classification; Soil classifica-
tion; Taxonomie classificationsClay content in soils
importance of, in Peninsular Malaysia, 43-49, 51,52 (Table 7), 61 (Table 12)
in India, 107, 109-111, 115, 119-123, 243-244, 247in Iran, 33in semiarid tropics, 222-223, 243-244in watershed development, 77-79, 81
Climate. See also Climatic parameters; Environment;Precipitation; Rain-fed agriculture
importance of, in agrotechnology transfer, 97,213-214
influence of, in soil-survey interpretation, 74, 86,88, 164
in semiarid tropics (see Semiarid regions, of tropics,characteristics of)
monsooneffect of moisture regimes on, 22in Bangladesh, 171in India, 107, 114
Climatic parameters, 20-27. See also Soil moistureregime; Soil temperature regime
effects of, on crop production, 20, 26-27in land-use planning and development, 20, 26-27in Soil Taxonomy, 25-27in technology transfer, 26-27, 206-207use of, in soil maps, 26
Cocoa productionin Ghana, 143, 149-151, 152in Peninsular Malaysia, 59in West Africa and Latin America, 87
Coconut productionin Ghana, 152
in Peninsular Malaysia, 59in Sri Lanka, 155on Christmas Island, 87
Cocoyam production, in Ghana, 146, 147College of Agriculture of Seoul National University,
68Colluvial soils
in Ghana, 152in India, 78in Iran, 29, 31
Colorado, land-use planning in, 96Computer analysis
analogue methods of, 196-199display techniques for, 91, 95-96, 99Soil Data Bank, 217use of, in agrotechnology transfer, 193, 196,
200-202Conservation
importance of, in Ghana, 145silt pits as measure of, 60 (Table 12)soil
in Pakistan, 166-167in Peninsular Malaysia, 41, 60 (Table 12)programs in India, 74, 76, 114
soil and waterin India, 109, 114in Iran, 28, 35-36practices of, in semiarid tropics, 228, 237
waterin People's Republic of China, 173in Sri Lanka, 156, 158
Consultative Group on International AgriculturalResearch (CGIAR), 185, 187-191, 201
Cotton productioneffect of contour bunding on, in semiarid tropics,
234in Ghana, 147 (Table 2), 149, 152in India, 115, 121, 169in Iran, 32, 33, 164
Cotton Production Company, in Ghana, 149Council for Scientific and Industrial Research,
152-153County Resource Inventory Handbook, preparation
of, in Montana, 102Cover, legume. See MulchingCowpeas, cultivation of
in Ghana, 147 (Table 2)in India, 110, 114,244research by IITA in, 188 (Table 1), 190
Critique of Pure Reason (Kant), 13Crop production. See also by specific crop
effect of climatic parameters on, 20, 26-27effect of international transfer networks on,
186-190, 210, 215effect of soil-suitability criteria in Australia on,
195-196in Bangladesh, 171-172in Ghana, 87, 143-153in India, 104, 107-119, 121, 123, 125-129, 169, 171in Iran, 28, 31-37, 164in Pakistan, 166in Peninsular Malaysia (see Rubber production)in semiarid tropics, 221-226, 228-230, 234-236,
238-241, 244-251in Sri Lanka, 155-161
SUBJECT INDEX 297
in watershed development, 74, 82irrigated (see Irrigation)kharif (see Kharif season)methods in assessment of, 196-200rabi (see Rabi season)rain-fed (see Rain-fed agriculture)trend toward improved technology in, 177-180, 181,
185-191, 228use of soil maps in, 117-129, 143, 145-146
Cryic soils, 23-24, 27CSIRO Division of Soils, soil survey in Australia, 194Cultivated lands. See Fanning practices
Development. See Land development; Nationaldevelopment; Regional development; Soilgenesis
Display techniques, for land-use planning, 91-103Drainage of soils
importance of, in Peninsular Malaysia, 41, 44-47,49, 50 (Table 4), 51, 56, 60-61 (Table 12)
influence of, in watershed development, 76in Ghana, 145-147, 151in India, 107, 109-111, 171, 250-251in Iran, 31-35, 164in Pakistan, 166in rice cultivation in Korea, 69, 70, 73in semiarid tropics, 236, 238, 241in soil classification in Australia, 195in Sri Lanka, 156, 158-160
Dry farming. See Farming practices, drylandDystrandepts, Hydric, family of, in Benchmark Soils
Project, 211, 214, 215Dystropepts, 44, 47, 50, 51
Engineering development. See Interpretation, soil-survey, in engineering
Entisols. See also Quartzipsamments; Torrifluvents;Torripsamments; Ustifluvents
characteristics of, 7, 8classifications of, in rubber cultivation in Penin-
sular Malaysia, 52 (Table 7, 8), 54-55(Table 9)
effect of climatic parameters on, at great grouplevel, 26
in semiarid tropics, 223Environment. See also Climate
importance of concept in rubber production, 41-42,49,57-58
in agrotechnology transfer, 161, 197, 202, 208-209,216-217
in land evaluation, 130-139in land-use planning, 97-99, 117-119, 130-132legislation to protect, 173relationship of, with crop production, 177-179, 197
Erosion. See Soil erosionErosion-intensity units, 74-75. See also Soil erosionEthiopia, seminar participant, ix, 281Eutrustox, Tropeptic, family of, in Benchmark Soils
Project, 211-212, 214-215Evaporation
in India, 117-119, 121, 123, 127in semiarid tropics, 240in Sri Lanka, 157
Evapotranspiration, 21-23in India, 118-119, 123, 125, 127
patterns of, in semiarid tropics, 225, 229-230use of maps for, in barley production, 98
Family, soil. See also by specific nameeffects of temperature regimes on, 25, 27in classification of Peninsular Malaysia, 52
(Table 7)in Soil Taxonomy, 8, 15-16phases of, in watershed development, 74use of, in agrotechnology transfer, 204-210,
214-217use of, in Benchmark Soils Project, 210-212,
214-217FAO (Food and Agricultural Organization of the
United Nations)agricultural development programming by, 163-165,
171, 174-175, 217projects of, 67, 87-88, 132, 163-165, 171, 174-175,
217soil classification of (see FAO/UNESCO World
Soil Map, legend of)soil-survey research by, 97, 163-165, 201
FAO/UNDP, programs and policies of, 174-175FAO/UNESCO World Soil Map
legend of, 17, 28, 29-30 (Table 1), 137problems using, in agrotechnology transfer, 197-198.use of units of, on soil map in Ghana, 143, 145
Farming practicesdryland
in Australia, 195in India, 104, 107, 109-110, 114-115, 118, 121,
123, 125in Iran, 31-36of barley, 98-99
early, 4-5in Bangladesh, 171-172in Ghana, 143, 145-153in Pakistan, 166in People's Republic of China, 173in Sri Lanka, 155-160wetland, in India, 80, 88, 107, 110
Fertilizersavailability of, in Ghana, 146in India, 109-111, 114-115, 169, 245-246in Iran, 164-165in Peninsular Malaysia, 41-42, 58-61in People's Republic of China, 173in semiarid tropics, 228-229, 233, 243in soil classification of Ireland, 87in Sri Lanka, 159-160need for, in Korea, 68-69need for, in Dystrandepts and Eutrustox, 211-212
Fisheries, in Bangladesh, 172Flooding of soils
in Bangladesh, 171-172in India, 120-121, 125in Iran, 31in Peninsular Malaysia, 60 (Table 12)in semiarid tropics, 228-229
Fluvisols, 70 (Table 4)Food Production Corporation, farms of, in Ghana,
147Forest and woodland soils
classification for, in Ghana, 88, 143, 152in Bangladesh, 172
298 SUBJECT INDEX
in India, 107-108, 169in Iran, 28, 35-36in Sri Lanka, 158soil-survey interpretation in development of, 74, 88use of Hydrandepts in Hawaii for, 26-27
Framework for Land Evaluation, 87, 132, 174-175France
seminar participant, ix, 281soil classification system in, 14, 15, 143, 145use of soil survey in, 88-89
Frigid soils, 23-24
Gallatin County (Montana), soil maps of, 95, 97,100-101
Gambia, soil surveys in, 87Ghana. See also Food Production Corporation; OFYI
programscrops grown (see Crop production, in Ghana)national development goals in, 87, 143-153role of Soil Research Institute in, 143-145, 147-149,
151, 153seminar participant, ix, 282soil survey in (see Soil survey, in Ghana)use of soil maps in, 143-152
Ginger production, in Ghana, 151Gleysols, 30, 32, 55 (Table 9), 70 (Table 4)Grains and Legumes Development Board, Ghana, 149Gram, cultivation of, in India, 110, 121, 125, 129,
244, 249 (Table 12)Grape production, in India, 107, 110, 111, 115Grazing, rangeland for
in India, 121in Iran, 31-36in Pakistan, 166
Great groups, soil. See also by specific nameemphasis of climatic parameters in, 26in classification of Peninsular Malaysia, 52, 53in India, 107in So/7 Taxonomy, 8, 15in Sri Lanka, 156
Green revolutioneffect of, on land quality, 177, 181in Asia, 104influence of, on development of international
transfer networks, 185-187technology of, 186
Groundnut productionin Ghana, 146 (Table 1), 147 (Table 2), 149, 152in India, 107-108, 110, 244research by ICRISAT in, 188 (Table 1), 190
Ground waterdevelopment in Pakistan, 166importance of, in soil-survey information, 96in aquic soils, 22in semiarid tropics, 228-229, 236in soils of Iran, 32in Sri Lanka, 156
Guidelines for Soil Description, 91Guinea corn production, in Ghana, 146, 147 (Table 2)
Halomorphic soils, 7, 32Haplorthox, 43, 45, 47, 49-56Haplustalfs
in soils of India, 107problem soils of, in Sri Lanka, 155-156, 158, 160
Hawaiiland evaluation in, 96pineapple production in, 27research work at University of (see Benchmark Soils
Project)use of Hydrandept soils in, 26-27use of Hydric Dystrandept soils in, 211, 214-215use of Tropeptic Eutrustox soils in, 211
Histosols, 7, 24-25Horizons of soils, 4, 7-8, 10, 91
effect of climatic parameters on, 20, 22, 24in India, 74, 81in Iran, 32-33in Peninsular Malaysia, 47, 49, 51oxic, 15spodic, 15
Horse gram. See Gram, cultivation ofHyderabad, India, seminar at. See "Uses of Soil
Survey and Classification. . . . "Hydrandepts, 26-27Hydrologie soil groups, in India, 73, 81Hydromorphic soils, 6, 7, 32, 158Hyperthermic soils, 23, 25, 78-79 (Table 2), 120
(Fig.5n)
IAS. See Institute of Agricultural SciencesICARDA, 189 (Table 1)ICRISAT. See International Crops Research Institute
for the Semi-Arid TropicsIITA. See International Institute of Tropical
AgricultureILCA, 189 (Table 1)Inceptisols. See also Dystrandepts; Dystropepts;
Hydrandepts; Sulfaquepts; Tropaquepts;Tropepts; Ustochrepts
characteristics of, 7effect of climatic parameters at great group level in,
26under rubber cultivation in Peninsular Malaysia, 52
(Table 7), 54-55in semiarid tropics, 223
Indiaagricultural development in Rajasthan region of,
164, 167-171classification of units in (see Soil classification, in
India)development of technology transfer network in
wheat in, 185-187land-use planning in, 117-129management of rain-fed agriculture (see Rain-fed
agriculture, in India)region of Karnataka State in, 104-116rice production in, 80-81, 107seminar participant, ix, 282-283soil data of northern plains area in, 119-129soil survey in (see Soil survey, in India)watershed development in, 73-82
Indonesiaseminar participant, ix, 283FAO agricultural development programming for,
175Institute of Agricultural Sciences (IAS), in Korea, 67Institute of Horticultural Research, in India 111, 116International Center for the Improvement of Maize
and Wheat (CIMMYT), 185-188 (Table 1)
ISUBJECT INDEX 299
I International Center for Tropical Agriculture (CIAT),188 (Table 1), 189-190
| International Crops Research Institute for the Semi-Arid Tropics (ICRISAT), ix, xi, 188 (Table 1),189-190
location of, 226management research programs of, 205, 215-216,
221, 223-225, 227-229, 236-241, 248seminar participant, ix, 286
International Institute of Tropical Agriculture (HTA),188 (Table 1), 189-191
International Potato Center (CIP), 188 (Table 1)International Rice Research Institute (IRR1), 68, 181,
185-189, 188, (Table 1)International Soil Science Society, soil-survey
research, 97, 201Interpretation
of soil maps, in arid and semiarid agriculture,117-129
soil surveyfor farming, 96, 98-99for 'Tongil' rice production in Korea, 67-72for watershed development, 73-82importance of teamwork in, 3, 10, 111, 115, 134,
160in engineering, 39, 86, 89, 109, 211influence of climatic parameters on, 26in India, 73-82, 110-115in Iran, 31in land-capability classification, 86-90in land evaluation and planning, 10, 86-91,
95-99, 101-103, 131in Peninsular Malaysia, 41-42, 58-64limitations of, 86, 87, 90objectives of, 86-87, 89-91, 109, 207parametric methods in (see Parametric system)use of maps in, 95-98, 111
Inventories. See Land-resource inventoriesIran
agricultural development in Khuzestan in, 164-165,166 (Table 2)
agricultural potential of soils in, 31-37, 164land-resource inventories in, 28-29, 31, 36-37land use in, 28-37 (Table 1), 164-165seminar participant, ix, 283soils of, 31-36soil survey in, 28, 29-31, 36-37, 164-165use of soil maps in, 28, 29, 36-37, 164
Ireland, soil-suitability classification in, 87IRRI. See International Rice Research InstituteIrrigation. See also Water resources
in Australia, 195in Bangladesh, 172in Ghana, 143, 151in India, 74, 81-82, 107-110, 114-117, 120-123,
128-129, 169-171in Iran, 28-29, 31-37, 164in Korea, 68in Pakistan, 165, 166in People's Republic of China, 173in semiarid tropics, 223, 235, 240-241, 244,
246-247, 249-251in Sri Lanka, 155-161use of maps to display, 98, 120-121
Irrigation-suitability classes, in India, 73, 81-82
Isofrigid soils, 24-25Isohyperthermic soils, 25, 27, 52 (Table 7)Isomesic soils, 25Isothermic soils, 25, 27Italy, seminar participant, ix, 283Ivory Coast, seminar participant, ix, 283
Jute production, in Bangladesh, 171
Karnataka State. See India, region of KarnatakaState in
Kenya, seminar participant, ix, 283Kharif season
definition of, 121, 126 (Table 1 n), 225 neffect on crops in India, 114-115, 121, 123-129
(Table 1), 250-251influence on soil moisture regime in semiarid
tropics, 224 (Table 1), 225Khuzestan. See IranKidney beans, cultivation of, in India, 117, 121, 125Korea. See also South Korea
agricultural development in, 67-68production of 'Tongil' rice variety in, 67-72soil survey in, 67-72
Korea Soil Survey Project, 67
Land appraisal. See Land evaluationLand attributes, importance of, in land evaluation,
130, 132-133, 137.Land capability
as basis of soil ratings in Montana, 97classification system
in Iran, 28-37in Peninsular Malaysia, 59in soil survey in India, 73, 77, 80-81, 109in the United States (see Land Capability
Classification of U.S. Soil ConservationService)
role in agricultural planning, 87-89, 145shortcomings of, 88-89soil-survey interpretation in, 86-90
use of data in planning, 95, 98, 101-102use of maps of, 98-99, 102, 145use of, in Benchmark Soils Project experiments, 214
Land Capability Classification of U.S. Soil Conserva-tion Service, system of soil classification, 86,131, 137-138
Land characteristics, in land evaluation, 130, 133,134, 137, 139. See also Land qualities
Land classification. See Land capability; Land evalua-tion
Land developmenteffect of climatic parameters on, 20, 26-27effect on land quality, 177, 180-181importance of resource inventories in, 96, 101, 103influence of land evaluation on, 130-139in Ghana, 143-145in India, 169in Iran, 28-29, 31-37laws governing, 96, 103use of interpretative displays in, 98-99, 101
Land evaluationimportance of, in land-resource inventories, 95-96,
99, 103
300 SUBJECT INDEX
importance of, in rubber production in PeninsularMalaysia, 41, 59, 64 (Table 14)
in agricultural land-use planning, 130-139, 177-181in India, 169in Iran, 28-29, 31, 36-37, 164-165role of soil-survey interpretation in, 10, 86-91,
95-99, 101-103, 131use of soil maps in, 95, 99, 129
Land potentialimportance of defining in planning, 95, 96, 134-137inadequacy of soil surveys in defining, 97use of display in, 96, 98-99, 103
Land qualitiesassigning of values of, 135-137, 138, 139effect of land development on, 177, 180-181importance of, in land evaluation, 130, 133,
134-139, 177-181influence of, on cost/benefit ratio, 138, 139,
179-180influence of, on environmental control, 138-139,
177-179Land-resource inventories
dissemination of information on, 97, 99-102in Iran, 28, 29, 31,36-37in land-use planning, 95-97, 163recommendations to increase usage of, 102-103use of in agrotechnology transfer, 209weaknesses of, 95, 96, 97
Land selectionfor agriculture in Ghana, 143, 145, 146-147, 151for cultivation of 'Tongil' in Korea, 67-72for watershed development in India, 81
Land unitsas management units, 137-138in land evaluation, 130-133, 137-139interaction with land utilization types, 130
Land use. See also Land-use planningabuses of, 96, 101-102definition of, 95importance of land evaluation and planning in,
96-97, 102, 109, 130-139, 174, 177-180in Bangladesh, 171-172in India, 74-82, 104-109, 118, 121, 123, 125-129,
169in Iran, 28-29, 31-37Pakistan, 166in rice production in Korea, 67-68, 71in rubber production in Peninsular Malaysia, 43,
59-64in semiarid tropics, 228-229, 233in Sri Lanka, 156-157, 160legal requirements in, 96, 103methods of displaying, 98-99, 118, 145programs in Montana, 101-102types of, 130-139, 174, 177-180
Land-use planning. See also National development;Regional development
display and dissemination methods in, 95-103effect of climatic parameters on, 20, 26-27importance of land evaluation in, 130-139, 174,
177-180importance of resource management in (see
Resource management, importance of, inland-use planning)
importance of soil-survey interpretation in {see In-
terpretation, soil-survey, in land evaluationand planning)
in Bangladesh, 172in India, 104-105, 108-129, 169in Iran, 28-29, 31-37, 164-165in Pakistan, 166-167in Sri Lanka, 155, 158-160policies of, 172-173research projects and programs in, 96-97, 101-102,
109-115use of soil survey in (see Soil survey, in land-use
planning)Land utilization types. See Land use, typesLa ten ties. See also Oxisols, characteristics of, in
semiarid tropicsin Ghana, 152in India, 107, 109, 114
Latin America, soil surveys in, 87Legislation, importance in effective use of resources,
96, 103, 163, 166, 169, 172-173Lentil, cultivation of, in India 121Livestock. See also Grazing, rangeland for
in Ghana, 87, 143, 145, 152-153research by ILCA and ICARDA in, 189 (Table 1)
Logic of Modern Physics (Bridgeman), 15, 19
Maha Illuppallama Agricultural Research Institute, inSri Lanka, 156-157, (Table 1), 159, 161
Maize productionin Ghana, 143, 146-147, 152in India, 114, 117, 125, 126 (Table 1), 129, 251in semiarid tropics, 240-241research by CIMMYT in, 185-186, 188 (Table 1)use of, in experiments of Benchmark Soils Project,
213Malawi, seminar participant, ix, 283Malaysia, seminar participant, ix, 283. See also Penin-
sular MalaysiaManagement. See Resource management. See also
ICRISAT, management research programs ofMapping. See also Maps, soil
of soilsin Australia, 194-195in Ghana, 143-145in India, 109-111, 115, 117-129in Iran, 32, 164in Peninsula Malaysia, 41, 55, (Table 9 n), 59-64in watershed development, 73, 75-77, 80
unitscompound land, definition of, 138effect of, on scale of map, 118, 121used in Ghana, 143, 145used in Sri Lanka, 156use of computers for descriptions of, 99
Maps, soil. See also Display techniques; Mappingcharacteristics in, 26, 102-103importance of, in land-use planning, 70, 86, 95-98,
100, 102-104, 109, 115-129in Australia, 195in Bangladesh, 171in crop production, 117-129, 143, 145-146in France, 89in Ghana, 143-153in India, 73-77, 81, 107, 115, 117-129, 168-169in Iran, 28-29, 36-37, 164
SUBJECT INDEX 301
in Korea, 67-68, 70, 72in Peninsular Malaysia, 41, 43, 59-64in Sri Lanka, 156, 159types of
base, 4, 9, 91, 103, 109, 110reconnaissance, 41, 43 (Fig. 1), 59, 63 (Fig. 3),
67-68, 70, 72-77, 81, 118-119, 121-125single-factor, 86, 91, 102soil-suitability, 143, 145-146
use of climatic parameters in preparation of, 26I Mesic soils, 23, 25I Millet, cultivation of
in Ghana, 146, 147 (Table 2)in India, 110, 117, 121, 123-126, 129, 169in semiarid tropics, 230, 232, 241, 244research by ICRISAT in, 188 (Table 1)
Moisture. See Precipitation; Soil moistureMoUisols, 7, 8, 15. See also BorollsMontana, land-use planning in, 95-103Moth. See Kidney beans, cultivation ofMulberry production, in India, 108-109Mulching
in rubber production in Peninsular Malaysia, 47,58,61
in semiarid tropics, 222-223, 234, 241in watershed development, 74practices, in India, 110, 115, 244-246, 248-249
Murrum, in semiarid tropicsin Alfisols, 222soil characteristics of, 243, 247, 251
Mustard, cultivation of, in India, 121, 129
National Cooperative Soil Survey of the UnitedStates, 16
National development. See also Land-use planning;Regional development
in Sri Lanka, 155-161policies, 172-173program in Ghana, 143-153program in Korea, 67soil survey in (see Soil survey, importance in na-
tional and regional development)National Soil Survey Organization, in India, 115National Soil Survey Project, in Sri Lanka, 156Natural classifications. See Taxonomie classifications,
systems ofNepal
seminar participant, ix, 283-284FAO agricultural development programming for,
175Netherlands, seminar participant, ix, 284New Zealand, seminar participant, ix, 284Niger. See Oilseed, cultivation ofNigeria
seminar participant, ix, 284agrotechnology transfer in, 161
Northeast Savannah Research Project, joint venturebetween Ghana and the United States, 152-153
Ochrosols, 147Office of Rural Development (ORD), in Korea, 67-68OFYI. See Operation Feed Yourself and IndustriesOil palm production
in Ghana, 146 (Table 1), 148 (Fig. 2), 149, 152soil suitability for, 59, 88
Oilseed, cultivation of, in India, 107, 108 (Fig. 3),110, 117, 123, 125, 169
Operation Feed Yourself and Industries (OFYI), inGhana, 143, 145-147, 149, 152
Orchard cultivationin Ghana, 151-152in India, 107, 109-111, 115-116, 169in Iran, 31, 34-36, 164
ORD. See Office of Rural DevelopmentOrders, soil. See also by specific name
effects of climatic parameters on, 25in classification of Peninsular Malaysia, 52
(Table 7)in Soil Taxonomy, 7, 15
Oxisols, 7, 16. See also Eu trust ox; Haplorthoxcharacteristics of, in semiard tropics, 223effects of climatic parameters on, 25in classification for rubber production, 52, 54-55oxic horizons, 15
Paddy (soils), 70, 73, 80. See also Rice productionPakistan
agricultural development in, 164, 166-167, 175, 187use of soil survey in, 87, 164, 165-166
Paleudults, 43-45, 47, 49-51Paleustalfs, 107, 161Pans
claypans, 10effect of, in rubber production in Peninsular
Malaysia, 43, 49, 51-56, 61 (Table 12)hardpan, in India subsoil, 109-110ironpan, in Ghana, 152
Paper industry, in Iran, 164Parametric system
in land evaluation, 131, 133, 137, 139in soil-survey interpretation, 88-90
Parent material. See Soil genesis, influence of parentmaterial on
Pasture landsin Bangladesh, 172in Ghana, 143, 152in India, 107in Iran, 29, 32-33, 35-36use of Hydrandept soils for, in Hawaii, 26-27
Peat. See Rubber production, effect on rubber yieldsPedons, definition of, 7, 13Peninsular Malaysia. See also Malaysia
rubber production in, 41-66soil classification system used, 41technical grouping system proposed in, 56-57
People's Republic of China, 3, 11, 173Pepper, black, production of, in Ghana, 151Pergelic soils, 23Permeability of soils, 73-74, 80-81Philippines, seminar participant, ix, 284pH of soils. See Acidity of soil; Alkalinity of soilPineapple production
in Ghana, 151-152in Hawaii, 211suitability of ustic soils for, 27
Plaintain production, in Ghana, 146-147Planning. See Land-use planning; National develop-
ment; Regional developmentPlinthudults, 45, 48-49Plinthustalfs, in India 107
302 SUBJECT INDEX
Plowing methodsin India, 110, 114, 244-251in Peninsular Malaysia, 58, 60-61 (Table 12) 'in People's Republic of China, 173in semiarid tropics, 233-235, 238-239, 241in Sri Lanka, 158
Podzolic soilsin Iran
grey-brown, 30, 35-36red and yellow, 30, 34-36
in proposed classification in Peninsular Malaysiagrey, yellowish brown, reddish brown, 55
(Table 9)red and yellow, 54 (Table 9)yellow, pale yellow, 54-55 CTable 9)
Polypedons, definition of, 7. See also PedonsPotato production
in India, 108 (Fig. 3)-109research by CIP in, 188 (Table 1)
Precipitation. See also Rain-fed agriculture; Soilmoisture; Water resources
effect of, on, evapotranspiration, 22effect of, on soils in Hawaii, 26-27in barley production, 98in India, 107-129in Iran, 28, 32, 34, 36in semiarid tropics, 224-251in Sri Lanka, 157 (Table 1), 160in watershed development, 74, 81-82
Puerto Rico. See Benchmark Soils ProjectPulses, cultivation of, in India, 107-108 (Fig. 3), 110,
121, 123, 125, 169
Quartzipsamments, in Peninsular Malaysia, 44 (Table1 n), 52 (Table 7), 53 (Table 8), 54 (Table 9)
Rabi seasondefinition of, 121, 126 (Table 1 n) 225 neffect on crops in India, 121, 123, 125, 126 (Table
1), 129, 248-25!influence on soil-moisture regime in semiarid
tropics, 224 (Table 1), 225Ragi production, in India, 107-108, 110, 114Rain-fed agriculture
in India, 107-109, 121-125, 169, 243-251in Pakistan, 165-166in Sri Lanka, 155-161
Rajasthan Land Development Corporation (RLDC),establishment of, in India, 169
Reclamationof arable lands in Korea, 68of land in Pakistan, 166of soils in India, 129, 169of soils in Iran, 32, 164
Regional development. See also Land-use planning;National development
in Ghana, 143-153in India, 73-74, 169-171in Iran, 28-37, 164-165in Sri Lanka, 155-161soil survey in, 9, 67, 102, 163
Regosols, in Iran, 29, 31, 33, 34, 36Rendzinas
in functional analyses, 198-199in Iran, 30, 35-36
Report of Coordinated Scheme for IrrigationResearch, in India, 121
Resource management. See also ICRISAT, manage-ment research programs of
FAO policies on, 174-175importance of, in land evaluation, 130-139,
177-181importance of, in land-use planning, 86-89, 96-97,
109-111, 114-129, 177importance of, in rubber production in Peninsular
Malaysia, 41-42, 55 (Table 9 n), 56-64in Ghana, 145, 149in India, 80, 109-116, 169, 171in Iran, 28-29, 31-37, 164-165in People's Republic of China, 173in semiarid tropics, 228, 233-241, 243-251problems in Sri Lanka, 155-161techniques in rice production, 67-72transferability of systems, 214-216
Rhodustalfsproblems soils of, in Sri Lanka, 155-156, 158, 160Typic
in Sri Lanka, 156in soils of India, 78, 107
Rice productionin Bangladesh, 171in Ghana, 143, 146-147, 151-152in India, 80-81, 107-108, 121, 125, 169, 246in Iran, 32-33in Korea (see 'Tongil', cultivation of)in Sri Lanka, 155-160international transfer network for, 185-186
Root developmentdefinition of zone of, 23in rubber production, 45-47, 51in 'Tongil' production, 68of crops in Sri Lanka, 158shallowness of, in India, 109-110, 243, 244, 245
RRIM. See Rubber Research Institute of MalaysiaRubber production
effect of peat on yields of, 49, 51, 61 (Table 12)influence of soil properties and groupings on,
41-56, 58-59in Peninsular Malaysia, 41-66in Sri Lanka, 155proposed technical grouping system for, 56-58,
60-61 (Table 12)use of nutrient surveys to diagnose fertilizer needs
in, 41, 58-59use of soil survey in, 41-42, 58-64
Rubber Research Institute of Malaysia (RRIM),41-43, 51 (Table 6)
Russia, early soil classifications in, 4-5, 10-12, 14Rwanda, seminar participant, ix, 284
Salinity of soilsimportance of, in early classifications, 4in aridic soils, 23in India, 123, 129, 247-248, 250in Iran, 31-35in Pakistan, 166
Sand content in soilseffect of, on rubber production, 43-44, 46 (Table
2), 49, 51, 60-61
SUBJECT INDEX 303
in India, 77, 79, 107-111, 117, 119-121, 123, 125,244
in Iran, 31-32, 34in semiarid tropics, 222-223
Sediment yield index (SI), computation of, 75-76Semiarid regions
ICRISAT research in, 205, 221in India
land-use in, 118-129, 169land-use planning in, 117-119rain-fed agriculture in (see Rain-fed agriculture,
in India)in Iran, 28, 32-34of tropics
characteristics of, 229-233resource management practices in, 228, 233-241,
243-251soils of, 221-223, 232-233, 243-248, 250-251water as a major constraint in, 221, 223-226,
228-229Series, soil. See also by specific name
as mapping unit in Ghana, 145in classification of India, 74, 77-81, 107, 109-111,
118-120, 122-127, 129in classification of Peninsular Malaysia, 43-55in So/7 Taxonomy, 7-8, 15-16
Sesame, cultivation of, in India, 110, 121, 1257th Approximation, 6, 11, 15, 19
influence of, on classification of Sri Lanka, 156,161
supplements to, 67th International Congress of Soil Science, in
Madison, 6Silt content in soils. See also Sediment yield index
effect of, on rubber yields, 51in India, 119-120in watershed development, 74-75, 78, 81
Site-factor methods, in assessing biological productivi-ty, 196, 197, 199-200
Slope of soilimportance of, in India, 107, 109-111, 119, 122importance of, in rubber production in Peninsular
Malaysia, 41, 43-49, 58, 60-61influence of, in watershed development, 74, 76,
78-81in Ghana, 146-147, 151-152
Soil characteristics. See Soil propertiesSoil classification
background of, 3-7, 12, 13effect of climatic parameters in, 20, 25-27in agrotechnology transfer, 137, 160-161, 193-202,
204-212, 215-217importance of worldwide system of, 137,
160-161, 204 (see also Benchmark SoilsProject)
systems ofbackground of, 3-6, 12-18FAO/UNESCO (see FAO/UNESCO World Soil
Map, legend of)for rice production in Korea, 69-72in Australia, 195-196in Bangladesh, 171-172in France, 14, 15, 143, 145in Ghana, 143-145, 151in India, 73, 77-81, 107-111, 122-128
in Iran, 28-37, 164-165in Ireland, 87in Pakistan, 166in Peninsular Malaysia, 41-64in Russia, 14in Sri Lanka, 155-161in the United States (see Soil Taxonomy)land capability (see Land Capability Classifica-
tion of U.S. Soil Conservation Service)taxa of (see Taxa of soil)
Soil colorin early classifications, 3, 4in Ghana, 146-147in India, 78-79, 107-110in soil classification in Australia, 195
Soil Data Bank, at University of Hawaii, 217Soil depth
in classification of Australia, 195in Ghana, 151in India, 74, 78-82, 107-110, 247, 250-251in Peninsular Malaysia, 41, 43-46, 48-51, 56in semiarid tropics, 222-225, 243
Soil erosionin Ghana, 145, 149in India, 74-75, 107, 110-111, 119, 244, 247,
250-251in Iran, 31, 34, 36in Pakistan, 166in Peninsular Malaysia, 49, 60 (Table 12)in semiarid tropics, 222-223, 228-229, 233-234,
236, 238-239in watershed development, 73-74systems to curb, 131
Soil genesisas affected by climatic parameters, 25early concepts of, 4-6, 12-13effect of, on soils in semiarid tropics, 222-223influence of, on soil classification, 3, 7-8, 14influence of parent material in, 4-5, 35, 43, 45, 74,
78-79research in Ghana on, 145, 151
Soil limitationseffects of, on rubber production in Peninsular
Malaysia, 41-42, 56-61development of standard management
practices of, 56-58, 60-61 (Table 12)grading, 56, 60-61 (Table 12)scoring, 53 (Table 8), 56
in India, 110, 115in Iran, 31-36use of display techniques to indicate, 95-99
Soil management. See Resource managementSoil moisture. See also Soil moisture regime; Water
resources, in soilimportance of, in Peninsular Malaysia, 43, 45-47,
49, 51, 60 (Table 12)in Bangladesh, 171-172in India, 117, 121-129, 244, 246, 249, 251in moisture regimes, 21-23in semiarid tropics, 221, 222, 223-226lack of, in Iran, 28, 31-37
Soil moisture control section, 20-24Soil moisture regime
as a climatic parameter, 20-23, 25-27classes of, 21-23
SUBJECT INDEX 304
definition of, 20in early classification, 4influence of, on crop production, 117, 223in Soil Taxonomy, 8, 15, 20-27use of soil moisture control section in, 20-21 (and
Figs. 1, 2)Soil properties, 73, 80. See also by names of specific
propertiesaccessory characteristics defining
definition of, 14use of, in classification systems, 14, 16, 26, 206
accidental characteristics defining, 14as basis of soil classification, 12-16importance of, in crop production in India, 117-129importance of, in rubber production in Peninsular
Malaysia, 41-58in cultivation of 'Tongil' in Korea, 67-71in Russia, 5influence of climatic parameters on, 20-27quantification of, 12-14, 56
Soil Research Institute of Ghana, 143-145, 147-148,149, 151, 153
Soil suitabilityclassification systems of, 80-81, 88, 90, 131-133,
139importance of, in land-use planning in India, 109,
111in crop production, 117in cultivation of 'Tongil' in Korea, 67-72in Ghana, 145-146, 149, 151soil-survey interpretations for, 86, 88
Soil surveycharacteristics and design of, 3, 4, 7-10for agrotechnology transfer, 193-202, 204, 207-209,
214importance of, in national and regional develop-
ment, 9, 28, 29-31, 35-37, 67, 105, 109-111,143-153, 155-161, 163-166, 169, 171-172,204,221
in Australia, 193-202in Bangladesh, 87, 164, 171-172in France, 88in Ghana, 143-153in India, 105, 107, 109-116, 118, 169in Iran, 28, 29-31, 36-37, 164-165in Korea, 67-72in land-use planning, 9-10, 67-72, 81-82, 95-99,
105, 109-116in Pakistan, 87, 164-166in Peninsular Malaysia, 41-42, 58-64in Sri Lanka, 155-161intensities of, 3, 9, 36-37, 67, 89-90, 109-110,
143-147, 149, 156interpretation (see Interpretation, soil-survey)limitations in, 86-88, 97mapping (see Mapping, of soils)reconnaissance (see also Maps, soil, reconnaissance)
in Alaska, 9in Ghana, 143, 145-146in India, 107, 109, 118in Korea, 67-68use of, 89-90
Soil Survey Manual (Soil Survey Staff, Governmentof India), 81, 83. See also U.S. Soil SurveyManual
Soil Taxonomycategories of, 7-8, 16classification system of, 3, 6, 8, 13-16, 89, 91correlation with other systems
FAO/UNESCO and Iranian, 29-30 (Table 1), 137 |Peninsular Malaysia, 43-45, 50-56
effect of climatic parameters on, 20, 25influence on system in Ghana, 143, 145nomenclature of, 7, 15-16, 20, 25, 103, 204-206problems in setting up, 15use of, in agrotechnology transfer, 204-211,
215-217Soil Taxonomy: A Basic System of Soil Classification
for Making and Interpreting Soil Surveys. SeeSoil Taxonomy
Soil temperature regimeas a climatic parameter, 20, 23-27classes of, 23-25definition of, 23effect of air temperature on, 23in So/7 Taxonomy, 8, 20, 23-27, 206-208, 211
Soil textureof soils in semiarid tropics, 222-223, 243importance of, in Peninsular Malaysia, 41, 43-49,
56in classification of Australia 195-196 .influence of, on crop growth, 117, 119-127,
146-147in Ghana, 146-147, 151in India, 107-111, 117, 119-125in Iran, 31-36in Sri Lanka, 159-160 - -in watershed development, 73-74, 76-81
Soil unitsimportance of, in land evaluation, 131, 137in classification systems, 13, 15, 124-125in Peninsular Malaysia, 41, 47, 58-59relationship of, to land use in India, 118, 125
Sorghum, cultivation ofin India, 117, 121, 169, 244, 246, 247, 249, 251in semiarid tropics, 230, 232, 234, 240-241research by CIMMYT and ICRISAT on, 188
(Table 1)South Korea, seminar participant, ix, 284. See also
KoreaSoybeans, cultivation of
in India, 110,251research by UTA in, 188 (Table 1), 190
Spodosols, 7, 15Sri Lanka
agricultural development in Alfisol region of,155-161
background development of, 155-157, 158research programs in, 156-158, 160-161seminar participant, ix, 284use of soil survey in, 155-161
Subgroups, soil. See also by specific nameeffect of moisture regimes on, 22extragrade, 8, 16in classification of Peninsular Malaysia, 47, 52,
54-56in classification of Sri Lanka, 156in So/7 Taxonomy, 8, 15-16intergrade, 8, 16typic, 8, 16
SUBJECT INDEX 305
I Suborders, soil. See also by specific namein classification of Peninsular Malaysia, 52
(Table 7)in So/7 Taxonomy, 8, 15prominence of moisture regimes in, 25-26
I Sudan, seminar participant, ix, 285Sugar beet production, in Iran, 32
| Sugarcane productionin Ghana, 151-152in Hawaii, 26-27, 211in India, 107-108, 169, 251in Iran, 164in Sri Lanka, 160
Sulfaquepts, 45, 47, 50-51Sunflower, cultivation of
in India, 114, 244-245 (and Table 2)in Iran, 164in semiarid tropics, 241
Tanzania, seminar participant, ix, 285Taxa of soils
effect of climatic parameters on, 20, 26importance of, in rubber production in Peninsular
Malaysia, 42, 47in classification systems, 6, 7, 12-15in Soil Taxonomy, 8, 14-16, 20
Taxonomie classifications, systems of, 14, 15, 54-55,(Table 9), 56, 81, 206
Tea productionin Iran, 35-36in Sri Lanka, 155
Thailand, seminar participant, ix, 285Thermic soils, 23, 25Tobacco production
in India, 107in Ghana, 147 (Table 2)
'Tongil', cultivation of. See also Rice productioncharacteristics of, 68relationship of yields to soil conditions, 68-71selection of suitable lands in Korea, 67-72
Torric soils. See Aridic soilsTorrifluvents, 120 (Fig. 5)Torripsamments, 120 (Fig. 5)Transfer of technology. See Agrotechnology transferTropaqualfs, 155-156, 158-159Tropaquepts, 47, 50-51Tropepts, 25Tropics. See also Semiarid regions, of tropics
effects of climatic parameters in, 25, 206land evaluation in 131-139, 177-181soils of, 16, 22, 155-161, 185-186, 189-192,
207-210, 215-217establishment of research network in 210,
215-217need for international research transfer network
in, 185-186, 189-192, 207-209work of experiment stations in, 207-209
Tropohumults, 211-212, 214Tropudults, 43, 46-47, 212
Udic soils, 21, 22, 25, 26Ultisols. See also Paleudults; Plinthudults;
Tropohumults; Tropudultsas region in Sri Lanka, 155, 157
effects of climatic parameters on, 25in Peninsular Malaysia, 52, 54-55
UNDP. See United Nations Development ProgramUnited Kingdom, seminar participant, ix, 285United Nations Development Program (UNDP), pro-
jects of, 67. See also FAO/UNDPUnited States
legal requirements for land development in, 96, 103seminar participant, ix, 285-286soil classifications in, 5-6, 11, 12, 14, 86use of So/7 Taxonomy in, 6-7, 11, 14-15
U.S. Agency for International Development (AID), inBenchmark Soils Project, 210, 215
U.S. Bureau of Reclamation (Department of Interior),soil-suitability classification of, 131
U.S. Department of Agriculture (USDA)development of So/7 Taxonomy by, 15research projects of, 96
"Uses of Soil Survey and Classification in Planningand Implementing Agricultural Development,"seminar on, ix, 215
participants in, ix, 281-287proceedings of, xi, 253-280
U.S. Soil Conservation Service (SCS)development of So/7 Taxonomy, by 15land assessment procedures of, 96land-capability classification of, 86, 131, 137-138research on soils of the tropics, 16soil-survey data, 87-88, 99
U.S. Soil Geography Unit (SCS, USDA), soil distribu-tion map of, 26
U.S. Soil Survey Laboratory Methods, 16U.S. Soil Survey Manual, 16, 90, 201U.S. Soil Survey Staff (SCS, USDA), development of
So/7 Taxonomy by, 6, 7Ustic soils, 21-22, 25, 27Ustifluvents, 107-109Ustochrepts, 78-79, 122 (Fig. 6)Ustorthents, 79U.S. Universities' Consortium on Tropical Soils, ix
Vegetable productionin Ghana, 146-147, 151in India, 109-111, 115, 169in Iran, 164
Vertisols, 7. See also Chromustertscharacteristics of, in semiarid tropics, 222-223effects of climatic parameters on, 25
Wageningen (The Netherlands), FAO consultation onprinciples of land evaluation at, 132, 174
Wastelandin India, 107in Iran, 29, 31-35
Water, collection and storage ofin India, 73-81, 107, 110, 114, 125-129, 244,
246-247, 249-251in Matatilla catchment, 73, 75-81in River Valley Project, 74in semiarid tropics of, 244, 246-247, 249-251
in semiarid tropics, 221, 223-226, 229, 235, 237,239-241
in Sri Lanka, 156, 158Water management. See Resource management
306 SUBJECT INDEXl
Water resources, in soil. See also Irrigation; Soilmoisture; Water table
effects of moisture regime on, 22effects of temperature regime on, 24in Bangladesh, 172infiltration
in soils of India, 110, 123in watershed development, 74, 81
in India, 117, 123, 169, 171in Iran, 31-35, 164-165in Peninsular Malaysia, 45, 49, 60-61 (Table 12)in semiarid tropics, 221, 223-226, 235in Sri Lanka, 155, 157, 160saturation point, definition of, 20significance of soil family properties to, 8, 211
Watershed development. See also Water, collectionand storage of
in India, 73-82in semiarid tropics, 237, 239-241use of Hydrandept soils for, 26-27
Water tableeffect of depth on rubber production in Peninsular
Malaysia, 45-47, 49, 61 (Table 12)in soils of India, 107-109in soils of Iran, 32
West Africa, use of soil surveys in, 87
Western Samoa, seminar participant, ix, 286Wetland. See Farming practices, wetlandWheat production
development of international transfer network(CIMMYT) for, 185-189
effect of contour bunding on, 234-235effect of green revolution on, 104, 186in India, 121, 123, 125-126 (Table 1), 129, 169,
186, 247, 250-251in Iran, 28, 33-34
Wildlife habitatin Sri Lanka, 158land-use planning for, 102use of Hydrandept soils for, 26-27
Wisconsin, regional planning in, 102Woodland soils. See Forest and woodland soils
Xeric soils, 21,23, 25
Yam productionin Ghana, 146-147 (and Table 2)research by IITA in, 188 (Table 1)
Yearbook of Agriculture, 6
Zaire, seminar participant, ix, 286
Related Documents