Soil phosphorus fractionation and nutrient dynamics along the Cooloola coastal dune chronosequence, southern Queensland, Australia C.R. Chen a, ⁎, E.Q. Hou a , L.M. Condron b , G. Bacon a , M. Esfandbod a , J. Olley c , B.L. Turner d a Environmental Futures Research Institute and Griffith School of Environment, Griffith University, Nathan, QLD 4111, Australia b Agriculture and Life Sciences, PO Box 85084, Lincoln University, Lincoln 7647, Christchurch, New Zealand c Australian Rivers Institute, Nathan Campus, Griffith University, Nathan, QLD 4111, Australia d Smithsonian Tropical Research Institute, Apartado 0843-03092, Balboa, Ancon, Panama abstract article info Article history: Received 30 August 2014 Received in revised form 19 April 2015 Accepted 22 April 2015 Available online xxxx Keywords: Soil phosphorus fractionation Organic phosphorus Occluded phosphorus Non-occluded phosphorus Nutrient dynamics Cooloola sequence The amounts and forms of soil phosphorus (P) follow predictable patterns during long-term pedogenesis, but have rarely been examined along subtropical chronosequences. We quantified changes in soil nutrient stocks, fo- liar nutrient concentrations, and the chemical forms of soil P along the Cooloola chronosequence, a series of coastal dunes spanning ca. 500,000 years of pedogenesis in subtropical Queensland. The total P stock in the upper 30 cm of the soil profile declined continuously with soil age, from 229–237 kg ha −1 on the youngest soils (40 years old) to 24–28 kg ha −1 on the oldest soils (195–N 460 ka). In contrast, total carbon (C) and nitrogen (N) stocks increased initially along the chronosequence and then declined in the oldest soils. As a consequence, soil N:P ratios increased continually throughout the sequence, from ≤4 on the youngest soils to 27–30 on the oldest soils. This indication of increasing biological P stress and ultimately P limitation was further supported by a decline in foliar P concentrations and increasing foliar N:P ratios of two common plant genera along the chronosequence. Sequential P fractionation revealed that although all forms of P declined during pedogenesis, young soils contained low concentrations of primary mineral P and relatively high concentrations of occluded P associated with secondary minerals, suggesting that the parent sand originated from strongly-weathered con- tinental soils. We conclude that the Cooloola chronosequence is an important example of long-term ecosystem development under a subtropical climate, although the pre-weathered nature of the parent sand indicates that the sequence represents a modification of the Walker and Syers model of P transformations during pedogenesis. © 2015 Elsevier B.V. All rights reserved. 1. Introduction Biogeochemical theory predicts that soil total phosphorus (P) declines during pedogenesis. At the same time there are changes in soil P chemistry, with a decline in primary mineral P and an accumu- lation of occluded and organic P as soils age (Walker and Syers, 1976). There is also a corresponding accumulation of carbon (C) and nitrogen (N) as soil develops, which results in increasing N:P and C:P ratios and strengthening P limitation through time (e.g., Wardle et al., 2004; Parfitt et al., 2005; Pelzer et al., 2010). Despite its widespread accep- tance, the Walker and Syers model of soil P transformations has been tested on only a few long-term chronosequences: in addition to the four sequences studied in New Zealand by Walker and Syers (1976), including the iconic Franz Josef post-glacial sequence, it has also been examined on basaltic soils along the Hawaiian Islands sequence (Crews et al., 1995) and the Northern Arizona Volcanic Field (Selmants and Hart, 2010), marine sedimentary soils along the Mendocino Terrace sequence (Izquierdo et al., 2013), and coastal dunes at Haast, New Zealand (Turner et al., 2012) and Jurien Bay, Western Australia (Turner and Laliberté, 2015). However, none of these occurs under a subtropical climate. The Cooloola chronosequence consists of a series of overlapping coastal dune systems formed by wind-blown sand along the southern Queensland coast (Thompson and Moore, 1984). The dunes range in age from recent to approximately 500,000 years old (Lees, 2006) and are characterised by marked differences in vegetation (biomass and community composition), soils (e.g. organic matter and nutrients) and biological activity (Thompson, 1981, 1992). The Cooloola chronosequence therefore provides an important opportunity to inves- tigate long-term soil and ecosystem development (e.g., Walker et al., 1987; Wardle et al., 2004). Soil development is largely governed by the highly quartzose parent material, which leads to the formation of podzols on old dunes (e.g., Thompson, 1992). Despite the significance of this chronosequence in terms of contributing to our understanding of ecosystem development, there is little information on the nature of the associated changes in the chemical transformations of soil P along the sequence. Geoderma xxx (2015) xxx–xxx ⁎ Corresponding author at: Griffith School of Environment, Griffith University, Nathan, Qld 4111, Australia. E-mail address: c.chen@griffith.edu.au (C.R. Chen). GEODER-11986; No of Pages 10 http://dx.doi.org/10.1016/j.geoderma.2015.04.027 0016-7061/© 2015 Elsevier B.V. All rights reserved. Contents lists available at ScienceDirect Geoderma journal homepage: www.elsevier.com/locate/geoderma Please cite this article as: Chen, C.R., et al., Soil phosphorus fractionation and nutrient dynamics along the Cooloola coastal dune chronosequence, southern Queensland, Australia, Geoderma (2015), http://dx.doi.org/10.1016/j.geoderma.2015.04.027

Welcome message from author
This document is posted to help you gain knowledge. Please leave a comment to let me know what you think about it! Share it to your friends and learn new things together.
Transcript
Geoderma xxx (2015) xxx–xxx
GEODER-11986; No of Pages 10
Contents lists available at ScienceDirect
Geoderma
j ourna l homepage: www.e lsev ie r .com/ locate /geoderma
Soil phosphorus fractionation and nutrient dynamics along the Cooloola coastal dunechronosequence, southern Queensland, Australia
C.R. Chen a,⁎, E.Q. Hou a, L.M. Condron b, G. Bacon a, M. Esfandbod a, J. Olley c, B.L. Turner d
a Environmental Futures Research Institute and Griffith School of Environment, Griffith University, Nathan, QLD 4111, Australiab Agriculture and Life Sciences, PO Box 85084, Lincoln University, Lincoln 7647, Christchurch, New Zealandc Australian Rivers Institute, Nathan Campus, Griffith University, Nathan, QLD 4111, Australiad Smithsonian Tropical Research Institute, Apartado 0843-03092, Balboa, Ancon, Panama
⁎ Corresponding author at: Griffith School of EnvironmQld 4111, Australia.
E-mail address: [email protected] (C.R. Chen).
http://dx.doi.org/10.1016/j.geoderma.2015.04.0270016-7061/© 2015 Elsevier B.V. All rights reserved.
Please cite this article as: Chen, C.R., et al., Soisouthern Queensland, Australia, Geoderma (
a b s t r a c t
a r t i c l e i n f oArticle history:Received 30 August 2014Received in revised form 19 April 2015Accepted 22 April 2015Available online xxxx
Keywords:Soil phosphorus fractionationOrganic phosphorusOccluded phosphorusNon-occluded phosphorusNutrient dynamicsCooloola sequence
The amounts and forms of soil phosphorus (P) follow predictable patterns during long-term pedogenesis, buthave rarely been examined along subtropical chronosequences.We quantified changes in soil nutrient stocks, fo-liar nutrient concentrations, and the chemical forms of soil P along the Cooloola chronosequence, a series ofcoastal dunes spanning ca. 500,000 years of pedogenesis in subtropical Queensland. The total P stock in theupper 30 cm of the soil profile declined continuously with soil age, from 229–237 kg ha−1 on the youngestsoils (40 years old) to 24–28 kg ha−1 on the oldest soils (195–N460 ka). In contrast, total carbon (C) and nitrogen(N) stocks increased initially along the chronosequence and then declined in the oldest soils. As a consequence,soil N:P ratios increased continually throughout the sequence, from ≤4 on the youngest soils to 27–30 on theoldest soils. This indication of increasing biological P stress and ultimately P limitation was further supportedby a decline in foliar P concentrations and increasing foliar N:P ratios of two common plant genera along thechronosequence. Sequential P fractionation revealed that although all forms of P declined during pedogenesis,young soils contained low concentrations of primary mineral P and relatively high concentrations of occludedP associated with secondary minerals, suggesting that the parent sand originated from strongly-weathered con-tinental soils. We conclude that the Cooloola chronosequence is an important example of long-term ecosystemdevelopment under a subtropical climate, although the pre-weathered nature of the parent sand indicates thatthe sequence represents a modification of theWalker and Syers model of P transformations during pedogenesis.
© 2015 Elsevier B.V. All rights reserved.
1. Introduction
Biogeochemical theory predicts that soil total phosphorus(P) declines during pedogenesis. At the same time there are changesin soil P chemistry, with a decline in primary mineral P and an accumu-lation of occluded and organic P as soils age (Walker and Syers, 1976).There is also a corresponding accumulation of carbon (C) and nitrogen(N) as soil develops, which results in increasing N:P and C:P ratios andstrengthening P limitation through time (e.g., Wardle et al., 2004;Parfitt et al., 2005; Pelzer et al., 2010). Despite its widespread accep-tance, the Walker and Syers model of soil P transformations has beentested on only a few long-term chronosequences: in addition to thefour sequences studied in New Zealand by Walker and Syers (1976),including the iconic Franz Josef post-glacial sequence, it has also beenexamined on basaltic soils along the Hawaiian Islands sequence(Crews et al., 1995) and the Northern Arizona Volcanic Field
ent, Griffith University, Nathan,
l phosphorus fractionation an2015), http://dx.doi.org/10.10
(Selmants and Hart, 2010), marine sedimentary soils along theMendocino Terrace sequence (Izquierdo et al., 2013), and coastaldunes at Haast, New Zealand (Turner et al., 2012) and Jurien Bay,Western Australia (Turner and Laliberté, 2015). However, none ofthese occurs under a subtropical climate.
The Cooloola chronosequence consists of a series of overlappingcoastal dune systems formed by wind-blown sand along the southernQueensland coast (Thompson and Moore, 1984). The dunes range inage from recent to approximately 500,000 years old (Lees, 2006) andare characterised by marked differences in vegetation (biomass andcommunity composition), soils (e.g. organic matter and nutrients)and biological activity (Thompson, 1981, 1992). The Cooloolachronosequence therefore provides an important opportunity to inves-tigate long-term soil and ecosystem development (e.g., Walker et al.,1987; Wardle et al., 2004). Soil development is largely governed bythe highly quartzose parent material, which leads to the formation ofpodzols on old dunes (e.g., Thompson, 1992). Despite the significanceof this chronosequence in terms of contributing to our understandingof ecosystem development, there is little information on the nature ofthe associated changes in the chemical transformations of soil P alongthe sequence.
d nutrient dynamics along the Cooloola coastal dune chronosequence,16/j.geoderma.2015.04.027
2 C.R. Chen et al. / Geoderma xxx (2015) xxx–xxx
Here we report detailed study of soil nutrients and soil P fraction-ation over approximately 500,000 years of soil development along theCooloola chronosequence. We studied the same sites as the originalstudy reported by Thompson andMoore (1984). Our aim was to assessthe extent to which the Cooloola chronosequence corresponds to theWalker and Syers (1976) model in terms of the dynamics of differentforms of soil P fractions, and to assess potential nutrient limitation vianutrient stoichiometry in soils and plant tissue. Most of the previousstudies carried out on the coastal dune chronosequences have formedunder temperate or Mediterranean climates (e.g., Syers and Walker,1969; Walker and Syers, 1976; Turner et al., 2012; Turner andLaliberté, 2015). This is the first study of soil P fractions in a long-termsubtropical coastal chronosequence that includes both the progressiveand retrogressive phases of ecosystem development (Wardle et al.,2004).
2. Materials and methods
2.1. Site description
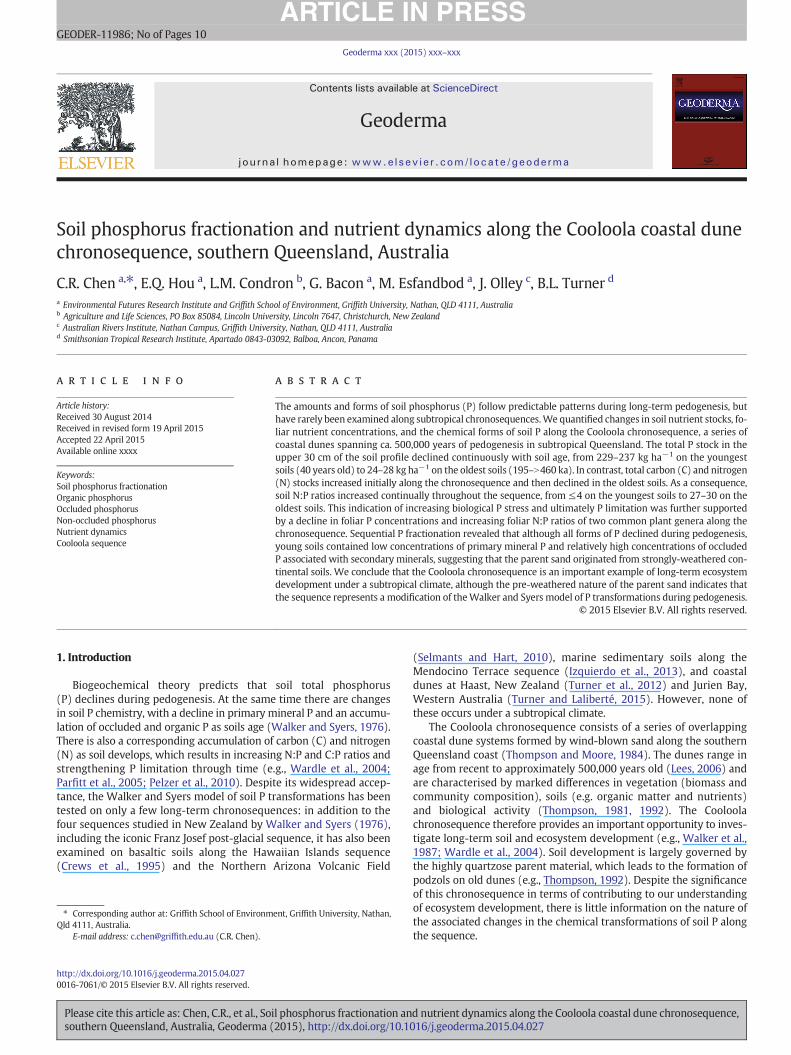
The Cooloola coastal dune chronosequence is located in the GreatSandy region of eastern Australia (26°S, 153°E; Thompson, 1981;Thompson and Moore, 1984). The chronosequence includes a series ofHolocene and late Pleistocene dune systems formed by the accumula-tion of wind-blown quartz sand along the subtropical Queenslandcoast. These siliceous parent materials were transported by dominantsand-moving winds (from the southeast) from the inner continentalshelf during marine transgressions (Thompson, 1992; Lees, 2006). Cli-matic events during the early Holocene might also have contributed toactive marine transgressions and thus dune development (Lees,2006). The maximum elevation of the Cooloola sand mass is 258 mabove sea level (Thompson, 1992). The Cooloola sequence wasdescribed in detail by Thompson (1981), Thompson and Moore(1984) and Thompson (1992). In brief, there are six clear dune systemsranging in age from recent (40 years) to Middle Pleistocene (N460 ka)(Fig. 1). Podzols have formed on the older dunes, with the depth ofsola varying from b1 m on the youngest dunes to N20 m on the oldest(Thompson, 1981; Fig. 1). Parts of these dune systems have not beencovered by young deposits and have therefore been exposed to
Fig. 1. Schematic presentation of the Cooloola sand dune sequence in the southeast Queenslansystems (ka= 1000 yrs) at the Cooloola sequence were from the report by Lees (2006) which ccence (TL) and from Olley et al. (personal communication) using optically stimulated lumines
Please cite this article as: Chen, C.R., et al., Soil phosphorus fractionation ansouthern Queensland, Australia, Geoderma (2015), http://dx.doi.org/10.1
weathering since deposition (Thompson, 1981; Thompson and Moore,1984). Thus, this sequence provides an important opportunity tostudy the co-development of soils and biological communities in a sub-tropical environment.
Soils along the chronosequence are characterised by the limiteddevelopment on the youngest dune systems (CS1-3, Cooloola se-quence 1–3) and the development of deep eluvial (E) horizonswith associated spodic B horizons on the older dune systems (CS4–6, Cooloola sequence 4–6), where the spodic horizon can reach upto 20 m below the soil surface (Thompson, 1981). The youngestfour dune systems (CS1–4) comprise U- and V-shaped parabolicdunes open to predominately south-east winds. The dunes of theyoungest systems (CS1–3) are much less weathered and erodedcompared with those of the oldest systems (CS4–6). The erosionhas not altered the shape of the younger dune systems (CS1–3), al-though the floors of CS4 dunes have been eroded by water (Fig. 1).The older dune systems (CS5–6) have been greatly modified bywater erosion (at their bases) and have lost their initial shapes andorientation (Thompson and Moore, 1984).
Soils of the Cooloola dune system form a podzol developmentsequence (Fig. 1). Soils at the CS1 site (including sites A and B) are sili-ceous sands, while at the CS2 site the soil is a rudimentary podzol. Thesoils are podzols at sites CS3A and CS3B, giant podzols at sites CS4Band CS4C, and giant humus podzols at sites CS5 and CS6 (Fig. 1;Australian Soil Classification, Isbell, 2003). In the Soil Taxonomy classifi-cation system (Soil Survey Staff, 1999) the young soils are classified asEntisols, while the intermediate-aged podzols are equivalent toSpodosols, although the older dunes with extremely deep eluvialhorizons are paradoxically classified as Entisols due to the absence of aspodic horizon in the upper 2 m of the soil profiles (Turner andLaliberté, 2015).
The Cooloola sequence has a subtropical coastal climate, with warmto hot, moist summers and mild, drier winters. Average annual rainfallat Rainbow Beach, Qld (25.92°S, 153.08°E), 5–15 km from the sequenceand at similar elevation, is 1314 mm, of which approximately 50% fallsin the summer (January to March). Mean daily temperatures aregreatest in January (22–28 °C) and lowest in July (12–20 °C).
There are N600 plant species at Cooloola, with habitats ranging fromshrubby woodland to open forest and rainforest (Thompson, 1992). The
d, Australia (redrawn from Thompson, 1981; Thompson and Moore, 1984). Ages of duneombined the data on the dune dates from Tejan-Kella et al. (1990) using Thermolumines-cence (OSL).
d nutrient dynamics along the Cooloola coastal dune chronosequence,016/j.geoderma.2015.04.027
actable
Clay
%Silt%
Sand
%
n gkg
−1)
Al(
gkg
−1)
Ca (mgkg
−1)
.1(1
.7)
2.26
4(0
.069
)65
(2)
4.5(0
.8)
2.1(0
.3)
93.4
(0.5)
.5(4
.3)
2.68
5(0
.288
)11
5(3
8)6.7(0
.4)
3.7(0
.5)
89.4
(0.7)
.5(4
.6)
0.56
9(0
.087
)93
(7)
2.5(1
.4)
3.50
(0.6)
93.9
(1.4)
.7(3
.7)
0.36
9(0
.072
)11
9(1
7)1.9(0
.8)
2.0(0
.3)
96.1
(0.5)
.6(2
.8)
0.38
6(0
.085
)12
0(2
1)2.1(0
.7)
2.5(0
.2)
95.3
(0.7)
.5(1
.6)
0.25
9(0
.008
)13
4(1
8)7.1(0
.9)
2.9(0
.8)
89.9
(1.1)
.3(0
.9)
0.13
2(0
.013
)17
5(2
7)6.0(0
.1)
2.5(0
.5)
91.5
(0.5)
.4(2
.7)
0.11
8(0
.001
)57
(8)
5.3(0
.5)
2.3(0
.4)
92.4
(0.7)
.2(0
.6)
0.13
5(0
.010
)70
(12)
4.4(0
.2)
3.8(0
.2)
91.8
(0.3)
OES
.tp
rodu
ctivesite;C
S5an
dCS
6,theolde
stsites.
3C.R. Chen et al. / Geoderma xxx (2015) xxx–xxx
youngest site (CS1A) is an unvegetated dune close to the coast, while thevegetation on the youngest dune system (CS1B) is classified asAllocasuarina low woodland (shrubby), dominated by Allocasuarina spe-cies (e.g., Allocasuarina littoralis; Casuarinaceae) and Banksia integrifolia(Proteaceae). The vegetation in the CS2 dune system is open layered for-ests, dominated by Eucalyptus signata, Eucalyptus racemosa, Eucalyptuspilularis, Angophora woodsiana (all Myrtaceae), Allocasuarina torulosa,Banksia serrata and B. integrifolia. The CS3A site is layered woodlandopen forest dominated by Eucalyptus intermedia, A. torulosa, Lepidospermalaterale (Cyperaceae), Lophostemon confertus (Myrtaceae), B. serrataand B. integrifolia. Allocasuarina species form symbiotic relationshipswith the N-fixing bacteria Frankia, which contribute to the nitrogen accu-mulation during the soil development. The CS3B site is vine forestdominated by Flagellaria indica (Flagellariaceae). The CS4B siteis tall forest dominated by E. pilularis. The CS4C is vine forests domi-nated by F. indica with emergent Agathis robusta (Araucariaceae).The CS5 and CS6 sites are Banksia low woodlands dominated byBanksia aemula. Some common species for these two sites includeXanthorrhoea johnsonii (Xanthorreaceae), Zieria laxiflora (Rutaceae),Strangea linearis (Proteaceae), and E. racemosa.
Table1
Selected
basicsoil(0–30
cm)prop
erties
alon
gtheCo
oloo
lasand
dune
sequ
ence,sou
thea
stQue
enslan
d,Aus
tralia
a .
Sequ
ence
andsite
bAge
c
(ka)
Elev
ationd
(m)
Veg
etation
Bulk
dens
ity
(Mgm
−3)
pH(H
2O)
TotalC
%To
talN
%To
talP
(mgPkg
−1)
HNO3–HClO4ex
tr
Fe(g
kg−
1)
M (m
CS1A
0.04
115
Bare
sand
1.58
9(0
.025
)5.41
(0.01)
0.02
8(0
.001
)0.00
50(0
.000
1)48
.1(2
.7)
3.23
8(0
.160
)32
CS1B
0.04
101
Allo
casuarinalow
woo
dlan
d1.57
0(0
.197
)5.64
(0.09)
0.64
9(0
.207
)0.02
80(0
.010
7)62
.0(9
.6)
2.78
8(0
.342
)25
CS2
3.1–
3.2
124
Eucalyptus
sign
ataop
enforest
1.52
4(0
.869
)4.82
(0.05)
0.86
9(0
.125
)0.02
60(0
.001
1)32
.1(6
.0)
2.13
6(0
.261
)25
CS3A
7.5–
9.6
148
E.interm
edia
open
forest
1.25
8(0
.019
)4.93
(0.04)
0.77
9(0
.080
)0.03
19(0
.003
0)28
.7(0
.8)
1.79
4(0
.121
)25
CS3B
7.5–
9.6
121
Vineforest
1.42
8(0
.108
)5.24
(0.22)
0.72
1(0
.100
)0.04
16(0
.004
9)36
.7(6
.2)
1.93
3(0
.134
)29
CS4B
130–
170
200
E.pilularistallforest
1.53
6(0
.039
)4.77
(0.07)
1.52
5(0
.233
)0.03
89(0
.003
9)24
.2(2
.0)
1.69
0(0
.113
)18
CS4C
130–
170
181
Vineforest-Tha
nnae
scrub
1.13
1(0
.087
)4.84
(0.05)
1.44
0(0
.271
)0.06
17(0
.011
1)28
.4(2
.3)
1.83
6(0
.131
)20
CS5
195–
395
135
Bank
sialow
woo
dlan
d1.41
0(0
.160
)4.71
(0.05)
1.02
8(0
.124
)0.02
11(0
.001
8)8.0(0
.8)
2.75
6(0
.173
)23
CS6
N46
064
Bank
sialow
woo
dlan
d1.47
9(0
.018
)4.74
(0.03)
1.02
3(0
.083
)0.01
99(0
.001
1)7.1(0
.9)
2.48
9(0
.064
)19
aDataon
soilprop
erties
inco
lumns
aremea
ns(n
=3)
withstan
dard
errors
inpa
renthe
sis.To
talsoilP
was
measuredby
theHNO3–HClO4dige
stionfollo
wed
byICP-
bCS
1–CS
6indicatesCo
oloo
lasequ
ence
1–6while
A,B
orCthedifferen
tsites
andve
getation
withinthesamesequ
ence.C
S1Aan
dCS
1B,the
youn
gest
sites,CS
4B,m
oscTh
eag
ewas
estimated
inLees
(200
6).
dAbo
vesealeve
l.
2.2. Sampling and chemical analysis
A total of nine sites from the six dune systems were chosen for thisstudy, including one site from each of the CS2, CS5 and CS6 dune sys-tems and two sites from each of the CS1, CS3 and CS4 dune systems(Table 1). We sampled two sites on the youngest dune system (CS1)(bare sand at CS1A and rudimentary podzol at CS1B) and two sitesfrom each of CS3 and CS4, based on different types of vegetation(open forest and vine forest). Three plots (20 m × 20 m) at each sitewere randomly selected for sampling. A total of 15 soil cores from the0–5 cm and 5–30 cm depths were collected from each plot using a7.5 cm corer and bulked as a composite sample in Oct 2008 (dryseason). These soil samples were air-dried and sieved (b2 mm) toremove roots and other large debris. A total of 54 composite soilsamples were collected.
Total soil C and N contents were analysed using an isotoperatio mass spectrometer with a Eurovector Elemental Analyser(Isoprime-EuroEA 3000, Milan, Italy). Total P was measured byHNO3–HClO4 digestion followed by the ICP-OES (Varian Vista ProSpectrophotometer) (Olsen and Sommers, 1982) and these datawere used to calculate soil N:P ratios and soil P stocks (kg P ha−1)(together with the bulk density data). These total soil P data werealso compared with values calculated from the sum of all P fractionsby sequential extraction (see below). Soil particle size was analysedby the hydrometer method after complete dispersion of clay min-erals by sodium hexametaphosphate, while soil bulk density was es-timated by inserting a metal bulk density ring into soils (Rayment andHigginson, 1992). Soil pHwas determined in water in a 1:5 (v/v) soil tosolution ratio using a glass electrode and moisture was determined bydrying at 105 °C for 48 h. Acid extractable aluminium (Al), iron (Fe)and manganese (Mn) contents were determined by the HNO3–HClO4
digestion (Burau, 1982) and ICP-OES detection (Varian Vista Pro Spec-trophotometer). Soil particle size, pH and acid extractable Al, Fe andMn concentrations were measured on the 2 mm soil samples. A sub-sample was finely ground (b150 μm) for analysis of total C, N and P,and sequential P fractionation.
Leaves of Banksia and Leptospermum species, which occur onmost dune systems along the chronosequence, were sampled andanalysed for total C, N, and P. Between 20 and 30 fully-expandedleaves were collected from three individual plants in each genusfrom each plot of the dune systemswhere Banksia and Leptospermumspecies were found. The leaves were oven-dried and finely groundfor analysis of C and N by mass spectrometer as above. The P contentin the leaf samples was determined by the HNO3–HClO4 digestion
Please cite this article as: Chen, C.R., et al., Soil phosphorus fractionation and nutrient dynamics along the Cooloola coastal dune chronosequence,southern Queensland, Australia, Geoderma (2015), http://dx.doi.org/10.1016/j.geoderma.2015.04.027
4 C.R. Chen et al. / Geoderma xxx (2015) xxx–xxx
followed by ICP-OES (Varian Vista Pro Spectrophotometer) (Olsenand Sommers, 1982).
2.3. Soil phosphorus fractionation
Soil P fractionation schemes described by Chang and Jackson (1957)and McDowell and Condron (2000) were combined and modified foruse in this study to differentiate and estimate soil P associated with Al,Fe and Ca and to group soil P into soluble P, organic P, non-occluded Pand occluded based on the Walker and Syers (1976) model. Threegrams of finely ground (b150 μm) soil sample was sequentially extract-ed by the following extraction method:
a) NH4Cl soluble P [Soluble P]: 30 ml 1.0 M NH4Cl; shaken for30 min; centrifuged (10,000 rpm, 10 min); supernatant filtered(b0.45 μm);
b) NH4F extractable P [mainly Al associated P, Chang and Jackson,1957]: 30ml 0.1MNH4F (adjusted to pH 8.5; shaken for 4 h; centri-fuged (10,000 rpm, 10min); supernatant filtered (b0.45 μm);wash:30ml DI H2O; shaken for 30min; centrifuged (10,000 rpm, 10min);supernatant discarded;
c) The first NaOH extractable P [NaOH-I P, mainly Fe associated P,Chang and Jackson, 1957]: 30 ml 0.1 M NaOH; shaken for 16 h; cen-trifuged (10,000 rpm, 10min); supernatant filtered (b0.45 μm); theresidual soil was washed as above.
d) H2SO4 extractable P [mainly Ca-associated P, Chang and Jackson,1957]: 30 ml 0.5 M H2SO4; shaken for 16 h; centrifuged (rpm10,000, 10 min); supernatant filtered (b0.45 μm); the residual soilwas washed as above.
e) The second NaOH extractable P [NaOH-II P; largely Fe associated,recalcitrant P; Chang and Jackson, 1957; McDowell and Condron,2000]: 30 ml 0.1 M NaOH; shaken for 16 h; centrifuged(10,000 rpm, 10min); supernatant filtered (b0.45 μm); the residualsoil was washed as above.
f) Residual P (non-extracted P): The residual soil was oven-dried at70 °C and transferred to a crucible and combusted at 550 °C for 1 hand then extracted by 0.5 M H2SO4 for 1 h.
Concentrations of inorganic P in the above extractswere determinedafter the precipitation of organic matter by acidification, while concen-trations of total P in the NH4F and NaOH extracts were determined afterpersulphate oxidation (Tiessen and Moir, 1993). The concentration oforganic P (Po) in the extracts was calculated as the difference betweentotal P and inorganic P (Pi). Total soil P was calculated as the sum ofall P fractions; total extractable inorganic P (Pi) as the sum of NH4Cl-Pi, NH4F-Pi, NaOH-I Pi, H2SO4 Pi and NaOH-II Pi. The P fractions werealso grouped by the Walker and Syers (1976) model into: organic P(extractable), the sum of NH4F-Po, NaOH-I Po and NaOH-II Po; non-occluded P (non-occl. P), the sum of NH4Cl-Pi, NH4F-Pi and NaOH-I Pi;occluded P (occl. P), the sum of NaOH-II Pi and residual P. The area-based soil P fractions (kg P ha−1) were calculated using the concentra-tions of soil P fractions and soil bulk density data.
2.4. Statistical analysis
All data were expressed on over-dry basis. Since the trendsin all chemical parameters (concentrations) between the 0–5 cm and5–30 cm soil samples were similar, the data from these two depthswere combined to work out the values of 0–30 cm depth by calculatingweighted mean by depth. However, for the area-based parameters(total C, N and P stocks and P fractions), data for both 0–5 cm and 5–30 cm depth were added to calculate the values for the 0–30 cmdepth. Descriptive statistics and Pearson correlation analyses werecarried out in Statistix (Version 8; Analytic Software).
Please cite this article as: Chen, C.R., et al., Soil phosphorus fractionation ansouthern Queensland, Australia, Geoderma (2015), http://dx.doi.org/10.1
3. Results
3.1. Soil properties along the Cooloola sand dune sequence
Soils along the Cooloola sequence contained mainly sand-sizedparticles (N90%), with small concentrations of clay (0.3–8.9%) and silt(1.7–4.6%) (Table 1). Soil pH decreased with age of site, ranging from5.4 at the youngest sites (CS1A, CA1B; 40 years) to 4.7 at the oldestsites (CS5, 195–395 ka; CS6, N460 ka; Table 1).
Soil total C and N concentrations increased with time tointermediate-aged soils (CS4B and CS4C), and then declined slightly(Table 1). In contrast, soil total P concentrations (determined byacid digestion) decreased continuously along the sequence from48–62 mg P kg−1 on the youngest soils (0–30 cm) to 7–8 mg kg−1
on the oldest soils (Table 1).Acid extractable soil Al concentrations declined continuously along
the sequence, particularly in the early stage of pedogenesis (from2.69 g kg−1 at the CS1B to 0.57 g kg−1 at the CS2). The overall trendof acid extractable Mn concentration was similar to that for the Al con-centration, while acid extractable Fe concentrations were greatest inboth youngest (2.79–3.24 g kg−1 at CS1A and CS1B) and oldest soils(2.49–2.76 g kg−1 at CS5, CS6) (Table 1). Acid extractable Ca concentra-tionswere lower at the youngest sites (65mg Ca kg−1, CS1A), increasedwith time up to the CS4C (175 mg Ca kg−1) and then declined at theoldest sites (57–70 mg Ca kg−1, CS5, CS6).
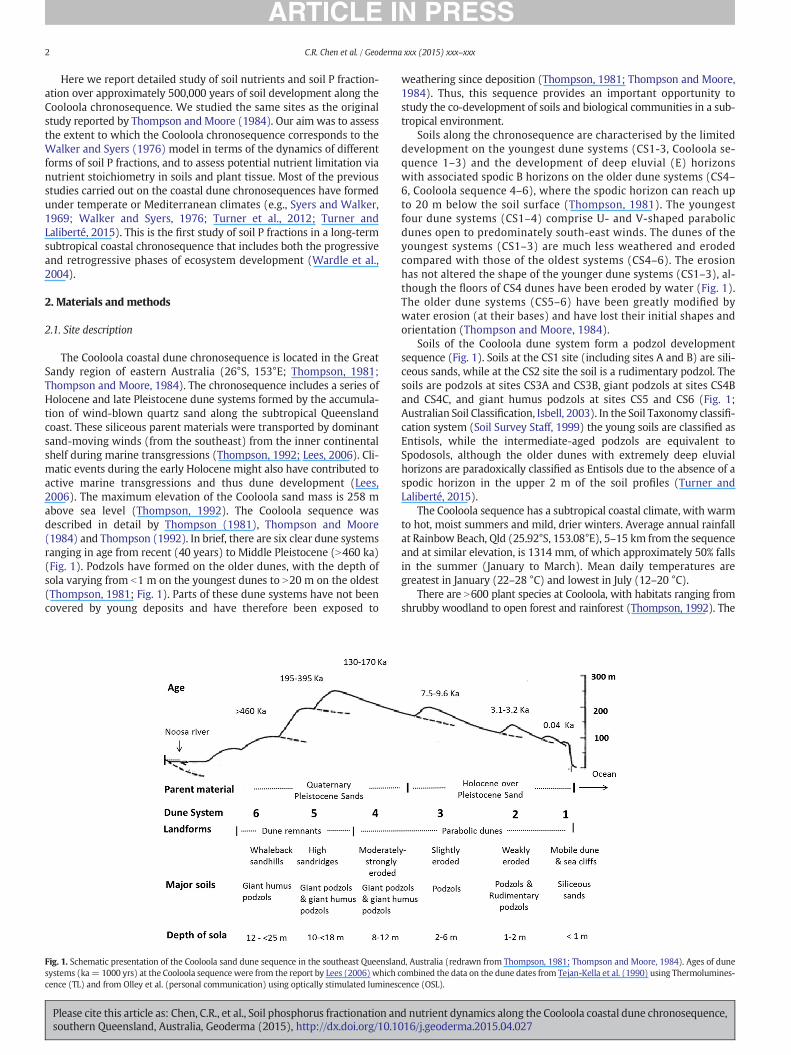
3.2. Soil carbon, nitrogen and phosphorus stock and elemental ratios alongthe Cooloola sand dune sequence
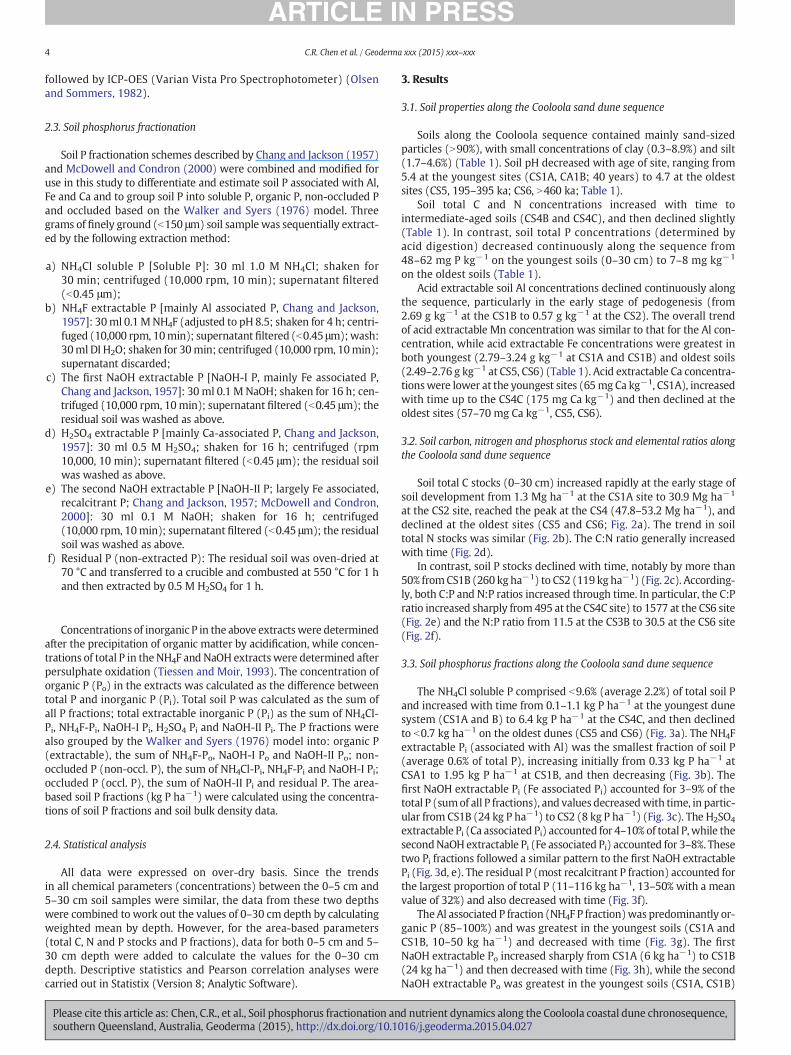
Soil total C stocks (0–30 cm) increased rapidly at the early stage ofsoil development from 1.3 Mg ha−1 at the CS1A site to 30.9 Mg ha−1
at the CS2 site, reached the peak at the CS4 (47.8–53.2 Mg ha−1), anddeclined at the oldest sites (CS5 and CS6; Fig. 2a). The trend in soiltotal N stocks was similar (Fig. 2b). The C:N ratio generally increasedwith time (Fig. 2d).
In contrast, soil P stocks declined with time, notably by more than50% fromCS1B (260 kg ha−1) to CS2 (119 kg ha−1) (Fig. 2c). According-ly, both C:P and N:P ratios increased through time. In particular, the C:Pratio increased sharply from 495 at the CS4C site) to 1577 at the CS6 site(Fig. 2e) and the N:P ratio from 11.5 at the CS3B to 30.5 at the CS6 site(Fig. 2f).
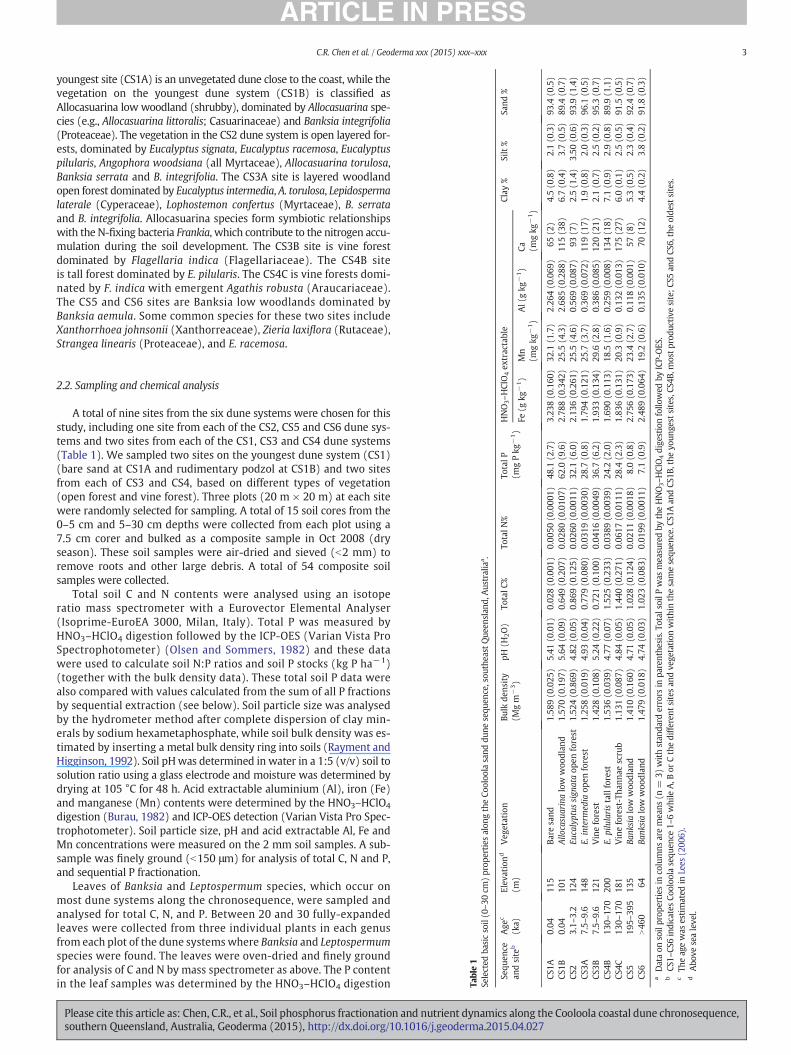
3.3. Soil phosphorus fractions along the Cooloola sand dune sequence
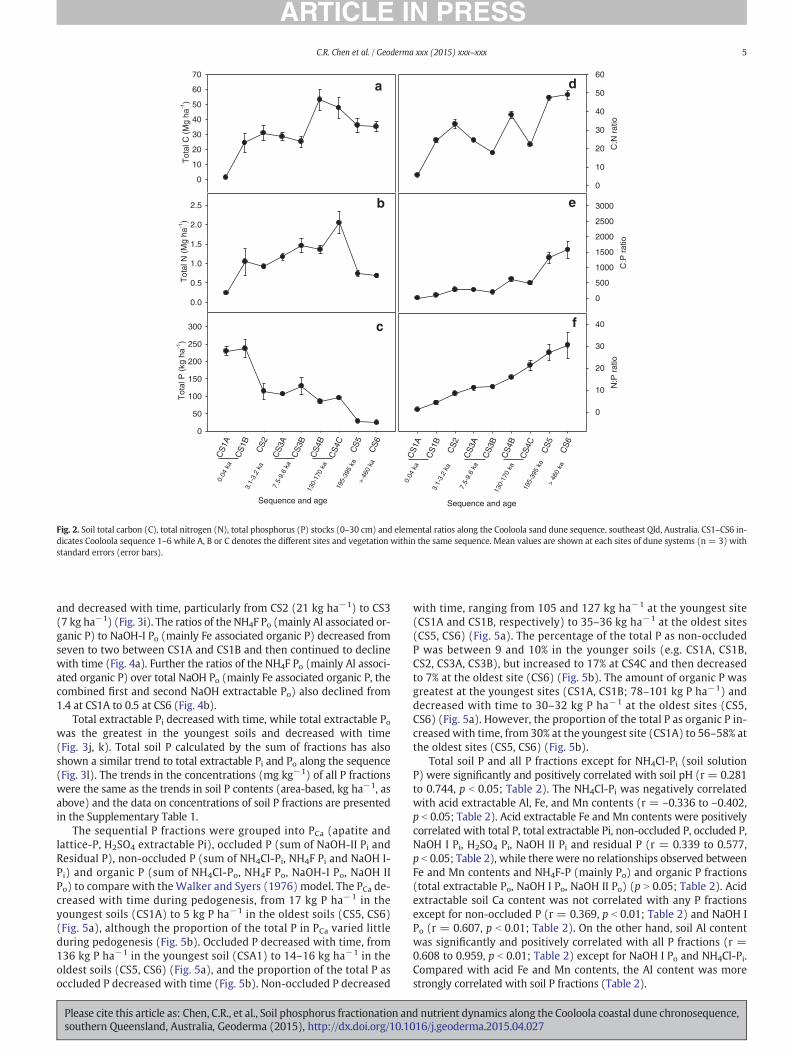
The NH4Cl soluble P comprised b9.6% (average 2.2%) of total soil Pand increased with time from 0.1–1.1 kg P ha−1 at the youngest dunesystem (CS1A and B) to 6.4 kg P ha−1 at the CS4C, and then declinedto b0.7 kg ha−1 on the oldest dunes (CS5 and CS6) (Fig. 3a). The NH4Fextractable Pi (associated with Al) was the smallest fraction of soil P(average 0.6% of total P), increasing initially from 0.33 kg P ha−1 atCSA1 to 1.95 kg P ha−1 at CS1B, and then decreasing (Fig. 3b). Thefirst NaOH extractable Pi (Fe associated Pi) accounted for 3–9% of thetotal P (sumof all P fractions), and values decreasedwith time, in partic-ular from CS1B (24 kg P ha−1) to CS2 (8 kg P ha−1) (Fig. 3c). The H2SO4
extractable Pi (Ca associated Pi) accounted for 4–10% of total P,while thesecondNaOH extractable Pi (Fe associated Pi) accounted for 3–8%. Thesetwo Pi fractions followed a similar pattern to the first NaOH extractablePi (Fig. 3d, e). The residual P (most recalcitrant P fraction) accounted forthe largest proportion of total P (11–116 kg ha−1, 13–50% with a meanvalue of 32%) and also decreased with time (Fig. 3f).
The Al associated P fraction (NH4F P fraction)was predominantly or-ganic P (85–100%) and was greatest in the youngest soils (CS1A andCS1B, 10–50 kg ha−1) and decreased with time (Fig. 3g). The firstNaOH extractable Po increased sharply from CS1A (6 kg ha−1) to CS1B(24 kg ha−1) and then decreased with time (Fig. 3h), while the secondNaOH extractable Po was greatest in the youngest soils (CS1A, CS1B)
d nutrient dynamics along the Cooloola coastal dune chronosequence,016/j.geoderma.2015.04.027
Tot
al C
(M
g ha
-1)
0
10
20
30
40
50
60
70
Tot
al N
(M
g ha
-1)
0.0
0.5
1.0
1.5
2.0
2.5
Sequence and age
CS
1A
CS
1B
CS
2C
S3A
CS
3B
CS
4BC
S4C
CS
5
CS
6
Tot
al P
(kg
ha-1
)
0
50
100
150
200
250
300
C:N
rat
io
0
10
20
30
40
50
60
C:P
rat
io
0
500
1000
1500
2000
2500
3000
Sequence and age
CS
1A
CS
1B
CS
2C
S3A
CS
3B
CS
4BC
S4C
CS
5
CS
6
N:P
rat
io
0
10
20
30
40
a
b
c
d
f
e0.
04 k
a
3.1-
3.2
ka
7.5-
9.6
ka
130-
170
ka
195-
395
ka>
460
ka
0.04
ka
3.1-
3.2
ka
7.5-
9.6
ka
130-
170
ka
195-
395
ka
> 46
0 ka
Fig. 2. Soil total carbon (C), total nitrogen (N), total phosphorus (P) stocks (0–30 cm) and elemental ratios along the Cooloola sand dune sequence, southeast Qld, Australia. CS1–CS6 in-dicates Cooloola sequence 1–6 while A, B or C denotes the different sites and vegetation within the same sequence. Mean values are shown at each sites of dune systems (n = 3) withstandard errors (error bars).
5C.R. Chen et al. / Geoderma xxx (2015) xxx–xxx
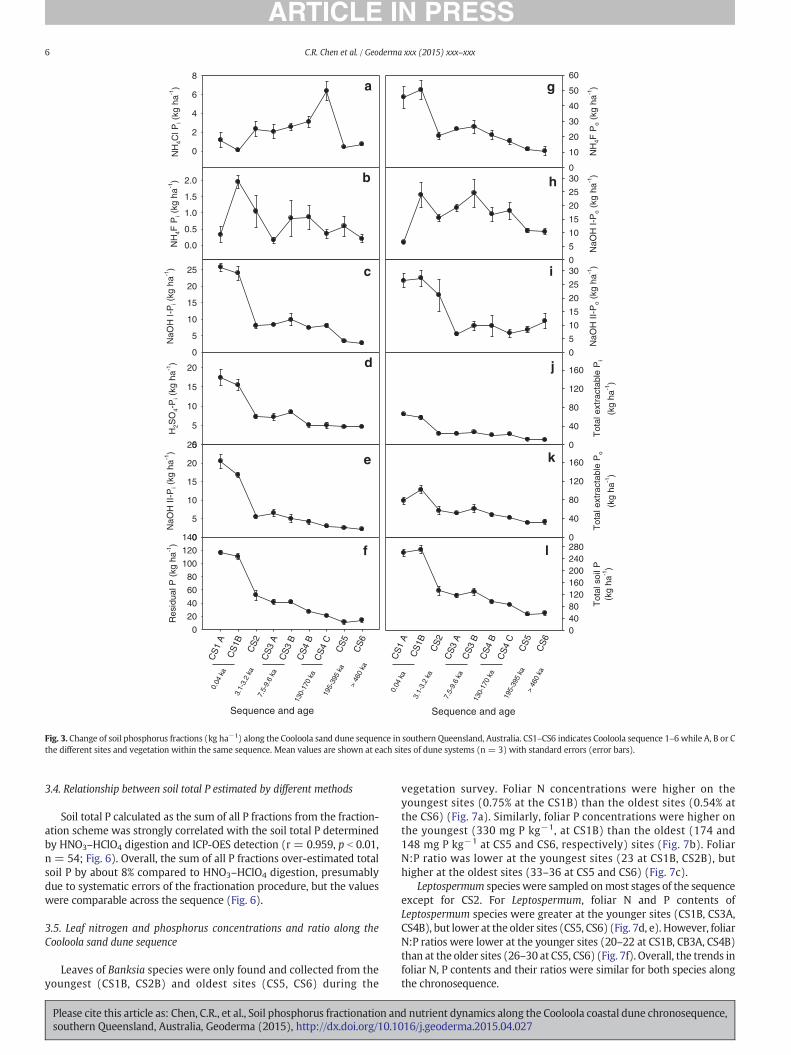
and decreased with time, particularly from CS2 (21 kg ha−1) to CS3(7 kg ha−1) (Fig. 3i). The ratios of the NH4F Po (mainly Al associated or-ganic P) to NaOH-I Po (mainly Fe associated organic P) decreased fromseven to two between CS1A and CS1B and then continued to declinewith time (Fig. 4a). Further the ratios of the NH4F Po (mainly Al associ-ated organic P) over total NaOH Po (mainly Fe associated organic P, thecombined first and second NaOH extractable Po) also declined from1.4 at CS1A to 0.5 at CS6 (Fig. 4b).
Total extractable Pi decreased with time, while total extractable Powas the greatest in the youngest soils and decreased with time(Fig. 3j, k). Total soil P calculated by the sum of fractions has alsoshown a similar trend to total extractable Pi and Po along the sequence(Fig. 3l). The trends in the concentrations (mg kg−1) of all P fractionswere the same as the trends in soil P contents (area-based, kg ha−1, asabove) and the data on concentrations of soil P fractions are presentedin the Supplementary Table 1.
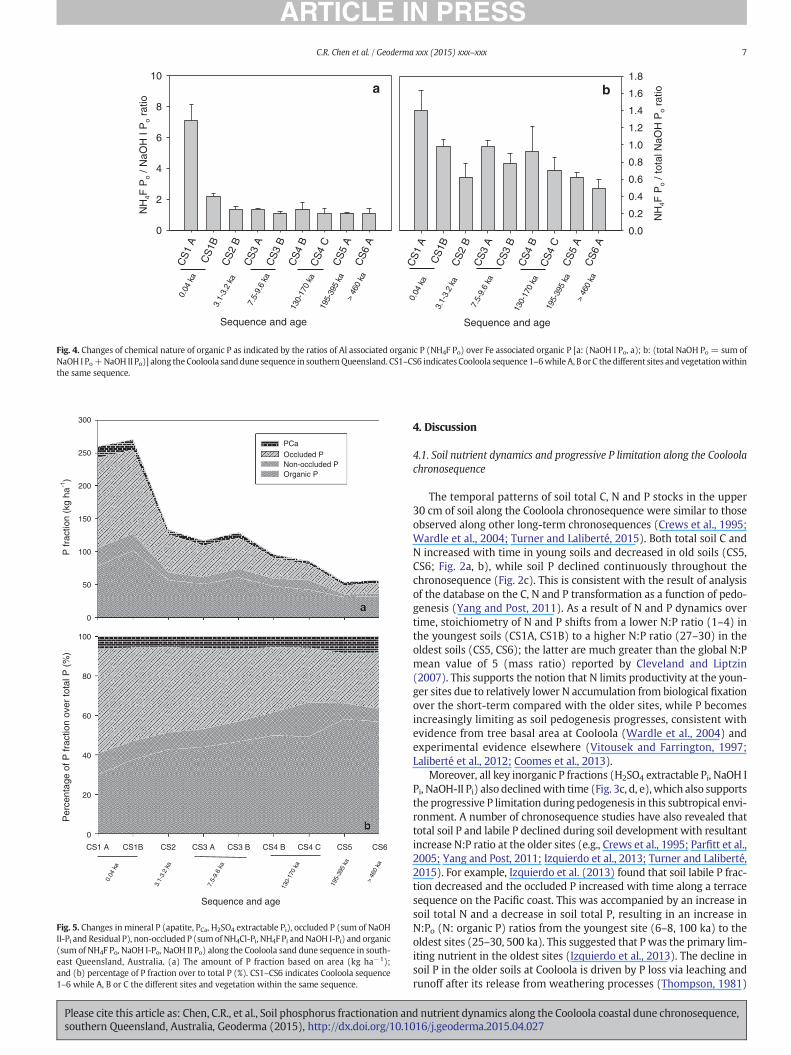
The sequential P fractions were grouped into PCa (apatite andlattice-P, H2SO4 extractable Pi), occluded P (sum of NaOH-II Pi andResidual P), non-occluded P (sum of NH4Cl-Pi, NH4F Pi and NaOH I-Pi) and organic P (sum of NH4Cl-Po, NH4F Po, NaOH-I Po, NaOH IIPo) to compare with theWalker and Syers (1976) model. The PCa de-creased with time during pedogenesis, from 17 kg P ha−1 in theyoungest soils (CS1A) to 5 kg P ha−1 in the oldest soils (CS5, CS6)(Fig. 5a), although the proportion of the total P in PCa varied littleduring pedogenesis (Fig. 5b). Occluded P decreased with time, from136 kg P ha−1 in the youngest soil (CSA1) to 14–16 kg ha−1 in theoldest soils (CS5, CS6) (Fig. 5a), and the proportion of the total P asoccluded P decreased with time (Fig. 5b). Non-occluded P decreased
Please cite this article as: Chen, C.R., et al., Soil phosphorus fractionation ansouthern Queensland, Australia, Geoderma (2015), http://dx.doi.org/10.10
with time, ranging from 105 and 127 kg ha−1 at the youngest site(CS1A and CS1B, respectively) to 35–36 kg ha−1 at the oldest sites(CS5, CS6) (Fig. 5a). The percentage of the total P as non-occludedP was between 9 and 10% in the younger soils (e.g. CS1A, CS1B,CS2, CS3A, CS3B), but increased to 17% at CS4C and then decreasedto 7% at the oldest site (CS6) (Fig. 5b). The amount of organic P wasgreatest at the youngest sites (CS1A, CS1B; 78–101 kg P ha−1) anddecreased with time to 30–32 kg P ha−1 at the oldest sites (CS5,CS6) (Fig. 5a). However, the proportion of the total P as organic P in-creased with time, from 30% at the youngest site (CS1A) to 56–58% atthe oldest sites (CS5, CS6) (Fig. 5b).
Total soil P and all P fractions except for NH4Cl-Pi (soil solutionP) were significantly and positively correlated with soil pH (r = 0.281to 0.744, p b 0.05; Table 2). The NH4Cl-Pi was negatively correlatedwith acid extractable Al, Fe, and Mn contents (r = –0.336 to –0.402,p b 0.05; Table 2). Acid extractable Fe and Mn contents were positivelycorrelated with total P, total extractable Pi, non-occluded P, occluded P,NaOH I Pi, H2SO4 Pi, NaOH II Pi and residual P (r = 0.339 to 0.577,p b 0.05; Table 2), while there were no relationships observed betweenFe and Mn contents and NH4F-P (mainly Po) and organic P fractions(total extractable Po, NaOH I Po, NaOH II Po) (p N 0.05; Table 2). Acidextractable soil Ca content was not correlated with any P fractionsexcept for non-occluded P (r = 0.369, p b 0.01; Table 2) and NaOH IPo (r = 0.607, p b 0.01; Table 2). On the other hand, soil Al contentwas significantly and positively correlated with all P fractions (r =0.608 to 0.959, p b 0.01; Table 2) except for NaOH I Po and NH4Cl-Pi.Compared with acid Fe and Mn contents, the Al content was morestrongly correlated with soil P fractions (Table 2).
d nutrient dynamics along the Cooloola coastal dune chronosequence,16/j.geoderma.2015.04.027
NH
4Cl P
i (kg
ha-1
)
0
2
4
6
8
NH
4F P
i (kg
ha-1
)
0.0
0.5
1.0
1.5
2.0N
aOH
I-P
i (kg
ha-1
)
0
5
10
15
20
25
H2S
O4-
Pi (
kg h
a-1)
0
5
10
15
20
NaO
H II
-Pi (
kg h
a-1)
0
5
10
15
20
25
Sequence and age
CS
1 A
CS
1BC
S2
CS
3 A
CS
3 B
CS
4 B
CS
4 C
CS
5C
S6
Res
idua
l P (
kg h
a-1)
0
20
40
60
80
100
120
140
NH
4F P
o (k
g ha
-1)
0
10
20
30
40
50
60
NaO
H I-
Po
(kg
ha-1
)
0
5
10
15
20
25
30
NaO
H II
-Po
(kg
ha-1
)
0
5
10
15
20
25
30
Tot
al e
xtra
ctab
le P
i
(kg
ha-1
)
0
40
80
120
160
Tot
al e
xtra
ctab
le P
o
(kg
ha-1
)
0
40
80
120
160
a
b
c
ke
f
g
h
d j
i
Sequence and age
CS
1 A
CS
1BC
S2
CS
3 A
CS
3 B
CS
4 B
CS
4 C
CS
5C
S6
Tot
al s
oil P
(kg
ha-1
)
04080120160200240280l
0.04
ka
3.1-
3.2
ka7.
5-9.
6 ka
130-
170
ka
195-
395
ka
> 46
0 ka
0.04
ka
3.1-
3.2
ka
7.5-
9.6
ka
130-
170
ka
195-
395
ka>
460
ka
Fig. 3. Change of soil phosphorus fractions (kg ha−1) along the Cooloola sand dune sequence in southern Queensland, Australia. CS1–CS6 indicates Cooloola sequence 1–6 while A, B or Cthe different sites and vegetation within the same sequence. Mean values are shown at each sites of dune systems (n = 3) with standard errors (error bars).
6 C.R. Chen et al. / Geoderma xxx (2015) xxx–xxx
3.4. Relationship between soil total P estimated by different methods
Soil total P calculated as the sum of all P fractions from the fraction-ation scheme was strongly correlated with the soil total P determinedby HNO3–HClO4 digestion and ICP-OES detection (r = 0.959, p b 0.01,n = 54; Fig. 6). Overall, the sum of all P fractions over-estimated totalsoil P by about 8% compared to HNO3–HClO4 digestion, presumablydue to systematic errors of the fractionation procedure, but the valueswere comparable across the sequence (Fig. 6).
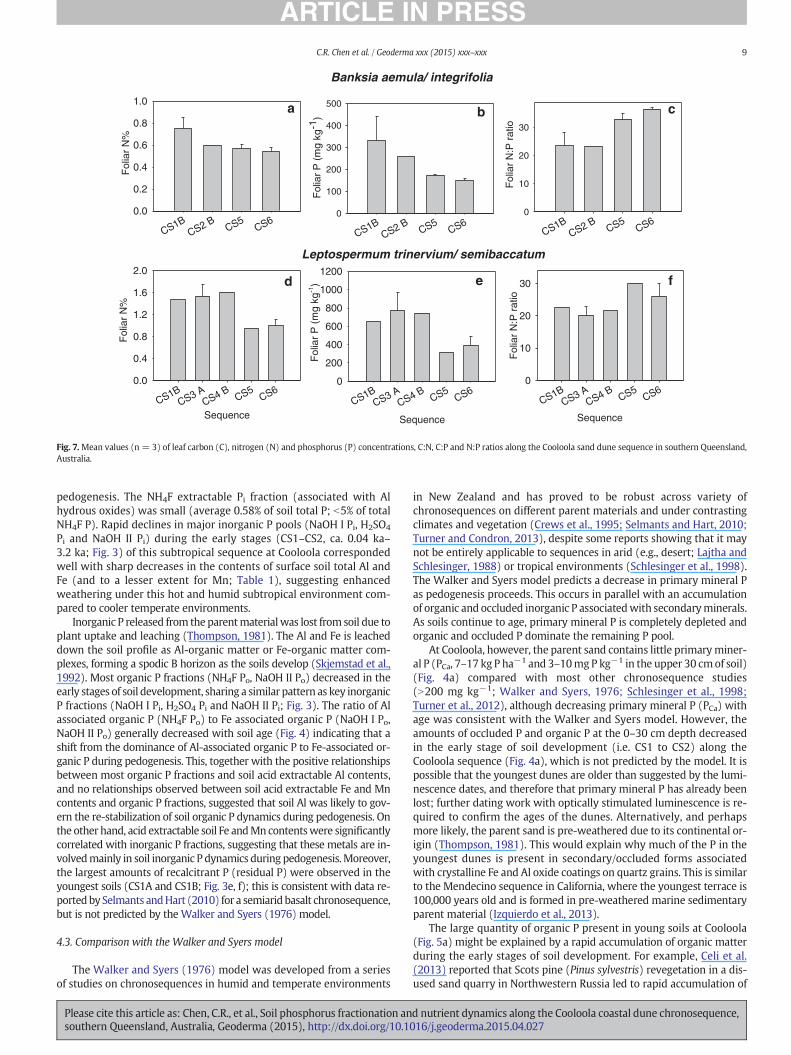
3.5. Leaf nitrogen and phosphorus concentrations and ratio along theCooloola sand dune sequence
Leaves of Banksia species were only found and collected from theyoungest (CS1B, CS2B) and oldest sites (CS5, CS6) during the
Please cite this article as: Chen, C.R., et al., Soil phosphorus fractionation ansouthern Queensland, Australia, Geoderma (2015), http://dx.doi.org/10.1
vegetation survey. Foliar N concentrations were higher on theyoungest sites (0.75% at the CS1B) than the oldest sites (0.54% atthe CS6) (Fig. 7a). Similarly, foliar P concentrations were higher onthe youngest (330 mg P kg−1, at CS1B) than the oldest (174 and148 mg P kg−1 at CS5 and CS6, respectively) sites (Fig. 7b). FoliarN:P ratio was lower at the youngest sites (23 at CS1B, CS2B), buthigher at the oldest sites (33–36 at CS5 and CS6) (Fig. 7c).
Leptospermum species were sampled onmost stages of the sequenceexcept for CS2. For Leptospermum, foliar N and P contents ofLeptospermum species were greater at the younger sites (CS1B, CS3A,CS4B), but lower at the older sites (CS5, CS6) (Fig. 7d, e). However, foliarN:P ratios were lower at the younger sites (20–22 at CS1B, CB3A, CS4B)than at the older sites (26–30 at CS5, CS6) (Fig. 7f). Overall, the trends infoliar N, P contents and their ratios were similar for both species alongthe chronosequence.
d nutrient dynamics along the Cooloola coastal dune chronosequence,016/j.geoderma.2015.04.027
Sequence and age
CS
1 A
CS
1BC
S2
BC
S3
AC
S3
BC
S4
BC
S4
CC
S5
AC
S6
A
NH
4F P
o / N
aOH
I P
o ra
tio
0
2
4
6
8
10
Sequence and age
CS
1 A
CS
1BC
S2
BC
S3
AC
S3
BC
S4
BC
S4
CC
S5
AC
S6
A
NH
4F P
o / t
otal
NaO
H P
o ra
tio
0.0
0.2
0.4
0.6
0.8
1.0
1.2
1.4
1.6
1.8a b
0.04
ka
3.1-
3.2
ka
7.5-
9.6
ka
130-
170
ka19
5-39
5 ka
> 46
0 ka
0.04
ka
3.1-
3.2
ka
7.5-
9.6
ka
130-
170
ka
195-
395
ka
> 46
0 ka
Fig. 4. Changes of chemical nature of organic P as indicated by the ratios of Al associated organic P (NH4F Po) over Fe associated organic P [a: (NaOH I Po, a); b: (total NaOH Po = sum ofNaOH I Po+NaOH II Po)] along theCooloola sanddune sequence in southernQueensland. CS1–CS6 indicates Cooloola sequence 1–6while A, B or C thedifferent sites and vegetationwithinthe same sequence.
Sequence and age
CS1 A CS1B CS2 CS3 A CS3 B CS4 B CS4 C CS5 CS6
Per
cent
age
of P
frac
tion
over
tota
l P (
%)
0
20
40
60
80
100
P fr
actio
n (k
g ha
-1)
0
50
100
150
200
250
300
PCa Occluded P Non-occluded P Organic P
0.04
ka
3.1-
3.2
ka
7.5-
9.6
ka
130-
170
ka
195-
395
ka
> 46
0 ka
Fig. 5. Changes in mineral P (apatite, PCa, H2SO4 extractable Pi), occluded P (sum of NaOHII-Pi and Residual P), non-occluded P (sumofNH4Cl-Pi, NH4F Pi andNaOH I-Pi) and organic(sum of NH4F Po, NaOH I-Po, NaOH II Po) along the Cooloola sand dune sequence in south-east Queensland, Australia. (a) The amount of P fraction based on area (kg ha−1);and (b) percentage of P fraction over to total P (%). CS1–CS6 indicates Cooloola sequence1–6 while A, B or C the different sites and vegetation within the same sequence.
7C.R. Chen et al. / Geoderma xxx (2015) xxx–xxx
Please cite this article as: Chen, C.R., et al., Soil phosphorus fractionation ansouthern Queensland, Australia, Geoderma (2015), http://dx.doi.org/10.10
4. Discussion
4.1. Soil nutrient dynamics and progressive P limitation along the Cooloolachronosequence
The temporal patterns of soil total C, N and P stocks in the upper30 cm of soil along the Cooloola chronosequence were similar to thoseobserved along other long-term chronosequences (Crews et al., 1995;Wardle et al., 2004; Turner and Laliberté, 2015). Both total soil C andN increased with time in young soils and decreased in old soils (CS5,CS6; Fig. 2a, b), while soil P declined continuously throughout thechronosequence (Fig. 2c). This is consistent with the result of analysisof the database on the C, N and P transformation as a function of pedo-genesis (Yang and Post, 2011). As a result of N and P dynamics overtime, stoichiometry of N and P shifts from a lower N:P ratio (1–4) inthe youngest soils (CS1A, CS1B) to a higher N:P ratio (27–30) in theoldest soils (CS5, CS6); the latter are much greater than the global N:Pmean value of 5 (mass ratio) reported by Cleveland and Liptzin(2007). This supports the notion that N limits productivity at the youn-ger sites due to relatively lower N accumulation from biological fixationover the short-term compared with the older sites, while P becomesincreasingly limiting as soil pedogenesis progresses, consistent withevidence from tree basal area at Cooloola (Wardle et al., 2004) andexperimental evidence elsewhere (Vitousek and Farrington, 1997;Laliberté et al., 2012; Coomes et al., 2013).
Moreover, all key inorganic P fractions (H2SO4 extractable Pi, NaOH IPi, NaOH-II Pi) also declinedwith time (Fig. 3c, d, e), which also supportsthe progressive P limitation during pedogenesis in this subtropical envi-ronment. A number of chronosequence studies have also revealed thattotal soil P and labile P declined during soil development with resultantincrease N:P ratio at the older sites (e.g., Crews et al., 1995; Parfitt et al.,2005; Yang and Post, 2011; Izquierdo et al., 2013; Turner and Laliberté,2015). For example, Izquierdo et al. (2013) found that soil labile P frac-tion decreased and the occluded P increased with time along a terracesequence on the Pacific coast. This was accompanied by an increase insoil total N and a decrease in soil total P, resulting in an increase inN:Po (N: organic P) ratios from the youngest site (6–8, 100 ka) to theoldest sites (25–30, 500 ka). This suggested that P was the primary lim-iting nutrient in the oldest sites (Izquierdo et al., 2013). The decline insoil P in the older soils at Cooloola is driven by P loss via leaching andrunoff after its release from weathering processes (Thompson, 1981)
d nutrient dynamics along the Cooloola coastal dune chronosequence,16/j.geoderma.2015.04.027
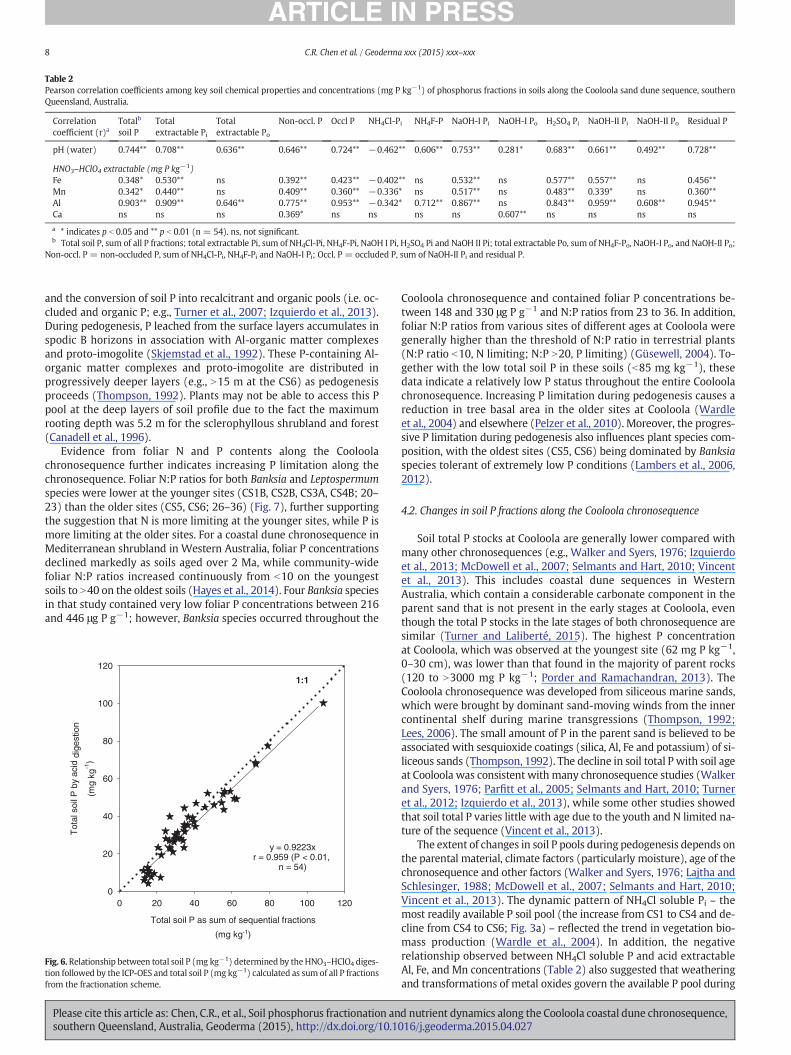
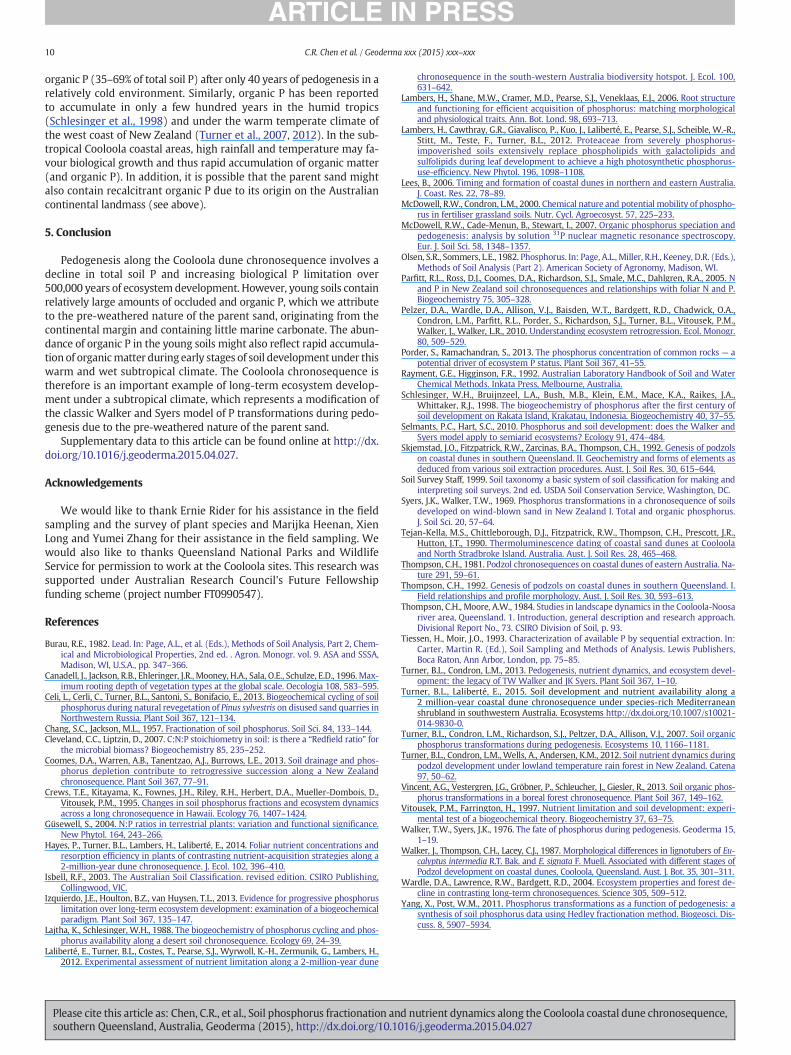
Table 2Pearson correlation coefficients among key soil chemical properties and concentrations (mg P kg−1) of phosphorus fractions in soils along the Cooloola sand dune sequence, southernQueensland, Australia.
Correlationcoefficient (r)a
Totalb
soil PTotalextractable Pi
Totalextractable Po
Non-occl. P Occl P NH4Cl-Pi NH4F-P NaOH-I Pi NaOH-I Po H2SO4 Pi NaOH-II Pi NaOH-II Po Residual P
pH (water) 0.744** 0.708** 0.636** 0.646** 0.724** −0.462** 0.606** 0.753** 0.281* 0.683** 0.661** 0.492** 0.728**
HNO3–HClO4 extractable (mg P kg−1)Fe 0.348* 0.530** ns 0.392** 0.423** −0.402** ns 0.532** ns 0.577** 0.557** ns 0.456**Mn 0.342* 0.440** ns 0.409** 0.360** −0.336* ns 0.517** ns 0.483** 0.339* ns 0.360**Al 0.903** 0.909** 0.646** 0.775** 0.953** −0.342* 0.712** 0.867** ns 0.843** 0.959** 0.608** 0.945**Ca ns ns ns 0.369* ns ns ns ns 0.607** ns ns ns ns
a * indicates p b 0.05 and ** p b 0.01 (n = 54). ns, not significant.b Total soil P, sum of all P fractions; total extractable Pi, sum of NH4Cl-Pi, NH4F-Pi, NaOH I Pi, H2SO4 Pi and NaOH II Pi; total extractable Po, sum of NH4F-Po, NaOH-I Po, and NaOH-II Po;
Non-occl. P = non-occluded P, sum of NH4Cl-Pi, NH4F-Pi and NaOH-I Pi; Occl. P = occluded P, sum of NaOH-II Pi and residual P.
8 C.R. Chen et al. / Geoderma xxx (2015) xxx–xxx
and the conversion of soil P into recalcitrant and organic pools (i.e. oc-cluded and organic P; e.g., Turner et al., 2007; Izquierdo et al., 2013).During pedogenesis, P leached from the surface layers accumulates inspodic B horizons in association with Al-organic matter complexesand proto-imogolite (Skjemstad et al., 1992). These P-containing Al-organic matter complexes and proto-imogolite are distributed inprogressively deeper layers (e.g., N15 m at the CS6) as pedogenesisproceeds (Thompson, 1992). Plants may not be able to access this Ppool at the deep layers of soil profile due to the fact the maximumrooting depth was 5.2 m for the sclerophyllous shrubland and forest(Canadell et al., 1996).
Evidence from foliar N and P contents along the Cooloolachronosequence further indicates increasing P limitation along thechronosequence. Foliar N:P ratios for both Banksia and Leptospermumspecies were lower at the younger sites (CS1B, CS2B, CS3A, CS4B; 20–23) than the older sites (CS5, CS6; 26–36) (Fig. 7), further supportingthe suggestion that N is more limiting at the younger sites, while P ismore limiting at the older sites. For a coastal dune chronosequence inMediterranean shrubland in Western Australia, foliar P concentrationsdeclined markedly as soils aged over 2 Ma, while community-widefoliar N:P ratios increased continuously from b10 on the youngestsoils to N40 on the oldest soils (Hayes et al., 2014). Four Banksia speciesin that study contained very low foliar P concentrations between 216and 446 μg P g−1; however, Banksia species occurred throughout the
Total soil P as sum of sequential fractions
(mg kg-1)
0 20 40 60 80 100 120
Tot
al s
oil P
by
acid
dige
stio
n
(mg
kg-1
)
0
20
40
60
80
100
120
y = 0.9223xr = 0.959 (P < 0.01,
n = 54)
1:1
Fig. 6.Relationship between total soil P (mg kg−1) determined by theHNO3–HClO4 diges-tion followed by the ICP-OES and total soil P (mg kg−1) calculated as sum of all P fractionsfrom the fractionation scheme.
Please cite this article as: Chen, C.R., et al., Soil phosphorus fractionation ansouthern Queensland, Australia, Geoderma (2015), http://dx.doi.org/10.1
Cooloola chronosequence and contained foliar P concentrations be-tween 148 and 330 μg P g−1 and N:P ratios from 23 to 36. In addition,foliar N:P ratios from various sites of different ages at Cooloola weregenerally higher than the threshold of N:P ratio in terrestrial plants(N:P ratio b10, N limiting; N:P N20, P limiting) (Güsewell, 2004). To-gether with the low total soil P in these soils (b85 mg kg−1), thesedata indicate a relatively low P status throughout the entire Cooloolachronosequence. Increasing P limitation during pedogenesis causes areduction in tree basal area in the older sites at Cooloola (Wardleet al., 2004) and elsewhere (Pelzer et al., 2010). Moreover, the progres-sive P limitation during pedogenesis also influences plant species com-position, with the oldest sites (CS5, CS6) being dominated by Banksiaspecies tolerant of extremely low P conditions (Lambers et al., 2006,2012).
4.2. Changes in soil P fractions along the Cooloola chronosequence
Soil total P stocks at Cooloola are generally lower compared withmany other chronosequences (e.g., Walker and Syers, 1976; Izquierdoet al., 2013; McDowell et al., 2007; Selmants and Hart, 2010; Vincentet al., 2013). This includes coastal dune sequences in WesternAustralia, which contain a considerable carbonate component in theparent sand that is not present in the early stages at Cooloola, eventhough the total P stocks in the late stages of both chronosequence aresimilar (Turner and Laliberté, 2015). The highest P concentrationat Cooloola, which was observed at the youngest site (62 mg P kg−1,0–30 cm), was lower than that found in the majority of parent rocks(120 to N3000 mg P kg−1; Porder and Ramachandran, 2013). TheCooloola chronosequence was developed from siliceous marine sands,which were brought by dominant sand-moving winds from the innercontinental shelf during marine transgressions (Thompson, 1992;Lees, 2006). The small amount of P in the parent sand is believed to beassociated with sesquioxide coatings (silica, Al, Fe and potassium) of si-liceous sands (Thompson, 1992). The decline in soil total P with soil ageat Cooloola was consistent with many chronosequence studies (Walkerand Syers, 1976; Parfitt et al., 2005; Selmants and Hart, 2010; Turneret al., 2012; Izquierdo et al., 2013), while some other studies showedthat soil total P varies little with age due to the youth and N limited na-ture of the sequence (Vincent et al., 2013).
The extent of changes in soil P pools during pedogenesis depends onthe parental material, climate factors (particularly moisture), age of thechronosequence and other factors (Walker and Syers, 1976; Lajtha andSchlesinger, 1988; McDowell et al., 2007; Selmants and Hart, 2010;Vincent et al., 2013). The dynamic pattern of NH4Cl soluble Pi – themost readily available P soil pool (the increase from CS1 to CS4 and de-cline from CS4 to CS6; Fig. 3a) – reflected the trend in vegetation bio-mass production (Wardle et al., 2004). In addition, the negativerelationship observed between NH4Cl soluble P and acid extractableAl, Fe, and Mn concentrations (Table 2) also suggested that weatheringand transformations of metal oxides govern the available P pool during
d nutrient dynamics along the Cooloola coastal dune chronosequence,016/j.geoderma.2015.04.027
CS1BCS2 B CS5
CS6
Fol
iar
N:P
rat
io
0
10
20
30
CS1BCS2 B CS5
CS6
Fol
iar
P (
mg
kg-1
)
0
100
200
300
400
500
CS1BCS2 B CS5
CS6
Fol
iar
N%
0.0
0.2
0.4
0.6
0.8
1.0a b c
Banksia aemula/ integrifolia
SequenceCS1B
CS3 ACS4 B CS5
CS6
Fol
iar
N%
0.0
0.4
0.8
1.2
1.6
2.0
Sequence
CS1BCS3 A
CS4 B CS5CS6
Fol
iar
P (
mg
kg-1
)
0
200
400
600
800
1000
1200
Sequence
CS1BCS3 A
CS4 B CS5CS6
Fol
iar
N:P
rat
io
0
10
20
30
Leptospermum trinervium/ semibaccatum
d e f
Fig. 7.Mean values (n = 3) of leaf carbon (C), nitrogen (N) and phosphorus (P) concentrations, C:N, C:P and N:P ratios along the Cooloola sand dune sequence in southern Queensland,Australia.
9C.R. Chen et al. / Geoderma xxx (2015) xxx–xxx
pedogenesis. The NH4F extractable Pi fraction (associated with Alhydrous oxides) was small (average 0.58% of soil total P; b5% of totalNH4F P). Rapid declines in major inorganic P pools (NaOH I Pi, H2SO4
Pi and NaOH II Pi) during the early stages (CS1–CS2, ca. 0.04 ka–3.2 ka; Fig. 3) of this subtropical sequence at Cooloola correspondedwell with sharp decreases in the contents of surface soil total Al andFe (and to a lesser extent for Mn; Table 1), suggesting enhancedweathering under this hot and humid subtropical environment com-pared to cooler temperate environments.
Inorganic P released from the parentmaterialwas lost from soil due toplant uptake and leaching (Thompson, 1981). The Al and Fe is leacheddown the soil profile as Al-organic matter or Fe-organic matter com-plexes, forming a spodic B horizon as the soils develop (Skjemstad et al.,1992). Most organic P fractions (NH4F Po, NaOH II Po) decreased in theearly stages of soil development, sharing a similar pattern as key inorganicP fractions (NaOH I Pi, H2SO4 Pi and NaOH II Pi; Fig. 3). The ratio of Alassociated organic P (NH4F Po) to Fe associated organic P (NaOH I Po,NaOH II Po) generally decreased with soil age (Fig. 4) indicating that ashift from the dominance of Al-associated organic P to Fe-associated or-ganic P during pedogenesis. This, together with the positive relationshipsbetween most organic P fractions and soil acid extractable Al contents,and no relationships observed between soil acid extractable Fe and Mncontents and organic P fractions, suggested that soil Al was likely to gov-ern the re-stabilization of soil organic P dynamics during pedogenesis. Onthe other hand, acid extractable soil Fe andMncontentswere significantlycorrelated with inorganic P fractions, suggesting that these metals are in-volvedmainly in soil inorganic P dynamics during pedogenesis.Moreover,the largest amounts of recalcitrant P (residual P) were observed in theyoungest soils (CS1A and CS1B; Fig. 3e, f); this is consistent with data re-portedby Selmants andHart (2010) for a semiarid basalt chronosequence,but is not predicted by the Walker and Syers (1976) model.
4.3. Comparison with the Walker and Syers model
The Walker and Syers (1976) model was developed from a seriesof studies on chronosequences in humid and temperate environments
Please cite this article as: Chen, C.R., et al., Soil phosphorus fractionation ansouthern Queensland, Australia, Geoderma (2015), http://dx.doi.org/10.10
in New Zealand and has proved to be robust across variety ofchronosequences on different parent materials and under contrastingclimates and vegetation (Crews et al., 1995; Selmants and Hart, 2010;Turner and Condron, 2013), despite some reports showing that it maynot be entirely applicable to sequences in arid (e.g., desert; Lajtha andSchlesinger, 1988) or tropical environments (Schlesinger et al., 1998).The Walker and Syers model predicts a decrease in primary mineral Pas pedogenesis proceeds. This occurs in parallel with an accumulationof organic and occluded inorganic P associatedwith secondaryminerals.As soils continue to age, primary mineral P is completely depleted andorganic and occluded P dominate the remaining P pool.
At Cooloola, however, the parent sand contains little primaryminer-al P (PCa, 7–17 kg P ha−1 and 3–10mgP kg−1 in the upper 30 cmof soil)(Fig. 4a) compared with most other chronosequence studies(N200 mg kg−1; Walker and Syers, 1976; Schlesinger et al., 1998;Turner et al., 2012), although decreasing primary mineral P (PCa) withage was consistent with the Walker and Syers model. However, theamounts of occluded P and organic P at the 0–30 cm depth decreasedin the early stage of soil development (i.e. CS1 to CS2) along theCooloola sequence (Fig. 4a), which is not predicted by the model. It ispossible that the youngest dunes are older than suggested by the lumi-nescence dates, and therefore that primary mineral P has already beenlost; further dating work with optically stimulated luminescence is re-quired to confirm the ages of the dunes. Alternatively, and perhapsmore likely, the parent sand is pre-weathered due to its continental or-igin (Thompson, 1981). This would explain why much of the P in theyoungest dunes is present in secondary/occluded forms associatedwith crystalline Fe and Al oxide coatings on quartz grains. This is similarto the Mendecino sequence in California, where the youngest terrace is100,000 years old and is formed in pre-weathered marine sedimentaryparent material (Izquierdo et al., 2013).
The large quantity of organic P present in young soils at Cooloola(Fig. 5a) might be explained by a rapid accumulation of organic matterduring the early stages of soil development. For example, Celi et al.(2013) reported that Scots pine (Pinus sylvestris) revegetation in a dis-used sand quarry in Northwestern Russia led to rapid accumulation of
d nutrient dynamics along the Cooloola coastal dune chronosequence,16/j.geoderma.2015.04.027
10 C.R. Chen et al. / Geoderma xxx (2015) xxx–xxx
organic P (35–69% of total soil P) after only 40 years of pedogenesis in arelatively cold environment. Similarly, organic P has been reportedto accumulate in only a few hundred years in the humid tropics(Schlesinger et al., 1998) and under the warm temperate climate ofthe west coast of New Zealand (Turner et al., 2007, 2012). In the sub-tropical Cooloola coastal areas, high rainfall and temperature may fa-vour biological growth and thus rapid accumulation of organic matter(and organic P). In addition, it is possible that the parent sand mightalso contain recalcitrant organic P due to its origin on the Australiancontinental landmass (see above).
5. Conclusion
Pedogenesis along the Cooloola dune chronosequence involves adecline in total soil P and increasing biological P limitation over500,000 years of ecosystem development. However, young soils containrelatively large amounts of occluded and organic P, which we attributeto the pre-weathered nature of the parent sand, originating from thecontinental margin and containing little marine carbonate. The abun-dance of organic P in the young soils might also reflect rapid accumula-tion of organicmatter during early stages of soil development under thiswarm and wet subtropical climate. The Cooloola chronosequence istherefore is an important example of long-term ecosystem develop-ment under a subtropical climate, which represents a modification ofthe classic Walker and Syers model of P transformations during pedo-genesis due to the pre-weathered nature of the parent sand.
Supplementary data to this article can be found online at http://dx.doi.org/10.1016/j.geoderma.2015.04.027.
Acknowledgements
We would like to thank Ernie Rider for his assistance in the fieldsampling and the survey of plant species and Marijka Heenan, XienLong and Yumei Zhang for their assistance in the field sampling. Wewould also like to thanks Queensland National Parks and WildlifeService for permission to work at the Cooloola sites. This research wassupported under Australian Research Council's Future Fellowshipfunding scheme (project number FT0990547).
References
Burau, R.E., 1982. Lead. In: Page, A.L., et al. (Eds.), Methods of Soil Analysis, Part 2, Chem-ical and Microbiological Properties, 2nd ed. . Agron. Monogr. vol. 9. ASA and SSSA,Madison, WI, U.S.A., pp. 347–366.
Canadell, J., Jackson, R.B., Ehleringer, J.R., Mooney, H.A., Sala, O.E., Schulze, E.D., 1996. Max-imum rooting depth of vegetation types at the global scale. Oecologia 108, 583–595.
Celi, L., Cerli, C., Turner, B.L., Santoni, S., Bonifacio, E., 2013. Biogeochemical cycling of soilphosphorus during natural revegetation of Pinus sylvestris on disused sand quarries inNorthwestern Russia. Plant Soil 367, 121–134.
Chang, S.C., Jackson, M.L., 1957. Fractionation of soil phosphorus. Soil Sci. 84, 133–144.Cleveland, C.C., Liptzin, D., 2007. C:N:P stoichiometry in soil: is there a “Redfield ratio” for
the microbial biomass? Biogeochemistry 85, 235–252.Coomes, D.A., Warren, A.B., Tanentzao, A.J., Burrows, L.E., 2013. Soil drainage and phos-
phorus depletion contribute to retrogressive succession along a New Zealandchronosequence. Plant Soil 367, 77–91.
Crews, T.E., Kitayama, K., Fownes, J.H., Riley, R.H., Herbert, D.A., Mueller-Dombois, D.,Vitousek, P.M., 1995. Changes in soil phosphorus fractions and ecosystem dynamicsacross a long chronosequence in Hawaii. Ecology 76, 1407–1424.
Güsewell, S., 2004. N:P ratios in terrestrial plants: variation and functional significance.New Phytol. 164, 243–266.
Hayes, P., Turner, B.L., Lambers, H., Laliberté, E., 2014. Foliar nutrient concentrations andresorption efficiency in plants of contrasting nutrient-acquisition strategies along a2-million-year dune chronosequence. J. Ecol. 102, 396–410.
Isbell, R.F., 2003. The Australian Soil Classification. revised edition. CSIRO Publishing,Collingwood, VIC.
Izquierdo, J.E., Houlton, B.Z., van Huysen, T.L., 2013. Evidence for progressive phosphoruslimitation over long-term ecosystem development: examination of a biogeochemicalparadigm. Plant Soil 367, 135–147.
Lajtha, K., Schlesinger, W.H., 1988. The biogeochemistry of phosphorus cycling and phos-phorus availability along a desert soil chronosequence. Ecology 69, 24–39.
Laliberté, E., Turner, B.L., Costes, T., Pearse, S.J., Wyrwoll, K.-H., Zermunik, G., Lambers, H.,2012. Experimental assessment of nutrient limitation along a 2-million-year dune
Please cite this article as: Chen, C.R., et al., Soil phosphorus fractionation ansouthern Queensland, Australia, Geoderma (2015), http://dx.doi.org/10.1
chronosequence in the south-western Australia biodiversity hotspot. J. Ecol. 100,631–642.
Lambers, H., Shane, M.W., Cramer, M.D., Pearse, S.J., Veneklaas, E.J., 2006. Root structureand functioning for efficient acquisition of phosphorus: matching morphologicaland physiological traits. Ann. Bot. Lond. 98, 693–713.
Lambers, H., Cawthray, G.R., Giavalisco, P., Kuo, J., Laliberté, E., Pearse, S.J., Scheible, W.-R.,Stitt, M., Teste, F., Turner, B.L., 2012. Proteaceae from severely phosphorus-impoverished soils extensively replace phospholipids with galactolipids andsulfolipids during leaf development to achieve a high photosynthetic phosphorus-use-efficiency. New Phytol. 196, 1098–1108.
Lees, B., 2006. Timing and formation of coastal dunes in northern and eastern Australia.J. Coast. Res. 22, 78–89.
McDowell, R.W., Condron, L.M., 2000. Chemical nature and potential mobility of phospho-rus in fertiliser grassland soils. Nutr. Cycl. Agroecosyst. 57, 225–233.
McDowell, R.W., Cade-Menun, B., Stewart, I., 2007. Organic phosphorus speciation andpedogenesis: analysis by solution 31P nuclear magnetic resonance spectroscopy.Eur. J. Soil Sci. 58, 1348–1357.
Olsen, S.R., Sommers, L.E., 1982. Phosphorus. In: Page, A.L., Miller, R.H., Keeney, D.R. (Eds.),Methods of Soil Analysis (Part 2). American Society of Agronomy, Madison, WI.
Parfitt, R.L., Ross, D.J., Coomes, D.A., Richardson, S.J., Smale, M.C., Dahlgren, R.A., 2005. Nand P in New Zealand soil chronosequences and relationships with foliar N and P.Biogeochemistry 75, 305–328.
Pelzer, D.A., Wardle, D.A., Allison, V.J., Baisden, W.T., Bardgett, R.D., Chadwick, O.A.,Condron, L.M., Parfitt, R.L., Porder, S., Richardson, S.J., Turner, B.L., Vitousek, P.M.,Walker, J., Walker, L.R., 2010. Understanding ecosystem retrogression. Ecol. Monogr.80, 509–529.
Porder, S., Ramachandran, S., 2013. The phosphorus concentration of common rocks — apotential driver of ecosystem P status. Plant Soil 367, 41–55.
Rayment, G.E., Higginson, F.R., 1992. Australian Laboratory Handbook of Soil and WaterChemical Methods. Inkata Press, Melbourne, Australia.
Schlesinger, W.H., Bruijnzeel, L.A., Bush, M.B., Klein, E.M., Mace, K.A., Raikes, J.A.,Whittaker, R.J., 1998. The biogeochemistry of phosphorus after the first century ofsoil development on Rakata Island, Krakatau, Indonesia. Biogeochemistry 40, 37–55.
Selmants, P.C., Hart, S.C., 2010. Phosphorus and soil development: does the Walker andSyers model apply to semiarid ecosystems? Ecology 91, 474–484.
Skjemstad, J.O., Fitzpatrick, R.W., Zarcinas, B.A., Thompson, C.H., 1992. Genesis of podzolson coastal dunes in southern Queensland. II. Geochemistry and forms of elements asdeduced from various soil extraction procedures. Aust. J. Soil Res. 30, 615–644.
Soil Survey Staff, 1999. Soil taxonomy a basic system of soil classification for making andinterpreting soil surveys. 2nd ed. USDA Soil Conservation Service, Washington, DC.
Syers, J.K., Walker, T.W., 1969. Phosphorus transformations in a chronosequence of soilsdeveloped on wind-blown sand in New Zealand I. Total and organic phosphorus.J. Soil Sci. 20, 57–64.
Tejan-Kella, M.S., Chittleborough, D.J., Fitzpatrick, R.W., Thompson, C.H., Prescott, J.R.,Hutton, J.T., 1990. Thermoluminescence dating of coastal sand dunes at Cooloolaand North Stradbroke Island. Australia. Aust. J. Soil Res. 28, 465–468.
Thompson, C.H., 1981. Podzol chronosequences on coastal dunes of eastern Australia. Na-ture 291, 59–61.
Thompson, C.H., 1992. Genesis of podzols on coastal dunes in southern Queensland. I.Field relationships and profile morphology. Aust. J. Soil Res. 30, 593–613.
Thompson, C.H., Moore, A.W., 1984. Studies in landscape dynamics in the Cooloola-Noosariver area, Queensland. 1. Introduction, general description and research approach.Divisional Report No., 73. CSIRO Division of Soil, p. 93.
Tiessen, H., Moir, J.O., 1993. Characterization of available P by sequential extraction. In:Carter, Martin R. (Ed.), Soil Sampling and Methods of Analysis. Lewis Publishers,Boca Raton, Ann Arbor, London, pp. 75–85.
Turner, B.L., Condron, L.M., 2013. Pedogenesis, nutrient dynamics, and ecosystem devel-opment: the legacy of TW Walker and JK Syers. Plant Soil 367, 1–10.
Turner, B.L., Laliberté, E., 2015. Soil development and nutrient availability along a2 million-year coastal dune chronosequence under species-rich Mediterraneanshrubland in southwestern Australia. Ecosystems http://dx.doi.org/10.1007/s10021-014-9830-0.
Turner, B.L., Condron, L.M., Richardson, S.J., Peltzer, D.A., Allison, V.J., 2007. Soil organicphosphorus transformations during pedogenesis. Ecosystems 10, 1166–1181.
Turner, B.L., Condron, L.M., Wells, A., Andersen, K.M., 2012. Soil nutrient dynamics duringpodzol development under lowland temperature rain forest in New Zealand. Catena97, 50–62.
Vincent, A.G., Vestergren, J.G., Gröbner, P., Schleucher, J., Giesler, R., 2013. Soil organic phos-phorus transformations in a boreal forest chronosequence. Plant Soil 367, 149–162.
Vitousek, P.M., Farrington, H., 1997. Nutrient limitation and soil development: experi-mental test of a biogeochemical theory. Biogeochemistry 37, 63–75.
Walker, T.W., Syers, J.K., 1976. The fate of phosphorus during pedogenesis. Geoderma 15,1–19.
Walker, J., Thompson, C.H., Lacey, C.J., 1987. Morphological differences in lignotubers of Eu-calyptus intermedia R.T. Bak. and E. signata F. Muell. Associated with different stages ofPodzol development on coastal dunes, Cooloola, Queensland. Aust. J. Bot. 35, 301–311.
Wardle, D.A., Lawrence, R.W., Bardgett, R.D., 2004. Ecosystem properties and forest de-cline in contrasting long-term chronosequences. Science 305, 509–512.
Yang, X., Post, W.M., 2011. Phosphorus transformations as a function of pedogenesis: asynthesis of soil phosphorus data using Hedley fractionation method. Biogeosci. Dis-cuss. 8, 5907–5934.
d nutrient dynamics along the Cooloola coastal dune chronosequence,016/j.geoderma.2015.04.027
Related Documents