Soil nutrient stocks and fluxes under smallholders’ mixed farming system in the central highlands of Ethiopia: research experiences from the Galessa and Gare areas Amare Haileslassie International Livestock Research Institute (ILRI), P.O.Box 5689, Addis Abeba Ethiopia. Email: [email protected]g Abstract We examined diversity in soil fertility management and resultant agro-ecosystem sustainability in barley-enset and cereals-pulse farming systems of the central highlands of Ethiopia. Galessa and Gare watersheds were selected as study sites. A questionnaire covering key aspects of resource holding and soil fertility management practices was used to collect information from stratified and randomly selected farm households. We applied Geographic Information System (GIS/ARCVIEW) to map the land use. Triplicate soil samples of each five sub-samples (0-30 cm) were collected from every land-use type in the watersheds and the data were subjected to statistical analysis. We calculated partial and full nutrients balance (N, P and K for the 2002/2003 cropping season) and nutrients stocks were connected to flows to visualise system sustainability. Our results showed intra- and inter-farming systems soil fertility gradients. Soil fertility gradients, difference in farming systems, land-uses and resources endowment levels had apparent impacts on the magnitude of nutrient fluxes and stocks. Management related N and K fluxes were more negative in the cereals-pulse system (-28 kg N ha -1 yr -1 and -34 kg K ha -1 yr -1 ) than in the barley-enset system (-6 kg N ha -1 yr -1 and -14 kg K ha -1 yr -1 ) while P fluxes were almost neutral or slightly positive. Within the barley-enset system, a strong redistribution of N, P and K took place from the meadows and cereals (negative balance) to enset (positive balances). Although in the cereals-pulse system, N, P and K were redistributed from meadows, small cereals and pulses to maize, the latter still showed a negative nutrient balance. 2

Welcome message from author
This document is posted to help you gain knowledge. Please leave a comment to let me know what you think about it! Share it to your friends and learn new things together.
Transcript
Soil nutrient stocks and fluxes under smallholders’ mixed farming system in the central highlands of Ethiopia: research experiences from the Galessa and Gare areas
Amare Haileslassie
International Livestock Research Institute (ILRI), P.O.Box 5689, Addis Abeba Ethiopia.Email: [email protected]
Abstract
We examined diversity in soil fertility management and resultant agro-ecosystem sustainability in barley-enset and cereals-pulse farming systems of the central highlands of Ethiopia. Galessa and Gare watersheds were selected as study sites. A questionnaire covering key aspects of resource holding and soil fertility management practices was used to collect information from stratified and randomly selected farm households. We applied Geographic Information System (GIS/ARCVIEW) to map the land use. Triplicate soil samples of each five sub-samples (0-30 cm) were collected from every land-use type in the watersheds and the data were subjected to statistical analysis. We calculated partial and full nutrients balance (N, P and K for the 2002/2003 cropping season) and nutrients stocks were connected to flows to visualise system sustainability. Our results showed intra- and inter-farming systems soil fertility gradients. Soil fertility gradients, difference in farming systems, land-uses and resources endowment levels had apparent impacts on the magnitude of nutrient fluxes and stocks. Management related N and K fluxes were more negative in the cereals-pulse system (-28 kg N ha-1 yr-1 and -34 kg K ha-1 yr-1) than in the barley-enset system (-6 kg N ha-1 yr-1 and -14 kg K ha-1 yr-1) while P fluxes were almost neutral or slightly positive. Within the barley-enset system, a strong redistribution of N, P and K took place from the meadows and cereals (negative balance) to enset (positive balances). Although in the cereals-pulse system, N, P and K were redistributed from meadows, small cereals and pulses to maize, the latter still showed a negative nutrient balance.
�2
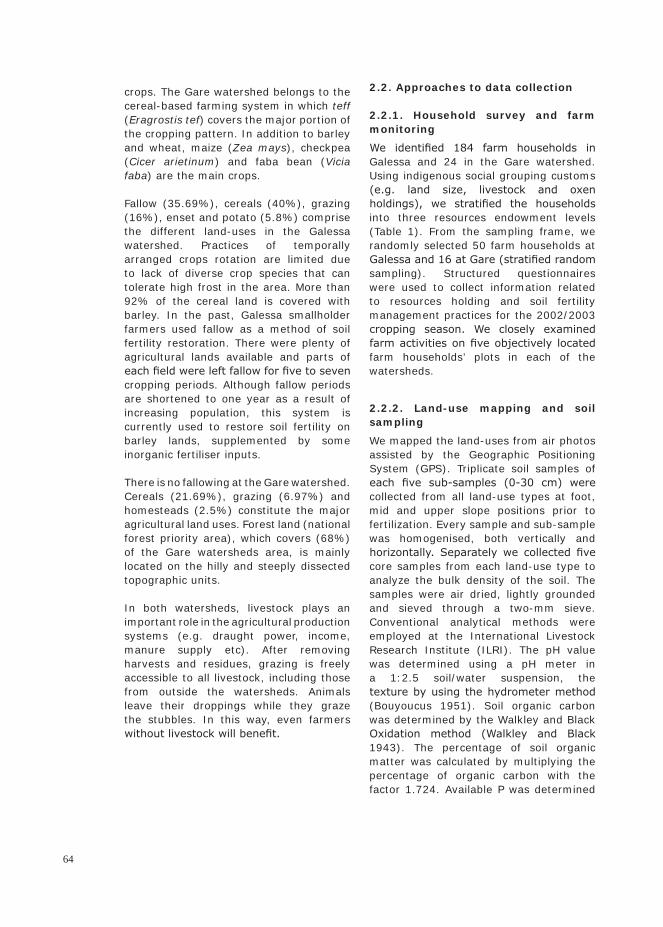
1. Introduction
Inherent soil fertility gradients can arise from differences in underlying geology, geomorphology and other soil forming processes (Brady and Weil 2002). Those properties determine the capacity of soil for different production activities, e.g. different farming systems and land uses (Lamers and Feil 1995). A given soil series cannot be considered to have a static set of characteristics. Different farming systems and land uses, induced by inherent soil fertility, can influence soil properties. Studies distinguish soil genoform and soil phenoform in this respect. The former is a genetically defined soil series while the latter indicates differences in a certain genoform as a result of different farming system and land use history (Pulleman et al. 2000, Emmerling and Udelhoven 2002).
Differences in farming systems and land uses can alter nutrient input and output fluxes in soil and vegetation. This can change soil fertility, which in turn affects biomass production and human decisions on land management (Priess et al. 2001). Smallholder farmers in barley-enset and cereal-pulses farming systems in the central highlands of Ethiopia are undertaking spatially arranged diverse land-use practices. One of the underlying assumptions is that different land uses and associated soil fertility managements can influence soil nutrient fluxes and stocks and improve agro-ecosystem sustainability. However, for this concern to be justified, such an assumption has to be made on the basis of empirical evidence. Identifying the role of soil fertility and management diversity in the sustainability of an agro-ecosystem has implications for optimised land-use and soil management planning (Stoorvogel 1993).
The objectives of this study are:
I) to investigate soil fertility gradients, associated management diversity and its impacts on agro-ecosystem sustainability
as related to nutrients stocks and fluxes;
II) to examine the effects of resources endowment levels on farm households’ perception of soil fertility management and magnitude of nutrient balances.
2. Materials and methods
2.1. Case study sites
2.1.1. Physical settings
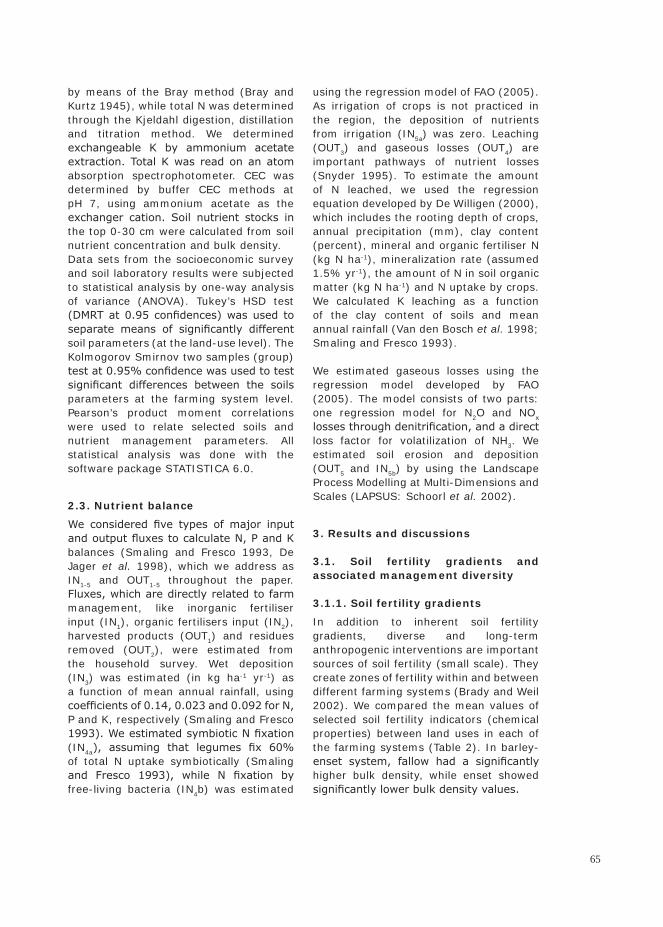
Galessa and Gare watersheds belong to the western escarpment of the Rift Valley and the landmass of the Central Highlands of Ethiopia (Figure 1). Traditionally, the Galessa watershed is classified as ‘Dega’ (cool highlands) and the Gare watershed as ‘Woyna-dega’ (warm to cool mid highlands) climatic zone (FAO/UNDP 1984). Elevation ranges of 2320-2620m at Gare and 2880-3095m at Galessa characterise the study sites.
70% of the total surface area of the Galessa watershed is covered by flat to rolling topography (0-16% slope). Hilly (16-30% slope) and steeply dissected (>30% slope) topography covers 24% and 6% of the total area, respectively. Gare has 55% flat to rolling, 24.39% hilly and 21% steeply dissected topographic units.
Rainfall data from Ginchi meteorological station (about 12 km south of Gare) shows a mean annual rainfall of 1117mm. Both study sites have a bimodal rainfall pattern, with the main rain season extending from June to September and the short rain from February to April.
2.1.2. Farming systems and land-uses
In the Galessa watershed barley (Hordeum vulgare), potato (Solanum tuberosum), and enset (Ensete ventricosum) are cultivated as major crops. Wheat (Triticum durum) and some vegetables like onion (Allium cepa) are also cultivated as minor
��
crops. The Gare watershed belongs to the cereal-based farming system in which teff (Eragrostis tef) covers the major portion of the cropping pattern. In addition to barley and wheat, maize (Zea mays), checkpea (Cicer arietinum) and faba bean (Vicia faba) are the main crops.
Fallow (35.69%), cereals (40%), grazing (16%), enset and potato (5.8%) comprise the different land-uses in the Galessa watershed. Practices of temporally arranged crops rotation are limited due to lack of diverse crop species that can tolerate high frost in the area. More than 92% of the cereal land is covered with barley. In the past, Galessa smallholder farmers used fallow as a method of soil fertility restoration. There were plenty of agricultural lands available and parts of each field were left fallow for five to seven cropping periods. Although fallow periods are shortened to one year as a result of increasing population, this system is currently used to restore soil fertility on barley lands, supplemented by some inorganic fertiliser inputs.
There is no fallowing at the Gare watershed. Cereals (21.69%), grazing (6.97%) and homesteads (2.5%) constitute the major agricultural land uses. Forest land (national forest priority area), which covers (68%) of the Gare watersheds area, is mainly located on the hilly and steeply dissected topographic units.
In both watersheds, livestock plays an important role in the agricultural production systems (e.g. draught power, income, manure supply etc). After removing harvests and residues, grazing is freely accessible to all livestock, including those from outside the watersheds. Animals leave their droppings while they graze the stubbles. In this way, even farmers without livestock will benefit.
2.2. Approaches to data collection
2.2.1. Household survey and farm monitoring
We identified 184 farm households in Galessa and 24 in the Gare watershed. Using indigenous social grouping customs (e.g. land size, livestock and oxen holdings), we stratified the households into three resources endowment levels (Table 1). From the sampling frame, we randomly selected 50 farm households at Galessa and 16 at Gare (stratified random sampling). Structured questionnaires were used to collect information related to resources holding and soil fertility management practices for the 2002/2003 cropping season. We closely examined farm activities on five objectively located farm households’ plots in each of the watersheds.
2.2.2. Land-use mapping and soil sampling
We mapped the land-uses from air photos assisted by the Geographic Positioning System (GPS). Triplicate soil samples of each five sub-samples (0-30 cm) were collected from all land-use types at foot, mid and upper slope positions prior to fertilization. Every sample and sub-sample was homogenised, both vertically and horizontally. Separately we collected five core samples from each land-use type to analyze the bulk density of the soil. The samples were air dried, lightly grounded and sieved through a two-mm sieve. Conventional analytical methods were employed at the International Livestock Research Institute (ILRI). The pH value was determined using a pH meter in a 1:2.5 soil/water suspension, the texture by using the hydrometer method (Bouyoucus 1951). Soil organic carbon was determined by the Walkley and Black Oxidation method (Walkley and Black 1943). The percentage of soil organic matter was calculated by multiplying the percentage of organic carbon with the factor 1.724. Available P was determined
��
by means of the Bray method (Bray and Kurtz 1945), while total N was determined through the Kjeldahl digestion, distillation and titration method. We determined exchangeable K by ammonium acetate extraction. Total K was read on an atom absorption spectrophotometer. CEC was determined by buffer CEC methods at pH 7, using ammonium acetate as the exchanger cation. Soil nutrient stocks in the top 0-30 cm were calculated from soil nutrient concentration and bulk density.Data sets from the socioeconomic survey and soil laboratory results were subjected to statistical analysis by one-way analysis of variance (ANOVA). Tukey’s HSD test (DMRT at 0.95 confidences) was used to separate means of significantly different soil parameters (at the land-use level). The Kolmogorov Smirnov two samples (group) test at 0.95% confidence was used to test significant differences between the soils parameters at the farming system level. Pearson’s product moment correlations were used to relate selected soils and nutrient management parameters. All statistical analysis was done with the software package STATISTICA 6.0.
2.3. Nutrient balance
We considered five types of major input and output fluxes to calculate N, P and K balances (Smaling and Fresco 1993, De Jager et al. 1998), which we address as IN1-5 and OUT1-5 throughout the paper. Fluxes, which are directly related to farm management, like inorganic fertiliser input (IN1), organic fertilisers input (IN2), harvested products (OUT1) and residues removed (OUT2), were estimated from the household survey. Wet deposition (IN3) was estimated (in kg ha-1 yr-1) as a function of mean annual rainfall, using coefficients of 0.14, 0.023 and 0.092 for N, P and K, respectively (Smaling and Fresco 1993). We estimated symbiotic N fixation (IN4a), assuming that legumes fix 60% of total N uptake symbiotically (Smaling and Fresco 1993), while N fixation by free-living bacteria (IN4b) was estimated
using the regression model of FAO (2005). As irrigation of crops is not practiced in the region, the deposition of nutrients from irrigation (IN5a) was zero. Leaching (OUT3) and gaseous losses (OUT4) are important pathways of nutrient losses (Snyder 1995). To estimate the amount of N leached, we used the regression equation developed by De Willigen (2000), which includes the rooting depth of crops, annual precipitation (mm), clay content (percent), mineral and organic fertiliser N (kg N ha-1), mineralization rate (assumed 1.5% yr-1), the amount of N in soil organic matter (kg N ha-1) and N uptake by crops. We calculated K leaching as a function of the clay content of soils and mean annual rainfall (Van den Bosch et al. 1998; Smaling and Fresco 1993).
We estimated gaseous losses using the regression model developed by FAO (2005). The model consists of two parts: one regression model for N2O and NOx losses through denitrification, and a direct loss factor for volatilization of NH3. We estimated soil erosion and deposition (OUT5 and IN5b) by using the Landscape Process Modelling at Multi-Dimensions and Scales (LAPSUS: Schoorl et al. 2002).
3. Results and discussions
3.1. Soil fertility gradients and associated management diversity
3.1.1. Soil fertility gradients
In addition to inherent soil fertility gradients, diverse and long-term anthropogenic interventions are important sources of soil fertility (small scale). They create zones of fertility within and between different farming systems (Brady and Weil 2002). We compared the mean values of selected soil fertility indicators (chemical properties) between land uses in each of the farming systems (Table 2). In barley-enset system, fallow had a significantly higher bulk density, while enset showed significantly lower bulk density values.
��
Organic matter is an important source of nutrients for plant growth in natural and managed ecosystems (Snapp et al. 1998). Different land-uses and farming systems can induce differences in the levels of organic matter and thereby act as indicators of the variability in attendant soil fertility (Pulleman 2000, Whitbread et al. 2003). Our results demonstrated a mean organic matter value of 6.96% at a barley-enset farming system and 5.62% at a cereal-pulses farming system. Similar trends of organic carbon were observed between the two farming systems. Aggregation at the farming system level suppressed divergences among the land-uses (Table 2).
Land-use level comparisons of mean values of selected soil fertility indicators are given in Table 2. Land-uses closer to households (enset, potato and maize) had significantly higher mean values of pH, organic matter, available P, P stock, exchangeable K and CEC. Remarkably, maize fields had significantly higher C/N ratio.
3.1.2. Diversity of soil fertility management
Soil fertility management is not static. Practices are being continually modified as conditions change in space and time (Boesen and Hansen 2001). A typical phenomenon is the movement from extensive to intensive soil fertility management when population pressure increases and land becomes scarce. Another example of changing soil fertility management practices is the still relatively recent shift from fertility management using natural means to synthetic fertiliser when conditions are favorable (Fournier, 1989). Farmers’ soil fertility management practices are also strongly influenced by topo-sequences and variation in soil types (Chuma et al. 2000, Wezel et al. 2002). Each soil fertility management strategy needs specific conditions and farmers combine those specific practices that are
the best suitable for them (Lamers and Feil 1995). Hence, farmers in the two study sites carry out different farming system and types of soil management due to soil fertility gradients and differences in other plant growth parameters (e.g. climate, soil physical and biological properties).
One year of fallowing (barley fields) and intensive management of homestead plots are the two basic soil fertility management practices for the barley-enset farming system. There is no planting of N fixing legume crops and there are no practices of crop rotation like in those farm households that use the cereal-pulses farming system. Farm households at barley-enset farming system have a significantly higher (DMRT at P<0.05) mean total land holding (2.21ha) and livestock (6.15TLU) compared to the cereal-pulses farming system and this is connected to soil fertility management. For example, relations between livestock holding (in TLU) and the land size of sample farm households are positive. The number of TLU and manure application also has positive correlations. Additionally, fallow land is used as animal grazing area during the months of peak feed shortage (July-September) and animal droppings on fallow plots are incorporated into the soil. But separate comparisons of mean soil properties (pH, organic matter, available P, total N, total P, total K, exchangeable K and CEC) between fallow and cereal lands at barley-enset farming system showed no significant differences (DMRT at P<0.05). Legume crops planting, crop rotation and diversification (more than 10 crops) at cereal-pulses farming system can be a compensation for less organic and inorganic fertiliser application and abandoned fallowing practices.
Sample farm households in both farming systems do not incorporate residues into the soil. Residues like maize stock are sources of household energy (cereals-pulses farming system), while fine size residues (teff, wheat, barley) are used as animal feed with priority given to lactating
��
cows, oxen and calves. In barley-enset farming system, enset leaves are a source of animal feed in years of an extended dry season. However, it is often incorporated into the soil. Of the sample households, more than 90% acknowledged the importance of erosion in both study areas. Practically, however, only cut-off drains and cultivation across the contour were indigenous soil conservation methods. The mean values of organic and inorganic fertiliser inputs by farm households in the two farming systems were compared. The results indicated that farm households in the barley-enset farming system apply a significantly higher quantity of both inorganic and organic fertilisers. Within the farming system (at micro level), crop nutrient requirement and its economic and cultural position determine the priority. For example, crops like maize (at the cereals-pulses farming system) and enset and potato (at the barley-enset farming system) require considerable nutrient inputs and hence are grown closer to residences where they can be managed intensively.
3.2. Differently resource endowed farm households: perception of soil fertility management
It is commonly assumed that poor farmers are victims of the vicious circle of ‘low income - low input - soil fertility depletion - low yield - low income’. In this study, of the interviewed (n=24) resource-poor farm households only 16% used inorganic fertilisers. About 86% of resource-rich (n=15) and 85% of medium class (n=27) sample farm households in both farming systems used inorganic fertilisers. Application of manure as a way of soil fertility improvement showed similar trend between different groups. Only 20.8% of the sample resource-poor farm households were using manure. Remarkably, 91.8% of resource-poor farmers applied household wastes to their farm plots. Of the interviewed farm households, 93% of resource-rich, 92% of
medium and 95% of resource-poor farmers replied that they had to face the problem of declining soil fertility on their field plots. Management technologies involving large size of land, livestock and financial resources were dominantly used by medium and resource-rich farmers in both study areas (this includes, for instance, the application of manure, inorganic fertiliser, and crop diversification). Similar trends of fertility management perception across socioeconomic groups in Tanzanian Semi-Arid agriculture have been reported (Boesen and Hansen 2001).
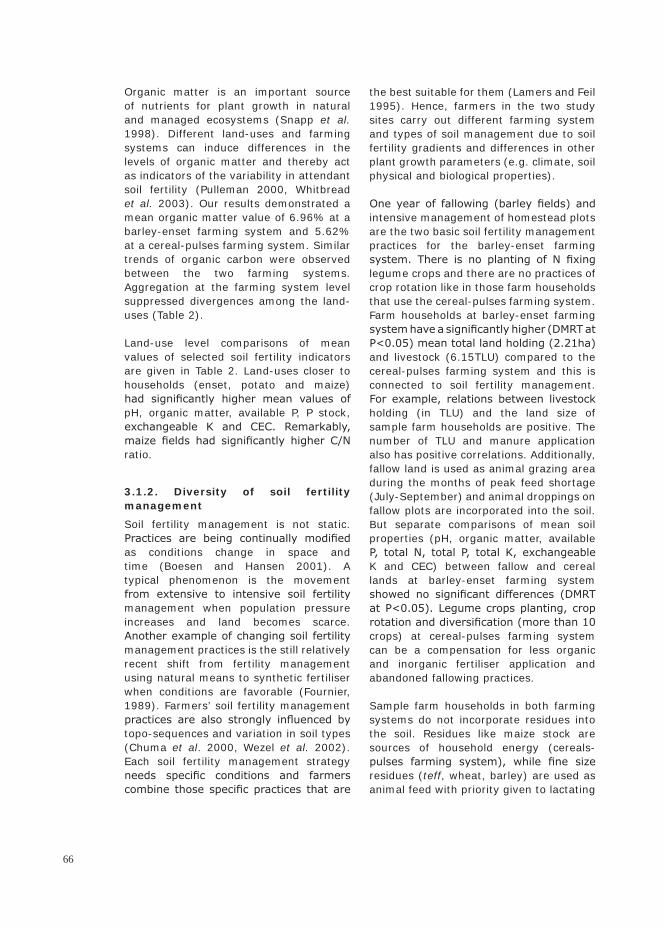
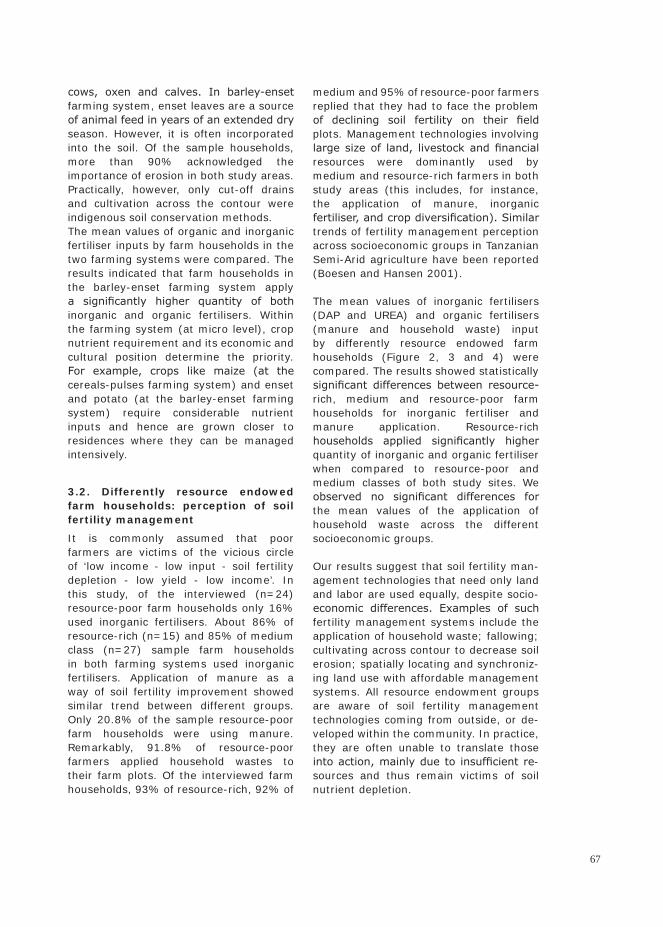
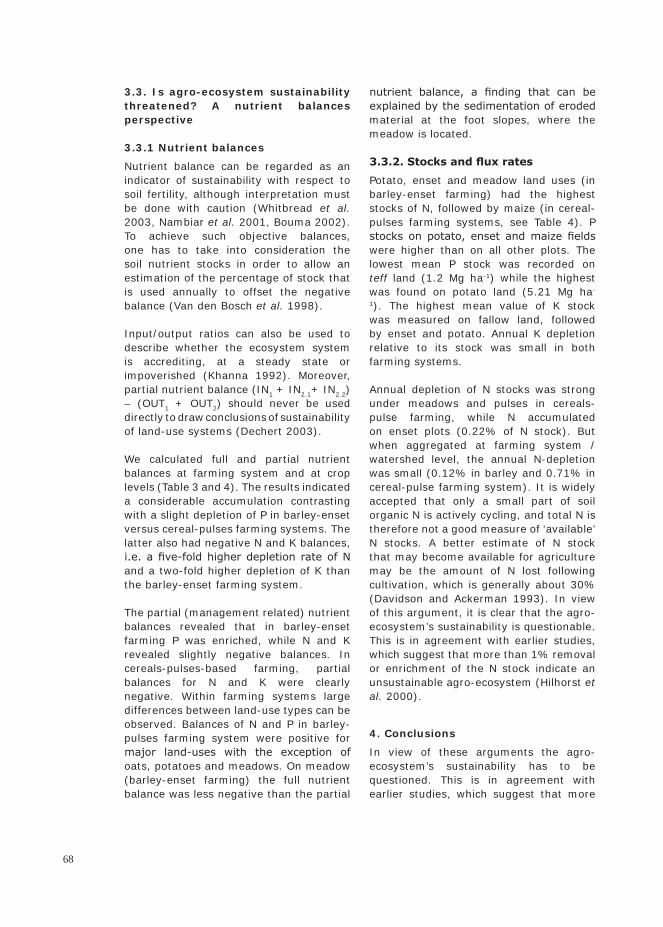
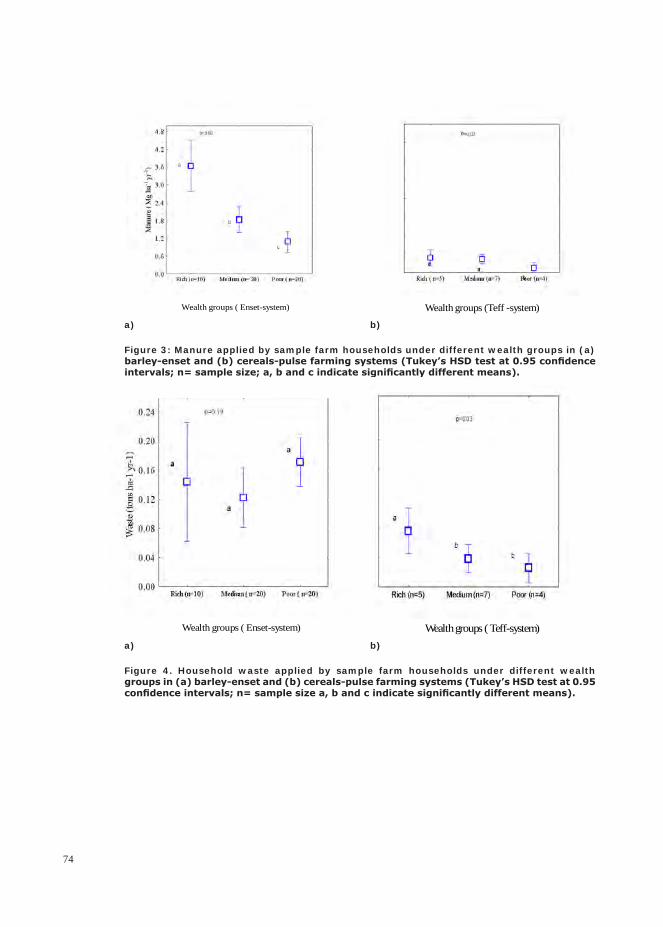
The mean values of inorganic fertilisers (DAP and UREA) and organic fertilisers (manure and household waste) input by differently resource endowed farm households (Figure 2, 3 and 4) were compared. The results showed statistically significant differences between resource-rich, medium and resource-poor farm households for inorganic fertiliser and manure application. Resource-rich households applied significantly higher quantity of inorganic and organic fertiliser when compared to resource-poor and medium classes of both study sites. We observed no significant differences for the mean values of the application of household waste across the different socioeconomic groups.
Our results suggest that soil fertility man-agement technologies that need only land and labor are used equally, despite socio-economic differences. Examples of such fertility management systems include the application of household waste; fallowing; cultivating across contour to decrease soil erosion; spatially locating and synchroniz-ing land use with affordable management systems. All resource endowment groups are aware of soil fertility management technologies coming from outside, or de-veloped within the community. In practice, they are often unable to translate those into action, mainly due to insufficient re-sources and thus remain victims of soil nutrient depletion.
��
3.3. Is agro-ecosystem sustainability threatened? A nutrient balances perspective
3.3.1 Nutrient balances
Nutrient balance can be regarded as an indicator of sustainability with respect to soil fertility, although interpretation must be done with caution (Whitbread et al. 2003, Nambiar et al. 2001, Bouma 2002). To achieve such objective balances, one has to take into consideration the soil nutrient stocks in order to allow an estimation of the percentage of stock that is used annually to offset the negative balance (Van den Bosch et al. 1998).
Input/output ratios can also be used to describe whether the ecosystem system is accrediting, at a steady state or impoverished (Khanna 1992). Moreover, partial nutrient balance (IN1 + IN2.1+ IN2.2) – (OUT1 + OUT2) should never be used directly to draw conclusions of sustainability of land-use systems (Dechert 2003).
We calculated full and partial nutrient balances at farming system and at crop levels (Table 3 and 4). The results indicated a considerable accumulation contrasting with a slight depletion of P in barley-enset versus cereal-pulses farming systems. The latter also had negative N and K balances, i.e. a five-fold higher depletion rate of N and a two-fold higher depletion of K than the barley-enset farming system.
The partial (management related) nutrient balances revealed that in barley-enset farming P was enriched, while N and K revealed slightly negative balances. In cereals-pulses-based farming, partial balances for N and K were clearly negative. Within farming systems large differences between land-use types can be observed. Balances of N and P in barley-pulses farming system were positive for major land-uses with the exception of oats, potatoes and meadows. On meadow (barley-enset farming) the full nutrient balance was less negative than the partial
nutrient balance, a finding that can be explained by the sedimentation of eroded material at the foot slopes, where the meadow is located.
3.3.2. Stocks and flux rates
Potato, enset and meadow land uses (in barley-enset farming) had the highest stocks of N, followed by maize (in cereal-pulses farming systems, see Table 4). P stocks on potato, enset and maize fields were higher than on all other plots. The lowest mean P stock was recorded on teff land (1.2 Mg ha-1) while the highest was found on potato land (5.21 Mg ha-
1). The highest mean value of K stock was measured on fallow land, followed by enset and potato. Annual K depletion relative to its stock was small in both farming systems.
Annual depletion of N stocks was strong under meadows and pulses in cereals-pulse farming, while N accumulated on enset plots (0.22% of N stock). But when aggregated at farming system /watershed level, the annual N-depletion was small (0.12% in barley and 0.71% in cereal-pulse farming system). It is widely accepted that only a small part of soil organic N is actively cycling, and total N is therefore not a good measure of ‘available’ N stocks. A better estimate of N stock that may become available for agriculture may be the amount of N lost following cultivation, which is generally about 30% (Davidson and Ackerman 1993). In view of this argument, it is clear that the agro-ecosystem’s sustainability is questionable. This is in agreement with earlier studies, which suggest that more than 1% removal or enrichment of the N stock indicate an unsustainable agro-ecosystem (Hilhorst et al. 2000).
4. Conclusions
In view of these arguments the agro-ecosystem’s sustainability has to be questioned. This is in agreement with earlier studies, which suggest that more
��
than 1% removal or enrichment of the N stock indicate an unsustainable agro-ecosystem (Hilhorst et al. 2000). It is high time to search for alternative energy sources instead of using crop residues and manure as energy sources. Equally important are issues of erosion which are the major driver of nutrient balance in both study areas. Personal observations during this study suggest strong potential of agroforestry practices in the area to relieve this tension. This is observation is attested by the work of Mekonnen.
References
Boesen J. and Hansen E.F. (2001) Soil fertility management in semi-arid agriculture in Tanzania: Farmers’ perception and management practices. Center for Development Research, Copenhagen, Denmark.
Bouma, J. (2002) Land quality indicators of sustainable land management across scales. Agric Ecosyst Environ, 88: pp. 129-136.
Bouyoucus, C.J. (1951) A calibration of the hydrometer method for making mechanical analysis of soils. Soil Sci, 59: pp. 434-438.
Brady N.C., Weil R.R. (2002) The nature and properties of soils. Prentice-Hall, New Jersey.
Bray H.R. and Kurtz L.T. (1945) Determination of total organic and available forms of phosphorus in soils. Soil Sci, 9: pp. 39-46.
Chuma E., Mombeshora B.G., Murwira H.K. and Chikuvire J. (2000) The dynamics of soil fertility management in communal areas of Zimbabwe. In: Hilhorst T., Muchena F.M. (ed) Nutrients on the move–soil fertility dynamics in African farming systems. International Institute for Environment and Development, London: pp 45-64.
Dechert, G. (2003) Nutrient dynamic and their control in land use systems of forest
margins in central Sulawesi, Indonesia. PhD thesis. Georg August Universität, Göttingen, Germany.
De Jager A., Nandwa S.M., Okoth P.F. (1998) Monitoring nutrient flows and economic performance in African Farming System (NUTMON) concept and methodology. Agric Ecosyst Environ, 71: pp. 37-48.
De Willigen, P. (2000) An analysis of the calculation of leaching and denitrification losses as practiced in the NUTMON approach. Report Nr. 18, Plant Research International: Wageningen.
Emmerling C. and Udelhoven T. (2002) Discriminating factors of the spatial variability of soil quality parameters at landscape scale. Plant Nutr Soil Sci, 165: pp. 706-712.
FAO (2005) Scaling soil nutrient balances. FAO, Rome.
Fournier, F. (1989) Effect of human activity on soil quality. In: Bouma J. and Bregt A.K. (ed) Land qualities in space and time. International Society of Soil Science, Wageningen, the Netherlands: pp. 25-31.
Hilhorst T., Muchena F., Defoer T., Hassink J., Smaling E.,Toulmin C. (2000) Managing soil fertility in Africa : diverse settings and changing practice. In: Hilhorst T., Muchena F.M. (ed) Nutrients on the move–soil fertility dynamics in African farming systems. International Institute for Environment and Development, London: pp. 1-27.
Khanna, P.K. (1992) Managing plant nutrients in soils based on the principles of nutrient cycling processes. International Symposium on Nutrient Management for Sustained Productivity, Canberra , Australia: pp. 298-311.
Lamers J.P.A. and Feil P.R. (1995) Farmers knowledge and management of spatial soil and crop growth variability in Niger, West Africa. Neth J Agr Sci, 43: pp. 375-389.
��
Nambiar K.K.M., Gupta A.P., Qinglin FU, LI S. (2001) Biophysical, chemical and socio economic indicators for assessing agricultural sustainability in the Chinese coastal zone. Agric Ecosyst Environ, 87: pp. 209-214.
Priess J.A., De Koning G.H.J, Veldkamp A. (2001) Assessment of interactions between land use change and carbon and nutrient fluxes in Ecuador. Agric Ecosyst Environ, 85: pp. 269-279.
Pulleman M.M., Bouma J., Van Essen E.A., Meijles E.W. (2001) Soil organic matter content as a function of different land use history. Soil Sci Soc Am J, 64: pp. 689-693.
Smaling E.M.A. and Fresco L.O. (1993) A decision support model for monitoring nutrient balances under agricultural land uses. Geoderma, 60: pp. 235-256.
Snapp S.S., Mafongoya P.L., Waddigton S. (1998) Organic matter technologies for integrated nutrient management in smallholder cropping systems of southern Africa. Agric Ecosyst Environ, 71: pp. 63-80.
Stoorvogel ,J.J. (1993) Optimizing land use distribution to minimise nutrient depletion: case study for the Atlantic Zone of Costa Rica. Geoderma, 60: pp. 277-292.
Stoorvogel J.J., Janssen B.H. and Van Breemen N. (1972) The nutrient budget of watershed and its forest ecosystem in the Tai National Park in Cote d’Ivoire; Biogeochemistry, 37: pp. 159-172.
Snyder, G.H. (1995) Nitrogen losses by leaching and runoff, methods and conclusions. In: Ahmed N. (ed): Nitrogen Economy in Tropical Soils. Kluwer Academic Publishers, Dordrecht, The Netherlands: pp. 215-230.
Van den Bosch H., Gitari J.N., Ogaro V.N., Maobe S.A., Vlaming J. (1998) Monitoring nutrientMonitoring nutrient flows and economic performance in African farming system (NUTMON), Monitoring
nutrient flows and balances in three districts in Kenya. Agric Ecosyst Environ, 71: pp. 63-80.
Walkley A. and Black C.A. (1934) An examination of the Degtjareff method for determining soil organic matter, and a proposed modification of the chromic acid titration method. Soil Sci, 37: pp. 29-38.
Westphal, E. (1975) Agricultural system in Ethiopia. PhD thesis. Agricultural University of Wageningen, Wageningen.
Wezel A., Steinmüller N. and Friederichsen J.R. (2002) Slope position effects on soil fertility and crop productivity and implications for soil conservation in upland northwest Vietnam. Agric Ecosyst Environ, 9: pp. 113-126.
Whitbread A., Blair G., Konboon Y., Lefroy R., and Naklang K. (2003) Managing crop residues, fertiliser and leaf litters to improve soil C, nutrient balances, and the grain yield of rice and wheat cropping systems in Thailand and Australia. Agric Ecosyst Environ, 100: pp. 251-263.
�0
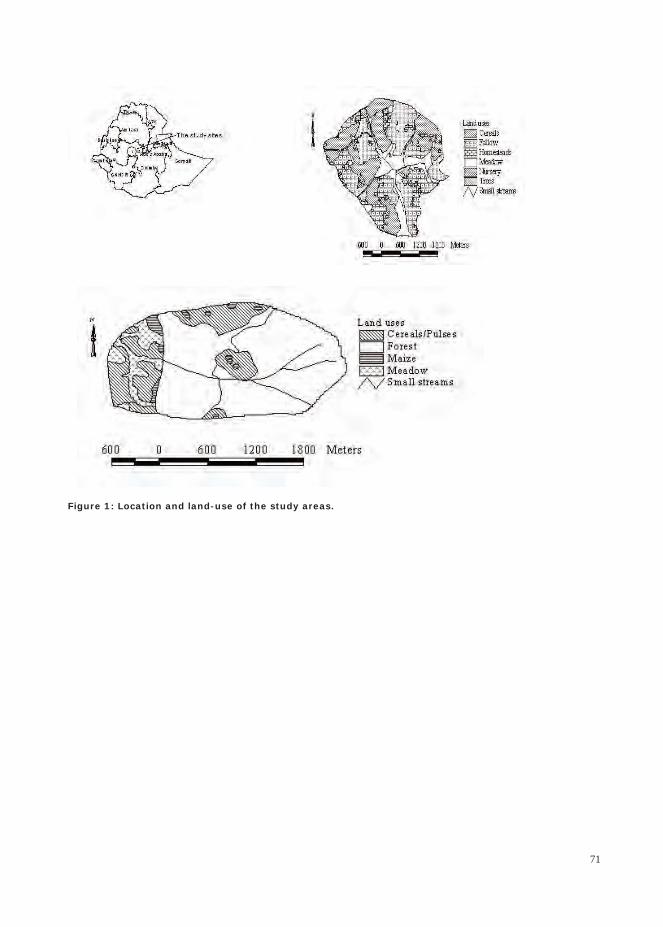
Figure 1: Location and land-use of the study areas.
�1
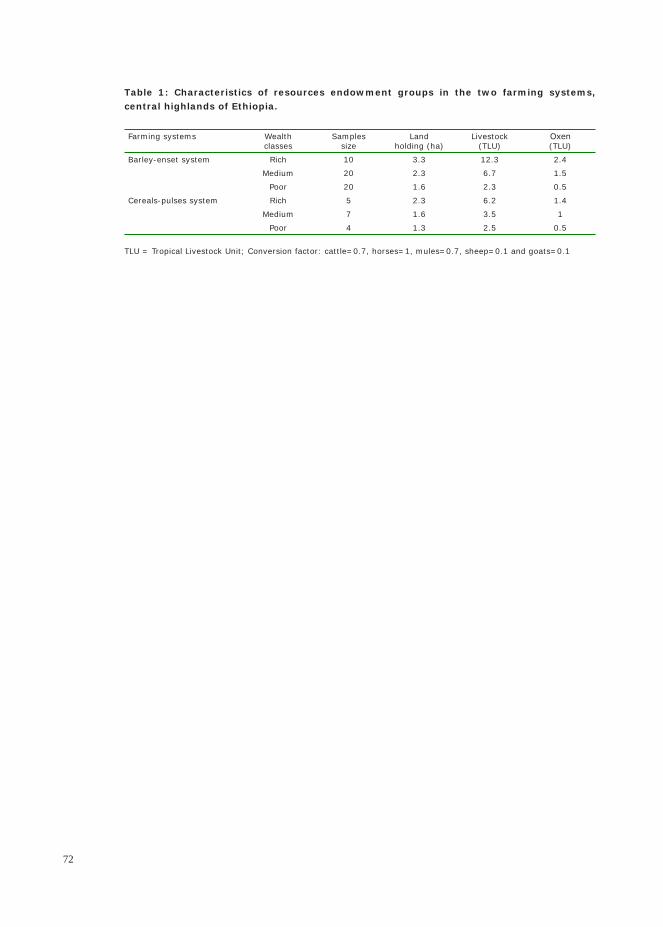
Table 1: Characteristics of resources endowment groups in the two farming systems, central highlands of Ethiopia.
Farming systems Wealthclasses
Samplessize
Landholding (ha)
Livestock(TLU)
Oxen(TLU)
Barley-enset system Rich 10 3.3 12.3 2.4
Medium 20 2.3 6.7 1.5
Poor 20 1.6 2.3 0.5
Cereals-pulses system Rich 5 2.3 6.2 1.4
Medium 7 1.6 3.5 1
Poor 4 1.3 2.5 0.5
TLU = Tropical Livestock Unit; Conversion factor: cattle=0.7, horses=1, mules=0.7, sheep=0.1 and goats=0.1
�2
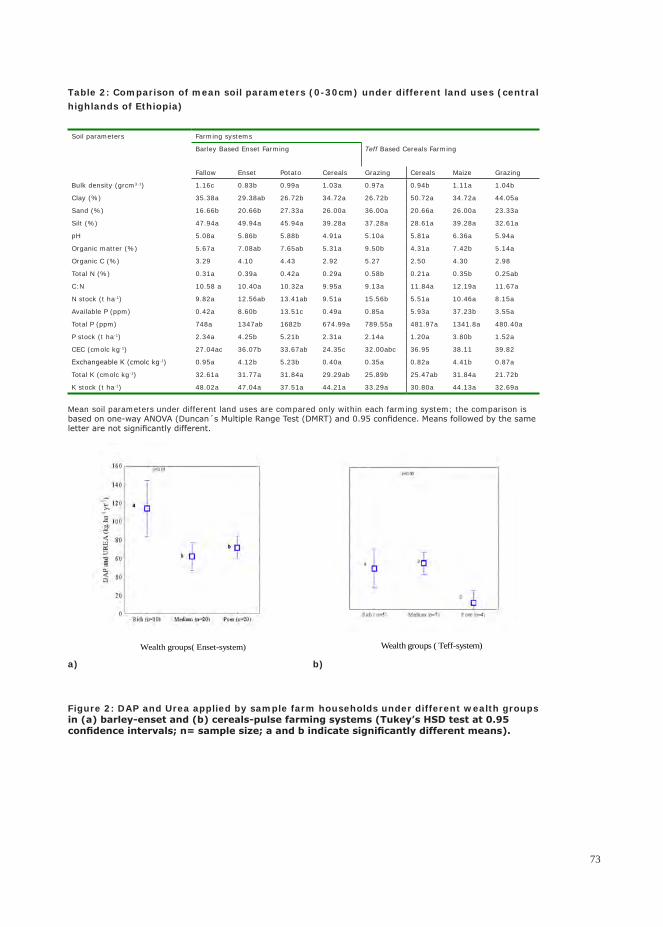
Table 2: Comparison of mean soil parameters (0-30cm) under different land uses (central highlands of Ethiopia)
Soil parameters Farming systems
Barley Based Enset Farming Teff Based Cereals Farming
Fallow Enset Potato Cereals Grazing Cereals Maize Grazing
Bulk density (grcm3-1) 1.16c 0.83b 0.99a 1.03a 0.97a 0.94b 1.11a 1.04b
Clay (%) 35.38a 29.38ab 26.72b 34.72a 26.72b 50.72a 34.72a 44.05a
Sand (%) 16.66b 20.66b 27.33a 26.00a 36.00a 20.66a 26.00a 23.33a
Silt (%) 47.94a 49.94a 45.94a 39.28a 37.28a 28.61a 39.28a 32.61a
pH 5.08a 5.86b 5.88b 4.91a 5.10a 5.81a 6.36a 5.94a
Organic matter (%) 5.67a 7.08ab 7.65ab 5.31a 9.50b 4.31a 7.42b 5.14a
Organic C (%) 3.29 4.10 4.43 2.92 5.27 2.50 4.30 2.98
Total N (%) 0.31a 0.39a 0.42a 0.29a 0.58b 0.21a 0.35b 0.25ab
C:N 10.58 a 10.40a 10.32a 9.95a 9.13a 11.84a 12.19a 11.67a
N stock (t ha-1) 9.82a 12.56ab 13.41ab 9.51a 15.56b 5.51a 10.46a 8.15a
Available P (ppm) 0.42a 8.60b 13.51c 0.49a 0.85a 5.93a 37.23b 3.55a
Total P (ppm) 748a 1347ab 1682b 674.99a 789.55a 481.97a 1341.8a 480.40a
P stock (t ha-1) 2.34a 4.25b 5.21b 2.31a 2.14a 1.20a 3.80b 1.52a
CEC (cmolc kg-1) 27.04ac 36.07b 33.67ab 24.35c 32.00abc 36.95 38.11 39.82
Exchangeable K (cmolc kg-1) 0.95a 4.12b 5.23b 0.40a 0.35a 0.82a 4.41b 0.87a
Total K (cmolc kg-1) 32.61a 31.77a 31.84a 29.29ab 25.89b 25.47ab 31.84a 21.72b
K stock (t ha-1) 48.02a 47.04a 37.51a 44.21a 33.29a 30.80a 44.13a 32.69a
Mean soil parameters under different land uses are compared only within each farming system; the comparison is based on one-way ANOVA (Duncan´s Multiple Range Test (DMRT) and 0.95 confidence. Means followed by the same letter are not significantly different.
a)
Figure 2: DAP and Urea applied by sample farm households under different wealth groups in (a) barley-enset and (b) cereals-pulse farming systems (Tukey’s HSD test at 0.95 confidence intervals; n= sample size; a and b indicate significantly different means).
Rich ( n=�) Medium (n=�) Poor (n=�)
Wealth groups ( Teff-system)
a a
b
p=0.00
b)
Rich (n=10) Medium (n=20) Poor (n=20)
Wealth groups( Enset-system)
0
20
�0
�0
�0
100
120
1�0
1�0
DA
P an
d U
REA
(kg
ha-1
yr-1
)
a
bb
p= 0.01
��
a) b)
Figure 3: Manure applied by sample farm households under different wealth groups in (a) barley-enset and (b) cereals-pulse farming systems (Tukey’s HSD test at 0.95 confidence intervals; n= sample size; a, b and c indicate significantly different means).
Rich ( n=�) Medium (n=�) Poor (n=�)
Wealth groups (Teff -system)
P=0.02
aa
b
Rich (n=10) Medium (n= 20) Poor ( n=20)
Wealth groups ( Enset-system)
0.0
0.�
1.2
1.�
2.�
�.0
�.�
�.2
�.�M
anur
e ( M
g ha
-1 yr
-1)
p= 0.00
a
b
c
a) b)
Figure 4. Household waste applied by sample farm households under different wealth groups in (a) barley-enset and (b) cereals-pulse farming systems (Tukey’s HSD test at 0.95 confidence intervals; n= sample size a, b and c indicate significantly different means).
Rich (n=10) Medium ( n=20) Poor ( n=20)
Wealth groups ( Enset-system)
0.00
0.0�
0.0�
0.12
0.1�
0.20
0.2�
Was
te (t
ons h
a-1
yr-1
)
p=0.19
a
a
a
Rich (n=5) Medium (n=7) Poor (n=4)
Wealth groups ( Teff-system)
p=0.03
a
b b
��
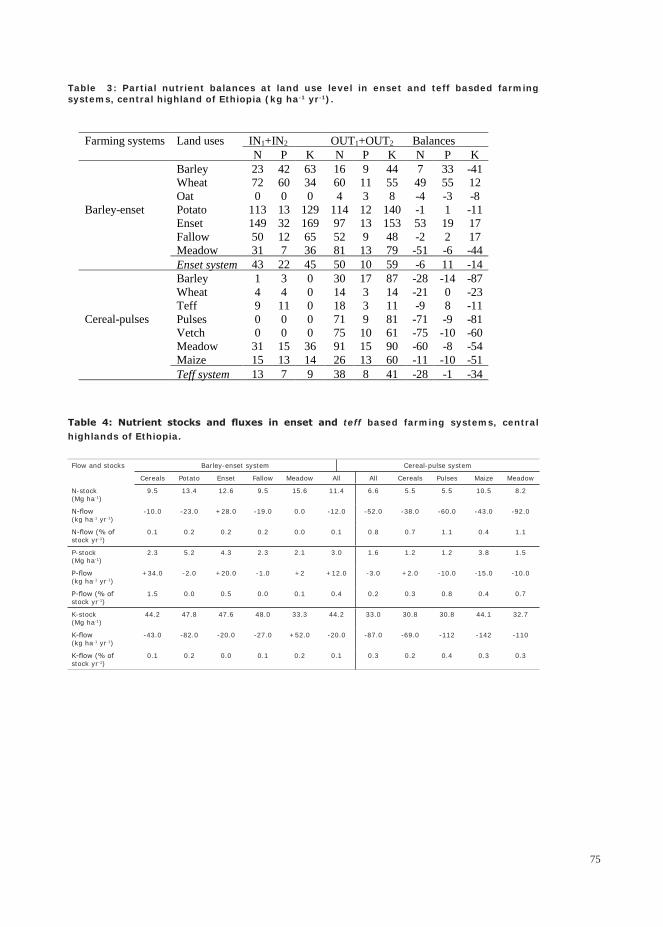
Table 3: Partial nutrient balances at land use level in enset and teff basded farming systems, central highland of Ethiopia (kg ha-1 yr-1).
Table 4: Nutrient stocks and fluxes in enset and teff based farming systems, central highlands of Ethiopia.
Flow and stocks Barley-enset system Cereal-pulse system
Cereals Potato Enset Fallow Meadow All All Cereals Pulses Maize Meadow
N-stock(Mg ha-1)
9.5 13.4 12.6 9.5 15.6 11.4 6.6 5.5 5.5 10.5 8.2
N-flow(kg ha-1 yr-1)
-10.0 -23.0 +28.0 -19.0 0.0 -12.0 -52.0 -38.0 -60.0 -43.0 -92.0
N-flow (% of stock yr-1)
0.1 0.2 0.2 0.2 0.0 0.1 0.8 0.7 1.1 0.4 1.1
P-stock(Mg ha-1)
2.3 5.2 4.3 2.3 2.1 3.0 1.6 1.2 1.2 3.8 1.5
P-flow(kg ha-1 yr-1)
+34.0 -2.0 +20.0 -1.0 +2 +12.0 -3.0 +2.0 -10.0 -15.0 -10.0
P-flow (% of stock yr-1)
1.5 0.0 0.5 0.0 0.1 0.4 0.2 0.3 0.8 0.4 0.7
K-stock(Mg ha-1)
44.2 47.8 47.6 48.0 33.3 44.2 33.0 30.8 30.8 44.1 32.7
K-flow(kg ha-1 yr-1)
-43.0 -82.0 -20.0 -27.0 +52.0 -20.0 -87.0 -69.0 -112 -142 -110
K-flow (% of stock yr-1)
0.1 0.2 0.0 0.1 0.2 0.1 0.3 0.2 0.4 0.3 0.3
Table �. Partial nutrient balances at land use level in enset and teff based farming systems, central highland of Ethiopia (kg ha-1 yr –1).
Farming systems Land uses IN1+IN2 OUT1+OUT2 Balances N P K N P K N P K
Barley 2� �2 �� 1� � �� � �� -�1 Wheat �2 �0 �� �0 11 �� �� �� 12 Oat 0 0 0 � � � -� -� -� Potato 11� 1� 12� 11� 12 1�0 -1 1 -11 Enset 1�� �2 1�� �� 1� 1�� �� 1� 1� Fallow �0 12 �� �2 � �� -2 2 1� Meadow �1 � �� �1 1� �� -�1 -� -��
Barley-enset
Enset system �� 22 �� �0 10 �� -� 11 -1� Barley 1 � 0 �0 1� �� -2� -1� -�� Wheat � � 0 1� � 1� -21 0 -2� Teff � 11 0 1� � 11 -� � -11 Pulses 0 0 0 �1 � �1 -�1 -� -�1 Vetch 0 0 0 �� 10 �1 -�� -10 -�0 Meadow �1 1� �� �1 1� �0 -�0 -� -�� Maize 1� 1� 1� 2� 1� �0 -11 -10 -�1
Cereal-pulses
Teff system 1� � � �� � �1 -2� -1 -��
��
Related Documents