Top Banner
Soil Moisture Statistics: Sampling, Averaging and Interpretation Gaylon Campbell Decagon Devices, Inc. Pullman, WA
37

Soil Moisture Statistics: Sampling, Averaging and ...library.metergroup.com/Retired and Discontinued/Slicks and content... · Soil Moisture Statistics: Sampling, Averaging and Interpretation

Jul 23, 2018

Download

Documents

vokhanh
Welcome message from author
This document is posted to help you gain knowledge. Please leave a comment to let me know what you think about it! Share it to your friends and learn new things together.
Transcript
Page 1: Soil Moisture Statistics: Sampling, Averaging and ...library.metergroup.com/Retired and Discontinued/Slicks and content... · Soil Moisture Statistics: Sampling, Averaging and Interpretation

Soil Moisture Statistics: Sampling, Averaging and Interpretation

Gaylon Campbell

Decagon Devices, Inc.

Pullman, WA

Page 2: Soil Moisture Statistics: Sampling, Averaging and ...library.metergroup.com/Retired and Discontinued/Slicks and content... · Soil Moisture Statistics: Sampling, Averaging and Interpretation

Main Topics

How many samples do I need?

To average or not to average

Spatial dependence and co-dependence

Page 3: Soil Moisture Statistics: Sampling, Averaging and ...library.metergroup.com/Retired and Discontinued/Slicks and content... · Soil Moisture Statistics: Sampling, Averaging and Interpretation

Main Topics

How many samples do I need?

To average or not to average

Spatial dependence and co-dependence

Page 4: Soil Moisture Statistics: Sampling, Averaging and ...library.metergroup.com/Retired and Discontinued/Slicks and content... · Soil Moisture Statistics: Sampling, Averaging and Interpretation

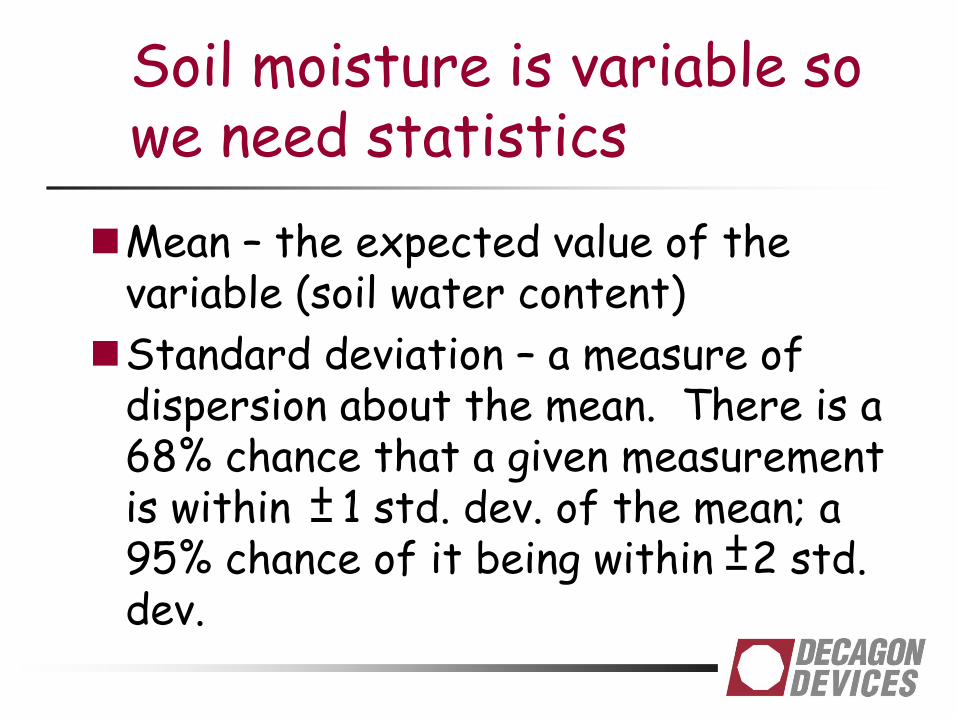
Soil moisture is variable so we need statistics

Mean – the expected value of the variable (soil water content)

Standard deviation – a measure of dispersion about the mean. There is a 68% chance that a given measurement is within 1 std. dev. of the mean; a 95% chance of it being within 2 std. dev.

±±

Page 5: Soil Moisture Statistics: Sampling, Averaging and ...library.metergroup.com/Retired and Discontinued/Slicks and content... · Soil Moisture Statistics: Sampling, Averaging and Interpretation

Example

We measure a water content of 27%

We know (or assume) the water content standard deviation is 3%

The mean or expected value of the soil water content is therefore likely (95% chance) between 21 and 33%

Page 6: Soil Moisture Statistics: Sampling, Averaging and ...library.metergroup.com/Retired and Discontinued/Slicks and content... · Soil Moisture Statistics: Sampling, Averaging and Interpretation

What if we need a more accurate value?

Sample multiple values of water content

Compute the average water content

sm =s

n

Page 7: Soil Moisture Statistics: Sampling, Averaging and ...library.metergroup.com/Retired and Discontinued/Slicks and content... · Soil Moisture Statistics: Sampling, Averaging and Interpretation

Another example

100 samples give an average of 28%

Std. dev. of mean = 3/10 = 0.3%

The mean or expected value of the soil water content is therefore likely (95% chance) between 27.4 and 28.6%

Page 8: Soil Moisture Statistics: Sampling, Averaging and ...library.metergroup.com/Retired and Discontinued/Slicks and content... · Soil Moisture Statistics: Sampling, Averaging and Interpretation

How many samples do I need?

What accuracy is needed?

What is the std. dev.

Accuracy = 2 std. dev. of mean

n =s

sm

æ

èç

ö

ø÷

2

=2s

e

æ

èç

ö

ø÷

2

±

Page 9: Soil Moisture Statistics: Sampling, Averaging and ...library.metergroup.com/Retired and Discontinued/Slicks and content... · Soil Moisture Statistics: Sampling, Averaging and Interpretation

Number of samples -calculation

How many samples would we need to know water content within 1%?

Std. dev. is 3%, e = 1%, n = (2x3/1)2 = 36

Page 10: Soil Moisture Statistics: Sampling, Averaging and ...library.metergroup.com/Retired and Discontinued/Slicks and content... · Soil Moisture Statistics: Sampling, Averaging and Interpretation

Field data – 3 transects, 1 m spacing

Page 11: Soil Moisture Statistics: Sampling, Averaging and ...library.metergroup.com/Retired and Discontinued/Slicks and content... · Soil Moisture Statistics: Sampling, Averaging and Interpretation

Drydown/wetup of a single, installed sensor

Page 12: Soil Moisture Statistics: Sampling, Averaging and ...library.metergroup.com/Retired and Discontinued/Slicks and content... · Soil Moisture Statistics: Sampling, Averaging and Interpretation

One sample per hour

Page 13: Soil Moisture Statistics: Sampling, Averaging and ...library.metergroup.com/Retired and Discontinued/Slicks and content... · Soil Moisture Statistics: Sampling, Averaging and Interpretation

10 samples per hour

Page 14: Soil Moisture Statistics: Sampling, Averaging and ...library.metergroup.com/Retired and Discontinued/Slicks and content... · Soil Moisture Statistics: Sampling, Averaging and Interpretation

100 samples per hour

Page 15: Soil Moisture Statistics: Sampling, Averaging and ...library.metergroup.com/Retired and Discontinued/Slicks and content... · Soil Moisture Statistics: Sampling, Averaging and Interpretation

Points to remember

Soil water content varies from place to place

We usually need to average several measurements to know what the water content is – and then we don’t know it very well

We usually can’t afford enough sensors to “know” what the water content is

Page 16: Soil Moisture Statistics: Sampling, Averaging and ...library.metergroup.com/Retired and Discontinued/Slicks and content... · Soil Moisture Statistics: Sampling, Averaging and Interpretation

More points to remember

But - for many purposes you just need to know if water content changed, not what it is, exactly.

You can get around many effects of spatial variability by monitoring in situ

Page 17: Soil Moisture Statistics: Sampling, Averaging and ...library.metergroup.com/Retired and Discontinued/Slicks and content... · Soil Moisture Statistics: Sampling, Averaging and Interpretation

Main Topics

How many samples do I need?

To average or not to average

Spatial dependence and co-dependence

Page 18: Soil Moisture Statistics: Sampling, Averaging and ...library.metergroup.com/Retired and Discontinued/Slicks and content... · Soil Moisture Statistics: Sampling, Averaging and Interpretation

Systematic and Random Variation in Soil Moisture

±

y = 5.49E-03x + 3.40E-01

R2 = 4.41E-01

0.00

0.10

0.20

0.30

0.40

0.50

0.60

0 5 10 15 20

Distance - m

Wat

er

Co

nte

nt

-m/m

Variance 44% model 56% random Std dev 5% syx 3.5%

Page 19: Soil Moisture Statistics: Sampling, Averaging and ...library.metergroup.com/Retired and Discontinued/Slicks and content... · Soil Moisture Statistics: Sampling, Averaging and Interpretation

Maybe there is even more structure to be modeled--

y = 2E-07x6 - 1E-05x5 + 0.0004x4 - 0.005x3 + 0.0284x2 - 0.0456x +

0.3264

R2 = 0.69460.00

0.10

0.20

0.30

0.40

0.50

0.60

0 5 10 15 20

Distance - m

Wat

er

Co

nte

nt

-m/m Variance

Model 69% Random 31%

Page 20: Soil Moisture Statistics: Sampling, Averaging and ...library.metergroup.com/Retired and Discontinued/Slicks and content... · Soil Moisture Statistics: Sampling, Averaging and Interpretation

Total variance is the sum two components

Total Variance

Systematic Random

Page 21: Soil Moisture Statistics: Sampling, Averaging and ...library.metergroup.com/Retired and Discontinued/Slicks and content... · Soil Moisture Statistics: Sampling, Averaging and Interpretation

The systematic or modeled part also has two components

Systematic Variation

Temporal Spatial

*horizontal *vertical

Page 22: Soil Moisture Statistics: Sampling, Averaging and ...library.metergroup.com/Retired and Discontinued/Slicks and content... · Soil Moisture Statistics: Sampling, Averaging and Interpretation

Temporal Variation - Drydown/wetup of a sensor

Don’t average this!

Page 23: Soil Moisture Statistics: Sampling, Averaging and ...library.metergroup.com/Retired and Discontinued/Slicks and content... · Soil Moisture Statistics: Sampling, Averaging and Interpretation

Water content variation with depth in a wheat field

Average is 0.24

Range is 0.17 to 0.41

-180

-150

-120

-90

-60

-30

0

0.0 0.2 0.4 0.6

Water Content (m3/m

3)

De

pth

(c

m)

Be careful about averaging this

Page 24: Soil Moisture Statistics: Sampling, Averaging and ...library.metergroup.com/Retired and Discontinued/Slicks and content... · Soil Moisture Statistics: Sampling, Averaging and Interpretation

Random variation also has two components

Random Variation

Natural randomness

Bad measurement *Bad sensors

*Bad research

Page 25: Soil Moisture Statistics: Sampling, Averaging and ...library.metergroup.com/Retired and Discontinued/Slicks and content... · Soil Moisture Statistics: Sampling, Averaging and Interpretation

Points to remember

Averaging is a slippery slope – don’t throw the baby out with the bathwater

Average over randomness – model and measure the rest

Don’t create randomness through sloppy experimental methods

Page 26: Soil Moisture Statistics: Sampling, Averaging and ...library.metergroup.com/Retired and Discontinued/Slicks and content... · Soil Moisture Statistics: Sampling, Averaging and Interpretation

Main Topics

How many samples do I need?

To average or not to average

Spatial dependence and co-dependence

Page 27: Soil Moisture Statistics: Sampling, Averaging and ...library.metergroup.com/Retired and Discontinued/Slicks and content... · Soil Moisture Statistics: Sampling, Averaging and Interpretation

Soccer field data, again: spatial distribution of variance

How do I sample to properly represent the field?

Does my sampling scheme affect the variance (or standard deviation) I get?

Are samples from the same spot more similar than more widely spaced samples?

Page 28: Soil Moisture Statistics: Sampling, Averaging and ...library.metergroup.com/Retired and Discontinued/Slicks and content... · Soil Moisture Statistics: Sampling, Averaging and Interpretation

Soccer field semivariogram

0

0.0021

0.0042

0 2 4 6 8 10 12

Lag (m)

Se

miv

ari

an

ce

(m

3/m

3)

kn

i

kiik xxkn 1

2)()1(2

1

Page 29: Soil Moisture Statistics: Sampling, Averaging and ...library.metergroup.com/Retired and Discontinued/Slicks and content... · Soil Moisture Statistics: Sampling, Averaging and Interpretation

Soccer field semivariogram

0

0.0021

0.0042

0 2 4 6 8 10 12

Lag (m)

Se

miv

ari

an

ce

(m

3/m

3) sill

nugget

Page 30: Soil Moisture Statistics: Sampling, Averaging and ...library.metergroup.com/Retired and Discontinued/Slicks and content... · Soil Moisture Statistics: Sampling, Averaging and Interpretation

Why two probes in the same field might read differently

Electronic or calibration problems

Installation problems

Water content does, in fact, vary in space and time – why?

Page 31: Soil Moisture Statistics: Sampling, Averaging and ...library.metergroup.com/Retired and Discontinued/Slicks and content... · Soil Moisture Statistics: Sampling, Averaging and Interpretation

Field Capacity:The water content of a soil profile 2-3 days after a heavy rain or irrigation

ECH2O (EC-5 & TE-5) in EM 50: F-W Conserv Site

0

4

8

12

16

20

8/1 8/4 8/7 8/10 8/13 8/16 8/19 8/22 8/25 8/28 8/31

August 2006

Vo

lum

etr

ic w

ate

r C

on

ten

t

(%)

0

4

8

12

16

20

Rain

fall

(m

m)

EC-5 15cm EC-5 30cm EC-5 45cm

EC-5 90cm TE-5(WC) 15cm Rain (mm) 0

Page 32: Soil Moisture Statistics: Sampling, Averaging and ...library.metergroup.com/Retired and Discontinued/Slicks and content... · Soil Moisture Statistics: Sampling, Averaging and Interpretation

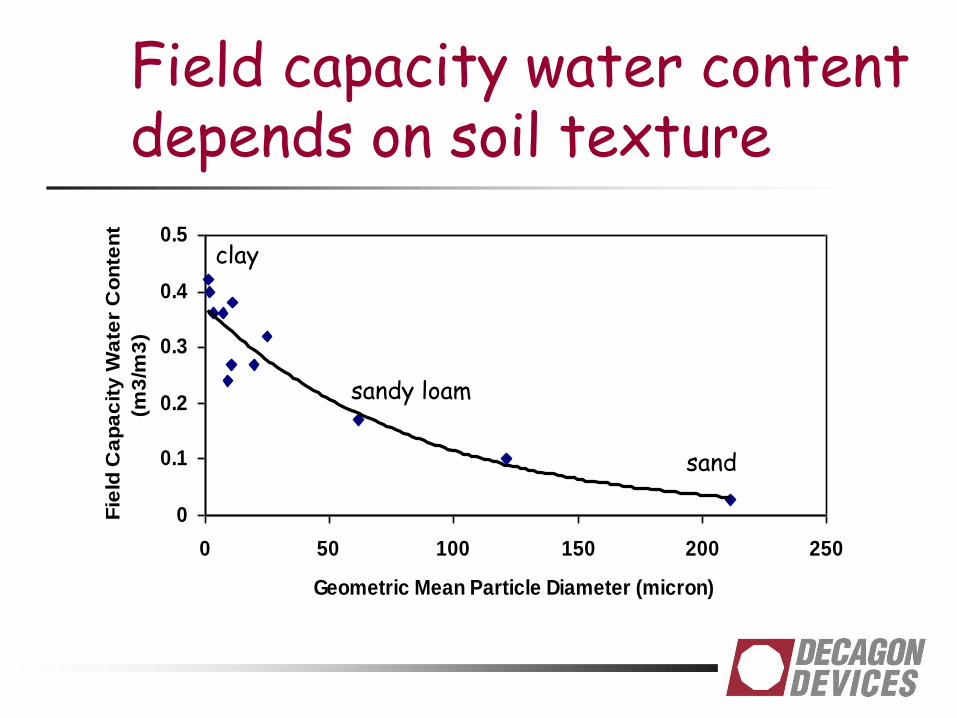
Field capacity water content depends on soil texture

0

0.1

0.2

0.3

0.4

0.5

0 50 100 150 200 250

Geometric Mean Particle Diameter (micron)

Fie

ld C

ap

ac

ity

Wa

ter

Co

nte

nt

(m3

/m3

)

sand

clay

sandy loam

Page 33: Soil Moisture Statistics: Sampling, Averaging and ...library.metergroup.com/Retired and Discontinued/Slicks and content... · Soil Moisture Statistics: Sampling, Averaging and Interpretation

Soil moisture variation can give information about texture

Texture is a source of variation when soil is at field capacity or permanent wilt

Texture is also a source of variation if it reduces permeability

Page 34: Soil Moisture Statistics: Sampling, Averaging and ...library.metergroup.com/Retired and Discontinued/Slicks and content... · Soil Moisture Statistics: Sampling, Averaging and Interpretation

Bulk EC can also be a covariate

0

0.1

0.2

0.3

0 50 100 150 200 250

Geometric Mean Particle Diameter (micron)

Fie

ld C

ap

acit

y B

ulk

EC

(dS

/m)

clay

sand

sandy loam

Page 35: Soil Moisture Statistics: Sampling, Averaging and ...library.metergroup.com/Retired and Discontinued/Slicks and content... · Soil Moisture Statistics: Sampling, Averaging and Interpretation

EC Maps Can Show Texture Distributions

Field capacity water content is determined by texture

Relative bulk electrical conductivity is determined by water content

The ECb map therefore shows water content and texture distributions

Page 36: Soil Moisture Statistics: Sampling, Averaging and ...library.metergroup.com/Retired and Discontinued/Slicks and content... · Soil Moisture Statistics: Sampling, Averaging and Interpretation

Points to remember

Soil moisture variation is typically not random. More closely spaced points have lower variance than more widely spaced ones

If water content is properly measured, variations can give information about soil properties

Page 37: Soil Moisture Statistics: Sampling, Averaging and ...library.metergroup.com/Retired and Discontinued/Slicks and content... · Soil Moisture Statistics: Sampling, Averaging and Interpretation

More points to remember

Texture and field capacity water content are correlated

Texture and bulk EC are correlated

because bulk EC and water content are correlated. Bulk EC maps can be texture maps if they are made when the soil is at field capacity.