SOIL HEALTH TESTING GUIDE SEPTEMBER 2020 Photo by Adrian Infernus

Welcome message from author
This document is posted to help you gain knowledge. Please leave a comment to let me know what you think about it! Share it to your friends and learn new things together.
Transcript

SOIL HEALTH TESTING GUIDE SEPTEMBER 2020
Photo by Adrian Infernus

1
About Delta Institute
Established in 1998, Delta Institute is a Chicago-based nonprofit organization that collaborates with communities to solve complex environmental challenges across the Midwest. Delta Institute’s Land Stewardship initiative seeks to increase the capacity of landowners — whether public or private — to better plan and enact land management practices. Over 100 practitioners, including farmers, land trusts, NGOs, and local/state/federal government agencies have used tools and models that Delta’s Land Stewardship initiative has developed or leveraged to improve environmental outcomes in the Midwest. Visit us online at www.delta-institute.org. This document and the tools provided aim to be action oriented and to provide the most current, correct, and clear information possible, but some information may have changed since publication. We encourage practitioners to reach out to us with questions, corrections, or to discuss implementation challenges. Please contact us at [email protected].
Acknowledgements
This report was produced with generous support from the Walton Family Foundation. We acknowledge the collaboration and contributions from our partners in developing and reviewing this guide: Forest Preserves of Cook County, Forest Preserve District of Kane County, Lake County Forest Preserves, McHenry County Conservation District, and Will County Forest Preserve District. Special thanks to Molly Embree of Agnes Scott College, Jeff Schahczenski of the National Center for Appropriate Technology and ATTRA Sustainable Agriculture Program, Ann Cates of the University of Minnesota, Ann Lewandowski of the University of Minnesota, and Hava Blair of the University of Minnesota for reviewing this guide.

2
Table of Contents
About Delta Institute ............................................................................................................................. 1
Acknowledgements ............................................................................................................................... 1
Table of Contents .................................................................................................................................. 2
Introduction ........................................................................................................................................... 4
Soil Overview ..................................................................................................................................... 4
Preparing for Soil Health Testing .......................................................................................................... 6
Identify Goals and Constraints .......................................................................................................... 6
Common Constraints on Soil Testing ........................................................................................... 7
Site Selection ..................................................................................................................................... 7
Lab Selection ..................................................................................................................................... 7
Timing ................................................................................................................................................ 8
Build Parcel Profiles ........................................................................................................................... 8
Historical Data ............................................................................................................................... 9
Land Use ......................................................................................................................................... 9
Soil Type and Characteristics ...................................................................................................... 10
Sampling Supplies ............................................................................................................................ 10
Sample Collection ................................................................................................................................ 11
Using Soil Health Testing Results ....................................................................................................... 12
Interpret Results .............................................................................................................................. 12
Soil Health Index vs Individual Indicators .................................................................................... 13
Explore Feasible Management Options .......................................................................................... 15
Aggregating Results at the Organizational Level ....................................................................... 18
Implement, Monitor, and Adapt ...................................................................................................... 18
Conclusion ........................................................................................................................................... 18
Appendix A - Soil Health Test Comparisons ....................................................................................... 19
Comprehensive Assessment of Soil Health (CASH) ....................................................................... 19
Output .......................................................................................................................................... 19
Tested Properties ........................................................................................................................ 20
Solvita Test ...................................................................................................................................... 22

3
Output .......................................................................................................................................... 22
Metrics ......................................................................................................................................... 23
Haney Test ....................................................................................................................................... 24
Output .......................................................................................................................................... 24
Metrics ......................................................................................................................................... 24
Test Comparison ............................................................................................................................. 27
Appendix B - Data Collection Template.............................................................................................. 29
Appendix C - Data Tool Instructions ................................................................................................... 30
CropScape ....................................................................................................................................... 30
Web Soil Survey ............................................................................................................................... 31
Appendix D - Alternative Soil Tests .................................................................................................... 35
Infiltration Test ................................................................................................................................ 35
“Soil Your Underwear” Test ............................................................................................................. 37
Works Cited ......................................................................................................................................... 38
4
Introduction
The USDA Natural Resources Conservation Service defines soil health as “the continued capacity of soil to function as a vital living ecosystem that sustains plants, animals, and humans.”1 There is significant interest by practitioners and land stewardship proponents in soil health, and to understand and harness soil's biological properties across the agricultural and conservation sector. Developing and utilizing tools that quantitatively test soil health and linking those tools to production practices presents a remarkable opportunity to restore soil health and inform land management. The soil health testing protocol outlined in this document is developed for institutional landowners, such as public agencies and conservation land trusts, to implement these tools. This protocol aims to provide institutional landowners the resources they need to identify appropriate soil health indicators to measure and track, conduct soil health testing, and understand the results. Ultimately, they can evaluate improvements in soil health due to regenerative agriculture practices implemented on their land. At Delta Institute, we work to expand conservation practices on public and private lands to preserve both natural and working landscapes throughout the Midwest.
Soil Overview
Soil has both inherent and dynamic properties. Inherent soil characteristics like soil texture and depth to bedrock are independent of use and management practices, though they impact the way soil functions. For example, sandy soil drains faster than clay soil due to differing particle size. Deep soil has more space for roots to spread than soils with bedrock near the surface. Dynamic soil attributes are related to how soil changes in response to various management approaches. Specific management choices affect the amount of soil organic matter, soil structure, bulk density, and nutrient holding capacity.2 Together, these properties indicate a soil’s capacity to function. Soil quality refers to a soil’s ability to be used in agricultural production. Soil health takes this a step further, considering soil as a living entity, where maintaining its soil organic matter and microbial activity are essential for long term use and sustaining ecosystems.3 One goal of soil health research is to learn how to manage soil in a way that improves soil function. Soils respond differently to management depending on the inherent properties of the soil and the surrounding landscape.4
1 “Soil Health,” USDA-NRCS Soils, accessed September 23, 2020, www.nrcs.usda.gov/wps/portal/nrcs/main/soils/health/. 2 Ibid. 3 M. Schonbeck et al., “Soil Health and Organic Farming,” Organic Farming Research Foundation, accessed September 23, 2020, ofrf.org/reports. 4 USDA-NRCS Soils, “Soil Health”.

5
Soil health indicators are quantifiable properties of soil or plants that inform how well the soil functions. Indicators can be physical, chemical, and biological properties, processes, or characteristics of soils. They can also be morphological or visual features of plants.5 There are several soil health tests and labs that measure biological, physical, and chemical characteristics. While soil health testing is an emerging and active field of research, advances are being made to better understand and develop these tests to provide accurate, consistent, and replicable results that inform soil management. Soil health tests usually provide information on biological properties, such as:
● Soil organic matter content ● Water extractable organic carbon ● Potentially mineralizable nitrogen ● Root health
In addition, these tests typically provide information on physical properties, such as:
● Aggregate stability ● Available water capacity ● Surface and subsurface hardness ● Soil texture
Soil health tests continue to provide information on chemical properties, such as:
● pH ● Phosphorus ● Potassium ● Minor and micronutrients6
Farmers are familiar with traditionally used soil tests that provide information about chemical indicators, but typically do not test for physical and biological indicators that are essential to soil health.7 For comprehensive soil health management, the scope of practice must be broadened to include managing biological and physical soil process functioning. Issues with chemical soil properties can be managed through application of amendments such as lime or wood ash for low pH; or, fertilizers,
5 “Soil Health Assessment,” USDA-NRCS Soils, accessed September 23, 2020, www.nrcs.usda.gov/wps/portal/nrcs/main/soils/health/assessment/ 6 Center for Regional Food Systems, “Cornell Soil Health Assessment Training Manual,” Michigan State University, accessed September 23, 2020, www.canr.msu.edu/foodsystems/uploads/files/cornell_soilhealth.pdf. 7 Cornell University College of Agriculture and Life Sciences, “Comprehensive Assessment of Soil Health,” Cornell University, accessed September 23, 2020, http://www.css.cornell.edu/extension/soil-health/manual.pdf.
6
manures, and compost to add required nutrients. Some biological and physical issues can be addressed with amendments, but others require management practices like planting cover crops and reducing tillage (8).8 Collecting soil samples for soil health testing, which includes testing for biological, physical, and chemical properties, requires a different kind of preparation and a few extra steps than traditional soil testing. The subsequent sections of this protocol walk through this process. Information on the specific tests that can be utilized for soil health measurements is available in Appendix A.
Preparing for Soil Health Testing
Planning activities prior to conducting soil health testing can streamline the sampling process, align testing goals with organizational goals, and make future testing easier. Though planning activities may vary depending on their needs, organizations should consider the goals and constraints they have, choose testing sites and a testing lab, create a testing timeline, and organize parcel information. The planning process for soil health testing can be an iterative process, as the insights from some steps inform others and may reveal additional considerations for testing. For example, an organization may have a list of testing sites in mind before collecting additional data about each site and learn that several of its parcels have multiple soil textures. As each distinct soil texture on a site should be tested separately, the organization may have to revisit its budget and testing capacity to see if these additional tests are possible and adjust its site list if necessary.
Identify Goals and Constraints
An organization should identify primary goals for soil health testing. Articulating goals early and often can give organizations a clear understanding of why they are performing soil health testing. Examples of goals can be to improve certain soil health indicators, to understand the effects of different practices and pilot projects, or to monitor the work of tenants. During this process, organizations should look to their long-standing goals to see how soil health testing can advance and quantify progress towards them. Alignment with goals can be achieved through its testing practices and how testing results are used. For testing practices, an organization can decide to prioritize certain land parcels for testing or choose a lab that tests indicators an organization is particularly interested in. The results from testing can be used in multiple ways - to summarize current conditions, track short- and long-term changes, inform future decisions, and assess previous management practices. How an organization chooses to use the results and plan for future testing is shaped by their goals.
8 Ibid.
7
Along with identifying goals, an organization should identify, and address challenges associated with comprehensive soil health testing. Budget can play a large role in an organization’s ability to perform testing. Soil tests can range from $60 to $120 per sample and take an hour per sample to collect, which can be used as a starting point to understand how many tests an organization can afford. Organizations should consider the current available budget, future funding opportunities, restrictions on budget or funding cycles, and fundraising during the planning process. Some labs offer bulk discounts and other cost-saving options to consider. It is also important to understand staff
bandwidth and to identify and prepare for sources of uncertainty like weather or late harvesting that may affect an organization’s ability to carry out testing.
Site Selection
Choosing sites for soil health testing depends on several factors. If budget allows, an organization can test all their agricultural lands, as well as natural areas like restored and remnant prairies as a control. If budget is limited, an organization can test a subset of their land, choosing parcels with different uses or selecting areas to focus on. Focus areas might include areas with unique uses, areas where an organization expects to see changes, or areas with ongoing management projects. Organizations can also use multi-year strategies like testing a third of their land each year so that each parcel is tested every three years. Some labs offer different levels of testing, so an organization could do extensive testing every three to five years and opt for a lower, cheaper level of testing in the intermediate years as a cost-saving measure. Many traditional soil tests use grid sampling, where soil plugs are taken a certain distance apart across an entire land parcel and tested individually. Most soil health tests are conducted using a composite sample, where several soil plugs are within different locations in the parcel and mixed to create an overall picture of the land parcel. Due to this, some parcels may require multiple samples if it has multiple soil textures, as soil texture affects the soil’s ability to function and may muddle results (see “Soil Type and Characteristics” on page 9). When selecting locations within a parcel to collect samples, it is also a good practice to sample in a consistent landscape position as different parts of a hillslope may have very different properties.
Lab Selection
Soil health testing labs offer different and specified services. Choosing a lab to work with depends on multiple criteria, including but not limited to cost, parameters tested, timing, and accessibility of
Common Constraints on Soil Testing
Budget Staff bandwidth Uncertainty
8
results. This decision can be informed by setting goals and identifying constraints early in the planning process. Many labs are willing to work with organizations, both prior to testing (by providing sample reports and cost estimates) and afterward (by addressing any questions or concerns and providing data in a usable way). If an organization has an ongoing relationship with a lab, inquire about their soil health testing offerings. As labs use different procedures and test for different metrics, it is important to use the same lab and testing protocols if the organization plans to test over multiple years--hence why it is important to choose a lab that meets both current and future testing needs.9 Information on the specific labs and tests reviewed while writing this protocol is available in Appendix A.
Timing
Soil properties undergo seasonal and other temporal fluctuations, such as precipitation and temperature. Because of this, it is important to consistently test at the same time of year each year - either within the same month or season when conditions are similar. Organizations should plan on waiting six to eight weeks for soil health test results. Testing usually occurs in the spring before tillage and planting or in the fall before tillage.10 Testing in the spring allows organizations to understand the soil they are planting in and to test during a less busy time for land managers. However, the testing window in the spring is very narrow for collecting samples, waiting for results, and sharing with farmers and inclement weather may affect an organization’s ability to collect samples. Fall testing can be used to inform decision making for the upcoming spring growing season, allow for the application of treatments like lime that take several months to affect soil health, and potentially receive discounts on items like fertilizer. Labs are generally less busy in the fall, meaning there may be a quicker turnaround on results.11 Timing may also depend on organizational factors such as budget and staff bandwidth. While writing this protocol, soil health testing was performed in the fall after planned spring testing had to be postponed. Some testing sites were not able to be tested due to late harvesting and soil freezing. Both were lessons in planning for flexibility and uncertainty which should be accounted for as an organization prepares for soil health testing.
Build Parcel Profiles
At the start of the soil testing process, land managers should compile data on the land management units they plan to test. This information can be used to refine further the list of sites
9 Zuber, Stacey and Eileen Kladivko, “How to Understand and Interpret Soil Health Tests,” Purdue Extension, accessed September 23, 2020, https://www.extension.purdue.edu/extmedia/AY/AY-366-W.pdf. 10 Cates, A., “5 Tips for Soil Health Test Sampling,” University of Minnesota Extension, accessed September 23, 2020, blog-crop-news.extension.umn.edu/2019/10/5-tips-for-soil-health-test-sampling.html. 11 Silva, G., “Why Soil Test in the Fall?” Michigan State University, accessed September 23, 2020, www.canr.msu.edu/news/why_soil_test_in_the_fall.
9
to be tested, whether a site will require multiple tests, and later, to interpret the soil health results. Historical and current land use data provide information on how the land has been taxed across different time horizons, affecting its health today. Soil type and soil characteristics capture the inherent soil properties that influence soil health. Management practices, such as the tillage and burn regimes, capture current ways the parcel is taxed and restored, explaining differences in soil health results and may point to opportunities for improving soil health in the future. Qualitative, local knowledge of parcels can also be helpful in informing testing decisions and later understanding test results. It is recommended to compile this information in a spreadsheet format, as it can clearly organize the data and be connected to spatial outputs. An example spreadsheet is available in Appendix B. Land managers may already have much of this information on hand as part of other land management projects. The following sections provide a walkthrough for accessing publicly available data sources to help determine land use patterns and their related impacts over the long-term.
Historical Data
Pre-settlement data captures land use in Illinois during the early 1800s, prior to the influx of settlers and the conversion of natural lands to agriculture or development. This data may explain modern-day challenges to productivity and management as lands are repurposed. Pre-settlement data is available for download as a shapefile of the entire state through the Illinois Geospatial Data Clearinghouse.12 This data can be opened in geospatial software like ArcGIS and QGIS. Historical aerial photographs capture land use in Illinois during the 1930s and 1940s. This data can be used to determine if land was used for agriculture during this time. As the dataset uses photographs, users need to use their best judgement to determine the land use for that period. Historical aerial photographs are available for download as .JPEGs and .TIFs and can be accessed through an online viewer through the Illinois Geospatial Data Clearinghouse.13
Land Use
Land use data can be used to understand how soil has been taxed and restored through what has been grown on it. For example, lands that have experienced intensive agricultural practices over many years may see poorer soil health. Land use data can also be used to understand the effects of certain management practices, like implementing crop rotations. For natural lands,
12 http://clearinghouse.isgs.illinois.edu/data/landcover/illinois-landcover-early-1800s 13 https://clearinghouse.isgs.illinois.edu/data/imagery/1937-1947-illinois-historical-aerial-photography
10
this information can be used to understand the transition of land from agriculture to natural lands and how long it takes to see changes in soil health. Many labs will ask for land use for the previous three to five years. Though many organizations may already have land use data, information on the particular crop or natural vegetation can be accessed using the USDA NASS CropScape Cropland Data Layer.14 Data is available from 1997 onward. It is also recommended to classify parcels into larger cohorts such as row crops, restored prairie, and remnant prairie in line with an organization’s land holdings. Instructions for using CropScape are available in Appendix C.
Soil Type and Characteristics
Soil type and characteristics provide additional context to the parcel and can inform which parcels to test. One of the most important soil characteristics to know for each parcel is soil texture. Soil textures vary and are determined by soil particle size, ranging from fine clays and silts to coarser sand. Soil texture affects other properties of soil like its ability to retain water. A lower score on a parcel may not be indicative of poor management, but a product of this inherent soil characteristic. Because of this, it is recommended to do multiple soil health tests on parcels with different soil textures to capture this variation. Most labs will also ask for this information. Data is available through a web-based tool developed by the United States Department of Agriculture - Natural Resource Conservation Service (USDA-NRCS) called Web Soil Survey.15 Instructions for using Web Soil Survey are available in Appendix C.
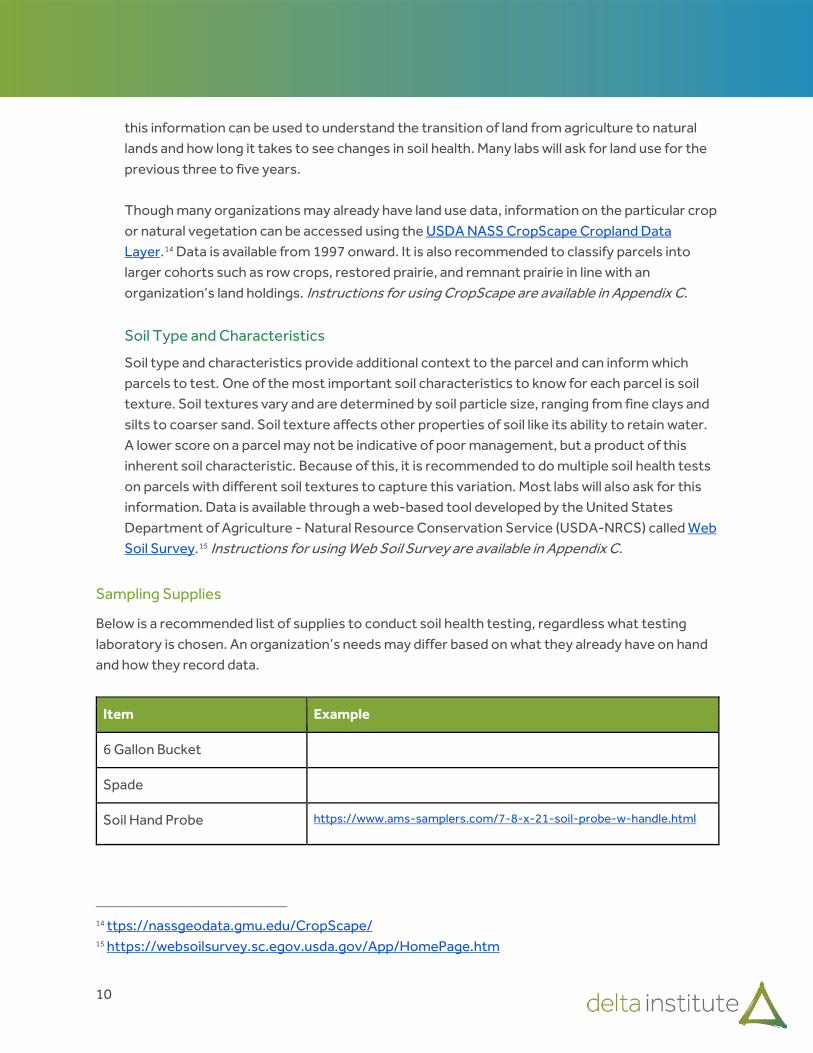
Sampling Supplies
Below is a recommended list of supplies to conduct soil health testing, regardless what testing laboratory is chosen. An organization’s needs may differ based on what they already have on hand and how they record data.
Item Example
6 Gallon Bucket
Spade
Soil Hand Probe https://www.ams-samplers.com/7-8-x-21-soil-probe-w-handle.html
14 ttps://nassgeodata.gmu.edu/CropScape/ 15 https://websoilsurvey.sc.egov.usda.gov/App/HomePage.htm
11
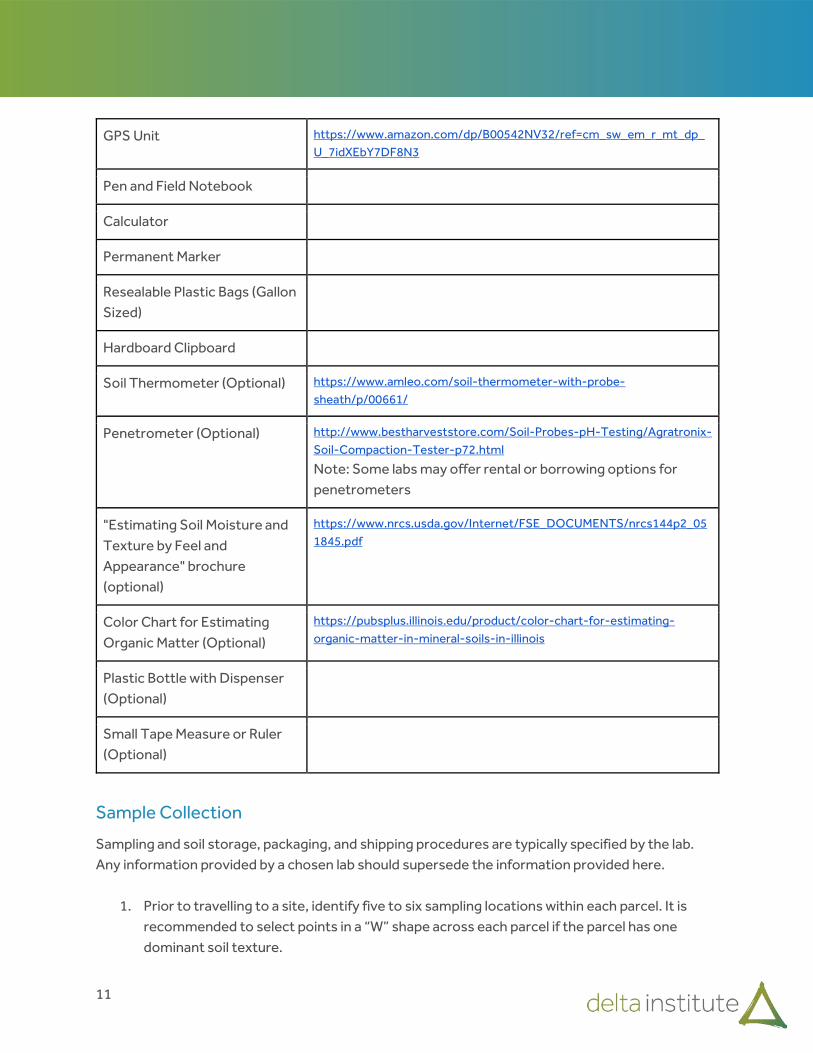
GPS Unit https://www.amazon.com/dp/B00542NV32/ref=cm_sw_em_r_mt_dp_U_7idXEbY7DF8N3
Pen and Field Notebook
Calculator
Permanent Marker
Resealable Plastic Bags (Gallon Sized)
Hardboard Clipboard
Soil Thermometer (Optional) https://www.amleo.com/soil-thermometer-with-probe-sheath/p/00661/
Penetrometer (Optional) http://www.bestharveststore.com/Soil-Probes-pH-Testing/Agratronix-Soil-Compaction-Tester-p72.html
Note: Some labs may offer rental or borrowing options for penetrometers
"Estimating Soil Moisture and Texture by Feel and Appearance" brochure (optional)
https://www.nrcs.usda.gov/Internet/FSE_DOCUMENTS/nrcs144p2_051845.pdf
Color Chart for Estimating Organic Matter (Optional)
https://pubsplus.illinois.edu/product/color-chart-for-estimating-organic-matter-in-mineral-soils-in-illinois
Plastic Bottle with Dispenser (Optional)
Small Tape Measure or Ruler (Optional)
Sample Collection
Sampling and soil storage, packaging, and shipping procedures are typically specified by the lab. Any information provided by a chosen lab should supersede the information provided here.
1. Prior to travelling to a site, identify five to six sampling locations within each parcel. It is recommended to select points in a “W” shape across each parcel if the parcel has one dominant soil texture.

12
2. For parcels with multiple soil textures or different treatments (buffer strip, etc.), collect composite samples from each representative area.
3. At each location, collect five to six cores from the first six inches of soil. Mix cores from all locations to form the parcel composite sample. Make sure there is enough soil to meet the lab’s testing requirements (usually four to six cups). Place soil in a plastic bag with an identifiable and unique label. Take any other data readings such as surface hardness and soil temperature during collection. Repeat this process for all parcels.
a. Mixing samples can be done in the field or after bringing samples back to a “lab” or office environment. Either process can work, if samples are well labeled.
4. Send the samples to the lab as soon as possible, following the packaging and shipping instructions provided by the lab. If unable to ship immediately, soil samples can be stored in a refrigerator for several weeks.16
Using Soil Health Testing Results
Improving soil health does not end when test results are received. An organization should work to understand their results and use them to develop short- and long-term goals for land management. Subsequent testing can be used to evaluate the impacts of any changes in management.
Interpret Results
Soil health results can be used to understand soil health at the parcel and organizational level. For each individual parcel, results can be used to inform specific management decisions, while looking at the results in aggregate can provide organizations with an overall picture of its land holdings.
16 Cornell University College of Agriculture and Life Sciences, “Comprehensive Assessment of Soil Health.”

13
Soil Health Index vs Individual Indicators
At first glance, soil health testing results can be daunting. However, most labs will provide context for each metric they are reporting on. Some labs will provide definitions and ideal ranges, and others will convert the absolute values from results into a score. This information can be used to understand where a parcel is doing well and where there is opportunity for improvement. In addition, most labs will also provide an overall soil health score. The soil health index is useful in seeing the general picture. The index reflects a combination of measurements from individual tests. Each lab has a different formula for the index, so it is important to understand how the soil index is derived to understand what the number represents. Figure 1 shows example soil health index results for samples taken in the fall of 2019 in northeastern Illinois. Samples were taken from index results from 7 cropland parcels, 1 grazing parcel, 1 hay parcel, 14 grassland parcels, and 1 restored prairie. Figure 1 shows the soil health index
results from 3 different labs, all demonstrating the same trend, but varying in magnitude. What is captured by each lab may change based on the criteria and methodology used, leading to some similar trends, though test results from different labs are not comparable to one another. By using the same lab consistently, one can make comparisons and assess trends over time. It is also important to look at the index alongside the individual results to have a more detailed picture of what is going on. Some results may be straightforward and predictable, while others may come as a surprise. Figure 2 shows examples of how specific indicators reflected the current condition of the soil for different field types. Lower respiration and aggregate stability for row crop fields are indicative of little to no soil cover and conventional tillage. For the grazing field, the highest soil protein index
Figure 1. Soil Health Index results from Haney, CASH, and Solvita Tests. Data Source: Delta Institute and McHenry County Conservation District.

14
reflects manure inputs, while lowest organic matter suggests a lack of stable replenishment of biomass. For a parcel with known compaction and rooting issues, an increased subsoil hardness may be expected. For less anticipated results, the parcel data previously collected can help inform a parcel’s results, and it may be helpful to compare parcels to one another, especially if they share some common characteristics. For example, a restored prairie site that has historically less intensive land use may score better than one currently being used for row crops. Two restored prairie sites currently under the same management regimen scoring differently could be explained by how long the parcels have been restored prairies. In this process, non-agricultural sites can be used as a control when comparing to the row crop results.
Figure 2. Respiration, Aggregate Stability, Soil Protein Index, and Organic Matter Results from CASH test. Data Source: Delta Institute and McHenry County Conservation District.
15
Explore Feasible Management Options
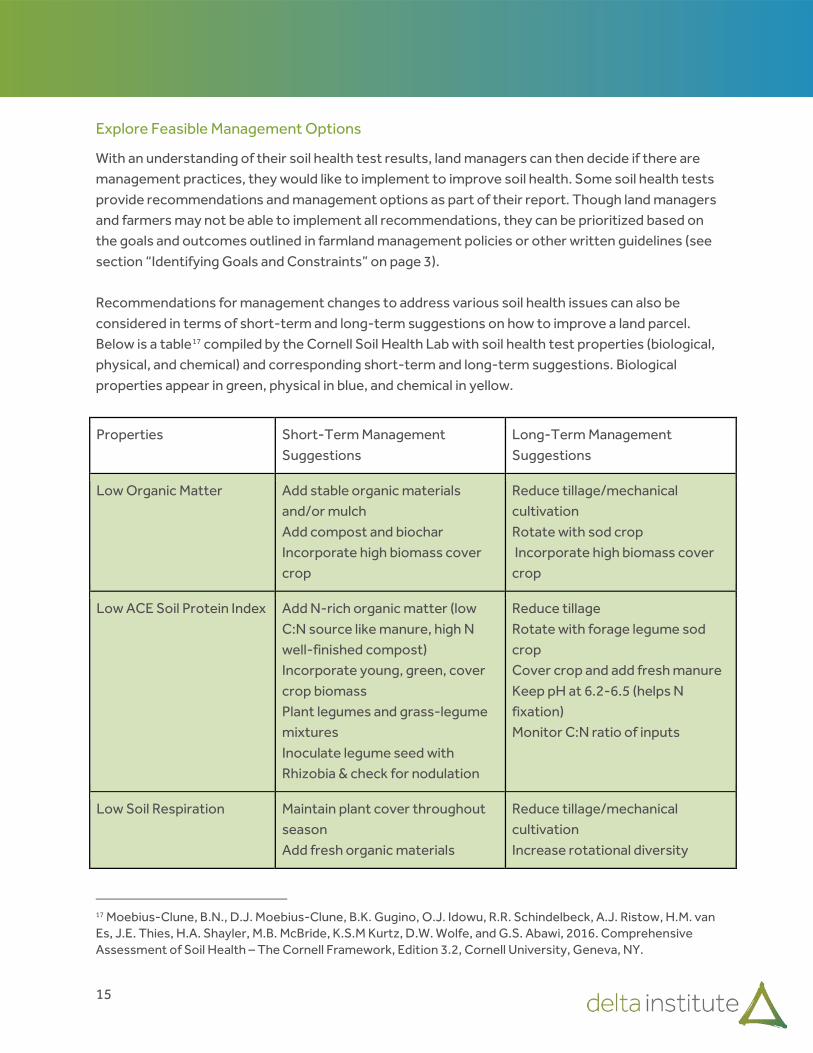
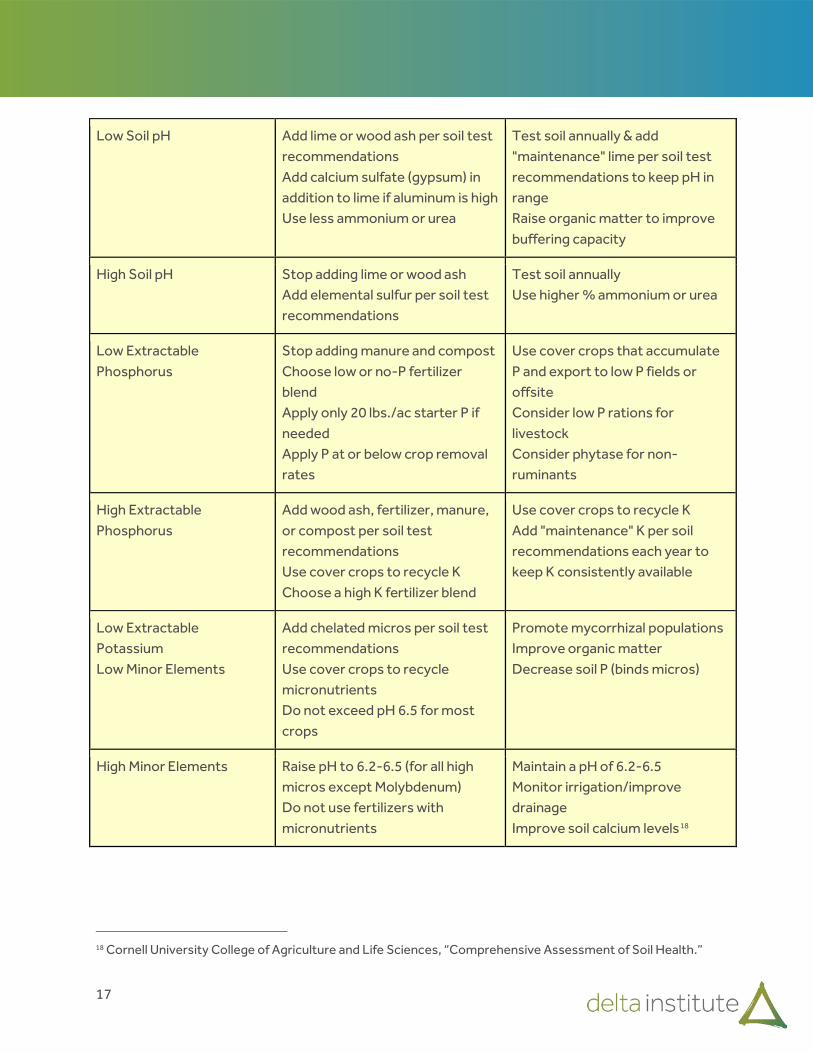
With an understanding of their soil health test results, land managers can then decide if there are management practices, they would like to implement to improve soil health. Some soil health tests provide recommendations and management options as part of their report. Though land managers and farmers may not be able to implement all recommendations, they can be prioritized based on the goals and outcomes outlined in farmland management policies or other written guidelines (see section “Identifying Goals and Constraints” on page 3). Recommendations for management changes to address various soil health issues can also be considered in terms of short-term and long-term suggestions on how to improve a land parcel. Below is a table17 compiled by the Cornell Soil Health Lab with soil health test properties (biological, physical, and chemical) and corresponding short-term and long-term suggestions. Biological properties appear in green, physical in blue, and chemical in yellow.
Properties Short-Term Management Suggestions
Long-Term Management Suggestions
Low Organic Matter Add stable organic materials and/or mulch Add compost and biochar Incorporate high biomass cover crop
Reduce tillage/mechanical cultivation Rotate with sod crop Incorporate high biomass cover crop
Low ACE Soil Protein Index
Add N-rich organic matter (low C:N source like manure, high N well-finished compost) Incorporate young, green, cover crop biomass Plant legumes and grass-legume mixtures Inoculate legume seed with Rhizobia & check for nodulation
Reduce tillage Rotate with forage legume sod crop Cover crop and add fresh manure Keep pH at 6.2-6.5 (helps N fixation) Monitor C:N ratio of inputs
Low Soil Respiration Maintain plant cover throughout season Add fresh organic materials
Reduce tillage/mechanical cultivation Increase rotational diversity
17 Moebius-Clune, B.N., D.J. Moebius-Clune, B.K. Gugino, O.J. Idowu, R.R. Schindelbeck, A.J. Ristow, H.M. van Es, J.E. Thies, H.A. Shayler, M.B. McBride, K.S.M Kurtz, D.W. Wolfe, and G.S. Abawi, 2016. Comprehensive Assessment of Soil Health – The Cornell Framework, Edition 3.2, Cornell University, Geneva, NY.

16
Add manure, green manure Consider reducing biocide usage
Maintain plant cover throughout season Cover crop with symbiotic host plants
Low Active Carbon Add fresh organic materials Use shallow-rooted cover/rotation crops Add manure, green manure, mulch
Reduce tillage/mechanical cultivation Rotate with sod crop Cover crop whenever possible
Low Available Water Capacity
Add stable organic materials, mulch Add compost or biochar
Reduce tillage Rotate with sod crops Incorporate high biomass cover crop
Low Aggregate Stability
Incorporate fresh organic materials Use shallow-rooted cover/rotation crops Add manure, green manure, mulch
Reduce tillage Use a surface mulch Rotate with a sod crop and mycorrhizal hosts
Low Soil Respiration
Maintain plant cover throughout season Add fresh organic materials Consider reducing biocide usage
Reduce tillage/mechanical cultivation Increase rotational diversity Cover crop with symbiotic host plants
High Subsurface Hardness
Perform some mechanical soil loosening (strip till, aerators, broadfork, spader) Use shallow-rooted cover crops Use a living mulch or interseed cover crop
Shallow-rooted cover/rotation crops Avoid traffic on wet soils, monitor Avoid excessive traffic/tillage/loads Use controlled traffic patterns/lanes
High Subsurface Hardness
Use targeted deep tillage (subsoiler, yeoman’s plow, chisel plow, spade) Plant deep rooted cover crops/radish
Avoid plows/disks that create pans Avoid heavy loads Reduce traffic when subsoil is wet
17
Low Soil pH Add lime or wood ash per soil test recommendations Add calcium sulfate (gypsum) in addition to lime if aluminum is high Use less ammonium or urea
Test soil annually & add "maintenance" lime per soil test recommendations to keep pH in range Raise organic matter to improve buffering capacity
High Soil pH Stop adding lime or wood ash Add elemental sulfur per soil test recommendations
Test soil annually Use higher % ammonium or urea
Low Extractable Phosphorus
Stop adding manure and compost Choose low or no-P fertilizer blend Apply only 20 lbs./ac starter P if needed Apply P at or below crop removal rates
Use cover crops that accumulate P and export to low P fields or offsite Consider low P rations for livestock Consider phytase for non-ruminants
High Extractable Phosphorus
Add wood ash, fertilizer, manure, or compost per soil test recommendations Use cover crops to recycle K Choose a high K fertilizer blend
Use cover crops to recycle K Add "maintenance" K per soil recommendations each year to keep K consistently available
Low Extractable Potassium Low Minor Elements
Add chelated micros per soil test recommendations Use cover crops to recycle micronutrients Do not exceed pH 6.5 for most crops
Promote mycorrhizal populations Improve organic matter Decrease soil P (binds micros)
High Minor Elements Raise pH to 6.2-6.5 (for all high micros except Molybdenum) Do not use fertilizers with micronutrients
Maintain a pH of 6.2-6.5 Monitor irrigation/improve drainage Improve soil calcium levels18
18 Cornell University College of Agriculture and Life Sciences, “Comprehensive Assessment of Soil Health.”
18
Aggregating Results at the Organizational Level
Organizations can compile this information in different ways to understand their land holdings at a broader level and track progress. The overall soil health index and individual metrics can be used to show how soil health is changing over time after management changes are implemented. Some individual metrics like soil organic matter change slowly and can take 3-5 years to show improvements. Other metrics like active carbon, short-term carbon mineralization, and ACE protein have potential to provide earlier feedback on soil health.19
Implement, Monitor, and Adapt
Building soil and improving the physical and biological characteristics takes time. If best management practices are implemented that could reduce nutrient runoff, sequester carbon and enhance biological activity in response to soil health testing results, the overall health of the soil should improve. Results will not be instantaneous and may take several years to see changes. Some properties such as soil organic matter respond slowly, taking about three years to see change. Others will respond more quickly, such as biological activity and soil respiration, and would be possible to see change sooner. The initial round of testing conducted creates a baseline of the soil health in land holdings. Once a baseline is achieved and the appropriate practices are established, based on recommendations from respective labs or professional practitioners, soil health tests then can be repeated in the same location to track progress. It is generally recommended that soil health testing is repeated at least every two to three years. Select fields can be tested more frequently for parameters especially if more rapid change is expected.
Conclusion
Soil health testing has increasingly become a means for landowners and farmers to understand what is happening on their land and how their actions affect it. Implementing a soil health testing practice within an organization begins with establishing goals, developing a testing plan, and researching land holdings. Once samples have been collected and results return, landowners are equipped with data explaining broad trends and more granular information on their land. This information can be used to identify key areas to work on and develop management plans going forward. Soil health testing can be a tool to guide implementation and adjust management practices to improve soil health. Moreover, it is a critical element of any comprehensive farm management plan.
19 Stott, D.E., “Recommended Soil Health Indicators and Associated Laboratory Procedures,” Soil Health Technical Note No. 450-03. USDA-NRCS. 2019, accessed September 23, 2020, https://directives.sc.egov.usda.gov/OpenNonWebContent.aspx?content=44475.wba.
19
Appendix A - Soil Health Test Comparisons
This appendix provides information on the specific tests that can be utilized for soil health measurements and a comparison of the three tests. Whichever lab an organization chooses, it is important to work with them consistently, as results from different tests are not comparable. These tests were reviewed over the course of this project, but this is not an exhaustive list of tests or labs. If choosing a different soil health testing package, review the parameters being tested to check that the test is looking at more than just chemical properties.
Comprehensive Assessment of Soil Health (CASH)
The Comprehensive Assessment of Soil Health (CASH) test is a soil health test designed and conducted by the Cornell University Soil Lab. This test evaluates twelve metrics that capture biological, physical, and chemical indicators. Metrics were chosen due to their sensitivity to changes in soil management practices and ability to represent agronomically and environmentally import soil processes, among other factors. The CASH test offers Basic and Standard packages for testing, with add-on tests available. More information is available via Cornell’s College of Agricultural and Life Sciences’ website.20
Output
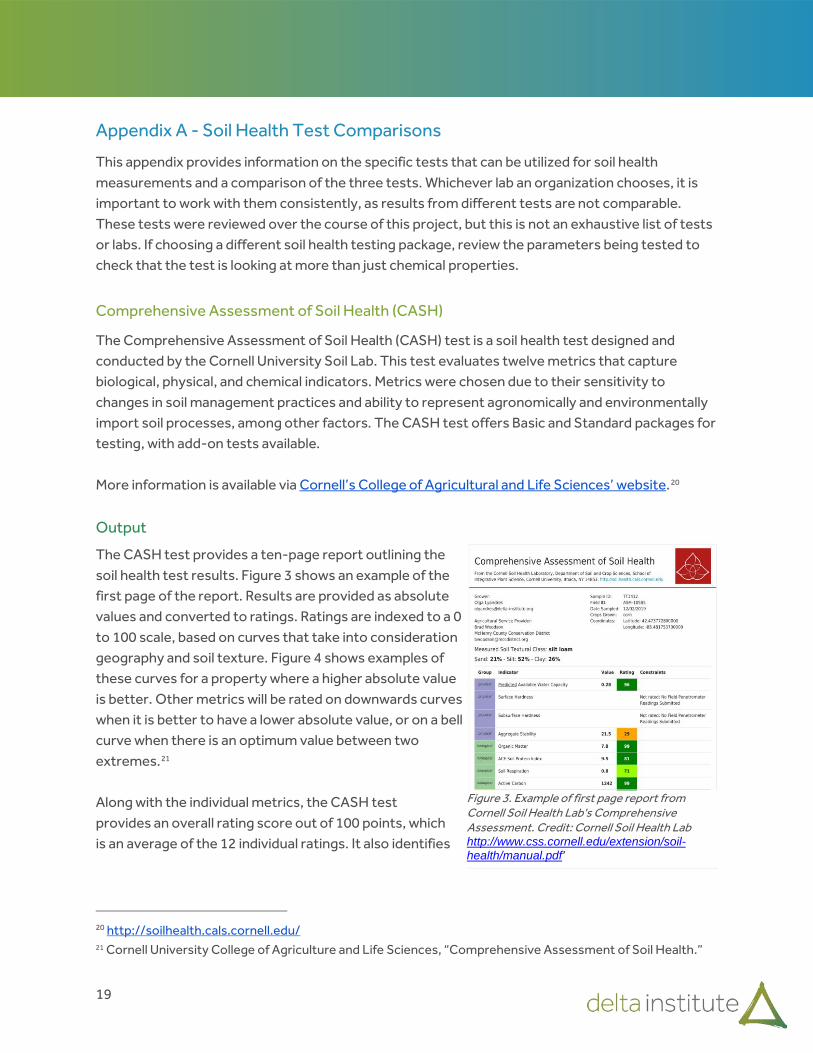
The CASH test provides a ten-page report outlining the soil health test results. Figure 3 shows an example of the first page of the report. Results are provided as absolute values and converted to ratings. Ratings are indexed to a 0 to 100 scale, based on curves that take into consideration geography and soil texture. Figure 4 shows examples of these curves for a property where a higher absolute value is better. Other metrics will be rated on downwards curves when it is better to have a lower absolute value, or on a bell curve when there is an optimum value between two extremes.21 Along with the individual metrics, the CASH test provides an overall rating score out of 100 points, which is an average of the 12 individual ratings. It also identifies
20 http://soilhealth.cals.cornell.edu/ 21 Cornell University College of Agriculture and Life Sciences, “Comprehensive Assessment of Soil Health.”
Figure 3. Example of first page report from Cornell Soil Health Lab's Comprehensive Assessment. Credit: Cornell Soil Health Lab http://www.css.cornell.edu/extension/soil-health/manual.pdf’

20
soil constraints, properties that are limiting the soil health of a parcel that was tested and provides recommendations to address these constraints.22
Tested Properties
Below are the properties that CASH reports. Bolded metrics are available in both the Basic and Standard packages, and unbolded metrics are only available in the Standard package. Biological properties appear in green, physical in blue, and chemical in yellow.
Properties Definition Soil Processes
Organic Matter
Measure of the carbonaceous material in the soil that is biomass or biomass‐derived
Indicates soil aggregate stabilization, water retention, nutrient cycling, and ion exchange capacity; Indicates need for inputs and resiliency to drought and extreme rainfall
Soil Proteins Fraction of the soil organic matter that are present as proteins or protein‐like substances
Indicates the ability of the soil to make N available by mineralization, and has been associated with soil aggregation and water movement
Soil Respiration
Measure of the metabolic activity of the soil microbial community
Indicates the biological status of the soil community, integrating abundance and activity of microbial life
Active Carbon
Measure of the small portion of the organic matter that can serve as an easily available food source for soil microbes
Indicates the ability to support a healthy and diverse microbial community, which is essential to maintain disease resistance, nutrient cycling, and aggregation
Texture Measure of how acidic the soil is, which controls how available nutrients are to crops
Not a true soil health indicator, but helpful in interpreting other metrics
22 Ibid.
Figure 4. Example of soil health index scores and increasing indicator values. Credit: Cornell Soil Health Lab http://www.css.cornell.edu/extension/soil-health/manual.pdf

21
Available Water Capacity
Measure of the porosity of the soil, within a pore size range important for water retention
The amount of plant‐available water the soil can store, and therefore how crops will fare in drought conditions.
Surface Hardness
Measure of compaction that develops when large pores are lost in the surface soil
Indicates ability of roots and fungal hyphae to grow through soil and may be severely restricted by excessively hard soil; Indicates water movement water movement through soil.
Subsurface Hardness
Measure of compaction that develops when large pores are lost in the subsurface
Subsurface hardness prevents deep rooting and thus deep water and nutrient uptake by plants and can increase disease pressure by stressing plants. It also causes poor drainage and poor deep-water storage
Aggregate Stability
Measure of how well soil aggregates or crumbs hold together under rainfall
Good aggregate stability helps prevent crusting, runoff, and erosion, and facilitates aeration, infiltration, and water storage, along with improving seed germination and root and microbial health.
Soil pH Measure of how acidic the soil is Indicates controls how available nutrients are to crops
Extractable Phosphorus
Measure of phosphorus (P) availability to a crop
Low P values indicate poor P availability to plants, and excessively high P values indicates a risk of adverse environmental impact through runoff and contamination of surface waters.
Extractable Potassium
Measure of potassium (K) availability to the crop
Indicates tolerance to extreme conditions, with good potassium levels extending season
Minor and Micro- Nutrients
Measure of essential plant nutrients taken up by plants in smaller quantities
Deficient nutrients will decrease yield and crop quality, while excess may cause toxicities23
23 Ibid.
22
Solvita Test
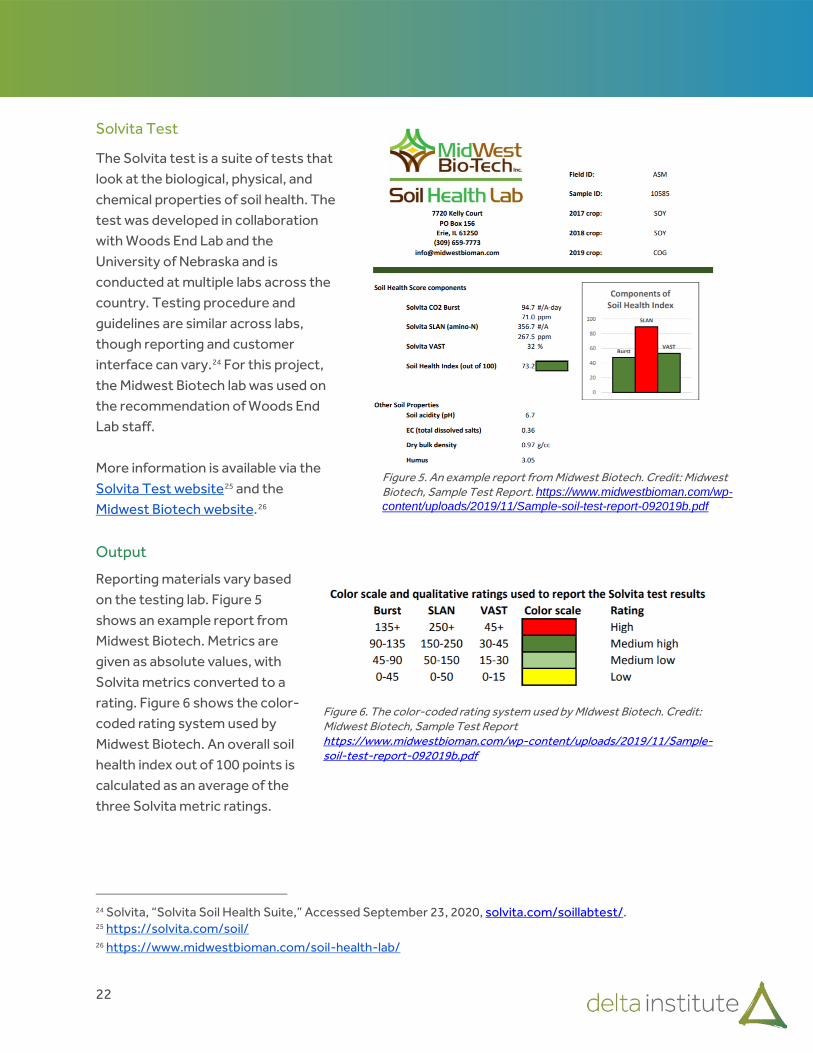
The Solvita test is a suite of tests that look at the biological, physical, and chemical properties of soil health. The test was developed in collaboration with Woods End Lab and the University of Nebraska and is conducted at multiple labs across the country. Testing procedure and guidelines are similar across labs, though reporting and customer interface can vary.24 For this project, the Midwest Biotech lab was used on the recommendation of Woods End Lab staff. More information is available via the Solvita Test website25 and the Midwest Biotech website.26
Output
Reporting materials vary based on the testing lab. Figure 5 shows an example report from Midwest Biotech. Metrics are given as absolute values, with Solvita metrics converted to a rating. Figure 6 shows the color-coded rating system used by Midwest Biotech. An overall soil health index out of 100 points is calculated as an average of the three Solvita metric ratings.
24 Solvita, “Solvita Soil Health Suite,” Accessed September 23, 2020, solvita.com/soillabtest/. 25 https://solvita.com/soil/ 26 https://www.midwestbioman.com/soil-health-lab/
Figure 5. An example report from Midwest Biotech. Credit: Midwest Biotech, Sample Test Report. https://www.midwestbioman.com/wp-content/uploads/2019/11/Sample-soil-test-report-092019b.pdf
Figure 6. The color-coded rating system used by MIdwest Biotech. Credit: Midwest Biotech, Sample Test Report https://www.midwestbioman.com/wp-content/uploads/2019/11/Sample-soil-test-report-092019b.pdf
23
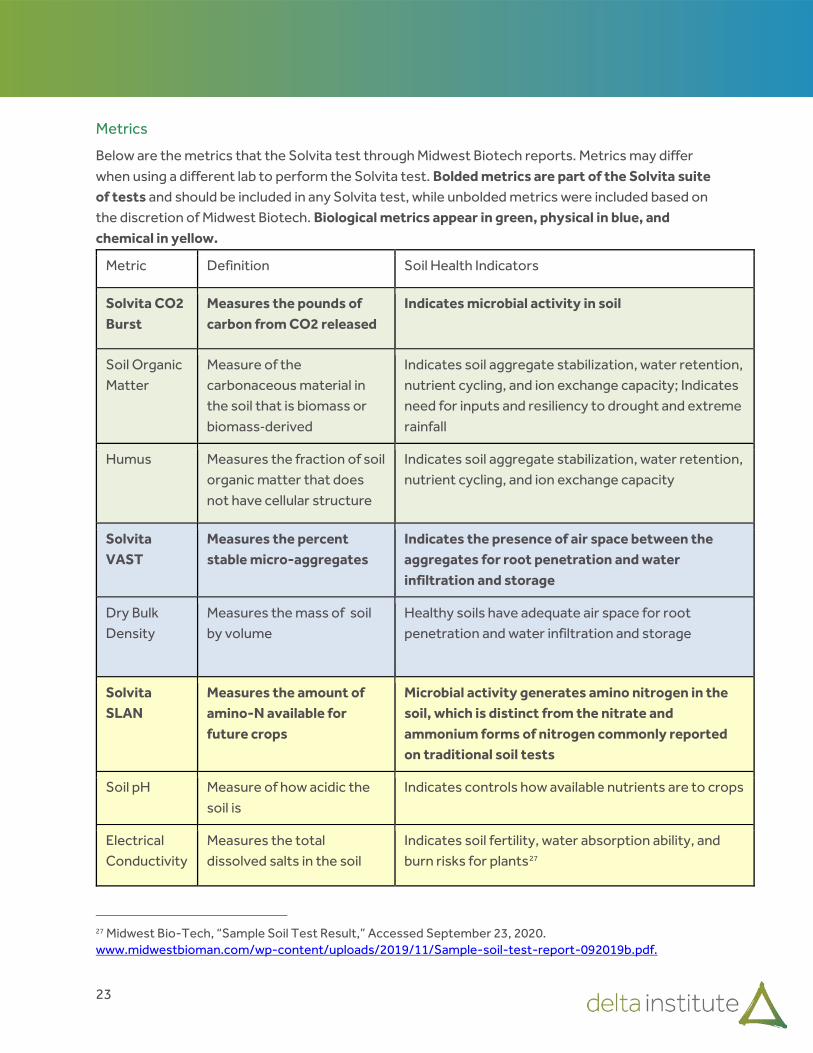
Metrics
Below are the metrics that the Solvita test through Midwest Biotech reports. Metrics may differ when using a different lab to perform the Solvita test. Bolded metrics are part of the Solvita suite of tests and should be included in any Solvita test, while unbolded metrics were included based on the discretion of Midwest Biotech. Biological metrics appear in green, physical in blue, and chemical in yellow.
Metric Definition Soil Health Indicators
Solvita CO2 Burst
Measures the pounds of carbon from CO2 released
Indicates microbial activity in soil
Soil Organic Matter
Measure of the carbonaceous material in the soil that is biomass or biomass‐derived
Indicates soil aggregate stabilization, water retention, nutrient cycling, and ion exchange capacity; Indicates need for inputs and resiliency to drought and extreme rainfall
Humus Measures the fraction of soil organic matter that does not have cellular structure
Indicates soil aggregate stabilization, water retention, nutrient cycling, and ion exchange capacity
Solvita VAST
Measures the percent stable micro-aggregates
Indicates the presence of air space between the aggregates for root penetration and water infiltration and storage
Dry Bulk Density
Measures the mass of soil by volume
Healthy soils have adequate air space for root penetration and water infiltration and storage
Solvita SLAN
Measures the amount of amino-N available for future crops
Microbial activity generates amino nitrogen in the soil, which is distinct from the nitrate and ammonium forms of nitrogen commonly reported on traditional soil tests
Soil pH Measure of how acidic the soil is
Indicates controls how available nutrients are to crops
Electrical Conductivity
Measures the total dissolved salts in the soil
Indicates soil fertility, water absorption ability, and burn risks for plants27
27 Midwest Bio-Tech, “Sample Soil Test Result,” Accessed September 23, 2020. www.midwestbioman.com/wp-content/uploads/2019/11/Sample-soil-test-report-092019b.pdf.
24
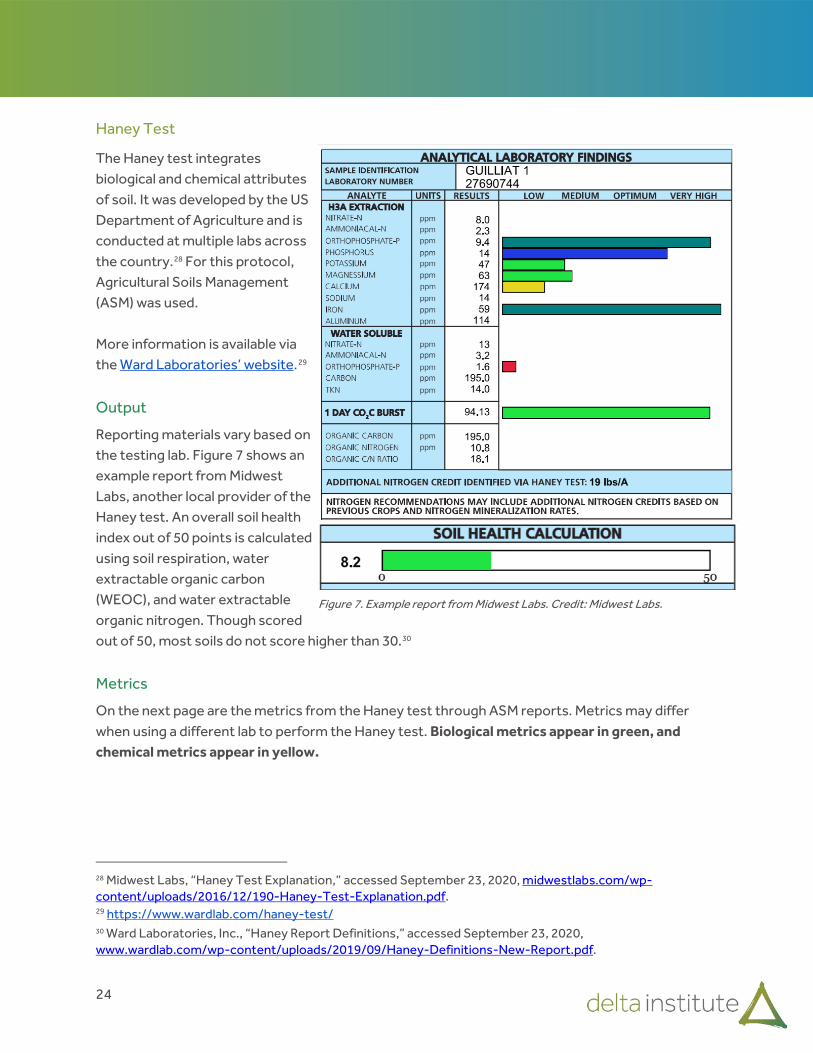
Haney Test
The Haney test integrates biological and chemical attributes of soil. It was developed by the US Department of Agriculture and is conducted at multiple labs across the country.28 For this protocol, Agricultural Soils Management (ASM) was used. More information is available via the Ward Laboratories’ website.29
Output
Reporting materials vary based on the testing lab. Figure 7 shows an example report from Midwest Labs, another local provider of the Haney test. An overall soil health index out of 50 points is calculated using soil respiration, water extractable organic carbon (WEOC), and water extractable organic nitrogen. Though scored out of 50, most soils do not score higher than 30.30
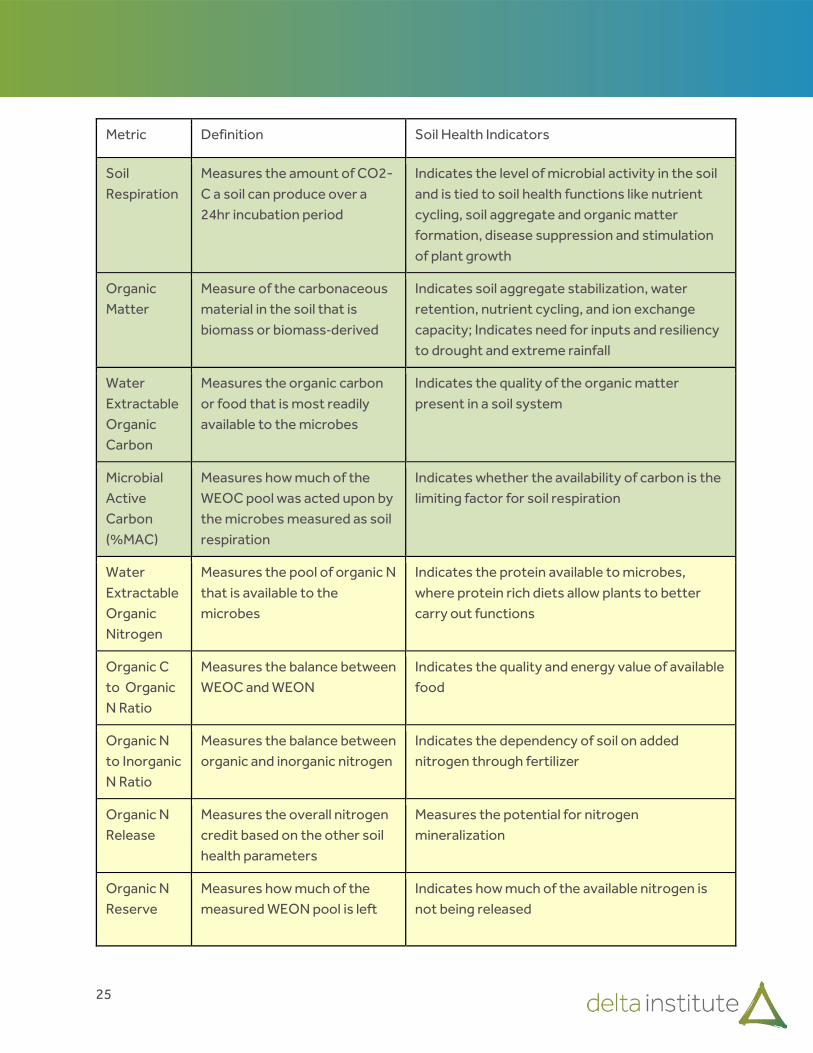
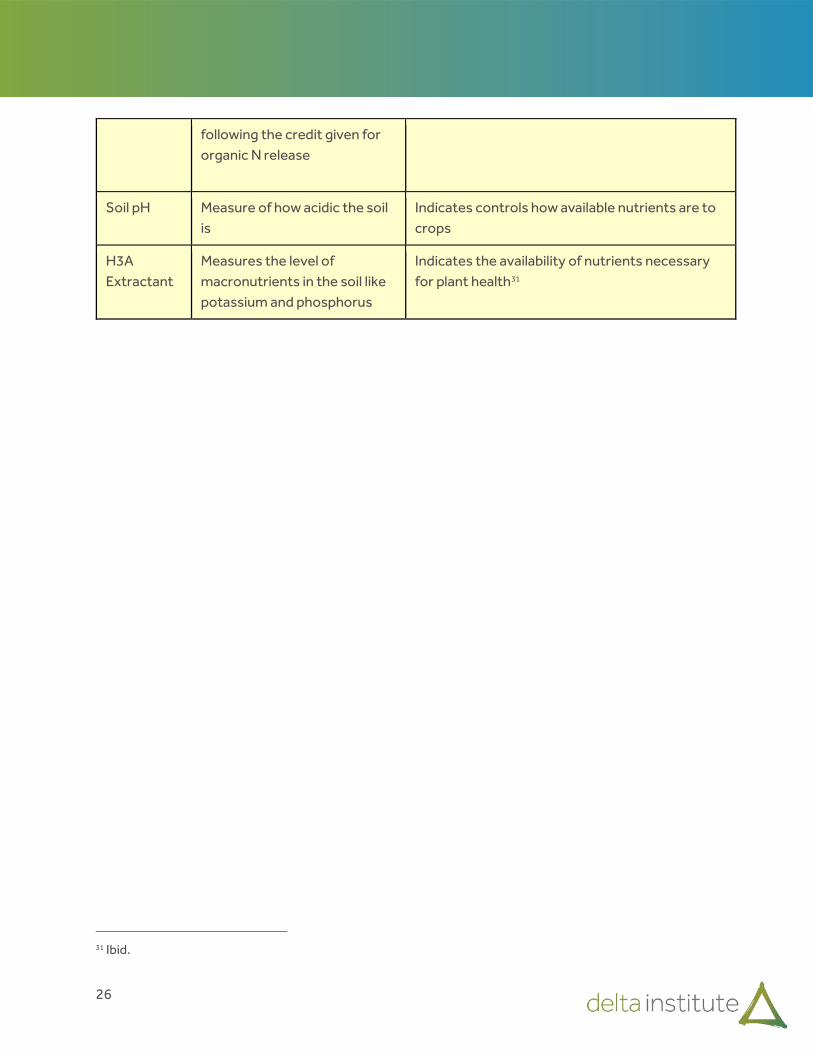
Metrics
On the next page are the metrics from the Haney test through ASM reports. Metrics may differ when using a different lab to perform the Haney test. Biological metrics appear in green, and chemical metrics appear in yellow.
28 Midwest Labs, “Haney Test Explanation,” accessed September 23, 2020, midwestlabs.com/wp-content/uploads/2016/12/190-Haney-Test-Explanation.pdf. 29 https://www.wardlab.com/haney-test/ 30 Ward Laboratories, Inc., “Haney Report Definitions,” accessed September 23, 2020, www.wardlab.com/wp-content/uploads/2019/09/Haney-Definitions-New-Report.pdf.
Figure 7. Example report from Midwest Labs. Credit: Midwest Labs.
25
Metric Definition Soil Health Indicators
Soil Respiration
Measures the amount of CO2-C a soil can produce over a 24hr incubation period
Indicates the level of microbial activity in the soil and is tied to soil health functions like nutrient cycling, soil aggregate and organic matter formation, disease suppression and stimulation of plant growth
Organic Matter
Measure of the carbonaceous material in the soil that is biomass or biomass‐derived
Indicates soil aggregate stabilization, water retention, nutrient cycling, and ion exchange capacity; Indicates need for inputs and resiliency to drought and extreme rainfall
Water Extractable Organic Carbon
Measures the organic carbon or food that is most readily available to the microbes
Indicates the quality of the organic matter present in a soil system
Microbial Active Carbon (%MAC)
Measures how much of the WEOC pool was acted upon by the microbes measured as soil respiration
Indicates whether the availability of carbon is the limiting factor for soil respiration
Water Extractable Organic Nitrogen
Measures the pool of organic N that is available to the microbes
Indicates the protein available to microbes, where protein rich diets allow plants to better carry out functions
Organic C to Organic N Ratio
Measures the balance between WEOC and WEON
Indicates the quality and energy value of available food
Organic N to Inorganic N Ratio
Measures the balance between organic and inorganic nitrogen
Indicates the dependency of soil on added nitrogen through fertilizer
Organic N Release
Measures the overall nitrogen credit based on the other soil health parameters
Measures the potential for nitrogen mineralization
Organic N Reserve
Measures how much of the measured WEON pool is left
Indicates how much of the available nitrogen is not being released
26
following the credit given for organic N release
Soil pH Measure of how acidic the soil is
Indicates controls how available nutrients are to crops
H3A Extractant
Measures the level of macronutrients in the soil like potassium and phosphorus
Indicates the availability of nutrients necessary for plant health31
31 Ibid.
27
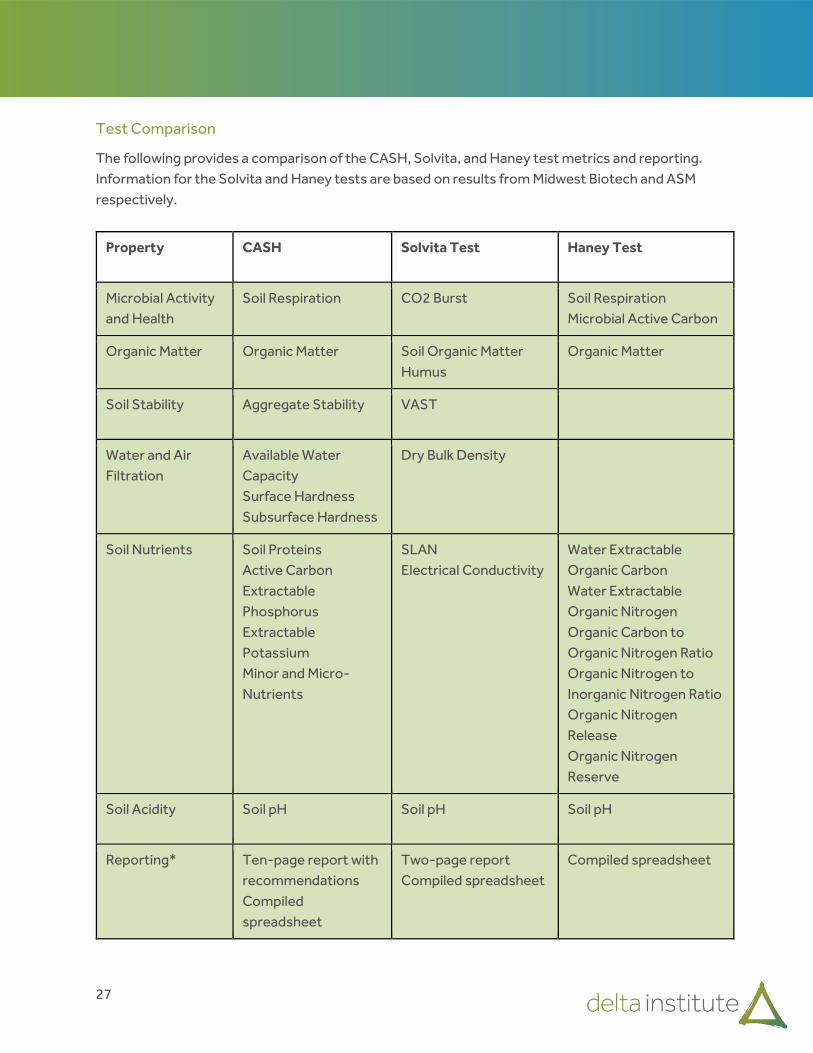
Test Comparison
The following provides a comparison of the CASH, Solvita, and Haney test metrics and reporting. Information for the Solvita and Haney tests are based on results from Midwest Biotech and ASM respectively.
Property CASH Solvita Test Haney Test
Microbial Activity and Health
Soil Respiration CO2 Burst Soil Respiration Microbial Active Carbon
Organic Matter Organic Matter Soil Organic Matter Humus
Organic Matter
Soil Stability Aggregate Stability VAST
Water and Air Filtration
Available Water Capacity Surface Hardness Subsurface Hardness
Dry Bulk Density
Soil Nutrients Soil Proteins Active Carbon Extractable Phosphorus Extractable Potassium Minor and Micro- Nutrients
SLAN Electrical Conductivity
Water Extractable Organic Carbon Water Extractable Organic Nitrogen Organic Carbon to Organic Nitrogen Ratio Organic Nitrogen to Inorganic Nitrogen Ratio Organic Nitrogen Release Organic Nitrogen Reserve
Soil Acidity Soil pH Soil pH Soil pH
Reporting* Ten-page report with recommendations Compiled spreadsheet
Two-page report Compiled spreadsheet
Compiled spreadsheet
28
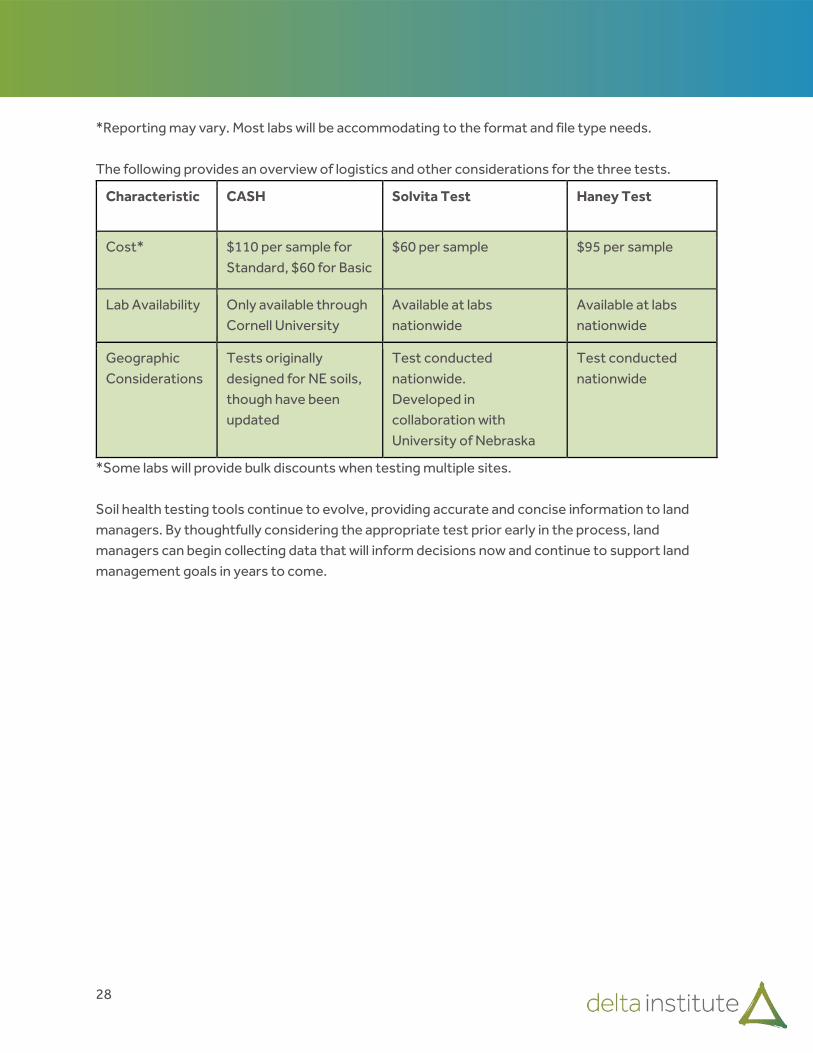
*Reporting may vary. Most labs will be accommodating to the format and file type needs. The following provides an overview of logistics and other considerations for the three tests.
Characteristic CASH Solvita Test Haney Test
Cost* $110 per sample for Standard, $60 for Basic
$60 per sample $95 per sample
Lab Availability Only available through Cornell University
Available at labs nationwide
Available at labs nationwide
Geographic Considerations
Tests originally designed for NE soils, though have been updated
Test conducted nationwide. Developed in collaboration with University of Nebraska
Test conducted nationwide
*Some labs will provide bulk discounts when testing multiple sites. Soil health testing tools continue to evolve, providing accurate and concise information to land managers. By thoughtfully considering the appropriate test prior early in the process, land managers can begin collecting data that will inform decisions now and continue to support land management goals in years to come.
29
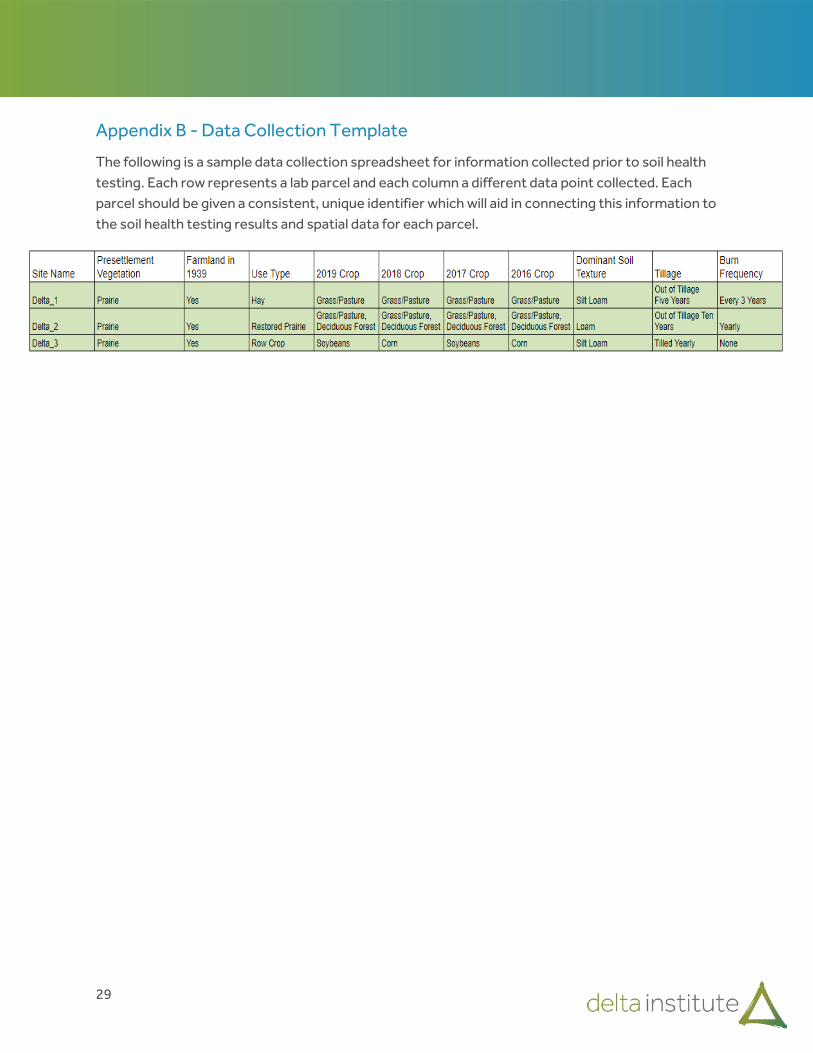
Appendix B - Data Collection Template
The following is a sample data collection spreadsheet for information collected prior to soil health testing. Each row represents a lab parcel and each column a different data point collected. Each parcel should be given a consistent, unique identifier which will aid in connecting this information to the soil health testing results and spatial data for each parcel.
30
Appendix C - Data Tool Instructions
The following are instructions for two tools, USDA CropScape and Web Soil Survey, that provide information on land use and soil type respectively.
CropScape
This is a guide to the USDA CropScape Crop Data Layer. It provides information on land use for the United States, with information available from 1997 onward. To get land use data for an individual parcel using the online tool:
1. Navigate to USDA CropScape.32 2. Define an area of interest by importing a shapefile or by drawing a polygon
a. To define an area of interest by importing a shapefile, select “Import Area of Interest” from the toolbar. Use “Browse” to find and select the file and click “Upload.” Files can be in a zipped shapefile or GML format. Note: the file can only contain 1 parcel.
b. To define an area of interest by drawing a polygon, navigate to the parcel site on the map using the zoom in, zoom out, and pan features on the toolbar at the top of the map. Once there, use the “Define Area of Interest” tool to draw the parcel on the map.
3. To change the year of data on the map, select the desired year using the left-hand menu. 4. Select “Area of Interest Statistic” to get a pixel and acreage breakdown of crops in the
parcel. Information can be exported as a .csv or .tif file and visualized as a bar graph or pie chart.
5. Information can also be downloaded by selecting “Download Defined Area of Interest Data” from the toolbar. In the menu that appears, select the desired years and then click “Submit”. In the next menu, select “Download” to download the data as a .tif file or “Export to KML” to download the data as a .kml file. The data is now ready to be used in geospatial software like ArcGIS and QGIS.
To download land use for a state or county:
1. Navigate to USDA CropScape.33 2. Select “Define Area of Interest by Region/State/ASD/County.” Use the menu to select an
area of interest. 3. Select “Download Defined Area of Interest Data” from the toolbar. In the menu that
appears, select the desired years and then click “Submit”. In the next menu, select
32 https://nassgeodata.gmu.edu/CropScape/ 33 https://nassgeodata.gmu.edu/CropScape/
31
“Download” to download the data as a .tif file or “Export to KML” to download the data as a .kml file. The data is now ready to be used in geospatial software like ArcGIS and QGIS.
Web Soil Survey
This is a guide to using the Web Soil Survey created and maintained by USDA-NRCS to identify different types of soil texture on a field. This tool will also aid in choosing appropriate areas to take soil samples.
1. Navigate to the Web Soil Survey home page.34 2. Click the large round green button in the top right-hand corner labeled “START WSS.” 3. Define an area of interest manually or by uploading a shapefile of the land parcels.
a. To manually select an area of interest, navigate to the parcel location on the map using the zoom in, zoom out, and pan buttons or by entering in the parcel information under “Quick Navigation” on the left-hand part of the screen. Use the “Define AOI by Rectangle” or “Define AOI by Polygon” to select the parcel. Note: This method will only allow one area of interest at a time. The area of interest selected may not exceed 100,000 acres.
b. To upload a shapefile, select “Import AOI” under “Area of Interest: on the left-hand part of the screen. Upload the appropriate vector data for the parcels, either as a separate .shp, .shx, .prj, and .dbf files or as a zipped shapefile containing those 4 files. Select “Set AOI.” Note: Only one shapefile can be uploaded at a time, but the shapefile can contain up to 100 separate polygons. The area of interest may not exceed 100,000 acres. Figure 8 shows the expected output.
34 https://websoilsurvey.sc.egov.usda.gov/

32
Figure 8. Example of output from Web Soil Survey. Credit: Soil Survey Staff, Natural Resources Conservation Service, United States Department of Agriculture. Web Soil Survey. Available online at the following link: http://websoilsurvey.sc.egov.usda.gov/.
4. Click on the second tab on the ribbon near the top of the page “Soil Map” shown in Figure 9. Figure 10 shows the expected output.
Figure 9. Web Soil Survey navigation. Soil Survey Staff, Natural Resources Conservation Service, United States Department of Agriculture. Web Soil Survey. Available online at the following link: http://websoilsurvey.sc.egov.usda.gov/.
Figure 10. Expected output from Web Soil Survey. Credit: Soil Survey Staff, Natural Resources Conservation Service, United States Department of Agriculture. Web Soil Survey. Available online at the following link: http://websoilsurvey.sc.egov.usda.gov/.
33
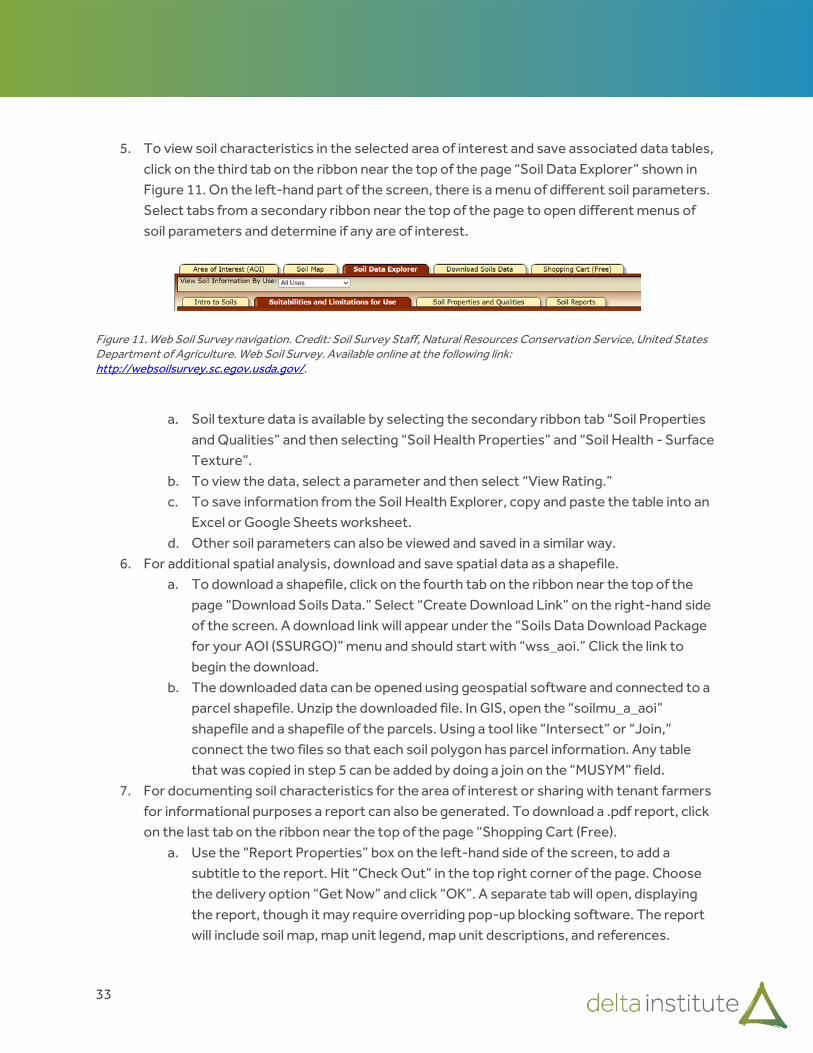
5. To view soil characteristics in the selected area of interest and save associated data tables,
click on the third tab on the ribbon near the top of the page “Soil Data Explorer” shown in Figure 11. On the left-hand part of the screen, there is a menu of different soil parameters. Select tabs from a secondary ribbon near the top of the page to open different menus of soil parameters and determine if any are of interest.
Figure 11. Web Soil Survey navigation. Credit: Soil Survey Staff, Natural Resources Conservation Service, United States Department of Agriculture. Web Soil Survey. Available online at the following link: http://websoilsurvey.sc.egov.usda.gov/.
a. Soil texture data is available by selecting the secondary ribbon tab “Soil Properties
and Qualities” and then selecting “Soil Health Properties” and “Soil Health - Surface Texture”.
b. To view the data, select a parameter and then select “View Rating.” c. To save information from the Soil Health Explorer, copy and paste the table into an
Excel or Google Sheets worksheet. d. Other soil parameters can also be viewed and saved in a similar way.
6. For additional spatial analysis, download and save spatial data as a shapefile. a. To download a shapefile, click on the fourth tab on the ribbon near the top of the
page “Download Soils Data.” Select “Create Download Link” on the right-hand side of the screen. A download link will appear under the “Soils Data Download Package for your AOI (SSURGO)” menu and should start with “wss_aoi.” Click the link to begin the download.
b. The downloaded data can be opened using geospatial software and connected to a parcel shapefile. Unzip the downloaded file. In GIS, open the “soilmu_a_aoi” shapefile and a shapefile of the parcels. Using a tool like “Intersect” or “Join,” connect the two files so that each soil polygon has parcel information. Any table that was copied in step 5 can be added by doing a join on the “MUSYM” field.
7. For documenting soil characteristics for the area of interest or sharing with tenant farmers for informational purposes a report can also be generated. To download a .pdf report, click on the last tab on the ribbon near the top of the page “Shopping Cart (Free).
a. Use the “Report Properties” box on the left-hand side of the screen, to add a subtitle to the report. Hit “Check Out” in the top right corner of the page. Choose the delivery option “Get Now” and click “OK”. A separate tab will open, displaying the report, though it may require overriding pop-up blocking software. The report will include soil map, map unit legend, map unit descriptions, and references.

34
Data can also be downloaded at the state and county level, which can be overlaid with parcel information. This process will provide the soil parcels, but not information on soil texture and other soil health properties. This can be a useful tool when adding new parcels.
1. To download state and county level data, start the Web Soil Survey, but do not define an area of interest. Select “Download Soil Data” from the ribbon at the top shown in Figure 12.
Figure 12. Web Soil Survey navigation. Credit: Soil Survey Staff, Natural Resources Conservation Service, United States Department of Agriculture. Web Soil Survey. Available online at the following link: http://websoilsurvey.sc.egov.usda.gov/.
2. Open the menu for the “Soil Survey Area (SSURGO)” using the down arrow on the right-
hand side. Enter the state and/or county level information to filter the list of available files. Click the download link to begin the file download.
3. Unzip the file and open the file starting with “soilmu_a.” Overlay this data with parcel information.

35
Appendix D - Alternative Soil Tests
There are several tests that can be performed without working with a lab. These include the infiltration test, which reflects soil health properties related to organic matter, aggregation, and compaction, and the ‘soil your underwear’ test in which a pair of cotton underwear is buried for six weeks and record the beginning and ending weight to see how much the soil biology consumed.
Infiltration Test
This test is adapted from the USDA Natural Resources Conservation Service Soil Quality Test Kit. It measures the infiltration rate, or how fast water enters the soil. Water entering too slowly may lead to ponding on level fields or to erosion from surface runoff on sloping fields. Materials needed to measure infiltration:
● 6 in. Diameter Ring ● Plastic Wrap ● 500 mL Plastic Bottle or Graduated Cylinder Distilled Water ● Stopwatch or Timer
Considerations: If the soil is saturated, infiltration will not occur. Wait for one or two days to allow for some drying. Make sure the sampling area is free of residue and weeds or that vegetation is trimmed to the soil surface before inserting the ring.
1. Drive Ring into Soil - Clear the sampling area of surface residue, etc. . If the site is covered with vegetation, trim it as close to the soil surface as possible. Using the hand sledge and block of wood, drive the 6-inch diameter ring, beveled edge down, to a depth of three inches (line marked on outside of ring). If the soil contains rock fragments, and the ring cannot be inserted to depth, gently push the ring into the soil until it hits a rock fragment. Measure the height from the soil surface to the top of the ring in centimeters (cm).
2. Firm Soil - With the 6-inch diameter ring in place, use a
finger to gently firm the soil surface only around the inside edges of the ring to prevent extra seepage. Minimize disturbance to the rest of the soil surface inside the ring.
Figure 13. Driving ring into soil. Credit: USDA, Soil Health Testing Kit Guide, August 1999, https://efotg.sc.egov.usda.gov/references/public/WI/Soil_Quality_Test_Kit_Guide.pdf

36
3. Line Ring with Plastic Wrap - Line the soil surface inside the ring with a sheet of plastic wrap to completely cover the soil and ring. This procedure prevents disturbance to the soil surface when adding water.
4. Add Water - Fill the plastic bottle or graduated
cylinder to the 444 mL mark with distilled water (approx. 15.6oz). Pour the water (1" of water) into the ring lined with plastic wrap
5. Remove Wrap and Record Time - Remove the
plastic wrap by gently pulling it out, leaving the water in the ring (Figure 15). Note the time. Record the amount of time (in minutes) it takes for the 1" of water to infiltrate the soil. Stop timing when the surface is just glistening. If the soil surface is uneven inside the ring, count the time until half of the surface is exposed and just glistening (Figure 4). Enter the amount of time in minutes on the Soil Data worksheet.
6. Repeat Infiltration Test - In the same ring, perform
Steps 2, 3, & 4 with a second inch of water. On the Soil Data worksheet, enter the number of minutes elapsed for the second infiltration measurement. If soil moisture is at or near field capacity, the second test is not necessary. The moisture content of the soil will affect the rate of infiltration; therefore, two infiltration tests are usually performed (if soil is dry). The first inch of water wets the soil, and the second inch gives a better estimate of the infiltration rate of the soil.35
35 USDA, “Soil Quality Test Kit Guide,” Accessed September 23, 2020, efotg.sc.egov.usda.gov/references/public/WI/Soil_Quality_Test_Kit_Guide.pdf.
Figure 14. Adding water. Credit: USDA, Soil Health Testing Kit Guide, August 1999, https://efotg.sc.egov.usda.gov/references/public/WI/Soil_Quality_Test_Kit_Guide.pdf
Figure 155. Removing plastic wrap. Credit: USDA, Soil Health Testing Kit Guide, August 1999, https://efotg.sc.egov.usda.gov/references/pu
Figure 166. Water draining into soil. Credit: USDA, Soil Health Testing Kit Guide, August 1999, https://efotg.sc.egov.usda.gov/references/public/WI/Soil_Quality_Test_Kit_Guide.pdf

37
“Soil Your Underwear” Test
This test was adapted from USDA Natural Resource Conservation Service Oregon. This do-it-yourself test is used to gauge the level of microbial activity present in soil by burying a pair of cotton underwear for six weeks and comparing the changes in the underwear, such as appearance and weight, before and after burying it. The greater the change, the more microbial activity is present, indicating healthier soil. Materials:
● New, 100% Cotton Briefs (No Dyes, Boxers, or Polyester Blends) ● Shovel ● Flags ● Scale
Weigh the underwear and record it. Dig a small trench and bury the underwear in the top six inches of the soil. Leave the waistband showing a little and mark the place with a flag. Leave the underwear buried for six weeks. Dig it up carefully and wash it in a bucket of water to remove the soil. Once the underwear is completely dry, weigh it again to find the difference in weight due to decomposition. If a scale is not available, visually assess the changes in the underwear. Underwear from different plots can be compared to one another to understand the effects of management practices and field histories on microbial activity. To make a good comparison:
● Test similar soil types under different rotations and field histories. ● Keep track of each pair by writing an identifying number on the waistband. ● Be sure to bury all underwear being compared on the same day, and for the same amount of
time. ● Use a scale able to detect the small changes in the underwear’s weight before and after
burial. ● Make sure the underwear is dried out completely after being buried.36
More information is available via YouTube.
36 USDA-NRCS Oregon, “Soil Your Undies,” Accessed September 23, 2020, www.nrcs.usda.gov/wps/portal/nrcs/detail/or/soils/health/?cid=nrcseprd1470410
38
Works Cited
Cates, A. “5 Tips for Soil Health Test Sampling.” University of Minnesota Extension. Accessed September 23, 2020. blog-crop-news.extension.umn.edu/2019/10/5-tips-for-soil-health-test-sampling.html. Center for Regional Food Systems. “Cornell Soil Health Assessment Training Manual.” Michigan State University. Accessed September 23, 2020. www.canr.msu.edu/foodsystems/uploads/files/cornell_soilhealth.pdf. Cornell University College of Agriculture and Life Sciences. “Comprehensive Assessment of Soil Health.” Cornell University. Accessed September 23, 2020. www.css.cornell.edu/extension/soil-health/manual.pdf. Midwest Bio-Tech. “Sample Soil Test Result.” Accessed September 23, 2020. www.midwestbioman.com/wp-content/uploads/2019/11/Sample-soil-test-report-092019b.pdf. Midwest Labs. “Haney Test Explanation.” Accessed September 23, 2020. midwestlabs.com/wp-content/uploads/2016/12/190-Haney-Test-Explanation.pdf. Schonbeck, M. et al. “Soil Health and Organic Farming.” Organic Farming Research Foundation. Accessed September 23, 2020. ofrf.org/reports. Silva, G. “Why Soil Test in the Fall?” Michigan State University. Accessed September 23, 2020. www.canr.msu.edu/news/why_soil_test_in_the_fall. Solvita. “Solvita Soil Health Suite.” Accessed September 23, 2020. solvita.com/soillabtest/. Stott, D.E. “Recommended Soil Health Indicators and Associated Laboratory Procedures.” Soil Health Technical Note No. 450-03. USDA-NRCS. 2019. Accessed September 23, 2020. https://directives.sc.egov.usda.gov/OpenNonWebContent.aspx?content=44475.wba USDA. “Soil Quality Test Kit Guide.” Accessed September 23, 2020. efotg.sc.egov.usda.gov/references/public/WI/Soil_Quality_Test_Kit_Guide.pdf. USDA-NRCS. “Soil Health Assessment.” Accessed September 23, 2020. www.nrcs.usda.gov/wps/portal/nrcs/main/soils/health/assessment/. USDA-NRCS Oregon. “Soil Your Undies.” Accessed September 23, 2020. www.nrcs.usda.gov/wps/portal/nrcs/detail/or/soils/health/?cid=nrcseprd1470410

39
USDA-NRCS Soils. “Soil Health.” Accessed September 23, 2020. www.nrcs.usda.gov/wps/portal/nrcs/main/soils/health/ Ward Laboratories, Inc. “Haney Report Definitions.” Accessed September 23, 2020. www.wardlab.com/wp-content/uploads/2019/09/Haney-Definitions-New-Report.pdf. Zuber, Stacey and Eileen Kladivko. “How to Understand and Interpret Soil Health Tests.” Purdue Extension. Accessed September 23, 2020. https://www.extension.purdue.edu/extmedia/AY/AY-366-W.pdf
Related Documents


