AERC Report No. 162 SOIL HEALTH CARD PROGRAMME IN GUJARAT: Implementation, Impacts and Impediments Mrutyunjay Swain S. S. Kalamkar Submitted to Centre for International Project Trust, New Delhi Agro-Economic Research Centre For the states of Gujarat and Rajasthan (Ministry of Agriculture and Farmers Welfare, Govt. of India) Sardar Patel University, Vallabh Vidyanagar, Dist. Anand, Gujarat January 2016 © Centre for International Project Trust, New Delhi & Agro-Economic Research Centre, Vallabh Vidyanagar 388120, Anand, Gujarat, India.

Welcome message from author
This document is posted to help you gain knowledge. Please leave a comment to let me know what you think about it! Share it to your friends and learn new things together.
Transcript
AERC Report No. 162
SOIL HEALTH CARD PROGRAMME IN GUJARAT: Implementation, Impacts and Impediments
Mrutyunjay Swain
S. S. Kalamkar
Submitted to
Centre for International Project Trust, New Delhi
Agro-Economic Research Centre For the states of Gujarat and Rajasthan
(Ministry of Agriculture and Farmers Welfare, Govt. of India)
Sardar Patel University, Vallabh Vidyanagar, Dist. Anand, Gujarat
January 2016 © Centre for International Project Trust, New Delhi & Agro-Economic Research Centre, Vallabh Vidyanagar 388120, Anand, Gujarat, India.
ii
AERC Report No. 162 Prepared by
Dr. Mrutyunjay Swain, Sr. Research Officer/Assistant Professor (SS) Dr. S.S. Kalamkar, Director and Professor
Research Team Shri T. B. Parihar, Research Associate Shri Manish Makwana, Research Associate Shri M. R. Ojha, Research Associate Ms. Kalpana Kapadia, Research Associate Shri N. G. Chauhan, Research Fellow Ms. Rinku Rathod, Research Fellow Ms. Priyanka Patel, Research Assistant All Five Field Supervisors/Agriculture Supervisor, CCS Fieldsmen/Agriculture Assistants, CCS Published by The Director Agro-Economic Research Centre (For the states of Gujarat and Rajasthan) (Ministry of Agriculture and Farmers Welfare, Govt. of India) H.M. Patel Institute of Rural Development, Opp. Nandalaya Temple Post Box No. 24, Sardar Patel University Vallabh Vidyanagar 388120, Dist. Anand, Gujarat Ph. No. +91-2692-230106, 230799; Mobile- 09822437451; 7383554616 Fax- +91-2692-233106 Email: [email protected]; [email protected]
Draft Submitted in January 2016 Report to be Published in 2016 Printed at: Lajja Publication, 2nd Floor, Super Market, Rajendra Marg, Vallabh Vidyanagar, Anand (02692-233864).
iii
Foreword
The phenomenal growth in agricultural production in India since the Green Revolution period in the late 1960s has been triggered by higher input use, particularly purchased inputs as well as technology induced productivity enhancement, massive extension efforts, improved farm practices and above all, ingenuity and hard work of Indian farmers. Among the inputs, significant increase in use of fertiliser has helped to enhance crop output and farmers’ income. The average consumption of fertilisers has increased from 6.9 kg per ha (of gross cropped area) in 1966-67 to 139.7 kg per ha in 2011-12. However, indiscriminate use of chemical fertilisers by farmers has led to deterioration of soil structure, wastage of nutrients, destruction of soil microorganisms and scorching of plants at the extreme cases. Therefore, various initiatives have been taken at national as well as regional level to encourage the farmers for balanced use of fertilisers. Gujarat has been a leading state in taking up such initiatives, among which Soil Health Card (SHC) Programme was a major one. The Soil Health Card Programme in Gujarat is a unique on line Programme making transfer of technology more scientific, precise, easy, and need based between Scientist-Extension Officer- Farmers and input output dealers effectively. With this background, the present study on ‘Soil Health Card Programme in Gujarat: Implementation, Impact and Impediments’ sponsored by Centre for International Projects Trust (CIPT), New Delhi was undertaken at our Centre to evaluate the implementation of programme after 10 years of its operation in Gujarat.
The study is based on both primary and secondary level data. The
study results show that SHC scheme has benefited the farmers in many ways, however, there are some gray areas where more attention is required to be given. Importantly, training should be provided to the farmers in the State on scientific method of collection of soil sample as well as reading and application of recommendations given on SHC. On the basis of the findings, relevant policy suggestions have been made.
I am thankful to authors and their research team for putting in a lot
of efforts to complete this excellent piece of work. I also thank CIPT, New Delhi for the unstinted cooperation and support. I hope this report will be useful for those who are interested in soil health, balanced use of fertiliser and performance of SHC programme in Gujarat. Agro-Economic Research Centre For the states of Gujarat and Rajasthan (Ministry of Agriculture and Farmers Welfare, Govt. of India) Sardar Patel University, Vallabh Vidyanagar 388120, Dist. Anand, Gujarat, India
(Dr. S.S. Kalamkar) Director

iv
v
Acknowledgements
The study on “Soil Health Card Programme: Implementation, Impact and Impediments” has been carried out at the Agro-Economic Research Centre, Sardar Patel University, Vallabh Vidyanagar, as suggested and sponsored by the CIPT, New Delhi.
We have benefited immensely from various scholars and officials from different government departments while carrying out this study. At the outset, we would like to thank Dr. Harish Padh, Vice Chancellor of our University and Chairman, AERC Governing Body as well as Dr. Mahesh Pathak, Honorary Advisor of our Centre for their constant encouragement and support for undertaking such research activity at the Centre. We are grateful to Dr. Kamal Vatta, Director, CIPT, New Delhi, Mr. Sandip Dixit, Programme Manager, CIPT, and Mr. Nikunj Parekh, Project Coordinator, CIPT, New Delhi for providing required support and guidance for smooth conduct of the study.
We are grateful to Dr S. R. Chaudhary, Director of Agriculture, Department of Agriculture and Cooperation, Government of Gujarat, Gandhinagar; Shri N.M. Shukla, present Deputy Director Agriculture (Fertiliser), Department of Agriculture; Shri Anil Patel, former Deputy Director Agriculture (Fertiliser), Department of Agriculture, GoG, Gandhinagar for providing the necessary data and support in data collection. We also thank Dr. K.B. Katheria, Director of Research and Director – IT, Anand Agricultural University, Anand for providing required information.
We thank our colleagues in the Centre for their support and encouragements while carrying out the study. We are thankful to all our Research Associates, Research Fellows, all five Field Supervisors/Agriculture Supervisors and all Fieldsmen/Agriculture Assistants of CCS for collecting soil samples, SHCs and data from field and other sources. Special thanks to Ms. Kalpana Kapadia, Shri N. G. Chauhan, and Miss Priyanka Patel for their assistance in data compilation, analysis and tabulation and Mr. Deep K. Patel, Research and Reference Assistant (Library) for his assistance in publication of the report.
We would like to record our sincere thanks to all the officials of AERC and CIPT for their invaluable help. The study would not have reached to this stage without the active co-operation of the sample households, who provided all the required data for the study without any hesitation and expectation. We thank each one of them for their invaluable support. Agro-Economic Research Centre For the states of Gujarat and Rajasthan (Ministry of Agriculture, Govt. of India) Sardar Patel University, Vallabh Vidyanagar 388120, Anand, Gujarat.
Mrutyunjay Swain S.S. Kalamkar

vi
vii
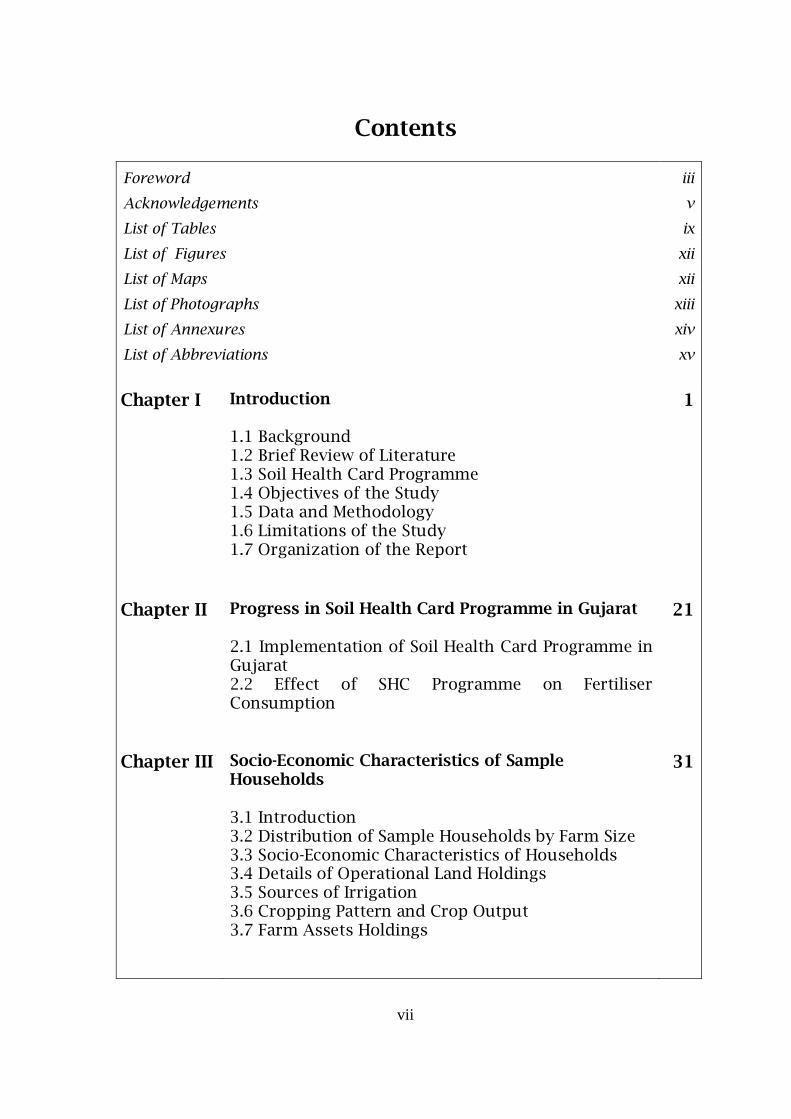
Contents
Foreword iii
Acknowledgements v
List of Tables ix
List of Figures xii
List of Maps xii
List of Photographs xiii
List of Annexures xiv
List of Abbreviations xv
Chapter I Introduction 1.1 Background 1.2 Brief Review of Literature 1.3 Soil Health Card Programme 1.4 Objectives of the Study 1.5 Data and Methodology 1.6 Limitations of the Study 1.7 Organization of the Report
1
Chapter II Progress in Soil Health Card Programme in Gujarat 2.1 Implementation of Soil Health Card Programme in Gujarat 2.2 Effect of SHC Programme on Fertiliser Consumption
21
Chapter III Socio-Economic Characteristics of Sample Households 3.1 Introduction 3.2 Distribution of Sample Households by Farm Size 3.3 Socio-Economic Characteristics of Households 3.4 Details of Operational Land Holdings 3.5 Sources of Irrigation 3.6 Cropping Pattern and Crop Output 3.7 Farm Assets Holdings
31
viii
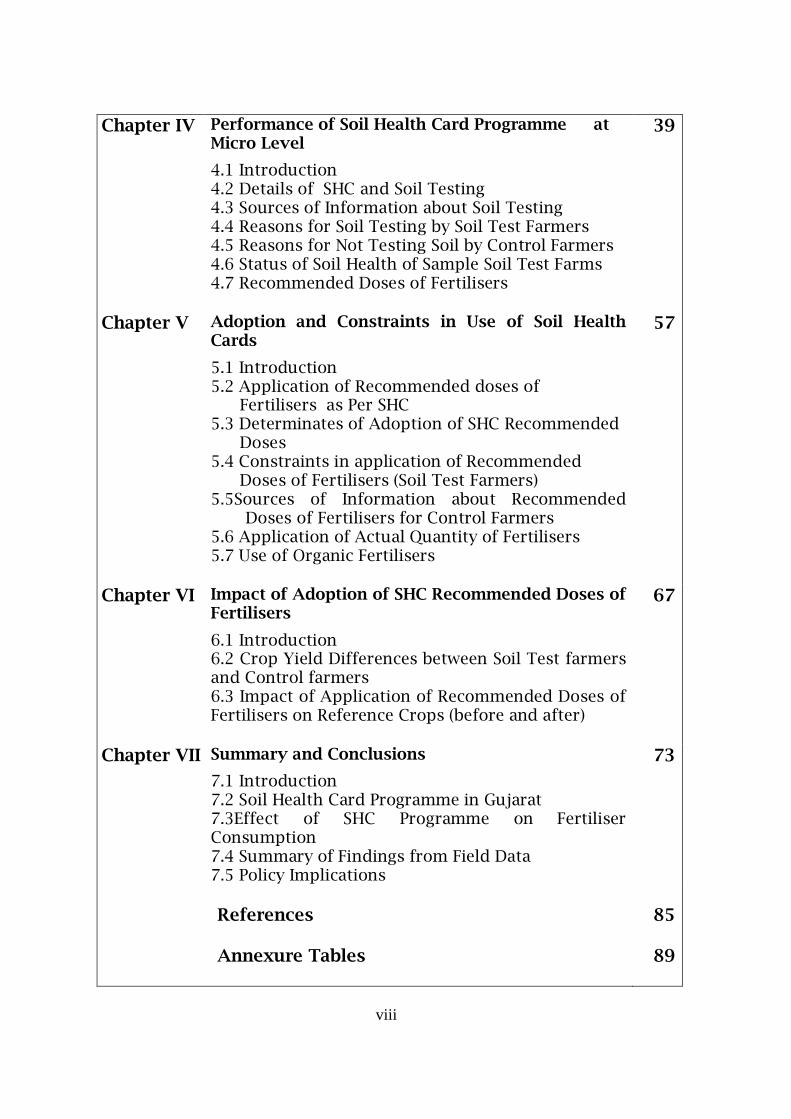
Chapter IV Performance of Soil Health Card Programme at Micro Level
4.1 Introduction 4.2 Details of SHC and Soil Testing 4.3 Sources of Information about Soil Testing 4.4 Reasons for Soil Testing by Soil Test Farmers 4.5 Reasons for Not Testing Soil by Control Farmers 4.6 Status of Soil Health of Sample Soil Test Farms 4.7 Recommended Doses of Fertilisers
39
Chapter V Adoption and Constraints in Use of Soil Health Cards
5.1 Introduction 5.2 Application of Recommended doses of Fertilisers as Per SHC 5.3 Determinates of Adoption of SHC Recommended Doses 5.4 Constraints in application of Recommended Doses of Fertilisers (Soil Test Farmers) 5.5Sources of Information about Recommended
Doses of Fertilisers for Control Farmers 5.6 Application of Actual Quantity of Fertilisers 5.7 Use of Organic Fertilisers
57
Chapter VI Impact of Adoption of SHC Recommended Doses of Fertilisers
6.1 Introduction 6.2 Crop Yield Differences between Soil Test farmers and Control farmers 6.3 Impact of Application of Recommended Doses of Fertilisers on Reference Crops (before and after)
67
Chapter VII Summary and Conclusions
7.1 Introduction 7.2 Soil Health Card Programme in Gujarat 7.3Effect of SHC Programme on Fertiliser Consumption 7.4 Summary of Findings from Field Data 7.5 Policy Implications
73
References
85
Annexure Tables 89
ix
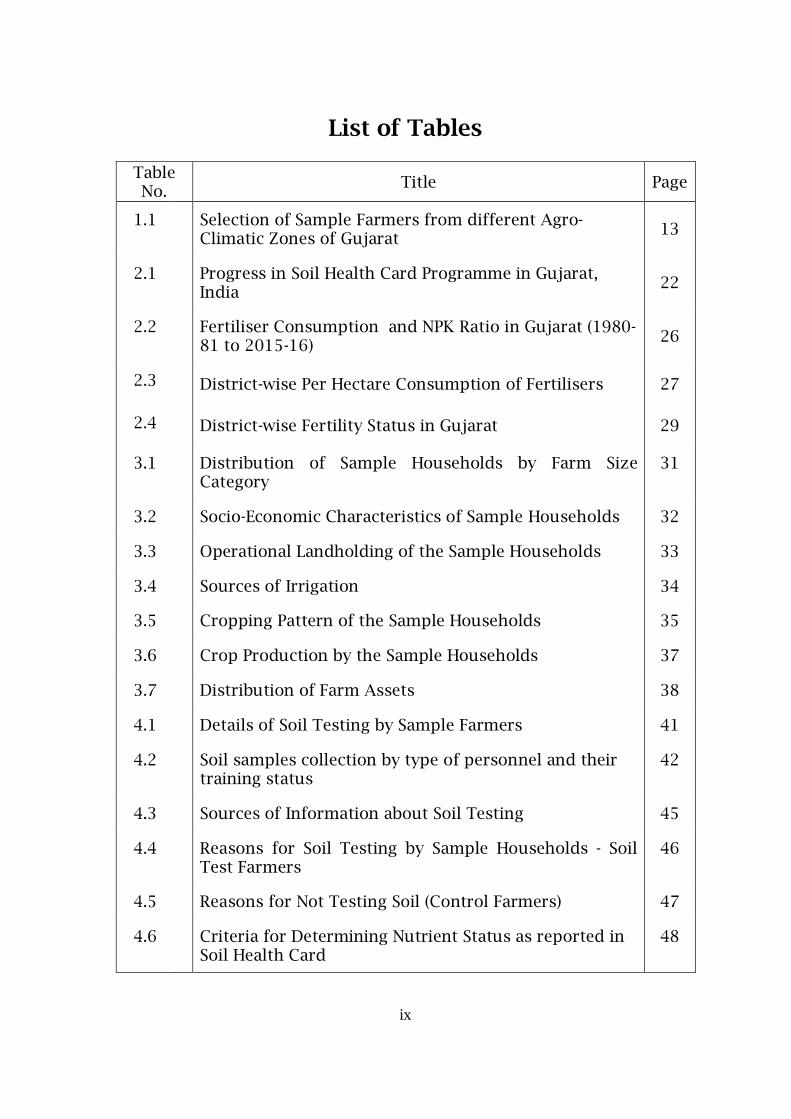
List of Tables
Table No.
Title Page
1.1
Selection of Sample Farmers from different Agro-Climatic Zones of Gujarat
13
2.1
Progress in Soil Health Card Programme in Gujarat, India
22
2.2
Fertiliser Consumption and NPK Ratio in Gujarat (1980-81 to 2015-16)
26
2.3 District-wise Per Hectare Consumption of Fertilisers 27
2.4 District-wise Fertility Status in Gujarat 29
3.1 Distribution of Sample Households by Farm Size Category
31
3.2 Socio-Economic Characteristics of Sample Households 32
3.3 Operational Landholding of the Sample Households 33
3.4 Sources of Irrigation 34
3.5 Cropping Pattern of the Sample Households 35
3.6 Crop Production by the Sample Households 37
3.7 Distribution of Farm Assets 38
4.1 Details of Soil Testing by Sample Farmers 41
4.2 Soil samples collection by type of personnel and their training status
42
4.3 Sources of Information about Soil Testing 45
4.4 Reasons for Soil Testing by Sample Households - Soil Test Farmers
46
4.5 Reasons for Not Testing Soil (Control Farmers) 47
4.6 Criteria for Determining Nutrient Status as reported in Soil Health Card
48
x
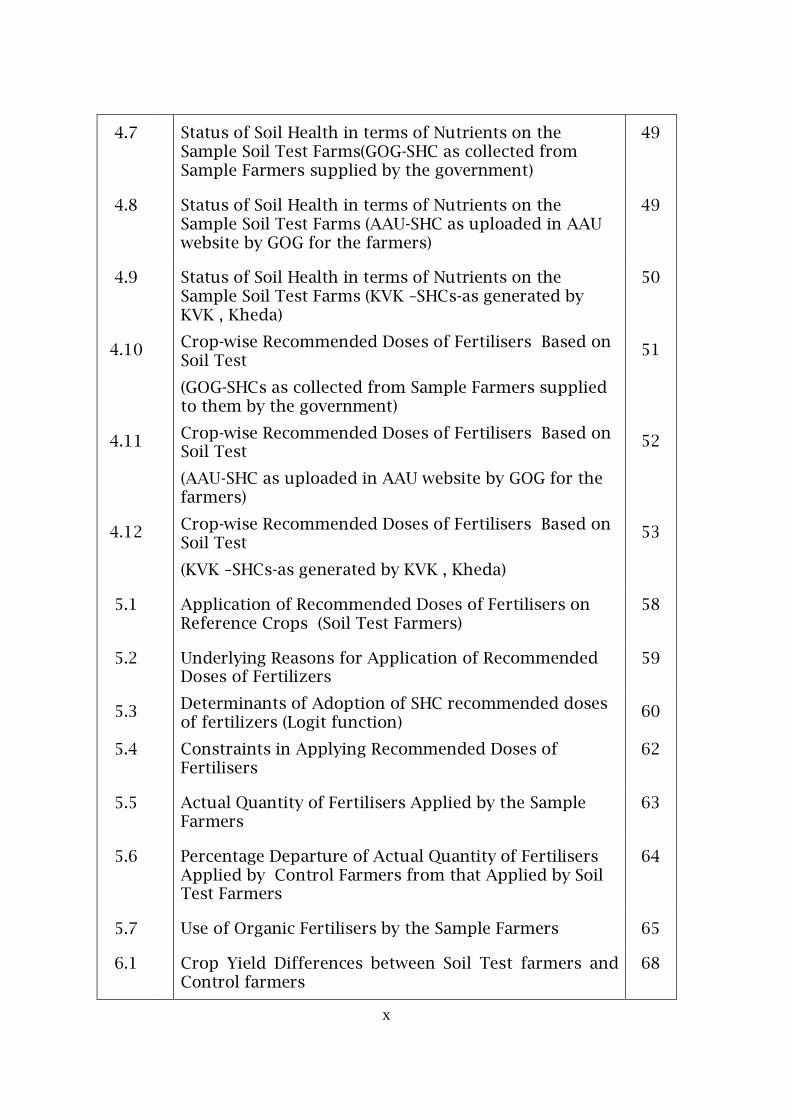
4.7 Status of Soil Health in terms of Nutrients on the Sample Soil Test Farms(GOG-SHC as collected from Sample Farmers supplied by the government)
49
4.8 Status of Soil Health in terms of Nutrients on the Sample Soil Test Farms (AAU-SHC as uploaded in AAU website by GOG for the farmers)
49
4.9 Status of Soil Health in terms of Nutrients on the Sample Soil Test Farms (KVK –SHCs-as generated by KVK , Kheda)
50
4.10 Crop-wise Recommended Doses of Fertilisers Based on Soil Test
(GOG-SHCs as collected from Sample Farmers supplied to them by the government)
51
4.11 Crop-wise Recommended Doses of Fertilisers Based on Soil Test
(AAU-SHC as uploaded in AAU website by GOG for the farmers)
52
4.12 Crop-wise Recommended Doses of Fertilisers Based on Soil Test
(KVK –SHCs-as generated by KVK , Kheda)
53
5.1 Application of Recommended Doses of Fertilisers on Reference Crops (Soil Test Farmers)
58
5.2 Underlying Reasons for Application of Recommended Doses of Fertilizers
59
5.3 Determinants of Adoption of SHC recommended doses of fertilizers (Logit function)
60
5.4 Constraints in Applying Recommended Doses of Fertilisers
62
5.5 Actual Quantity of Fertilisers Applied by the Sample Farmers
63
5.6 Percentage Departure of Actual Quantity of Fertilisers Applied by Control Farmers from that Applied by Soil Test Farmers
64
5.7 Use of Organic Fertilisers by the Sample Farmers 65
6.1 Crop Yield Differences between Soil Test farmers and Control farmers
68
xi
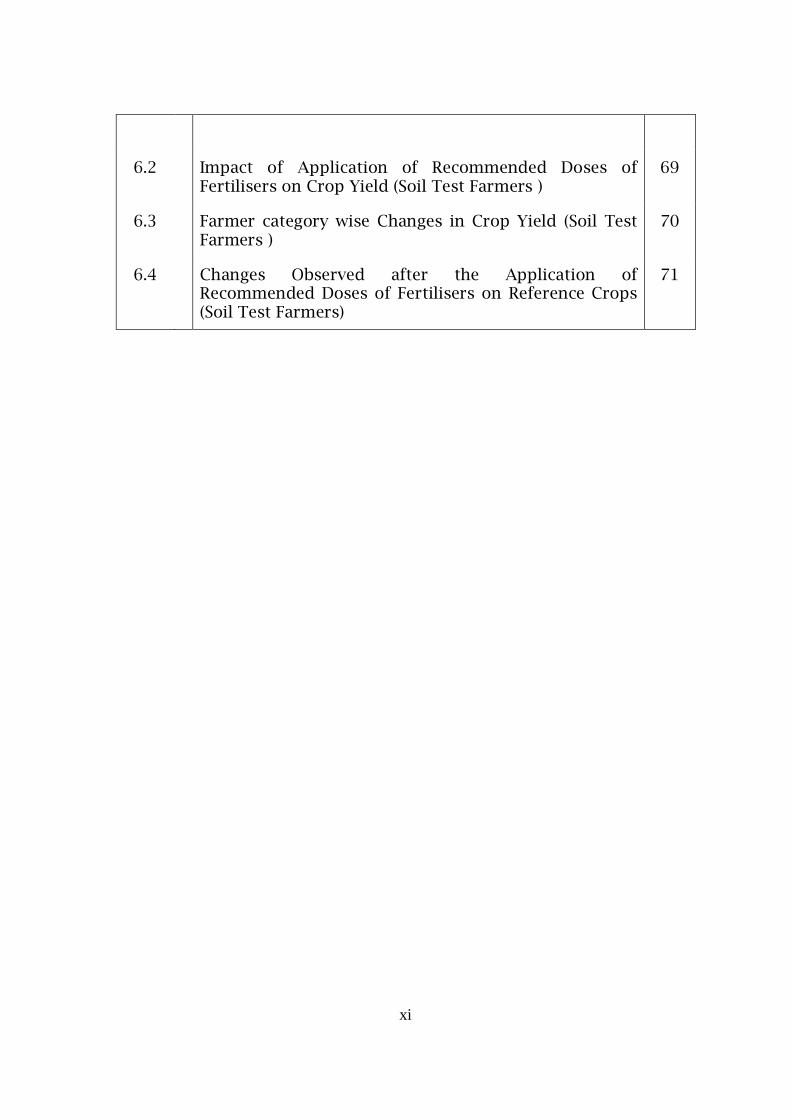
6.2 Impact of Application of Recommended Doses of Fertilisers on Crop Yield (Soil Test Farmers )
69
6.3 Farmer category wise Changes in Crop Yield (Soil Test Farmers )
70
6.4 Changes Observed after the Application of Recommended Doses of Fertilisers on Reference Crops (Soil Test Farmers)
71
xii
List of Figures
Figure No.
Figures Page
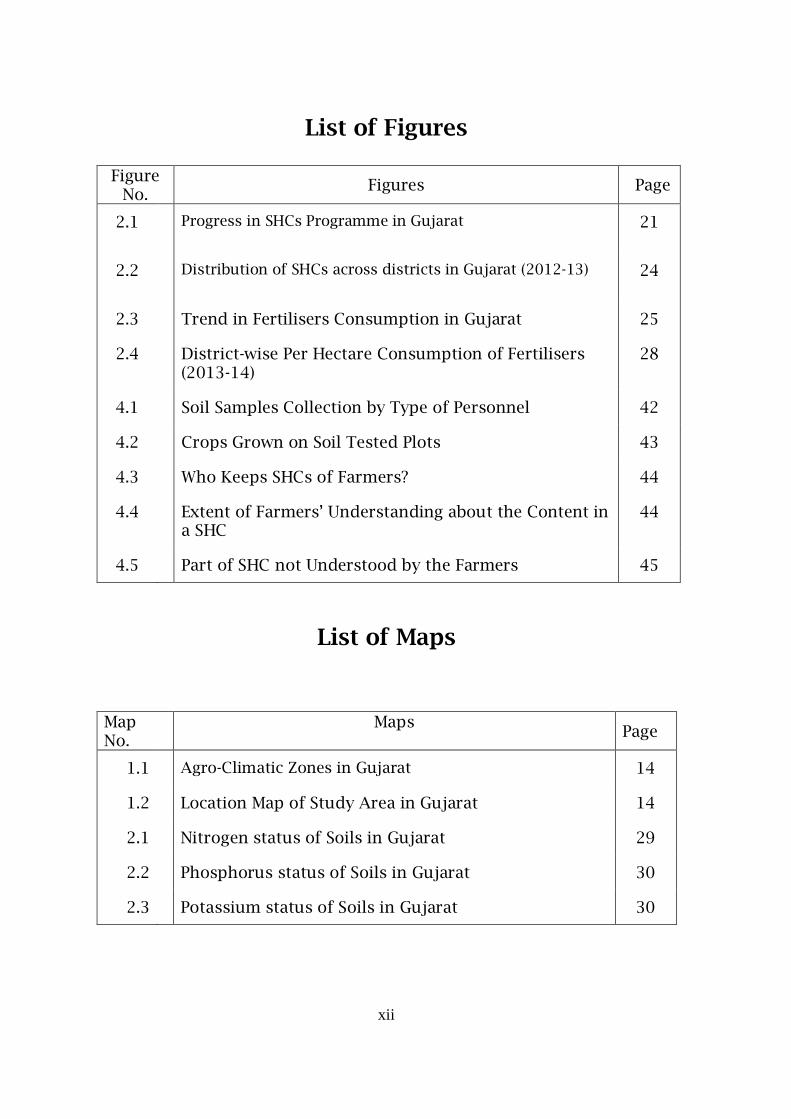
2.1 Progress in SHCs Programme in Gujarat 21
2.2 Distribution of SHCs across districts in Gujarat (2012-13) 24
2.3 Trend in Fertilisers Consumption in Gujarat 25
2.4 District-wise Per Hectare Consumption of Fertilisers (2013-14)
28
4.1 Soil Samples Collection by Type of Personnel 42
4.2 Crops Grown on Soil Tested Plots 43
4.3 Who Keeps SHCs of Farmers? 44
4.4 Extent of Farmers’ Understanding about the Content in a SHC
44
4.5 Part of SHC not Understood by the Farmers 45
List of Maps
Map No.
Maps Page
1.1 Agro-Climatic Zones in Gujarat 14
1.2 Location Map of Study Area in Gujarat 14
2.1 Nitrogen status of Soils in Gujarat 29
2.2 Phosphorus status of Soils in Gujarat 30
2.3 Potassium status of Soils in Gujarat 30
xiii
List of Photographs
Photo No. Title Page
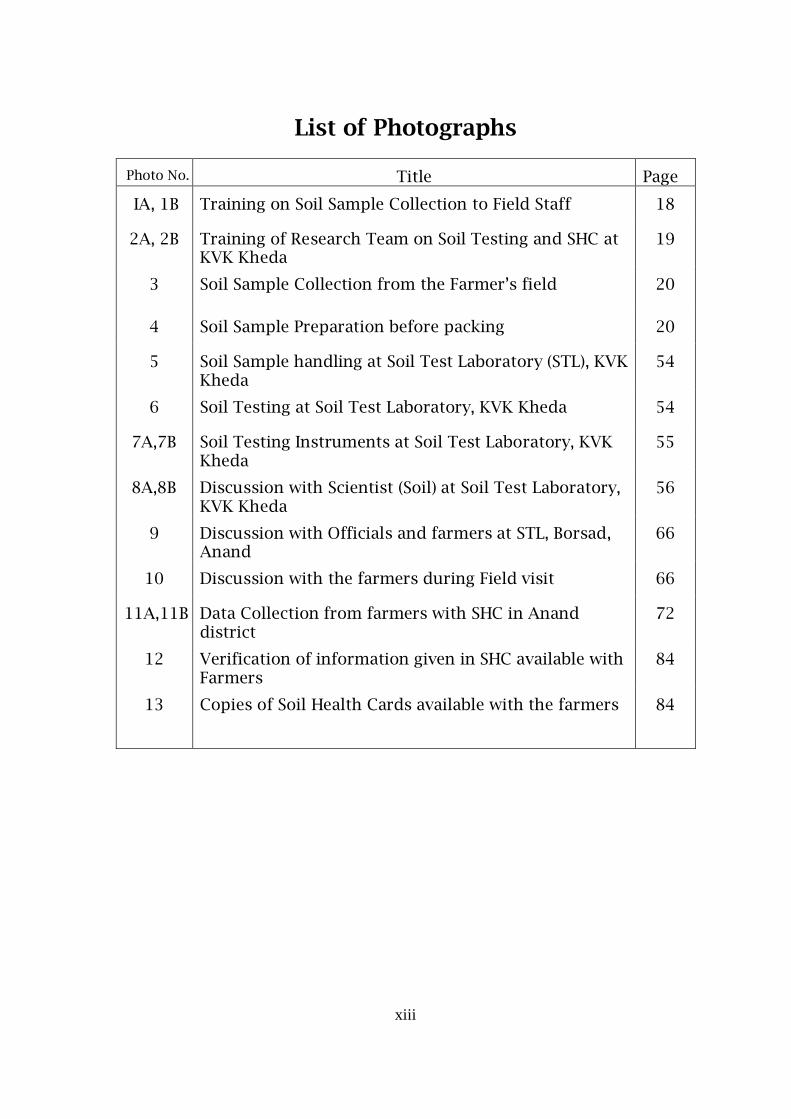
IA, 1B Training on Soil Sample Collection to Field Staff 18
2A, 2B Training of Research Team on Soil Testing and SHC at KVK Kheda
19
3 Soil Sample Collection from the Farmer’s field 20
4 Soil Sample Preparation before packing 20
5 Soil Sample handling at Soil Test Laboratory (STL), KVK Kheda
54
6 Soil Testing at Soil Test Laboratory, KVK Kheda 54
7A,7B Soil Testing Instruments at Soil Test Laboratory, KVK Kheda
55
8A,8B Discussion with Scientist (Soil) at Soil Test Laboratory, KVK Kheda
56
9 Discussion with Officials and farmers at STL, Borsad, Anand
66
10 Discussion with the farmers during Field visit 66
11A,11B Data Collection from farmers with SHC in Anand district
72
12 Verification of information given in SHC available with Farmers
84
13
Copies of Soil Health Cards available with the farmers 84
xiv
List of Annexures Annexure
No. Title Page
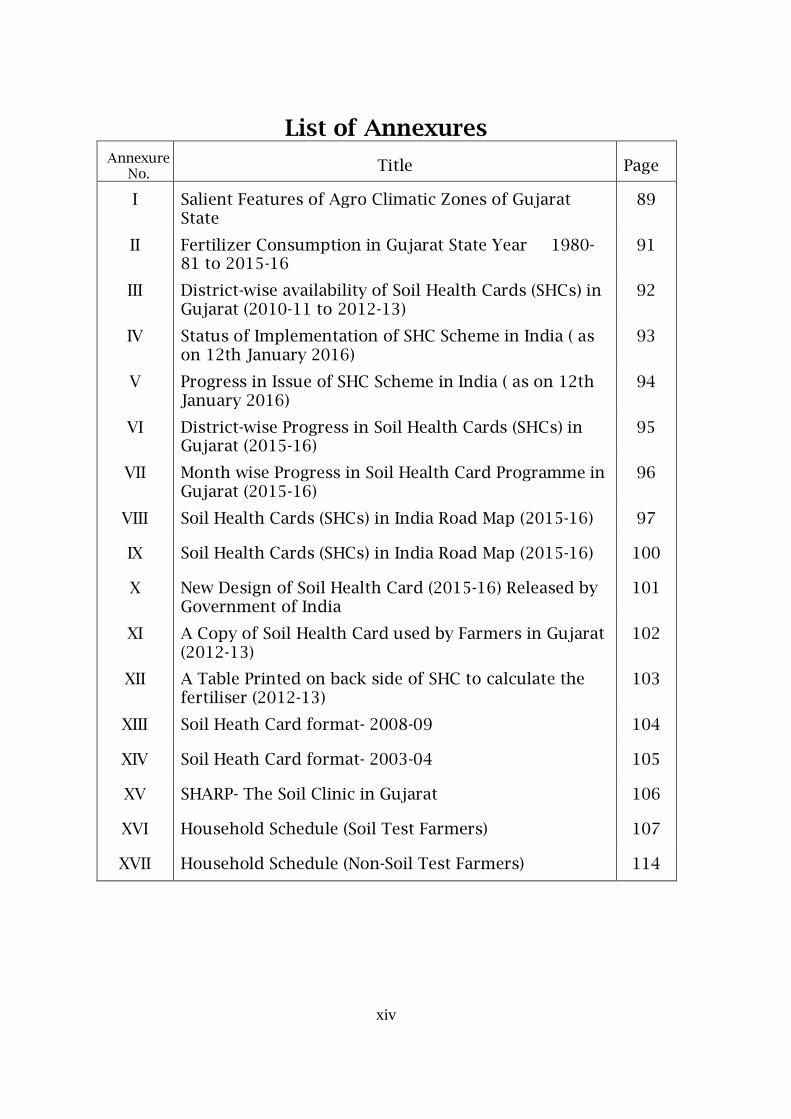
I Salient Features of Agro Climatic Zones of Gujarat State
89
II Fertilizer Consumption in Gujarat State Year 1980-81 to 2015-16
91
III District-wise availability of Soil Health Cards (SHCs) in Gujarat (2010-11 to 2012-13)
92
IV Status of Implementation of SHC Scheme in India ( as on 12th January 2016)
93
V Progress in Issue of SHC Scheme in India ( as on 12th January 2016)
94
VI District-wise Progress in Soil Health Cards (SHCs) in Gujarat (2015-16)
95
VII Month wise Progress in Soil Health Card Programme in Gujarat (2015-16)
96
VIII Soil Health Cards (SHCs) in India Road Map (2015-16) 97
IX Soil Health Cards (SHCs) in India Road Map (2015-16) 100
X New Design of Soil Health Card (2015-16) Released by Government of India
101
XI A Copy of Soil Health Card used by Farmers in Gujarat (2012-13)
102
XII A Table Printed on back side of SHC to calculate the fertiliser (2012-13)
103
XIII Soil Heath Card format- 2008-09 104
XIV Soil Heath Card format- 2003-04 105
XV SHARP- The Soil Clinic in Gujarat 106
XVI Household Schedule (Soil Test Farmers) 107
XVII Household Schedule (Non-Soil Test Farmers) 114
xv
List of Abbreviations
AEZ Agro-Ecological Zones APC Agricultural Prices Commission APMC Agricultural Produce Marketing Committee Av. Average B Boron C.I. Cropping Intensity CACP Commission for Agricultural Costs and Prices CAGR Compound Annual Growth Rate CCS Cost of Cultivation Scheme CDAP Comprehensive District Agricultural Plan CGR Compound Growth Rate CMS Cooperative Marketing Society CoC Cost of Cultivation Cu Copper DAO District Agriculture Officer DAP Diammonium Phosphate DDO District Development Officer DES Directorate of Economics and Statistics DOC Division of Cooperation DOC Division of Cooperation DPAP Drought Prone Area Programme Ec Electro-conductivity FAO Food & Agriculture Organization FAI Fertilisers Association of India Fe Ferrous (Iron) GCA Gross Cropped Area GIS Geographic Information System GDP Gross Domestic Product GIA Gross Irrigated Area GOG Government of Gujarat GOI Government of India GSDP Gross State Domestic Product GSFCL Gujarat State Fertilizers Company Limited GSLDB Gujarat State Cooperative Land Development Bank ha Hectare HYV High Yielding Variety I.I. Irrigation Intensity kg kilograms
xvi
mha Million hectares MIP Market Intervention Price MIS Market Intervention Scheme Mn Manganese MOA Ministry of Agriculture MOP Muriate of Potash mt Metric Tonnes NABARD National Bank for Agriculture and Rural Development NBS Nutrient Based Subsidy NCA Net Cropped Area NFSB National Food Security Bill NGO Non Government Organization NIA Net Irrigated Area NPK Nitrogen (N), Phosphorus (P), and Potassium (K) NPMSF National Project on Management of Soil Health& Fertility NSA Net Sown Area PDS Targeted Public Distribution System PIM Participatory Irrigation Management PSS Price Support Scheme R & D Research and Development RRB SHC
Regional Rural Banks Soil Health Card
SHC-AAU Soil Health Card-Anand Agricultural University SHC-GOG Soil Health Card-Government of Gujarat SHC-KVK Soil Health Card-Krishi Vigyan Kendra SRR Seed Replacement Ratio STLs Soil Testing Laboratories TE Triennium Ending Zn Zinc
1
Chapter I
Introduction
1.1 Background
Agriculture in India has undergone considerable transformation
over time. Some aspects of this transformation are seen in the form of
changes in agrarian structure, technological interventions, cropping
pattern, enterprise mix and marketing system. During early phases of
agricultural development, much emphasis was placed on increasing
agricultural production through adoption of high yielding varieties along
with use of chemical fertilisers and pesticides. This had led to intensive
use of land and agricultural inputs particularly in the regions endowed
with irrigation facilities. The more use of HYVs necessitated the more
application of chemical fertilizers. The use of chemical fertilisers in India
has tremendously grown since the advent of green revolution in late
1960s. With the improvement in production since green revolution period,
India’s position has turned from the state of net importer of agricultural
products to exporter of certain agricultural commodities like rice, wheat
and sugar. At farm household level also, the green revolution technology
has helped to improve the livelihood pattern, nutrition and education of
children. However, the technology has brought some negative aspects as
well (Elumalai, 2016). Since it proved successful in irrigated areas, dry
land regions and crops grown therein were left out of the process and
hence had created regional disparity in rural income (Krishnaji 1975;
Vaidyanathan, 1988; Rao 1996). Further, the technology has also altered
traditionally followed cropping pattern, which comprised growing
multiple crops every season to mono-cropping, for example cultivation of
only rice in some parts of south India. This practice put the land and other
resources under severe strain resulting in depletion of soil nutrients,
2
decline in water table, build up of pest and diseases, and micro-nutrient
deficiency (Murgai et al 2001; Pingali and Shah 2001).
There are concerns about the indiscriminate use of chemical
fertilisers by the farmers with a view to increase the crop yield (Bera,
2016). This has led to deterioration of soil structure, wastage of nutrients,
destruction of soil micro-organisms and scorching of plants at the
extreme cases. A combination of factors such as intensive cultivation of
crops, differential pricing of fertilisers and subsidy might have
contributed to excessive use of fertilisers by the farmers. Besides, due to
lack of awareness among the farmers about balanced use of fertiliser,
there are wide spread problems related to the indiscriminate use of
chemical fertilisers, mismanagement of surface water and over
exploitation of ground water. The over use of chemical fertilisers in most
parts of India in the last few decades led to several problems affecting soil
health, nutrient flow and natural environment. There is a need for
promoting, among others, balanced use of fertilisers for increasing
productivity of crops and for better absorption of nutrients from the
applied fertilizers. The adoption of recommended doses of fertiliser either
as per the State Agricultural Universities (SAU) norms or as given in the
Soil Health Card (SHC) is essential.
Many initiatives have been undertaken by the government to
ameliorate the above mentioned situation and encourage the farmers for
balanced use of fertilisers. These initiatives included, among others,
decontrol of phosphatic and potassic fertilisers, promotion of integrated
nutrient management, promotion of organic manures and bio-fertilisers,
National Project on Management of Soil Health and Fertility(NPMSF), and
nutrient based subsidy (NBS) policy. Attempts have also been made to
strengthen and revamp soil testing laboratories in various districts under
NPMSF. Farmers are encouraged to test their soil periodically and apply
fertilisers based on the deficiency of nutrients in soil. This is intended to
ensure balanced supply of nutrients for maintaining soil health and
improving crop productivity. Soil testing helps the farmers to know the
3
fertility status of the soil and apply optimum dose of fertilisers. Research
evidence shows that soil test based fertilisation has significant impact on
crop yield (Bhatt, 2013). Further, this helps to reduce operational
expenditure, incidence of pests and diseases, and environmental
pollution.
The soil nutrient management technology is a bundle of technology
package comprising two components viz., soil testing and application of
fertilisers based on soil test results. Soil testing includes collection of
representative soil samples by following standard procedure, packing and
transporting to soil test laboratories for testing of nutritional status. After
testing of soil, soil health cards are prepared and distributed to farmers.
Soil health card mainly contains details of soil fertility status and dosage
of fertiliser to be applied to reference crops. Soil test values remain valid
for three years and hence it is recommended that soil testing should be
done once in three years. Therefore, adoption of soil nutrient management
technology is sequential in nature.
1.2 Brief Review of Literature
Most of the studies focused on use of fertilisers revealed that the
fertiliser consumption and food grains production in India have shown an
upward trend since 1950s. Sharma and Sharma (2000) stated that the
fertiliser use in India increased from 69 thousand tonnes in 1950-51 to
16.2 million tonnes in 1997-98, at an annual growth rate of over 12 per
cent and the foodgrains production has also increased from about 51
million tonnes to 192.2 million tonnes in the same period, indicating a
direct relationship between fertiliser use and foodgrains production. A
study by Randhawa (1992) found that around 60 per cent increase in
agricultural production could be attributed to fertilisers; whereas Kanwar
(1997) noted that increase in food production in India due to increased
input of fertilisers has been between 50-60 per cent.
4
Importance of Fertiliser Use for Food Production
Prasad (2000) has studied the impact of fertiliser consumption on rice and
wheat productivity (tonnes per ha) in the northern states where rice-wheat
cropping system has emerged as the dominant cropping system. The
study clearly brought out that the five northern states (Punjab, Haryana,
J&K, Uttar Pradesh and Himachal Pradesh) share the same status in
productivity of rice and wheat as in consumption of fertiliser. Many other
studies (Pingali, 2004; Sharma and Sharma, 2000) have established the
direct relationship between fertiliser consumption and yield enhancement.
Since fertiliser plays a vital role in increasing the production and
productivity, per hectare consumption has substantially increased over
the decades. Fertiliser Association of India (FAI, 1974) ‘Survey on fertiliser
use on specific crops in India’ has identified that the most important
reason for increased fertiliser use was the expected increase in yields and
outputs. Another major reason was the wide adoption of high yielding
variety seeds (HYVs). Until the period of Green Revolution in mid 1960s,
commercial use of fertiliser was very low. The traditional varieties were
not very responsive to high fertilisation. However, with the introduction of
HYV seeds, the use of fertiliser increased dramatically (McGuirk and
Mundlak 1991).
Impact of Irrigation on Fertiliser Use
Irrigation expansion has been another important factor for increased
application of fertiliser. FAI (1974) studied the fertiliser use on different
crops under irrigated and un-irrigated conditions. The study found that a
higher per cent of irrigated area was fertilised as compared to un-irrigated
area. Menon and Rao (1983) noted that over 85 per cent of the fertiliser
consumption is still confined to irrigated areas which accounts for
approximately 27 per cent of cropped area. The level of economic
development has a bearing on the increased consumption of fertiliser.
Whereas FAO (2005) noted that irrigated lands accounted for 40 per cent
of total agricultural area, received 60 per cent of the fertilizer applied. Five
5
crops (rice, wheat, cotton, sugarcane, rapeseed mustard) consume about
two thirds of the fertiliser applied. Bhattacharya (2000) compared the
consumption of fertilisers between the advanced and the backward
regions and observed that the advanced regions have a lead over the
backward regions in terms of consumption of inputs. The effects of
fertiliser demonstration programmes, availability of credit and
development in infrastructural facilities including the supply of fertiliser
have also contributed to growth in fertiliser use in various parts of the
country.
Among various major factors, expected increase in yield has been
the major driving force for substantial increase in fertiliser application.
This has also resulted in overdoses of fertilisers and imbalances in soil
nutrients. The application of recommended doses of fertiliser, therefore,
assumes prime importance so as to maintain a good soil health.
NPK Ratio
Pingali (2004) stated that the NPK ratio at all-India level was never close to
the ideal NPK ratio of 4:2:1. The variation was very high during the pre-
green revolution period and post liberalization era. During the pre-green
revolution era, the consumption was mainly confined to nitrogen and the
ratio was on an average 10:1.6:1. After the introduction of high yielding
varieties, the ratio inched towards the ideal, reaching a 5.1:1.8:1 in 1973-
74. The price rise in 1974 increased the consumption of nitrogen at the
expense of phosphorus, distorting the ratio to 7.7: 2:1. The ratio improved
to a ratio of 6:2:1 in the seventies and the eighties after the reduction in
prices. After decontrol of phosphoric and potassic fertilisers in August
1992, the ratio worsened to 9.5:3.2:1 in 1992-93 and to 9.68:2.94:1 in
1993-94. Thus the imbalance in prices of N, P and K were mainly
responsible for the imbalance in their use. Generally, the farmers
substitute one fertiliser for the other in order to maximise their revenue. ]
6
Inter-state Variations in Fertiliser Use
Among states, Punjab took a very big and early lean in fertiliser
application. Inter-state variation in per hectare application of fertiliser
declined after early 1980s, but large difference still exists (Chand and
Pandey, 2008). Among different parts of the country, the distortion of NPK
ratio was the worst in North India where the application of nitrogen was
much higher than phosphorus and potash. Punjab, UP and Rajasthan had
deviated significantly from the recommended NPK ratio of 4:2:1 while
West Bengal, Tamil Nadu, Karnataka have been hovering around the
recommended NPK ratio (Pingali, 2004). The fertliser consumption
intensity varies greatly between the regions, from 40.5 kg/ha of total
nutrient in Rajasthan to 184 kg/ha in Punjab. In Gujarat, the NPK use ratio
was heavily tilted in favour of N during 1960-61 and 1970-71 due to price
hike of phosphatic and potassic fertilizers and reduction of price of urea
by 10 per cent (Pathak et al, 1993). As an immediate reaction to fertilizers
price hike, notable decline in per hectare consumption of nutrients was
also observed for various irrigated crops in the State. Since the marginal
and small farmers were exempted from price hike, per hectare
consumption of fertilizer in case of marginal farmers increased as usual.
However, small farmers did not report normal growth in fertilizer
consumption. While per hectare consumption of NPK for medium (2 to 4
ha) and big/large farms (6 ha & above) was stagnant, it declined
significantly for large famers (4 to 6 ha) in the state. Based on the data
from a field study in Haryana pertaining to two years 1990-91 and 1991-
92 (rabi season), Rao and Jayasree (2000) found that fertiliser use was
more in case of the small farmers too, considering all crops. In case of
fertiliser application per hectare of cotton, the small farmers have been
applying more fertiliser as compared to the other groups.
7
Deficiency in Micronutrients
The deficiency in micronutrients in soils of various parts of the country
has been aptly analysed by Prasad (2000) and Singh (2001), among others.
Based on 1.48 lakh soil samples from different agro-ecological zones
(AEZ), Singh (2001) indicated the existence of 45, 8.3, 4.5, 3.3 and 33 per
cent mean deficiency of Zinc (Zn), Iron (Fe), Manganese (Mn), Copper (Cu)
and Boron (B), respectively in India. However, the level of deficiency varies
widely among various AEZs. Prasad (2000) states that the mean
percentage samples deficient in Zinc (Zn), Iron (Fe), Copper (Cu), Boron (B)
and Manganese (Mn) in Gujarat was 24 per cent, 8 per cent, 5 per cent, 2
per cent and 1 per cent, respectively.
Constraints in Balanced Use of Fertiliser
There is a need to restore a balance in soil nutrients so as to maintain a
good soil health. The application of recommended doses of fertiliser,
therefore, assumes prime importance. However, there are several factors
that force the farmers not to adopt the recommended doses of fertiliser.
Rastogi and Annamalai (1981) studied the adoption of recommended
practices in dryland area and found that shortage of capital and fear of
losses was the main reasons for not adopting these practices. Among
other factors, high prices of fertiliser, lack of knowledge about the
recommended doses and their benefits, and non-availability of irrigation
water and desired fertilisers were the major ones.
Soil Testing Services and Soil Health Card Scheme
A study on ‘Soil Testing Services in Rajasthan’ was carried out by Sevak
(1982). The study has examined the organizational set up and working of
soil testing service in Rajasthan on the basis of available secondary data
and a field survey covering 60 beneficiary households and 40 non-
beneficiary households for the reference year 1979-80. The study revealed
that the fertilizers had not been used on any of the soil tested plots as per
the recommendations. Similarly, the yield rates were found to be higher
8
on farms using less than the recommended doses of NPK nutrients. This
study had suggested that these results deserve to be looked into more
carefully for making this service more effective. This study had provided
several specific recommendations for improving the working of this
service in Rajasthan.
Swain et al. (2014) undertook a study in Gujarat that examined the
level of adoption and constraints in the application of recommended
doses of fertilisers based on soil test (through Soil Health Card Scheme) by
the farmers in the state. The study was conducted on two major crops
grown in the state (groundnut and cotton), following a cluster approach
on a sample of160 control farmers (no soil test) and 240 soil test farmers
from four districts (Surendranagar and Rajkot for cotton
and Jamnagar and Junagarh for groundnut).
The study found that the level of adoption of recommended doses
by the soil test farmers was reasonably less (around 40 per cent for both
cotton and groundnut groups) among the sample farmers. However, the
adoption of recommended doses of fertiliser based on soil test has helped
the farmers in increasing the agricultural productivity and income. The
crop yield after soil tests has increased by 23.8 per cent and 22.9 per cent
in case of groundnut and cotton respectively. The low adoption of
recommended doses of fertilizers by the soil test farmers was due to
various constraints, viz. difficulty in understanding and following
application of recommended doses as stated in Soil Health Cards,
unavailability of technical advice on method and time of fertiliser
application, high prices of fertilisers and unavailability of required
fertilisers in adequate quantity. The quality of implementation of the
programme was found unsatisfactory due to focus on target achievement
ignoring quality norms, inadequate staff strength, unavailability of
required number of soil test laboratories (STLs) and mobile STLs and lack
of upgradation of skills of the personnel involved in the implementation
of the programme.
9
1.3 Growing Emphasis on Soil Health Card Programme
‘Soil Health Card (SHC) Scheme’, a Central Scheme that provides
information about soils and the kind of crops to be grown in various
regions, has been launched in February 2015 by the Union Government
that has aimed at issuing 14 crore Soil Health Cards to the farmers in the
country over the next 3 years to check the excess use of fertilizers and to
improve the soil health (GOI, 2015a). It has been approved for
implementation during the remaining period of 12th Plan with an outlay of
Rs 568.54 crore. This scheme is being promoted by the Department of
Agriculture & Co-operation under the Ministry of Agriculture & Farmers
Welfare. It is being implemented through the Department of Agriculture
of all the State and Union Territory Governments.
Since the year 2015 was celebrated by the United Nations as the
‘International Year of the Soils’, it was decided by Government of India to
issue soil health cards to as many farmers as possible during the
corresponding year. Hence, it was decided to complete the first cycle in 2
years instead of 3 years. The target for 2015-16 was revised from the
initial 84 lakh samples to 100 lakh samples to issue an estimated number
of 5 crore soil health cards to the farmers. The remaining 153 lakh
samples have been targeted to be covered in 2016-17. The 5th December,
2015 has been celebrated as ‘World Soil Day’ on which the MOA has
celebrated the same by organizing events at State, District and Block levels
by issuing soil health cards to invited farmers and also educate them and
create greater awareness about the importance of soil health. The
Department also planned a media campaign and organize training
programmes at various State Agricultural Universities and Krishi Vigyan
Kendras, as also at the national & state levels.
A SHC is meant to be given to each farmer to make him/her aware
of soil nutrient status of his/her land holding and advice him/her on the
dosage of fertilizers and also the needed soil amendments, that s/he
should apply to maintain soil health in the long run. SHC is a printed
report that a farmer is handed over for each of his holdings. It contains
10
the status of his soil with respect to 12 parameters, namely N, P, K (Macro-
nutrients); S (Secondary- nutrient); Zn, Fe, Cu, Mn, Bo (Micro - nutrients);
and pH, EC, OC (Physical parameters). Based on this, the SHC also
indicates fertilizer recommendations and soil amendment required for the
farm. The card contains an advisory based on the soil nutrient status of a
farmer’s holding. It shows recommendations on dosage of different
nutrients needed. Further, it advises the farmer on the fertilizers and their
quantities s/he should apply, and also the soil amendments that he
should undertake, so as to realize optimal yields.
SHCs are made available once in a cycle of 3 years, which indicates
the status of soil health of a farmer’s holding for that particular period.
The SHC given in the next cycle of 3 years will be able to record the
changes in the soil health for that subsequent period. As per the present
norms (GOI, 2015b), the soil samples are to be drawn in a grid of 2.5 ha in
irrigated area and 10 ha in rainfed area with the help of GPS tools and
revenue maps.
The State Governments have been given the responsibility to collect
samples through the staff of their departments or through the staff of an
outsourced agency. The State Government may also involve the students
of local Agriculture / Science Colleges.
Collection and Testing of Soil Samples As per the Government of India norms, the soil samples are taken
generally two times in a year, after harvesting of Rabi and Kharif Crop
respectively or when there is no standing crop in the field. Soil Samples
are collected by a trained person from a depth of 15-20 cm by cutting the
soil in a “V” shape. The soil sub-samples are collected from four corners
and the centre of the field and mixed thoroughly and a part of this picked
up as a sample. Areas with shade, ploughed or disturbed fields, very moist
or flooded by rains are avoided, while taking soil samples. The sample
chosen are bagged and coded. It is then transferred to soil test laboratory
(STL) for analysis. The soil samples are tested as per the approved
11
standards for all the agreed 12 parameters in the approved STLs as
follows:
i. At the STLs owned by the Department of Agriculture and by their
own staff.
ii. At the STLs owned by the Department of Agriculture but by the
staff of the outsourced agency.
iii. At the STLs owned by the outsourced agency and by their staff.
iv. At ICAR Institutions including KVKs and SAUs.
v. At the laboratories of the Science Colleges/Universities by the
students under supervision of a Professor/ Scientist.
Implementation of SHC Programme
Central Government has been providing assistance to State Governments
for setting up more number of Soil Testing Laboratories so as to issue Soil
Health Cards to farmers at their doorsteps within the stipulated time
periods. State Governments have adopted innovative practices like
involvement of agricultural students, NGOs and private sector in soil
testing, determining average soil health of villages, etc., to issue Soil
Health Cards.
Among various states, Gujarat has been a leading State in
streamlining the Soil Health Card (SHC) Programme for the benefit of
farmers at grass-root level. So far, a total of 53.69 lakh soil health cards
have been generated and given to farmers by the end of 2013-14. Out of
which, 6.26 lakh soil health cards have been distributed in the year 2013-
14 alone (Swain et. al, 2014). The programme has generated alternative
crop planning and recommendations for 229 Talukas and 24324 villages
and generated all Talukas and Villages Model Action Plans (GOG, 2013).
So far, there is a dearth of systematic studies undertaken to
examine the problems and prospects in implementation of SHC
programme in various parts of the country. It is necessary to examine the
effectiveness of the programme in assuring better soil health, more crop
productivity and problems and prospects in adoption of recommended
doses of fertilisers by farmers in the country. Since the Gujarat state is
12
one of the front runners in implementation of the scheme well before
(2003-04) the launch of the Scheme at all-India level, the present study
attempts to undertake a detailed systematic study to address all these
issues in the context of Gujarat state.
1.4. Major Objectives/Agenda of the Study
The objectives of the study are as follows:
1. To assess the progress in implementation of Soil Health Card
Programme in Gujarat;
2. To evaluate the quality of implementation of the programme in
terms of quality of soil sample collection, soil testing for different
nutrients, generation and timely delivery of soil health cards, and
the extent of use and acceptability of the SHCs by the farmers;
3. To examine the level of adoption and constraints in the adoption of
recommended doses of fertilizers based on soil test reports by the
farmers; and
4. To analyse the impact of adoption of recommended doses of
fertilisers on soil health, crop productivity and returns.
1.5. Data and Methodology
The present study is based on both secondary and primary level data. The
reference year for the study based on primary data collection and analysis
is 2014-15. The farmers who got their soil tested during the last three
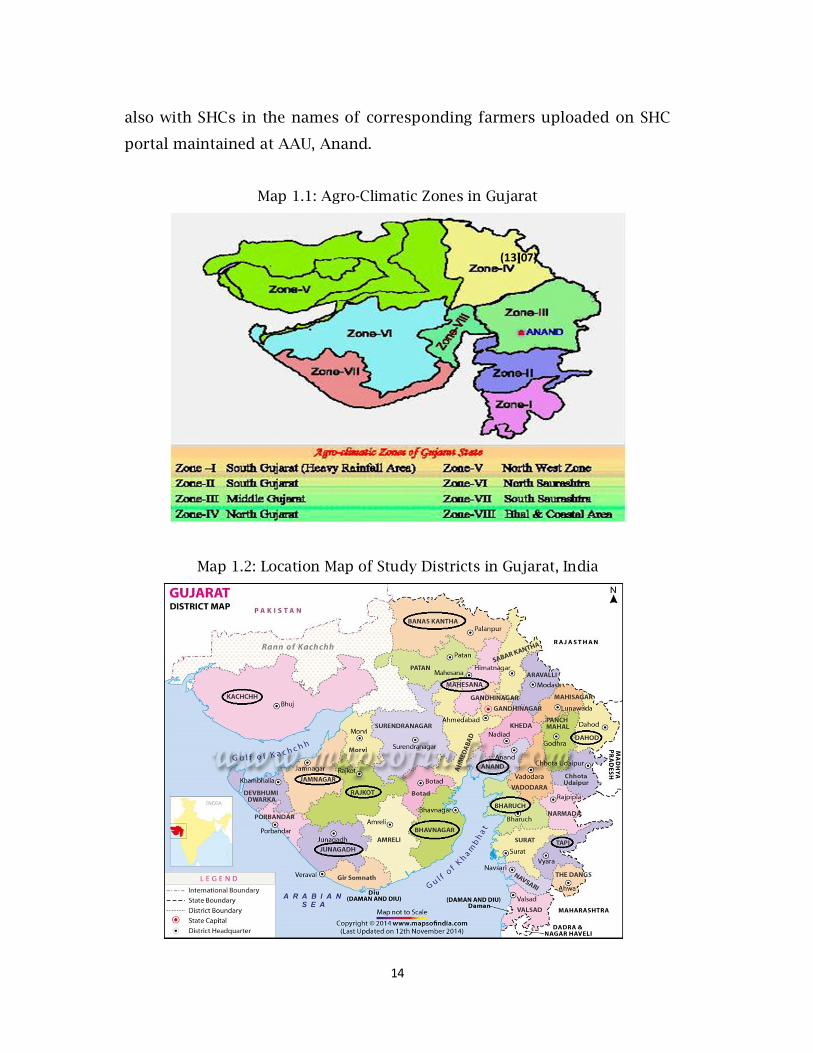
years period (2012-13 to 2014-15) were covered under the survey. About
11 districts covering all 8 agro climatic zones (ACZ) of the state were
included for the detailed study (Map-1.1 & Map 1.2). Number of districts
from each ACZ was determined according to size of corresponding ACZ.
Number of talukas/tehsils (16 in total) and sample size from various
13
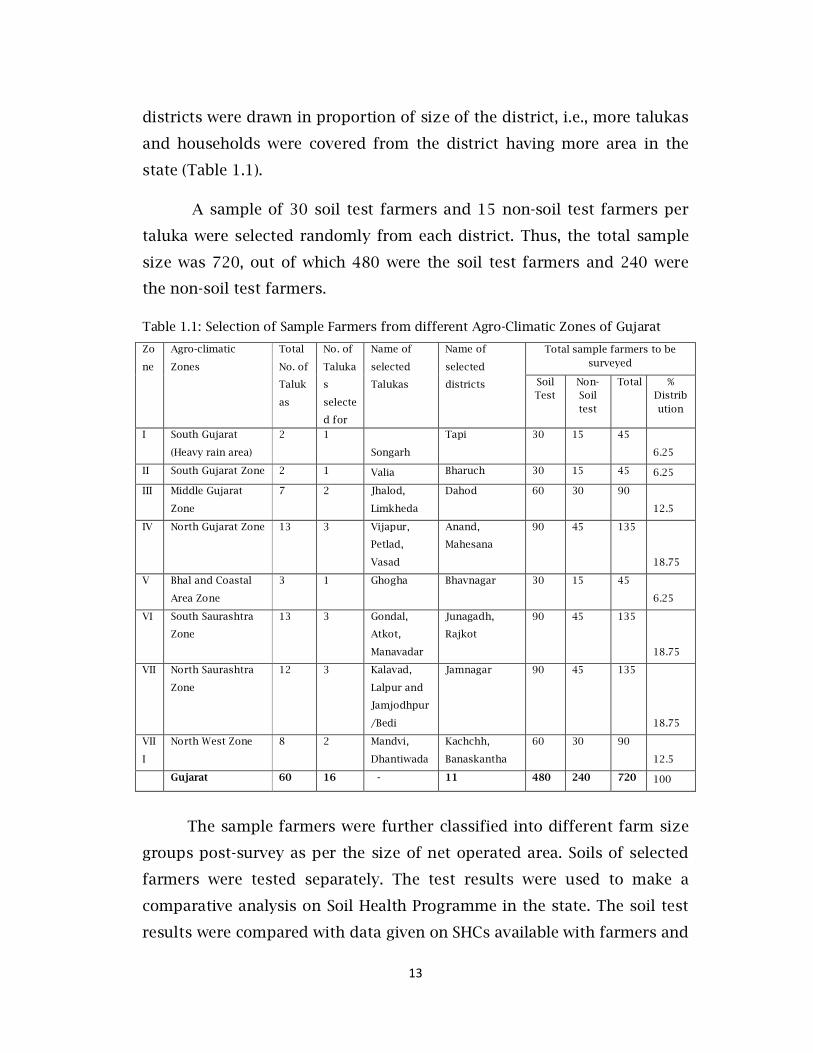
districts were drawn in proportion of size of the district, i.e., more talukas
and households were covered from the district having more area in the
state (Table 1.1).
A sample of 30 soil test farmers and 15 non-soil test farmers per
taluka were selected randomly from each district. Thus, the total sample
size was 720, out of which 480 were the soil test farmers and 240 were
the non-soil test farmers.
Table 1.1: Selection of Sample Farmers from different Agro-Climatic Zones of Gujarat
Zo
ne
Agro-climatic
Zones
Total
No. of
Taluk
as
No. of
Taluka
s
selecte
d for
Name of
selected
Talukas
Name of
selected
districts
Total sample farmers to be surveyed
Soil Test
Non-Soil test
Total % Distribution
I South Gujarat
(Heavy rain area)
2 1
Songarh
Tapi 30 15 45
6.25
II South Gujarat Zone 2 1 Valia Bharuch 30 15 45 6.25
III Middle Gujarat
Zone
7 2 Jhalod,
Limkheda
Dahod 60 30 90
12.5
IV North Gujarat Zone 13 3 Vijapur,
Petlad,
Vasad
Anand,
Mahesana
90 45 135
18.75
V Bhal and Coastal
Area Zone
3 1 Ghogha Bhavnagar 30 15 45
6.25
VI South Saurashtra
Zone
13 3 Gondal,
Atkot,
Manavadar
Junagadh,
Rajkot
90 45 135
18.75
VII North Saurashtra
Zone
12 3 Kalavad,
Lalpur and
Jamjodhpur
/Bedi
Jamnagar 90 45 135
18.75
VII
I
North West Zone 8 2 Mandvi,
Dhantiwada
Kachchh,
Banaskantha
60 30 90
12.5
Gujarat 60 16 - 11 480 240 720 100
The sample farmers were further classified into different farm size
groups post-survey as per the size of net operated area. Soils of selected
farmers were tested separately. The test results were used to make a
comparative analysis on Soil Health Programme in the state. The soil test
results were compared with data given on SHCs available with farmers and
14
also with SHCs in the names of corresponding farmers uploaded on SHC
portal maintained at AAU, Anand.
Map 1.1: Agro-Climatic Zones in Gujarat
Map 1.2: Location Map of Study Districts in Gujarat, India
(13) (07)
15
The cluster approach was followed to ensure that adequate soil test
farmers are available for the survey. Further, passable measures were
taken to ensure that the selected villages fall under the same agro-climatic
conditions of sample districts and that the selected villages have certain
common characteristics such as soil type, irrigation and crop variety.
The multi-stage sampling method was used to select the districts,
blocks and farm households. At first stage, 11 districts of Gujarat were
selected from 8 ACZs. At second stage, 16 blocks/talukas were selected
from 11 study districts. At third stage, desired number of sample
households (720) representing different farm categories (MF: Marginal
farmers (0-1 ha); SF: Small farmers (1-2 ha); SMF: Semi Medium farmers (2-
4ha); MDF: Medium farmers (4- 6 ha); LF: Large farmers (>6 ha)) were
selected from the study talukas. The sample farmers were classified into
different farm size groups post-survey as per the size of net operated
area.
Soil samples of selected farmers in the soil test group were
collected and tested separately at Krishi Vigyan Kendra (KVK), Kheda,
Gujarat. The test results were used to make a comparative analysis on Soil
Health Card Programme in the state. The soil test results were compared
with data given on SHCs available with the farmers (issued under SHC
Programme by the Government) and also with SHCs in the names of
corresponding farmers uploaded on SHC portal maintained at AAU,
Anand. Thus, following three types of Soil Health Cards (SHCs) were used
for comparative analysis:
SHCs available with the farmers (issued under SHC
Programme by the Government of Gujarat (SHC-GOG)
SHCs in the names of corresponding farmers uploaded on
SHC portal maintained at AAU, Anand (SHC-AAU)
SHCs generated afresh by Krishi Vigyan Kendra (KVK), Kheda
(SHC-KVK)
16
1.6 Limitation of the Study
As per the study design, copy of soil health card from each selected
farmer was to be collected. In some cases, some farmers did not have the
same with them. Second, most of soil tested farmers were not aware about
their soil test results. Third, comparing and interpreting soil test results
under different scenarios was a difficult task since the quality of soil
samples is very delicate that can vary from place to place even within the
same plot, or over a period of time. The soil quality can be affected by a
number of factors which may not be controllable within a period of time.
1.7 Organization of the Report
The present report is organized in seven chapters. The introductory
chapter discusses the rationale, objectives of the study and methodology
used for data collection and data analysis. The coverage, sampling design
and conceptual framework of the study have been discussed in this
chapter followed by the chapter scheme of the report.
The second chapter analyses the progress in soil health card
programme in Gujarat state. The overview of socio-economic profile of
sample households/farmers, main features of the sample households
including land ownership pattern, cropping pattern, sources of irrigation,
area under HYV and value of output, farm assets holdings and the details
of agricultural credit availed have been analyzed in Chapter III. The fourth
chapter assesses the performance of Soil Health Card Programme in the
state with the help of household level data. The details of soil testing and
recommended doses of fertilisers adopted by the sample farmers and the
source of information about soil testing by soil test farmers, reasons for
soil testing by soil test farmers, reasons for not testing soil by control
farmers, status of soil health on the sample soil test farms, and
recommended doses of fertilisers applied by the sample farmers on soil
test basis, and the extent of variations in soil test results given in various
SHCs produced by government and other agencies have been discussed in
this chapter.
17
The next chapter (i.e., Chapter V) examines the extent of adoption of
recommended doses of fertilisers as per the SHC and its constraints. The
determinants of adoption of recommended doses of fertilisers have been
analysed with the use of a Logit Model. The sources of information about
recommended doses of fertilisers by control farmers, application of actual
quantity of fertilisers by sample households, method of application of
chemical fertilisers by sample farmers, and the extent of use of organic
fertilisers by the sample households have been discussed in this chapter.
The impacts of adoption of recommended doses of fertilisers have been
discussed in Chapter VI. The last chapter (i.e., Chapter VII) presents the
summary, concluding observations and policy implications of the study.
1.8 Stakeholders in the Research Project
The present study on ‘Soil Health Card Programme in Gujarat:
Implementation, Impact and Impediments’ was sponsored by Centre for
International Projects Trust (CIPT), New Delhi and was undertaken at our
Centre, i.e., Agro-Economic Research Centre, Sardar Patel University,
Vallabh Vidyanagar, Gujarat, India.
18
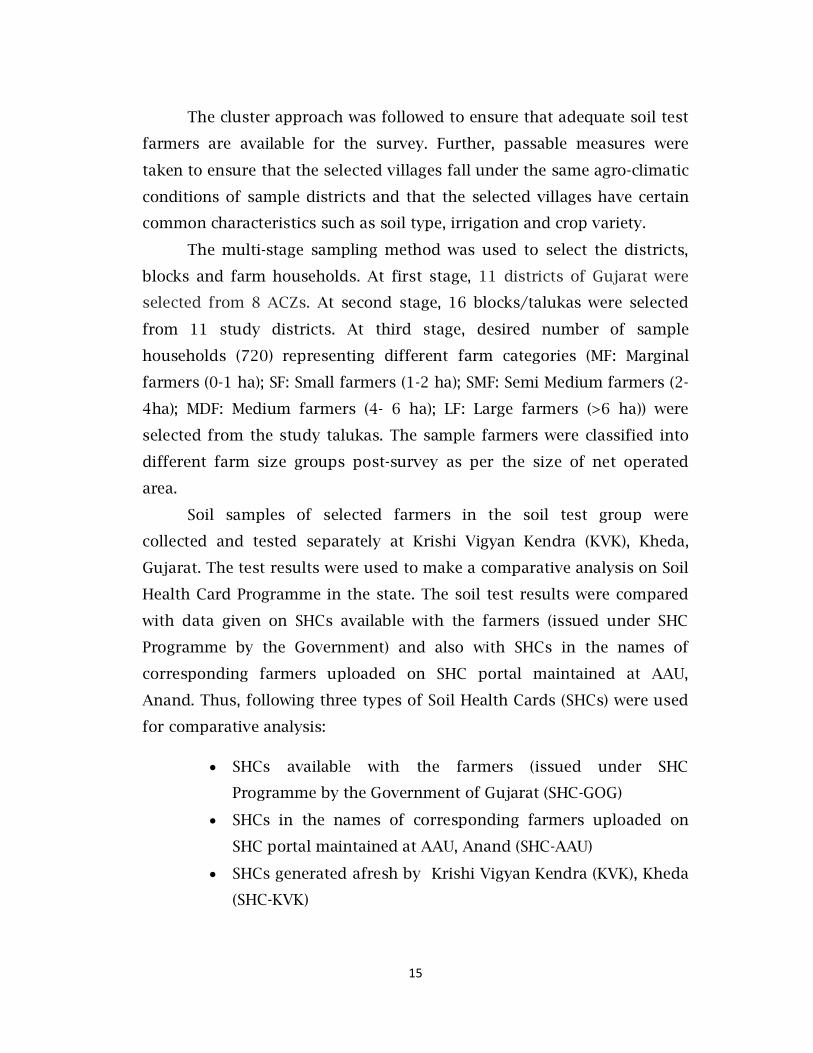
Photo 1A & 1B: Training on Soil Sample Collection to Field Staff
19
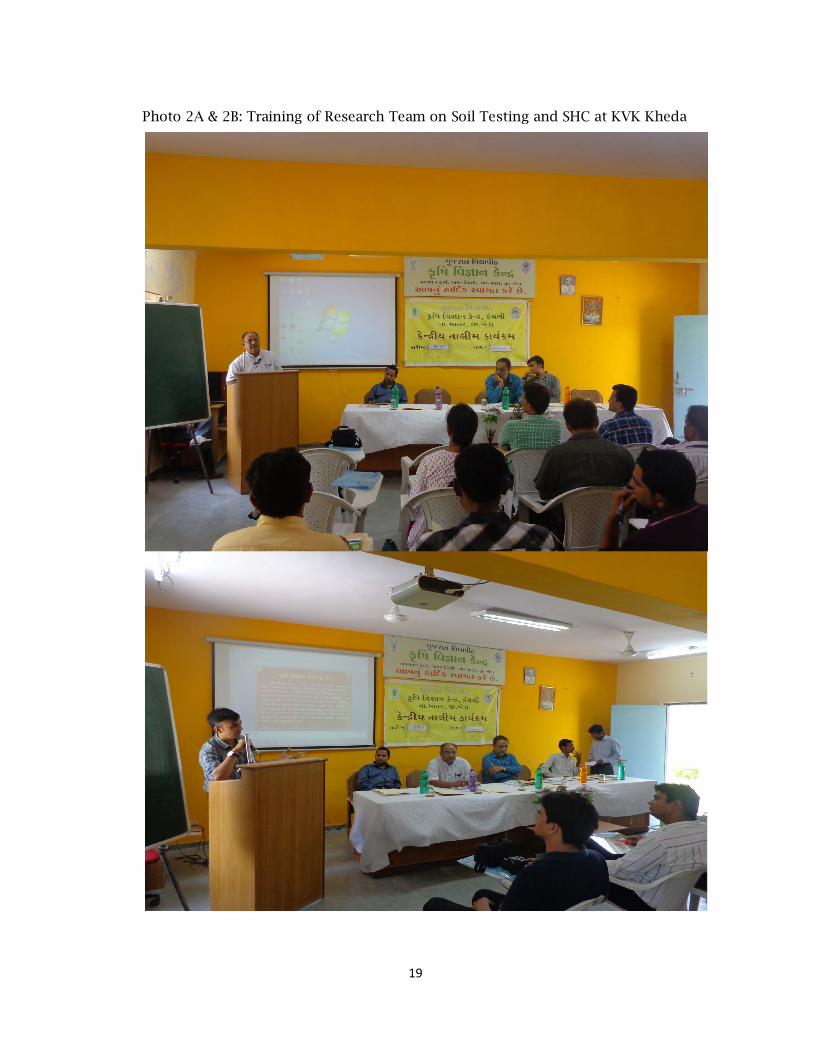
Photo 2A & 2B: Training of Research Team on Soil Testing and SHC at KVK Kheda
20
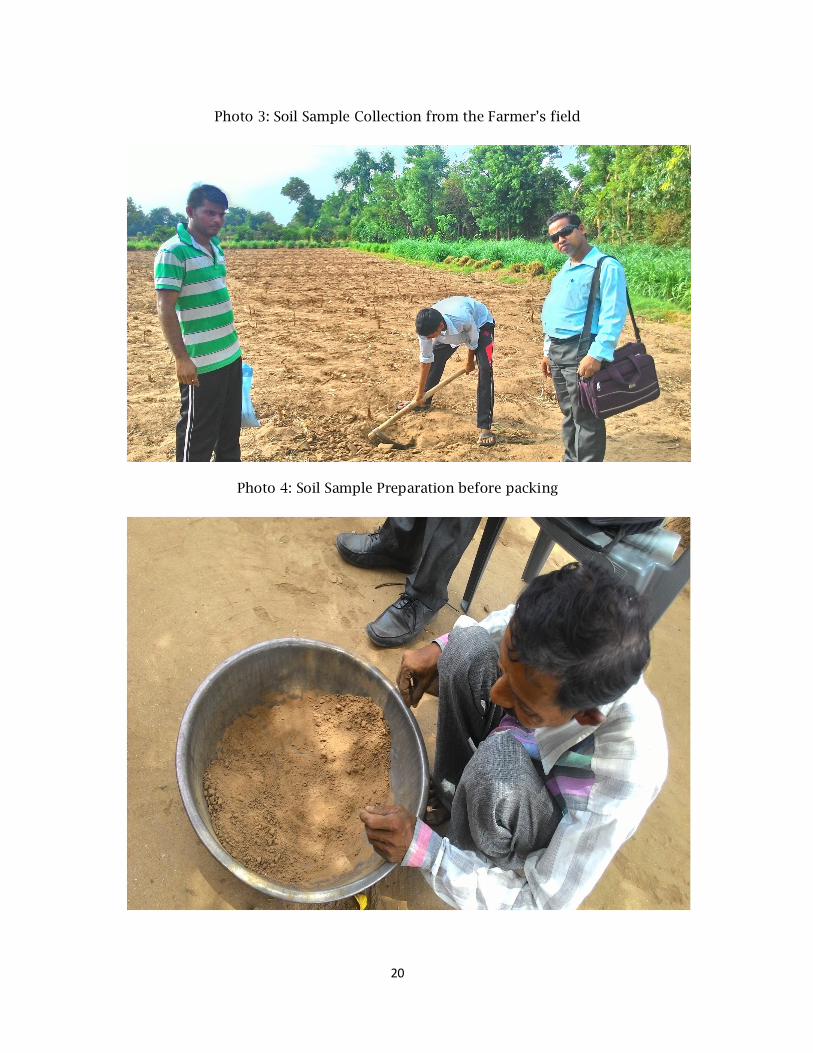
Photo 3: Soil Sample Collection from the Farmer’s field
Photo 4: Soil Sample Preparation before packing
21
Chapter II
Progress in Soil Health Card Programme in Gujarat
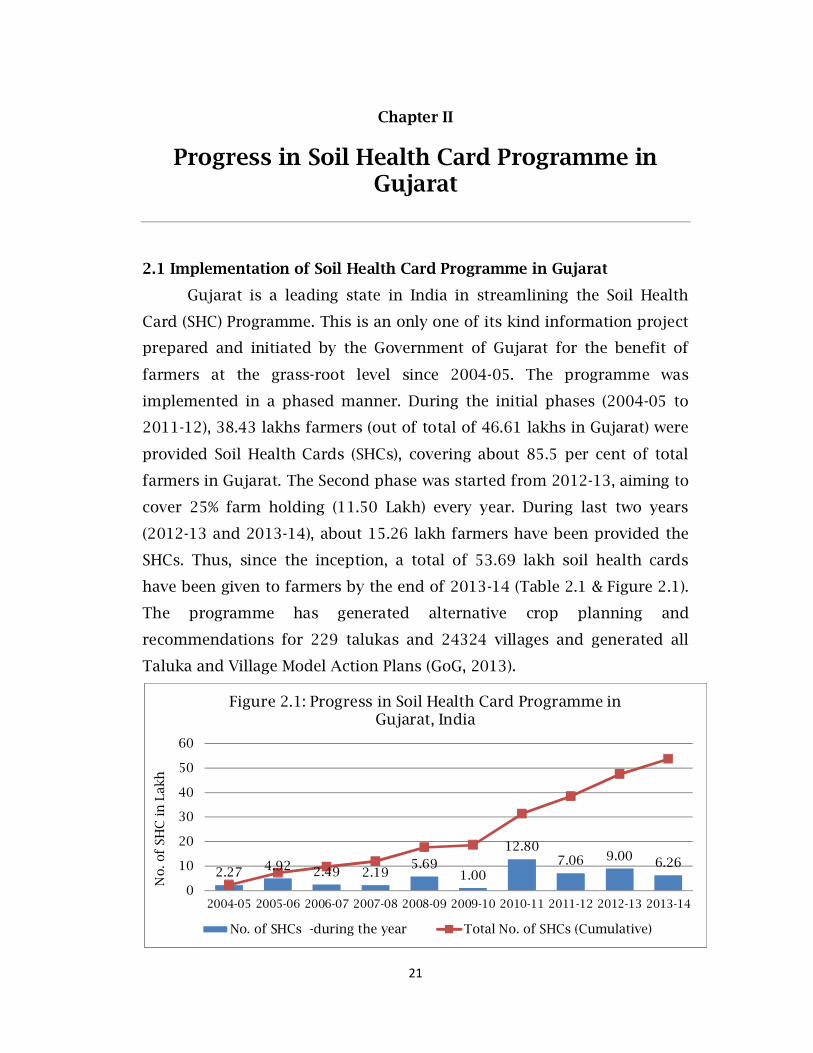
2.1 Implementation of Soil Health Card Programme in Gujarat
Gujarat is a leading state in India in streamlining the Soil Health
Card (SHC) Programme. This is an only one of its kind information project
prepared and initiated by the Government of Gujarat for the benefit of
farmers at the grass-root level since 2004-05. The programme was
implemented in a phased manner. During the initial phases (2004-05 to
2011-12), 38.43 lakhs farmers (out of total of 46.61 lakhs in Gujarat) were
provided Soil Health Cards (SHCs), covering about 85.5 per cent of total
farmers in Gujarat. The Second phase was started from 2012-13, aiming to
cover 25% farm holding (11.50 Lakh) every year. During last two years
(2012-13 and 2013-14), about 15.26 lakh farmers have been provided the
SHCs. Thus, since the inception, a total of 53.69 lakh soil health cards
have been given to farmers by the end of 2013-14 (Table 2.1 & Figure 2.1).
The programme has generated alternative crop planning and
recommendations for 229 talukas and 24324 villages and generated all
Taluka and Village Model Action Plans (GoG, 2013).
2.27 4.92 2.49 2.195.69
1.00
12.807.06 9.00 6.26
0
10
20
30
40
50
60
2004-05 2005-06 2006-07 2007-08 2008-09 2009-10 2010-11 2011-12 2012-13 2013-14
No. o
f SH
C i
n L
akh
Figure 2.1: Progress in Soil Health Card Programme in Gujarat, India
No. of SHCs -during the year Total No. of SHCs (Cumulative)
22
20
07
-08 (i) State Government 18 2 20 190000 142692 75.1 18 219000
(ii) Public Sector Undertaking
3 1 4 50000 84789 169.6 3
(iii) Private Sector 0.0
(iv) Total 21 3 24 240000 227481 94.8 21 219000 1187811
200
8-0
9 (i) State Government 18 2 20 190000 158224 83.3 18 568614
(ii) Public Sector Undertaking
3 1 4 50000 83819 167.6 3
(iii) Private Sector 0.0
(iv) Total 21 3 24 240000 242043 100.9 21 568614 1756425
20
09
-10
(i) State Government 18 2 20 190000 307348 161.8 19 100000
(ii) Public Sector Undertaking
3 3 50000 104733 209.5 3
(iii) Private Sector 0.0
(iv) Total 21 2 23 240000 412081 171.7 22 100000 1856425
20
10
-11
*
(i) State Government 18 2 20 210000 650000 309.5 19
1279968
(ii) Public Sector Undertaking
70 0 70 1430223 1401646 98.0 24
(iii) Private Sector 0 0 0 0 0 0.0 0
(iv) Total 88 2 90 1640223 2051646 125.1 26
1279968
3136393
20
11
-12 (i) State Government 20 2 22 220000 136408 62.0 21 706241
(ii) Public Sector Undertaking
81 0 81 810000 353625 43.7 24
(iii) Private Sector 0 0 0 0 0 0.0 0
(iv) Total 101 2 103 1030000 490033 47.6 24 706241 3842634
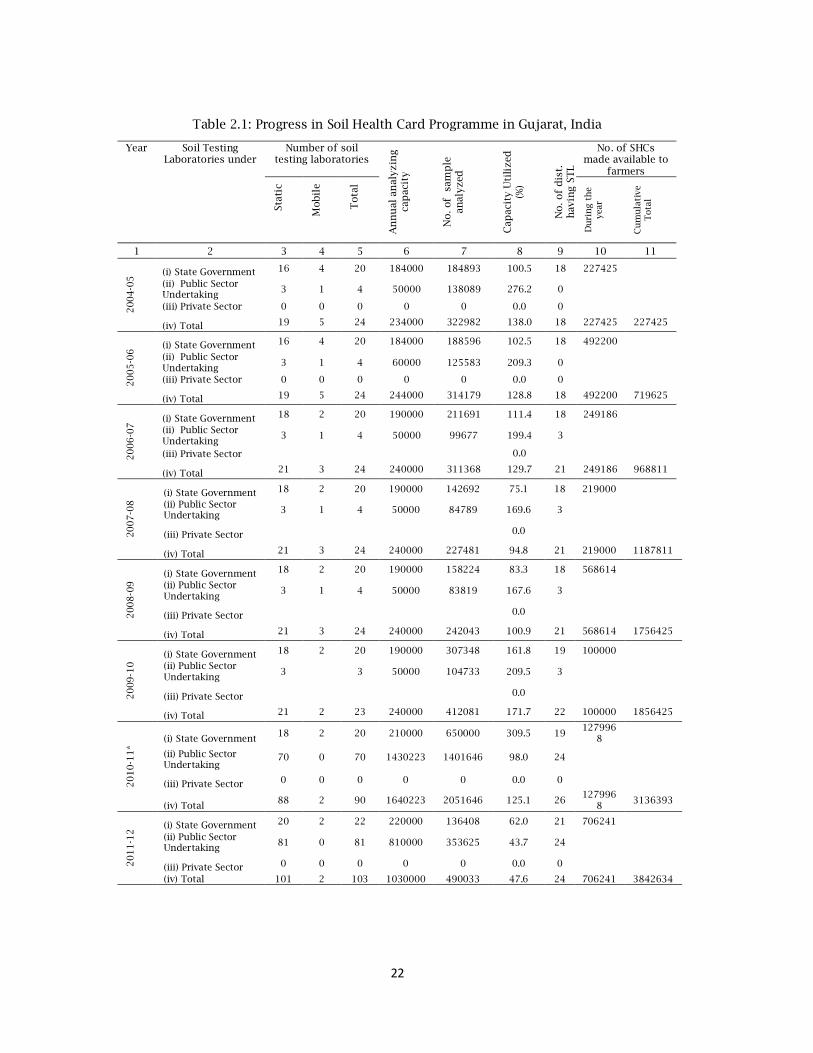
Table 2.1: Progress in Soil Health Card Programme in Gujarat, India
Year Soil Testing Laboratories under
Number of soil testing laboratories
An
nu
al a
nal
yzin
g
cap
acit
y
No
. of
sam
ple
an
alyz
ed
Cap
acit
y U
tili
zed
(%
)
No
. o
f d
ist.
h
avin
g S
TL
No. of SHCs made available to
farmers
Stat
ic
Mob
ile
Tota
l
Du
rin
g t
he
year
Cu
mu
lati
ve
Tota
l
1 2 3 4 5 6 7 8 9 10 11
200
4-0
5 (i) State Government 16 4 20 184000 184893 100.5 18 227425
(ii) Public Sector Undertaking
3 1 4 50000 138089 276.2 0
(iii) Private Sector 0 0 0 0 0 0.0 0
(iv) Total 19 5 24 234000 322982 138.0 18 227425 227425
20
05
-06 (i) State Government 16 4 20 184000 188596 102.5 18 492200
(ii) Public Sector Undertaking
3 1 4 60000 125583 209.3 0
(iii) Private Sector 0 0 0 0 0 0.0 0
(iv) Total 19 5 24 244000 314179 128.8 18 492200 719625
20
06
-07 (i) State Government 18 2 20 190000 211691 111.4 18 249186
(ii) Public Sector Undertaking
3 1 4 50000 99677 199.4 3
(iii) Private Sector 0.0
(iv) Total 21 3 24 240000 311368 129.7 21 249186 968811
23
Table 2.1 Continued…
1 2 3 4 5 6 7 8 9 10 11 2
01
2-1
3
(i) State Government
20 2 22 220000 278931 126.8 21 900095
(ii) Public Sector Undertaking
81 0 81 810000 607421 75.0 24
(iii) Private Sector 0 0 0 0 0 0.0 0
(iv) Total 101 2 103 103000
0 886352 86.1 26
900095
4742729
20
13
-14
(i) State Government
20 2 22 220000 203725 92.6 21 626362
(ii) Public Sector Undertaking
112 0 112 810000 560099 69.1 24
(iii) Private Sector 0 0 0 0 0 0.0 0
(iv) Total 132 2 134
1030000
763824 74.2 26 626362
5369091
CA
GR
(2
00
4-0
5 t
o
201
3-1
4)
(i) State Government
2.5 -7.4 1.1 2.0 1.1 -0.9 1.7 11.9
(ii) Public Sector Undertaking
49.5 -
100.0 44.8 36.3 16.8 -14.3
(iii) Private Sector
(iv) Total 24.0 -9.7 21.1 17.9 10.0 -6.7 4.2 11.9 42.1
Notes: *During 2010-11, other than 70 PSU, analysis work done in 55 science colleges to meet the Golden Goal 739431 samples were analysed by science colleges. Analysis work was outsourced to private agencies by State Government STLs to meet the Golden Goal and work was done in two shifts. Soil samples were analysed by Public Sector Undertakings such as APMCs, Govt. supported Corporation Labs, Govt supported Sugar cooperatives labs) and Science Colleges.
Source: Department of Agriculture, Government of Gujarat
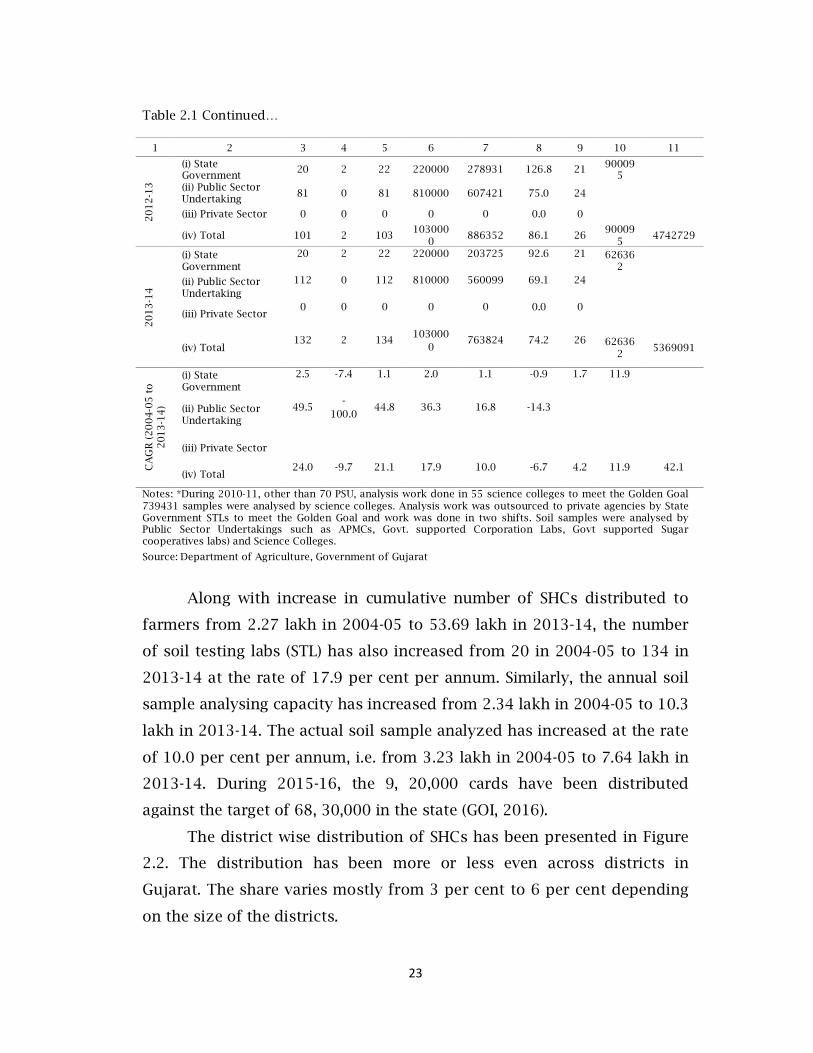
Along with increase in cumulative number of SHCs distributed to
farmers from 2.27 lakh in 2004-05 to 53.69 lakh in 2013-14, the number
of soil testing labs (STL) has also increased from 20 in 2004-05 to 134 in
2013-14 at the rate of 17.9 per cent per annum. Similarly, the annual soil
sample analysing capacity has increased from 2.34 lakh in 2004-05 to 10.3
lakh in 2013-14. The actual soil sample analyzed has increased at the rate
of 10.0 per cent per annum, i.e. from 3.23 lakh in 2004-05 to 7.64 lakh in
2013-14. During 2015-16, the 9, 20,000 cards have been distributed
against the target of 68, 30,000 in the state (GOI, 2016).
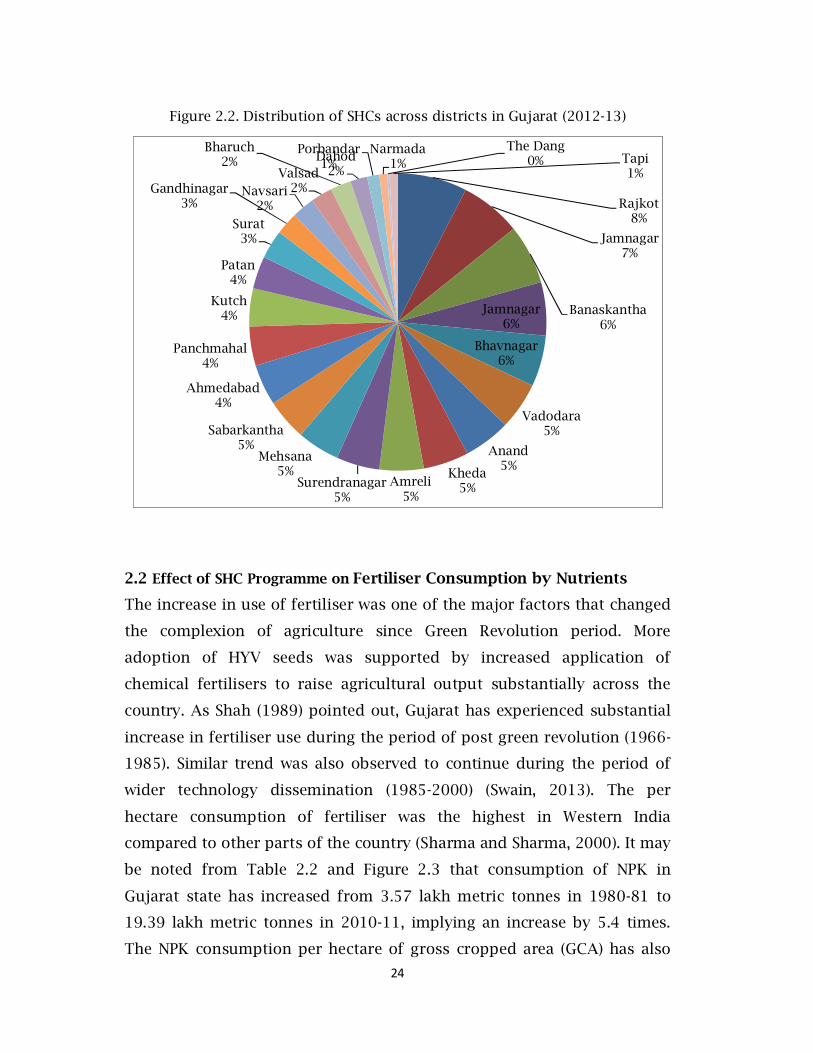
The district wise distribution of SHCs has been presented in Figure
2.2. The distribution has been more or less even across districts in
Gujarat. The share varies mostly from 3 per cent to 6 per cent depending
on the size of the districts.
24
Figure 2.2. Distribution of SHCs across districts in Gujarat (2012-13)
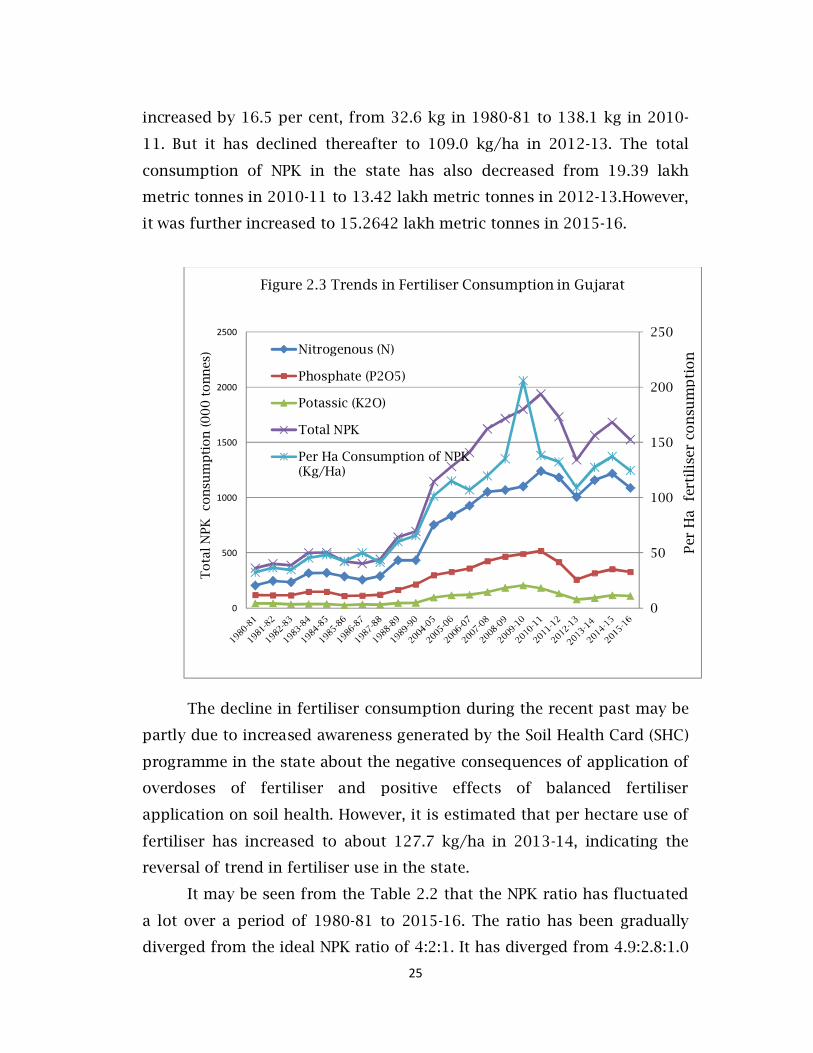
2.2 Effect of SHC Programme on Fertiliser Consumption by Nutrients
The increase in use of fertiliser was one of the major factors that changed
the complexion of agriculture since Green Revolution period. More
adoption of HYV seeds was supported by increased application of
chemical fertilisers to raise agricultural output substantially across the
country. As Shah (1989) pointed out, Gujarat has experienced substantial
increase in fertiliser use during the period of post green revolution (1966-
1985). Similar trend was also observed to continue during the period of
wider technology dissemination (1985-2000) (Swain, 2013). The per
hectare consumption of fertiliser was the highest in Western India
compared to other parts of the country (Sharma and Sharma, 2000). It may
be noted from Table 2.2 and Figure 2.3 that consumption of NPK in
Gujarat state has increased from 3.57 lakh metric tonnes in 1980-81 to
19.39 lakh metric tonnes in 2010-11, implying an increase by 5.4 times.
The NPK consumption per hectare of gross cropped area (GCA) has also
Rajkot8%
Jamnagar7%
Banaskantha6%
Jamnagar6%
Bhavnagar6%
Vadodara5%
Anand5%
Kheda5%Amreli
5%Surendranagar
5%
Mehsana5%
Sabarkantha5%
Ahmedabad4%
Panchmahal4%
Kutch4%
Patan4%
Surat3%
Gandhinagar3%
Navsari2%
Valsad2%
Bharuch2% Dahod
2%
Porbandar1%
Narmada1%
The Dang0% Tapi
1%
25
increased by 16.5 per cent, from 32.6 kg in 1980-81 to 138.1 kg in 2010-
11. But it has declined thereafter to 109.0 kg/ha in 2012-13. The total
consumption of NPK in the state has also decreased from 19.39 lakh
metric tonnes in 2010-11 to 13.42 lakh metric tonnes in 2012-13.However,
it was further increased to 15.2642 lakh metric tonnes in 2015-16.
The decline in fertiliser consumption during the recent past may be
partly due to increased awareness generated by the Soil Health Card (SHC)
programme in the state about the negative consequences of application of
overdoses of fertiliser and positive effects of balanced fertiliser
application on soil health. However, it is estimated that per hectare use of
fertiliser has increased to about 127.7 kg/ha in 2013-14, indicating the
reversal of trend in fertiliser use in the state.
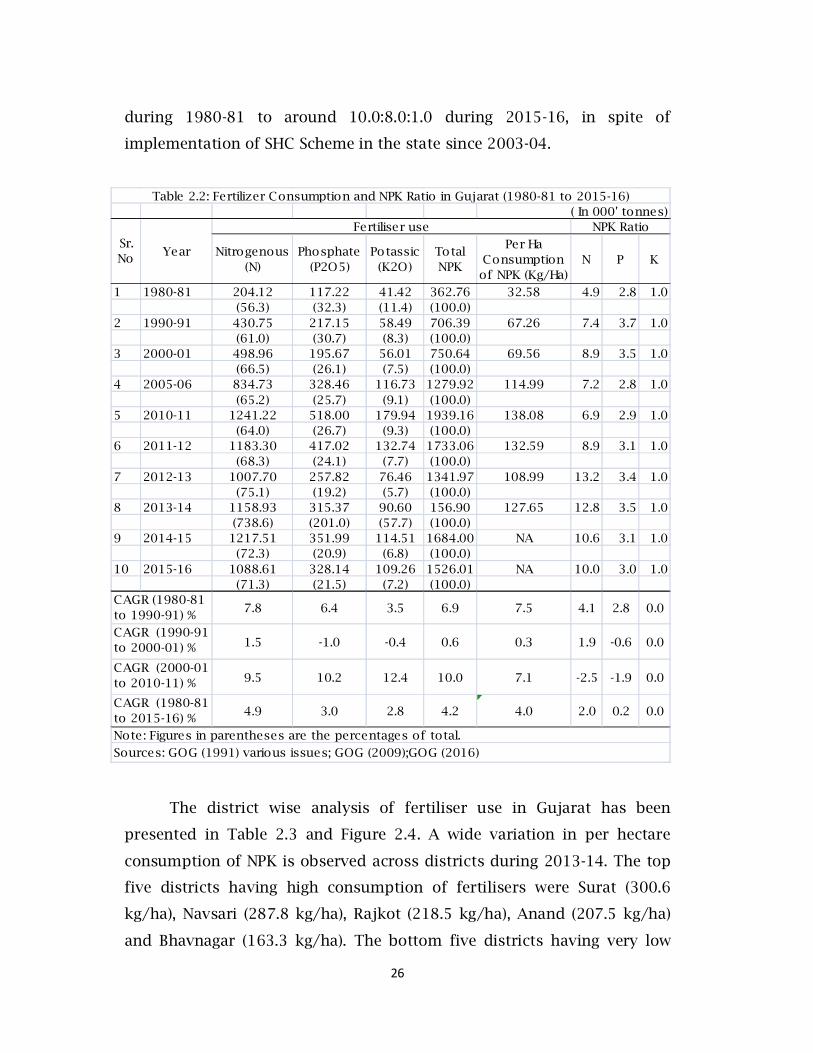
It may be seen from the Table 2.2 that the NPK ratio has fluctuated
a lot over a period of 1980-81 to 2015-16. The ratio has been gradually
diverged from the ideal NPK ratio of 4:2:1. It has diverged from 4.9:2.8:1.0
0
50
100
150
200
250
0
500
1000
1500
2000
2500
Tota
l N
PK
co
nsu
mp
tion
(00
0 t
on
nes
)
Figure 2.3 Trends in Fertiliser Consumption in Gujarat
Nitrogenous (N)
Phosphate (P2O5)
Potassic (K2O)
Total NPK
Per Ha Consumption of NPK(Kg/Ha)
Per
Ha fe
rtil
iser
co
nsu
mp
tio
n
26
during 1980-81 to around 10.0:8.0:1.0 during 2015-16, in spite of
implementation of SHC Scheme in the state since 2003-04.
( In 000' tonnes)
Nitrogenous (N)
Phosphate (P2O5)
Potassic (K2O)
Total NPK
Per Ha Consumption of NPK (Kg/Ha)
N P K
1 1980-81 204.12 117.22 41.42 362.76 32.58 4.9 2.8 1.0(56.3) (32.3) (11.4) (100.0)
2 1990-91 430.75 217.15 58.49 706.39 67.26 7.4 3.7 1.0(61.0) (30.7) (8.3) (100.0)
3 2000-01 498.96 195.67 56.01 750.64 69.56 8.9 3.5 1.0(66.5) (26.1) (7.5) (100.0)
4 2005-06 834.73 328.46 116.73 1279.92 114.99 7.2 2.8 1.0(65.2) (25.7) (9.1) (100.0)
5 2010-11 1241.22 518.00 179.94 1939.16 138.08 6.9 2.9 1.0(64.0) (26.7) (9.3) (100.0)
6 2011-12 1183.30 417.02 132.74 1733.06 132.59 8.9 3.1 1.0(68.3) (24.1) (7.7) (100.0)
7 2012-13 1007.70 257.82 76.46 1341.97 108.99 13.2 3.4 1.0(75.1) (19.2) (5.7) (100.0)
8 2013-14 1158.93 315.37 90.60 156.90 127.65 12.8 3.5 1.0(738.6) (201.0) (57.7) (100.0)
9 2014-15 1217.51 351.99 114.51 1684.00 NA 10.6 3.1 1.0(72.3) (20.9) (6.8) (100.0)
10 2015-16 1088.61 328.14 109.26 1526.01 NA 10.0 3.0 1.0(71.3) (21.5) (7.2) (100.0)
7.8 6.4 3.5 6.9 7.5 4.1 2.8 0.0
1.5 -1.0 -0.4 0.6 0.3 1.9 -0.6 0.0
9.5 10.2 12.4 10.0 7.1 -2.5 -1.9 0.0
4.9 3.0 2.8 4.2 4.0 2.0 0.2 0.0
Sources: GOG (1991) various issues; GOG (2009);GOG (2016)
Table 2.2: Fertilizer Consumption and NPK Ratio in Gujarat (1980-81 to 2015-16)
Sr. No
Year
Fertiliser use NPK Ratio
CAGR (1980-81 to 1990-91) %
CAGR (1990-91 to 2000-01) %
CAGR (2000-01 to 2010-11) %
CAGR (1980-81 to 2015-16) %
Note: Figures in parentheses are the percentages of total.
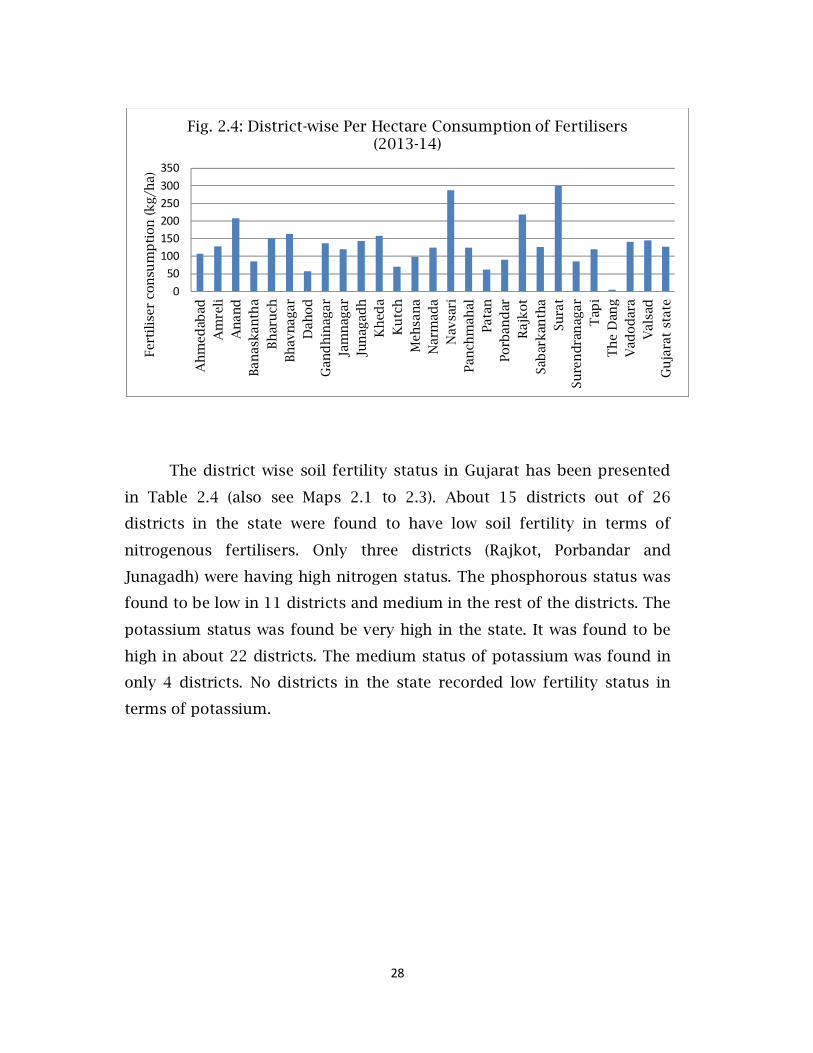
The district wise analysis of fertiliser use in Gujarat has been
presented in Table 2.3 and Figure 2.4. A wide variation in per hectare
consumption of NPK is observed across districts during 2013-14. The top
five districts having high consumption of fertilisers were Surat (300.6
kg/ha), Navsari (287.8 kg/ha), Rajkot (218.5 kg/ha), Anand (207.5 kg/ha)
and Bhavnagar (163.3 kg/ha). The bottom five districts having very low
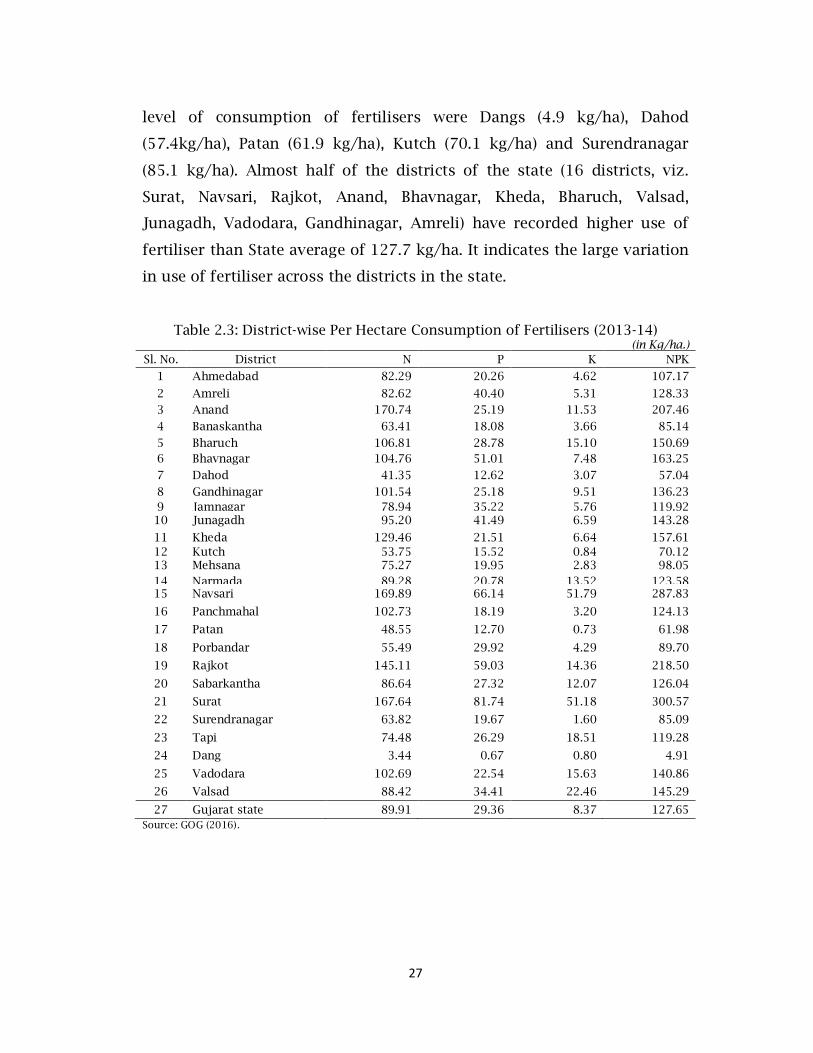
27
level of consumption of fertilisers were Dangs (4.9 kg/ha), Dahod
(57.4kg/ha), Patan (61.9 kg/ha), Kutch (70.1 kg/ha) and Surendranagar
(85.1 kg/ha). Almost half of the districts of the state (16 districts, viz.
Surat, Navsari, Rajkot, Anand, Bhavnagar, Kheda, Bharuch, Valsad,
Junagadh, Vadodara, Gandhinagar, Amreli) have recorded higher use of
fertiliser than State average of 127.7 kg/ha. It indicates the large variation
in use of fertiliser across the districts in the state.
Table 2.3: District-wise Per Hectare Consumption of Fertilisers (2013-14) (in Kg/ha.) Sl. No. District N P K NPK
1 Ahmedabad 82.29 20.26 4.62 107.17
2 Amreli 82.62 40.40 5.31 128.33
3 Anand 170.74 25.19 11.53 207.46
4 Banaskantha 63.41 18.08 3.66 85.14
5 Bharuch 106.81 28.78 15.10 150.69 6 Bhavnagar 104.76 51.01 7.48 163.25
7 Dahod 41.35 12.62 3.07 57.04
8 Gandhinagar 101.54 25.18 9.51 136.23 9 Jamnagar 78.94 35.22 5.76 119.92 10 Junagadh 95.20 41.49 6.59 143.28
11 Kheda 129.46 21.51 6.64 157.61 12 Kutch 53.75 15.52 0.84 70.12 13 Mehsana 75.27 19.95 2.83 98.05 14 Narmada 89.28 20.78 13.52 123.58 15 Navsari 169.89 66.14 51.79 287.83
16 Panchmahal 102.73 18.19 3.20 124.13
17 Patan 48.55 12.70 0.73 61.98
18 Porbandar 55.49 29.92 4.29 89.70
19 Rajkot 145.11 59.03 14.36 218.50
20 Sabarkantha 86.64 27.32 12.07 126.04
21 Surat 167.64 81.74 51.18 300.57
22 Surendranagar 63.82 19.67 1.60 85.09
23 Tapi 74.48 26.29 18.51 119.28
24 Dang 3.44 0.67 0.80 4.91
25 Vadodara 102.69 22.54 15.63 140.86
26 Valsad 88.42 34.41 22.46 145.29
27 Gujarat state 89.91 29.36 8.37 127.65 Source: GOG (2016).
28
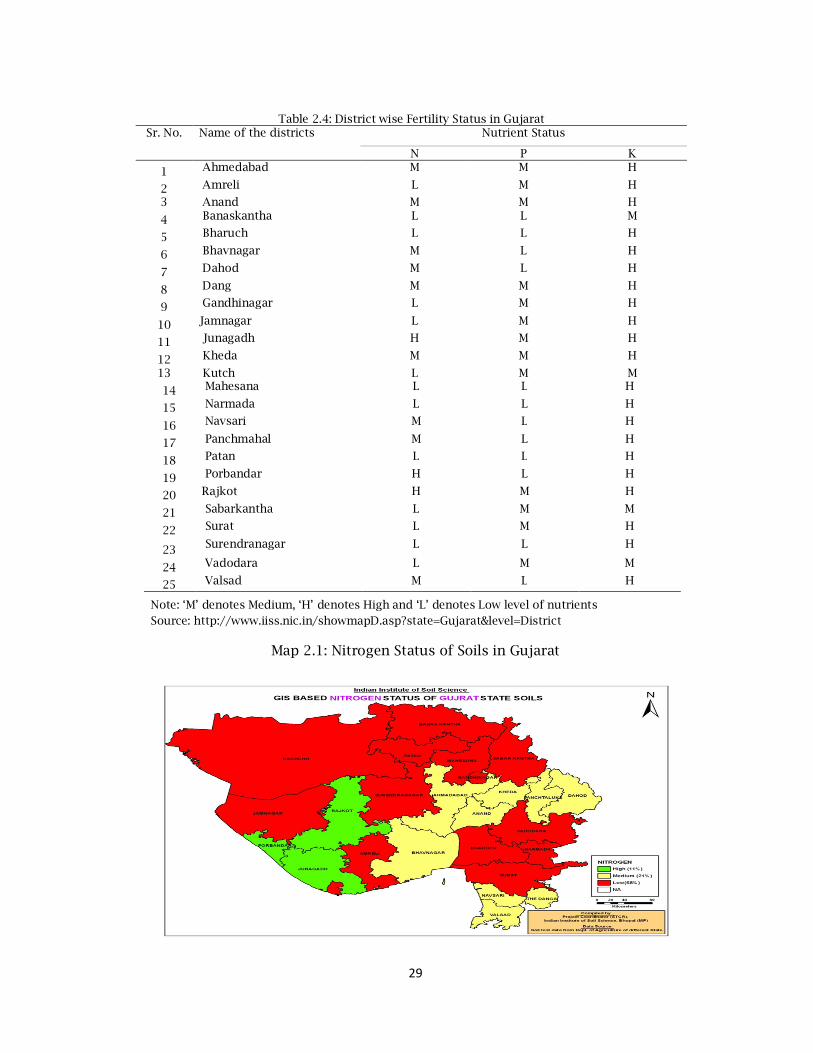
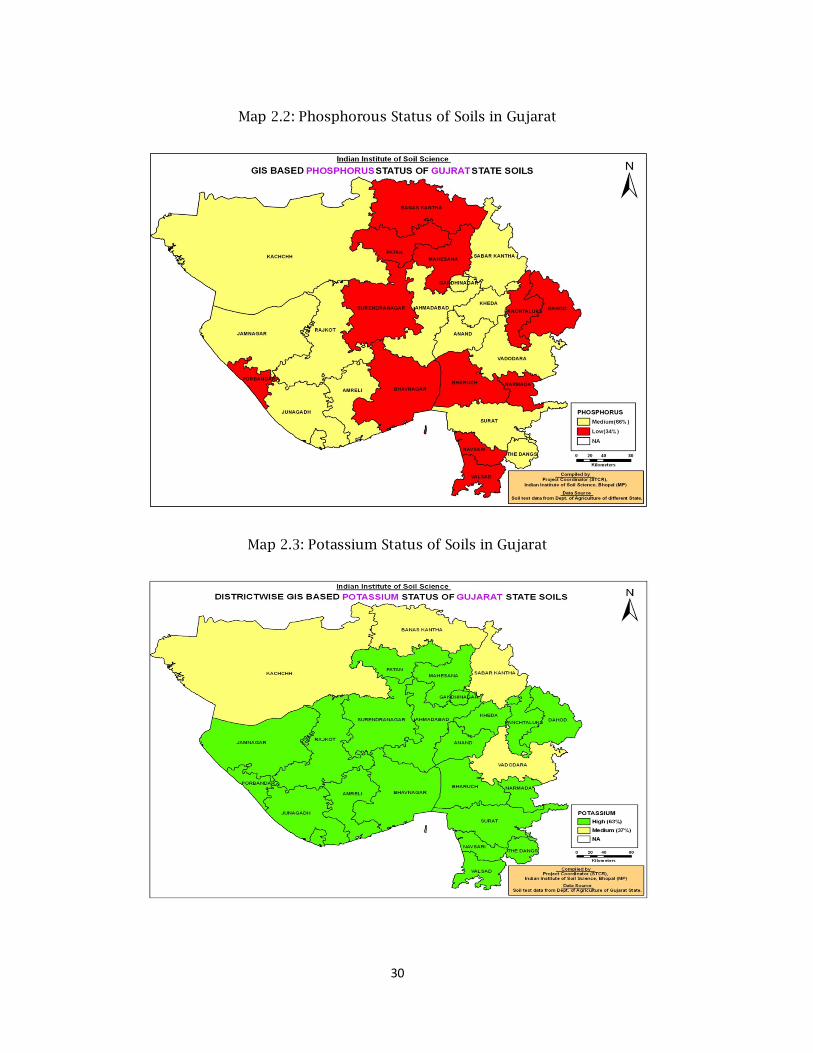
The district wise soil fertility status in Gujarat has been presented
in Table 2.4 (also see Maps 2.1 to 2.3). About 15 districts out of 26
districts in the state were found to have low soil fertility in terms of
nitrogenous fertilisers. Only three districts (Rajkot, Porbandar and
Junagadh) were having high nitrogen status. The phosphorous status was
found to be low in 11 districts and medium in the rest of the districts. The
potassium status was found be very high in the state. It was found to be
high in about 22 districts. The medium status of potassium was found in
only 4 districts. No districts in the state recorded low fertility status in
terms of potassium.
050
100150200250300350
Ah
med
abad
Am
reli
An
and
Ban
askan
tha
Bh
aru
chBh
avn
agar
Dah
od
Gan
dh
inag
arJa
mn
agar
Jun
agad
hK
hed
a
Ku
tch
Meh
san
aN
arm
ada
Nav
sari
Pan
chm
ahal
Pata
nPo
rban
dar
Raj
kot
Sab
arkan
tha
Sura
tSu
ren
dra
nag
arT
api
Th
e D
ang
Vad
od
ara
Val
sad
Gu
jara
t st
ate
Fert
ilis
er c
on
sum
pti
on
(kg/
ha)
Fig. 2.4: District-wise Per Hectare Consumption of Fertilisers (2013-14)
29
Table 2.4: District wise Fertility Status in Gujarat Sr. No. Name of the districts Nutrient Status
N P K
1 Ahmedabad M M H
2 Amreli L M H
3 Anand M M H
4 Banaskantha L L M
5 Bharuch L L H
6 Bhavnagar M L H
7 Dahod M L H
8 Dang M M H
9 Gandhinagar L M H
10 Jamnagar L M H
11 Junagadh H M H
12 Kheda M M H
13 Kutch L M M
14 Mahesana L L H
15 Narmada L L H
16 Navsari M L H
17 Panchmahal M L H
18 Patan L L H
19 Porbandar H L H
20 Rajkot H M H
21 Sabarkantha L M M
22 Surat L M H
23 Surendranagar L L H
24 Vadodara L M M
25 Valsad M L H
Note: ‘M’ denotes Medium, ‘H’ denotes High and ‘L’ denotes Low level of nutrients Source: http://www.iiss.nic.in/showmapD.asp?state=Gujarat&level=District
Map 2.1: Nitrogen Status of Soils in Gujarat
30
Map 2.2: Phosphorous Status of Soils in Gujarat
Map 2.3: Potassium Status of Soils in Gujarat
31
Chapter III
Socio-Economic Characteristics of Sample Households
3.1 Introduction
The primary level data pertaining to selected farmers, their classification
as per the land holdings and their other socio-economic characteristics
have been discussed in this Chapter. The household level analysis was
conducted following a cluster approach on a sample of 240 control
farmers (non-soil test) and 480 soil test farmers for assessing the extent
of adoption and use of SHCs, adoption of recommended doses of
fertilisers and their impacts on crop production and productivity.
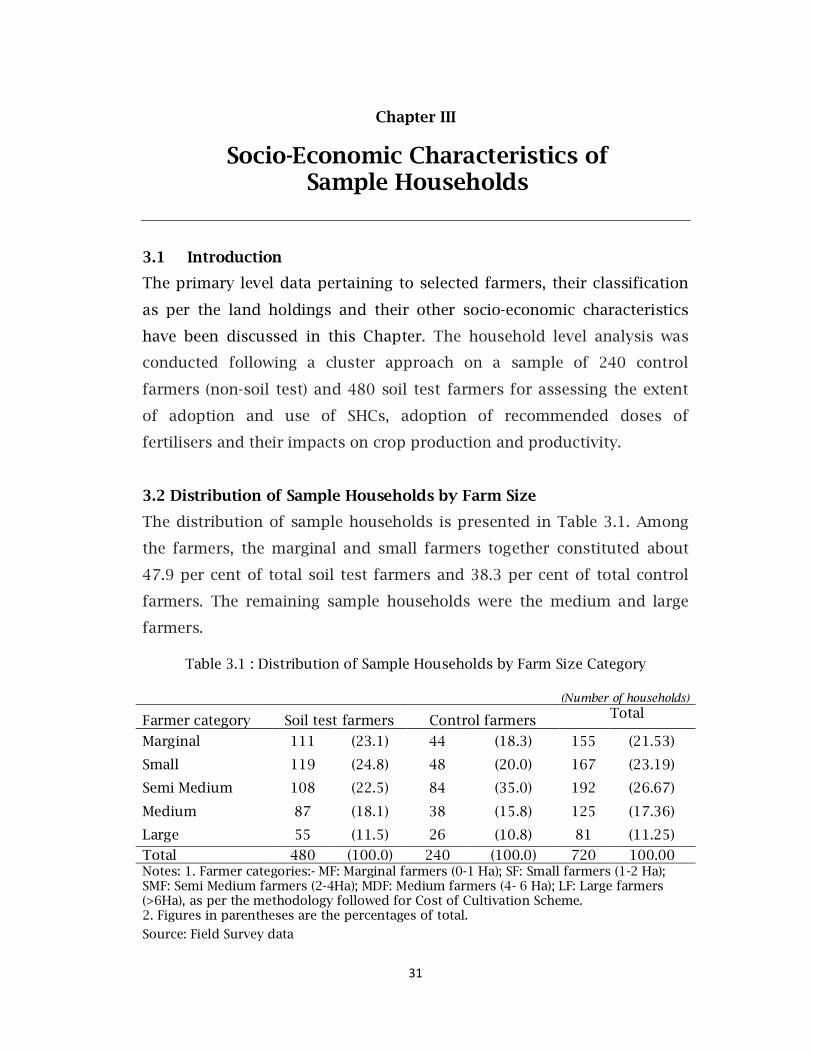
3.2 Distribution of Sample Households by Farm Size
The distribution of sample households is presented in Table 3.1. Among
the farmers, the marginal and small farmers together constituted about
47.9 per cent of total soil test farmers and 38.3 per cent of total control
farmers. The remaining sample households were the medium and large
farmers.
Table 3.1 : Distribution of Sample Households by Farm Size Category
(Number of households)
Farmer category Soil test farmers Control farmers Total
Marginal 111 (23.1) 44 (18.3) 155 (21.53)
Small 119 (24.8) 48 (20.0) 167 (23.19)
Semi Medium 108 (22.5) 84 (35.0) 192 (26.67)
Medium 87 (18.1) 38 (15.8) 125 (17.36)
Large 55 (11.5) 26 (10.8) 81 (11.25)
Total 480 (100.0) 240 (100.0) 720 100.00 Notes: 1. Farmer categories:- MF: Marginal farmers (0-1 Ha); SF: Small farmers (1-2 Ha); SMF: Semi Medium farmers (2-4Ha); MDF: Medium farmers (4- 6 Ha); LF: Large farmers (>6Ha), as per the methodology followed for Cost of Cultivation Scheme. 2. Figures in parentheses are the percentages of total.
Source: Field Survey data
32
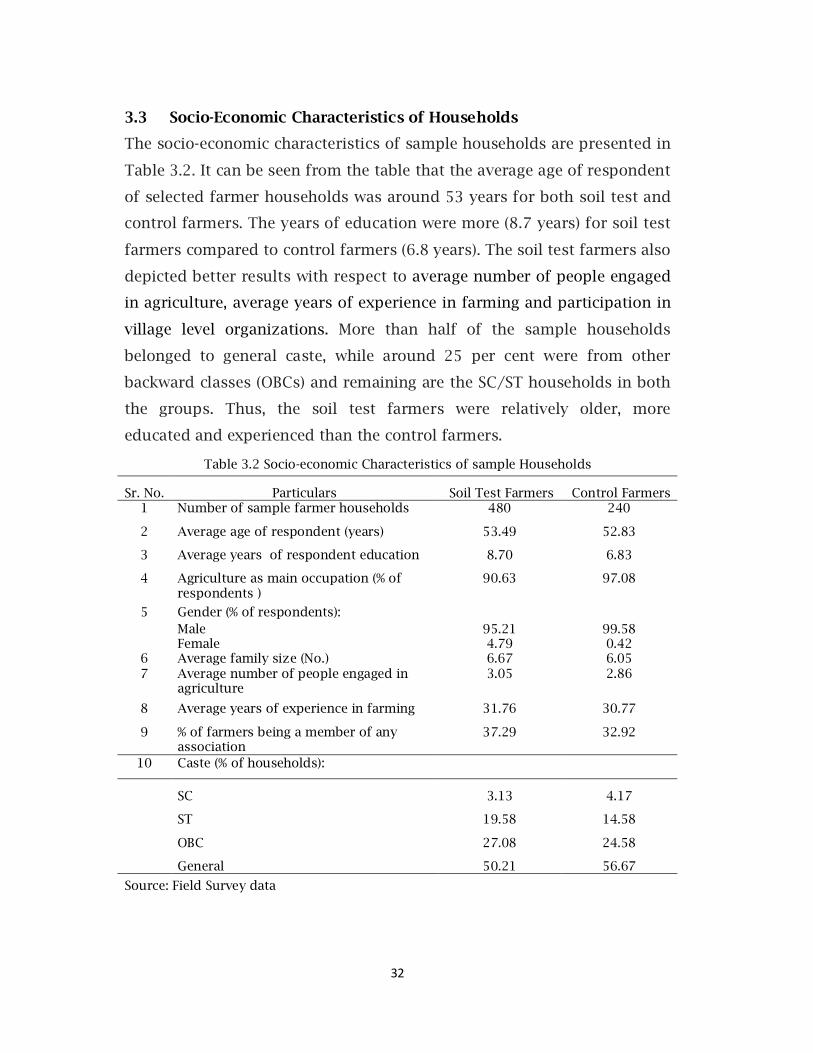
3.3 Socio-Economic Characteristics of Households
The socio-economic characteristics of sample households are presented in
Table 3.2. It can be seen from the table that the average age of respondent
of selected farmer households was around 53 years for both soil test and
control farmers. The years of education were more (8.7 years) for soil test
farmers compared to control farmers (6.8 years). The soil test farmers also
depicted better results with respect to average number of people engaged
in agriculture, average years of experience in farming and participation in
village level organizations. More than half of the sample households
belonged to general caste, while around 25 per cent were from other
backward classes (OBCs) and remaining are the SC/ST households in both
the groups. Thus, the soil test farmers were relatively older, more
educated and experienced than the control farmers.
Table 3.2 Socio-economic Characteristics of sample Households
Sr. No. Particulars Soil Test Farmers Control Farmers 1 Number of sample farmer households 480 240
2 Average age of respondent (years) 53.49 52.83
3 Average years of respondent education 8.70 6.83
4 Agriculture as main occupation (% of respondents )
90.63 97.08
5 Gender (% of respondents): Male 95.21 99.58 Female 4.79 0.42
6 Average family size (No.) 6.67 6.05 7 Average number of people engaged in
agriculture 3.05 2.86
8 Average years of experience in farming 31.76 30.77
9 % of farmers being a member of any association
37.29 32.92
10 Caste (% of households):
SC 3.13 4.17
ST 19.58 14.58
OBC 27.08 24.58
General 50.21 56.67
Source: Field Survey data
33
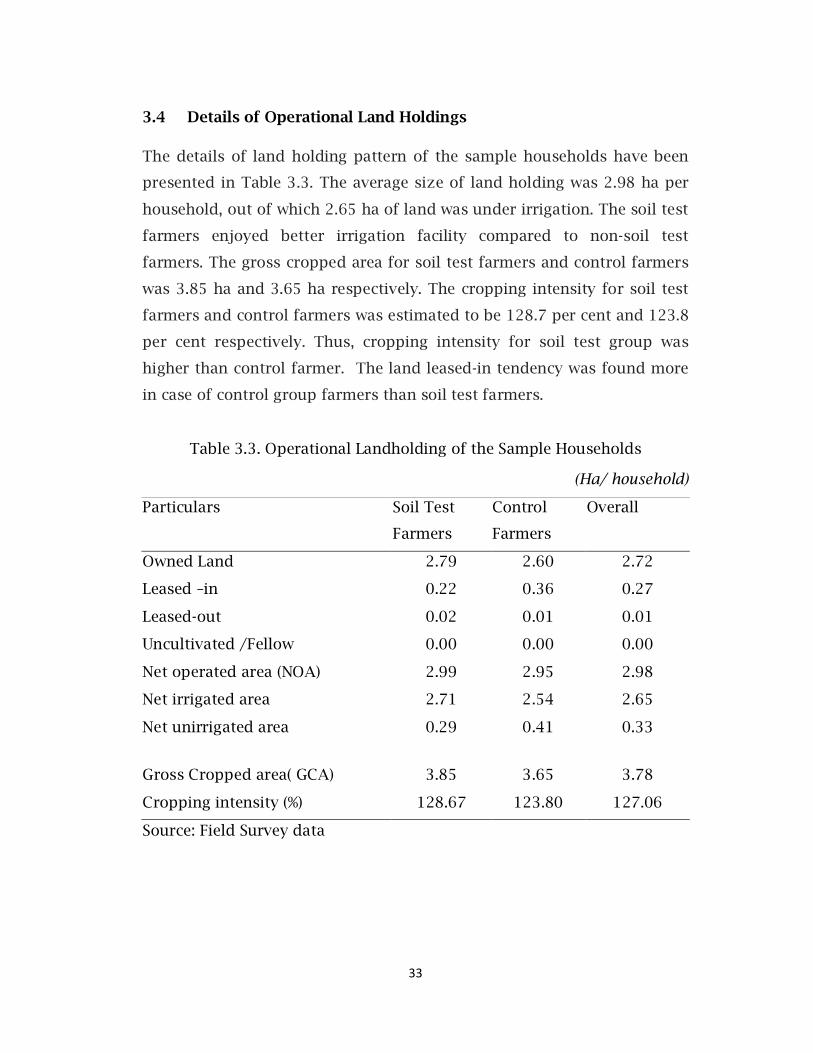
3.4 Details of Operational Land Holdings
The details of land holding pattern of the sample households have been
presented in Table 3.3. The average size of land holding was 2.98 ha per
household, out of which 2.65 ha of land was under irrigation. The soil test
farmers enjoyed better irrigation facility compared to non-soil test
farmers. The gross cropped area for soil test farmers and control farmers
was 3.85 ha and 3.65 ha respectively. The cropping intensity for soil test
farmers and control farmers was estimated to be 128.7 per cent and 123.8
per cent respectively. Thus, cropping intensity for soil test group was
higher than control farmer. The land leased-in tendency was found more
in case of control group farmers than soil test farmers.
Table 3.3. Operational Landholding of the Sample Households
(Ha/ household)
Particulars Soil Test
Farmers
Control
Farmers
Overall
Owned Land 2.79 2.60 2.72
Leased –in 0.22 0.36 0.27
Leased-out 0.02 0.01 0.01
Uncultivated /Fellow 0.00 0.00 0.00
Net operated area (NOA) 2.99 2.95 2.98
Net irrigated area 2.71 2.54 2.65
Net unirrigated area 0.29 0.41 0.33
Gross Cropped area( GCA) 3.85 3.65 3.78
Cropping intensity (%) 128.67 123.80 127.06
Source: Field Survey data
34
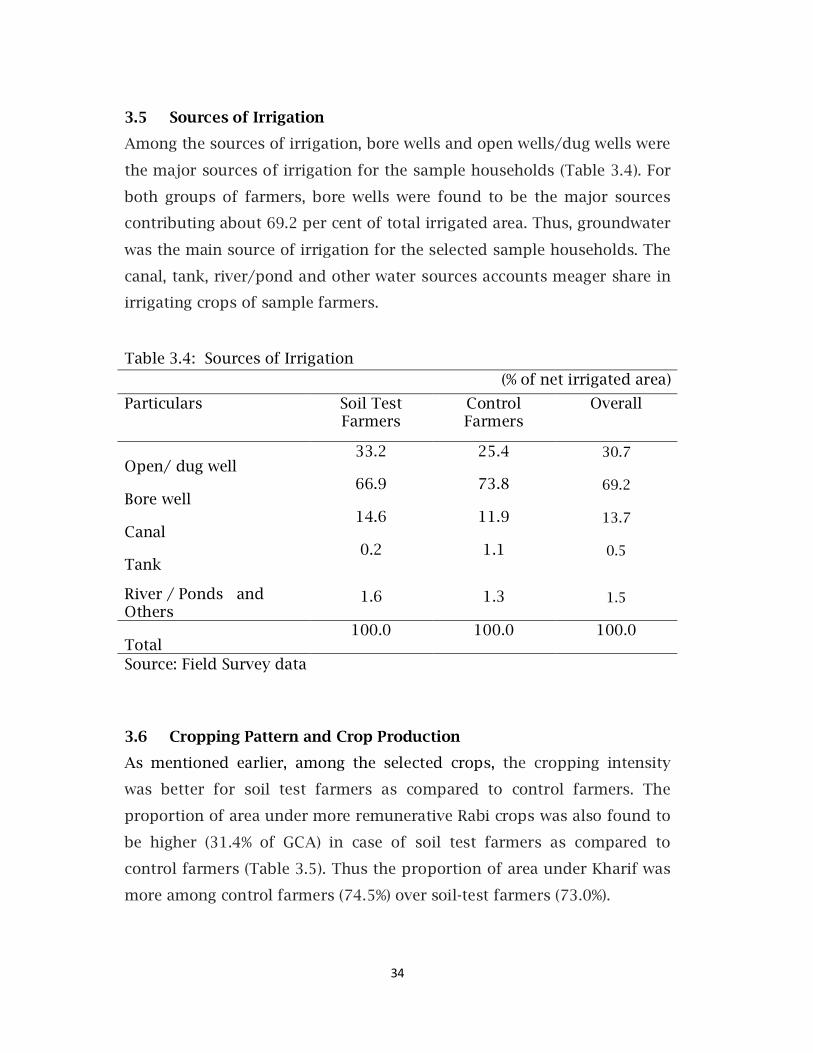
3.5 Sources of Irrigation
Among the sources of irrigation, bore wells and open wells/dug wells were
the major sources of irrigation for the sample households (Table 3.4). For
both groups of farmers, bore wells were found to be the major sources
contributing about 69.2 per cent of total irrigated area. Thus, groundwater
was the main source of irrigation for the selected sample households. The
canal, tank, river/pond and other water sources accounts meager share in
irrigating crops of sample farmers.
Table 3.4: Sources of Irrigation (% of net irrigated area)
Particulars Soil Test Farmers
Control Farmers
Overall
Open/ dug well 33.2 25.4 30.7
Bore well 66.9 73.8 69.2
Canal 14.6 11.9 13.7
Tank 0.2 1.1 0.5
River / Ponds and Others
1.6 1.3 1.5
Total 100.0 100.0 100.0
Source: Field Survey data
3.6 Cropping Pattern and Crop Production
As mentioned earlier, among the selected crops, the cropping intensity
was better for soil test farmers as compared to control farmers. The
proportion of area under more remunerative Rabi crops was also found to
be higher (31.4% of GCA) in case of soil test farmers as compared to
control farmers (Table 3.5). Thus the proportion of area under Kharif was
more among control farmers (74.5%) over soil-test farmers (73.0%).
35
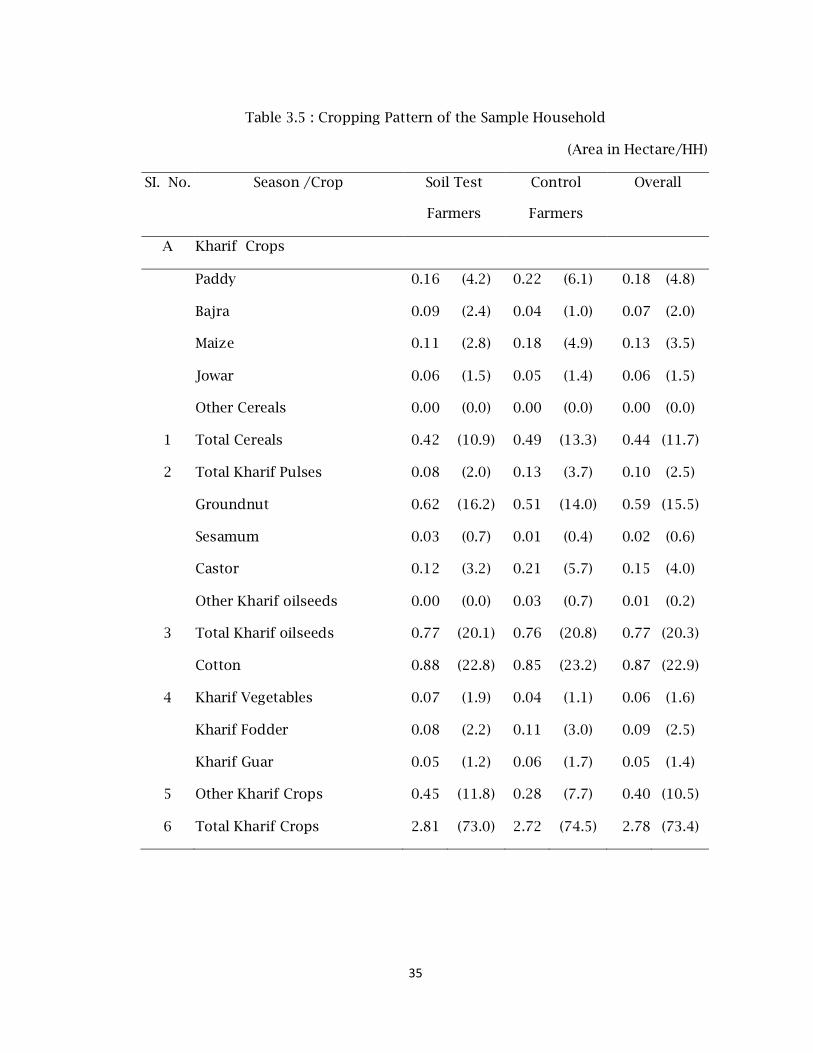
Table 3.5 : Cropping Pattern of the Sample Household
(Area in Hectare/HH)
SI. No. Season /Crop Soil Test
Farmers
Control
Farmers
Overall
A Kharif Crops
Paddy 0.16 (4.2) 0.22 (6.1) 0.18 (4.8)
Bajra 0.09 (2.4) 0.04 (1.0) 0.07 (2.0)
Maize 0.11 (2.8) 0.18 (4.9) 0.13 (3.5)
Jowar 0.06 (1.5) 0.05 (1.4) 0.06 (1.5)
Other Cereals 0.00 (0.0) 0.00 (0.0) 0.00 (0.0)
1 Total Cereals 0.42 (10.9) 0.49 (13.3) 0.44 (11.7)
2 Total Kharif Pulses 0.08 (2.0) 0.13 (3.7) 0.10 (2.5)
Groundnut 0.62 (16.2) 0.51 (14.0) 0.59 (15.5)
Sesamum 0.03 (0.7) 0.01 (0.4) 0.02 (0.6)
Castor 0.12 (3.2) 0.21 (5.7) 0.15 (4.0)
Other Kharif oilseeds 0.00 (0.0) 0.03 (0.7) 0.01 (0.2)
3 Total Kharif oilseeds 0.77 (20.1) 0.76 (20.8) 0.77 (20.3)
Cotton 0.88 (22.8) 0.85 (23.2) 0.87 (22.9)
4 Kharif Vegetables 0.07 (1.9) 0.04 (1.1) 0.06 (1.6)
Kharif Fodder 0.08 (2.2) 0.11 (3.0) 0.09 (2.5)
Kharif Guar 0.05 (1.2) 0.06 (1.7) 0.05 (1.4)
5 Other Kharif Crops 0.45 (11.8) 0.28 (7.7) 0.40 (10.5)
6 Total Kharif Crops 2.81 (73.0) 2.72 (74.5) 2.78 (73.4)
36
Table 3.5 continued….
SI. No. Season /Crop Soil Test Farmers
Control Farmers
Overall
B Rabi Crops Wheat 0.29 (7.6) 0.23 (6.4) 0.27 (7.2)
Maize 0.06 (1.6) 0.06 (1.7) 0.06 (1.7)
Jowar 0.01 (0.3) 0.01 (0.3) 0.01 (0.3)
7 Total Rabi Cereals 0.37 (9.5) 0.31 (8.4) 0.35 (9.2)
Gram 0.03 (0.8) 0.03 (0.8) 0.03 (0.8)
8 Total Rabi Pulses 0.03 (0.8) 0.03 (0.8) 0.03 (0.8)
9 Total Rabi Oilseeds 0.00 (0.1) 0.01 (0.3) 0.01 (0.2)
Cumin 0.03 (0.7) 0.01 (0.4) 0.02 (0.6)
Other spices 0.13 (3.3) 0.14 (3.8) 0.13 (3.5)
10 Total Spices 0.16 (4.0) 0.15 (4.1) 0.15 (4.1)
11 Total Vegetable 0.14 (3.6) 0.08 (2.1) 0.12 (3.1)
12 Fodder 0.02 (0.4) 0.00 (0.0) 0.01 (0.3)
Other Rabi Crops 0.11 (2.9) 0.09 (2.5) 0.10 (2.8)
13 Total Rabi Crops 0.82 (21.3) 0.67 (18.3) 0.77 (20.3)
C Summer Crops
Bajra 0.09 (2.4) 0.08 (2.2) 0.09 (2.3)
Other Summer crops 0.02 (0.5) 0.12 (3.3) 0.05 (1.4)
14 Total Summer Cereals 0.11 (2.9) 0.20 (5.5) 0.14 (3.7)
Groundnut 0.00 (0.1) 0.02 (0.4) 0.01 (0.2)
15 Total Oilseeds 0.00 (0.1) 0.03 (0.8) 0.01 (0.3)
Total Vegetable 0.02 (0.5) 0.01 (0.2) 0.02 (0.4)
Other summer crops 0.09 (2.3) 0.03 (0.8) 0.07 (1.8)
16 Total summer Crops 0.22 (5.8) 0.27 (7.3) 0.24 (6.2)
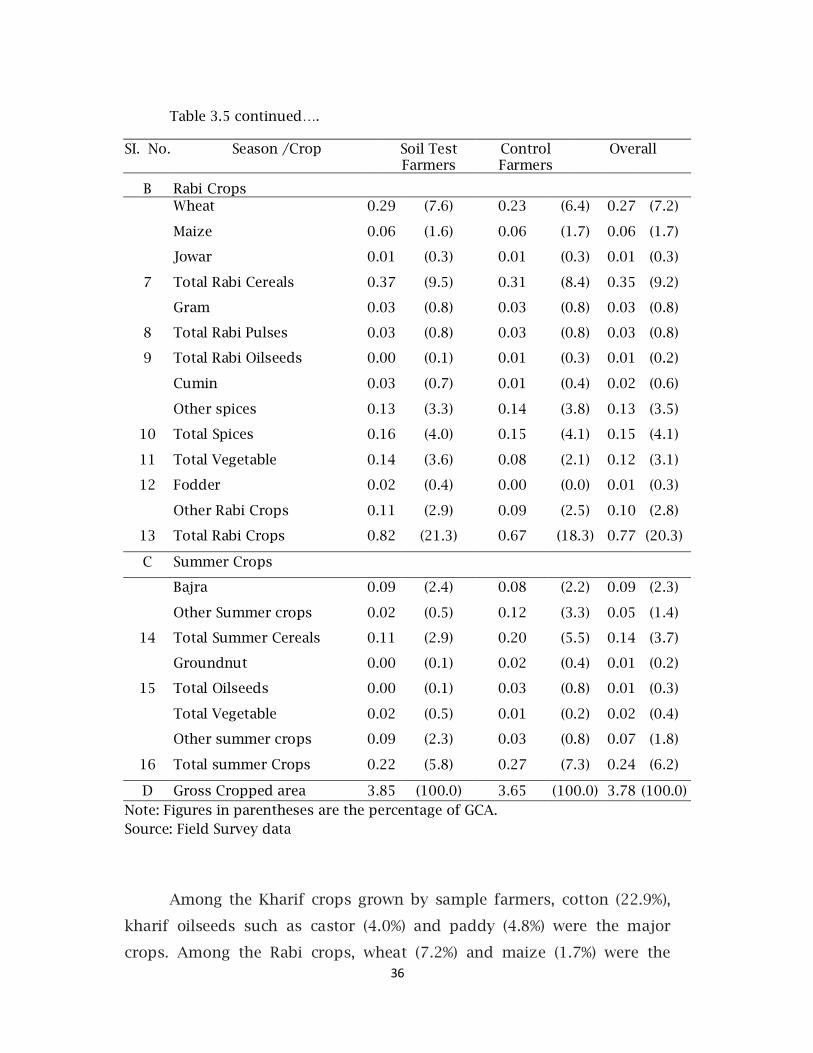
D Gross Cropped area 3.85 (100.0) 3.65 (100.0) 3.78 (100.0) Note: Figures in parentheses are the percentage of GCA. Source: Field Survey data
Among the Kharif crops grown by sample farmers, cotton (22.9%),
kharif oilseeds such as castor (4.0%) and paddy (4.8%) were the major
crops. Among the Rabi crops, wheat (7.2%) and maize (1.7%) were the
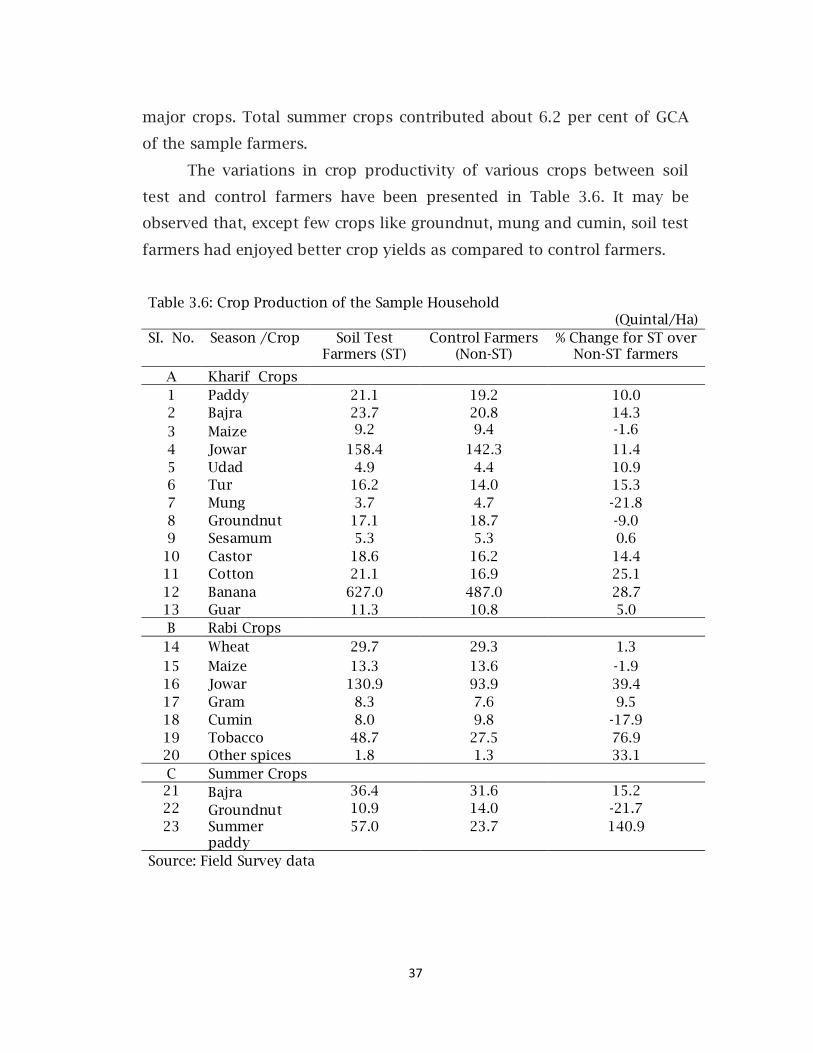
37
major crops. Total summer crops contributed about 6.2 per cent of GCA
of the sample farmers.
The variations in crop productivity of various crops between soil
test and control farmers have been presented in Table 3.6. It may be
observed that, except few crops like groundnut, mung and cumin, soil test
farmers had enjoyed better crop yields as compared to control farmers.
Table 3.6: Crop Production of the Sample Household (Quintal/Ha)
SI. No. Season /Crop Soil Test Farmers (ST)
Control Farmers (Non-ST)
% Change for ST over Non-ST farmers
A Kharif Crops 1 Paddy 21.1 19.2 10.0 2 Bajra 23.7 20.8 14.3 3 Maize 9.2 9.4 -1.6
4 Jowar 158.4 142.3 11.4 5 Udad 4.9 4.4 10.9 6 Tur 16.2 14.0 15.3 7 Mung 3.7 4.7 -21.8 8 Groundnut 17.1 18.7 -9.0 9 Sesamum 5.3 5.3 0.6
10 Castor 18.6 16.2 14.4 11 Cotton 21.1 16.9 25.1 12 Banana 627.0 487.0 28.7 13 Guar 11.3 10.8 5.0 B Rabi Crops
14 Wheat 29.7 29.3 1.3 15 Maize 13.3 13.6 -1.9 16 Jowar 130.9 93.9 39.4 17 Gram 8.3 7.6 9.5 18 Cumin 8.0 9.8 -17.9 19 Tobacco 48.7 27.5 76.9 20 Other spices 1.8 1.3 33.1 C Summer Crops 21 Bajra 36.4 31.6 15.2 22 Groundnut 10.9 14.0 -21.7 23 Summer
paddy 57.0 23.7 140.9
Source: Field Survey data
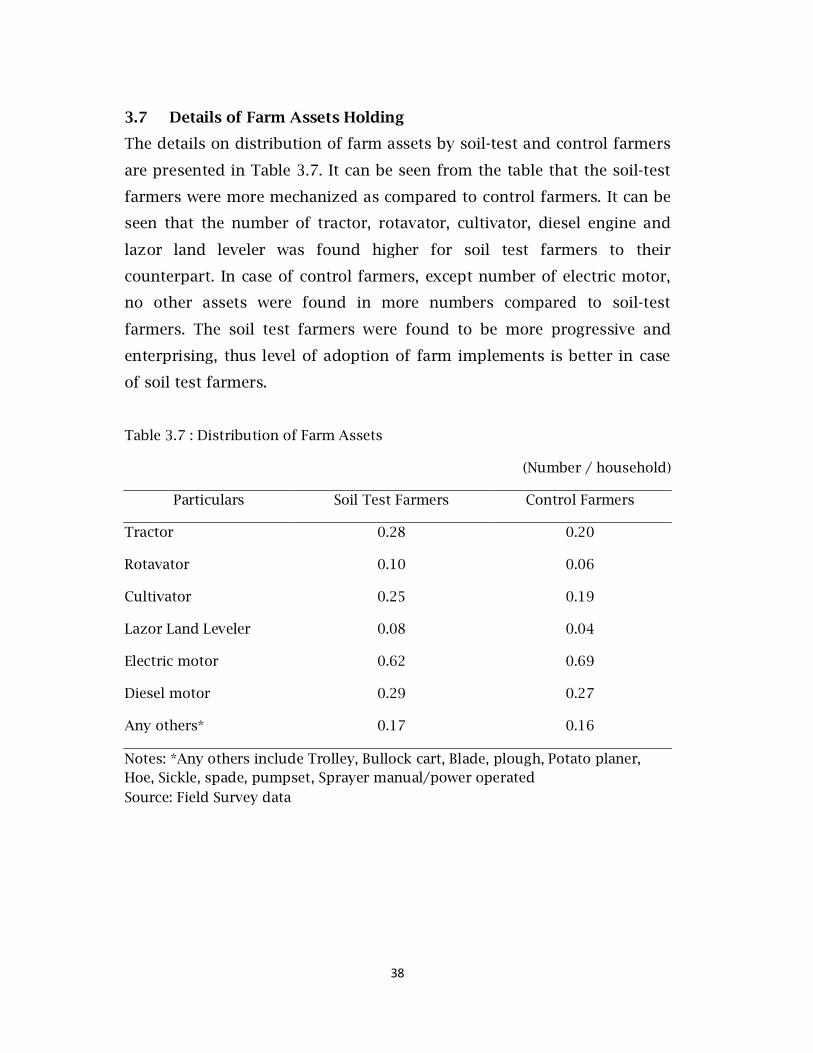
38
3.7 Details of Farm Assets Holding
The details on distribution of farm assets by soil-test and control farmers
are presented in Table 3.7. It can be seen from the table that the soil-test
farmers were more mechanized as compared to control farmers. It can be
seen that the number of tractor, rotavator, cultivator, diesel engine and
lazor land leveler was found higher for soil test farmers to their
counterpart. In case of control farmers, except number of electric motor,
no other assets were found in more numbers compared to soil-test
farmers. The soil test farmers were found to be more progressive and
enterprising, thus level of adoption of farm implements is better in case
of soil test farmers.
Table 3.7 : Distribution of Farm Assets
(Number / household)
Particulars Soil Test Farmers Control Farmers
Tractor 0.28 0.20
Rotavator 0.10 0.06
Cultivator 0.25 0.19
Lazor Land Leveler 0.08 0.04
Electric motor 0.62 0.69
Diesel motor 0.29 0.27
Any others* 0.17 0.16
Notes: *Any others include Trolley, Bullock cart, Blade, plough, Potato planer, Hoe, Sickle, spade, pumpset, Sprayer manual/power operated
Source: Field Survey data
39
Chapter IV
Performance of Soil Health Card Programme at
Micro Level
4.1 Background
As mentioned earlier, Soil Health Cards are being provided to all farmers
in the country at an interval of 3 years so as to enable the farmers to
apply appropriate recommended doses of nutrients to realize improved
and sustainable soil health and fertility status and also higher per unit
yields. As part of this massive programme, soil samples testing and
distribution of SHC to farmers are carried out on a regular basis as per the
norms. The success of these services depends on how scientifically the
soil samples have been collected. Several factors such as technical
expertise of the people engaged in collecting and testing soil samples,
instruments used, depth of the soil collected and number of spots for soil
collection are important for the efficiency of this service. Apart from
scientific soil testing, optimum fertilizer application depends upon several
other factors as follows: whether the reports of soil sample reach the
farmers? If they reach to farmers, whether the farmers understand them?
Again, whether farmers adopt the fertilizer recommendations fully or not?
The Soil Health Cards (SHC) Programme in Gujarat was aimed at
providing the soil testing facilities to the farmers in the most convenient
way. The ultimate objective was to increase the level of adoption of
recommended doses of fertiliser by the sample farmers that would
eventually lead to reduction in imbalances in fertilizer application. The
programme facilitates the collection of soil samples from the farmers’
field1 and test the soil health in the nearest soil test laboratories (STLs).
1 The soil sample collection activity was out sourced by hiring farmers’ friends (Gram Mitras) hired under ATMA Programme, who collect the soil sample at the rate of Rs 15 per sample which includes collection charges, primary requirement like Sample bag, woven bag, Forms, Marker pens as well as transportation charges of samples. Village level workers (VLWs) supervise the work at village level and District Agriculture Officer and District Panchayat supervise the work at district
40
Different institutions such as Agriculture Department of the State
government, Public Sector Undertakings (such as Government supported
APMCs, Govt. corporation managed Soil Testing Labs, Government
supported Sugar cooperatives labs) and Science Colleges were involved in
testing the soil samples and generating the soil health cards. The tests on
major nutrients like N, P, K, Ph etc were done at all 101 STLs. However, the
tests on micronutrients were done at only at designated 50 STLs and
Agricultural Universities in the state. Some of the Science Colleges were
also given the responsibility of soil testing through their students. The
test results were used for generating SHCs at respective STLs and the
SHCs were then handed over to District Agriculture Officers for
distribution of the same among farmers within a stipulated time period.
Anand Agricultural University, Anand was given the responsibility for
uploading all these SHCs in its website through e-Krishi Kiran Programme.
Thus, the results of soil test were digitized, uploaded on the website and
same were communicated to farmers in the form of Soil Health Cards
(SHC) for easy access by the farmers.
4.2 Details of Soil Testing
As discussed in earlier chapters, soil testing was carried out for 480
farmers as presented in Table 1.1 and Table 3.1. The details on the soil
testing and related parameters based on SHC-GOG are presented in Table
4.1. The cost of soil test was nil for all soil test farmers since it was
provided free of cost by the Government. Some of the progressive farmers
were also provided the detailed soil test analysis by the cooperatives
through private soil testing labs. The cost of soil test through private soil
testing labs varied from Rs 50 to Rs 273 per sample depending on nature
of soil tests undertaken. In case of our sample farmers, these charges
were borne by the some of the sugar cooperatives.
level. The Samples collected from villages are aggregated at taluka level and sent to designate Soil Testing Laboratory (STL).
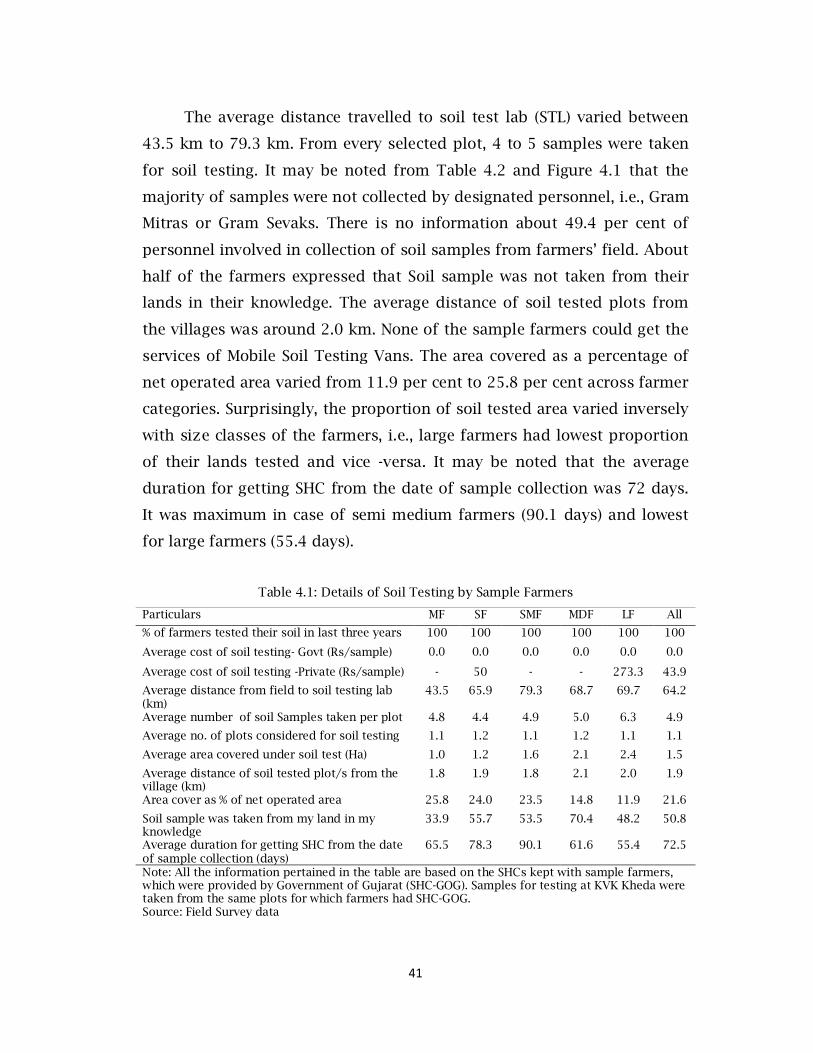
41
The average distance travelled to soil test lab (STL) varied between
43.5 km to 79.3 km. From every selected plot, 4 to 5 samples were taken
for soil testing. It may be noted from Table 4.2 and Figure 4.1 that the
majority of samples were not collected by designated personnel, i.e., Gram
Mitras or Gram Sevaks. There is no information about 49.4 per cent of
personnel involved in collection of soil samples from farmers’ field. About
half of the farmers expressed that Soil sample was not taken from their
lands in their knowledge. The average distance of soil tested plots from
the villages was around 2.0 km. None of the sample farmers could get the
services of Mobile Soil Testing Vans. The area covered as a percentage of
net operated area varied from 11.9 per cent to 25.8 per cent across farmer
categories. Surprisingly, the proportion of soil tested area varied inversely
with size classes of the farmers, i.e., large farmers had lowest proportion
of their lands tested and vice -versa. It may be noted that the average
duration for getting SHC from the date of sample collection was 72 days.
It was maximum in case of semi medium farmers (90.1 days) and lowest
for large farmers (55.4 days).
Table 4.1: Details of Soil Testing by Sample Farmers
Particulars MF SF SMF MDF LF All
% of farmers tested their soil in last three years 100 100 100 100 100 100
Average cost of soil testing- Govt (Rs/sample) 0.0 0.0 0.0 0.0 0.0 0.0
Average cost of soil testing -Private (Rs/sample) - 50 - - 273.3 43.9
Average distance from field to soil testing lab (km)
43.5 65.9 79.3 68.7 69.7 64.2
Average number of soil Samples taken per plot 4.8 4.4 4.9 5.0 6.3 4.9
Average no. of plots considered for soil testing 1.1 1.2 1.1 1.2 1.1 1.1
Average area covered under soil test (Ha) 1.0 1.2 1.6 2.1 2.4 1.5
Average distance of soil tested plot/s from the village (km)
1.8 1.9 1.8 2.1 2.0 1.9
Area cover as % of net operated area 25.8 24.0 23.5 14.8 11.9 21.6
Soil sample was taken from my land in my knowledge
33.9 55.7 53.5 70.4 48.2 50.8
Average duration for getting SHC from the date of sample collection (days)
65.5 78.3 90.1 61.6 55.4 72.5
Note: All the information pertained in the table are based on the SHCs kept with sample farmers, which were provided by Government of Gujarat (SHC-GOG). Samples for testing at KVK Kheda were taken from the same plots for which farmers had SHC-GOG. Source: Field Survey data
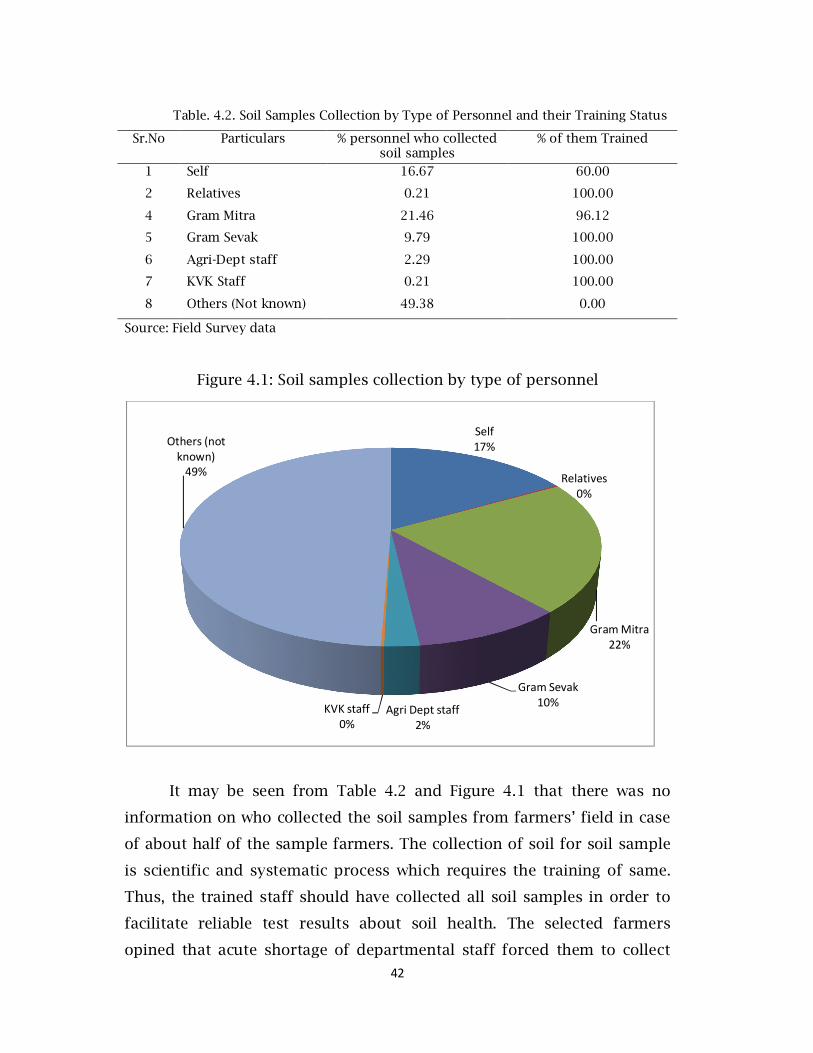
42
Table. 4.2. Soil Samples Collection by Type of Personnel and their Training Status
Sr.No Particulars % personnel who collected soil samples
% of them Trained
1 Self 16.67 60.00
2 Relatives 0.21 100.00
4 Gram Mitra 21.46 96.12
5 Gram Sevak 9.79 100.00
6 Agri-Dept staff 2.29 100.00
7 KVK Staff 0.21 100.00
8 Others (Not known) 49.38 0.00
Source: Field Survey data
Figure 4.1: Soil samples collection by type of personnel
It may be seen from Table 4.2 and Figure 4.1 that there was no
information on who collected the soil samples from farmers’ field in case
of about half of the sample farmers. The collection of soil for soil sample
is scientific and systematic process which requires the training of same.
Thus, the trained staff should have collected all soil samples in order to
facilitate reliable test results about soil health. The selected farmers
opined that acute shortage of departmental staff forced them to collect
Self17%
Relatives0%
Gram Mitra22%
Gram Sevak10%
Agri Dept staff2%
KVK staff0%
Others (not known)
49%
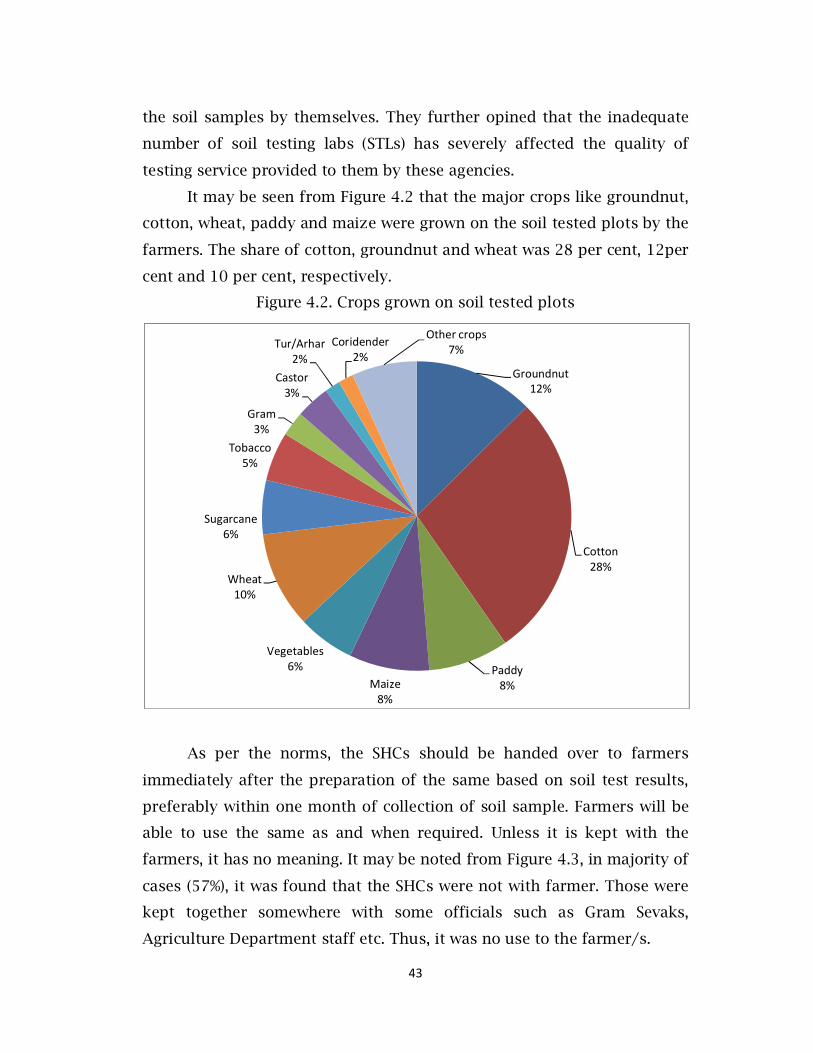
43
the soil samples by themselves. They further opined that the inadequate
number of soil testing labs (STLs) has severely affected the quality of
testing service provided to them by these agencies.
It may be seen from Figure 4.2 that the major crops like groundnut,
cotton, wheat, paddy and maize were grown on the soil tested plots by the
farmers. The share of cotton, groundnut and wheat was 28 per cent, 12per
cent and 10 per cent, respectively.
Figure 4.2. Crops grown on soil tested plots
As per the norms, the SHCs should be handed over to farmers
immediately after the preparation of the same based on soil test results,
preferably within one month of collection of soil sample. Farmers will be
able to use the same as and when required. Unless it is kept with the
farmers, it has no meaning. It may be noted from Figure 4.3, in majority of
cases (57%), it was found that the SHCs were not with farmer. Those were
kept together somewhere with some officials such as Gram Sevaks,
Agriculture Department staff etc. Thus, it was no use to the farmer/s.
Groundnut12%
Cotton28%
Paddy8%Maize
8%
Vegetables6%
Wheat10%
Sugarcane6%
Tobacco5%
Gram3%
Castor3%
Tur/Arhar2%
Coridender2%
Other crops7%
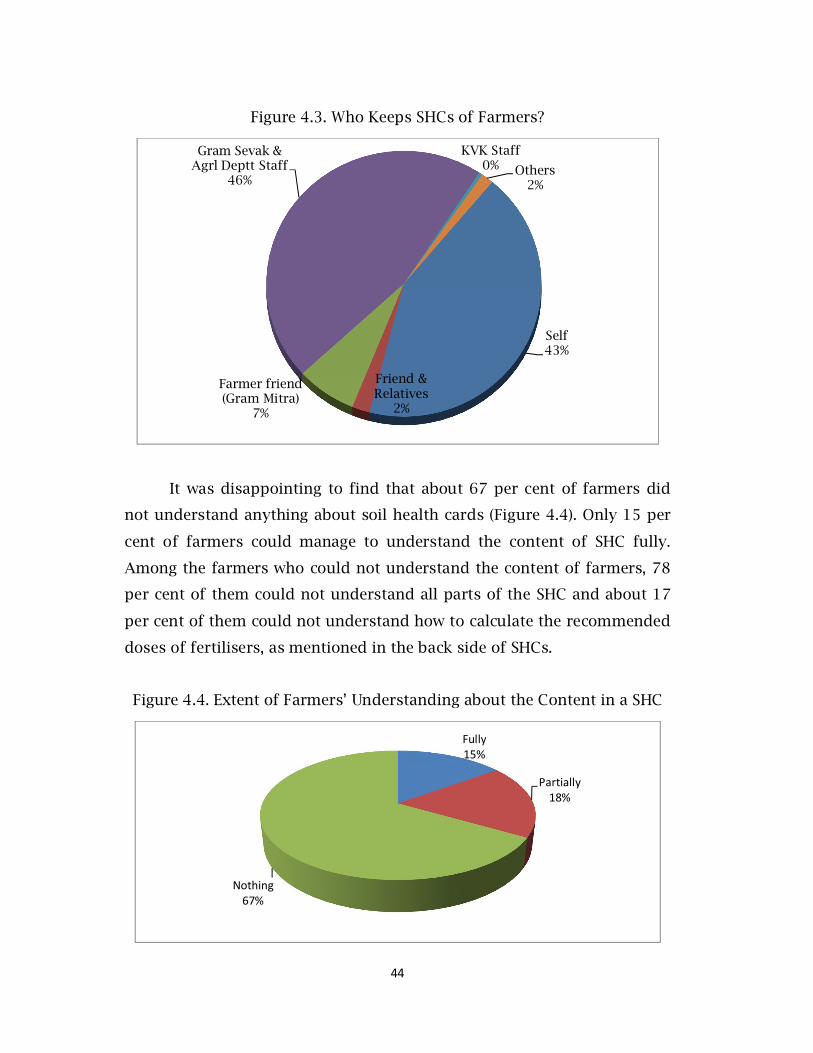
44
Figure 4.3. Who Keeps SHCs of Farmers?
It was disappointing to find that about 67 per cent of farmers did
not understand anything about soil health cards (Figure 4.4). Only 15 per
cent of farmers could manage to understand the content of SHC fully.
Among the farmers who could not understand the content of farmers, 78
per cent of them could not understand all parts of the SHC and about 17
per cent of them could not understand how to calculate the recommended
doses of fertilisers, as mentioned in the back side of SHCs.
Figure 4.4. Extent of Farmers’ Understanding about the Content in a SHC
Self43%
Friend & Relatives
2%
Farmer friend (Gram Mitra)
7%
Gram Sevak & Agrl Deptt Staff
46%
KVK Staff0% Others
2%
Fully15%
Partially18%
Nothing67%
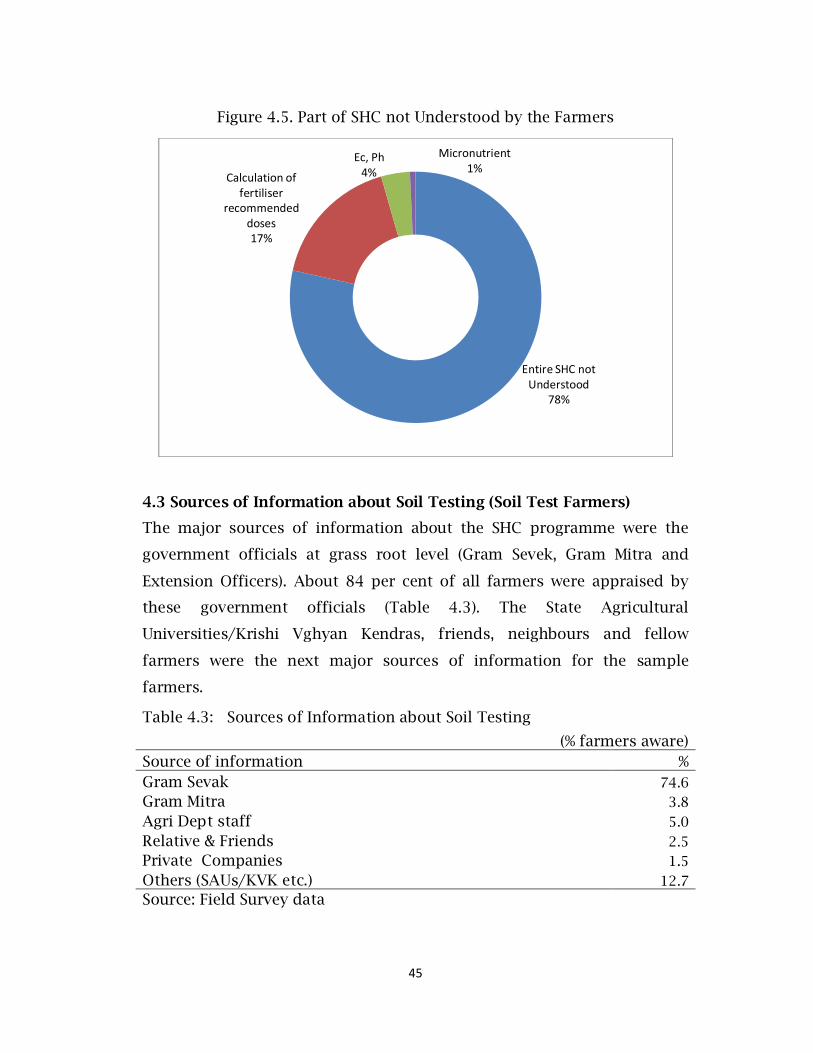
45
Figure 4.5. Part of SHC not Understood by the Farmers
4.3 Sources of Information about Soil Testing (Soil Test Farmers)
The major sources of information about the SHC programme were the
government officials at grass root level (Gram Sevek, Gram Mitra and
Extension Officers). About 84 per cent of all farmers were appraised by
these government officials (Table 4.3). The State Agricultural
Universities/Krishi Vghyan Kendras, friends, neighbours and fellow
farmers were the next major sources of information for the sample
farmers.
Table 4.3: Sources of Information about Soil Testing
(% farmers aware) Source of information % Gram Sevak 74.6 Gram Mitra 3.8 Agri Dept staff 5.0 Relative & Friends 2.5 Private Companies 1.5 Others (SAUs/KVK etc.) 12.7 Source: Field Survey data
Entire SHC not Understood
78%
Calculation of fertiliser
recommended doses17%
Ec, Ph4%
Micronutrient1%
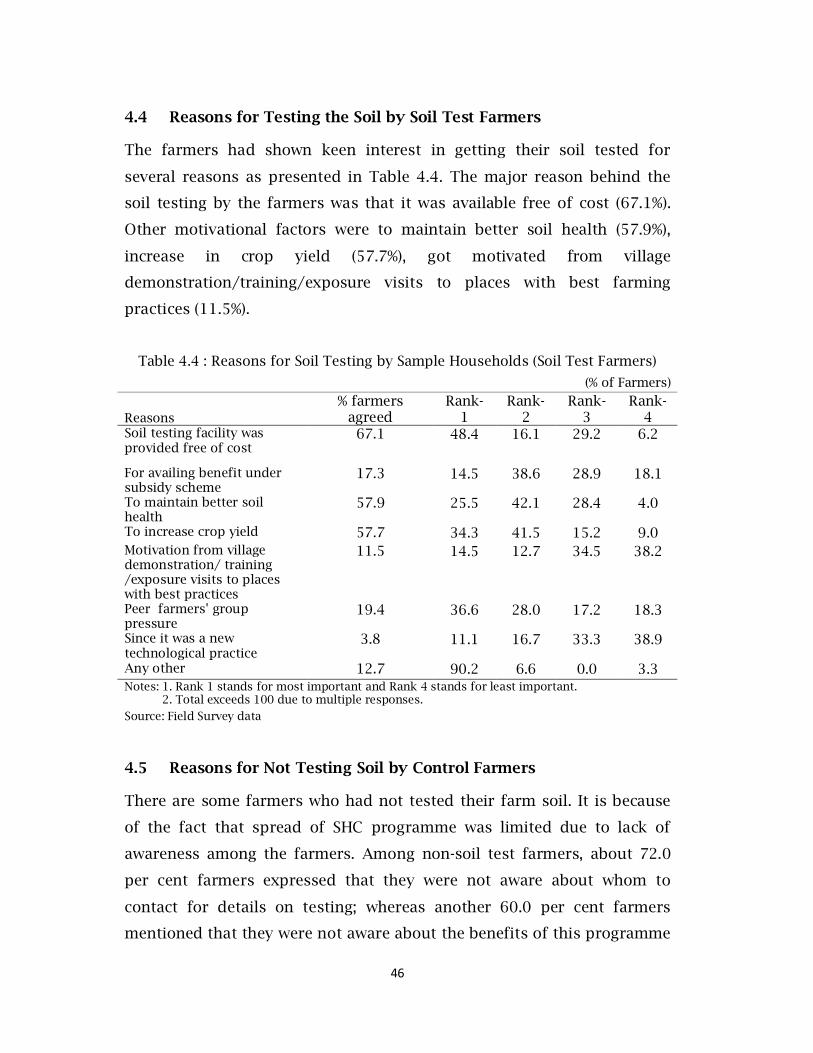
46
4.4 Reasons for Testing the Soil by Soil Test Farmers
The farmers had shown keen interest in getting their soil tested for
several reasons as presented in Table 4.4. The major reason behind the
soil testing by the farmers was that it was available free of cost (67.1%).
Other motivational factors were to maintain better soil health (57.9%),
increase in crop yield (57.7%), got motivated from village
demonstration/training/exposure visits to places with best farming
practices (11.5%).
Table 4.4 : Reasons for Soil Testing by Sample Households (Soil Test Farmers)
(% of Farmers)
Reasons % farmers
agreed Rank-
1 Rank-
2 Rank-
3 Rank-
4 Soil testing facility was provided free of cost
67.1 48.4 16.1 29.2 6.2
For availing benefit under subsidy scheme
17.3 14.5 38.6 28.9 18.1
To maintain better soil health
57.9 25.5 42.1 28.4 4.0
To increase crop yield 57.7 34.3 41.5 15.2 9.0 Motivation from village demonstration/ training /exposure visits to places with best practices
11.5 14.5 12.7 34.5 38.2
Peer farmers' group pressure
19.4 36.6 28.0 17.2 18.3
Since it was a new technological practice
3.8 11.1 16.7 33.3 38.9
Any other 12.7 90.2 6.6 0.0 3.3 Notes: 1. Rank 1 stands for most important and Rank 4 stands for least important. 2. Total exceeds 100 due to multiple responses.
Source: Field Survey data
4.5 Reasons for Not Testing Soil by Control Farmers
There are some farmers who had not tested their farm soil. It is because
of the fact that spread of SHC programme was limited due to lack of
awareness among the farmers. Among non-soil test farmers, about 72.0
per cent farmers expressed that they were not aware about whom to
contact for details on testing; whereas another 60.0 per cent farmers
mentioned that they were not aware about the benefits of this programme
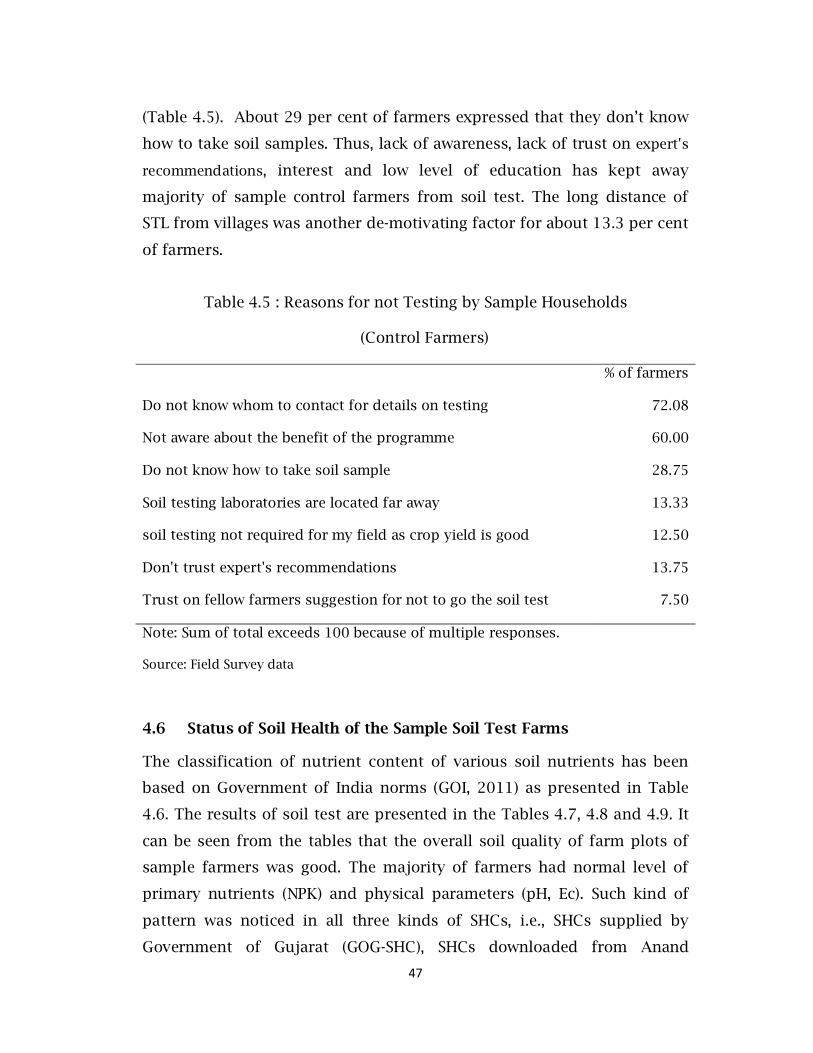
47
(Table 4.5). About 29 per cent of farmers expressed that they don’t know
how to take soil samples. Thus, lack of awareness, lack of trust on expert's
recommendations, interest and low level of education has kept away
majority of sample control farmers from soil test. The long distance of
STL from villages was another de-motivating factor for about 13.3 per cent
of farmers.
Table 4.5 : Reasons for not Testing by Sample Households
(Control Farmers)
% of farmers
Do not know whom to contact for details on testing 72.08
Not aware about the benefit of the programme 60.00
Do not know how to take soil sample 28.75
Soil testing laboratories are located far away 13.33
soil testing not required for my field as crop yield is good 12.50
Don't trust expert's recommendations 13.75
Trust on fellow farmers suggestion for not to go the soil test 7.50
Note: Sum of total exceeds 100 because of multiple responses.
Source: Field Survey data
4.6 Status of Soil Health of the Sample Soil Test Farms
The classification of nutrient content of various soil nutrients has been
based on Government of India norms (GOI, 2011) as presented in Table
4.6. The results of soil test are presented in the Tables 4.7, 4.8 and 4.9. It
can be seen from the tables that the overall soil quality of farm plots of
sample farmers was good. The majority of farmers had normal level of
primary nutrients (NPK) and physical parameters (pH, Ec). Such kind of
pattern was noticed in all three kinds of SHCs, i.e., SHCs supplied by
Government of Gujarat (GOG-SHC), SHCs downloaded from Anand
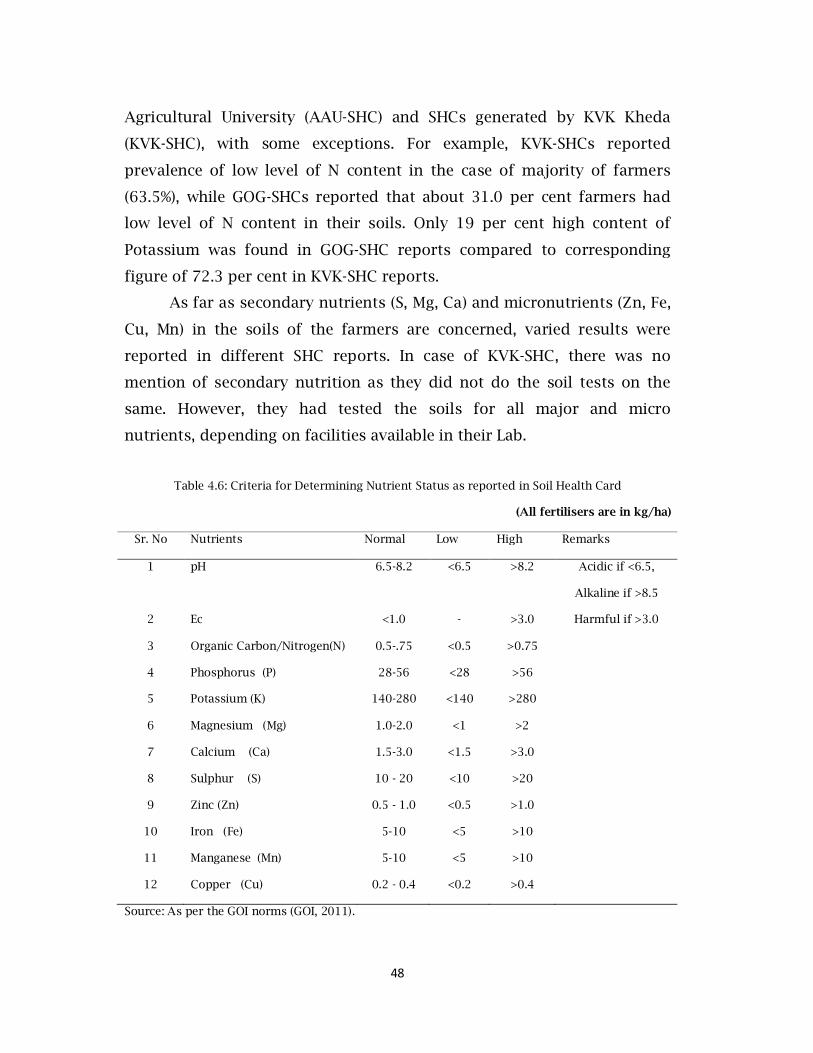
48
Agricultural University (AAU-SHC) and SHCs generated by KVK Kheda
(KVK-SHC), with some exceptions. For example, KVK-SHCs reported
prevalence of low level of N content in the case of majority of farmers
(63.5%), while GOG-SHCs reported that about 31.0 per cent farmers had
low level of N content in their soils. Only 19 per cent high content of
Potassium was found in GOG-SHC reports compared to corresponding
figure of 72.3 per cent in KVK-SHC reports.
As far as secondary nutrients (S, Mg, Ca) and micronutrients (Zn, Fe,
Cu, Mn) in the soils of the farmers are concerned, varied results were
reported in different SHC reports. In case of KVK-SHC, there was no
mention of secondary nutrition as they did not do the soil tests on the
same. However, they had tested the soils for all major and micro
nutrients, depending on facilities available in their Lab.
Table 4.6: Criteria for Determining Nutrient Status as reported in Soil Health Card
(All fertilisers are in kg/ha)
Sr. No Nutrients Normal Low High Remarks
1 pH 6.5-8.2 <6.5 >8.2 Acidic if <6.5,
Alkaline if >8.5
2 Ec <1.0 - >3.0 Harmful if >3.0
3 Organic Carbon/Nitrogen(N) 0.5-.75 <0.5 >0.75
4 Phosphorus (P) 28-56 <28 >56
5 Potassium (K) 140-280 <140 >280
6 Magnesium (Mg) 1.0-2.0 <1 >2
7 Calcium (Ca) 1.5-3.0 <1.5 >3.0
8 Sulphur (S) 10 - 20 <10 >20
9 Zinc (Zn) 0.5 - 1.0 <0.5 >1.0
10 Iron (Fe) 5-10 <5 >10
11 Manganese (Mn) 5-10 <5 >10
12 Copper (Cu) 0.2 - 0.4 <0.2 >0.4
Source: As per the GOI norms (GOI, 2011).
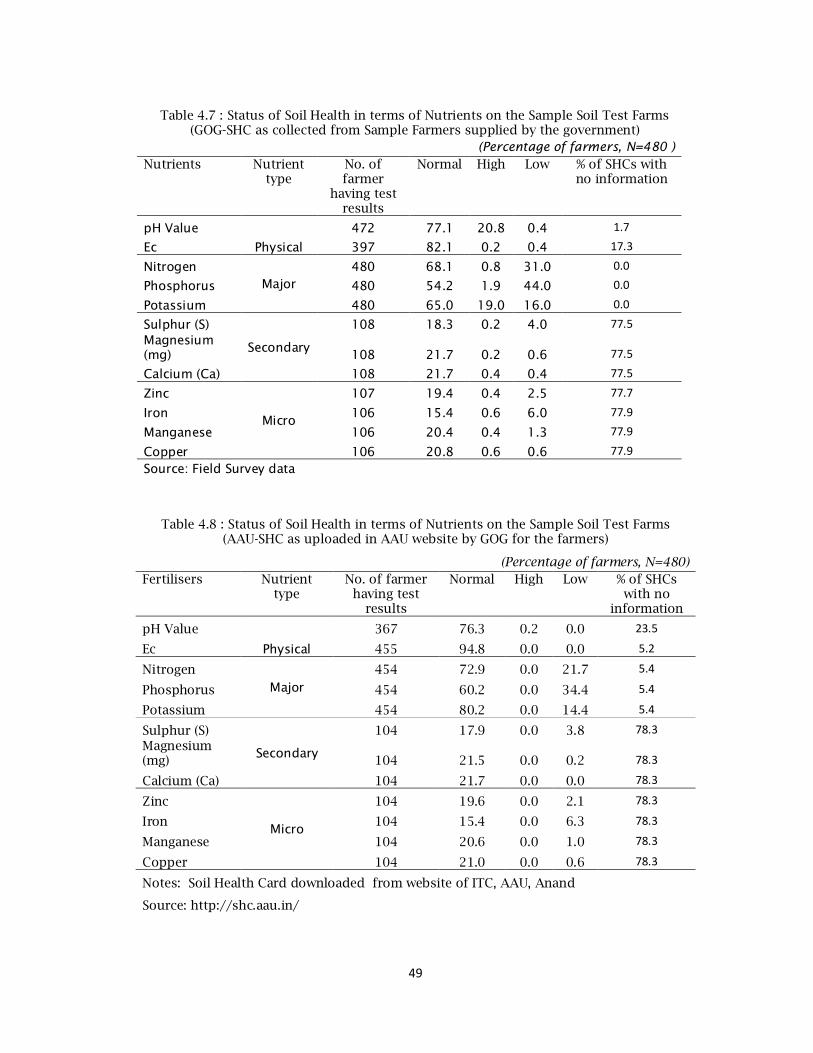
49
Table 4.7 : Status of Soil Health in terms of Nutrients on the Sample Soil Test Farms (GOG-SHC as collected from Sample Farmers supplied by the government)
(Percentage of farmers, N=480 ) Nutrients Nutrient
type No. of farmer
having test results
Normal High Low % of SHCs with no information
pH Value
Physical
472 77.1 20.8 0.4 1.7
Ec 397 82.1 0.2 0.4 17.3
Nitrogen Major
480 68.1 0.8 31.0 0.0
Phosphorus 480 54.2 1.9 44.0 0.0
Potassium 480 65.0 19.0 16.0 0.0
Sulphur (S)
Secondary
108 18.3 0.2 4.0 77.5 Magnesium (mg) 108 21.7 0.2 0.6 77.5
Calcium (Ca) 108 21.7 0.4 0.4 77.5
Zinc
Micro
107 19.4 0.4 2.5 77.7
Iron 106 15.4 0.6 6.0 77.9
Manganese 106 20.4 0.4 1.3 77.9
Copper 106 20.8 0.6 0.6 77.9
Source: Field Survey data
Table 4.8 : Status of Soil Health in terms of Nutrients on the Sample Soil Test Farms (AAU-SHC as uploaded in AAU website by GOG for the farmers)
(Percentage of farmers, N=480) Fertilisers Nutrient
type No. of farmer
having test results
Normal High Low % of SHCs with no
information
pH Value
Physical
367 76.3 0.2 0.0 23.5
Ec 455 94.8 0.0 0.0 5.2
Nitrogen Major
454 72.9 0.0 21.7 5.4
Phosphorus 454 60.2 0.0 34.4 5.4
Potassium 454 80.2 0.0 14.4 5.4
Sulphur (S)
Secondary
104 17.9 0.0 3.8 78.3 Magnesium (mg) 104 21.5 0.0 0.2 78.3
Calcium (Ca) 104 21.7 0.0 0.0 78.3
Zinc
Micro
104 19.6 0.0 2.1 78.3
Iron 104 15.4 0.0 6.3 78.3
Manganese 104 20.6 0.0 1.0 78.3
Copper 104 21.0 0.0 0.6 78.3
Notes: Soil Health Card downloaded from website of ITC, AAU, Anand
Source: http://shc.aau.in/
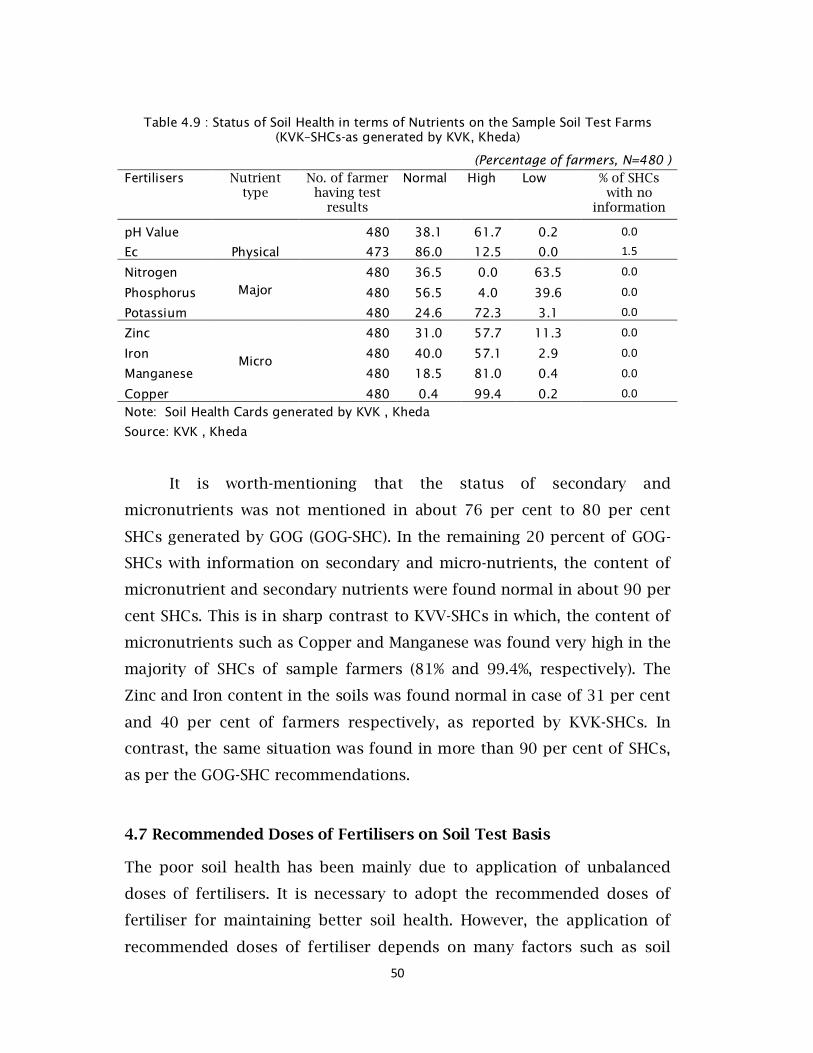
50
Table 4.9 : Status of Soil Health in terms of Nutrients on the Sample Soil Test Farms (KVK–SHCs-as generated by KVK, Kheda)
(Percentage of farmers, N=480 ) Fertilisers Nutrient
type No. of farmer
having test results
Normal High Low % of SHCs with no
information
pH Value
Physical
480 38.1 61.7 0.2 0.0
Ec 473 86.0 12.5 0.0 1.5
Nitrogen Major
480 36.5 0.0 63.5 0.0
Phosphorus 480 56.5 4.0 39.6 0.0
Potassium 480 24.6 72.3 3.1 0.0
Zinc
Micro
480 31.0 57.7 11.3 0.0
Iron 480 40.0 57.1 2.9 0.0
Manganese 480 18.5 81.0 0.4 0.0
Copper 480 0.4 99.4 0.2 0.0
Note: Soil Health Cards generated by KVK , Kheda
Source: KVK , Kheda
It is worth-mentioning that the status of secondary and
micronutrients was not mentioned in about 76 per cent to 80 per cent
SHCs generated by GOG (GOG-SHC). In the remaining 20 percent of GOG-
SHCs with information on secondary and micro-nutrients, the content of
micronutrient and secondary nutrients were found normal in about 90 per
cent SHCs. This is in sharp contrast to KVV-SHCs in which, the content of
micronutrients such as Copper and Manganese was found very high in the
majority of SHCs of sample farmers (81% and 99.4%, respectively). The
Zinc and Iron content in the soils was found normal in case of 31 per cent
and 40 per cent of farmers respectively, as reported by KVK-SHCs. In
contrast, the same situation was found in more than 90 per cent of SHCs,
as per the GOG-SHC recommendations.
4.7 Recommended Doses of Fertilisers on Soil Test Basis
The poor soil health has been mainly due to application of unbalanced
doses of fertilisers. It is necessary to adopt the recommended doses of
fertiliser for maintaining better soil health. However, the application of
recommended doses of fertiliser depends on many factors such as soil
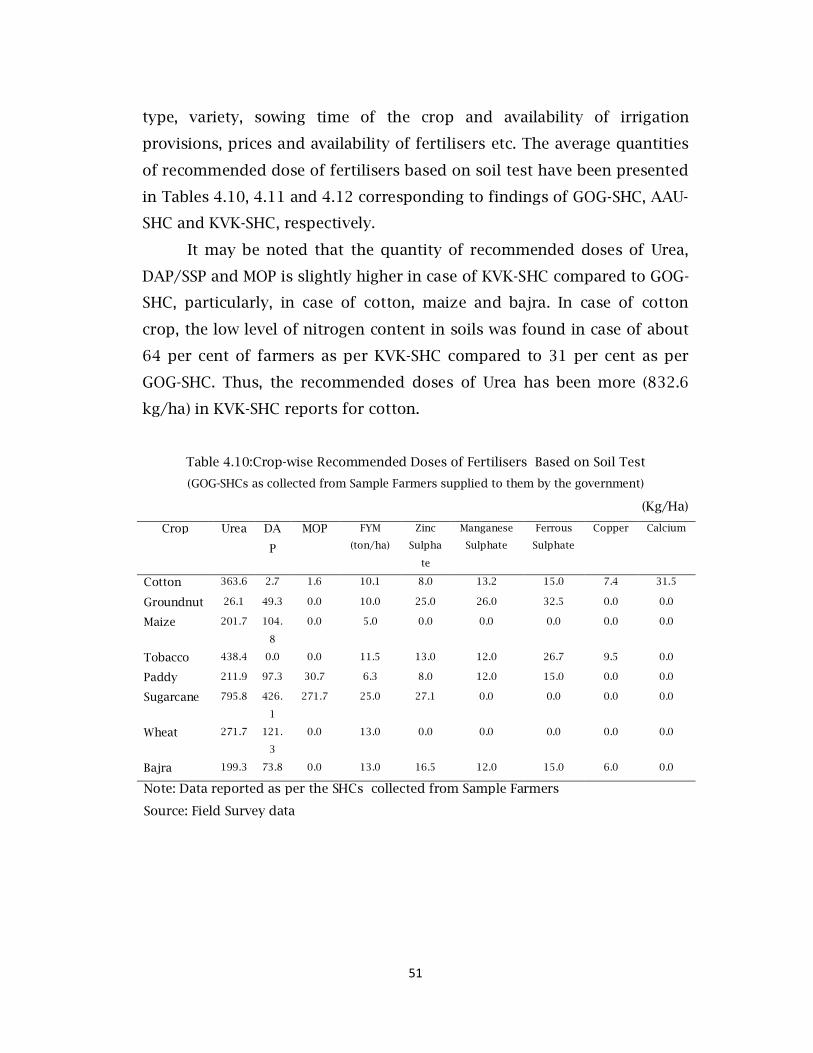
51
type, variety, sowing time of the crop and availability of irrigation
provisions, prices and availability of fertilisers etc. The average quantities
of recommended dose of fertilisers based on soil test have been presented
in Tables 4.10, 4.11 and 4.12 corresponding to findings of GOG-SHC, AAU-
SHC and KVK-SHC, respectively.
It may be noted that the quantity of recommended doses of Urea,
DAP/SSP and MOP is slightly higher in case of KVK-SHC compared to GOG-
SHC, particularly, in case of cotton, maize and bajra. In case of cotton
crop, the low level of nitrogen content in soils was found in case of about
64 per cent of farmers as per KVK-SHC compared to 31 per cent as per
GOG-SHC. Thus, the recommended doses of Urea has been more (832.6
kg/ha) in KVK-SHC reports for cotton.
Table 4.10:Crop-wise Recommended Doses of Fertilisers Based on Soil Test
(GOG-SHCs as collected from Sample Farmers supplied to them by the government)
(Kg/Ha)
Crop Urea DA
P
MOP FYM
(ton/ha)
Zinc
Sulpha
te
Manganese
Sulphate
Ferrous
Sulphate
Copper Calcium
Cotton 363.6 2.7 1.6 10.1 8.0 13.2 15.0 7.4 31.5
Groundnut 26.1 49.3 0.0 10.0 25.0 26.0 32.5 0.0 0.0
Maize 201.7 104.
8
0.0 5.0 0.0 0.0 0.0 0.0 0.0
Tobacco 438.4 0.0 0.0 11.5 13.0 12.0 26.7 9.5 0.0
Paddy 211.9 97.3 30.7 6.3 8.0 12.0 15.0 0.0 0.0
Sugarcane 795.8 426.
1
271.7 25.0 27.1 0.0 0.0 0.0 0.0
Wheat 271.7 121.
3
0.0 13.0 0.0 0.0 0.0 0.0 0.0
Bajra 199.3 73.8 0.0 13.0 16.5 12.0 15.0 6.0 0.0
Note: Data reported as per the SHCs collected from Sample Farmers
Source: Field Survey data
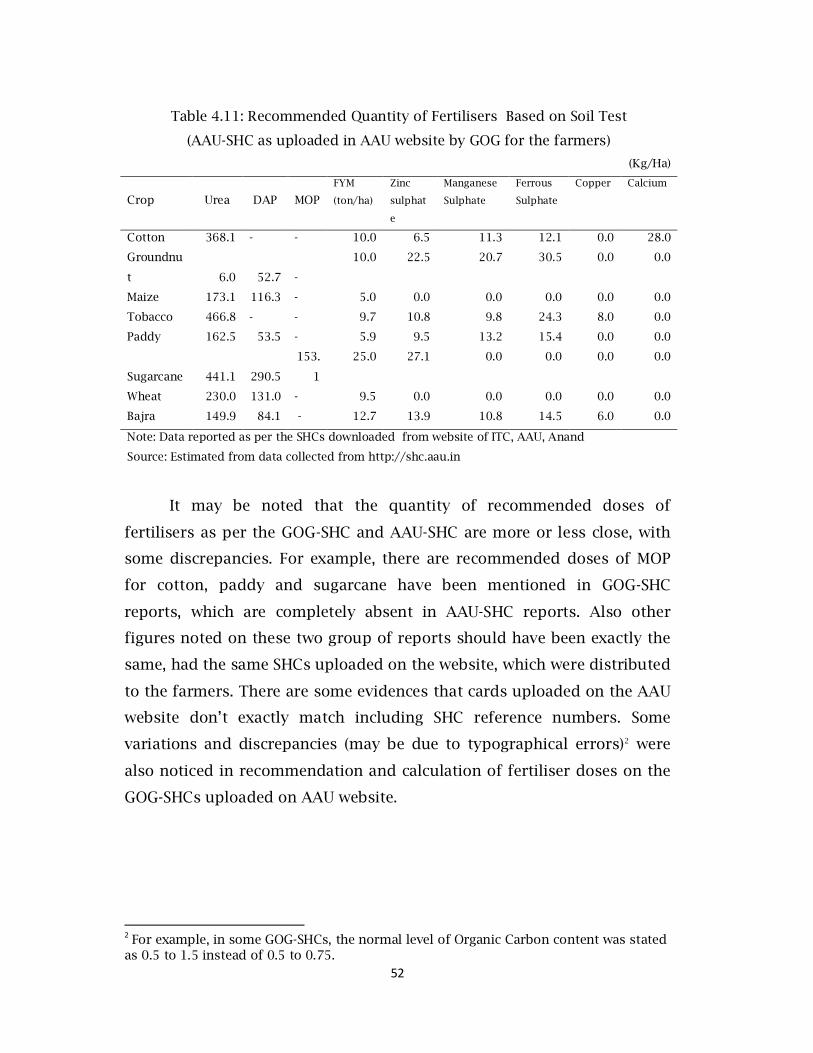
52
Table 4.11: Recommended Quantity of Fertilisers Based on Soil Test
(AAU-SHC as uploaded in AAU website by GOG for the farmers)
(Kg/Ha)
Crop Urea DAP MOP
FYM
(ton/ha)
Zinc
sulphat
e
Manganese
Sulphate
Ferrous
Sulphate
Copper Calcium
Cotton 368.1 - - 10.0 6.5 11.3 12.1 0.0 28.0
Groundnu
t 6.0 52.7 -
10.0 22.5 20.7 30.5 0.0 0.0
Maize 173.1 116.3 - 5.0 0.0 0.0 0.0 0.0 0.0
Tobacco 466.8 - - 9.7 10.8 9.8 24.3 8.0 0.0
Paddy 162.5 53.5 - 5.9 9.5 13.2 15.4 0.0 0.0
Sugarcane 441.1 290.5
153.
1
25.0 27.1 0.0 0.0 0.0 0.0
Wheat 230.0 131.0 - 9.5 0.0 0.0 0.0 0.0 0.0
Bajra 149.9 84.1 - 12.7 13.9 10.8 14.5 6.0 0.0
Note: Data reported as per the SHCs downloaded from website of ITC, AAU, Anand
Source: Estimated from data collected from http://shc.aau.in
It may be noted that the quantity of recommended doses of
fertilisers as per the GOG-SHC and AAU-SHC are more or less close, with
some discrepancies. For example, there are recommended doses of MOP
for cotton, paddy and sugarcane have been mentioned in GOG-SHC
reports, which are completely absent in AAU-SHC reports. Also other
figures noted on these two group of reports should have been exactly the
same, had the same SHCs uploaded on the website, which were distributed
to the farmers. There are some evidences that cards uploaded on the AAU
website don’t exactly match including SHC reference numbers. Some
variations and discrepancies (may be due to typographical errors)2 were
also noticed in recommendation and calculation of fertiliser doses on the
GOG-SHCs uploaded on AAU website.
2 For example, in some GOG-SHCs, the normal level of Organic Carbon content was stated as 0.5 to 1.5 instead of 0.5 to 0.75.
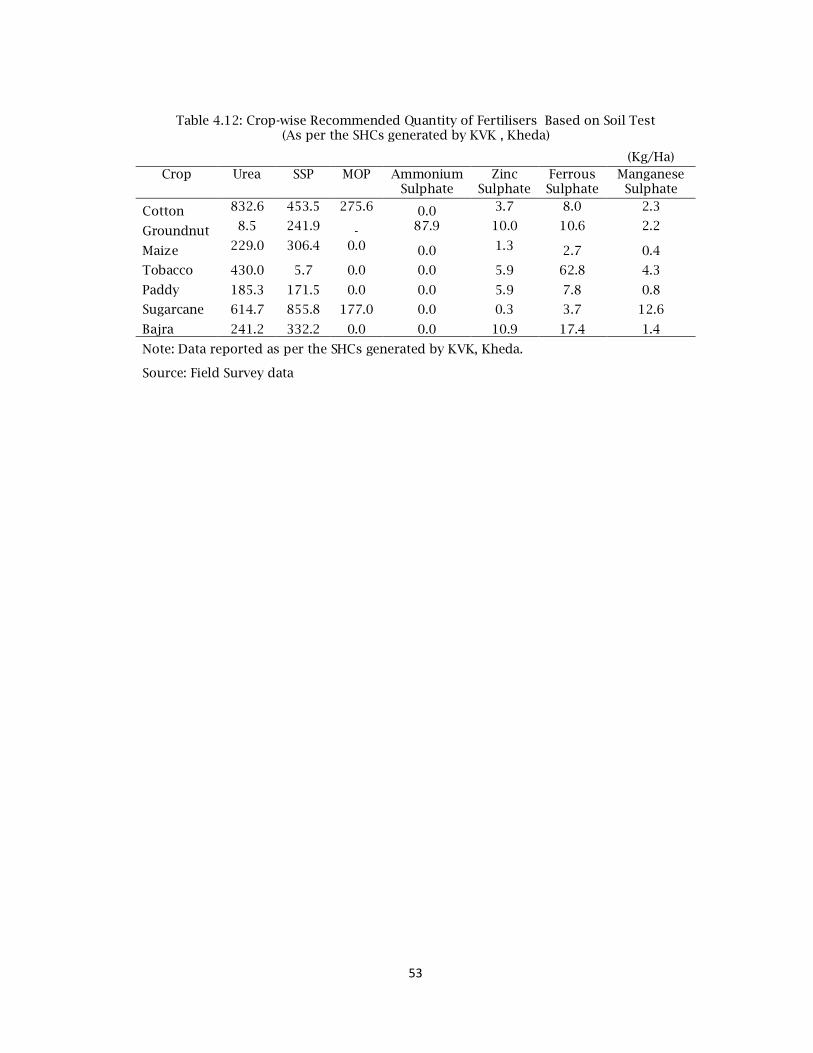
53
Table 4.12: Crop-wise Recommended Quantity of Fertilisers Based on Soil Test (As per the SHCs generated by KVK , Kheda)
(Kg/Ha) Crop Urea SSP MOP Ammonium
Sulphate Zinc
Sulphate Ferrous Sulphate
Manganese Sulphate
Cotton 832.6 453.5 275.6 0.0 3.7 8.0 2.3
Groundnut 8.5 241.9 - 87.9 10.0 10.6 2.2
Maize 229.0 306.4 0.0 0.0 1.3 2.7 0.4
Tobacco 430.0 5.7 0.0 0.0 5.9 62.8 4.3
Paddy 185.3 171.5 0.0 0.0 5.9 7.8 0.8
Sugarcane 614.7 855.8 177.0 0.0 0.3 3.7 12.6
Bajra 241.2 332.2 0.0 0.0 10.9 17.4 1.4
Note: Data reported as per the SHCs generated by KVK, Kheda.
Source: Field Survey data
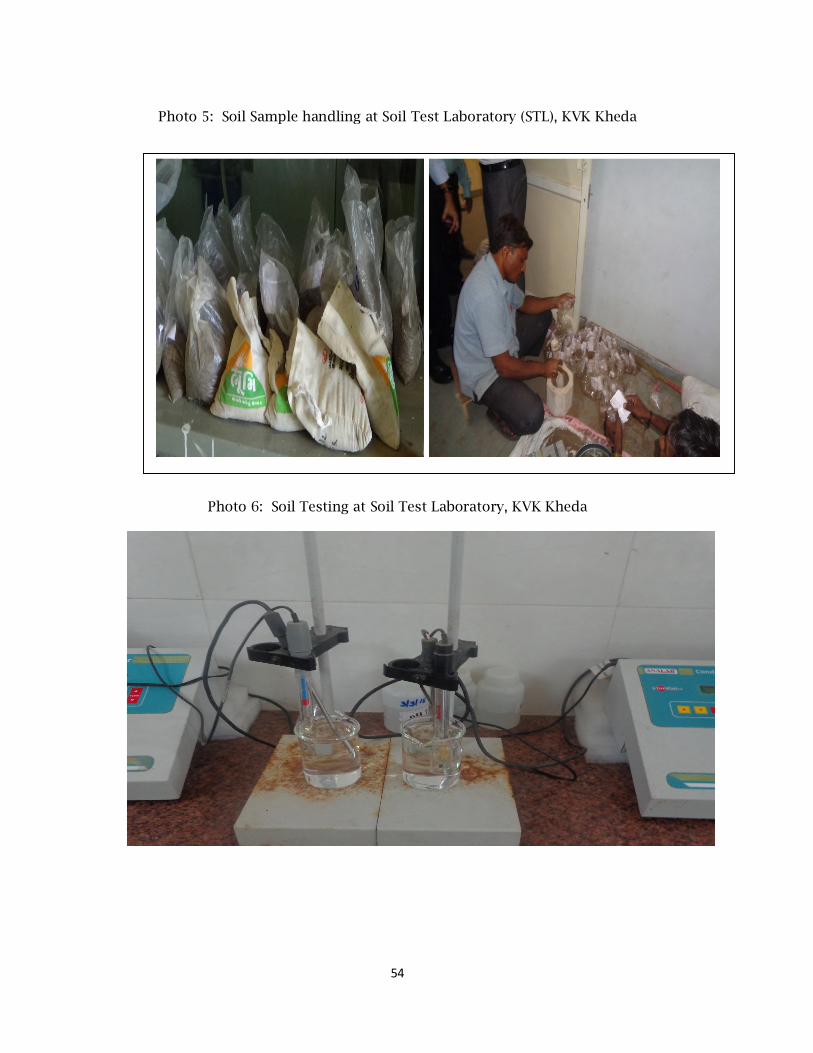
54
Photo 5: Soil Sample handling at Soil Test Laboratory (STL), KVK Kheda
Photo 4: Soil Sample Testing at Soil Test Laboratory, KVK Kheda
Photo 6: Soil Testing at Soil Test Laboratory, KVK Kheda
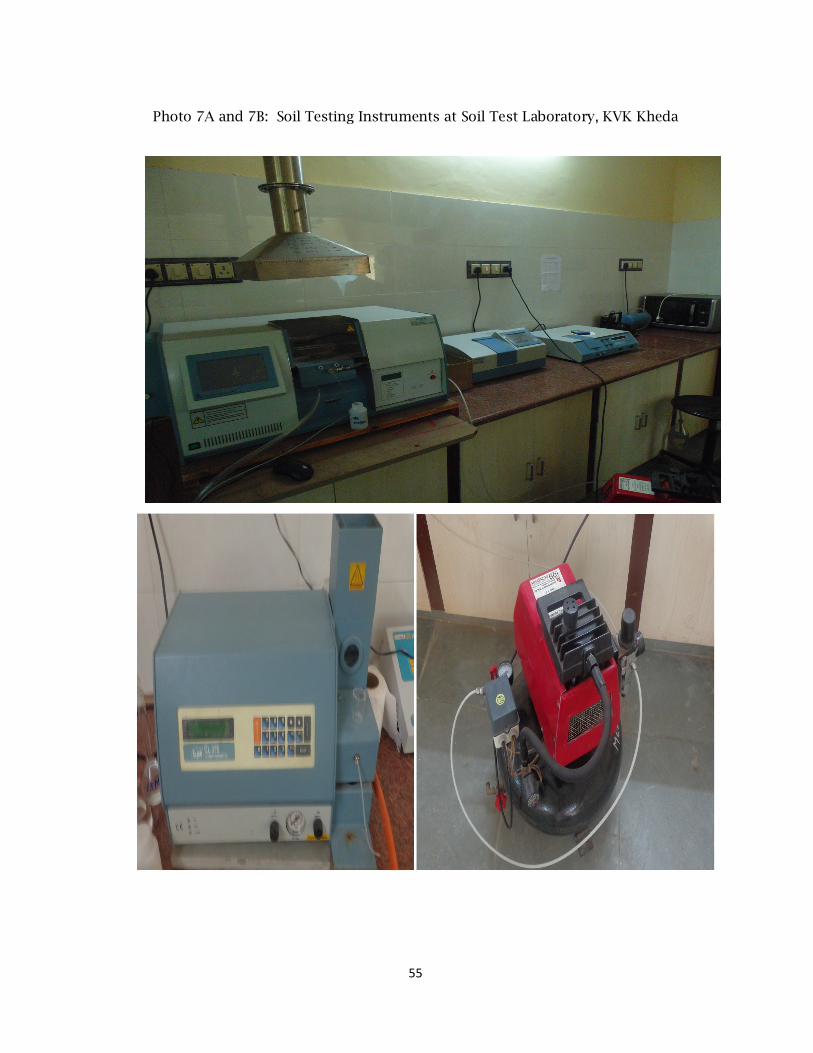
55
Photo 7A and 7B: Soil Testing Instruments at Soil Test Laboratory, KVK Kheda
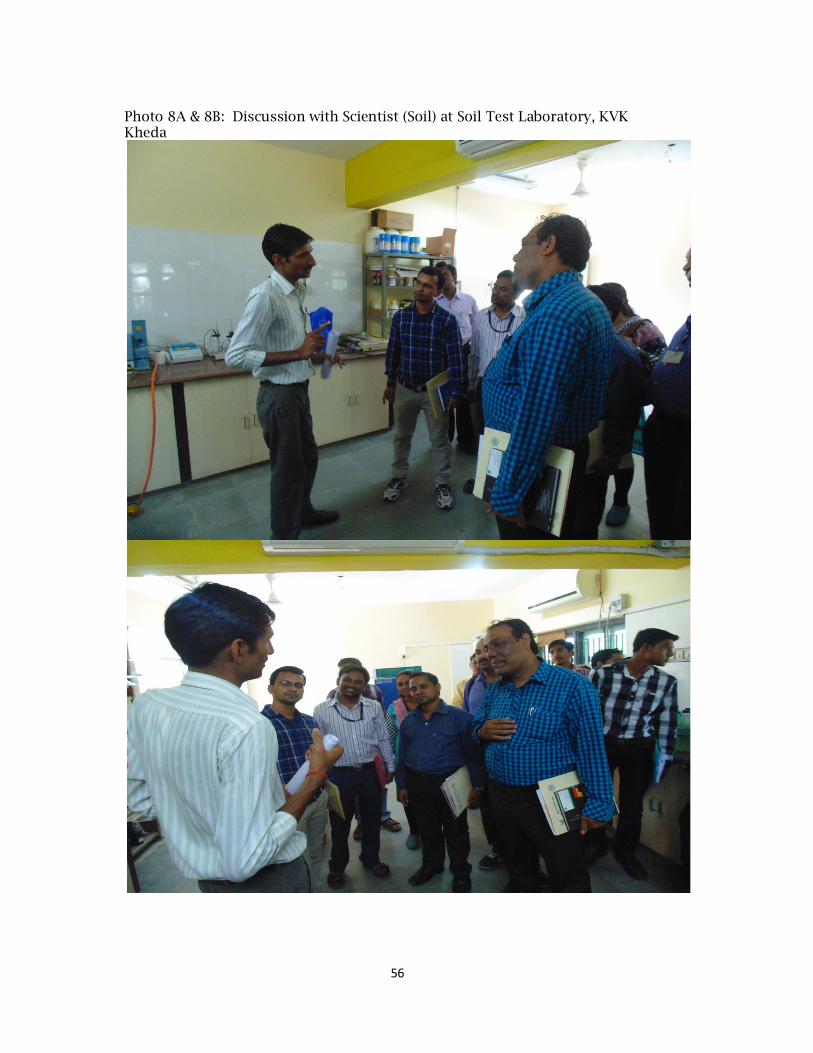
56
Photo 8A & 8B: Discussion with Scientist (Soil) at Soil Test Laboratory, KVK Kheda
57
Chapter V
Adoption and Constraints in Use of Soil Health Cards
5.1 Background
To facilitate and promote Integrated Nutrient Management (INM) through
judicious use of chemical fertilizers, including secondary and micro
nutrients, in conjunction with organic manures and bio-fertilizers, the
farmers’ awareness and adoptability to recommended doses are
necessary. The increase in level of adoptability will surely help in
improving soil health and its productivity. The Government of Gujarat had
therefore planned and implemented the Soil Health Card (SHC)
Programme in a phased manner so as to provide Soil Health Card to all
farmers. By the year 2013-14, more than 53 lakh farmers had been
provided the SHC in the state. However, it was observed during field
survey that there are many farmers who got their soils tested and
obtained the SHCs but didn’t apply the recommended doses of fertiliser
on field. There are also many farmers who did not want to have soil health
cards. There are number of reasons for demand supply mismatch which
are discussed in this Chapter. Before analyzing these constraints, let’s first
discuss the various aspects of adoptability of recommended doses
especially after soil testing.
5.2 Application of Recommended Doses of Fertilisers by Soil Test
Farmers
The level of adoption of recommended doses were examined from three
different angles: (i) farmers own perception, (ii) deviation of fertiliser use
from the recommended doses and (iii) deviation from the recommended
doses in terms of nutrient content (NPK). It was observed that the number
of fertiliser products used by the farmers varied a lot among the farmers.
Some farmers used DAP and some farmers used SSP or NPK mixture
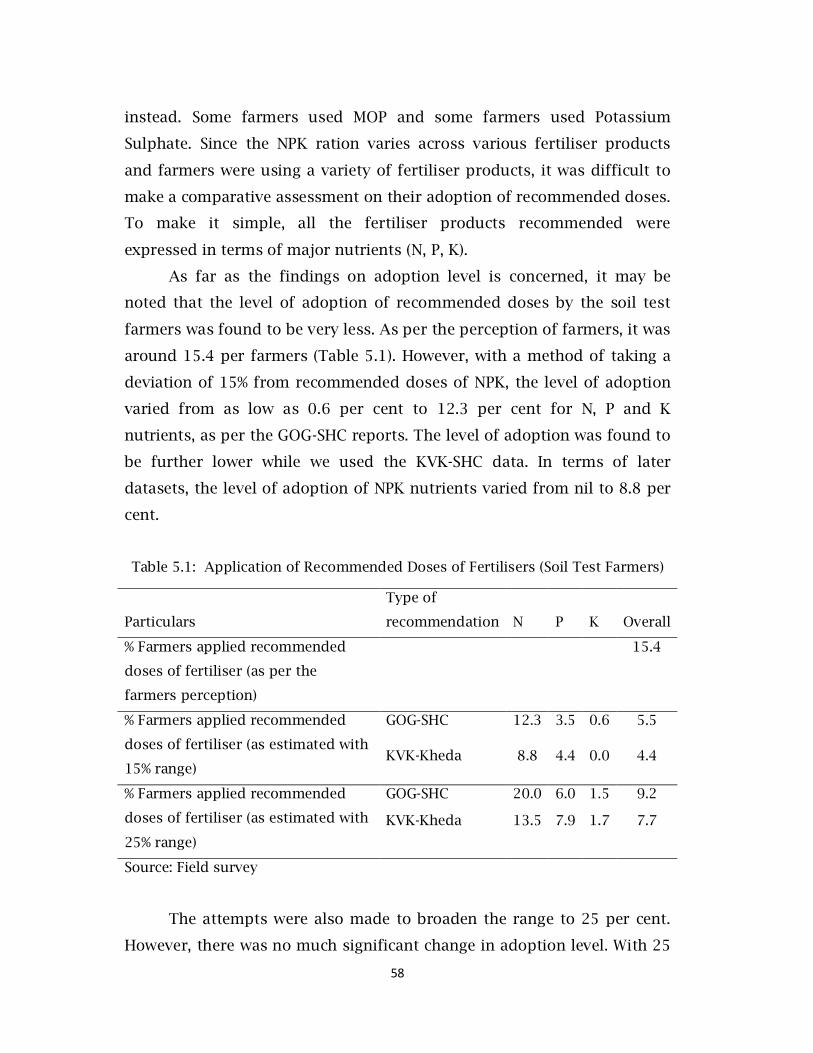
58
instead. Some farmers used MOP and some farmers used Potassium
Sulphate. Since the NPK ration varies across various fertiliser products
and farmers were using a variety of fertiliser products, it was difficult to
make a comparative assessment on their adoption of recommended doses.
To make it simple, all the fertiliser products recommended were
expressed in terms of major nutrients (N, P, K).
As far as the findings on adoption level is concerned, it may be
noted that the level of adoption of recommended doses by the soil test
farmers was found to be very less. As per the perception of farmers, it was
around 15.4 per farmers (Table 5.1). However, with a method of taking a
deviation of 15% from recommended doses of NPK, the level of adoption
varied from as low as 0.6 per cent to 12.3 per cent for N, P and K
nutrients, as per the GOG-SHC reports. The level of adoption was found to
be further lower while we used the KVK-SHC data. In terms of later
datasets, the level of adoption of NPK nutrients varied from nil to 8.8 per
cent.
Table 5.1: Application of Recommended Doses of Fertilisers (Soil Test Farmers)
Particulars
Type of
recommendation N P K Overall
% Farmers applied recommended
doses of fertiliser (as per the
farmers perception)
15.4
% Farmers applied recommended
doses of fertiliser (as estimated with
15% range)
GOG-SHC 12.3 3.5 0.6 5.5
KVK-Kheda 8.8 4.4 0.0 4.4
% Farmers applied recommended
doses of fertiliser (as estimated with
25% range)
GOG-SHC 20.0 6.0 1.5 9.2
KVK-Kheda 13.5 7.9 1.7 7.7
Source: Field survey
The attempts were also made to broaden the range to 25 per cent.
However, there was no much significant change in adoption level. With 25
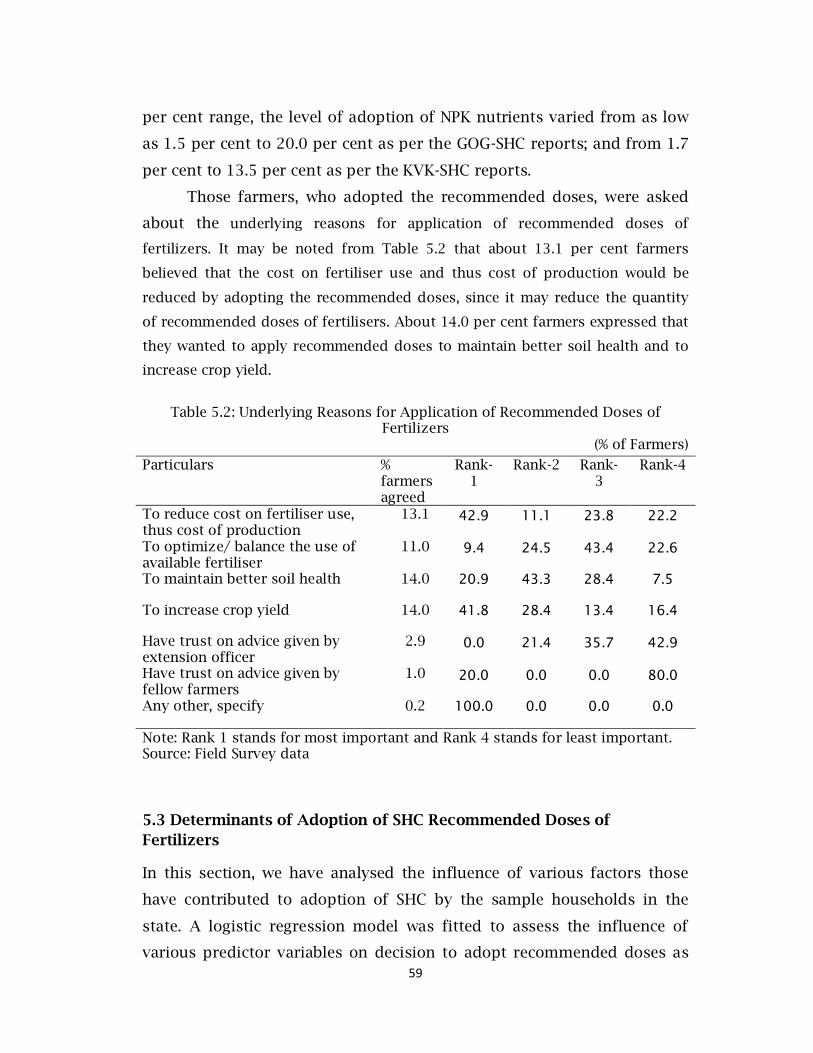
59
per cent range, the level of adoption of NPK nutrients varied from as low
as 1.5 per cent to 20.0 per cent as per the GOG-SHC reports; and from 1.7
per cent to 13.5 per cent as per the KVK-SHC reports.
Those farmers, who adopted the recommended doses, were asked
about the underlying reasons for application of recommended doses of
fertilizers. It may be noted from Table 5.2 that about 13.1 per cent farmers
believed that the cost on fertiliser use and thus cost of production would be
reduced by adopting the recommended doses, since it may reduce the quantity
of recommended doses of fertilisers. About 14.0 per cent farmers expressed that
they wanted to apply recommended doses to maintain better soil health and to
increase crop yield.
Table 5.2: Underlying Reasons for Application of Recommended Doses of
Fertilizers (% of Farmers)
Particulars % farmers agreed
Rank- 1
Rank-2 Rank- 3
Rank-4
To reduce cost on fertiliser use, thus cost of production
13.1 42.9 11.1 23.8 22.2
To optimize/ balance the use of available fertiliser
11.0 9.4 24.5 43.4 22.6
To maintain better soil health 14.0 20.9 43.3 28.4 7.5
To increase crop yield 14.0 41.8 28.4 13.4 16.4
Have trust on advice given by extension officer
2.9 0.0 21.4 35.7 42.9
Have trust on advice given by fellow farmers
1.0 20.0 0.0 0.0 80.0
Any other, specify 0.2 100.0 0.0 0.0 0.0
Note: Rank 1 stands for most important and Rank 4 stands for least important. Source: Field Survey data
5.3 Determinants of Adoption of SHC Recommended Doses of Fertilizers
In this section, we have analysed the influence of various factors those
have contributed to adoption of SHC by the sample households in the
state. A logistic regression model was fitted to assess the influence of
various predictor variables on decision to adopt recommended doses as
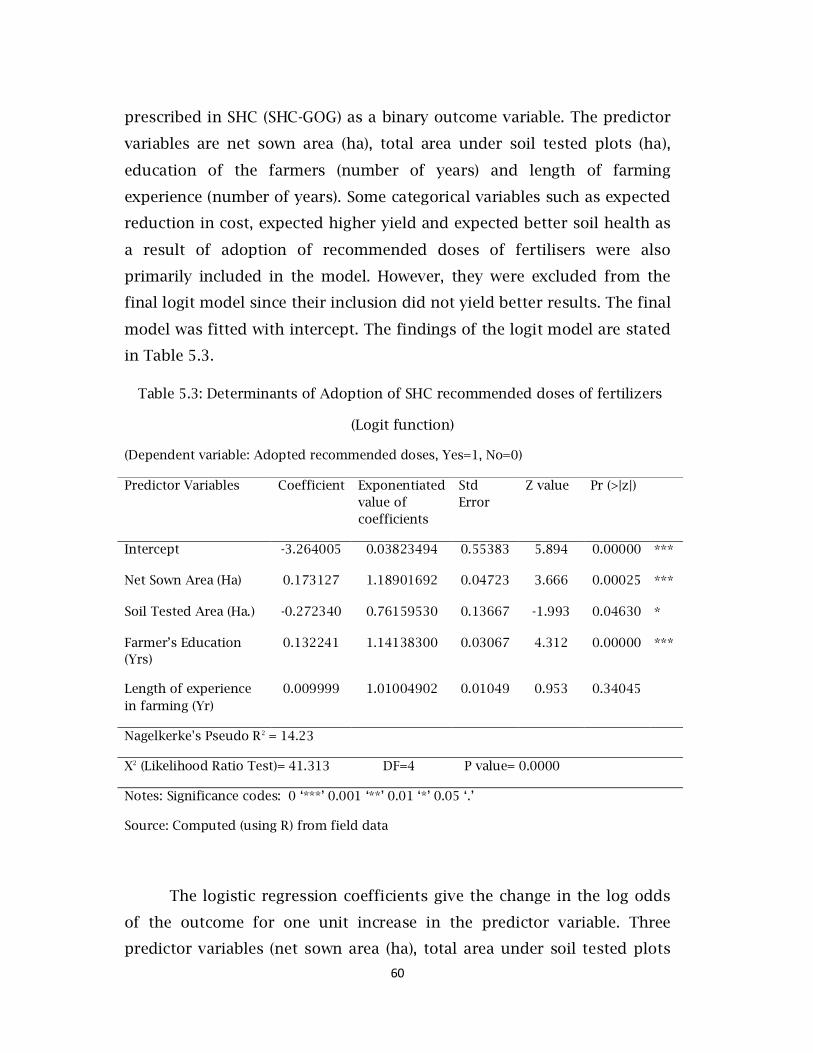
60
prescribed in SHC (SHC-GOG) as a binary outcome variable. The predictor
variables are net sown area (ha), total area under soil tested plots (ha),
education of the farmers (number of years) and length of farming
experience (number of years). Some categorical variables such as expected
reduction in cost, expected higher yield and expected better soil health as
a result of adoption of recommended doses of fertilisers were also
primarily included in the model. However, they were excluded from the
final logit model since their inclusion did not yield better results. The final
model was fitted with intercept. The findings of the logit model are stated
in Table 5.3.
Table 5.3: Determinants of Adoption of SHC recommended doses of fertilizers
(Logit function)
(Dependent variable: Adopted recommended doses, Yes=1, No=0)
Predictor Variables Coefficient Exponentiated value of coefficients
Std Error
Z value Pr (>|z|)
Intercept -3.264005 0.03823494 0.55383 5.894 0.00000 ***
Net Sown Area (Ha) 0.173127 1.18901692 0.04723 3.666 0.00025 ***
Soil Tested Area (Ha.) -0.272340 0.76159530 0.13667 -1.993 0.04630 *
Farmer’s Education (Yrs)
0.132241 1.14138300 0.03067 4.312 0.00000 ***
Length of experience in farming (Yr)
0.009999 1.01004902 0.01049 0.953 0.34045
Nagelkerke's Pseudo R2 = 14.23
X2 (Likelihood Ratio Test)= 41.313 DF=4 P value= 0.0000
Notes: Significance codes: 0 ‘***’ 0.001 ‘**’ 0.01 ‘*’ 0.05 ‘.’
Source: Computed (using R) from field data
The logistic regression coefficients give the change in the log odds
of the outcome for one unit increase in the predictor variable. Three
predictor variables (net sown area (ha), total area under soil tested plots
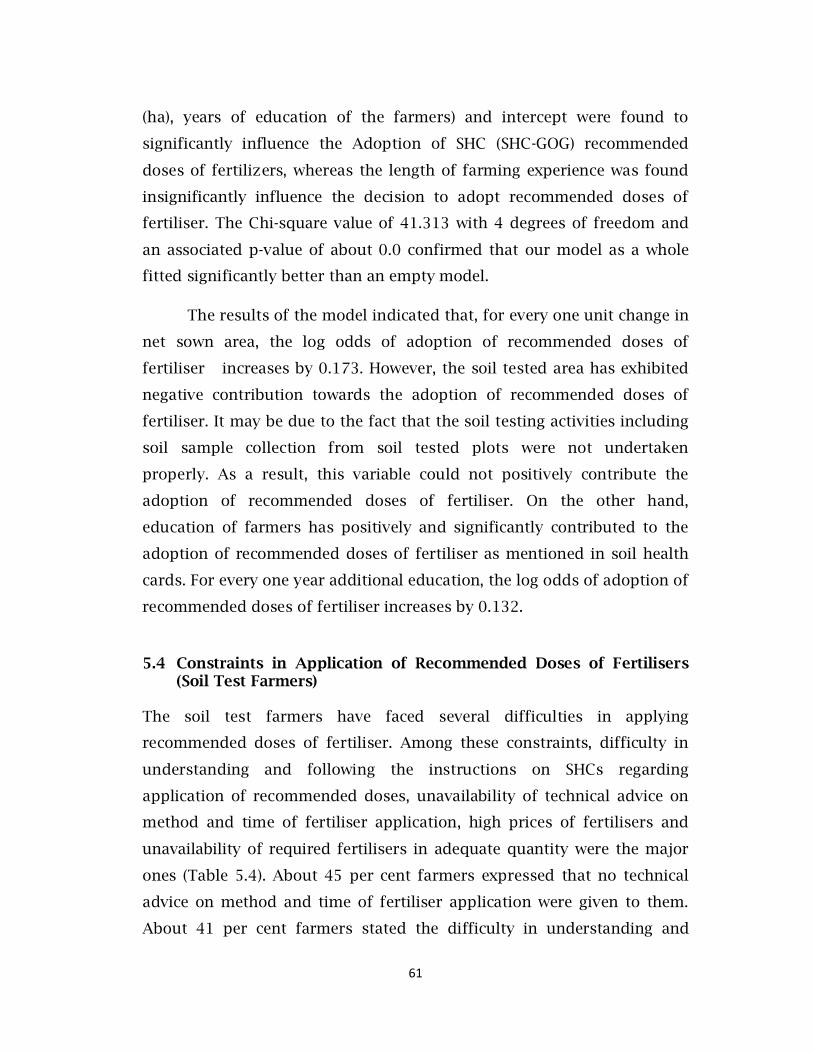
61
(ha), years of education of the farmers) and intercept were found to
significantly influence the Adoption of SHC (SHC-GOG) recommended
doses of fertilizers, whereas the length of farming experience was found
insignificantly influence the decision to adopt recommended doses of
fertiliser. The Chi-square value of 41.313 with 4 degrees of freedom and
an associated p-value of about 0.0 confirmed that our model as a whole
fitted significantly better than an empty model.
The results of the model indicated that, for every one unit change in
net sown area, the log odds of adoption of recommended doses of
fertiliser increases by 0.173. However, the soil tested area has exhibited
negative contribution towards the adoption of recommended doses of
fertiliser. It may be due to the fact that the soil testing activities including
soil sample collection from soil tested plots were not undertaken
properly. As a result, this variable could not positively contribute the
adoption of recommended doses of fertiliser. On the other hand,
education of farmers has positively and significantly contributed to the
adoption of recommended doses of fertiliser as mentioned in soil health
cards. For every one year additional education, the log odds of adoption of
recommended doses of fertiliser increases by 0.132.
5.4 Constraints in Application of Recommended Doses of Fertilisers
(Soil Test Farmers) The soil test farmers have faced several difficulties in applying
recommended doses of fertiliser. Among these constraints, difficulty in
understanding and following the instructions on SHCs regarding
application of recommended doses, unavailability of technical advice on
method and time of fertiliser application, high prices of fertilisers and
unavailability of required fertilisers in adequate quantity were the major
ones (Table 5.4). About 45 per cent farmers expressed that no technical
advice on method and time of fertiliser application were given to them.
About 41 per cent farmers stated the difficulty in understanding and
62
following application of recommended doses as their major problem in
applying recommended doses. About 35 per cent farmers stated higher
price as their main constraints; while 31.3 per cent farmers stated lack of
money to purchase fertilisers as their main constraints.
Table 5.4: Constraints in Applying Recommended Doses of Fertilisers
(% of Farmers) Constraints % farmers
agreed Rank- 1 Rank-2 Rank- 3 Rank-4
No technical advice on method and time of fertiliser application
44.8 26.5 37.2 24.2 12.1
Difficult to understand and follow the recommended does
40.8 46.9 33.2 12.2 7.7
Adequate quantity of fertiliser not available
35.8 8.7 33.1 39.5 18.6
Fertiliser prices are high 34.6 12.0 31.3 34.9 21.7
Lack of money to purchase fertilisers
31.3 12.7 36.7 42.7 8.0
Trust on their own experiences/ practices
17.9 43.0 33.7 14.0 9.3
Any other 31.9 90.2 3.9 5.2 0.7
Note: Rank 1 stands for most important and Rank 4 stands for least important.
Source: Field Survey data
5.5 Application of Actual Quantity of Fertilisers
The details on actual quantity of fertilisers applied by the sample farmers
during the reference year are presented in Table 5.4 and Table 5.5. It can
be seen from the tables that the selected soil test farmers have applied
more quantity of major fertilisers than the control group farmers. In case
of some major crops grown in Gujarat such as cotton, bajra tobacco and
castor, the soil test farmers have applied more urea and DAP than that of
control farmers. The urea and DAP have been applied more by a range of
5.3 per cent to 35.2 per cent (Table 5.5). However, in case of groundnut,
maize, wheat and sugarcane, the control farmers have applied more
fertilisers compared to soil test farmers. It may be noted that the
recommended doses of fertilisers by GOG-SHC and KVK-SHC varied a lot
in case of some crops like cotton and groundnut, basically due to no
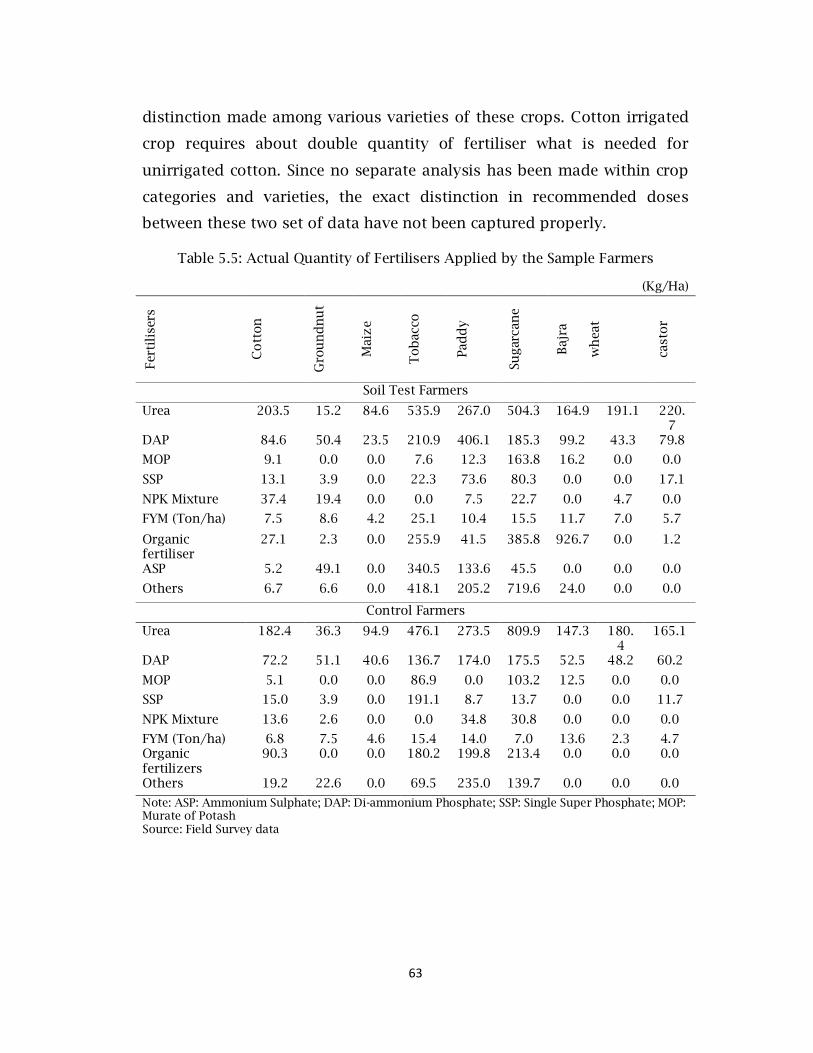
63
distinction made among various varieties of these crops. Cotton irrigated
crop requires about double quantity of fertiliser what is needed for
unirrigated cotton. Since no separate analysis has been made within crop
categories and varieties, the exact distinction in recommended doses
between these two set of data have not been captured properly.
Table 5.5: Actual Quantity of Fertilisers Applied by the Sample Farmers
(Kg/Ha)
Fert
ilis
ers
Co
tton
Gro
un
dn
ut
Mai
ze
To
bac
co
Pad
dy
Sugar
can
e
Baj
ra
wh
eat
cast
or
Soil Test Farmers
Urea 203.5 15.2 84.6 535.9 267.0 504.3 164.9 191.1 220.7
DAP 84.6 50.4 23.5 210.9 406.1 185.3 99.2 43.3 79.8
MOP 9.1 0.0 0.0 7.6 12.3 163.8 16.2 0.0 0.0
SSP 13.1 3.9 0.0 22.3 73.6 80.3 0.0 0.0 17.1
NPK Mixture 37.4 19.4 0.0 0.0 7.5 22.7 0.0 4.7 0.0
FYM (Ton/ha) 7.5 8.6 4.2 25.1 10.4 15.5 11.7 7.0 5.7
Organic fertiliser
27.1 2.3 0.0 255.9 41.5 385.8 926.7 0.0 1.2
ASP 5.2 49.1 0.0 340.5 133.6 45.5 0.0 0.0 0.0
Others 6.7 6.6 0.0 418.1 205.2 719.6 24.0 0.0 0.0
Control Farmers
Urea 182.4 36.3 94.9 476.1 273.5 809.9 147.3 180.4
165.1
DAP 72.2 51.1 40.6 136.7 174.0 175.5 52.5 48.2 60.2
MOP 5.1 0.0 0.0 86.9 0.0 103.2 12.5 0.0 0.0
SSP 15.0 3.9 0.0 191.1 8.7 13.7 0.0 0.0 11.7
NPK Mixture 13.6 2.6 0.0 0.0 34.8 30.8 0.0 0.0 0.0
FYM (Ton/ha) 6.8 7.5 4.6 15.4 14.0 7.0 13.6 2.3 4.7 Organic fertilizers
90.3 0.0 0.0 180.2 199.8 213.4 0.0 0.0 0.0
Others 19.2 22.6 0.0 69.5 235.0 139.7 0.0 0.0 0.0
Note: ASP: Ammonium Sulphate; DAP: Di-ammonium Phosphate; SSP: Single Super Phosphate; MOP: Murate of Potash Source: Field Survey data
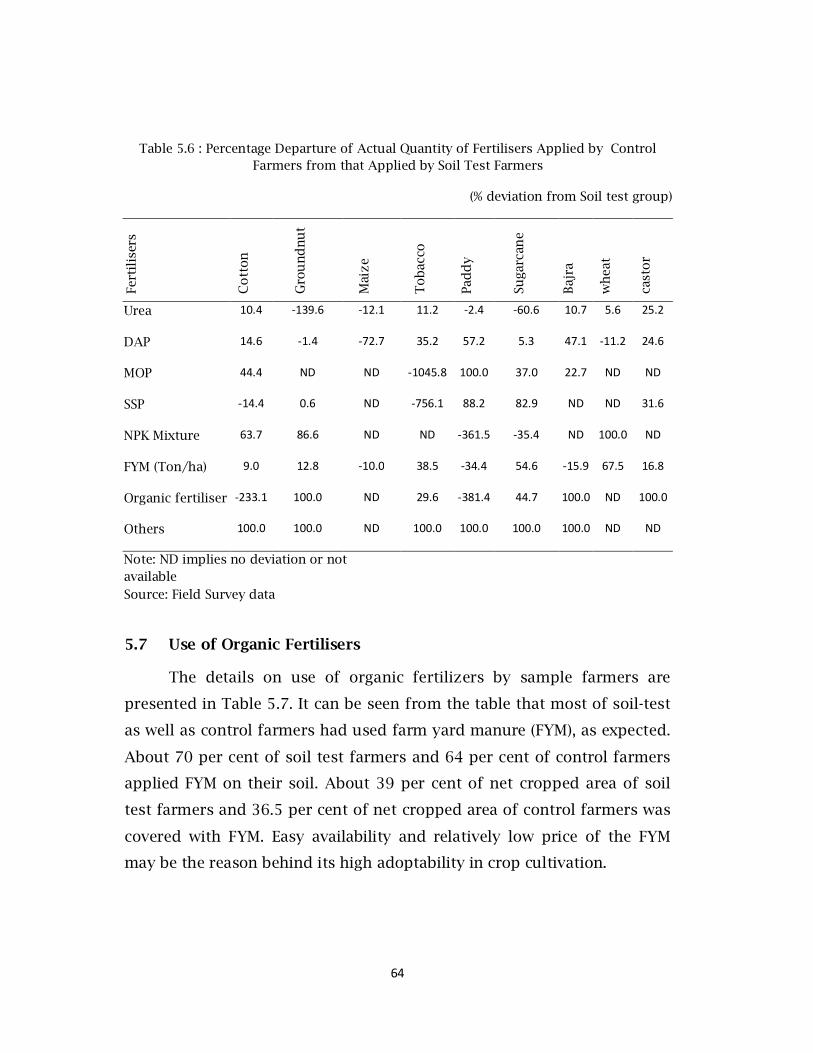
64
Table 5.6 : Percentage Departure of Actual Quantity of Fertilisers Applied by Control Farmers from that Applied by Soil Test Farmers
(% deviation from Soil test group)
Fert
ilis
ers
Co
tton
Gro
un
dn
ut
Mai
ze
To
bac
co
Pad
dy
Suga
rcan
e
Baj
ra
wh
eat
cast
or
Urea 10.4 -139.6 -12.1 11.2 -2.4 -60.6 10.7 5.6 25.2
DAP 14.6 -1.4 -72.7 35.2 57.2 5.3 47.1 -11.2 24.6
MOP 44.4 ND ND -1045.8 100.0 37.0 22.7 ND ND
SSP -14.4 0.6 ND -756.1 88.2 82.9 ND ND 31.6
NPK Mixture 63.7 86.6 ND ND -361.5 -35.4 ND 100.0 ND
FYM (Ton/ha) 9.0 12.8 -10.0 38.5 -34.4 54.6 -15.9 67.5 16.8
Organic fertiliser -233.1 100.0 ND 29.6 -381.4 44.7 100.0 ND 100.0
Others 100.0 100.0 ND 100.0 100.0 100.0 100.0 ND ND
Note: ND implies no deviation or not available
Source: Field Survey data
5.7 Use of Organic Fertilisers
The details on use of organic fertilizers by sample farmers are
presented in Table 5.7. It can be seen from the table that most of soil-test
as well as control farmers had used farm yard manure (FYM), as expected.
About 70 per cent of soil test farmers and 64 per cent of control farmers
applied FYM on their soil. About 39 per cent of net cropped area of soil
test farmers and 36.5 per cent of net cropped area of control farmers was
covered with FYM. Easy availability and relatively low price of the FYM
may be the reason behind its high adoptability in crop cultivation.
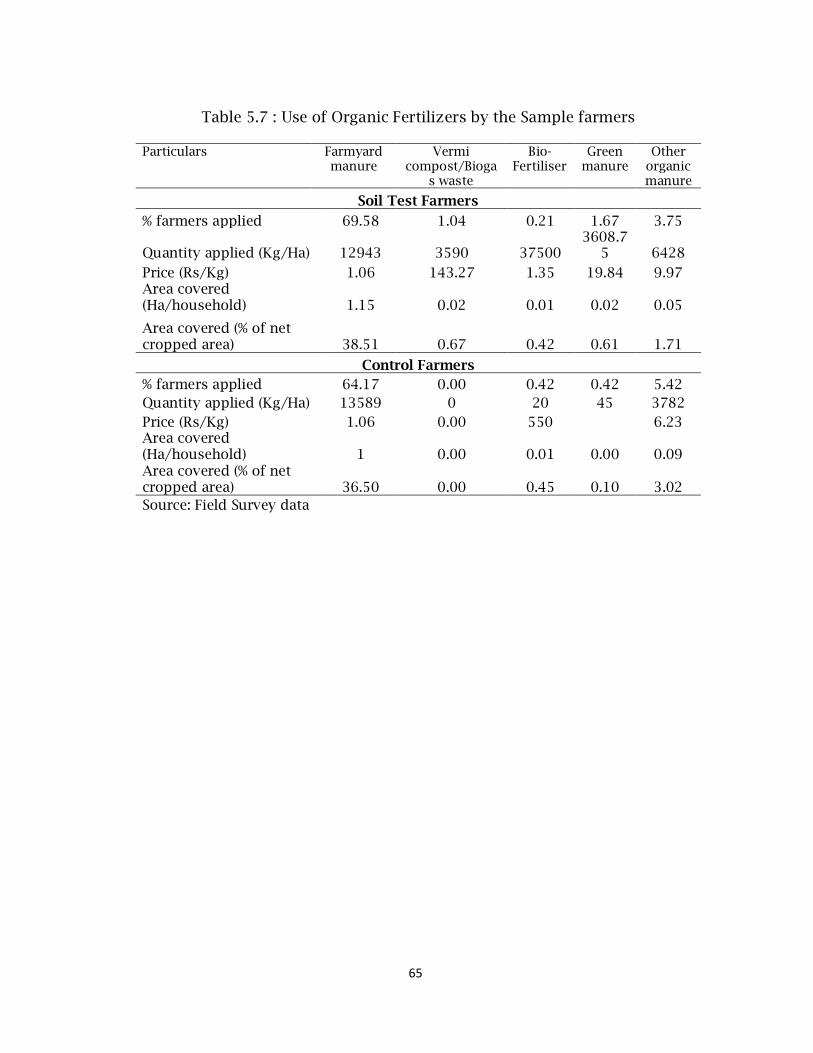
65
Table 5.7 : Use of Organic Fertilizers by the Sample farmers
Particulars Farmyard manure
Vermi compost/Bioga
s waste
Bio-Fertiliser
Green manure
Other organic manure
Soil Test Farmers
% farmers applied 69.58 1.04 0.21 1.67 3.75
Quantity applied (Kg/Ha) 12943 3590 37500 3608.7
5 6428
Price (Rs/Kg) 1.06 143.27 1.35 19.84 9.97 Area covered (Ha/household) 1.15 0.02 0.01 0.02 0.05
Area covered (% of net cropped area) 38.51 0.67 0.42 0.61 1.71
Control Farmers % farmers applied 64.17 0.00 0.42 0.42 5.42 Quantity applied (Kg/Ha) 13589 0 20 45 3782 Price (Rs/Kg) 1.06 0.00 550 6.23 Area covered (Ha/household) 1 0.00 0.01 0.00 0.09 Area covered (% of net cropped area) 36.50 0.00 0.45 0.10 3.02 Source: Field Survey data
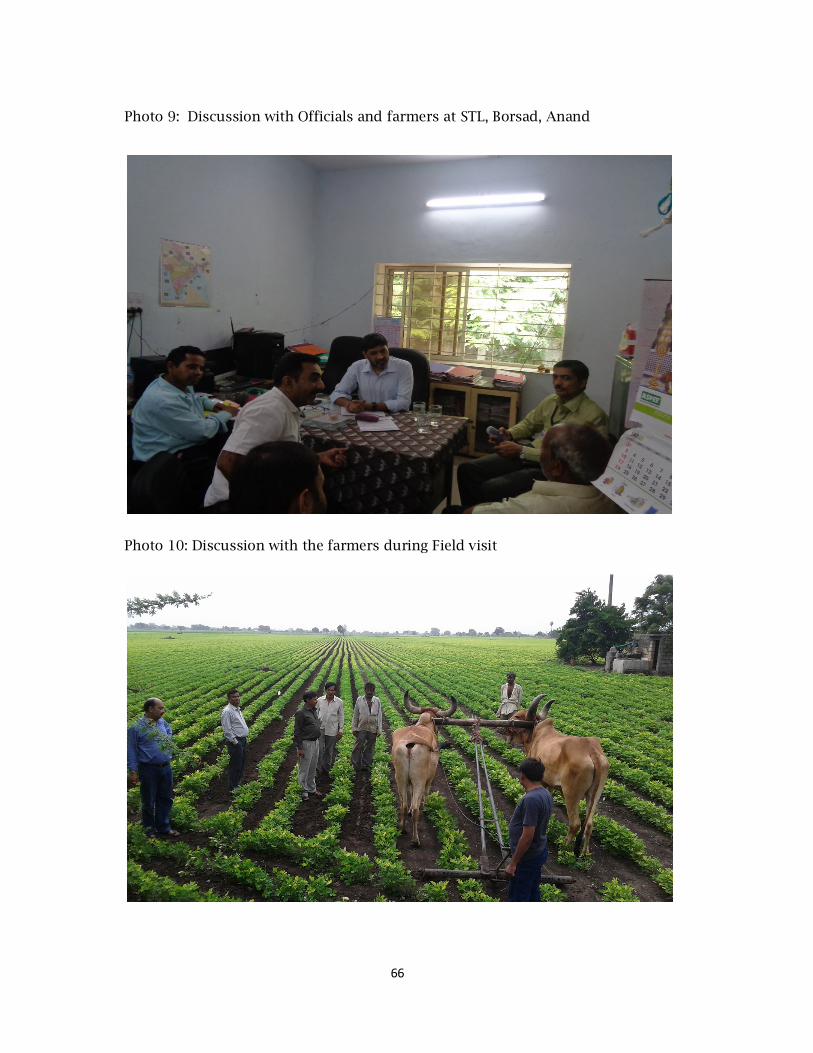
66
Photo 9: Discussion with Officials and farmers at STL, Borsad, Anand
Photo 10: Discussion with the farmers during Field visit
67
Chapter VI
Assessing Impact of Adoption of SHC Recommended Doses of Fertilisers
6.1 Introduction
The adoption of recommended doses is believed to benefit the farmers in
terms of improvement in yield, net returns and better soil health. In this
chapter, an attempt has been made to examine these aspects. The changes
observed after the application of recommended doses of fertilisers on
reference crops have been analysed in detail.
6.2 Crop Yield Differences between Soil Test and Control farmers
The adoption of recommended doses may not lead to more yields
compared to non-adopters. Sometimes, application of higher fertiliser
doses irrespective of recommended doses results in more yield ignoring
the implications for soil health. The application of recommended doses
necessarily required to promote sustainable agriculture with better soil
health along with reasonable level of yield. The implications of adoption
of recommended doses of fertiliser on change in crop yield can be seen in
Table 6.1.
It is revealed that the soil test group realized better average yield
compared to the control group. Thus, overall yield impact was better in
case of soil test farmers. Crop wise analysis reveals that out of thirteen
crops during Kharif season, only two crops have experienced fall in yield
while ten crops such as cotton, tobacco, castor, maize, paddy, bajra, udad,
jowar, tur, guar and banana have experienced increase in yield by soil test
group of farmers, while comparing the same with non-soil test group of
farmers. Looking at this angle, it is evident that the soil test has helped
the farmers in stabilizing their individual crop yields, as expected. Overall,
all soil test farmers have experienced higher yield over control or non-soil
test farmers.
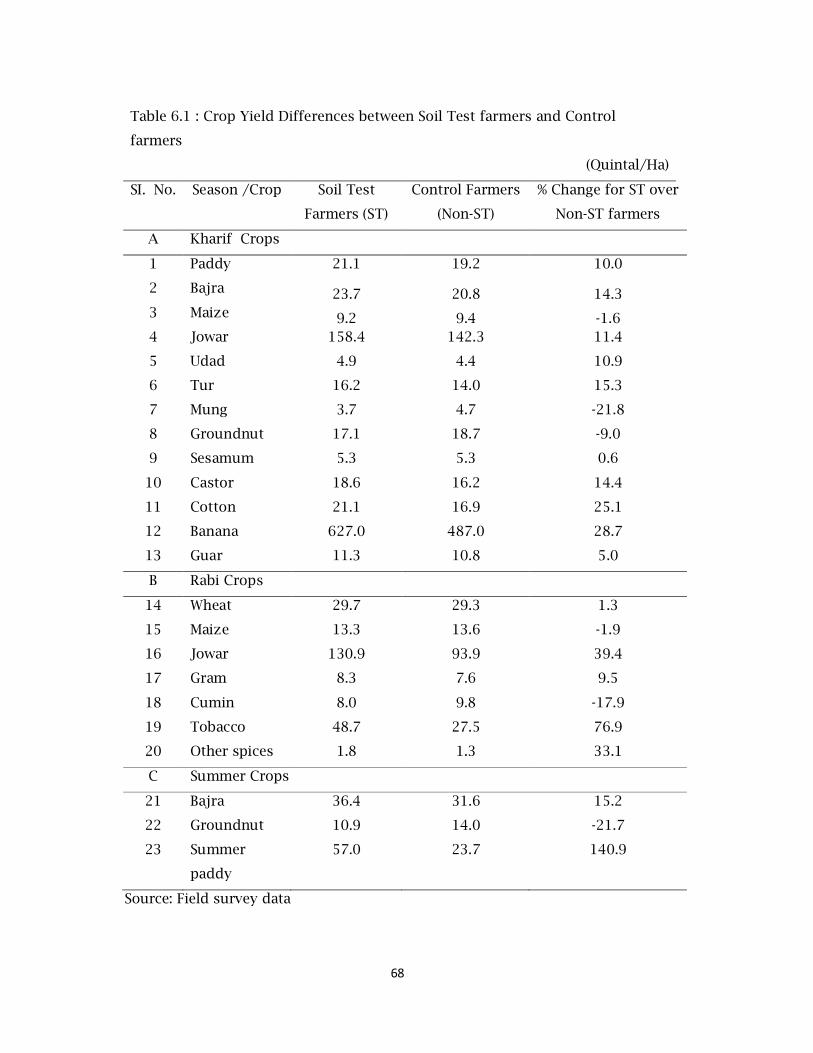
68
Table 6.1 : Crop Yield Differences between Soil Test farmers and Control
farmers
(Quintal/Ha)
SI. No. Season /Crop Soil Test
Farmers (ST)
Control Farmers
(Non-ST)
% Change for ST over
Non-ST farmers
A Kharif Crops
1 Paddy 21.1 19.2 10.0
2 Bajra 23.7 20.8 14.3 3 Maize 9.2 9.4 -1.6 4 Jowar 158.4 142.3 11.4
5 Udad 4.9 4.4 10.9
6 Tur 16.2 14.0 15.3
7 Mung 3.7 4.7 -21.8
8 Groundnut 17.1 18.7 -9.0
9 Sesamum 5.3 5.3 0.6
10 Castor 18.6 16.2 14.4
11 Cotton 21.1 16.9 25.1
12 Banana 627.0 487.0 28.7
13 Guar 11.3 10.8 5.0
B Rabi Crops
14 Wheat 29.7 29.3 1.3
15 Maize 13.3 13.6 -1.9
16 Jowar 130.9 93.9 39.4
17 Gram 8.3 7.6 9.5
18 Cumin 8.0 9.8 -17.9
19 Tobacco 48.7 27.5 76.9
20 Other spices 1.8 1.3 33.1
C Summer Crops
21 Bajra 36.4 31.6 15.2
22 Groundnut 10.9 14.0 -21.7
23 Summer
paddy
57.0 23.7 140.9
Source: Field survey data
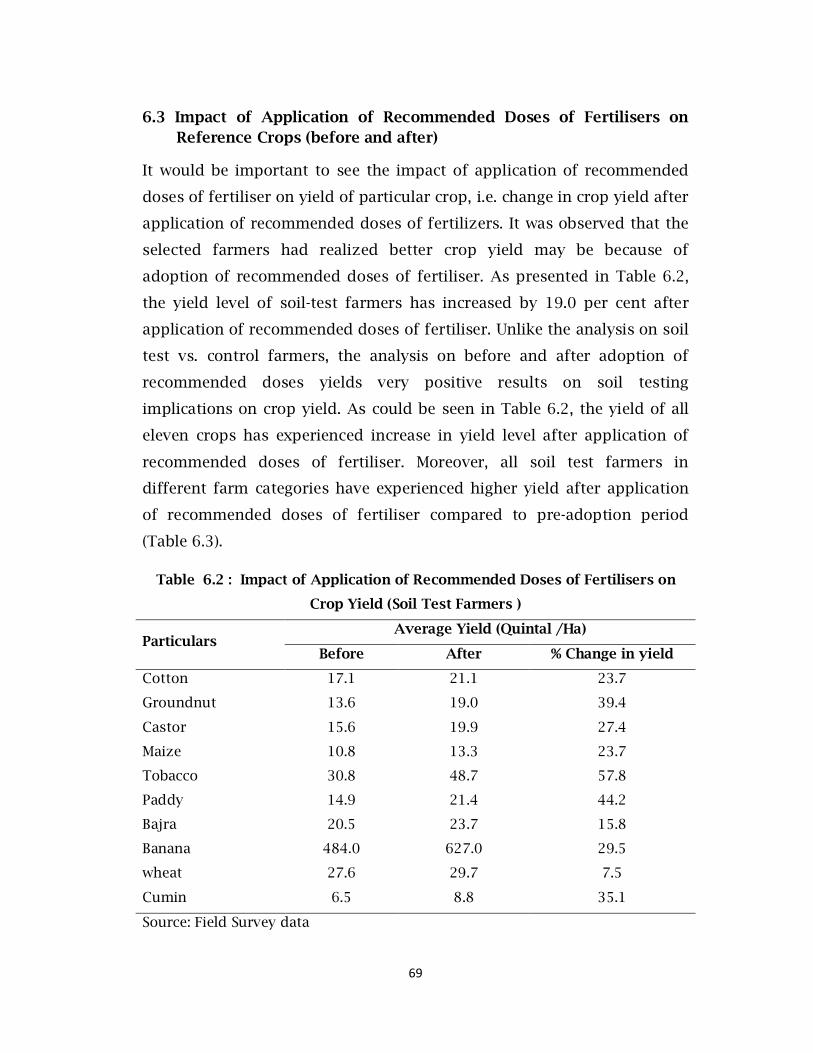
69
6.3 Impact of Application of Recommended Doses of Fertilisers on Reference Crops (before and after)
It would be important to see the impact of application of recommended
doses of fertiliser on yield of particular crop, i.e. change in crop yield after
application of recommended doses of fertilizers. It was observed that the
selected farmers had realized better crop yield may be because of
adoption of recommended doses of fertiliser. As presented in Table 6.2,
the yield level of soil-test farmers has increased by 19.0 per cent after
application of recommended doses of fertiliser. Unlike the analysis on soil
test vs. control farmers, the analysis on before and after adoption of
recommended doses yields very positive results on soil testing
implications on crop yield. As could be seen in Table 6.2, the yield of all
eleven crops has experienced increase in yield level after application of
recommended doses of fertiliser. Moreover, all soil test farmers in
different farm categories have experienced higher yield after application
of recommended doses of fertiliser compared to pre-adoption period
(Table 6.3).
Table 6.2 : Impact of Application of Recommended Doses of Fertilisers on
Crop Yield (Soil Test Farmers )
Particulars Average Yield (Quintal /Ha)
Before After % Change in yield
Cotton 17.1 21.1 23.7
Groundnut 13.6 19.0 39.4
Castor 15.6 19.9 27.4
Maize 10.8 13.3 23.7
Tobacco 30.8 48.7 57.8
Paddy 14.9 21.4 44.2
Bajra 20.5 23.7 15.8
Banana 484.0 627.0 29.5
wheat 27.6 29.7 7.5
Cumin 6.5 8.8 35.1
Source: Field Survey data
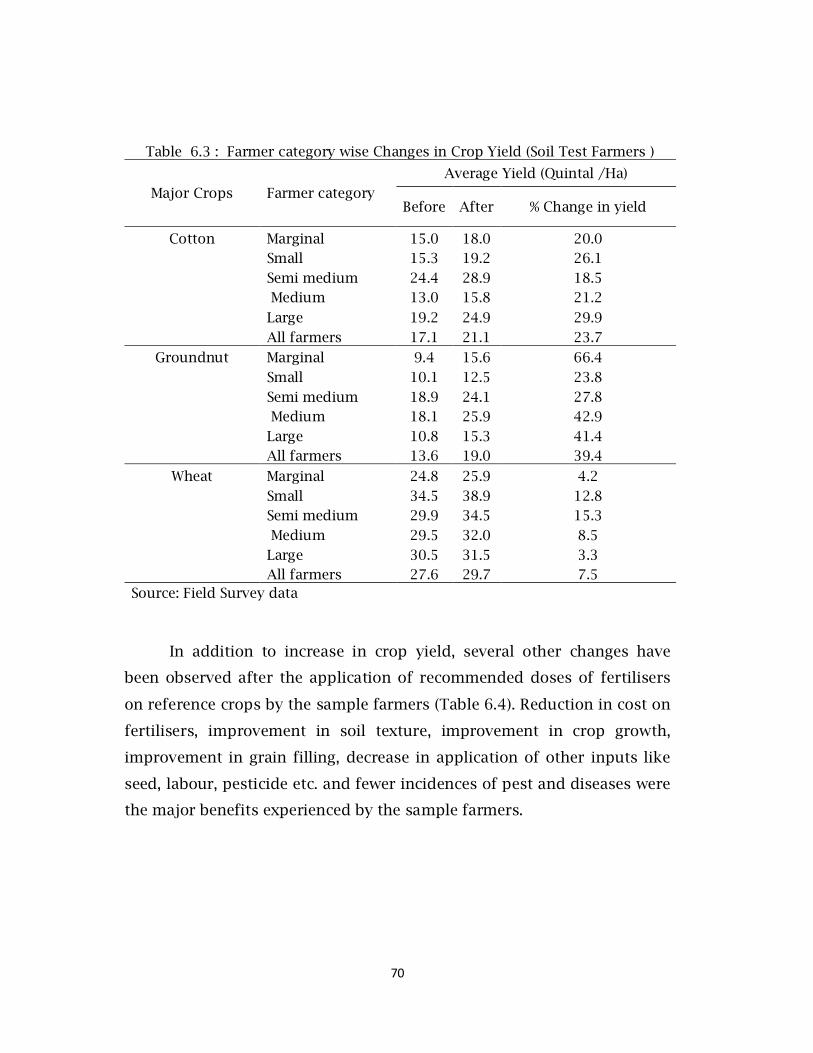
70
Table 6.3 : Farmer category wise Changes in Crop Yield (Soil Test Farmers )
Major Crops Farmer category
Average Yield (Quintal /Ha)
Before After % Change in yield
Cotton Marginal 15.0 18.0 20.0 Small 15.3 19.2 26.1
Semi medium 24.4 28.9 18.5 Medium 13.0 15.8 21.2
Large 19.2 24.9 29.9
All farmers 17.1 21.1 23.7
Groundnut Marginal 9.4 15.6 66.4
Small 10.1 12.5 23.8
Semi medium 18.9 24.1 27.8 Medium 18.1 25.9 42.9
Large 10.8 15.3 41.4 All farmers 13.6 19.0 39.4
Wheat Marginal 24.8 25.9 4.2
Small 34.5 38.9 12.8 Semi medium 29.9 34.5 15.3
Medium 29.5 32.0 8.5
Large 30.5 31.5 3.3 All farmers 27.6 29.7 7.5
Source: Field Survey data
In addition to increase in crop yield, several other changes have
been observed after the application of recommended doses of fertilisers
on reference crops by the sample farmers (Table 6.4). Reduction in cost on
fertilisers, improvement in soil texture, improvement in crop growth,
improvement in grain filling, decrease in application of other inputs like
seed, labour, pesticide etc. and fewer incidences of pest and diseases were
the major benefits experienced by the sample farmers.
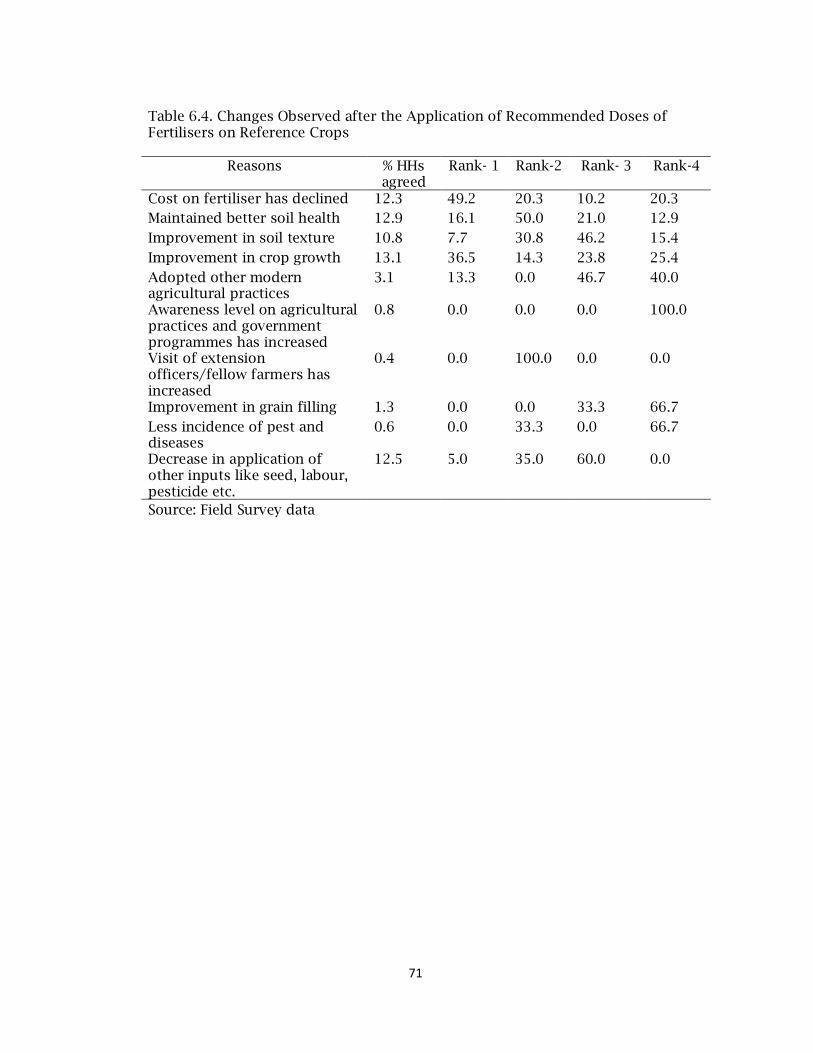
71
Table 6.4. Changes Observed after the Application of Recommended Doses of Fertilisers on Reference Crops
Reasons % HHs agreed
Rank- 1 Rank-2 Rank- 3 Rank-4
Cost on fertiliser has declined 12.3 49.2 20.3 10.2 20.3 Maintained better soil health 12.9 16.1 50.0 21.0 12.9 Improvement in soil texture 10.8 7.7 30.8 46.2 15.4 Improvement in crop growth 13.1 36.5 14.3 23.8 25.4 Adopted other modern agricultural practices
3.1 13.3 0.0 46.7 40.0
Awareness level on agricultural practices and government programmes has increased
0.8 0.0 0.0 0.0 100.0
Visit of extension officers/fellow farmers has increased
0.4 0.0 100.0 0.0 0.0
Improvement in grain filling 1.3 0.0 0.0 33.3 66.7 Less incidence of pest and diseases
0.6 0.0 33.3 0.0 66.7
Decrease in application of other inputs like seed, labour, pesticide etc.
12.5 5.0 35.0 60.0 0.0
Source: Field Survey data
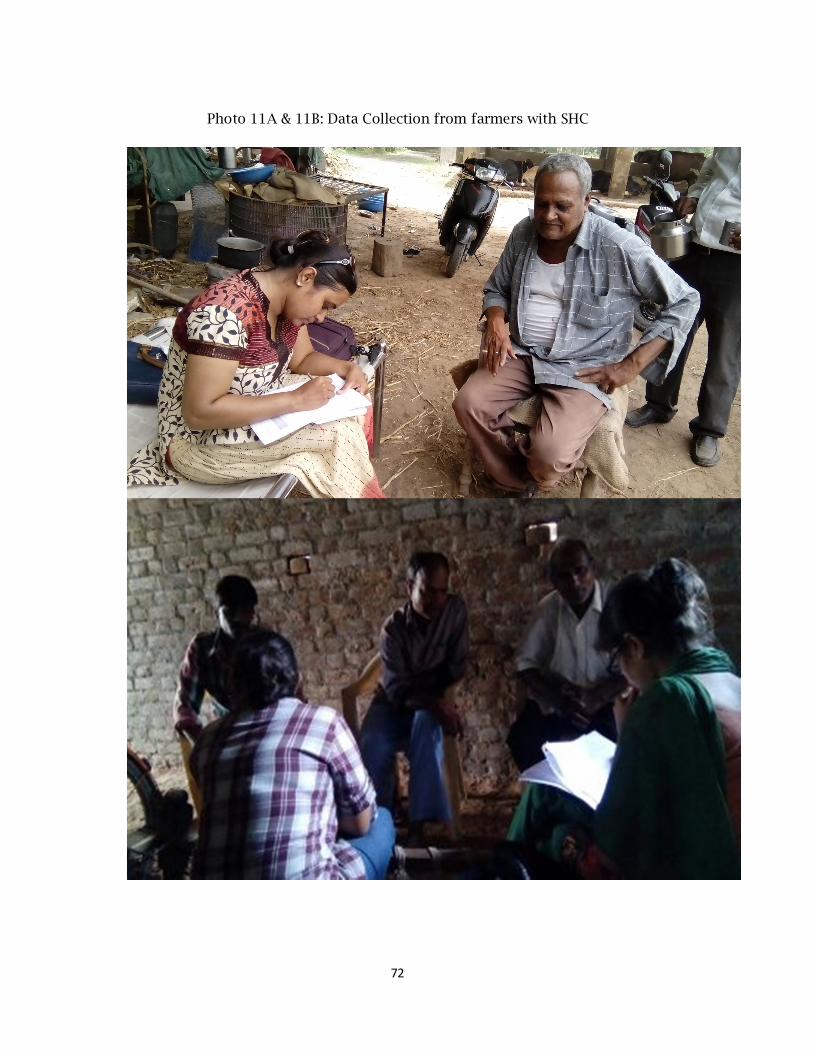
72
Photo 11A & 11B: Data Collection from farmers with SHC
73
Chapter VII
Summary and Conclusions
7.1 Introduction
Since green revolution period, the fertiliser application has tremendously
increased. The indiscriminate use of chemical fertilisers by farmers has
led to deterioration of soil structure, wastage of nutrients, destruction of
soil microorganisms and scorching of plants at the extreme cases. The
Government of India has undertaken initiatives to encourage the farmers
for balanced use of fertilisers. Among various states of India, Gujarat has
been a leading state in streamlining these programmes, among which Soil
Health Card Programme is a major one. Under this programme, Soil Health
Cards are being provided to all farmers in the country at an interval of 3
years so as to enable the farmers to apply appropriate recommended
doses of nutrients to realize improved and sustainable soil health and
fertility status and also higher per unit yields. As part of this massive
programme, soil samples testing and distribution of SHC to farmers are
carried out on a regular basis as per the norms.
Since the programme has been implemented on a larger scale, it is
necessary to evaluate its implementation, extent of soil testing for
mapping nutrient deficiency and adoption of recommended doses of
fertilisers by the farmers based on the soil tests and the effects of the
programme on crop productivity. Since the Gujarat state is one of the
front runners in implementation of the scheme well before (2003-04) the
launch of the Scheme at all-India level (2015-16), the present study
attempts to undertake a detailed systematic study (1) to assess the
progress in implementation of Soil Health Card Programme in Gujarat; (2)
to evaluate the quality of implementation of the programme in terms of
quality of soil sample collection, soil testing for different nutrients,
generation and timely delivery of soil health cards, and the extent of use
74
and acceptability of the SHCs by the farmers; (3) to examine the level of
adoption and constraints in the application of recommended doses of
fertilizers based on soil test reports by the farmers; and (4) to analyse the
impact of adoption of recommended doses of fertilisers on soil health,
crop productivity and returns.
The present study is based on both secondary and primary level
data. The reference year for the study based on primary data collection
and analysis is 2014-15. 11 districts covering all 8 agro climatic zones
(ACZ) of the state were included for the detailed study. The total sample
size was 720, out of which 480 were the soil test farmers and 240 were
the non-soil test farmers. Following three types of Soil Health Cards
(SHCs) were used for comparative analysis:
SHCs available with the farmers (issued under SHC
Programme by the Government of Gujarat (SHC-GOG)
SHCs in the names of corresponding farmers uploaded on
SHC portal maintained at AAU, Anand (SHC-AAU)
SHCs generated afresh at Krishi Vigyan Kendra (KVK), Kheda
(SHC-KVK)
7.2 Progress in Soil Health Card Programme in Gujarat
Gujarat is the leading state in India in streamlining the Soil Health Card
(SHC) Programme for the benefit of farmers at the grass-root level. So far,
a total of 53.69 lakh soil health cards have been generated and given to
farmers by the end of 2013-14. Out of which, 6.26 lakh soil health cards
have been distributed in the year 2013-14 alone. Along with increase in
number of SHCs distributed to farmers from 2.27 lakh in 2004-05 to 53.69
lakh in 2013-14, the number of soil testing labs (STL) has also increased
from 20 in 2004-05 to 134 in 2013-14 at the rate of 17.9 per cent per
annum. Similarly, the annual soil sample analyzing capacity has increased
from 2.34 lakh in 2004-05 to 10.3 lakh in 2013-14.
75
7.3 Effect of SHC Programme on Fertiliser Consumption
The consumption of NPK in Gujarat has increased from 3.57 lakh metric
tonnes in 1980-81 to 19.39 lakh metric tonnes in 2010-11, implying an
increase by 5.4 times. The NPK consumption per hectare of gross cropped
area (GCA) has also increased by 16.5 per cent, from 32.6 kg in 1980-81 to
138.1 kg in 2010-11. But it has declined thereafter to 109.0 kg/ha in 2012-
13. The total consumption of NPK in the state has also decreased from
19.39 lakh metric tonnes in 2010-11 to 13.42 lakh metric tonnes in 2012-
13. The decline in fertiliser consumption during the later period may be
partly due to increased awareness generated by the Soil Health Card (SHC)
programme in the state about the negative consequences of application of
overdoses of fertiliser and positive effects of balanced fertiliser
application on soil health. However, the NPK ratio has been gradually
diverged from the ideal ratio of 4:2:1. It has diverged from 4.9:2.8:1.0
during 1980-81 to around 10.0:8.0:1.0 during 2015-16, in spite of
implementation of SHC Scheme in the state since 2003-04.
7.4 Summary of Findings from Field Data
Soil Test Facilities and Test results
The cost of soil test was nil for all soil test farmers since it was
provided by the free of cost by the Government. Some of the
progressive farmers were also provided the detailed soil test
analysis by the cooperatives through private soil testing labs.
However, the average distance travelled to soil test lab (STL) by the
farmers was 69.7 km. The area covered under soil test as a
percentage of net operated area varied from 11.9 per cent to 25.8
per cent across farmer categories. Surprisingly, the proportion of
soil tested area varied inversely with size classes of the farmers,
i.e., large farmers had lowest proportion of their lands tested and
vice -versa.
It was very surprising to note that the majority of samples were not
collected by designated personnel, i.e., Gram Mitras or Gram Sevaks.
76
There is no information about 49.4 per cent of personnel involved
in collection of soil samples from farmers’ field. The collection of
soil sample is scientific and systematic process which requires the
training of same. Thus, the trained staff should have been collected
all soil sample to have correct results about soil health. The selected
farmers opined that inadequate number of STLs and staff shortages
have affected the quality of soil testing service provided by these
agencies.
About half of the farmers expressed that Soil sample was not taken
from their lands in their knowledge. The average distance of soil
tested plots from the villages was around 2.0 km. None of the
sample farmers could get the services of Mobile Soil Testing Vans.
The major sources of information about the SHC programme were
the government officials at grass root level (Gram Sevek, Gram Mitra
and Extension Officers). About 84 per cent of all farmers were
appraised by these government officials. The State Agricultural
Universities/Krishi Vghyan Kendras, friends, neighbours and fellow
farmers were the next major sources of information for the sample
farmers.
The major reason behind the soil testing by the farmers was that it
was available free of cost (67.1%). Other motivational factors were to
maintain better soil health (57.9%), increase in crop yield (57.7%), got
motivated from village demonstration/training/exposure visits to
places with best farming practices (11.5%).
There are some farmers who had not tested their farm soil. It is
because of the fact that spread of SHC programme was limited due
to lack of awareness among the farmers. Among non-soil test
farmers, about 72.0 per cent farmers expressed that they were not
aware about whom to contact for details on soil testing; whereas
another 60.0 per cent farmers mentioned that they were not aware
about the benefits of this programme. The larger distance of STL
77
from villages was another de-motivating factor for about 13.3 per
cent of farmers.
The overall soil quality of farm plots of sample farmers was good.
The majority of farmers had normal level of physical parameters
(pH, Ec) and primary nutrients (NPK). Such kind of pattern was
noticed in all three kinds of SHCs, i.e., SHCs supplied by
Government of Gujarat (GOG-SHC), SHCs downloaded from Anand
Agricultural University (AAU-SHC) and SHCs generated by KVK
Kheda (KVK-SHC), with some exceptions.
As far as secondary nutrients (S, Mg, Ca) and micronutrients (Zn, Fe,
Cu, Mn) in the soils of the farmers are concerned, varied results
were reported in different SHC reports. The status of secondary and
micronutrients was not mentioned in about 76 per cent to 80 per
cent SHCs generated by GOG (GOG-SHC). In the remaining 20
percent of GOG-SHCs with information on secondary and micro-
nutrients, the content of micronutrient and secondary nutrients
were found normal in about 90 per cent SHCs. This is in sharp
contrast to KVV-SHCs in which, the content of micronutrients such
Copper and Manganese was found very high in the majority of SHCs
of sample farmers (81% and 99.4%, respectively). The Zinc and Iron
content in the soils was found normal in case of 31 per cent and 40
per cent of farmers respectively, as reported by KVK-SHCs. In
contrast, the same situation was found in more than 90 per cent of
SHCs, as per the GOG-SHC recommendations.
Recommended Doses of Fertilisers on Soil Test Basis
The quantity of recommended doses of Urea, DAP/SSP and MOP was
slightly higher in case of KVK-SHC compared to GOG-SHC,
particularly, in case of cotton, maize and bajra. In case of cotton
crop, the low level of nitrogen was found in case of about 64 per
cent of farmers as per KVK-SHC compared to 31 per cent as per
GOG-SHC.
78
The quantity of recommended doses of fertilisers as per the GOG-
SHC and AAU-SHC are more or less close, with some discrepancies.
For example, there is recommended doses of MOP for cotton, paddy
and sugarcane as per GOG-SHC reports, which are completely
absent in AAU-SHC reports. Also other figures between these two
group of reports should have been exactly the same, had the same
SHCs uploaded on the website, which were distributed to the
farmers. There are some other evidences that cards uploaded on the
AAU websites don’t exactly match including SHC reference
numbers.
Adoption of Recommended Doses of Fertilisers and Its Constraints
The level of adoption of recommended doses were examined from
three different angles: (i) farmers own perception, (ii) deviation of
fertiliser use from the recommended doses of fertilisers and (iii)
deviation from the recommended doses in terms of nutrient content
(NPK). It was observed that the number of fertiliser products used
by the farmers varied a lot among the farmers. To make it simple,
all the fertiliser products recommended were expressed in terms of
major nutrients (N, P, K).
As per the perception of farmers, the level of adoption of
recommended doses by the soil test farmers was only 15.4 per
farmers. However, with a method of taking a deviation of 15% from
recommended doses of NPK, the level of adoption of NPK nutrients
varied from 0.6 per cent to 12.3 per cent, as per the GOG-SHC
reports. The level of adoption of NPK nutrients was found to be
further lower while we used the KVK-SHC data. In terms of later
datasets, the level of adoption of NPK nutrients varied from nil to
8.8 per cent.
The attempts were also made to broaden the range to 25 per cent.
However, there was no much significant change in adoption level.
79
With 25 per cent range, the level of adoption of NPK nutrients
varied from as low as 1.5 per cent to 20.0 per cent, as per the GOG-
SHC reports; and from 1.7 per cent to 13.5 per cent, as per the KVK-
SHC reports.
Underlying Reasons for Adoption or Non-adoption of Recommended Doses
of Fertilizers
Those farmers, who adopted the recommended doses, were asked
about the underlying reasons for application of recommended doses
of fertilizers. About 13.1 per cent farmers believed that the cost on
fertiliser use and thus cost of production would be reduced by
adopting the recommended doses, since it may reduce the quantity
of recommended doses of fertilisers. About 14.0 per cent farmers
expressed that they wanted to apply recommended doses to
maintain better soil health and to increase crop yield. The fitted
Logit Model finds that, net sown area, total soil tested area and
education level of farmers influenced the decision to adopt the
recommended doses of fertilisers as suggested in SHCs.
The soil test farmers have faced several difficulties in applying
recommended doses of fertiliser. Among these constraints,
difficulty in understanding and following application of
recommended doses, unavailability of technical advice on method
and time of fertiliser application, high prices of fertilisers and
unavailability of required fertilisers in adequate quantity were the
major ones.
As regards the use of organic fertilizers by sample farmers, most of
soil-test as well as control farmers had used farm yard manure
(FYM). Among soil-test farmers, about 69.6 per cent of soil test
farmers and 64.2 per cent of control farmers applied FYM on their
soil. About 38.5 per cent of net cropped area of soil test farmers
and 36.5 per cent of net cropped area of control farmers was
covered with FYM. Easy availability and relatively low price of the
80
FYM may be the reason behind its high and dominant use in crop
cultivation.
Impacts of Adoption of Recommended Doses of Fertilisers
The soil test group realized better average yield compared to the
control group. Out of thirteen crops during Kharif season, only two
crops have experienced fall in yield while ten crops such as cotton,
tobacco, castor, maize, paddy, bajra, udad, jowar, tur, guar and
banana have experienced increase in yield by soil test group of
farmers, while comparing the same with non-soil test group.
The analysis of crop yield before and after soil tests revealed that
the yield level of soil-test farmers has increased by about 30 per
cent after application of recommended doses of fertilizer. All soil
test farmers in different farm categories have experienced higher
yield after application of recommended doses of fertilizer compared
to pre-adoption period.
In addition to increase in crop yield, several other changes have
been observed after the application of recommended doses of
fertilisers on reference crops by the sample farmers. Reduction in
cost on fertilisers, improvement in soil texture, improvement in
crop growth, improvement in grain filling, decrease in application of
other inputs like seed, labour, pesticide etc. and fewer incidences of
pest and diseases were the major benefits experienced by the
sample farmers.
7.5 Policy Implications
The Soil Health Card (SHC) programme is highly beneficial
programme for sustainable growth in agriculture. However, there
have been a number of shortcomings in implementation of the
programme which need to be taken care of for strengthening this
farmer friendly programme.
81
It was noticed that, in view to achieve the quantity targets fixed for
some period/s, quality norms were not given proper attention. As a
result, a majority of farmers did not use the cards judiciously. They
could not attach more importance to it over their own long
experiences of farming.
In majority of cases, it was found that the SHCs were not given to
the farmer or these were not in custody of farmers. Those were kept
together somewhere with some officials or local leaders. Thus, in
true sense, it was no use to the farmers.
It was observed that many farmers even failed to understand the
content of the card. They failed to calculate the recommended doses
of various fertilisers required for their pieces of lands. Thus, the
information on SHC should be provided in simple format and
understandable language.
The level of adoption of recommended doses by the soil test
farmers was reasonably less due to various constraints, viz.
difficulty in understanding and following application of
recommended doses as stated in Soil Health Cards, unavailability of
technical advice on method and time of fertiliser application, and
high prices of fertilisers. Adequate efforts should be made to
eliminate such constraints in order to increase the adoption level
of recommended doses of fertilizers.
Activities of Soil health Card Programme may be organised in a
particular village in campaign mode. All stakeholders [such as
farmers, farmer friends (Gram Mitras), village level workers (VLWs),
Block level officers fertilizer industries, Co-op Society, SAU students
(as part of their internship of farmer’s field /village for technical
exposure), people representatives] should be brought to common
platforms on some occasions so as to bring qualitative
improvements and to raise the level of awareness in the villages.
The inadequate number of Soil Testing Lab (STLs) in the State has
severely affected the quality of service provided to the farmers, as
82
opined by the most of the sample farmers. Therefore, adequate STL
facility should be created/made available in nearby areas, at least at
the Taluka level.
The daunting task ahead can be gauged by the fact that it would
cost at least Rs.3 crore to set up a new STL. The number of new
STLs is not growing at the rate the targets have been increasing to
generate and distribute SHCs, which is not feasible. The special
annual targets must be set and monitored to establish or increase
number of STLs and associated staff strength and to renovate the
existing STLs with regular training and capacity building activities.
Looking at existing situation of inadequate staff in implementation
of scheme, the involvement of non-governmental organizations and
public private partnership (PPP) mode of operation may be
promoted for the benefits of the farmers. Alternatively,
establishment of private STLs should be encouraged/ promoted
with some government incentives/support.
The soil samples collection need to be monitored properly since
about 50 per cent of soil test farmers did not know when the soil
samples from their lands were collected. Some of the farmers
during discussion reported that samples had been collected from a
single plot but had been shown for a large number of plots. Such
findings raises questions about the reliability of the soil test results
and debilitating farmers’ confidence on the recommendations given
in the SHCs. Therefore, necessary steps to be taken to ensure
quality implementation so as to raise the confidence level of the
farmers.
One way to raise the level of confidence of the farmers is to
demonstrate the usefulness of the recommendations by applying
recommended doses of fertiliser on experimental plots at every
village or at least at Gram Panchayat level. If the better results can
be demonstrated on the experimental plots compared to farmers’
field, farmers will be self-motivated to have SHCs.
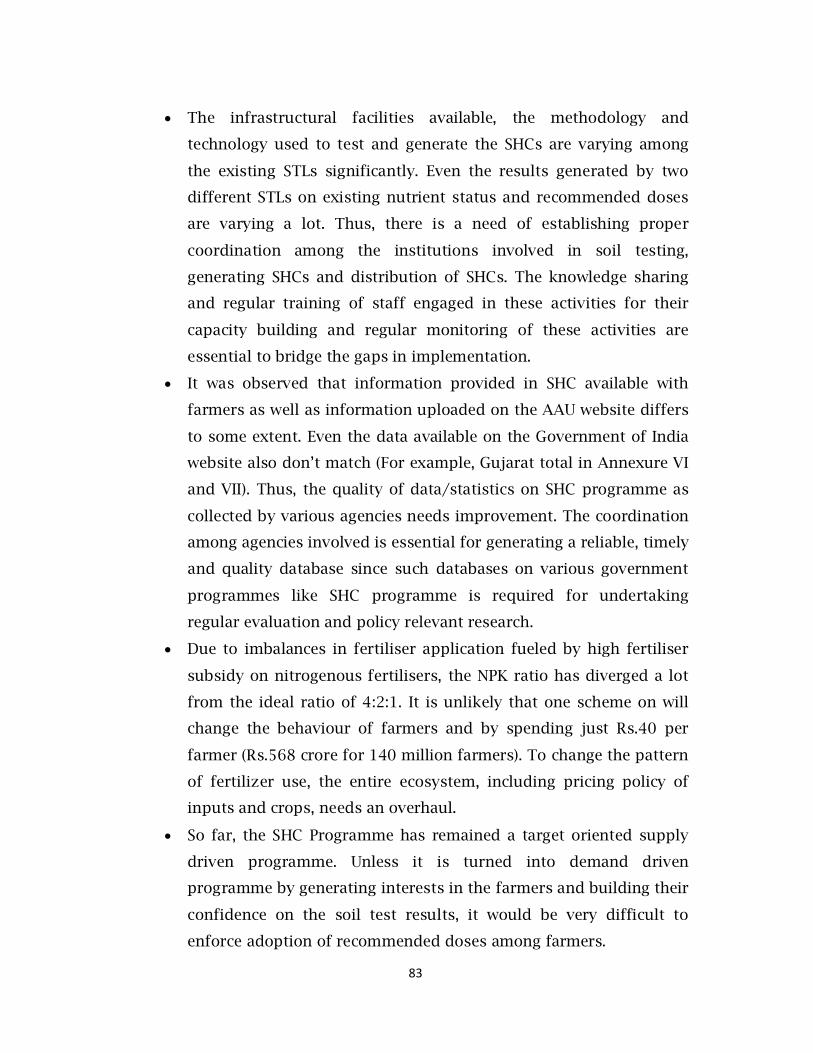
83
The infrastructural facilities available, the methodology and
technology used to test and generate the SHCs are varying among
the existing STLs significantly. Even the results generated by two
different STLs on existing nutrient status and recommended doses
are varying a lot. Thus, there is a need of establishing proper
coordination among the institutions involved in soil testing,
generating SHCs and distribution of SHCs. The knowledge sharing
and regular training of staff engaged in these activities for their
capacity building and regular monitoring of these activities are
essential to bridge the gaps in implementation.
It was observed that information provided in SHC available with
farmers as well as information uploaded on the AAU website differs
to some extent. Even the data available on the Government of India
website also don’t match (For example, Gujarat total in Annexure VI
and VII). Thus, the quality of data/statistics on SHC programme as
collected by various agencies needs improvement. The coordination
among agencies involved is essential for generating a reliable, timely
and quality database since such databases on various government
programmes like SHC programme is required for undertaking
regular evaluation and policy relevant research.
Due to imbalances in fertiliser application fueled by high fertiliser
subsidy on nitrogenous fertilisers, the NPK ratio has diverged a lot
from the ideal ratio of 4:2:1. It is unlikely that one scheme on will
change the behaviour of farmers and by spending just Rs.40 per
farmer (Rs.568 crore for 140 million farmers). To change the pattern
of fertilizer use, the entire ecosystem, including pricing policy of
inputs and crops, needs an overhaul.
So far, the SHC Programme has remained a target oriented supply
driven programme. Unless it is turned into demand driven
programme by generating interests in the farmers and building their
confidence on the soil test results, it would be very difficult to
enforce adoption of recommended doses among farmers.
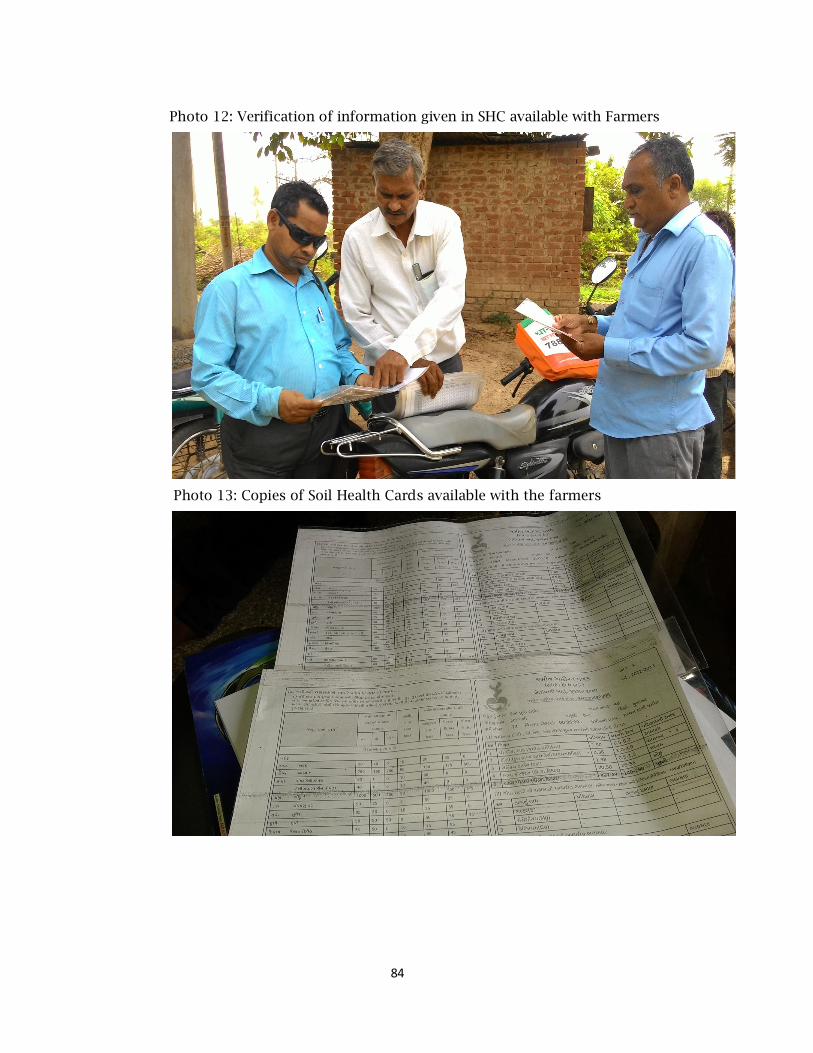
84
Photo 12: Verification of information given in SHC available with Farmers
Photo 13: Copies of Soil Health Cards available with the farmers
85
REFERENCES
Bera, Sayantan (2015), ‘A soil health card not enough for balanced
fertilizer use’, http://www.livemint.com/Politics/1xM0dNr7g9BLYw5Rx45tvK/A-soil-
health-card-not-enough-for-balanced-fertilizer-use.html, August, Accessed on 9th
February 2016.
Chand, Ramesh and L. M. Pandey (2008), “Fertiliser Growth, Imbalances and
Subsides: Trends and Implications”, Discussion Paper (NPP 02/2008),
National Centre for Agricultural Economics and Policy Research (Indian
Council of Agricultural Research), New Delhi.
Elumalai, Kannan (2016), Analysis of Farm Level Adoption of Soil Nutrient
Management Technology by Paddy Farmers in Karnataka, A paper
presented in the National Seminar on "Role of Public Policy in
Development Process (Emerging Economic/Social Scenarios in the Indian
Economy)” held at SPIESR, Ahmedabad on 4th and 5th January, 2016
FAO (2005), Fertiliser Use by Crop in India, Land and Plan Nutrition Management
Service, Land and Water Development Division, Food and Agriculture
Organization of the United Nation, Rome.
FAI (1974), A Study on Fertiliser Demand and Marketing, Volume III, All India
Summary Report, Fertiliser Association of India, New Delhi.
GOG (1991), Statistical Outline of Gujarat 1990-91, Directorate of Economics and
Statistics, Government of Gujarat, Gandhinagar, various issues
GOG (2009) Statistical Abstract 2009, Directorate of Economics and Statistics,
Government of Gujarat, Gandhinagar
GOG (2016), ‘unpublished data’, Office of Director of Agriculture, Government of
Gujarat.
GOI (2008), ‘Eleventh Five Year Plan Volume III Agriculture, Rural development,
Industry, Services, and Physical infrastructure’, Government of India, New
Delhi: Oxford University Press.
86
GOI (2011), Methods Manual on Soil Testing in India, Department of Agriculture
& Cooperation Ministry of Agriculture Government of India, New Delhi
January.
GOI (2013), ‘State of Indian Agriculture, 2012-13’, Department of Agriculture and
Cooperation, Ministry of Agriculture, Government of India, New Delhi.
GOI (2015a), ‘PM launches 'Soil Health Card scheme’, Press Information Bureau,
Government of India, New Delhi,
http://pib.nic.in/newsite/PrintRelease.aspx?relid=115589, Accessed on
19th April 2015.
GOI (2015b), ‘FAQs on Soil Health Card Scheme, Department of Agriculture and
Cooperation, Ministry of Agriculture, Government of India, New Delhi,
soilhealth.dac.gov.in/Content/FAQ/FAQ_Final_English.docx, Accessed on
2nd January 2016.
GOI (2015c), ‘Agricultural Statistics at a Glance 2014’, Department of Agriculture
and Cooperation, Ministry of Agriculture, Government of India, New Delhi
GOI (2016), Soil Health Card scheme - Road Map 2015-16, Government of India,
http://www.soilhealth.dac.gov.in/, Accessed on 4th February 2016.
Kanwar, J.S. (1997), ‘Balanced Fertiliser Use and Food Security – Overview of
Indian Scenario’, Fertiliser News, Vol.42, No. 7, pp. 63- 67.
Krishnaji. N., (1975), ‘Inter-Regional Disparities in Per Capita Production and
Productivity of Food Grains: A Preliminary Note on Trends’. Economic and
Political Weekly, Vol.10, No.33/35, pp. 1377-85.
McGuirk, A. and Y. Mundlak (1991), ‘Incentives and Constraints in the
Transformation of Punjab Agriculture’, IFPRI Research Report 87,
Washington, D.C.
Menon, K.N.N. and H.K. Lakshman Rao (1983), Is ECA Allocation Conducive to
Stimulate Fertiliser Consumption?, Fertiliser News, July 1983, pp.1-69.
87
Murgai, R., M. Ali and D. Byerlee (2001), ‘Productivity and Sustainability in Post-
Green Revolution Agriculture: the Case of Indian and Pakistan Punjab’. The
World Bank Research Observer, Vol. 16, No.2, pp.199-218.
Pathak, Mahesh, V.D. Shah and M.L. Jhala (1993), Impacts of Fertiliser Price Hike
on Gujarat Agriculture, AERC Report No. 89, Agro-Economic Research
Centre, S.P. University, Vallabh Vidyanagar, Gujarat.
Pingali, P.L. and M. Shah, (2001), ‘Policy Re-directions for Sustainable Resource
Use: The Rice-Wheat Cropping System of The Indo-Gangetic Plains’. In The
Rice-Whet Cropping System of South Asia: Trends, Constraints,
Productivity and Policy, ed. P.K. Kataki, 103-18. New York: Food Products
Press.
Pingali, Venugopal (2004), ‘Input Management’, in MOA (ed) “State of Indian
Farmers: A Millennium Study (Volume 8)”, Academic Foundation, New
Delhi.
Prasad R (2000), ‘Nutrient Management Strategies for the Next Decade:
Challenges Ahead’, www.cabdirect.org/abstracts/20001914969.html.,
Accessed on 15th September 2014.
Randhawa, M.S. ((1992), ‘Green Revolution in Punjab’, Punjab Agricultural
University, Ludhiana, India.
Rao, Hanumantha and K. Jayasree, (2000), ‘Subsidies and Fertiliser Use Efficiency
under the New Economic Policy Regime’, Rural Prosperity and Agriculture
Policies and Strategies, 197-239.
Rao, V. M., (1996), ‘Agricultural Development with A Human Face: Experiences
and Prospects’. Economic and Political Weekly, 31(26): A50-A62.
Rastogi, B.K., V. Annamalai (1981), ‘A Study on the Adoption and Diffusion of
Recommended Technology in Dryland Agriculture’, All India Coordinated
Research Project for Dryland Agrculture (AICRPDA), CRIDA, Hyderabad.
Sevak, R.D. (1982), ‘Soil Testing Services in Rajasthan’, AERC Report No. 60, Agro-
Economic Research Centre, S.P. University, Vallabh Vidyanagar, Gujarat.
88
Shah, V.D. (1989), Fertiliser Consumption in Gujarat, AERC Report No. 80, Agro-
Economic Research Centre, S.P. University, Vallabh Vidyanagar, Gujarat.
Sharma, Vijay P. and Pritee Sharma (2000), ‘Environmental Effects of Agricultural
Trade Liberalisation in Indian Agriculture’, “Rural Prosperity and
Agriculture Policies and Strategies”, pp. 419-456.
Singh, M.V. (2001), ‘Evaluation of Current Micronutrient Stocks in Different Agro-
Ecological Zones of India for Sustainable Crop Production’, Fertiliser News,
Vol. 46. Issue No.2. February, pp. 25-42.
Swain, M (2013), Problems and Prospects of Oilseeds Production in Gujarat’,
AERC Report 148, Agro-Economic Research Centre, S.P. University, Vallabh
Vidyanagar.
Swain, M.; S .S. Kalamkar and Kalpana Kapadia (2014), ‘Adoption of
Recommended Doses of Fertiliser on Soil Test Basis in Gujarat’, AERC
Report No. 154, Agro-Economic Research Centre, S. P. University
VallabhVidyanagar.
Vaidyanathan, A. (1988), ‘India’s Agricultural Development in a Regional
Perspective’, Orient Longman, Hyderabad.
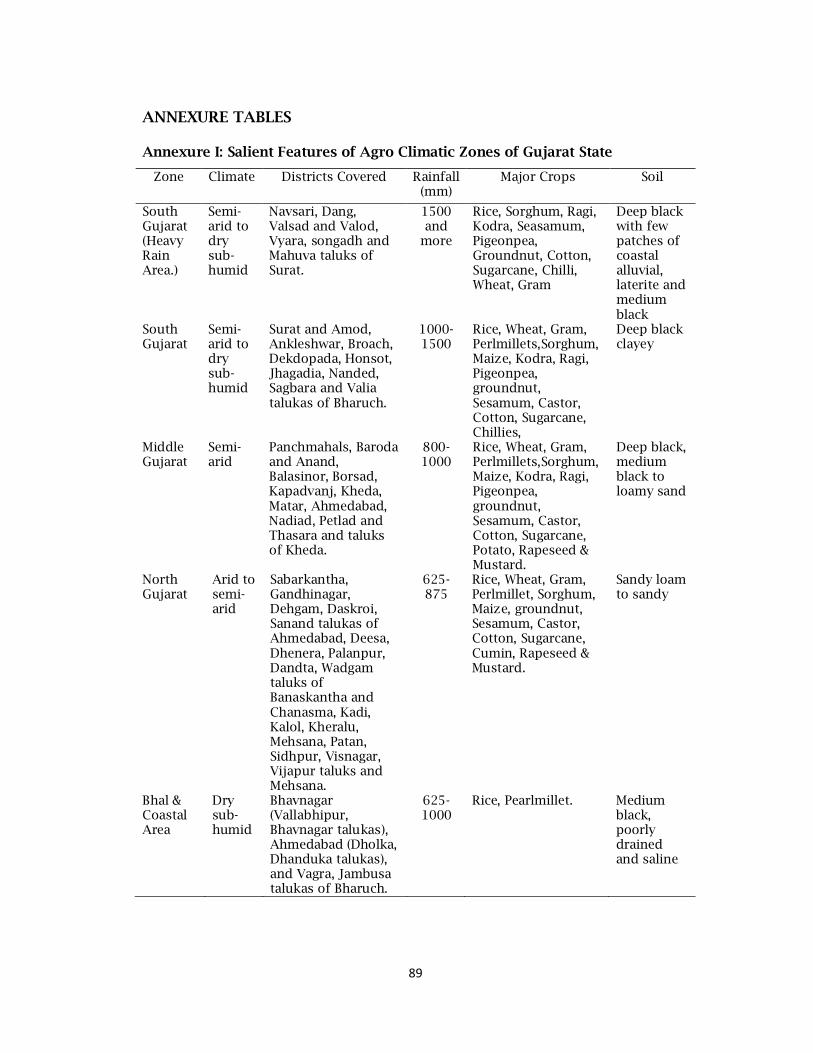
89
ANNEXURE TABLES Annexure I: Salient Features of Agro Climatic Zones of Gujarat State
Zone Climate Districts Covered Rainfall (mm)
Major Crops Soil
South Gujarat (Heavy Rain Area.)
Semi-arid to dry sub-humid
Navsari, Dang, Valsad and Valod, Vyara, songadh and Mahuva taluks of Surat.
1500 and
more
Rice, Sorghum, Ragi, Kodra, Seasamum, Pigeonpea, Groundnut, Cotton, Sugarcane, Chilli, Wheat, Gram
Deep black with few patches of coastal alluvial, laterite and medium black
South Gujarat
Semi-arid to dry sub-humid
Surat and Amod, Ankleshwar, Broach, Dekdopada, Honsot, Jhagadia, Nanded, Sagbara and Valia talukas of Bharuch.
1000-1500
Rice, Wheat, Gram, Perlmillets,Sorghum, Maize, Kodra, Ragi, Pigeonpea, groundnut, Sesamum, Castor, Cotton, Sugarcane, Chillies,
Deep black clayey
Middle Gujarat
Semi-arid
Panchmahals, Baroda and Anand, Balasinor, Borsad, Kapadvanj, Kheda, Matar, Ahmedabad, Nadiad, Petlad and Thasara and taluks of Kheda.
800-1000
Rice, Wheat, Gram, Perlmillets,Sorghum, Maize, Kodra, Ragi, Pigeonpea, groundnut, Sesamum, Castor, Cotton, Sugarcane, Potato, Rapeseed & Mustard.
Deep black, medium black to loamy sand
North Gujarat
Arid to semi-arid
Sabarkantha, Gandhinagar, Dehgam, Daskroi, Sanand talukas of Ahmedabad, Deesa, Dhenera, Palanpur, Dandta, Wadgam taluks of Banaskantha and Chanasma, Kadi, Kalol, Kheralu, Mehsana, Patan, Sidhpur, Visnagar, Vijapur taluks and Mehsana.
625-875
Rice, Wheat, Gram, Perlmillet, Sorghum, Maize, groundnut, Sesamum, Castor, Cotton, Sugarcane, Cumin, Rapeseed & Mustard.
Sandy loam to sandy
Bhal & Coastal Area
Dry sub-humid
Bhavnagar (Vallabhipur, Bhavnagar talukas), Ahmedabad (Dholka, Dhanduka talukas), and Vagra, Jambusa talukas of Bharuch.
625-1000
Rice, Pearlmillet. Medium black, poorly drained and saline
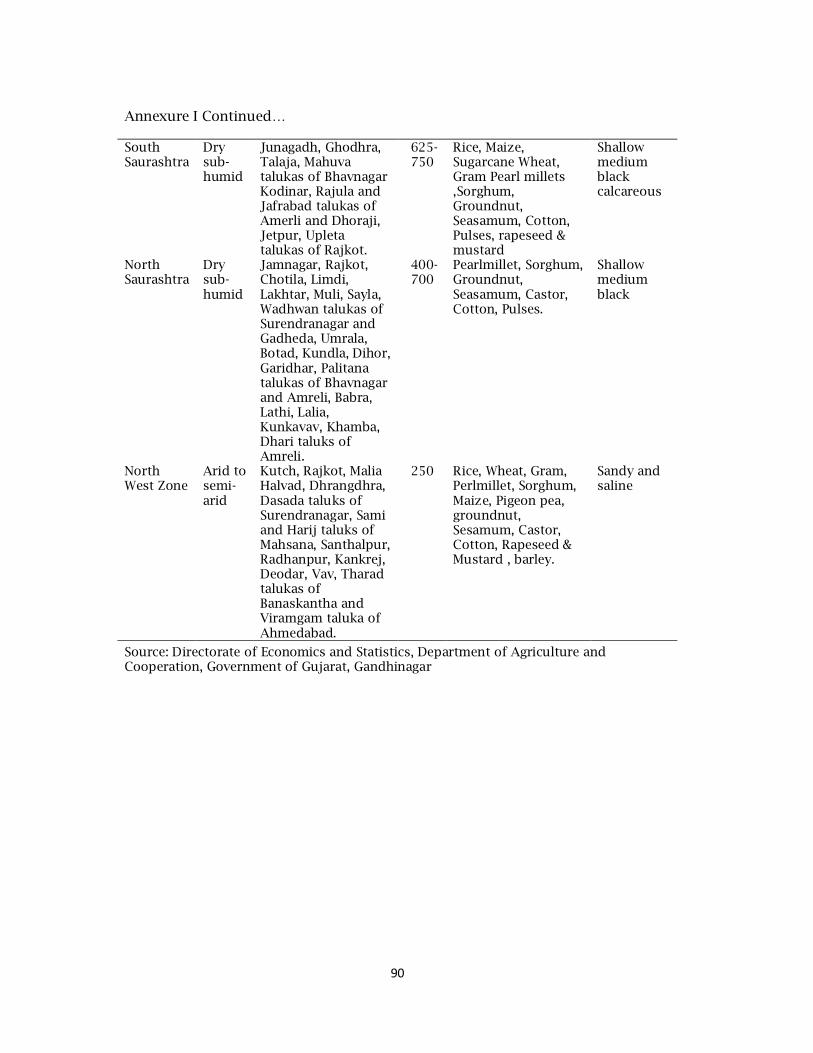
90
Annexure I Continued…
South Saurashtra
Dry sub-humid
Junagadh, Ghodhra, Talaja, Mahuva talukas of Bhavnagar Kodinar, Rajula and Jafrabad talukas of Amerli and Dhoraji, Jetpur, Upleta talukas of Rajkot.
625-750
Rice, Maize, Sugarcane Wheat, Gram Pearl millets ,Sorghum, Groundnut, Seasamum, Cotton, Pulses, rapeseed & mustard
Shallow medium black calcareous
North Saurashtra
Dry sub-humid
Jamnagar, Rajkot, Chotila, Limdi, Lakhtar, Muli, Sayla, Wadhwan talukas of Surendranagar and Gadheda, Umrala, Botad, Kundla, Dihor, Garidhar, Palitana talukas of Bhavnagar and Amreli, Babra, Lathi, Lalia, Kunkavav, Khamba, Dhari taluks of Amreli.
400-700
Pearlmillet, Sorghum, Groundnut, Seasamum, Castor, Cotton, Pulses.
Shallow medium black
North West Zone
Arid to semi-arid
Kutch, Rajkot, Malia Halvad, Dhrangdhra, Dasada taluks of Surendranagar, Sami and Harij taluks of Mahsana, Santhalpur, Radhanpur, Kankrej, Deodar, Vav, Tharad talukas of Banaskantha and Viramgam taluka of Ahmedabad.
250 Rice, Wheat, Gram, Perlmillet, Sorghum, Maize, Pigeon pea, groundnut, Sesamum, Castor, Cotton, Rapeseed & Mustard , barley.
Sandy and saline
Source: Directorate of Economics and Statistics, Department of Agriculture and Cooperation, Government of Gujarat, Gandhinagar
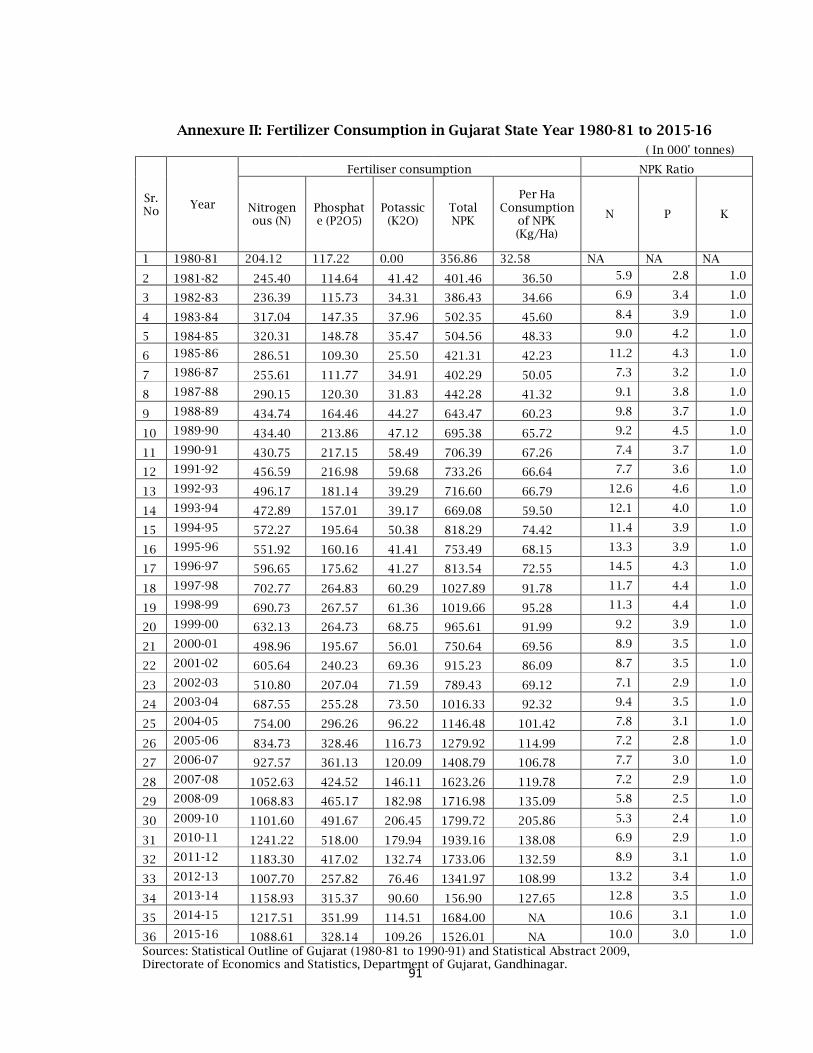
91
Annexure II: Fertilizer Consumption in Gujarat State Year 1980-81 to 2015-16 ( In 000' tonnes)
Sr. No
Year
Fertiliser consumption NPK Ratio
Nitrogenous (N)
Phosphate (P2O5)
Potassic (K2O)
Total NPK
Per Ha Consumption
of NPK (Kg/Ha)
N P K
1 1980-81 204.12 117.22 0.00 356.86 32.58 NA NA NA
2 1981-82 245.40 114.64 41.42 401.46 36.50 5.9 2.8 1.0
3 1982-83 236.39 115.73 34.31 386.43 34.66 6.9 3.4 1.0
4 1983-84 317.04 147.35 37.96 502.35 45.60 8.4 3.9 1.0
5 1984-85 320.31 148.78 35.47 504.56 48.33 9.0 4.2 1.0
6 1985-86 286.51 109.30 25.50 421.31 42.23 11.2 4.3 1.0
7 1986-87 255.61 111.77 34.91 402.29 50.05 7.3 3.2 1.0
8 1987-88 290.15 120.30 31.83 442.28 41.32 9.1 3.8 1.0
9 1988-89 434.74 164.46 44.27 643.47 60.23 9.8 3.7 1.0
10 1989-90 434.40 213.86 47.12 695.38 65.72 9.2 4.5 1.0
11 1990-91 430.75 217.15 58.49 706.39 67.26 7.4 3.7 1.0
12 1991-92 456.59 216.98 59.68 733.26 66.64 7.7 3.6 1.0
13 1992-93 496.17 181.14 39.29 716.60 66.79 12.6 4.6 1.0
14 1993-94 472.89 157.01 39.17 669.08 59.50 12.1 4.0 1.0
15 1994-95 572.27 195.64 50.38 818.29 74.42 11.4 3.9 1.0
16 1995-96 551.92 160.16 41.41 753.49 68.15 13.3 3.9 1.0
17 1996-97 596.65 175.62 41.27 813.54 72.55 14.5 4.3 1.0
18 1997-98 702.77 264.83 60.29 1027.89 91.78 11.7 4.4 1.0
19 1998-99 690.73 267.57 61.36 1019.66 95.28 11.3 4.4 1.0
20 1999-00 632.13 264.73 68.75 965.61 91.99 9.2 3.9 1.0
21 2000-01 498.96 195.67 56.01 750.64 69.56 8.9 3.5 1.0
22 2001-02 605.64 240.23 69.36 915.23 86.09 8.7 3.5 1.0
23 2002-03 510.80 207.04 71.59 789.43 69.12 7.1 2.9 1.0
24 2003-04 687.55 255.28 73.50 1016.33 92.32 9.4 3.5 1.0
25 2004-05 754.00 296.26 96.22 1146.48 101.42 7.8 3.1 1.0
26 2005-06 834.73 328.46 116.73 1279.92 114.99 7.2 2.8 1.0
27 2006-07 927.57 361.13 120.09 1408.79 106.78 7.7 3.0 1.0
28 2007-08 1052.63 424.52 146.11 1623.26 119.78 7.2 2.9 1.0
29 2008-09 1068.83 465.17 182.98 1716.98 135.09 5.8 2.5 1.0
30 2009-10 1101.60 491.67 206.45 1799.72 205.86 5.3 2.4 1.0
31 2010-11 1241.22 518.00 179.94 1939.16 138.08 6.9 2.9 1.0
32 2011-12 1183.30 417.02 132.74 1733.06 132.59 8.9 3.1 1.0
33 2012-13 1007.70 257.82 76.46 1341.97 108.99 13.2 3.4 1.0
34 2013-14 1158.93 315.37 90.60 156.90 127.65 12.8 3.5 1.0
35 2014-15 1217.51 351.99 114.51 1684.00 NA 10.6 3.1 1.0
36 2015-16 1088.61 328.14 109.26 1526.01 NA 10.0 3.0 1.0
Sources: Statistical Outline of Gujarat (1980-81 to 1990-91) and Statistical Abstract 2009, Directorate of Economics and Statistics, Department of Gujarat, Gandhinagar.
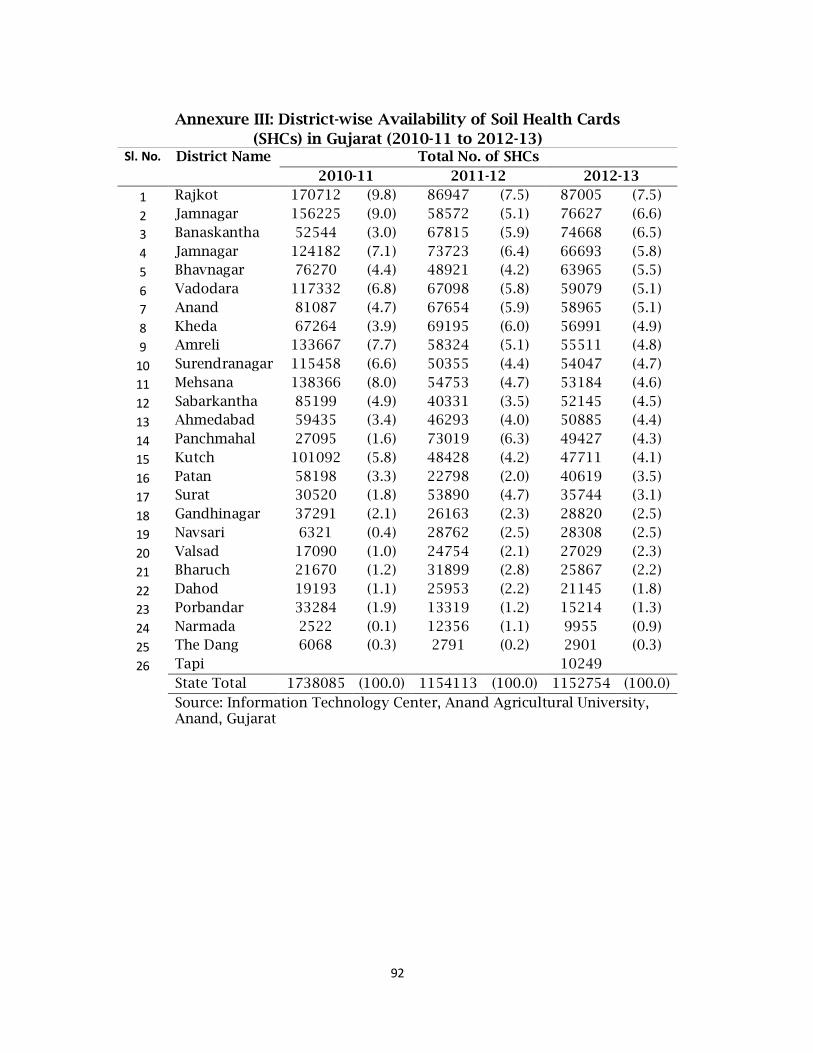
92
Annexure III: District-wise Availability of Soil Health Cards (SHCs) in Gujarat (2010-11 to 2012-13)
Sl. No. District Name Total No. of SHCs 2010-11 2011-12 2012-13
1 Rajkot 170712 (9.8) 86947 (7.5) 87005 (7.5)
2 Jamnagar 156225 (9.0) 58572 (5.1) 76627 (6.6)
3 Banaskantha 52544 (3.0) 67815 (5.9) 74668 (6.5)
4 Jamnagar 124182 (7.1) 73723 (6.4) 66693 (5.8)
5 Bhavnagar 76270 (4.4) 48921 (4.2) 63965 (5.5)
6 Vadodara 117332 (6.8) 67098 (5.8) 59079 (5.1)
7 Anand 81087 (4.7) 67654 (5.9) 58965 (5.1)
8 Kheda 67264 (3.9) 69195 (6.0) 56991 (4.9)
9 Amreli 133667 (7.7) 58324 (5.1) 55511 (4.8)
10 Surendranagar 115458 (6.6) 50355 (4.4) 54047 (4.7)
11 Mehsana 138366 (8.0) 54753 (4.7) 53184 (4.6)
12 Sabarkantha 85199 (4.9) 40331 (3.5) 52145 (4.5)
13 Ahmedabad 59435 (3.4) 46293 (4.0) 50885 (4.4)
14 Panchmahal 27095 (1.6) 73019 (6.3) 49427 (4.3)
15 Kutch 101092 (5.8) 48428 (4.2) 47711 (4.1)
16 Patan 58198 (3.3) 22798 (2.0) 40619 (3.5)
17 Surat 30520 (1.8) 53890 (4.7) 35744 (3.1)
18 Gandhinagar 37291 (2.1) 26163 (2.3) 28820 (2.5)
19 Navsari 6321 (0.4) 28762 (2.5) 28308 (2.5)
20 Valsad 17090 (1.0) 24754 (2.1) 27029 (2.3)
21 Bharuch 21670 (1.2) 31899 (2.8) 25867 (2.2)
22 Dahod 19193 (1.1) 25953 (2.2) 21145 (1.8)
23 Porbandar 33284 (1.9) 13319 (1.2) 15214 (1.3)
24 Narmada 2522 (0.1) 12356 (1.1) 9955 (0.9)
25 The Dang 6068 (0.3) 2791 (0.2) 2901 (0.3)
26 Tapi 10249 State Total 1738085 (100.0) 1154113 (100.0) 1152754 (100.0) Source: Information Technology Center, Anand Agricultural University, Anand, Gujarat
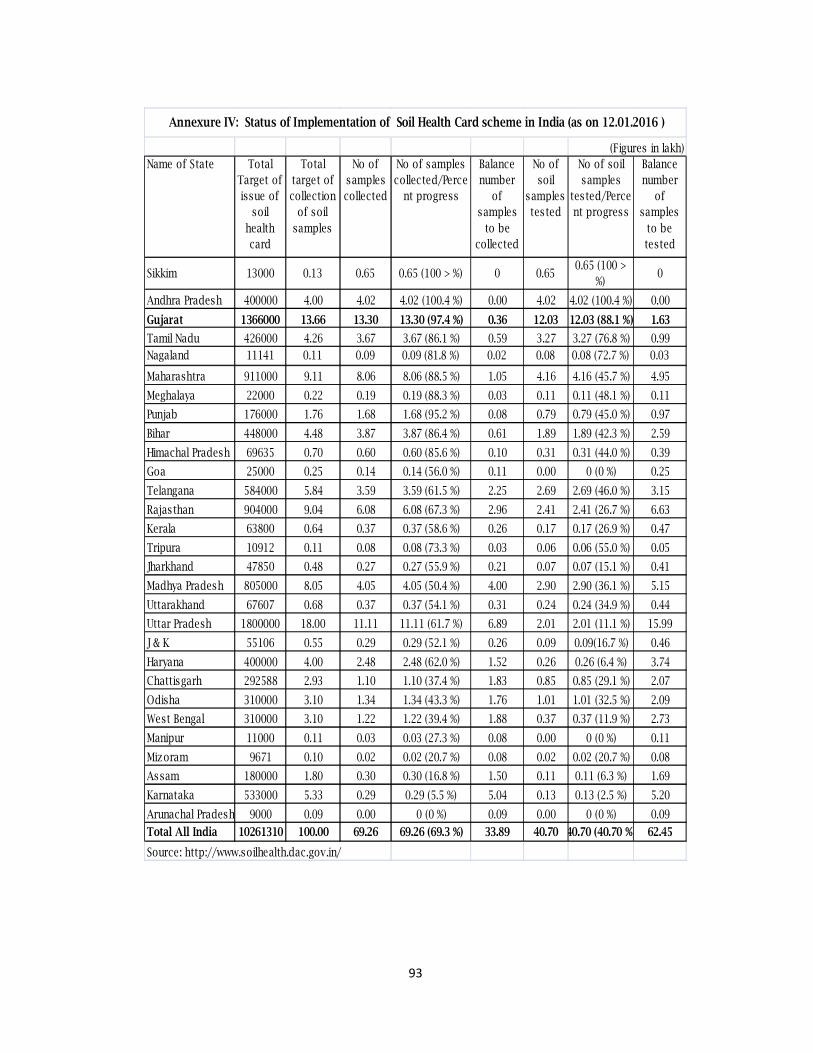
93
Name of State Total Target of issue of
soil health card
Total target of collection
of soil samples
No of samples collected
No of samples collected/Perce
nt progress
Balance number
of samples
to be collected
No of soil
samples tested
No of soil samples
tested/Percent progress
Balance number
of samples
to be tested
Sikkim 13000 0.13 0.65 0.65 (100 > %) 0 0.650.65 (100 >
%)0
Andhra Pradesh 400000 4.00 4.02 4.02 (100.4 %) 0.00 4.02 4.02 (100.4 %) 0.00
Gujarat 1366000 13.66 13.30 13.30 (97.4 %) 0.36 12.03 12.03 (88.1 %) 1.63
Tamil Nadu 426000 4.26 3.67 3.67 (86.1 %) 0.59 3.27 3.27 (76.8 %) 0.99Nagaland 11141 0.11 0.09 0.09 (81.8 %) 0.02 0.08 0.08 (72.7 %) 0.03
Maharashtra 911000 9.11 8.06 8.06 (88.5 %) 1.05 4.16 4.16 (45.7 %) 4.95
Meghalaya 22000 0.22 0.19 0.19 (88.3 %) 0.03 0.11 0.11 (48.1 %) 0.11
Punjab 176000 1.76 1.68 1.68 (95.2 %) 0.08 0.79 0.79 (45.0 %) 0.97
Bihar 448000 4.48 3.87 3.87 (86.4 %) 0.61 1.89 1.89 (42.3 %) 2.59
Himachal Pradesh 69635 0.70 0.60 0.60 (85.6 %) 0.10 0.31 0.31 (44.0 %) 0.39
Goa 25000 0.25 0.14 0.14 (56.0 %) 0.11 0.00 0 (0 %) 0.25
Telangana 584000 5.84 3.59 3.59 (61.5 %) 2.25 2.69 2.69 (46.0 %) 3.15
Rajasthan 904000 9.04 6.08 6.08 (67.3 %) 2.96 2.41 2.41 (26.7 %) 6.63
Kerala 63800 0.64 0.37 0.37 (58.6 %) 0.26 0.17 0.17 (26.9 %) 0.47
Tripura 10912 0.11 0.08 0.08 (73.3 %) 0.03 0.06 0.06 (55.0 %) 0.05
Jharkhand 47850 0.48 0.27 0.27 (55.9 %) 0.21 0.07 0.07 (15.1 %) 0.41
Madhya Pradesh 805000 8.05 4.05 4.05 (50.4 %) 4.00 2.90 2.90 (36.1 %) 5.15
Uttarakhand 67607 0.68 0.37 0.37 (54.1 %) 0.31 0.24 0.24 (34.9 %) 0.44
Uttar Pradesh 1800000 18.00 11.11 11.11 (61.7 %) 6.89 2.01 2.01 (11.1 %) 15.99
J & K 55106 0.55 0.29 0.29 (52.1 %) 0.26 0.09 0.09(16.7 %) 0.46
Haryana 400000 4.00 2.48 2.48 (62.0 %) 1.52 0.26 0.26 (6.4 %) 3.74
Chattisgarh 292588 2.93 1.10 1.10 (37.4 %) 1.83 0.85 0.85 (29.1 %) 2.07
Odisha 310000 3.10 1.34 1.34 (43.3 %) 1.76 1.01 1.01 (32.5 %) 2.09
West Bengal 310000 3.10 1.22 1.22 (39.4 %) 1.88 0.37 0.37 (11.9 %) 2.73
Manipur 11000 0.11 0.03 0.03 (27.3 %) 0.08 0.00 0 (0 %) 0.11
Mizoram 9671 0.10 0.02 0.02 (20.7 %) 0.08 0.02 0.02 (20.7 %) 0.08
Assam 180000 1.80 0.30 0.30 (16.8 %) 1.50 0.11 0.11 (6.3 %) 1.69
Karnataka 533000 5.33 0.29 0.29 (5.5 %) 5.04 0.13 0.13 (2.5 %) 5.20
Arunachal Pradesh 9000 0.09 0.00 0 (0 %) 0.09 0.00 0 (0 %) 0.09
Total All India 10261310 100.00 69.26 69.26 (69.3 %) 33.89 40.70 40.70 (40.70 %) 62.45
Source: http://www.soilhealth.dac.gov.in/
Annexure IV: Status of Implementation of Soil Health Card scheme in India (as on 12.01.2016 )
(Figures in lakh)
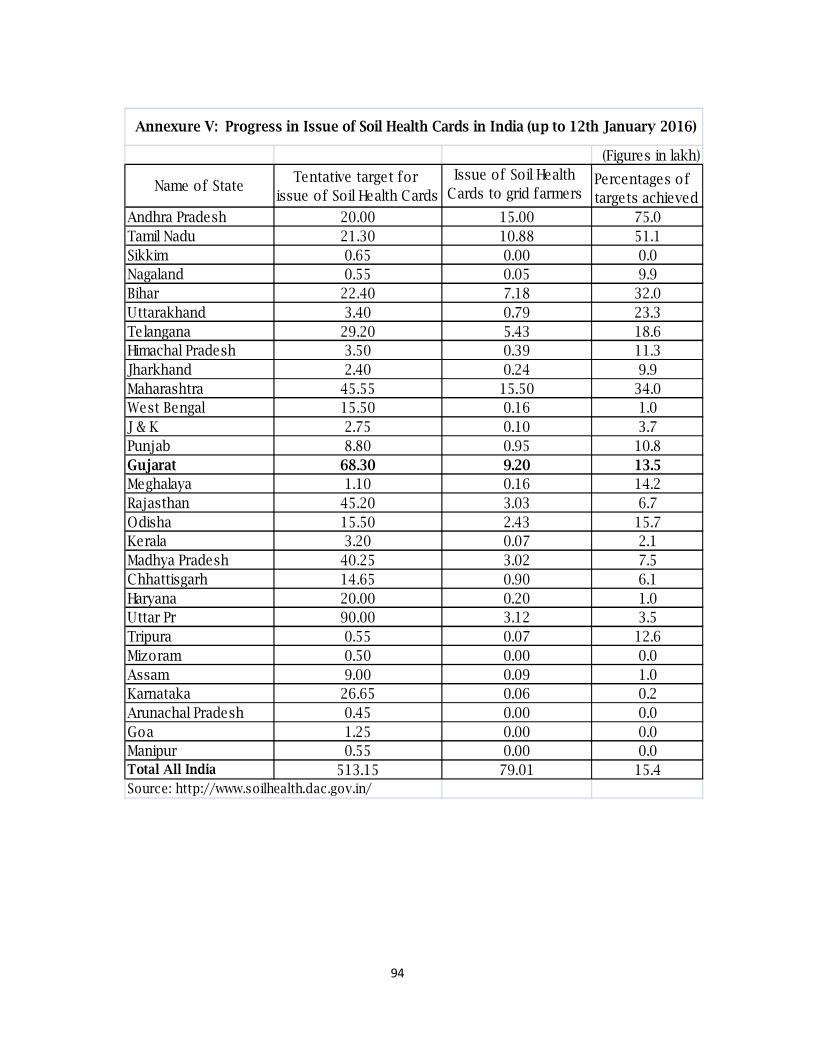
94
(Figures in lakh)
Name of StateTentative target for
issue of Soil Health Cards
Issue of Soil Health Cards to grid farmers
as on 12.01.2016
Percentages of targets achieved
Andhra Pradesh 20.00 15.00 75.0Tamil Nadu 21.30 10.88 51.1Sikkim 0.65 0.00 0.0Nagaland 0.55 0.05 9.9Bihar 22.40 7.18 32.0Uttarakhand 3.40 0.79 23.3Telangana 29.20 5.43 18.6Himachal Pradesh 3.50 0.39 11.3Jharkhand 2.40 0.24 9.9Maharashtra 45.55 15.50 34.0West Bengal 15.50 0.16 1.0J & K 2.75 0.10 3.7Punjab 8.80 0.95 10.8Gujarat 68.30 9.20 13.5Meghalaya 1.10 0.16 14.2Rajasthan 45.20 3.03 6.7Odisha 15.50 2.43 15.7Kerala 3.20 0.07 2.1Madhya Pradesh 40.25 3.02 7.5Chhattisgarh 14.65 0.90 6.1Haryana 20.00 0.20 1.0Uttar Pr 90.00 3.12 3.5Tripura 0.55 0.07 12.6Mizoram 0.50 0.00 0.0Assam 9.00 0.09 1.0Karnataka 26.65 0.06 0.2Arunachal Pradesh 0.45 0.00 0.0Goa 1.25 0.00 0.0Manipur 0.55 0.00 0.0Total All India 513.15 79.01 15.4Source: http://www.soilhealth.dac.gov.in/
Annexure V: Progress in Issue of Soil Health Cards in India (up to 12th January 2016)
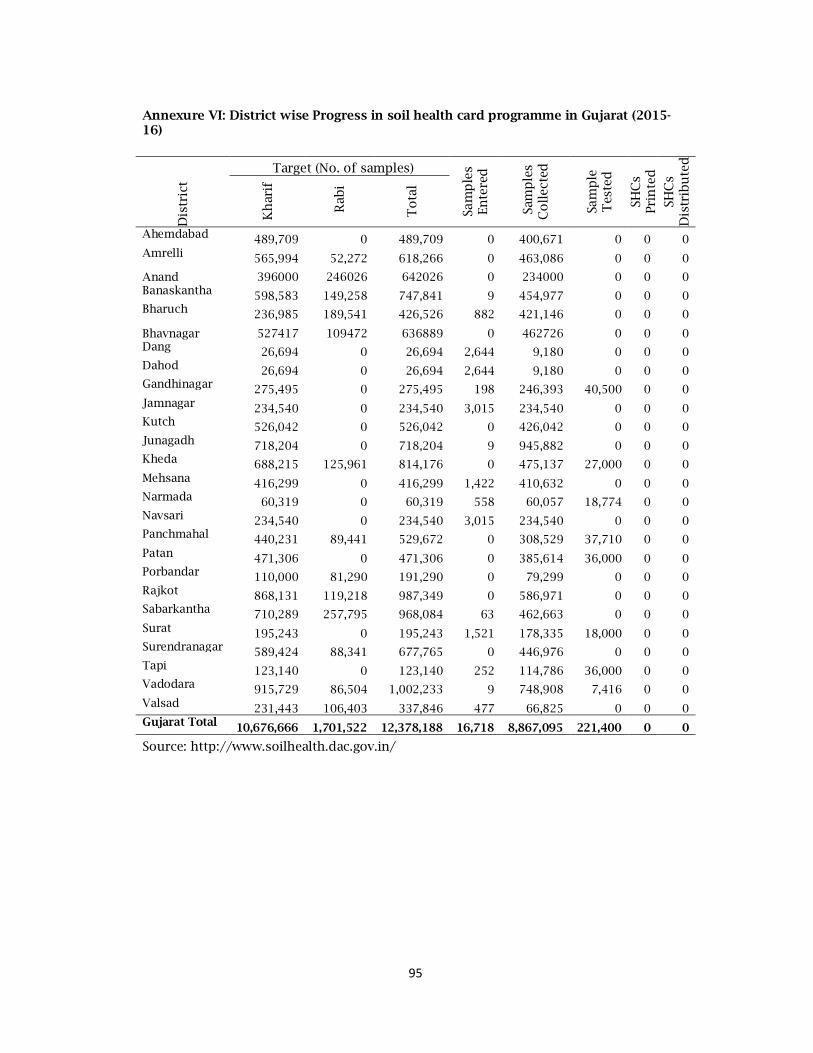
95
Annexure VI: District wise Progress in soil health card programme in Gujarat (2015-16)
Dis
tric
t Target (No. of samples)
Sam
ple
s En
tere
d
Sam
ple
s C
oll
ecte
d
Sam
ple
T
este
d
SHC
s Pr
inte
d
SHC
s D
istr
ibu
ted
Kh
arif
Rab
i
To
tal
Ahemdabad 489,709 0 489,709 0 400,671 0 0 0 Amrelli 565,994 52,272 618,266 0 463,086 0 0 0
Anand 396000 246026 642026 0 234000 0 0 0 Banaskantha 598,583 149,258 747,841 9 454,977 0 0 0 Bharuch 236,985 189,541 426,526 882 421,146 0 0 0
Bhavnagar 527417 109472 636889 0 462726 0 0 0 Dang 26,694 0 26,694 2,644 9,180 0 0 0 Dahod 26,694 0 26,694 2,644 9,180 0 0 0 Gandhinagar 275,495 0 275,495 198 246,393 40,500 0 0 Jamnagar 234,540 0 234,540 3,015 234,540 0 0 0 Kutch 526,042 0 526,042 0 426,042 0 0 0 Junagadh 718,204 0 718,204 9 945,882 0 0 0 Kheda 688,215 125,961 814,176 0 475,137 27,000 0 0 Mehsana 416,299 0 416,299 1,422 410,632 0 0 0 Narmada 60,319 0 60,319 558 60,057 18,774 0 0 Navsari 234,540 0 234,540 3,015 234,540 0 0 0 Panchmahal 440,231 89,441 529,672 0 308,529 37,710 0 0 Patan 471,306 0 471,306 0 385,614 36,000 0 0 Porbandar 110,000 81,290 191,290 0 79,299 0 0 0 Rajkot 868,131 119,218 987,349 0 586,971 0 0 0 Sabarkantha 710,289 257,795 968,084 63 462,663 0 0 0 Surat 195,243 0 195,243 1,521 178,335 18,000 0 0 Surendranagar 589,424 88,341 677,765 0 446,976 0 0 0 Tapi 123,140 0 123,140 252 114,786 36,000 0 0 Vadodara 915,729 86,504 1,002,233 9 748,908 7,416 0 0 Valsad 231,443 106,403 337,846 477 66,825 0 0 0 Gujarat Total 10,676,666 1,701,522 12,378,188 16,718 8,867,095 221,400 0 0
Source: http://www.soilhealth.dac.gov.in/
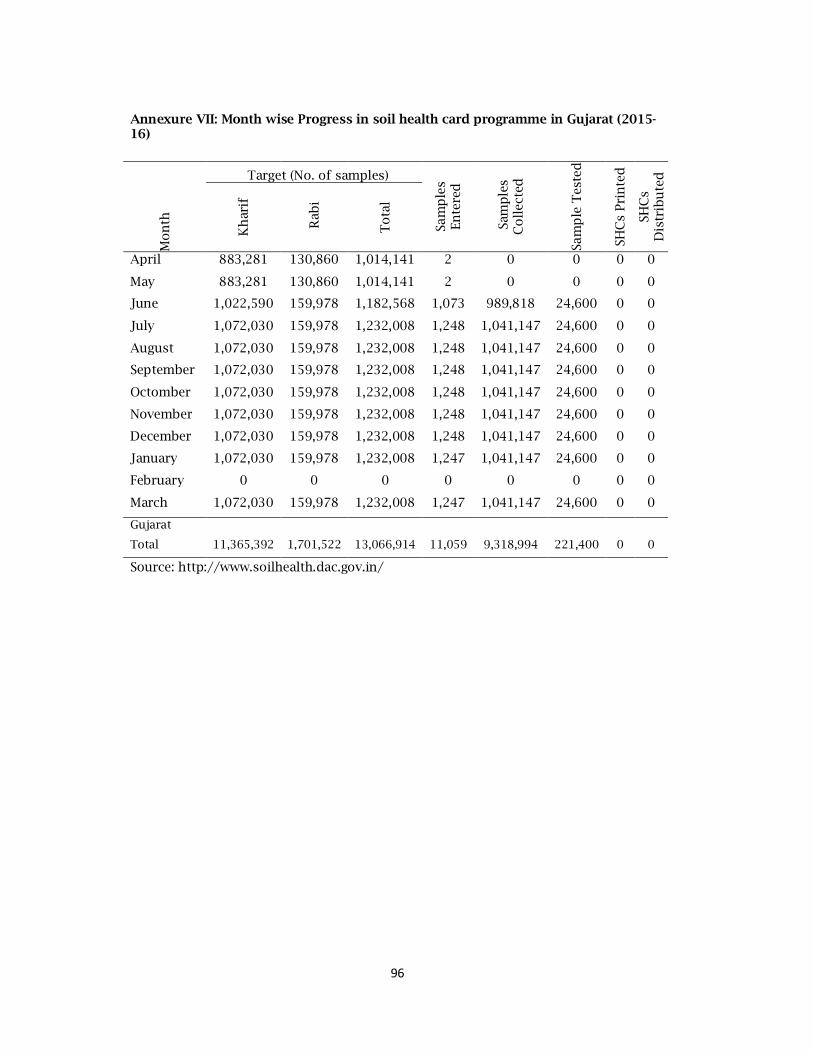
96
Annexure VII: Month wise Progress in soil health card programme in Gujarat (2015-16)
M
on
th
Target (No. of samples)
Sam
ple
s En
tere
d
Sam
ple
s C
oll
ecte
d
Sam
ple
Tes
ted
SHC
s Pri
nte
d
SHC
s D
istr
ibu
ted
Kh
arif
Rab
i
To
tal
April 883,281 130,860 1,014,141 2 0 0 0 0
May 883,281 130,860 1,014,141 2 0 0 0 0
June 1,022,590 159,978 1,182,568 1,073 989,818 24,600 0 0
July 1,072,030 159,978 1,232,008 1,248 1,041,147 24,600 0 0
August 1,072,030 159,978 1,232,008 1,248 1,041,147 24,600 0 0
September 1,072,030 159,978 1,232,008 1,248 1,041,147 24,600 0 0
Octomber 1,072,030 159,978 1,232,008 1,248 1,041,147 24,600 0 0
November 1,072,030 159,978 1,232,008 1,248 1,041,147 24,600 0 0
December 1,072,030 159,978 1,232,008 1,248 1,041,147 24,600 0 0
January 1,072,030 159,978 1,232,008 1,247 1,041,147 24,600 0 0
February 0 0 0 0 0 0 0 0
March 1,072,030 159,978 1,232,008 1,247 1,041,147 24,600 0 0
Gujarat
Total 11,365,392 1,701,522 13,066,914 11,059 9,318,994 221,400 0 0
Source: http://www.soilhealth.dac.gov.in/
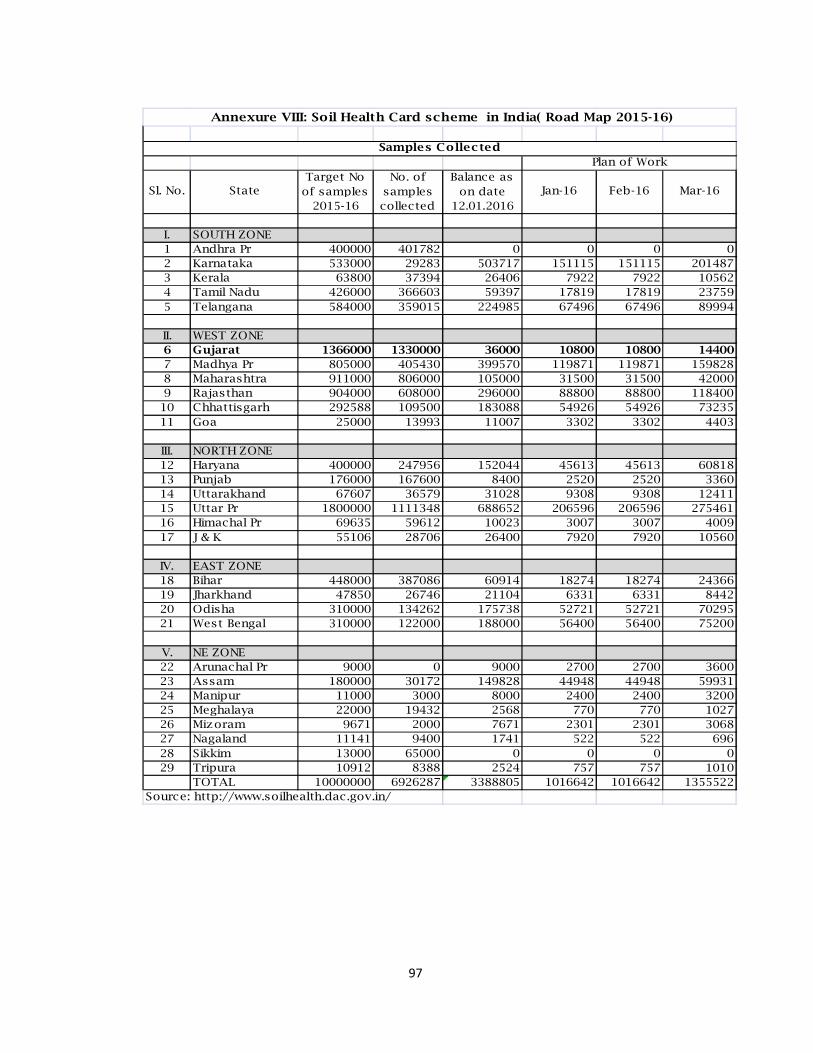
97
I. SOUTH ZONE1 Andhra Pr 400000 401782 0 0 0 02 Karnataka 533000 29283 503717 151115 151115 2014873 Kerala 63800 37394 26406 7922 7922 105624 Tamil Nadu 426000 366603 59397 17819 17819 237595 Telangana 584000 359015 224985 67496 67496 89994
II. WEST ZONE6 Gujarat 1366000 1330000 36000 10800 10800 144007 Madhya Pr 805000 405430 399570 119871 119871 1598288 Maharashtra 911000 806000 105000 31500 31500 420009 Rajasthan 904000 608000 296000 88800 88800 118400
10 Chhattisgarh 292588 109500 183088 54926 54926 7323511 Goa 25000 13993 11007 3302 3302 4403
III. NORTH ZONE12 Haryana 400000 247956 152044 45613 45613 6081813 Punjab 176000 167600 8400 2520 2520 336014 Uttarakhand 67607 36579 31028 9308 9308 1241115 Uttar Pr 1800000 1111348 688652 206596 206596 27546116 Himachal Pr 69635 59612 10023 3007 3007 400917 J & K 55106 28706 26400 7920 7920 10560
IV. EAST ZONE18 Bihar 448000 387086 60914 18274 18274 2436619 Jharkhand 47850 26746 21104 6331 6331 844220 Odisha 310000 134262 175738 52721 52721 7029521 West Bengal 310000 122000 188000 56400 56400 75200
V. NE ZONE22 Arunachal Pr 9000 0 9000 2700 2700 360023 Assam 180000 30172 149828 44948 44948 5993124 Manipur 11000 3000 8000 2400 2400 320025 Meghalaya 22000 19432 2568 770 770 102726 Mizoram 9671 2000 7671 2301 2301 306827 Nagaland 11141 9400 1741 522 522 69628 Sikkim 13000 65000 0 0 0 029 Tripura 10912 8388 2524 757 757 1010
TOTAL 10000000 6926287 3388805 1016642 1016642 1355522Source: http://www.soilhealth.dac.gov.in/
Sl. No. StateTarget No
of samples 2015-16
No. of samples collected
Balance as on date
12.01.2016 Jan-16 Feb-16 Mar-16
Annexure VIII: Soil Health Card scheme in India( Road Map 2015-16)
Samples CollectedPlan of Work
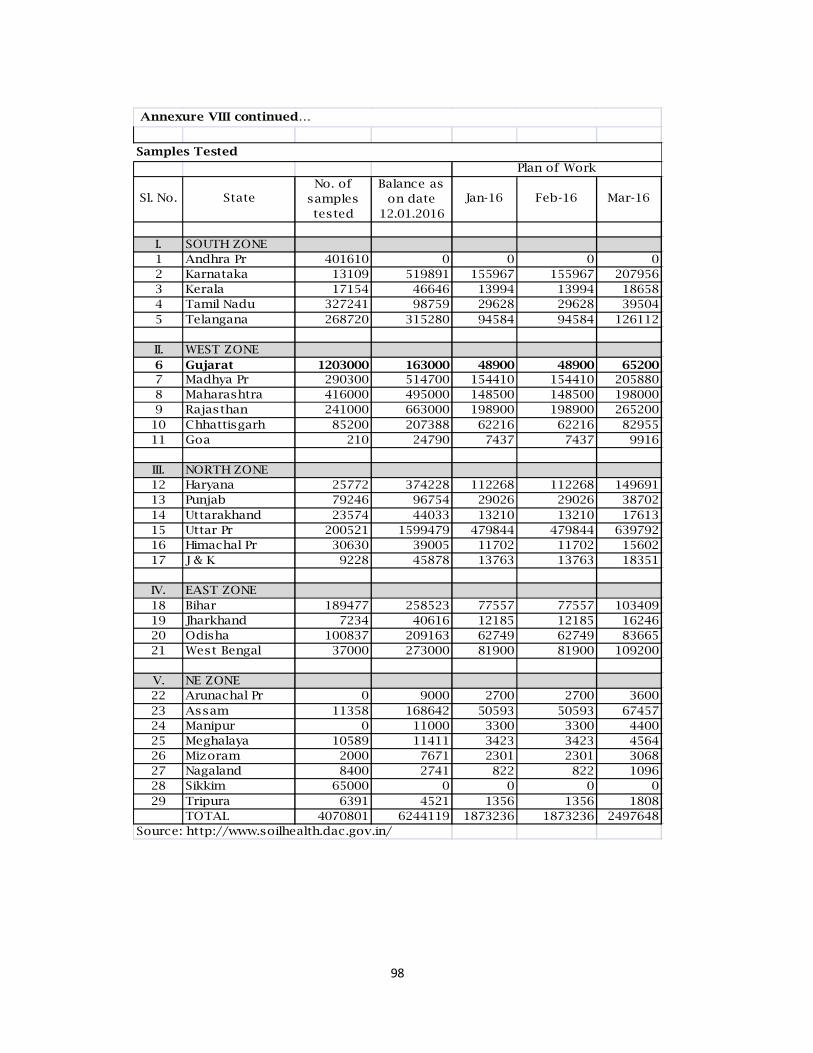
98
I. SOUTH ZONE1 Andhra Pr 401610 0 0 0 02 Karnataka 13109 519891 155967 155967 2079563 Kerala 17154 46646 13994 13994 186584 Tamil Nadu 327241 98759 29628 29628 395045 Telangana 268720 315280 94584 94584 126112
II. WEST ZONE6 Gujarat 1203000 163000 48900 48900 652007 Madhya Pr 290300 514700 154410 154410 2058808 Maharashtra 416000 495000 148500 148500 1980009 Rajasthan 241000 663000 198900 198900 265200
10 Chhattisgarh 85200 207388 62216 62216 8295511 Goa 210 24790 7437 7437 9916
III. NORTH ZONE12 Haryana 25772 374228 112268 112268 14969113 Punjab 79246 96754 29026 29026 3870214 Uttarakhand 23574 44033 13210 13210 1761315 Uttar Pr 200521 1599479 479844 479844 63979216 Himachal Pr 30630 39005 11702 11702 1560217 J & K 9228 45878 13763 13763 18351
IV. EAST ZONE18 Bihar 189477 258523 77557 77557 10340919 Jharkhand 7234 40616 12185 12185 1624620 Odisha 100837 209163 62749 62749 8366521 West Bengal 37000 273000 81900 81900 109200
V. NE ZONE22 Arunachal Pr 0 9000 2700 2700 360023 Assam 11358 168642 50593 50593 6745724 Manipur 0 11000 3300 3300 440025 Meghalaya 10589 11411 3423 3423 456426 Mizoram 2000 7671 2301 2301 306827 Nagaland 8400 2741 822 822 109628 Sikkim 65000 0 0 0 029 Tripura 6391 4521 1356 1356 1808
TOTAL 4070801 6244119 1873236 1873236 2497648Source: http://www.soilhealth.dac.gov.in/
Plan of WorkNo. of
samples tested
Mar-16Feb-16
Annexure VIII continued…
Samples Tested
Sl. No. StateBalance as
on date 12.01.2016
Jan-16
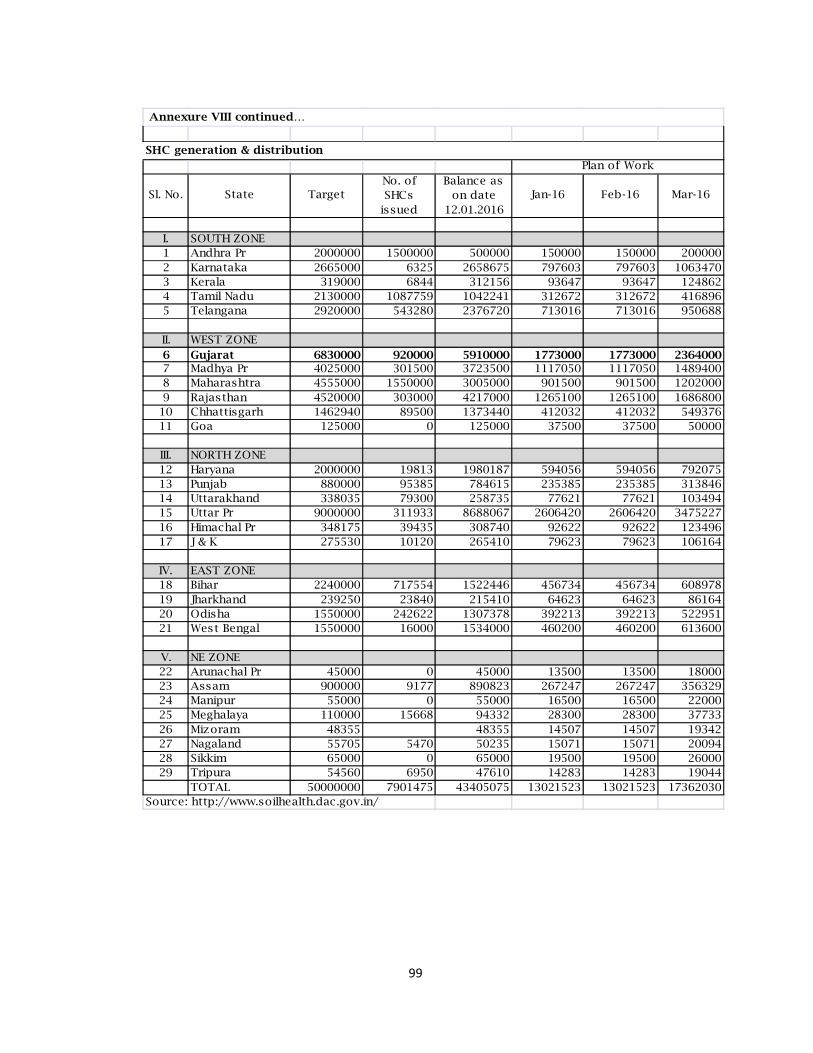
99
I. SOUTH ZONE1 Andhra Pr 2000000 1500000 500000 150000 150000 2000002 Karnataka 2665000 6325 2658675 797603 797603 10634703 Kerala 319000 6844 312156 93647 93647 1248624 Tamil Nadu 2130000 1087759 1042241 312672 312672 4168965 Telangana 2920000 543280 2376720 713016 713016 950688
II. WEST ZONE6 Gujarat 6830000 920000 5910000 1773000 1773000 23640007 Madhya Pr 4025000 301500 3723500 1117050 1117050 14894008 Maharashtra 4555000 1550000 3005000 901500 901500 12020009 Rajasthan 4520000 303000 4217000 1265100 1265100 1686800
10 Chhattisgarh 1462940 89500 1373440 412032 412032 54937611 Goa 125000 0 125000 37500 37500 50000
III. NORTH ZONE12 Haryana 2000000 19813 1980187 594056 594056 79207513 Punjab 880000 95385 784615 235385 235385 31384614 Uttarakhand 338035 79300 258735 77621 77621 10349415 Uttar Pr 9000000 311933 8688067 2606420 2606420 347522716 Himachal Pr 348175 39435 308740 92622 92622 12349617 J & K 275530 10120 265410 79623 79623 106164
IV. EAST ZONE18 Bihar 2240000 717554 1522446 456734 456734 60897819 Jharkhand 239250 23840 215410 64623 64623 8616420 Odisha 1550000 242622 1307378 392213 392213 52295121 West Bengal 1550000 16000 1534000 460200 460200 613600
V. NE ZONE22 Arunachal Pr 45000 0 45000 13500 13500 1800023 Assam 900000 9177 890823 267247 267247 35632924 Manipur 55000 0 55000 16500 16500 2200025 Meghalaya 110000 15668 94332 28300 28300 3773326 Mizoram 48355 48355 14507 14507 1934227 Nagaland 55705 5470 50235 15071 15071 2009428 Sikkim 65000 0 65000 19500 19500 2600029 Tripura 54560 6950 47610 14283 14283 19044
TOTAL 50000000 7901475 43405075 13021523 13021523 17362030Source: http://www.soilhealth.dac.gov.in/
Plan of Work
Mar-16TargetNo. of SHCs
issued
Balance as on date
12.01.2016Jan-16 Feb-16Sl. No. State
Annexure VIII continued…
SHC generation & distribution
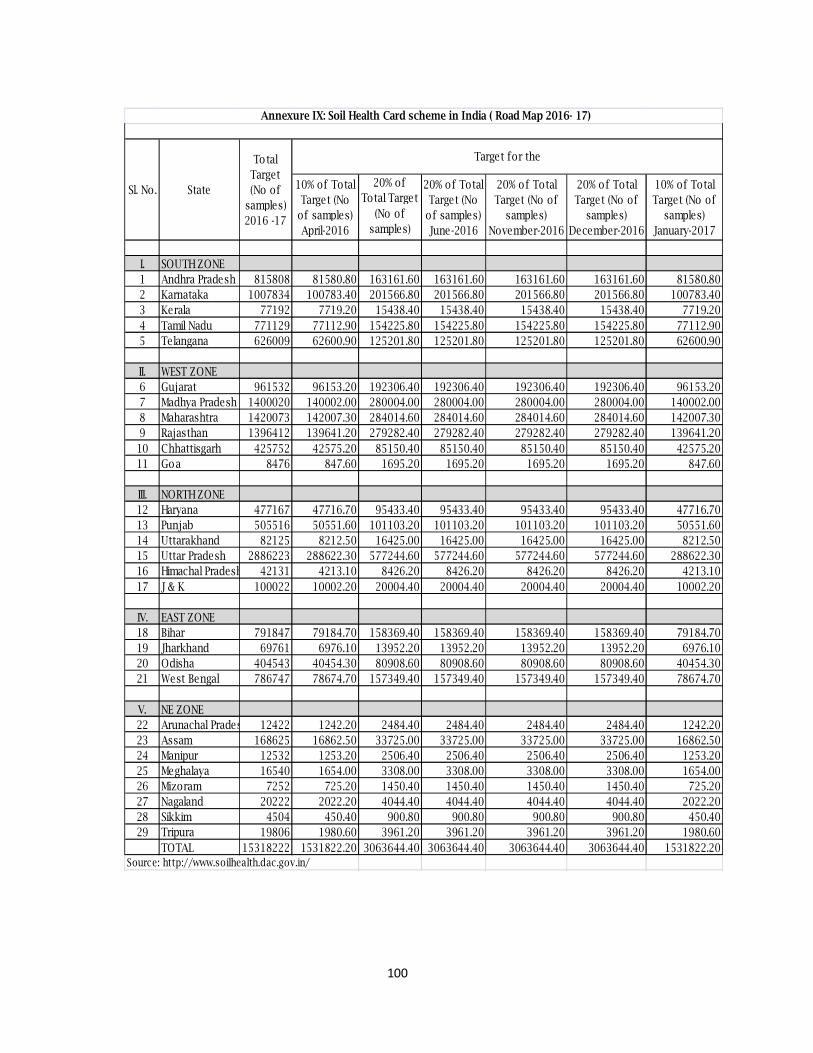
100
I. SOUTH ZONE1 Andhra Pradesh 815808 81580.80 163161.60 163161.60 163161.60 163161.60 81580.802 Karnataka 1007834 100783.40 201566.80 201566.80 201566.80 201566.80 100783.403 Kerala 77192 7719.20 15438.40 15438.40 15438.40 15438.40 7719.204 Tamil Nadu 771129 77112.90 154225.80 154225.80 154225.80 154225.80 77112.905 Telangana 626009 62600.90 125201.80 125201.80 125201.80 125201.80 62600.90
II. WEST ZONE6 Gujarat 961532 96153.20 192306.40 192306.40 192306.40 192306.40 96153.207 Madhya Pradesh 1400020 140002.00 280004.00 280004.00 280004.00 280004.00 140002.008 Maharashtra 1420073 142007.30 284014.60 284014.60 284014.60 284014.60 142007.309 Rajasthan 1396412 139641.20 279282.40 279282.40 279282.40 279282.40 139641.2010 Chhattisgarh 425752 42575.20 85150.40 85150.40 85150.40 85150.40 42575.2011 Goa 8476 847.60 1695.20 1695.20 1695.20 1695.20 847.60
III. NORTH ZONE12 Haryana 477167 47716.70 95433.40 95433.40 95433.40 95433.40 47716.7013 Punjab 505516 50551.60 101103.20 101103.20 101103.20 101103.20 50551.6014 Uttarakhand 82125 8212.50 16425.00 16425.00 16425.00 16425.00 8212.5015 Uttar Pradesh 2886223 288622.30 577244.60 577244.60 577244.60 577244.60 288622.3016 Himachal Pradesh 42131 4213.10 8426.20 8426.20 8426.20 8426.20 4213.1017 J & K 100022 10002.20 20004.40 20004.40 20004.40 20004.40 10002.20
IV. EAST ZONE18 Bihar 791847 79184.70 158369.40 158369.40 158369.40 158369.40 79184.7019 Jharkhand 69761 6976.10 13952.20 13952.20 13952.20 13952.20 6976.1020 Odisha 404543 40454.30 80908.60 80908.60 80908.60 80908.60 40454.3021 West Bengal 786747 78674.70 157349.40 157349.40 157349.40 157349.40 78674.70
V. NE ZONE22 Arunachal Pradesh 12422 1242.20 2484.40 2484.40 2484.40 2484.40 1242.2023 Assam 168625 16862.50 33725.00 33725.00 33725.00 33725.00 16862.5024 Manipur 12532 1253.20 2506.40 2506.40 2506.40 2506.40 1253.2025 Meghalaya 16540 1654.00 3308.00 3308.00 3308.00 3308.00 1654.0026 Mizoram 7252 725.20 1450.40 1450.40 1450.40 1450.40 725.2027 Nagaland 20222 2022.20 4044.40 4044.40 4044.40 4044.40 2022.2028 Sikkim 4504 450.40 900.80 900.80 900.80 900.80 450.4029 Tripura 19806 1980.60 3961.20 3961.20 3961.20 3961.20 1980.60
TOTAL 15318222 1531822.20 3063644.40 3063644.40 3063644.40 3063644.40 1531822.20Source: http://www.soilhealth.dac.gov.in/
20% of Total Target (No of
samples) December-2016
10% of Total Target (No of
samples) January-2017
Annexure IX: Soil Health Card scheme in India ( Road Map 2016- 17)
Sl. No. State
Total Target (No of
samples) 2016 -17
Target for the
10% of Total Target (No
of samples) April-2016
20% of Total Target
(No of samples) May-2016
20% of Total Target (No
of samples) June-2016
20% of Total Target (No of
samples) November-2016
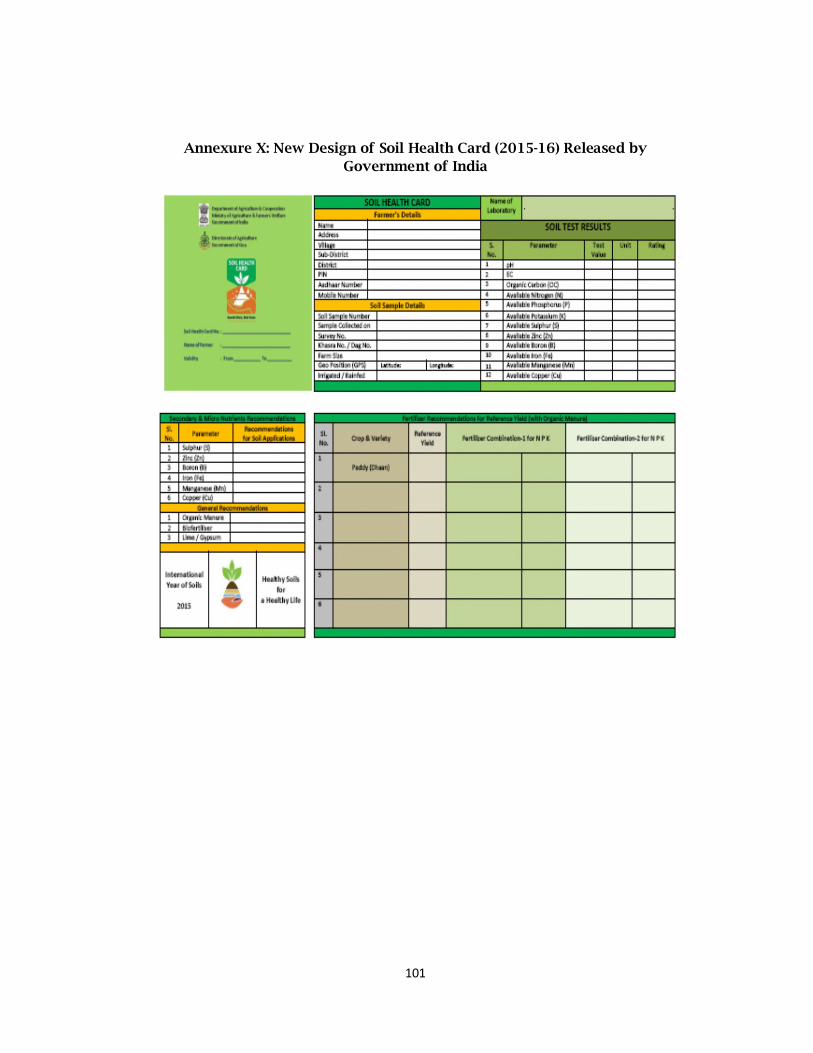
101
Annexure X: New Design of Soil Health Card (2015-16) Released by Government of India
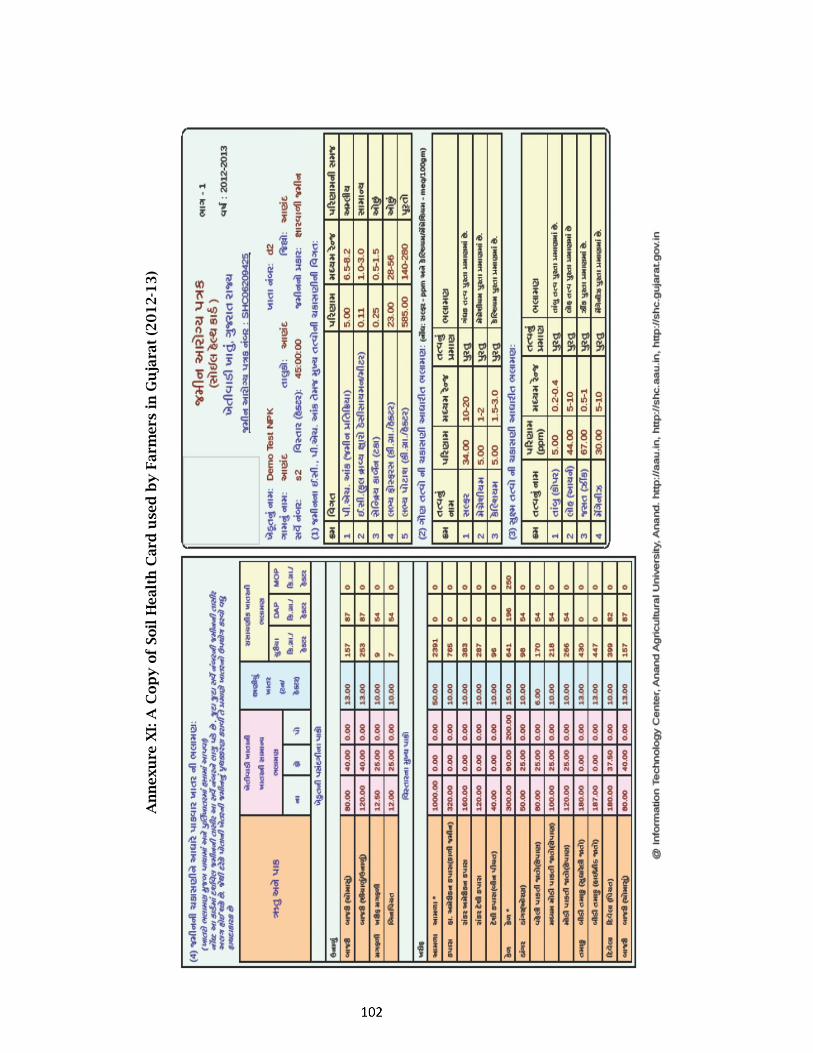
An
nex
ure
XI: A
Cop
y o
f So
il H
eal
th C
ard
use
d b
y F
arm
ers
in G
uja
rat
(2012-1
3)
pc-4
Typewritten text
102
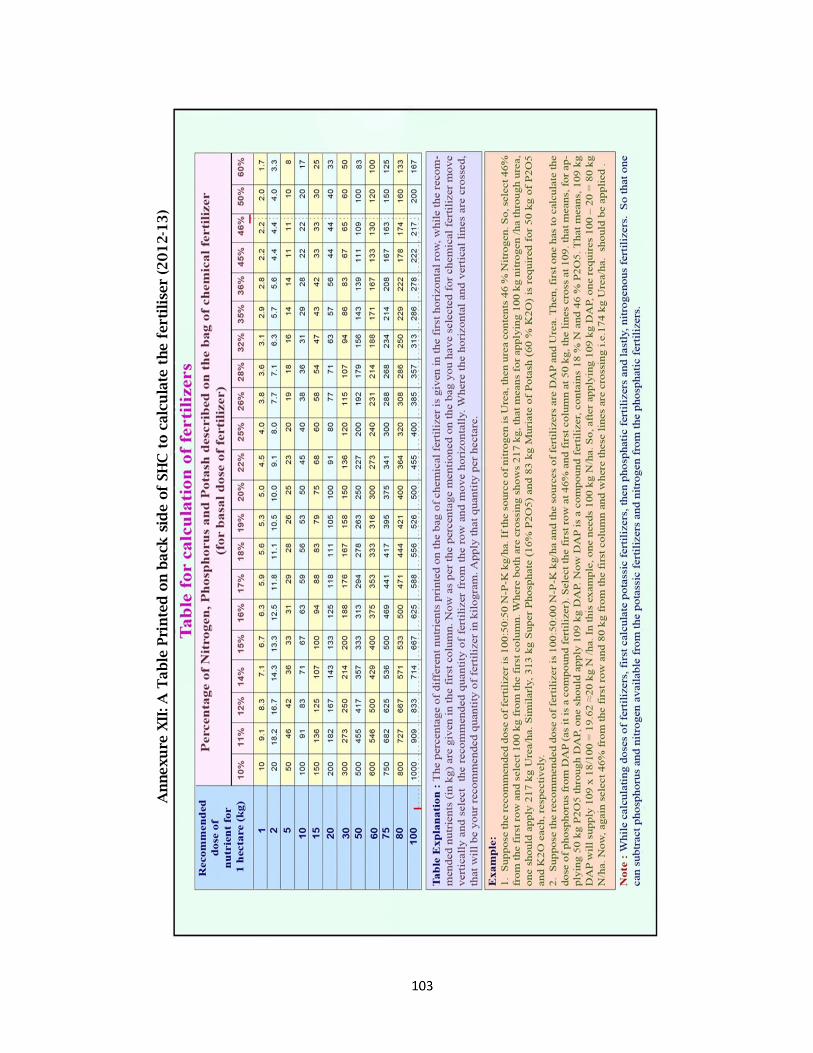
A
nnexu
re X
II: A
Tab
le P
rin
ted
on b
ack
sid
e of
SHC
to c
alcu
late
the f
erti
lise
r (2
01
2-1
3)
pc-4
Typewritten text
103
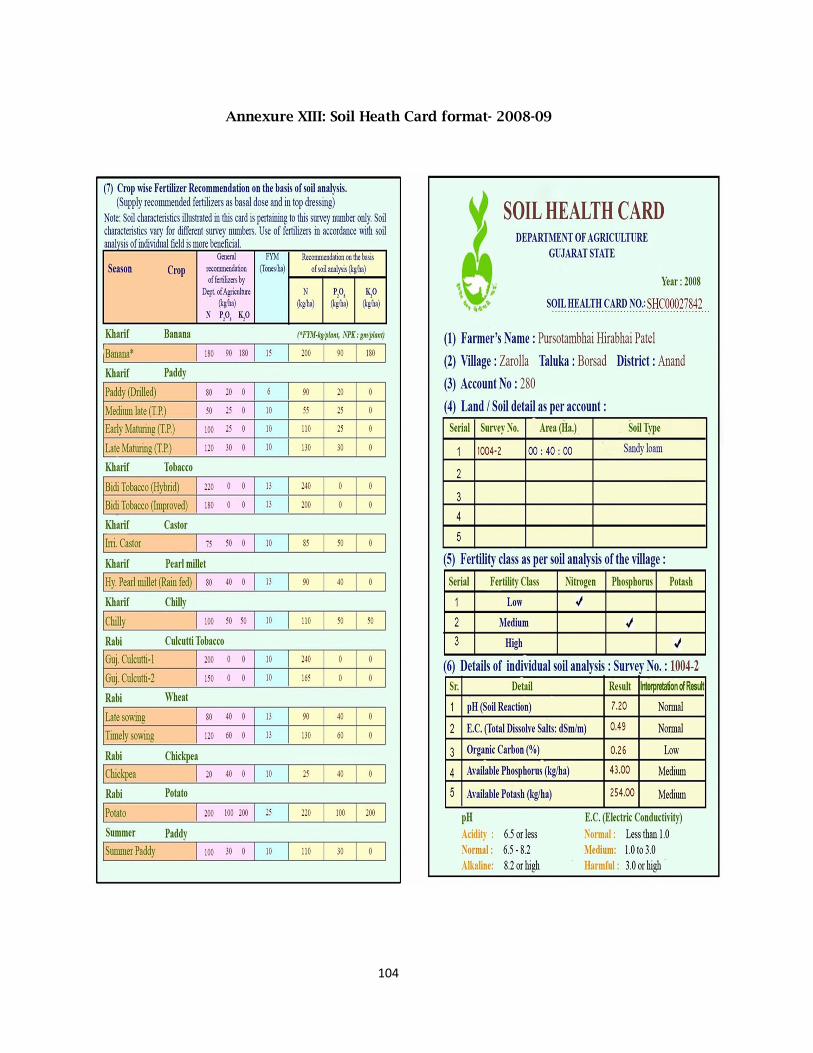
104
Annexure XIII: Soil Heath Card format- 2008-09
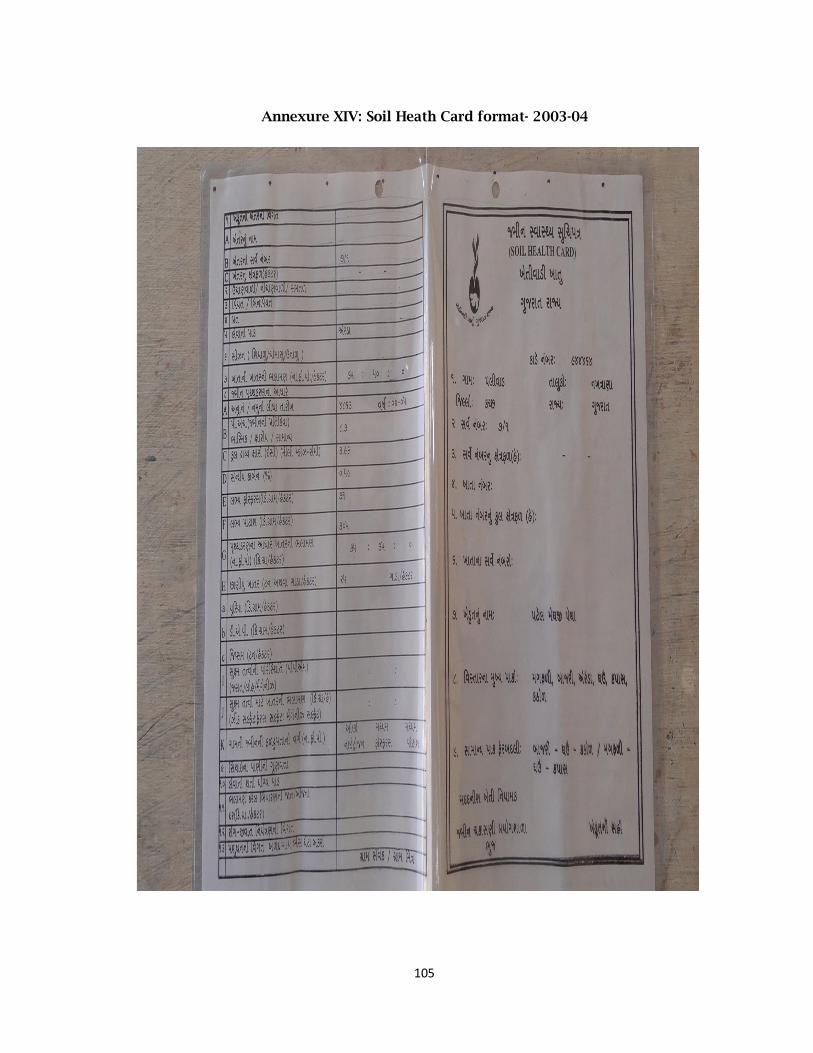
105
Annexure XIV: Soil Heath Card format- 2003-04
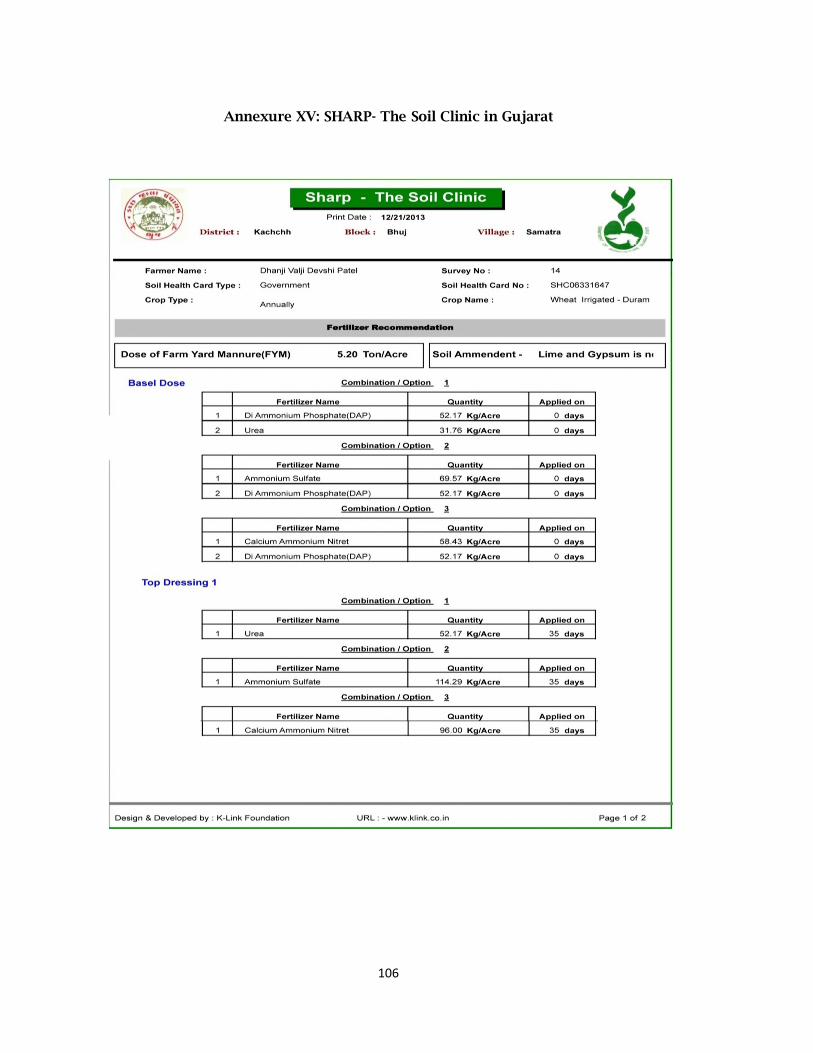
106
Annexure XV: SHARP- The Soil Clinic in Gujarat
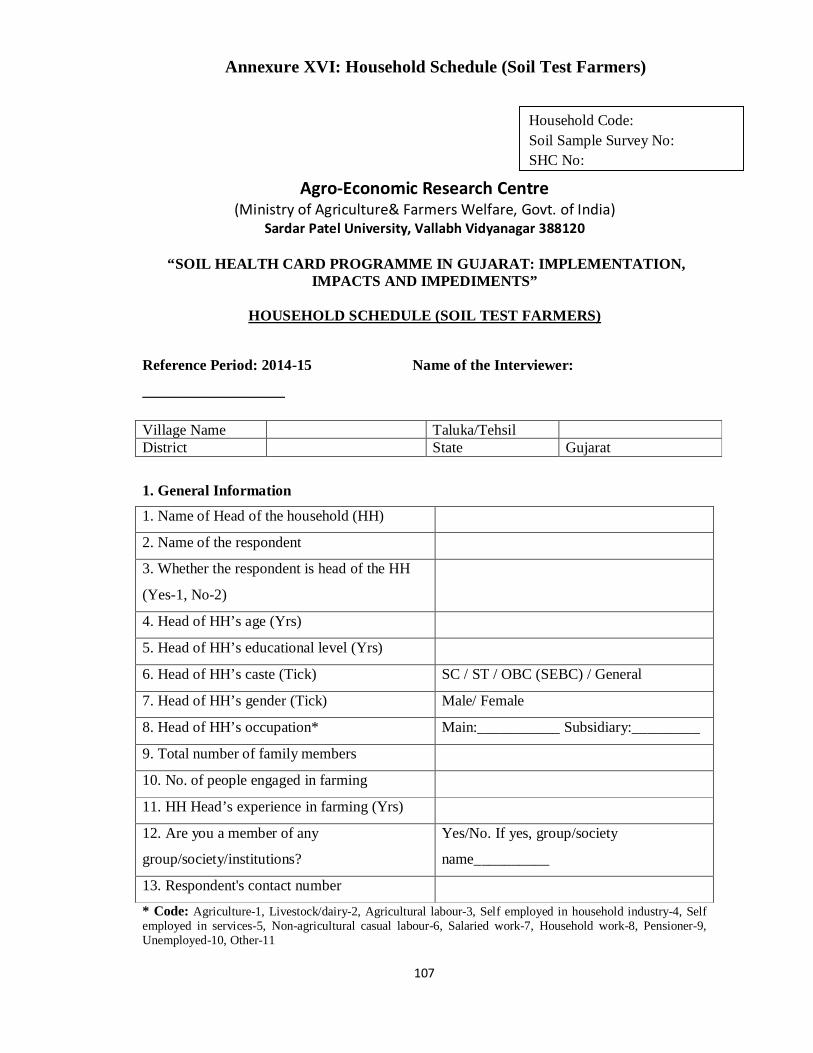
107
Agro-Economic Research Centre (Ministry of Agriculture& Farmers Welfare, Govt. of India)
Sardar Patel University, Vallabh Vidyanagar 388120
“SOIL HEALTH CARD PROGRAMME IN GUJARAT: IMPLEMENTATION, IMPACTS AND IMPEDIMENTS”
HOUSEHOLD SCHEDULE (SOIL TEST FARMERS)
Reference Period: 2014-15 Name of the Interviewer:
___________________
Village Name Taluka/Tehsil District State Gujarat
1. General Information
1. Name of Head of the household (HH)
2. Name of the respondent
3. Whether the respondent is head of the HH
(Yes-1, No-2)
4. Head of HH’s age (Yrs)
5. Head of HH’s educational level (Yrs)
6. Head of HH’s caste (Tick) SC / ST / OBC (SEBC) / General
7. Head of HH’s gender (Tick) Male/ Female
8. Head of HH’s occupation* Main:___________ Subsidiary:_________
9. Total number of family members
10. No. of people engaged in farming
11. HH Head’s experience in farming (Yrs)
12. Are you a member of any
group/society/institutions?
Yes/No. If yes, group/society
name__________
13. Respondent's contact number
* Code: Agriculture-1, Livestock/dairy-2, Agricultural labour-3, Self employed in household industry-4, Self employed in services-5, Non-agricultural casual labour-6, Salaried work-7, Household work-8, Pensioner-9, Unemployed-10, Other-11
Household Code: Soil Sample Survey No: SHC No:
Annexure XVI: Household Schedule (Soil Test Farmers)
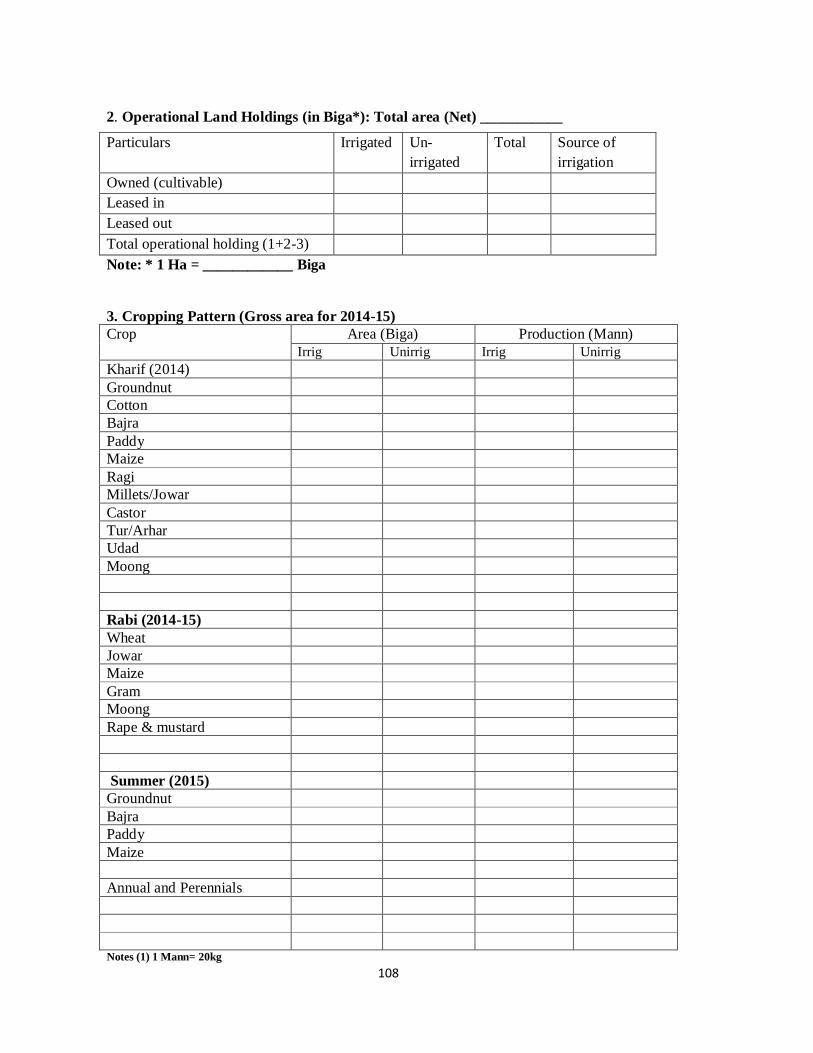
108
2. Operational Land Holdings (in Biga*): Total area (Net) ___________
Particulars Irrigated Un-irrigated
Total Source of irrigation
Owned (cultivable) Leased in Leased out Total operational holding (1+2-3) Note: * 1 Ha = ____________ Biga 3. Cropping Pattern (Gross area for 2014-15) Crop
Area (Biga) Production (Mann) Irrig Unirrig Irrig Unirrig
Kharif (2014) Groundnut Cotton Bajra Paddy Maize Ragi Millets/Jowar Castor Tur/Arhar Udad Moong Rabi (2014-15) Wheat Jowar Maize Gram Moong Rape & mustard Summer (2015) Groundnut Bajra Paddy Maize Annual and Perennials Notes (1) 1 Mann= 20kg
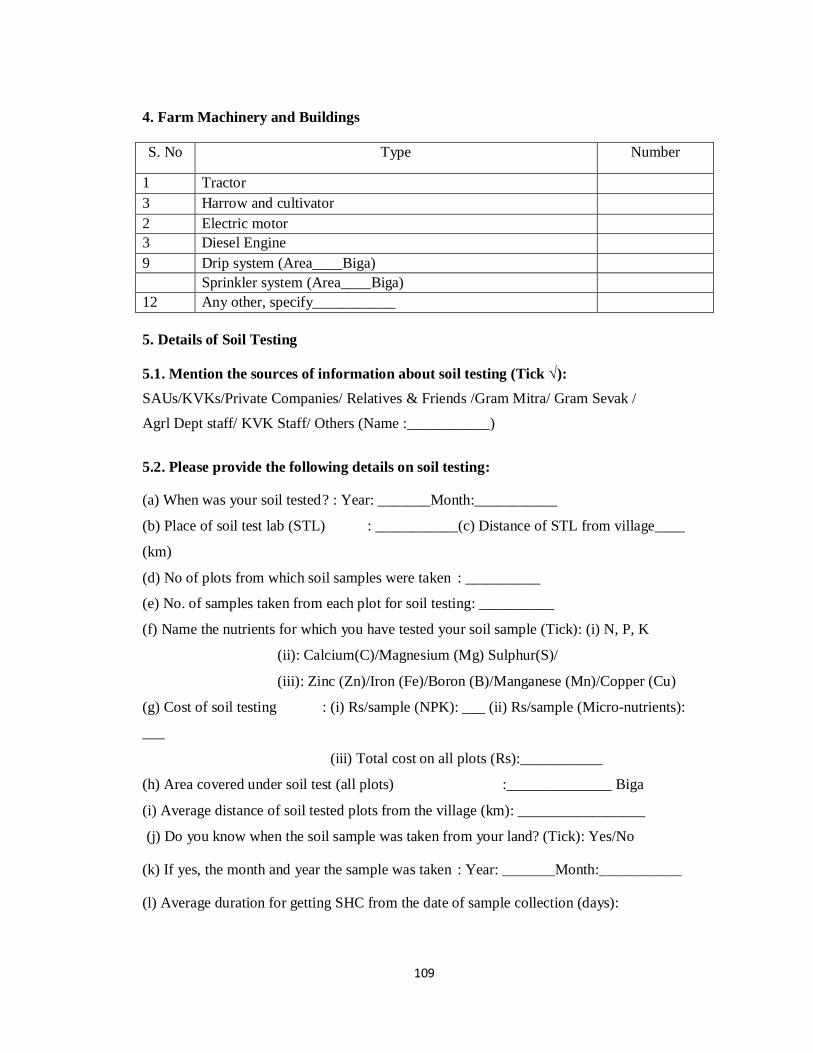
109
4. Farm Machinery and Buildings S. No Type Number
1 Tractor 3 Harrow and cultivator 2 Electric motor 3 Diesel Engine 9 Drip system (Area____Biga) Sprinkler system (Area____Biga) 12 Any other, specify___________ 5. Details of Soil Testing 5.1. Mention the sources of information about soil testing (Tick √):
SAUs/KVKs/Private Companies/ Relatives & Friends /Gram Mitra/ Gram Sevak /
Agrl Dept staff/ KVK Staff/ Others (Name :___________)
5.2. Please provide the following details on soil testing:
(a) When was your soil tested ? : Year: _______Month:___________
(b) Place of soil test lab (STL) : ___________(c) Distance of STL from village____
(km)
(d) No of plots from which soil samples were taken : __________
(e) No. of samples taken from each plot for soil testing: __________
(f) Name the nutrients for which you have tested your soil sample (Tick): (i) N, P, K
(ii): Calcium(C)/Magnesium (Mg) Sulphur(S)/
(iii): Zinc (Zn)/Iron (Fe)/Boron (B)/Manganese (Mn)/Copper (Cu)
(g) Cost of soil testing : (i) Rs/sample (NPK): ___ (ii) Rs/sample (Micro-nutrients):
___
(iii) Total cost on all plots (Rs):___________
(h) Area covered under soil test (all plots) :______________ Biga
(i) Average distance of soil tested plots from the village (km): _________________
(j) Do you know when the soil sample was taken from your land? (Tick): Yes/No
(k) If yes, the month and year the sample was taken : Year: _______Month:___________
(l) Average duration for getting SHC from the date of sample collection (days):
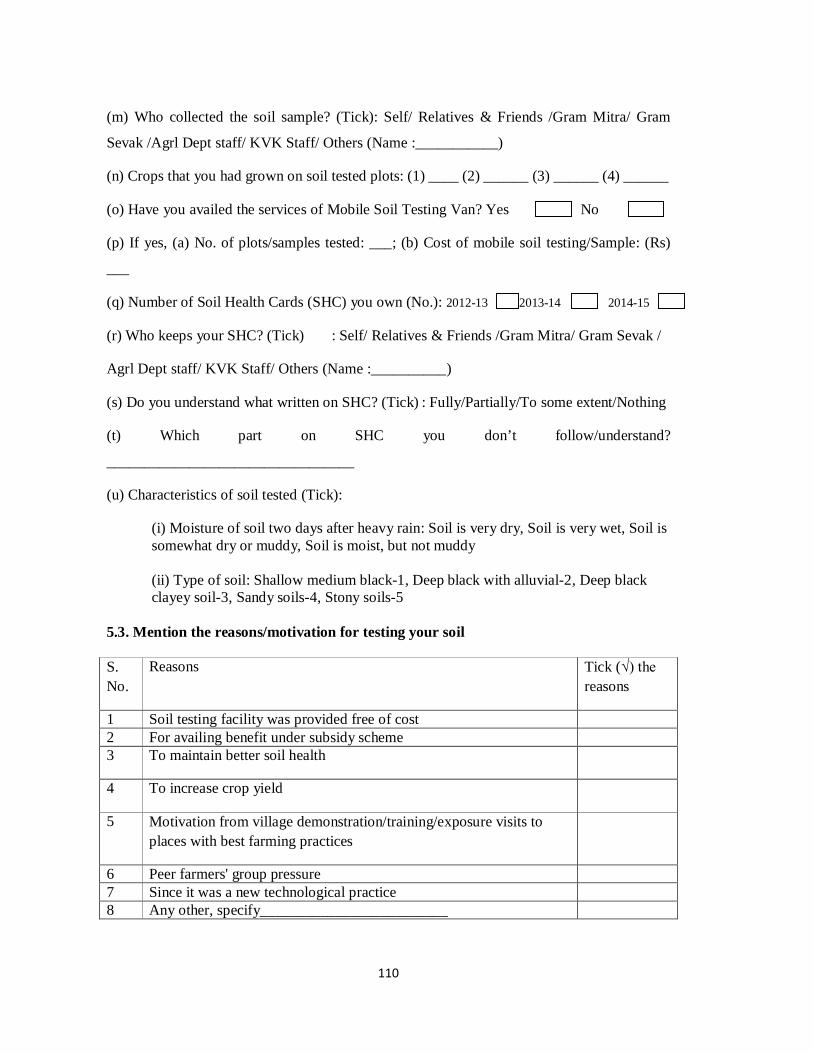
110
(m) Who collected the soil sample? (Tick): Self/ Relatives & Friends /Gram Mitra/ Gram
Sevak /Agrl Dept staff/ KVK Staff/ Others (Name :___________)
(n) Crops that you had grown on soil tested plots: (1) ____ (2) ______ (3) ______ (4) ______
(o) Have you availed the services of Mobile Soil Testing Van? Yes No
(p) If yes, (a) No. of plots/samples tested: ___; (b) Cost of mobile soil testing/Sample: (Rs)
___
(q) Number of Soil Health Cards (SHC) you own (No.): 2012-13 2013-14 2014-15
(r) Who keeps your SHC? (Tick) : Self/ Relatives & Friends /Gram Mitra/ Gram Sevak /
Agrl Dept staff/ KVK Staff/ Others (Name :__________)
(s) Do you understand what written on SHC? (Tick) : Fully/Partially/To some extent/Nothing
(t) Which part on SHC you don’t follow/understand?
_________________________________
(u) Characteristics of soil tested (Tick):
(i) Moisture of soil two days after heavy rain: Soil is very dry, Soil is very wet, Soil is somewhat dry or muddy, Soil is moist, but not muddy (ii) Type of soil: Shallow medium black-1, Deep black with alluvial-2, Deep black clayey soil-3, Sandy soils-4, Stony soils-5
5.3. Mention the reasons/motivation for testing your soil S. No.
Reasons Tick (√) the reasons
1 Soil testing facility was provided free of cost 2 For availing benefit under subsidy scheme 3 To maintain better soil health
4 To increase crop yield
5 Motivation from village demonstration/training/exposure visits to places with best farming practices
6 Peer farmers' group pressure 7 Since it was a new technological practice 8 Any other, specify_________________________
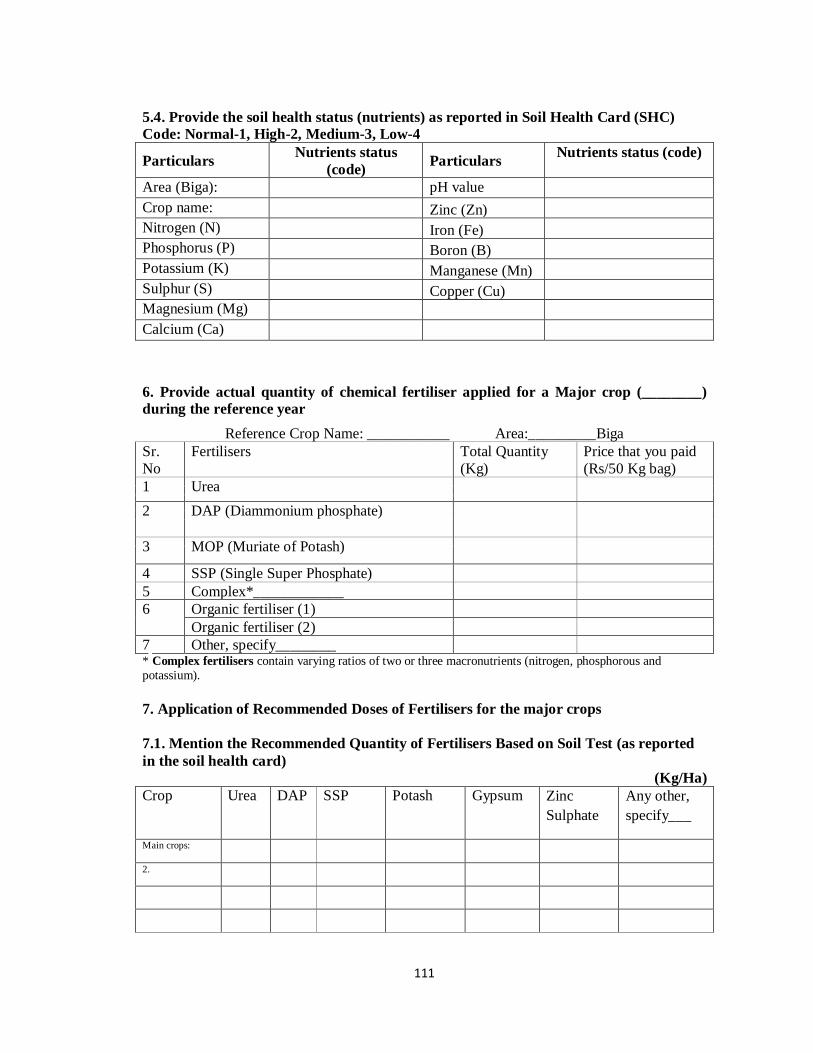
111
5.4. Provide the soil health status (nutrients) as reported in Soil Health Card (SHC) Code: Normal-1, High-2, Medium-3, Low-4
Particulars Nutrients status (code) Particulars Nutrients status (code)
Area (Biga): pH value Crop name: Zinc (Zn) Nitrogen (N) Iron (Fe) Phosphorus (P) Boron (B) Potassium (K) Manganese (Mn) Sulphur (S) Copper (Cu) Magnesium (Mg) Calcium (Ca)
6. Provide actual quantity of chemical fertiliser applied for a Major crop (________) during the reference year
Reference Crop Name: ___________ Area:_________Biga Sr. No
Fertilisers Total Quantity (Kg)
Price that you paid (Rs/50 Kg bag)
1 Urea
2 DAP (Diammonium phosphate)
3 MOP (Muriate of Potash)
4 SSP (Single Super Phosphate) 5 Complex*____________ 6 Organic fertiliser (1)
Organic fertiliser (2) 7 Other, specify________ * Complex fertilisers contain varying ratios of two or three macronutrients (nitrogen, phosphorous and potassium). 7. Application of Recommended Doses of Fertilisers for the major crops 7.1. Mention the Recommended Quantity of Fertilisers Based on Soil Test (as reported in the soil health card)
(Kg/Ha) Crop Urea DAP SSP Potash Gypsum Zinc
Sulphate Any other, specify___
Main crops: 2.
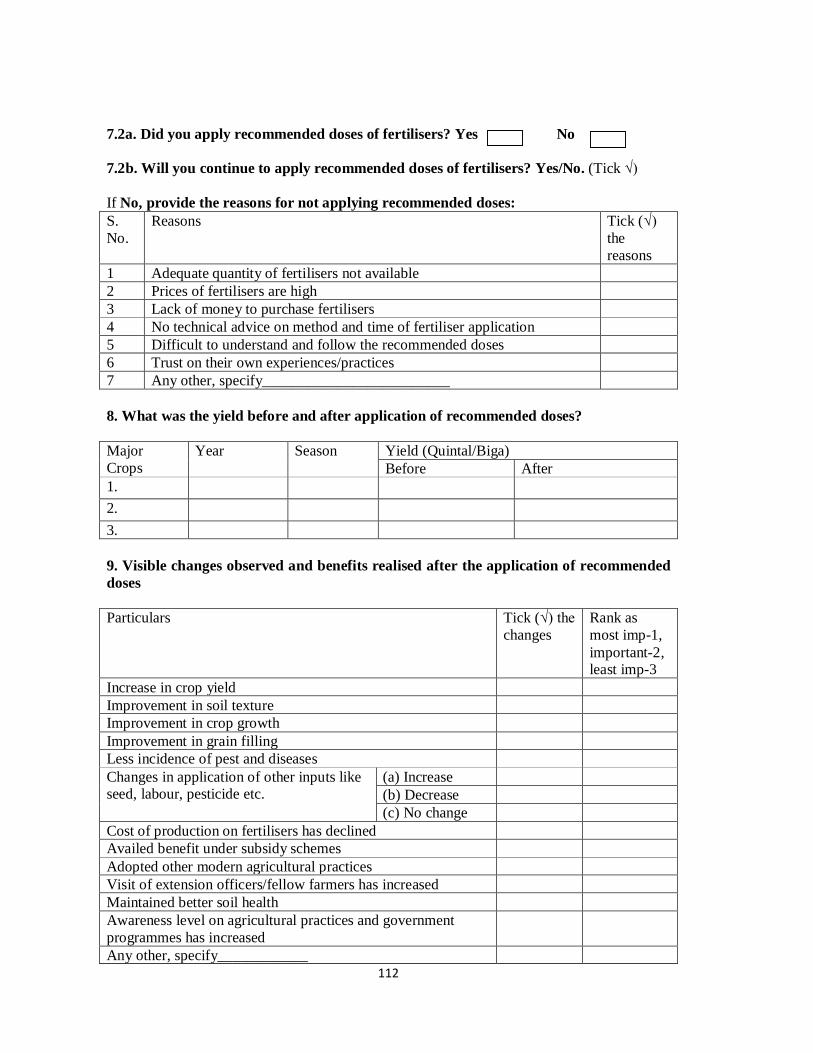
112
7.2a. Did you apply recommended doses of fertilisers? Yes No 7.2b. Will you continue to apply recommended doses of fertilisers? Yes/No. (Tick √) If No, provide the reasons for not applying recommended doses: S. No.
Reasons Tick (√) the reasons
1 Adequate quantity of fertilisers not available 2 Prices of fertilisers are high 3 Lack of money to purchase fertilisers 4 No technical advice on method and time of fertiliser application 5 Difficult to understand and follow the recommended doses 6 Trust on their own experiences/practices 7 Any other, specify_________________________ 8. What was the yield before and after application of recommended doses? Major Crops
Year Season Yield (Quintal/Biga) Before After
1.
2.
3. 9. Visible changes observed and benefits realised after the application of recommended doses Particulars Tick (√) the
changes Rank as most imp-1, important-2, least imp-3
Increase in crop yield Improvement in soil texture Improvement in crop growth Improvement in grain filling Less incidence of pest and diseases Changes in application of other inputs like seed, labour, pesticide etc.
(a) Increase (b) Decrease (c) No change
Cost of production on fertilisers has declined Availed benefit under subsidy schemes Adopted other modern agricultural practices Visit of extension officers/fellow farmers has increased Maintained better soil health Awareness level on agricultural practices and government programmes has increased
Any other, specify____________
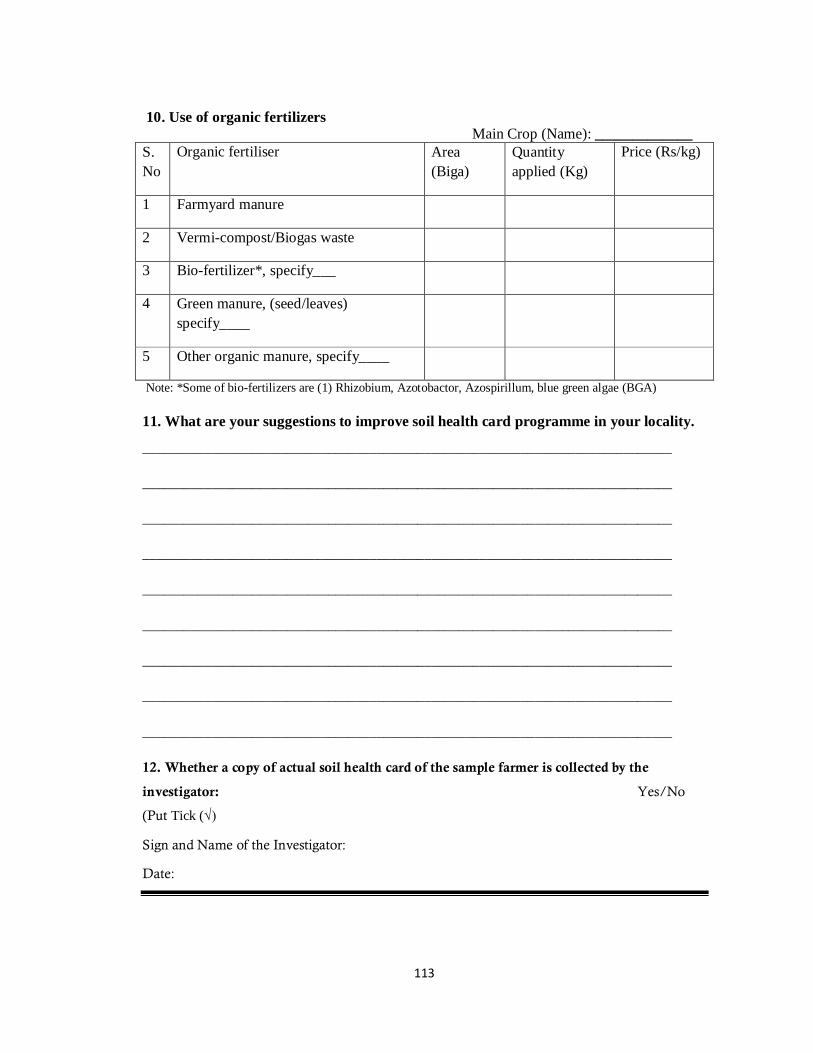
113
10. Use of organic fertilizers Main Crop (Name): _____________
S. No
Organic fertiliser Area (Biga)
Quantity applied (Kg)
Price (Rs/kg)
1 Farmyard manure
2 Vermi-compost/Biogas waste
3 Bio-fertilizer*, specify___
4 Green manure, (seed/leaves) specify____
5 Other organic manure, specify____
Note: *Some of bio-fertilizers are (1) Rhizobium, Azotobactor, Azospirillum, blue green algae (BGA) 11. What are your suggestions to improve soil health card programme in your locality.
_____________________________________________________________________________
_____________________________________________________________________________
_____________________________________________________________________________
_____________________________________________________________________________
_____________________________________________________________________________
_____________________________________________________________________________
_____________________________________________________________________________
_____________________________________________________________________________
_____________________________________________________________________________
12. Whether a copy of actual soil health card of the sample farmer is collected by the
investigator: Yes/No
(Put Tick (√)
Sign and Name of the Investigator:
Date:
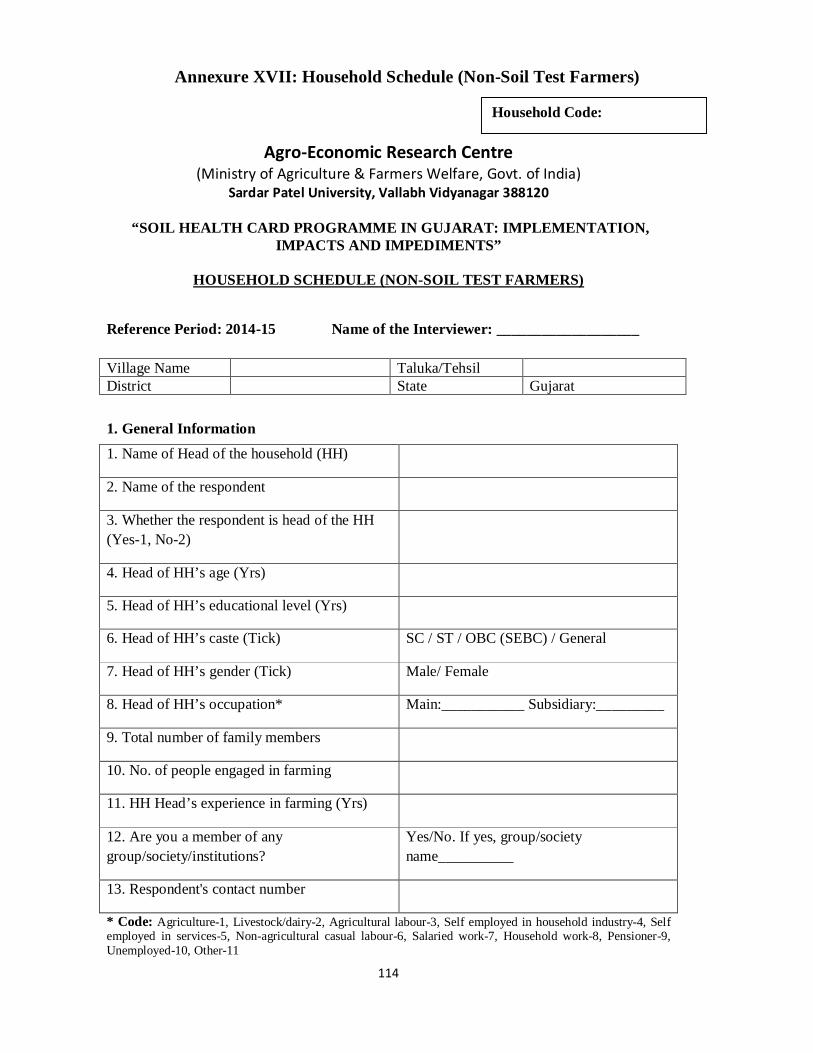
114
Agro-Economic Research Centre (Ministry of Agriculture & Farmers Welfare, Govt. of India)
Sardar Patel University, Vallabh Vidyanagar 388120
“SOIL HEALTH CARD PROGRAMME IN GUJARAT: IMPLEMENTATION, IMPACTS AND IMPEDIMENTS”
HOUSEHOLD SCHEDULE (NON-SOIL TEST FARMERS)
Reference Period: 2014-15 Name of the Interviewer: ___________________
Village Name Taluka/Tehsil District State Gujarat
1. General Information
1. Name of Head of the household (HH)
2. Name of the respondent
3. Whether the respondent is head of the HH (Yes-1, No-2)
4. Head of HH’s age (Yrs)
5. Head of HH’s educational level (Yrs)
6. Head of HH’s caste (Tick) SC / ST / OBC (SEBC) / General
7. Head of HH’s gender (Tick) Male/ Female
8. Head of HH’s occupation* Main:___________ Subsidiary:_________
9. Total number of family members
10. No. of people engaged in farming
11. HH Head’s experience in farming (Yrs)
12. Are you a member of any group/society/institutions?
Yes/No. If yes, group/society name__________
13. Respondent's contact number
* Code: Agriculture-1, Livestock/dairy-2, Agricultural labour-3, Self employed in household industry-4, Self employed in services-5, Non-agricultural casual labour-6, Salaried work-7, Household work-8, Pensioner-9, Unemployed-10, Other-11
Annexure XVII: Household Schedule (Non-Soil Test Farmers)
Household Code:
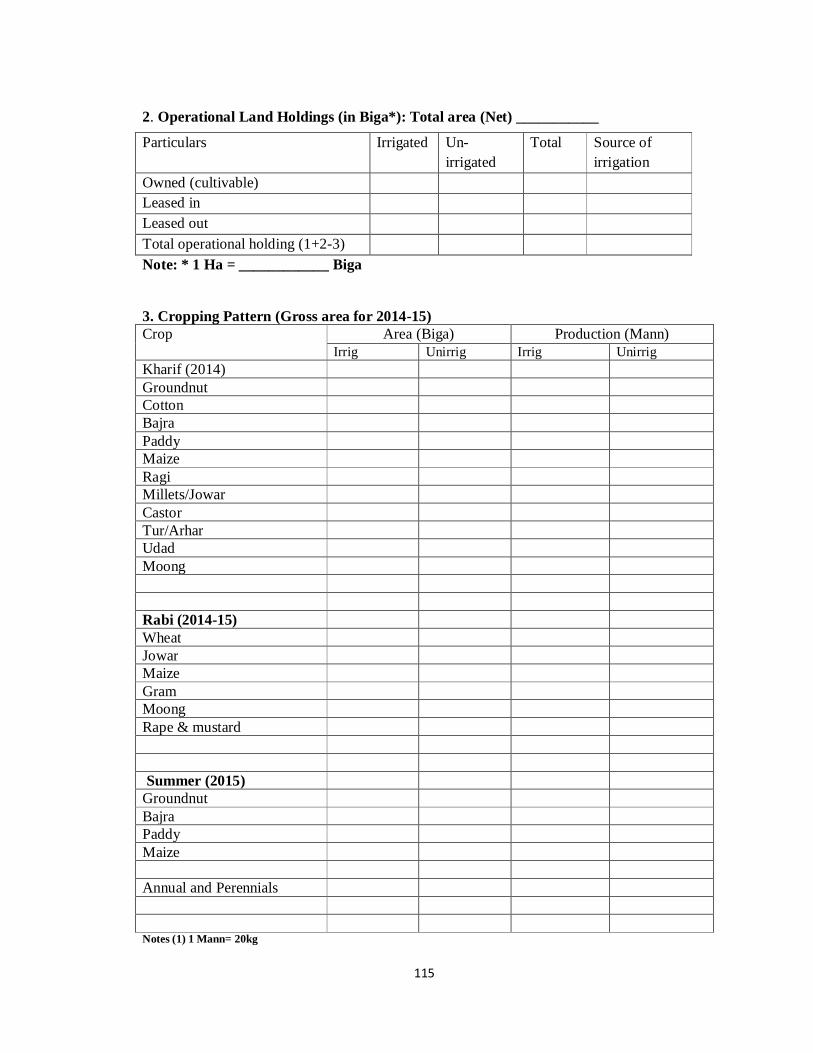
115
2. Operational Land Holdings (in Biga*): Total area (Net) ___________
Particulars Irrigated Un-irrigated
Total Source of irrigation
Owned (cultivable) Leased in Leased out Total operational holding (1+2-3) Note: * 1 Ha = ____________ Biga 3. Cropping Pattern (Gross area for 2014-15) Crop
Area (Biga) Production (Mann) Irrig Unirrig Irrig Unirrig
Kharif (2014) Groundnut Cotton Bajra Paddy Maize Ragi Millets/Jowar Castor Tur/Arhar Udad Moong Rabi (2014-15) Wheat Jowar Maize Gram Moong Rape & mustard Summer (2015) Groundnut Bajra Paddy Maize Annual and Perennials Notes (1) 1 Mann= 20kg
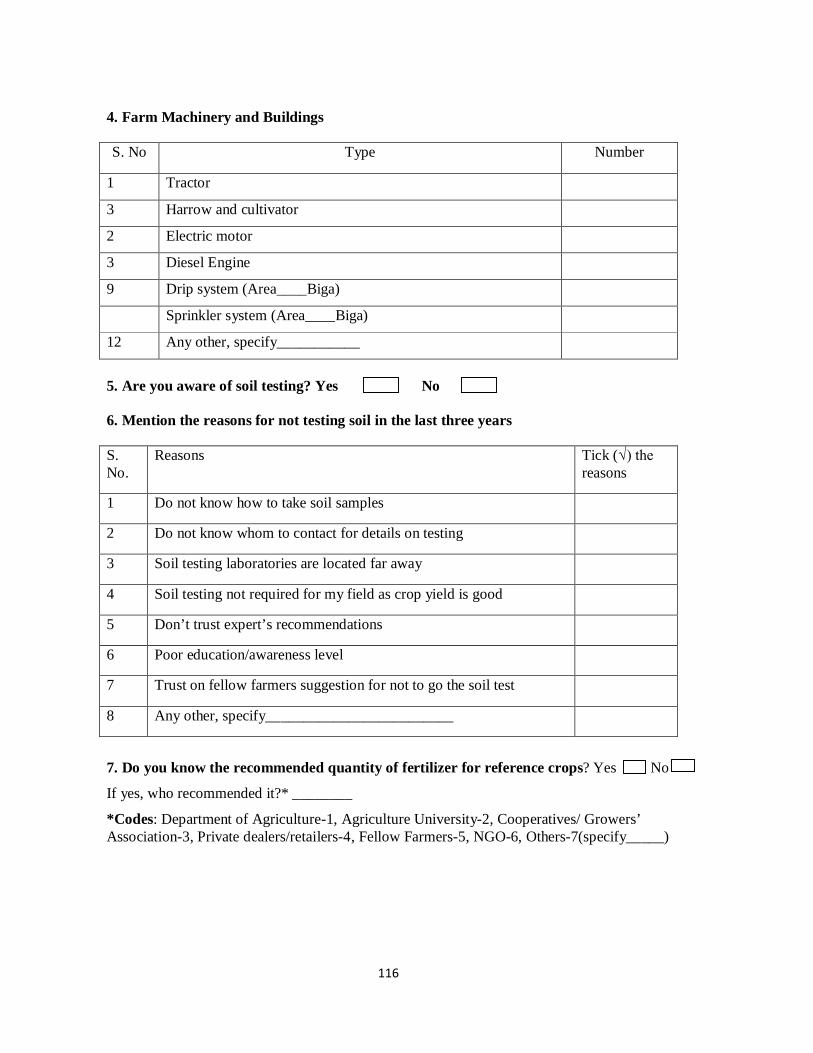
116
4. Farm Machinery and Buildings S. No Type Number
1 Tractor
3 Harrow and cultivator
2 Electric motor
3 Diesel Engine
9 Drip system (Area____Biga)
Sprinkler system (Area____Biga)
12 Any other, specify___________
5. Are you aware of soil testing? Yes No 6. Mention the reasons for not testing soil in the last three years S. No.
Reasons Tick (√) the reasons
1 Do not know how to take soil samples
2 Do not know whom to contact for details on testing
3 Soil testing laboratories are located far away
4 Soil testing not required for my field as crop yield is good
5 Don’t trust expert’s recommendations
6 Poor education/awareness level
7 Trust on fellow farmers suggestion for not to go the soil test
8 Any other, specify_________________________
7. Do you know the recommended quantity of fertilizer for reference crops? Yes No
If yes, who recommended it?* ________
*Codes: Department of Agriculture-1, Agriculture University-2, Cooperatives/ Growers’ Association-3, Private dealers/retailers-4, Fellow Farmers-5, NGO-6, Others-7(specify_____)
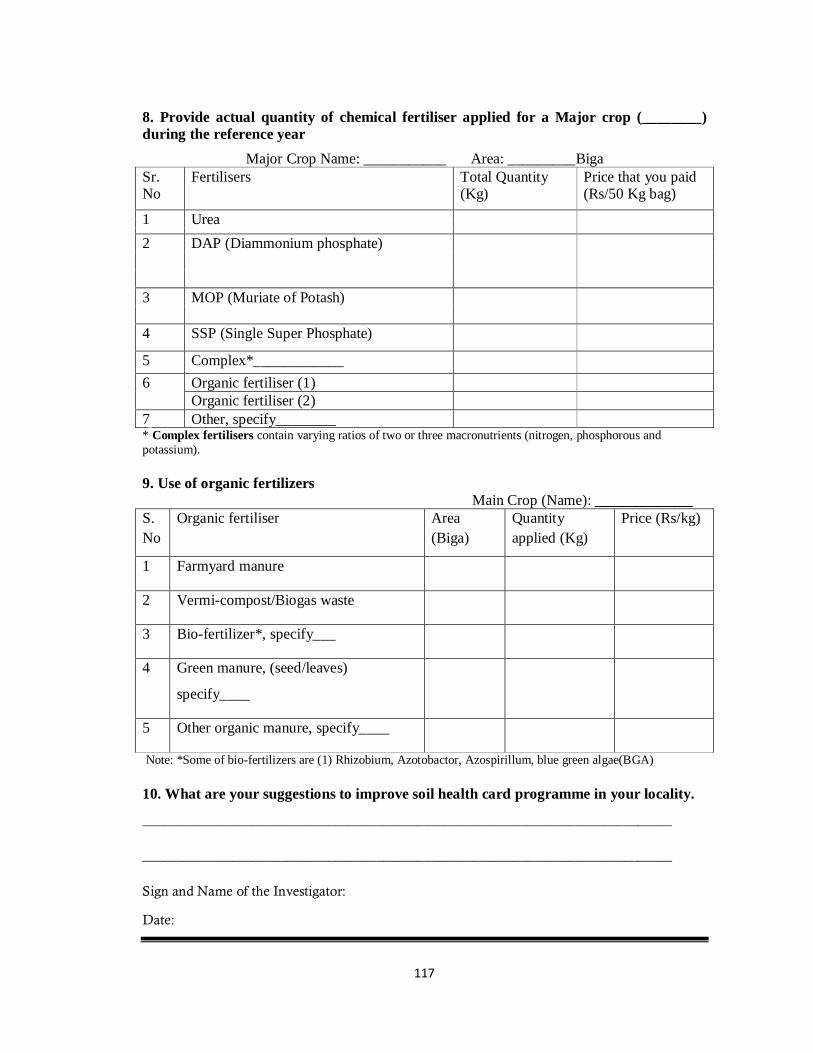
117
8. Provide actual quantity of chemical fertiliser applied for a Major crop (________) during the reference year
Major Crop Name: ___________ Area: _________Biga Sr. No
Fertilisers Total Quantity (Kg)
Price that you paid (Rs/50 Kg bag)
1 Urea
2 DAP (Diammonium phosphate)
3 MOP (Muriate of Potash)
4 SSP (Single Super Phosphate)
5 Complex*____________
6 Organic fertiliser (1) Organic fertiliser (2)
7 Other, specify________ * Complex fertilisers contain varying ratios of two or three macronutrients (nitrogen, phosphorous and potassium). 9. Use of organic fertilizers
Main Crop (Name): _____________ S. No
Organic fertiliser Area (Biga)
Quantity applied (Kg)
Price (Rs/kg)
1 Farmyard manure
2 Vermi-compost/Biogas waste
3 Bio-fertilizer*, specify___
4 Green manure, (seed/leaves)
specify____
5 Other organic manure, specify____
Note: *Some of bio-fertilizers are (1) Rhizobium, Azotobactor, Azospirillum, blue green algae(BGA) 10. What are your suggestions to improve soil health card programme in your locality.
_____________________________________________________________________________
_____________________________________________________________________________
Sign and Name of the Investigator:
Date:
Related Documents


![FINAL REPORT SOIL INVESTIGATION WORK FOR A ... 1...Job no. 101/05/2018 2 [ 1 ] INTRODUCTION : Gujarat Power Corporation Ltd.,Dholera proposes soil investigation work for construction](https://static.cupdf.com/doc/110x72/5e6c1d43bb87d52ec46c2fe2/final-report-soil-investigation-work-for-a-1-job-no-101052018-2-1-.jpg)

