(*) Also at ITA - Aeronautics Institute of Technology - Brazil Software Product Measurement and Analysis in a Continuous Integration Environment Gabriel de Souza Pereira Moreira Imagem – Geographic Intelligence Solutions * - Brazil Roberto Pepato Mellado Imagem – Geographic Intelligence Solutions - Brazil Denis Ávila Montini ITA – Aeronautics Institute of Technology - Brazil Luiz Alberto Vieira Dias ITA – Aeronautics Institute of Technology - Brazil Adilson Marques da Cunha ITA – Aeronautics Institute of Technology - Brazil Abstract This paper describes a framework for a software internal quality measurement program with automatic metrics extraction. This framework was successfully implemented in an Industrial Software Factory. That was possible through the implementation of a proposed Continuous Integration (CI) environment to periodically analyze source codes and extract metrics. These metrics were consolidated in a Data Warehouse by allowing On-line Analytical Processing (OLAP) and Key Performance Indicator (KPI) analysis with high-performance and user- friendly interface. The measurement program followed GQ(I)M paradigm for metrics selection to ensure that collected metrics are relevant from the Software Factory goals perspective. Finally, the Measurement and Analysis Process Area of the Capability Maturity Model integration - CMMi was used for measurement and analysis planning and implementation. Key Words: Software Measurement, Software Metrics, Goal-Driven Measurement, Software Product Quality, Continuous Integration. 1. Introduction This paper focuses in a case study of developing a framework for automatic extraction of software product metrics and its consolidation in a Software Factory Data Warehouse (DW). The process for planning and implementing the software product metrics program followed some best practices of Measurement and Analysis, a Process Area of the Capability Maturity Model Integration (CMMi)[2]. The software metrics selection followed the Goals- Questions-(Indicators)-Measures (GQ(I)M) concepts. Thus, all Metrics were related to Questions which were also related to Measurement Goals, ensuring that all metrics have good reasons for collections and analyses, from the business perspective of a Software Factory. The automatic metrics extraction multiple times a day was possible by means of a Continuous Integration (CI) implementation. The CI strategy used in this work involves compiling, analyzing source-codes, running unit tests, and deploying a software project. Software code metrics were periodically extracted from the analysis of source codes persisted in a database. Then, after the last CI build of the day, an Extract, Transform, and Load (ETL) process run, and some software metrics were consolidated into a Data Warehouse (DW) of a Software Factory. The use of Online Analytical Processing (OLAP) analysis of software metrics has allowed easy auditing of the Object-Oriented (OO) software code and architecture. It allowed also its comparison with other OO projects from the same platform. The OLAP has provided other benefits like analysis of test metrics, such as test code coverage and unit tests that have passed in a build. A set of Key Performance Indicators (KPI) were created over some consolidated metrics in a DW to present a dashboard view of the current status of software product quality in Software Factory projects. 2. Software Metrics Measurements can be used by software engineers to help assessing the quality of technical work products and to assist in tactical decisions during a project [1]. After developing metrics and collecting measures some indicators can be obtained. An indicator is a metric or combination of metrics that provide insights into a software process, a software project, or the product [1]. To accomplish real-time quality assessment, engineers must use technical measures to evaluate quality in objective rather than in subjective ways. [1] The ISO/IEC 9126 [12] was the first generation of software quality engineering standards for software products. The second generation [13] of the series of software quality standards was ISO/IEC 25000 (SQuaRE) [10]. Both ISO standard families are based on the model described in Figure 1, where the quality of the process influences the internal quality of the software product, which in turn influences its external quality, and then its quality in use.

Welcome message from author
This document is posted to help you gain knowledge. Please leave a comment to let me know what you think about it! Share it to your friends and learn new things together.
Transcript
(*) Also at ITA - Aeronautics Institute of Technology - Brazil
Software Product Measurement and Analysis in a Continuous Integration Environment
Gabriel de Souza Pereira Moreira
Imagem – Geographic Intelligence Solutions * - Brazil
Roberto Pepato Mellado Imagem – Geographic
Intelligence Solutions - Brazil
Denis Ávila Montini ITA – Aeronautics Institute
of Technology - Brazil
Luiz Alberto Vieira Dias ITA – Aeronautics Institute of
Technology - Brazil
Adilson Marques da Cunha ITA – Aeronautics Institute
of Technology - Brazil
Abstract This paper describes a framework for a software internal quality measurement program with automatic metrics extraction. This framework was successfully implemented in an Industrial Software Factory. That was possible through the implementation of a proposed Continuous Integration (CI) environment to periodically analyze source codes and extract metrics. These metrics were consolidated in a Data Warehouse by allowing On-line Analytical Processing (OLAP) and Key Performance Indicator (KPI) analysis with high-performance and user-friendly interface. The measurement program followed GQ(I)M paradigm for metrics selection to ensure that collected metrics are relevant from the Software Factory goals perspective. Finally, the Measurement and Analysis Process Area of the Capability Maturity Model integration - CMMi was used for measurement and analysis planning and implementation. Key Words: Software Measurement, Software Metrics, Goal-Driven Measurement, Software Product Quality, Continuous Integration. 1. Introduction
This paper focuses in a case study of developing a framework for automatic extraction of software product metrics and its consolidation in a Software Factory Data Warehouse (DW).
The process for planning and implementing the software product metrics program followed some best practices of Measurement and Analysis, a Process Area of the Capability Maturity Model Integration (CMMi)[2].
The software metrics selection followed the Goals-Questions-(Indicators)-Measures (GQ(I)M) concepts. Thus, all Metrics were related to Questions which were also related to Measurement Goals, ensuring that all metrics have good reasons for collections and analyses, from the business perspective of a Software Factory.
The automatic metrics extraction multiple times a day was possible by means of a Continuous Integration (CI) implementation. The CI strategy used in this work
involves compiling, analyzing source-codes, running unit tests, and deploying a software project.
Software code metrics were periodically extracted from the analysis of source codes persisted in a database. Then, after the last CI build of the day, an Extract, Transform, and Load (ETL) process run, and some software metrics were consolidated into a Data Warehouse (DW) of a Software Factory.
The use of Online Analytical Processing (OLAP) analysis of software metrics has allowed easy auditing of the Object-Oriented (OO) software code and architecture. It allowed also its comparison with other OO projects from the same platform. The OLAP has provided other benefits like analysis of test metrics, such as test code coverage and unit tests that have passed in a build.
A set of Key Performance Indicators (KPI) were created over some consolidated metrics in a DW to present a dashboard view of the current status of software product quality in Software Factory projects.
2. Software Metrics
Measurements can be used by software engineers to help assessing the quality of technical work products and to assist in tactical decisions during a project [1].
After developing metrics and collecting measures some indicators can be obtained. An indicator is a metric or combination of metrics that provide insights into a software process, a software project, or the product [1].
To accomplish real-time quality assessment, engineers must use technical measures to evaluate quality in objective rather than in subjective ways. [1]
The ISO/IEC 9126 [12] was the first generation of software quality engineering standards for software products. The second generation [13] of the series of software quality standards was ISO/IEC 25000 (SQuaRE) [10]. Both ISO standard families are based on the model described in Figure 1, where the quality of the process influences the internal quality of the software product, which in turn influences its external quality, and then its quality in use.
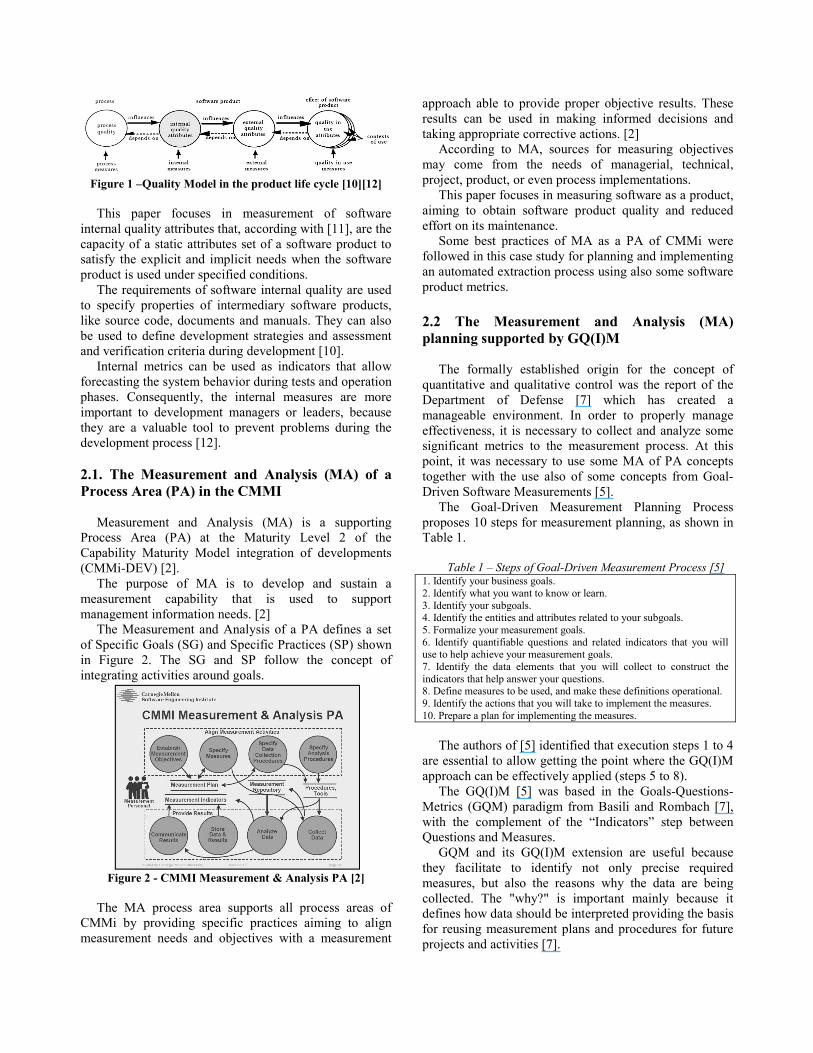
Figure 1 –Quality Model in the product life cycle [10][12] This paper focuses in measurement of software
internal quality attributes that, according with [11], are the capacity of a static attributes set of a software product to satisfy the explicit and implicit needs when the software product is used under specified conditions.
The requirements of software internal quality are used to specify properties of intermediary software products, like source code, documents and manuals. They can also be used to define development strategies and assessment and verification criteria during development [10].
Internal metrics can be used as indicators that allow forecasting the system behavior during tests and operation phases. Consequently, the internal measures are more important to development managers or leaders, because they are a valuable tool to prevent problems during the development process [12]. 2.1. The Measurement and Analysis (MA) of a Process Area (PA) in the CMMI
Measurement and Analysis (MA) is a supporting Process Area (PA) at the Maturity Level 2 of the Capability Maturity Model integration of developments (CMMi-DEV) [2].
The purpose of MA is to develop and sustain a measurement capability that is used to support management information needs. [2]
The Measurement and Analysis of a PA defines a set of Specific Goals (SG) and Specific Practices (SP) shown in Figure 2. The SG and SP follow the concept of integrating activities around goals.
Figure 2 - CMMI Measurement & Analysis PA [2]
The MA process area supports all process areas of
CMMi by providing specific practices aiming to align measurement needs and objectives with a measurement
approach able to provide proper objective results. These results can be used in making informed decisions and taking appropriate corrective actions. [2]
According to MA, sources for measuring objectives may come from the needs of managerial, technical, project, product, or even process implementations.
This paper focuses in measuring software as a product, aiming to obtain software product quality and reduced effort on its maintenance.
Some best practices of MA as a PA of CMMi were followed in this case study for planning and implementing an automated extraction process using also some software product metrics. 2.2 The Measurement and Analysis (MA) planning supported by GQ(I)M
The formally established origin for the concept of
quantitative and qualitative control was the report of the Department of Defense [7] which has created a manageable environment. In order to properly manage effectiveness, it is necessary to collect and analyze some significant metrics to the measurement process. At this point, it was necessary to use some MA of PA concepts together with the use also of some concepts from Goal-Driven Software Measurements [5].
The Goal-Driven Measurement Planning Process proposes 10 steps for measurement planning, as shown in Table 1.
Table 1 – Steps of Goal-Driven Measurement Process [5]
1. Identify your business goals. 2. Identify what you want to know or learn. 3. Identify your subgoals. 4. Identify the entities and attributes related to your subgoals. 5. Formalize your measurement goals. 6. Identify quantifiable questions and related indicators that you will use to help achieve your measurement goals. 7. Identify the data elements that you will collect to construct the indicators that help answer your questions. 8. Define measures to be used, and make these definitions operational. 9. Identify the actions that you will take to implement the measures. 10. Prepare a plan for implementing the measures.
The authors of [5] identified that execution steps 1 to 4
are essential to allow getting the point where the GQ(I)M approach can be effectively applied (steps 5 to 8).
The GQ(I)M [5] was based in the Goals-Questions-Metrics (GQM) paradigm from Basili and Rombach [7], with the complement of the “Indicators” step between Questions and Measures.
GQM and its GQ(I)M extension are useful because they facilitate to identify not only precise required measures, but also the reasons why the data are being collected. The "why?" is important mainly because it defines how data should be interpreted providing the basis for reusing measurement plans and procedures for future projects and activities [7].
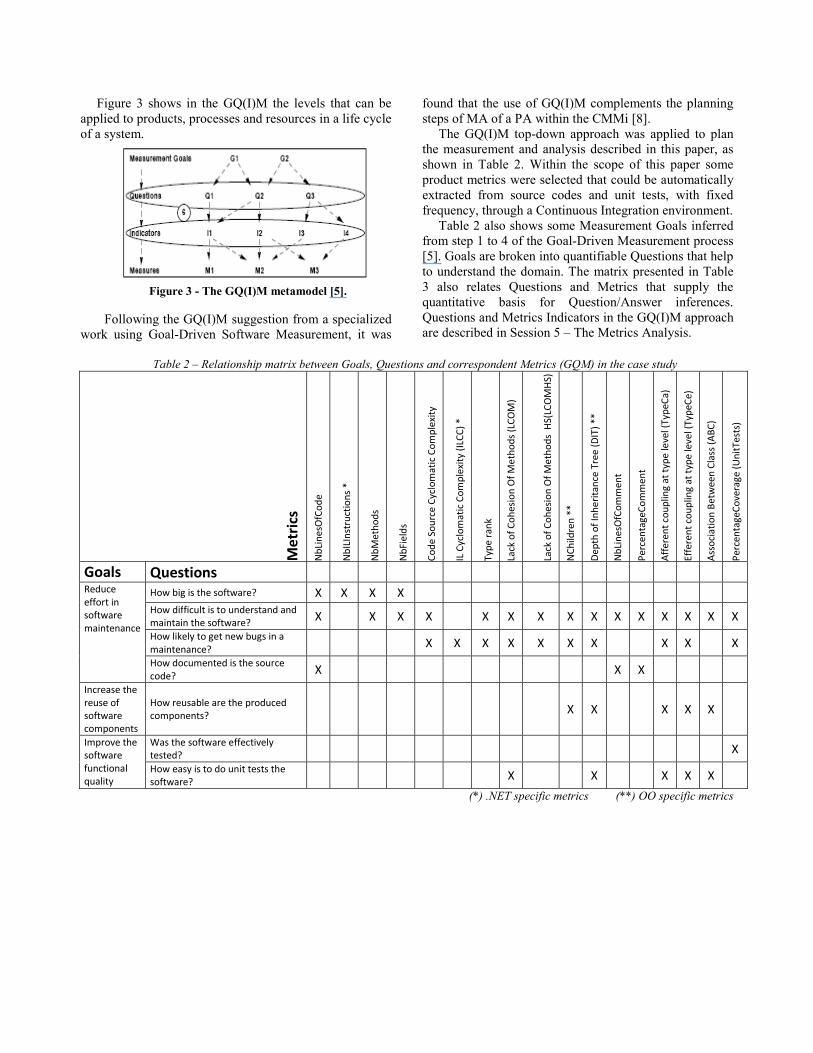
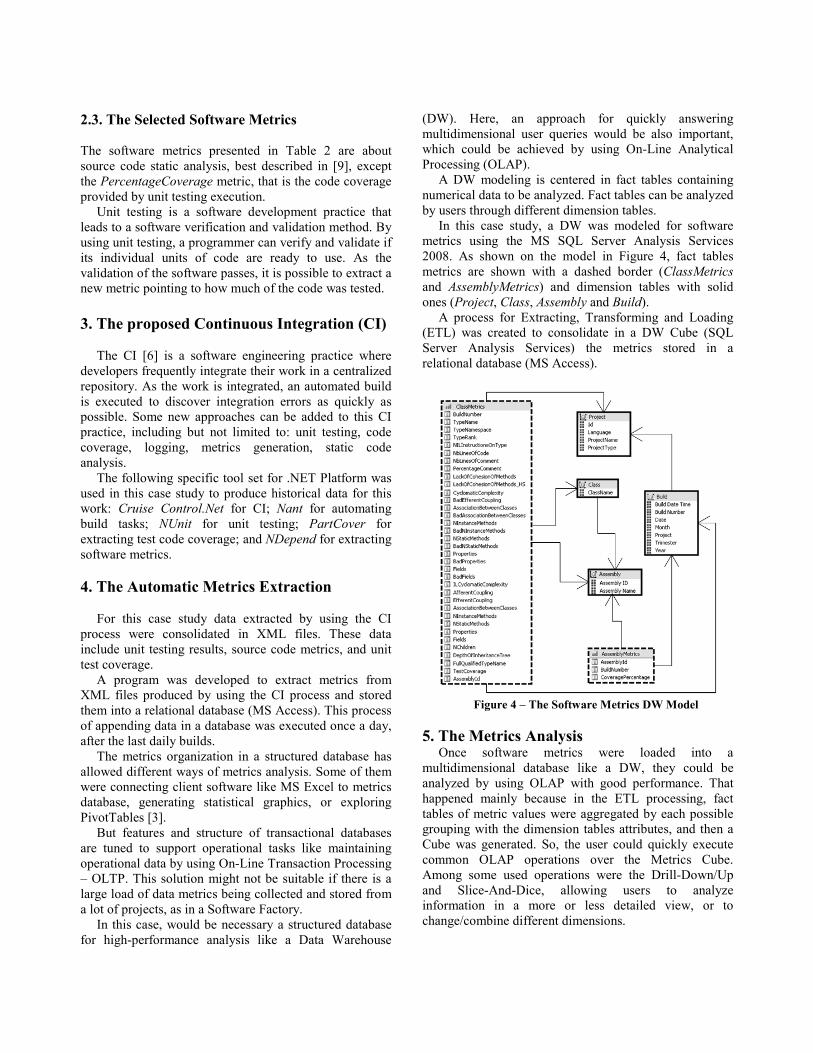
Figure 3 shows in the GQ(I)M the levels that can be applied to products, processes and resources in a life cycle of a system.
Figure 3 - The GQ(I)M metamodel [5].
Following the GQ(I)M suggestion from a specialized
work using Goal-Driven Software Measurement, it was
found that the use of GQ(I)M complements the planning steps of MA of a PA within the CMMi [8].
The GQ(I)M top-down approach was applied to plan the measurement and analysis described in this paper, as shown in Table 2. Within the scope of this paper some product metrics were selected that could be automatically extracted from source codes and unit tests, with fixed frequency, through a Continuous Integration environment.
Table 2 also shows some Measurement Goals inferred from step 1 to 4 of the Goal-Driven Measurement process [5]. Goals are broken into quantifiable Questions that help to understand the domain. The matrix presented in Table 3 also relates Questions and Metrics that supply the quantitative basis for Question/Answer inferences. Questions and Metrics Indicators in the GQ(I)M approach are described in Session 5 – The Metrics Analysis.
Table 2 – Relationship matrix between Goals, Questions and correspondent Metrics (GQM) in the case study
Met
rics
NbL
ines
OfC
ode
NbI
LIns
truc
tions
*
NbM
etho
ds
NbF
ield
s
Code
Sou
rce
Cycl
omat
ic C
ompl
exity
IL C
yclo
mat
ic C
ompl
exity
(ILC
C) *
Type
rank
Lack
of C
ohes
ion
Of M
etho
ds (L
COM
)
Lack
of C
ohes
ion
Of M
etho
ds H
S(LC
OM
HS)
NCh
ildre
n **
Dep
th o
f Inh
erita
nce
Tree
(DIT
) **
NbL
ines
OfC
omm
ent
Perc
enta
geCo
mm
ent
Aff
eren
t cou
plin
g at
type
leve
l (Ty
peCa
)
Effe
rent
cou
plin
g at
type
leve
l (Ty
peCe
)
Ass
ocia
tion
Betw
een
Clas
s (A
BC)
Perc
enta
geCo
vera
ge (U
nitT
ests
)
Goals Questions Reduce effort in software maintenance
How big is the software? X X X X How difficult is to understand and maintain the software? X X X X X X X X X X X X X X X
How likely to get new bugs in a maintenance? X X X X X X X X X X
How documented is the source code? X X X
Increase the reuse of software components
How reusable are the produced components? X X X X X
Improve the software functional quality
Was the software effectively tested? X
How easy is to do unit tests the software? X X X X X
(*) .NET specific metrics (**) OO specific metrics
2.3. The Selected Software Metrics The software metrics presented in Table 2 are about source code static analysis, best described in [9], except the PercentageCoverage metric, that is the code coverage provided by unit testing execution.
Unit testing is a software development practice that leads to a software verification and validation method. By using unit testing, a programmer can verify and validate if its individual units of code are ready to use. As the validation of the software passes, it is possible to extract a new metric pointing to how much of the code was tested. 3. The proposed Continuous Integration (CI)
The CI [6] is a software engineering practice where developers frequently integrate their work in a centralized repository. As the work is integrated, an automated build is executed to discover integration errors as quickly as possible. Some new approaches can be added to this CI practice, including but not limited to: unit testing, code coverage, logging, metrics generation, static code analysis.
The following specific tool set for .NET Platform was used in this case study to produce historical data for this work: Cruise Control.Net for CI; Nant for automating build tasks; NUnit for unit testing; PartCover for extracting test code coverage; and NDepend for extracting software metrics. 4. The Automatic Metrics Extraction
For this case study data extracted by using the CI process were consolidated in XML files. These data include unit testing results, source code metrics, and unit test coverage.
A program was developed to extract metrics from XML files produced by using the CI process and stored them into a relational database (MS Access). This process of appending data in a database was executed once a day, after the last daily builds.
The metrics organization in a structured database has allowed different ways of metrics analysis. Some of them were connecting client software like MS Excel to metrics database, generating statistical graphics, or exploring PivotTables [3].
But features and structure of transactional databases are tuned to support operational tasks like maintaining operational data by using On-Line Transaction Processing – OLTP. This solution might not be suitable if there is a large load of data metrics being collected and stored from a lot of projects, as in a Software Factory.
In this case, would be necessary a structured database for high-performance analysis like a Data Warehouse
(DW). Here, an approach for quickly answering multidimensional user queries would be also important, which could be achieved by using On-Line Analytical Processing (OLAP).
A DW modeling is centered in fact tables containing numerical data to be analyzed. Fact tables can be analyzed by users through different dimension tables.
In this case study, a DW was modeled for software metrics using the MS SQL Server Analysis Services 2008. As shown on the model in Figure 4, fact tables metrics are shown with a dashed border (ClassMetrics and AssemblyMetrics) and dimension tables with solid ones (Project, Class, Assembly and Build).
A process for Extracting, Transforming and Loading (ETL) was created to consolidate in a DW Cube (SQL Server Analysis Services) the metrics stored in a relational database (MS Access).
Figure 4 – The Software Metrics DW Model
5. The Metrics Analysis
Once software metrics were loaded into a multidimensional database like a DW, they could be analyzed by using OLAP with good performance. That happened mainly because in the ETL processing, fact tables of metric values were aggregated by each possible grouping with the dimension tables attributes, and then a Cube was generated. So, the user could quickly execute common OLAP operations over the Metrics Cube. Among some used operations were the Drill-Down/Up and Slice-And-Dice, allowing users to analyze information in a more or less detailed view, or to change/combine different dimensions.
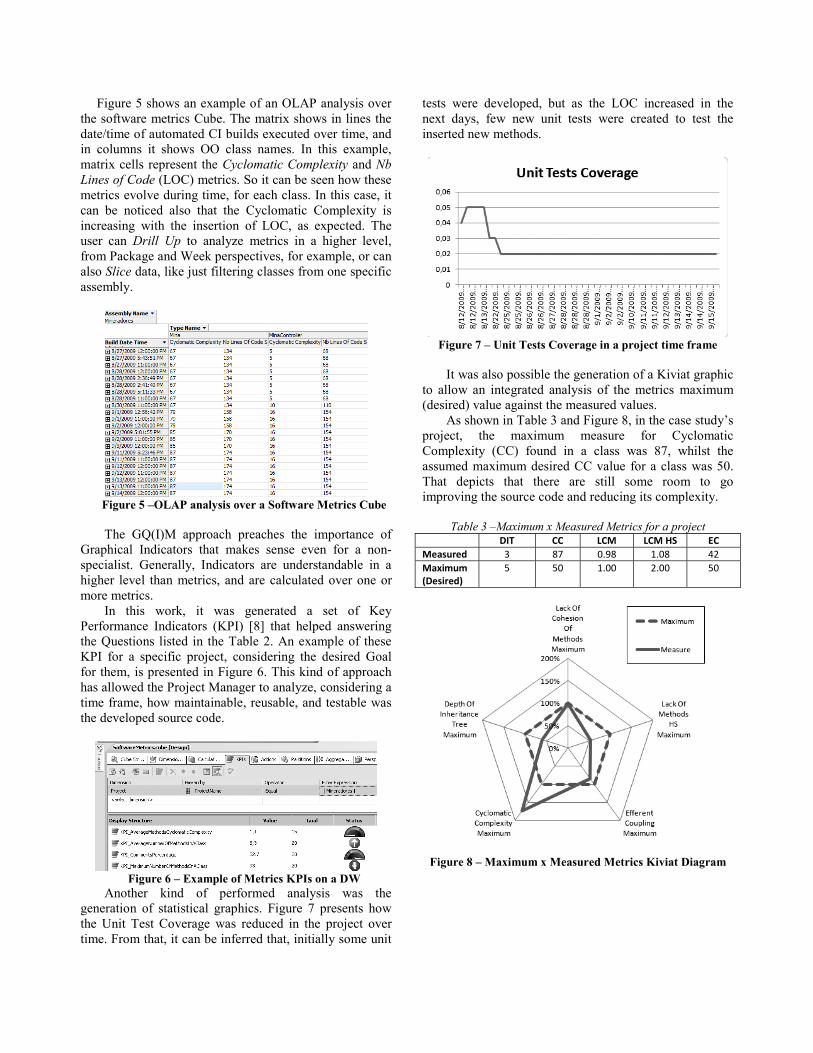
Figure 5 shows an example of an OLAP analysis over the software metrics Cube. The matrix shows in lines the date/time of automated CI builds executed over time, and in columns it shows OO class names. In this example, matrix cells represent the Cyclomatic Complexity and Nb Lines of Code (LOC) metrics. So it can be seen how these metrics evolve during time, for each class. In this case, it can be noticed also that the Cyclomatic Complexity is increasing with the insertion of LOC, as expected. The user can Drill Up to analyze metrics in a higher level, from Package and Week perspectives, for example, or can also Slice data, like just filtering classes from one specific assembly.
Figure 5 –OLAP analysis over a Software Metrics Cube The GQ(I)M approach preaches the importance of
Graphical Indicators that makes sense even for a non-specialist. Generally, Indicators are understandable in a higher level than metrics, and are calculated over one or more metrics.
In this work, it was generated a set of Key Performance Indicators (KPI) [8] that helped answering the Questions listed in the Table 2. An example of these KPI for a specific project, considering the desired Goal for them, is presented in Figure 6. This kind of approach has allowed the Project Manager to analyze, considering a time frame, how maintainable, reusable, and testable was the developed source code.
Figure 6 – Example of Metrics KPIs on a DW
Another kind of performed analysis was the generation of statistical graphics. Figure 7 presents how the Unit Test Coverage was reduced in the project over time. From that, it can be inferred that, initially some unit
tests were developed, but as the LOC increased in the next days, few new unit tests were created to test the inserted new methods.
Figure 7 – Unit Tests Coverage in a project time frame
It was also possible the generation of a Kiviat graphic
to allow an integrated analysis of the metrics maximum (desired) value against the measured values.
As shown in Table 3 and Figure 8, in the case study’s project, the maximum measure for Cyclomatic Complexity (CC) found in a class was 87, whilst the assumed maximum desired CC value for a class was 50. That depicts that there are still some room to go improving the source code and reducing its complexity.
Table 3 –Maximum x Measured Metrics for a project
DIT CC LCM LCM HS ECMeasured 3 87 0.98 1.08 42Maximum(Desired)
5 50 1.00 2.00 50
Figure 8 – Maximum x Measured Metrics Kiviat Diagram
6. Conclusion The main contributions of this research was obtained
from the planning of a software product metrics program in a Industrial Software Factory and its implementation using a Continuous Integration environment for automatic metrics extraction from source codes.
The use of Goal-Driven Measurement approach and GQ(I)M concepts have allowed to ensure during the planning that all collected metrics have matched not only measurement objectives but also business objectives of a Software Factory, in this case study. The selected metrics have shown how maintainable, reusable and testable was the source code developed in a project.
The practices of Measurement and Analysis (MA), as Process Area (PA) within a CMMi level 2, was used to successfully plan the metrics program by considering which kind of analysis could be done after its implementation.
In a case study, software metrics were systematically collected from the source code and consolidated in a DW through the customization of a proposed CI environment strategy. This application has allowed software product analysis by using high-performance architecture, DW, and user-friendly interface with OLAP.
There were some created Indicators like KPI and statistical graphics that have also allowed a higher level of understanding of the project source code status and its evolution. At last, it was found that some KPI could also be used to compare Object-Oriented projects developed in the same platform. 7. Recommendations
The authors of this paper recommend that concepts of constructing framework of automatic source-code metrics extraction and its consolidation in a DW can be effectively applied also to other languages and development platforms.
But for other languages it is also important to use the best practices in planning and implementing a software metrics program that includes, but is not limited to: the Goal-Driven Measurement approach; the GQ(I)M paradigm; and the practices of Measurement and Analysis (MA) as Process Area (PA) in CMMi level 2. 8. Acknowledgments
The maintenance of an infrastructure for software engineering research is a crucial point.
The authors of this paper would like to thank some institutions and research groups that have been contributing to the advancement of this specialized work. Among them are: the Brazilian Aeronautics Institute of Technology (Instituto Tecnológico de Aeronáutica – ITA), the Fundação Casimiro Montenegro Filho (FCMF), and the ITA Software Engineering Research Group (Grupo de Pesquisa em Eng. de Software-GPES).
Thanks are also due to the following two enterprises: the Imagem Geographic Solutions, for providing the proper research scenario; and the Tata Consulting Services, for its research support. 9. References [1] R. S. Pressman, “Software Engineering”, 6ª Edition, McGraw Hill, NY, 2006. [2] CMMI, Version 1.2 - CMMI-DEV, V1.2, CMU/SEI-2006-TR-008 - Improving processes for better products, SEI - Carnegie Mellon University, Pittsburgh, 2006. [3] TCS, Tata Consultancy Services, “Operational Process for Iterative Development (Unified Process) Integrated Quality Management System IQMS, Air India Building Mumbai, India, October 2006.
[5] R. E. Park; W. B. Goethert; W. A. Florac, CMU/SEI-96-HB-002 - Goal-Driven Software Measurement - A Guidebook. August 1996.
[6] Fowler M. Continuous Integration. Available in http://martinfowler.com/articles/continuousIntegration.html. Accessed at October 29, 2009.
[7] Victor R. Basili, Gianluigi Caldeira, H.Dieter Rombach. The Goal Question Metric Approach. 5th ACM-IEEE International Symposium on Empirical Software Engineering (ISESE ’06), Rio de Janeiro, 2006.
[8] Denis Ávila Montini. Modelo de indicadores de risco para o orçamento de componentes de software para célula de manufatura. Dissertação de Mestrado em Eng. da Produção, Univ. Paulista, São Paulo, 2005.
[9] NDepend Metrics Definition. Available in http://www.ndepend.com/metrics.aspx. Accessed at October 23, 2009.
[10] ISO/IEC 25000, Software Engineering – Software Product Quality Requirements and Evaluation (SQuaRE) - Guide to SQuaRE, 2005.
[11] ISO/IEC 25020, Software and System Engineering - Software Product Quality Requirements and Evaluation (SQuaRE) – Measurement Ref. Model and Guide, 2007.
[12] ISO/IEC 9126-3, Software Engineering – Product Quality - Part 3: Internal Metrics, Geneva, 2003.
[13] Suryn, W.; Abran A.; and April A. ISO/IEC SQuaRE: The Second Generation of Standards for Software Product Quality," 7th IASTED International Conference on Software Engineering and Applications, California, USA, 2003.
Related Documents