Software Measurement Guidebook / SPC-91060-CMC Version 02.01.00 -u i99

Welcome message from author
This document is posted to help you gain knowledge. Please leave a comment to let me know what you think about it! Share it to your friends and learn new things together.
Transcript

Software MeasurementGuidebook
/
SPC-91060-CMCVersion 02.01.00
-u i99

NOTICE
THIS DOCUMENT IS BEST
QUALITY AVAILABLE. THE COPY
FURNISHED TO DTIC CONTAINED
A SIGNIFICANT NUMBER OF
PAGES WHICH DO NOT
REPRODUCE LEGIBLY.

Software MeasurementGuidebook
SPC-91060-CMC
Version 02.01.00
August 1994
Produced by theSOFTWARE PRODUCTIVITY CONSORTIUM SERVICES CORPORATION
under contract to theVIRGINIA CENTER OF EXCELLENCE
FOR SOFTWARE REUSE AND TECHNOLOGY TRANSFER
SPC Buiding2214 Rock Hill Road
Herndon, Virginia 22070
Copyrigt 01991, 1992 1994, Sofware Productivi Cmmortim Sev Csorportiahi,Hedandmo, rginiL Prisisio to use, copy,rnodlI, and dishinte this material for any purpose and withaot fee is hereby granted cnistent with 48 (FR 227 and 252, andprovided thit the above copyright notice appears hi all copies and that both ths copyrih noic and this permmsion notice appearin suppot" doumentatin. Thu materia is based in part upon work sponsored by the Defewe Advanced Research PrjectsAgec under Grant #MDA972-92-J-1018. The content does not necemsargy reflect the position or the policy of the U. S.Govranment, and no cfcial endosemnent should be inferred. The name Sofware Productivity Couri h not be uned inadvatishig or pdmnty pertining to this material or otherwise wthout the prior written peimwacm of Sotware Produc"Ccmoctium, Inc. SOFIWARE PRODUCIIVIlY CONSORTIUM, INC. AND SOFTWARE PRODUCTIVITYCONSOKIlUM SERVICES CORPORATION MAKE NO REPRESENTATIONS OR WARRANTIES ABOUT THESUITABIIlTY OFTHIS MATERIAL FORANY PURPOSE OR ABOUT ANY OTHER MATIM AND TIS MATERIALIS PROVIDED WITHOUr EXPRESS OR IMPLIED WARRANTI OF ANY KIND.

CHANGE HISTORY
Version Number Date of Change Change Description
Version 01.00.04 June 1991 Original document.
Version 02.00.02 December 1992 Complete rewrite. See Preface for a completedescription of the changes since the previousversion.
Version 02.01.00 August 1994 Adjusted terminology relating to the use ofmeasurement in the management of softwaredevelopment.

This page intentionally left blank
CONTENTS
ACKNOWLEDGEMENTS ................... .......... ........... xxiii1. INTRODUCTION .................................................... 1-1
1.1 Scope ................................................................. 1-1
1.1.1 Guidebook Objectives .............................................. 1-1
1.1.2 New Topics in Version 2.0 ........................................... 1-2
1.2 Audience and Benefits ................................................... 1-2
1.3 Guidebook Organization ................................................. 1-4
1.4 How to Use This Guidebook .............................................. 1-5
1.5 Quick Reference Estimation Guide ........................................ 1-6
1.6 Summary of Recommendations ........................................... 1-7
1.7 Typographic Conventions ................................................ 1-8
2. MEASUREMENT.DRIVEN SOFTWARE MANAGEMENT ................. 2-1
2.1 Overview .............................................................. 2-1
2.2 Measurement-Driven Software Management ................................ 2-1
2.2.1 What Is Measurement-Driven Software Management? .. . . . . . . . . . . . . . . . . . 2-1
2.2.2 Project Control .................................................... 2-1
2.2.3 Process and Product Improvement .................................... 2-1
2.2.4 Software Management at Lower Maturity Levels ....................... 2-2
2.2.5 Software Development Management at Intermediate Maturity Levels ...... 2-2
2.2.6 The Measurement-Driven Software Management Process Mndel atAdvanced Maturity Levels ........................................... 2-2
2.2.6.1 Analogy of the Software Development Process to a ClosedLoop Feedback Control System .................................. 2-3
Wi
Contents
2.2.6.2 The Measurement-Driven Software Management Process ClosedLoop Feedback Control Model .................................. 2-3
2.2.6.3 Representation of Knowledge in the Measurement-DrivenSoftware Management Process Model ............................ 2-4
2.2.6.4 Representation of Technology in the Measurement-DrivenSoftware Management Process Model ............................ 2-4
2.2.6.5 Representation of Uncertainty in the Measurement-Driven
Software Management Process Model ............................ 2-5
2.2.7 Measurement-Driven Software Management Summarized ................ 2-5
2.2.8 Goal Setting and R'acking ........................................... 2-6
2.3 How to Use Measurements in the Measurement-Driven Management Process .. 2-7
2.3.1 Store Proposal Data in the Experience Database ........................ 2-7
2.3.2 Establish Process, Project, and Product Goals .......................... 2-7
2.3.3 Plan the Work ................ .................................... 2-7
2.3.4 Perform the Work .................................................. 2-9
2.3.5 Perform Prcoject Status Assessment ................................... 2-9
2.3.6 Store Status Data in the Experience Database .......................... 2-9
2.3.7 Validate the Goals ................................................. 2-9
2.3.8 Control the Project ................................................. 2-10
2.3.9 Complete the Project ............................................... 2-10
2.3.10 Store Final Data in Experience Database ............................. 2-10
2.4 Summ ary .............................................................. 2-10
3. MEASUREMENT AND THE SOFITWARE ENGINEERINGINSTITUTE PROCESS MATURITY LEVEL STRUCTURE ................ 3-1
3.1 Introduction ........................................................... 3-1
3.2 Process/Capability Maturity Levels ........................................ 3-1
3.2.1 Five Levels of Software Capability Maturity ............................ 3-2
3.2.2 How Activities Evolve From Levels 2 Through 5 ....................... 3-3
3.2.2.1 Measurement-Related Activities ................................. 3-3
iv

Contents
3.3 Benefits of Higher Maturity Levels ........................................ 3-5
3.3.1 Enhanced Ability to Predict Accurately ................................ 3-5
3.3.1.1 Reducing Variability Around Process Mean ....................... 3-5
3.3.1.2 Improving Shape of Process Distribution .......................... 3-6
3.3.2 Improved Results, From Greater Control of the Process ................. 3-7
3.3.3 Visibility Into Software Development Process .......................... 3-8
3.3.3.1 Level 1, Initial ................................................ 3-8
3.3.3.2 Level 2, Repeatable ........................................... 3-8
3.3.3.3 Level 3, Defined .............................................. 3-9
3.3.3.4 Level 4, Managed ............................................. 3-9
3.3.3.5 Level 5, Optimizing ........................................... 3-9
3.3.4 Summary ......................................................... 3-10
3.4 Measurement Activities Required for Levels 2 and 3 ......................... 3-11
3.4.1 Measurement Foundation ........................................... 3-11
3.4.2 Measurement Activities Required at Maturity Level 2 ................... 3-12
3.4.3 Measurement Activities Required at Maturity Level 3 ................... 3-13
3.4.4 Measurement Activities Required at Maturity Level 4 ................... 3-13
3.4.5 Measurement Activities Required at Maturity Level 5 ................... 3-14
3.5 Measurement Foundations for Raising Process Maturity Level ................. 3-14
3.5.1 Capability Maturity Model Key Process Areas .......................... 3-14
3.5.2 Measurement Foundations .......................................... 3-15
3.6 Measurement Support ................................................... 3-16
3.6.1 Experience Databases .............................................. 3-16
3.6.2 Feedback of Metrics Data ........................................... 3-16
3.6.3 Software Management Indicators and Metrics for Maturity Levels 2 and 3 .. 3-17
3.7 How to Organize for Measurement ........................................ 3-22
3.7.1 Benefits to the Organization ......................................... 3-22
V

Contenta
3.7.2 Functions of an Organization-Standard Measurement Program ............ 3-22
3.7.2.1 Support for Proposal Development .............................. 3-23
3.7.2.2 Support for Setting Quantified Goals ............................. 3-23
3.7.2.3 Support for Analyzing Subcontractor Proposals .................... 3-23
3.7.2.4 Support for Ongoing Projects-In-Process Tracking and Monitoring... 3-23
3.7.2.5 Support for Corrective Action ................................... 3-23
3.7.2.6 Software Development Process Improvement ...................... 3-24
3.7.3 Implementing a Project Measurement Program ......................... 3-24
3.7.3.1 Getting Started on a Systematic Measurement Program ............. 3-24
3.7.3.2 Setting Objectives for a Measurement Program .................... 3-24
3.7.3.3 Essentials for Early Action ...................................... 3-25
3.7.4 Beginning to Measure a Project ...................................... 3-26
3.7.5 Measurement Organizational Models ................................. 3-27
3.7.5.1 Measurement Function Under Project Control in aProject Environment ........................................... 3-27
3.7.5.2 The Measurement Function as a Part of Software Development ...... 3-28
3.7.5.3 The Measurement Function Under Project Control in aProject Environment ..................... .................... 3-29
3.8 Summ ary .............................................................. 3-30
4. HOW TO DESCRIBE A SOFTWARE PROCESS ......................... 4-1
4.1 Overview .............................................................. 4-1
4.2 The Activity-Based Process Model ......................................... 4-1
4.3 The Entry-Task-Verification-Exit Paradigm .................................. 4-2
4.3.1 Entry-Task-Verification-Exit Paradigm Description ...................... 4-2
4.3.1.1 What Is the Nature of the Input to the Activity? .................... 4-2
4.3.1.2 What Is the Nature of the Output From the Activity? . . . . . . . . . . . . . . . 4-3
4.3.1.3 What Is the Nature of the Iansformation From Input to Output? . . . . 4-3
4.3.1.4 How Do You Know When the Activity Is Completed? . . . . . . . . . . . . . . . 4-3
vi

Contents
4.3.1.5 How Well Did the Activity Do What It Was Supposed to Do? . . . . . . . . 4-3
4.3.1.6 What Activity Is to Be Performed Next? ... . . . . . . . . . . . . . . . . . . . . . . . 4-4
4.3.2 Further Description of Process Activities .............................. 4-4
4.3.2.1 What Method Should Be Used to Implement the TransformationAlgorithm From Input to Output? ..... . . . . . . . . . . . . . . . . . . . . . . . . . . . 4-5
4.3.2.2 What Verification Methods Should Be Used to Determine theDegree of Success of the Process Modification" .................... 4-5
4.3.3 Example of Quantifying Aspects of a Process Activity .................... 4-5
4.3.4 Entry-Task-Verification-Exit Paradigm Flexibility Issues .................. 4-6
4.4 Process Improvement .................................................... 4-7
4.4.1 Impacts of Process Modification ...................................... 4-7
4.4.1.1 Changes in Unit Cost of Doing the Activity ........................ 4-7
4.4.1.2 The Tmpacts on the Inputs and Outputs ........................... 4-7
4.4.1.3 Changes in the 11ansformation From Input to Output ............... 4-8
4.4.1.4 Impacts on the Determination Method of How and Whenthe Activity Is Completed ....................................... 4-8
4.4.1.5 The Impact on the Quality of the Activity ...................... 4-8
4.4.1.6 What Activity Is Done Next ..................................... 4-9
4.4.2 Metrics for Process Modification ..................................... 4-9
4.5 Summ ary .............................................................. 4-9
5. SETTING QUANTIFIABLE REQUIREMENTS AND GOALS ANDMANAGING TO THEM .............................................. 5-1
5.1 Quantitative Product Requirements and Process Objectives ................... 5-1
5.1.1 Identifying Critical Requirements .................................... 5-1
5.1.2 Quantifying Requirements and Setting Measurable/Testable Targets ....... 5-2
5.1.3 How to Quantify Requirements for Software ........................... 5-4
5.1.3.1 True/False Attributes .......................................... 5-4
5.1.3.2 Multiple Value Attributes ....................................... 5-4
5.1.3.3 Identifying Requirements ....................................... 5-5
vi
Contents
5.1.4 How to Specify Attributes of Requirements ............................ 5-6
5.1.5 Unstated Critical Product Attributes .................................. 5-7
5.2 How to Benefit From Negotiating Requirements ............................. 5-7
5.2.1 Level of Flexibility in a Requirement ................................... 5-7
5.2.2 How to Negotiate Product Requirements .............................. 5-8
5.2.3 How to Benefit From Prior Examples of Quantitative Critical Attributes .... 5-9
5.3 How to Motivate the Customer to Quantify Requirements .................... 5-10
5.4 Summary of Recommendations ........................................... 5-11
6. MATHEMATICAL MODELING AND METRICS SELECTION ............. 6-1
6.1 Overview .............................................................. 6-1
6.2 Measurements and Metrics ............................................... 6-1
6.2.1 Definitions ........................................................ 6-1
6.2.2 Metrics Categories ................................................. 6-2
6.2.3 Basic Measurement Set ............................................. 6-2
6.2.4 Code Counting .................................................... 6-3
6.3 Mathematical Modeling ................................................. 6-4
6.4 Selection of Metrics Using the Goal-Question-Metric Paradigm ................ 6-4
6.5 Organization and Goals .................................................. 6-5
6.5.1 User Groups ...................................................... 6-5
6.5.2 Project Control and Process Improvement Questions .................... 6-9
6.6 Derivation of Unit Costs for New and Reused Code .......................... 6-11
6.6.1 Unit Costs ........................................................ 6-11
6.6.2 Equivalent Source Statements ........................................ 6-13
6.7 Product Size Metrics .................................................... 6-14
6.8 Cost and Effort Metrics .................................................. 6-16
6.8.1 Labor Cost Metrics ................................................. 6-16
6.8.2 Labor Months and Labor Hours ...................................... 6-17
vWi
Contents
6.8.3 Computer Usage Cost Metrics ....................................... 6-18
6.9 Schedule M etrics ....................................................... 6-18
6.10 Some Quality M etrics .................................................. 6-19
6.11 Product Application Environment Metrics ................................. 6-22
6.12 Development Environment Metrics ....................................... 6-23
6.13 Development Constraint Metrics ......................................... 6-23
6.14 Development Personnel Metrics ......................................... 6-24
6.15 Productivities and Unit Costs ............................................ 6-24
6.16 Summary of Recommendations .......................................... 6-25
7. HOW TO ESTIMATE SOFTWARE SYSTEM SIZE ....................... 7-1
7.1 Size Estimation ......................................................... 7-1
7.1.1 The Importance of Size Estimation ................................... 7-1
7.1.2 Size Estimation Activities ........................................... 7-1
7.1.3 Size Estimation and the Development Cycle ............................ 7-2
7.1.4 Size Estimation and Process Maturity Levels ........................... 7-2
7.2 Size Estimation During the Development Cycle ............................. 7-2
7.2.1 Size Estimation by Development Activity .............................. 7-3
7.2.2 Using Source Lines of Design to Estimate Software Size ................. 7-3
7.2.3 Size Estimation Steps ............................................... 7-3
7.3 Function Block Counting ................................................. 7-4
7.4 Statistical Size Estimation ................................................ 7-5
7.5 Function Points ......................................................... 7-7
7.5.1 Definition of Function Points ........................................ 7-7
7.5.2 Example of Function Point Calculation ................................ 7-9
7.5.3 Applications of Function Points ...................................... 7-9
7.5.4 Calculation of Physical Program Size .................................. 7-10
7.6 How to Estimate Software Size by Counting Externals ........................ 7-10
iI
Contents
7.7 Software Product Size Growth ............................................ 7-11
7.8 Combining Estimates .................................................... 7-12
7.9 Summary of Recommendations ........................................... 7-13
8. HOW TO ESTIMATE SOFTWARE COST ............................... 8-1
8.1 O veiiew .............................................................. 8-1
8.2 Cost Estimation Overview ................................................ 8-1
8.2.1 U nits of Cost ...................................................... 8-1
8.2.2 Cost Estimation and Process Maturity Levels ........................... 8-1
8.3 Holistic M odels ......................................................... 8-2
8.3.1 Constructive Cost Model ............................................ 8-2
8.3.1.1 Basic Constructive Cost Model .................................. 8-3
8.3.1.2 Intermediate Constructive Cost Model ........................... 8-3
8.3.1.3 Detailed Constructive Cost Model ............................... 8-5
8-3.1.4 Reuse With Constructive Cost Model ............................. 8-5
8.3.1.5 Ada Process Model ............................................ 8-6
8.3.2 The Software Development Model .................................... 8-7
8.3.2.1 The Model Equation ........................................... 8-8
8.3.2.2 Production Team Efficiency Indicator and the Model ............... 8-8
8.3.2.3 Incremental Chan-!es With the Model ............................ 8-9
8.3.2.4 Calculation of the Thchnology Constant ........................... 8-9
8.3.3 The Cooperative Programming Model ................................. 8-10
8.3.4 How to Apply Holistic Models for Cost Estimation ...................... 8-10
8.4 Activity-Based Models ................................................... 8-11
8.4.1 The Activity-Based Cost Model ...................................... 8-11
8.4.2 A Basic Stagewise Activity-Based Cost Model .......................... 8-13
8.4.3 Estimating Costs Using Activity-Based Models ......................... 8-15
8.4.3.1 Assignment of Costs ........................................... 8-15

Contents
8.4.3.2 Example of Activity-Based Cost Estimation ....................... 8-15
8.4.3.3 Adjustment of Unit Costs ....................................... 8-17
8.4.4 Other Activity-Based Models ........................................ 8-17
8.4.5 General Software Development Process Models and Risk Management .... 8-18
8.5 Adjusting Cost Estimates ................................................. 8-19
8.5.1 Pooling Estimates .................................................. 8-19
8.5.2 Point and Interval Estimates of Cost .................................. 8-19
8.5.3 The Cost Effect of a Higher Order Language ........................... 8-20
8.5.4 The Cost Effect of Software Product Size .............................. 8-20
8.5.5 Cost Effects of CASE Tools .......................................... 8-21
8.6 The Costs of Software Reuse ............................................. 8-21
8.6.1 Systematic Reus.. .................................................. 8-21
8.6.2 The Basic Economics Model of Software Reuse ......................... 8-22
8.6.2.1 Reuse Economics Model With Up-Front Domain Engineering ....... 8-22
8.6.2.2 Library Efficiency ............................................. 8-23
8.7 How to Estimate Documentation Costs .................................... 8-24
8.7.1 Example of Cross-Checking Estimates of Documentation Cost ............ 8-26
8.8 Tbp-Down Estimation of Ibtal System Development Costs .................... 8-27
8.9 How to Estimate Costs of Support to Software Development .................. 8-29
8.10 Risk in Estimates of Cost ............................................... 8-29
8.10.1 Point Estimates of Cost ............................................ 8-30
8.10.2 Interval Estimates of Cost .......................................... 8-30
8.10.3 Cost Risk Management Activities .................................... 8-32
8.11 Software Maintenance Costs ............................................. 8-33
8.12 Costs of a Measurement Program ........................................ 8-34
8.13 Summary of Recommendations .......................................... 8-34
9. HOW TO ESTIMATE SCHEDULE ..................................... 9-1
at
Contents
9.1 Schedule Estimation Overview ............................................ 9-1
9.2 Estimating the Development Schedule ..................................... 9-2
9.3 Schedule Impact of Reused Code .......................................... 9-2
9.4 Schedule/Development Effort Tradeoff ..................................... 9-3
9.5 Schedule/Effort/Size Compatibility ........................................ 9-4
9.6 Software Development Labor Profiles ...................................... 9-5
9.6.1 Basic M odel ....................................................... 9-6
9.6.2 Expanded Model ................................................... 9-7
9.7 Summary of Recommendations ........................................... 9-8
10. SOFIWARE QUALITY MEASUREMENT ............................... 10-1
10.1 Overview ............................................................. 10-1
10.2 The Nature of Software Quality .......................................... 10-2
10.2.1 Some Definitions of Quality ........................................ 10-2
10.2.2 On the Role of Quality in the Software Development Process ............ 10-3
10.2.3 Users ........................................................... 10-3
10.3 Quality and Quality Factors ............................................. 10-4
10.3.1 The Nature of Software Quality Factors .............................. 10-4
10.3.2 Some Software Quality Factors ...................................... 10-4
10.3.3 Interaction Among Software Quality Factors .......................... 10-5
10.3.4 Some Other Software Quality Factors ................................ 10-6
10.3.5 Software Quality Factors and Product and Process Quality ............... 10-6
10.4 Using the Goal-Question-Metric Paradigm in the Selection of Quality Metrics .. 10-7
10.4.1 An Example of Quality Metrics Selection: Correctness .................. 10-7
10.4.2 An Example of Quality Metrics Selection: Usability .................... 10-7
10.4.3 Quality Factors and the Goal-Question-Metric Paradigm ................ 10-9
10.5 Some Definitions for Deviations From Requirements .................... 10-9
10.6 Defector Error Models ................................................. 10-10
Zni

Contents
10.6.1 Purpose of Software Error Models ................................... 10-10
10.6.2 Overview of Software Error Models .................................. 10-11
10.6.2.1 Primary Assumptions ......................................... 10-11
10.6.2.2 Principal Error Model T1ypes ................................... 10-12
10.6.3 Time-Based Error Models and Availability and Reliability ............... 10-12
10.6.3.1 Software Stimulation and Model imce Bases ..................... 10-12
10.6.3.2 Reliability and Availability ..................................... 10-13
10.6.3.3 Decaying Exponential Time-Based Error Models .................. 10-14
10.6.3.4 Rayleigh Time-Based Error Model ........................... 10-15
10.6.4 Rayleigh Phase or Activity-Based Model .............................. 10-16
10.7 The Effect of Reuse on Software Quality .................................. 10-17
10.7.1 Reuse and Quality, Overview ...................................... 10-17
10.7.2 Model of Effect of Reuse on Software Quality ......................... 10-17
10.8 Statistical Process and Quality Control .................................... 10-20
10.8.1 Statistical Process and Quality Control Definitions ..................... 10-21
10.8.2 Quality Control Charts ............................................. 10-21
10.8.3 Applying Quality Control Charts to Software .......................... 10-21
10.8.4 Using a Software Defect Statistical Quality Control Chart ............... 10-23
10.8.5 Establishing Control Bands for Software Quality Control Charts ......... 10-23
10.8.6 Applying "hguchi Quality Control Concepts to Software ................. 10-24
10.9 Quality and Process Maturity ............................................ 10-25
10.9.1 Level 1, Initial Process......................................... 10-25
10.9.2 Level 2, Repeatable ............................................. 10-26
10.9.3 Level 3, Defined ........ ....................................... 10-26
10.9.4 Level 4, Managed ................................................. 10-26
10.9.5 Level 5, Op mized ................................................. 10-27
10.10 Summary and Recommendations ........................................ 10-27
xlii

Contents
11. MANAGEMENT INDICATORS FOR TRACKING AND MONITORING .... 11-1
11.1 Management by Measurement ........................................... 11-1
11.1.1 Software Development Project Tracking and Monitoring ................ 11-1
11.1.1.1 Status Tr acking ............................................... 11-1
11.1.1.2 Measurement and Status Tracking .............................. 11-2
11.1.1.3 "Iacking Activities ............................................ 11-2
11.1.2 Project Monitoring and Process Maturity Levels ....................... 11-3
11.2 Management Indicators ................................................. 11-4
11.3 How to Select Management Indicators .................................... 11-7
11.3.1 Goal-Question-Metric Paradigm ..................................... 11-7
11.3.2 Incremental Improvement .......................................... 11-7
11.3.2.1 Feedback ................................................... 11-8
11.3.2.2 Corrective Action ............................................ 11-8
11.4 How to Compute Management Indicators ................................. 11-8
11.4.1 Software Product Size Indicators .................................... 11-9
11.42 Software Cost Indicators ........................................... 11-9
11.4.3 Development Schedule Indicators ................................... 11-9
11.4.4 Project Tehnical Stability Indicators ................................. 11-9
11.4.5 Project Status Indicators ........................................... 11-10
114.6 Quality Indicators ....................................... 11-10
11.4.7 Computer Resources Indicators ..................................... 11-10
11.5 Overall Proportion Complete and Earned Value ............................ 11-11
11.6 The Estimate at Completion ............................................. 11-14
11.7 Software Product Size Growth ........................................... 11-14
11.7.1 Code Growth With No Function Growth .............................. 11-15
11.7.2 Code Growth With Function Growth ................................. 11-16
11.8 The Project Status Assessment ........................................... 11-18
xiN

Coatents
11.8.1 Activities for Project Status Assessment .............................. 11-18
11.8.2 The Project Status Assessment Report ................................ 11-19
11.8.3 Cost and Schedule Performance Reporting for Tracking ................. 11-21
11.9 Graphical Methods of Monitoring and Control ............................. 11-22
11.9.1 Graphical Methods of Earned Value Monitoring ....................... 11-22
11.9.2 Graphical Methods of Project Monitoring ............................. 11-22
11.10 Summary of Recommendations ......................................... 11-25
12. EXPERIENCE DATABASES AND DATA COLLECTION ................. 12-1
12.1 Overview ............................................................. 12-1
12.2 The Software Experience Database ....................................... 12-1
12.3 Data Set Definition .................................................... 12-2
12.3.1 Datasets and Process Maturity Level ................................. 12-2
12.3.2 Database Management Systems ..................................... 12-3
12.4 Measurements and Metrics Data Collection ............................... 12-3
12.4.1 Definition ........................................................ 12-3
12.4.2 Organization and Activities ......................................... 12-3
12.5 Data Sources .......................................................... 12-4
12.6 Work Breakdown Structures ............................................. 12-5
12.7 Metrics for Managing Software Subcontractors ............................. 12-7
12.8 Data Validation ........................................................ 12-8
12.9 Summary of Recommendations .......................................... 12-8
LIST OF ABBREVIATIONS AND ACRONYMS ............................. Abb-1
REERENCES ......................................... ........ ........ Rd-1
BIBLIOGRAPHY ....................................................... Bib-1
INDEX ................................................................ Ind -I
i iv

FIGURES
Figure 2-1. Software Development at Early Software Engineering InstituteM aturity Levels .................................................. 2-2
Figure 2-2. Software Development at Intermediate Software Engineering InstituteM aturity Levels .................................................. 2-3
Figure 2-3. Measurement-Driven Software Management Process at AdvancedSoftware Engineering Institute Maturity Levels ....................... 2-4
Figure 2-4. Measurement-Driven Software Management Process .................. 2-8
Figure 3-1. Enhanced Ability to Predict Accurately, for Processes UnderStatistical Control ................................................ 3-5
Figure 3-2. Increasing Predictability and Lower Variability With IncreasingCapability Maturity Model Levels ................................... 3-6
Figure 3-3. Increasing Predictability and Lower Variability With IncreasingCapability Maturity Model Levels ................................... 3-7
Figure 3-4. Level 1, Initial Process ............................................ 3-8
Figure 3-5. Level 2, Repeatable Process ........................................ .3-8
Figure 3-6. Level 3, Defined Process ............ ........................ 3-9
Figure 3-7. Level 4, Managed Process .......................................... 3-10
Figure 3-8. Level 5, Optimizing Process ........................................ 3-10
Figure 3-9. Measurement Foundation for Maturity Levels 2-5 .................... 3-12
Figure 3-10. Measurement Function Under Project Control in a Project Environment .. 3-28
Figure 3-11. The Measurement Function as a Part of Software Development ......... 3-28
Figure 3-12. The Independent Measurement Function ............................ 3-29
Figure 3-13. Measurement in a Project Environment ............................... 3-30
Figure 3-14. Fishbone Chart for Attaining Process Maturity Level 2 ................. 3-31
ivi

Figures
Figure 3-15. Fishbone Chart for Attaining Process Maturity Level 3 ................. 3-32
Figure 3-16. Fishbone Chart for Attaining Process Maturity Level 4 ................. 3-33
Figure 3-17. Fishbone Chart for Attaining Process Maturity Level 5 ................. 3-34
Figure 4-1. Entry-Task-Verification-Exit Activity Paradigm ........................ 4-2
Figure 4-2. Example Process Network Instance .................................. 4-4
Figure 4-3. Resource Profiles for Each Principal Development Activity ............. 4-5
Figure 5-1. Typical Pareto Distribution, Illustrating "Critical Requirements" ......... 5-2
Figure 5-2. Requirements Hierarchy ........................................... 5-5
Figure 5-3. Example of Utility of a Product Capability to a User ................... 5-8
Figure 8-1. Cumulative Distribution of Costs ................................... 8-33
Figure 9-1. Schedule Reduction Versus Productivity Enhancement ................. 9-4
Figure 9-2. Schedule Compatibility Testing Process .............................. 9-5
Figure 9-3. Development Effort Planning Curve ................................. 9-7
Figure 10-1. Decaying Exponential Error Mode) .................................. 10-14
Figure 10-2. Rayleigh Distribution Error Model ................................... 10-15
Figure 10-3. Activity-Based Rayleigh Model ..................................... 10-16
Figure 10-4. Average Relative Defect Content Versus Number of Uses (p=0.20) ...... 10-20
Figure 10-5. Control Chart for Paint Can Top Diameter ........................... 10-22
Figure 10-6. Software Defect/Error Statistical Quality Control Chart ................ 10-22
Figure 11-1. Cumulative Patterns of Activity Completion .......................... 11-12
Figure 11-2. The Monitoring and Control Process ................................ 11-18
Figure 11-3. Earned Value and Budgeted Value .................................. 11-22
Figure 11-4. Changes in Earned and Budgeted Value .............................. 11-23
Figure 11-5. Example of Monitoring Defects Per Thousand Source Lines ofCode by Review or Inspection ...................................... 11-23
Figure 11-6. Example of Status Macking ........................................ 11-23
Figure 11-7. Problem fouble Reports Opened Minus Problem Trouble ReportsClosed Over Time ................................................ 11-24
iviH

Figures
Figure 11-8. Cost Growth-Disappearance of Reused Code ........................ 11-24
Figure 11-9. Example of Computer Resource Monitoring and Control ............... 11-25
Figure 11-10. Percent Engineering Hours by Development Activity ................... 11-25
Figure 12-1. Work Breakdown Structure for Software as a Subsystem ................ 12-6
Figure 12-2. Work Breakdown Structure for Software as a Subcomponent ............ 12-7
XiV

TABLES
Table 1-1. Interest-Specific Views of This Guidebook ............................ 1-5
Table 1-2. Quick Reference Estimate Guide ................................... 1-6
Table 1-3. Measurement-Related Activities by Process Maturity Level ............. 1-7
Table 3-1. Levels of Software Capability Maturity ............................... 3-2
Table 3-2. Evolution of Measurement-Related Activities by Maturity Level ......... 3-4
Table 3-3. Key Process Areas of the Software Engineering Institute CapabilityMaturity Model ........................................ 3-14
Table 3-4. Process Maturity Level and Associated Metrics ....................... 3-17
Table 4-1. Metrics For Process Changes and Improvement Evaluation ............. 4-9
ibble 5-1. Example of Quantifying System Performance Objectives ................ 5-3
Table 5-2. Example of Quantifying Functional Objectives ........................ 5-4
Table 5-3. Examples of Critical Requirements .................................. 5-6
Thble 5-4. Example of Performance Objective, Minimum Acceptable, andCurrent Levels of Requirements .................................... 5-7
Tible 5-5. Examples of Critical Quality Attributes for Software Products ........... 5-10
Table 6-1. Recommended Basic Measurement Set .............................. 6-2
Tible 6-2. Goal-Question-Metric Paradigm Applied to the Basic Measurement Set . 6-3
Table 6-3. Tbp.Level Process Improvement Goals and Involved Groups/Users ...... 6-6
Table 6-4. Tbp-Level Project Control Goals and Involved Groups ................. 6-6
Table 6-5. General Management Goals, Measurement Activities, and Questionsfor Project Control ................................................ 6-7
Tible 6-6. Decomposition of Project Control Goals ......................... 6-8
Ibble 6-7. Information System Support to Project Control Goals .................. 6-9

Mhbles
Table 6-8. Questions Asked in Support of Project Control and ProcessImprovement Goals ............................................... 6-9
Table 6-9. Software Product Size Metrics ...................................... 6-15
Table 6-10. Software Cost Metrics ............................................. 6-17
Table 6-11. Software Schedule Metrics ......................................... 6-18
Table 6-12. Software Quality Metrics .......................................... 6-19
Table 6-13. Software Product Application Environment Metrics .................... 6-22
Table 6-14. Software Development Environment Metrics ......................... 6-23
Table 6-15. Software Development Constraint Metrics ........................... 6-24
Table 6-16. Software Development Personnel Characterization Metrics ............. 6-24
Table 7-1. Size Estimation Table Example ..................................... 7-7
Table 7-2. Function Count Weights for Complexity .............................. 7-8
Table 7-3. Code Growth Factors ............................................. 7-12
Table 7-4. Sample Software Product Size Estimates ............................. 7-13
Table 8-1. Basic Constructive Cost Model Effort and Schedule Equations .......... 8-2
Thble 8-2. Embedded Mode Activity and Schedule Distribution ................... 8-3
Table 8-3. Intermediate Model Effort Multipliers ............................... 8-4
Thble 8-4. Adaptive Quantities by Activities for Equivalent DeliveredSource Instructions ............................................... 8-5
Thble 8-5. Weights for the Ada-Constructive Cost Model ......................... 8-7
Table 8-6. Sample Effort and Productivities for the Ada-Constructive Cost Model ... 8-7
Table 8-7. Sample Technology Constant Values ................................. 8-10
Table 8-8. A Basic Activity-Based Development Model .......................... 8-14
Table 8-9. Worksheet Cost Calculations for an Activity-Based Model .............. 8-16
Table 8-10. Ada Development Model .......................................... 8-18
Table 8-11. Estimating Pages From Software System Size ......................... 8-24
Table 8-12. Estimating Documentation Effort From Document Size ................ 8-25
Tible 8-13. Example of lbp-Down Estimating Model ............................. 8-27

lhbles
Table 8-14. Top-Down Cost Estimating Example ................................. 8-28
'Thble 8-15. Percent Additional Cost for Support to Software Development .......... 8-29
Table 8-16. Example of Size Probability Distribution ............................. 8-30
Table 8-17. Example of Unit Cost Probability Distribution ........................ 8-31
Tible 8-18. Example of Derivation of Distribution of Costs ........................ 8-31
Table 8-19. Example of Distribution of Costs .................................... 8-32
Thble 9-1. Relative Staffing Levels and Schedules ............................... 9-6
Thble 10-1. User Group Quality Objectives ..................................... 10-4
Thble 10-2. Software Quality Factors ........................................... 10-5
Table 10-3. Additional Software Quality Factors ................................. 10-6
Table 10-4. Example Questions and Metrics for Usability ......................... 10-8
Thble 10-5. Example Values of Error Discovery Percentages.. ..................... 10-18
ibble 10-6. Sample Values of L for p=0.20 ..................................... 10-20
Table 11-1. Software Management Indicators and Metrics ........................ 11-4
"Jbble 11-2. Example of Goal-Question-Metric for "Iacking ....................... 11-7
Tible 11-3. Product Completion Indicator Calculation ............................ 11-13
Table 11-4. Example of Code Growth With No Function Growth ................... 11-16
Table 11-5. Example of Code Growth With Function Growth ...................... 11-17
Thble 11-6. Comparison of Cost and Schedule Reporting Tbrms .................... 11-21
Table 11-7. Equivalent Estimation Formulas .................................... 11-21
"Table 12-1. Data Sources .................................. ........ 12-5
lii

lbbkes
This page intentionll left blanI
zil
ACKNOWLEDGMENTS
The authors of this guidebook are Robert Cruickshank, Henry Felber, John Gaffney, and RichardWerling. The Consortium wishes to thank Jerry Decker, James Marple, and Samuel Redwine for their help-ful aitids•s and suggestions in reviewing this material. George Bon~ki, Paul Garnett, and Andy Rabinowitzof the Consortium member companies also provided insgigtful comments.
Thanks also go to the many member company personnel who attended the Software Measurement Courseand whose comments oontnbuted so much to this version of the guide k.
The authors also wish to reongnize Environment and Support Services for their many production services inmaking this guidebook happen.
ZiW

Ackiowicdguants
Thif page intentiona1~y left blank
zziv

1. INTRODUCTION
1.1 SCOPE
The Software Measurement Guidebook, Version 2.0, provides practical guidance for the quantitativemanagement of a software development project. It describes how to use measurement methods in set-ting quantifiable goals for a software project, in selecting metrics to support those goals, and in manag-ing to meet those goals. It presents methods for estimating software size, cost, and development
schedule. It provides tracking and monitoring methods to evaluate status and earned value for ongo-ing development projects and to help ensure that the software projects proceed as planned and thatany deviations from the plan are detected and quickly corrected. It also presents methods to estimatethe costs of support to software development.
This guidebook describes the Software Engineering Institute (SEI) process maturity model and therole of software metrics in raising the capability maturity level of a software development organiza-tion. It relates metrics to various levels of the capability maturity model (CMM). It also presents theactivities included in a software measurement function at various levels of process maturity. It de-scribes various ways in which a measurement functional capability can be structured to support theoperation of a software organization. The guidebook also provides guidance in collection and valida-tion of metrics data and in feeding back experience data to support the improvement of both processand future products. Also presented is a description of the impact of code reuse on software cost,schedule, and quality. The guidebook also presents measures of software quality and describes modelsfor estimating and predicting software defects. It describes an approach to software statistical qualitycontrol, a part of statistical process control, and relates it to measures needed at higher levels ofsoftware process maturity.
A major focus of this guidebook is to provide practical information on using software metrics toorganizations that develop and/or maintain software for the Government. However, most of the mate-rial presented should also be useful by organizations developing software for other customers. Thisincludes commercial software developers. This is important because to minimize the expense of devel-oping new systems, the government strongly supports the use of commercial off-the-shelf (COTS)software in software systems developed for its use.
Substantial effort may be required to understand and apply some of the material presented in thisguidebook. There are no unusual mathematical requirements since the quantitative techniquespresented are at a first-year college mathematics level.
1.1.1 GurmnKo Owzccvms
This guidebook is designed to:
* Present methods for the quantitative management of software development projects,including establishing goals for software process and product estimation, and tracking.
* Provide practical methods for the establishment, organization, and operation (includingcosts) of a software measurement program.
1-1

1. Introduaion
"• Present methods for selecting metrics to support project goals. It defines practical metrics anddescribes how you can obtain and apply them during the software development cycle.
"* Provide measurement models for estimating software development cost and schedule andsoftware product size.
"* Provide metrics and models to estimate the cost impact of software reuse on product cost,schedule, and quality.
"* Provide techniques for estimating software development cost and schedule, software productsize, and software quality.
"* Show how to track and monitor software projects using metrics.
"* Include lessons learned from experience.
1.1.2 NEw ToPIcs IN VERisON 2.0
The guidebook, Version 2.0, has added the following subjects to those in Version 1.0:
SDescription of the nature of a software measurement program and alternatives for implementing asoftware measurement program.
* Descriptions of various system and software life cycles, their interrelationships, and theirmeasurement aspects based on the view of a process as consisting of a network of activities.
" Description of the Goal-Question-Metric (GQM) paradigm for systematically selectingsoftware metrics.
"* Description of the nature of software quality and how to measure it.
"* Description of how to estimate the number of defects in software and how to establish quality goals.
"* Methods of metrics data collection and validation for new and reused software.
" Methods for estimating earned value during the course of software development for projectsthat incorporate both new and reused software.
" Procedures and guidelines for attaining higher levels of process maturity (as defined by the SEI).
1.2 AUDIENCE AND BENEFITS
The guidebook addresses the measurement needs of software managers and engineers, measurementanalysts, finance personnel, program managers, and others involved in implementing and/or improv-ing the software process. The others include systems and software line managers, project managers,business area managers, proposal managers, and senior financial analysts. This guidebook is usefulto a broad spectrum of software development personnel, particularly those concerned with improvingthe predictability, control, and performance of the software process employed and the software itproduces. The guidebook explains what points in the software process are to be measured, the metrics
1-2
1. Introducion
that should be tracked for process and product control, and the relationship of the measures tomanagement decisions that you need to make based on them. It will aid you in estimating the impactof software reuse and in gauging the viability of reuse in varied development environments.
The guidebook is designed to help those associated with software development to improve theircontrol and improve the capability maturity level of their organization's software process by applyingmeasurement-driven software management (MDSM) techniques. The guidebook was created to sup-port the Consortium's long-term goals of helping software organizations attain the benefits of higherquality software at a lower net cost and of helping them to improve their software process and the soft-ware products generated. An aspect of both of these goals is to provide metrics models to estimatethe cost, schedule, and quality impacts and benefits of software reuse. The guidebook presents meth-ods for tracking and monitoring the software process and the software products it generates. Thesemethods are consistent with the principles of the SEI CMM of software management technology. Animportant benefit of the measurement methodology presented here is that it is designed to aid a soft-ware organization in attaining higher SEI capability maturity levels and in producing higher qualityand more usable software products.
The functional responsibilities for this guidebook's audience are:
" Semior Manager. Area manager, division or corporate vice president, or equivalent responsiblefor improving the software development process and capable of authorizing a measurementprogram across all software projects. His responsibility includes authorizing both direct costsand the indirect (overhead) expense of the measurement program.
"* HardwarelSoftware Sysn Manager. The person responsible for managing a project containing
both hardware and software.
"* Softwae Projec Manager. The person responsible for managing a software-based project.
" Lead Software Engineer. A technical supervisor responsible for developing or supporting asoftware-based system. He supervises the use of prescribed processes, methods, and standardsto perform technical activities.
"* Software Engineer. A person who works on developing or supporting a software-based system.
"* Cost Enginefei MeasswuentAnalyst, orSyst•mAnalyst. A technical staff member responsible forcollecting project cost and schedule status data and for analyzing this data.
"* Software Quaity Engineer. A technical staff member responsible for collecting data fromreviews and inspections of requirements, design, code, and test and for analyzing this data.
"* Proposal Manager. The person responsible for describing and supporting the estimated size,cost, schedule, and quality of a software product.
"*Fusancia Manaq. A person responsible for developing prices for software systems, consisten intracking and monitoring procedures for software projects, the cost of software products, andcomparing them to planned and budgeted figures.
"* Fbnancial Anabw. A person who works on financial matters such as tracking and monitoringthe cost of software products.
1-3
I. Introduction
1.3 GUIDEBOOK ORGANIZATION
The guidebook is composed of 12 sections. They are:
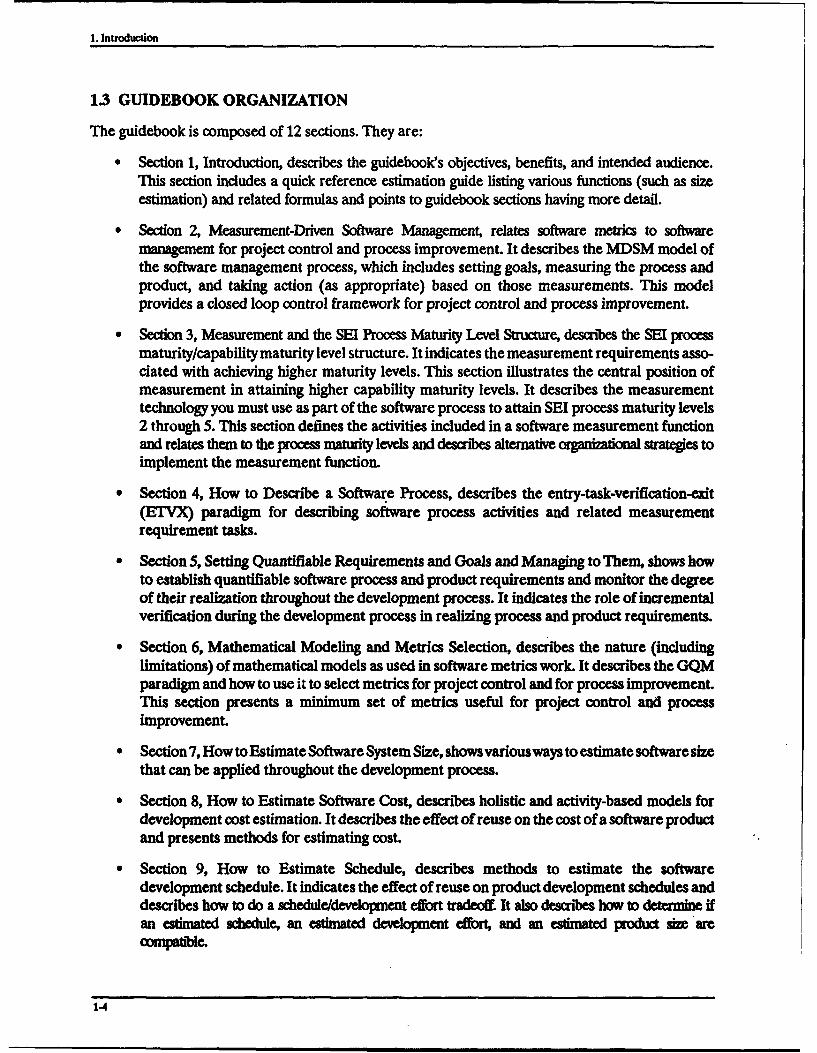
" Section 1, Introduction, describes the guidebooks objectives, benefits, and intended audience.This section includes a quick reference estimation guide listing various functions (such as sizeestimation) and related formulas and points to guidebook sections having more detail.
" Section 2, Measurement-Driven Software Management, relates software metrics to softwaremanagement for project control and process improvement. It describes the MDSM model ofthe software management process, which includes setting goals, measuring the process andproduct, and taking action (as appropriate) based on those measurements. This modelprovides a closed loop control framework for project control and process improvement.
" Section 3, Measurement and the SEI Process Maturity Level Structure, desacibes the MEI processmaturity/capability maturity level structure. It indicates the measurement requirements asso-dated with achieving higher maturity levels. This section illustrates the central position ofmeasurement in attaining higher capability maturity levels. It describes the measurementtechnology you must use as part of the software process to attain SEI process maturity levels2 through 5. This section defines the activities included in a software measurement functionand relates them to the process maturity levels and describes alternative o strategies toimplement the measurement function.
" Section 4, How to Describe a Software Process, describes the entry-task-verification-exit(ErVX) paradigm for describing software process activities and related measurementrequirement tasks.
" Section 5, Setting Quantifiable Requirements and Goals and Managing to Them, shows howto establish quantifiable software process and product requirements and monitor the degreeof their realization throughout the development process. It indicates the role of incrementalverification during the development process in realizing process and product requirements.
" Section 6, Mathematical Modeling and Metrics Selection, describes the nature (includinglimitations) of mathematical models as used in software metrics work. It describes the GQMparadigm and how to use it to select metrics for project control and for process improvement.This section presents a minimum set of metrics useful for project control and processimprovement.
"* Section 7, How to Estimate Software System Size, shows variousways to estimate software sizethat can be applied throughout the development process.
" Section 8, How to Estimate Software Cost, describes holistic and activity-based models fordevelopment cost estimation. It describes the effect of reuse on the cost of a software productand presents methods for estimating cost.
" Section 9, How to Estimate Schedule, describes methods to estimate the softwaredevelopment schedule. It indicates the effect of reuse on product development schedules anddescribes how to do a schedule/development effort tradeoff It also describes how to determine ifan estimated schedule, an estimated development effort, and an estimated product size arecompatiNe.
1-4

1. Introduction
"Section 10, Software Quality Measurement, provides indicators of software quality includingdefect-based measures and others, such as "availability." This section relates quality consider-ations to the establishment of quantifiable requirements. It also shows the effect of softwarereuse on the (defect-related) quality of a software product and relates software defect esti-mates to software availability. This section describes an approach to statistical quality controlinvolving the establishment and monitoring of software quality objectives during development-
" Section 11, Management Indicators for Tracking and Monitoring, shows how to selectmanagement indicators (metrics) and how to use management indicators to track and monitorsoftware development projects. It describes how to compute a measure of earned value (over-all status) of a software development project and describes its relation to the estimated costof completing a project.
"* Section 12, Experience Databases and Data Collection, shows how to collect, organize,validate, and archive software metrics data. It describes alternative work breakdown struc-tures (WBSs) for collecting and analyzing cost metrics data. This section describes how to col-lect data for the purposes of product and process improvement and how to collect data to trackand monitor software development to anticipate possible problems. Practical methods ofvalidating data are given.
1.4 HOW TO USE THIS GUIDEBOOK
Your use of this guidebookwilU depend, to a large extent, on your specific interests in software metricsand their applications. It is not necessary to read this guidebook linearly, i.e., in the ascending orderof sections. You can select sections and read them for your specific interest at a specific time and thenread the other sections at a future time. Table 1-1 guides your reading relative to your interests.
lhble 1-1. Interest-Specific Views of This Guidebook
Interest-Specinc View SectionMeasurement overview 1,2,3.9,12Organizing for measurement 3.9,12Deriving measurable requirements and determine their degree of 5,10attainmentMetrics selection for project control and process improvement 2,3,4,6Metrics and database establishment 6,12Quality metrics 10Process maturity and metrics 3Estimation of size, cost, and schedule 7,8,9Monitoring a project 11Reuse impacts 8.4,8.6,9.3,10.7Statistical process control 2,10.8Risk management 8.4,8.10
This guidebook is not meant to be a comprehensive treatise on software measurement. You may findreferences to other texts useful when gaining an understanding of this material; relevant referencesare identified. You should be prepared to invest time in the study of the methods given in this bookand in learning how to apply them.
1-5

1. Introduction
1.5 QUICK REFERENCE ESTIMATION GUIDE
Table 1-2 is a quick reference estimation guide. It summarizes how to estimate certain key items suchas development effort It is designed to help guide you to sections that show you how to estimate commonlyused parameters such as the software size and development effort
Table 1-2. Quick Reference Estimate Guide
Estimate Of Point in Process Input Required Fbrmula Output Section
Software system Project initial C1= Number of CSCIs S=41.6C1 KSLOC 73size stagesCSCI size Project initial Cz= Number of CSCs S = 4.16C2 KSLOC 7.3
stagesSoftware size Project initial A = Sumn of 3 externals S = 13.94 + 0.034A KSLOC 7.6
stages E = Sum of 4 externals + S = 12.28 + 0.030E KSLOCinterfaces
Development Any (when size 1,000 delivered source LM=a(KDSI)b for organic, LM 8.3.1effort, is known or instructions (KDSI) semidetached, or embeddedCOCOMO estimated) modes
Schedule, Any LMfilabormonths TDEVfc(LM) for organic, months 8.3.1CO MO TDEVfdevelopment time semidetached, or embedded
in months modesSize, effort, or Any (when size C, technology constant S=CIMVq SLOe 8.3.2development is known or S, size in SLOC and/ortime, given any estimated) K. effort, labor years labor yearstwo (Devel. cycle ti, development time in and/ormodel) years years
Development Any (when size S= 1,000 lines of source E-a+bS+cLd for COPMO LM 8.3.3effort, COPMO isknown or code (KSLOC) model
estimated) L=zAve. level in LM/monthUnit cost Any (when size L/K, unit cost in TOW Cost= 2JK)1 KLoC LM U4development is known or LM/KSLOC for eacheffort estimated) activity, KSLOC(activity-bsed)Reme cot Any Unit costs and sizes of new Cs= LM 8.6impacts and reused code and domain CDESr/N+CvNSN+CVRSR
(eng.) lbraryDocmnentpages Any KSLOC estimate Pfa(KSLOC)-b(KSLOC)Z pages 8.7Documentation Any KP=thousand pages LM=J& uILH=ff? LM (or 8.7effort 100 1000 Lii)Top-down Preproposal or Software development total Percent breakdown Lm 8.8estimation of proposal stages unit costs in LM/KSLOCtotal project coits and size in KSLOC
Costs of support Software Estimated software Cost for support in each LM 8.9to software development development costs raa*(sfwedevelopment planning development cost)
Risk estimate of Any Knowledge of distribution Point and interval estimates Probability 8.10cost of size and cost estimates of risk andLMSoftware Any Size in KSLOC Cotf(defet/KSLOC)• L1 811maintenance KSLOC O. (LMideft)Schedule Impact Any New & reused code unit td _=P(P-pAq Relative 9.3of Reuse costs, proportion of reuse P=CvR/(CvN(1-R)+CvR( schedule
1R)) reductionScheduleffort Any K0, estimated effort Vtp laboryears 9.4tradeoff to, estimated schedule ,.K !l
K1, new estimated effortt1, new estimated schedule _
1-6

1. Introducilon
1.6 SUMMARY OF RECOMMENDATIONS
You should adapt and implement, as appropriate, methods presented for predicting and monitoringyour software process and the software products it generates. As shown in Table 1-3, the methods areconsistent with the principles of the SEI process maturity concept. Implementing the methodologywill aid you in achieving higher SEI process maturity levels allowing you to produce higher quality,more usable software products and simultaneously improving your software development process.
The primary benefit of having a sound measurement program is to increase the degree of predictability andcontrol of software process and products. "Management by measurement" benefits both projectcontrol and process improvement by:.
"* Providing more and better information.
"* Enabling management to make better decisions.
Table 1-3. Measurement-Related Activities by Process Maturity Level
Level 2, Repeatable Process Level 3, Defined Levels 4 and 5
Estimate, plan, and measure: Level 2 data, plus: Levels 2 and 3 data, plus:software size, resource usage,staffing levels, schedules, cost of Maintain formal records for Set quantitative quality goals anddevelopment, and risk. progres of unit development, manage according to quality plan.
Maintain profiles over time of In addition to level 2 profiles, In addition to level 3 profiles,actual versus plan for. software maintain profiles over time of maintain control limit charts onsize; units designed, build/elease ranges, variances, and comparisons size growth; costs; completions; andcontent, units completing test, units with historical data. characteristics of peer reiews.integrated, and test progress;computer resource utilization; Develop software measurement Collect process and product data,mqluireirnts status; and staffing, standards, and experience-based and analyze according to
metrics for estimating size, cost, documented procedures, in
Maintain profiles over time of use and schedule. systematic efforts to preventof target system memory, defects, assess beneficial processthrougput, and I/0 channes. Measurements of errors found and innovations, and manage process
costs incurred by process actvty. change.Collect statistics on trouble reports, Pareto analysis of defects, andand on design errors, and software preliminary control charts. Maintain managed and controlledcode and test errors found in process database for processreviews and inpections. Coordinate software process asset metrics aross all projects
metrics database at organizationleveL Maintain profiles over time for
ratios of rework time and cost ofproject totals; actual versus plannedcosts and benefits of processimprovement and defectprevention activities.
1-7

1. Introduction
1.7 TYPOGRAPHIC CONVENTIONS
This guidebook uses the following typographic conventions:
Serif font ....................... General presentation of information.
Italicized serif font ............... Mathematical expressions and publication titles.
Boldfaced serif font ................ Section headings and emphasis.
1-8

2. MEASUREMENT-DRIVEN SOFTWAREMANAGEMENT
2.1 OVERVIEW
Ths section shows how you can integrate measurement with the software management process. Theunderlying concept is that effective management requires effective measurement This section presents amodel of the MDSM process as a dosed loop feedback control system. It shows how project measurementdata is generated and used in the software process. The MDSM process is also presented as a time orderedsequence of the process activities and their descaiptions.
2.2 MEASUREMENT-DRIVEN SOFTWARE MANAGEMENT
This section is concerned with the management of the software development process, not the structureof any particular process. Measurement that is required for effective management and improvementof the process is described.
2.2.1 WmAT Is M uFs-.DRriV Sovjwmm MANAGEmEmT?
The MDSM process is a framework for software management that integrates the concepts of softwaremeasurement, management, process improvement, and statistical process and quality control. Themain theme of MDSM is to drive the development process output toward quantified goals and toincrementally assess the degree to which these goals are likely to be attained.
Managing the size, cost, schedule, and quality of product development requires comprehensivemeasurement to provide the visibility needed for making both project and process management deci-sions. The following sections describe how measurement data originates and how it is collected andpresented. To understand the MDSM process, you need to understand the terms project control andprocess and product improvement.
2.2.2 PioJE-r COMTROL
Project control is the planned periodic assessment of the degree of realization of the softwaredevelopment project's pre-established goals. It includes taking the appropriate corrective action tomitigate the effects of anticipated or current problems indicated by the assessment. MDSM can helpyour organization achieve project control and process improvement. Guidelines for the identificationof quantified goals and their resulting metrics are found in Sections 5 and 6 of this guidebook.
2.2.3 PRocass AND PRoDucr IMPRovnMENT
Software process improvement is achieved through changes to the software creation and supportprocess which result in improved products that exhibit higher quality and the same or lower cost than
2-1
2. Measurement-Driven Software Management
those created using the earlier process. Higher quality is associated with lower defect levels and higherfunctional content relative to cost. "Cost" relates to the consumption of all relevant resources, includ-ing labor, money, and time. The ultimate goal of MDSM is enhanced project control and measurablesoftware process and product improvement. Process improvement, attained in part through the appli-cation of the MDSM process, leads toward raising an organization's SEI CMM level. More informa-tion about the SEI CMM is found in Section 3.
2.2.4 SovrwARE MANAGEmENT A LowElR MATURmY LEVELS
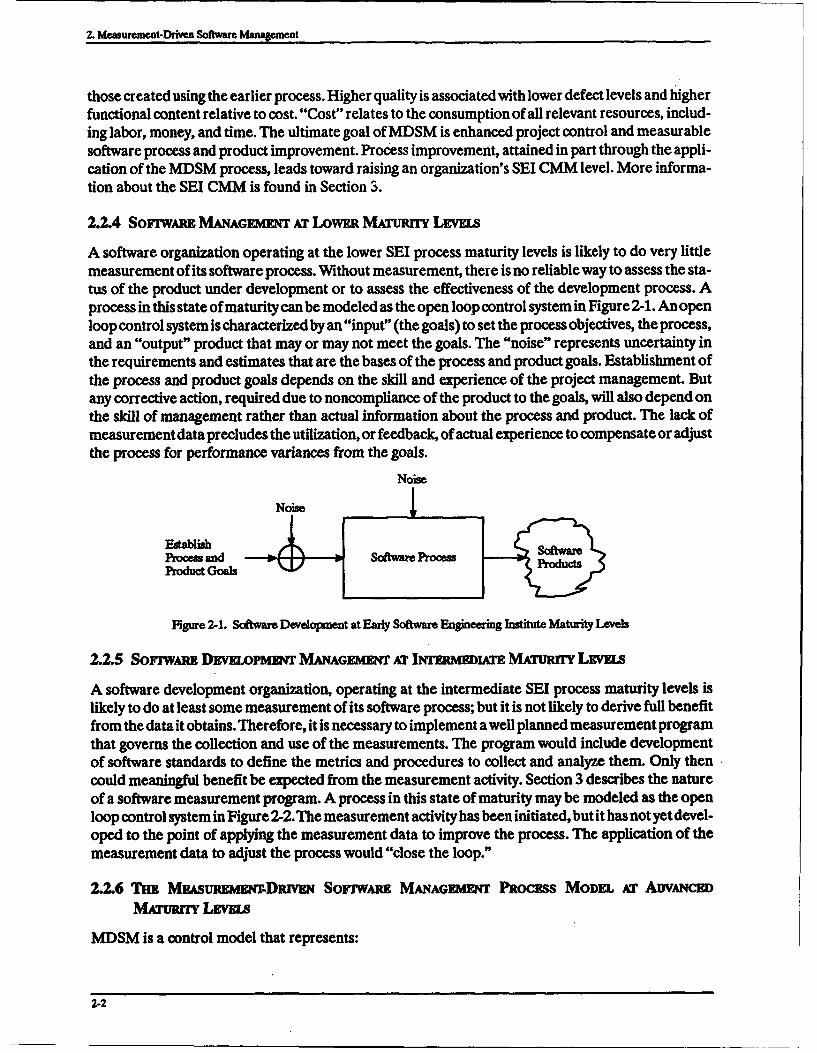
A software organization operating at the lower SEI process maturity levels is likely to do very littlemeasurement of its software process. Without measurement, there is no reliable way to assess the sta-tus of the product under development or to assess the effectiveness of the development process. Aprocess in this state of maturity can be modeled as the open loop control system in Figure 2-1. An openloop control system is characterized by an "input" (the goals) to set the process objectives, the process,and an "output" product that may or may not meet the goals. The "noise" represents uncertainty inthe requirements and estimates that are the bases of the process and product goals. Establishment ofthe process and product goals depends on the skill and experience of the project management. Butany corrective action, required due to noncompliance of the product to the goals, will also depend onthe skill of management rather than actual information about the process and product. The lack ofmeasurement data precludes the utilization, or feedback, of actual experience to compensate or adjustthe process for performance variances from the goals.
Noise
Noise
Establish s f wP ro c e ss a nd o t P o e sr d u sProduct Goals
Figure 2-1. Software Development at Early Software Engineering Institute Maturity Levels
2.2.5 SOFrWAmm DEvELoPMNm MANAGEMENT AT Im'mm)aT MATur LEVELS
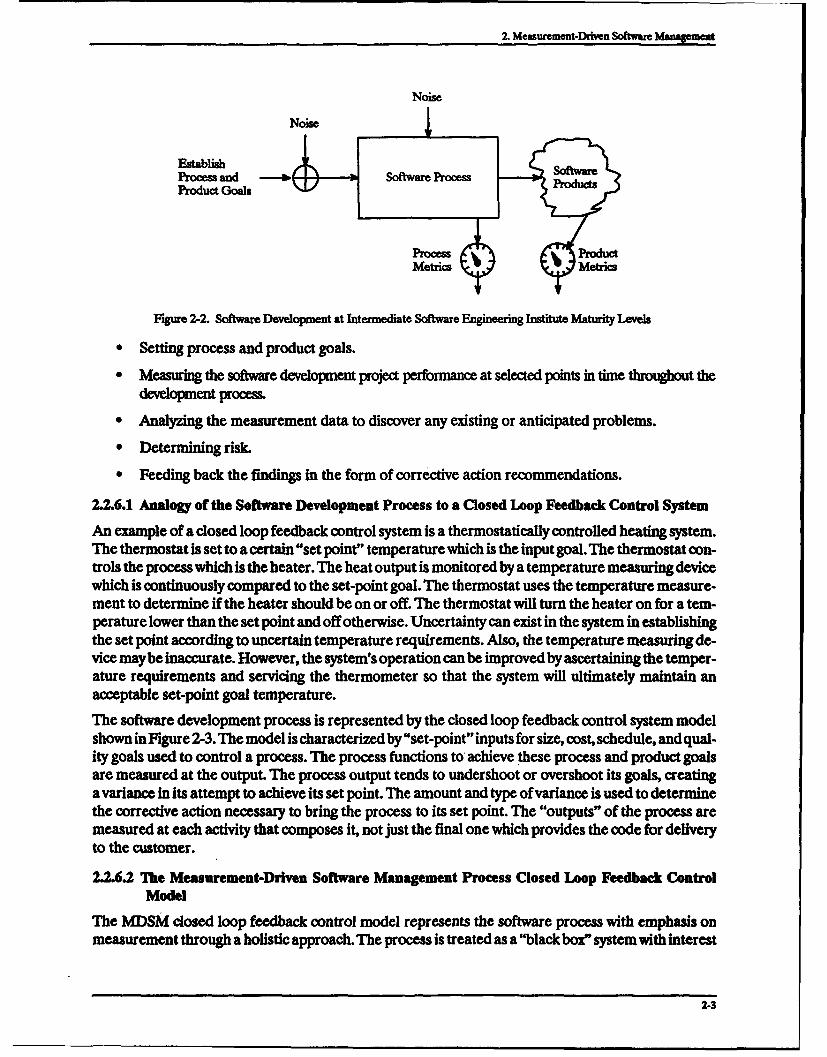
A software development organization, operating at the intermediate SEI process maturity levels islikely to do at least some measurement of its software process; but it is not likely to derive full benefitfrom the data it obtains. Therefore, it is necessary to implement a well planned measurement programthat governs the collection and use of the measurements. The program would include developmentof software standards to define the metrics and procedures to collect and analyze them. Only thencould meaningful benefit be expected from the measurement activity. Section 3 describes the natureof a software measurement program. A process in this state of maturity may be modeled as the openloop control system in Figure 2-2. The measurement activity has been initiated, but it has not yet devel-oped to the point of applying the measurement data to improve the process. The application of themeasurement data to adjust the process would "close the loop."
2.2.6 THE M& sun mL-D-Rlm Sovrwit MANAGEmwr PRocess MODEL AT ADVANCEDMNniM' LEVELS
MDSM is a control model that represents:
2-2
2. Measurement-Driven Software Management
NoiseNoiseI
EstablishProcess and > " Software ProcessPxutProduct Goals
Metrics erc
Figure 2-2. Software Development at Intermediate Software Engineering Institute Maturity Levels
"* Setting process and product goals.
"* Measuring the software development project performance at selected points in time throughout thedevelopment process.
"• Analyzing the measurement data to discover any existing or anticipated problems.
"* Determining risk.
"• Feeding back the findings in the form of corrective action recommendations.
2.2.6.1 Analogy of the Software Development Process to a Closed Loop Feedback Control System
An example of a dosed loop feedback control system is a thermostatically controlled heating system.The thermostat is set to a certain "set point" temperature which is the input goal. The thermostat con-trols the process which is the heater. The heat output is monitored by a temperature measuring devicewhich is continuously compared to the set-point goal. The thermostat uses the temperature measure-ment to determine if the heater should be on or off. The thermostat will turn the heater on for a tem-perature lower than the set point and off otherwise. Uncertainty can exist in the system in establishingthe set point according to uncertain temperature requirements. Also, the temperature measuring de-vice may be inaccurate. However, the system's operation can be improved by ascertaining the temper-ature requirements and servicing the thermometer so that the system will ultimately maintain anacceptable set-point goal temperature.
The software development process is represented by the closed loop feedback control system modelshown in Figure 2-3. The model is characterized by "set-point" inputs for size, cost, schedule, and qual-ity goals used to control a process. The process functions to achieve these process and product goalsare measured at the output. The process output tends to undershoot or overshoot its goals, creatinga variance in its attempt to achieve its set point. The amount and type of variance is used to determinethe corrective action necessary to bring the process to its set point. The "outputs" of the process aremeasured at each activity that composes it, not just the final one which provides the code for deliveryto the customer.
2.2.6.2 The Measurement-Driven Software Management Process Closed Loop Feedback ControlModel
The MDSM closed loop feedback control model represents the software process with emphasis onmeasurement through a holistic approach. The process is treated as a "black box" system with interest
2-3

2. Measurement-Driven Software Management
NoiseNoise
Establish NProes ad ofwae roes Software
Prodiuct Goal Products
PProdect
Metriw
Presctptionfor Correctie Assessamet
Action
Figure 2-3. Mesurment-Driven Software Management Prooess atAdvanced Software Engineern Institute Maturity Les
focused on the inputs and outputs at the interfaces to the system. Process and product goals areestablished based on the best estimates available. The process is initiated and, at the planned times,measurements are collected and analyzed and compared to measurement goals. The goals correspondto the set-point inputs and the measurements correspond to the outputs of the feedback control sys-tem. The measurements quantify the combined effect of the operation ofthe process and its uncertain-ties. These are the actual performance results. The difference between the goal and the measurementsis the process variance that becomes the driver of the process correction.
2.2.6.3 Representation of Knowledge In the Measurement-Driven Software Management ProcessModel
The MDSM closed loop feedback control model represents the important aspects of softwaredevelopment. The model takes several important factors into consideration. First, the establishmentof process and product goals is not an exact science. These goals are based, in part, on estimates ofthe expected performance of the involved people: the software engineers and the software develop-ment process managers. Also, the MDSM model considers the fact that the transformation of theproduct from its initial form of functional requirements through the various levels of design to thecode level is not purely mechanical. People are required to apply their relevant knowledge to the pro-cess. At each activity of the process, "knowledge" is added to the product during its transformationof form. Knowledge is also added by the support a computer-aided software engineering (CASE) toolprovides by constraining the developer to use standardized or approved methods and procedures. Inmost cases, the people involved will have to learn more about the application than they knew at thestart of the project. Theywill also have to learn about the latest methods of accomplishing the processactivities to maintain process competitiveness. "Ihe model represents the variability of eductin,eprience, and the people's rate of
2.2.64 Representation of Technology in the Measurement-Driven Software Management ProcessModel
The MDSM model representation also includes the technology used to support the engineers and themanagers. The establishment of the process and product goals are based, in part, on estimates of the
2-4
2. Measurement-Driven Software Management
effectiveness of the information engineering methodology employed by the process, the CASE toolperformance, and the supporting computer hardware capacity. The entire development environmentis considered and represented by the model.
2.2.6.5 Representation of Uncertainty in the Measurement-Driven Software Management ProcessModel
"Noise," in the form of uncertainty, is introduced at several points in the process. Uncertainty in theprocess is evidenced in many ways. Some examples are:
"* Uncertainty in the product requirements
Software development projects are often initiated before all products requirements are knownor firm. In many cases, firm requirements are subject to change as the product is developeddue to increasing knowledge of the product and the product's operational environment.
"* Variability in the performance of the people assigned to the project
It is likely that some of the people available for project assignment do not possess the requiredskills or experience. A wide variety of abilities have to be integrated into a team to completethe project that require training and experience. An overall productivity of the team has to beestimated in setting project goals.
"* Inaccuracies in the measurement data
The noise also represents the inaccuracies in the measurement data that underlies the projectand process status assessments each time they are performed. You must recognize that manypeople are recording the size, cost (effort), schedule, and quality measurement data; and notall of them interpret the standards for data collection and analysis in the same way. The mea-surement data may not be available to the analyst in a convenient form or organization, espe-cially if it does not conform to the WBS of the project. If the data has to be reorganized beforeit is useful for estimating or assessing status, a certain amount of error may be introduced dur-ing reorganization.
" Variation in the judgement of the project measurement analysts
Application of estimating models requires judgement on the part of the analyst who has toquantify the many parameters of the estimating models. These estimating models are truly theexpression of the analyst's judgement. No matter how simple or intricate the model is, the re-suit of its use depends, to a great extent, on the experience of the analyst in dhe field and hisjudgement in applying the experience.
2.2.7 Mz suR m -Diu w SonwAum MANAGEMmNT Summzw
The MDSM closed loop control model concept must accommodate the activities of establishing goals,performing estimates, and collecting measurements, each with varying degrees of uncertainty. It dealswith variations of the abilities among people and their application of methodologies and tools. Theholistic approach of the closed loop feedback control model focuses on the input and output externalsto the process. It combines and integrates all performance and uncertainties that provides thisrepresentational capability.
2-5

2. Measurement-Driven Software Management
The mod:1 gives the project manager an assessment of the process performance and knowledge of theproject's overall completion status compared to the projected goal. The holistic approach does notdepend on knowledge of the exact cause of possible problems or uncertainties in the process or proj-ect. The technique is extremely useful in assessing the overall status of the project and pointing outthe magnitude of a problem. The ETVX paradigm, a model of the software development process acti-vities described in Section 4, then becomes useful in pinpointing the exact cause of the problems. Cor-rective action, then, is the feedback that compensates for the problems occurring in the process andacts to resolve them.
The major constituents of the MDSM process are:
" Set goals:
- Estimate size, costs, schedule, and quality using past experience and expected impactsof process change
- Set quantitative objectives for process and product
- Determine approach for monitoring the project and verifying the goals
"* Assess output:
- Collect data
- Monitor and track incrementally and compare with plan
- Verify goals incrementally
- Predict the development direction of process and product relative to goals and controllimits
- Determine if project is under control and if plan is still valid
- Estimate the risks of proceeding to the next activity
"* Take corrective action:
- Modify process to achieve product and process goals
- Prescribe and execute cost-effective management action
2.2.8 GoA. STnmG AND TRAcKmG
You can perceive a variety of top-level metrics-oriented goals for supporting the management of softwareproject control and software process improvement. The sets of metrics-oriented goals suggested here are:
* Process Improvement:
- Understand and quantify the software process (both short and long term)
- Produce and update estimation algorithms
2-6
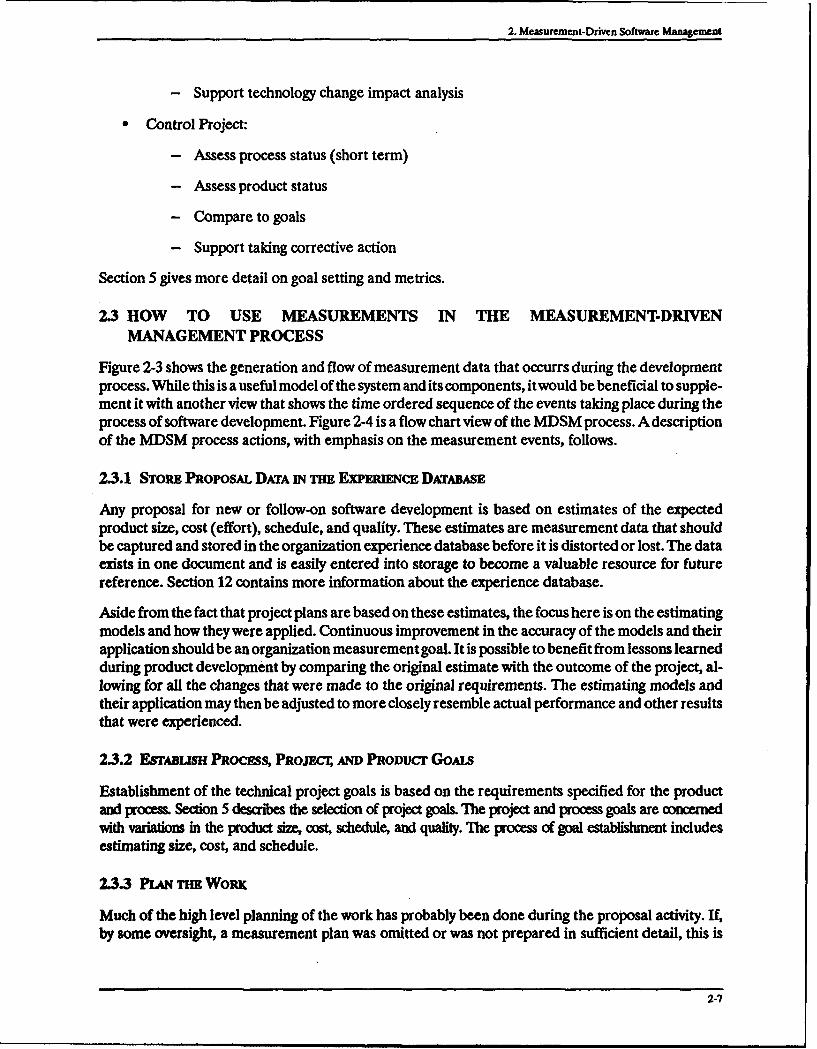
2. Meaurement-Driven Software Management
- Support technology change impact analysis
Control Project:
- Assess process status (short term)
- Assess product status
- Compare to goals
- Support taking corrective action
Section 5 gives more detail on goal setting and metrics.
2.3 HOW TO USE MEASUREMENTS IN THE MEASUREMENT-DRIVENMANAGEMENT PROCESS
Figure 2-3 shows the generation and flow of measurement data that occurrs during the developmentprocess. While this is a useful model of the system and its components, it would be beneficial to supple-ment it with another view that shows the time ordered sequence of the events taking place during theprocess of software development. Figure 2-4 is a flow chart view of the MDSM process. A descriptionof the MDSM process actions, with emphasis on the measurement events, follows.
2.3.1 STORE PROPOSAL DATA IN TmE EXPERmIECE DATABASE
Any proposal for new or follow-on software development is based on estimates of the expectedproduct size, cost (effort), schedule, and quality. These estimates are measurement data that shouldbe captured and stored in the organization experience database before it is distorted or lost. The dataexists in one document and is easily entered into storage to become a valuable resource for futurereference. Section 12 contains more information about the experience database.
Aside from the fact that project plans are based on these estimates, the focus here is on the estimatingmodels and how they were applied. Continuous improvement in the accuracy of the models and theirapplication should be an organization measurement goal. It is possible to benefit from lessons learnedduring product development by comparing the original estimate with the outcome of the project, al-lowing for all the changes that were made to the original requirements. The estimating models andtheir application may then be adjusted to more closely resemble actual performance and other resultsthat were experienced.
2.3.2 EsTABiuS PRocms, PROJECT, AND PRODUCT Goms
Establishment of the technical project goals is based on the requirements specified for the productand process. Section 5 describes the selection of project goals. The project and process goals are conceredwith variations in the product size, cost, schedule, and quality. The process of goal establishment includesestimating size, cost, and schedule.
2.3.3 PLAN Tm WoRn
Much of the high level planning of the work has probably been done during the proposal activity. If,by some oversight, a measurement plan was omitted or was not prepared in sufficient detail, this is
2-7

2. Measurement-Driven Software Management
Enter
Store propowa data in experience databaseI
Establish process, project and productgos
Perform wrojetsatsksem
I s~ m~p~d I -i, i ,b
Store status data in eperience database
Stor fiAldtinepree daN bs
goalsts
y" I-~ o civeato
Figure 2-4. Measurement-Driven Software Management Process
2-8

2. Measurement-Driven Software Management
the time to rectify any deficiencies. As the project manager develops the project technical work plandetails, the metrics analyst should be coordinating the measurement plan. The measurement planshould be based on an organization's standard for measurements. The standard should define, in de-tail, all the possible metrics of interest and the procedures for their collection and analysis. The projectmeasurement plan can then reference the standard and enumerate the applicable sections. The mostimportant feature of the project measurement plan is the schedule for the project status assessments.These may be at major milestone dates or at other specific points in the development schedule; forexample, at the projected 1/3, 2/3, and completion points. The budget for the status assessmentsshould be allocated at about 2 percent of the software development costs. The project manager shouldexpect to receive and use the results of the assessment analyses.
2.3.4 P RwoM HE WORK
This guidebook focuses on collecting, analyzing, and monitoring status data on product, project, andprocess. How to perform the planned product development technical work is not discussed here. Thatis subject to the requirements of the particular product and development procedures of a particularorganization.
2.3.5 PEmumo PROJECt STATUS ASSESSMENT
The project status assessment is essential to the project's success. It is just as crucial to the project asthe proposal. It provides the project manager with snapshot visibility into the project in terms of itssize, cost, schedule, and quality. He receives an assessment of the project's earned value or overallproportion complete. He also receives a projection of how the project development will proceed untilits completion. This projection is an estimate to complete (ETC) that includes a statistical evaluationof the risks of not attaining any project goals and the associated exposures. Additional managementindicators, such as productivity and various work rates, should be calculated. Section 11 contains moredetail on the management indicators, project status assessment, and the analysis report format usedto convey the resulting information to project and development management.
2.3.6 SToRE STATUS DATA iN nm ExPumric DATABASE
The activity of the project status assessment is another generator of measurement data. This snapshotof project size, cost, schedule, and quality status can easily be preserved by entering the data from theproject assessment analysis report into the experience database. The data will have to be identifiedas assessment data to keep it separate from the proposal data.
2.3.7 VALmATE THE GOAlS
It is inevitable that the product functional requirements will change during the course of a product'sdevelopment. The customer increases his understanding of his requirements and the product as it ap-proaches maturity and completion. This increased familiarity suggests additional uses for the product,some of which will lead to requirements changes. Therefore, project management periodically reviewsproject goals to determine if any of the project goals change in product functional requirements. It islikely that if a goal is changed, the associated targets and limits for the statistical process controls willneed to be correspondingly changed. These changes should be made prior to any attempt to comparethe results of the project status assessment with the goals and limits.
2-9
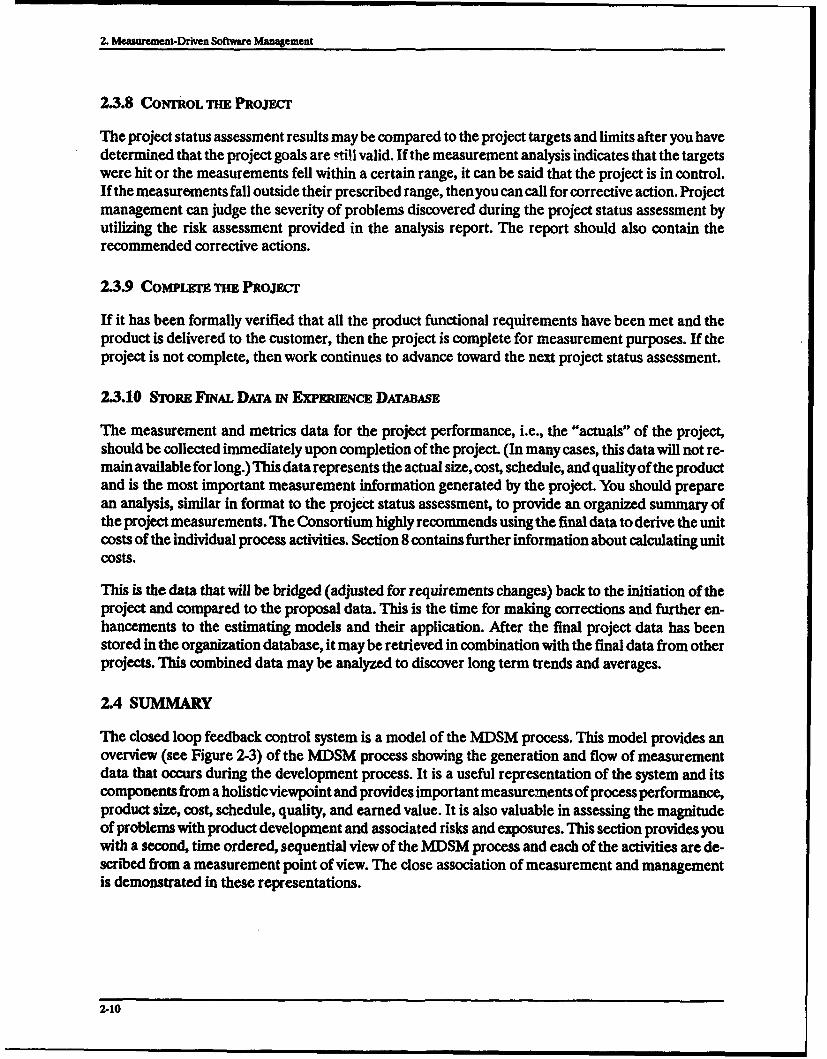
2. Measurement-Driven Software Management
2.3.8 CONTROL THE PROJECT
The project status assessment results may be compared to the project targets and limits after you havedetermined that the project goals are still valid. If the measurement analysis indicates that the targetswere hit or the measurements fell within a certain range, it can be said that the project is in control.If the measurements fall outside their prescribed range, then you can call for corrective action. Projectmanagement can judge the severity of problems discovered during the project status assessment byutilizing the risk assessment provided in the analysis report. The report should also contain therecommended corrective actions.
2.3.9 CoMPIgrE THE PRoJcr
If it has been formally verified that all the product functional requirements have been met and theproduct is delivered to the customer, then the project is complete for measurement purposes. If theproject is not complete, then work continues to advance toward the next project status assessment.
2.3.10 STORE FiNAL DATA iN ExPERInwCE DATABASE
The measurement and metrics data for the project performance, i.e., the "actuals" of the project,should be collected immediately upon completion of the project. (In many cases, this data will not re-main available for long.) This data represents the actual size, cost, schedule, and quality of the productand is the most important measurement information generated by the project. You should preparean analysis, similar in format to the project status assessment, to provide an organized summary ofthe project measurements. The Consortium highly recommends using the final data to derive the unitcosts of the individual process activities. Section 8 contains further information about calculating unitcosts.
This is the data that will be bridged (adjusted for requirements changes) back to the initiation of theproject and compared to the proposal data. This is the time for making corrections and further en-hancements to the estimating models and their application. After the final project data has beenstored in the organization database, it may be retrieved in combination with the final data from otherprojects. This combined data may be analyzed to discover long term trends and averages.
2.4 SUMMARY
The closed loop feedback control system is a model of the MDSM process. This model provides anoverview (see Figure 2-3) of the MDSM process showing the generation and flow of measurementdata that occurs during the development process. It is a useful representation of the system and itscomponents from a holisticviewpoint and provides important measurements of process performance,product size, cost, schedule, quality, and earned value. It is also valuable in assessing the magnitudeof problems with product development and associated risks and exposures. This section provides youwith a second, time ordered, sequential view of the MDSM process and each of the activities are de-scribed from a measurement point of view. The close association of measurement and managementis demonstrated in these representations.
2-10
3. MEASUREMENT AND THE SOFTWAREENGINEERING INSTITUTE PROCESS MATURITY
LEVEL STRUCTURE
3.1 INTRODUCTION
This section describes the key role that software measurement plays in reaching higher maturity levelsdefined by the SEI. A measurement-based strategy to reach higher maturity levels is defined. This sec-tion also describes the measurement activities that should be provided for any software organization,and it presents several alternative organizational approaches for implementing these activities.
It is impossible for an organization to progress to higher process maturity levels without havinginstitutionalized a software measurement program. The measurement-based approach to improvingmaturity levels stems from observing that an effective measurement activity, which is necessary formaturity level 2, is an essential underpinning for all activities needed to manage software projects atSEI level 3 and above. However, while an effective measurement program is necessary, it is not suffi-cient to achieve higher capability maturity levels. When your organization successfully has attainedlevel 2, it has simultaneously built the foundation for its future progress to levels 3, 4, and 5.
3.2 PROCESS/CAPABILITY MATURITY LEVELS
SEI published two versions of its process/CMM: one in 1987 and one in 1991. The first model(Humphrey and Sweet 1987) described the process maturity framework and gave the 1987 version ofthe process maturity assessment questionnaire. The 1987 questionnaire, which was intended to be "asimple tool for identifying areas where an organization's software process needed improvement,"served as the starting point for nearly all assessments performed through 1992. In assessment practice,it has recently been supplemented extensively by the more definitive CMM.
By 1991, SEI had evolved the framework into a fully defined product, the CMM for Software, which".._. provides organizations with more effective guidance for establishing process improvement pograms thanwas offered by the (preliminary process) maturity questionnaire" (PauFlk Curtis, and Chrissis 1991, vii). Indeveloping the CMM, SEI used knowledge acquired during many software process assessments and informa-tion gathered by extensive feedback from industry and gvermment. In assessaent practice, the more definitiveCMM has been used to suppement the 1987 model When revised assessment questionnaires are available,perhaps in early 1993, the CMM will likely supersede the earlier version.
The models rest on the premise that software process maturity is a credible indicator of capability. Theconcept (1) implies that the productivity and quality resulting from an organization's software processcan be improved over time and (2) presumes that improvement comes through consistent gains in the
3-1
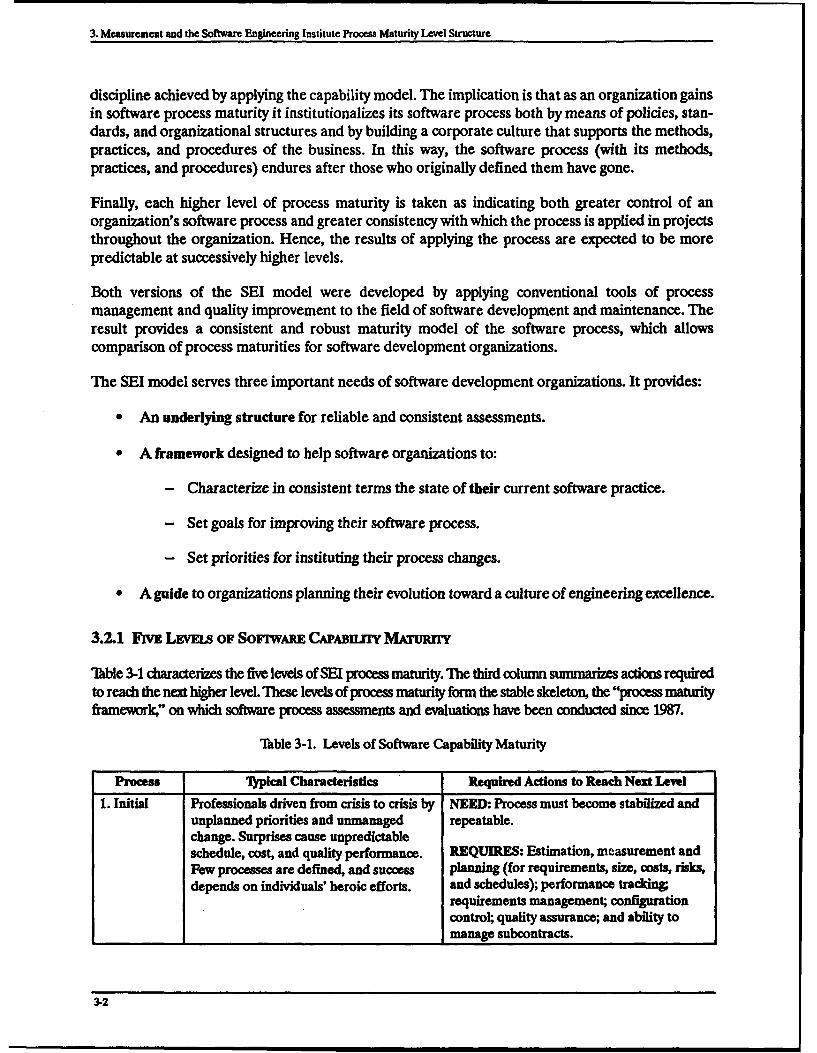
3. Measurement and the Software Engineering Institute Process Maturity Level Structure
discipline achieved by applying the capability model. The implication is that as an organization gainsin software process maturity it institutionalizes its software process both by means of policies, stan-dards, and organizational structures and by building a corporate culture that supports the methods,practices, and procedures of the business. In this way, the software process (with its methods,practices, and procedures) endures after those who originally defined them have gone.
Finally, each higher level of process maturity is taken as indicating both greater control of anorganization's software process and greater consistency with which the process is applied in projectsthroughout the organization. Hence, the results of applying the process are expected to be morepredictable at successively higher levels.
Both versions of the SEI model were developed by applying conventional tools of processmanagement and quality improvement to the field of software development and maintenance. Theresult provides a consistent and robust maturity model of the software process, which allowscomparison of process maturities for software development organizations.
The SEI model serves three important needs of software development organizations. It provides:
* An underlying structure for reliable and consistent assessments.
* A framework designed to help software organizations to:
- Characterize in consistent terms the state of their current software practice.
- Set goals for improving their software process.
- Set priorities for instituting their process changes.
* A guide to organizations planning their evolution toward a culture of engineering excellence.
3.2.1 FivE Li'mts OF Soviw~m CAPABnrr MA~ uR
blble 3-1 characterizes the five levels of SEI process maturity. The third column summarizes actions requiredto reach the next higher level. These levels of process maturity form the stable skeleton, the "process maturityframework" on which software process assessments and evaluations have been conducted since 1987.
Table 3-1. Levels of Software Capability Maturity
Process 1'plcal Characteristics Required Actions to Reach Next Level
1. Initial Professionals driven from crisis to crisis by NEED: Process must become stabilized andunplanned priorities and unmanaged repeatable.change. Surprises cause unpredictableschedule, cost, and quality performance. REQUIRES: Estimation, measurement andFew processes are defined, and success planning (for requirements, size, costs, risks,depends on individuals' heroic efforts. and schedules); performance tracking;
requirements management; configurationcontrol; quality assurance; and ability tomanage subcontracts.
3-2

3. Meaurement and the Software Engineering Institute Process Maturity Level Structure
Ibble 3-1, continued
Process Typicai Characteristics Required Actions to Reach Next Level2. Repeatable Basic project management processes are NEED: An organization standard process for
in place to track cost, schedule, and developing and maintaining software.functionality. Necessary process disciplineis in place to repeat earlier successes on REQUIRES: Developing and documentingprojects with similar applications. Product process standards and definitions, assigningquality is variable, process resources, and establishing methods
for managing requirements, design, test andinspection. Also requires measures ofintergroup coordination and of trainingprograms.
3. Defined Defined software process for both NEED: Quantitative quality goals formanagement and engineering activities is software products.documented, standardized, and integratedinto an organization-wide software REQUIRES: Establishing and tracking overprocess. All projects use a documented time process measurements and quantitativeand approved [tailored] version of the quality goals, plans, and process cost andorganization's process to develop and performance. Calculate cost of poor qualitymaintain software. Costs and schedules and compare to costs of achieving qualityare reliable, although quality performance goals.is still unpredictable.
4. Managed Detailed measures of the software process NMEED Process must become optimizing;and product quality are collected. Both first by narrowing variation in performancethe software process and products are to within acceptable quantitative boundaries,quantitatively understood and controlled then by continuous process improvement.using detailed measures. There isreasonable statistical control over process, REQUIRES: Quantitative productivity plansand thus over costs, schedules, and and tracking, instrumented processproduct quality. Organization-wide environment, and economically justifiedprocess database is in place. technology investments.
5. Optimizing Continuous process improvement is STATE: Continuous process improvement.enabled by quantitative feedback from theprocess and from testing innovative ideas REQUIRES: Continued emphasis onand technologies. Quantitative basis is process measurement and process methodsused for continuous process improvement for error prevention.and for continued capital investment inprocess improvement and automation.
3.2.2 How Acrmws EVOLVE FROM LEvEls 2 ThROUGH 5
The nature of project activities evolves as an organization performs at higher levels on the CMM.
3.2.2.1 Measurement-Related Activities
"Uhble 3-2 shows how measurement-related activities evolve in both the process and 0MM& for levels 2throug 5. Level 2 function use a minimim set of data (desclbed in Section 6) needed to control andmangea software project. Level 3 functions add to level 2's by defining and instit alizin the izat s
3-3

3. Measuremnt and the Software Engineering Institute Proem Maturity Level Structure
software development process and on estimating for a projeces defined software process (obtained by tailoringthe organization's standard process). Level 4 then focuses on further identifying and quantifying the organiza-tion's software development processes, selecting process and product data to be collected, analyses to beperformed, process and product metrics to be used in managing a project, and defining quantitativegoals for product and process quality. The software product quality goals are flowed down to subcon-tractors. Level 5 focuses on the "optimizing" process by incorporating the lessons learned from continuingprocess measurements and development experience. 7hble 3-2 is adapted from Humphrey and Sweet (1987),Weber et al. (1991), and Baumert and McWhinney (1992).
Table 3-2. Evolution of Measurement-Related Activities by Maturity Level
Level 3, Defined(Customizable "standard" Levels 4 and S
Level 2, Repeatable Process process) (Measured, analyzed process)
Estimate, plan, and measure: Level 2 data, plus: Levels 2 and 3 data, plus:software size, resource usage,staffing levels, schedules, cost of Maintain formal records for Set quantitative quality goals anddevelopment, and risk. progress of unit development, manage according to quality plan.
Maintain profiles over time of In addition to level 2 profiles, In addition to level 3 profiles,actual versus plan for:. software maintain profiles over time of maintain control limit charts onsize; units designed, build/release ranges, variances, and comparsons size growth; costs; completions; andcontent, units completing test, units with historical data. characteristics of peer reviews.integrated, and test progress;computer resource utilization; Develop software measurement Collect process and product data,requirements status; and staffint standards, and experience-based and analyze according to
metrics for estimating size, cost, documented procedures, inMaintain profiles over time of wse and schedule. systematic efforts to preventof target system memory, defects, assess beneficial processthroughput, and /o channels. Measurements of errors found and innovations, and manage process
costs incurred by process activity. change.Collect statistics on trouble reports, Pareto analysis of defects, andand on design errors, and software application of statistical control Maintain managed and controlledcode and test errors found in charts. process database for processreviews and inspections. metrics across all projects.
Coordinate software experiencedatabase at organization level. Maintain profiles over time for.
ratios of rework time and cost ofproject totals, actual versusplanned costs and benefits ofprocess improvement and defectprevention activities.
The progression for definition of methods and standards follows a similar path. Level 2 organizationsprovide training for newly appointed managers of software projects and for conducting reviews, inspec-tions, and audits; estimating, planning, and scheduling resources; managing risk for technical, schedule,and cost issues; quality assurance; configuration management of changes to requirements, designs, andcode; and for management of subcontracts.
3-4

3. Measurement and the Software Engineering Institute Proces Maturity Level Structure
3.3 BENEFITS OF HIGHER MATURITY LEVELS
This section illustrates the benefits organizations gain by raising their software process maturitylevels. Benefits include (1) enhanced ability to predict accurately software size, cost, quality, andschedule reducing statistical variability of the process; (2) improved results from greater control ofthe software process and from changing the shape of the process distribution curves; and (3) greatertechnical and managerial visibility into the software process.
Increasing3.3.1 ENHANCED ABnir To PREICr -ptiinV gSOptimi ing
AccuRATMEYI ..... I 5
Greater predictability stems from two majoractivities: (1) decreasing the process variability(variance) and (2) process improvement work .that changes the shape of the process distribu- Meantion curve. You first discuss the effects ofdecreasing process variability. Ma4aged
I I
3.3.1.1 Reducing Variability Around Process 4Mean I
Figure 3-1 shows how predictability improvesat higher maturity levels as the actual results of i Meanthe software process around the process mean Dei
become more controlled and less variable. Thechart represents predictability of effort or cost I 3of a software construction process. All five lev-els have the same mean (indicated by the solidvertical line) but different variance around themean. The narrowing pattern of the shaded Meanareas is typical of higher maturity level organi-zations, which maintain their software process Repeatable
under statistical control. For a level 5 process,actual results diverge only a little from the esti- 2...mated mean; however, for lower maturity lev-els, process dispersion is muchgreater. At level1, actual results may bear little resemblance tothe estimated effort or cost. Mean
The dashed vertical lines, within which about Ad Hoc95 percent of the level 5 process results fall,show how relatively unpredictable results areat lower levels.
Mean
Figure 3-1. Enhanced Ability to Predict Accurately forProcesses Under Statistical Control
3-5
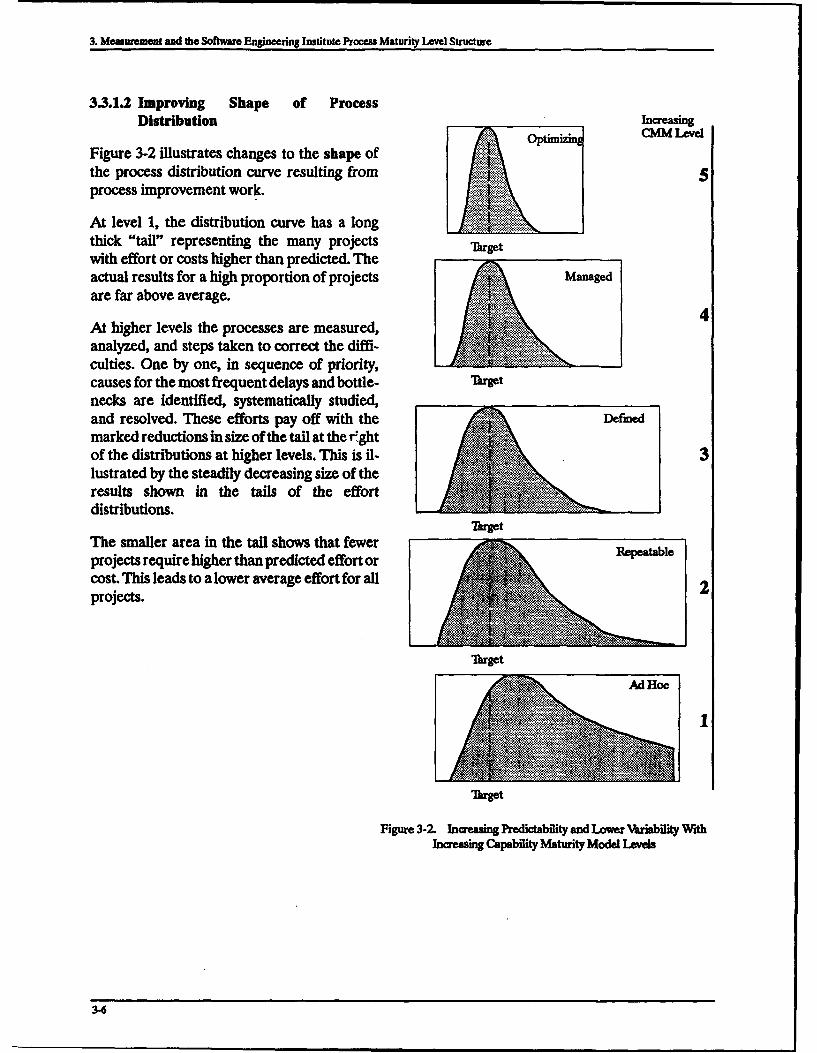
3. Measurement and the Software Engineering Institute Process Maturity Level Structure
3.3.1.2 Improving Shape of ProcessDistribution Increasing
Optimizing CM Level
Figure 3-2 illustrates changes to the shape of .the process distribution curve resulting from 5process improvement work.
At level 1, the distribution curve has a longthick "tail" representing the many projects Targetwith effort or costs higher than predicted. Theactual results for a high proportion of projects Managed
are far above average.1* 4
At higher levels the processes are measured,analyzed, and steps taken to correct the diffi-
culties. One by one, in sequence of priority,causes for the most frequent delays and bottle- 'Argetnecks are identified, systematically studied,and resolved. These efforts pay off with the Defined
marked reductions in size of the tail at the r'ghtof the distributions at higher levels. This is il- 3lustrated by the steadily decreasing size of theresults shown in the tails of the effortdistributions.
The smaller area in the tail shows that fewerprojects require higher than predicted effort orcost. This leads to a lower average effort for allprojects.
'Irget
Ad Hoc
_01
Figure 3-2. Inareasg Predictability and Lower Variability WthIncreas Capabiity Maturty Modeleveh
3-6

3. Measurement and the Software Engineering Institute Process Maturity Level Structure
3.3.2 IMPROVED RESULTS FROM GREATER CONTROL
OF THE PROCESS IncreasingCMM Level
When the effects are combined, as in Figure 3-3, you opti g
can see how higher process maturity levels are charac-/terized by a combination of reduced variability aroundthe process mean performance and by improved pro-cess results, which combine to yield greater accuracy ofprediction. The figure represents the effect on sched-ule predictability. .Managed
Greater predictive accuracy is shown by the closer 4match of target delivery date with distributions ofschedule performance. At level 1, the dashed line de-noting the mean delivery date is noticeably later than .......the target date; scheduled delivery commitment is metfor only a minority of projects while the vast majority Target
are late. By level 3, the mean delivery date is much clos- Defineder to the target and the distribution of dates is nearly"normal." About half the projects are earlier and half 3are later than the scheduled target date. The improvedpredictability results from a better selection of targetdelivery dates using the factual knowledge of processcapabilities instead of naive optimism or wishful Targetthinking.
Targeted results improve as maturity increases. As an 2
organization's process matures, development time andcost decrease as quality and productivity increase. Inthe level 1 organization, for example, developmenttime can be excessive because of the extensive rework T Meanneeded to correct errors. At higher maturity levels, de-fect prevention techniques (inspections and peer re-views) eliminate rework and increase processefficiency. I
Decreased variability of actual results around thetarget is shown by the narrower distributions at highermaturity levels. The widest curve, with the greatest Target Meanvariability, is at level 1; this contrasts with the tighter Figure 3-3. Increasing Predictability and Lowerdistributions achieved at higher levels, where the Variability With Increasing Capability Maturprocess is operating within controlled parameters. Model Levels
Sections 3.3.1 and 3.3.2 illustrate the benefits that organizations gain by raising their software processmaturity levels. Benefits described here enhance the ability to accurately predict software productsize, cost, and quality and to schedule and improved process results. Section 3.3.3 illustrates how high-er maturity levels provide greater technical and managerial visibility into the software developnent process.
3-7

3. Measurement and the Software Engineering Institute Process Maturity Level Structure
3.3.3 Vismiuny INTo SoFTWARE DEVEwOPMEm" PROCESS
The following diagrams show how visibility into the nature of the software process increases withhigher maturity levels.
333.1 Level 1, Initial
The initial level, Figure 3-4, is typical of organizations and projects that function at the initial level ofsoftware process maturity. The process is essentially a "black box." It provides virtually no visibilityinto the nature of the process being used. The level 1 process can be described as:
".. . an amorphous entity, and visibility into project processes is difficult. Since the staging of activitiesis ambiguous, managers have an extremely difficult time establishing the status of project progress andactivities. Requirements flow into the software process in an uncontrolled manner, and a product re-sults. Software development is frequently viewed as black magic, especially by managers who areunfamiliar with software." (Paulk, Curtis, and Chrissis 1991, 16)
Inputs•i u~t
Figure 3-4. Level 1, Initial Process
At this maturity level, the software process is constantly changing as project work progresses. It isvirtually impossible to accurately predict product size, schedule, functionality, quality, or budget. Ifperformance can be predicted at all, it is only by individual rather than organizational capability. Lev-el 1 successes are largely due to the inspiration and heroic efforts of gifted software professionals.Thus, managers often complain that the process is a "black box" that consumes large amounts ofresources and ejects products of questionable quality at irregular intervals.
3.3.3.2 Level 2, Repeatable
At level 2, repeatable, the software process becomes more visible and controlled. While the internalprocess activities have become visible, they are not well defined. Figure 3-5 shows how increased detailat completion of activities such as requirements, design, code and unit test, and integration is availableat level 2.
F 3-5 I
Figure 3-5. Level 2, Repeatable Process
3-8

3. Measurement and the Software FEAngeering Institute Proces Maturity Level Structure
"Repeatable" process activities (such as requirements, design, code and unit test, and integration) areknown, and stabilized, especially for estimating, planning, and monitoring progress of a softwareproject. At this level, organizations can repeat and apply practices that they have found to besuccessful, especially on similar projects. Realistic project commitments are made based on a recordof estimates and results from previous projects. Software requirements and the configuration of inter-im products developed to satisfy requirements are baselined and controlled. Project standards are de-fined and followed. Projects track software size, schedules, functionality, and costs (perhaps usinglittle more than minimum data). Implementation may still use ad hoc methods and may still rely onheroic efforts by the project people.
3.3.3.3 Level 3, Defined
The level 3, defined, process in Figure 3-6 extends the degree of visibility to activities within the "whitebox" process. The nature of the process activities is better known than in the level 2 process. Processperformance is no longer dependent entirely on the capability of the individual performers. The "or-ganization standard" process is institutionalized and embedded in the organization's policies, stan-dards, and procedures for both software engineering and management processes. Consequently,process performance becomes considerably more repeatable and variability is reduced substantially.Each project's defined process is a tailored, documented and approved, version of the "organizationstandard" process for developing and maintaining software.
InutReiements Desig Test Integrate
Figure 3-6. Level 3, Defined Proess
To maintain and improve the visbility into the process activities, there is a permanent, active softwareengineering process group (SEPG). Organization-wide training ensures that all software managers and practi-tioners have both the knowledge and skills needed to perform the tasks assigned to them. Although muchimproved, some degree of unpredictability remains, especially with regard to product quality.
3.3.3.4 Level 4, Managed
The level 4, managed, process in Figure 3-7 adds still more visibility into the white box process(sharpening the image with measurements symbolized by meter dials) at key points in the process.This process instrumentation, providing well-defined and consistent measures, yields enhanced levelsof predictability into process quality and precision in estimating and controlling size, cost, and schedule.
The level 4 process capability is measured and operates within stated limits. The organization can predict andtrack trends of process and product quality within the known (statistical) limits of its process capabilities. Theorganization sets quantitative goals for the quality of its software products. It measures quantity and qualityfor important software process activities across all projects in the organization. It uses an orgaation-wileprocess database to collect and analyze process data from many projects.
3.3.3.5 Level 5, Optimizing
Finally, at the level 5, optimizing, the measurements made at key points in the process lead to processmodifications designed to improve process performance as illustrated in Figure 3-8. Measurements
3-9
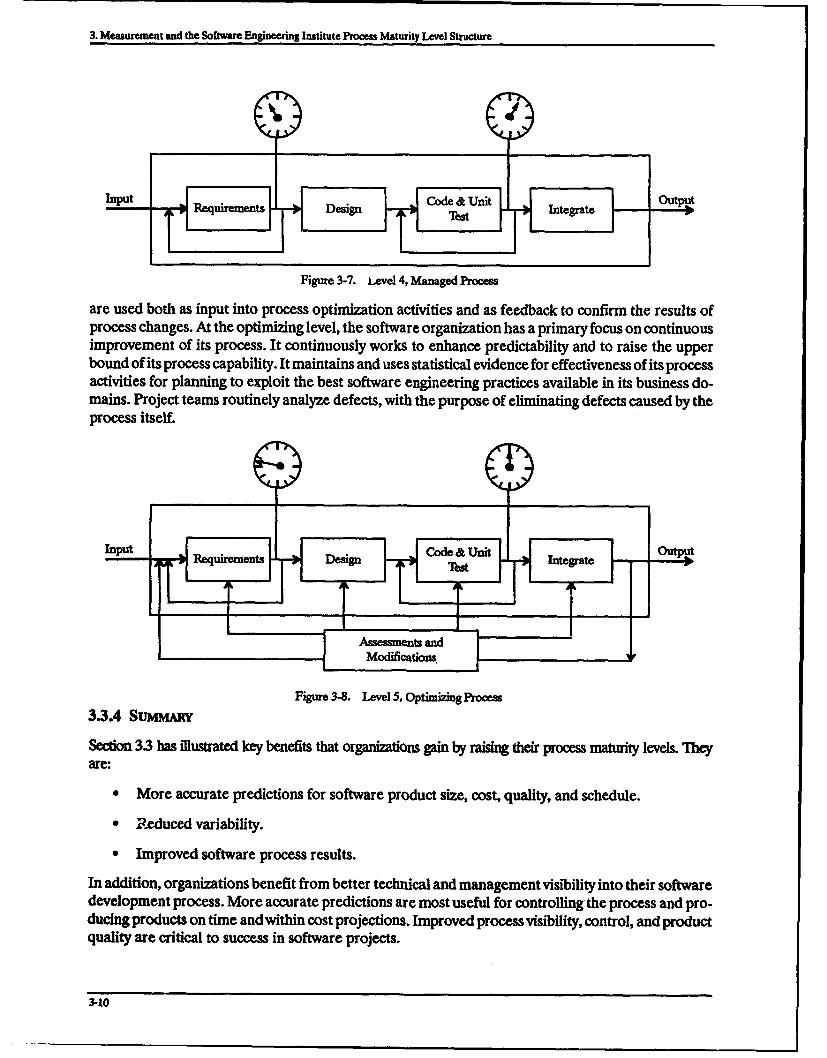
3. Measurement and the Software Enginering Institute Process Maturity Level Structure
CIN
Figure 3-7. .evel 4, Managed Process
are used both as input into process optimization activities and as feedback to confirm the results ofprocess changes. At the optimizing level, the software organization has a primary focus on continuousimprovement of its process. It continuously works to enhance predictability and to raise the upperbound of its process capability. It maintains and uses statistical evidence for effectiveness of its processactivities for planning to exploit the best software engineering practices available in its business do-mains. Project teams routinely analyze defects, with the purpose of eliminating defects caused by theprocess itself.
Assessments andModifications.
Figure 3-& Level 5, Optimtizing Process
3.3.4 SuMMARY
Section 3.3 has illustrated key benefits that organizations gain by raising their process maturity levels. Theyare:
"* More accurate predictions for software product size, cost, quality, and schedule.
"* Reduced variability.
"• Improved software process results.
In addition, organizations benefit from better technical and management visibility into their softwaredevelopment process. More accurate predictions are most useful for controllingthe process and pro-ducing products on time and within cost projections. Improved process visibility, control, and productquality are critical to success in software projects.
3-10

3. Measurement and the Software Engineering Institute Proces Maturity Level Structure
3.4 MEASUREMENT ACTIVITIES REQUIRED FOR LEVELS 2 AND 3
The goal of this section is to help organizations systematically use measurement technology to morequickly achieve process maturity levels 2 and 3 than might otherwise be possible. It shows how to useminimum data and minimal levels of software measurement practices to improve an organization'ssoftware capability maturity level to level 2, and later to level 3.
Raising process maturity level is not an easy or trivial accomplishment. Only one in six softwaredevelopment organizations now function at level 2or higher and have repeatable or defined processes.In late 1992, the industiy "state-of-practice" software processes are at level 1, the initial or "ad hoc" level.
Many items in the CMM and in the SEI assessment questionnaire imply the use of measurements andmetrics, even when they are not explicitly prescribed. Activities required at higher levels often involvemeasuring properties of the software process and products, deriving metrics from those measure-ments, and taking effective action based on the results. To ensure credibility, recommended proce-dures and a suggested minimum set of project data are traced to individual assessment items and tokey practices in the CMM (Humphrey and Sweet 1987, App. B; Paulk, Curtis, and Chrissis 1991).
Tables 3-1 and 3-2 were originally derived from the above 1987 publication. They represent a basic andstill accurate description of observable process activities. An SEI assessment addresses each charac-teristic shown in these tables, with at least one question. Responses to these questions are reviewed,then followed by detailed questions to verify the extent to which the questionnaire responses are typi-cal of the organization's standard processes. For an organization to be assessable as having attaineda particular level of software process maturity, investigation of responses to questions on the 1987 SEIassessment questionnaire (still in use in 1992) must show that from 80 to 90 percent of the indicatedcharacteristics are present at each level of process maturity.
3.4.1 MkSuRnmT FOUNDArION
Your hard-earned experience and the CMM both teach that managing a project effectively requirescountless actions, many invlving measurements. From the project beginning, you must, as a minimum:
"* Estimate the characteristics of your end products, including functional capability, quality, andSpecify the method of testing that the delivered product meets the requirements imposed on it.
" Estimate resource requirements and schedule for developing the product (including anyknown risks that might impede the effort) and prepare the software development plan. Youknow the need for intermediate milestones and review points to verify progress on projecttasks: both internal reviews and those done by subcontractors.
"* Change the development plan, as needed, to reflect changes in requirements throughout thedevelopment effirt.
"* Provide adequate tools for developers, testers, configuration management, and qualityassurance staff to avoid impairing effectiveness of your project team.
" Rely on a continuing process of measurement to track and monitor project status and toevaluate product and process quality during development (while it is still possible to benefitfrom feedback and build in features that will delight users or to correct deficiencies).
3-11
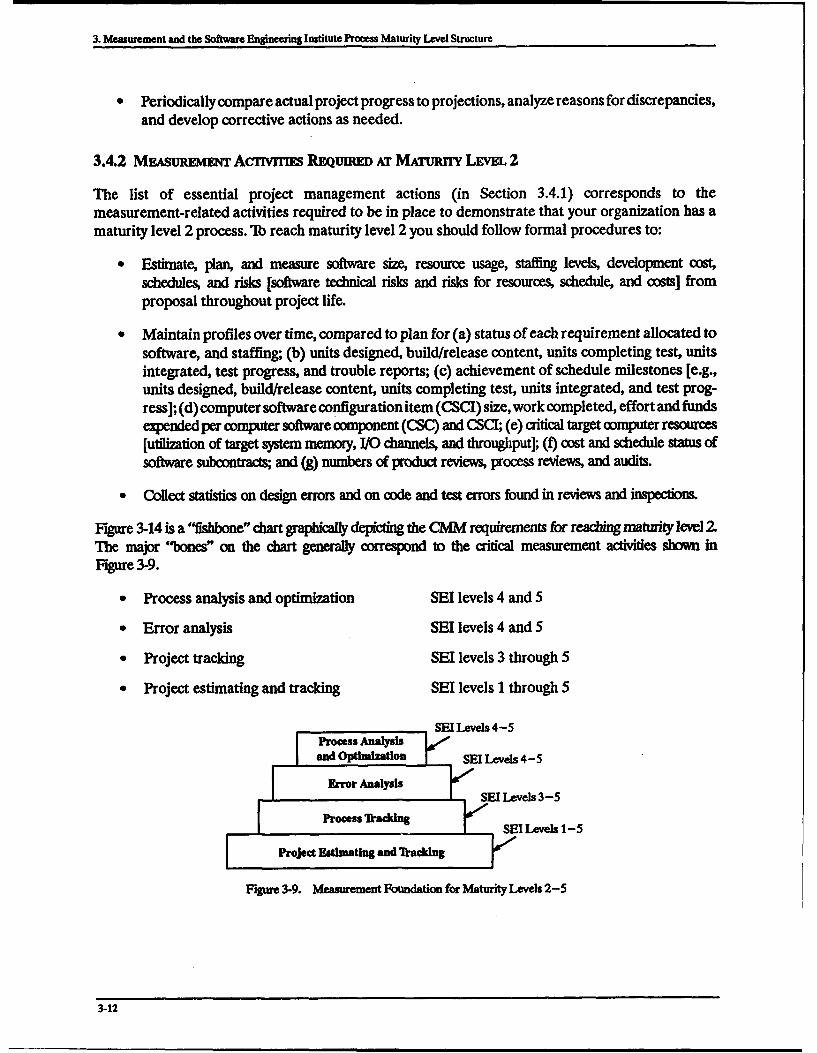
3. Measurement and the Software Engineering Institute Process Maturity Level Structure
* Periodically compare actual project progress to projections, analyze reasons for discrepancies,and develop corrective actions as needed.
3.4.2 ME*suiEmmT AcnvmEs REQunuD AT MATurr LEVEL 2
The list of essential project management actions (in Section 3.4.1) corresponds to themeasurement-related activities required to be in place to demonstrate that your organization has amaturity level 2 process. To reach maturity level 2 you should follow formal procedures to:
" Estimate, plan, and measure software size, resource usage, staffing levels, development cost,schedules, and risks [software technical risks and risks for resources, schedule, and costs] fromproposal throughout project life.
" Maintain profiles over time, compared to plan for (a) status of each requirement allocated tosoftware, and staffing; (b) units designed, build/release content, units completing test, unitsintegrated, test progress, and trouble reports; (c) achievement of schedule milestones [e.g.,units designed, build/release content, units completing test, units integrated, and test prog-ress]; (d) computer software configuration item (CSCI) size, work completed, effort and fundsexpended per computer software component (CSC) and CSCI; (e) critical target computer resources[utilization of target system memory, I/O channels, and throughput]; (0) cost and schedule status ofsoftware subcontracts; and (g) numbers of product reviews, process reviews, and audits.
"* Collect statistics on design errors and on code and test errors found in reviews and inspections.
Figure 3-14 is a 'fishbone" chart graphically depicting the CMM requirements for reaching maturity level 2.The major "bones" on the chart generally correspond to the aitical measurement activities shown inFigure 3-9.
"* Process analysis and optimization SEI levels 4 and 5
"* Error analysis SEI levels 4 and 5
"* Project tracking SEI levels 3 through 5
"* Project estimating and tracking SEI levels 1 through 5
SEI Levels 4-5Process Analysisand Optimization SEI Levels 4-5
S Error Analysis SEI Levels 3-5
Process Mrackting SILvl -
F Project Estimating and brackning
Figure3-9. Measurement Fcmndation for Maturity Levels 2-5
3-12
3. Measurement and the Software Engineering Institute Proces Maturity Level Structure
Project tracking activities are shown, because there are so many at level 2 with none for processtracking. The largest number of activities fall into the more general category of organizational activi-ties. In Figure 3-14 the shaded boxes also indicate the location of the six CMM key process activities.Figures 3-15 to 3-17 are similar depictions leading to levels 3, 4, and 5.
In summaiy, to reach level 2 your organization needs to have defined documents and institutionalized
methods. Defined methods are required for:
"* Software design, code, and tests.
"* Estimating software size.
"* Projecting, planning, and scheduling resources.
"* Making changes to requirements, designs, and code.
"* Conducting reviews, inspections, and audits.
3.4.3 MF-suRammf Acnvrrs REQUIRED AT MATUn LEVEL 3
The measurement activities required to reach maturity level 3 deal with the process and product inmore detail than do the methods and activities associated with level 2. For example, the methods pro-vide more detail for estimating resources for each key activity by the defined software process and inmanaging risk for technical, schedule, and cost issues. The measurement activities to help you reachprocess maturity level 3 consist of the required level 2 data and activities plus:
"* Maintain formal records for progress of unit development.
"* Develop software measurement standards.
"* Maintain formal records for test coverage.
"* Develop experience-based metrics for estimating size, schedule, and cost.
Figure 3-15 is a "fishbone" chart graphically depicting the CMM requirements for reaching maturitylevel 3. The major bones generally correspond to the critical measurement activities in Figure 3-9:project estimating and tracking; process tracking; error analysis; and process analysis and optimiza-tion. Measurement and project tracking activities are each shown separately because there are somany at level 3 with none for process tracking. A large number of activities fall into the more generalorganizational category with training and project management specialties. In Figure 3-15, the shadedboxes indicate the locations of activities devoted to estimating, planning, and measurement; to reviewsand audits; and to process definition and control.
3.4.4 MEsuRvs A r Acnvrrms REQumED AT MATuiRy LIim 4
Figure 3-16 is a "fishbone" chart graphically depicting the CMM requirements for reaching maturitylevel 4. The major bones correspond to the critical measurement activities in Figure 3-9:. measure-ment; project tracking; error analysis; and process analysis and optimization. The largest number ofactivities at level 4 are in the measurement and process analysis and optimization areas. A fewactivities are located in the organizational category.
3-13

3. Measurement and the Software Engineering Institute Proces Maturity Level Structure
3.4.5 MK~suR~mwm AcrnvmEs R •umm AT MAruwff LEvEL 5
Figure 3-17 is a "fishbone" chart graphically depicting the CMM requirements for reaching maturitylevel 3. The major bones generally correspond to the critical measurement activities in Figure 3-9:measurement, project tracking, error analysis, and process analysis and optimization. At level 5, mostactivities fall into the organizational category with significant measurement activities only in the erroranalysis and the process analysis and optimization areas.
3.5 MEASUREMENT FOUNDATIONS FOR RAISING PROCESS MATURITY LEVEL
The CMM has expanded the detail of coverage in the 1987 SEI process maturity model. This ishighlighted next.
3.5.1 C~AAuxfrv MATuRrry MODEL KEY PRoCEss AREAS
The process maturity framework shown in "lble 3-1 was expanded in the SErs CMM (Paulk, Curtis, andChrissis 199128,40). ¶Thble 3-3 shows the 18 "key process areas" that organizations must have in place to quali-fy at each level of process maturity. Process areas in bold type are related to, or rely heavily on, measurementtechniques. The six key process areas at level 2 are shown in bold type to indicate that they have significantmeasurement-related components. Acronyms, shown at the right edge of the table, are used in this sectionas shorthand for the full name of a key process area. Key Process Areas in bold type aremeasurement-related. For example, "CM" represents "software configuration management."
"Ihble 3-3. Key Process Areas of the Software Engineering Institute Capability Maturity Model
Process Level Key Process Areas Acronym
5. Optimizing Prevent defects (DP)Manage process change (PC)Manage technology innovation (MI)
4. Managed Process measurement and analysis (PA)Management of quality (QM)
3. Defined Focus on organization process (PF)Define organization process (PD)Training programs (TP)Integrated software management (IM)Software product engineering (PE)Intergroup coordination (IC)Peer reviews (PR)
2. Repeatable Manage requirements (RM)Plan software projects (PP)Track and oversee software projects (PT)Manage software subcontracts (SM)Software quality assurance (SQA) (QA)Software configuration management (SCM) (CM)
3-14

3. Measurement and the Software Engineering Institute Proess Maturity Level Structure
3.5.2 MwASutmEwr FOUNDATIONS
Figure 3-9 graphically characterizes the critical measurement activities of each maturity level. Thespecific SEO maturity levels at which the activity is required are shown. For example, the activity"proj-ect estimating and tracking," emphasizes that tracking project size, schedule, and cost must begin atthe initial process level. It is required at level 2 and at all higher maturity levels. By level 3, emphasisof measurement functions shifts from project to process, where it remains through level 5. Systematicprocess change begins at level 3, and organizations check for potential reuse of their existing designsand code. By level 4, an expanded, managed, and controlled process metrics database is in place forprocess improvement across all projects.
You must begin measuring in order to reach level 2. Your organization can not wait until it has beenassessed at level 2 process to begin estimating, tracking, and collecting data on errors found in reviewsand inspections. These must be in place for an organization to be considered as level 2. Do not wait,start as soon as you can to put your measurement program into action.
Figure 3-9 shows how an effective measurement program begins with project estimating and tracking.A necessary foundation for level 2, it is also the essential foundation for all activities needed to man-age software projects at SEI levels 3 and above. For clarity, the descriptions begin at the bottomfunction, project estimating and tracking, and extend up.
" Project Estimating and Trhcking. These activities must be formally documented and in place atlevel 2 to ensure that the process is repeatable. The activities initially focus on estimates andmeasurements for project planning, managing requirements, tracking, and oversight. Theamount and nature of data collected will evolve at higher levels to include process measures as well.Included here are the lkble 3-3 key process areas RMI P, PT, and SM.
" Process Twc/•fi. 1b be assessable at level 3 as having a documented organization-standard process,you follow documented procedures to measure, track, and maintain profiles by key tasks of the proj-ect's defined software process. Included are key process areas TM, IC, PF, PD, TP, PR, and PE.
" ErrorAnalyuis. At level 4, the managed level, this function routinely uses the organization'sstandard software process as a basis for determining data to be collected, analyses to be per-formed, process and product metrics to be used in managing a project, and defining quantita-tive goals for product quality. Establish, measure, and track quantitative quality goals for softwareerrors found in reviews and inspections of requirements, design, code, and formal software tets.Compare projections to actuals, and analyze the design errors and the code and test errors.The emphasis is on measuring to verify that operations remain within measurable process lim-its and to continuously narrow the variations in process performance. Use results from analysesof process data to bring an organization's standard process under statistical control Flow the soft-ware product quality goals down to subcontractors. Monitor the performance baseline for the or-ganization's standard software process on a regular basis to identify areas that could benefit fromnew technology. Included are key process areas PA and QM.
" ProwwAnalysi mad OptimiAtion, (atkvels 4andS). At level 5, the optimizing level, continuingprocess improvement is institutionalized. Detailed quantitative process performance andtrend data is relied on for analyses of benefits, costs, and risks. The organization maintains a pro-cess database for process metrics across all projects and for coordinating defect prevention actionsacross the organization. Over time, it tracks the overall productivity and quality trends for each
3-15
3. Measurment and the Software Engeing Institute Process Maturity Level Structure
project, reporting the results to the project managers and senior management. Theorganization analyzes its standard software process to identify areas that need or could benefitfrom new technology, and incorporates appropriate new technologies into the organization'sstandard software process and the projects' defined software processes. It follows up by com-paring effects of implementing each process improvement to its defined goals; the organiza-tion uses results to identify needed changes to the process improvement process. Included arekey process areas DP, Tn and PC
3.6 MEASUREMENT SUPPORT
You should collect as much useful data as possible, but begin with at least the minimum data setdescribed in Sections 6 and 12. The minimum data set represents the smallest number of data itemsyou need to manage your software project and to characterize your process. Your minimum data setwill include the actual values of software size, cost (mainly effort, in labor hours), defect counts, andschedule. The minimum data set, adequate at the lower process maturity levels, is augmented progressivelyas required for the higher process maturity levels. At levels 3 and 4, your organization can add detailedprocess data elements developed using the GQM paradigm described in Section 6.3.
3.6.1 ExPE=RcE DATAwASES
Your measurement program should collect data from software projects and organize that data intoan experience database. The establishment and maintenance of an organization software experience data-base should be an activity conducted at the highest levels of the organization since many projects andorganizations will contribute information to it, and many organizations will want to use data from it.Software development, systems engineering, system test, quality engineering, configuration manage-ment, product support (logistics), and project management are among the organizations that will con-tribute to the database and will benefit from the software information it contains. Section 12 describesthe nature of the creation of a software experience database.
3.6.2 FEmBACK oF MKIImcs DATA
Metrics should be 'fed back' as quiddy as possible to serve as inpit to those persons having the authority totake appropriate actions to improve the process and the product. This feedback process is the essence ofdosed loop software process control (see Section 2) and, as shown in Figures 3-5 through 3-8, is required atSEI levels 3 to 5. The metrics data, indicating past perfomance in the organization's software experience data-base, should be fed back to improve present and future project perifrmance. The measurements from thedatabase can be used to develop metrics, that in turn can be used to not only evaluate the softwaredevelopment performance of the project from which they came, but also to establish estimationstandards and project control methods for better plans and proposals.
An essential element of closed loop software process control is to track and monitor ongoing softwaredevelopment projects. This feedback process is really a continuous quantitative management processof measuring the product and process, comparing those measurements and metrics with the goals andlimits set by the project plans, and taking corrective action when the performance falls outside the pre-set limits or fall short of the preset and/or project goals. See Section 2 for a detailed description of thequantitative management process.
3-16

3. Measurement and the Software Engineering Institute Process Maturity Level Structure
3.6.3 SOrfWARE MANAGEMENT INDICATORS AND METRICS FOR MATURITY - !.VEI 2 AMD 3
Thble 3-4 brings together in one place the measurement activities and metrics you need to reach highermaturity levels. To increase its usefulness, the primary key for the table is the question number of the1987 assessment questionnaire.
"* The measurement-related SEI assessment questions in pages 23 to 28 of Humphrey and Sweet(1987).
"* CMM key process area from Paulk, Curtis, and Chrissis (1991).
"* Process maturity level, where required.
"* Guidebook section number where it is described.
"* Management indicators and related metrics in this guidebook.
Table 3-4 includes only the requirements needed at levels 2 and 3 (with the exceptions of fourrequirements related to the corporate experience database, which is required at level 4). Ninetypercent of the requirements marked with asterisks on the 1987 questionnaire must be met.
Table 3-4. Process Maturity Level and Associated Metrics
SEI Metuics and Description
Requirement ProcessMatui-y Section* Indicator
1987 CMM Level Number Category Metrics Units
2.1.4 PT 2 11 N/A N/A Formal procedure ensuresperiodic managementreview
2.1.7 QA 2 11 N/A N/A Independent audits for eachstep of the softwaredevelopment process
2.1.140 PP 2 6 Size Current estimate or count New, reused, and totalKSLOC (or function points)
2.1.15* PP 2 8 Schedule Elapsed development time Elapsed months2.1.16* PP 2 7 Cost Cost to date LM or LH
Percent budget spent to date Donlars ($)Percent budget spent to date Percent LMPercent budget spent to date Percent LH
2.1.16" PP 2 11 Earned Overall proportion of See Section 11value software (in KSLOC
function points, etc.)complete
22.1 PT 2 7 Cost Cost to date LM or LHPercent budget spent to date Dollars ($), Percent LM, or
Percent LH11 Stability Authorized positions staffed Count people
Percent planned positions (Staffe4anned)100L _staffed to date
Section number in this guidebook.
3-17

3. Meaurement and the Software Enginecring Institute Proces Maturity Level Structure
Table 3-4, continued
SEE Metrics and Description
Requirement ProcessMaturity Section* Indicator
1987 CMM Level Number Category Metrics Units
2.2"2 PT 2 6 Size Current estimate or count New, reused, and totalKSLOC (or function points)KESLOC
Percent current estimate of (Current/initial)100original estimate
22.3* PD 3 10 Quality Number of defects per Defects or errors inKSLOC in preliminary design preliminary designreviews reviews/KSLOC (actual or
estimated KSLOC)
Number of defects per Defects or errors in detailedKSLOC in detailed design design reviews/SLOCreviews (actual or estimated
_______KSLOC)
26 4* PT 2 10 Quality Number of defects per Defects or errors in codeSKSLOC in code inspections inspections/ KSLOC (actual
or estimated KSLOC)
22.4* PT 2 10 Quality Predicted defects/KSLOC at Predicted defects/KSLOC at_ delivery delivery
2.15* PA 4 10 Quality Number of defects per Defects or errors projectedKSLOC (preliminary, and compared to actualsdetailed)
2.2.6* PA 4 10 Quality Number of defects per Defects or errors projectedI KSLOC in code inspections and compared to actuals
22-7 PT 2 11 Status Percent requirements (Requirementsdesigned designed/total
requirements)100Status Percent requirements coded (Requirements coded/total
requirements)100Status Percent measurement units (Units designed/total
(KSLOCM function points, units)100CSUs, or CSCs) designed todate
Status Percent measurement units (Units coded/total units) 100(KS=OC, function points,CSUs, or CSCs) coded(induding CSU test) to date
2.28 Pr 2 11 Status Percent requirements tested (Requirements tested/totalrequirements)100
Status Percent tests passed (Tests passed/total tests)100
Status Percent measurement units (Units tested/total units)100(KS=OC function points,CSUs, or CSCs) tested(induding CSC test) to date
•Section nmber in thi, guidebook.
3-18

3. Measurement and the Software Engineering Institute Process Maturity Level Structure
Table 3-4, continued
SEE Metrics and Description
Requirement ProcessMaturity Section* Indicator
1987 CMM Level Number Category Metrics Units
2.2.9 PFl 2 11 Status Percent measurement units (Units integrated/total(KSLOC, function points, units)100CSUs, CSCs, or CSCIs)integrated (including CSCItest)
2.2.10 PT 2 11 Computer Proportion of memory CPU =4dAPU available orresources utilization (words, bytes, mass storage used/mass
characters, or bits) storage available
2.2.11 PT 2 11 Computer Ikrget CPU processmg speed (Ilbrget mips/host mips) xresources (for standard functions) (function size in mips/ost
processing second)estimated target mips forstandard function
2.212 FI' 2 11 Computer Proportion of software 1/) (Message length)(anrivalresources capacity used rate)/(processing speed)
2.2.13" QM 4 10 Quality Number of defects per Defects or errors inKSLOC in PDRs PDR1KSLOC (actual or
estimated KSLOC)
Number of defects per Defects or errors in detailedKSLOC in detailed design desg reviewslOC (usereviews actual or estimated
2.2.14" QM 4 10 Quality N/A Test coverage is measuredand recorded for each phaseof functional testing
2.2.15* PR 3 10 Quality Number of defects per Defects or errors inKSIOC in PDRs PDRs/KSLOC (actual or
estimated KSLOC)
Number of defects per Defects or errors in detailedKSLOC in detailed design design reviews/KSOC (usereviews actual or estimated
_ KSLOC)
2=16 FP 2 11 Stability Number of SAIs Count SAIsStability Percent SAIs dosed to date (SAIs dosed/total SAIs)100
2.-16 FP 2 11 Quality Number (valid) FIRs Countto date
Quality Percent FMRs dosed to date (FMRs dosed/total
2.16 PT 2 11 Quality P tKSoc in CSC test l'Rs,/mLoc
"2.2-16 Pr 2 11 Quality PTRs/KSLoc in system test FI'*dsLC
* Section number in this guideboo
3-19
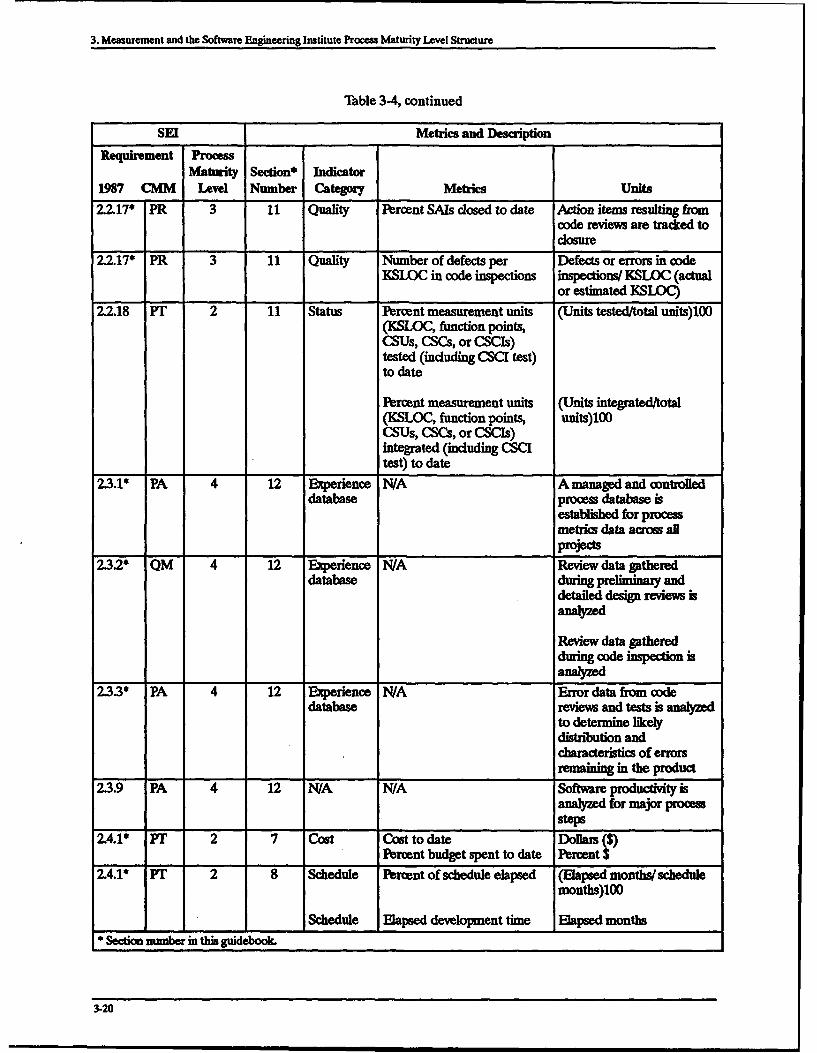
3. Measurement and the Software Engineering Institute Process Maturity Level Structure
Table 3-4, continued
SEI Metrics and Description
Requirement ProcessMaturity Section* Indicator
1987 CMM Level Number Category Metrics Units
2.2.17* PR 3 11 Quality Percent SAIs dosed to date Action items resulting fromcode reviews are tracked todosure
22.17* PR 3 11 Quality Number of defects per Defects or errors in codeKSLOC in code inspections inspections/ KSLAC (actual
or estimated KSLOC)22.18 PT 2 11 Status Percent measurement units (Units tested/total units)100
(KSLOC, function points,CSUs, CSCs, or CSCls)tested (including CSCI test)to date
Percent measurement units (Units integratedftotal(KSLOC, function points, units)100CSUs, CSCs, or CSCIs)integrated (including CSCItest) to date
23.1* PA 4 12 Experience N/A A managed and controlleddatabase process database is
established for processmetrics data acrs allproe
232* QM 4 12 Experience N/A Review data gathereddatabase during preliminary and
detailed design reviews is
Review data gatheredduring code inspection isanalybd
23.3* PA 4 12 Experience N/A Error data from codedatabase reviews and tests is analyzed
to determine likelydistribution andcharacteristics of errorsremaining in the product
23.9 PA 4 12 N/A N/A Software productivity isanalyzed for major processsteps
2.4.1" PT 2 7 Cost Cost to date Dollas (S)1 1 Percent budget spent to date Percent $
2.4.1* Fr 2 8 Schedule Percent of schedule elapsed (Elapsed months/schedulemonths)100
Schedule Elapsed development time Elapsed months
* Section number in this guidebook.
3-20

3. Measurement and the Software Engineering Institute Process Maturity Level Structure
Thble 3-4, continued
SEI Metrics and Description
Requirement ProcessMaturity Section* Indicator
1987 CMM Level Number Category Metrics Units
2.4.1* PT 2 11 Product Overall proportion of Product completioncompletion software (in KSLOC,
function points, etc.)complete
2.4.7" PP 2 8,11 Schedule Elapsed development time Elapsed months
2.4.7* PP 2 7,11 Cost Cost to date DollarsPercent budget spent to date Percent
2.4.7* PP 2 11 Product Overall proportion of Product completioncompletion software (in KSLOC, See Section 11
function points, etc.)complete
2.4.8 PE 3 11 Status Percent tests passed (rests passed/total tests)100
2.4.9* CM 2 11 Stability ECPs Count ECPs
2.4.9* CM 2 11 Stability Percent requirements (Requirements to beundefined defined/otal
requirements)100
2.4.11 PE 11 Status Percent tests passed (Tests passed/total tests)100
2.4.12" PR 3 10,11 Quality Number of defects per Defects or errors inKSLOC in PDRs PDRE/KSLOC (actual or
estimated KSLOC)
Number of defects per Defects or errors in detailedKSLOC in detailed design design reviewu/KSLOCreviews (actual or estimated
______KSLOC)
2.4.12* PR 3 10,11 Quality Number of defects per Defects or errors inKSLOC in PDRs PDRs/KSLOC (actual or
estimated KSLOG
2.4.12* PR 3 10 N/A N/A Internal software designreviews are conducted
2.4.15 PD 3 11 N/A N/A Formal records aremaintained of unit (module)development progress
2.4.16" PR 3 10 N/A N/A Software code reviews are
conducted
2.4.16' PR 3 10 Quality Number of defects per Defects or errors in codeKSLOC in code inspections inspectiom/ KSLOC (actual
or estimated KSLOC)
Section number in this guidebooL
3-21
3. Measurement and the Software Engineering Institute Process Maturity Level Structure
3.7 HOW TO ORGANIZE FOR MEASUREMENT
This section describes measurement functions and several alternative organizational arrangementsfor implementing those functions. Rifkin and Cox (1991) give additional detail on the characteristicsof successful metrics programs and organizations.
The organizational measurement program grows from the CMM requirement for a definedorganization-standard software process. Awritten policy is required to define both the organization'sstandard software process and the use of tailored versions by software projects.
3.7.1 BENEFrrs Tro Tm ORGAmZAION
A measurement program, regardless of size and form, exists to support management (both senior and projectmanagement) and to aid in improving the organization's software process. The major software developmentfunctions supported by the measurement program include proposal development and analysis, project man-agement and control, management of the software experience database, and software process and productimprovement. Benefits to the organization of a formal measurement activity include:
"* Improved ability to meet software commitments for costs, quality, and schedule.
" Demonstrated ability to stabilize then to systematically improve the organization's standardsoftware development process. The standard process is tailored to fit the needs of individualprojects, customers, and end users.
"* More effective use of the organization's software experience.
A vital activity of the measurement function to establish and maintain an organization-standardsoftware project database. Software projects produce software experience data of great potential val-ue to the organization, when data elements are defined in organization-standard terms and stored inconsistent formats. That data, the essence of an organization's software development experience, isa valuable corporate asset usable to great advantage by subsequent software development projects.
3.7.2 FuNCTIONS oF AN ORGANIZATION-STANDARD MEASUREMENT PROGRAM
Establishing a systematic measurement program in an organization requires coordinating activitiesperformed by several functions: labor accounting, finance, configuration management, quality assur-ance, and software project management. This coordination may need to be implemented on severallevels: site, division, and corporate. The measurement program begins by providing a minimum setof project control information. The program evolves, both as the organization's SEI process maturitylevel rises, and in response to increasing demands for information by projects and by the maturingdevelopment organization.
The measurement program objective is to support the development organization in:
"* Proposal development and analysis.
"* Project control (planning, tracking and monitoring).
"• Process improvement (greater predictability, lower cost, and higher quality).
3-22
3. Measurement and the Software Engineering Institute Process Maturity Levil Structure
Development of experience data for future use in estimating.
At any level of maturity, a measurement program is a set of activities that:
"• Quantitatively characterizes the software project and process.
"* Supports project control and process improvement.
3.7.2.1 Support for Proposal Development
Software development projects typically begin with proposals which must include cost and scheduleestimates. The measurement function assists the program office in developing proposals by providingconsistent organization-standard estimates of most probable software size, cost, and schedule and byproviding risk estimates for technical, cost, and schedule.
The measurement function may develop estimates in parallel with the software developmentorganization or be the sole estimating agency. The objectives of an estimate made by the measurementfunction are to show the most probable actual cost, not to dictate proposal price, and to indicate therisk of the organization's exceeding a proposed cost. Many techniques for estimating these criticalsystem characteristics are described in Sections 7, 8, and 9.
3.7.2.2 Support for Setting Quantified Goals
The measurement function can assist project management in setting quantifiable, measurable andtestable goals for the development process. Some of these goals become the targets or "plan" againstwhich actual accomplishment will be compared. See Section 5 on setting quantifiable, testable, goals.
3.7.2.3 Support for Analyzing Subcontractor Proposals
Subcontractor proposal analysis is closely related to proposal development. The same models andtechniques are used to verify subcontractor estimates that are used if the development organizationwere performing the work itself. These "should cost" estimates can then be compared to subcontrac-tor proposals to determine their credibility. The measurement organization can then support theprogram office during negotiation of subcontracts by indicating questionable items in the proposal.
3.7.2.4 Support for Ongoing Projects-In-Process Tracking and Monitoring
Measurement support of ongoing projects mainly involves tracking and monitoring. The status of aproject is measured at pre-planned points and is compared with project goals for product size, cost,schedule, quality and earned value.
Organizing and anlyzing measurement data involves calulating derived metrics and comparing those metricsto those planned. By using the cost and schedule models developed for the proposal plus a model to predictand control software product quality, the analyst can determine the proportion of the project work that hasbeen completed and forecast the size, cost, schedule, and quality at project completion. This E=C, and numer-ous other management indicators, can be derived from analsis of measurement data. Section 11 dscssestrkkdng and monitoring in detail, and provides examples of management indicators.
3.7.2M Support for Corrective Action
A measurement analyst will be deeply involved in collecting and analyzing measurement data toprovide management indicators during the performance of a project assessment. As a result, the
3-23
3. Measurement and the Software Engineering Institute Process Maturity Level Structure
analyst is often in an ideal position to recommend actions to avoid or correct problems that canpotentially throw the project out of control. The measurement data provides quantifiable informationto use as a basis for management decision-making.
3.7.2.6 Software Development Process Improvement
As a software development organization progresses from the initial toward the more advanced SEI processmaturity levels, the focus widens beyond assessment of the software products yielded by the process to indudeanalysis of the functioning of the process itself. The software process itself becomes the subject of systematicimprovement efforts that will lower cost and shorten the schedule while achieving higher quality.
3.7.3 IMPMMNTING A PROJECT MEASuU iRE PROGRAM
The following actions are needed to implement an organization-wide measurement program.
3.7.3.1 Getting Started on a Systematic Measurement Program
You must first demonstrate to management that improving maturity levels and continual processimprovement make good business sense in today's business climate. The benefits of a formal measure-ment activity, as a key practice for improving the software development process, will then be evident.The development environment must support a goal-oriented measurement program, and the mea-surement function must provide project tracking and monitoring methods to support management'sneed to know project status, i.e., to control the project. When these conditions are present, manage-ment will support the need to invest in a measurement program. It will be clear that the investmentcosts for the measurement program will be recouped through the cost savings effected by the improvedprocess.
You should identify a "champion" of measurement, a person convinced of the business and technicalbenefits the organization will obtain from a measurement and metrics program. This person will sellthose benefits to the organization. Widespread recognition of benefits to all levels of management isnecessary, as is a risk aversion plan to ensure that the benefits are realized. Managers must first beconvinced of the net benefits of the software measurement program. Management support is obtainedmost easily when the need to attain higher CMM levels has been recognized, and in environmentswhich already have an institutionalized belief in quantitative management.
3.7.3.2 Setting Objectives for a Measurement Program
The following excellent advice about organizing a measurement program is found in Fenton (1991,112-113). This guidebook endorses and uses these organizational principles for measurement.
Every measurement program, no matter what scale is envisaged, must have very dearly stated objectivesand goals.
No matter how humble or grand the objectives for a measurement program, it will only be taken serious-ly if the right people are given responsibility for it.
The ideal way of implementing a measurement program is to establish a small independent team ofhighly motivated personnel. This metrics team should have responsibility for all measurementactivities.
"3-24

3. Measurement and the Software Engineering Institute Process Maturity Level Structure
You should begin by developing your measurement program plan. This plan must define objectivesfor the program, considering the strategic needs of the organization as well as the known needs of cus-tomers, and end users. Begin with the minimum data set in Section 6, to identify measures and metricsthat meet the needs of the organization, customers, and end users. Then, use the GQM paradigm (Sec-tion 6) to expand the set of data to be collected, as required by your organization's business and techni-cal needs. A representative set of metrics that you may use to capture project size, cost, schedule,quality, and environmental factors is given in the same section. Metrics chosen to meet goals for a proj-ect are often included in the organization's standard metrics. When nonstandard metrics are required,define and add them to the standards.
3.7.3.3 Essentials for Early Action
You should quickly take several essential actions:
" Specify, describe, and document every organization-standard measure and metric, to avoidambiguity of interpretation among various projects and users. People will use the metrics asthe bases for project tracking and control, and for development and analysis of proposals.
" Document procedures for collecting measurement data and for using the data. Proceduresshould identify where and when to acquire the data, how to validate and analyze it, and howto use the data. Illustrate with models and formats of the spreadsheets to be used. Describeprocedures for calculating average unit size, cost and quality by project phase, and update fre-quency, for use in customizing estimation models. Later, document all additional functionsof the measurement program as they are identified. Include how and when to make anindependent assessment of a project, with the format of the report to present the findings.
" Develop a basic toolset for the measurement program. It facilitates collection of measurementdata, conversion to metrics, and presentation of the results in ways that help take correctiveactions. The toolset may include:
- Estimate models (such as COCOMO, calibrated for the organization's process). Overtime, as they estimate more accurately the actual performance of the developmentprocess, these become the most significant tools in the set.
- Analysis spreadsheets and report formats, to use measurement data easily and consistently.
- Computer programs that implement standard code counting rules.
- CASE tools provide a wealth of measurement data on the requirements, design andcode for both the data and the process sides of the software system. Other softwaretools, for use where manual data collection is impractical or impossible, can be builtto automatically collect data such as: computer time used during development; pagesof documentation; or number of test procedure steps implemented.
- Organization-specific estimating ratios and rules of thumb.
"* Establish procedures for data entry, validation, deletion, modification and retrieval to preventcorruption of the data. The more standardized the data, the less it will have to be adjusted for analysis.
3-25
3. Measurement and the Software Engineering Institute Process Maturity Level Structure
3.7.4 BEGINNING TO MFASUR A PROjECr
The measurement program will have obtained from organization management the business objectivesto be met by all projects, and will have verified the likelihood that the program will yield benefits inmeasurable business terms. Once a measurement program has been established and is operating inan organization, it is only necessary to define the set of measurement activities required bymanagement for a particular project. The following steps are guidelines for doing this:
"* Develop a plan for implementing all measurement related activities.
The first action is always to document a plan that specifies the measurement support to beprovided for the project. For the simplest case, the measurement plan may be simply a memo-randum of understanding. The purpose of the document is to communicate to the project man-agement, details of the support to be provided by the measurement function. The plancontains the following information:
"* Identify the metrics to be used for the project.
Identification of project metrics should begin with the minimum data set in Section 6, whichcovers project size, cost, schedule, quality and environmental factors. In adding to this mini-mum data set, the GQM paradigm helps guide the project management in identifying thosekey factors that are most critical to the success of the project. These factors, which need to be trackedclosely, may be both technical and process oriented. The resulting project goals will lead to a set ofsub-goals which include project specific and facility wide goals. Metrics chosen to indicate satisfactionof the goals will usually, but not necessarily, be among the facility's standard metrics. If non-standardmetrics are required, they should be defined and added to the standards.
"* Identify measurement support needed for proposal, subcontract, and negotiations.
The plan should include all support to software development during the proposal phase.Measurement can provide estimates of size, cost and schedule. Project management may electto subcontract parts of the project or team with another contractor. Measurement can provide"should cost" analysis of the resulting proposals. Measurement can also support negotiationsby indicating questionable proposal items and providing dynamic recalculation of costsreflecting alternative proposals occurring during negotiations.
"* Identify the support that measurement will provide to the project.
Deriving management indicators several times during the project development cycleconstitutes tracking and monitoring, or stated in another way, project assessments. A projectassessment typically provides size, cost, schedule and quality information at a point in time,plus earned value and an ETC. The assessment can also provide early warning of potentialproblems indicated by the values of the project indicators and, in many instances, recommenda course of action to avoid or mitigate the effect of the problem. When a project assessmentis performed during development, it is an effective tool for project control.
Some development organizations will want to save the data collected at each projectassessment but, at a minimum, the final data from a project should be saved. The saved datashould compare the management indicators to the planned values and indicate variances. This
3-26

3. Measurement and the Software Enginering Institute Prooess Maturity Level Structure
is the beginning of statistical process control. Measurement can also provide early warning ofpotential problems indicated by the statistical controls and in many instances, recommend acourse of action to avoid or mitigate the effect of the problem.
Develop a Final Report.
A final report should be developed at the completion of each software project. The final reportis oriented toward both the project and the facility measurement program. Effectively, it isanother assessment of the project "actuals" without the necessity for estimation. It is used asthe basis of the final project experience data collection. The final data is the most critical datafrom the project. It must be carefully organized and stored in the measurement program data-base. The measurement analyst can "bridge" back to the original project proposal estimateand allowing for all changes to the original requirements, to assess the accuracy of the originalproposal estimates.
3.7.5 M&4suREmm ORGANIZATnONAL MODELS
A single person can comprise the entire measurement function when first established. Later, it canbe a distinct group, depending on the needs of the enterprise. Alternatively, measurement activitiescan be performed by a number ofgroups and/or individuals in different parts of the development orga-nization. However, the measurement function must be budgeted separately to ensure that resourceswill be focused on this important area and so that the measurement costs themselves can be measured.The measurement function should also have the responsibility for training the software organizationin measurement techniques.
The effectiveness of the measurement function depends to some extent on its organizational position.The resources that measurement can use and the constraints under which it operates are closely re-lated to the organizational unit of which it is a part and to the organizational units it deals with. Thissection shows four of the many possible organizational alternatives. For your organization, you shouldchoose or invent a model that is compatible with the mission of its measurement function.
SEPG does not appear as a named organization in Fgures 3-10 through 3-13 because this organization ismostly a consumer and not a generator of measurement and metrics information. Many organizations andfunctions ue or "consume" measurement information, and they all play vital roles in software development.But the organizationl diagrams shown here were intended to show the active role of generating measurementand metrics data. The contribution of the SEPG is primary to improving the software process and advancingthe organizatko's maturity level. But its measurement activities are, in most cases, limited. Measurement, fi-nance, confguration measurement, quality assurance, and software development are generators as well ascowwners of measurement data and metrics.
3.7.5.1 Measurement Function Under Project Control in a Project Environment
Figure 3-10 shows a software organization in which each software development project is an independentorganization unto itself, in which the measurement function is confined to that project only, and inwhich each project maintains its own measurement database. This is a typical measurement functionin a level 1 organization. In this organization model, it is very difficult to share measurement dataamong projects, or to establish overall software standards. There is no common software databaseshared by the projects in the organization. It is difficult for new projects to profit from the experienceof concurrent or previous projects.
3-27
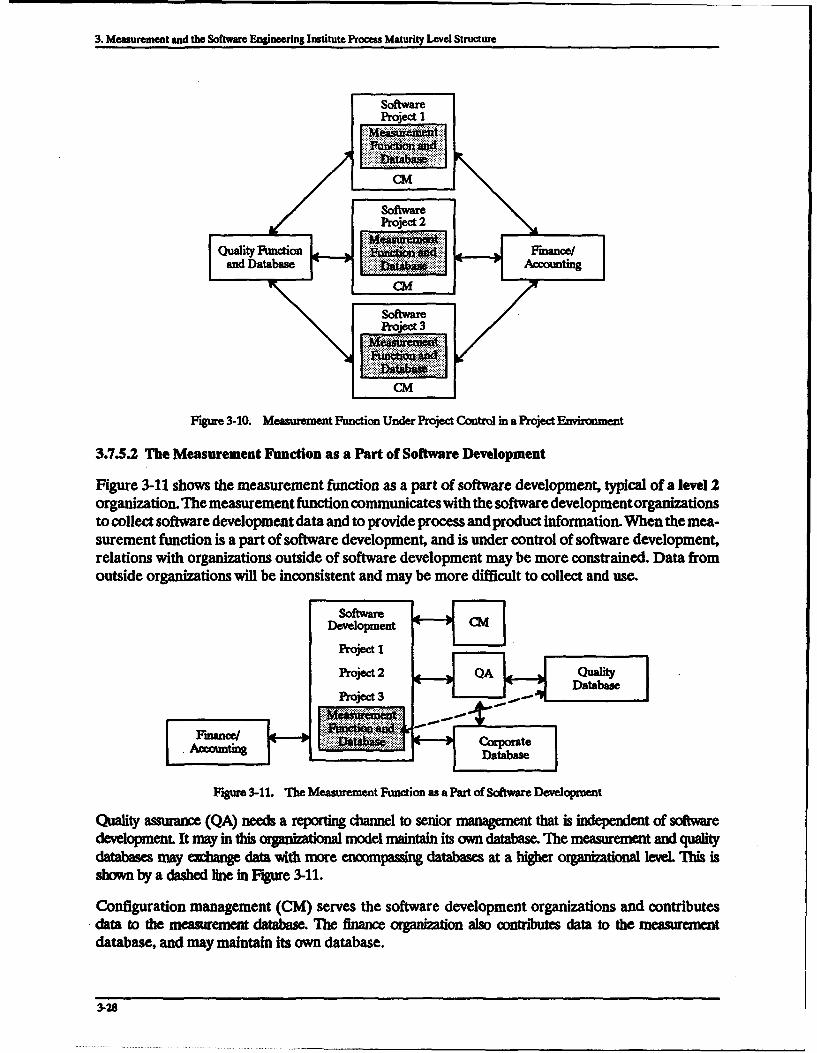
3. Measurement and the Software Engineering Institute Process Maturity Level Structure
SoftwareSProject I
Figure 3-10. Mea et F n Under Project ont i a Projct Et
3.7.5.2 The Measurement Function as a Part of Software Development
Figure 3-11 shows the measurement function as a part of software development, typical of a ievel 2organization. The measurement function communicates with the software development organizationsto collect software development data and to provide process and product information. When the mea-surement function is a part of software development, and is under control of software development,
relations with organizations outside of software development may be more constrained. Data fromoutside organizations will be inconsistent and may be more difficult to collect and use.
Development CM]Project I
DatabaseProjec~t 3
•Database
Figure 3-11. The Measurement Function as a Part of Sofware Development
Quality asurn (QA) needs a reporting diannel to senior management that is independent of softwaredevelopment. It may in this organbational model maintain its own database. The measurement and qualitydatabases may emhng data with more encompassing databases at a higher organizational level This isshown by a dashed line in Fgure 3-11.
Configuration management (CM) serves the software development organizations and contributesdata to the measurement databaW . The finance organization also contributes data to the measrementdatabase, and may maintain its own database.
3-28
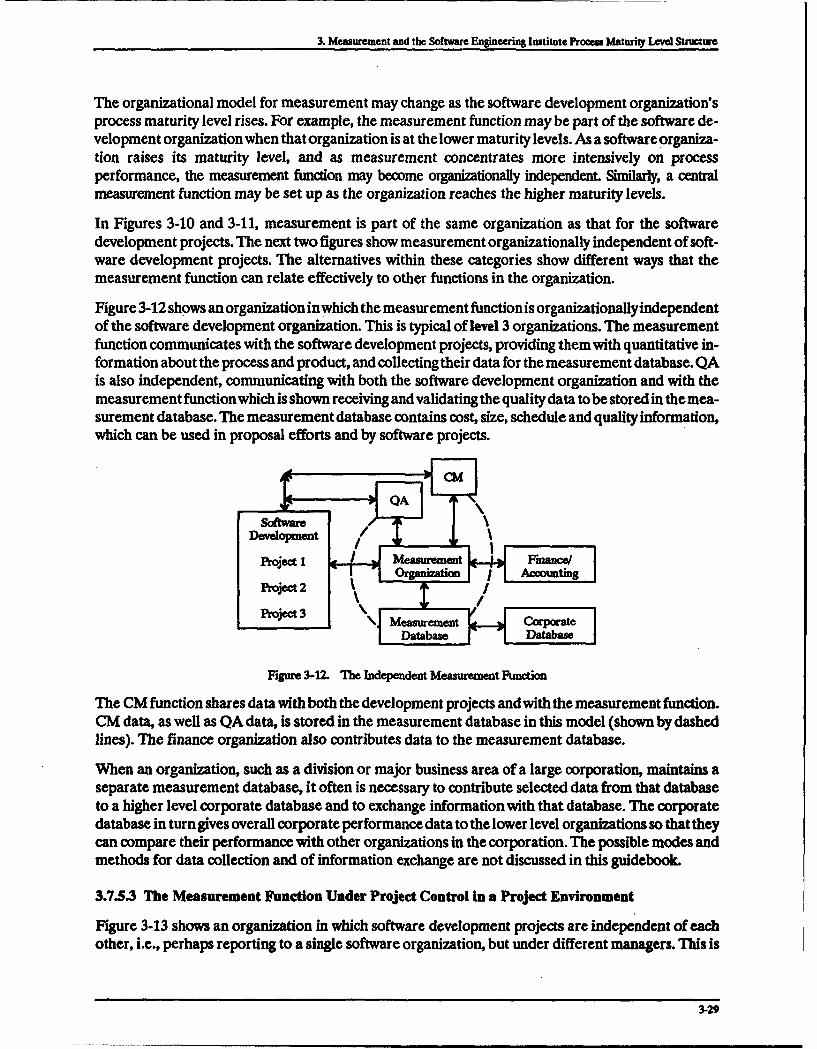
3. Measurement and the Software Engineering Institute Proce Maturity Level Structure
The organizational model for measurement may change as the software development organization'sprocess maturity level rises. For example, the measurement function may be part of the software de-velopment organization when that organization is at the lower maturity levels. As a software organiza-tion raises its maturity level, and as measurement concentrates more intensively on processperformance, the measurement function may become organizationally independent. Similarly, a centralmeasurement function may be set up as the organization reaches the higher maturity levels.
In Figures 3-10 and 3-11, measurement is part of the same organization as that for the softwaredevelopment projects. The next two figures show measurement organizationally independent of soft-ware development projects. The alternatives within these categories show different ways that themeasurement function can relate effectively to other functions in the organization.
Figure 3-12 shows an organization in which the measurement function is organizationallyindependentof the software development organization. This is typical of level 3 organizations. The measurementfunction communicates with the software development projects, providing them with quantitative in-formation about the process and product, and collecting their data for the measurement database. QAis also independent, communicating with both the software development organization and with themeasurement function which is shown receiving and validating the quality data to be stored in the mea-surement database. The measurement database contains cost, size, schedule and quality information,which can be used in proposal efforts and by software projects.
software /Developoment=• =
Maabs Database
Figure 3-12. The Independent Measurement Funetion
The CM function shares data with both the development projects and with the measurement function.CM data, as well as QA data, is stored in the measurement database in this model (shown by dashedlines). The finance organization also contributes data to the measurement database.
When an organization, such as a division or major business area of a large corporation, maintains aseparate measurement database, it often is necessary to contribute selected data from that databaseto a higher level corporate database and to exchange information with that database. The corporatedatabase in turn gives overall corporate performance data to the lower level organizations so that theycan compare their performance with other organizations in the corporation. The possible modes andmethods for data collection and of information exchange are not discussed in this guidebook.
3.7.5.3 The Measurement Function Under Project Control in a Project Environment
Figure 3-13 shows an organization in which software development projects are independent of eachother, i.e., perhaps reporting to a single software organization, but under different managers. This is
3-29

3. Measurement and the Software Engineering Institute Process Maturity Level Structure
typical of a level 4 organization. The measurement function deals separately with each softwareproject to coordinate collection, validation, and dissemination of experience data. The measurementfunction in this model maintains the measurement database.Through the database, the measurementfunctions becomes the unifying measurement force for the enterprise, communicating data and meth-ods to all of the projects and making significant contributions to establishment of software standardsand to improvement of process and product.
Both measurement and quality assurance communicate with each project independently and each groupmaintains their own database. The model in Figure 3-13 shows quality and measurement maintaining separatedatabases. Alternatively, there can be one common measurement database containing size, cost, schedule, andquality data. These databases could communicate with a corporate database (not shown here).
Sotaet 1 Cm Finanoe/Project___ 1Accounting
Database Prjc 3 Dtbs
Figure 3-13. Measurment in a Project Environment
3.8 SUMMARY
This section is intended to help your organization improve its internal process for developing software. Itdescribed the SEI CMM, demonstrated that effective measurement is essential in successf implementationof a maturity growth program, shown how to practice software measurement so as to improve the level ofboth process and capability maturity, and given organizational guidelines for an effective measurementprogramL
3-30

Requ~irements Management; Projec Planning; --------- __
Project Estimating F ý Project Ikackng J lSenior mngemetrvn lcommns Work to be subcontracted is del
Allocated requirements are documented in made estewmal to the organization. Approved pandconsistent format and are dearly stated, changes to software commitments are explicitly and subcontractor is stverifiabie and testable. RM- 1 comm~funicated to sftware egineering based on documented yrocedur
P_4 nd sftwae-reatedContraictual agreement betSoftware Engineering Group reviews and Identify/define a software life cycle model subcontractor establishes t~
Changes to allocated requirements are P-6 attiviti is used formutracking sotware.pT used for tracking soft,
approprivately andewe aonuiatn status.n status
incoporaed ito sftwre efort. RM 4 Qianseand oth
Software Engineering Group participates actively Estimates for size, resources, costs, schedule,in oeral prjec planin, frm poposl tamand Arisks, are derived and tracked according
engineering facilities, environiments, and Actual measured data and replanning; data sauSupport tooIls Controlled project baseline ar trcked throughout life of T-1O 111112products and process specifications an Software engineering staff and managers hs
ietfePP- 14 conduct regular reviews to imsk technicalprogress, plans, performance, iasm agans Pr"
Software planning data are recorded software development plan. Formal revine e,
A documentedSCM are impkc
None at level 2 None at level 2 prjc'S life cySdplan is us
SCd activities.
Documented procedure is followeconduct, report results fram andtsoftware baseline audits.
Standard reports documenting SCM activitie.and the contents of the software baseline arecreated and distributed to affected groupsand individuals. CM- Iti,
Fie nlssPro~cess Aalyrsis Ognzto
Figure 3-14. Fishbone Chart for Attaining Process

3. Measurement and the Software Engineering Institute Process Maturity Level Structure
SCMSQ4 nd.Subcontract:Ma ,raement
Organizational
An SQA plan is prepared for each software projectto be subcontracted is defined and according to a documented procedure, and the
and subcontractor is selected, SQA activities are performed in accordancedocumented dures. SM-I 2 A-I/2 with the plan.
:ontractual agreement between prime and SQA group participate in preparation, review, and approval ofubcontractor establishes basis for managing project's software development plan, process specifications,
orct. SM- standards, and procedures. SQA group reviews and audits
A dcumnte ad aproed byprime QA-3/4 software engieering activities to ensure pomcomplianeA documented and approved (by prime) - - -""
subcontra ctor's software devel op et plan is
soe tplan ie s SQA group reviews representative samples of sftware productsused for tracking software activities andcommunicatr using stare av s M-4 5 to ensure compliance with designated process requirements. SQA
group regularly reports results of its reviews and audits to softwareChanges to subcontracted scope ofwork, engineering staff and managers. Deviations identified in softwareand other commitments, are resolved engineering activities are documented and handled according toaccording to a documented commitment A-S a documented procedur
S SM - I
SM 6 SQA group conducts regular reviews of its activities andPrime contractor's management conducts r~egular A- findings with customer's SQA personnel.
-_g data status/coordination riewa with ctor's Prime'sQAandSCM groupsmonitor subcontractor's WAct . management. Periodc technical reviews are heid~with and CM activities, according to a documented procedure.
r and managers the subcontractor. Formal reviews are conducted at Prime conducts acceptance testing as part of delivery of) trck technical selected milestones and completion of selected stages. poc according to a
Prime reviews stibcontractce's performance periodically; SM-10/12 documented rocedurea. Formal reviews evalution is reviewed with the subcontractor.
-1SM-7/9.\13
A documented SCM plan exists- Diff~erent levels ofSCM are implemented, as apropriate, duringproject's life cycle. A documented, approved A CM library system is established as a repositorySCM plan is used as basis for performing for software baselines. Software engineering products andSCM activities. CM-I process specifications to be placed
.CM-4/5 under CM are identified.anted procedure is followed to prepare for.Sreport results from, and track action Documented procedures are followed to: initiate, record, review,e baseline audits. CM-I approve, and track change requests and trouble reports for all
configuration items; control changes to configuration items; create andocumeCting SCM activities control release of software baseline products; and record statusf the software baseline are CM-6/- of configation items and change requests.uted to affected groups
hart for Attaining Process Maturity Level 2
3-31

3. Measurinm=I and the -Sohtware *kngweecnng Inawuluc haces Maturity Lcvel btructure
Measurement Project Mrad~iag
Trainuing for organization's and
A documented plan is used to communicate Ew i cor deieaops arnd
inegopcommitments and coordinate and
Management of software project is based Software project is reviewed periodically toan od e t
'npias defined software grcs.IM-3 deternmin actions needed to bring projects raitos
Software process database for the ranatoispfrm ceinto line with current and prjctdm revisedp
used for software planning and estimlating ac- nedofbsp cutmraded-e.IM I cmno
cording to a documented poeue. M-5 Inemeit products andeeopd V wied pctoA documnented procedure is used to govern project's documented, and verified, according to theanusdtquantitative management of. Size, resources, costs project's defined software process, for. softwarel
schedule.rs; and critical depedencies. IM-/110 requiremenfts design, code. test, foormmal system ~ ktesting, and aePtaCe testing Ta
Software engineering group actively paripates i [Also ensures traceabiltl PE-3 e
conro ofam noirmens iggudtoPE-2 Consistency is maintained across software
SEPG and other project engineering grups actively allocated requirements, software requirements,participate with customer and end-users to establish specification, software design, code, test plas,
hedmld h tas leaders of nRoie &rMMe
2Software process is assessed periodically~and action plans
/0W e eelmmdto address the assessment findina PF-
Peerreviws re pannd, dcumnted an perormd Owza fonlflows documented and approved plan to coordinateaccoodisofwar toadcuetdPrcd-eP- PD-3
Coordinate at erairtonlve the wse of softwarN pom database for SotaelfData on defects identified in peer reviews and system tj . *"'sr anSoftwaacirtesfr einn Ptesting of soft*= are collected and analyzed the UWIMt-2 a the umtin'sadpjcs frdfln 4i h
acomding to a documlented e. E-3 sNew in we inov saftware pom PF-3 library of sfNwtechnologies inlimited us nteorganization are monitored,g PD-st tb=Z
Information an conduct and results of peer evaluated, and where appropriate, implemented in other partsreviews is recorde in an organizational of the oraization. PF- Org anization's software po
dtbs.PR-3 Groups involved in implementing softare processes participate in, documented procedure Planand are informed of, activities for definition and improvement PD-7/ Prcsast~ lan is
ofth sftar pn&PF-7 reviews changes to all projects' dOrganization develops and maintains a repository of that conflict with, or would improve og
softm poces aset fo weby gk=PD- I S A- sotare poes
Procenlyisss Analysishaber~nand Optimization id, I
Figure 3-15. Fishbone Q~art for Attainin
3-32

Organizational
r ornzdP n njcsftwr Ec project sdefined software process is developed by tailoringthe orgmnization's standard software process according to organizational
yoJOIdevelops mnd taintam-;- a trainin pla1 2 idelines and criteria: and revised accordin to a documentedtinmg its training needs. Where appraqviate, Appropriate state-of practc software engineering tools and methods arejinsg courses are developed, smaitained, PE- 1 integrted with mect's defined software poesand software life cle.mid conducted at proetelo. P- 1 5 Software project is staffed, trained, and managed to fuill the special
Organization's training plan is developed IM4neso h yedadisdfndsfwr OS
&W rvisd peiodcall. acordng o aRepresentatives of SEPG work with representatives of other projectdocumntedp~edue, T 2/3engneering goup to monitor and coordinate project level
Vihverproedre or equre trinig i ~IC-2 technical activities and resolve -ridlevel technical issues.
yatet
sol ivr proceds, fohequredaporae training sessabiosh frenivdul
an usee to' actividetiyesoothermotide wetperienc Ciia dpnees wilrnoc e midntaifih ytm srveed and approved b
-w rPrinn ors1T - Pro ucsprdue as- c pus tom oter end ec and r aotupss
w a a n i n t e c h a n es o e a r e m a en a ir ds a of ra i in g a rt a n a ndon s d b
nofplans argams ti=' standard proess andrgou softwar processn databasecueteeotatd
softare idal IC-6~' sofiftwarecl RVWtotespnrigmaaPD- prn6 WeeAporitbkn e& orendividels ar
twer Softreme Ii. l Coe) thtaeapoe o s ypoetsLira y sfwre tioed t speiiatons previonsiblytdevelopedto-te-o
codeb triest ina thel bento ise esabise andat andd
ato'sowaep actiitets are revied aoutrdeing incswl rnna h ytm srtewdadaprvdbte rcdr.Plan lage efot toann weeopIeithi soa re m .T - E 9 cstmr n sran ytmm msm
wsangedt kalprcts'p deied softwre s poesses gar antiedadusdb
,r woldn ipveognzton'gsandztossandadpoesansotresnr adtbs,3
Jinate 11-01-0 ~ofrganization'ssfwrepomkenllr
Libriart f ~orttainin proemss M iatuity L revel sl 3eeoe

F ý Measurement Project MraddingOr
A docusnaited and approved software quality planafor the project is the basis for the project'sactivities for software qualit mans met. \M-2
A documented and approved plan is used as the basisfor organization's and projects' activties for processmeasurement and alyi. PA\-1
Organization's standard software process is the basis Poetdfor selecting data to be collected and analyses tob Pqojecty d
PA- qualitProcess and product metrics are identified based oc:n theirusefulness to the organization and projects. PA-3 Alteri
Process and product data are collected according meetwto a documented procedhte PA-\4 Quantitative quality goals are established-I
and tracked for. software requirements;Quatittiv prduc qulit pas w dM-3e saltware desig, software code; and for
Quniaiepomquality g0osh are Quality of the ro4'3 products arecompar~ed againt the product's quality
Software product quality goash flow goals on a regular basis. QM-14down to subcontractors. MA-5
Level3
Analysis of selected proces dataaocordin2 tora documented vyrom
Results from the process data analyses are used to brinithe organization's standard software process and its crit
PomAayis onyat level 4 suprceseuder stati~tical proess control. PA-6
Proess performance baseline for the organization'sstandard software process is monitored on a regularbasis and updated as appropriate. PA-7 M
Results of measurement and analysis activities are monitored 4PA-9on a regular basis and appropriate adjustments are madeto keep process performance baseline in line with
e7i PA-8
Erro AnaysisProcess AnalysisF - ErorAnalsisand Optimization
Figure 3.16. Fishbone Chart for Attaining Proceý

3. Measurement and the Softwar Eimneminit Institute Proess Maturity Level Structue
Organlzatlonal
Project develops strategies to satisfy thequality needs of organization. customer, and
agree t%~ and work to meet, the project's quality goals
mee sftar prdut uaitygolsan Corrective actions are takien by rops involved
libdsftaeriuw ty . dse tOcnfin th softwa~rebis prdocetswen troe oruaoduty
requiremeits design. software development Plan,U~tS q~u~i~yand sotaequality plan are revised to reflectM14 tenecessa trados OM-11
selected process data is performed-)adcmne oeue PA-
Alyses we used to bring Proces data are monitored to identify'we roces an itscritcalactions needed to satisfy the process
vaesscongtrol. PA-6 O -3 qaiyRas
anmiztions11 a regOa
PA-7 pto. analysis reports are prepared and
irt. for Attaining Process Maturity Level 4
3-33

I bleasurement and fth Software Engineering Institute Process Maturity Leve Structure
Measurement Project Traddiag
Organization prepares andgovern its activities for softw.imorovemenu arnd technology
Organizton's softwam re
Senior management reguand motvational progranprocess improvement. an(
Documented proceduresof process iimprovetmetIimpolementing and rci
Orgaizaton aalyzs it stadardsoftare o ne 1ieact king tasks at level 5 sadr
process to identify aeas that need or could for revs*obenefit from new technoloy T1-4 seklecting, a
software
A database containing process improvementAt beginning of a sota- ZoM56 5f the teminformation is maintained to mantage theperforming tetask meet to prepare for activities of that rcsimIO
rn-process meetings, conforming to practices for task TI2 DP-& PCt-ikcof a-tndes Acusal analyismeetin DP-
Each team that performs a software task conducts a Each team assigned to coordinate defect prevention Where appropriate,causal analysis meeting shortly after the taskc a5 cos* aciIismesrglryt eiwadcodnt n noaietcNogpleted;- also, conducts meetings during the aiiismesrglryt eiwadcodnt n noaietcnlq~task .whennumber of defects uncovered implementation of action proposals from the determine their benefits
waats n cnutspridccaslcausal analyi D!!M1P-5- 11-6, PC-7 ft are inanslsismeetngsafte puuctsareA database for documeating, tracking, and
Msetothe customer. DP-2 coord~inating defect prevention actionsamou the organization is used accodingto adocumented prcdr. DP-ý
Error Analysis Po sAayi
Figure 3-17. Fishbone Chart for Altsini
3-34
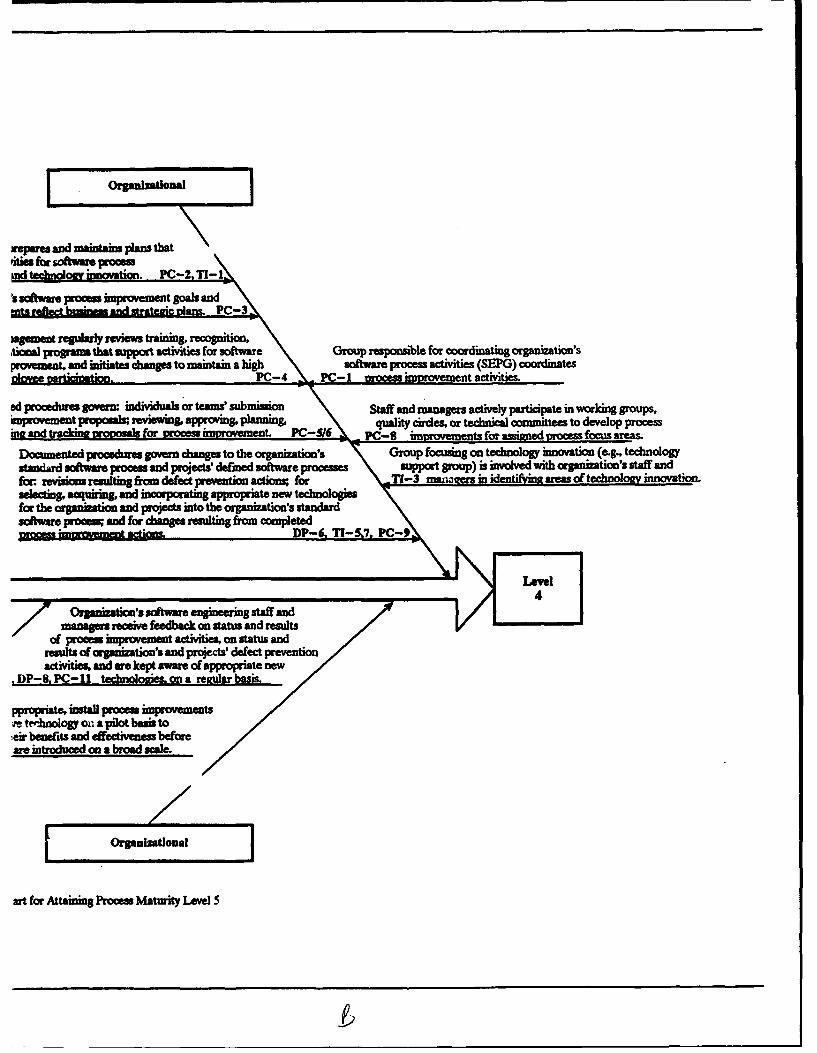
IOrgazniztIoRMairprsadmaintains plans that
ities ftr Software prM mss a I
Is software poesimprovement goals andMtsrefec wAstateicplas.PC\-3
agement regularly reviews training, recognition,btoml programs that support actiites for software Group responsible for coordinating organizatio'sproveient. and initiates changes to maintain a high software prcss activities (SEPG) coordinates
Di e aridginPC-4 - PC-I prcsimroe ment, activities.
ed procedures govern: individuals or tem sub~misio Staff and managers actively participate in working groups,jmproverent proposals; reviewinig, approving, planning, quality circles, or technical commitees to develop Process
iaand tradcins ar asefor eflt. PC-6 PC-$ liii ezta for assianed pomfocus areais.
Documented procedures govern changes to the organization's Group focusing on technology innovation (e~g. technologystandard software p -ro-ess4 and projects' defined software prcese support group) is involved with organization's staff andfor revisions resulting irain defect prevention Actxon for 7I-3 maiwa-e in idenfiyn areas of technolw innovation.selecting, acquiring, and incorporating appropriate new technologiesfor the organizaio and projects into the orgniaton's standardsedtware -pics.; and for changes resulting from completed
nyment ctimsDP-6, T1-5,7 PC-9
4Organizatio's software engineering staff and
managers receive feedback on status and resultsOf poesimprovemenit activities, on status and
rslsof organization's and projcts defect preventionactivities, and are kept aware of appropriate new
*DP-8. PC-li technologims on a remilar basis.
ppropriate, installIprocein improvements.,- tetlhoology on a pilot basis toecir benefits and effectiveness beforeawe introduced on a broad scale.
I ~Organlzational
art for Attaining ProeN Maturity Level 5

4. HOW TO DESCRIBE A SOFTWARE PROCESS
4.1 OVERVIEW
This section shows you how to describe a software process in terms of the activities that compose itand the communications among those activities. Each activity is presented in terms of theEntry-'Ihsk-Verification-eXit (ETVX) paradigm as defined by Radice and Phillips (1988). The para-digm may be used to characterize the overall process or any part of the process. Several key questionsare posed as a basis for developing the model and a set of metrics is provided for quantitativecharacterization of the process and indication of process improvement.
4.2 THE ACTIVITY-BASED PROCESS MODEL
A process is a way of accomplishing an objective. The objective of a software development process isto transform a set of requirements into a software system. The software development process that isultimately created is composed of a set of activities that occur, in some order, to produce software.A software process can be described in terms of the activities that compose it and the interconnectionsamong them. Indeed, as indicated in Selby and Basili (1991), "One central feature of the structure ofa software system is the nature of the interconnections among its components (e.g., subsystems, mod-ules)." Clearly, this same view can be applied to the process of creating software systems where theinterconnections are among the process activities.
Although there are differences in structure, most software development processes contain suchactivities as requirements analysis, design, implementation, and test. (This is a natural order of pre-sentation but not necessarily the expected order of development.) The order of the activities maychange from project to project. For example, the design activity may have to be repeated because toomany errors were discovered during the inspection. Also, the overall design activity may contain otheractivities such as preliminary design and detailed design. Thus, a process is the selective combiningand ordering of activities appropriately suited to a particular development project.
The ordering of the process activities can be described as a network. The network represents thesequence of the activities as required by the circumstances and objectives of a project. They may varyduring the course of a project. This network of activities can be assembled from experience with a par-ticular process, or it can be a selected subset of a larger set or "menu" of possible process activities.For example, a certain project may be established to upgrade the computer hardware for a system,which only requires a rehosting of the software. In this case, it is probable that no requirements analy-sis or preliminary design would be necessary and a reduced detailed design would be sufficient. Inanother example, a project may be initiated with the objective of producing a major new software sys-tem through the preliminary design of the system, with a strategy in place for a separate procurementfor the system's production. In this case, the process is complete after the preliminary design iscomplete.
4-1
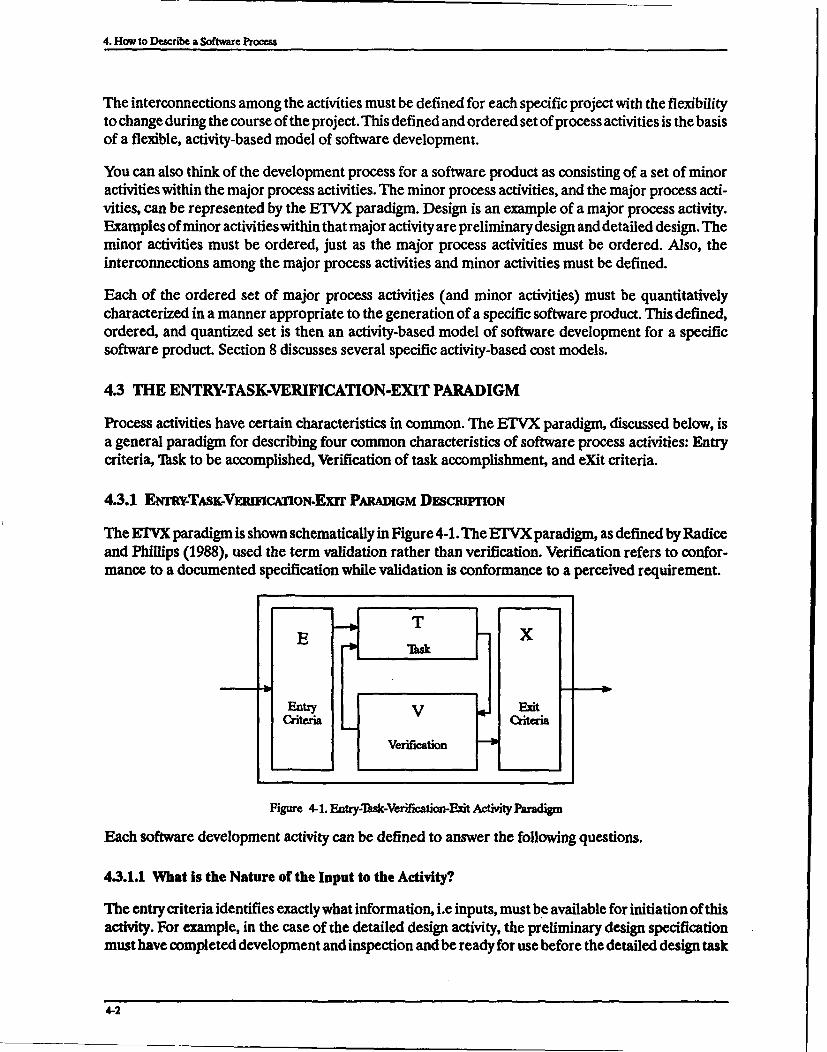
4. How to Describe a Software Process
The interconnections among the activities must be defined for each specific project with the flexibilityto change during the course of the project. This defined and ordered set of process activities is the basisof a flexible, activity-based model of software development.
You can also think of the development process for a software product as consisting of a set of minoractivities within the major process activities. The minor process activities, and the major process acti-vities, can be represented by the ETVX paradigm. Design is an example of a major process activity.Examples of minor activities within that major activity are preliminary design and detailed design. Theminor activities must be ordered, just as the major process activities must be ordered. Also, theinterconnections among the major process activities and minor activities must be defined.
Each of the ordered set of major process activities (and minor activities) must be quantitativelycharacterized in a manner appropriate to the generation of a specific software product. This defined,ordered, and quantized set is then an activity-based model of software development for a specificsoftware product. Section 8 discusses several specific activity-based cost models.
4.3 THE ENTRY-TASK-VERIFICATION-EXIT PARADIGM
Process activities have certain characteristics in common. The ETVX paradigm, discussed below, isa general paradigm for describing four common characteristics of software process activities: Entrycriteria, Task to be accomplished, Verification of task accomplishment, and eXit criteria.
4.3.1 Emw-TASK-VnmcimoN.Exrr PARADIGM DESCRIFrION
The ElVX paradigm is shown schematically in Figure 4-1. The ETVX paradigm, as defined by Radiceand Phillips (1988), used the term validation rather than verification. Verification refers to confor-mance to a documented specification while validation is conformance to a perceived requirement.
E T t xTmE xn
Entry EBidtCriteria CVteri
Verification
Figure 4-1. Entry-lbsk-Verification-EDit Activity Pardigm
Each software development activity can be defined to answer the following questions.
43.1.1 What is the Nature of the Input to the Activity?
The entry criteria identifies exactly what information, i.e inputs, must be available for initiation of thisactivity. For example, in the case of the detailed design activity, the preliminary design specificationmust have completed development and inspection and be ready for use before the detailed design task
4-2

4. How to Describe a Software Proces
can begin. The preliminary design specification document must be available along with the inspectionresult metrics, indicating that the observed defect rate was within the predefined project tolerance.The size of the document should be in the range indicated for like-sized projects to provide an indica-tion of completeness and adequacy. The delivery of the document should be according to the projectschedule to assure that the process will not encounter an unanticipated delay. The effort at this pointcan be captured in tms of engineering effort expended in design to serve as cost data for the experi-ence database and also to compare with other like development efforts to discover any excess costsor cost savings and their reasons.
43.1.2 What Is the Nature of the Output From the Activity?
The exit criteria identifies exactly what information, i.e., outputs, is produced as a result of this activity.For example, the detailed design is complete when the software detailed design document is completeand has passed inspection. Important metric data similar to that from the input criteria should be cap-tured at this point. The exit criteria may call for capturing the size, cost, schedule, and quality data soit is available to input the next process activity. There are no hard and fast rules for what data shouldbe selected, or whether the data is captured at the input or output stage of an activity. Eachdevelopment organization should derive a method appropriate to its particular needs.
4.3.1.3 What Is the Nature of the Transformation From Input to Output?
The transformation from input to output, i.e., the task, specifies exactly what action is performed bythis activity. There is no intent to specify how the transformation is accomplished. lb continue withthe above example, you can state that the detailed design activity shall advance the design of the systemfrom the CSC level to the computer software unit (CSU) level. While there may be metrics associatedwith this activity, they would be technical in nature rather than the managerial metrics of size, cost,schedule, and quality. The techniques for identifying and selecting quantifiable goals and their result-ing metrics are the same (see Section 6 for the GQM paradigm) for the technical and managerial data.
43.1.4 How Do You Know When the Activity Is Completed?
The verification criteria is defined for each activity. Early in a project, most verification is achievedby requiring the product, at each defined level of completion, to pass an inspection and later in theproject to pass various levels of product testing. This process, known as incremental (periodic) verifi-cation, provides continuous assurance of acceptable product quality during development. The inspec-tion and test criteria becomes the verification criteria for each process activity. Defects discoveredduring the design and implementation inspections and program operational test failures must be documentedand completely resolved or at least to a specified level before declaring an activity as completed.
4.3.1.5 How Well Did the Activity Do What It Was Supposed to Do?
How well the activity was accomplished can be determined by the quality of the product produced bythe activity. Quality data, captured during the verification activity, can be analyzed to determine thelevel of product quality, and the data can be used as the basis of a prediction of the defects that willbe discovered during future process activities. Inspection and test efforts find many errors but not allof them. Statistical process control may be used to determine a level of confidence in the degree ofthe activity completion. If the number of defects discovered are not within some predicted range, asdeternined by statistics (see Section 10), this may suggest that product developnent is not proceeding
4-3
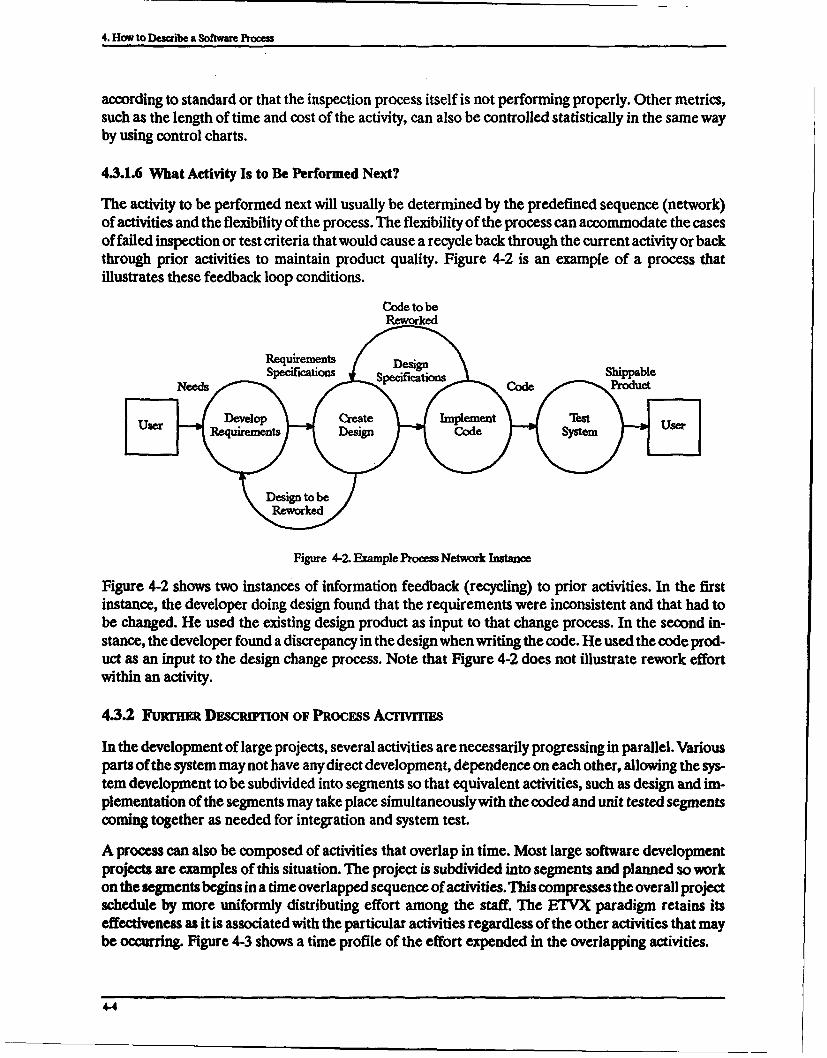
4. How to Descibe a Software Process
according to standard or that the inspection process itself is not performing properly. Other metrics,such as the length of time and cost of the activity, can also be controlled statistically in the same wayby using control charts.
43.1.6 What Activity Is to Be Performed Next?
The activity to be performed next will usually be determined by the predefined sequence (network)of activities and the flexibility of the process. The flexibility of the process can accommodate the casesof failed inspection or test criteria that would cause a recycle back through the current activity or backthrough prior activities to maintain product quality. Figure 4-2 is an example of a process thatillustrates these feedback loop conditions.
Code to beReworked
Figure 4-2. meample Process Network Instance
Figure 4-2 shows two instances of information feedback (recycling) to prior activities. In the firstinstance, the developer doing design found that the requirements were inconsistent and that had tobe changed. He used the existing design product as input to that change process. In the second in-
stance, the developer found a discrepancy in the design when writing the code. He used the code prod-uct as an input to the design change process. Note that Figure 4-2 does not illustrate rework effort
within an activity.
4.3.2 Futrmm DEscRIwON OF PROCESS Acnvrrns
In the development of large projects, several activities are necessarily progressing in parallel. Variousparts of the system may not have any direct development, dependence on each other, allowing the sys-tem development to be subdivided into segments so that equivalent activities, such as design and im-plementation of the segments may take place simultaneously with the coded and unit tested segmentscoming together as needed for integration and system test.
A process can also be composed of activities that overlap in time. Most large software developmentprojects are examples of this situation. The project is subdivided into segments and planned so workon the segments begins in a time overlapped sequence of activities. This compresses the overall projectschedule by more uniformly distributing effort among the staff. The ETVX paradigm retains itseffectiveness as it is associated with the particular activities regardless of the other activities that maybe occurring. Figure 4-3 shows a time profile of the effort expended in the overlapping activities.
44

4. How to Describe a Software Procem
NormalizedEffort
Time
tdEnd of
Developmnent
Figure 4-3. Resource Profiles for Eaci Principal Development Activity
In addition to the process activity questions posed in Section 4.3.1, you can ask other questions whichaddress process activity implementation issues such as:
4.3.2.1 What Method Should Be Used to Implement the Transformation Algorithm From Input toOutput?
A commercially available or a locally developed methodology may be specified for an activity or toinclude several activities. Software development methodologies that are implementation supportedby CASE tools exist, and may be part of the specified transformation activity.
4.3.2.2 What Verification Methods Should Be Used to Determine the Degree of Success of theProcess Modification?
The degree of success can be determined by statistical methods of quantitatively assessing a projectto determine the size, unit costs, schedule status, and quality and then comparing the results to pastprojects or accepted industry norms. If the product quality is lower, costs are higher, or developmentlagged behind schedule, then process improvement may be beneficial. Other production factors mustalso be considered such as the capability of the technical staff and CASE tools used. An improvementin the expertise of the technical staff can produce an improvement in the process; for example, a pro-cess improvement that occurs without any change in the process. More likely though, a process-relatedtraining program would be necessary to achieve that kind of process improvement.
4.3.3 EXAMPIZ OF QUANT•IG AsPECTS OF A PRoCEss Acrivnr
A set of metrics can be derived using the GQM paradigm to quantify the main aspects of each of thefour principal components of the ETVX paradigm as applied to a software process activity. As an ex-ample, the detailed design activity could suggest the following questions and metrics for use inanswering the questions:
4-5
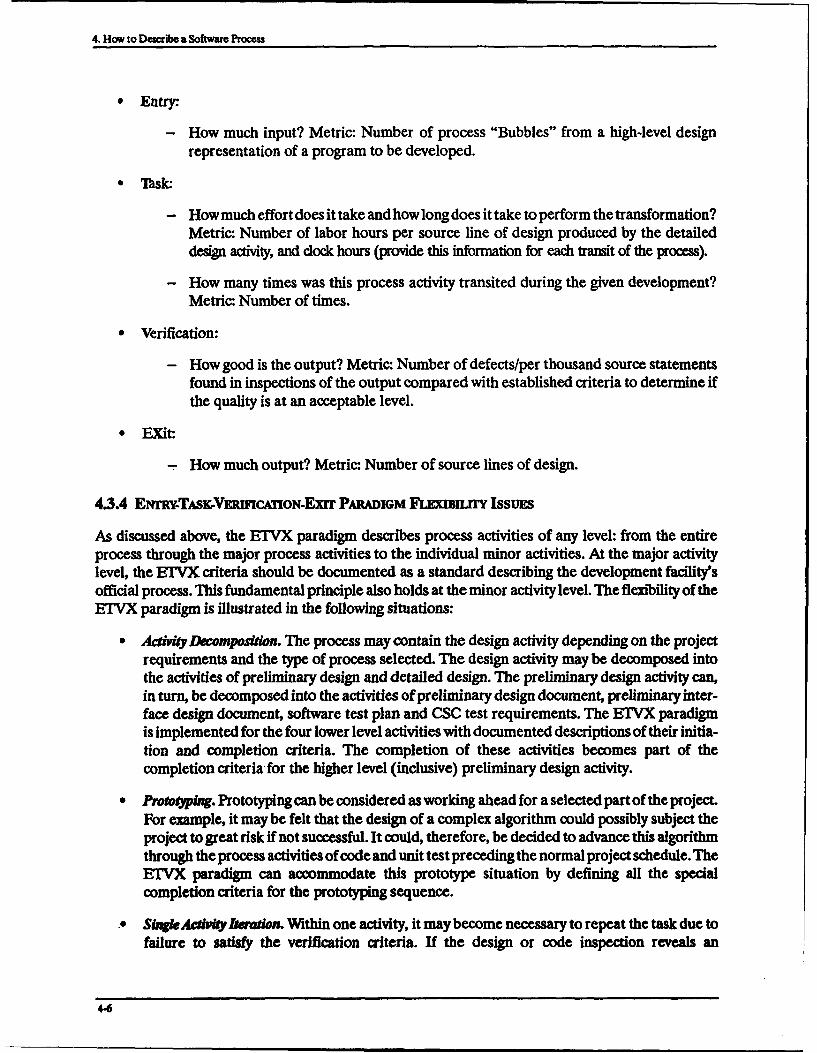
4. How to Describe a Software Process
" Entry:
- How much input? Metric: Number of process "Bubbles" from a high-level designrepresentation of a program to be developed.
"T sk:
- How much effort does it take and how long does it take to perform the transformation?Metric: Number of labor hours per source line of design produced by the detaileddesign activity, and dock hours (provide this information for each transit of the process).
- How many times was this process activity transited during the given development?
Metric: Number of times.
"* Verification:
- How good is the output? Metric: Number of defects/per thousand source statementsfound in inspections of the output compared with established criteria to determine ifthe quality is at an acceptable level.
"* EXit:
- How much output? Metric: Number of source lines of design.
4.3.4 EmRTAs-VgumcAcTIoN-Exrr PARADIGM FLExIrnmrY IsmsUF
As discussed above, the ETVX paradigm describes process activities of any level: from the entireprocess through the major process activities to the individual minor activities. At the major activitylevel, the ETVX criteria should be documented as a standard describing the development facility'sofficial process. This fundamental principle also holds at the minor activity level. The flexibility of theETVX paradigm is illustrated in the following situations:
" Aci Decompositon. The process may contain the design activity depending on the projectrequirements and the type of process selected. The design activity may be decomposed intothe activities of preliminary design and detailed design. The preliminary design activity can,in turn, be decomposed into the activities of preliminary design document, preliminary inter-face design document, software test plan and CSC test requirements. The E1VX paradigmis implemented for the four lower level activities with documented descriptions of their initia-tion and completion criteria. The completion of these activities becomes part of thecompletion criteria for the higher level (inclusive) preliminary design activity.
"* Prwotxping. Prototyping can be considered as working ahead for a selected part of the project.For example, it may be felt that the design of a complex algorithm could possibly subject theproject to great risk if not successful. It could, therefore, be decided to advance this algorithmthrough the process activities of code and unit test preceding the normal project schedule. TheETVX paradigm can accommodate this prototype situation by defining all the specialcompletion criteria for the prototyping sequence.
A SqgeAcdtiiItaon. Within one activity, it may become necessary to repeat the task due tofailure to satisfy the verification criteria. If the design or code inspection reveals an
4-6
4. How to De.scrbe a Software Proces
unacceptably high defect rate, the ETVX paradigm of the single activity will have to be"repeated" through the task and verification requirements until their criteria are met. Thistask (verification iteration path) can be seen in Figure 4-1.
Multi-Actvity Iteranon (Rework). It may become necessary to repeat several activities of theprocess. For example, if a change to the software requirements occurs and it affects a portionof the software that has already progressed to the integration test activity, that portion of thesoftware will have to be recycled back to the design activity. In this case, the ETVX paradigmaccommodates the rework by applying the original completion criteria to the reworkedportion of the software.
4.4 PROCESS IMPROVEMENT
The ETVX paradigm represents the software development process during product development andfor process improvement. This section describes how the ETVX paradigm represents processimprovement.
4.4.1 IMAcrs OF PROCESS MODnIFCATON
The interconnections among the activities may change during development of a specific softwareproduct. For example, an analysis of errors may show that it is advisable to recycle the product devel-opment sequence back through the design activity to lower the error rate. Or, a large number of testerrors may indicate an unacceptably high level of risk if the product is delivered in that condition. Therefore,testing is continued past the planned time. These are examples of short-term proems modification.
The interconnections among the activities or the activities themselv". may change over time and overthe development of several products due to the introduction of new technology (e.g., CASE tools).This is an example of long-term process modification.
The effect of procs modification is measured by the effect of the modification on each of the activities inthe process.The effect on each activity should be measured in terms of:
4.4.1.1 Changes in Unit Cost of Doing the Activity
An improvement in the software process usually results in a lower overall cost to develop software.However, it is not necessarily true that every activity in the process decreases in cost. You may decidethat it is more cost effective to invest increased effort in the design activity and find development er-rors early in the process rather than later during the test activity. This causes a corresponding increasein the cost of the design activity, but that increase is more than offset by savings in rework to correcterrors discovered later during the test activities. The cost of each activity should be monitored usingthe metrics developed for project trackdng and control to quantify the effects of the process modification. Youcan then determine whether the modification is producing the desired improvement.
"44.1.2 The Impacts on the Inputs and Outputs
A business need may require a process modification that can result in a temporary or even permanentcost increase with the underlying assumption of product quality improvement. A software develop-ment facility may have been operating under the criteria of DOD-SMD-1679A for several years. The
4-7

4. How to Describe a Software Process
inputs and outputs of its process activities, as defined in its standards and conventions met the criteriaof DOD-STD-1679A. Increasing customer sophistication eventually resulted in the replacement ofDOD-STD-1679A by DOD-STD-2167 and shortly thereafter by DOD-STD-2167A (Department ofDefense 1988). The upgraded standard contains requirements for several new and revised documentsand milestone activities, among other things. In this case, the development facility will have to revisitthe ETVX description of each activity in its process and revise the entry and exit criteria to reflect thenew documentation requirements. Careful monitoring of costs is absolutely necessary at this point toaccumulate the justification required for increases in proposed cost of new work.
4.4.13 Changes in the Transformation From Input to Output
A software development process depends, to a great extent, on the level of its supporting technology,or software development environment. While software development is a labor intensive, intellectualprocess, its efficiency can be increased by improvements in the automation of selected parts of thedevelopment process. Steady improvement in computer hardware technology has made cost effectivesoftware CASE tool applications possible. CASE tools allow the implementation of automated graph-ical techniques of design and automatic code generation, and they provide extensive repository facili-ties. It is almost inevitable that CASE tools will be adopted by most software development facilities.The potential cost reductions are significant enough to provide a competitive advantage. In this case,upon adoption of a CASE tool, the ETVX description of process activities will have to be revised toreflect the changes in the methods of accomplishing the tasks of all affected activities. Careful moni-toring of costs is absolutely necessary at this point to accumulate the experience data on which to basedecreases in proposed cost of new work.
4.4.1.4 Impacts on the Determination Method of How and When the Activity Is Completed
Verifying the completion of the process activities' tasks is one of the most significant cost drivers ofthe process. As the process becomes more automated, the verification task becomes more orderly andless time consuming due to the traceability of design and code provided by CASE tools. Such thingsas consistency and completeness of design are greatly improved by process automation through adop-tion of CASE tools. The manner of the inspection process can be changed toward reduction of effor#as familiarity with the tool is gained. Automatic code generation can immediately eliminate the needfor all coding effort, but some code inspection should be retained to verify that the proper code wasgenerated. The ETVX descriptions will need to reflect the changes in inspection procedures. Also,it is important that quality, cost tracking, and monitoring is performed to ascertain that reduction ininspection effort is not having a detrimental effect on the process.
44.1.5 The Impact on the Quality of the Activity
You may decide that sufficient experience in a specific domain (business area) permits the qualitylimits to be tightened somewhat, causing an increase in the quality of the software product. Forexample, the effect of the people's experience level staffing the project. A change in the statisticalprocess control limits (see Section 10) standards may be required to solidify the improvement in theproduct quality. The ETVX activity descriptions will need to be changed accordingly. This is an exam-ple of a process improvement that is subject to some variability from project to project. It is highlydependent on continuity of staff which is not always possible to maintain. This being the case, it be-comes important to have good quality tracking and monitoring mechanisms in place to determine ifquality levels are being maintained. Process automation can be a great influence on product qualityimprovement that does not depend so heavily on the project staff experience.
44

4. How to Describe a Software Process
4.4.1.6 What Activity Is Done Next
In the long term, over the life of several projects, the general order of process activities will not change.The requirements, design, implement, test order is generic to any development effort. Greater em-phases on such things as software reuse and formal risk analysis may change the emphases placed onvarious process activities. It is in activity iteration or temporary deviation from the normal processactivities, in the short term, where process order modification occurs. This can be due to such thingsas rework or prototyping. These activities should also be tracked to determine their effect on costs andquality.
4.4.2 METRICS FOR PROCESS MODIFICATION
You accomplish process improvement when lower cost and/or a shorter schedule result in a higher orat least the same level of quality. Process improvement is also accomplished when higher quality isachieved at no increase in cost and/or schedule. You achieve process improvement when small incre-ments of increase in cost and/or schedule result in large increments of increase in quality. Metrics thatcan be used to indicate the effects of the above impacts should be specified at the initiation of the proj-ect. You should derive and apply metrics that can measure the direction (improvement or deteriora-tion) and the amount of change in process performance resulting from every process modificationaction.
You should also derive and apply metrics to measure the impact of new technology. New technologyoften influences process performance changes over the course of several projects. You should mea-sure the long-term effects of new technology. While process improvement can take place without pro-cess modification, as in the case of increasing skills of the staff, it often occurs with some modificationto the process.
Tab'e 4-1 presents a summary of metrics which can be used to evaluate the impact of process changesand the amount of process improvement. You should apply the indicated metrics before and after aprocess modification action to evaluate the impacts. See Section 6 for additional information aboutmetrics selection.
Table 4-1. Metrics For Process Changes and Improvement Evaluation
Metric Apply Metric To
LM/KSLOC Each Activity, Overall ProcessEstimated defects/KSLOC Overall Process
Discovered defects/KSLOC Each Activity
Estimated schedule - time to complete Overall Process
4.5 SUMMARY
A software development process may be modeled in terms of the appropriate set of activities and theirinterconnections that will accomplish the project objectives. The ETVX paradigm provides a disci-pline for use in describing the software development process, by rigorously defining the Entry, Task,Verification and eXit criteria of the individual activities that compose the process. The ETVX para-digm has been described in terms of its ETVX criteria with examples of each criterion. Process
4-9

4. How to Deacnibe a Software Proces
modification for improvement has impacts on the process ETVX activity definitions. Examples ofthese impacts to the process and their effects are given and related to the ETVX descriptions of theprocess activities. You are provided with a set of metrics to evaluate -.he effectiveness of processperformance and modifications to the process.
4-10

5. SETTING QUANTIFIABLE REQUIREMENTSAND GOALS AND MANAGING TO THEM
Developing quantitative requirements is an important part of MDSM. This section describes how toexpress requirements in quantitative terms and how to associate them with testable/measurable tar-gets. This will enable you to objectively verify performance. Users' operational requirements dictatea project's goals, which in turn determine the minimum set of management data required to effectivelymanage the project. This section also shows you how to establish quantitative product requirementsand process goals.
Other sections in this guidebook relate to the material covered in this section. Section 2 describesMDSM, how to apply the MDSM process, and how to use measurements in the process. Section 6shows you how to derive a minimum set of measurements needed to effectively manage a softwareproject by using the GQM paradigm. Section 10 presents statistical quality control methods to helpyou determine the degree of satisfaction of the quantified requirements imposed on the product andthe process used to create it.
5.1 QUANTITATIVE PRODUCT REQUIREMENTS AND PROCESS OBJECTIVES
This section describes how to identify the most critical software project requirements, how to quantifyrequirements, and how to express them in measurable/testable terms. Clearly identified and quantifiedfunctional requirements, quality objectives, and resource limitations are essential to project suecess.
5.1.1 IDEMING CRtmcAL REQUUUIR M
This section describes how to identify the critical attributes (the highest priority attributes) soessential in defining how, and how well, the end user needs to have the software product work in itsintended operational environment. You should not expect software to be accepted by your customerif its performance level for a measurable/testable critical attribute is less than the minimum acceptablelevel specified. For mission-critical software, you expect the critical requirements to include systemattributes of performance, reliability, user satisfaction, and maintainability. Examples of these andother attributes of requirements are given in Section 10. You will need to define what is meant by eachattributes with respect to your particular customer's needs. You will then need to define quantitativemeasures for these attributes.
In identifying the critical requirements for software, you may also need to consider critical characteristics ofthe system of which software is a part. As cited in Department of Defense (1991a), such critical systemcharacteristics may include compatibility with other forces and systems including post-deploymentsupport organizations, survivability, transportability, electronic countermeasures, energy efficiency,interoperability, and standardization.
Requirements evolve and refinements and darifications are often negotiated during projects in discussionsbetween the system developer and the customer for the system. The first sets of requirements are often "Wh
541
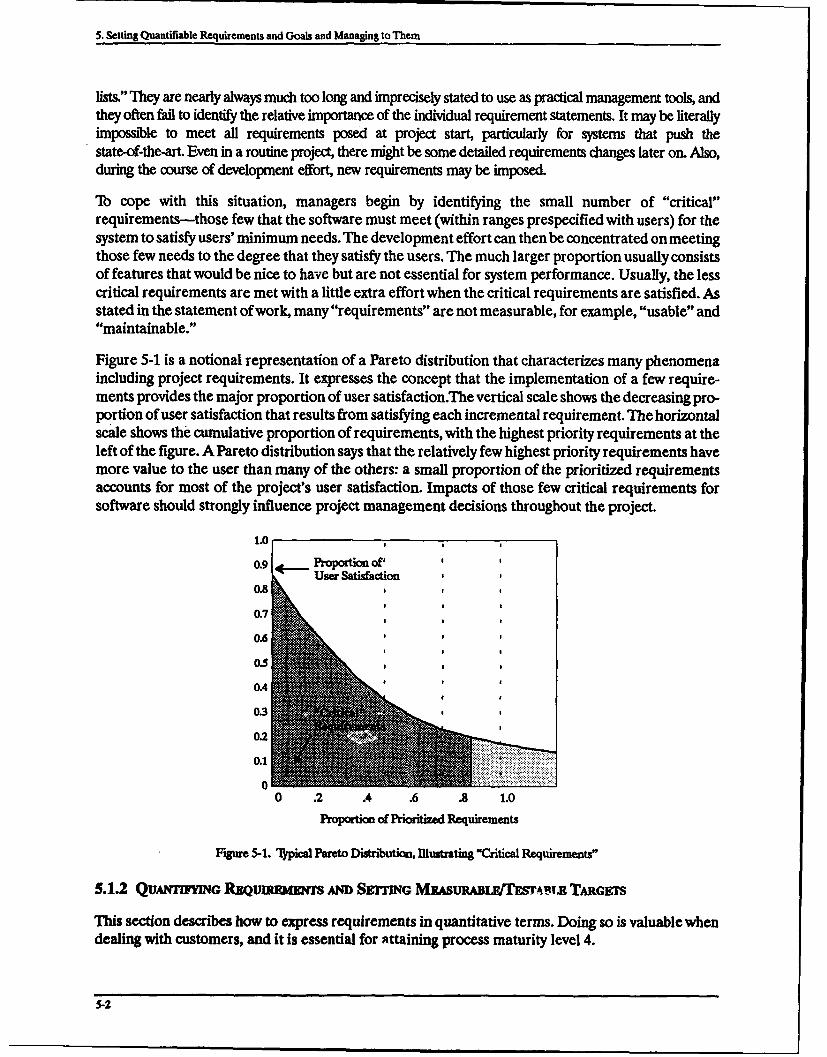
5. Setting Quantifiable Requirements and Goals and Managing to Them
lists." They are nearly always much too long and imprecisely stated to use as practical management tools, andthey often fail to identify the relative importance of the individual requirement statements. It may be literallyimpossible to meet all requirements posed at project start, particularly for systems that push thestate-of-the-art. Even in a routine project, there might be some detailed requirements changes later on. Also,during the course of development effort, new requirements may be imposed.
To cope with this situation, managers begin by identifying the small number of "critical"requirements--those few that the software must meet (within ranges prespecified with users) for thesystem to satisfy users' minimum needs. The development effort can then be concentrated on meetingthose few needs to the degree that they satisfy the users. The much larger proportion usually consistsof features that would be nice to have but are not essential for system performance. Usually, the lesscritical requirements are met with a little extra effort when the critical requirements are satisfied. Asstated in the statement of work, many "requirements" are not measurable, for example, "usable" and"maintainable."
Figure 5-1 is a notional representation of a Pareto distribution that characterizes many phenomenaincluding project requirements. It expresses the concept that the implementation of a few require-ments provides the major proportion of user satisfaction.The vertical scale shows the decreasing pro-portion of user satisfaction that results from satisfying each incremental requirement. The horizontalscale shows the cumulative proportion of requirements, with the highest priority requirements at theleft of the figure. A Pareto distribution says that the relatively few highest priority requirements havemore value to the user than many of the others: a small proportion of the prioritized requirementsaccounts for most of the project's user satisfaction. Impacts of those few critical requirements forsoftware should strongly influence project management decisions throughout the project.
0.9
UsroportionsfaPrioniie eqeet
0.8,
0.7
0.6
01.4
0.2
00 .2 .4 .6 .8 1.0
Proportion of ftioa'tie Requirements
F'•gtr 5-1. Typical Pareto Distra'ution, Illstrating "Cr-itical lReluirements"
5.1.2 QuA~mvmG RE••uw Arm Srmom( MzisuRnLFs/Ivsr4_v •. TARGm
This section describes how to express requirements in quantitative terms. Doing so is valuable whendealing with customers, and it is essential for attaining process maturity level 4.
S-2
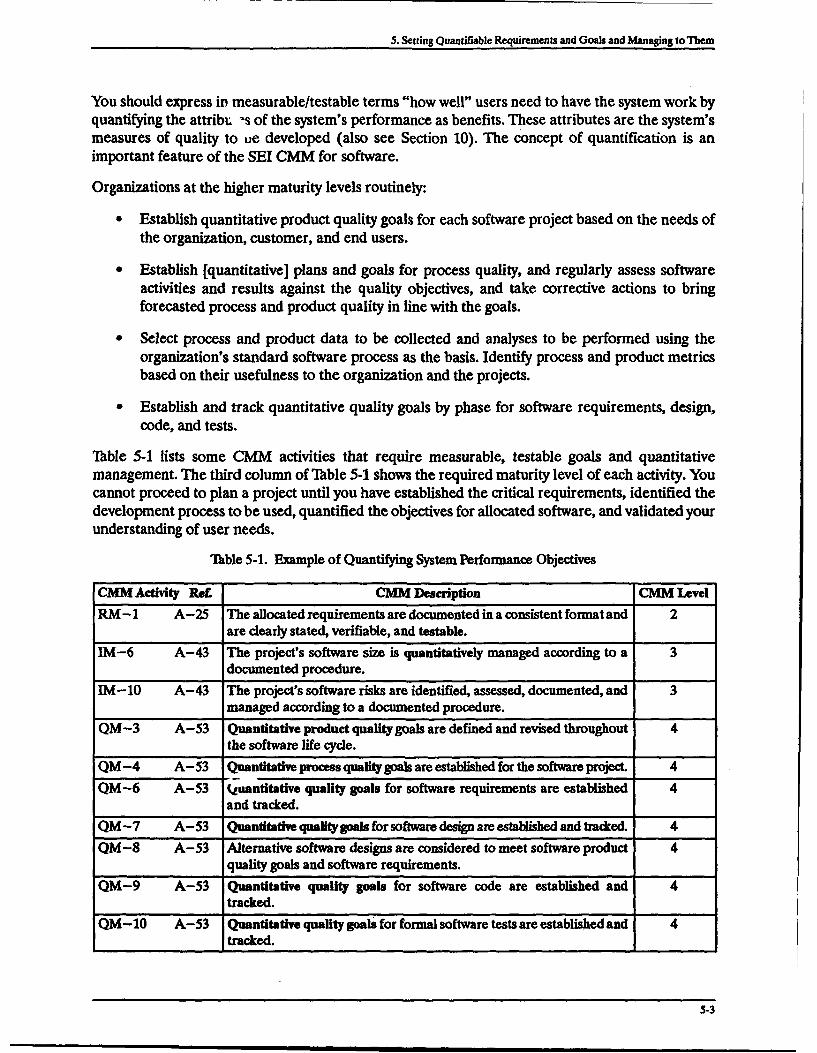
5. Setting Quantifiable Requirements and Goals and Managing to Them
You should express in measurable/testable terms "how well" users need to have the system work byquantifying the attribt. -s of the system's performance as benefits. These attributes are the system'smeasures of quality to ue developed (also see Section 10). The concept of quantification is animportant feature of the SEI CMM for software.
Organizations at the higher maturity levels routinely:
"* Establish quantitative product quality goals for each software project based on the needs ofthe organization, customer, and end users.
" Establish [quantitative] plans and goals for process quality, and regularly assess softwareactivities and results against the quality objectives, and take corrective actions to bringforecasted process and product quality in line with the goals.
" Select process and product data to be collected and analyses to be performed using theorganization's standard software process as the basis. Identify process and product metricsbased on their usefulness to the organization and the projects.
"* Establish and track quantitative quality goals by phase for software requirements, design,code, and tests.
Table 5-1 lists some CMM activities that require measurable, testable goals and quantitativemanagement. The third column of Table 5-1 shows the required maturity level of each activity. Youcannot proceed to plan a project until you have established the critical requirements, identified thedevelopment process to be used, quantified the objectives for allocated software, and validated yourunderstanding of user needs.
"Ihble 5-1. Example of Quantifying System Performance Objectives
CMM Activity Re- CMM Description CMM LevelRM-1 A-25 The allocated requirements are documented in a consistent format and 2
are clearly stated, verifiable, and testable.
IM-6 A-43 The project's software size is quantitatively managed according to a 3documented procedure.
IM-10 A-43 The project's software risks are identified, assessed, documented, and 3managed according to a documented procedure.
QM-3 A-53 Quantitative product quality goals are defined and revised throughout 4the software life cycle.
QM-4 A-53 Quantitative process quality goals are established for the software project. 4
QM-6 A-53 Quantitative quality goals for software requirements are established 4and tracked.
QM-7 A-53 Quantitative quality goals for software design are established and tracked. 4
QM-8 A-53 Alternative software designs are considered to meet software product 4quality goals and software requirements.
QM-9 A-53 Quantitative quality goals for software code are established and 4tracked.
OM-l 1 A-53 Quantitative quality goals for formal software tests are established and 4____ ___ tracked.
5-3
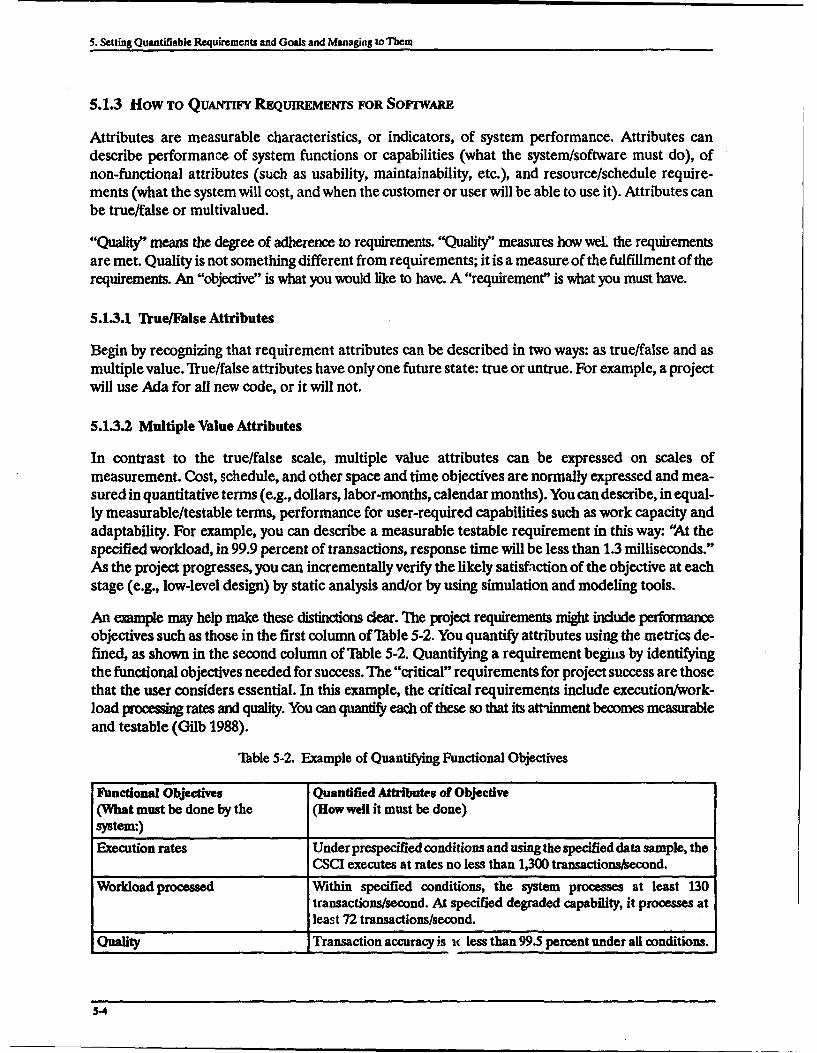
5. Setting Quantifiable Requirements and Goals and Managing to Them
5.1.3 How To QuANTir REQUmIREMENTS FOR SOFrWARE
Attributes are measurable characteristics, or indicators, of system performance. Attributes candescribe performance of system functions or capabilities (what the system/software must do), ofnon-functional attributes (such as usability, maintainability, etc.), and resource/schedule require-ments (what the system will cost, and when the customer or user will be able to use it). Attributes canbe true/false or multivalued.
"Quality" means the degree of adherence to requirements. "Quality" measures how weL the requirementsare met. Quality is not something different from requirements; it is a measure of the fulfillment of therequirements. An "objective" is what you would like to have. A "requirement" is what you must have.
5.1.3.1 "Irue/False Attributes
Begin by recognizing that requirement attributes can be described in two ways: as true/false and asmultiple value. Tfue/false attributes have only one future state: true or untrue. For example, a projectwill use Ada for all new code, or it will not.
5.1.3.2 Multiple Value Attributes
In contrast to the true/false scale, multiple value attributes can be expressed on scales ofmeasurement. Cost, schedule, and other space and time objectives are normally expressed and mea-sured in quantitative terms (e.g., dollars, labor-months, calendar months). You can describe, in equal-ly measurable/testable terms, performance for user-required capabilities such as work capacity andadaptability. For example, you can describe a measurable testable requirement in this way: "At thespecified workload, in 99.9 percent of transactions, response time will be less than 1.3 milliseconds."As the project progresses, you can incrementally verify the likely satisfaction of the objective at eachstage (e.g., low-level design) by static analysis and/or by using simulation and modeling tools.
An example may help make these distinctions dear. The project requirements might include performanceobjectives such as those in the first column of Thble 5-2. You quantify attributes using the metrics de-fined, as shown in the second column of Thble 5-2. Quantifying a requirement begins by identifyingthe functional objectives needed for success. The "critical" requirements for project success are thosethat the user considers essential. In this example, the critical requirements include execution/work-load processing rates and quality. You can quantify each of these so that its attrinment becomes measurableand testable (Gilb 1988).
Table 5-2. Example of Quantifying Functional Objectives
Flunctional Objectives Quantified Attributes of Objective(What must be done by the (How well it must be done)system:)
Execution rates Under prespecified conditions and using the specified data sample, theCSCI executes at rates no less than 1,300 transactions/second.
Workload processed Within specified conditions, the system processes at least 130transactions/second. At specified degraded capability, it processes atleast 72 transactions/second.
Quality Transaction accuracy is ic less than 99.5 percent under all conditions.
5-4

5. Setting Quantifiable Requirements and Goals and Managing to Them
In summary, you can quantify and test both functional and attribute objectives. This permits you tomeasure the degree to which the system's performance meets these objectives.
5.1.3.3 Identifying Requirements
Quantifying requirements enables you to establish clear, complete, and measurable/testableobjectives for software products and processes that are agreed upon by the developer and the intendedusers (or surrogates for them). To be useful, quantified requirements must describe the results usersreally want, the goodness of those results, and statements on the costs they are willing to incur forthose benefits. Figure 5-2 is an overview of quantifiable requirements. You can help users selectrequirements by conducting cost-effectiveness tradeoffs (see Section 5.2.1).
PtojeaRequirements
P.uments Qualit ObjectivesUnttin
"What" "IHow wel" "How much"must it do? must it be done? will it consume?
Figre 5-52. Requirements Hiedy
The three categories of requirements are:
" Fwcwonal Requirements. These represent the functions to be performed by the software: whatthe software is to do for the end user. The extent and nature of functions the software mustperform for the system drives the size of the software product.
" Quality Objdctives. Quality may be defined as conformance to requirements (Crosby 1979).Section 10 describes quality further. You can and should unambiguously state all quality re-quirements. Ease of use, reliability, maintainability, portability, and usability are typical re-quirements that you should try to quantify (Gilb 1988). Section 10 shows you an example ofa methodology for doing so. Usability is an example of a quality objective that treats theamount of effort required to learn how to operate a system.
" RPowurceLimitations. Resource limitations identify such constraints as dollar cost, labor hours,computer time, and calendar months available until delivery. The development effort dependson the size of the software system and is the primary driver of cost. Tb a lesser extent, thesoftware size also drives other expenses incurred in development (such as computer support).
The greatest difficulty in establishing quantitative requirements is in getting a "clear, complete,unambiguous statement of our quality requirements" (Gilb 1988). Gilb (1988) points out that thereis "a certain art to finding the necessary metrics concepts and measuring tools. Often they have notraditional written form, and it is essential that they are tailored to the case in hand."
The quantitative objectives you establish for each product goal (especially for software qualitycharacteristics) permit you to make meaningful assessments of project risk based on probabilisticanalysis at each stage of the software development project.
5-5

5. Setting Quantifiable Requirements and Goals and Managing to Them
5.1.4 How TO SPrcIy ArROnTuS OF REQUIRMENTS
Decisions made at the beginning of a software project, and therefore hardest to change, are the mostvital ones. Base your subsequent project plans and budgets on the few critical performance require-ments that you formalize in this early work. Typically, the plans and budgets change throughout thedevelopment process. This is not a random or careless process. As more information becomes avail-able about the system's behavior and more system requirements are added during development, aquantitative baseline is essential for evaluating the effects of changes on schedule and cost.
Table 5-3 provides several examples of how you can express requirements in quantitative terms. Thecritical performance requirements columns list what the product must do and how well it must do it;the Method of Measurement column identifies the method for measuring the degree to which thoserequirements are satisfied.
lhble 5-3. Examples of Critical Requirements
Examples: Critical Performance Requirements
What it Must Do How Well Method of Measurement
Pass acceptance tests for critical Specified in terms that you can Specify agreed-on test orabilities (by physical test or measure and test measuring toolsimulation)
Transaction rate at given volume Transactions/second Transactions/second, underlevels simulated field operating
conditionsResponse time for given Less than 0.3 seconds from Simulation prior to FQTtransaction loads receipt of incoming signal
Availability, etc. More than 99.8 percent FQTPass design review Fewer than 10 major faults to be Pass review, with no open major
corrected before proceeding faults from CDR
You must state how each performance requirement can be measured on some scale and verified bysome test or set of tools. You will find it helpful to make comparisons among the current level of per-formance, the minimum acceptable levels (at delivery) and performance objective level (at delivery),and the "best ever" or current state of the art. Reference the authority that quantitatively specifiesthe minimum acceptable and performance objective levels. In the past, the minimum acceptable leveland the performance objective level have often been assumed to be the same. You can continue withthis simpUr assumption, if you wish. However, in a competitive market, as your process capabilities im-prove at higher maturity levels, you may benefit by differentiating your performance objective fromthe minimum acceptable level.
In lhble 5-4, the performance level column shows the four levels of performance that need to be quantifiedfor each of two typical requirements: response time and availability. The critical performance require-ments columns list what the product must do and how well it must do it. The performance objectiveand minimum acceptable levels are those on which the users and software developers have agreed.The best ever (record, state of the art, or best performance known) puts these levels into perspectiveby comparing the performance objective and minimum acceptable levels with the state of the art. Thecurrent level shows performance of whatever current system is in use, whether the tedmology is manual orautomated.
5-6
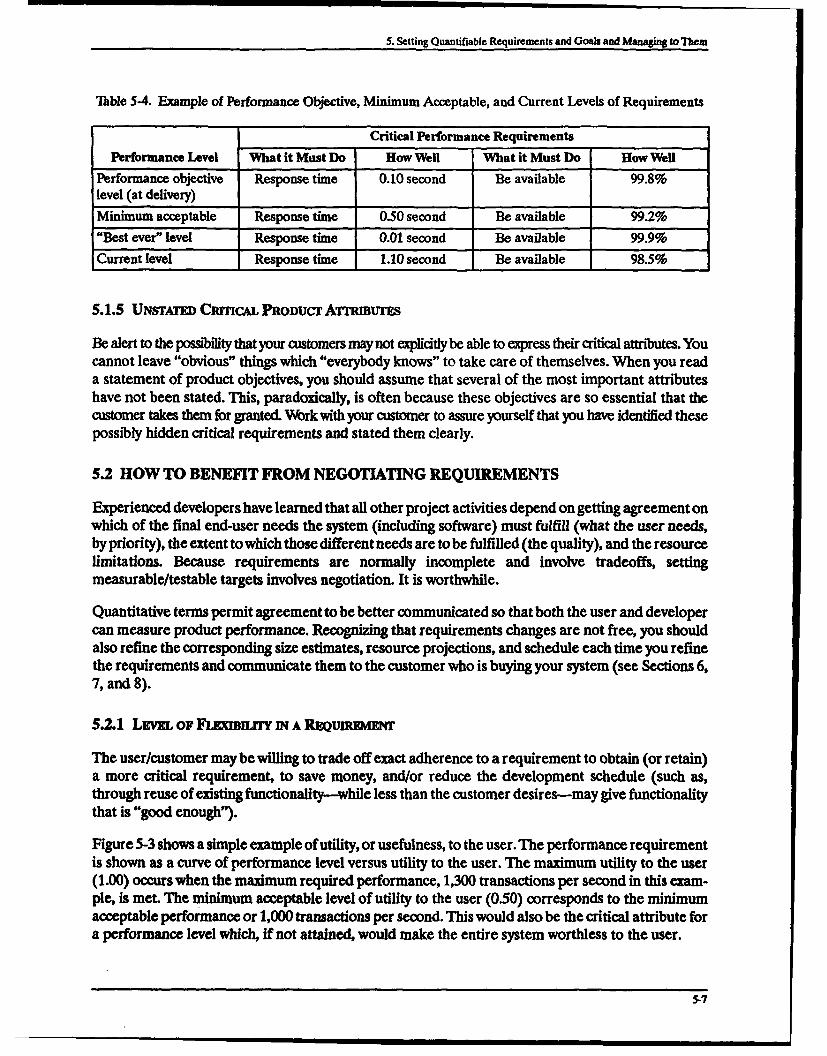
5. Setting Quantifiable Requirements and Goals and Managing to Them
Thble 5-4. Example of Performance Objective, Minimum Acceptable, and Current Levels of Requirements
Critical Performance Requirements
Performance Level What it Must Do How Well What it Must Do How Well
Performance objective Response time 0.10 second Be available 99.8%level (at delivery)
Minimum acceptable Response time 0.50 second Be available 99.2%
"Best ever" level Response time 0.01 second Be available 99.9%
Current level Response time 1.10 second Be available 98.5%
5.1.5 UNSTAr CRncAL PRODUCr ATIRIBUrEs
Be alert to the possibility that your customers may not explicitly be able to express their critical attributes. Youcannot leave "obvious" things which "everybody knows" to take care of themselves. When you reada statement of product objectives, you should assume that several of the most important attributeshave not been stated. This, paradoxically, is often because these objectives are so essential that thecustomer takes them for granted. Vbrk with your customer to assure yourself that you have identified thesepossibly hidden critical requirements and stated them clearly.
5.2 HOW TO BENEFIT FROM NEGOTIATING REQUIREMENTS
Experienced developers have learned that all other project activities depend on getting agreement onwhich of the final end-user needs the system (including software) must fulfil (what the user needs,by priority), the extent to which those different needs are to be fulfilled (the quality), and the resourcelimitations. Because requirements are normally incomplete and involve tradeoffs, settingmeasurable/testable targets involves negotiation. It is worthwhile.
Quantitative terms permit agreement to be better communicated so that both the user and developercan measure product performance. Recognizing that requirements changes are not free, you shouldalso refine the corresponding size estimates, resource projections, and schedule each time you refinethe requirements and communicate them to the customer who is buying your system (see Sections 6,7, and 8).
5.2.1 LEVE oF FBIurY IN A RnQumrntmiT
The user/customer may be willing to trade off exact adherence to a requirement to obtain (or retain)a more critical requirement, to save money, and/or reduce the development schedule (such as,through reuse of existing functionality-while less than the customer desires-may give functionalitythat is "good enough").
Figure 5-3 shows a simple example of utility, or usefulness, to the user. The performance requirementis shown as a curve of performance level versus utility to the user. The maximum utility to the user(1.00) occurs when the maximum required performance, 1,300 transactions per second in this exam-ple, is met. The minimum acceptable level of utility to the user (050) corresponds to the minimumacceptable performance or 1,000 transactions per second. This would also be the critical attribute fora performance level which, if not attained, would make the entire system worthless to the user.
5-7

5. Setting Quantifiable Requirements and Goals and Managing to Them
Maximum Utility to User1.00 --- - - - - - - - - - - - - - - - - - - - - - - - - -
Operationally Adequate Utiily to User
0.75 Maximum0.•s /• ', equied
Transactions Per Secomd
Figure 5-3. Example of Utilty of a Product Capability to a User
The utility curve rises more sharplyin the range of 1,100 to 1,300 transactions per second. If everythingelse is equal, of course, the user would like to have performance corresponding to maximum utility.However, when cost-performance tradeoffs need to be made, the user would get maximum operation-al utilitywith a transaction performance rate, 1,250 transactions per second, different from that in theformal requirement. Clearly, such situations offer opportunities for negotiation. You shouldrecognize such situations and negotiate these requirements with the customer.
5.2.2 How To NByGoTi PRoDucr Rmumm ms
The term "negotiating" is useful for describing the process frequently observed during the course ofa project. Negotiating is a search for "win-win" alternatives where no one loses. Negotiating is an inter-active process that converges upon a cost-effective set of requirements. The negotiation process is cy-clical and continuous throughout a project. Initial requirements are negotiated prior to, and during,the System Requirements Review (SRR) milestone. Changes occur after preliminary design review(PDR) as users make tradeoffs among costs and desired product functionality.
You should follow these steps when working with your customers to solidify requirements:
* Identify the subset of critical product attributes that the software product must meet to surviveand be successful. These attributes are the means for determining project success, and youneed to control them throughout the project. Other product attributes, those in the "like tohave" category, would not cause catastrophic system failure if they were not met. Obviously,
s-s

5. Setting Quantifiable Requirements and Goals and Managing to Them
a continuing close relationship with the customer is necessary to maintain awareness of thecustomer's current priorities and to ensure that the documented requirements are met. Whenpossible, use customer language in describing critical product attributes.
" Differentiate critical attributes of requirements from feasible solution(s), which arealternative ways of obtaining the results you want. Often solutions are confused with objec-tives, particularly in the early stages. My to avoid developing solutions to meet end-user needsbefore you have broken down those needs into product "attributes" and, negotiating with yourcustomer, have quantified those attributes and agreed to them. You must differentiate be-tween customer requirements and feasible solutions: you can easily mistake a feasible solution fora requirement.
" Quantify the minimum acceptable level for each critical attribute, e.g., "usability." This is acrucial step. Often in the past, the "minimum" level of performance and the "performanceobjective" have not been clearly differentiated. In Part 4B2c, DOD Instruction 5000.2 clearlyintends that the distinction be made in future acquisitions (Department of Defense 1991a).This step addresses that intention.
" Find and describe critical attributes that may seem so obvious that they are not written down.When you read a statement of customer objectives, it is wise to assume that the customer hasnot stated several of the most important attributes. This, paradoxically, is often because theseobjectives are so critical that the customer takes them for granted (Gilb 1988).
" Identify all product attributes in terms of measurable/testable results needed by the final enduser. Determine the limits within which each attribute can vary, such that the system will stillbe acceptable to the user.
5.2.3 How TO BEmwrr FROM PRIOR EXAMPIts OF QUNrAwrrV CRmCAL ATrrRuTzs
You would be wise to negotiate the specific, quantified measurable/testable attributes expressed in thecustomer's language with him. Table 5-5 shows examples of common critical attributes for softwareproducts that you can quantify. It shows examples of both critical performance factors and limited re-sources. The two columns are independent of each other. The left-hand column shows how you canexpress the critical performance attributes of workability, availability, adaptability, and usability inquantitative terms. An alternative expression for usability is shown in Section 10. "Uhble 5-5 shows eachattribute with a briefdefinition and shows in brackets {example measures}. For instance, here are thedefinition and examples for process capacity:.
Process capacity: measure of the ability to process units of work in units of time. {measurechosen: units of useful work per unit of time: transactions/second, display refreshes/second].
Equally necessary, and easier to quantify, are the limited development resources such as calendartime, people, and money shown in the right column.
The examples in Table 5-5 may help you negotiate with your customers the descriptions of specificquality attributes in the customers' language.
5-9

5. Setting Quantifiable Requirements and Goals and Managing to'Them
Table 5-5. Examples of Critical Quality Attributes for Software Products
Examples of Project-Critical Attributes
Quality Attributes Critical to Success Limited Resources
Workability: Measure of the raw ability of the system to perform Tune: Subattributes include:work. Subattributes can include:
* Calendar time elapsed to build a"* Process capacity- Measure of the ability to process units of system.
work. {measure chosen: units of useful work per unit oftime: transactions/second, display refreshes/second}. a Work days needed to
accomplish a task." Responsiveness: Measure of the reaction to a single event.
{measure time between two events in an "ask-answer"process: time from the question being understood by theoperator until the answer displays on the screen (no load),response time (when worst case activity load exists)}.
"* Storage capacity. The capacity of the system to store units ofany defined thin& {Characters/record, source instructions}.
Availability: Measure of how much a system is usefully available to People: Covers all people-relatedperform the work it was designed to do. Subattributes can include: resources such as "work years" to
construct a system and the people" Maintainability/improvability. Measure of how quickly needed to staff or operate it. Serves as
surrogates for customer's maintenance programmers can limiting objectives when designing abring an unreliable system to a reliable state in a system and controlling its resourcesimulation. In general, it includes recovezy from the consumption in operation.effects of a fault. {Measure time needed to correct errors,possiUy artifidaly inserted}.
"• Integrity. Measure of the trustworthiness of the system. Isit in the state it is supposed to be in? {Simulate threats ofdifferent types to measure the ability of installed securitytechniques to counteract them}.
Adaptability. Measures the system's ability to change or be Money- Covers all types of the monetarychanged without uncontrolled side effects. Subattributes include: costs of building and maintaining the
system.* Extendability: Measure of the ease of expansion of data
storage requirements or computational functions.{Negotiate, express in customer's language}.
* Portability: {Negotiate, express in customer's language}.
5.3 HOW TO MOTIVATE THE CUSTOMER TO QUANTIFY REQUIREMENTS
Although there are many reasons to quantify requirements now, it is a substantial change in culturefor both customers and developers. You need to motivate both your colleagues and your customersto quantify requirements. The following approaches have succeeded in allaying concerns and fears(Gilb 1988):
5-10

5. Setting Quantifiable Requirements and Goals and ManainS to Them
"Recognize that your organization may need to educate your customers with regard to allocatedsoftware requirements. In the next few years it is likely that few acquisitions will include fullyquantified requirements. This situation represents an opportunity for your organization togain competitive advantages.
" Appeal to your customers' need for clarity. Quantifying requirements reduces the risk of aproposal failing because of misunderstood requirements. It stimulates an earlier, more in-tense discussion among customer personnel about what they really want. As a result, you canprepare better estimates based on a firmer understanding of the real requirements. Your com-pany may use "design by objectives" to systematically engineer and cost a solution to thecustomer's requirements.
" Relate or trace quantified software requirements to customer and management requirements.By doing so, the customer is much more certain of getting what he wants. At the same time,the customer cannot surprise you later with more demanding results requirements than youexpected to have to deliver without being willing to pay for the changes.
" Show that quantified requirements do not require exact knowledge. Rough estimates (thatyoucan refine as data becomes available) are more useful than none at all. Often, you must expressestimates for controversial or especially significant values as uncertainty estimates, expectedvalues, or ranges of possible values. For further protection against misinterpretation, attacha short description of the assumed conditions under which the estimate is valid.
" Show your colleagues that quantified requirements are not set in stone. As user needs change(they always do), your company can more easily show that those needs are different fromearlier approved statements and justify a cost change.
5.4 SUMMARY OF RECOMMENDATIONS
By using the recommendations presented in this section as a foundation, you can fully benefit fromthe detailed measurement techniques presented in the following sections. You can:
" Reduce the amount of unnecessary rework by assessing the completeness of your team'sunderstanding of user needs/requirements and plan the work. Knowledge of how much userneed for each requirement is to be met is indispensable in delivering software products thatmeet user performance requirements and are delivered on time and within budget. Select themeasures based on user concerns and with the benefits they anticipate from a completed sys-tem. Future agreement is aided when you describe requirements in quantitative terms andassociate them with testable/measurable targets that enable you to verify performance.
" Avoid contention at project end by agreeing on how the customer will recognize success. Youand the customer need to agree on how he will recognize success (including responsibility foracceptance testing), the criteria to be used, and any warranties or other consequences of fail-ure. You should clearly establish links with customers who know the application well (to stayaware of approaching changes in requirements).
" Select measurements of software process and product according to the GQM paradigm. Usingthis paradigm helps you identify what measures you should use based on a rationale for theirselection. The paradigm provides a systematic approach to metric selection.
5-11

5. Setting Quantifiable Requirments and Goals and Managn to Them
"Identify and monitor with special care the handful of critical requirements: the few that thesoftware must meet (within ranges prespecified by users) for the system to satik y minimumuser needs. The critical attributes typically include measures describing how well the end userwants the software product to work, such as performance, reliability, user satisfaction, main-tainability, and extendability. No user will accept software if its performance level for a criticalattribute is less than the worst acceptable level he specified. This action is essential for settingpriorities and assigning staff and resources to the requirements of most value to the customer.
" Have measurements relate to requirements, and express requirements in quantitative terms.
5-12

6. MATHEMATICAL MODELING AND METRICSSELECTION
6.1 OVERVIEW
This section discusses mathematical modeling and its meaning and use in the context of softwaremetrics. It lists the benefits and limitations of mathematical models together with the rules of applica-tion for project control and process improvement. The GQM paradigm for the selection of softwaremetrics is presented. You should apply this paradigm when establishing project goals and softwaremetrics for process improvement and project control. Project goals are stated as numerical values oras simple mathematical models called software metrics. This section presents a set of software processand product metrics for size, cost, productivity, quality, and schedule. You can adopt this set for yourdevelopment environment to define, control, and improve your software development process.
You should use the measurements and metrics discussed in this section, representing actual softwaredevelopment experience, not only for controlling project performance but also for helping to setfuture software development planning and control standards and for process improvement.
6.2 MEASUREMENTS AND METRICS
This section provides some definitions, defines categories of metrics, and defines categories of code.
6.2.1 DommiNoNs
"Software measrabla. They are directly observable quantities that you can count, such assource statements (source lines of design [SLOD], source lines of code [SLOC], thousand ofsource lines of code [KSLOC]), or that you can otherwise measure, such as labor hours (LH)and labor months (LM). A measurable is a primitive.
" A software measurem . It is a number assigned to an observable aspect (i.e., a quantitativeassessment) of a software process or product (DeMarco 1982).
" A software mer*. It is a number assigned to a quantifiable concept that relates to a softwareproduct or to the process that created it. A metric is not always directly observable. A metricmay be a single measurable as defined above, or it may be a function of one or more measur-ables. For example, a SLOC is a measurable that is an indicator of software system size; there-fore, it is also a metric. SLOC/LM is a productivity metric that is composed of the measurables,SLOC and LM.
6-1

6. Mathematical Modeling and Metrics Selection
6.2.2 Mmrucs CATE-ORiES
The main categories of metrics are:
"* Product size (Section 6.7)
"* Product cost (effort) (Section 6.8)
"* Schedule (Section 6.9)
"* Quality (Section 6.10)
"* Product application environment (Section 6.11)
"* Development environment characterization (Section 6.12)
"* Development constraints (Section 6.13)
"• Development personnel characterization (Section 6.14)
The metrics in each of these categories are discussed later in this section as indicated.
6.2.3 BAsxc MN•R•SURWr Sir
Your software organization should implement the collection of a basic measurement set, if it has notalready done so. A recommended basic set is given in "hble 6-1. This set corresponds to the basic setpresented by the Software Engineering Institute (Carleton et al. 1992) with one exception: this guide-book recommends logical source statements (see Section 6.24) as the prime measure of size. Logicalsource statements are recommended because their count is subject to less variability. In addition tological source statements (LSSs), you may want to count physical source statements (PSSs) in orderto compare with others who count physical statements (Carleton et al. 1992). You can derive thesemetrics in terms of the GQM paradigm described in Section 6.4.
"Ihble 6-1. Recommended Basic Measurement Set
Metric MetricCategory (Measurement) Definition
Size SLOC or KSLOC Logical source statements without comments.(PSSs for comparison purposes.) Identifylanguage and separate new and reused codecounts.
Effort Labor hours (LH) Effort for each activity, at least to the level ofrequirements, design, etc. Prefer LH to LM.
Schedule Calendar time Total development time. Completion times(months, weeks) for principal milestones such as CDR, etc.
Quality Defects Normalim to KSLOC (de XSLO. Cectat each stag of development.
In addition to the above recommended basic measurement set, you should always identify and recordthe development and target computers by type and model.
6-2
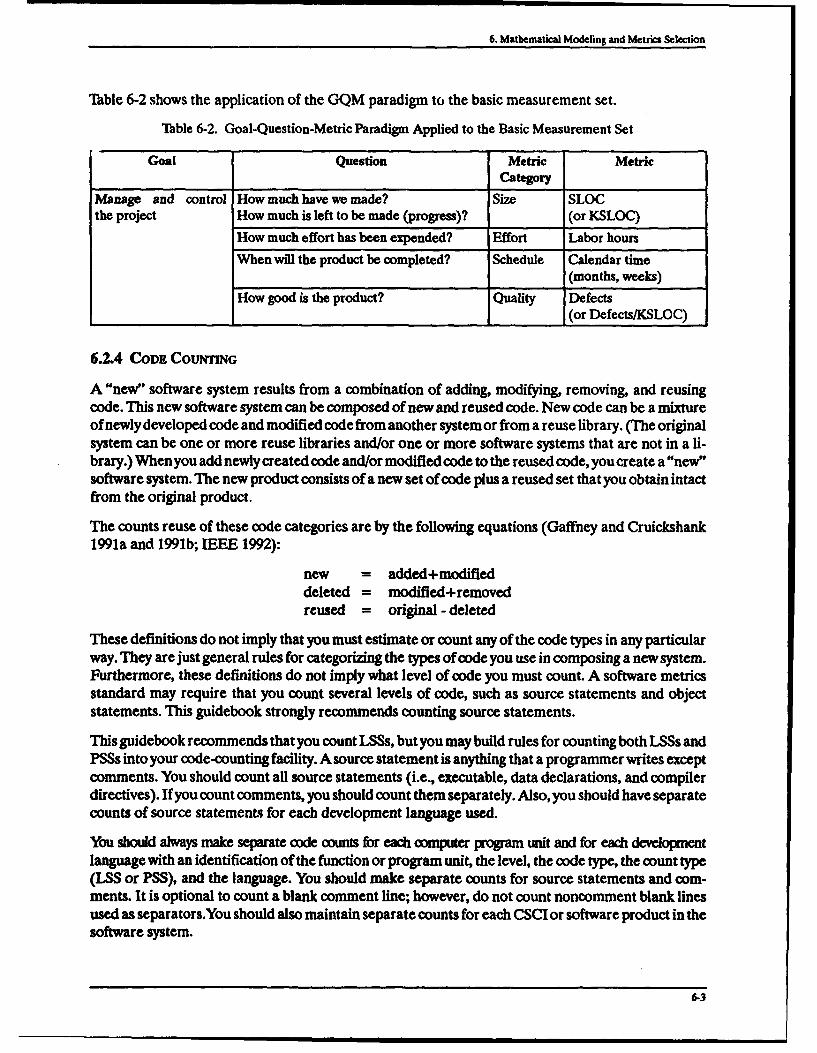
6. Mathematical Modeling and Metrics Selection
Thble 6-2 shows the application of the GQM paradigm to the basic measurement set.
Table 6-2. Goal-Question-Metric Paradigm Applied to the Basic Measurement Set
Goal Question Metric MetricCategory
Manage and control How much have we made? Size SLOCthe project How much is left to be made (progress)? (or KSLOC)
How much effort has been expended? Effort Labor hoursWhen will the product be completed? Schedule Calendar time
(months, weeks)
How good is the product? Quality Defects(or Defects/KSLOC)
6.24 CODE COUNTING
A "new" software system results from a combination of adding, modifying, removing, and reusingcode. This new software system can be composed of new and reused code. New code can be a mixtureof newly developed code and modified code from another system or from a reuse library. (The originalsystem can be one or more reuse libraries and/or one or more software systems that are not in a li-brary.) When you add newly created code and/or modified code to the reused code, you create a "new"software system. The new product consists of a new set of code plus a reused set that you obtain intactfrom the original product.
The counts reuse of these code categories are by the following equations (Gaffney and Cruickshank1991a and 1991b; IEEE 1992):
new = added+modifieddeleted = modified+removedreused = original -deleted
These definitions do not imply that you must estimate or count any of the code types in any particularway. They are just general rules for categorizing the types of code you use in composing a new system.Furthermore, these definitions do not imply what level of code you must count. A software metricsstandard may require that you count several levels of code, such as source statements and objectstatements. This guidebook strongly recommends counting source statements.
This guidebook recommends that you count LSSs, but you may build rules for counting both LSSs andPSSs into your code-counting facility. A source statement is anything that a programmer writes exceptcomments. You should count all source statements (i.e., executable, data declarations, and compilerdirectives). If you count comments, you should count them separately. Also, you should have separatecounts of source statements for each development language used.
You should always make separate code counts for each computer program unit and for each devekpmentlanguage with an identification of the function or program unit, the level, the code type, the count type(LSS or PSS), and the language. You should make separate counts for source statements and com-ments. It is optional to count a blank comment line; however, do not count noncomment blank linesused as separators.You should also maintain separate counts for each CSCI or software product in thesoftware system.
6-3

6. Mathematical Modeling and Metrics Selection
6.3 MATHEMATICAL MODELING
The creation and use of mathematical models is an integral part of software measurement practice.Software measurements are quantified observable aspects of software processes and products, andsoftware metrics are mathematical functions of these software measurements. These functions arecalled mathematical models, and they provide a framework for relating various software measures tomake predictions of size, cost, schedule, and quality. Mathematical models also provide proceduresfor relating one set of metrics to another, such as generating productivity metrics from size and effortmetrics or generating a resource profile from effort and schedule metrics. This guidebook presentsand shows the application of many types of mathematical models that can be used in processimprovement and project control.
A mathematical model is an idealized representation of a real-world situation, such as a problem. Thisrepresentation is actually an abstraction, a simplified representation of reality, to which mathematicscan be applied to yield information about the problem. You employ mathematical models as an aidin analyzing and in problem-solving to answer a question, to help in decision-making, and/or to makea prediction. In employing mathematical models you, in effect, reduce the level of complexity withwhich you must deal. This reduction enables you to focus on the aspects of the situation that the modesprovide which interests the information users. This user might be the person who has asked a question,a person who must make a decision or a person who wishes to make a prediction.
A mathematical model should be in a form amenable to using mathematical manipulations andtechniques, and the model and its application should be understandable, at least on an elementarylevel, to the user of the model outputs and results. The results of applying the model must be credibleto the information user; he should be comfortable with the idea that the model results apply to his(perhaps) larger problem. The model must be of practical use in decision making.
Fimally, a mathematical model must be verifiable in the sense that real-world inputs to the model produceoutputs that both the modeler and the user know correlates with established real-world conditions. Thbis verifi-cation can be intuitive in the sense that the model results "make sense" or it can be analytical based oninformation gathered from xperience or from other models: both objective and subjective.
Both the modeler and the user of a mathematical model must understand its limitations. They mustunderstand that the model represents a simplified view of reality, and it does that in an approximatefashion. Then, being cognizant of these characteristics, they must recognize that the model can onlybe applied to a limited set of situations. They must recognize that mathematical modeling reducescomplexity and thus may limit the generality of the results of applying the model. The user must tailorhis expectations to the limited environment that is being modeled and to the specific problem addressed.
6.4 SELECTION OF METRICS USING THE GOAL-QUESTION-METRIC PARADIGM
The GQM paradigm is a framework for the systematic specification of metrics appropriate for anidentified need for an information consumer (such as a project manager, a software manager, or asoftware quality assurance group). The paradigm indicates who needs to know what and why this per-son or group needs to know it (Weiss 1981; Basili and Weiss 1984).You select software process andproduct measurements according to the GQM paradigm. Using the paradigm helps you avoid pickingmeasures "out of the air." Following it aids you in identifying what measures you should use based ona rationale for their selection. The three principal steps of the GQM paradigm are:
6-4
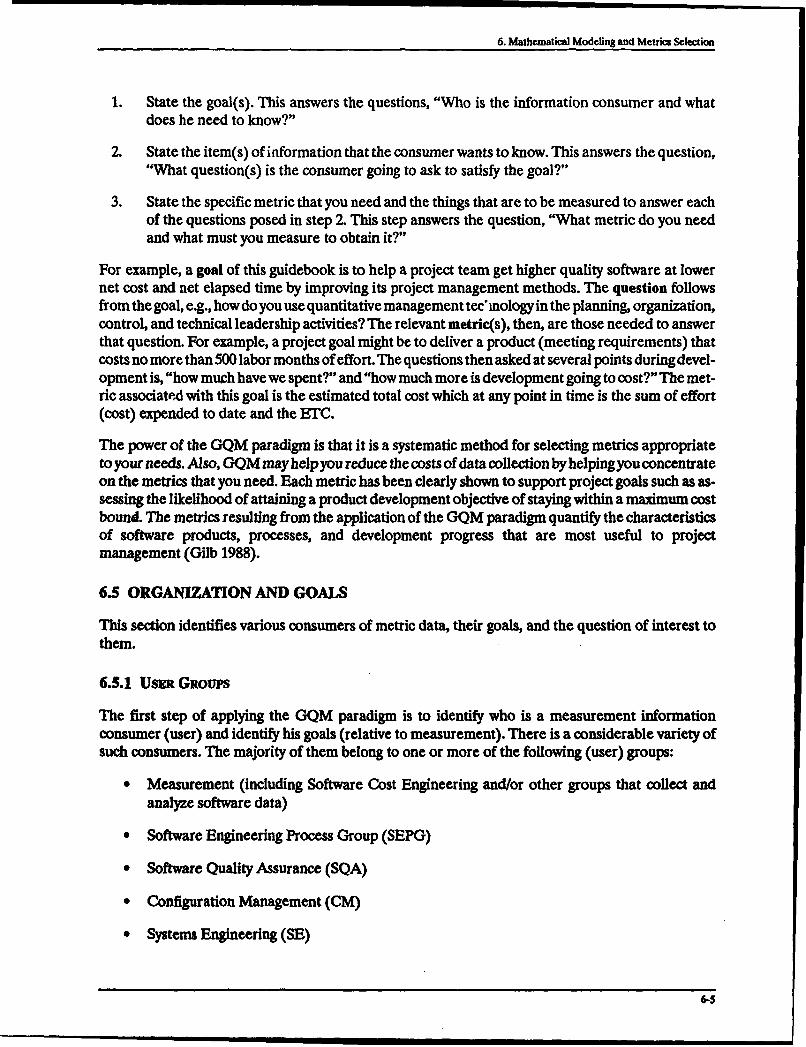
6. Mathematical Modeling and Metrics Selection
1. State the goal(s). This answers the questions, "Who is the information consumer and whatdoes he need to know?"
2. State the item(s) of information that the consumer wants to know. This answers the question,"What question(s) is the consumer going to ask to satisfy the goal?"
3. State the specific metric that you need and the things that are to be measured to answer eachof the questions posed in step 2. This step answers the question, "What metric do you needand what must you measure to obtain it?"
For example, a goal of this guidebook is to help a project team get higher quality software at lowernet cost and net elapsed time by improving its project management methods. The question followsfrom the goal, e.g., how do you use quantitative management tec'mology in the planning, organization,control, and technical leadership activities? The relevant metric(s), then, are those needed to answerthat question. For example, a project goal might be to deliver a product (meeting requirements) thatcosts no more than 500 labor months of effort. The questions then asked at several points during devel-opment is, "how much have we spent?" and "how much more is development going to cost?" The met-ric associated with this goal is the estimated total cost which at any point in time is the sum of effort(cost) expended to date and the ETC.
The power of the GQM paradigm is that it is a systematic method for selecting metrics appropriateto your needs. Also, GQM may help you reduce the costs of data collection by helping you concentrateon the metrics that you need. Each metric has been clearly shown to support project goals such as as-sessing the likelihood of attaining a product development objective of staying within a maximum costbound. The metrics resulting from the application of the GQM paradigm quantify the characteristicsof software products, processes, and development progress that are most useful to projectmanagement (Gilb 1988).
6.5 ORGANIZATION AND GOALS
This section identifies various consumers of metric data, their goals, and the question of interest tothem.
6.5.1 UsER GRoups
The first step of applying the GQM paradigm is to identify who is a measurement informationconsumer (user) and identify his goals (relative to measurement). There is a considerable variety ofsuch consumers. The majority of them belong to one or more of the following (user) groups:
"* Measurement (including Software Cost Engineering and/or other groups that collect and
analyze software data)
"* Software Engineering Process Group (SEPG)
"* Software Quality Assurance (SQA)
"* Configuration Management (CM)
"• Systems Engineering (SE)
6-5

6. Mathematical Modeling and Metrics Selection
"* Project or Program Management
"* Software Management (various levels, each of which may have different information needs;one may want to know about design, but another may want to know about testing, for example)
"* Finance/Accounting
"* Software Engineering (both development and test groups, each of which may have differentinformation needs)
Thble 6-3 provides an association of the top-level process improvement goals discussed later in thissection with the involved groups. An "X" indicates that the indicated group is actively involved in theindicated process improvement goal.
Table 6-3. Top-Level Process Improvement Goals and Involved Groups/Users
Understand and Produce/Update Support TechnologyQuantify Software Estimation Change Impact
Involved Group Process Algorithms Analysis
Project/Program Management X X
Software Management X X
Measurement X X X
Software Engineering XSEPG X X X
SQA X X X
CM X
SE X X"Finance/Accountiog "X
Table 6-4 provides an association of the top-level project control metrics goals discussed later in thissection and the involved groups. An "X" indicates that the indicated group is actively involved in theindicated project control goal.
"lible 6-4. Top-Level Project Control Goals and Involved Groups
Assess Prems Product Compare To Coeru"Involved Group Status Status Goals Action
Projet/rm Management X X X XSoftware Management X X X X
Measurement X X X X
Software Engineering X X X
SEPG X X X X
SQA X X -
CM X --
SE X X XFinance/Accounting -- X x -
6-6a I !l I

6. Mathematical Modeling and Metrim Selection
Tables 6-3 and 6-4 are not intended to suggest that the indicated groups are associated with the goalson every software development project. While each group of consumers has the goal of product assess-ment, this does not mean that each group would be interested in precisely the same data set. One groupmay be interested in a view at a higher level than another. For example, a program manager wouldprobably not be interested in the detailed status of a CSCI design, code, and test. Instead, he wouldmost likely want to know only one measure indicative of the CSCI's degree of completion: one thatcovers all of the activities which comprise the development process. Such a top-level measure is"earned value" and is discussed in Section 11.
Table 6-5 presents the management goals for project control. The goals are cross-referenced to theproject control questions presented in Table 6-8. Management goals for process improvement are notgiven because they are closely tied to the organization's specific development process, and thisguidebook does not discuss organization-specific process detail.
Table 6-5. General Management Goals, Measurement Activities, and Questions for Project Control
General Management Goals Measurement Activities Questions
1. Stay on schedule. 1.1 Determine schedule. 1,2,3.7, 11.3
2. Stay within budget. 2.1 Do cost estimate. 2,3.4,3.5,3.6,6,7,8,1122.2 Do size estimate. 3.1,3.2,4,6,11.1
3. Maximize requirements stability. 22 Do size estimate. 3.1,3.2,4,6,11.14. Maximize staff stability. 5.1 Develop staffing profile for each 2
development activity and for projectoverall.
5. Meet product quality 6.1 Determine defect content at each 3.3requirements. process stage.
6.2 Estimate defect content at delivery. 3.3, 11.46.3 Estimate defect discovery rate during 3.3
operation.6. Keep product development 7.1 Determine status of each unit of the 2,3.4,4,5,11.1,13
consistent with resource software product.expenditure. 7.2 Determine overall software product 2,3.4,4,5,11.1,13
status and earned value.
7. Meet product performance 8.1 Estimate memory utilization. 4,11.1,14.1goals. 82 Estimate processing capacity 4,11.1,142
utilimfton. 4,11.1,14.38.3 Estimate 1/0 capacity utilization.
8. Minimize project risk. 9.1 Estimate risks. 12
Table 6-6 presents some typical goals of each of the involved groups. The list is not exhaustive, but itshows how goals and their associated activities differ among the involved groups.
6-7

6. Mathematical Modeling and Metrics Selection
Table 6-6. Decomposition of Project Control Goals
Involved Group Group Activities and Project Control Goals
Project/Program Deliver product on schedule.Management Develop product within budget.
Meet product specifications/requirements.Meet stated level of product quality.Minimize/eliminate project risk.Maximize profit.Maintain security.Maximize staff stability.
Software Deliver software on schedule.Management Deliver software within budget.
Meet stated level of software quality.Stay within software size constraint.Keep development productivity above xxx SLOC/LM.Keep resources spent consistent with earned value attained.
Measurement Track and monitor software development to anticipate problems.Provide metrics information to management to aid in corrective action.Collect software experience measurements for process and product improvement.Provide measurements to aid in incremental process improvement.Provide metrics to revise/improve software standards.Maintain a software development experience database.
Software Design to requirements.Engineering Meet functional objectives.
Meet software performance goals.Develop all software by structured methods.Develop software in a manner consistent with standards.
SEPG Raise the process maturity level.RevisefImprove the software development standards.Define new development processes and methods to lower cost and raise quality.Track the software action items (SAIs).
SQA ain all software developers in design and code inspection methods.Maintain a quality experience database.Audit the development project for compliance to quality standards.Deliver software with an estimated latent defect density of at most 1.0.
CM Organize a Software Change Control Board and meet regularly.Audit the project for compliance to configuration management standards.Review the configuration of every software build for correctness.
SE Maintain a Engineering Change Proposal (ECP) database.Monitor the status of all ECPs.Maintain a Program 'rouble Report (PIR) database.Monitor the status of all PTRs.Define and communicate all software requirements.Maintain and audit requirements traceability.Minimize interface problems.
Finance/Accounting Establish and maintain a separate tier of cost accounts for each CSCI.Establish and maintain a separate cost account for every development activity.Audit and monitor project financial status.
6.6
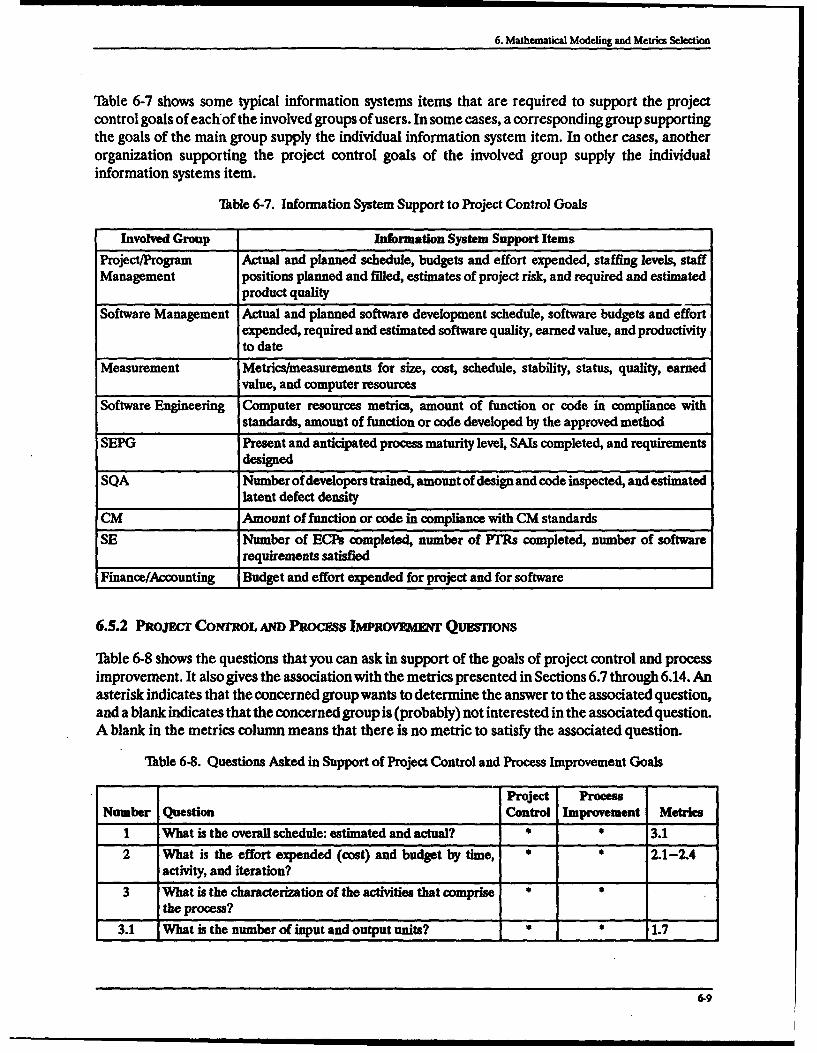
6. Mathematical Modeling and Metrics Selection
Table 6-7 shows some typical information systems items that are required to support the projectcontrol goals of each of the involved groups of users. In some cases, a corresponding group supportingthe goals of the main group supply the individual information system item. In other cases, anotherorganization supporting the project control goals of the involved group supply the individualinformation systems item.
Table 6-7. Information System Support to Project Control Goals
Involved Group Information System Support Items
Project/Program Actual and planned schedule, budgets and effort expended, staffing levels, staffManagement positions planned and filled, estimates of project risk, and required and estimated
product qualitySoftware Management Actual and planned software development schedule, software budgets and effort
expended, required and estimated software quality, earned value, and productivityto date
Measurement Metrics/measurements for size, cost, schedule, stability, status, quality, earnedvalue, and computer resources
Software Engineering Computer resources metrics, amount of function or code in compliance withstandards, amount of function or code developed by the approved method
SEPG Present and anticipated process maturity level, SAIs completed, and requirementsdesigned
SQA Number of developers trained, amount of design and code inspected, and estimatedlatent defect density
CM Amount of function or code in compliance with CM standardsSE Number of ECPs completed, number of FIRs completed, number of software
requirements satisfied
Finance/Accounting Budget and effort expended for project and for software
6.5.2 PRoJEcr CONTROL AND PRocEss IMPROvm QUESTIONS
Table 6-8 shows the questions that you can ask in support of the goals of project control and processimprovement. It also gives the association with the metrics presented in Sections 6.7 through 6.14. Anasterisk indicates that the concerned group wants to determine the answer to the associated question,and a blank indicates that the concerned group is (probably) not interested in the associated question.A blank in the metrics column means that there is no metric to satisfy the associated question.
Table 6-8. Questions Asked in Support of Project Control and Process Improvement Goals
Project ProcessNumber Question Control Improvement Metrics
1 What is the overall schedule: estimated and actual? 3.12 What is the effort expended (cost) and budget by time, 2.1-2.4
activity, and iteration?
3 What is the characterization of the activities that comprise .the process?
3.1 What is the number of input and output units? 1.7
6-9
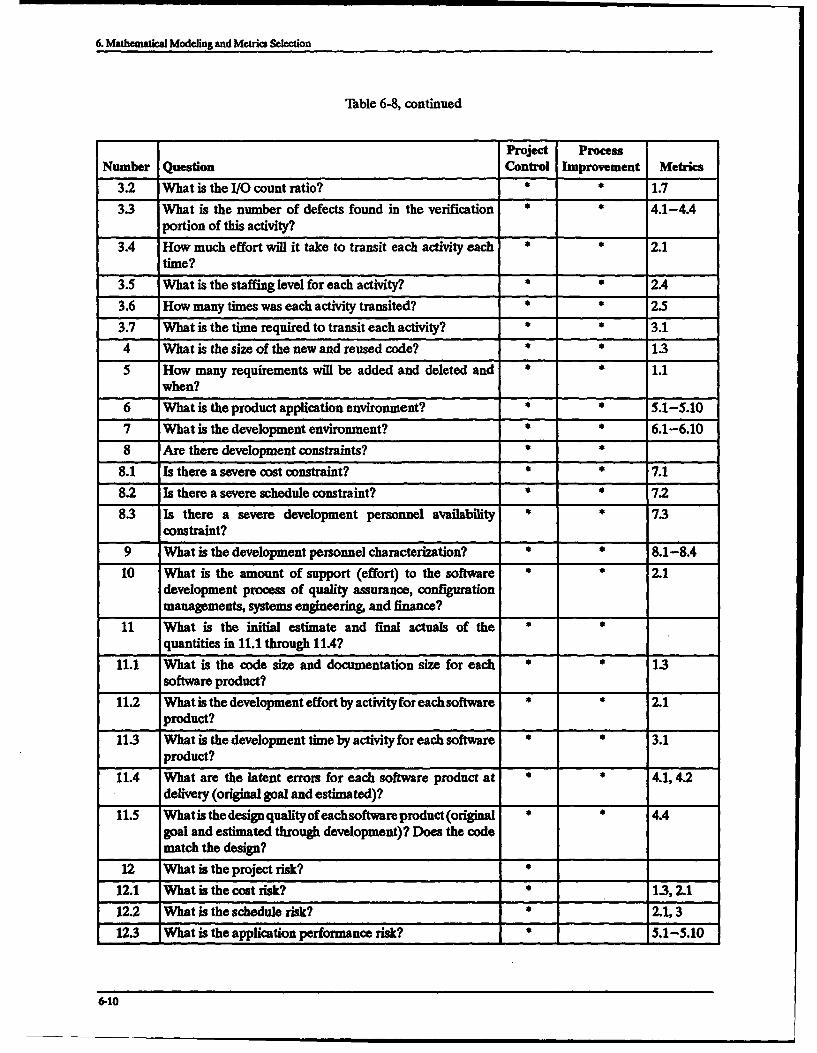
6. Mathematical Modeling and Metrics Selection
Table 6-8, continued
Project Process
Number Question Control Improvement Metrics
3.2 What is the I/O count ratio? 1.7
3.3 What is the number of defects found in the verification 4.1-4.4portion of this activity?
3.4 How much effort will it take to transit each activity each 2.1time?
3.5 What is the staffing level for each activity? 2A *_.4
3.6 How many times was each activity transited? __*_2.5
3.7 What is the time required to transit each activity? * *_3.1
4 What is the size of the new and reused code? 13
5 How many requirements will be added and deleted and * 1.1when?
6 What is the product application environment? 5.1-5.10
7 What is the development environment? * * 6.1-6.10
8 Are there development constraints? * *
8.1 Is there a severe cost constraint? a * 7.1
8.2 Is there a severe schedule constraint? a * 7.2
83 Is there a severe development personnel availability * 73constraint?
9 What is the development personnel characterization? * * 8.1-8.4
10 What is the amount of support (effort) to the software * * 2.1development process of quality assurance, configurationmanagements, systems engineering and finance?
11 What is the initial estimate and final actuals of the a *
quantities in 11.1 through 11.4?
11.1 What is the code size and documentation size for each a a 1.3software product?
11.2 What is the development effort by activity for each software a * 2.1product?
113 What is the development time by activity for each software * * 3.1product?
11.4 What are the latent errors for each software product at a * 4.1,4.2delivery (original goal and estimated)?
11.5 Whatis the design qualityof eachsoftware product (original a a 4.4goal and estimated through development)? Does the codematch the design?
12 What is the project risk? a
12.1 What is the cost risk? a 13,2.1
12.2 What is the schedule risk? a 2.1,3
12.3 What is the application performance risk? 5.1-5.10
6-10

6. Mathematical Modeling and Metrics Selection
lTble 6-8, continued
Project Process
Number Question Control Improvement Metrics
12.4 What is the risk in requirements stability? * 1.1
12.5 What is the risk in unstaffed positions? * 2.4
13 What is the status? *
13.1 What is the status of each software product in each 1.1, 1.2,development activity? 1.3, 1.4,
1.5,1.6,2
13.2 What is the earned value of each software product? * 1.7
13.3 What is the overall project status? * 1.0,2.0
14 What is the estimated utilization of the target processor? *
14.1 Memory? * 5.8
14.2 Amount of processing capacity? * 5.9
14.3 Amount of 1/0 capacity? * 5.10
6.6 DERIVATION OF UNIT COSTS FOR NEW AND REUSED CODE
Unit cost is an important metric regardless of the activity or set of activities to which it applies. If youhave no other information about the unit cost for an activity, you can select a value for this metric. Thevalue selected can be an estimate based on industry experience, or it can be a unit cost goal selectedby your management. However, ifyou have cost performance data based on past projects such as mightbe contained in your organization's experience database, then you can calculate unit costs by themethod presented in this section.
6.6.1 UNrr CoSTS
The cost of software development can be expressed as:
C=CN+CR
where C is the cost in LM (or LH) of the software product in question, CN is the cost of developingnew code for the product, and CR is the cost of reusing code for the product. This cost includes allactivities from design through integration and system test, but it does not include any costs of amortiz-ing the development of code that is reused. (A more general model does include the amortizationcosts, and more detail on this model can be found in Section 8.) Documentation costs (contractdeliverables) are included; however, support costs are not included. You can express CN and CR asthe product of a unit cost in LM/KSLOC (or LH/SLOC) and a size in KSLOC (or SLOC) for new andreused code, respectively, as:
C = CVN * SN + Cv R "
where CvN is the unit cost in LM/KSLOC of new code, CVR is the unit cost of reusing code, SN is thesize of the new code in KSLOC, and SR is the size of the reused code.
6-11

6. Mathematical Modeling and Metrics Selection
Separate unit costs for new and reused code will usually not be directly observable, although theoverall cost of development and the sizes will be measurable. The overall cost comes from accountingrecords, and the sizes result from counts of the SLOC. Sinct the individual unit costs are notobservable, they are unknowns. However, you can estimate them as follows:
Denote the unknown unit cost parameters, CVN and CVR, by u and v and consider software productj. The general cost equation is:
C$= u SN+V.SR
Assume that data on software size and cost for m similar development projects (similar applicationsdeveloped using similar environments) are available. Since you are to calculate two parameters, u andv, you need data from at least two projects. However, if more than two project data sets are available,you should use all of the applicable data sets (i.e., those from similar development projects) sincegreater accuracy in the calculated unit costs will result. You can formulate this data in matrix form asfollows:
5 N.2 S~, *l
X= .B.=Y= B=
where SNj and SRj are the sizes in KSLOC (or SLOC or other appropriate unit) of new and reused
code in project j, and C_ is the cost of software development in project j.
Then you may solve the matrix equations (Graybill 1961) to get the values of u and v.
(XTX)B = XTY
B = (XT - X3Y
Remember that the weights u and v are really the (estimated) unit costs of the activities of developingnew code and of reusing code. You can use these unit costs for cost estimation as shown in Section 8.You can apply this mathematical technique, using all appropriate project cost and size data, to eachdevelopment activity (e.g., design, implementation, and test), and you can compute separate unit costsfor each of these activities. Furthermore, you can apply the technique, using all project data, to theconstituent activities of the development process (if cost and size data are available) and computeseparate unit costs for activities (or a groups of several activities).
Of course, the values of u and v (i.e., CvN and CVR) you have computed apply to the distinct type ofsoftware product under consideration and the environment used in the development of the projectsfrom whose cost and size data their values were estimated. You should not mix the cost and size datafrom different types of software when computing these unit costs. For example, display software andcontrol software should have unique unit costs for development activities, so you should not mix theirsizes and costs in this type of computation. Further, the values of CVN and CvR that you have
6-12

6. Mathematical Modeling and Metrics Selection
computed can be connected and used only for some range of size values. The numerical relationshipmay change for a different range of size values.
As an example, suppose that data is available (perhaps from your experience database) for threeprevious projects as follows:
x= 0 5.5[ B= 0-9
This data indicates that project 1 was composed of 25 KSLOC of new code and 75 KSLOC of reusedcode and that the total development effort was 205.0 LM. The other row vectors indicate similarinformation for projects 2 and 3.
The inverse of the XTX matrix is:
(xTx 10.769 - .641=- 11.641 22.1J"°-
Since the elements of the X matrix are KSLOC of new code and KSLOC of reused code and since theelements of the Y matrix are LM for development, the elements of the B matrix are LM/KSLOC fornew code, u, and for reused code, v. The unit cost for new code, u = CVN, is 5.96 LM/KSLOC, andthe unit cost for reused code, v = CvR, is 0.35 LM/KSLOC.
6.6.2 EQ•ivALE- SOURCE STATEMEws
The (cost) equivalent size of a system composed of new and reused code (Gaffney 1983; Cruickshank1984 and 1988) is represented by the ESLOC metric which combines the two metrics of new and re-used source statements into one size metric. You can define the metric either in terms of SLOC orKSLOC (one thousand source lines of code). It combines new code (N) and reused code (R) sizes intoone size metric that is cost-equivalent to all new code. The definition is:
ESLOC = (SLOC)N + w(SLOC)R
KESLOC = (KSLOC)N + w(KSLOC)R
The ESLOC (or KESLOC) metric assigns a weight of 1.00 to new SLOC and a weight of w<1.00 toreused SLOC. Experience shows that w typically has a value of 0.04 to 0.31, which means that reusedcode costs (on a per statement or per unit basis) is 0.04 to 0.31 as much as the new code to be includedin the system being developed.Using a value of 0.30, a software product composed of 100 KSLOC ofnew code and 190 KSLOC of reused code has 100+(0.30)190= 157 KESLOC. This example illustratesthe representation of size by one number when there are two code types present.
In the example of CvN and CVR previously given, the weight for equivalent code is:
SCVR=v 0.35_0.06
These results are within the range of some specific experience with real-time embedded softwaredevelopment.
6-13
6. Mathematical Modeling and Metrics Selection
The ESLOC and KESLOC concepts allow you to compute overall size and unit cost or productivitymetrics for software products that include both new and reused code. The ESLOC concept facilitatesquality assurance size and productivity comparisons among computer programs and amongdevelopment projects with varying code mixtures.
Your organization should determine a standard value for the weight w so that all definitions andcalculations of ESLOC will be on the same basis and will be comparable. The precise value of w willbe a characteristic of the development environment and process.
As used above, it is possible to define the ESLOC metric in terms of more than the two code types.For example, you could use the categories of new (N), modified (M), and reused (R). In this caseESLOC would be defined as:
ESLOC = (SLOC)N + W1 • (SLOC)M + w2• (SLOC)R
For this and similar definitions of ESLOC metrics, you have to derive numerical values for the weights,and such a derivation depends on a very detailed quantitative knowledge of your software develop-ment process and the unit costs that compose it. For convenience and because of lack of data, it is usu-ally assumed that modified code costs the same (and therefore has the same weight) as new code. Inmost cases, reusing code costs less than developing new code, as previously asserted. It is usually truethat reused components cost less to use than modified components. (Cruickshank 1988).
It may be assumed that deleting or removing code has no cost, i.e., code deletion or removal has a unitcost of 0.00 LM/KSLOC or LH/SLOC. In this case, the cost impacts of deletion or removal are as-signed to the costs of new code development. Generally speaking, by using this type of code in yourcost calculations, you are assigning the costs to the categories of code even though there actually maybe more than the two code categories of new and reused.
Since the weight for reused code is relative to new code, the weight for reused code in the ESLOCrelation is w=(v/u), where the weights u and v are derived in the previous subsection. You calculateESLOC and KESLOC as:
ESLOC (or KESLOC) = SN + (v/u)SR
6.7 PRODUCT SIZE METRICS
Table 6-9 shows the software product size metrics.
6-14
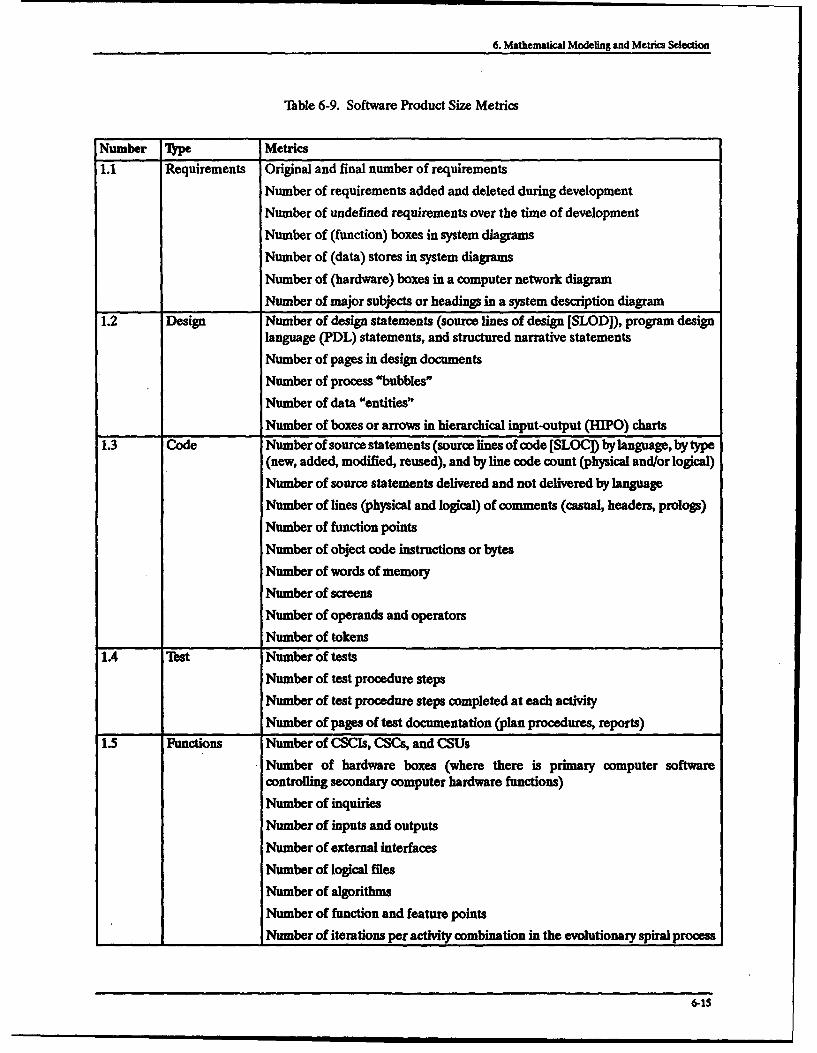
6. Mathematical Modeling and Metrics Selection
Table 6-9. Software Product Size Metrics
Number Type Metrics
1.1 Requirements Original and final number of requirements
Number of requirements added and deleted during development
Number of undefined requirements over the time of development
Number of (function) boxes in system diagrams
Number of (data) stores in system diagrams
Number of (hardware) boxes in a computer network diagram
Number of major subjects or headings in a system description diagram
1.2 Design Number of design statements (source lines of design [SLOD]), program designlanguage (PDL) statements, and structured narrative statements
Number of pages in design documents
Number of process "bubbles"
Number of data "entities"
Number of boxes or arrows in hierarchical input-output (HIPO) charts
1.3 Code Number of source statements (source lines of code [SLOC]) by language, by type(new, added, modified, reused), and by line code count (physical and/or logical)
Number of source statements delivered and not delivered by language
Number of lines (physical and logical) of comments (casual, headers, prologs)
Number of function points
Number of object code instructions or bytes
Number of words of memory
Number of screens
Number of operands and operators
Number of tokens
1.4 Test Number of tests
Number of test procedure steps
Number of test procedure steps completed at each activity
Number of pages of test documentation (plan procedures, reports)
1.5 Functions Number of CSCIs, CSCs, and CSUs
Number of hardware boxes (where there is primary computer softwarecontrolling secondary computer hardware functions)
Number of inquiries
Number of inputs and outputs
Number of external interfaces
Number of logical files
Number of algorithms
Number of function and feature points
Number of iterations per activity combination in the evolutionary spiral process
6-IS
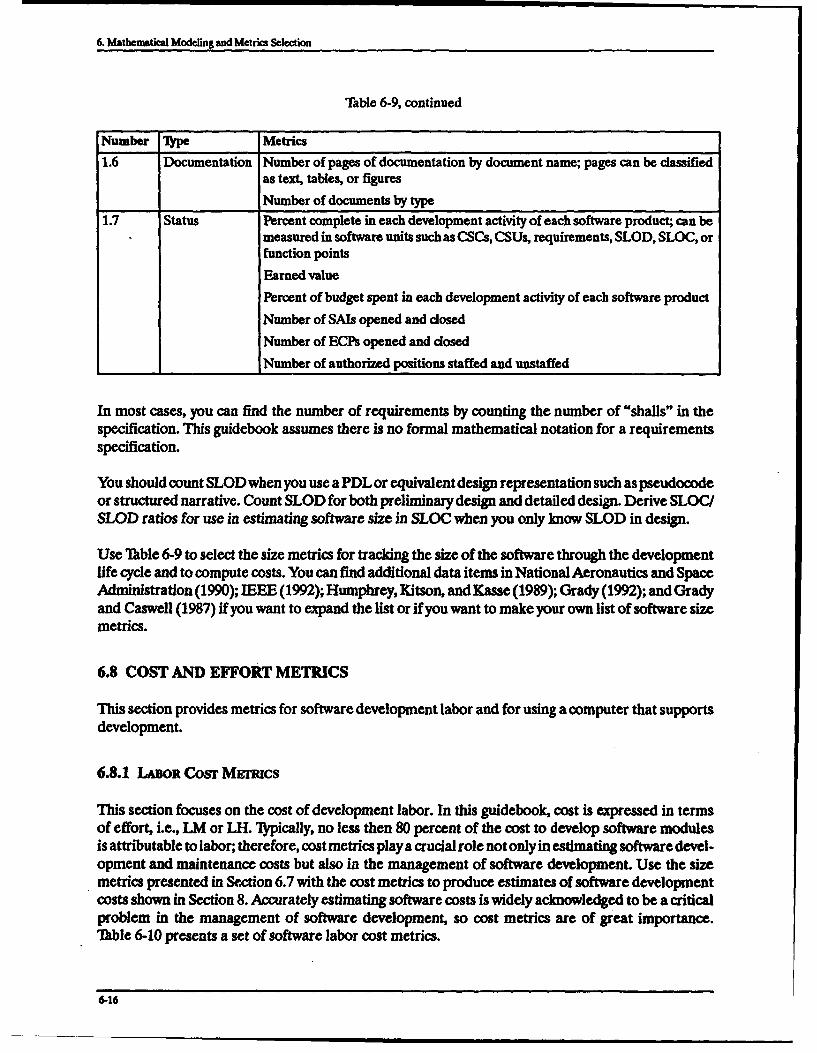
6. Mathematical Modeling and Metrics Selection
Table 6-9, continued
Number ¶hn Metrics
1.6 Documentation Number of pages of documentation by document name; pages can be classifiedas text, tables, or figures
Number of documents by type1.7 Status Percent complete in each development activity of each software product; can be
measured in software units such as CSCs, CSUs, requirements, SLOD, SLOG, orfunction pointsEarned value
Percent of budget spent in each development activity of each software product
Number of SAls opened and dosed
Number of ECPs opened and dosed
_ Number of authorized positions staffed and unstaffed
In most cases, you can find the number of requirements by counting the number of "shalls" in thespecification. This guidebook assumes there is no formal mathematical notation for a requirementsspecification.
You should count SLOD when you use a PDL or equivalent design representation such as pseudocodeor structured narrative. Count SLOD for both preliminary design and detailed design. Derive SLQC/SLOD ratios for use in estimating software size in SLOC when you only know SLOD in design.
Use Table 6-9 to select the size metrics for tracking the size of the software through the developmentlife cycle and to compute costs. You can find additional data items in National Aeronautics and SpaceAdministration (1990); IEEE (1992); Humphrey, Kitson, andKasse (1989); Grady (1992); and Gradyand Caswell (1987) if you want to expand the list or if you want to make your own list of software sizemetrics.
6.8 COST AND EFFORT METRICS
This section provides metrics for software development labor and for using a computer that supportsdevelopment.
6.8.1 LABOR CosT MMIUcs
This section focuses on the cost of development labor. In this guidebook, cost is expressed in termsof effort, i.e., LM or LH. ¶lypically, no less then 80 percent of the cost to develop software modulesis attributable to labor; therefore, cost metrics play a crucial role not only in estimating software devel-opment and maintenance costs but also in the management of software development. Use the sizemetrics presented in Section 6.7 with the cost metrics to produce estimates of software developmentcosts shown in Section 8. Accurately estimating software costs is widely acknowledged to be a criticalproblem in the management of software development, so cost metrics are of great importance."IUble 6-10 presents a set of software labor cost metrics.
6-16

6. Mathematical Modeling and Metrics Selection
Table 6-10. Software Cost Metrics
Number 1rpe Metrics
2.1 Effort (cost) Initial estimate and final actuals of effort (cost) in LM, LH, and/or dollars foreach activity in each software product
Budgets in LM, LH, and/or dollars for each activity in each software product
Amount spent in LM, LM, and/or dollars for each activity in each softwareproduct
2.2 Computer Budgets and actuals of computer dollars spent for each development activity forsupport each software product
2.3 Risk Number of risk management activities (including risk aversion and iterations)management associated with a development activityactivities
2.4 Staffing Number of full-time equivalent positions authorized and filled
You can measure software costs labor by LM, LH, and dollars. In estimating costs, you estimate LMor LH first and then convert them to dollars. LM and LH are the primary measures of cost since usingthese cost measures facilitates comparisons among different projects at different times. State the costsof activities comprising the software development life cycle in terms of LM or LH. You can state thesecost measures in terms of dollars once you determine the proper labor categories.
You can compare measurements of cost in LM or LH with other measurements in LM or LH that youmade at different points in time: such as with previous projects. Measurements made in dollars aredifficult to compare through time or among development projects done by different organizations be-cause of variability in unit costs (in dollars) among organizations and in the value of the dollar andbecause of the changing cost of labor. You first make estimates in LM or LH and convert them to dol-lars for proposal and budgetary purposes. Normally, you use LM or LII as the primary estimationquantity. If you use LM, be sure to state the number of LH per LM.
Collect cost data in LM or LH for the total labor expended: normal time plus overtime. Keep separatecost accounts for each CSCI in the WBS, and keep a separate cost account for each of the activities inthe WBS development process. The development activities' cost accounts should tier up to the CSCI totaldevelopment cost account, and there should be a separate tiering structure for each CSCI. If parts of aCSCI use different development processes, each process should be a separate tiering structure. Such anaccounting scheme makes budgeting more precise and makes collecting costs much easier.
This guidebook presents costs in terms of LM and LII, not dollars, since dollars per LM or LH differsubstantially among organizations, locations, and labor category.
6.8.2 LABOR Momwns AND LABOR Houns
It is important to note that where you use LM as the measure of effort, you should know and clearlystate the number of hours per LM. Such a statement in cost reports facilitates the comparison andstandardization of the LM measure among separate organizations. Collect all charges to each costaccount and activity in a development project.
One measure of LM is 167 L-I per direct LM. This figure is derived from observing that there are 52weeks per year at 40 hours per work week or 2080 possible work hours per year. Subtracting 80 hours
6-17

6. Mathematical Modeling and Meincs Selection
(10 days) of holidays yields 2000 work hours per year. Thus, there are 2000/12=167 hours per LM.However, the 167 hours/LM figure does not take into account vacations and sick time. If 120 hoursis allocated for vacation and 40 hours for illness, the actual staffing LM is 1840/12=153 hours.
Because of possible confusion among the various definitions of a LM, it is desirable to use LH inpreference to LM. If you use the LM measure, ensure that you define it in terms of LH, providing therationale for the figure you chose.
6.8.3 COMPUTE USAGE COST MEmCS
The cost of computer support during software development is a measure that you collect if yourproject is charged for computer time. Some software development projects use both host and targetcomputer systems. In many cases, the target computer is government-furnished equipment (GFE),but the host computer is a corporate computer. No charge is made for using the GFE system, but aninternal procedure bills you for host computer time. Since the host system performs such tasks as simu-lation studies, data analysis, documentation production, and program conversion for execution on theGFE system, this cost can be a significant burden.
Most organizations base their billing procedures on the amount of computer time used, but this is adifficult quantity to estimate in advance since few developers know how fast their software will executeon the host or target system and how many runs they will need to make. If your organization keepsaccounting records on the hours of computer time (internally or externally) billed and the LM or LHfor software development, then you can derive an hours/LM or hours/LH metric. You use this typeof metric for estimating future development computer costs by using the estimate of LM or LH fordevelopment and multiplying by the appropriate ratio.
More commonly, organizations keep accounting records for computer usage (where internal billingis involved) in dollars. In this case, you derive dollars/LM or dollars/LH metrics for computer usage.Furthermore, you develop separate metrics of dollars/LM or dollars/LH for the coding, documenta-tion production, software integration testing, and system integration testing development activity. Thevalues of these metrics will differ, but the use of unique computer cost ratio metrics for each activityin software development can lead to very accurate estimates of computer costs. There should be a dateassociated with each computer cost metric to indicate the time when the cost metrics were updated.This time label allows the adjustment of costs forward and backward in time.
6.9 SCHEDULE METRICS
Schedule is an important determinant of cost. If not enough time is available for the development ofa software product, you will make errors and not discover them, and your costs will be high. If too muchtime is available, your productivity will be low and your costs will be high. It is important to have areasonable schedule for development.
The most common schedule measurable is time in months, although you might use years. You may also use
milestones and events as time or schedule measures. 'ITble 6-11 presents software schedule metrics.
Table 6-11. Software Schedule Metrics
Number Type Metrics
3.1 Schedule Schedules and elapsed time in weeks, months and/or yearsMilestone or events (on an ordinal scale)
6-18

6. Mathematical Modeling and Metrics Selection
6.10 SOME QUALITY METRICS
Quality of the software product and of the software development process is an important consideration. Thebasic quality measure is defects. To produce a high-quality product, you must attune your developmentprocess to a zero-defect goal method of operation. To produce a high-quality product at the lowestpossible cost, you must remove defects at the earliest possible point in the development process. Con-centrate on discovering and removing defects/errors at the earliest possible stage of development, i.e.,in design and code inspections. Thble 6-12 presents a set of quality metrics. See Section 10 for additionaldiscussion and information about software errors and the selection of software quality metrics.
Table 6-12. Software Quality Metrics
Number Type Metrics
4.1 Number of Number of each type of defect including program trouble reports (PTRs)defects Number of valid and invalid defects including PTRs
Number of defects discovered in each activity of development and/or by type ofinspection or review (includes PTRs)
Number of major and minor defects (on an ordinal scale)
Number of valid field deficiency reports4.2 Defects/product Defects/KSLOC or defects/function point
unit
43 Defect cost LM, LH, or dollars of inspection/detection cost per defect
Number of persons participating in inspections
4.4 Design quality Design defects/KSLOC discovered during development (Correctness)
Average number of days to fix an error (Maintainability)
Average effort to expand the product divided by effort to develop the product(Expandability)
Average effort to verify the product divided by effort to develop the product(Verifiability)
Effort to port (apply to a new application) the product divided by effort todevelop the product (Plrtability)
Effort to reuse the product divided by effort to develop the product (Reusability)Number of two-way jumps + 1 (McCabe Complexity)
Halstead's difficulty metric (design goodness)
Number of latent defects divided by number of life cycle defects (Error discoveryefficiency)
Function of the number of unique inputs and outputs and the number ofassignment statements (Strength)
Average number of input and output items shared by this product with others(Coupling)
Data Bindings
Possible categories for the types of defects include design, logic, syntax, standards, data, returnmessage, prolog/comment, performance, and interface. You may count requirements defects, both
6-19

6. Mathematical Modeling and Metrics Selection
the number of instances of incompleteness and the number of instances of inconsistencies, ifrequirements reviews are a formal part of your software development process.
The design quality metrics deserve some special discussion. You measure design defect density indesign defects/KSLOC to get an indication of design correctness. Design defects can be discoveredin any development activity from preliminary design to CSCI test. Measuring design defect densitygives you a good indication of design quality, although your judgement of whether the measured de-sign quality is acceptable or not will depend upon your experience in your environment. Any judge-ment of design quality acceptability will depend upon a comparison of the current measurement witha standard or an acceptable design performance in the past.
It is also worthwhile to note that defects/KSLOC is a metric for overall software product quality,whether measured throughout development or given as estimated latent defects/KSLOC at delivery.Experience with the measurement of overall product quality in defects/KSLOC for real-time em-bedded software shows that about 20 defects/KSLOC is a good level of performance over thedevelopment cycle (excluding requirements analysis).
Similarly, metrics for maintainability, expandability, verifiability, portability, and reusability might beproposed as measures of design quality and of overall software product quality (see Section 10). Theproducts could not be maintainable unless they are well designed. There is no quantitative guidanceas to acceptable values of the metrics of these software attributes. You will have to develop your ownstandards based on past experience with like products.
Some of these design quality metrics relate to the software product, some relate to the developmentprocess, and some relate to both. The metrics suggested for maintainability, expandability, verifiabil-ity, portability, and reusability relate to the software product. The error discovery efficiency metricrelates to the process. And the metrics for complexity and design goodness relate to both the productand the control process.
Complexity is defined (McCabe 1976) as the cyclomatic number of a graph and is computed by theformula:
V(G) =e-n+p
where V(G) is the cyclomatic complexity of (a graph with (e) edges, (n) nodes, and (p)) connectedcomponents. This quantity is equal to the number of two-way conditional jumps plus one. V(G) is ametric for the control complexity of a unit of software.
Halstead (1977) defined difficulty; and Christensen, Fitsos, and Smith (1981) proposed it as a measureof design goodness. The metric is:
Difficulty (uniqueoperator count totaloperandsDpotential operator count) unique..operandcountJ
where operands are the variables or constants employed in the software algorithm or product and theoperators are the symbols (e.g., instructions) that affect the values or ordering of the operands. Thepotential.operator.count is the minimum possible number of operators and is known to be equal to 2.Therefore, the difficulty metric becomes:
D unique._operator count )( total.operands )D.2 unique.0operandcunt)
6-20
6. Mathematical Modeling and Metrkis Selection
The difficulty metric is a measure of the difficulty constants of writing (and reading) code and is thereciprocal of the level measure (Halstead 1977; Christensen, Fitsos, and Smith 1981). Christensenet al. discovered that the difficulty metric, especially its second factor, has a relatively high correlationwith the number of defects discovered in the operation of a software system.
Defect (Error) discovery efficiency may be defined as:
Defect discoveryefficiency = 1 - latent-defectsTotalNo._ofdefects_injected
where the number of latent defects is the number of defects estimated to be remaining in the softwareafter delivery and the total number of defects injected is the number of defects injected duringdevelopment and preliminary design through CSCI test.
Myers' (1975) two measures related to the structure of software and the goodness of a software designare strength (cohesion) and coupling. Strength is a measure of the degree of cohesiveness of the ele-ments in a software product unit (a module). Coupling indicates the degree of interconnectedness ofa number of such units.
Cruickshank and Gaffney (1980) proposed the strength metric:
Strength = (X2 + y2)'/ 2
where X is the reciprocal of the number of assignment statements in the module (product), and Y isthe number of unique function (product) outputs divided by the number of unique function (product)inputs.
Cruickshank and Gaffney (1980) proposed the coupling metric
n
YziCoupling =
where:
i.M
zi -I m
Mj is the sum of the number of input and output items shared between component i and componentj in the software product. Zi is, therefore, the average number of input and output items shared overm components with component i. Therefore, the coupling metric is the average number of input andoutput items shared over all n components in the software product.
These metrics have not been widely used, however they do provide quantification of the coupling andstrength concepts.
Selby and Basili (1991) developed another measure of a software system's structure which essentiallycombines the strength and coupling measures. It is based on intrasystem interaction in terms of
6-21

6. Mathematical Modleing and Metrics Selectio
software data bindings. Selby and Basili (1991) define "data bindings" as "... measures that capturethe data interaction across portions of a software system." These bindings are defined with respectto clusters of routines of the software system analyzed.This metric is defined as the ratio:
b
Where,B = the number of data bindings between routines within the cluster and those outside of it, andb = the number of data bindings between routines within the cluster
This number is interpreted as the ratio:
Qc
Where,C = the coupling of the cluster with other clusters in the subsystemc = the internal strength of the duster
6.11 PRODUCT APPLICATION ENVIRONMENT METRICS
The scaling measures of some subjective measurables (lhbles 6-13 through 6-16) are based onorthogonal polynomials. These values not only scale the variable numerically but they also ensuretheir mathematical independence in any statistical regression (or similar) studies.bIble 6-13 presentsthe software product application environment metrics.
"lble 6-13. Software Product Application Environment Metrics
Number Tyrpe Metrics5.1 Planning Bytes or words of memory used and bytes or words limitation
limitation5.2 Processng Mips used and mips limitation
capacitylimitation
5.3 1/0 capacity 1/0 capacity used in terms of information per unit processing timelimitation
I/O capacity limitation where information is measured in messages, characters,or transactions
5.4 Reliability Reliability level (very low= -2, low= -1, nominal=0, high=1, very high =2)5.5 Embedded Embedded (no=-1, yes=l)5.6 Real-time Real-time (no=-1, yes--1)5.7 Complexity Software product complexity (low=-1, medium=0, high=i)
6-22

6. Mathematical Modeling and Metrics Selection
Table 6-13, continued
Number Iype Metrics
5.8 Size limitation Number of bytes or words of memory used and number of bytes or wordslimitation
5.9 Speed Mips used (needed) for product execution and mips permitted for productlimitation execution
5.10 Transactions Number of I/O transaction processed by unit time and minimum required numberlimitation of I/O transactions processed by unit time
6.12 DEVELOPMENT ENVIRONMENT METRICS
Development environment metrics are quantitative measures of how software development ismanaged, including process, practice, and organizational aspects. Because the environmental scalesare subjective and different for each of the metric types, the metrics have been quantized on an ortho-gonal scale. The orthogonal scales ensure the mathematical independence of these variables in linearregression studies. Table 6-14 presents the software development environment metrics.
Table 6-14. Software Development Environment Metrics
Number I)pe Metrics
6.1 Computer Development computer access (no workstation/remote mainframe= -1, sharedaccess workstation=0, individual workstation=1)
62 Practices Use of modem programming practices and methods (very low=f-2, low=f-1,nominal=1, very high =2)
63 Tools Use of programming tools (very low= -2, low=f-1, nominal=0, high=l, veryigh =2)
6.4 Risk Use of development risk management techniques Qow=-1, moderate=0,management high=1)
6.5 Defined Use of defined process Qow=- 1, moderate=O, high=1)process
6.6 Requirement Product requirement stability (low=-1, moderate=O, high =1)stability _
6.7 Process Development process stability (low=- 1, moderate=0, high= 1)stability
6.8 Simultaneous Simultaneous hardware/software development (no=-1, yes=1)development
6.9 Standards Degree of enforcement of software engineering standards (low or noi__ standards=-1, moderate=0, high=1)
6.10 Contract 1)" of contract (cost plus fixed fee [CPFF]f-1, cost plus incentive feeI [CPIF]UM=0, fixed price [FP] =1)
6.13 DEVELOPMENT CONSTRAINT METRICS
Development constraint metrics are quantitative measures of the limitations placed on developmentcosts, schedules, and staffing. Because the constraint scale is subjective, ranging from not severe to
6-23

6. Mathematical MoMeling and Metrim Selection
severe, the metrics have been quantized on a scale from -1 to 1. These values orthogonalize the scaleand ensure their mathematical independence in linear regression studies. Thble 6-15 presents thesoftware development constraint metrics.
Table 6-15. Software Development Constraint Metrics
Number npe Metrics
7.1 Cost Cost constraint (not severe= -1, severe=1)7.2 Schedule Schedule constraint (not severe=-1, severe=1)7.3 Staffing Staffing constraint (not severe=- 1, severe = 1)
6.14 DEVELOPMENT PERSONNEL METRICS
'Able 6-16 presents the software development personnel characterization metrics. Because thepersonnel characterization scale is subjective, ranging from low to high, the metrics have beenquantized on a scale from -1 to 1. These values also orthogonalize the scale.
"Iblble 6-16. Software Development Personnel Characterization Metrics
Number yp. Metrics8.1 Language Development group familiarity with product implementation language
familiarity (low=-l, moderate=0, high=1)8.2 Experience Development group software engineering experience Qow=-1, moderatef=0,
_high=l1)
8.3 Application Development group familiarity with application (low=-l, moderate=0,famUiarity high=1)
8.4 Management Management personnel experience (low= -1, moderate=0, high= 1)
6.15 PRODUCTIVITIES AND UNIT COSTS
Use the size metrics from Section 6.7 with the cost metrics from Section 6.8 to produce productivitiesand/or unit labor costs. Choose the metrics appropriate to your needs and compute the values of themetrics for the delivered product over the development process for each product. Also, separatelycompute the appropriate metrics for new and reused code for each activity, where applicable, usingthe method shown in Section 6.6. Some useful productivity and unit cost metrics are:
"• SLOC per LM or per LH.
"* LM per KSLOC or LH per SLOC.
"* ESLOC per LM or per LH.
"* LM per KESLOC.
"• SLOD per LM or per LH.
"* Words of object code per LM or per LH.
6-24

6. Mathematical Modeling and Metrics Selection
"* Test procedure steps per LM or per LH.
"* Pages of documentation per LM or per LH.
"• Function points per LM or per LH.
You use SLOC/LM as the productivity metric or LM1KSLOC as the unit cost metric for the activitiesin development even though SLOC is not the output of some of the activities: such as design. SLOCmay be actual or estimated. The design cost metric can be SLOD/LM. This metric requires estimatesand counts of SLOD. When the development of the software product(s) has been completed, you re-vise the values of the productivity and unit cost metrics to reflect the actual value of the size of theproduct(s) or of the new and reused code they contain.
Unit costs are the scaled inverse of productivities. Alternatively, you use LM/KSLOC as a unit laborcost metric for either new or reused code. The advantage of using LHI/SLOC or LM/KSLOC is thatthese unit costs are additive so you can easily calculate the total unit cost for development from theindividual activity unit costs. Productivities such as SLOCILM are not additive and thus offer no suchconvenience of representation or calculation. Alternatively, you use LM/KELOC or LH/ESLOC asoverall unit cost metrics. Unit labor cost metrics such as LM/KSLOC and LH/SLOC are also calledunit costs.
The conversion formulas between productivities and unit costs are:
SLOC/LM = 1,000/(LM/KSLQC)
SLOC/LH = 1/(LH/SLOC)
Your software development organization should derive a unit cost for every activity in its developmentprocess for each type of software product it develops. You view this set of unit costs as the "standard"or "baseline" set to guide or be used as a "menu" corresponding to the set of possible activities com-posing the software development process. This process consists of selecting the activities that form thestandard or baseline set describing (model) the particular software process in question then modifyingthe standard unit costs, if necessary, for some of these selected activities.
You should collect the number of iterations (or the number of prototypes) through the software devel-opment life cycle and the number of iterations through each of the activities that compose the spiralprocess. These quantities appear in the list of product size metrics given in Section 6.7. You shouldalso determine the cost per iteration and the cost of the activities that compose each iteration if possible.
When you collect labor cost data, whether in LM or LIH, it is important that you collect all of theapplicable labor cost data. Since a software product is often produced with significant overtime andnormal working time, you should capture all of this cost data. 7b consider only normal working hourstends to overstate productivity and understate costs.
6.16 SUMMARY OF RECOMMENDATIONS
The recommendations on the selection of metrics presented in Section 6 are:
* Define metrics relative to objectives and establish measurements in advance of projectinitiation. Use the GQM paradigm.
6-25

6. Mathematical Modeling and Metrics selection
" Relate metrics to problem (or potential problem) solutions.
" Count source statements and comments separately. Do not count noncomment blank lines.
" Compute cost estimates and initially state them in LM or LH. The LM or LH mode allowsmore precise comparisons between projects or activities. The value of the dollar constantlychanges through time and by labor category, whereas LM or LH do not. Convert LM and LHto dollars when appropriate.
" Select metrics based on goals that a particular user group has established for information onproject control and/or process improvement.
" Select the metrics you will use in a cost-effective manner.
6-26
7. HOW TO ESTIMATE SOFTWARE SYSTEM SIZE
7.1 SIZE ESTIMATION
The effort, cost, and length of time required to develop software all depends on the size of the softwareproducts to be developed. This section describes software product size.
7.1.1 THE IMPOrTANCE OF SIZE ESrIMATION
Size estimation is an important activity in the quantitative management of software projects becausemost cost estimation algorithms use size estimates as an input, and the misestimation of size will leadto inaccurate cost estimates. Misestimation of software product size is probably a greater source oferror in software cost estimates than misestimation of productivity or unit costs. The biggest difficultyin using the cost estimation algorithms available today is the problem of providing sound sizingestimates (Boehm 1983).
Software size estimation is also difficult because there is no fundamental size to accomplish a statedrequirement. The size of the software component created to satisfy a requirement may depend on thesoftware engineers assigned to the job (Boehm 1983). The nature of this dependence is not readilydiscernable. Therefore, careful size estimation and the use of empirically based size estimationalgorithms are of prime importance.
7.1.2 Sru EjrATON Acnvnrs
This section is designed to help you answer the question, "How big will the system be?" It providesmethods for estimating software size, emphasizing methods that you can apply early in the development cyde.
Estimating the size of a new software system is the key to estimating develomt cost, both in dollar teamand in the amount of labor and other resources required, since the size determines a large part of the costof a software syster. An accurate estimate of size is important because size is the basis for estimates of devel-op•ent costs for software. Errors in the estimate of a software system's size often emod the estimation errorfor the amount of labor required for development and for productivity of its creation.
You should reestimate software product size throughout the development process. You should derivethe initial estimate prior to the initiation of software development using your knowledge of the re-quirements. You can derive subsequent estimates during the development process based on increasedknowledge about the software system as it evolves. You should derive this additional information fromfurther elaboration and expansion of the requirements, the design, and other intermediate products,e.g., documentation, of the process as you create them during development. The methodologypresented here uses knowledge about what is to be built, i.e., the requirements, as well as what hasbeen designed and/or coded to date during the development process. However, the emphasis here ison the development of "front-end" estimates, those you make before you begin the actual development.
7-1
7. How to Estimate Software System Size
There are two principal types of measures of software product size:
" 7 TAmount of Code. This is the number of source statements or number of SLOC, as discussedin Section 6. A SLOC count tends to vary with the language in which the software is written.That is, in general, a given system is expressible in fewer higher level language statements (e.g.,Ada) than are required for lower level (e.g., assembly) language.
" The Number of Function (or Feature) Points. This is a measure of the amount of functionprovided by the software system, as defined in Section 7.5. It is independent of the languagein which the system is written although the cost of development is not.
This section focuses on the estimation of code size in SLOC because it is the more general approach.
7.13 Siz, E mAON AmD TH Dm•oplmTr CycLE
This section is particularly concerned with estimating the size of a new software system very early in thedevelopment cycle, i.e., in the proposal or conceptual and requirements analysis activities. At this veryearly point in the development cycle, there is usually very little detailed information available aboutthe intended software system. You may not have assigned new and reused code to the planned ftuc-tions. Later in the development cycle, when you have assigned new and reused code to functions, youcan estimate the size of the functions to be represented by new code using other methods presentedin this section. When you identify the functions to be implemented by reused code, you can count thereused code.
7.1.4 Smzi E mTON AND PRoems MAxurry LEVErS
Software organizations at process maturity levels I and 2 concentrate on using methods that requirea minimum of experience data. An organization at level 3 through 5 will use methods that emphasizethe use of experience data to estimate size, incporating lessons learned from results of the orpnion'sprocess modifications and development experience.
Software size is the primary parametric input to most cost and schedule estimating algorithms, but theestimates of size used for these purposes are frequently based on guesses or anecdotal information.Inaccuracies in size estimates are the primary cause for inaccuracies in cost and schedule estimates.Even where you know your unit costs and where you have thoroughly analyzed your schedule con-straints, the overall cost and schedule estimates for your software development projects may ladck redsionbecause your size estimates were not derived using systematic methods.
Code size estimates should be based on the past experience of your own organization. This experienceshould be accessible in terms of the data available in a formal database. This database should containthe sizes of CSCIs, the number of major inputs and outputs, the code counts, and other such informa-tion. You should take considerable care in making a direct comparison between projects, i.e., betweenthe new project in question and a previous project as it appears in the experience database. You shouldmake a careful analysis of both the similarities and differences of the functions in both projects beforebasing your size estimates on previous experience.
7.2 SIZE ESTIMATION DURING THE DEVELOPMENT CYCLE
This section shows you ways to estimate software product size throughout the development cycle.
7-2
7. How to Estimate Software System Size
7.2.1 SIZE ESTIMATION BY DEVELOPMENT AcTrIVTY
A software development organization which has a defined process (i.e., the process of an organizationat SEI process maturity level 3) should have accumulated enough data in its software experience data-base that it can make reasonable estimates of size throughout the life cycle of the software. Your orga-nization should use systematic methods for size estimation such as those presented in this section.Thelife cycle is composed of many activities, all of which you define and place under management controlat process maturity level 3. It is not necessary to make size estimates as the product transitions fromone development activity to another, but you should make size estimates at several milestones duringdevelopment.
Monitor a software development project, with all of its associated software products, throughout thedevelopment cycle using a continuous measurement process. Make measurements such as estimatesof product size in the conceptual and the requirements stages; at proposal time; at initiation of theproject; and throughout design, coding, and testing. Considerable variation characterizes softwareproduct size estimates done early in the development cycle because so little detail about the softwareis available. Size estimates you make throughout the design, code, and test activities are subject tomuch less variation since you have based them primarily on code counts made during development.The increasing accuracy of size estimates characterizes the process of measurement and sizeestimation through the development cycle.
In general, when your software development project is in the system-level conceptual stage, youshould use a technique such as function block counting (see Section 7.3) since you know very little elsebut the major functions included in the system. As the project moves from conception to proposal,techniques like I/O counting (see Section 7.6) come into play since you will have defined the main in-terfaces between the major functions. At proposal time, you can use function block and 1/0 techniquesas cross-checks on each other to achieve a reasonable level of confidence that you made a suitable sizeestimate. At the design phase, you should count design statements and convert them to SLOC esti-mates by an SLOC-to-SLOD ratio derived from your organization's experience. As the project movesfrom design to coding and testing, use code counts to give very accurate estimates of final product cost.Fimally code growth becomes important during the testing activities. Section 7 presents size estimationmethods applicable at all of these points in the development cycle.
7.2.2 UsING SouRcE Lum oF DESiGN TO EnSIT SoFrwEut SIzE
During the conduct of the design activity, information in the form of SLOD counts are available ifyouuse a design language. Preserve these SLOD counts in your software experience database. When thecorresponding SLOC counts become available, compute an SLOC-to-SLOD ratio and preserve it.This ratio will aid you in converting SLOD to SLOC estimates for future projects. You can use an esti-mate for this ratio based on past project development experience or other information that may beavailable to you. Alternatively, you can compute function point-to-SLOD ratios and use them for fu-ture estimates of the amount of design (in SLOD) that you will develop for a system of some givensize in function points.
7.2.3 SmzE ESTiMAmiON STEPS
You should follow these steps in making size estimates:
7-3

7. How to Estimate Software System Size
" At the conceptual or requirements stages, compile the requirements for the system and itsmajor parts, such as CSCI or a software product, whose size you wish to estimate.
" Get all of the data you can about the system you are to estimate (i.e., functions to beperformed, counts of inputs and outputs, etc.).
" Get as much detail as you can. Get the data for as many of the (likely) component functionsor parts of the system as you can. Consult with those who have the most expert knowledge ofthe components or functions in which you are interested. Take advantage of the fact that anunderestimate of the size of one component often cancels the overestimate of the size ofanother component.
" Make several estimates at each stage of development based on different types of data, thencompare them. If they differ beyond 10 to 20 percent, reconsider your assumptions and tryagain. Repeat the process.
7.3 FUNCTION BLOCK COUNTING
This section describes a method for estimating a software system's size based on the number of majorsoftware functions or subfunctions that you expect to compose the system. When you have very littleinformation about the intended application system, you can make a rough estimate of the softwaresystem size using the counted or estimated number of CSCIs or CSCs. This method has the advantageof requiring little information, so you can apply it very early in the development cycle. You can applythis method at the conceptualization or requirements stages when the size implication of a require-ment is itself the input to a decision-making process, e.g., the decision to include the function or tobid on a contract. The method has the disadvantage of not directly including the effect of otherinformation that may be available about the application system.
You can count major functions and equate them to the number of CSCIs or the number of CSCs. Youcan also count major functions as function blocks in a system description document or in a system-levelblock diagram or flow chart. At the conception of the system (when you are planning the system at thetop level), you should identify the major software functions and count them as function blocks. A func-ton block corresponds to a CSCI; and the next level of decomposition, major subfunctions,corresponds to a CSC.
You can apply the methods presented here at one or two levels of decomposition: at the CSCI or CSClevel. Gaffney (1984b) and Britcher and Gaffney (1985) demonstrated that, under the assumption thatmost systems have the same number of decomposition levels, you can estimate the system's size as afunction of the number of functional elements at any one level. Thus, you would not expect a largersystem to have more (vertical) levels of decomposition than a smaller one. Instead, the larger systemwould have more units of code at each level: CSCI and CSC.
You can base your estimate of software system size on the number of CSCs or CSCIs that you expectto compose the system. (Britcher and Gaffney 1985) present figures of 41.6 KSLOC and 4.16 KSLOC,respectively, for the expected values of size for a CSCI and a CSC. Experience suggests that the sizeof a CSCI can vary rather substantially among systems or even within a given system. It is quitereasonable to expect a substantial variation since the estimation process uses little information aboutthe actual system. Some data on the experience of an aerospace contractor showed that the standarddeviation of the sizes of a CSCI averaged 27.5 percent of the expected value, a/E = 0.275 (see
7-4

7. How to Estimate Softwar System Size
Section 7.4). The values presented here are undoubtedly domain-dependent, and you should makegreat efforts to adopt these values to the domain or environment in question.
Your organization should collect data about the sizes of the CSCI and CSC and then develop averagesize figures to use in developing function block estimates as described here. However, if no such datais available, then you might use the figures of 41.6 KSLOC and 11.45 KSLOC (= 0.275 x 41.6), respec-tively, for the expected value and standard deviation of the size of each CSCI in the system whose sizeyou wish to estimate. Then, based on the statistical concepts presented in Section 7.4, calculate theexpected estimate of size in KSLOC and the estimated standard deviation of the size in KSLOC ofthe overall system using the equations:
Etot = 41.6 N
otot = 0.275 Etot
where N is the number of CSCIs. Alternatively, you can multiply the number of CSCs by 4.16 KSLOCto produce an estimate of size. One of the estimates would be based on your estimate of the numberof CSCIs, and the other estimate would be based on your estimate of the number of CSCs. You canuse the two product size estimates as a cross-check on each other.
In summary, the steps of the function block method are:
"* Count or estimate the number of blocks at a given level of detail, i.e., at the CSCI or CSC level,or both.
"* Multiply the number of blocks by the expected value of the size for that type of block. This isthe expected size of the system overall.
"* Compute the standard deviation of estimated system size.
"* Compute the desired range of the system size for the probability levels desired per the methoddescribed in Section 7.4.
"* Apply this method forboth the count of CSCIs and for the count of CSCs, and pool the results.Do not apply this method when there are fewer than three function blocks.
7.4 STATISTICAL SIZE ESTIMATION
This section describes a systematic method for estimating the code size of a software system byestimating the ranges of size of the component elements such as CSCs and CSCIs that will composeit. This method enables you to make systematic estimates of the sizes of the software system's individu-al components that you are to develop. The method involves decomposing the system into a numberof functions, considering each of them in turn, and then statistically operating on the data to obtainestimates of the overall size and the standard deviation of the estimate. This method enables you toreduce the effect of uncertainty in estimated sizes of the individual components and to obtain a betterestimate of the overall system size. The source of the information for the size estimate typically is thesizes of components or units in similar jobs that your organization has done earlier, i.e., softwareproduct sizes from your software experience database.
7-5

7. How to Estimate Softwm system Size
The method presented here systematizes the estimation-by-analogy approach based on yourorganization's experience. Such estimates are done by an individual or by pooling the educated guessesof a group of people. The method is described in Putnam (1978). The steps in this process are:
"* Determine the functions that will compose the new system.
"* Compile size data about any similar functions previously developed.
"* Identify the differences between the similar functions and the new ones.
"* For each component (t), function whose size you are to estimate, estimate three parameters:
- The lowest possible number of source statements (or function points or other sizemeasure); ai
- The highest possible number of source statements (or function points or other sizemeasure); bj
- The most lely number of source statements (or function points or other sizemeasure); mi
"* Compute two numbers for the estimated size of each of the components, the expected valueand the standard deviation. The formulas for calculating each of them are as follows:
- The equation for estimating the expected value of the number of source statements(or function points or other size measure) in the ith unit of code, Ei, is:
Ei - ai + 4m, + bi6
where ai is the lowest possible number, bi is the highest possible number, and mi is themost likely number.
- The equation for estimating the standard deviation of the number of sourcestatements (or function points or other size measure) in the ith unit of code, oi, is:
Gi = (6
"• MTbulate the estimates for each of the components.
"* Compute the expected value, Eto, and the standard deviation, otu, for the overall system.
nEtot =• Ei
otot - yi-7
7-6

7. How to Estimate Software System Size
Table 7-1 is an example of a table that you can use when applying the method just described. Itillustrates a case in which there are four units of software to be built.
Table 7-1. Size Estimation Table Example
StandardFunction Smallest Most Likely Largest Expected Deviation
A 5,830 8,962 17,750 9,905 1,987
B 9,375 14,625 .8,000 15,979 3,104
C 6,300 13,700 36,250 16,225 4,992
D 5,875 8,975 14,625 9,400 1,458
Overall Etot- ot =6,37451,509
You can approximate the uncertainty in the overall size of the system using the values just calculatedfor the overall expected value and standard deviation under the assumption that the size is normallydistributed. You would expect this approximation to be more accurate-for cases in which there arelarger numbers of functions in the overall system. Some of the size uncertainty ranges are:
68 percent range: Etot+ 1 a: 45,135 to 57,883
99 percent range: Etot +3 a: 32,387 to 70,631
The 99 percent probability range is much wider than the 68 percent range. You can use the methoddescribed here to provide a range of size estimates for use in the calculation of cost risk as describedin Section 7.5.
The method of calculating size uncertainty ranges justpresented assumes that the estimate it producesis unbiased toward neither overestimation or underestimation. However, some experience indicatesthat the "most likely" estimates are biased more toward the lower limit than the upper one. The sizesof actual software products tend more toward the upper limit (Boehm 1981). This observation is inkeepingwith a common view that software estimators tend to underestimate the size of their products.Section 7.7 gives more detail on size growth.
7.5 FUNCTION POINTS
This section describes the nature of the function point size measure and how to compute and applyit.
7.5.1 DEP•mON OF FAMMrION Poncrs
"The function point metric intends to measure the functionality of the software product in standard units,independent of the coding language. A funcion point is a measure of software functionality based on thecounted or estimated number of "externals" (inputs, outputs, inquiries, and interfaces) of a system plus theestimated number of internal files of a program unit. This section briefly describes the nature of thefunction point measure and summarizes how you calculate it.
You calculate the function point metric by counting the number of each of the four types of systemexternals, plus the count of internal logical files. The statement of software system requirements often
7-7
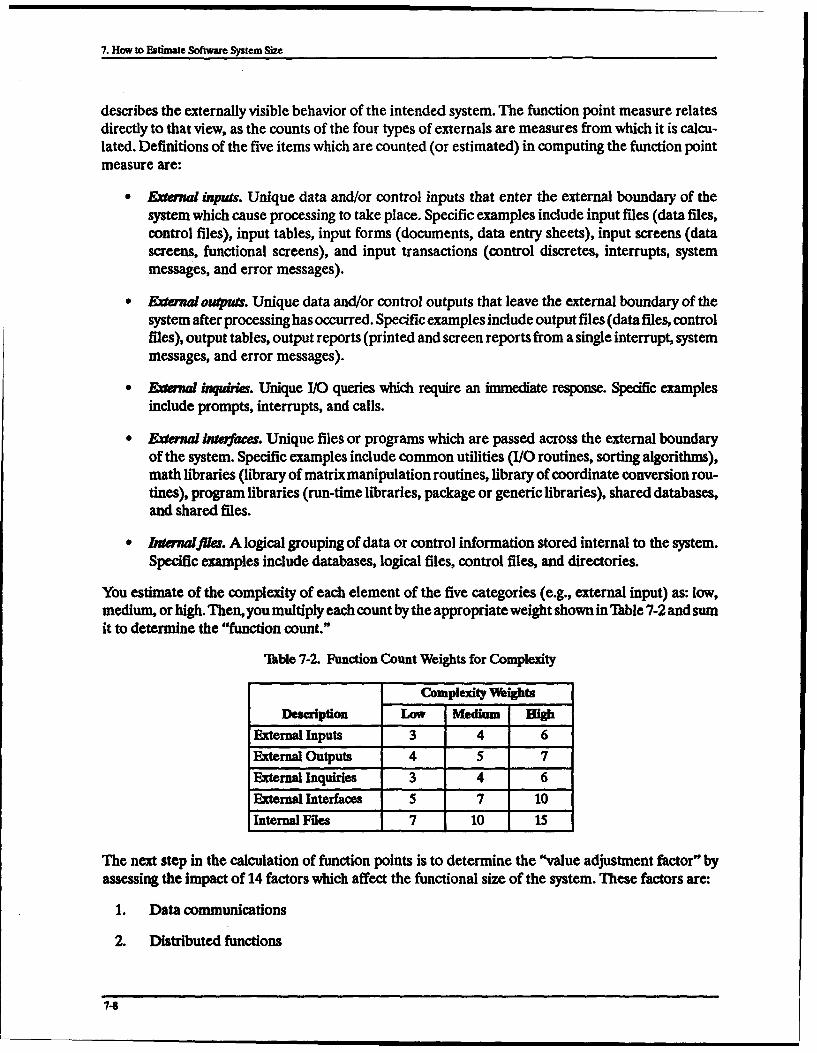
7. How to Estimate Software System Si
describes the externally visible behavior of the intended system. The function point measure relatesdirectly to that view, as the counts of the four types of externals are measures from which it is calcu-lated. Definitions of the five items which are counted (or estimated) in computing the function pointmeasure are:
" Externai inputs. Unique data and/or control inputs that enter the external boundary of thesystem which cause processing to take place. Specific examples include input files (data files,control files), input tables, input forms (documents, data entry sheets), input screens (datascreens, functional screens), and input transactions (control discretes, interrupts, systemmessages, and error messages).
"* Ezxae outputs. Unique data and/or control outputs that leave the external boundary of thesystem after processing has occurred. Specific examples include output files (data files, controlfiles), output tables, output reports (printed and screen reports from a single interrupt, systemmessages, and error messages).
" Eftma/ianquri. Unique I/0 queries which require an immediate response. Specific examplesinclude prompts, interrupts, and calls.
" Exea intaefaces. Unique files or programs which are passed across the external boundaryof the system. Specific examples include common utilities (I/O routines, sorting algorithms),math libraries (library of matrix manipulation routines, library of coordinate conversion rou-tines), program libraries (run-time libraries, package or generic libraries), shared databases,and shared files.
" I/nAhalfiles. A logical grouping of data or control information stored internal to the system.Specific examples include databases, logical files, control fies, and directories.
You estimate of the complexity of each element of the five categories (e.g., external input) as: low,medium, or high. Then, you multiply each count by the appropriate weight shown in Table 7-2 and sumit to determine the "function count."
"Ihble 7-2. Function Count Weights for Complexity
Complexi gts
Description Low Medium High
External Inputs 3 4 6
External Outputs 4 5 7
External Inquiries 3 4 6External Interfaces 5 7 10
Internal Files 7 10 15
The next step in the calculation of function points is to determine the "value adjustment factor" by
assessing the impact of 14 factors which affect the functional size of the system. These factors are:
1. Data communications
2. Distributed functions
7-8

7. How to Estimate Software System Size
3. Performance
4. Heavily used operational configuration
5. Transaction rate
6. Online data entry
7. Design for end-user efficiency
8. Online update (for logical internal files)
9. Complex processing
10. Reusability of system code
11. Installation ease
12. Operational ease
13. Multiple sites
14. Ease of change
These factors are evaluated on a scale that runs from 0 to 5 defined as 0 - factor not present or hasno influence, 1 - insignificant influence, 2 - moderate influence, 3 - average influence, 4 -significant influence, 5 - strong influence.
After the 14 factors have been rated and summed, the total must be converted to a complexityadjustment multiplier by the following formula:
Multiplier = Sum- 0.01 + 0.65
Finally, you calculate the function point count by multiplying the function count by the valueadjustment multiplier. The result is the final adjusted function point totals. More information aboutfunction points, including rules for calculating them, is given in Albrecht (1979), Albrecht and Gaffney(1983), Brown (1990), and Jones (1990 and 1991).
7.5.2 ExAMPL OF FUNCrION POINT CALCULTION
Jones (1991) gives an example of a low complexity application with I external input, 2 external outputs,1 logical file, and no interfaces or inquiries. The calculation with the weights inlkble 7-2 gives 18 unad-justed function points. Of the 14 influential factors, online data entry and online update are rated at2, end-user efficiency and operational ease rated at 3, and all the other factors are rated at 0. The totalof the influence factors is 10. When this sum-is entered into the above value adjustment formula, avalue adjustment multiplier of 0.75 is obtained. Therefore, there is (0.75)(18) = 13.5 total adjustedfunction points.
7.5.3 APPLCATIONS OF FuNCrION PoeNmS
Function points correlate well with software cost, as do lines of code for management informationsystems (MIS) software. However, you cannot assure that the units (e.g., SLOC) per function point
7-9

7. How to Estimate Software System Size
is independent of the language used to implement the software component. This uncertainty existsbecause the cost of development is a function of code size as well as the amount of functionality to beimplemented (Gaffney 1986).
The function point size metric is consistent across languages and applications. When you know theSLOC-to-function point ratio for a particular language, you can use function points to estimate sourcecode size in SLOC by multiplying that ratio by the number of function points. For example, Jones(1986) states that there are 106 COBOL statements per function point.
Experience with MIS and commercial software shows that, using function points, you can make anearly estimate of size, generally quite successfully, for those classes of software. However, functionpoint advocates typically use the counts of the five items cited above as the basis for calculating function points,as described above, and not as the basis for making an estimate of the count of source statements.
Jones (1991) presents a variant of function points called feature points. Feature points are based on countsof the five externals discussed in connection with function points plus a count of the number of algorithms.Jones (1991) has asserted the utility of this metric for various real-time and system applications.
7.5.4 CALCULAMON OF PHYSICAL PROGRAM SIZE
Even if you can calculate the function point number relatively consistently and accurately, it does notprovide all of the information that you need to answer all your questions about the size of a softwareproduct. It is likely that you can estimate the physical implementation size of a program or major func-tion such as a CSCI, relatively easily from a KSLOC estimate. To do this, you should use data aboutthe compiler's functioning, in particular the average expansion from SLOC to the number of objectstatements. Then, multiply this figure by the average size (in bytes) of an object statement, based onexperience captured in the experience database. Unfortunately, this process is not likely to be donewhen function points are the measure of program size. This is because there is, in general, no funda-mental (physical) program size to perform a given function. Indeed, Boehm (1983) reported on anexperiment in which there was a several-fold variation in the size of the programs designed to meetthe same functional objectives but with different optimizing criteria.
7.6 HOW TO ESTIMATE SOFTWARE SIZE BY COUNTING EXTERNALS
This section shows how to estimate the size of an aerospace software system in KSLOC using externalmeasures of the intended system's requirements. Here, aerospace software can be characterized asreal-time command and control embedded software. This method is of particular interest since themeasures you use are counts that are often avasiable very early in the development cycle. The methodis a generalization of the function point method described in Section 7.5. The four external measuresused here are defined in Section 7.5.
The method described here (Gaffney and Werling 1991) is based on the observation that theunweighted sum of the counts of the externals (the primitives from which you determine the functionpoint value) correlates about as well with the source statement count as do function points. Since thecalculation of function points involves a subjective estimation ofsome additional factors, including theappropriate weighting to apply to the counts of each of the primitives, use of the "raw" sum of the prim-itives could prove advantageous since it does not require making the additional subjective judgmentsimplicit in the estimation of function points. Not doing the weighting and other processing of the raw
7-10

7. How to Estimate Software System Size
counts is simpler and might result in a reduced degree of error in the source statement estimate andalso the development labor estimate determined in part from it.
You can apply an empirical software size-estimating model, based on counts of the program externalsdefined here, to both embedded and business software systems. The estimates of the parameters ofsuch a model are best developed by the organization intending to use it, based on data from the experi-ence of that organization. However, if such data is not available, you can use either of the two estimatingequations presented here, one for the case of three externals and the other for four externals.
The first estimating equation for estimating size from counts of externals is:
S = 13.94 + 0.034A
where S is the software system size in KSLOC and A is the sum of three program externals-inputs,outputs, and inquiries. The second estimating equation is:
S = 12.28 + 0.030E
where S is the software system size in KSLOC and E is the sum of all four program externals.
The estimation procedure is:
"• Collect counts of program externals and product size in KSLOC for projects in your softwareexperience database.
" Develop an organization-specific estimating formula for estimating size from counts ofexternals. To derive such a formula, use the project data in the organization software experi-ence database to plot size (on the y-axis) against counts of externals (on the x-axis), and fit aline that seems to best represent the data. Although a visual fit can be made, it is preferableto to use a linear regression fit, as described in Graybill (1961) and other standard texts.
"* lb estimate size for a new proposal, identify the number of program externals for each majorprogram unit (CSCI or equivalent).
"* Estimate size in KSLOC by using the formulas above or those derived from your experiencedata, and the appropriate counts of externals.
You can obtain the data for the estimating model and use it to develop an estimate of software sizefor your project at requirements time. This allows you to make a more accurate estimate of develop-ment costs earlier in the project. You can pool this estimate with size estimates developed using othertechniques.
7.7 SOFTWARE PRODUCT SIZE GROWTH
The size, however measured, of software products of all types tends to grow from the time you initiatedevelopment to the time you deliver the product. No matter how accurate the data used to make theinitial estimate, and no matter how precise the method used to make the initial estimate, the deliveredsize will differ significantly in most cases from the initial estimate of size. This growth adds to thedevelopment cost and thus becomes an important consideration.
711
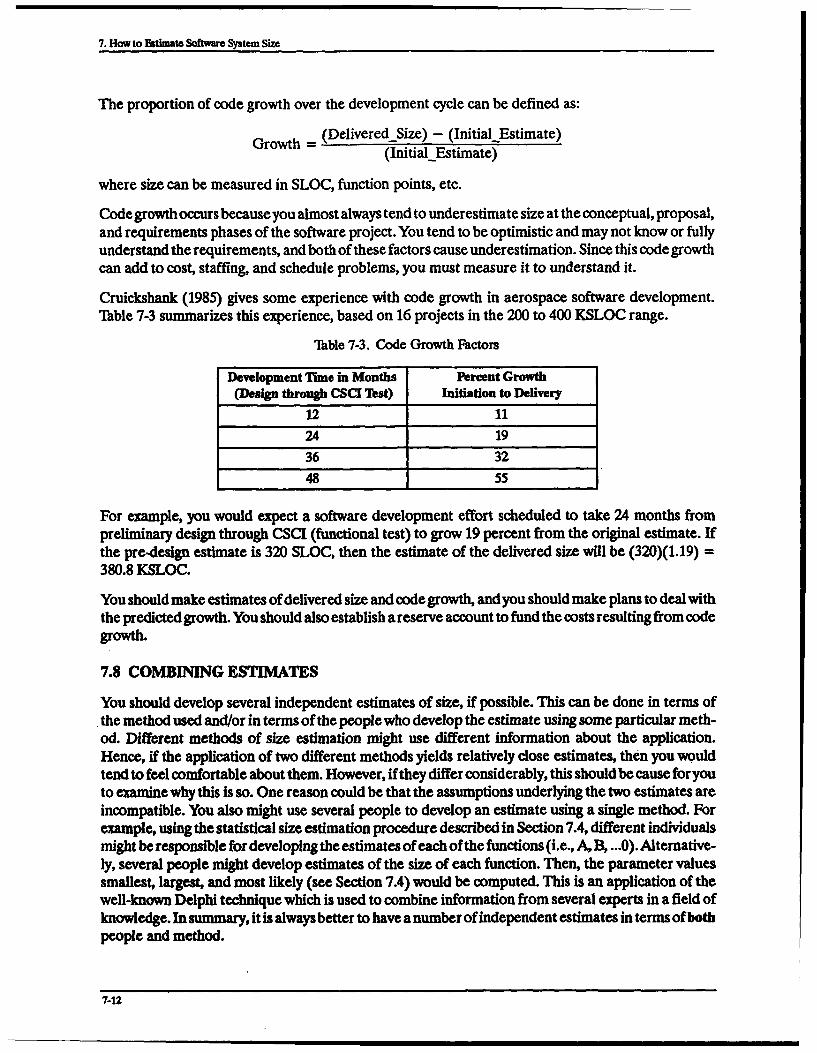
7. How to Estimate Software System Size
The proportion of code growth over the development cycle can be defined as:
Growth = (Delivered Size) - (Initial Estimate)(Initial-Estimate)
where size can be measured in SLOC, function points, etc.
Code growth occurs because you almost always tend to underestimate size at the conceptual, proposal,and requirements phases of the software project. You tend to be optimistic and may not know or fullyunderstand the requirements, and both of these factors cause underestimation. Since this code growthcan add to cost, staffing, and schedule problems, you must measure it to understand it.
Cruickshank (1985) gives some experience with code growth in aerospace software development.
Table 7-3 summarizes this experience, based on 16 projects in the 200 to 400 KSLOC range.
Table 7-3. Code Growth Factors
Development Time in Months Percent Growth(Design through CSCI Test) Initiation to Delivery
12 1124 1936 3248 55
For example, you would expect a software development effort scheduled to take 24 months frompreliminary design through CSCI (functional test) to grow 19 percent from the original estimate. Ifthe pre-design estimate is 320 SLO5, then the estimate of the delivered size will be (320)(1.19) =380.8 KSLOC.
You should make estimates of delivered size and code growth, and you should make plans to deal withthe predicted growth. You should also establish a reserve account to fund the costs resulting from codegrowth.
7.8 COMBINING ESTIMATES
You should develop several independent estimates of size, if possible. This can be done in terms ofthe method used and/or in terms of the people who develop the estimate using some particular meth-od. Different methods of size estimation might use different information about the application.Hence, if the application of two different methods yields relatively close estimates, then you wouldtend to feel comfortable about them. However, if they differ considerably, this should be cause for youto examine why this is so. One reason could be that the assumptions underlying the two estimates areincompatible. You also might use several people to develop an estimate using a single method. Forexample, using the statistical size estimation procedure described in Section 7.4, different individualsmight be responsible for developing the estimates of each of the functions (i.e., A, B, ...0). Alternative-ly, several people might develop estimates of the size of each function. Then, the parameter valuessmallest, largest, and most likely (see Section 7.4) would be computed. This is an application of thewell-known Delphi technique which is used to combine information from several experts in a field ofknowledge. In summary, it is always better to have a number of independent estimates in terms of bothpeople and method.
7-12
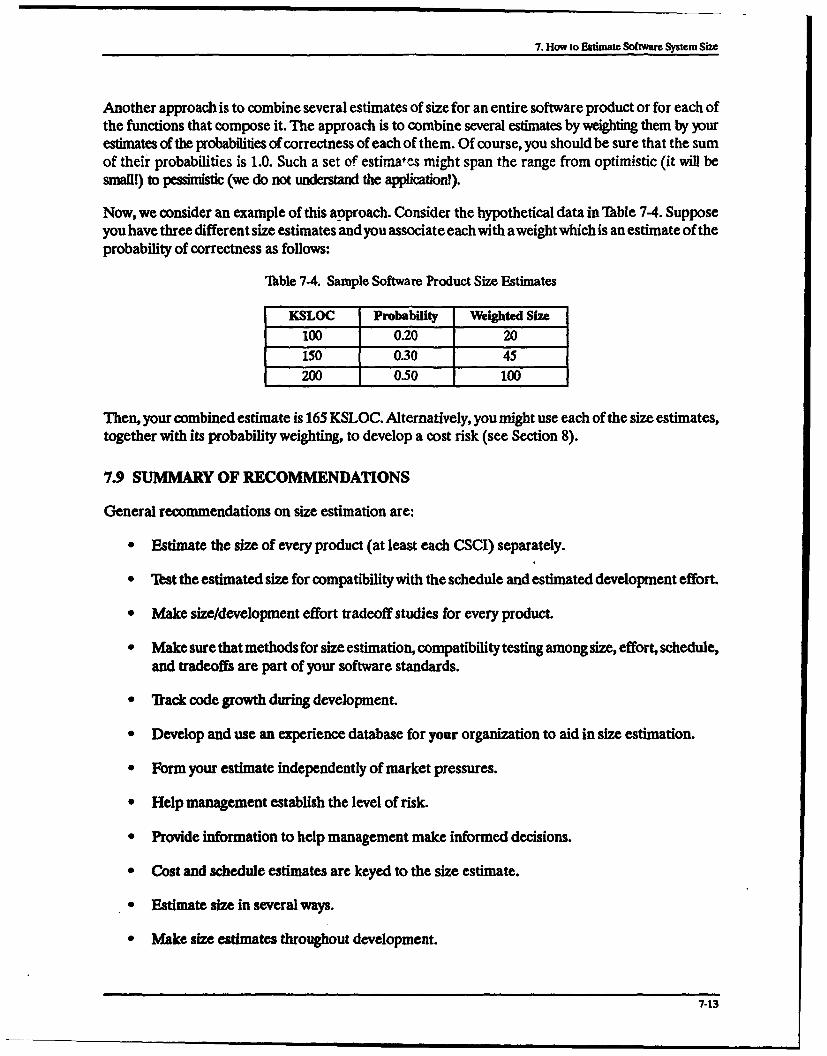
7. How to Estimate Software System Size
Another approach is to combine several estimates of size for an entire software product or for each ofthe functions that compose it. The approach is to combine several estimates by weighting them by yourestimates of the probabilities of correctness of each of them. Of course, you should be sure that the sumof their probabilities is 1.0. Such a set of estirnates might span the range from optimistic (it will besmall!) to pessimistic (we do not understand the application!).
Now, we consider an example of this approach. Consider the hypothetical data in Table 7-4. Supposeyou have three different size estimates and you associate each with a weight which is an estimate of theprobability of correctness as follows:
Table 7-4. Sample Software Product Size Estimates
KSLOC Probability Weighted Size
100 0.20 20150 0.30 45200 0.50 100
Then, your combined estimate is 165 KSLOC. Alternatively, you might use each of the size estimates,together with its probability weighting, to develop a cost risk (see Section 8).
7.9 SUMMARY OF RECOMMENDATIONS
General recommendations on size estimation are:
"* Estimate the size of every product (at least each CSCI) separately.
"* Thst the estimated size for compatibility with the schedule and estimated development effort.
"* Make size/development effort tradeoff studies for every product.
"• Make sure that methods for size estimation, compatibility testing among size, effort, schedule,and tradeoffs are part of your software standards.
"* fiack code growth during development.
"* Develop and use an experience database for your organization to aid in size estimation.
"* Form your estimate independently of market pressures.
"• Help management establish the level of risk.
"• Provide information to help management make informed decisions.
"• Cost and schedule estimates are keyed to the size estimate.
0 Estimate size in several ways.
" Make size estimates throughout development.
7-13
7. How to Estimate Software System Size
"* Base your estimates of size on your organization's experience, retained in its database.
"• Relate code size to the size of other products of the software development process such as theamount of design. Th'is technique facilitates making updates during the development processas you elaborate the requirements.
"* A good estimate of size is key to a good estimate of cost.
"* There are various ways to estimate size.
"* Formyour estimate based on counting available functions, input/output, etc., of your project.
"* Update your estimate throughout the development process.
7-14

8. HOW TO ESTIMATE SOFTWARE COST
8.1 OVERVIEW
This section presents methods to estimate software development costs. The methods are expressedin terms of cost estimating models and are classified into three categories: holistic cost estimationmodels, activity-based cost estimation models, and system cost models. Holistic models are overviewmodels that yield estimates of the total software development labor cost and/or schedule. Activ-ity-based models use a bottom-up approach to software development cost estimation based on ananalysis of the costs of the individual activities that compose the software development process. Activ-ity-based models are especially effective in an environment in which you have established a softwareexperience database and where you use that database to feed back information about the process toimprove the process. System cost estimation models are based on top-level system knowledge of thehardware and software to be developed. The software development costs are estimated from an analysis ofthe system cost sucture. Tbis section also discusses cost risk and cost risk management for software.
The cost estimation methods presented in this section use estimates of the software product size. Youcan estimate size by the methods presented in Section 7. In turn, the development schedule estimatingmethods shown in Section 9 uses the cost estimates produced by the methods presented in this section.The size, cost, and schedule parameters are closely related.
8.2 COST ESTIMATION OVERVIEW
This section defines units for quantifying software development labor, and relates cost estimatingmethods to software process maturity levels.
8..1 UNM ov CoST
Software development labor costs are presented in this section and in this guidebook in terms of unitsof effort such as LM and LH. In short, cost is synonymous with effort in this guidebook. Do your esti-mates of cost in LM or LH and convert them to dollars as required. No attempt is made to converteffort to dollars since labor costs have very different dollar equivalents from one environment toanother and from one year to another. When you have estimated your software development laboreffort, you can easily convert effort in LM or LH to dollars. Using LM or LH as your primary cost unit en-ables you to compare costs and productivities for projects conducted at different times and at different places.
8.2.2 CosT Eaudm ON AND PRocmSs MARm Lvns
The methods presented here roughly correspond to a progression through the SEI process maturitylevels. If your software development organization is at process maturity level 1, the initial level, you
8-1

8. How to Estimate Software Cost
probably have no experience data in a database. In this case, you should estimate costs with the holisticmodels shown in Section 8.3. By the time your software development organization is at SEI processmaturity level 2, the repeatable process level, you will have established a software experience databaseand accumulated sufficient data so that you can calculate urit costs for the main activities of softwaredevelopment (e.g., requirements definition, design, code and test, integration and test) and applythem on a project basis (shown in Section 8.4).
When your organization reaches SEI process maturity level 3, the defined level, you will have hadsufficient experience and data to do more precise cost estimation (shown in Section 8.4) and to esti-mate the costs of documentation, testing, and support to software (shown in Sections 8.7 and 8.9).When your organization reaches process maturity level 4, the managed level, you will have had suffi-cient expertise to use top-down methods (shown in Section 8.8). Finally, at level 5, the optimized level,your organization will be sophisticated enough to routinely handle cost risk (Section 8.10) and the costof software maintenance (Section 8.11).
As your process maturity level increases, you will have a software experience database that willprovide you the information you need to use your own parameter values in the estimation equationsgiven in this section. You should apply the estimating methods presented in an iterative way, continu-ously throughout the development cycle. You should apply each of these methods within the scope ofyour organization's cost management policies, plans, and procedures.
8.3 HOLISTIC MODELS
A holistic model uses the size of the prospective software product to estimate the development effortand/or schedule as a whole without considering in detail the costs of the individual activities that com-pose the development process. A holistic model associates size, effort, and development schedule us-ing one or more equations and uses this relationship(s) for the exploration of tradeoff possibilities.A holistic model usually applies a percent corresponding to each activity to the overall cost or scheduleto get the parameter values for the individual activities. These percents differ for each activity andoften vary from one application to another.
8.3.1 CoNSTRucnwV COST MoDEL
The Constru e Cost Model (COC)MO) (Boehm 1981) is probably the most widely emplyed holisticmodel. If you do not have any productivity data of your own, then you can use the figures embeddedin COCOMO. But if you have experience data, you should use parameter values derived from yourorganization's experience.
There are three basic modes or application types in the COCOMO model: organic, semidetached, andembedded. There are also three principal levels of the COCOMO model: basic, intermediate, anddetailed. In addition, there is an Ada-COCOMO model. This section describes the three modes andthe three levels as well as the Ada process model. Models similar to the basic COCOMO for the estimationof effort and schedule are given by Walston and Felix (1977). 'lkble 8-1 sunmmarizes the basic model
Table 8-1. Basic Constructive Cost Model Effort and Schedule Equations
Mode Effort (Cost)= a(KDSI)b Schedule Time= c(LM)d
Oanic LM=214(KWI)' 05 TDEV=2.5(LM)o.mSemidetached LM=3.0(KDSI)1.1 2 TDEV=2.5(LM)0-35
Embedded LM=3.6(KDSI)UO TDEV=2.(LM) 32
8-2

8. How to Estimate Software Cost
83.1.1 Basic Constructive Cost Model
In "hble 8-1, LM is labor months, KDSI is thousands of delivered source instructions, and TDEV isdevelopment time in months. Delivered source instructions include a count of physical source state-ments for new and reused code but excludes undelivered support software such as test drivers. KDSIincludes format and data declarations and excludes comments and unmodified utility software. TotalKDSI is equal to total KSLOC for the same code categories as described. The LM estimated by thebasic COCOMO effort-estimating equation includes the direct effort for product (top-level) softwaredesign through integration and acceptance testing. It includes project management, program librari-ans, documentation effort, quality assurance, and configuration management. However, it does notinclude personnel, the computer center, clerical help, facilities, and higher management effort.
The organic mode applies to a small to medium-sized product development in a familiar in-housedevelopment environment. The embedded mode represents a tightly constrained software productdevelopment situation where the product must operate in a complex hardware/software, interactive,and procedure-driven system. Military mission-critical and real-time command and control softwareand air traffic control systems are examples of such products. The semidetached mode is intermediatebetween organic and embedded.
Boehm (1981) gives the distribution of effort and schedule for the main activities of development foreach mode and for a variety of development system sizes. As an example, Table 8-2 shows these distri-butions for a very large system of 512 KDSI for the embedded mode. For data on systems of other sizes,see page 99 of Boehm (1981). Gaffney (1982) presents a different set of activity distributions and notesthat the distribution of effort among the development activities is a function of the development pro-ductivities. Gaffney also found higher production use to be associated with higher proportions of thedevelopment effort in front-end activities.
"lhble 8-2. Embedded Mode Activity and Schedule Distnrbution
Activity Percent Effort Percent Schedule Time
Product design 18 38
Detailed design 24 16
Code and unit test 24. 16
Integration test 34 30
Total 100 100
8.3.1.2 Intermediate Constructive Cost Model
The COCOMO intermediate model expands the basic model to include cost multiplier factors whichmodify the cost estimates (LM) developed from the basic models shown in Table 8-1. Table 8-3 pres-ents these cost multipliers. You can use your subjective judgment to select a ratings level. Moredetailed definitions of the ratings levels are in Boehm (1981) if you need them.
8-3

8. How to Estimate Software Cost
Table 8-3. Intermediate Model Effort Multipliers
Ratings (MO _
Very Very ExtraCost Drivers Low Low Nominal High High High
Product AttributesRELY Required software reliability 0.75 0.88 1.00 1.15 1.40
DATA Database size 0.94 1.00 1.08 1.16
CPLX Product complexity 0.70 0.85 1.00 1.15 1.30 1.65
Computer Attributes
TIME Execution time constraint 1.00 1.11 1.30 1.66
STOR Main storage constraint 1.00 1.06 1.21 1.56VIRT Virtual storage volatility 0.87 1.00 1.15 1.30
TURN Computer turnaround time 0.87 1.00 1.07 1.15
Personnel Attributes
ACAP Analyst capability 1.46 1.19 1.00 0.86 0.71AEXP Applications experience 1.29 1.13 1.00 0.91 0.82
PCAP Programmer capability 1.42 1.17 1.00 0.86 0.70VEXP Virtual machine experience 1.21 1.10 1.00 0.90
LEXP Programming language experience 1.14 107 1.00 0.95
Project Attributes
MODP Use of modem programming practices 1.24 1.10 1.00 0.91 0.82TOOL Use of software tools 1.24 1.10 1.00 0.91 0.83
SCED Required development schedule 1.23 1.08 1.00 1.04 1.10
The general formula for effort (cost) estimation within the COCOMO model is:
nLM = a(KDSI)b .HIM.
where Table 8-1 gives values for the parameters a and b. The values of the parameter MK, the selectedcost multiplier, are found in Table 8-3.
Using Tables 8-1 and 8-3, the cost of developing a 512 KDSI (very large), semidetached softwareproduct with a high product complexity, low programmer capability, very low virtual machineexperience, and very low use of modem software practices (all other factors nominal) is:
3.0(512)1"12(1.15)(1.17)(1.21)(1.24) = 6,555 LM
These multipliers are not totally independent of each other, although you apply them under theCOCOMO model as though theywere. There is a cost-effect overlap between any two and among anygroup of COCOMO cost multipliers. Where you apply only avery small group of cost multipliers (say,two or three), the effect of this cost overlap is minimal. But if you use a large number of multipliers,the cumulative effect of the overlap may be serious. The estimated costs may be too high or too low.
8-4
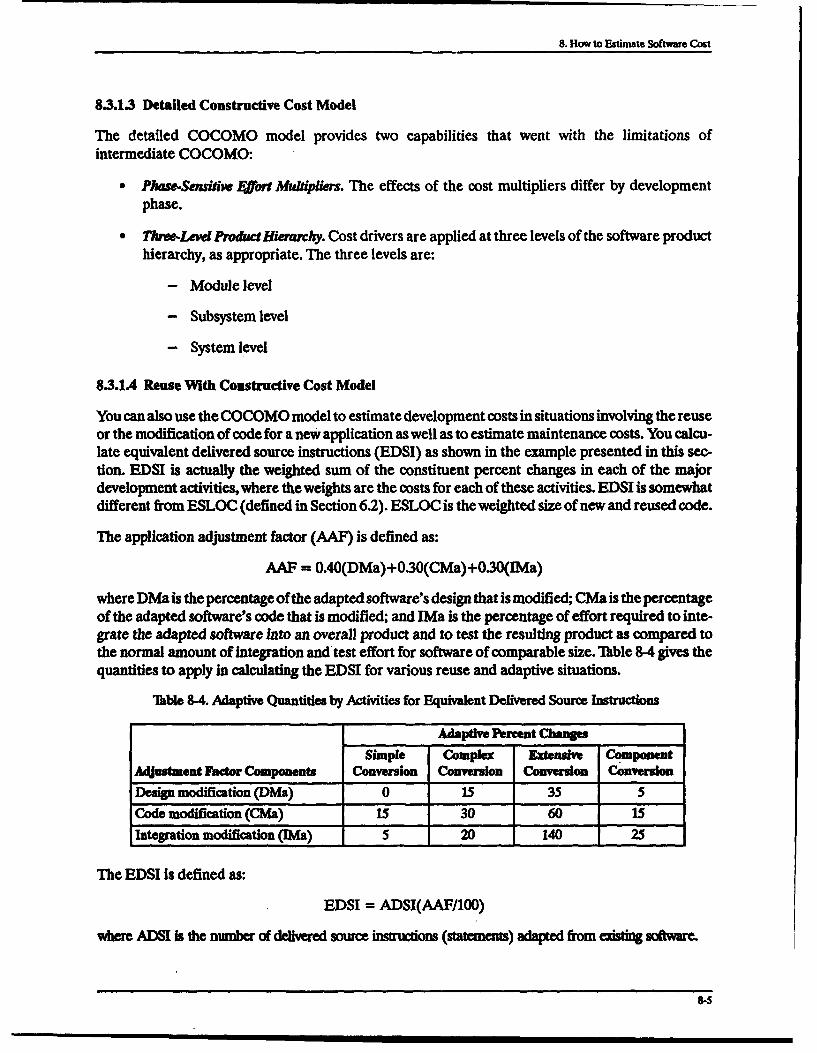
8. How to Estimate Software Cost
8.3.1.3 Detailed Constructive Cost Model
The detailed COCOMO model provides two capabilities that went with the limitations ofintermediate COCOMO:
"* Phase-Sansitie Effort Multipliers. The effects of the cost multipliers differ by developmentphase.
"* Three-Lev Product Hierarchy. Cost drivers are applied at three levels of the software producthierarchy, as appropriate. The three levels are:
- Module level
- Subsystem level
- System level
83.1.4 Reuse With Constructive Cost Model
You can also use the COCOMO model to estimate development costs in situations involving the reuseor the modification of code for a new application as well as to estimate maintenance costs. You calcu-late equivalent delivered source instructions (EDSI) as shown in the example presented in this sec-tion. EDSI is actually the weighted sum of the constituent percent changes in each of the majordevelopment activities, where the weights are the costs for each of these activities. EDSI is somewhatdifferent from ESLOC (defined in Section 6.2). ESLOC is the weighted size of new and reused code.
The application adjustment factor (AAF) is defined as:
AAF = 0.40(DMa)+030(CMa)+0.30(Ma)
where DMa is the percentage of the adapted software's design that is modified; CMa is the percentageof the adapted software's code that is modified; and IMa is the percentage of effort required to inte-grate the adapted software into an overall product and to test the resulting product as compared tothe normal amount of integration and'test effort for software of comparable size. Ibble 8-4 gives thequantities to apply in calculating the EDSI for various reuse and adaptive situations.
"lhble 8-4. Adaptive Quantities by Activities for Equivalent Delivered Source Instructions
Adaptive Percent Chagessimple complex Extensive Component
Adjustment Factor Components Conversion Conversion Conversion Conversion
Design modification (DMa) 0 15 35 5Code modification (CMa) 15 30 60 15Integration modification (OMa) 5 20 140 25
The EDSI is defined as:
EDSI = ADSI(AAF/100)
where ADSI is the number of delivered source insmt ons (statements) adapted from ezisting software.
8-5

8. How to Estirmtc Softwma Cost
Thus, for a simple conversion (i.e., a simple reuse application) involving 500 statements, in whichthere is 0 percent change in design, 15 percent change in coding, snd 5 percent change in testing:
AAF=0.4(0)+0.3(15)+0.3(5)=6.0 and EDSI=500(0.06)=30.0
The KDSI and EDSI models assume known and stable requirements. The EDSI model accounts forusing only existing code and does not cover the use of existing domain and design information,including the effort to locate and evaluate reusable code.
Balda and Gustafson (1990) present a COCOMO-related reuse model that overcomes these difficulties. Themodel is:
LM = aN1b + 20yaN 2b + yaN3,
where a and b are the multipliers and the exponents, respectively, from Table 8-1; and y (gamma) isthe cost ratio of developing a reusable component to the cost of developing a unique component. Therange of y is from 0.06 to 0.24; so for real-time command and control software, y will have a value ofabout 0.2. For MIS software, y will have a value of about 0.1. N1 is the number of unique KDSI devel-oped, N2 is the number of KDSI developed to be reusable, and N3 is the number of unchanged reusedKDSI.
Balda and Gusafson (1990) also present a COCOMO-based prototype cost model for the evolutionary spiralprocess (see Section 8.4) of the form:
LM =f a.pb + alb + alt
where a and b are the multipliers and exponents, respectively, from the effort column of "ible 8-1. Aswith the basic COCOMO model, you must select the proper software development mode. P is theSLOC developed for the initial prototype. I is the number of SLOC developed during iterations of theprocess and is the total of SLO)C added, removed, and modified. T is the number of SLOC developed specfi-cally to convert the software to a deliverable product. (Ibis pototype cost model is considered to be an initialmodel.)
83.1.5 Ada Process Model
The Ada Process Model (Boehm 1987) is a variation of the COCOMO model. It incorporates the effects ofthe use of Ada, rapid prototyping, risk management, the spiral model, and certain modern softwaredevelopment practices (as shown in Table 8-3 and in Boehm [1987]) into one model. The Ada versionof COCOMO, which incorporates the effects of the use of Ada and the Ada Process Model, is:
4. .. 1.04 + XWi
LM = 2.8(KDSI) I
where the weights Wi are given in Ibble 8-5.
8-6

8. How to Estimate Software Cost
Table 8-5. Weights for the Ada-Constructive Cost Model
Design Thoroughnessat PDR: Requirements
Experience With Ada Specifications Risks Eliminated Volatility DuringWeights Wi Process Model Compiled by PDR Development
0.00 Successful on > 1 Fully (1000%) Fully (100%) No changesmission-criticalproject
0.01 Successful on 1 Mostly (90%) Mostly (90%) Small noncriticalmission-critical changesproject
0.02 General familiarity Generally (75%) Generally (75%) Frequent noncriticalwith practices changes
0.03 Some familiarity with Often (60%) Often (60%) Occasional moderatepractices changes
0.04 Little familiarity with Some (40%) Some (40%) Frequent moderatepractices changes
0.05 No familiarity with Little (20%) Little (20%) Many large changespractices
Using the guidance in Table 8-5, a software development environment with no familiarity with the AdaProcess Model or with the modem software practices of design thoroughness and risk managementin an environment of changing requirements would rate a value of 0.05 in all four categories ofsoftware practice. Then the Ada-COCOMO estimating equation for 512 KDSI would be:
LM = 2.8(512)124 = 6,407
Table 8-6 gives some values of LM from the Ada-COCOMO model with the associated productivities.
"Table 8-6. Sample Effort and Productivities for the Ada-Constructive Cost Model
100 KDSI 500 KDSI
Sum Wi LM SLOCILM LM SLOC/LM
0.00 336 298 1,795 279
0.04 405 247 2,302 217
0.08 487 205 2,951 169
0.12 585 171 3,784 132
0.16 703 142 4,852 103
0.20 846 118 6,221 80
8.3.2 Tim SovxWARw DEvELOPMENrr MODEL
The software development model (Putnam 1978) is a widely used holistic model. This sectiondescribes this model and presents some of its application.
8-7
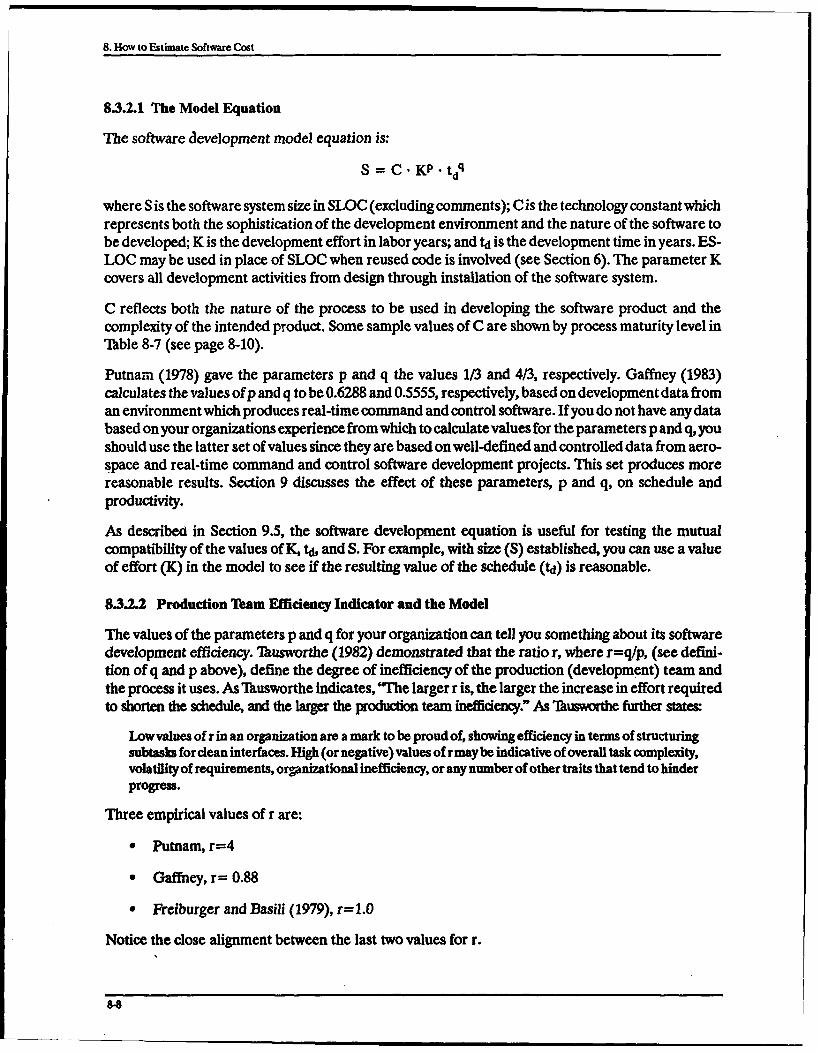
8. How to Estimate Software Cost
83.2.1 The Model Equation
The software development model equation is:
S = C. KP - tdq
where S is the software system size in SLOC (excluding comments); C is the technology constant whichrepresents both the sophistication of the development environment and the nature of the software tobe developed; K is the development effort in labor years; and td is the development time in years. ES-LOC may be used in place of SLOC when reused code is involved (see Section 6). The parameter Kcovers all development activities from design through installation of the software system.
C reflects both the nature of the process to be used in developing the software product and thecomplexity of the intended product. Some sample values of C are shown by process maturity level inThble 8-7 (see page 8-10).
Putnam (1978) gave the parameters p and q the values 1/3 and 4/3, respectively. Gaffney (1983)calculates the values of p and q to be 0.6288 and 0.5555, respectively, based on development data froman environment which produces real-time command and control software. If you do not have any databased on your organizations experience from which to calculate values for the parameters p and q, youshould use the latter set of values since they are based on well-defined and controlled data from aero-space and real-time command and control software development projects. This set produces morereasonable results. Section 9 discusses the effect of these parameters, p and q, on schedule andproductivity.
As described in Section 9.5, the software development equation is useful for testing the mutualcompatibility of the values of K, td, and S. For example, with size (S) established, you can use a valueof effort (K) in the model to see if the resulting value of the schedule (td) is reasonable.
83.2.2 Production Team Efficiency Indicator and the Model
The values of the parameters p and q for your organization can tell you something about its softwaredevelopment efficiency. Tausworthe (1982) demonstrated that the ratio r, where r=q/p, (see defini-don of q and p above), define the degree of inefficiency of the production (development) team andthe process it uses. As Tausworthe indicates, "The larger r is, the larger the increase in effort requiredto shorten the schedule, and the larger the production team inefficiency.: As 71husworthe further states:
Low values of r in an organization are a mark to be proud of, showing efficiency in terms of structuringsubtasks for dean interfaces. High (or negative) values of r may be indicative of overall task complexity,volatility of requirements, organizational inefficiency, or any number of other traits that tend to hinderprogress.
Three empirical values of r are:
"* Putnam, r=4
"* Gaffney, r= 0.88
"• Freiburger and Basili (1979), r=1.0
Notice the close alignment between the last two values for r.
8-8

8. How to Estimate Software Cost
8.3.2.3 Incremental Changes With the Model
You can use the derivative form of the software development model equation to determine theamount of change in one or two process variables given a small change in the third variable.The incre-mental change equation (Gaffney 1982) is derived from the full differential of the software life cyclemodel. Its form is:
AS = AC + p. AK+ q td
where AK/K and Atd/td are small percentage changes. If size and technology are held constant:
AK (qý) (Atd)K td t
Thus a 5 percent shrinkage in schedule is expected to induce a 4.4 percent increase in effort.
- 0.8834 - 5 AK = 4.4K
The incremental change equation can be used to estimate the effect of small changes in size, tedmology,effort, and/or schedule on any one of these variables. For example, you might want to estimate theeffect of small relative reductions in effort (K) and schedule (td) on the technology constant (C) suchas might be expected from the introduction of a new tool or technology into the development process.
8.3.2.4 Calculation of the Technology Constant
You can estimate the value of the technology constant C for your environment and your applicationby use of the following equation:
where the values of q =0.5555 and p=0.6288 are recommended. The values of the three variables td,
K, and S should be from (in your experience database) similar applications as the one that you areestimating C. If you have several similar previous applications, calculate C for each and average themto get your new application. You should keep in mind that values of C will vary by type of applicationand by development environment.
The technology constant C may be understood as representing two principal categories of factorsaffecting software development: the complexity of the software to be developed and the nature of thetools (Gaffney 1982). It really includes more factors than just those that can be grouped under the term'technology.' Walston and Felix (1977) identify 29 of these factors.
If you do not have sufficient software development experience data to calculate the value of thetechnology constant C, you can estimate it with the help of Table 8-7. Table 8-7 presents sample valuesof C (Putnam 1990) that assume the use of a basic software development environment and the threemodes of the COCOMO model. (If a more sophisticated environment is expected, higher values ofC would be appropriate since higher values represent higher productivity and shorter schedule.) Youcan use these values as guidance in estimating the value of C for your environment and your application.
8-9

8. How to Estimate Software Cost
Table 8-7. Sample Technology Constant Values
SEI Process Value of Technology Constant (C) for Software Mode
Maturity Organic Semidetached EmbeddedLevel
1 12,000 10,000 6,000
2 30,000 25,000 15,000
3 42,000 35,000 21,0004 54,000 45,000 27,000
5 78,000 65,000 39,000
8.3.3 ThE CoommnvE PROGmmIG MODEL
The Cooperative Programming Model (COPMO) is another type of holistic model (Conte,Dunsmore, and Shen 1986). COPMO is designed to explicitly reflect the effect of development teamsize on effort. The effect of team size on development effort is especially strong in large projects wherethe complex nature of the software causes communication among the technical staff and among man-agement to be difficult thus causing costs to rise dramatically. For large, complex projects, cooperationand communication must be effective to hold costs down.
The COPMO model is:
E=EP+EC
where Ep is the effort in LM for programming and technical development of the software product andEc is the effort in LM for communication among the development staff. The programming effort isgiven by.
Ep= e+f S
where S is the software size in KSLOC. The communications effort is given by:.
c=g'Lh
where L is the average staffing level in LM per month over the duration of software development.
Some parameter values empirically derived from actual development data are e=48.0, f=0.33,g=2.02, and h=1.67. Conte, Dunsmore, and Shen (1986) give similar values.
8.3.4 How TO APPLY Housnc MODELS FOR COST ESTIMAnON
If your organization has little or no accumulated software development experience, you can applyholistic models such as COCOMO, the software development cycle model, and COPMO using theparametric values presented here. As you gain and record software experience, you should modify orcustomize the holistic model parameter values to more closely represent your own software process.Regardless of the degree of development of your estimating process, you can use the holistic modelsas a cross-check on each other. You should make estimates for any situation using two or more models,
8-10
8. How to Estimate Software Cost
and you should compare their results. If the results differ by more than 10 to 20 percent (either costor schedule time), then you should closely examine your assumptions and data about the softwareproject in question.
As an example of cross-checking, suppose that you use the basic COCOMO semidetached model toestimate the cost of developing 660 KDSI. The estimate is 3.0(660)1"12 = 4,315.3 LM. If you also usethe software development cycle equation to calculate the effort involved in developing 660 SLOC in3.5 years with a technology constant of 10,000, the result involves solving the following relation for K:
660,000 = 10, 000 • K°-62m • 3.50•5555
The result is 258.8 labor years, or 3,105.6 LM, a value that does not compare well to theCOCOMO-generated value. If you remember that the COCOMO value includes quality assurance,configuration management, and software builds which are an additional (estimated) 19 percent costincrement (see Section 8.9), then the COCOMO value becomes 4,315.3/1.19 = 3,626.3 LM. This valueis only 14 percent different from the software development life cycle equation value, so you can consider bothvalues to be essentially the same.
In general, when two estimates do not compare in a cross-check, look for differences in the definitionof work to be done. Since KSLOC and KDSI are essentially the same, the difference is in the rangeof activities implied by each model. Check for size/effort/schedule compatibility as shown in Section 9.
If your organization is at process maturity level 1 or 2, use holistic models for cost and schedule estimationand for cross-checking purposes. You should initiate a software experience database to preserve costexperience, and use the data to customize the holistic model parameter values to your developmentenvironment.
8.4 ACTIVITY-BASED MODELS
This section describes activity-based cost models and how you can apply them to do cost estimates foryour projects. For cost estimation, holistic models represent a great improvement over the ad hoc costestimation methods of the past; however, but they are not as precise as the activity-based methodswhen applied with your own experience data. lb implement activity-based models, you need to accu-mulate software process and product information, preferably recorded in a formal database. Evenwhen your software development process is mature enough to implement activity-based models withcustomized cost data, you can still use the holistic models as an approximate cross-check on theestimated overall software project costs.
8.4.1 TIm Ac Vrff.BASE Cosr MODEL
An activity-based cost model enables you to consider the costs of each of the activities in the developmentcycle, such as requirements analysis, preliminary and detailed design, code and unit test, CSC integra-tion test, and CSCI system test. You build an activity-based cost model by assembling and orderingthe activities that compose the development process to be used to produce the intended software product. Theactivities that form your development process may be from a previously used process, or they maycome from a modified version of a previous process with some activities removed and other activitiesadded, or there may be a selected subset of activities from a "menu" of activities. Your project maynot use all of the "repertoire" of possible activities. For example, if you are developing a new version
8-11

8. How to Estimate Software Cost
of an existing system, you may not have any preliminary design in your development process. Youusually measure unit costs in LM/KSLOC or LH/WSLOC, although other metrics may be appropriateunder certain circumstances. You should define your software development cyde in terms of known and mea-surable activities based on your organization's experience as contained in your experience database.
The activity-based model assigns a unit cost to each activity and estimates costs in LM or LH bymultiplying the size of the software product (KSLOC or SLOC) by the assigned unit cost (LM/KSLOCor LH/SLOC). The general form of the activity-based model is based on the operations of adding,modifying, reusing, and removing code as discussed in Section 6. The general form of the model is:
a n
TLM = (LM/KSLOC)ikd • KSLOCadded + -(LM/KSLOC)imodied KSLOCm.odiedi=1 i=1
n a1
+ -(LM/KSLOC)i,,sd" KSLOCreue + 1(LM/KSLOC)irjeo " KSLOCemoedi-I i"1
where TLM indicates the total effort in LM for all n activities and (LM/KSLOC)ij indicates a unit costin LM/KSLOC for activity i and code category j.
You can simplify this general form byweighting the modified code the same as added code (since bothcan be assigned the same unit cost) and then combining the added and modified code into the new codecategory. You can also assign the removed code a unit cost of 0.0. This procedure reduces the aboveequation to:
n a
77,M = (LM/KSLOC)4w, • KSLOCnew + Y(LM/KSLOC)ireu d 0 KSLOCrdi-i i=1
where TLM indicates the total effort inLM for all n activities and (LM/KSLOC)ij indicates a unit costin LM/KSLOC for activity i and code category j. You can use either actual or estimated size data.
An alternative form of the previous cost (effort) estimating equation employs the categories "new"and "reused" code only. It is the recommended format to employ (IEEE 1992; Gaffney andCruickshank 1991a and 1991b).
"n n
TLH = D(LH/SLOC)I,I.w" SLOCnIw + -(LH/SLOC)ire=d - SLOCrea•i-i i-i
where TIM indicates the total effort in LH for all n activities and (LH/SLOC)ij indicates a unit costin LH/SLOC for activity i and code category j. You can use either actual or estimated size data. Othercategories of code can be used with this type of activity-based model. Section 6.6.1 explains how youcan estimate the unit costs for use in the activity-based cost model.
Activity-based costs models are linear models. Actually, software cost estimation models may not belinear in size. The COCOMO and development life cycle models previously discussed are examplesof such nonlinear models. The activity-based model, as a linear cost model, is useful for cost estimationand control in the duration of a software development project. The unit costs of activities may be non-linear over the wider range of software product sizes, but they can be treated as linear over shorterranges.
8-12

8. How to Estimate Software Cost
Alternative linear models include:
Cost = a + b • S and Cost = d • S
where cost (effort) can be measured in LM or LH and S is SLOC or KSLOC (or other appropriatesize measure). The parameters a, b, and d are calculated based on the experience database for yourorganization in a manner similar to that described in Section 6.6.1.
8.4.2 A BAsic STAGEWISE Acrlry-BAsED CosT MODEL
Table 8-8 contains activities from DOD-STD-2167A (Department of Defense 1988) andDOD-STD-1521B (Department of Defense 1985) and unit costs that were derived from actual experi-ence in developing embedded software in the aerospace industry during the development of 25 large(over 500 KSLOC) real-time command and control software systems. Cruickshank and Lesser (1982)present similar unit costs for a related sample of activity-based models. You may use the activities inTable 8-8 as a "menu" from which to select activities, if appropriate, to form your development pro-cess. The ordering of the activities in Table 8-8 is a natural order for presentation but not necessarilythe expected order of development. The unit costs shown in this table are for guidance, and your goalis to create your own set of unit costs based on your organization's experience.
The LM in Table 8-8 are based on 167 hours, and the unit costs for new and reused code for eachactivity includes the costs of multiple iterations through that activity. The model of the software devel-opment process presented in Table 8-8 is a stagewise model in that it is composed of a succession ofactivities. The model incorporates the possibility of iteration between successive major steps. Thecosts of a normal amount of iteration are incorporated in the unit costs given. The costs for eachiteration are not normally separable.
The unit costs in Ulble 8-8 indude the costs (about 13 percent) for first-line management and applicablesecond-line management (Cruickshank 1988). Section 8.9 discusses additional costs for qualityassurance, configuration management, and program management.
8-13
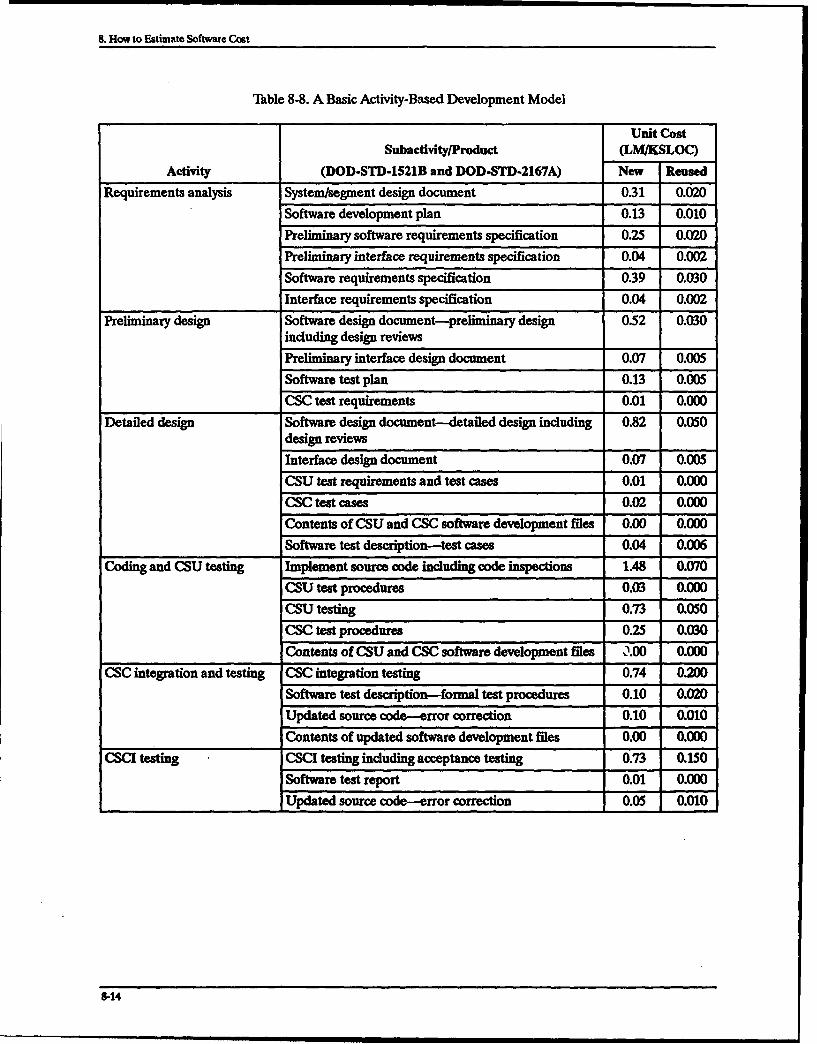
8. How to Estimate Software Cast
Table 8-8. A Basic Activity-Based Development Model
Unit CostSubactivity/Product (LM/KSLOC)
Activity (DOD-STD.1521B and DOD-STD-2167A) New Reused
Requirements analysis System/segment design document 031 0.020
Software development plan 0.13 0.010
Preliminary software requirements specification 0.25 0.020
Preliminary interface requirements specification 0.04 0.002
Software requirements specification 0.39 0.030
Interface requirements specification 0.04 0.002
Preliminary design Software design document-preliminary design 0.52 0.030including design reviews
Preliminary interface design document 0.07 0.005
Software test plan 0.13 0.005
CSC test requirements 0.01 0.000
Detailed design Software design document-detailed design including 0.82 0.050design reviews
Interface design document 0.07 0.005
CSU test requirements and test cases 0.01 0.000CSC test cases 0.02 0.000
Contents of CSU and CSC software development files 0.00 0.000
Software test description-test cases 0.04 0.006
Coding and CSU testing Implement source code including code inspections 1.48 0.070
CSU test procedures 0.03 0.000
CSU testing 0.73 0.050
CSC test procedures 0.25 0.030Contents of CSU and CSC software development files 0.00 0.000
CSC integration and testing CSC integration testing 0.74 0.200
Software test description-formal test procedures 0.10 0.020
Updated source code-error correction 0.10 0.010
Contents of updated software development files 0.00 0.000
CSCI testing CSCI testing including acceptance testing 0.73 0.150Software test report 0.01 0.000
Updated source code-error correction 0.05 0.010
8-14

8. How to Estimate Software Caat
8.4.3 ESTWIATING COSTS USING Acnvry-BAsED MODELS
This section tells you how to estimate unit costs for the various software development processactivities. Also, Section 6.6 deals with this subject.
8.43.1 Assignment of Costs
The basic procedure in estimating costs with activity-based models is to assign costs to each of theactivities in the process being estimated and then to compute the total cost estimate. This procedureconsists of the following steps:
1. Decompose your project software development process into its constituent activities in theprocess to be used to develop the specific software system. List the activities of the softwaredevelopment process.
2. Assign a unit cost (LMIKSLOC, LHISLOC, etc.) to each of the activities. You can sample theunit costs for the activities inTable 8-8 for guidance if this table contains activities that are simi-lar to those in your development process, or you can use the existing unit costs of the develop-ment process being modeled. If you don't have any unit cost figures, then you may be able toderive them from the information in your experience database using the methodologypresented in Section 6.6.1.
3. Modify the unit costs selected to be consistent with the development environment as discussedin the following sections.
4. Estimate the size of the new and reused code in the software product whose development costsare being estimated.
5. Estimate the cost of each activity and total the costs of the activities in the process.
8.43.2 Example of Activity-Based Cost Estimation
The general cost model for a software product containing new and reused code is:
CS = CvN" SN + CvR" SR
where:
Cs = The total cost of the software product.
CVN = Unit cost of new code developed for this product.
CVR = Unit cost of reusing code in this product. It represents the unit cost of reused codein the case where the components can be inserted directly into the product with nomodification.
SN = Amount of new code in source statements developed for this product.
SR = Amount of reused code incorporated into this product in source statements.
As an example, suppose that you are to develop software consisting of 450 new KSLOC and 710 reusedKSLOC and that you are to perform the activities of preliminary design, detailed design, coding and
8-15
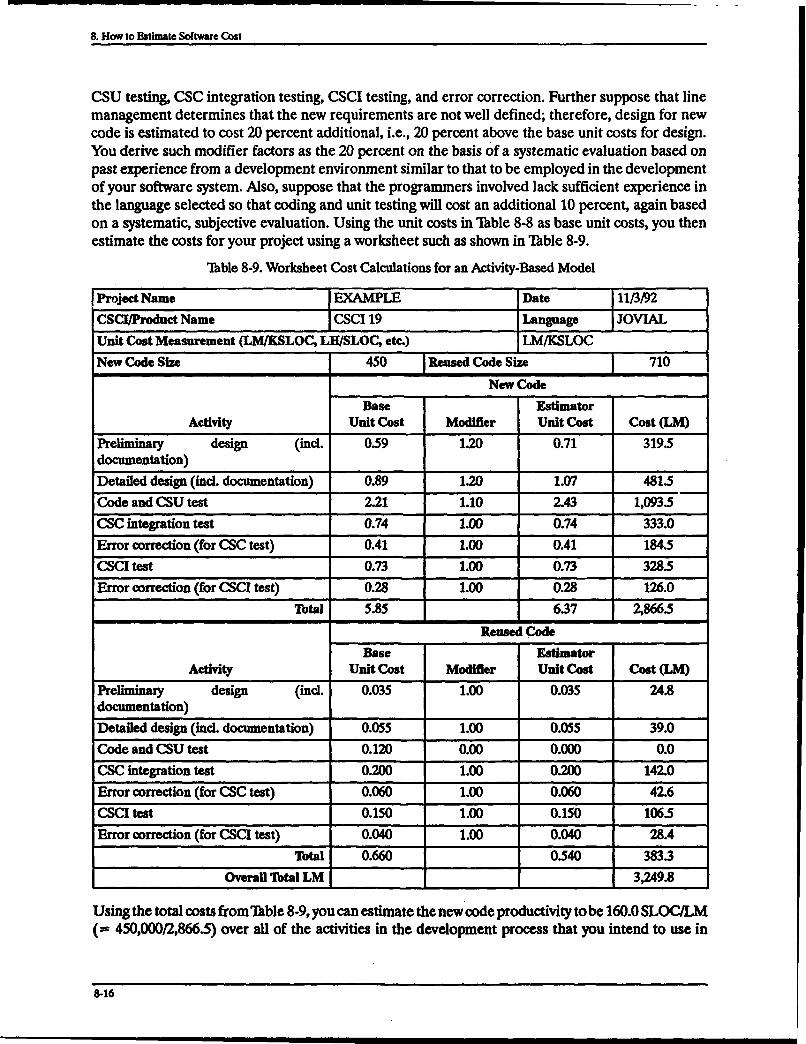
8. How to Extimmle Software Cost
CSU testing, CSC integration testing, CSCI testing, and error correction. Further suppose that linemanagement determines that the new requirements are not well defined; therefore, design for newcode is estimated to cost 20 percent additional, i.e., 20 percent above the base unit costs for design.You derive such modifier factors as the 20 percent on the basis of a systematic evaluation based onpast experience from a development environment similar to that to be employed in the developmentof your software system. Also, suppose that the programmers involved lack sufficient experience inthe language selected so that coding and unit testing will cost an additional 10 percent, again basedon a systematic, subjective evaluation. Using the unit costs in Table 8-8 as base unit costs, you thenestimate the costs for your project using a worksheet such as shown in Thble 8-9.
Table 8-9. Worksheet Cost Calculations for an Activity-Based Model
Project Name EXAMPLE Date 11/3/92
CSCL/Product Name CSCI 19 Language JOVIAL
Unit Cost Measurement (LM/KSLOC, LHISLOC, etc.) LM/KSLOC
New Code Size 450 Reused Code Size 710
New Code
Base EstimatorActivity Unit Cost Modifier Unit Cost Cost (LM)
Preliminary design (inc. 0.59 1.20 0.71 319.5documentation)
Detailed design (ind. documentation) 0.89 1.20 1.07 481.5
Code and CSU test 2.21 1.10 2.43 1,093.5
CSC integration test 0.74 1.00 0.74 333.0
Error correction (for CSC test) 0.41 1.00 0.41 184.5
CSC test 0.73 1.00 0.73 328.5
Error correction (for CSCI test) 0.28 1.00 0.28 126.0
Total 5.85 6.37 2,866.5
Re=se CodeBase Estimator
Activity Unit Cost Modifier Unit Cost Cost (LM)
Preliminary design (ind. 0.035 1.00 0.035 24.8documentation)
Detailed design (ind. documentation) 0.055 1.00 0.055 39.0
Code and CSU test 0.120 0.00 0.000 0.0
CSC integration test 0"200 1.00 0200 142.0
Error correction (for CSC test) 0.060 1.00 0.060 42.6
CSCI test 0.150 1.00 0.150 106.5
Error correction (for CSCI test) 0.040 1.00 0.040 28.4
Total 0.660 0.540 383.3Overall Total LM 3,249.8
Using the total costs from Tible 8-9, you can estimate the new code productivity to be 160.0 SLOC/LM(= 450,000/2,866.5) over all of the activities in the development process that you intend to use in
8-16

8. How to Estimate Software Cost
creating the new software product. Assuming that reusing code costs 30 percent of developing newcode, then KESLOC is 450+(0.30)(710)=663. The overall equivalent to new code productivity is(663,000/3,249.8)=204.0 ESLOC/LM. Also, the overall (delivered) product productivity is 357SLOC/LM (=1,160,000/3249.8). Comparing this productivity figure to that for new code, one ob-serves the dramatic effect of code reuse on the productivity realized in the creation of the softwareproduct.
8.4.3.3 Adjustment of Unit Costs
View the unit costs in Table 8-8 as an example or as guidance based on some specific experience in theaerospace industry with developing real-time command and control software. The same methodologyis used for estimating the costs of developing software for different industries. Your organization's ex-perience coupled with your judgment as a cost estimator may lead to a modification of some or all ofthese unit costs-up or down. For example, in a situation where your organization wants to integratemany CSCs, you may want to increase the unit cost for CSC integration test to account for additionalcomplexity. The same is true of the functional testing of the software system where you integrate manyCSCIs in the CSCI test.
Do not view these unit cost values as fixed quantities that must be applied with no modification. Theyrepresent guidance to the cost estimator and should be modified to represent the software develop-ment environment in question. For example, suppose that the unit cost for implementing source codeas shown in Table 8-8 had to be modified, in the judgment of the estimator, to reflect the fact that theprogramming staff is inexperienced in using the target coding language. Then, the estimator might as-sume that developing the code would cost 20 percent more than the given unit cost, and of a strongmanagement team, which would cost 10 percent less that the given unit cost, then the modified unitcost for the coding activity would be 1.48(1+.20-.10)=1.63 LM/KSLOC.
The optimum estimation situation, both for estimating cost and software size, is one in which your or-ganization creates, updates, and maintains a database of actual software and documentation sizes andcosts recorded by software development activity. Such a database, which your organization must haveto be at process maturity levels 3 or 4, allows you to create unit costs and overall cost estimates tailoredto your software development environment.
If a set of standard or guideline unit costs based on such a database, as suggested above, is notavailable, you can use the COCOMO detailed model, specifically the modern programming practices(MODP) effort multipliers shown in Boehm (1981, Mible 27-1). Using this scheme, you can modifythe baseline unit cost for each activity from requirements through integration and test by a multiplierfactor to adjust for the degree of adherence to modem programming practices. Boehm (1981) givesa set of factors to be used in this case.
Unit costs must be periodically recalculated since they change as more experience is recorded and asthe development process is improved. This guidebook treats unit cost values as though they did notvary with time, but actually they should decrease in the long term as the cumulative effects oftechnology change take effect.
8.4.4 OHmi Acn vr-BAs= MODELS
Table 8-10 presents the unit costs of an Ada Language Development Model (Cruickshank and Gaffney1992) and compares it with the unit costs shown in Table 8-8. Industry experience shows that in general
8-17

8. How to Estimate Software Cost
the costs of developing software using the Ada language is more costly than developing software usingstandard, more established languages. The higher cost for Ada is due to many factors, including theincreased functionality that Ada provides and an industry inexperienced with Ada.
Tlble 8-10. Ada Development Model
Ada Model Basic Activity-Based ModelActivity LM/KSLOC Percent LMIKSLOC Percent
Requirements Analysis 0.74 7.4 1.16 16.4Preliminary Design 1.67 "1_6.7 0.73 10.3
Detailed Design 2.22 22.2 0.96 13.6Code and Unit Test 2.22 22.2 2.49 35.2CSC Integration Test 1.60 16.0 0.94 13.3CSCI Test 1.55 15.5 0.79 11.2
Total 10.00 100.0 7.07 100.0
8.4.5 GENuiA Sorrwum DEVEmLPENT PRocEss MoDEis AND RlSK MANAGEMENT
Spiral models (Boehm 1988) of software development subsume all other software developmentmodels such as the basic activity-based model previously discussed. Spiral models are general modelsin the sense that they incorporate a formal risk management process that includes analysis and thedetermination and evaluation of risk, i.e., the objectives, alternatives, and constraints of proceedingto the next activity. Risk management includes measurement, analysis, and taking action. The actionmight be to do nothing but await the completion of another process activity. If the level of the risk(s)is evaluated to be unacceptable, then the developer should not proceed to the next activity but shouldperform risk aversion (or mitigation) until the risks are under control. Risk aversion can take the formof remaining in the present activity, going to another activity further 'downstream' from the presentactivity, or working on some other software component.
Risk aversion can also take the form ofworking to make the risk in the next activity be at an acceptablelevel, i.e., risk mitigation. Basically, the risk analysis helps the developer decide when to go to the nextactivity and when not to go to the next activity. This risk analysis procedure can be applied separatelyto each component of the software under development so that the developer will proceed with somecomponents and not proceed with other components.
For example, you might determine during the risk analysis activity performed at the end of design thatthe cost risks of proceeding to code and unit test are too high because of unacceptable risks, e.g., theunavailability of programmers with experience in the implementation language. Therefore, you de-cide that it is less risky to postpone code and unit test activities until the code and unit test risks havestabilized at an acceptable level. Presumably, this stabilization occurs when experienced programmersare assigned to the project.
The unit costs given for the basic activity-based model discussed in this section contain the total costsof all risk aversion subactivities. However, those risk aversion subactivities were not visible and theircosts were not known explicitly. It is likely that more advanced software process designs would devotemore effort to risk management activities than that included in the unit costs of the basic activity-based
8-18
8. How to Estimate Software Cost
model. In instances of the application of spiral models, record the number and costs of riskmanagement activities, if possible, inyour experience database as valuable pieces of information. Forexample, one form of risk aversion might be to iterate back through the present development activityuntil the risks associated with the following activity have stabilized at an acceptable level. Then recordthe number of iterations through this activity in your experience database.
8.5 ADJUSTING COST ESTIMATES
This section describes how you can pool several cost estimates. It also tells you how to adjust yourestimates to represent the impact of various factors, such as the level of the coding language to be used.
8.5.1 POOUNG ESrIM
It is vital that you be familiar with the software development process for which you are making a costestimate. Knowledge of the process means detailed knowledge of the activities that compose the pro-cess. You can select from the activities in Table 8-8 and modify the given unit costs to suit your situa-tion. If no activity in these tables corresponds to an activity in your intended development process, youmust find some other way to estimate the corresponding unit cost. Often, it helps to find an analogousactivity in a past development project and use the associated unit cost data. This selection andmodification process is known as modeling the software development process.
It is often helpful to make a cost estimate using an activity-based model then cross-check the estimateby using one or more of the holistic models. If the estimates do not differ by more than 10 percent (atmost 20 percent), you can conclude that the results from all the estimating techniques and models aregiving a consistent result. In the event that this desirable state of affairs does not exist (i.e., that someof the models give significantly different cost estimates), you must analyze the data and the modelsthemselves to find an explanation. It may be that some of the models are not suitable for applicationto the situation at hand. Experience will show which cost-estimating models and techniques are bestfor your software development environment.
8.5.2 Pouqr mND INmAL EsTmAm OF Cosr
If the unit costs of the activities in your development process are known from much experience for aspecific type of software product and a specific environment, there is little need to be concerned withthe amount of statistical variation in the unit cost values. The values of unit costs derived from experi-ence will be estimates of the "true" values, but they will be relatively precise estimates with little in-herent variation. However, estimates of software size tend to have much more inherent variation.When used with a single estimate of size, unit costs such as those in Table 8-8 will produce a point esti-mate of cost, i.e., a single estimate of cost with no information about variation or about an impliedstatistical distribution. In addition to the point estimate, you should try to produce an interval esti-mate, i.e., a range of possible cost values with the statistical distribution of values. One possible wayto do this is to estimate costs based on a sample of estimated software sizes with each of the size esti-mates produced by a different method. Section 7 presents several sizing methods that are useful in thiscontext.
However, when your unit costs are estimates based on little or no experience or other information,you must estimate costs based on a sample of sizes each with an assigned probability, spanning a possi-ble range of sizes, and based on a sample of possible unit costs with an assigned probability spanning
8-49

8. How to Estimate Softwe Cost
a range of possible unit costs. (The ranges of size and unit costs should be such that each set ofprobabilities totals 1.0.) This method will generate an interval estimate of cost. Section 8.10 gives anexample of this method in the context of computing an estimate of cost risk.
8.5.3 THE CosT EFEr OF A HIGHmR ORDER LANGUAGE
Using a higher order language (HOL) has an effect on software development costs. Gaffney (1986)establishes that the cost ratio of development in an HOL to development in assembly-level language is:
M- X++c
where c is the ratio of the (estimated) costs of software design and system testing costs to the softwarecoding and unit test costs, and X is the ratio of the size of the software function or product inassembly-level code to the size in HOL, i.e., the inverse of the language level. Gaffney (1986) givesa value of 0.59 for C and 3.0 for X for one development situation. You can use M as a multiplier onsoftware development costs in situations where you wish to account for the effect of using an HOLon software development costs.
You can apply this formula (make ratios) to estimate the relative costs of developing software in twodifferent HOLs.
8.5.4 THE CosT Em~cr oF SoFrwARu PRODUcr SIZE
Check for the effect that the software product size has on unit costs. As software product size increasesbeyond some given size, the unit costs generally rise. Gaffney and Werling (1990) show unit cost asa function of size for real-time embedded (aerospace) software:
URTE = 5.091 - S°O-s9
where Um= is the unit cost for aerospace software in LM/KSLOC and S is the software product sizein KSLOC. The relationship also holds if you measure unit cost in LHISLOC and size in SLOC, butyou would have to calculate revised parameter values accordingly.
For MIS (management information systems) software, a quadratic model does a somewhat better jobof predicting unit costs than an exponential model. Such a model for MIS software is:
Urms = 106.076 - 0.6542 • S + 0.00439. S2
where UMIs is the unit cost for MIS software in LMIKSLOC and S is KSLOC.
These relationships between unit cost and size were derived using new code development data. Youshould explore the sensitivity of your project unit costs by inserting several size values in KSLOCabove the current estimate of size and observing the effects on U. If U increases by more than 10 per-cent, there is probably a risk exposure. Each set of unit costs relate to a specific range of sizes, andwhen you estimate costs outside of your normal range of sizes, you may have to use a different set ofunit costs.
8-20

8. How to Estimate Software Cost
8.5.5 Cosr EmFcrs oF CASE TooLs
When considering the use of a CASE tool, you must determine (or estimate) its effect on specific activitiesin the software development process. This consideration should be tempered by recognizing the factthat some aspects of an activity are subject to automation while others can only be done by a person.For each activity, you should determine the impact of the CASE tool application on:
"* The reduction in the unit cost of doing the activity.
"* The additional cost, if any, on this and any other activity of applying the CASE tool.
"• The inputs to and the outputs from the activity.
"* The determination of how and when the activity is completed.
"* The quality of the activity.
"* The sequence of activities.
You cannot assess the (potential) impacts of the CASE tool without the detailed knowledge of theprocess that an activity-based model, backed up by an extensive experience database, provides. As anexample, suppose that your development process is like the Ada model shown in Table 8-10. Also sup-pose that you estimate that the application of the CASE tool results in a 30 percent reduction in thedetailed design costs. The unit cost of detailed designwill become (2.22)(0.70)=1.55 LMIKSLOC, allother activities being unaffected. This reduces the overall unit costs from 10.00 to 9.33 LM/KSLOC.
You must not only consider the potential impacts of applying the CASE tool on each activity but alsothe possible interactions of applying several CASE tools. If investment (in the tools or the process)is the same for each application, then you must recognize the possibility of a decreasing return oninvestment.
8.6 THE COSTS OF SOFTWARE REUSE
Section 8.4.3 showed how to estimate software development costs using the activity-based cost modelfor a software product involving new and reused code. This section expands on that cost model byshowing the effects of investment in a domain on the total cost of a software product.
8.6.1 SyMATIc REusE
The reuse economics model presented here focuses on the systematic reuse (Campbell, Faulk, andWeiss 1990) of large-scale functional objects. You should view systematic reuse in the reuse economicsmodel as consisting of two principal activities: domain engineering and application engineering. Do-main engineering is the capital investment involved in creating reusable software objects that can beemployed in a number of specific software systems or application systems. Capital investment heremeans the initial investment in terms of effort to create the means to produce application systems be-fore those application systems are actually produced. This investment may be made all at once for theentire domain investment, or it may be made incrementally over the life of the domain, i.e., as longas the domain is used to produce application systems. The term capital investment here does not implyany specific contractual arrangement.
8-21

8. How to Estimate Software Cost
Application engineering is the set of activities involved in creating a specific application system fromnew and reused code (covered by the equation at the beginning of Section 8.4.3.2).
8.6.2 THE BAsic EcoNoMIcs MODEL OF SornwARE REUSE
This section describes the basic reuse economics cost model.
8.6.2.1 Reuse Economics Model With Up-Front Domain Engineering
The basic reuse economics model (Gaffney and Cruickshank 1992; Cruickshank and Gaffney 1991aand 1991b) is designed to reflect the total costs of applying a reuse scheme. The model treats the costof an application system as the cost of the capital investment in domain engineering apportioned overthe expected N application systems plus the cost of application engineering (the cost of creating thatparticular system). Thus, the cost of an application system, Cs, equals the prorated cost of domainengineering plus the cost of application engineering. Further, the cost of application engineering isthe cost of the new code plus the cost of the reused code in the new application system, and R is theproportion of code that is reused code. Then:
CS = CDP + CA
CS= CD/N + CN + CR
CDp = CD/N and CA = CN + CR
where:
Cs = The total cost of an application system.
CD = The total cost of domain engineering.
CDp = The pro rata share of domain engineering distributed between each of the N applicationsystems.
CA = The cost of an application system.
CN = The cost of the new code in the application system.
CR = The cost of the reused code in the application system.Each of the costs, CD, CN, and CRk, is the product of a unit cost (LM/KSLOC) and an amount of code
(KSLOC).
Then:
CD = CDE- ST
CN = CVN* S N
CR = CVR- SR
Therefore, the basic reuse cost equation is:
CS = CU$ SS = CDE ST/N + CVN SN + CVR SR
where:
Cus = Unit cost of the application system.
CDE = Unit cost of domain engineering.
8-22

8. How to Estimate Software Cost
CVN = Unit cost of new code developed for this application system.
CVR = Unit cost of reusing code from the reuse library in this application system. It representsthe unit cost of reused code where the library components can be instantiated directly intothe application system with no modification.
ST = Expected value of the unduplicated size of the reuse library, i.e., the available,reusable functionality (software objects measured in source statements) in thelibrary.
SN = Amount of new code in source statements developed for this application system.
SR = Amount of reused code (from the reuse library) incorporated into this applicationsystem in source statements.
Ss = Total size of the application system in source statements.
Code sizes SN, SR, Ss, and ST are denominated in source statements, either physical or logical(Gaffney and Cruickshank 1991a and 1991b). These code sizes could be denominated in functionpoints (Albrecht and Gaffney 1983) or their variations (such as feature points). The important thingis that consistent units of code size are used.
Let SN/SS = I - R and SR/Ss = R, where R is the proportion of reuse.
Dividing through by Ss and rewriting:
cDESr = + R)+Cs NSs + - CVRR
Now let ST/Ss = K, the library relative capacity. Thus:Cus = -D•'K + CvN - (CvN -- Cvp)"
N Cw C C ,) *R
This is the basic reuse unit cost equation. On the average, it presumes a single reuse Of SR units (SLOC,KSLOC, function points) in each of the N application systems. Thus, this equation is most applicableto systematic reuse of code units having a relatively large amount of functionality.
8.6.2.2 Ubrary Efficiency
You can construct a reuse library to cover the expected variation of a unit of function with any numberof alternative or duplicate units of code (or reusable software objects). Let ST be the "unduplicated"size of the library or its capacity. There may well be alternate or duplicate implementation functional-ity in the reuse library (source codes, as just stated), but that alternate or duplicate functionality doesnot add to the size of S. The case of alternative implementation of source code or all of the functional-ity of size ST is covered in the cost model by an appropriate selection of the value of the unit costparameter, CDE.
The factor K (= ST/Ss), the library relative capacity, represents the average proportion (over the Napplication systems) of functionality of an application system covered by the reuse library. If Ss repre-sents the average application system size in the domain of interest, K is the upper bound for R, or R
SK•<1.
8-23

& How to Estimate Software Cost
The efficiency of the library infrastructure, E, is the ratio of the amount of reused code in theapplication system to the available reusable code.
E = R - SR / Ss - SR
K ST/ SS ST
where 0 _5 E _5 1.
The factor E indicates the extent to which the developer of a new application system has been ableto make use of the library of reusable components in the new system. E can be viewed as the proportionof reuse that is attained relative to what could be attained. Consideration of the meaning of E suggeststhat you organize your reuse libraries to focus on a particular subject or domain to achieve higher effi-ciencies and larger returns on investment (Cruickshank and Gaffney 1991a and 1991b; Gaffney andCruickshank 1992).
E is a measure of the systematic reuse application process efficiency. It is desirable that E be equalto 1.0 or slightly less than 1.0; application engineers, on average, are expected to reuse as much codeas possible when composing an application system.
8.7 HOW TO ESTIMATE DOCUMENTATION COSTS
Sections 8.7 through 8.9 present methods of estimating documentation costs and software developmentactivities costs, in which documentation is the main product. You use these estimating formulas ifyoudo not have any data about documentation sizes and costs in your experience database. Ifyou do havedata, develop similar estimating formulas based on your own experience. In the case of estimating doc-ument size from software size and effort from document size, you collect experience data so that youcan substitute your own parameter values into the estimation algorithms.
Hancock (1982) and Cruickshank (1984) give formulas for estimating the number of documentationpages from program size (SLOC) information and for estimating the documentation effort (LM) fromthe estimated pages. Table 8-11 provides formulas that you can use for estimating the number of docu-mentation pages from (estimates of) software size. In Table 8-11, P stands for pages and S stands forKSLOC. The methods, equations, and parameter values shown are based on the analysis of the soft-ware experience database (actual costs) of an aerospace developer of real-time command and controlsoftware. The database contains over 6 million source statements (new and reused) developed withmore than 1,000 labor years of effort over 40 major software products from the years 1976 to 1988(Cruickshank 1984, revised).
Ihble 8-11. Estimating Pages From Software System Size
Document DoD-STD-2167A Estimating Formula KSLOCDocument Range
System requirements SSS, SRS, IRS, P = 10.0 S - 0.073 S2 Below 68Software requirements SDPInterface requirementsSoftware development plan
P = 5.04S Above 68
Preliminary software design document Preliminary SDD, P = 10.0 S - 0.044 S2 Below 114Preliminary interface design document Preliminary IDD
P = 4.99 S Above 114
8-24
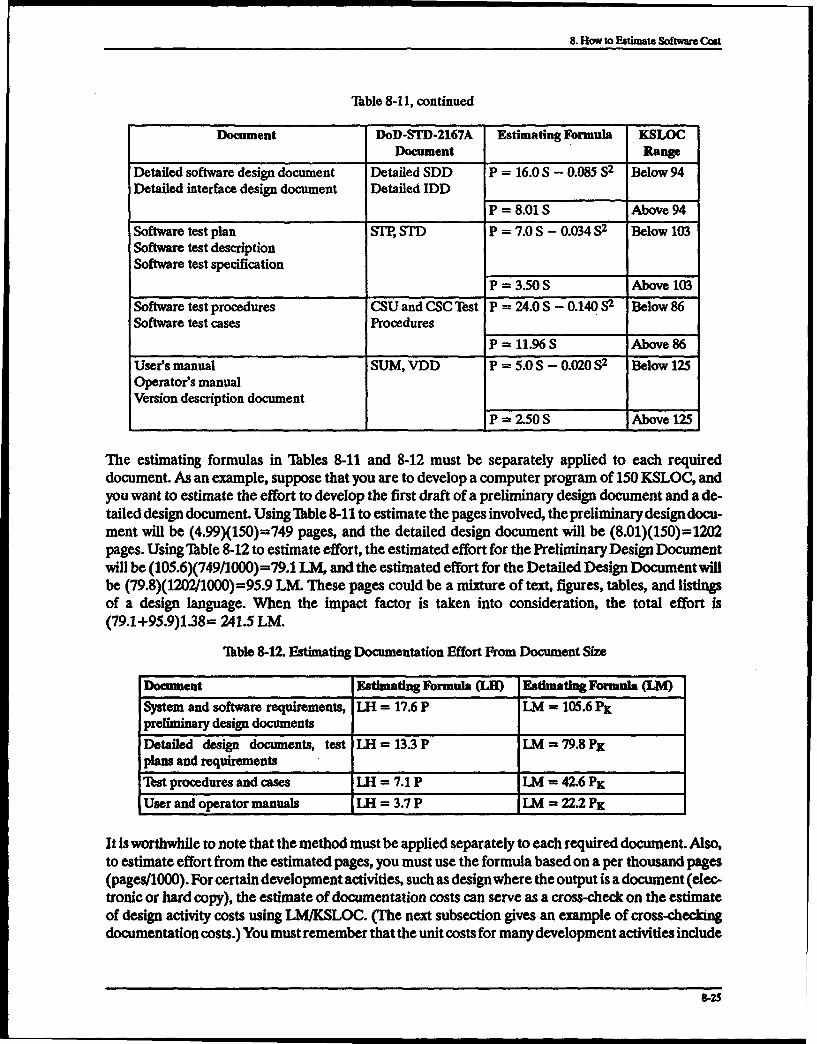
8. How to Estimate Software Cost
Table 8-11, continued
Document DoD-STD-2167A Estimating Formula KSLOCDocument Range
Detailed software design document Detailed SDD P = 16.0 S - 0.085 S2 Below 94Detailed interface design document Detailed IDD
P = 8.01 S Above 94Software test plan STP, STD P = 7.0S - 0.034 S2 Below 103Software test descriptionSoftware test specification
P = 3.50S Above 103Software test procedures CSU and CSC Test P = 24.0 S - 0.140 S2 Below 86Software test cases Procedures
P = 11.96 S Above 86User's manual SUM, VDD P = 5.0 S - 0.020 S2 Below 125Operator's manualVersion description document
P = 22.50S Above 125
The estimating formulas in Thbles 8-11 and 8-12 must be separately applied to each requireddocument. As an example, suppose that you are to develop a computer program of 150 KSLOC, andyou want to estimate the effort to develop the first draft of a preliminary design document and a de-tailed design document. Using Table 8-11 to estimate the pages involved, the preliminary design docu-ment will be (4.99)(150)=749 pages, and the detailed design document will be (8.01)(150)=1202pages. Using Table 8-12 to estimate effort, the estimated effort for the Preliminary Design Documentwill be (105.6)(749/1000)=79.1 LM, and the estimated effort for the Detailed Design Document willbe (79.8)(1202/1000)=f95.9 LM. These pages could be a mixture of text, figures, tables, and listingsof a design language. When the impact factor is taken into consideration, the total effort is(79.1+95.9)1.38= 241.5 LM.
Thble 8-12. Estimating Documentation Effort From Document Size
Document Estimating Formula (LE) Estimating Formula (LM)
System and software requirements, LH = 17.6 P LM = 105.6 PKpreliminary design documents
Detailed design documents, test LH = 13.3 P LM = 79.8 PKplans and requirements
Test procedures and cases LH = 7.1 P LM = 42.6 PK
User and operator manuals LH = 3.7 P LMJ= 22.2 PK
It is worthwhile to note that the method must be applied separately to each required document. Also,to estimate effort from the estimated pages, you must use the formula based on a per thousand pages(pages/1000). For certain development activities, such as design where the output is a document (elec-tronic or hard copy), the estimate of documentation costs can serve as a cross-check on the estimateof design activity costs using LM/KSLOC. (The next subsection gives an example of cross-checkingdocumentation costs.) You must remember that the unit costs for many development activities include
8-25

8. How to Eatimatc Software Cost
the costs of documentation as a separate minor activity or subactivity. You use these estimatingformulas for documentation size and costs when you want to estimate the cost of documentation asa separate activity or when you want to cross-check an estimate of documentation costs made with theuse of unit costs.
The relationships shown in Table 8-11 came from data generated before the publication ofDOD-STD-2167A (Department of Defense 1988), but these relationships have been extensivelytested and used in estimating situations since the publication of DOD-STD-2167A
Table 8-12 provides the formulas for estimating the documentation effort for a first draft in LH andLM from the estimated number of pages. The effort shown here includes the analysis time and writinga first draft. In Table 8-12, P stands for the number of pages and PK stands for 1,000 pages; therefore,the effort in LH is on a per page basis and the effort in LM is on a per thousand page basis.
Estimates produced by using the formulas in Tibles 8-11 and 8-12 are for a first draft of a document.There is an additional cost for producing a final document from the first draft, and you may wish toinclude these additional costs in some cases. For example, the real cost of documentation is the costof getting the document completed, which includes not onlywriting but also reviews and revisions, cus-tomer interfacing, and management. Reviews and revisions to the draft and preliminary versions ofthe document will cost an additional (to the first draft costs) 17 percent, customer interfacing will costan additional 8 percent, and management will cost an additional 13 percent. So the total impact factoris 1.38, and you must multiply the cost or effort of writing the document by the appropriate value ofthe impact factor to get the true cost of the document.
Suppose that you are to develop a computer program of 450 KSLOC, and you want to know how muchthe preliminary and detailed software design documents (SDD) will cost. Using Table 8-11 to estimatethe pages involved, the preliminary design documentation will be (3.5)(450)= 1,575 pages, and the de-tailed design documentation will be (2.0)(450)=900 pages. Using Table 8-12 to get costs, the prelimi-nary design documentation will cost (105.6)(1.575)=166.3 LM, and the detailed designdocumentation will cost (79.8)(0.900)=71.8 LM. These pages could be a mixture of text, figures,tables, and listings of a design language. Whenyou take the impact factor into consideration, the totalcost is (166.3+71.8)1.38= 328.6 LM.
8.7.1 ExAwPLE OF CROSS-CHECKING Esrmw OF DOCUMENTATION CosT
Suppose you wish to estimate the costs of software design documentation (but not test documentation)for a software project of 400 KSLOC in size. Table 8-8 shows that you require four design documents:the SDD and the interface design document (IDD) in both the preliminary and final forms. Using the newdocument unit costs from the table, the unit cost of documentation is (0.52+0.82+0.07+0.07) = 1.48 LWKSLOC, and the estimated total cost is (1.48X400 KSLOC) = 592.0 L
lb cross-check this estimate, use the documentation models presented in ahbles 8-11 and 8-12. FromTable 8-11, the preliminary design, detailed design, preliminary interface design, and interface designwill generate (3.5)(400) = 1,400 pages for the preliminary SDD and for the preliminary IDD and(2.0)(400) = 800 pages for the detailed SDD and for the detailed IDD. Estimate the same numberof pages for the preliminary and detailed IDD. Using Table 8-12, the preliminary SDD will cost(105.6)(1.4) = 147.8 LM as will the preliminary IDD. The detailed SDD will cost (79.8)(0.8) = 63.8LM as will the detailed IDD for a total of 423.2 LM. Applying an impact factor of 1.38, the total costis (423.2)1.38 = 584.0 0 LM. This estimate is clearly within 10 percent of the activity-based estimate.You may use either estimate.
8-26

8. How to Estimate Software Cost
8.8 TOP-DOWN ESTIMATION OF TOTAL SYSTEM DEVELOPMENT COSTS
As an estimator, you will sometimes be asked to answer the question, "Given a development programwith a total estimated cost of (say) $50 million, beginning in two years, what will be the breakdownon the costs of major products and activities (i.e., cost drivers)?" You might also be asked, "How muchsoftware can we produce for this program?" The methods presented in this section can help answersuch questions.
Often, projects entail the simultaneous development of computer hardware and software for a newsystem. (Here system means an interacting group of target computer hardware and software itemsdeveloped simultaneously.) This section presents a top-down method for estimating the allocation ofcost resources to all of the major aspects of system cost. The methodology is called top-down sincethe only inputs to the methods are the total amount of resources (in dollars or LM) and the applicableaspects of the developmental system.
The top-down estimating method represents the view that the total system costs (of which softwareis a part) are proportional to the costs of the major cost drivers such as the example proportions shownin Thble 8-13 (Cruickshank 1988). You can use estimating algorithms to calculate the costs of each ofthose cost drivers. In addition, the method represents the costs of all the major cost drivers as propor-tional to the software development costs. Table 8-13 shows an example of estimating algorithms fora developmental system. This includes all the major cost drivers of a full-scale program involving thesimultaneous development of computer hardware and software. This set of estimating algorithms andproportions is an example (based on the experience of a large system developer), and you should de-velop your own set of algorithms and proportions based on experience. You will want a separate setfor each type of development program and for each development environment.
Tlble 8-13. Example of Top-Down Estimating Model
Program Cost-Driver Proportion Algorithm
Software development (SW) (including builds and 0.22libraries)Computer hardware development (HW design and 0.14 0.65 SWmodel)Systems engineering (SE) 0.10 0.30 (HW+SW) or 0.50 SW
Test and evaluation (ME) (software and system testingl 0.11 0.25 (SW+HW+SE) or 0.50 SWvalidation)Manufacturing (MFG) (full-scale development) 0.12 2 to 5 systems
Product support (logistics) 0.06 0.09 (SW+HW+SE+TE+MFG)Configuration management, data management, and 0.07 0.10 (SW+HW+SE+TE+MFG)quality assurance (CM, DM, QA)Program management 0.18 Program management, financial
management, clerical, costengineering, measurement
Total 1.00
8-27
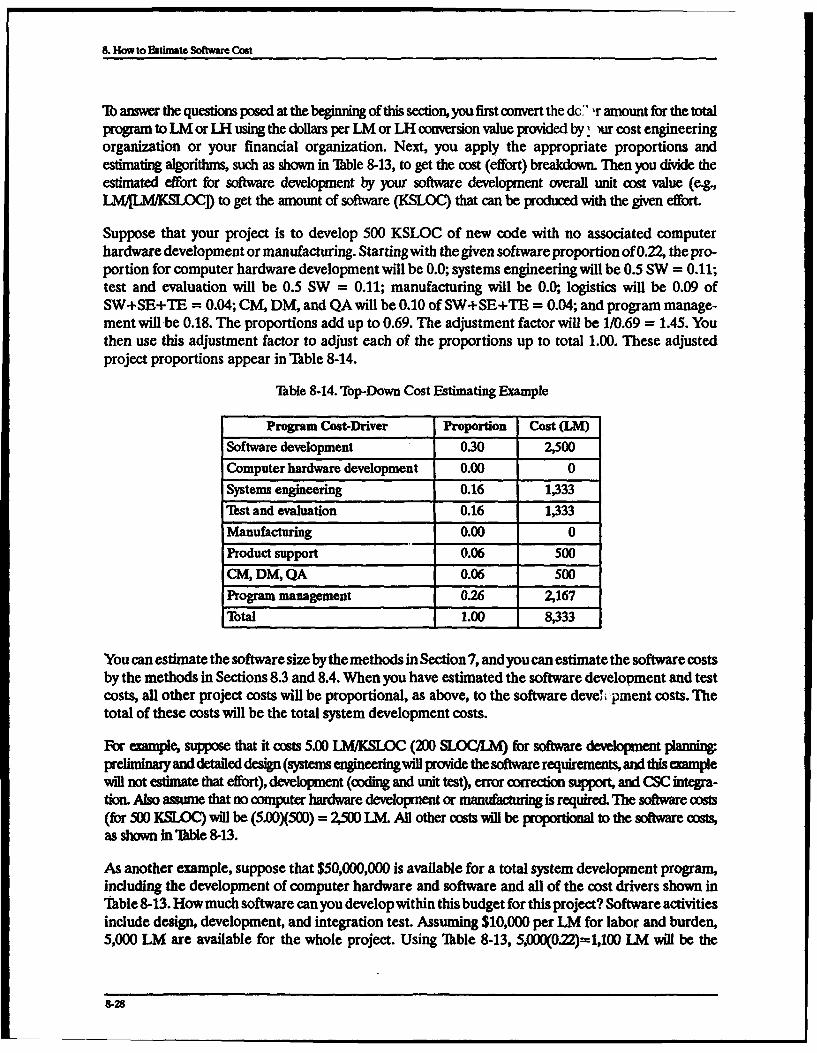
8. How to Estimate Software Cost
To answer the questions posed at the beginning of this section, you first convert the do" r amount for the totalprogram to LM or LH using the dollars per LM or LH conversion value provided by. 'ur cost engineeringorganization or your financial organization. Next, you apply the appropriate proportions andestimating algorithms, such as shown in "Ible 8-13, to get the cost (effort) breakdown. Then you divide theestimated effort for software development by your software development overall unit cost value (e.g.,LM4ILM/KSLOC]) to get the amount of software (KSLOC) that can be produced with the given effort
Suppose that your project is to develop 500 KSLOC of new code with no associated computerhardware development or manufacturing. Starting with the given software proportion of 0.22, the pro-portion for computer hardware development will be 0.0; systems engineering will be 0.5 SW = 0.11;test and evaluation will be 0.5 SW = 0.11; manufacturing will be 0.0; logistics will be 0.09 ofSW+SE+TE = 0.04; CM, DM, and QA will be 0.10 of SW+SE+TE = 0.04; and program manage-ment will be 0.18. The proportions add up to 0.69. The adjustment factor will be 1/0.69 = 1.45. Youthen use this adjustment factor to adjust each of the proportions up to total 1.00. These adjustedproject proportions appear in Table 8-14.
Table 8-14. Top-Down Cost Estimating Example
Program Cost-Driver Proportion Cost (LM)Software development 030 2,500Computer hardware development 0.00 0Systems engineering 0.16 1,333Tbst and evaluation 0.16 1,333
Manufacturing 0.00 0Product support 0.06 500CM, DM, QA 0.06 500Program management 0.26 2,167Total 1.00 8,333
You can estimate the software size by the methods in Section 7, and you can estimate the software costsby the methods in Sections 8.3 and 8.4. When you have estimated the software development and testcosts, all other project costs will be proportional, as above, to the software deve, ipment costs. Thetotal of these costs will be the total system development costs.
For example, suppose that it costs 5.00 LM/KSLIC (200 SLOC(LM) for software development planning:preliminary and detailed design (systems engineering will provide the software requirements, and this examplewill not estimate that effort), development (coding and unit test), error correction support, and CSC integra-tion. Also assume that no computer hardware development or manufacturing is required. The software costs(for 500 KSLC) will be (5.O0X500) = 2,500 LM Al other costs will be proportional to the software costs,as shown in Ibble 8-13.
As another example, suppose that $50,000,000 is available for a total system development program,including the development of computer hardware and software and all of the cost drivers shown inThble 8-13. How much software can you develop within this budget for this project? Software activitiesinclude design, development, and integration test. Assuming $10,000 per LM for labor and burden,5,000 LM are available for the whole project. Using "Fble 8-13, 5,000(0.22)=1,100 LM will be the
8-28
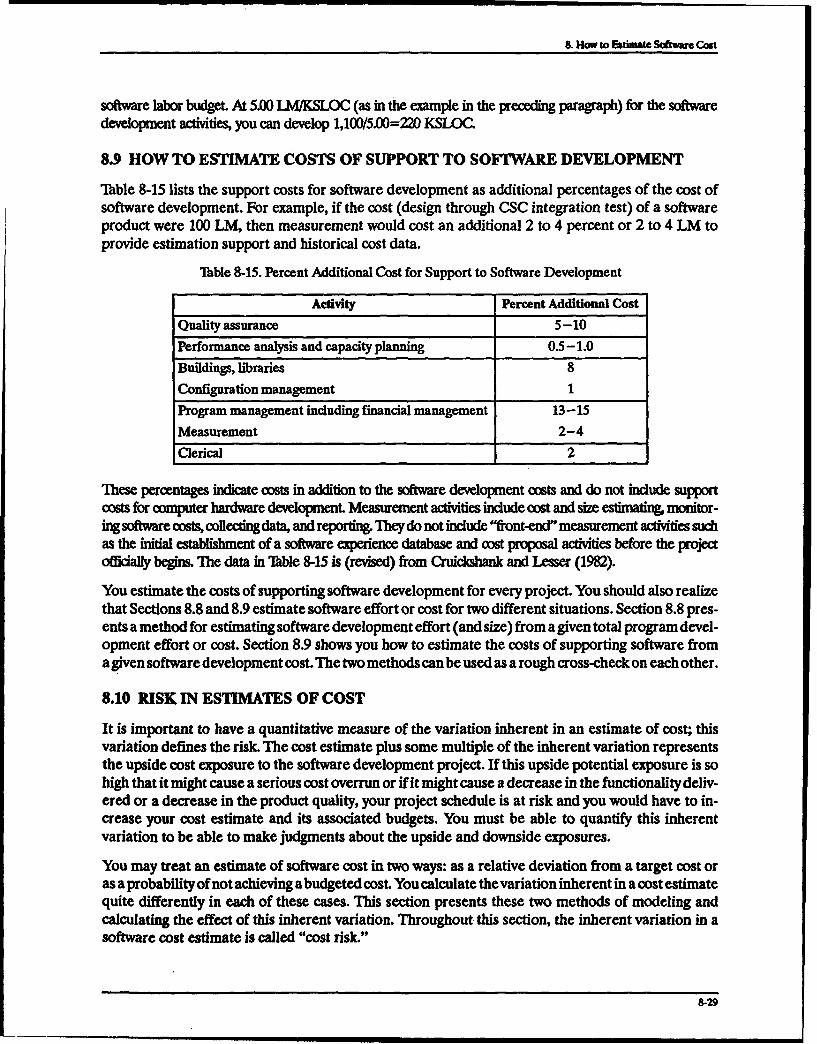
8. How to Estimate Softwe Cost
software labor budget. At 5.00 LM/KSLOC (as in the example in the preedi paragraph) for the softwaredevelopment activities, you can develop 1,100/5.00=220 KSLOC
8.9 HOW TO ESTIMATE COSTS OF SUPPORT TO SOFTWARE DEVELOPMENT
Thble 8-15 lists the support costs for software development as additional percentages of the cost ofsoftware development. For example, if the cost (design through CSC integration test) of a softwareproduct were 100 LM, then measurement would cost an additional 2 to 4 percent or 2 to 4 LM toprovide estimation support and historical cost data.
Table 8-15. Percent Additional Cost for Support to Software Development
Activity Percent Additional Cost
Quality assurance 5-10Performance analysis and capacity planning 0.5-1.0
Buildings, hlbraries 8
Configuration management 1
Program management including financial management 13-15Measurement 2-4Clerical 2
These percentages indicate costs in addition to the software development costs and do not include supportcosts for computer hardware development Measurement activities include cost and size estimating. monitor-ing software costs, collecting data, and reporting. They do not include "front-end" measurement activities suchas the initial establishment of a software experience database and cost proposal activities before the projectofficially begins. The data in Tlble 8-15 is (revised) from Crickshank and Lesser (1982).
You estimate the costs of supporting software development for every project. You should also realizethat Sections 8.8 and 8.9 estimate software effort or cost for two different situations. Section 8.8 pres-ents a method for estimating software development effort (and size) from a given total program devel-opment effort or cost. Section 8.9 shows you how to estimate the costs of supporting software froma given software development cost. The two methods can be used as a rough cross-check on each other.
8.10 RISK IN ESTIMATES OF COST
It is important to have a quantitative measure of the variation inherent in an estimate of cost; thisvariation defines the risk. The cost estimate plus some multiple of the inherent variation representsthe upside cost exposure to the software development project. If this upside potential exposure is sohigh that it might cause a serious cost overrun or if it might cause a decrease in the functionality deliv-ered or a decrease in the product quality, your project schedule is at risk and you would have to in-crease your cost estimate and its associated budgets. You must be able to quantify this inherentvariation to be able to make judgments about the upside and downside exposures.
You may treat an estimate of software cost in two ways: as a relative deviation from a target cost oras a probability of not achieving a budgeted cost. You calculate the variation inherent in a cost estimatequite differently in each of these cases. This section presents these two methods of modeling andcalculating the effect of this inherent variation. Throughout this section, the inherent variation in asoftware cost estimate is called "cost risk."
8-29
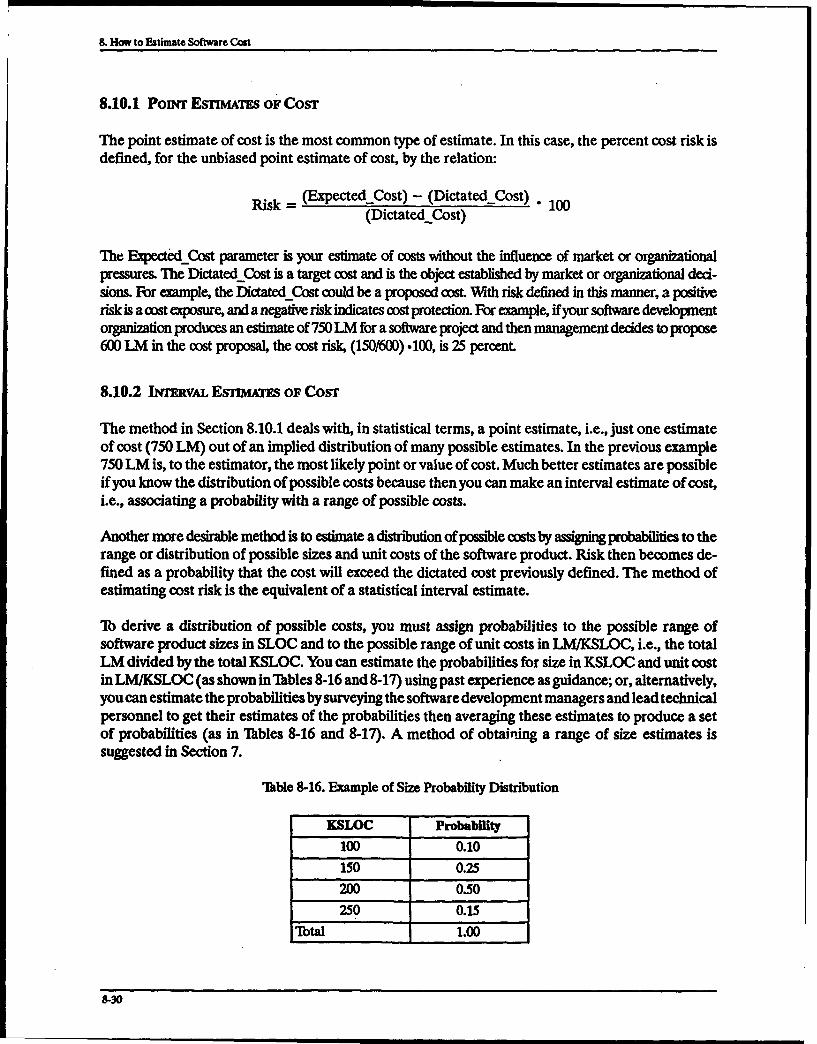
8. How to Estimate Software Cost
8.10.1 PowNT EsmMATES OF COST
The point estimate of cost is the most common type of estimate. In this case, the percent cost risk isdefined, for the unbiased point estimate of cost, by the relation:
Risk = (Expected Cost) - (DictatedjCost) . 100(Dictated-Cost)
The ExpectedCost parameter is your estimate of costs without the influence of market or organizationalpressures. The DictatedCost is a target cost and is the object established by market or organizational ded-sions. For example, the Dictated Cost could be a proposed cost. With risk defined in this manner, a positiverisk is a cost exposure, and a negative risk indicates cost protection. For example, ifyour software developmentorganization produces an estimate of 750 LM for a software project and then management decides to propose600 LM in the cost proposal, the cost risk, (150/600) .100, is 25 percent.
8.10.2 IwmmvAL Esrm&m OF CosT
The method in Section 8.10.1 deals with, in statistical terms, a point estimate, i.e., just one estimateof cost (750 LM) out of an implied distribution of many possible estimates. In the previous example750 LM is, to the estimator, the most likely point or value of cost. Much better estimates are possibleif you know the distribution of possible costs because then you can make an interval estimate of cost,i.e., associating a probability with a range of possible costs.
Another more desirable method is to estimate a distribution of possible costs by assigning probabilities to therange or distribution of possible sizes and unit costs of the software product. Risk then becomes de-fined as a probability that the cost will exceed the dictated cost previously defined. The method ofestimating cost risk is the equivalent of a statistical interval estimate.
lb derive a distribution of possible costs, you must assign probabilities to the possible range ofsoftware product sizes in SLOC and to the possible range of unit costs in LM/KSLOC, i.e., the totalLM divided by the total KSLOC. You can estimate the probabilities for size in KSLOC and unit costin LMIKSLOC (as shown in'Tables 8-16 and 8-17) using past experience as guidance; or, alternatively,you can estimate the probabilities by surveying the software development managers and lead technicalpersonnel to get their estimates of the probabilities then averaging these estimates to produce a setof probabilities (as in Thbles 8-16 and 8-17). A method of obtaining a range of size estimates issuggested in Section 7.
Ikble 8-16. Example of Size Probability Distribution
KSLOC Probability
100 0.10
150 0.25200 0.50250 0.15
Total 1.00
8-30

8. How to Estimate Software Cost
Table 8-17. Example of Unit Cost Probability Distribution
LM/KSLOC Probability
6.500 0.15
5.500 0.20
4.500 0.40
3.500 0.25
Total 1.00
You can estimate size using any of the techniques shown in Section 5, and you can build a range ofpossible values around the figures you develop. With that estimate in mind, you should develop a rangeof size and unit costs by varying some of the assumptions underlying the estimate until you havecovered the range of possible values of size. You divide the range of size values into equal intervals and, usingexperience as a guide, assign probabilities. You can generate unit cost probabilities in the same way.
Next, you cross-tabulate the unit cost values with the size values and create two values for each size-unit costcombination. The first value is the product of the size probability with the unit cost probability. This valueindicates the probability of the occurrence of this size-unit cost pair, i.e., the probability of the associated costThe second value is the product of size with unit cost and indicates the cost (in LM) associated with that pair.Then the two values generated for each size-unit cost combination (pair) are:
Probability(Pair) =Probability(Size) • Probability(Unit Cost)
Cost(LM)=KSLOC. LM/KSLOC
In the case where the software system is composed of new and reused code, the size metric should beKESLOC, which you can determine using the methods in Section 7. For example, if reused code costs30 percent of new code, then:
KESLOC = 1.0(KSLOCnew) + 0.30(KSLOCreused)
Table 8-18 shows the cross-tabulation and generation of the distribution probabilities with the LM costestimates. The probabilities in Thble 8-18 have been multiplied by 100 to express them as percentagesof (the area under) the distribution.
Thble 8-18. Example of Derivation of Distribution of Costs
Probabiity/Size (KSLOC)ProbablitylUnit Cost 0.10 0.25 0.50 0.15
(LMWKSLOC) 100.00 150.00 200.00 250.00
0.150 1.50 3.75 7.50 2.256.500 650.00 975.00 1,300.00 1,625.00
o0oo 2.00 5.00 10.00 3.005.500 550.00 825.00 1,100.00 1,375.00
0.400 4.00 10.00 20.00 6.00
4.500 450.00 675.00 900.00 1,125.00
0.250 2.50 6.25 12.50 3.753.500 350.00 525.00 700.00 875.00
8-31

8. How to Estimate Software Cost
Now you can order the LM values with their associated probabilities of being realized, as shown inTable 8-19. You can compute risk by reference to a table of cost versus cumulative probability, suchas Table 8-19. Risk is defined as the difference between the cumulative percent probability of any giventarget cost and 100. If management were to make a decision to propose the software at a target costof 1,100 LM, the riskwould be 18.75 percent (see Table 8-19). You linearly interpolate the given targetcost to calculate the associated probability.
Table 8-19. Example of Distnrbution of Costs
Probability CumulativeCost (LM) (Percent) Probability
350 2.50 2.50450 4.00 6.50525 6.25 12.75
550 2.00 14.75650 1.50 16.25
675 10.00 26.25700 12.50 38.75825 5.00 43.75
875 3.75 47.50900 20.00 67.50
975 3.75 71.251,100 10.00 81.251,125 6.00 87.251,300 7.50 94.751,375 3.00 97.751,625 2.25 100.00
The calculation of risk provides management with information it can employ as a rational basis formaking business decisions about what is a good proposed price based on knowledge of the cost risk.The cost risk is one of several major factors involved in the development of a proposal price.
You calculate cost risk for every software development project.
So now you can say that there is "only" a probability of 0.5925 (by linear interpolation) that yourexpected cost estimate of 750 LM will be exceeded while there is a 0.8500 probability (by linear inter-polation) that the management-proposed cost value of 600 LM will be exceeded. The difference inthese probabilities may cause the proposal value of cost to undergo further review. If a 20 percent riskis acceptable, the corresponding value by linear interpolation of 1,084.4 LM will be the software's newproposed cost value. Figure 8-1 shows this cost risk graphically.
8.103 CosT RIsK MANAGEMENT Acrivrrms
The recommended sequence of estimation activities is to first estimate the size of the softwareproduct, then estimate the cost, and finally estimate the development schedule based on the size andthe cost estimates. You can revise these estimates as often as available resources permit.
8-32

8. How to Estimate Softwae Cost
10090Cumulative20.Cs
Probability Risk
70
60
5040
30
20
10 Labor moenth0
0 200 400 600 800 1000 1200 1400 1600
Figure 8-1. Cumulative Distribution of Costs
You use multiple cost-estimating methods (including size-estimating methods) whenever possible,because one method can serve as a useful cross-check on another. When the results do not agree towithin 10 (or 20) percent, you reconcile them.
It is important to realize that a cost estimate is not the same as a price, which in turn is not the sameas a budget. A cost estimate is based on all the facts at hand. With this estimate, management maydecide to take a cost risk and propose a different (usually lower) cost from which the price is computed.The proposed cost becomes the basis of negotiation with the customer, and the cost that emerges fromthese negotiations is actually a negotiated price including a profit. When you win the business, youestablish budgets based on the negotiated price. These budgets are often lower than those derivedfrom the negotiated price since it is standard procedure in many organizations to withhold 10 to 15percent of everybudget as a "management reserve." Thus, the negotiated price may be lower than thecost estimate, and the budget may be lower than the negotiated price.
8.11 SOFTWARE MAINTENANCE COSTS
If the enhancements and the revisions to an existing software system are relatively large, the situationceases to be maintenance of an existing system and becomes the development of a new version of theoriginal system. In either case, the operations of adding, modifying, reusing, and removing code, asdescribed in Section 6, are used. The process of developing a new version of an existing or "original"system (IEEE 1992) involves the processes of deleting code from the original system, some of whichis to be removed and some of which is to be modified for inclusion in the new version. This enhancesthe original system with new code that is added and with the modified code from the original systemand reusing code that was not deleted from the original system. Thus, the development of a newversion of an existing system is the process of creating new code and combining it with reused code.
Software maintenance consists of relatively small-scale enhancements to the software system and thecorrection of errors (defects), often done in response to an engineering change proposal. You can viewsoftware maintenance as a form of software development. This guidebook treats defect correction andenhancements under a single category called "problems." Cruickshank (1988) reports that experiencewith a real-time operating system showed that there were 350 problems or defects in a 62 KSLOC op-erating system, or about 6.0 problems per KSLOC in the period after delivery, i.e., during
8-33

8. How to Estimate Software Cost
maintenance. Other experience in software maintenance showed that each problem cost about 0.6LMto fix.
Estimates of defects per KSLOC existing at delivery, based on actual software design review and codeinspection error data, show that you might expect man-rated (space) software to have about 0.02defects/KSLOC at delivery. Ground-based software can have about 0.3 defects/KSLOC at delivery,and airborne and seaborne software can have about 0.7 to 1.0 defects/KSLOC at delivery. You can usethese figures to estimate the costs of error correction, or you can derive your own. Keep in mind thatonce you estimate the cost of maintenance and enhancements, the additional costs of support tosoftware discussed in Section 8.9 also apply.
8.12 COSTS OF A MEASUREMENT PROGRAM
Experience shows that the activities inherent in a measurement/metrics program (see Section 3) costsan amount equal to about two to four percent of the software cost on average. This cost will vary withthe capability maturity level of the software development organization. When a software organizationbudgets for a development project, it should budget an additional amount equal to the percentage ofthe direct labor software budget (shown in UTble 8-15) for the metrics program to support that softwareproject. The cost of measurement activities should not be taken from the software budget because thesoftware organization should not be in a position of sacrificing their own resources to supportorganizational measurement goals. Metrics and measurement should be budgeted separately.
8.13 SUMMARY OF RECOMMENDATIONS
The general recommendations presented in Section 8 are:
"* Use LM or LH for the initial computation of software costs. Using these cost units facilitatescost comparisons. You can convert the LM or LH to dollars when appropriate.
"* Have a defined and managed software development process for accurate cost estimation.
"* Make estimates of software cost throughout the development cycle. The models you use toestimate cost will depend on the process maturity level of your development organization.Generally, the lower maturity levels should use holistic models and the higher maturity levelsshould use activity-based models.
"* Cross-check cost estimates made by holistic and activity-based models whenever possible. Thetype of cross-checking depends on the process maturity level.
"* Customize software costing models, metrics, and parameter values to your softwaredevelopment environment. The type of customization depends on the process maturity level.
"* Consider the effect of an HOL and of product size on development costs.
"* Use top-down models at the earliest stages of system conceptualization to estimate theallocation of resources (effort) to the general tasks to be accomplished.
"* Estimate the costs of support to software development for every project.
8-34

8. How to Estimate Software Cost
Make estimates of software development costs in parallel with an organization (such asmeasurements or cost :ngineering) that is independent of software development. Negotiatedifferences where they are substantial. If you cannot reconcile differences, then inform highermanagement.
Estimate cost risk and cost exposure for every project. Use the information resulting fromestimates made in parallel to provide estimates of cost risk and cost exposure.
8-35

8. How to Estimate Software Cost
This page intentionaly left blank.
-8.36

9. HOW TO ESTIMATE SCHEDULE
9.1 SCHEDULE ESTIMATION OVERVIEW
It is important to accurately estimate the time required to develop a software product and to be ableto perform schedule/development effort tradeoffs. It is also important to be able to create a staffingcurve for the project development labor that you can use in project planning.
This section provides methods that help you answer the following schedule-related questions:
"* How long will the development take?
"* What effect will a shrinking development schedule have on the development effort from whathas either been imposed or will be required?
"* What is the staffing profile, (i.e, what is the profile of effort per month) over the project duration?
To address these questions, this section presents guidance in methods that tell you how to:
"* Estimate a development schedule, given that you know (or have an estimate of) the size of yoursoftware product and how much effort it will take to develop it.
"• Make a tradeoff between the length of the development schedule and the effort required todevelop the product.
"* Determine whether a schedule given to you is compatible with the size of a proposed productand the required effort estimated for its development.
"* Develop a spread of software development labor over the development time (schedule) thatyou have estimated.
"* Estimate the potential impact on the software development schedule of incorporating reusedcode into the new software product that you are developing.
When planning the development of a new software product, you can make tradeoffs among cost,schedule, and size. For example, if you want a lower cost, then you must reduce the product size.Schedule (the period of time for software development) is a key consideration in planning for a soft-ware development project. You expect the effect of varying quality requirements to impact scheduleand/or cost. Often, you can ensure higher quality software, in part, through more extensive testing.Sometimes this may increase the development effort and development time (schedule) over the timeyou would require for a software product that does not need to be of that quality level.
9-1
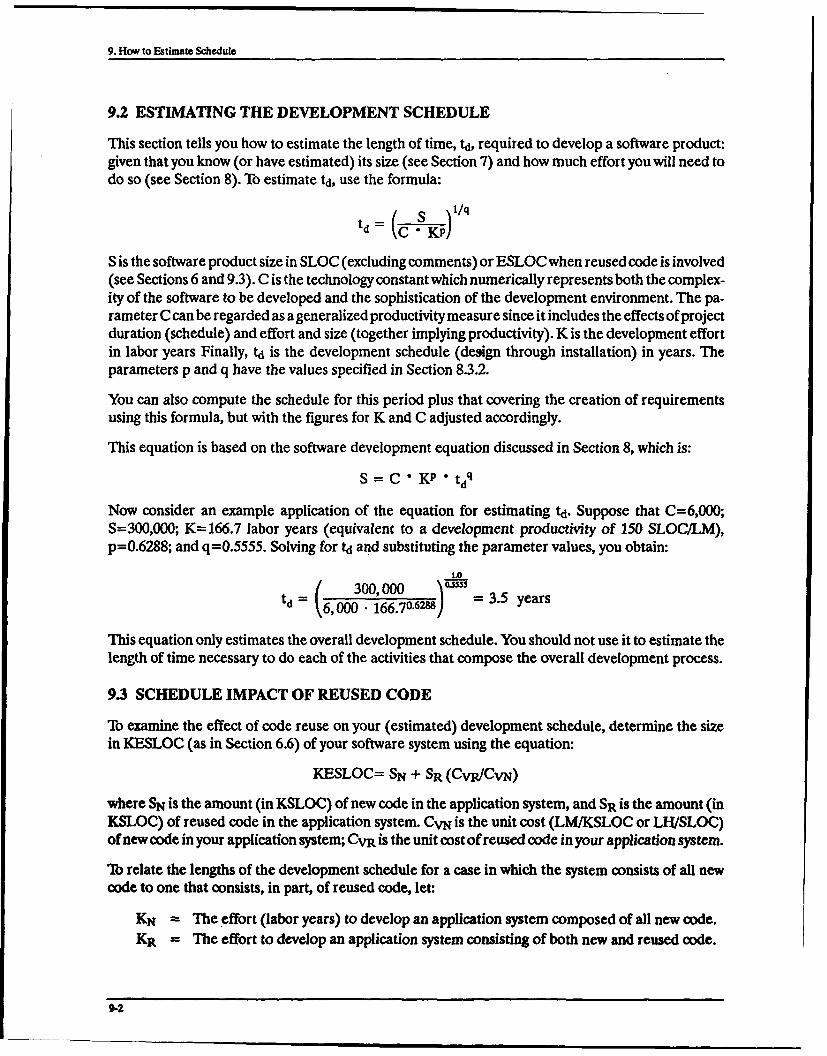
9. How to Estimate Schedule
9.2 ESTIMATING THE DEVELOPMENT SCHEDULE
This section tells you how to estimate the length of time, td, required to develop a software product:given that you know (or have estimated) its size (see Section 7) and how much effort you will need todo so (see Section 8). To estimate td, use the formula:
td = (C *- P/
S is the software product size in SLOC (excluding comments) or ESLOC when reused code is involved(see Sections 6 and 9.3). C is the technology constant which numerically represents both the complex-ity of the software to be developed and the sophistication of the development environment. The pa-rameter C can be regarded as a generalized productivity measure since it includes the effects of projectduration (schedule) and effort and size (together implying productivity). K is the development effortin labor years Finally, td is the development schedule (design through installation) in years. Theparameters p and q have the values specified in Section 8.3.2.
You can also compute the schedule for this period plus that covering the creation of requirementsusing this formula, but with the figures for K and C adjusted accordingly.
This equation is based on the software development equation discussed in Section 8, which is:
S = C 0 Kp " tdq
Now consider an example application of the equation for estimating td. Suppose that C=6,000;S=300,000; K=166.7 labor years (equivalent to a development productivity of 150 SLOCILM),p=0.6288; and q=0.5555. Solving for td and substituting the parameter values, you obtain:
1o
td-( 30)00 0 0-62 5 = 3.5 years( 6,000 -166.7U.62m
This equation only estimates the overall development schedule. You should not use it to estimate thelength of time necessary to do each of the activities that compose the overall development process.
9.3 SCHEDULE IMPACT OF REUSED CODE
To examine the effect of code reuse on your (estimated) development schedule, determine the sizein KESLOC (as in Section 6.6) of your software system using the equation:
KESLOC= SN + SR (CVR/CVN)
where SN is the amount (in KSLOC) of new code in the application system, and SR is the amount (inKSLOC) of reused code in the application system. CVN is the unit cost (LM/KSLOC or LI/SLOC)of new code in your application system; CVR is the unit cost of reused code in your application system.
Tb relate the lengths of the development schedule for a case in which the system onsists of all newcode to one that consists, in part, of reused code, let:
KN = The effort (labor years) to develop an application system composed of all new code.KR = The effort to develop an application system consisting of both new and reused code.
9-2

9. How to Estimate Schedule
P = The relative productivity enhancement to be found in developing the system whenreuse is involved as compared with the case in which it is not.
tdn = The development schedule (months or years) for an application system of sizeS KSLOC composed of all new code.
tdr = The development schedule for an application system of size S KESLOC composed ofboth new and reused code.
R = The proportion of code reuse=SR/(SN + SO).
Gaffney and Durek (1991) give a formula that relates the schedule for developing a software systemimplemented with all new code to one required if the software system is implemented with acombination of new and reused code:
tdr (P-1)
tdn P-
where:
KR p v *( - R+ Cv R = I + R " ILRKN CV RNi~
You may use the relation for KRiKN for various parametric "what-if" analyses to estimate the possibleeffect of various amounts of code reuse on the development schedule.
As an example, let CvN=5.0 LM/KSLOC, CVR==0. 37 5 LM/KSLOC, and R=0.9. Then 1/P=0.1675and P=5.97. Using the values of p=0.6288 and q=0.5555 given in Section 9.2:
tdr = p p-068 = 0.30tdn
The schedule to develop the software product containing new and reused code is only 30 percent aslong as that to develop the same product with all new code.
Figure 9-1 shows the relative schedule reduction versus the relative productivity enhancement for twosets of values for the parameters p and q. The top line uses the parameter values developed by Putnam(1978) of p=.3333 and q = 1.3333. The bottom line uses more recent parameter values developed byGaffney (1983) of p=0.6288 and q =.5555. The thin shaded area between the lines shows that P (P-1)/qis relatively insensitive to a fairly wide range of p and q; therefore, it is a fairly robust estimator oftdr/tdn.
9.4 SCHEDULE/DEVELOPMENT EFFORT TRADEOFF
Suppose that you used the software development equation of Section 9.2 to estimate that the "ideal"length of the schedule for your software product is to. This is based on size estimate (see Section 7)of SESLOC and on a development labor effort of Kolabor years with a technology constant of C. Now,suppose that you want to compute the amount of labor years required if you were to reduce the sched-ule from to to t1 (a figure that may have been imposed on you). The labor years required will increaseto K1, which is calculated using the equation:
9-3

9. How to Estimate Schedule
RelativeSchedule
1-
-0.6682P
0 0.5 10 115 2.0 2!5 3.0
PRelative
Figure 9-1. Schedule Reduction Versus Productivity Enhancement Productivity
This equation is the schedule/development effort tradeoff equation and is derived from the softwaredevelopment equation given above. A word of caution. Use this equation only to estimate the effectof schedule compression on your development effort.
As an example, suppose there was a 20 percent schedule reduction. Then to/ht = 1/.8 = 1.25. Supposethe originally estimated effort was Ko = 50 labor years. Then the effort for the case in which the sched-ule was reduced by 20 percent would be K1= 60.9 labor years or an increase of 22 percent. Thiscalculation illustrates the effect of schedule compression on development effort that you can expect.
Make schedule/development effort tradeoff studies for all software development projects andproducts. "ftadeoff methods should be part of your organization's software standards. There are ob-viously limitations in the proportionate amount that the development schedule can be reduced. Forexample, if ti were to take the value of 0.1, i.e., a 90 percent reduction in the development schedule,the increase in effort would be about 7.6 times the original effort. But experience shows that no in-crease could overcome this drastic schedule reduction to produce a product. Very large amounts ofeffort applied to software development in a very short time interval are not feasible.
9.5 SCHEDULE/EFFORT/SIZE COMPATIBILITY
You should determine whether the figures (estimates or objectives) for schedule, size, and effort foryour project are compatible. The customer may impose the length of time for development, or youmay perceive a need to quickly get a new product out into the marketplace. Independent of suchconsiderations, you may develop a size estimate of your intended software product (using one or moreof the methods described in Section 7) and a productivity and thence an estimate of the developmentlabor required (using the methods described in Section 8). It is important to determine if these esti-mates for size (S), effort (K), and development period (td) are mutually ompatible.You can deter-mine their compatibility by using a test based on an application of the software development equation.First, you estimate the value of the technology constant C implied by the values of S, K., and td thatyou have been given or otherwise calculated. You calculate C from the equation:
9-4

9. How to Estimate Schedule
t055 - K10.6288
On the basis of the value calculated for C, for this example, you can determine whether a givenschedule is compatible with the size and effort (and hence, productivity) proposed for the project byusing the process shown in Figure 9-2. That is, you compare the C that you have calculated (estimatedfor the project) with the C's for compatible complete projects.
Compute or infer a
value of C
vC~uomfo`~ikparevtb
Significantly ' SignificantlyvLuess forliera e
Schedule probably Is Compatbilit Tetbarctoo long t too short
ReativelyGClose
Schedule probably
all right
Figure 9-2. Schedule Compatibility Testing Proces
9.6 SOFTWARE DEVELOPMENT LABOR PROFILES
This section provides an equation that you can use to create an overall spread of labor months of
development labor over the schedule of length td months. The equation is based on the Rayleigh(Norden 1958 and 1970) distribution. Putnam (1978) built on Norden's (1958 and 1970) work andshowed that a Rayleigh curve represents, to a reasonable degree of approximation, the application oflabor resources to the creation of a software product. The equation presented here is a variant of thePutnam (1978) representation. The method does not take into consideration the individual activitiesthat constitute the development project you are planning (as described in Section 8) nor does it takeinto consideration the nature of the technology your organization uses for the project in question.
You may need to do some adjusting and modify the spreed that the procedure provides. However, theprocedure does give you a first approximation. Obviously, the relatively simple staffing model pres-ented here can not reflect the effects various factors could have on your selection of a staffing profileappropriate to your particular software development situation. You should also think about your proj-ect's activities in detail when doing labor resource spreading. View the staffing profile estimate devel-oped with the method demonstrated here as only a first estimate. Clearly, it is preferable for you todevelop a staffing profile based on your organization's experience. That experience might cause a dif-ferent emphasis, such as greater front-loading, than the profile estimate based on the Rayleigh model.
9-5
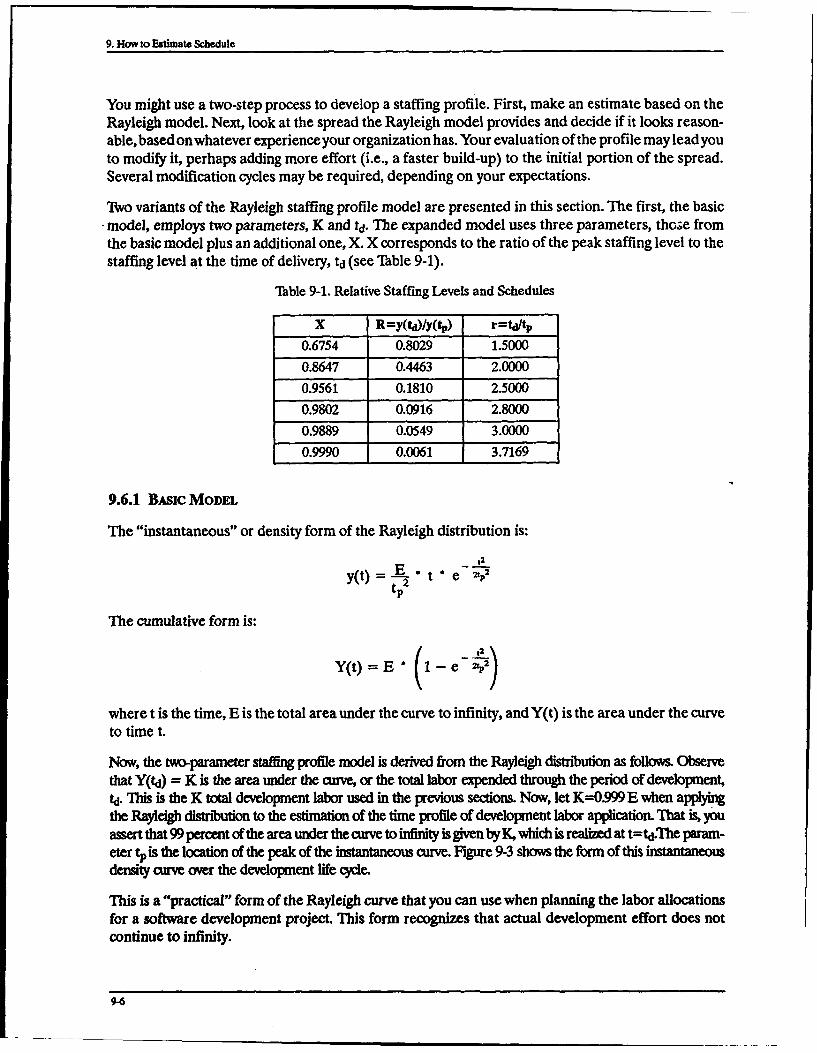
9. How to Estimate Schedule
You might use a two-step process to develop a staffing profile. First, make an estimate based on theRayleigh model. Next, look at the spread the Rayleigh model provides and decide if it looks reason-able, based on whatever experience your organization has. Your evaluation of the profile may lead youto modify it, perhaps adding more effort (i.e., a faster build-up) to the initial portion of the spread.Several modification cycles may be required, depending on your expectations.
Two variants of the Rayleigh staffing profile model are presented in this section. The first, the basicSmodel, employs two parameters, K and td. The expanded model uses three parameters, tho;e from
the basic model plus an additional one, X. X corresponds to the ratio of the peak staffing level to thestaffing level at the time of delivery, td (see Table 9-1).
Table 9-1. Relative Staffing Levels and Schedules
X R=y(td)/y(tp) r=td/tp
0.6754 0.8029 1.50000.8647 0.4463 2.00000.9561 0.1810 2.50000.9802 0.0916 2.80000.9889 0.0549 3.00000.9990 0.0061 3.7169
9.6.1 BAsic MODEL
The "instantaneous" or density form of the Rayleigh distribution is:
y(t) = .t * e-,-'t
tp
The cumulative form is:
Y(t)= E" I- e-V
where t is the time, E is the total area under the curve to infinity, and Y(t) is the area under the curveto time t.
Now, the two-parameter staffing profile model is derived from the Rayleigh distribution as follows. Observethat Y(td) = K is the area under the anve, or the total labor expended through the period of development,td. This is the K total development labor used in the previous sections. Now, let K=0.999 E when applyinthe Rayleigh distribution to the estimation of the time profile of development labor application. That is, YOuassert that 99 percent of the area under the curve to infinity is given byK, which is realized at t=td.The param-eter tp is the location of the peak of the instantaneous curve. Figure 9-3 shows the form of this instantaneousdensity curve over the development life cycle.
This is a "practical" form of the Rayleigh curve that you can use when planning the labor allocationsfor a software development project. This form recognizes that actual development effort does notcontinue to infinity.
9-6
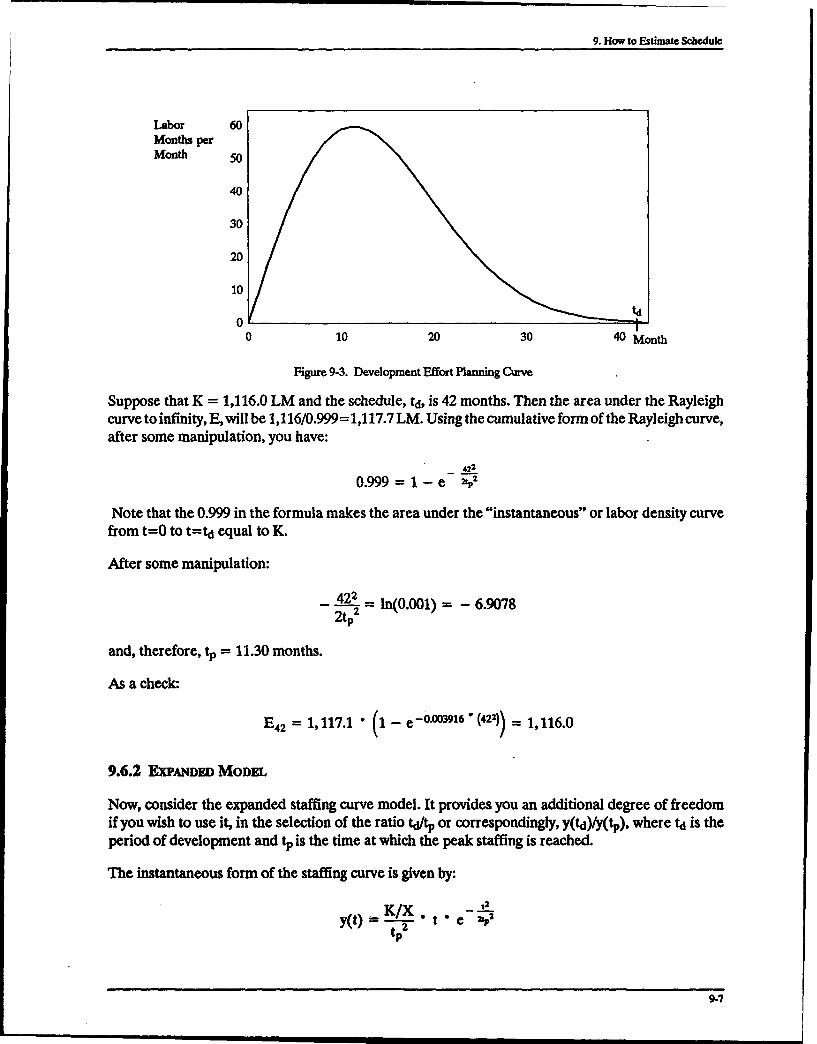
9. How to Estimate Schedule
Labor 60onfths per
Month 50
40
30
20
10
td0
0 10 20 30 40 Month
Figure 9-3. Development Effort Planning Curve
Suppose that K = 1,116.0 LM and the schedule, td, is 42 months. Then the area under the Rayleighcurve to infinity, E, will be 1,116/0.999=1,117.7 LM. Using the cumulative form of the Rayleigh curve,after some manipulation, you have:
,422
0.999 = 1-_ e "
Note that the 0.999 in the formula makes the area under the "instantaneous" or labor density curvefrom t=0 to t=td equal to K.
After some manipulation:
422 = ln(0.001) = -6.90782t P2
and, therefore, tp = 11.30 months.
As a check:
E42 = 1,117.1* (1- e-0.003916 (422))= 1,116.0
9.6.2 EXPANDED MODEL
Now, consider the expanded staffing curve model. It provides you an additional degree of freedomif you wish to use it, in the selection of the ratio td/tp or correspondingly, y(td)/y(tp), where td is theperiod of development and tp is the time at which the peak staffing is reached.
The instantaneous form of the staffing curve is given by:
K/X . ,y(t)= t---I- t"0 e-
9-7

9. How to Estimate Schedule
The cumulative form of the staffing curve is given by:
Y(t) I-e2
There is a discrete form that gives you the effort, Fi, for interval i (LM if you have given yourdevelopment period, td, in months). Fi is given by the equation:
K ( (-1)2 _2Fi= Y(i)-Y(i- 1)= • e 2tpZ - e ;P
where K is the total development effort equal to K(td) as explained above. Note that K=XE, whereE is the area under the curve from 0 to infinity. Note that i is the interval number and that there areN=td/12 one-month intervals in a development period of td months.
You can fix the value of y(td), the staffing level at the end of the development process relative to thepeak staffing level, y(tp), by selecting the value of X. This selection also establishes the ratio, r= td/tp.Table 9-1 shows some values of r and X.
9.7 SUMMARY OF RECOMMENDATIONS
The recommendations on schedule estimation presented in Section 9 are:
"* Estimate the schedule for every product.
"* Recognize that methods for schedule estimation, compatibility testing, and tradeoffs shouldbe part of your software standards.
"* Test the estimated schedule for compatibility with the size and estimated development effort.
"* Generate a labor profile for every software product.
"• Make schedule/development effort tradeoff studies for every product.
"* TRack schedule growth during development.
"* Develop and use an experience database to aid in schedule estimation.
"* Relate schedule, effort, and size.
"* Do tradeoff studies between schedule and effort.
"* Reuse code, if possible, to reduce the schedule.
"* Test for compatibility of schedule, effort, and size.
"* Use a Rayleigh distribution to develop an initial estimate of the overall software productdevelopment staffing profile.
9-8
10. SOFTWARE QUALITY MEASUREMENT
10.1 OVERVIEW
The industry views quality as the degree to which the requirements for a software process or theproduct it produces are satisfied (IEEE 1990). Measuring the quality of the software process and theproducts it creates is a very important aspect of the MDSM process (see Section 2). Quality measure-ments are taken of the process degree of compliance and/or the products it produced with the require-ments they are supposed to satisfy. The measurements are to be used as the basis for modifying theprocess or product to minimize its degree of deviance from the established requirements. Such useof software metrics is a primary attribute of attaining the highest levels of (SEI) process maturity (asdescribed in Section 3).
This section shows you ways in which you can define and measure both software quality and someaspects of system quality: it is sometimes difficult to distinguish between the quality of a system fromthat of the software which is a component of it. The measurement of quality is complementary to theestablishment of requirements. Section 5 showed you how to quantify requirements. This section com-plements Section 5 by showing you how to specify measurements of the degree of requirements attain-ment. Thus, such measurements quantify quality. This section also deals with requirements that areexpressed as quality factors, such as usability (see Section 10.4.2).
There are two primary categories of software quality. The first category is concerned withdiscrepancies in functional requirements. The second category is concerned with discrepancies in oth-er nonfunctional types of requirements. The nonfunctional category includes process requirements(e.g., a requirement to produce a product within 10 percent of budget) and product requirements (e.g.,a requirement that a product must attain certain measures of usability, see Section 10.4.2). Currently,there is a greater emphasis on the functionality-oriented view of software quality than the nonfunc-tionally-oriented view. Indeed, "A popular viewpoint about software quality concerns the detectionand removal of errors from executing code" (Deutsch and Willis 1988). The nonfunctional quality at-tributes, generally speaking, deal with the goodness of a software development process or a softwareproduct. One difficulty with these quality attributes is that they have no generally agreed upon mea-sures. However, they can be very useful as a means of clarifying the meaning of software process orproduct qualities of interest. Section 10.4 shows you how to select metrics for software or systemsnonfunctional quality attributes using the GQM paradigm (see Section 6).
A primary purpose of this section is to show you how to measure the discrepancies of a software product orprocess (defects) from the requirements imposed on it. The fundamental objective ofyour sofwe processis to minniake ingald errors that result in such defects. The goal of many software organizaions is "zero de-fects." It is obvious that achieving such a desirable goal should be tempered by considerations of cost effidoeny.You should always try to determine where in the process each error that resulted in a discrepancy was com-mitted. You should use such information as a basis for process modificationf&mprovement. Such action willhelp minimize the number of defects in future projects.
10-1

10. Software Quality Measurement
Some methodologies presented here have been found to be useful in measuring and estimating thenumber of errors or defects in a software product. Defects are defined as discrepancies in its functionalperformance with respect to its requirements specification. This section describes several approachesfor making projections of defect content in software upon completion of development, i.e., in post-de-livery operations. The use of the data resulting from their application in the estimation of availabilityis also presented.
The section describes the nature of statistical quality and process control and shows you how it maybe applied to defects or problem discovery in the software system (e.g., preliminary design, detaileddesign, code, etc.) that are created by the various activities of the software development process (seeSection 4). It also states what your software development organization should be doing about defectdata collection and analysis to be certifiable at various levels of (SEI) software process maturity. Thissection shows you the connection between software process maturity levels and quality assessment.
10.2 THE NATURE OF SOFTWARE QUALITY
This section provides some definitions of quality as applicable to software, to systems containingsoftware, and to the software development process. The section also describes where quantitativequality assessment fits into the software development process.
10.2.1 SoME DEFInmONS OF QuALmr,
As stated in Section 10.1, there are two principal categories of software product quality measurement:functional and nonfunctional. Several definitions from industry and government standards are presented. Arecent one from the March 1992 draft of MIL-SMD-2168 A (Department of Defense 1992) is:
Software quality. The conformance to explicitly stated functional and performance requirements,explicitly documented development standards, and implicit characteristics, such as maintainability andmodularity.
This definition is a generalization of the relatively simple one given by Crosby (1979):
Quality is conformance to requirements.
It is important to note that both definitions cited cover products and the processes that create them.They also cover the functional (defect or error count based) and the nonfunctional categories of quali-ty measures noted in Section 10.1. You should note several important points about these definitions.First, quality is defined, and hopefully measured, according to some basis, some standard. Second,there are different aspects or types of quality, including the functional and the nonfunctional aspectsof a software system (noted as "performance" types in the definition quoted and in the DoD sourcereferenced). Third, the nonfunctional aspects can include standards applicable to all, or a subset of,the software products produced by a development organization. Product defects (functional discre-pancies), such as a preliminary design, detailed design, or the actual code, are always noted. For exam-ple, defects in the detailed design as outlined in the preliminary design or the requirements statementare noted, both of which are higher level or more abstract representations of the software product (thecode) actually employed by the user. Also, such defects are noted according to general standards thatapply to all software products developed by the organization. For example, the two-way conditional(If-Then-Else) structure is forbidden and a CASE structure must always be employed when you devel-op a software system. Such a standard design requirement might be an explicit standard (see the DoDdefinition above) to facilitate the achievement of product "adaptability."
10-2

10. Software Quality Measurement
Two other definitions (IEEE 1990) of quality are:
"* The degree to which a system, component, or process meets specified requirements.
"* The degree to which a system, component, or process meets customer or user needs or expectations.
The first definition is preferred to the second. You should develop a system to satisfy statedrequirements. If a user has a need or "expectation" not stated in the requirements document in sucha manner that it can be verified, it should not be viewed as a requirement. Unfortunately, there is adifference between what a customer needs or wants (or believes he is going to get) and what he actuallygets, even if that product or system meets the specification imposed on it. Software is a "component"of a system as defined above. A system consists of hardware, software, and procedures for operatingit. The focus of Section 10 is software quality. However, keep in mind that if you are concerned withsoftware quality issues (and measures) you will have to be concerned with issues (and measures) ofthe system's quality which consists, in part, of the software. One such measure is availability. Softwareis neither available or unavailable; however, the system that includes software is described that way(see Section 10.6.3).
10.2.2 ON THE RoLE OF QuALrry iN THE SonwARE DEVELoPMENr PROCESS
Measure the quality of your software process and the product it is creating to determine their degreeof compliance with the requirements. This is an important aspect to implementing the MDSM viewof the software development process (see Section 2).
Section 5 told you to develop requirements that are incrementally verifiable. In Section 4 you weretold that each activity of the software development process includes a verification step. In this step,the quality of the output of that activity (a product created by that activity) is assessed. For example,you should not wait until code has been written until you determine whether this representation ofthe software system under development satisfies the functional specifications imposed upon it. Rath-er, you should check for compliance at intermediate steps in the creation of the code. One way to dothis is to determine if the defect discovery profile is within the bounds established for it (seeSection 10.8 on statistical quality and process control).
You can think of software quality management as an aspect of MDSM, in which you should:
"* Incrementally measure the quality aspects (as described in Section 10) of your product and process.
"* Use the measurements to determine, with some degree of confidence (verify), whether the goals arebeing realized or will have been realized at the completion of the development process.
"* Estimate the risk of not attaining your goals at each phase of the development process.
"* Take (corrective) action appropriate to the results of your verification (including measurement)process.
10.2.3 Usus
The nature of software quality depends on your viewpoint. The hands-on user of a software product,for example, might have a rather different perception of software quality than the developers of that
10-3

10. Software Quality Measurement
software product (Deutsch and Willis 1988). When you refer to the "user" of a software product, becareful to specify whom you mean. There are (at least) five different categories of users. Each of thesegroups may have its own, possibly unique, perception of what constitutes software product quali-ty.Table 10-1 provides five categories of users together with their principal quality objectives. Notethat the items of importance can be called "goals" in the sense of the GQM paradigm (described inSections 6 and 10.4.3). It is never a certainty that a product meets specifications and/or is defect-free.Rather, a cost-effective amount of verification is done and some degree of confidence is realized thatthe product does what is specified for it to do. Deutsch and Willis (1988) identified the last fourcategories listed in the Thble 10-1.
Table 10-1. User Group Quality Objectives
User Group Principal Software Quality Objective
End User Management Specifications support business goalsHands-On End User Product helps me do my job better, faster, easier
Buyer Product meets the specifications
Developer Product is defect-free when installed
Maintainer Product is understandable, modifiable, testable
10.3 QUALITY AND QUALITY FACTORS
This section describes the nature of software quality factors. Software quality factors relate to thoseaspects of quality that interest a particular set of users and reflects their particular concerns. As shownsubsequently, metrics such for usability (see Section 10.4.2), can be devised to dimension the specificconcerns of a user or group of users.
10.3.1 THE NATuRE OF SoFrWARE QuAXry FACTORS
Quality can be defined as, "The degree to which a system, component, or process meets customer oruser needs." (IEEE 1990) Software quality factors (SQFs) are attributes that a specific group of usersbelieve a specific software system should possess (Bowen, Wigle, and TMai 1985). That is, a SQF is auser-oriented view of an aspect of software product quality (Department of Transportation FederalAviation Administration 1991). In fact, one or more sets of SQFs may constitute a subset of the re-quirements for a software product. Following the view expressed in Section 5, any such requirementsshould be quantifiable. As you will see, various SQFs do not appear to be quantifiable, at least in termsthat a significant body of software engineers would agree with. McCall (1979) ;dentified a number ofSQFs (defined below). A number of SQFs are associated with one or more metrics.
10.3.2 SoME SOFTWARE QUALm'y FAcroRS
The SQF's identified by McCall (1979) and their definitions, as stated by Gaffney (1981), are givenin Table 10-2. Bowen, Wigle, and Tsai (1985) developed metrics for each of these factors and are givenin the column labeled "Metric" in Table 10-2, with the word "fault" substituted for the word "error."The USAF Rome Laboratory, through the Software Quality Technology Tfansfer Consortium, hastaken these software quality factors/attributes and created models and a methodology termed the"Rome Laboratory Software Qupity Framework" (Chruscicki 1992a). The items in the "Metric"
10-4
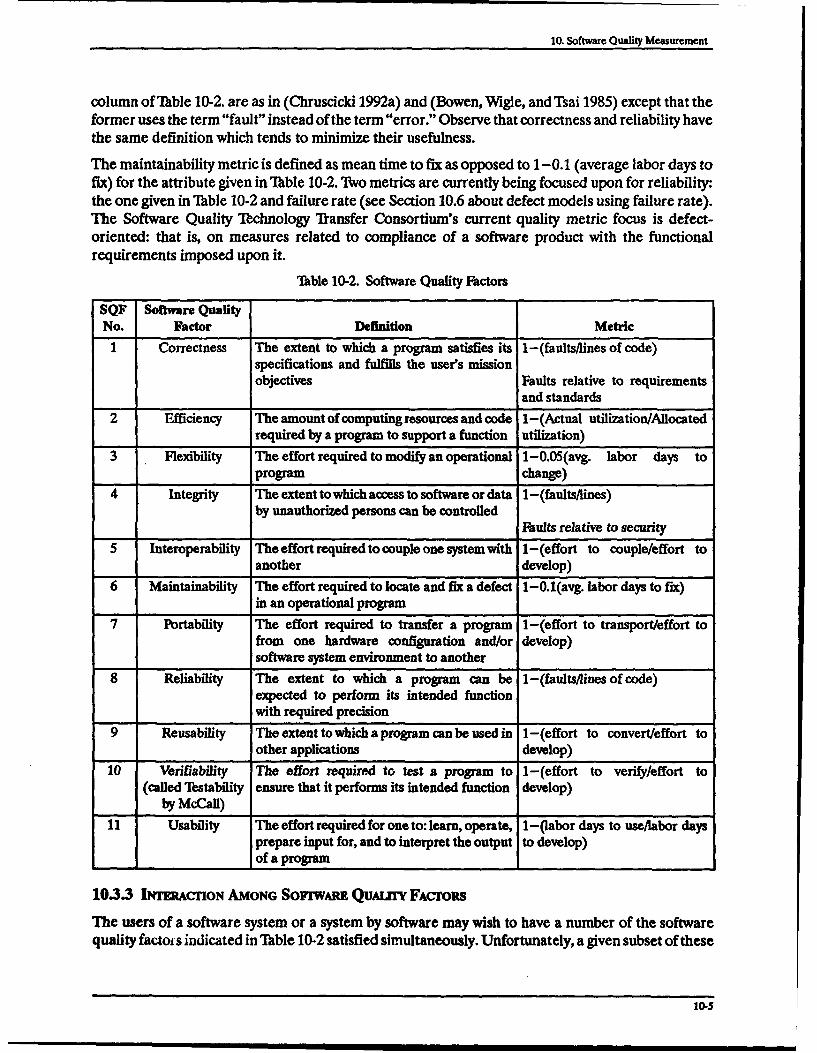
10. Software Quality Measurement
column of Thble 10-2. are as in (Chruscicki 1992a) and (Bowen, Wigle, and Tsai 1985) except that theformer uses the term "fault" instead of the term "error." Observe that correctness and reliability havethe same definition which tends to minimize their usefulness.
The maintainability metric is defined as mean time to fix as opposed to 1-0.1 (average labor days tofix) for the attribute given in Table 10-2. TWo metrics are currently being focused upon for reliability:the one given in Tible 10-2 and failure rate (see Section 10.6 about defect models using failure rate).The Software Quality Itchnology flansfer Consortium's current quality metric focus is defect-oriented: that is, on measures related to compliance of a software product with the functionalrequirements imposed upon it.
Table 10-2. Software Quality Factors
SQF Software QualityNo. Factor Definition Metric1 Correctness The extent to which a program satisfies its 1-(faults/lines of code)
specifications and fulfills the user's missionobjectives Faults relative to requirements
and standards2 Efficiency The amount of computing resources and code 1-(Actual utilization/Allocated
required by a program to support a function utilization)3 Flexibility The effort required to modify an operational 1-0.05(avg. labor days to
program change)4 Integrity The extent to which access to software or data 1-(faults/lines)
by unauthorized persons can be controlledFaults relative to security
5 Interoperability The effort required to couple one system with 1-(effort to couple/effort toanother develop)
6 Maintainability The effort required to locate and fix a defect 1-0.1(avg. labor days to fix)in an operational program
7 Portability The effort required to transfer a program 1-(effort to transport/effort tofrom one hardware configuration and/or develop)software system environment to another
8 Reliability The extent to which a program can be 1-(faults/lines of code)expected to perform its intended functionwith required precision
9 Reusability The extent to which a program can be used in 1-(effort to convert/effort toother applications develop)
10 Verifiability The effort required to test a program to 1-(effort to verify/effort to(called Testability ensure that it performs its intended function develop)
by McCall)11 Usability The effort required for one to: learn, operate, 1-Qabor days to use/labor days
prepare input for, and to interpret the output to develop)of a program
10.3.3 INERACrION AMONG SovrwARE QuAJzIY FACrORS
The users of a software system or a system by software may wish to have a number of the softwarequality factoi s indicated in Table 10-2 satisfied simultaneously. Unfortunately, a given subset of these
10-5
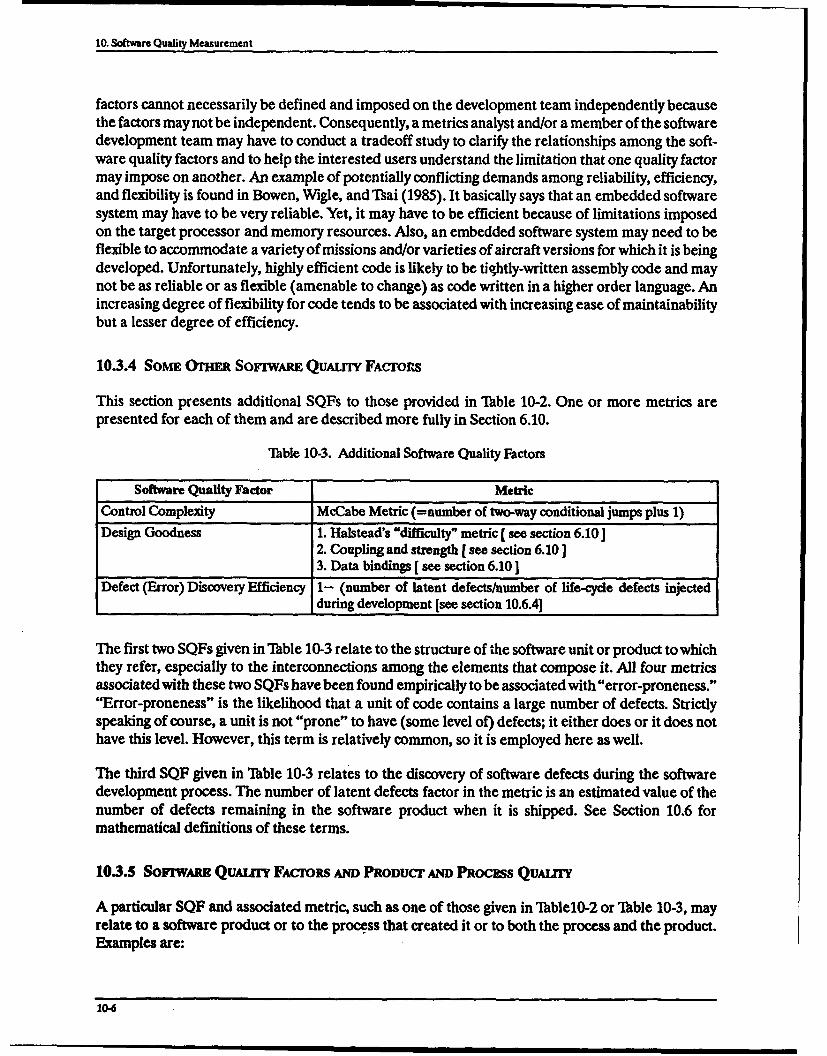
10. Software Quality Measurement
factors cannot necessarily be defined and imposed on the development team independently becausethe factors may not be independent. Consequently, a metrics analyst and/or a member of the softwaredevelopment team may have to conduct a tradeoff study to clarify the relationships among the soft-ware quality factors and to help the interested users understand the limitation that one quality factormay impose on another. An example of potentially conflicting demands among reliability, efficiency,and flexibility is found in Bowen, Wigle, and Tsai (1985). It basically says that an embedded softwaresystem may have to be very reliable. Yet, it may have to be efficient because of limitations imposedon the target processor and memory resources. Also, an embedded software system may need to beflexible to accommodate a variety of missions and/or varieties of aircraft versions for which it is beingdeveloped. Unfortunately, highly efficient code is likely to be tightly-written assembly code and maynot be as reliable or as flexible (amenable to change) as code written in a higher order language. Anincreasing degree of flexibility for code tends to be associated with increasing ease of maintainabilitybut a lesser degree of efficiency.
10.3.4 SoME (humR Sov•iv QUALrIY FAcrons
This section presents additional SQFs to those provided in Table 10-2. One or more metrics arepresented for each of them and are described more fully in Section 6.10.
Table 10-3. Additional Software Quality Factors
Software Quality Factor MetricControl Complexity McCabe Metric (=number of two-way conditional jumps plus 1)Design Goodness 1. Halstead's "difficulty" metric [ see section 6.10]
2. Coupling and strength [ see section 6.10 ]3. Data bindings [ see section 6.10]
Defect (Error) Discovery Efficiency 1- (number of latent defects/number of life-cycle defects injectedduring development [see section 10.6.4]
The first two SQFs given in Table 10-3 relate to the structure of the software unit or product to whichthey refer, especially to the interconnections among the elements that compose it. All four metricsassociated with these two SQFs have been found empirically to be associated with "error-proneness.""Error-proneness" is the likelihood that a unit of code contains a large number of defects. Strictlyspeaking of course, a unit is not "prone" to have (some level of) defects; it either does or it does nothave this level. However, this term is relatively common, so it is employed here as well.
The third SQF given in Table 10-3 relates to the discovery of software defects during the softwaredevelopment process. The number of latent defects factor in the metric is an estimated value of thenumber of defects remaining in the software product when it is shipped. See Section 10.6 formathematical definitions of these terms.
10.3.5 SorrwAm QuALr FAcToRs AND PRODUCT AmD PRocESS QuA/zT
A particular SQF and associated metric, such as one of those given in Tablel0-2 or Table 10-3, mayrelate to a software product or to the process that created it or to both the process and the product.Examples are:
10-6
10. Software Quality Measurement
"* Maintainability and expandability relate to the product.
"* Complexity and design goodness relate to both the process and the product.
"* Defect (Error) discovery efficiency relates to process. However, it is derived from measurestaken of the product as shown in Section 10.6.
10.4 USING THE GOAL-QUESTION-METRIC PARADIGM IN THE SELECTION OFQUALITY METRICS
Use the GQM paradigm to select the metric or set of metrics that matches your users' view of quality(see Thble 10-1) expected from your software product. It is important to keep in mind that user groupswill have substantially different perceptions of quality for the same product or process that you deliverto them. Two examples of applying the GQM paradigm in the selection of quality metrics are correct-ness and usability. Usability is considerably more detailed than correctness; therefore, use the secondexample as the basis for selecting quality metrics for your software system or process.
10.4.1 AN ExAMPLE OF QUALrry MERICS SELEcTrON.- Com s
Let the buyer's goal for the product be that it meets its specification. He asks the question, "Does theproduct meet its specification?" Essentially, he is expressing interest in the correctness quality factor(see Table 10-2). One metric that can be used to provide an answer for this question is the number ofdefects discovered during the development process (probably the normalized value, defectsK(SLOC,rather than the absolute value, defects). Another metric is the (estimated) number of latent defectsremaining in the software when it is delivered (presumably the same aswhen shipped) to the end-user.
10.4.2 AN ExMPwLE oF QuALrrY METRIcs SELECION: USABIIrfY
This section provides a more detailed example of the selection of a set of metrics for a SQF. Twoapproaches of metrics selection are provided. This demonstrates that there is more than one way todefine the aspects of a SQF and the metrics used to quantify it. Thble 10-2 provides one definition forSQF. Now, reconsider it and show how to develop a set of metrics that can be employed to quantifyusability as applied to a specific product. It is important to note that a universal or unique set of aspects(or corresponding metrics) to characterize usability does not exist. The metrics you should use to char-acterize usability depend on the questions you ask about the product. Basically, you ask the question,"How usable is this product?" This question is not specific enough for you to select a set of metricsfor the usability software quality factor. Therefore, you must develop more specific questions that aredependent on the users' nature of a specific product. Further, you must select the metrics you will useaccording to the needs of a specific user set for a specific product. It is unlikely that metrics of generalapplicability across all possible products can be developed for usability or for any other SQE Rather,you will need to select specific metrics that are tailored to the set of users involved, based on whatusability means to them.
Consider the example of identifying a set of metrics that characterize a text editor's degree of usability.First, you select the goal(s) that the metrics you will identify must help meet. In this example, the goalis that a prospective text editor be usable by the people for whom it is to be developed. Bailey (1984)defined three aspects of usability for text editors: ease of learning, efficiency, and operational error-proneness. From these, you can develop the questions your prospective metrics must answer.
10-7

10. Softwmae Quality Measurement
Consider each of these aspects in terms of the editor's performance on a set of benchmark tests foreither of two user groups: novice or expert software engineers. This approach to defining usability isanalogous to benchmarking a computer system's performance. Learning is considered from the nov-ice user's point of view and is defined as the number of benchmark tests completed per unit time. Effi-ciency is defined as the time required by an expert user to successfully complete the entire set ofbenchmark tests. Finally, error-proneness is defined as the time an expert user spends correcting er-rors divided by the time to conduct the benchmark tests (including the correction of errors). This mea-sure of error-proneness is analogous to the unavailability of a system (see section 10.6.3.2). Table 10-4gives you three questions and their associated metrics that you might choose.
Table 10-4. Example Questions and Metrics for Usability
Question Metric
How easy is it to learn to operate this editor? Number of benchmarks completed per hour (average(relates to learning) for a sample set of novice users)
How efficient is this editor? Number of hours required to successfully complete(relates to efficiency) the set of benchmarks (average for a sample set of
expert users)How error-prone is the operation of this editor? Number of hours correcting errors divided by number(relates to error-proneness) of hours required to successfully complete the set of
benchmarks. The figures used are the averages for asample set of expert users
Clearly, aspects of usability other than ease of learning, efficiency, and error-proneness can beselected as a basis for quantizing usability. Boehm (1978) defined one possible alternative set of as-pects in which he states that there are two principal aspects of usability. product-related and user-re-lated. Use the categorization in Boehm (1978), expand upon it, and apply it to the example of an editordescribed earlier. The product-related category includes notions of product adaptability and the easeof modifying the product to meet new requirements. In the case of an editor, you can apply this to adifferent language for expressing the text being edited. A question related to the product-related as-pect is, "Can this product be used in other situations (environments)?" A corresponding metric canbe the number of environments in which the editor is designed to operate divided by some agreed upontarget number, such as 3. In this case, the corresponding metric ranges from 0.33 (for the case of onlyone environment) to > 1 (for the case in which there are more than three environments). By conven-tion, values > 1 are considered to equal 1. The user-related category includes ease of use by all targetclasses of users or of a particular class. A question related to the user-related aspect of usability then,could be, 'Are the functions well-comm-inted?" This question is not specific enough to be the basisfor an evaluation (verification) as to whe ther the quality objective, "well-commented," was achievedor not. This question can be rephrased into, "Does the editor provide commends for each of the func-tions?" A corresponding metric can be the proportion of functions for which there are comments. Thismetric would range from 0 to 1.
Section 10.4.2 showed you two alternative ways that you can apply the GQM paradigm to selectpractical metrics for the usability software quality factor. You can employ a similar approach to selecta set of metrics more appropriate to your situation for usability or for another SQF. The exampleillustrates several very important points that you must keep in mind when you select software qualitymetrics:
104

10. Software Quality Measurement
"* There are no universally accepted metrics for any software quality factor, such as usability.
"* Apply the GQM paradigm when selecting quality metrics. Do not just pull a set of metrics "outof thin air." Select them according to the needs of the set of users identified for your processor product.
" Base the metrics on questions that relate to specific, quantifiable, and verifiable characteristics of aprocess or product.
" Base the metrics on measurable aspects (see Section 6) of the process or product to which theyrefer, i.e., they should be operational and repeatable on an objective scale.
10.4.3 Qu rmy FACTORS AND THE GOAI.QuEsTioN-METRic PARADIGM
Although the literature does not suggest that the SQFs were selected using the GQM paradigm, it canbe done, as demonstrated by the previous examples. The goal is to attain a substantial measure of aparticular SQF. The question associated with the measurement of quality is whether a given criterion(may be one of several) associated with a SQF has some particular value, exceeds some given value,or falls in the range defined by two given values. The metric is the measure of the criterion. The processof establishing such metrics complements the establishment of quantitative requirements or goals fora process or product, as described in Section 5.
10.5 SOME DEFINITIONS FOR DEVIATIONS FROM REQUIREMENTS
This section gives you definitions of software product deviations from its requirements. There is oftenconfusion about their meaning because they are not used consistently. These terms relate to the cre-ation of a problem in the software structure and to its manifestation in the output of the software orin the system when that software is appropriately stimulated.
Some important terms and definitions are:
" Deect: A software product anomaly (IEEE 1988); the evidence of the existence of a fault(Conte, Dunsmore, and Shen 1986). Examples include such things as omissions and imperfec-tions found during early life-cycle phases and faults contained in software sufficiently maturefor test or operation.
" Fault: A manifestation of an error in software (IEEE 1988); an incorrect step, process, or datadefinition (IEEE 1990). Commonly, the terms bug and error are used to express this meaning(IEEE 1990). An accidental condition that causes a functional unit to fail to perform itsrequired function. A fault, if encountered, may cause a failure.
" Error: Human action that results in software containing a fault (IEEE 1988). Examplesinclude omission or misinterpretation of user requirements in a software specification andincorrect translation or omission of a requirement in the design specification.
"*Faiure: A manifestation of an error in software (IEEE 1988); an incorrect result (IEEE 1990).(1) The termination of the ability of a functional unit to perform its required function. (2) Anevent in which a system or system component does not perform a required function withinspecified limits. A failure may be produced when a fault is encountered.
10-9

10. Softwar Quality Meaurement
You can relate these various terms as follows. An error is what the programmer does in creating a faultor a defect in software. The manifestation of a fault is a failure. Often, the terms error, defect, andbug are used interchangeably. As noted in IEEE (1990), for example, an error model (see Section10.6) is used "... to predict the number of remaining faults.. ." Also, the SEI process maturity modelquestions related to quality (see Section 10.9) use the term error synonymously with defects, faults,and failures.
A fault can exist in any unit of software, requirements, design, or code. Its existence is noted on thebasis of a disagreement with a higher authority. For example, a fault exists in the detailed design ofa software system if it is not part of the preliminary design for that system. A fault also exists in thedetailed design if the design is not properly expressed according to the syntax of the design languagestandard for that project.
A fault in the design and code is defined with respect to either the requirements (which is a higher levelrepresentation of the software system) or to some standard or common practice (e.g., that you maynot have a loop that does not terminate). A fault in the requirements document can only exist withrespect to some standard (that might mandate that a requirements document be consistent and com-plete). One possible definition says that a requirements document is erroneous if it does not representwhat the customer/user wants. Unfortunately, it might be difficult to define a fault in a requirementsdocument in this manner.
10.6 DEFECT OR ERROR MODELS
Section 10.6 provides an overview of various mathematical models used for estimating the defect orerror content of a software system or unit. This section uses the terms error and defect interchangeably(in keeping with common engineering usage) to cover failures, faults, errors, and defects. Section 10.5provides definitions of these terms. The subject of Section 10.6 is software error models. As noted inIEEE (1990) an error model is defined as, "a model used to estimate or predict the number of remain-ing faults, required test time, and similar characteristics [such as mean time between outages andavailability]." Note that the terms error and fault are treated as synonymous here even though strictlyspeaking, they are not. However, you should know what you really mean when using a term such aserror or fault. In keeping with IEEE (1990), Section 10.6 is concerned with software error models.These models are used for three principal purposes: prediction (of error or defect discovery, availabil-ity, etc.); comparative analysis (to help you answer a question such as, "How does my product comparewith others?"); and product development control (part of statistical process control described inSection 10.8).
10.6.1 PURPOSE OF SolFARR ERROR MODEIS
Software error models use information about software failures to make projections (estimates) ofsuch items as:
"* The number of failures that will be found during some time period in the future.
"• How much time will be required to detect a certain number of failures.
"• What is the mean time between failure detections.
These models are probabilistic, not deterministic. The error models presented later in Section 10.6provide expected values for defect discovery rates, not exact predictions. You can use the outputs of
10-10
10. Software Quality Measurement
these models to infer the number of faults from the number of failures predicted provided that youknow the relationship of faults to failures. Remember, a failure is the manifestation of a fault (seeSection 10.5). There are several factors to consider here, including the number of locations in the coderequired, on average per failure, to be fixed and the degree of masking a failure. Masking relates tothe fact that the logical structure of a system, composed of hardware and software, might be such thatsome faults are masked. That is, they are not detected (from an external view of the system). You canget around this problem by focusing on the failures that are observed and not on the number of faults.Based on the experience of your organization, you can estimate the number of instructions that needto be fixed, on average, per (unmasked) failure observed. This figure is the effective number of faultsper failure.
Most of the work on error models that has been reported in the literature is based on hardwarereliability theory. Hardware fails for physical reasons (due to such causes as alpha particles injuringa computer chip). However, software does not fail in the same sense as hardware. Software can onlyfail when operating in a computer. Always keep this in mind when working with software error models.
10.6.2 OvERviEw OF SoFrwuE ERROR MODELS
This section provides an overview of software error models and the primary assumptions underlyingthese models. This section also briefly describes the two principal types of these models: time basedand phase or activity based.
10.6.2.1 PRIMARY ASSUMPTONS
There are many software error models such as those constructed by Musa, Goel, Jelinski, andMoranda, and Schick and Wolverton as described in Goel (1980 and 1985); Shooman (1983); Musa,Iannino, and Okumoto (1987); Cho (1987); Conte, Dunsmore, and Shen (1986); Gaffney and Davis(1988); Gaffney (1984a); Gaffney and Pietrolewicz (1990) and many other sources. Most of thesemodels share some characteristics, including:
" Data about the incidents of software unit failures or system failures attributed to the softwareis fit to an equation. Estimates of the software's future behavior are based on the values of thefitting equation parameters.
"* The defect in a piece of software can be counted (or inferred from the count of software failureto perform per the requirements specification imposed upon it).
"* The number of defects remaining in a piece of software can be projected from the numberdiscovered to date (and equation for the rate of discovery).
"* Defects can be removed one by one; this is done before the software continues to run and datais collected concerning its performance.
"• No new defects are introduced in the software as errors that have been identified are removed.This assumption is sometimes modified and a factor for the injection of additional errors isincluded in the model.
"• The stimulation of software during the time interval that defect data is collected has the samecharacteristics as the stimulation that is expected during the interval for which the projectionis to be made.
10-11

10. Software Quality Measurement
The last point is of particular importance and may not be noticed by those who are taken up with the"elegance" of the error models' mathematics they are using. Projections about the software's perform-ance in operation are frequently made during the testing period, before the software has been deliv-ered to users and put into operation. The validity of a projection is based on the assumption that thenature of the tests, the stimulation to the software, statistically represents what will be experiencedin the operational environment during the period for which the projections are made.
10.6.2.2 Principal Error Model 'lypes
There are two principal types of software error models: time based and activity or phase based. Thesetwo types are differentiated by the nature of the principal independent variable that they employ torepresent the passage through the development process or part of it. The first category of model istime-based. Either calendar time or processor-on time (often referred to as central processing unit[CPU] time) is used. The latter is preferred. Some models use a combination of calendar time andprocessor-on time. This type of model cannot be used until the code is operating (albeit in a test stageof development). Time-based models are presented in Section 10.6.3.
The second category of model is activity or phase based. The independent variable is a numberindicative of the major activities of the development process. Often, the word phase is used, ratherthan activity, in connection with these models. The idea is to fit an equation for defect discovery asa function of a number indicative of the activity in which it is delivered. The activities are ordered inthe principal sequence in which they are executed (e.g., preliminary design, detailed design, code andunit test, CSC integration test, and CSCI test in the case of projects adhering to DOD-STD-2167A).The term phase or development phase is used here to represent this sequence (or corresponding onesif other names, such as top-level design are used). Phase-based models are presented in Section 10.6.4.
10.6.3 TImz-BASED ERROR MODELS AND AvA•ABnXrY AND REuABnY
This section presents two time-based error models. One is based on the use of the decayingexponential equation and the other uses the Rayleigh equation. The former is described in Section10.6.3.3 and the latter is presented in Section 10.6.3.4. Both of these models use equations that repre-sent the incidence rate of defect discovery as a function of time. The values of a time-based model'sparameters are calculated by using regression or other mathematical techniques to fit the equationto error or defect (actually failure) data. The data used for the fit is obtained from tests conductedduring development (as soon as the coding effort has been completed), after the software has beenplaced in operation.
10.6.3.1 Software Stimulation and Model Time Bases
Typically, data obtained during the testing operation is used to make projections (estimates) abouthow the software, or the system, will behave in the future. In order for these projections to have anyvalidity, the environment and the time base (duty cycle) must match the operational situation. Theenvironment category relates to the software's nature of the stimulation; the testing inputs shouldrepresent what will be expected in operation. Among other considerations, you must ensure that thevarious software components will be stimulated during testing at the same rate and with the types ofinput that they will encounter during operation.
The time variable used in these models is either CPU time, calendar time, or a combination of the two.CPU time, or a surrogate for it, is preferred. This is necessary in order for projections using the models
10-12

10. Software Quality Measurement
to be valid. The reason for this is that the models assume that defects are discovered as a function ofthe actual time that the software is stimulated. For example, software stimulated only during one 8hour shift over a one day period (33.3 percent duty cycle) will not be as likely to fail if it had beenstimulated on a continuous basis during that (24 hour) period: a 100 percent duty cycle.
10.63.2 Reliability and Availability
The time based models are used in connection with the estimation of reliability and availability,defined as:
"Reliability. "Software reliability is the probability that the program performs successfully [incompliance with its specification] for a given time period." (Shooman 1983). That is, it is theprobability that there are no failures in the time interval 0-t. "'he ability of a system or a com-ponent to perform its required functions under stated conditions for a specified period oftime." (IEEE 1990)
" Aviability. "Software availability is the probability that the program (software) is performing
successfully (meeting requirements), according to specification, at a given point in time."(Shooman 1983)
Availability is used more often than reliability; and frequently, the term reliability is used whenavailability is meant. The method for computing availability comes from hardware experience. Theformulas for computing it are:
Availability=A= (MTBF)/(MTBF+MTIR)
where:
MTBF= mean time between failures
MTMR= mean time to repair
The MTBF is the inverse of the failure incidence rate obtained from an error model.The error modelprovides the metric errors/unit time while MTBF provides time/errors. You expect that the MTBFwould increase over time; and hence, A, the availability, increases, provided that the MITR eitherremains constant or decreases over time. The term "availability growth" can be used to express thisconcept. In the case of software, it is more appropriate to define MMITR as "the mean time to restoreservice." This is due to the fact that the system can continue operating after a failure as long as thesoftware is not part of that failure.
Another view of availability is that it is the proportion of time that the software is successfully
operating. The corresponding formula is:
Availability=A=Uptime/(Upime+Downtime)=Uptimeflbtaltime
The down time is equal to the number of failures over the (total) time interval times MTMR.
Often, people are interested in the unavailability of a system due to software caused outages orfailures. The corresponding formula is:
10-13
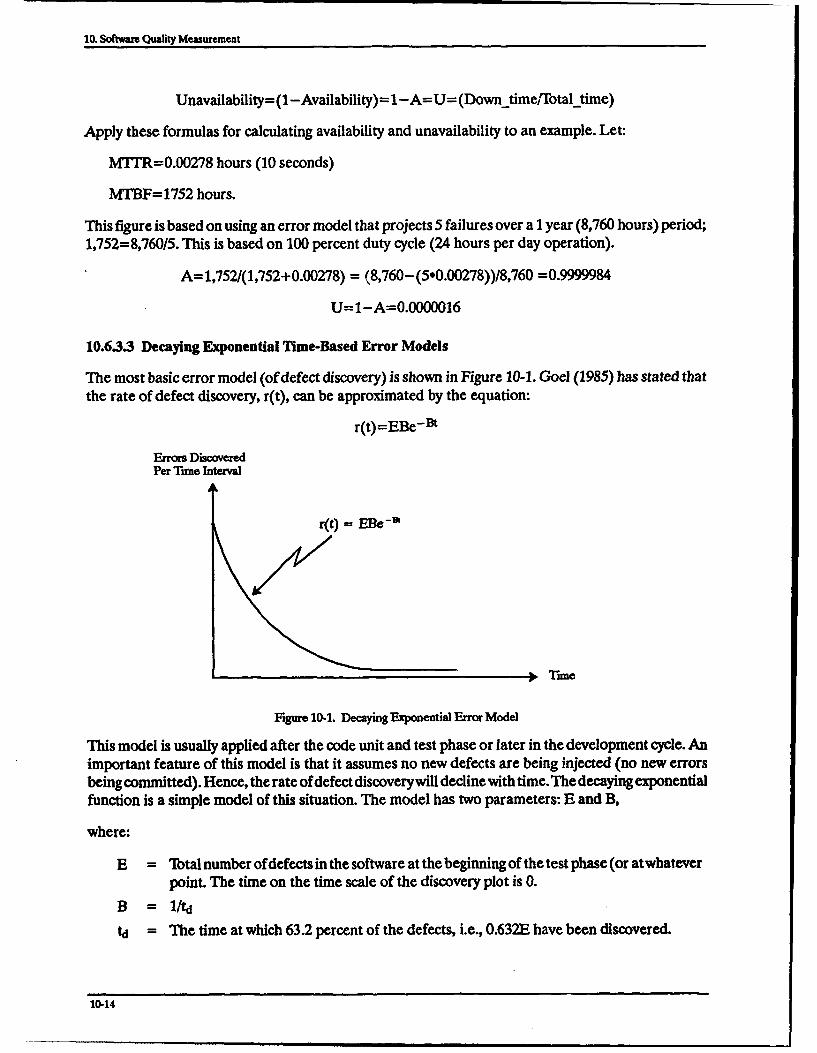
I0. Software Quality Measurement
Unavailability= (1 -Availability)= 1 -A=U= (Downtime!Totalitime)
Apply these formulas for calculating availability and unavailability to an example. Let:
MTTR=0.00278 hours (10 seconds)
MTBF=1752 hours.
This figure is based on using an error model that projects 5 failures over a 1 year (8,760 hours) period;1,752=8,760/5. This is based on 100 percent duty cycle (24 hours per day operation).
A=1,752/(1,752+0.00278) = (8,760-(5*0.00278))/8,760 =0.9999984
U=1-A=0.0000016
10.63.3 Decaying Exponential Time-Based Error Models
The most basic error model (of defect discovery) is shown in Figure 10-1. Goel (1985) has stated thatthe rate of defect discovery, r(t), can be approximated by the equation:
r(t)=EBe-Bt
Errors DiscoveredPer Tume interval
r(t) = EBe-U
s Tune
Figure 10-1. Decaying Exponential Error Model
This model is usually applied after the code unit and test phase or later in the development cycle. Animportant feature of this model is that it assumes no new defects are being injected (no new errorsbeing committed). Hence, the rate of defect discoverywill decline with time. The decaying exponentialfunction is a simple model of this situation. The model has two parameters: E and B,
where:
E = Total number ofdefects in the software at the beginning of the test phase (or atwhateverpoint. The time on the time scale of the discovery plot is 0.
B = 1/tdtd = The time at which 63.2 percent of the defects, i.e., 0.632E have been discovered.
10-14
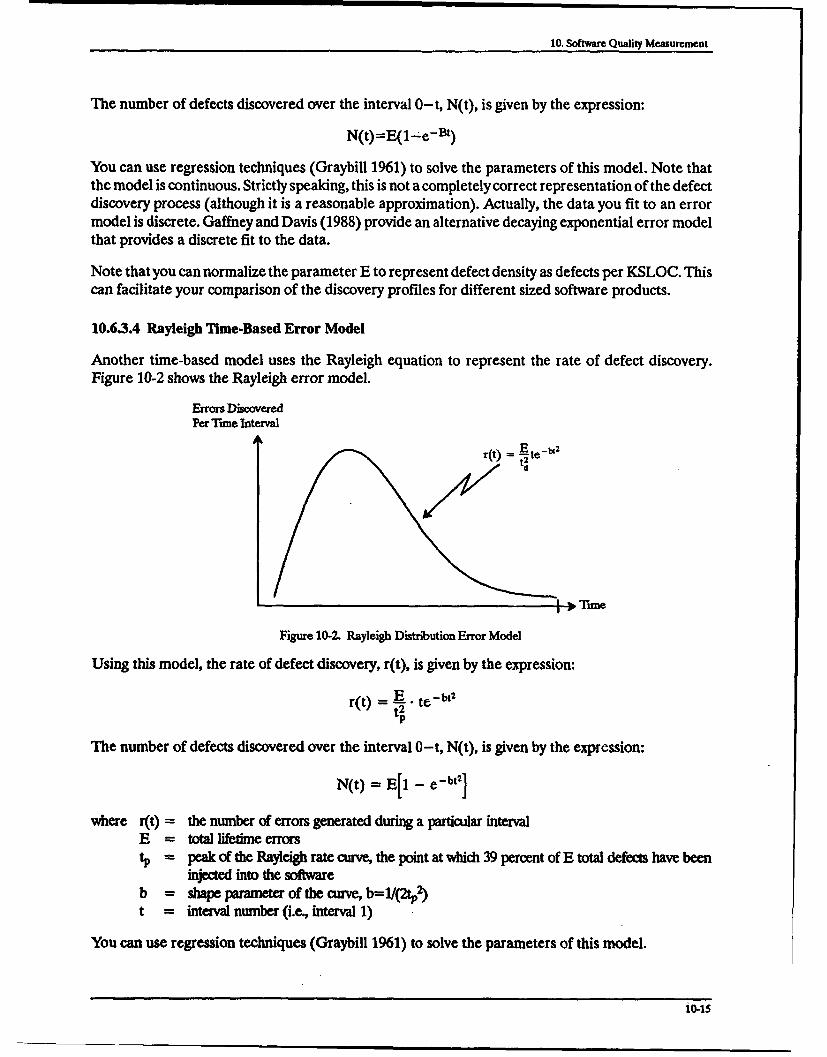
10. Software Quality Measurement
The number of defects discovered over the interval O-t, N(t), is given by the expression:
N(t)=EO- .e-Bt)
You can use regression techniques (Graybill 1961) to solve the parameters of this model. Note thatthe model is continuous. Strictly speaking, this is not a completely correct representation of the defectdiscovery process (although it is a reasonable approximation). Actually, the data you fit to an errormodel is discrete. Gaffney and Davis (1988) provide an alternative decaying exponential error modelthat provides a discrete fit to the data.
Note that you can normalize the parameter E to represent defect density as defects per KSLOC. Thiscan facilitate your comparison of the discovery profiles for different sized software products.
10.63.4 Rayleigh Time-Based Error Model
Another time-based model uses the Rayleigh equation to represent the rate of defect discovery.Figure 10-2 shows the Rayleigh error model.
Errors DiscoveredPer Time Interval
r(t) = Ete -b2
Figure 10-2. Rayleigh Distribution Error Model
Using this model, the rate of defect discovery, r(t), is given by the expression:
r(t) = hE. te -bWt2
The number of defects discovered over the interval O-t, N(t), is given by the expression:
N(t) = E[1 - e-bt2]
where r(t) = the number of errors generated during a particular intervalE = total lifetime errorstp = peak of the Rayleigh rate curve, the point at which 39 percent of E total defects have been
injected into the softwareb = shape parameter of the curve, b=-/(2tp,)t = interval number (i.e., interval 1)
You can use regression techniques (Graybill 1961) to solve the parameters of this model.
i0-15

10. SoNe Quality Measurement
Note that you can normalize the parameter E to represent defect density as defects per KSLOC asin the case of the decaying exponential model. This facilitates your comparison of the discoverýprofiles for different sized software products.
10.6.4 RAYLEIGH PHASE OR AcrlvrlY.BAsW MODEL
Use the Rayleigh curve to plot defect discovery data on an activity-by-activity basis. Using this modelenables you to employ valuable data from inspections and other verification mechanisms obtained be-fore the code is executing. This can not be done with the time-based models described in Section 10.63(Gaffney 1984a; (3affney and Pietrolewicz 1990). The equations provided in Figure 10-3 summarize thenature of this model.
Errors/KSLOCPer Phase
AV 1 AV2 AV 3 AV 4 AV 5 AV 6 01 Development
Phasel t Phase3 Phase5 T I Phase tPhase 2 Phase 4 Phase 6 Inherent or
Latent Error
Rayleigh Curve Fit: AV, = E[eB(t-1)2 - e -_t]
E = Total lifetime error rate (errors per KSLOC)
B -1 ; ¶p = Defect discovery phase constant, the location of the2 "peak" in a continuous fit to the data.
Rayleigh Curve, Cumulative Form: V, = E(1 - e-w)
Figure 10-3. Activity-Based Rayleigh Model
The independent variable, tin Figure 10-3, represents error discovery activity index values for the caseof six error discovery phases, where a phase is one or more activities grouped together to apply themodel and performing estimates. In this model, there are six phases. The incremental (phase) formof this model is:
AVt = E[eB(t-1)2 - e- 3t2]
where AVt=the number of defects (or defects per KSLOC) discovered during development activity t.
The number of latent defects L, the amount of defects or defect/KSLOC remaining at the conclusionof development and test, is given by the expression:
L = Fe-BM2
where M is the number of defect discovery phases in the development process. If M= 6, then:
L = Fe-3B
One may define the efr .iency of the defect discovery process as:
10-16

10. Software Quality Measurement
EFF = (E L) X 100E
Thus:
EFF = 1 - e-36B
Higher efficiency processes have larger values of B or smaller values of tp. The earlier the peak isreached, the higher the efficiency of the error discovery process. It is interesting to note that the twoparameters of the Rayleigh phase-based model shown in Figure 10-3 (the location of the peak (t.) andthe area under the curve (E), respectively) correspond to mutually exclusive'aspects of software errordiscovery. E corresponds to the "goodness" of the development process which relates directly to thearea under the curve. Poorer processes produce (inject) more errors and have higher values of E. Poorverification methods let more of the injected defects "leak" into later phases resulting in higher valuesof tp, the location of the peak.
10.7 THE EFFECT OF REUSE ON SOFTWARE QUALITY
This section describes the impact of software reuse on the quality of the software product. It showsthat greater amounts of reuse generally result in a lower number of latent defects.
10.7.1 REuSE AND QuALrU OVEvRIw
If a software system is composed, in part, of reused code, its quality will probably be greater than ifit were composed entirely of new code. Here, higher quality means fewer defects remaining undiscov-ered when it is shipped to its users. Reuse principally enhances the quality of a software product be-cause of the increased opportunity it provides for defect discovery. Each time reusable code is usedin a new application software system, it passes through the integration and system test processes again.Thus, an additional opportunity is provided for defect discovery and removal. This section focuses onthe effect on quality (defined in terms of defect content) code reuse and, implicitly, the reuse of therequirements and the design from which it came.
You can use the mathematical model to predict the quality enhancement expected as a function of R,the proportion of reused code in a software system implemented with both new and reused code. Themodel relates the number of defects in a software system at the time of delivery (i.e., the latent defectcontent) to R. A software development process consists of a set of activities in which defects can bediscovered. The difference between the quality of new and reused code is that the reused code under-goes integration testing N times for use in N application systems, while the new code (for an applicationsystem) undergoes testing just once. You presume that both the new and reused code components of asoftware system go through the other defect discovery activities the same number of times.
10.7.2 MODEL OF Emzcr OF REusE ON SoriwARw QUALrrY
This section develops a model showing the effect of code reuse on software product quality. The modelshows the increase in product quality (fewer defects) due to reuse (relative to the quality of the productif it were all new code). This model reflects the fact that multiple uses of the same code affords moreopportunities for discovering errors or defects than if that element of code were employed for the firsttime in the software product.
10-17

10. Software Quality Measurement
Let DvR be the latent error density (see Section 10.6) of some code when placed in a software reuse libraryfor initial reuse or when picked up for reuse from the software system. Let Dvm be the latent error densityof the software product as if it were composed entirely of new code. Let both DvN and DVR be measuredin errors per KSLOC. These parameters represent the latent error content densities of their softwarecategories, i.e., the error content density of the software when it is delivered to the customer or user.
Assume that the code to be reused in a new software product has gone through the completedevelopment process (whether it is provided from a library or taken from a prior system). The codeto be reused in a new software product is presumed to go through integration and system test duringdevelopment of a new application system. However, it is assumed the code does not go through theearlier defect discovery steps in design and code inspections and not go through unit test earlier in thedevelopment process as the new application system's code component is expected to.
'rake the following expression for Dp,, the latent defect density in the new software product whichincludes the ith use of the "reused" code:
DRi-- DvN-(1-R)+ DvR'R'pi
where R is the proportion of code reused (on the average over the N planned uses of the reused code).Let:
P= Latent defect content
Defects discovered and removed during the integration and system test process+ latent defect con-tent
where the development process consists of the activities preliminary and detailed design (includinginternal reviews and preliminary and critical design reviews), implementation (including codeinspections and error correction), CSC integration test, and CSCI (system) test.
In the case of the first use after the creation of the reusable software, p1=p, and:
DRI =DRI =DvN*(1 -R)+DvR-R'p
In the case of the second use:
D = DM- DvN -(1 - R) + Dy*- R - p2
An example value of p can be derived from data in Gaffney (I984a) and it is presented in Table 10-5.
Table 10-5. Example Values of Error Discovery Percentages
Phase/Activity Percent of Lifetime Errors
High-Level (Preliminary) Design Inspections 7.69
Detailed Design Inspections 19.70
Code Inspections 23.93
Unit Test 20.88
Integration Test 14.27
System Test 7.92
Latent error content 5.61
Total 100.00
10-18

10. Software Quality Measurement
In this case:
5.61 =0201814.27 + 7.927+ 5.61
The thinking behind the factor p.DVR is as follows. After the reusable code was developed for thelibrary or for use in some prior application system, it still had some latent defects (such as 5.61 percentof the errors indicated in the example situation in Table 10-5) that were injected during the develop-ment process. Upon the first ofN uses, the code to be reused goes through integration and system tests,thus removing a proportion given by:
14.27 +_7.92 0.798214.27 + 7.92 + 5.61
and leaving a proportion of 1.0 - 0.7982 = 0.2018 = p times the latent defect content of the code afterit was developed and put into the library. The same relative percentage of error reduction occurs whengoing from the first use to the second use, and so on.
Let L be the latent error content of a software product composed of reused components, relative toone composed of entirely new code. Thus, for a product having no reused components, L= 1. In gener-al, 0<L•< (under the assumption that reuse does not add to the latent error content). The quantityL may be seen as equal to the proportion of new code times the latent errors relative to the all newcode case, plus the proportion of reused code times the latent errors relative to the all new code case.Thus for the ith instance of use out of N:
Li = (1 - R) + D---- R"-p
Now, if you assume that the defect discovery profile shown in ThblelO-5 applies to both the new codecreated for an application system and the reused code, then DVR=p*DvN. In this case, the equationfor LI can be written as:
Li = (1 - R) + R " pi+l
The factor L is the average quality enhancement (latent error reduction) over the N instances. Thus:
L = NLiI
And:
g=(1-S)" N+R
This expression for L can be simplified to (Cruickshank and Gaffney 1991a):
L = (1 - R)+p"R"N (1---)
10-19
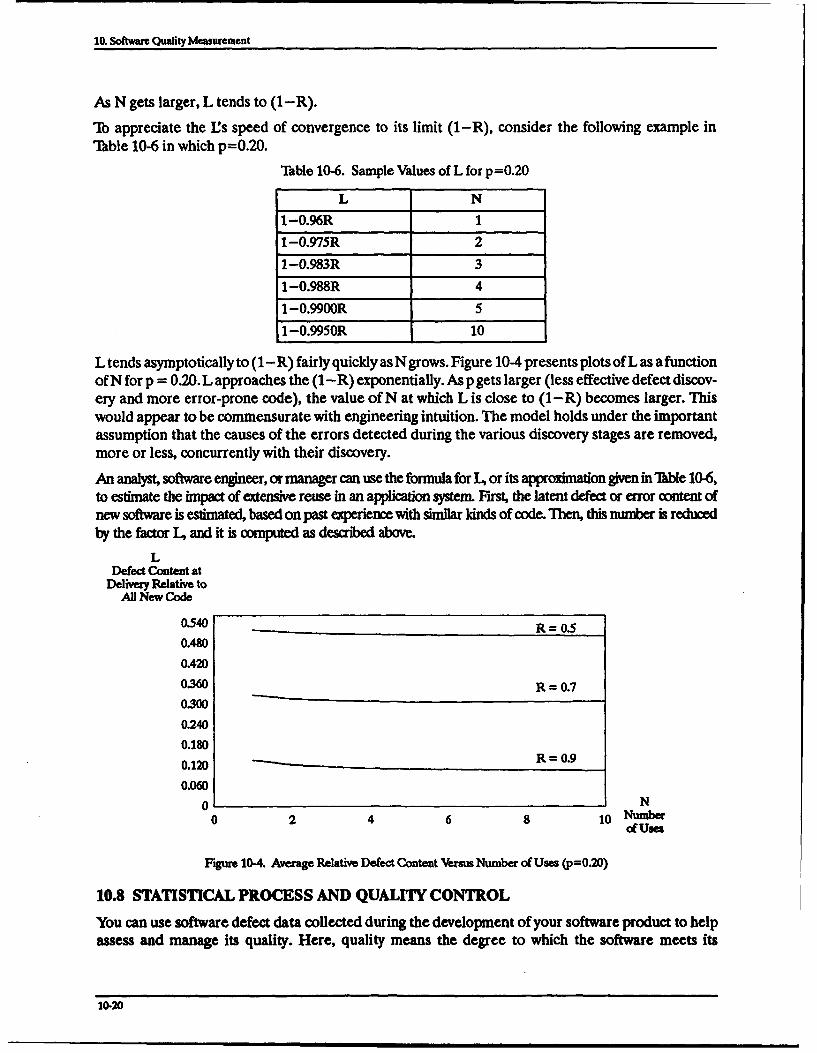
10. Softwar Quality Measurement
As N gets larger, L tends to (1-R).
Th appreciate the Us speed of convergence to its limit (1-R), consider the following example inTIable 10-6 in which p=0.20.
Table 10-6. Sample Values of L for p=0.20
L N1-0.96R 11-0.975R 21-0.983R 31-0.988R 4
1-0.9900R 51-0.9950R 10
L tends asymptotically to (1- R) fairly quickly as N grows. Figure 10-4 presents plots of L as a functionof N for p = 0.20. L approaches the (1 -R) exponentially. As p gets larger (less effective defect discov-ery and more error-prone code), the value of N at which L is close to (1-R) becomes larger. Thiswould appear to be commensurate with engineering intuition. The model holds under the importantassumption that the causes of the errors detected during the various discovery stages are removed,more or less, concurrently with their discovery.
An analyst, software engineer, or manager can use the formula for I., or its ap ation given in '-Mbe 10-6,to estimate the impact of extensive reuse in an application system. Frst, the latent defect or error content ofnew software is estimated, based on past experience with similar kinds of code. Then, this number is reducedby the factor L, and it is computed as descnbed above.
LDefect Content at
Delivery Relative toAll New Code
0.540 R = 0.5
0.480
0.420
0.360 R = 0.7
0300
0240
0.180
0.120 R = 0.90.06O
0 N0 2 4 6 8 10 Number
of Use
Figure 10-4. Average Relative Defect Content Vensu Number of Uses (p=0.2 0)
10.8 STATISTICAL PROCESS AND QUALITY CONTROL
You can use software defect data collected during the development of your software product to helpassess and manage its quality. Here, quality means the degree to which the software meets its
10-20

10. Software Qualiy Measurement
requirements. You can also use the defect data to help determine the effectiveness of the defectdiscovery process (see Section 10.6.4). Section 10.8 outlines how you can do so. Thking these productmeasurements should be viewed as an important part of the process improvement activity of your soft-ware development organization. This section defines the nature of statistical process and qualitycontrol and shows you how to apply it to monitor and better control software quality.
10.8.1 STATISTICAL PROCMsS AND QUALIMr CONTROL DEFiNmoNs
A prime objective of statistical process control (SPC) is to enhance the predictability of a process. Thisis also a primary requisite for a software organization to be certifiable at the higher levels of softwareprocess maturity (see Section 3). SPC uses products measurements to monitor and support the controlof the production process that creates them by predicting future quality based on past experience(Rock and Guerin 1992). Quality control is ".... the act of directing, influencing, verifying, and cor-recting [software and/or the software process] to ensure the conformance of a specific product to adesign or specification." (Cho 1987)
10.8.2 QuALrrM CONTROL CHARTs
This section descrbes the concept of a control chart. Control charts have been applied in the manufacturingindustries for many years. Control cbarts serve three general purposes (Rock and Guerin 1992):
" They define a standard form variable to be tracked. This variable is an indicator of the qualityof the product to which it applies, i.e., a measure of the degree to which the unit meets somespecific requirement.
" They provide information for process feedback that may be dynamically applied for processmodification. In the case of software (see Section 10.8.3), this requires a developmentorganization to be assessable at the highest levels of process maturity.
"* They indicate the status of a process.
Figure 10-5 illustrates the concept of a control chart. The example is an assembly line for paint cantops. The diameter of each paint can top produced on the line is monitored. Acceptable tops are thosewhose diameters lie within a control band (see Figure 10-5). Those tops whose diameters lie outsidethe control band are rejected. You monitor the top diameters over a period of time, correspondingto the horizontal axis in the figure. Divergences from the planned goal, the middle line in the controlband, indicate potential trouble. The nearer to the maximum or the minimum acceptable lines, thegreater the level of trouble. If the product track (i.e., the dotted curve in Figure 10-5) is consistentlysituated in the section of the control band between the planned goal and the maximum acceptable val-ue, this indicates that the process should be re-evaluated. Clearly, something needs to be done because theplanned goal is not be achieved for amy can top produced. As you can see, the measure of the product canbe used to indicate something about the production process and about the quality of the individual product.
10.83 APPLYING QuALrr CoNTRmoL CHARTS TO SOFIWARE
You can apply the concept of a quality control as described for a material "good" (a paint can top) tosoftware. This section shows how this is done. The idea is to use a techniques similar to the one pres-ented in Section 10.8.2. You define goals for defect discovery for the software development activity(e.g., preliminary design, detailed design,etc.) of a software development process. These activities areanalogous to the stations of a manufacturing process.
10-21

10. Software Quality Measurement
Can Top Diameter Indication of Trouble
MaximumAcceptable
Plannd • • Control BandGoal•
Minimum -
Acceptable
Time
Figure 10-5. Control Chart for Paint Can Top Diameter
The basic concept of the methodology is to plot defect discovery versus development activity or phasenumber. You can make a control chart (Figure 10-6) where you define a control band. This controlband prescribes a tolerance range of acceptable values for the number of defects/KSLOC to be foundin the defect discovery (verification stages) of each development activity, such as preliminary design.These tolerance range values relate to the control limits that you must establish for your quality con-trol process.You use control bands to establish acceptable departures from a base or satisfactoryquality level of behavior. Sections 10.8.5 and 10.8.6 tell you how to establish a control band.
Defects Per KSLOCDismvered/Rmoved
L___j/ T ----- Mvdetailed unit test Aoe
design tolerance tolerance e--- ------- - Low
Prelim. Detailed Code Unit CSC CSCI Latent at Delivery SoftwareDesign Design Test Integ. Test Development
Test Phane
Figure 10-6. Software Defect/Errr Statistical Quality Control Chart
You use the defect data obtained from one or a number of products to make inferences about theprocess used to develop them. Therefore, you use product monitoring as an input to process control.You can see that this process is viewed as an implementation of MDSM (as described in Section 2)in which you establish a goal, you monitor its degree of realization, and you take corrective action, asappropriate. The corrective action can be, for example, the recycling of your software process backthrough detailed design if too many defects were discovered during the verification portion of thecoding activity. You collect defect data and use it to monitor the quality level of your product and also
10-22

10. Software Quality Measurement
to make inferences about the quality of the process used to create it. One measure of the processquality is the efficiency of the defect discovery process (see Section 10.6.4). You use the data as inputto a decision process and action strategy to modify the process or product. That is, yvu provide data to devel-opers to discover the cause of departures from the desired behavior and support a return to satisfactorybehavior (return to control). The data that you collect and analyze is used to prompt action by theresponsible manager.
10.8.4 USING A SovxwARE DEFFcr STAnFSrcAL QUALrrY CoNTROL CHART
This section describes how you might use a software defect/error statistical quality control chart.These two charts show a sequence of activities in an order generally followed in software development.They show the expected value for defect discovery and the acceptable range of values. In an actualcase, you plot the defect counts (the actual value or the values normalized with respect to KSLOC)on the graph. Then, you see if the plot stays within the tolerance range. If not, you take appropriateaction. You expect the defect profiles for a set of products produced by your development process tolie within the tolerance band. Depending on how the profiles were grouped, you may wish to take ac-tion to change your process. For example, if the plots were consistently above the middle of the toler-ance range, this could indicate that your process needs to adopt an improved methodology forverification and defect removal. Conversely, if the plots were consistently below the middle of the tol-erance range this could indicate that the process was injecting, but not detecting, existing defects. Or,if the process was a new process, lower defect detection levels could indicate that the process was animproved process.
When using this approach, you accumulate the counts of the errors or defects for all transits through* a given activity and show it on the graph. For example, if detailed design had to be repeated becausedesign defects injected during the detailed design process were found in the coding activity, the sumof the defects found during the detailed design activity are accumulated and shown on a graph.Sometimes the word phase is used to cover the totality of passages through a given activity.
10.8.5 ESTABUSMNG CONTROL BANDS FOR SovrwE QUALrry CONTROL CHARTS
Using a software statistical quality control chart, you establish objectives for defect discovery (andremoval) during the defect discovery phases (the verification portions of the activities constitutingyour software development process described in Section 4). You establish a desired goal defect discov-ery profile pattern and two tolerance profiles related to that profile pattern (the upper and lower pro-files). They define the tolerance band for defect discovery during the development process. Forexample, the range of error discovery bounded by the tolerance profiles for preliminary design corre-sponds to an "acceptable" range for the defects found in preliminary design; it is called the defecttolerance range. The range relates to the control limits of your software quality control process.
You use the established phase-by-phase control limits to indicate departures from satisfactory or"quality level" behavior and to anticipate/help forecast them. Doing this will enable you to take earli-er, more cost-effective, action to rectify problems that will otherwise not be found until later in thedevelopment process. You should view the establishment of defect discovery goals, and their trackingor monitoring the degree of compliance realized during the development process, as a fundamentalaspect of MDSM. The establishment of discovery goals is equally important to the establishment andmonitoring of cost, schedule, and size objectives.
10-23

10. Software Quality Measurement
There are a number of ways you can establish the total defect injection and latent defect content valuesfor the (Rayleigh) goal error discovery profile. One way is to base it on previous experience. You deter-mine that you are now using a better process than the one employed to develop a previous product.Hence, you maybe willing to establish smaller values of both E (the total estimated/injected error con-tent) and tp (the location of the peak of the defect profile) as a goal. Refer to Section 10.6.4 for a discus-sion of the Rayleigh fit to phase-based defect discovery profiles. E can be reduced by the use of betterdesign methods that result in the introduction of fewer defect than preceding development efforts.The value of tp can be reduced (moved to the left) due to the use of improved verification methods.
Alternatively, you can establish the parameter values of the goal defect discovery profile based on thereliability requirements that the product is to satisfy. For example, the software product may have lessthan some value of latent defect content in order for it to be plausibly characterized as meeting somereliability objective. The tolerance band about the goal profile could correspond either to its abilityto satisfy your customei's reliability requirement and/or on the degree to which you believe your pro-cess can control the level of defect introduced into your software. Another alternative for selectingthe defect discovery goal profile is a combination of customer requirements and general processimprovement (including verification) objectives that have been established for your organization.
Thus, using the defect discovery profile graphics and the analysis support they provide, you can employsoftware product data to make inferences about the development process being used to create theproduct (during development or after it has been completed). By monitoring the product, you can im-prove control of the software development process. Such data can be used in your decision processand action strategy to support modifying the product under production while you are creating it or theprocess you employ to produce it (or, if post facto analysis is employed, after you have created it). Thisapproach provides developers with data in a timelymanner to aid them in discovering departures fromthe development process and supports returning it to control. You use the information displayed ingraphs (such as Figure 10-6) to prompt corrective action.
10.8.6 APPLYING TAGUCHm QuAmY CONTROL CONCEPTS TO SOFTWARE
An alternate method for establishing tolerance profiles is based on work done by Dr. Genichi Taguchi(Barker 1990). Taguchi has focused on improving the quality of measuring systems and measuring pro-cedures by introducing the concept of sensitivity (Cherng, Fathy, and Lumsdaine 1989). Thguchi sug-gests using the concept of signal-to-noise ratio to evaluate the sensitivity of a measuring system. Sofar, there is no report of these ideas being applied to software. Electrical engineers widely apply theconcept of signal-to-noise ratio. The basic concept is if there is a desired signal value, G, and it is im-bedded in noise whose power is 02, (corresponding to statistical variance) then S, the signal-to-noiseratio, is equal to Old. The inverse of this value is known to statisticians as the "coefficient of variation,"when G is taken as the expected value of a random variable. Larger values of signal-to-noise ratio correspondto smaller values of the defect tolerance range.
You can apply the Taguchi concept (as described for establishing the goal defect discovery pattern and
the tolerance patterns) above and below it.
There are two ways to establish the goal defect discovery profile pattern. You could select:
"* The total defect content (total injected), E, and the latent defect content, L.
"* The total defect content (total injected), E, and the location of peak defect discovery, tp.
10-24

10. Software Quality Measurement
There are two ways to establish the (optional) tolerance profile patterns. You could select:
0 The percent upper tolerance level, Pu, and the percent lower tolerance level, PL.
0 The value of the signal-to-noise ratio, S.
The equation for the goal defect profile (Gt) value for phase t is:
Gt = E[e-B(t-1)2 - e-Bt2]
The equations for the upper (Ut) and lower (L1 ) error profile values for phase t are:Ut=E (l+pu - 0.01) • phase multiplier and Lt=E (1-pL" 0.01) • phase multiplier; the "phasemultiplier" is given by the expression:
[e-B(t- 1)2 - e-_Bt2
When the signal-to-noise value, S, is entered, the program sets pu=pL=p, and p= 100/S. Then, Ut=E(S+1)/S -phase multiplier and Lt=E (S-1)/S -phase multiplier. Note that S must be greater than 1for these equations to hold.
See Section 10.6.4 for more details about the Rayleigh phase-based model of defect discovery.
10.9 QUALITY AND PROCESS MATURITY
This section shows you the connection between the five (SEI) software process maturity levels andquality assessment. It provides you with the "error" related questions involved in process assessmentdescribed by the SEI (Humphrey and Sweet 1987). This SEI document uses the term "error" whereothers often employ the term "defect" (see Section 10.5). It views quality from the point of view offunctional discrepancies. The questions focus on data related to such discrepancies. The numbers ofthe questions in the Humphrey and Sweet document are presented in Sections 10.9.2 to 10.9.5 for yourreference. Observe that each of the error related questions is asterisked, as in Humphrey and Sweet(1987). The asterisk indicates that the specific question is one of the group of which 90 percent mustbe answered affirmatively in order for your software development organization to be certifiable as be-ing at the indicated process maturity level. This is indicative of the importance with which quality datacollection and analysis are viewed in connection with your organization's being certifiable as havingattained one of the higher levels of process maturity. That is, your organization can not be assessedas achieving the higher levels of process maturity without having institutionalized the performance ofcertain error collection and analysis functions. Of course, you should seek to perform the functionsascribed to a higher level as soon as possible, commensurate with your ability to collect and analyzethe data and to act upon it.
The following subsections list and briefly describe the five levels of software process maturity and thequality related questions associated with them.
10.9.1 LyUm, 1, INmw PRocuss
The initial environment, sometimes referred to as "chaotic," has ill-defined procedures and controls.Until the process is under statistical control, orderly progress in process improvement is not possible.
10-25

10. Softwre Quality Masurement
10.9.2 LEMEL 2, REPEATABLE
The organization has achieved a stable process with a repeatable level of statistical control by initiatinrigorous project management of commitments, costs, schedules, and changes. The error-related question forthis maturity level is, 'Are statistics on software code and test errors gathered?" (2.2.4*)
10.9.3 LEVEL 3, DEFNED
The organization has defined the process as a basis for consistent implementation and betterunderstanding. It has made a series of organizational and methodological improvements: design andcode reviews, training programs for software engineers, and increased organizational focus onsoftware engineering. The error-related questions for this maturity level are:
"* Are statistics gathered on software design errors? (2.2.3*)
"* Are the action items resulting from design reviews tracked to closure? (2.2.15 *)
"• Are the action items resulting from code reviews tracked to closure? (2.2.17 *)
10.9.4 Lrvzu 4, MANAGED
The organization has initiated comprehensive process measurement and analysis. This is when themost significant quality improvements begin. The organization bases its operating decisions onquantitative process data, and conducts extensive analyses of the data gathered during softwareengineering reviews and tests. The error-related questions for this maturity level are:
"* Are design errors projected and compared to actuals? (2.2.5*)
"* Are code and test errors projected and compared to actuals? (2.2.6*)
"* Are design and code review coverages measured and recorded? (2.2.13*)
"* Is test coverage measured and recorded for each phase of functional testing? (2.2.14")
"* Has a managed and controlled process database been established for process metrics dataacross all projects? (2.3.1*) This question is directed more broadly than maintaining "error"statistics solely.
"* Are the review data that were gathered during design reviews analyzed? (2.3.20)
"* Are the error data from code reviews and tests analyzed to determine the likely distributionand characteristics of the errors remaining in the product?
"* Are the errors discovered [that have been] discovered [been] analyzed to determine the likelydistribution of the errors remaining in the product? (2.3.3*)
"* Are the errors [that have been]discovered [been] analyzed to determine their process relatedcauses? (2.3.4")
10-26
10. Software Quality Measurement
" Is the review efficiency analyzed for each product? (2.3.8*)
" Is a mechanism used for periodically assessing the software engineering process andimplementing indicated improvements? (2.4.10"). Process assessment includes, but is not re-stricted to error management. Recall that Section 10.8 on statistical quality/process controlindicated howyou can use defect data to help you assess the efficiency of your defect discoveryprocess and perhaps suggest steps that you can take to enhance it.
10.9.5 LEVEL 5, Oprirazm
The organization now has a foundation for continuing process improvement and optimization. It hasa major focus on improving and optimizing its operation. This includes more sophisticated analysesof the error and cost data gathered during the process and the introduction of comprehensive errorcause analysis and prevention studies. The error-related questions for this maturity level are:
"* Is a mechanism used for error cause analysis? (2.3.5*)
"* Are the error causes reviewed to determine the process changes required to prevent them?(2.3.6")
"* Is a mechanism used for initiating error prevention actions? (2.3.7*)
10.10 SUMMARY AND RECOMMENDATIONS
This section has provided an overview of software quality. It has indicated that "quality" refers to bothyour process and the products resulting from it. It has indicated the great importance of qualitymanagement techniques to your organization. Also, you should realize that "quality"is concernedwithmore than the detection and removal of errors from code. Fewer defects in a software product clearlyindicates "higher quality." However, the term "quality" is not a synonymous measure of defect con-tent. There are other attributes of software quality, such as usability, in which you can tailor the defini-tions to your specific requirements. The degree to which your software system realizes these attributescan be tracked throughout the development process.
This section has also indicated that:
"* Software quality measurement is key to both project control and process improvement.
"• You need to:
- Know where you are now.
- Monitor progress toward your goals.
- Have a database of quality metrics for your process and products to help you set goalsfor your new products and expectations of process change results.
"* You should quantify the quality goals for process and product and then monitor metricsindicative of their degrees of realization.
". You should view quality measurement as part of the MDSM process.
10-27

10. Sofmwa OQulity Mcaurcment
"* You should view defect injection and discovery in the context of MDSM.
"* You can predict the number of defects expected to be left in the product before the code isrunning.
"* You can use defect discovery as input to software process evaluation.
"* You should recognize that various types of defect data collection and analysis are keyrequisites to attaining higher levels of process maturity.
10-28

11. MANAGEMENT INDICATORS FOR TRACKINGAND MONITORING
11.1 MANAGEMENT BY MEASUREMENT
This section presents quantitative methods and procedures for tracking the product and the progressof a software development project. Project management personnel routinely determine progress;compare results to estimates, commitments, and plans; analyze reasons for discrepancies; adjust thecommitment and plans; and develop corrective action if needed. These management actions requirea continuing process of measurement. Establishing quantitative objectives, monitoring project status,and evaluating product and process quality all involve measurement of some kind. This section dis-cusses how to measure the status of a software development project and how to use these measure-ments to make judgments about that project (such as recycling back through the development processin order to improve the product).
11.1.1 Sonrwimi DEVELOPMEN PROJECT TRACKING ANm MONIoTOi NG
This section describes the management of software project tracking and monitoring.
11.1.1.1 Status Tracking
The effective management of a software project requires quantitative information to supportdecisions about the achievement of project objectives both during development and at the completionof the project. The process of producing this information begins with defining quantitative project ob-jectives, continues with status tracking during the software development project, and ends with therecording of project performance in the experience database. Goal management practices require de-cisions about project status and the achievement of goals at all points in this process, and the informa-don that supports these decisions is in the form of software metrics. Some of these metrics are fromthe set discussed in Section 6. Others are unique to the process of status tracking. The metrics dis-cussed in this section are called "management indicators" because they indicate the project status rel-ative to size, cost, schedule, quality, stability, and computer resources. The process of using theseindicators to support managing a software development project is called "tracking" or "monitoring."(This section uses the terms "tracking"and "monitoring" interchangeably.) The tracking process con-sists of periodically collecting data, calculating indicator metrics from that data, and organizingreports that indicate the status of the project.
The goals of software project tracking and monitoring (Paulk, Curtis, and Chrissis 199 1) are:
"* "acking the actual results and performance of the software project against plans andcommitment.
" Ihking corrective actions when the results and performance of the project deviate significantlyfrom the plans.
" Understanding and agreeing to commitment changes by all affected parties.
11-1
11. Managemcnt Indicators fo: n'facking and Monitoring
The metrics that support decision making should alert management to potential or actual problemsthat could prevent project goals from being achieved. In the pre, ious example, if the effort to date plusthe projected effort to complete the project (when compared with the budget) indicates a possible bud-getary overrun, the management has to take some action such as increasing the budget or decreasingthe amount of testing (while preserving quality). The metrics should also provide information abouthow to solve or mitigate the problem. In the previous example, if the ongoing analysis of product de-fects discovered during development (a quality metric) shows that high quality is being achieved, thenperhaps the amount of testing can be reduced and the projected costs decreased.
11.1.1.2 Measurement and Status Tracking
The rules to follow in using tracking metrics are:
" Establish the metrics to be used and the measurements to be collected in advance of the startof the effort. The measurement function should work with software development manage-ment and with project management to define and quantize project goals and the metrics toindicate project and product status. Use the GQM paradigm (see Section 6) to aid in thedefinition of tracking metrics that support the achievement of those project goals.
"* Relate the metrics to action that you can take to rectify problems (or at least limit the damage).
"* Collect measurements during the project. Do not reconstruct them after the fact.
" Collect an appropriate set of measurements to aid you in setting realistic goals for the future,to enable you to determine the degree of improvement, and to provide input into your estimatingalgorithm.
"• Ensure the validity of the measures you collect (Basili and Weiss 1984).
The measurement function defines the data collection methods; indicator construction; and softwaredevelopment planning, tracking, and monitoring procedures in its software development standardsand policies. Management does not need to understand the technical details of data collection or theconstruction of the indicator metrics since the measurement function (however organized) performsthe data collection and analysis. Management, however, should understand what the indicators arerevealing about the project. Then management will be able to take the appropriate actions to solveany problems indicated by the tracking indicators.
'Tfack "large" software development projects using the methods presented in this section. Thedefinition of a large project should be in your enterprise's software development standards; however,some organizations, for example, have tracked only those projects above 100 LM of effort.
11.1.1.3 Tacking Activities
The following lists the top-level activities for tracking and monitoring a software development process(Paulk, Curtis, and Chrissis 1991):
* A documented software development plan is used for tracking and monitoring the softwareactivities and communicating status.
11-2

11. Management Indicators for Ihcking and Monitoring
"• Senior management reviews and approves all commitments and commitment changes madeto all parties external to the software development organization.
"* Approved changes to software commitments are communicated to software development,
software-related organizations, and the customer.
"• Project size, cost, and schedule are tracked and corrective actions are taken.
"* Project critical target computer resources are tracked and corrective actions are taken.
"* Project product quality is tracked and corrective actions are taken.
"* Software engineering technical activities are tracked and corrective actions are taken.
"• The software technical, cost, resource, schedule, and quality risks are tracked throughout theproject development life cycle.
* Actual measurement and metrics data and replanning data for software project tracking arerecoded for use by the technical staff and management.
"* The software staff and managers conduct regular reviews to track status, plans, performance,and issues against the software development plan.
"* Formal reviews of accomplishments are conducted at selected milestones and at the beginningand the end of selected stages of the software project.
11.1.2 PRojEcr MomrromRG AND PROCSss MUuRm LEvus
One of the requirements for achieving capability maturity level 4 (SEI assessment question 2.3.1)(Paulk, Curtis, and Chrissis 1991) is that you establish a database for process metrics/measurementdata. Section 6 of this guidebook presents process and product measurement/metrics data (size, cost,schedule, quality, etc.) that you define relative to project goals and that you collect upon project com-pletion. The capability maturity scheme suggests that you use this data to improve your process andproducts in the long term, i.e., in future development projects.
There is, however, another aspect to data collection. Section 6 discusses the collection of"actuals"at the project's completion for historical analysis and both process and product improvement. You alsodevelop metrics to track the project during development; this data can be fed back to the ongoing proj-ect to make short term adjustments to mitigate problems by improving the process and to aid in achiev-ing project process and product objectives. You must collect data during the project for process andproduct improvement while in development. You keep this data in your software experience databaseor in a separate database. This section discusses the analysis of this "in process" data and how you canuse it to determine project status.
You begin data collection and analysis for both historical and project monitoring purposes while yourorganization is at process maturity level 1 or 2. There is no need to wait until level 3 to do so. The orga-nization at level I or 2 should be able to feed back the experience data for incremental process andproduct improvement, whether historical or immediate. The quantitative monitoring of a software de-velopment project by tracking progress, process, and product during development through datacollection, analysis, and management action is characteristic of a level 4 or 5 organization.
11-3

11. Management Indicators for hacking and Monitoring
11.2 MANAGEMENT INDICATORS
Many sets of software management indicators have been published that form a list of hundreds ofmetrics. Obviously, you cannot perform effective tracking with hundreds of indicators, so you mustselect a manageable set at the project's initiation. You can find extensive discussions of indicators inGrady (1992), Grady and Caswell (1987), Schultz (1988), Air Force Systems Command (1986), ArmyMateriel Command (1987), National Aeronautics and Space Administration (1990), Paulk, Curtis,and Chrissis (1991), and Carleton et al. (1992). This guidebook presents 38 metrics that you can useto track a software development project. Many of these indicator metrics have been taken from thesereferences. Many of them have been redefined to be more precise.
It is important to recognize that a management indicator can have several metrics associated with it.For example, you can measure the cost-to-date indicator in LM, LH, or dollars. If your software stan-dards do not specify cost units, your measurement function should decide how best to measure thecost-to-date indicator. You can select either LM or dollars or both. If your organization has notestablished software standards and policies, you must make these choices before the project begins.
Table 11-1 presents some management indicators for your guidance. You should view this table as a"menu" from which you can select indicator metrics for tracking and monitoring. Select and definethe indicators by using the GQM paradigm relative to your project's goals. The indicators that yourequire for a particular project may not be in this table, and you may have to design unique indicatorsaccording to the needs of the project. Effective tracking depends on selecting a set of indicators smallenough to be manageable and economically viable and large enough to contain all of the informationnecessary to manage them efficiently.
Many of the size, cost, schedule, and quality indicators and metrics are the same as the project controlmetrics listed in Section 6, the important difference being that the indicators and metrics in Table 11-1are based on intermediate measurements made for tracking during the development of the software(i.e., during project execution) and thus are labeled".., to date" or"... elapsed." The Section 6 met-rics for project control have the same intent and direction as the corresponding indicator metrics inTable 11-1, but they are not discussed in the specific climate of tracking and monitoring.
Table 11-1 also contains some metrics that have no corresponding metrics in Section 6, such as theproject stability indicators and the earned value indicator. These indicator metrics are important andspecific to the tracking and monitoring process, but they have less meaning once the project is completed.
Table 11-1. Software Management Indicators and Metrics
MeasurementNumber Category Indicator Metrics
1 Software product Current estimate or count New, reused, and total KSLOCsize (or function points)
2 Software product Current estimate or count IKESLOCsize
3 Software product Percent current estimate is of (Current/initial)100size estimate at initiation
4 Software cost Cost to date LM5 Software cost Cost to date , LH6 Software cost Cost to date Dollars ($)
11.4

11. Management Indicators for "fl-acking and Monitoring
Thble 11-1, continued
MeasurementNumber Category Indicator Metrics
7 Software cost Percent of budget spent to date Percent LM
8 Software cost Percent of budget spent to date Percent LH
9 Software cost Percent of budget spent to date Percent $
10 Development Elapsed development time Elapsed monthsschedule
11 Development Percent of schedule elapsed (Elapsed months/schedule schedule months)100
12 Project technical ECPs Count ECPsstability
13 Project technical Percent requirements (Requirements to be defined/stability undefined (Expected major total requirements)100
subsystems undefined)
14 Project technical Number of software action Count SAIs
stability items (SAIs)
15 Project technical Percent SAIs closed to date (SAIs dosed/total SA~s)100stability
16 Project technical Authorized positions staffed Count peoplestability
17 Project technical Percent planned positions (Staffed/planned)100stability staffed to date
18 Project status Percent requirements designed (Requirements designed/total requirements)100
19 Project status Percent requirements coded (Requirements coded/total requirements)100
20 Project status Percent requirements tested (Requirements tested/total requirements)100
21 Project status Percent tests passed (Tests passed/total tests)100
22 Project status Percent measurement units (Units designed/total units)100(KSLOC, function points,CSUs, or CSCs) designed todate
23 Project status Percent measurement units (Units coded/total units)100(KSLOC, function points,CSUs, or CSCs) coded(including CSU test) to date
24 Project status Percent measurement units (Units tested/total units)100(KSLOC, function points,CSUs, or CSCs) tested(including CSC test) to date
11-s

11. Management Indicators for flacking and Monitoring
Table 11-1, continued
MeasurementNumber Category Indicator Metrics
25 Project status Percent measurement units (Units integrated/total units)100(KSLOC, function points,CSUs, CSCs, or CSCIs)
_integrated (including CSCI test)
26 Quality indicators Number of defects per KSLOC Defects or errors inin preliminary design reviews preliminary designand detailed design reviews revitews/KSLOC,
Defects or errors in detaileddesign reviews/KSLOC,(use actual or estimatedKSLOC)
27 Quality indicators Number of defects per KSLOC Defects or errors in codein code inspections inspections/KSLOC (use actual
or estimated KSLOC)28 Quality indicators Design quality Complexity
Error discovery efficiencyStrengthCoupling
29 Quality indicators Number of (valid) PIRs opened Count (valid) PTRs
30 Quality indicators Percent of PTRs dosed to date (FIRs closed/total PTRs)100
31 Quality indicators PFRs per KSLOC in CSC test PFRs/KSLOC
32 Quality indicators PTRs per KSLOC in CSCI test PTRs/KSLOC
33 Quality indicators PTRs per KSLOC in system test PTRsIKSLOC
34 Quality indicators Predicted defects/KSLOC at Predicted defects/KSLOC atdelivery delivery
35 Earned value Overall proportion of software See Section 11(in KSLOC, function points,etc.) complete
36 Computer resources lhrget CPU processing speed (Target mips/host mips) x(for standard functions) ((function size in millions of
inst.)/(host processing speed inseconds)) = estimated targetmips for standard function
37 Computer resources Proportion of memory CPU use4/CPU available orutilization (words, bytes, mass storage used/mass storagecharacters, or bits) available
38 Computer resources Proportion of software I/O (Message length)(arrivalcapacity utilized rate)/(processing speed)
Use the data collected during the development process for tradi product ari for determning projectstatus. Feed back the collected data to incrementally optimize the software development process. In
11-6

11. Management Indicators for Iacking and Monitoring
addition, you should use at least the minimum data set for tracking software development projects.Your enterprise will define its own data set for tracking.
You can track the indicators in Table 11-1 and graphically and numerically present them. You can alsotrack the actual measurements or metrics instead of the percentages if so desired.
11.3 HOW TO SELECT MANAGEMENT INDICATORS
This section describes how to select metrics that support project goals.
11.3.1 GoAL.QUESrION-MEnmc PARADIGM
Use the GQM paradigm to select the metrics that you track. The goals and questions will determinethe metrics to be used for tracking. As an example, suppose your project goals are as follows:
"* Productivity for the activities of preliminary design through CSCI test should be at least 200
SLOC/LM.
"* Do not begin designing until all requirements are defined.
"* Without changing the review and inspection process, hold the total defects/KSLOC in thedevelopment process to below 25.
"* Deliver software with an estimated latent defect density of no more than 1.0 defects/KSLOC.
"* Complete the project within budget and planned schedule.
The questions and metrics (i.e., management indicators from Tible 11-1) associated with these goalsare shown in Table 11-2.
"Ibble 11-2. Example of Goal-Question-Metric for Tracking
Goal Questions Metrics(Management
Indicators)
1 What is the estimated overall productivity? 1,4,352 What is the number of requirements? 12,18
What percent of requirements are undefined? 13,223 What is our current total defect density? 26,274 What is our current estimate of latent defect density? 1,26,27,31-345 What is the current budget status? 4-9
What is the current schedule status? 10,11What is the development status? 18-25,35What problems remain? 12-15
11.3.2 INCREMENTAL IMPROVEMEN
If you find that the indicator metrics you are using have revealed a problem, such as not meetingproject goals, it may be necessary for management to change the software development process. As
11-7

11. Managment Indicators for Tracking and Monitoring
the tracking and monitoring procedures are applied and reapplied throughout the softwaredevelopment cycle, many such decisions need to be made. In each case, the management indicatormetrics not only indicates the possibility of a problem, it provides information on what adjustment tomake in the process. Therefore, try to select metrics that give you indications of problems in thedevelopment cycle as early as possible so that you can minimize the cost and scheduling impact.
11.3.2.1 Feedback
The value of the management indicator metrics at any stage in the development process not only showsthat a problem exists but it also provides information useful in improving your software developmentprocess. For example, take the project goals stated in Section 11.3.1. Assume that 100 KSLOC ofsoftware is to be developed and that this software is presently in the coding activity having been com-pletely designed. At this point, the tracking and monitoring process discovers that the current totaldefect density is already 30 defects/KSLOC, thus exceeding the third project goal of 25 defects/KSLOC. A problem has been shown to exist.
It seems that, in this case, the error discovery process, especially with respect to design reviews, isworking well; however, too many design errors are being generated. Since the coding can not beginuntil the requirements are complete (the fourth project goal), it seems that the high design defect rateis not from undefined requirements. Therefore, the code is not being designed correctly the first timethrough, i.e., before the design reviews. Since the software is now designed and being coded, nothingcan be done to improve this particular instance of design. But future projects maychange to structuredmethods, for example, and use a program design language. Or perhaps better training is needed forthe designers. All of these actions help to incrementally improve the development process by feedingthe metrics information back to the process through management over a longer term.
113.2 Corrective Action
The example discussed in Section 11.3.2.1 suggested corrective actions that could be taken to improvethe development process in the long term, i.e., future development efforts. Often, management cantake short term actions to solve or mitigate a problem. Take the set of project goals stated in Section11.3.1 as an example. Suppose you discovered that when the software was almost completely codedthat the project effort has spent ten percent over the design, code, and unit test budget of 355 LM; andthere is a high probability of you not meeting the fifth project goal. Management could decide to tryto make up those (0.10)(355)=35.5 LM by trying to make the test process more efficient. If the totalbudget is 500 LM (100,000 SLOC/200 SLOC/LM), then 35.5 LM has to come out of the remainingbudget of 500-355=145 LM. Management may decide to institute a two-tier testing procedure forCSC integration in which all of the program units critical or error-prone are extensively tested whilenoncritical and stable units are tested less intensively. Also, the CSCI test can be made more cost-effi-cient (but perhaps reducing its effectiveness) by forgoing stress testing near or at the performanceboundaries of the software function. Such a process improvement might save 20 to 25 percent of thetesting budget and make up for most, if not all, of the design and coding overrun. Before cost reductiondecisions such as those described here are taken, the risk in taking them (e.g., not finding all the errorsthat more testing would have found) should be evaluated.
11.4 HOW TO COMPUTE MANAGEMENT INDICATORS
This section defines the metrics for software project tracking and monitoring.
11-4

11. Managemcnt Indicators for Tacking and Monitoring
11.4.1 SorrwAm PRODUCT SIZE INDICATORS
You track the size of a software system using indicator I or indicators 2 and 3 because the deliveredsize is almost always larger than the initial estimate. Also, there are often memory or CPU processorconstraints that restrict program size, and these restrictions can become critical in the later stages ofdevelopment. Monitor the size of the software product (i.e., the new and the total [new plus reused)KSLOC) through the full development schedule. You can also monitor function points ifyou use them.If estimates of the software product size are available, track the estimated size. If actual code countsare available, track the actual code counts. While the software product is in design, you can still trackthe estimated KSLOC by converting the counts of SLOD or process bubbles to KSLOC estimates. Thepast experience of the enterprise design process, as recorded in the enterprise software experiencedatabase, will reveal the SLOC-to-SLOD ratio. (Some specific experience shows a ratio of about 4,but each enterprise must calculate its own ratio.) You can also continuously track function points andexternals throughout the development process.
11.4.2 SoFTWrwE Cost INDICATORS
Indicators 4 through 9 relate to development cost. You monitor dollars and either LH or LM, relativeto the budget. You track softwaredevelopment costs in LH or LM but track expenses, such as comput-er support and equipment, in terms of dollars. You track subcontractors in LM or LH, if possible; butsince subcontractor billing is usually done in dollars, you may have to track subcontractor dollars.Also, you track total dollars spent to date. When you place the data in your software experience data-base, annotate this data with the date on which they were incurred so that you can relate or comparethem with similar experiences on other projects at different times.
11.4.3 DEvEwPmNs~T SCHEDULE INDICATORS
Schedule trackng should be standard practice on every software development project. Schedule tracking, asin indicator 10, is usually in terms of months. The percent of schedule elapsed, as in indicator 11, maybe helpful in comparing time resources spent (for example) to financial resources spent.
11.4.4 PNojar TECmiA STABu.rrf INDICATORS
Project technical stability is the extent to which the requirements of the software development areundefined from the time of the project's initiation. This lack of definition is principally manifested inincomplete and contradictory technical requirements and in insufficient human resources.Insufficient schedule and budgets are also related to technical instability, but these situations arecovered by other management indicators.
Technical stability of the software development project, as shown by indicators 12 through 17, isimportant since stability is often the prime determinant of whether or not the project is completedwithin the required cost, schedule, and quality requirements. The volume of engineering change pro-posals and the percent of undefined requirements are key indicators that you should track. It is oftendifficult to find a sufficient number of qualified personnel; a shortage of such people can severely im-pact the schedule. You should closely monitor the number of unfilled software development positions.
11-9
11. Management Indicatdn for Tracking and Monitoring
11.4.5 PRojEcr STATUS INDiCAToRS
You can monitor the status (the degree of project completion) and the earned value (the amount ofwork done in terms of product actually complete) by measuring the degree of implementation of therequirements analysis activity through the CSCI testing activity (shown by indicators 18 through 20).You should express the project status in terms of the percentage of measurement units that have beencompleted at each of the development activities (shown by indicators 21 through 25). Measurementunits can be SLOC, function points, CSUs, CSCs, or even CSCIs.
11.4.6 QuAunv INDicrolts
The data records you normally keep as part of design reviews and code inspections should provide thedata for the quality indicators 26 and 27. You can use these indicators, together with quality indicators31 through 33, as input to methodologies. Gaffney and Pietrolewicz (1990) predict software defectsper KSLOC at delivery.
Indicator 28, design quality, has many facets that are listed in 'ible 11-1 and defined in Section 5. Youmay want to track some or all of these metrics; however, they are not part of the minimum set.
11.4.7 Comn~uTR REsouRcEs INDicAtRS
Sometimes you track computer resources, as shown by indicators 36 through 38, especially when youhave doubts about the existence of sufficient computer resources. The software specification some-times requires that the software to be developed or a specific software function must execute at a mini-mum speed on a CPU that is specified but is not yet developed or is otherwise unavailable. Toapproximate and monitor target processing speed (as shown by indicator 36) when the target CPU isunavailable, you must first identify the key software functions that have the potential to impose majorconstraints on the speed of system processing. These functions may be frequently used routines ormodules that have (perhaps) some difficulty in handling the information flow. Examples include fastFourier transforms, Kalman filtering, message handling, or input/output (I/O) routines.
For any of these functions, the ratio of the specified target CPU speed in millions of instructions persecond (mips) to the host (development) CPU speed in mips represents the ratio of processing speedsfor these particular functions or for the developmental software in general, whatever the specificationrequires. If you divide the software function size in millions of instructions by the number of secondsit takes the host CPU to process the software function (or multiple iterations of the function), you ob-tain the software function host execution speed in mips. You can multiply this host execution speed by the ratioof processing speeds to yield an estimate of the target CPU software processing speed in mips.
You can monitor this CPU processing speed indicator as you develop the software function(s). Theearly software versions may indicate a target processing under the specification; but as you developand optimize the software with respect to speed (among other factors), the estimated target processspeed should approach the specification.
You calculate indicator 37, memory utilization, by dividing the CPU utilization by the CPU availablecapacity. You can measure memory in words, bytes, characters, bits, or instructions. You can calculatethe proportion of mass storage utilization by dividing mass storage utilization by mass storageavailable. In addition, you can use tracks and cylinders as viable measures of memory for disk units.
11-10

11. Management Indicators for'flacdin and Monitoring
Indicator 38, I/O facility utilization, requires knowledge of the statistical distribution of messagelength in which messages are the units of information that the I/O software processes. With knowledgeof this distribution, you select a high message length of about three standard deviations above themean. You convert this message length (which you express in characters, words, or bytes) to thenumber of bits per message. Multiply this length in bits by the arrival rate of the messages (in or out)in messages per second. Then divide this product by the processing capacity in bits per second of theI/O software that prepares and sends messages to or receives messages from the hardware channel.These calculations result in the proportion of I/O software capacity used. You can monitor this propor-tion (i.e., you can calculate and compare it with the specification) as you develop and optimize thesoftware that is concerned with message handling capacity.
11.5 OVERALL PROPORTION COMPLETE AND EARNED VALUE
This section describes how you estimate the overall proportion complete (OPC) and the earned value(EV) of a software development project Earned value is a very important quantity that you shouldtrack during software development; yet, it seldom is because of a lack of knowledge about how to usethe applicable metrics. It measures the degree of project completion. The measured degree of a proj-ect or product completion is not the same as a measurement of labor or dollars expended to date; itis possible for you to expend more effort and resources with very little useful work (product develop-ment) to show for it. EV is a measure of the actual work that you have accomplished to date as distinctfrom the amount of effort spent to date.
EV is calculated from the more fundamental measure, the OPC. You calculate EV in terms of workcompleted units such as source statements (KSLOC or KESLOC) completed. The expenditure of ef-fort does not necessarily mean that you have accomplished any actual work in terms of product devel-oped (e.g., design completed or code written). The EV metric shows what actual work, i.e., the degreeof product completion, you have actually accomplished, and this metric is based on the degree of com-pletion of each of the activities in the development process. From this EV metric, it is relatively easyto show how much additional effort you will require to complete product development.
Estimating the degree of completion, i.e., the overall proportion complete, of a software developmentproject is difficult because many elements of the software products being developed are in differentactivities and have different degrees of completion, i.e., at any point during the development life cycle.Figure 11-1 illustrates the overlapping and very complex nature of the cumulative percent completeof software development activities. Measuring the overall degree of completion is sometimes doneby merely guessing or grossly estimating the percent complete of the software product without usingany detailed completion measurement data and without the aid of any quantitative methods. This sec-tion provides quantitative algorithms to accurately calculate the EV using detailed completion data.
The steps in computing OPC and EV are:
1. Characterize each activity in the development process by a labor rate in LM/KSLOC orequivalent units (e.g., LMISLOD for the detailed design activity). The enterprise at SEIprocess maturity level 3 or 4 should know its develcpment process(es) at least that well.
2. Determine the proportion of software, measured in SLOC or other designated measurementunits, that is through each activity. You may be able to obtain status data from a software statusreport. The proportion of software that is through activity i is defined as:
11-li
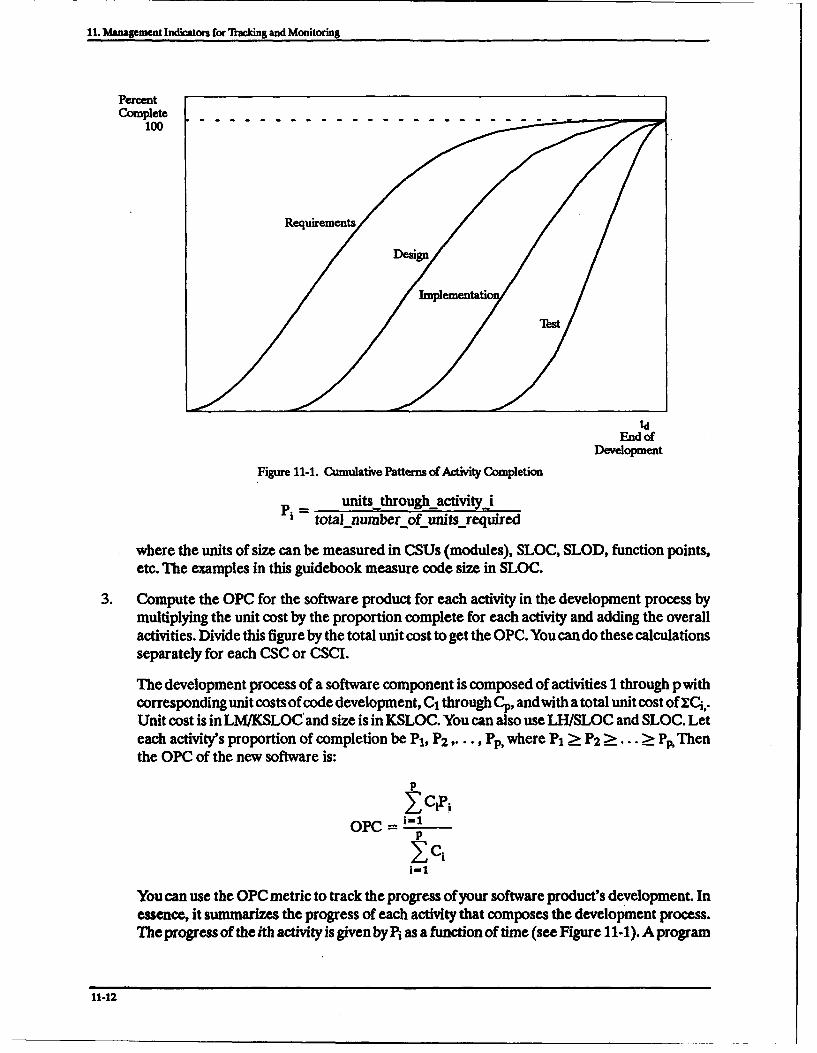
11. Management Indicators for Tracking and Monitoring
Percentconplete
100
Requirements
De.sig
ImPlernentat.
Test
tdEnd of
Development
Figure 11-1. Cumulative Patterns of Activity Completion
units through activity itotal number ofunitsjrequired
where the units of size can be measured in CSUs (modules), SLOC, SLOD, function points,etc. The examples in this guidebook measure code size in SLOC.
3. Compute the OPC for the software product for each activity in the development process bymultiplying the unit cost by the proportion complete for each activity and adding the overallactivities. Divide this figure by the total unit cost to get the OPC. You can do these calculationsseparately for each CSC or CSCI.
The development process of a software component is composed of activities I through p withcorresponding unit costs of code development, C1 through Cp, and with a total unit cost of Cij,.Unit cost is in LM/KSLOC'and size is in KSLOC. You can also use LHISLOC and SLOC. Leteach activity's proportion of completion be P1, P2 .... , Pp, where PI Ž P2 a--... -- P, Thenthe OPC of the new software is:
~PI
OPC = i-1
i-i
You can use the OPC metric to track the progress of your software product's development. Inessence, it summarizes the progress of each activity that composes the development process.The progress of the ith activity is given byPi as a function of time (see Figure 11-1). A program
11-12

11. Management Indicators for lrcking and Monitoring
manager could look at the OPC metric as a function of time and compare a plot of the OPCvalues over time with the software development plan. If the actual (overall) progress fell belowthe planned figure, the manager can look at of each of the individual activities (as illustratedin Figure 11-1) in the development process.
KESLOC (or ESLOC) = SN + w- SR
where SN and SR are in the appropriate units of KSLOC or ESLOC. Other size units, such asfunction or feature points, can be used in EV calculations where they meet user needs.
4. Multiply the OPC for each CSC or CSCI by the corresponding (estimate of) SLOC (or otherunit) to obtain the EV in terms of the designated measurement units such as LM or LH. Youcan add the EVs over all of the CSCs or CSCIs to obtain the total earned value.
EV = S • Ci •OPC
The units of the estimated size, S, used in the EV calculations is in terms of KESLOC or ESLOC. Theuser must choose which of these units is appropriate for his situation. KESLOC and ESLOC are usedhere because they are the general representations of size. If you calculate EV for a project that in-volves developing only new code, the units of size should be KSLOC or SLOC. But if you calculateEV for a project involving both new and reused code, use KESLOC or ESLOC.
As an example of the calculation and application of the EV metric, suppose that a software product(i.e., a CSCI) has a development process and present status, as described in iable 11-3. Assume that60 percent of the code (KESLOC) is through preliminary and detailed design, 45 percent of the codeis through code and CSU test, and 10 percent of the code is through CSC integration.This examplealso assumes that the software product size is not increasing- there is no code growth.
Table 11-3. Product Completion Indicator Calculation
ci PCI Activiy Complete (LMJKESLOC) (Proportion Through i)1 "A.limiuay design 0.52 0.600? )etailed design 0.82 0.6003 Code and CSU test 2.21 0.450
4 CSC integration test 0.74 0.100
s CSCI test 0.73 0.000Total 5.02
Using the previous formula, the OPC for new code is:
OPC = [0.52(0.60)+0.82(0.60)+2.21(0.45)+0.74(0.10)+0.73(0.0)]/5.02 = 1.8725/5.02 = 0.373
If, for example, there are 75 KESLOCs in the CSCI, the EV is:
EV = 75(5.02)(.373) = 140.4 LW
11-13
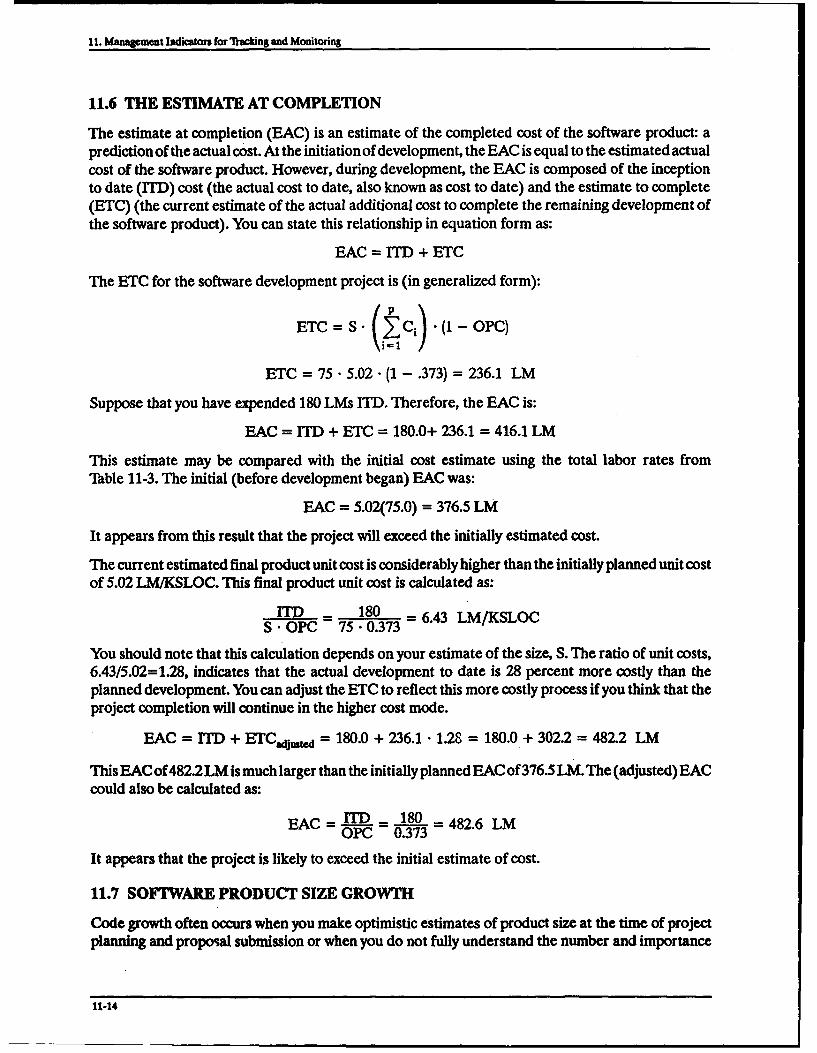
11. Management Indicators for "flacking and Monitoring
11.6 THE ESTIMATE AT COMPLETION
The estimate at completion (EAC) is an estimate of the completed cost of the software product: aprediction of the actual cost. At the initiation of development, the EAC is equal to the estimated actualcost of the software product. However, during development, the EAC is composed of the inceptionto date (ITD) cost (the actual cost to date, also known as cost to date) and the estimate to complete(ETC) (the current estimate of the actual additional cost to complete the remaining development ofthe software product). You can state this relationship in equation form as:
EAC = ITD + ETC
The ETC for the software development project is (in generalized form):
ETC=S (- Ci .(I-OPC)
ETC = 75 • 5.02 (1 - .373) = 236.1 LM
Suppose that you have expended 180 LMs lTD. Therefore, the EAC is:
EAC = 1TD + ETC = 180.0+ 236.1 = 416.1 LM
This estimate may be compared with the initial cost estimate using the total labor rates fromTable 11-3. The initial (before development began) EAC was:
EAC = 5.02(75.0) = 376.5 LM
It appears from this result that the project will exceed the initially estimated cost.
The current estimated final product unit cost is considerably higher than the initially planned unit costof 5.02 LM/KSLOC. This final product unit cost is calculated as:
ITD = 180 =6.43 LM/KSLOCS OPC 75 • 0.373
You should note that this calculation depends on your estimate of the size, S. The ratio of unit costs,6.43/5.02=1.28, indicates that the actual development to date is 28 percent more costly than theplanned development. You can adjust the ETC to reflect this more costly process if you think that theproject completion will continue in the higher cost mode.
EAC = 1TD + ETCadiuted = 180.0 + 236.1 • 1.28 = 180.0.+ 302.2 = 482.2 LM
This EACof 482.2LMis much larger than the initially planned EAC of 376.5 LM. The (adjusted) EACcould also be calculated as:
EAC = ITD 180 = 482.6 LMOPC 0.373It appears that the project is likely to exceed the initial estimate of cost.
11.7 SOFT7WARE PRODUCT SIZE GROWTH
Code growth often occurs when you make optimistic estimates of product size at the time of projectplanning and proposal submission or when you do not fully understand the number and importance
11-14
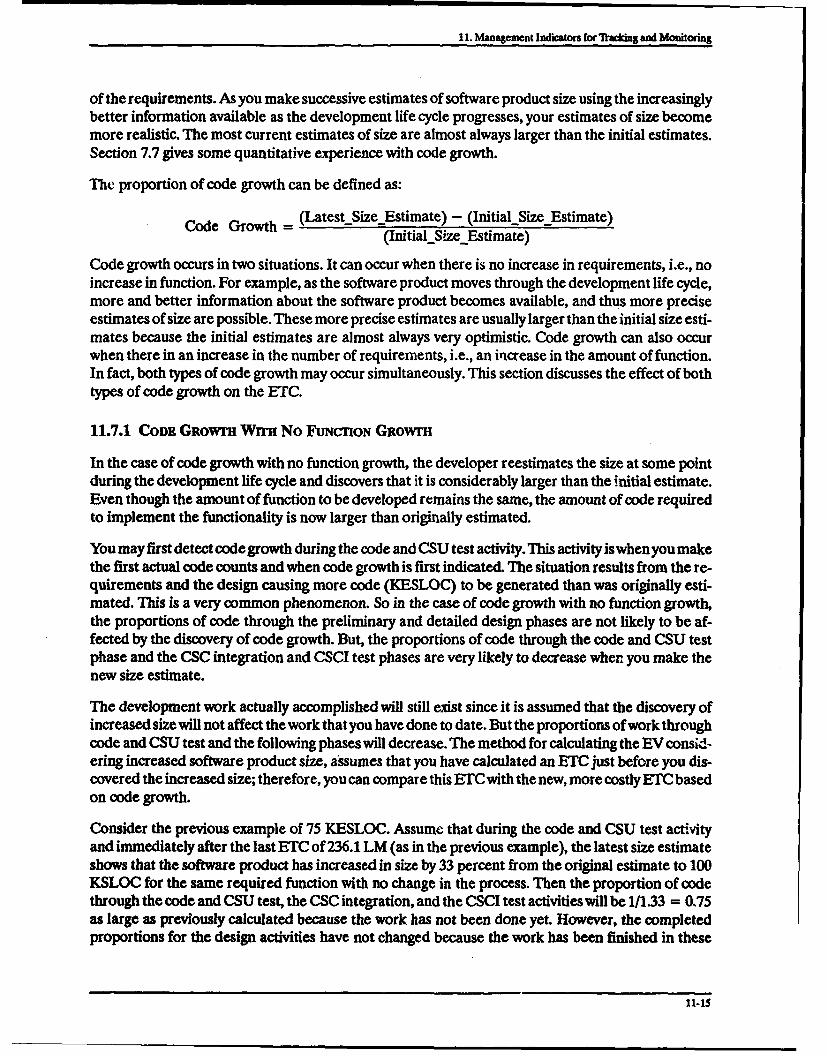
11. Management Indicators for'nacking and Monitorng
of the requirements. As you make successive estimates of software product size using the increasinglybetter information available as the development life cycle progresses, your estimates of size becomemore realistic. The most current estimates of size are almost always larger than the initial estimates.Section 7.7 gives some quantitative experience with code growth.
The proportion of code growth can be defined as:
Code Growth = (Latest Size Estimate) - (Initial Size Estimate)(Initial SizeEstimate)
Code growth occurs in two situations. It can occur when there is no increase in requirements, i.e., noincrease in function. For example, as the software product moves through the development life cycle,more and better information about the software product becomes available, and thus more preciseestimates of size are possible. These more precise estimates are usually larger than the initial size esti-mates because the initial estimates are almost always very optimistic. Code growth can also occurwhen there in an increase in the number of requirements, i.e., an increase in the amount of function.In fact, both types of code growth may occur simultaneously. This section discusses the effect of bothtypes of code growth on the ETC.
11.7.1 CoDE GRowm WrrH No FUNCnON GRowrH
In the case of code growth with no function growth, the developer reestimates the size at some pointduring the development life cycle and discovers that it is considerably larger than the initial estimate.Even though the amount of function to be developed remains the same, the amount of code requiredto implement the functionality is now larger than originally estimated.
You may first detect code growth during the code and CSU test activity. This activity is when you makethe first actual code counts and when code growth is first indicated. The situation results from the re-quirements and the design causing more code (KESLOC) to be generated than was originally esti-mated. This is a very common phenomenon. So in the case of code growth with no function growth,the proportions of code through the preliminary and detailed design phases are not likely to be af-fected by the discovery of code growth. But, the proportions of code through the code and CSU testphase and the CSC integration and CSCI test phases are very likely to decrease when you make thenew size estimate.
The development work actually accomplished will still exist since it is assumed that the discovery ofincreased size will not affect the work that you have done to date. But the proportions of work throughcode and CSU test and the following phases will decrease. The method for calculating the EV consid-ering increased software product size, assumes that you have calculated an ETC just before you dis-covered the increased size; therefore, you can compare this ETCwith the new, more costly ETC basedon code growth.
Consider the previous example of 75 KESLOC. Assume that during the code and CSU test activityand immediately after the last ETC of 236.1 LM (as in the previous example), the latest size estimateshows that the software product has increased in size by 33 percent from the original estimate to 100KSLOC for the same required function with no change in the process. Then the proportion of codethrough the code and CSU test, the CSC integration, and the CSCI test activities will be 1/1.33 = 0.75as large as previously calculated because the work has not been done yet. However, the completedproportions for the design activities have not changed because the work has been finished in these
11.15
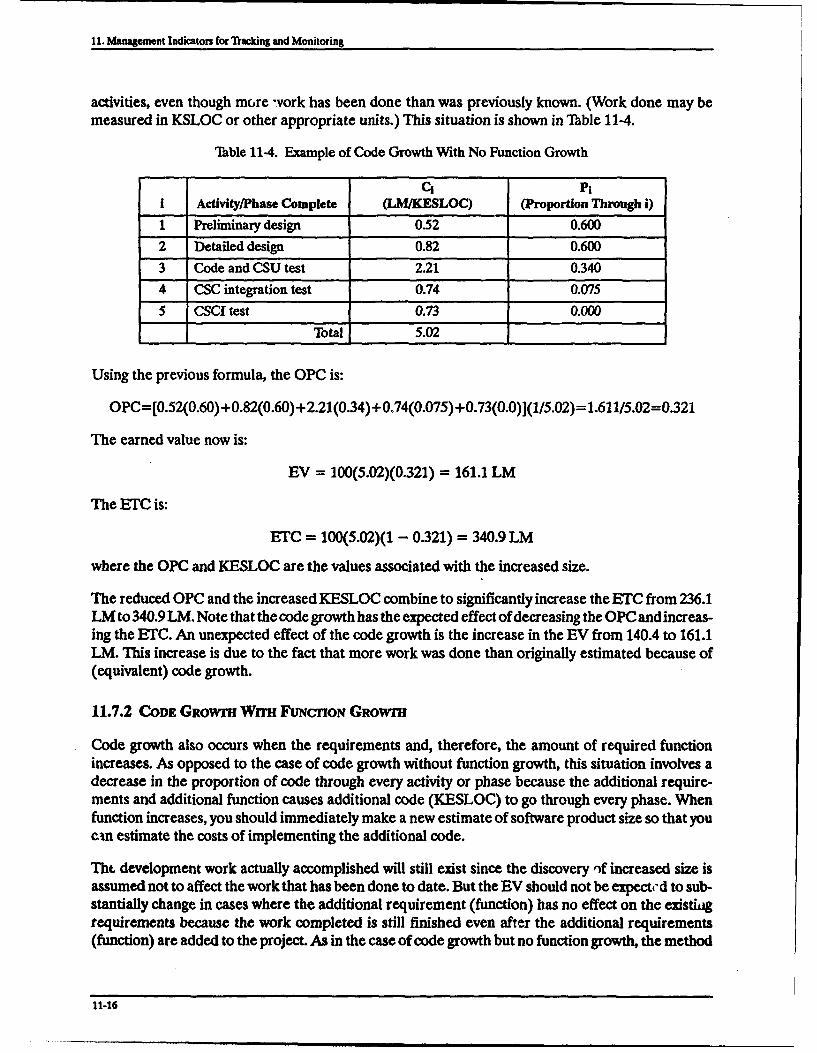
11. Management Indicators for *Racking and Monitoring
activities, even though more "vork has been done than was previously known. (Work done may bemeasured in KSLOC or other appropriate units.) This situation is shown in "hble 11-4.
Table 11-4. Example of Code Growth With No Function Growth
CQ P1i Activity/Phase Complete (LM/KESLOC) (Proportion Through i)
1 Preliminary design 0352 0.600
2 Detailed design 0.82 0.600
3 Code and CSU test 2.21 0.340
4 CSC integration test 0.74 0.075
5 CSCI test 0.73 0.000
Total 5.02
Using the previous formula, the OPC is:
OPC=[0.52(0.60)+0.82(0.60)+2.21(0.34)+ 0,74(0.075)+0.73(0.0)](1/5.02)= 1.611/5.02=0.321
The earned value now is:
EV = 100(5.02)(0.321) = 161.1 LM
The ETC is:
ETC = 100(5.02)(1 - 0.321) = 340.9 LM
where the OPC and KESLOC are the values associated with the increased size.
The reduced OPC and the increased KESLOC combine to significantly increase the ETC from 236.1LM to 340.9 LM. Note that the code growth has the expected effect of decreasing the OPC and increas-ing the ETC. An unexpected effect of the code growth is the increase in the EV from 140.4 to 161.1LM. This increase is due to the fact that more work was done than originally estimated because of(equivalent) code growth.
11.7.2 CODE GRowrfH WITH FuNcnoN GROWrH
Code growth also occurs when the requirements and, therefore, the amount of required functionincreases. As opposed to the case of code growth without function growth, this situation involves adecrease in the proportion of code through every activity or phase because the additional require-ments and additional function causes additional code (KESLOC) to go through every phase. Whenfunction increases, you should immediately make a new estimate of software product size so that youcin estimate the costs of implementing the additional code.
Tht. development work actually accomplished will still exist since the discovery of increased size isassumed not to affect the work that has been done to date. But the EV should not be expect, d to sub-stantially change in cases where the additional requirement (function) has no effect on the existiagrequirements because the work completed is still finished even after the additional requirements(function) are added to the project. As in the case of code growth but no function growth, the method
11-16
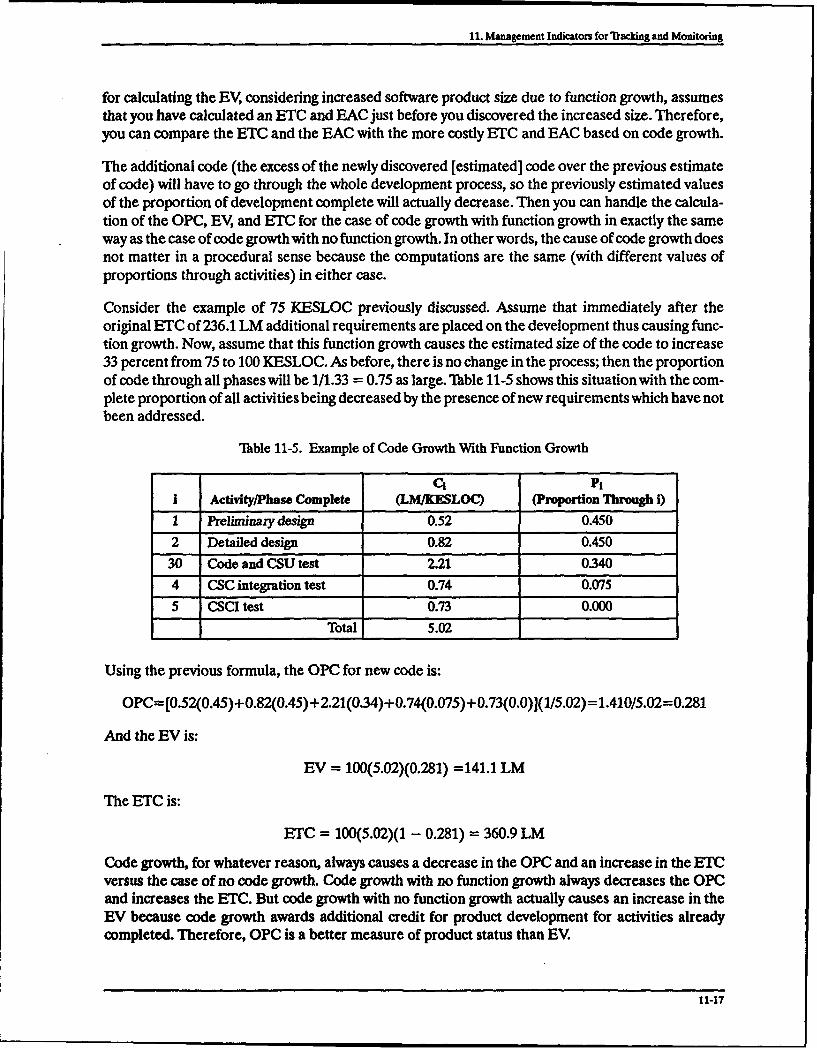
11. Management Indicators for Tracking and Monitoring
for calculating the EV, considering increased software product size due to function growth, assumesthat you have calculated an ETC and EAC just before you discovered the increased size. Therefore,you can compare the ETC and the EAC with the more costly ETC and EAC based on code growth.
The additional code (the excess of the newly discovered [estimated] code over the previous estimateof code) will have to go through the whole development process, so the previously estimated valuesof the proportion of development complete will actually decrease. Then you can handle the calcula-tion of the OPC, EV, and ETC for the case of code growth with function growth in exactly the sameway as the case of code growth with no function growth. In other words, the cause of code growth doesnot matter in a procedural sense because the computations are the same (with different values ofproportions through activities) in either case.
Consider the example of 75 KESLOC previously discussed. Assume that immediately after theoriginal ETC of 236.1 LM additional requirements are placed on the development thus causing func-tion growth. Now, assume that this function growth causes the estimated size of the code to increase33 percent from 75 to 100 KESLOC. As before, there is no change in the process; then the proportionof code through all phases will be 1/1.33 = 0.75 as large. Table 11-5 shows this situation with the com-plete proportion of all activities being decreased by the presence of new requirements which have notbeen addressed.
Table 11-5. Example of Code Growth With Function Growth
C, P,i Activity/Phase Complete (LM/KESLOC) (Proportion Through i)
1 Preliminary design 0.52 0.4502 Detailed design 0.82 0.450
30 Code and CSU test 2.21 0.3404 CSC integration test 0.74 0.0755 CSCI test 0.73 0.000
Total 5.02
Using the previous formula, the OPC for new code is:
OPC= [0.52(0.45)+0.82(0.45) +2.21(0.34)+0.74(0.075)+0.73(0.0)](1/5.02)= 1.410/5.02=0.281
And the EV is:
EV = 100(5.02)(0.281) =141.1 LM
The ETC is:
ETC = 100(5.02)(1 - 0.281) = 360.9 LM
Code growth, for whatever reason, always causes a decrease in the OPC and an increase in the ETCversus the case of no code growth. Code growth with no function growth always decreases the OPCand increases the ETC. But code growth with no function growth actually causes an increase in theEV because code growth awards additional credit for product development for activities alreadycompleted. Therefore, OPC is a better measure of product status than EV.
11-17

11. Management Indicators for Tlrcking and Monitoring
And code growth, if caused by function growth, has little effect on the EV. In the example above, thecode growth with function growth caused only a very small increase in the EV over the original nogrowth EV. The OPC metric gives more information about project status than the EV metric does. TheOPC metric is the prime indicator of status.
11.8 THE PROJECT STATUS ASSESSMENT
The implementation of tracking and monitoring procedures is really a continuous process of quantitativelyassessing the product and process; comparing those measurements and metrics with the quantitativegoals and limits set by the project plans; and taling corrective action when the performance falls out-side the preset limits or falls short of the preset goals. Figure 11-2 illustrates this monitoring andcontrol process as a flow chart.
Enter measurement program
projectmeasurementprogram
compare withplan
STake action wti
Figure 11-2. The Monitoring and Control Process
A typical series of the actions required to perform the project status assessment is presented here. Thisis not the only way to proceed, but it is an approach that has been successfully used in industry.
11.8.1 AcrvmEs FOR PROJECr STATUS ASSESSMENT
1. Collect the data:
a. Number and status of requirements.
b. Size and status of design. Tbtal number of design modules, number of SLOD, numberof design modules through preliminary design inspection (reviews) through PDR,number of design modules through detailed design inspection (reviews) throughCDR.
c. Size and status of software code: Total number of software modules and SLOC oWpttNumber of modules through code inspection.
d. Size and status of integration test. Number of software modules through CSC integrationtest, total number of integration test procedure steps, and number of integration testprocedure steps completed.
11-18

11. Management Indicators for Tacking and Monitoring
e. Size and status of system (CSCI) test. Number of software modules through CSCI system(product) test, total number of system test procedure steps, and number of system testprocedure steps completed.
f. Cost of project. All applicable cost accounts in the work breakdown structure (WBS).Collect budgeted LH or LM, actual LH or LM, and actual development computer dollars.
g. Quality. Number of defects discovered during design reviews and code inspectionscategorized by major and minor and type of error, and number of program troublereports (PTRs) by category.
h. Project cost and schedule status reports.
i. Project organization charts.
2. Analyze the data for each CSCI or software product:
a. Status of design. Calculate preliminary and detailed design percent complete usingCSUs, SLOD, or other available units.
b. Size and status of code and unit test. Calculate code percent complete using SLOC data.
c. Size and status of integration test. Calculate percent complete by module and/or anytest steps.
d. Size and status of system test. Calculate percent complete by module and/or by number oftest steps.
e. Cost of project. Summarize and total budgeted LH or LM and inception to date (ITD)LH or LM by activity and by CSCI and/or by CSC. Calculate the percent budget ex-pended. Calculate earned value (EV), estimate to complete (ETC), and estimate atcompletion (EAC). Compare EAC to budget for each software product.
f. Quality. Calculate defect density by development activity. Project defect densities to
product delivery. Compare with project objectives.
g. Calculate project stability, prductivity, and other appxpiate management indicators,
h. Calculate the project risks.
3. Prepare the Project Status Assessment Report
11.8.2 Tin PNoJrE STATUS ASSESSMENT REPowr
A project status assessment contains the measurements and management indicators that are vital tothe MDSM process. They must be made readily available to project management for use in basingproject control decisions. It is, therefore, absolutely necessary to present the results of the analysis inthe form of a highly communicative report. The following outline of a project status assessment reportis an approach to the task that has been used successfully in industry.
Objectie--Genmfd Discdon. State the general objective of the report: which is to provide astatus assessment, as of a certain date, of the size, cost, schedule and quality of the project.
11-19

11. Management Indicators for Macking and Monitoring
Other specific objectives are to provide the proportion of the work completed and a projection(estimate) of the cost to completion. An analysis of the product quality and projection(estimate) of the quality at delivery should also be provided.
Include a brief discussion of any unusual or extraordinary circumstances surrounding thisreport or the project. Stated that this is a scheduled assessment or if it is unscheduled thereason should be documented.
" Groundnues and Assumptions. A reference to the organization standards can be placed here.Reasons for collecting data that may not have been directly observable or according to standardshould be noted. Note any extraordinary procedures in the process, special support tools, or personnelthat affect the projections. Note any estimating models that require adjustment factors.
" Approach. You may state methods of data collection. Note whether the data was personallycollected by the analyst or provided by some automated mechanism or other project person-nel. Briefly discuss methods of analysis. Explain the calculation of metrics not directlymeasurable, such as productivity or reference a standard.
" Summary of StaussAssessment. This is the boiled down result of the project status assessment.It should include the project size, cost, schedule, and quality summaries. The summaries maybe tabular or graphical results only, do not include analytical information. Include risk expo-sure shown by the analysis in this section. The information can be presented in the context ofinformation from prior reports for comparison and progress indication.
" Recommembdatons.The project status assessment almost always uncovers certain facts that werenot apparent prior to the analysis. At times, there wil be indications of problems with the productor process. These problems may eist or may be of a potential nature. It is the analystes responsibilityto bring these perceived problems to the attention of management and, if possible, recommend acourse of action to avoid a potential risk or problem or mitigate an e stingone.
The measurement function should, once the analysis report is completed, show the softwareproject management and staff the results and to get their input. There may be some errors orundefined areas in the report that must be changed. The project personnel may or may notagree with the conclusions contained in the report. If the project disagrees, the measurementfunction should not necessarily feel that the results of the analysis must be changed. However,the project personnel should feel that the report is fair and accurate. Since they may have con-tributed data, they should see the results of the analysis. This communication is also a goodway for you to build support for the measurement function.
" Analyses. Analysis is the process of reducing the raw data to meaningful information in theform of management indicators. This section can contain the spreadsheets used to develop thedetailed listings of the organized data and the summaries of the derived information. This sec-tion shows the use of the estimating models and the projections developed from the models.All calculations are shown for derivation of the overall proportion completed and the estimateto complete and any other management indicators.
" Appendir. This section is not distributed with the report. It is only included for the benefit ofthe analyst. All the raw data is saved here.
11-20

11. Management Indicators for TMaking and Monitoring
11.8.3 Cosn AmD Scim)uL PFRmRMNCE RoRTING FOR TRACKING
Some organizations use different terminology in reporting cost and schedule for project tracking."Table 11-6 compares the cost and schedule terms used for many Department of Defense projects (Depart-ment of the Army, Communications-Electronics Command 1991) with those discussed in this guidebook. Anentry of 'none' indicates that the particular term was not discussed in the corresponding document.
Table 11-6. Comparison of Cost and Schedule Reporting Terms
Department of Defense Software Measurement Guidebook
Budget at completion (BAC) Budget (BUD)Actual cost of work performed (ACWP) Inception to date (ITD)Budgeted cost of work performed (BCWP) Earned value (EV)(none) Estimate to completion (ETC)Estimate at completion (EAC) Estimate at completion (EAC)
Budgeted cost of work scheduled (BCWS) (none)(none) Overall proportion complete (OPC)
"Table 11-7 shows the equivalent estimation formulas for cost and schedule status reporting for tracking soft-ware development projects given by the Department of Defense (Department of the Army, Commu-nications-Electronics Command 1991) and this guidebook.
Table 11-7. Equivalent Estimation Formulas
Department of Defense Software Measurement Guidebook
Budget at completion: BAC BUD=S (size) -EUC (estimated unit cost)
BCWP (submitted by reporting organization) EV=BUI-OPC
Cost performance index: CPI=BCWP/ACWP EV/ID(BAC-BCWP)/CPI ETCjA=(BUD-EV)(rrD/EV)=(1-OPC)(ITD/OPC)
EAC=ACWP+(BACBCWP)JCPII EACdj-=rrD+ECadj-ITDIOPCSchedule performance index SPI=BCWP/BCWS EV/BUD (to date)Current cost performance: BCWP-ACWP EV-ITDCurrent schedule performance: BCWP-BCWS EV-BUD (to date)Variance at completion: EAC-BAC EACadj-BUD
Several differences between the Department of Defense reporting system discussed here and themethods presented in this guidebook are:
"* BCWP is sometimes submitted by the reporting organization rather than computed during thetracking process as an EV.
"* The Department of Defense ETC computation includes a factor (1/CPI) that adjusts the ETC(and therefore the EAC) for cost performance to date.
The Department of the Army, Communications-Electronics Command (1991) gives an example ofstatus reporting using actual data and formats.
11-21
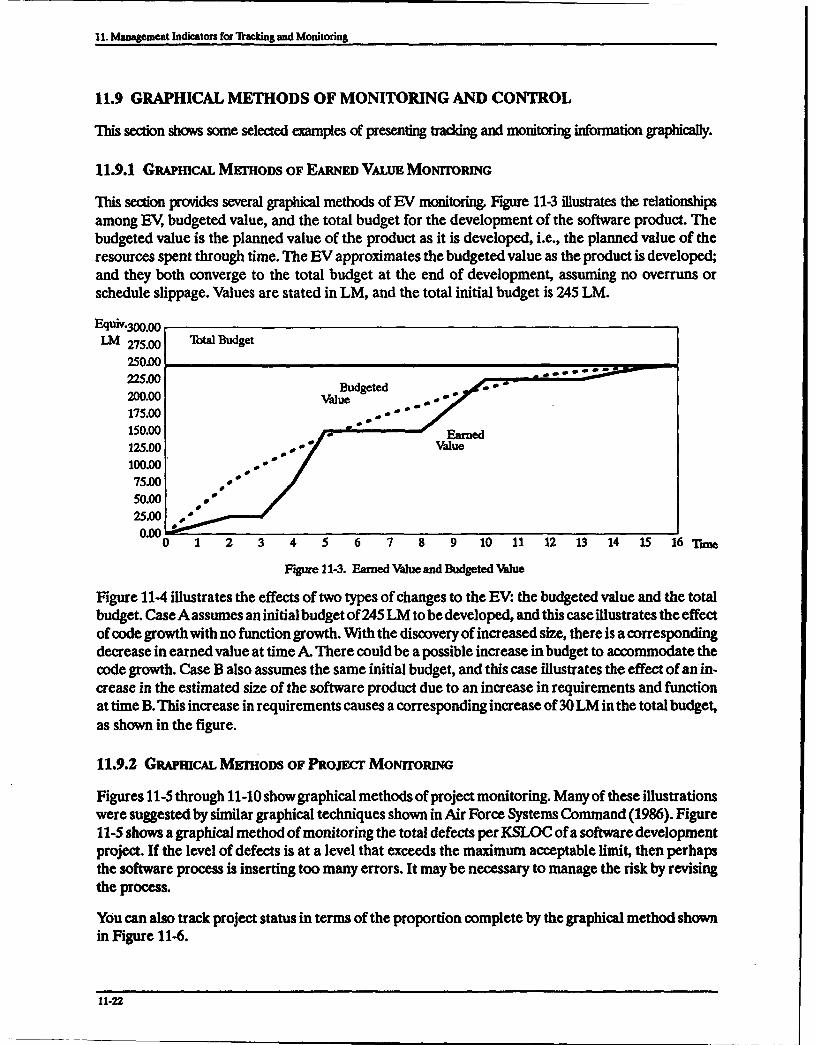
11. Management Indicators for Tracking and Monitoring
11.9 GRAPHICAL METHODS OF MONITORING AND CONTROL
This section shows some selected examples of presenting tracking and monitoring information graphically.
11.9.1 GRAPHiCAL METHODS OF EARNED VALU• MONITORING
This section provides several graphical methods of EV monitoring. Figure 11-3 illustrates the relationshipsamong EV, budgeted value, and the total budget for the development of the software product. Thebudgeted value is the planned value of the product as it is developed, i.e., the planned value of theresources spent through time. The EV approximates the budgeted value as the product is developed;and they both converge to the total budget at the end of development, assuming no overruns orschedule slippage. Values are stated in LM, and the total initial budget is 245 LM.
Equiv.30 0 .00
LM 275.00 Total Budget
250.0075.00 aBudgeted
**o"200.00 value
175.00150.00 Ea° ,
125.00 'P Value100.00 °75.00 ""
50.0025.000.00
0 1 2 3 4 5 6 7 8 9 10 11 12 13 14 15 16 Tum
Figure 11-3. Earned Value and Budgeted Value
Figure 11-4 illustrates the effects of two types of changes to the EV: the budgeted value and the totalbudget. Case A assumes an initial budget of 245 LM to be developed, and this case illustrates the effectof code growth with no function growth. With the discovery of increased size, there is a correspondingdecrease in earned value at time A. There could be a possible increase in budget to accommodate thecode growth. Case B also assumes the same initial budget, and this case illustrates the effect of an in-crease in the estimated size of the software product due to an increase in requirements and functionat time B. This increase in requirements causes a corresponding increase of 30 LM in the total budget,as shown in the figure.
11.9.2 GwqmcAL. MmODS OF PojEcr MoMORrIG
Figures 11-5 through 11-10 show graphical methods of project monitoring. Many of these illustrationswere suggested by similar graphical techniques shown in Air Force Systems Command (1986). Figure11-5 shows a graphical method of monitoring the total defects per KSLOC of a software developmentproject. If the level of defects is at a level that exceeds the maximum acceptable limit, then perhapsthe software process is inserting too many errors. It may be necessary to manage the risk by revisingthe process.
You can also track project status in terms of the proportion complete by the graphical method shownin Figure 11-6.
11-22
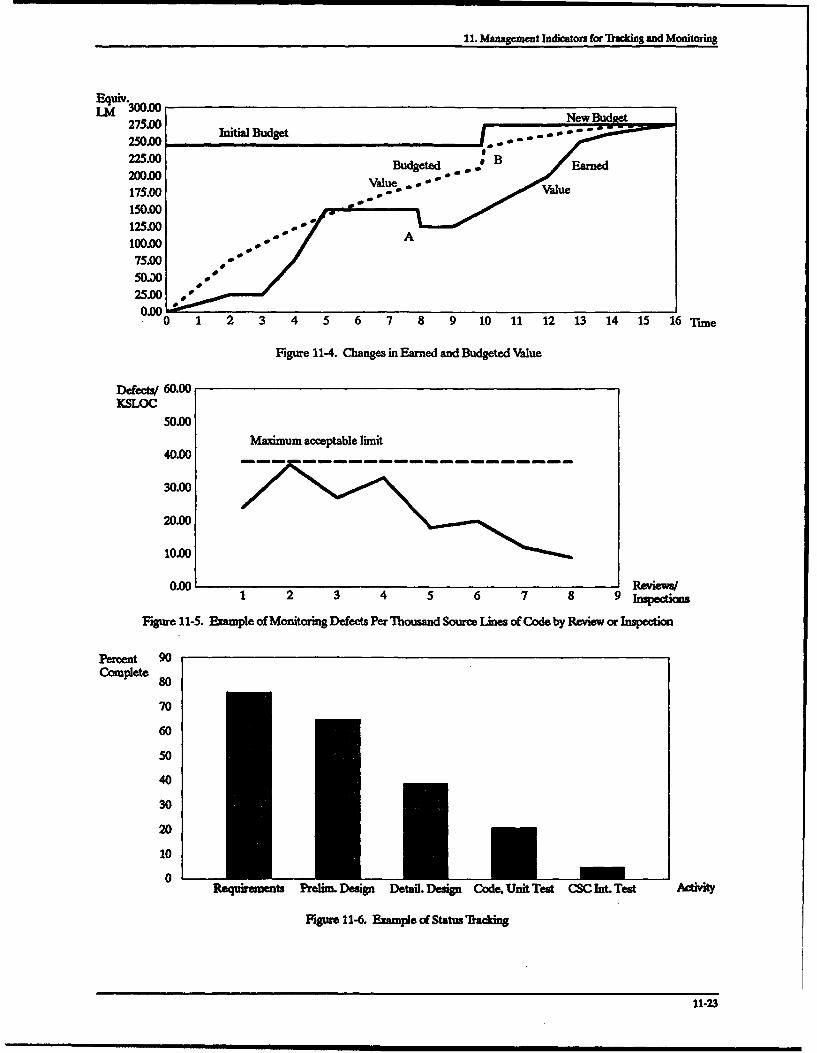
11. Management Indicators for Tkacking and Monitoring
Equiv.L 300.00Budt
275.00 ntsIBde250.00225.00BugtdBEre
200.00 Value .175.00 ,-o Value
150.00125.00100.00o "
70.00
0 1 2 3 4 5 6 7 8 9 10 11 12 13 14 15 16 Thre
Figure 11-4. Changes in Earned and Budgeted Value
Defects 60.00KSLOC
50.00
Maximum acceptable limit40.00
30.00
20.00
10.00
0.001 Reviews/1 2 3 4 5 6 7 8 9 Inpetions
Figure 11-5. Example of Monitoring Defects Per Thousand Source Lines of Code by Review or Inspection
Percent 90Complete
70
60
so
40
30
20
10
0Requirements Prelim. Design Detail. Design Code, Unit Test CSC Int. Test Activity
Figure 11-6. Fazmpie of Status 1addpg
11-23

11. Management Indicators for Ttacking and Monitoring
Figure 11-7 shows the pattern of the program trouble reports (PTRs) over time opened minus FTRsclosed metric. You should expect that at the early stages of testing the rate of PTR opening to be highand increasing and the rate of PTR closing to be low, lagging behind the rate of opening. At some pointin time, the rates will be equal and the process will peak. As the testing progresses, expect that the rateof opening will decrease and the rate of closing will increase until there are no more PTRs to service.
PMRs Opened 110.00MinusPIRs 100.00(3osed 9"0
90.00
80.00
70.00
60.00
50.00
40.00
30.00
20.00
10.00
0.00 __1 2 3 4 5 6 7 8 9 10 11 12 13 14 1516 Time
Figure 11-7. Problem Trouble Reports Opened Minus Problem Trouble Reports CQosed Over Tune
Figure 11-8 graphically shows a situation of new code growth together with the disappearance ofreused code (Carleton et al. 1992) in the planned software product. This causes cost growth over thedevelopment cycle due to the fact that more new code was developed than originally estimated.
KSLOC 360
320
280
240
210
120
80
40
0PropoGSa Cnact PDR CDR Plan I Plan 2 Plan 3
Planned Now KSLOC Delopment A
* Planned Reused KSLOC
Figure 11-8. Cost Growth-Disappearance of Reused Code
11-24

11. Management Indicators for Ttacking and Monitoring
Figure 11-9 shows the monitoring of a computer resources indicator where there are both upper andlower control limits.
% CPU Required Indication of Trouble
Planned ". , CnrlBn
Minimum -4Acceptable
Figure 11-9. Example of Computer Resource Monitoring and Control
Figure 11-10 graphically shows the distribution of engineering hours by development activity (Grady1992) for applications software. You compare this graph of your effort performance to date with theplanned distribution of effort in your software development plan.
*] Desgn
G Impoemtation
GTim
Applications
Figure 11-10. Percent engineering Hours by Development Activity
11.10 SUMMARY OF RECOMMENDATIONS
The recommendations on project tracking and monitoring presented in Section 11 are:
p Use the r QM paradigm to select indicator metrics.
* Define data collection methods and project tracking and monitoring procedures in your
software standards and policies.
11-25
11. Manapnment Indicators for racking and Monitoring
"* fRack the status of software development projects for your organization. Your organizationshould define procedures for deciding what projects are to be tracked.
"* Use the minimum data set for software project tracking.
"* Begin data collection for tracking at the earliest possible time, regardless of process maturitylevel.
" Feed back data to improve the process and the products.
11-26

12. EXPERIENCE DATABASES AND DATACOLLECTION
12.1 OVERVIEW
This section presents ways of collecting and organizing software development experience data to aidyou in achieving higher levels of performance and in making dependable plans for the future. It is im-portant that an organization preserves and learns from its software development experience. The ac-quisition of new business requires you to make accurate estimates of cost and schedule. Process im-provement is based on quantitative knowledge of process history; all of the activities of the softwaredevelopment process can be quantitatively characterized. Estimates of the future depend on past ex-perience characterized by performance measurement data. Experience data is vitally necessary to thesoftware development organization for higher performance levels of process improvement, projectcontrol, and product quality.
12.2 THE SOFTWARE EXPERIENCE DATABASE
Every organization concerned with software development should establish and maintain a softwareexperience database as a repository of its software development experience. This database shouldcontain the measurements, metrics, and other important information (such as product and develop-ment environment description) that can be used to support software project control and software pro-cess improvement, both short and long term. The establishment and maintenance of a software experi-ence database should be mandated by and supported at the highest organizational level since the datacollected and the metrics derived from that data will be used in the organization's business to formthe basis of software standards, estimate costs, evaluate product quality, and improve thedevelopment process.
Many projects and organizations will contribute information to the experience database. Softwaredevelopment, systems engineering, system test, quality engineering, measurement, cost engineering,finance, configuration management, product support (logistics), and project management are amongthe organizational functions that will contribute to the database and will benefit from the software in-formation it con tains. All of the organizations concerned with software development and/or mainte-nance should be familiar with the database. The experience database should not become the exclusiveproperty of the group that maintains it. All organizations should be encouraged to contribute to it andto use it.
You should use your software experience database both to preserve software measurement andmetrics information and to feed back the data about the organization's past performance to help:
* Improve the software development and support processes.
12-1
12. Experience Databases and Data Collection
"* Make cost and schedule more manageable.
"* Control development projects.
"* Manage risk.
"* Improve software quality.
"• Develop productivity guidelines.
"* Determine size and unit costs of software.
"* Develop and refine estimation models.
"* Raise process maturity levels.
"• Develop and refine software standards.
"* Improve the planning and proposal processes.
A software experience database is an important component of the management-driven softwaremanagement process. It is a powerful tool for improving organizational performance, and everyorganization concerned with software development should establish such a database.
12.3 DATA SET DEFNITION
Part of the planning for your organization's experience database is to define the set of measurementdata elements of interest to users. This section provides reference to several sources for these dataelements.
12.3.1 DATASErs A-mw Nocms Ma r LEV-
Humphrey and Sweet (1987) present a set of data items thatyou should collect and analyze to improveand optimize your software development process. Humphrey and Sweet discuss this set in the contextof achieving process maturity levels 2 through 5. The set of data items identified overlaps the set ofindicators presented in Section 11. Section 3 correlates the process maturity level data item require-ments with the indicators listed in Section 11 and with the methods presented in Sections 5 through 10.
In its methodology for the assessment of software engineering capability, SEI has inferred a set of dataitems that you collect and analyze to improve and optimize your software development process. Al-though the SEI has not specified an explicit set of data items, it discusses the inferred set in the contextof achieving process maturity levels 2 through 5. Many of the set of data i tems overlap the set of indica-tors presented in this guidebook, and most of the common data items are associated with achievingprocess maturity level 2 or 3.
You should begin data collection as soon as you decide to establish a metrics program. At processmaturity levels 1 and 2, your organization will at first concentrate on collecting software product costand size data, as you can immediately apply this data to better control your project and process. Atprocess maturity levels 3 and 4, your organization will add product data such as quality data that canhelp you characterize both process and product (see Section 10).
12-

12. Fxperience Databases and Data Collection
123.2 DATABASE MANAGEMEN SySmms
A database, under control of a database management system (DBMS), is the conventional mode ofdata storage. Emerging measurement organizations may elect to begin their data storage graduallywith a microcomputer application, or the decision may be made to permanently maintain the databaseon a microcomputer. An advantage of this system is that diskettes containing the database can be easi-ly copied on many microcomputers throughout the organization. Such an arrangement allows a widerange of the staff to become familiar with the database.
Where the resources are available, a networked workstation or a mainframe DBMS may be selected.Any of the alternatives is acceptable. A small DBMS on a microcomputer can handle up to a billionrecords. Most development organization collections will not exceed a few thousand records per year.The mainframe, on the other hand, usually offers the advantage of centralized maintenance andcontrol and wide access.
The DBMS will manipulate the data in the database but the database structure has to serve theorganization's development projects. These organizations, as well as the measurement function,should have an influence on the structure and contents of the database. Assuming the measurementsto be stored have been selected, they should be organized according to database theory into entities,relationships and attributes in the form of a data model. The model should be normalized to third nor-mal form to prevent excessive use of storage space and loss of integrity through data redundancy. Alsoease of information retrieval will be enhanced. Even if database implementation requires outsideconsultation, the recommendation stands, for its acquisition as a worthwhile investment.
12.4 MEASUREMENTS AND METRICS DATA COLLECTION
You need to use measurement data to support the software development process. This sectiondescribes several approaches to the collection of that data.
12.4.1 DEFiNiON
Data collection (for any purpose) may be defined as the activities of locating, gathering, organizing,and archiving information at a level consistent with the intent of the measurement goal which it is de-signed (or selected) to satisfy. In other words, you collect data at the highest organizational level con-sistent with the goal it satisfies. This definition means that you do not collect metrics data, for example,on a software development effort from individual time cards. Instead, you collect effort data from ac-counting records which conglomerate effort data in labor months or labor hours at the appropriateprocess or product level. In addition, you do not collect the size of aCSCI by visually counting individu-al source statements but by getting the overall count from the code counting facility built into the soft-ware development environment. The capacity to automatically count code should be one of the capa-bilities of the software development environment and should be used by the organization'sconfiguration management organization.
12.4.2 ORGANIZATION AND Acrivrnps
The data collection activity involves a "hands-on" approach. The organization with software metricsdata collection responsibility, regardless of how many are involved in data collection, should not sendout forms and expect to receive data with any degree of reliability. If the forms are filled out at all,
12-3

12. Eperienwe Databases and Data Collection
the data will probably be incomplete, inaccurate, and biased toward making the project performancelook good. Often, project personnel will provide "actuals" that are not actual and that reflect projectperformance objectives rather than actual cost, schedule, and quality accomplishments. Therefore,you need to personally assure yourself that the data you have acquired has, in fact, been properly col-lected. The organization that has the responsibility for the software experience database, which in allprobability is the metrics or measurement function, must collect actual performance data at the endof the project by personally reviewing project and accounting records. You should keep in mind thatit is difficult to collect actuals at the end of the project if the project has not been tracked during theproject execution. Both the tracking of ongoing projects and the collection of actual project perform-ance metrics data are measurement activities, regardless of what organizational function actually per-forms them. In all probability, it will be the measurement function, but it may be software develop-ment, systems engineering, or some other functional organization. In fact, the measurement functionmay be part of these organizations.
You should collect the metrics data in real time, i.e., at the planned time during the project andimmediately upon completion of the project. It is a mistake to try to reconstruct measurement afterthe fact when the project records are gone. Also, it is very difficult to collect the proper metrics dataat the end of a project if the metrics group has not been trn cking the project all the way through. Thetracking and monitoring effort provides the metrics group with a basic familiarity of the processes, products,and problems of the development project, and it thus enables efficient and precise data collection.
The group with the data collection responsibility should take pains to reassure project personnel, bothtechnical and management, that they are collecting the data to determine status and anticipate prob-lems, not to evaluate personnel performance. They should reassure, whenever necessary, project per-sonnel that the data does affect their performance appraisals. lb reinforce this statement, do not labelthe data with the names of any project personnel. Project personnel should be made to feel that theyare participating in process and project improvement.
Most software development environments include a code counting ability. You should use this abilityto count source statements. You should count both logical and physical lines. Count all source state-ments, not just executable, and count comments separately from the source statements. Section 6discusses code counting in more detail.
The software organization, together with the accounting organization, should establish a policy thatfor each software development project, the WBS must reflect the software product and process. Thereshould be a separate cost account for every development activity, and development activities shouldbe at least at the DOD-STD-2167A levels of preliminary design, detailed design, code and unit test,CSC integration test, and CSCI test. You should use additional activities and a more detailed break-down if possible. The activity cost accounts should tier up to the total cost account for the correspond-ing CSCI (or software product if there is only one CSCI). There should be a separate tiering structurefor every CSCI. Such a WBS makes the collection of cost data efficient and precise, and it makes costdata collection much easier and provides very accurate cost and effort information.
12.5 DATA SOURCES
An organization developing complex systems will have many information sources that it can utilizefor software development tracking. Table 12-1 shows some metrics data and their probable sources.
12-4

12. Experience Databases and Data Coflection
Table 12-1. Data Sources
MeasurementCategory Indicator Group Organization Data Sources
Size Current estimate or Software development 1. Software development plancount of size (library) or
configuration 2. Count from programmingmanagement environment or CASE tool
3. Configuration managementreports
4. Software library
Cost Cost Finance Accounting reports
Schedule Elapsed time Software development Software development plan
Stability Engineering change Systems engineering 1. ECP status reportproposals (ECPs) (change control) or
project management 2. Program management reports
Stability Undefined requirements System engineering 1. Requirements analysis reportsSatisfied requirem ents (change co ntrol)2 . R q i e nt tr c a l ty m r x
____________2. Requirements traceability matrix
Stability Software action items Software development Software status report(SAls)
Stability Project staffing Software development Software status report
Status Software progress Software development Software status report
Quality Current and predicted Software quality 1. Software quality plandefects (reviews and engineering (assurance)inspections) 2.. Software quality status report
Quality Program trouble reports Software quality PTR status report(FTRs) engineering or system
test
Earned value Overall Proportion Software development Software status reportComplete (OPC) orEarned Value (EV)
Computer Computer resources Software development Software and system developmentresources or system engineering I plans
12.6 WORK BREAKDOWN STRUCTURES
Figure 12-1 shows an example of a partial WBS for software as a subsystem, i.e., an organization forfinancial reporting in which the various major (developmental) hardware components and the variousmajor (developmental) software components each have their own tiering structure (Department ofDefense 1991b). The system or platform is at level 1, the highest level of the tiering stricture and thelevel which contains the cost account(s) for total (developmental) costs. Major subsystems are at level2, and major components of the subsystems are at level 3. The level 2 WBS in Figure 12-1 shows astructure for application software. The level 2 structure could also show a structure for system soft-ware (e.g., executive or operating systems) or support software (logistics software, test scenarios,diagnostics, etc.).
12-5

12. Exprience Databases and Data Collection
system Level I
Application System Hardware/oftware systemSoftware Software Component Engineering
I I CSTs Pasi ICSCI CSIN BuildSoftware SoftaLirc Ca, Level 3
Requiremnts Peimnr Dtie Code and Cnegato CSCI Test Level 4
Analysis Design Design CSU Test Tea v
P Manals, rrorLevel 5
Figure 12-1. Work Breakdown Structure for Software as a Subsystem
Often the software and systems engineering organizations will work in tandem on the same system orsubsystem. The software organization may have the software development responsibility from (soft-ware) design through CSC integration test as level 4 activities. The software organization may have(as usual) responsibility for user documentation such as user and operator manuals and version de-scription documents. The software organization may also have the responsibility for doing softwarebuilds (often called configuration management) for software system test and for maintaining the li-brary of software components; but in the WBS in Figure 12-1, the systems engineering (test) organiza-tion has this responsibility. The systems engineering organization may have the requirements analysisresponsibility and the test planning responsibility for both the developmental hardware (if any) andsoftware as level 4 activities. In addition, the systems engineering organization may have the systemtest responsibility (CSCI test) as shown in the partial WBS example in Figure 12-1.
The systems engineering CSCI testing (software system testing) is an independent (from software)test organization that finds defects in the software. These defects will cause code rework and perhapsdesign rework. Not only should these rework activities have separate cost accounts, but the cost of eachiteration through design or code for rework should be recorded within those cost accounts. Retest costor effort in CSC integration testing can be recorded as part of the code rework cost account. The costor effort data for each rework iteration will prove valuable in estimating the effectiveness of riskmanagement efforts.
Figure 12-2 shows an alternative WBS with software as a subcomponent. In this structure, costs aregathered by component; and the hardware, software, and systems engineering is by component. Allof the cost accounts are one level lower than in the previous WBS because the structure tiers up toa subsystem rather than a system. It is very important that the WBS provide "slots" for all of theactivities for which you wish to collect labor and other cost data.
12-4

12. Experience Databases and Data Collection
Subsystem Level 2
1"
Component Component BLevel 3
H~a N SCI NTest Plans,Hardware$•ton Cases, Level 4
SatwarelProcedures
RequirementsI Preliminay Detailed Code and CSCAnalysis esign Design CSU Test Itegration CSCI Test Level 5
Test
Figure 12-2. Work Breakdown Structure for Software as a Subcomponent
12.7 METRICS FOR MANAGING SOFTWARE SUBCONTRACTORS
A contractor needs to require the same size, cost, schedule, and quality measurements and metricsfrom the software subcontractor as he requires from his own software development projects. He needsto collect experience data at the completion of the contract at least to the extent of the minimum expe-rience data set. But since the contractor, in most cases, will not have access to the subcontractor's datasources, it will be necessary to get the subcontractor to report the data. This situation means that thecontractor must validate the reported data to a considerable extent. But if he has required data reportsfrom the subcontractor at planned intervals during the contract execution, validation of the final ac-tuals should be fairly straightforward. Note that it is necessary to make all software data reportingrequirements a part of the subcontract.
The requirement that the subcontractor report software metrics data during the contract executionshould be recognized as very important. The subcontractor should also report tracking and monitoringdata at least to the extent of the minimum data set for tracking and monitoring. The contractor shouldalways monitor software subcontractors; and he should plan to assign managerial, technical, andfinancial personnel to this monitoring function.
The contractor should apply the same (or equivalent) software standards to the subcontractor thatgovern the contractor. The subcontractor WBS should be to the same level of detail that the contractormust use.
Often the subcontractor will report effort expended in terms of dollars and notLM orLH. This formatoften appears in the monthly bill that the subcontractor submits. The contractor will need to get an
12-7

12. Experience Dataases and Data Collection
overall (for the contract) average dollarsILM or dollars/LH metric from the subcontractor so that hecan convert this information to LM or LH.
12.8 DATA VALIDATION
Collected data is not necessarily validated data. It is quite possible that development projectpersonnel can record or transmit inaccurate or otherwise "wrong" data to the measurements/metricsfunction. It is also possible that the measurement group (i.e., the data collection agency) will misun-derstand the information they are given and will again record "wrong" data. So, it is always necessaryto validate or test the data for accuracy before you use it in an analysis (Basili and Weiss 1984).
One method to validate data is to use a general reasonableness check approach. For example, if thereported total cost of a software development project is 430 LM and you have observed approximately20 developers working for 20 months (400 LM), then the observed and reported effort are reasonablyclose; within 20 to 25 percent of each other will satisfy the test. Or if you are told that the overall devel-opment labor rate is 5.125 LM/KSLOC and your investigation reveals that 125 LM was used to devel-op a (counted) 50 KSLOC (2.500 LM/KSLOC), then the reported and observed values are far apart.
You can test size and schedule measureables in similar ways. For example, if it is reported that the sizeof a delivered software product is 142.8 KSLOC and investigation reveals that similar products havebeen at least 210 KSLOC, then additional investigation is required. Perhaps the code was counted byvery different methods for the product in question, or (and more likely) some program units wereinadvertently excluded from the latest product size count.
Another method of validating cost or effort data is to use the top-down estimation methods discussedin Section 6.7 to check the cost or effort allocation that is reported. For example, suppose that a projectinvolves software development but no hardware development, and suppose you find in accounting re-cords that the total cost of software development was 100 LM and that the cost of product logisticalsupport was 50 LM. Section 6 suggests that the ratio of software development to logistical supportshould be about 5 to 1, certainly not 2 to 1 as in this scenario with software development but no hard-ware development. Thoroughly investigate this discrepancy. There may be reasons for the highproduct support cost, which you should record.
You should also validate the metrics data collected to ensure that it really accomplishes the purposethat it was designed to accomplish. Use the GQM paradigm to select the metric. Metrics thus selectedshould fulfill that purpose since the GQM paradigm forces the metric to correspond to a specificproject goal. The GQM paradigm is itself a method for validating metrics data.
Data validation is based on experience tempered by common sense. It frequently involves using datafrom various sources and comparing them, or it may involve checking the reported data against somestandard or rule of thumb. You can validate data for reasonableness without much trouble, but it isvery difficult to establish the precision of reported data.
12.9 SUMMARY OF RECOMMENDATIONS
The recommendations on data collection and validation presented in this section are:
* Begin data collection as soon as you institute a measurements program, regardless of processmaturity level.
12-8

12. Eq)erience Databases and Data Colection
" Collect at least the minimum data set (or the equivalent as defined by your organization).
" Management, with the help of the metrics group, should define the measurements data to becollected. You should use the GQM paradigm to help select metrics.
"* The software standards and policies should define the data collection methods, indicatorconstruction, metrics definition, and project monitoring procedures.
" Data should be fed back to those responsible for improving the process and the products itproduces.
" The metrics group should collect experience data (actuals) at the end of each softwaredevelopment project.
" The metrics group should maintain a software experience database.
" The software project WBS should gather cost data down to the level of development activitieswithin each CSCI.
" Establish a software experience database to aid in deriving software metrics and estimating.This database should contain the "actuals" (actual costs, counted sizes, etc.) from the processand product aspects of the project collected upon completion of the project.
" Save metrics for use in process improvement, for increasing product quality, and for refiningstandards and estimating algorithms.
" Encourage project personnel to feel that, in contributing data, they are part of processimprovement. Reassure them that they are not being audited.
" Record LM or LH as well as dollars for cost performance. LM and LH should includeovertime, even if unpaid.
" Establish separate WBS cost accounts for each CSCI. Establish separate CSCI-specific costaccounts for each development activity that tier up to each total CSCI cost account.
12-9

12. Experiesm Dautbam and Data Coectio
This page intentionally left blank
12-10

LIST OF ABBREVIATIONS AND ACRONYMS
AAF Application adjustment factor
ADSI Number of delivered source instructions
CASE Computer-aided software engineering
CDR Critical design review
CM Configuration management
CMM Capability maturity model
COCOMO Constructive Cost Model
COPMO Cooperative Programming Model
COTS Commercial off-the-shelf
CPU Central processing unit
CSC Computer software component
OSCI Computer software configuration item
CSU Computer software unit
DBMS Database management system
DM Data management
EAC Estimate at completion
ECP Engineering change proposal
EDSI Equivalent delivered source instructions
ESLOC (Cost) equivalent to new source lines of code
ETC Estimate to complete
ETVX Entry-task-verification-exit
EV Earned value
AWb-

List of Abbtvatjm and ktnym
FQT Final qualification test
GFE Gyernment-furnished equipment
GQM Goal-question-metric
HIPO Hierarchical input-process-output
HOL Higher order language
HW Hardware
HWCI Hardware configuration item
IDD Interface design document
I/O Input/output
IRS Interface requirements specification
1TD Inception to date
KDSI Thousand delivered source instructions
KESLOC Thousand equivalent source lines of code
KSLOC Thousand source lines of code
LH Labor hours
LM Labor months
LSS Logical source statement
MDSM Measurement-driven software management
MFG Manufacturing
mips Millions of instructions per second
MIS Management information system
MODP Modern programming practices
MTBF Mean time between failure
MTIR Mean time to repair
OPC Overall proportion complete
PDL Program design language
Ahb-2

list of Abbrcviatiom and Acroaynm
PDR Preliminary design review
PSS Physical source statement
FPR Program trouble report
QA Quality assurance
SAI Software action item
SDD Software design document
SDP Software development plan
SE Systems engineering
SEI Software Engineering Institute
SEPG Software engineering process group
SLOC Source line(s) of code (also known as source statement)
SLOD Source line(s) of design
SPC Statistical process control
SQA Software quality assurance
SQF Software quality factors
SRR Software requirements review
SRS Software requirements specification
SSS System/segment specification
STD Software test description
STP Software test plan
SUM Software users manual
SW Software
TDEV Development time in months
TE Tbst and evaluation
TLH Total labor hours
TLM Tbtal labor months
Abb-3

List of Abbreviations and Acronyms
VDD Version description document
WBS Work breakdown structure
Ab"m| |

REFERENCES
Air Force Systems Command Software Management Indicatorm AFSCP 800-43. VWshington, D.C-1986 U.S. Air Force Systems Command.
Albrecht, AJ. Measuring Application Development Productivity. App/ication1979 Development SYMpoSium Proceedings, GUIDE and SHARE
IntenationaL Monterey, California.
Albrecht, AJ., and Software Function, Source Lines of Code, Development EffortJ.E. Gaffney, Jr. Prediction: A Software Science Validation. IEEE 7hnsactions on1983 Software Engineering SE-9.
Army Materiel Command Software Management Indicators, AMC-P 70-13. Aleatndria,1987 Virginia: US. Army Materiel Command.
Bailey, E.K. A Fiamework for Ewd dngAPSDE Usabilit Alexandria, Vrginia:1984 Institute for Defense Analysis.
Balda, D.M., and Cost Estimation Models for the Reuse and Prototype SoftwareD.A. Gustafson Development Uife-Cydes. ACM Sigsoft Software Engineern Notes1990 15, 3:1-1&
Barker, T.B. Engineering Quality by Desin Interpreting the Taguchi Method New1990 York, New York: Marcel Dekker.
Basili, V.R., and D.M. Weiss A Methodology for Collecting Valid Software Engineering Data.
1984 IEEE Transactions on Software Engineerng SE-10, 6.
Baumert, J.H. and Software Measures and the Capability Maturity Model,M.S. McWhinney CMU/SEI-92-TR-25. Pittsburgh, Pennsylvania: Software1992 Engineering Institute.
Boehm, B.W Charactenic of Software Quahlit New York, New York: North1978 Holland.
1981 Software Engineering Economics Englewood liffs, New Jersey.Prentice-Hall.
1983 Software Cost Estimation: Outstanding Research Issues, Workshopon Software Cost Engineering. Bedford, Massachusetts: MITRECorporation.
Ref-I
References
1987 Rapid Prototypiog. Risk Management, 2167, and the Ada ProcessModel. Proceedings of the Eleoic Industries Association 1987G-331G-34 Workshop. Washington, D.C.
1988 A Spiral Model of Software Development and Enhancement. IEEEComputer.
Bowen, TT, G.B. Wigle, SPECIFICATION OF SOFIWARE QUAL17Y ATTRIBUTES:and J.T. Mbai Software Quality Specification Guidebook, RADCLTR-85-37. Rome,1985 New York: Rome Air Development Center.
Britcher, R.N., and Reliable Size Estimates for Software Systems Dexomposed as StateJ.E. Gaffney, Jr. Machines. Proceedings of COMPSAC 1985, IEEE Catalog1985 No. 85CH2221-0. Chicago, Illinois.
Brown, D. Productivity Measurement Using Fucton Points. Software1990 Engineerng.
Campbell, G.H., S.R.Faulk, Introduction to Synthesis. Version 01.00.01 INEROSYNTHESIS_and D.M. Weiss PROCESS-90047-N. Hemdon, Virginia: Software Productivity1990 Consortium.
Carleton, A.D. et al. Software Measurement For DoD Systems Recommendatio For1992 Initia Core Measures, CMU/SEI-92-TR. 19. Pittsburgh, Pennsylvania:
Software Engineering Institute.
Cherng, J.G., A. Fathy, Improvement of Sound Measurement Procedures Using the Mgudiand E. Lumsdaine Method. Proceedings of the Seventh Symposium on Tuchi Method&1989 American Supplier Institute.
Cho, CK. Quality Programming. Developing and Testing Software With1987 Statistical Quality ControL New York, New York: Wiley.
Christensen, K., G.1 Fitsos, A Perspective on Software Science. IBM .Sytems Journal 20,and C.P. Smith 4.372-387.1981
Chruscicki, AJ. Software Qualiy Technolog, Consortium Status Repora Rome, New1992a Yorkc United States Air Force Rome Laboratory.
1992b Personal communiatio
Conte, S.D., H.E. Dunsmore, Software Engineering Metrics and Models Menlo Park, California:and V.Y. Shen Benjamin,Cummings,1986
Crosby, RB. Quality Is lic. New York, New Yoric Mentor.1979
Ref-2

______________________________________Refercenes
Cruickshank, R.D. Cost Relationships in Simulator Software Development Summer1984 Computer Smulation Conference Boston, Massachusetts.
1985 Code Growth Factors for Software Development, SSCE 85-0138.Manassas, Virginia: IBM Federal Systems Division.
1988 A Course in System and Software Cost Engineering. Manassas,Virgnia. IBM Federal Systems Division.
Cruickshank, R.D., and Software Design Coupling and Strength Metrics. NASA AnnuaJ.E. Gaffney, Jr. Software Engineerng Workshop. Greenbelt, myland. National1980 Aeronautics and Space Administration, Goddard Space Flight
Center.
1991a The Economics of Software Reuse, SPC-91128-MC. Herndon,Virginia: Software Productivity Consortium.
1991b An Economics Model of Software Reuse, Conference on Ana4ticalMehods in Software Engineenng Econmic& McLean, Vrginia:MuRE Corp
1992 A Software Cost Model of Reuse Within a Single System, Conferenceon Ana:46c Methods in Sftware EngeneMg Economics Md.xan,Virginia: MIR Corp.
Cruickshank, RD., and An Approach to Estimating and Controlling Software DevelopmntM. Lesser Costs. The Economics of Data Pnxesung. New York, New York:1982 Wiley.
DeMarco, T. Controiling Software Projects. Engltewod Cliffs, New Jersey:1982 Yourdon Press.
Department of the Army Ereauw Management Software Mevics GudebodACommunications-Electronics SPS-EMSM-00391. Ft Monmouth, New Jersey: U.S. ArmyCommand Communications-Electronics Command.1991
Department of Defense Thchnica Re*w and Audits for Sysems Reqidrments, and1985 Computer Prgrfams, DOD-SIT-1521B. Washington, D.C.:
Department of Defense.
1988 Defense S)Wae Software Devewopment DOD-SID-2167A.Washington, D.C.: Department of Defense.
1991a Department of Defense Insuction 5000.2Washington D.C:Department of Defense.
Ref-3
Refere•n•s
1991b Work Breakdown Struture for Software Elements,MIL-HDBK-WBS.SW (1 October Draft). Washington, D.C:Department of Defense.
1992 Software Quality hgrWa, MIL-SID-2168A (Draft). Washington,D.C.: Department of Defense.
Department of Thansportation Software Quaity Metrics, DOT/FAA/CT-91/1. Atlantic City, NewFederal Aviation Jersey. Department of "Mansportation, Federal AviationAdministration Administration.1991
Deutsch, M.S. and Software Quali&y Engineering. Englewood CUE[% New Jersey:R.R. Willis Prentice-HalL1988
Fenton, N.E. Software Metric A RigorousApproach London, England: Chapman1991 and Hall.
Freiburger, K. and The Software Engineerng Laboratory Reationshop Equation, TR-769.V.R. Basili College Park, Maryland: University of Maryland Computer Science1979 Center.
Gaffney, J.E., Jr. Metrics in Software Quality Assurance. Proceedings of the ACM '811981 Conference Los Angeles, Cafnia.
1982 A Macroanalysis Methodology for Assessment of SoftwareDevelopment Costs. The Economics of Data Procesg. New York,New York: Wiley.
1983 Approaches to Estimating and Controlling Software Costs. 1983International Conference of the Computer Measurement Group,CMG XMV. Washko D.C.
1984a On Predicting Software Related Performance of Large-Scale Systems.1984 International Conference of the Computer Measurement Group,CMG XV San Francisco, California.
1984b Estimation of Software Code Size Based on Quantitative Aspects ofFunction (Mth Applcation of Expert System Tecdmologr), Journal ofParametrics 4, 3:23.
1986 The Impact on Software Development Costs of Using HOLs. IEE7hlusactions on Software Engineering 12, 3:496-499.
Gaffney, J.E., Jr., and Code Counting Rules and Categoty DefinislRe/ationdhkR.D. Cruickshank CODECOUNT RUIES-90010-N. Hemdon, Virginia: Software1991a Productivity Consortium.
Ref-4

References
1991b The Measurement of Software Product Size: New and ReusedCode. ThirdAnnual Oregon Workshop on Software Metrics. SilverFalls, Oregon.
1992 A General Economics Model of Software Reuse. 14th InternationalConference on Software Engineering. Melbourne, Australia: IEEE
Gaffney, J.E., Jr., and C.F. An Approach to Estimating Software Errors and Availability,Davis SPC-TR-88-007. Herndon, Virginia: Software Productivity1988 Consortium.
Gaffney, J.E., Jr., and Software Reuse-Key To Enhanced Productivity;, Some QuantitativeT.A. Durek Models The Economics of Information Systems and Software1991 Oxford, England- Butterworth Heinernan.
Gaffney, J.E., Jr., and An Automated Model for Software Early Error Prediction (SWEEP).J. Pietrolewicz Thirteenth Minnowbrook Workshop on Software Engineering. July1990 24-27, 1990. Blue Mountain Lake, New York.
Gaffney, J.E., Jr., and A Model for Analysis of Scale Economies and Software Po t.R. Werling ANALYSIS PROJECr DATA-90018-N. Herndon, Virginia:1990 Software Productivity Consortium.
1991 Estimating Software Size From Counts ofq&emal; A Generaizationof Function Points, SPC-91094-N. Herndon, Virginia: SoftwareProductivity Consortium, and ISPA'91, New Orleans, Louisiana.
Gilb, T. Pdnciples of Software Engineering Management. New York, New1988 Yorkc Addison-Wesley.
Goel, A.L. Software Error Detection Model With Applications. IEEE1980 Trnsactions on Software Engineering 1, 243-249.
1985 Software Reliability Models: Assumptions, Limitations, andApplicability. IEEE Thrnsactions on Software Engineering 11,12.1411.
Grady, R.B., and D.L. Caswell Software Matrics: Establishing a Company-Wide Program. Englevowd1987 Cliffs, New Jersey: Prentice-Hall.
Grady, R.B. Practical Software Metrics: For Project Management and Prcess1992 Improvement Englewood Cliffs, New Jersey: Prentice-Hall.
Graybill, FA. An Inrducion to Linear Statstical Models Volume I. New York,1961 New Yoric McGraw-Hill.
Halstead, M.H. Elements of Software Science. New York, New YorLk Elsevier North1977 Holland.
RM-S

References
Hancock, W.C. Practical Application of Three Basic Algorithms in Estimating1982 Software Systems Costs. The Economiks of Data Processing. New
York, New York. Wiley.
Humphrey, W.S., and A Method for Assessing the Software Engineering Capability ofW.L. Sweet Contractors, CMU/SEI-87-TR-23. Pittsburgh, Pennrylania: Software1987 Engineering Institute.
Humphrey, W.S., D.H. Kitson, The State of Software Engineering Practice: A Preimina Report,and T.C. Kasse CMU/SEI-89-TR-1. Pittsburgh, Pennsylvania: Software Engineering1989 Institute.
IEEE Draft Guide for the Use of Standard Dictionary of Meastm to1988 Prduce Reliable Software, P9822•6. New York, New York: Institute
of Electrical and Electronics Engineering.
1990 Draft Glossary of Software Engineering Terminology, P729/610.12/D8.New York, New York: Institute of Electrical and ElectronicsEngineering.
1992 Standard for Software Productity Metrics, P1045. New York, NewYork: Institute of Electrical and Electronics Engineering.
Jones, C. Programming Produvit. New York, New York: McGraw-Hill.1986
1990 Cost Estimation for Software Development Wokingbarn, England:Addison-Wesley.
1991 Applied Software M surnent. New York, New York: McGraw-Hill.
McCabe, TJ. A Complexity Measure. IEEE Trhasactions on Software Engineering1976 1Z 4:308-320.
McCall, J.A. An Introduction to Software Quality Metrics. Software Quality1979 Management. New York, New York Petrocelli.
Musa, J.D., A. lannino, and Software Reliability Measurement, Prediction, Application. NewK. Okumoto Yoi k, New York: McGraw-Hill.1987
Myers, G.J. Reliable Software Through Composite Design. New York, New York:1975 Petrocelli/Charter.
National Aeronautics and Managers Handbook for Software Developunen Revision 1,Space Administration SEL-84-101. Greenbelt, Maryland: National Aeronautics and Space1990 Administration, Goddard Space Flight Center.
Norden, P.V. Using Tbols For Project Management. The Management of1970 Production. Baltimore, Maryland. Penguin.
Ret-'
References
1958 Curve Fitting for a Model of Applied Research and DevelopmentScheduling. IBM Systems Journal.
Paulk, M.C., B. Curtis, Capability Maturity Model for Software. CMU/SEI-91-TR-24.M.B. Chrissis Pittsburgh, Pennsylvania: Software Engineering Institute.1991
Putnam, L.H. A General Empirical Solution to the Macro Software Sizing and1978 Estimating Problem. IEEE 7hinsacions on Software Si&ng 4,
4"345-361.
1990 Personal Communication
Radice, R.A., and R.W. Phillips Software Engineering: An IndustrialApproach, Volume I. Englewood1988 Cliffs New Jersey: Prentice-HalL
Rifkin, S. and C. Cox Measurement in Practice, CMU/SEI-91-TR-16. Pittsburgh,1991 Pennsylvania: Software Engineering Institute.
Rock, D. and D. Guerin Applying Al to Statistical Process ControL AIEapl 7, 9.30-35.1992
Schultz, H.P. Software Management Meiic4 ESD-TR-88-001/M88-1. Bedford,1988 Massachusetts: MITRE Corporation.
Selby, R.W and Analyzing Error-Prone System Structure. FIEE 7Tansacions onV.R. Basili Software Engineering 17, 2:141-152.1991
Shooman, M.L. Software Engineering: Design, Reliability, and ManagementL New1983 York, New York: McGraw-Hill.
Tausworthe, R.C. Staffing Implications of Software Produdivity Modes, TDA Progress1982 Report 42-72. Pasadena, California: Jet Propulsion Laboratory.
Walston, C.E. and A Method of Programming Estimation and Management IBMC.P Felix Systems Journal 16,1:54-73.1977
Weber, C.V., M.C. Paulk, Key Practices of the Capabiity Matwity Mode4 CMU/SEI-91-TR-25.CJ. Wise, and J.V. Withey Pittsburgh, Pennsylvania: Software Engineering Institute.1991
Weiss, D.M. Evaluating Software Dewlopment by Anaysis of Change Data,1981 TR-1 120. College Park, Maryland. University of Maryland Computer
Science Center.
Ref-7

Rferefncs
This page intentionally left blank
Rdf-
BIBLIOGRAPHYBasili, V.R., and D.M. Weiss. "Evaluating Software Development by Analysis of Changes: Some Data From
the Software Engineering Laboratory." IEEE 7hmsactions on Software Engineering SE-11, 2 (1985).
Bratman, H., and T. Court. 'The Software Factory." IEEE Computer 1975.
Cruickshank, R.D., and J.E. Gaffney, Jr. Progres in Software Sizing Methods, SSCE 84-0141. Manassas,Virginia: IBM Federal Systems Division, 1984.
Cusumano, M.A. Japan's Software Factories A Challenge to US. Management New York: OxfordUniversity Press, 1991.
Davenport, T.H., and J.E. Short. "The New Industrial Engineering; Information bchnology and BusinessProcess Redesign" Sloan Management Review 11-27 (1990).
Defense Science Board. Report of the Defense Sdence Board Task Force on Mfditary Softwwm Office of theUnder Secretary of Defense for Acquisition. Washington, D.C., 1987.
Dijkstra, E.W. "Notes on Structured Programing.'" In Stuctuned Progrmming. Edited by OJ. Dahl, E.W.Dijkstra, and CA.R. Hoare. New York, New York: Academic Press, 1972.
Fagan, M. Design and Code Inspection and Process Contro in the Development of Progmm TR-21.572IBM System Development Division, 1974.
Fagan, M. "Design and Code Inspections to Reduce Errors in Program Dev-lopment."!BMSystemsJournal18,3 (1976):182-207.
Fagan, M. "Advances in Software Inspections:" IEEE 7Tansactions on Software Engineering SE-1Z 7(1986):744-751.
Florac, WA. Software Quality Meamnrent: A Framework for Counting Problems and Defect;CMU/SEI-92-TR-22. Pittsburgh, Pennsylvan Software Engineering Institute, 1992.
Gaffney, J.E., Jr. "Software Metrics: A Key to Improved Software Development Management"Proceedings; 13th Symnposiw on the Interface. Pittsburgh, Pennsylnia (1981).211-220.
Gaffney, J.E., Jr. An Economics Foundation for Software Reuse, SW REUSE ECONOM-89040-N.Herndon, Virginia: Software Productivity Consortium, and AMAA Computem in Aemface Confermce,Monterey, California, 1989.
Gilb, T. PLANGUAGE. Working draft available from author, 1989.
Bb-1

Bibfiapy
Goethart, W.., E.K. Bailey, and M.B. Busby. Software Effort & Schedule Measurement. A Frameworkfor Counting Staff-Hours and Reporing Schedule Information. CMUlSEI-TR-92-21. Pittsburgh, PennsylvaniaSoftware Engineering Institute, 1992.
Grady, R.B. "Measuring and Managing Software Maintenance." IEEE Software (1987):35-45.
Hon, S.E., III. 'Assuring Software Quality Through Measurements: A Buyer's Perspective." Journal ofSystems and Software 13 (1990):117-130.
Humphrey, WS. Characterizing the Software Process: A Maturity Framework. IEEE Software 73-79
(1988).
Humphrey, WS. Managing the Software Proces. Reading, Massachusetts: Addison-Wesley, 1989.
Kuo, B.C., 'Automatic Control Systems." Englewood Cliffs, New Jersey: Prentice-Hall.
Lanphar, R. "Quantitative Process Management in Software Engineering, A Reconciliation Between Processand Product Views." Journal of Systems and Software 12 (1990):243-248.
Mills, E.E. Software Mevict SF1 Cwriadum Module SEI-CM-12 -1.1. Pittsburgh, Pennslvania: SoftwareEngineering Institute, 1988.
Parnas, D.L. "On the Design and Development of Program Families." IEEE 7ansactions on SoftwareEngineering SE-2 (1976):1.
Pfleeger, S.L., and C. McGowan. "Software Metrics in the Process Maturity Framework." Journal ofSystems and Software 12 (1990):255-261.
Poston, R.M. 'Treventing Most-Probable Errors in Requirements." IEEE Software (1987):81-83.
Putnam, L.H., and A. Fitzsimmons. "Estimating Software Costs." Datamation, 1979.
Quenouille, M.H. Associated Measurwmenta London: Butterworth's Scientific Publications, 1952.
Robinson, WN. "Negotiation Behavior During Requirement Specification." Proceedings of 12thInternational Conference on Software Engineering. Nice, 1990.
Schulmeyer, C.G., and J.I. McManus. Handbook of Software QualityAssuance. New York, New York:Van Nostrand Reinhold, 1987.
U.S. House of Representatives, Committee on Science, Space, and Technology. Bugs in the Pg "Pmblems in Federal Government Computer Software Development and Regulation. Staff study by theSubcommittee on Investigations and Oversight. Washington, D.C.: US. Government Printing Office, 1989.
U.S. Secretary of Defense. Total Quality Management (TQM) Program. Letter from Secretary of Defenseto Secretary of the Navy, 1987.
Werling, R. 'Action-Oriented Information Systems." Datamation, 1967.
Werling, R. "MIoring Information to Your Firm's Decision Models." Proceedings 1984 InternationalConfef .ce on Computer Capacity ManagemenL Sunnyvale, California: Institute for InformationManagement, 1984.
Werling, R. Foal Reponr: Data Collecton SWtem for Esimatng Software Development Cost Prepared forUSAF Business Research Management Center, AFBRMC/RDCA Wright-Patterson AFB, Ohio, underContract F33615.85.C,5123, 1986.
Bb-2
INDEX
Activities required at maturity level 2, 3-12 improving shape of process distribution,measurement-related activities, 3-12 3-6
a flshbone chart, 3-12 reducing variability, 3-5Activities required at maturity level 3, 3-13 improved results, from greater control of the
to reach maturity level 3, 3-13 process, 3-7a fishbone chart, 3-13
Activities required at maturity level 4, 3-13a fishbone chart, 3-13 Capability maturity model, quantitative goals, 5-3
Activities required at maturity level 5, 3-14 process quality, 5-3a fishbone chart, 3-14 product quality, 5-3
Activity, software process activities and the ETVX quality goals, 5-3model, 4-2 Closed loop process control model, 2-4
Activity-based estimating models COCOMO estimating modelAda development model, 8-18 Ada process model, 8-6Ada language development model, 8-17 basic COCOMO, 8-2,8-3adjusting cost estimates, 8-19 detailed COCOMO, 8-5
cost effective of software product size, 8-20 intermediate COCOMO, 8-3cost effects of CASE tools, 8-21 reuse with COCOMO, 8-5point and interval estimates, 8-19 Code size, counting, 6-3pooling estimates, 8-19 COPMO, 8-10
basic activity-based development model, 8-14 Cost and effort metrics, 6-16estimating costs, 8-15 computer usage cost metrics, 6-18
adjustment of unit costs, 8-17 labor cost metrics, 6-16assignment, 8-15 labor months and labor hours, 6-17example of, 8-15 Cost of software
general models and risk management, 8-18 See also activity-based model; holistic model;stagewise cost model, 8-13 software cost estimation
Activity-based models, 8-11 costs of support to software development, 8-29cost model, 8-11 holistic models, 8-2
Activity-based process model, 4-1 top-down estimation, 8-27Attributes example of top-down estimating model,
critical quality attributes, 5-10 8-27examples of project-critical attributes, 5-10 Costs of software reuse, 8-21specify attributes or requirements, 5-6 basic economic model, 8-22
library efficiency, 8-23up-front domain engineering. 8-22
how to estimate documentation costs, 8-24Basic measurement set, 6-2 Critical requirements, 5-1Benefits, 3-5 evolutionary requirements development, 5-1
higher maturity levels, 3-5 Pareto distribution, 5-2ability to predict accurately, 3-5 performance objectives, 5-3
Ind-I

Index
setting measurable/testable targets, 5-2 Holistic cost estimating modelCOCOMO, 8-2cooperative programming model, 8-10software development model, 8-7
Defect or error models, 10-10assumptions, 10-11decaying exponential time-based error models, Implementation, essentials for early action, 3-25
10-14 Improvement. See process improvementRayleigh phase or activity-based model, 10-16Rayleigh time-based error model, 10-15time-based error models, 10-12 Levels of software capability maturity, 3-2
availability, 10-13reliability, 10-13
Deviations from requirements, definitions, 10-9 Management. See measurement-driven softwaredefect, 10-9 managementerror, 10-9 Management indicators for tracking andfailure, 10-9 monitoring, 11-1fault, 10-9 how to compute management indicators, 11-8
computer resources indicators, 11-10cost indicators, 11-9earned value, 11-11, 11-14
Earned value, 11-11 product size indicators, 11-9Equivalent source statements, 6-13 project stability indicators, 11-10Error. See defect quality indicators, 11-10Error model. See defect schedule indicators, 11-9Estimate at completion, 11-14 technical stability indicators, 11-9ETVX paradigm, 4-2 how to select, 11-7
See also software process activities corrective action, 11-8flexibility issues, 4-6 feedback, 11-8process activities, 4-4 management indicators, table of, 11-4quantifying aspects, 4-5 software management indicators and
metrics, 11-4process maturity levels, 11-3product size growth, 11-14
Feedback control process model, 2-3 project status assessment, 11-18Function point status tracking, 11-1
applications, 7-9 tracking activities, 11-2definition of, 7-7 Managing subcontractors, 12-7example of calculation, 7-9 Measurables, 6-1
Measurement, 3-27, 6-1fishbone chart
level 2, 3-31Goals level 3, 3-32
process improvement, 6-6 level 4, 3-33project control, 6-6 level 5, 3-34
GQM paradigm, 6-4,10-7 organization, 3-27selection of quality metrics, 10-7 Measurement support, 3-16
example of correctness, 10-7 experience databases, 3-16example of usability, 10-7 feedback of metrics data, 3-16
Graphical methods, 11-22 metrics, 3-17project monitoring 11-22 software management indicators and metrics,
3-17
lad-2

Index
Measurement-related activities, 3-4 Planning a measurement program, 3-24Measurement-driven software management, 2-1 Process control models, 2-2
dosed loop feedback control system, 2-3 Process description, 4-1goal setting and tracking, 2-6 Process improvement, 4-7MDSM process model, 2-4, 2-5 goals, 6-6measurements, 2-7 impacts of process modification, 4-7process and product improvement, 2-1 metrics for process modification, 4-9process maturity levels, 2-2 Process maturity level, 3-1process model, 2-4 Process/capability maturity levels, 3-1project control, 2-1 consistency of application, 3-2
Measurement-driven software management control of software process, 3-2process, 2-8 framework, 3-2
Measurements, 6-1 maturity, 3-2Metrics, 6-1 measurement-related activities, 3-3
development constraint, 6-23 raising process maturity level, 3-3development environment, 6-23 Product size growth, 11-14development personnel, 6-24 function growth, 11-16product application environment, 6-22 no function growth, 11-15
Metrics categories, 6-2 Productivities and unit costs, 6-24development constraints, 6-2 Project controldevelopment environment characterization, 6-2 goals, 6-6,6-8development personnel characterization, 6-2 support, 6-9product application environment, 6-2 Project status assessment, 11-18product cost and effort, 6-2 activities, 11-18product size, 6-2 assessment report, 11-19quality, 6-2 cost and schedule performance reporting, 11-21schedule, 6-2 graphical methods, 11-22
Model, mathematical, 6-4Motivate, to quantify requirements, 5-10
Quality and process maturity, 10-25
Negotiating requirements, 5-7 level 2, repeatable, 10-26
flexibility, 5-7 level 3, defined, 10-26
product requirements, 5-8 level 4, managed, 10-26level 5, optimized, 10-27
Quality and software reuse, 10-17Quality control charts, 10-21
Organization, 6-5 Quality factors, 10-4configuration management, 6-5 Quality metrics, 6-19finance/accounting, 6-6 Quantitative process objectives, 5-1measurement, 6-5 Quantitative product requirements, 5-1project or program management, 6-6 critical requirements identification, 5-1software engineering, 6-6 Quantitative requirementssoftware engineering process group, 6-5 identification, 5-5software management, 6-6 multiple value attributes, 5-4software quality assurance, 6-5 quantitative critical attributes, 5-9systems engineering, 6-5 setting measurable/testable targets, 5-2
Organize a measurement program, 3-22 true/false attributes, 5-4benefits, 3-22 Questions, 6-7, 6-9functions of a measurement program, 3-22 process improver-ent, 6-9implementing a measurement program, 3-24 project control, I 9
Ind-3

Index
Raising process maturity level, 3-14 role of quality in the software developmentkey process areas, 3-14 process, 10-3measurement foundations, 3-11, 3-15 users, 10-3
Reuse, 10-17 Software quality factors, 10-4, 10-5See also cost of software reuse control complexity, 10-6effect on software quality, 10-17 correctness, 10-5
model of, 10-17 defect (error) discovery efficiency, 10-6effect on software schedule, 9-2 design goodness, 10-6
Risk in estimates of cost, 8-29 efficiency, 10-5cost risk management activities, 8-32 flexibility, 10-5interval estimates, 8-30 integrity, 10-5measurement program, 8-34 interaction among, 10-5point estimates, 8-30 interoperability, 10-5software maintenance costs, 8-33 maintainability, 10-5
nature of, 10-4portability, 10-5
Schedule estimation, 9-1 quality factors, 10-4estimating the development schedule, 9-2 reliability, 10-5impact of reused code, 9-2 reusability, 10-5schedule/development effort tradeoff, 9-3 testability, 10-5schedule/effort/size compatability, 9-4 usability, 10-5software development labor profiles, 9-5 verifiability, 10-5
Schedule metrics, 6-18 Software size estimation, 7-1SEI process maturity model, 3-1 activities, 7-1SEO recommendations for initial core measures, 6-2 combining estimates, 7-12Selection, product size, 6-14 counting externals, 7-10Selection of, metrics, 6-4 development activity, 7-3Software cost estimation development cycle, 7-2
activity-based models, 8-11 during the development cycle, 7-2COCOMO, 8-2 example of calculation, 7-9holistic models, 8-2 function block counting, 7-4how to apply holistic models, 8-10 function points, 7-7methods, 8-1 process maturity levels, 7-2process maturity levels, 8-1 size growth, 7-11units of cost, 8-1 statistical, 7-5
Software development cycle model, 8-7 Starting a measurement program, 3-22equation, 8-8 Statistical process control, 10-20incremental changes, 8-9 definitions, 10-21technology constant, 8-9 quality control charts, 10-21
Software experience database, 12-1 Taguchi quality control concepts, 10-24data collection, 12-3 using a defect/error quality control chart, 10-23data set definition, 12-2
process maturity level, 12-2data sources, 12-4data validation, 12-8 Unit cost, equivalent source statements, 6-13database management systems, 12-3 Unit costs for new and reused code, 6-11
Software process activity. See ETVX model derivation, 6-11Software quality, 10-2 Unstated requirements, critical product attributes,
definitions, 10-2 5-7
Ind-4

Index
Visibility into software development process, 3-8 level 5, optimizing, 3-9initial level, 3-8level 2, repeatable, 3-8level 3, defined, 3-9 Work breakdown structures, 12-5level 4, managed, 3-9 managing subcontracted work, 12-7
hnd-5
Index
This page intentionally left bkank
lnd.6

o6 6 o o 00 00 6 0
00 00 00 00 00 0 00 0 00d d' 0
10
UUo 4)
00 0
0 U 200) 0 0
.1. 0 .
+ II00
+).-
0t 048cl~ ~ ~ ''a .oA %., -
~0r
U1. 0* E! a .. g
0 - .00- -~04
cc > ) 4) 4)-
.z V)0
A o if
0
~ o00)0 -0i~!~1111 _
Related Documents


