Software as a Service (SaaS) Report Autumn 2021

Welcome message from author
This document is posted to help you gain knowledge. Please leave a comment to let me know what you think about it! Share it to your friends and learn new things together.
Transcript

Software as a Service (SaaS) Report Autumn 2021

2REDEYE - SAAS REPORT 2021
AGENDA
09.20 Redeye Introduction and Report
09.30 Impero – Rikke Skov, CEO
09.50 Penneo – Christian Stendevad, CEO
10.10 Konsolidator – Claus Finderup Grove, CEO
10.30 Short break
10.40 SameSystem – Henrik Salicath, CEO
11.00 Formpipe Software – Christian Sundin, CEO
11.20 Mestro – Gustav Stenbeck, CEO
11.40 Lunch break
12.30 Litium – Patrik Settlin, CEO
12.50 Artificial Solutions – Per Ottosson, CEO
13.10 Modelon – Magnus Gäfert, CEO
13.30 SleepCycle – Carl Johan Hederoth, CEO
13.50 Short break
14.00 Carasent – Dennis Höjer, CEO – Svein Martin Bjørnstad, CFO
14.20 Safeture – Magnus Hultman, CEO
14.40 Efecte – Niilo Fredrikson, CEO
15.00 BIMobject – David Kullander, CRO
15.20 Short Break
15.30 Compodium – Charlotte Berg, CEO
15.50 Hoylu – Stein Revelsby, CEO
16.10 XM Reality – Jörgen Remmelg, CEO
16.30 Goalplan – Markus Täkte, CEO
16.50 The end

3REDEYE - SAAS REPORT 2021
SAAS REPORT 2021
About Redeye 4
The Redeye Technology Team 5
Transactions 8
Why invest in SaaS & the Cloud 10 The BIG one: The shift to the Cloud 11 Consumerization of IT 11 The rise of subscription economy 11 Investors and recurring revenue 11
Software Overview 12 Large variations in SaaS adoption rates 12 Only 30% of IT spend heading for the Cloud 13 Solid growth trend expected to continue 13 Rule of 40 – when the best metrics are missing 14 Time to look at 2023 15 2023E – A better proxy for underlying performance 16 Less Correlation as 2022 Approaches 16 Strong Correlation Between EV/S and R40 Persists 17 Profitability Important in Lack of Proper Metrics 17 Net Revenue Retention 19
SaaS Metrics 21
Nordic Public Metrics Benchmarks 22
Covered Companies 24
Currently not covered companies at the event 48
Disclaimer 51
Table of contents

ABOUT REDEYE RESEARCH-POWERED INVESTMENT BANKING
Leading Nordic Investment BankLeading Advisor for Growth Companies
Founded 1999Under supervision of the Swedish FSA
Employees 65+Analysts: 25 Corporate Advisory: 20
Ownership Partner owned
Redeye.se 140,000+Attracting 140,000+ unique visitors monthly
Corporate Broking 160+160+ public corporates as clients
Key Specialties Tech & Life Science
Corporate Finance 150+150+ transactions executed over the last five years
Focused themes 10+Includes 5G, AI, AR, Autotech, Cybersecurity, Disease of the Brain, Envirotech, Fight Cancer, Digital Entertainment and SaaS
Redeye Corporate AdvisoryLeading Advisor for Growth Companies
Corporate Broking• In-depth research coverage – sector expertise
• Investor events & activities
• Create brand awareness, credibility and manage expectations
• Stratetgic advise regarding how to create the optimal shareholder structure and build a strong and well-positioned financial brand
Certified Adviser• Requirement for companies listed on Nasdaq First North incl. Premier
• Ensures compliance with Nasdaq Rule Book
• CA-breakfast seminars and newsletters to ensure client companies are up-to-date with the latest information and hot topics
Corporate Finance• The go-to adviser for growth companies
• One of the most active advisors within the segment
• Leading adviser within private and public transactions
• Highly skilled team with vast experience from private and public transactions
• Over 150+ executed transactions including IPO:s, preferential rights issues, directed issues
ECM• The most relevant investor network for growth companies
• Matching companies with the right investors
• Broad network of investors including institutional investors, family offices and retail investors
4REDEYE - SAAS REPORT 2021

w
THE REDEYE TECHNOLOGY TEAM
Erik KrammingClient Manager & Head of Technology
Erik has a Master of Science in finance from Stockholm University. His previous work has included a position at Handelsbanken Capital Markets. At Redeye, Erik works with Corporate Broking for the Technology team.
Greger JohanssonClient Manager & Co-head Technology
Greger has a background from the telecom industry, both from large companies as well as from entrepreneurial companies in Sweden (Telia and Ericsson) and USA (Metricom). He also spent 15+ years in investment banking (Nordea and Redeye). Furthermore, at Redeye Greger advise growth companies within the technology sector on financing, equity storytelling and getting the right shareholders/investors (Corporate Broking). Coder for two published C64-games. M.Sc.EE and M.Sc.Econ.
Johan EkströmClient Manager
Johan has a Master of Science in finance from the Stockholm School of Economics, and has studied e-com-merce and marketing at the MBA Haas School of Business, University of California, Berkeley. Johan has worked as an equity portfolio manager at Alfa Bank and Gazprombank in Moscow, as a hedge fund manager at EME Partners, and as an analyst and portfolio manager at Swedbank Robur. At Redeye, Johan works in the Corporate Broking team with fundamental analysis and advisory in the tech sector.
Erik RolanderClient Manager
Erik has a Master’s degree in finance from Linköpings Universitet. He has previously worked at Remium as a tech analyst and product manager for the equity research platform Introduce.se, which today is owned by ABG Sundal Collier. At Redeye, Erik works with Corporate Broking for the Technology team.
Niklas BlumenthalClient Manager
Niklas has studied business administration at Uppsala University and has over 20 years of experience in the financial market. He has previously worked as client manager at Nordnet, CMC Markets, Remium and ABG Sundal Collier. At Redeye, Niklas works with Corporate Broking in both Technology and Life Science teams.
Gustav Olin MånssonClient Manager
Gustav has a Master’s degree in business administration from Karlstad University. He has previously worked at PwC as an auditor towards listed entities. At Redeye, Gustav works with Corporate Broking for the Technology team.
5REDEYE - SAAS REPORT 2021

THE REDEYE TECHNOLOGY TEAM
Jesper HenriksonAnalyst
Jesper is an equity analyst in the technology team with a focus on telecom, automotive tech and more. He holds a Master’s degree in Industrial Engineering and Management from Lund University, institute of technol-ogy. In addition, he has studied abroad in Madrid. He has previously worked as an entrepreneur, management consultant and business development manager at a B2B SaaS company. He has also run a stock-research blog for nearly five years.
Mats HyttingeAnalyst
Mats is an equity analyst in the technology & life science team at Redeye. He has an MBA and Bachelor degree in Finance from USE in Monaco.
Mattias EhrenborgAnalyst
Mattias is an equity analyst within Redeye’s technology team, focusing on the renewable energy & cleantech sector. He holds a BSc in Business and Economics from Uppsala University. Mattias has previously worked at ABG Sundal Collier as a part of the Capital Goods team, primarily focusing on the renewable energy & cleantech sector.
Henrik AlveskogAnalyst
Henrik has an MBA from Stockholm University. He started his career in the industry in the mid-1990s. After working for a couple of investment banks he came to Redeye, where he has celebrated 10 years as an analyst.
Forbes Goldman Analyst
Forbes is an equity analyst within the technology team at Redeye. He holds a BSc in Business and Economics from the Stockholm School of Economics and has also completed an academic exchange semester in Mexico City.
Douglas Forsling Analyst
Douglas is an equity analyst in the technology team with a focus on the online gambling sector and fintech sec-tor. He holds a Bachelor’s degree in finance and an unfinished Master’s degree in Operational Management and Control from Stockholm University, School of Business. In addition, he has studied abroad in Hong Kong, Beijing, and Oxford. He has had positions in SEB, Nordic Capital, and Danone. He has also produced a finance podcast for nearly two years.
Tomas OtterbeckHead of Research
Tomas gained a Master’s degree in Business and Economics at Stockholm University. He also studied Computing and Systems Science at the KTH Royal Institute of Technology. Tomas was previously responsible for Redeye’s website for six years, during which time he developed its blog and community and was editor of its digital stock exchange journal, Trends. Tomas also worked as a Business Intelligence consultant for over two years.
6REDEYE - SAAS REPORT 2021

THE REDEYE TECHNOLOGY TEAM
Jacob SvenssonAnalyst
Jacob Svensson is an equity analyst within the technology team, focusing on software companies. He holds a BSc in Business Administration and a Master’s in Finance from Lund University and has previously worked within the banking industry and asset management.
Danesh Zare Analyst
Danesh has a Master’s degree in mechanical engineering from the Royal Institute of Technology. He has previously worked as a Calculation Engineer for more than 6 years, holding positions at both Scania and Volvo Trucks. He also produced a finance podcast for nearly two years. Danesh joined Redeye in 2020 and works as an equity research analyst, covering companies in the tech-sector, with a focus on gaming companies
Mark Siöstedt Analyst
Mark has a Master’s degree in Accounting and Finance from Lund University. He has a dual role within Redeye as an editor (quality assurance and Top Picks) and as an equity analyst on the technology team.
Viktor LindströmAnalyst
Viktor is an equity analyst in the technology team, focusing on gaming and cleantech sectors. He holds a Master’s degree in Finance from University of Gothenburg. Previously, he held positions at Carnegie Investment Bank and Consensus Asset Management.
Fredrik NilssonAnalyst
Fredrik is an equity analyst within Redeye’s technology team. He has an MSc in Finance from University of Gothenburg and has previously worked as a tech-focused equity analyst at Remium.
Hjalmar AhlbergAnalyst
Hjalmar is an equity analyst within the technology team focusing on gaming and online gambling sectors. He holds a Master’s degree in finance and has previously worked within the banking industry with focus on equity research covering various sectors.
Niklas SävåsAnalyst
Niklas has more than ten years experience from the financial industry working within banking and financial technology. He started his first company in 2016 focused on consultancy and investments. Niklas has a dual role within Redeye where he splits his time between the podcast Investing By The Books, Redeye Academy and as an analyst on the technology team. He has a bachelor degree in Business and Economics from SLU.
7REDEYE - SAAS REPORT 2021

Technology Selected Transactions
8REDEYE - SAAS REPORT 2021

9REDEYE - SAAS REPORT 2021
TECHNOLOGY SELECTED TRANSACTIONS
RECENT
FEBRUARY 2018Private Placement
20 MSEK
APRIL 2018 Private Placement
20 MSEK
MAY 2018 IPO
30 MSEK
JUNE 2018 Private Placement
50 MSEK
OCTOBER 2018 Direced Issue
43 MSEK
NOVEMBER 2018 Rights Issue
25 MSEK
JUNE 2018 Rights Issue
Join Lead Manager127 MSEK
JUNE 2018 Private Placement
108 MSEK
OCTOBER 2018 Right Issue39 MSEK
OCTOBER 2018 Directed Issue
21 MSEK
MARCH 2020Rights Issue
36 MSEK
DECEMBER 2020Private Placement
52 MSEK
MAY 2019 Rights Issue
Co-Lead Manager135 MSEK
OCTOBER 2020 Rights Issue
57 MSEK
OCTOBER 2020Directed Issue
66 MSEK
OCTOBER 2020 Rights Issue
50 MSEK
NOVEMBER 2020 Directed Issue + Rights Issue
204 MSEK
NOVEMBER 2019 IPO
26 MSEK
DECEMBER 2019 Pre-IPO
18 MSEK
MAY 2019 Directed Issue + Rights Issue
139 MSEK
JUNE 2019 Rights Issue
40 MSEK
OCTOBER 2019 Rights Issue
51 MSEK
APRIL 2019 Dual Listing
10 MSEK
APRIL 2019Rights Issue102 MSEK
MARCH 2019 IPO
80 MSEK
JANUARY 2019 IPO
Joint Bookrunner 120 MSEK
NOVEMBER 2017 IPO
60 MSEK
NOVEMBER 2017 IPO
180 MSEK
NOVEMBER 2017 Private Placement
9 MSEK
OCTOBER 2017 22 MSEK
APRIL 2017 IPO
60 MSEK
2017–2020
FEBRUARY 2021 Private Placement
60 MSEK
JULY 2021 Directed Issue
15 MSEK
APRIL 2021 Rights Issue
55 MSEK
MAY 2021 IPO
60 MSEK
MAY 2021 Rights Issue
25 MSEK
JULY 2021 Directed Issue
45 MSEK
OCTOBER 2021 IPO
Completed65 MSEK
OCTOBER 2021 Private Placement
Completed124 MSEK
10REDEYE - SAAS REPORT 2021
In this report we dig deeper into:
• SaaS adoption rates by country and application vertical• Cloud IT spending percentage• Projected growth rates for SaaS• Performance and Valuation of Nordic SaaS businesses• Net Revenue Retention and its Importance
Why invest in SaaS & the Cloud

11REDEYE - SAAS REPORT 2021
The BIG one: The shift to the CloudThe big trend that shapes the Cloud industry is the shift from on-premise software spend to Cloud. This is a secular shift that has been ongoing for many years; however, the transformation is still in the early days within some verticals. The Cloud service, with the most substantial revenue, is the application layer (SaaS).
Consumerization of ITAnother trend affecting the Cloud service industry is the consumerization of IT. That means that the applications used in work more resemble consumer tech products when it comes to usability, UX and UI. This has also led to another buying pattern within organizations as the buy decision many times have become decentralized where the end-user of the product might be the one who decides which service to use.
The rise of subscription economyIn many ways, Cloud technology is the enabler of the sub-scription economy, but the consumer and user behavior fuel the rise of subscription even further. The subscription economy is a trend both within B2C and B2B but is extremely apparent within the software market, where a focus has shifted from providing a product to an ongoing service.
SOFTWARE OVERVIEW
SaaS and Cloud companies provide investors the opportunity to benefit from ongoing secular growth trends, including: Shift from on-premise enterprise infrastructure to the Cloud, Consumerization of IT, and the rise of the subscription economy and investors craving for recurring revenue.
YYeeaarr ‘‘1199 ‘‘2200EE ‘‘2211EE ‘‘2222EEBPaaS 45.21 46.07 51.03 55.54PaaS 37.51 58.92 80.00 100.64SaaS 102.06 120.69 145.51 171.92CLd. Mng & sec. 12.84 22.66 25.99 29.74
IaaS 44.46 64.29 91.54 121.62DaaS 0.62 1.24 2.08 2.17TToottaall 224422..7700 331133..8855 339966..1155 448822..1166Source: Gartner
GGlloobbaall CClloouudd SSeerrvviiccee RReevveennuuee ((bbnn$$))
Investors and recurring revenueWhat can be better than always starting with an almost full bucket every month? Well, according to investors, nothing is better than recurring revenue. The SaaS pricing model creates:
• Stability• Predictability• High margins• Lower business risk
All the above factors are the reason why investors crave recurring revenue companies and price them high. In the early days of SaaS, many market participants did not under-stand the model, with the argument that it’s better to have the money in the bank today than in the future. However, it has become apparent that the Life-time-value is much higher for the same type of service when people or companies pay on a recurring basis over a long time period. If the companies have the right type of structure on their offering, there will also be significant upsell possibilities per client, which can be compared to selling a one-time license to use a software with a small support fee.
Source: Gartner
12REDEYE - SAAS REPORT 2021
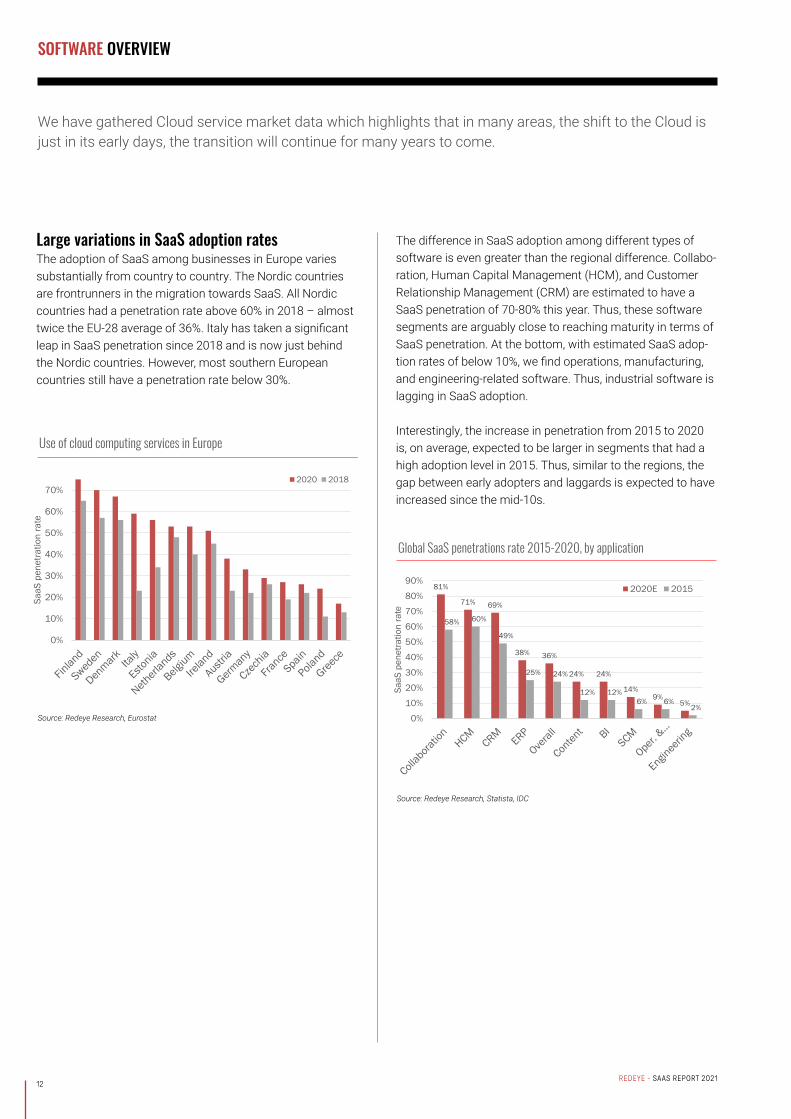
The difference in SaaS adoption among different types of software is even greater than the regional difference. Collabo-ration, Human Capital Management (HCM), and Customer Relationship Management (CRM) are estimated to have a SaaS penetration of 70-80% this year. Thus, these software segments are arguably close to reaching maturity in terms of SaaS penetration. At the bottom, with estimated SaaS adop-tion rates of below 10%, we find operations, manufacturing, and engineering-related software. Thus, industrial software is lagging in SaaS adoption.
Interestingly, the increase in penetration from 2015 to 2020 is, on average, expected to be larger in segments that had a high adoption level in 2015. Thus, similar to the regions, the gap between early adopters and laggards is expected to have increased since the mid-10s.
SOFTWARE OVERVIEW
Large variations in SaaS adoption ratesThe adoption of SaaS among businesses in Europe varies substantially from country to country. The Nordic countries are frontrunners in the migration towards SaaS. All Nordic countries had a penetration rate above 60% in 2018 – almost twice the EU-28 average of 36%. Italy has taken a significant leap in SaaS penetration since 2018 and is now just behind the Nordic countries. However, most southern European countries still have a penetration rate below 30%.
0%
10%
20%
30%
40%
50%
60%
70%
SaaS
pen
etra
tion
rate
Use of cloud computing services in Europe
2020 2018
81%
71% 69%
38% 36%
24% 24%
14%9%
5%
58% 60%
49%
25% 24%
12% 12%6% 6%
2%0%
10%
20%
30%
40%
50%
60%
70%
80%
90%
SaaS
pen
etra
tion
rate
Global SaaS penetrations rate 2015-2020, by application
2020E 2015
Source: Redeye Research, Eurostat
Source: Redeye Research, Statista, IDC
We have gathered Cloud service market data which highlights that in many areas, the shift to the Cloud is just in its early days, the transition will continue for many years to come.

13REDEYE - SAAS REPORT 2021
SOFTWARE OVERVIEW
46%
20%
10%
20%
IT Spend
Other On-premises software SaaS IaaS/PaaS
Source: Redeye Research, Statista, Gartne
Source: Redeye Research, Flexera, Statista
Solid growth trend expected to continue
While Gartner expects a slowdown from an impressive CAGR of 31% 2015-2020 – although, from low levels, SaaS growth is expected to remain healthy, as Gartner forecasts a 19% CAGR 2012-2022.
Given a current SaaS adoption of +60% in several software segments and regions, SaaS has reached a more mature state and slower – although still substantial – overall market growth seems reasonable. However, in many software segments and regions, the SaaS adoption rate is modest. As mentioned earlier, EU28 had a SaaS penetration rate of only 36% in 2020. The growth potential going forward is likely to vary substantially depending on the software segment and region.
Only 30% of IT spend heading for the Cloud
While the adoption of SaaS is significant in several regions and segments, as mentioned before, only 30% of IT spend is currently allocated to the cloud (SaaS and IaaS/PaaS), according to Flexera. For comparison, 20% of IT spend is allocated to On-premises software, suggesting that SaaS still can gain significant market shares.

14REDEYE - SAAS REPORT 2021
Rule of 40 – When the Best Metrics are Missing
Like for most companies, there is typically a tradeoff between sales growth and profitability for SaaS businesses as well. As a SaaS business has its customer acquisition costs (CAC) upfront, while the revenues are recognized over time, sales growth usually hurts margins even more for a SaaS business. The best way to assess the underlying profit-ability in growing SaaS businesses is to look at unit econom-ics such as CAC and CAC-payback period and net revenue retention. However, most listed Nordic SaaS businesses do not disclose these figures. Thus, the “Rule of 40” is used as a proxy for the listed SaaS businesses’ underlying unit economics. Although, since our first SaaS report the number of companies disclosing SaaS metrics have increased, and in this report, we will look at the net revenue retention.

15REDEYE - SAAS REPORT 2021
Time to Look at 2023EAs we approach the end of 2021, we argue the 2021E figures are irrelevant. First, it is packed with M&A affecting the numbers. Second, equities are valued on future earnings not past, and we would argue that professional investors, this time of year, are looking at 2022E and 2023E – or preferably on an even longer perspective, however, there are generally no forecasts for 2024E and onwards at this time.
Like regarding 2021E in our last report, the 2022E numbers are boosted by acquisitions in several companies. While many companies have seen minor revisions only, several companies that were expected to grow fast with rising margins have seen its estimates being revised downwards. In the defense of the analysts, in many cases us, small changes in expected sales growth have a large impact on margins as costs are fixed to a large degree. Thus, even slight revisions have a significant impact on a company’s R40.
247
ANOD
ADMCM
BIM
CARA
CHECK
CSAMEFECTEFPIP
FNOX
LEADD
LIME
LITIMRCEL
NORDH
PSKY
PENNEO
PEXIP
PTRK
SFTR
SMCRT
UPSALE
VERT
VITEC
XMR
-50%
-40%
-30%
-20%
-10%
0%
10%
20%
30%
40%
50%
0% 10% 20% 30% 40% 50% 60% 70% 80%EB
IT m
argi
nSales growth
Rule of 40 2022E (November 2021)
247
ANOD
ADMCM
BIM
CARA
EFECTE
FPIP
FNOX
LEADD
LIME
LITI
MRCEL
PEXIP SFTR
UPSALEVERT
VITEC
XMR
ZETA
ZUTEC
-40%
-30%
-20%
-10%
0%
10%
20%
30%
40%
50%
0% 10% 20% 30% 40% 50%
EBIT
mar
gin
Sales growth
Rule of 40 2022E (April 2021)
November 2021, Source: Redeye Research, Company reports, FactSet
April 2021, Source: Redeye Research, Company reports, FactSet
A few outliers are not included in the figure, as their sales growth is expected to be very high in percentage terms, main-ly due to large acquisitions.
SOFTWARE OVERVIEW

16REDEYE - SAAS REPORT 2021
SOFTWARE OVERVIEW
2022E – A better proxy for underlying performanceAs the 2023E forecasts, unlike 2022E, do not include any significant contribution from acquisitions, we believe it is a better proxy for the expectations on the companies’ under-lying sales growth and their performance relative to Rule of 40. Interestingly, but not very surprising as analysts, including ourselves, tend to be optimistic, forecasters expect basically all companies to improve their underlying performance in 2023 relative to 2022 – this pattern was similar for 2021 relative to 2022 in our last report.
247
ANOD
ADMCM
BUSER
BIM
BUILD
CARA
CHECKCSAMEFECTE
FPIP
FNOX
LEADD
LIMELITI
MRCEL
NORDH
PSKY
PENNEO
PEXIP
SFTR
SMCRT
UPSALEVERT
VITEC
XMR
-40%
-30%
-20%
-10%
0%
10%
20%
30%
40%
50%
0% 10% 20% 30% 40% 50% 60% 70%
EBIT
mar
gin
Sales growth
Rule of 40 2023E (November 2021)
November 2021, Source: Redeye Research, Company reports, FactSet
247 ANOD
ADMCM
BUSERCARA
CHECK
CSAMEFECTEFPIP
FNOX
LEADD
LIME
LITIMRCEL
NORDHPENNEO
PEXIPPTRK
SFTR
SMCRTUPSALE
VERT
VITEC
XMR
R² = 0.1973
0
5
10
15
20
25
30
-10% 10% 30% 50% 70%
EV/S
ales
Sales growth + EBIT margin
EV/S vs Growth + EBIT m. 2022E (Nov. 2021)
247
ANOD
ADMCM
BUSER
BIM
CARA
EFECTEFPIP
FNOX
LEADD
LIME
LITI
MRCEL
PEXIP
SFTR
UPSALE
VERT
VITEC
XMR
ZETA
ZUTEC
0
5
10
15
20
0% 20% 40% 60% 80%
EV/S
ales
Sales growth + EBIT margin
EV/S vs Growth + EBIT m. 2022E (April 2021)
November 2021, Source: Redeye Research, Company reports, FactSet
November 2021, Source: Redeye Research, Company reports, FactSet
Less Correlation as 2022 Approaches
While underlying forecasts (excluding M&A) have remained largely unchanged, as mentioned earlier, valuations have increased slightly relative to November 2020 for most com-panies. However, as we are now in April and closer to the 2021 cash flows, a slight increase in valuations is expected, everything else being equal. Thus, regarding underlying estimates and valuations, the situation remains largely unchanged compared to our last SaaS report in November 2020.

17REDEYE - SAAS REPORT 2021
SOFTWARE OVERVIEW
247ANOD
ADMCM
BUSER
BUILD
CARA
CHECK
CSAMEFECTEFPIP
FNOX
LEADD
LIME
LITIMRCEL
NORDH
PSKY
PENNEO
PEXIP
SFTR
SMCRTUPSALE
VERT
VITEC
XMR
R² = 0.4399
0
5
10
15
20
25
0% 20% 40% 60% 80%
EV/S
ales
Sales growth + EBIT margin
EV/S vs Growth + EBIT m. 2023E (Nov. 2021)
247ANOD
ADMCM
BUSER
BIMBUILD
CARA
CHECK
CSAMEFECTEFPIP
FNOX
LEADD
LIME
LITIMRCEL
NORDH
PSKY
PENNEO
PEXIP
SFTR
SMCRT UPSALE
VERT
VITEC
XMR
R² = 0.0195
0
5
10
15
20
25
0% 10% 20% 30% 40% 50% 60% 70%
EV/S
ales
Sales growth
EV/S vs Growth 2023E (November 2021)
November 2021, Source: Redeye Research, Company reports, FactSet
November 2021, Source: Redeye Research, Company reports, FactSet
Strong Correlation Between EV/S and R40 Persists
As mentioned earlier, we believe 2023E is a better proxy for the underlying performance than 2022E, as 2023E is most-ly unaffected by M&A. Overall, the picture is similar to the 2021E figure from our previous SaaS report from April 2021, with a high correlation between EV/S and sales growth + EBIT margin.
Companies that can combine high growth with decent mar-gins or vice versa are unsurprisingly valued at high multiples. High growth and margins combined indicate that the compa-ny can grow its sales efficiently. Companies with a combined sales growth and EBIT margin of 40% or above are generally considered to be successful SaaS companies – i.e., the “Rule of 40”. However, several other essential factors determine valuation—for example, company size, competitive advantag-es, recurring revenue share, and total addressable market.
The graph above is only a snapshot of the total sales growth rate and margin, in this case, the estimates for 2021. The long-term sales growth and margin outlooks are likely more important to the businesses’ valuation than the 2021E snapshot. However, there tends to be a high serial correlation regarding both sales growth and margins over the years in most SaaS businesses. That is likely one reason behind the high correlation between EV/Sales multiples and the sales growth + EBIT margin. Note that most Nordic SaaS compa-nies are followed only by one or a couple of analysts, which likely decreases the estimates’ accuracy.
Profitability Important in Lack of Proper Metrics While sales growth arguably is more important than mar-gins, as it compounds and generally results in high margins over time (assuming scalable SaaS businesses), margins remain an important component in Nordic SaaS businesses’ valuations. As mentioned earlier, the correlation between sales growth + EBIT margins and EV/S is significant for Nordic SaaS businesses. However, when comparing only sales growth to EV/S, the correlation is weak, as shown in the figure below.
In the US, sales growth tends to be more important, with a higher correlation between EV/S and sales growth. We believe one reason for the difference between the US and the Nordics is the lack of companies disclosing SaaS metrics. While almost every unprofitable SaaS business will tell you it could be profitable if it wanted to, without the right SaaS met-rics it is hard for investors to evaluate the statement. Thus, in the lack of the proper metrics, we believe investors are unwilling to pay high multiples for unprofitable companies.

18REDEYE - SAAS REPORT 2021
SOFTWARE OVERVIEW
SaaS EV SalesCompany (SEKm) 21E 21E 22E 23E 21E 22E 23E 21E 22E 23E 21E 22E 23E24SevenOffice 788 228 3.5 2.8 2.3 neg neg neg 35% 27% 19% -22% -18% -4%Addnode 12 045 4 008 3.0 2.6 2.4 42 32 27 5% 15% 12% 7% 8% 9%Admicom 4 124 252 16.4 13.6 11.4 38 31 25 13% 18% 17% 44% 44% 46%Bambuser 3 495 156 22.3 10.8 7.0 neg neg neg 403% 106% 56% -116% -52% -15%BIMobject 585 123 4.7 4.3 3.7 neg neg neg -10% 18% 23% -69% -40% -24%Briox 186 6 31.0 20.0 14.2 neg neg neg 35% 67% 50% -333% -190% -113%BuildData 307 44 7.0 3.3 2.7 neg neg neg 0% 106% 26% -28% -14% -5%Carasent 2 545 142 18.0 13.0 10.4 81 51 35 99% 36% 22% 22% 25% 30%CSAM 1 815 352 5.2 3.8 3.2 neg 53 31 52% 48% 31% -3% 7% 10%Efecte 861 174 4.9 4.2 3.6 213 65 35 16% 16% 17% 2% 7% 10%Formpipe 1 675 465 3.6 3.5 3.1 27 25 19 15% 3% 10% 14% 14% 16%Fortnox 37 931 926 41.0 29.9 22.2 115 74 51 34% 36% 33% 36% 40% 44%LeadDesk 1 195 262 4.6 3.6 2.9 238 65 40 88% 24% 23% 2% 5% 7%Lime 4 696 410 11.4 9.4 7.9 54 43 30 21% 19% 17% 21% 22% 26%Litium 276 62 4.4 3.4 2.6 neg 92 11 28% 29% 31% -19% 4% 23%Mercell 3 938 741 5.3 4.2 3.6 neg 67 25 136% 26% 15% -6% 6% 14%NordHealth 2 594 203 12.8 8.4 7.0 neg neg 297 48% 66% 30% -7% -3% 2%PatientSky 748 209 3.6 3.6 3.2 neg neg neg 48% 15% 22% -30% -32% -20%Penneo 992 56 12.9 8.8 6.4 neg neg neg 58% 46% 39% -46% -42% -29%Pexip 3 511 833 4.2 3.5 2.6 neg neg neg 22% 36% 38% -37% -33% -8%Physitrack 690 76 9.1 5.9 n/a 60 29 n/a n/a 53% n/a 15% 20% n/aSafeture 264 27 9.9 7.0 4.8 neg neg 698 24% 47% 46% -82% -32% 1%SmartCraft 3 688 272 13.5 10.9 9.3 46 34 27 nmf 24% 17% 29% 32% 34%Upsales 1 296 93 13.9 11.1 8.6 99 52 39 24% 24% 26% 14% 21% 22%Vertiseit 673 127 5.3 3.7 3.0 210 53 20 65% 45% 22% 3% 7% 15%Vitec 19 366 1 592 12.2 11.6 11.2 62 60 57 21% 4% 2% 20% 19% 20%XMReality 138 26 5.3 3.5 2.5 neg neg neg 26% 54% 40% -98% -34% -5%Average 3 786 410 10.5 7.3 5.9 93 47 78 57% 45% 27% -23% -6% 6%Median 1 245 189 7.0 4.3 3.6 61 52 30 27% 32% 23% -2% 6% 10%Source: Redeye, Company reports, FactSet
EV/SALES EV/EBIT (x) Sales growth EBIT margin
The peer table above shows the estimated multiples, growth, and EBIT margins for a large portion of the Nordic SaaS businesses. Some companies are not included in the “Rule of 40” and the “EV/S vs. Sales Growth + EBIT margin” as they are outliers.
Source: Redeye Research, Company reports, Eikon

19REDEYE - SAAS REPORT 2021
SOFTWARE OVERVIEW
Net Revenue Retention The Net Revenue Retention (NRR), sometimes called Net Dollar Retention, is the percentage of recurring revenue retained from existing customers relative to last year’s corresponding period. It considers churn, upsell, and down-grades (100% + upsell – churn – downgrades), and an NRR >100% means that the existing customer base has grown year over year.
Companies that can maintain an NRR substantially above 100% over time have a significant advantage. Customer acquisition costs are typically much higher for new custom-ers relative to upselling, making companies with high NRR more likely to become profitable over time. Also, a high NRR is a sign that customers are satisfied with the product as they, on average, increase their usage instead of churning.
The graph below highlights the significant impact of different NRRs for the average customer for five years. After a few years, the importance of a solid NRR is obvious. Over five years, a 30% difference in NRR results in a >200% difference in ARPA.
The importance of NRR becomes even clearer when adding several cohorts. In the examples below, we assume 100 in annual new sales, increasing by 5% per year, and an NRR of 115% and 95%, respectively. Over ten years, the company with 115% in NRR will have almost 2.5x the sales of the 95% NRR company. Thus, investors should value companies that can sustain a high NRR over time at higher multiples.
0
50
100
150
200
250
1 2 3 4 5
ARPA
Year
NRR - One Cohort Over Five Years
120% 110% 100% 90% 80%
0
500
1 000
1 500
2 000
2 500
1 2 3 4 5 6 7 8 9 10
Sale
s
Year
NRR 115% - Ten Cohorts Over Ten Years
1 2 3 4 5 6 7 8 9 10
0
500
1 000
1 500
2 000
2 500
1 2 3 4 5 6 7 8 9 10
Sale
s
Year
NRR 95% - Ten Cohorts Over Ten Years
1 2 3 4 5 6 7 8 9 10
While many other factors are important, of course, valuing the 115% NRR business at two times the 95% NRR business would not be unreasonable. As the 115% NRR business is likely to be more profitable over time, we believe an even larger difference can be justified in many cases.

20REDEYE - SAAS REPORT 2021
SOFTWARE OVERVIEW
95%
100%
105%
110%
115%
120%
125%
130%
135%
Q1 Q2 Q3
NRR
Year
NRR - Nordic SaaS
Penneo Carasent Efecte Mercell
Vertiseit (Dise) Pexip Safeture
A few Nordic SaaS businesses are reporting their NRR, and the graph below shows their numbers for 2021 so far. Basically, all companies reporting their NRR have an NRR in line with or above 100%. However, we would assume these numbers are not representative of the Nordics, as we believe companies with decent NRRs and above are more likely to disclose their numbers.
Note that some companies naturally should have a higher NRR than others. For example, we expect enterprise SaaS solutions with large customers to have a higher NRR than SaaS targeting SMEs. Also, companies typically starting out selling to only a fraction of a large corporation should gener-ally have a higher NRR than companies selling to the whole corporation up-front.
Among Nordic SaaS businesses reporting its NRR, Penneo is the star, with an NRR hitting 130% in H1 2021. While Penneo targets a large corporations, the solid NRR indicates custom-ers are satisfied with the solution, significantly increasing their usage of Penneo’s offering. Carasent, on the other hand, with an average NRR of ~120% in 2021 so far, mainly has its expansion driven by customers using additional integrations from Carasent’s ecosystem. Also, both companies have low churn rates (<3%), which is crucial to achieve a high NRR.

21REDEYE - SAAS REPORT 2021
SAAS METRICS
REDEYE Equity Research Redeye SaaS report 2020 14 April 2020
13
MMeettrriicc DDeeffiinniittiioonn CCaallccuullaattiioonn
MMRRRR = Number of customers * (ARPU / Month)IImmpplliieedd AARRRR = Actual MRR * 12
CCuussttoommeerr AAccqquuiissiittiioonn CCoosstt ((CCAACC)) All S&M costs for new customers. S&M / Number of new customers
CCuussttoommeerr LLiiffeettiimmee VVaalluuee ((CCLLTTVV))
CLTV is the net present value of the recurring profit streams of a given customer less the acquisition cost. (ARPU * Gross margin) / Churn
CCuussttoommeerr AAccqquuiissiittiioonn CCoosstt PPaayybbaacckk PPeerriioodd
The CAC payback period is a statement in months, of the time to fully payback sales and marketing investment.
Total S&M costs last quarter / (New MRR added last quarter * Gross margin)
CCuussttoommeerr GGrroossss//LLooggoo CChhuurrnn
This is a percentage calculation of all customer names (“logos”) that have churned over the measured time period.
Customers lost over time period / Customers at the beginning of time period
GGrroossss DDoollllaarr RReetteennttiioonn:: Looks at how much of the customer ARR are kept over the measured time period. As such it’s always below 100%. ARR – downgrades – churn / Beginning ARR
NNeett DDoollllaarr RReetteennttiioonn:: As above, but including upgrades. As such it’s can be higher than 100% (and should be for a healthy business). (ARR + upgrades – downgrades – churn) / Beginning ARR
Source: Redeye Research
RReetteennttiioonn
MMRRRR && IImmpplliieedd AARRRR Measurment of monthly/annual recurring revenue.
KKeeyy SSaaaaSS MMeettrriiccss
SSMMBB MMiiddmmaarrkkeett EEnntteerrpprriissee
AARRRR ggrroowwtthh 4400--5500%%++ 5500--6600%%++ 3300--5500%%++
GGrroossss RReetteennttiioonn 7700--8800%% 8800--9900%% 9900%%++
NNeett RReetteennttiioonn 8800--110000%% 9900--112200%% 111100%%++
LLTTVV//CCAACC 33--55xx 44--66xx 44--66xx
CCAACC PPaayybbaacckk PPeerriioodd 33--66 MMooss 1122 MMooss 1188--2244 MMooss
GGrroossss MMaarrggiinn
Source: Redeye Research
5500--7755%%++
SSaaaaSS MMeettrriiccss ffoorr ddiiffffeerreenntt ccuussttoommeerr sseeggmmeennttss
BBeesssseemmeerr VVeennttuurree PPaarrttnneerrss EEffffiicciieennccyy SSccoorree ((<< $$3300 mmiilllliioonn AARRRR))
Source: Bessemer Venture Partners
SaaS Metrics There are many metrics to use when evaluating the strength of a SaaS business. Data on CAC, retention, and churn are crucial to look at. Public SaaS companies in the USA most often report their CAC, ARR, gross margin, and retention rates. Sadly in the Nordic’s only one, Agillic (AGILIC:CHP) of the publicly listed companies report both their CAC and retention rates. We hope we will see an improvement in metric disclosure. In the tables below we explain different kinds of SaaS metrics and provide benchmarks to look at when evaluating recurring revenue business.
There are many metrics to use when evaluating the strength of a SaaS business. Data on CAC, retention, and churn are crucial to look at. Public SaaS companies in the USA most often report their CAC, ARR, gross margin, and retention rates. Sadly in the Nordic’s, we are not aware of any publicly listed companies reporting both their CAC and retention rates. We hope we will see an improvement in metric disclosure. The tables below explain different kinds of SaaS metrics and provide benchmarks to look at when evaluating recurring revenue business.

In this section, we present different valuation and operational metric benchmarks. Data from Redeye and FactSet (Novem-ber 2021).
Nordic Public Metrics Benchmarks
22REDEYE - SAAS REPORT 2021
30
2120
14 1312 11 11 11
9 9 87
64 4 4 4 4 4 4 3 3 3 3 3 3 3
1
22
13 14
11 10 119 9
7 86 7
54 4 4 3 3 3 3 3 2 3 3 2 2
1
0
5
10
15
20
25
30
EV/Sales2022E 2023E
7067 66
54 5348 47 46 45
36 36 3629 27 26 24 24 24
19 18 18 16 15 157 4 3
56
26
62
50
30
40
31
4639
22 22
3833 31
1915 17
26 2317 17
2317
22
126 2
10
0
10
20
30
40
50
60
70
80
90
100
Sales growth (%)2022E 2023E

23REDEYE - SAAS REPORT 2021
74
67 65 6560
53 52 52 51
43
34 32 31 2925
17
812
51
25
4035
57
31
20
3935
3027 27 25
19
7 6
0
10
20
30
40
50
60
70
80
LITI FNOX MRCEL LEADD EFECTE VITEC CSAM VERT UPSALE CARA LIME SMCRT ANOD ADMCM PTRK FPIP IRIST MNTR
EV/EBIT2022E 2023E
4440
32
2522 21 20 19
1714
8 7 7 7 6 5 4
4644
3430
2622
20 2016
9 10
1510
14
7
23
05101520253035404550
ADMCM FNOX SMCRT CARA LIME UPSALE PTRK VITEC MNTR FPIP ANOD CSAM VERT EFECTE MRCEL LEADD LITI
EBIT margin (%)2022E 2023E
92
76 73
63 62 6257 55 54 52 52
4541
33 3329
24 23 23 23 20 17 1510
4 3
20
76
32
63
52 51
41 41 37
65
4843
29
54
3022
2720
3527
47
159
30
0102030405060708090100
G+P Ratio (%)2022E 2023E
Sales growth + EBIT margin

Covered Companies
24REDEYE - SAAS REPORT 2021

Addnode Group 26
Artificial Solutions 28
BIMobject 30
Carasent 32
Formpipe Software 34
Fortnox 36
Penneo 38
Safeture 40
Speqta 42
Vertiseit 44
XMReality 46
25REDEYE - SAAS REPORT 2021
COVERED COMPANIES

26REDEYE - SAAS REPORT 2021
Addnode Group ANOD B Company page
https://www.redeye.se/company/addnode-group
Publication date
November 10 2021
Analyst
Fredrik [email protected]
Conflict of interests
Fredrik Nilsson owns shares in Addnode Group: No
Redeye performs/have performed services for the Company and receives/have
received compensation from the Company in connection with this.
Snapshot
Addnode GroupOMXS30
Marketplace NASDAQ Stockholm
CEO Johan Andersson
Chairman Staffan Hanstorp
Share information
Share price (SEK) 349.5
Number of shares (M) 33.6
Market cap (MSEK) 11,754
Net debt (MSEK) 0
Financials
Redeye Estimates
2019 2020E 2021E 2022E 2023E
Revenue, MSEK 3,434 3,807 4,182 4,867 5,322
Growth 16.7% 10.9% 9.9% 16.4% 9.3%
EBITDA 413 444 414 596 572
EBITDA margin 12.0% 11.7% 9.9% 12.2% 10.8%
EBIT 218 229 307 392 430
EBIT margin 6.4% 6.0% 7.4% 8.1% 8.1%
Pre-tax earnings 175 211 290 378 417
Net earnings 128 163 225 295 325
Net margin 3.7% 4.3% 5.4% 6.1% 6.1%
Dividend/Share 2.50 2.50 3.00 3.50 4.00
EPS adj. 3.83 4.85 6.68 8.78 9.66
P/E adj. 46.6 77.1 55.9 42.6 38.7
EV/S 1.8 3.3 3.1 2.6 2.4
EV/EBITDA 15.1 28.5 31.2 21.6 22.6
Last updated: 2021-07-22
Owner Equity Votes
SEB Fonder 10.3% 8.1%
Swedbank Robur Fonder 8.9% 7.0%
ODIN Fonder 6.5% 5.2%
Handelsbanken Fonder 5.6% 4.4%
Staffan Hanstorp & Jonas Gejer 5.4% 15.1%
Lannebo Fonder 5.0% 4.0%
Fjärde AP-fonden 4.4% 3.5%
Andra AP-fonden 4.4% 3.4%
Nordea Fonder 4.3% 3.4%
AMF Pension & Fonder 3.6% 2.9%
Redeye Rating
COMPANY QUALITY
5People
5Business
4Financials
FAIR VALUE RANGE
Base305.0
Bear170.0
Bull410.0
Last price349.5
TIMELINESS
6
VolumeVolume
Jan Mar May Jul Sep Nov
200
250
300
350
400
0
500k

27REDEYE - SAAS REPORT 2021
Company descriptionAddnode Group was established in 2003 and is listed on Nasdaq OMX
Stockholm. In 2019 Addnode had a turnover of SEK 3.4 billion, with an EBITA of
SEK 327million. Addnode Group is divided into three divisions: Design
Management, Product Lifecycle Management, Process Managemen. The
business segments operate in different regions with about 25 different brands.
Operating margin varies considerably between the various business areas
where the most profitable can perform up to 20 percent. Addnode Group uses a
very decentralized management model where the individual subsidiaries are
run by management teams to maintain an entrepreneurial spirit. A key growth
strategy in Addnode Group is to grow through acquisitions, which they
managed to do successfully in recent years. The company's own financial
goals is to reach a growth of 10% per year (both organically and through
acquisitions), an EBITA margin of 10% and at least 50% of profit after tax will be
distributed to shareholders.
Investment case• Has evolved into becoming a software company
• Interesting acquisition history
• Well-diversified in three different divisions
Investment case
Has evolved into becoming a software company. Today, only about 25% of
Addnode’s sales are related to services, and most of these services are related
to the implementation of the company’s software solutions. Moreover, the
company has a strong focus on recurring revenues, and today more than 60%
of sales are recurring revenues. These qualities make us believe the company
should be valued at a premium compared to the IT-consultants. More precisely,
we claim Addnode should be valued in line with comparable software
companies.
Interesting acquisition history. Addnode has for a long been one of our
favorites in its sector. The company has a successful acquisition history, which
driven by its focus on fair price, good people, and management in place. As a
result of the completed acquisitions, Addnode has increased its debt. However,
we claim that the leverage is healthy and that the acquisitions have been value-
creating. Since 2013, Addnode has acquired about 30 businesses, adding a
total of over SEK 2 000m in sales. Historically, the company has acquired at 6x
EBITA, way below Addnode’s valuation. We believe the prospects for additional
value-adding acquisitions is good, however, it is partly already priced in
according to us.
Well-diversified in three different divisions. To sum up, Addnode is well
diversified in three different divisions with interesting niches. Further, the
company has taken a leading Nordic position in most of its niches, which also
is the ambition for all of its business areas.
Counter-Thesis – Bear points
Dependent on the economy and the willingness to invest
In recent years, Addnode has had a favorable demand from manufacturing
industries, as well as the construction and property sector. During the last
quarters, some smaller and specialized companies in the real estate industry
appear to have problems. However, Addnode’s direct exposure to housing
developers is low, and it should therefore not be concluded that Addnode will
face lower demand in the coming quarters. Even so, we will follow the
development of the Design Management business area as well as the
underlying industry.
Acquisition-led growth always risky
Organic growth can be slow, international expansion is complex and
acquisitions tend to be difficult. Despite Addnode’s successful acquisition
history, acquiring companies takes time and poses a risk. Nevertheless, we
have confidence in the management team.
Catalyst types
Increase in SaaS orders
The shift towards more SaaS orders may affect sales and earnings negatively
in the short run. However, we believe that the shift will have a positive impact
on profitability in the long term.
Economic downturn
While we believe Addnode diversification in terms of markets and regions as
well as the digitalization help making the company rather resilient to economic
downturns, software revenue is generally related to the number of users. Thus,
layoff of engineers likely has a negative effect on Addnode’s revenue and profit.
COVERED COMPANIES

28REDEYE - SAAS REPORT 2021
Artificial Solutions ASAI Company page
https://www.redeye.se/company/artificial-solutions
Publication date
November 10 2021
Analyst
Forbes [email protected]
Conflict of interests
Forbes Goldman owns shares in Artificial Solutions: No
Redeye performs/have performed services for the Company and receives/have
received compensation from the Company in connection with this.
Snapshot
Artificial SolutionsOMXS30
Marketplace First North Stockholm
CEO Per Ottosson
Chairman Åsa Hedin
Share information
Share price (SEK) 7.2
Number of shares (M) 65.7
Market cap (MSEK) 476
Net debt (MSEK) 166
Financials
Redeye Estimates
2019 2020 2021E 2022E 2023E
Revenue, MSEK 49 54 40 57 80
Growth 9.1% 9.6% -24.7% 41.3% 40.4%
EBITDA -134 -85 -60 -52 -39
EBITDA margin Neg Neg Neg Neg Neg
EBIT -146 -97 -73 -65 -52
EBIT margin Neg Neg Neg Neg Neg
Pre-tax earnings -181 -154 -75 -88 -78
Net earnings -181 -154 -75 -88 -78
Net margin 0.0% 0.0% 0.0% 0.0% 0.0%
Dividend/Share 0.00 0.00 0.00 0.00 0.00
EPS adj. -9.33 -3.62 -1.15 -1.35 -1.20
P/E adj. -0.7 -3.2 -6.6 -5.6 -6.3
EV/S 6.9 12.4 15.4 12.4 9.8
EV/EBITDA -2.5 -7.8 -10.3 -13.5 -20.1
Last updated: 2021-11-01
Owner Equity Votes
Scope 25.6% 25.6%
UBS Switzerland AG 9.0% 9.0%
Banque Cantonale Vaudoise 6.9% 6.9%
Nice & Green 5.6% 5.6%
AFA Försäkring 5.0% 5.0%
SEB-Stiftelsen 4.4% 4.4%
ATS Finans AB 3.0% 3.0%
JP Morgan Bank Luxembourg S.A. 2.6% 2.6%
C WorldWide Asset Management 2.6% 2.6%
Avanza Pension 2.6% 2.6%
Redeye Rating
COMPANY QUALITY
4People
3Business
1Financials
FAIR VALUE RANGE
Base11.0
Bear2.0
Bull36.0
Last price7.2
TIMELINESS
5
VolumeVolume
Jan Mar May Jul Sep Nov
6
8
10
12
14
0
2M

29REDEYE - SAAS REPORT 2021
Company descriptionFounded in 2001, Artificial Solutions is best known for Teneo, its flagship
product. Teneo is an Azure-based (Microsoft) development platform for
Conversational Artificial Intelligence (CAI). Essentially, Teneo appeals to
developers - both independent and at large corporations - to program
conversational applications. About 90% of the use cases regard customer-
facing services. In 2020, Artificial Solutions appointed Per Ottosson as CEO
and initiated its transition to a SaaS business and delivery model shortly after
that. The company is listed on First North and has around 60 employees.
Investment case• Scalable SaaS Business Model
• Major Partners to Drive Growth
• Attractive Exposure to the Conversational AI Market
Scalable SaaS Business Model
Artificial Solutions announced its transition to a SaaS business and delivery
model in Q1 2021. In contrast to its previous model, the SaaS model is
inherently scalable, owing to its usage-based revenues. Additionally, the
company expects to transition most of its installed base from the legacy to the
SaaS model in 2022, representing a SEK >75m ARR opportunity.
Major Partners to Drive Growth
Since Q3 2021, Artificial Solutions has an IP Co-Sell Incentivized Partnership
with Microsoft. Essentially, it means that Microsoft's sales team is incentivized
through commissions to promote Teneo to enterprise clients on Microsoft
Azure. The agreement marks a vote of confidence in Teneo and could enable
significant lead-generation among the 1,700+ organizations using Microsoft
Azure and LUIS.
Artificial Solutions relies on systems integrators and channel partners such as
Tech Mahindra, CGI, and Deloitte to drive sales and usage. These partners have
a global profile and could reach many potential customers at a limited
customer acquisition cost.
Attractive Exposure to the Conversational AI Market
The Conversational AI Market is a $50B industry, while its software segment
represents a $14B opportunity growing at a 22% CAGR. As one of the leading
companies in this space, and one of the only publicly listed peers, Artificial
Solutions provides attractive exposure to this sought-after market.
Solid Financial Position
In Q3 2021, Artificial Solutions agreed to a long-term SEK 250m financing
agreement with Capital Four, a leading credit asset management firm in the
Nordics (€15 billion AUM). Essentially, the company will not need to make cash
interest payments during the five-year tenure, in addition to interest expenses
decreasing by 7ppts. Near- and mid-term financing issues are out of the
picture, providing management ample room to execute on its SaaS model and
sales ramp-up.
Catalyst typesEarly Signs of Significant Usage Revenue Potential
The SaaS model launched in 2021 could turn out to be highly scalable.
However, it is still early days, and the model remains unproven. Early signs of
scalability, such as steady sequential usage growth, should inspire confidence
in its long-term potential.
Significant ARR and Top-Line Growth
Solid quarterly reports demonstrating significant top-line growth, and thus a
path to profitability should positively impact the share price.
Lighthouse Customer Agreements
We see great potential in large corporations choosing to implement Teneo and
Conversational AI for an increasing number of use-cases. Apart from yielding a
significant ARR at high margins, it could indicate that its industry is truly ready
to adopt the technology on a larger scale.
COVERED COMPANIES
30REDEYE - SAAS REPORT 2021
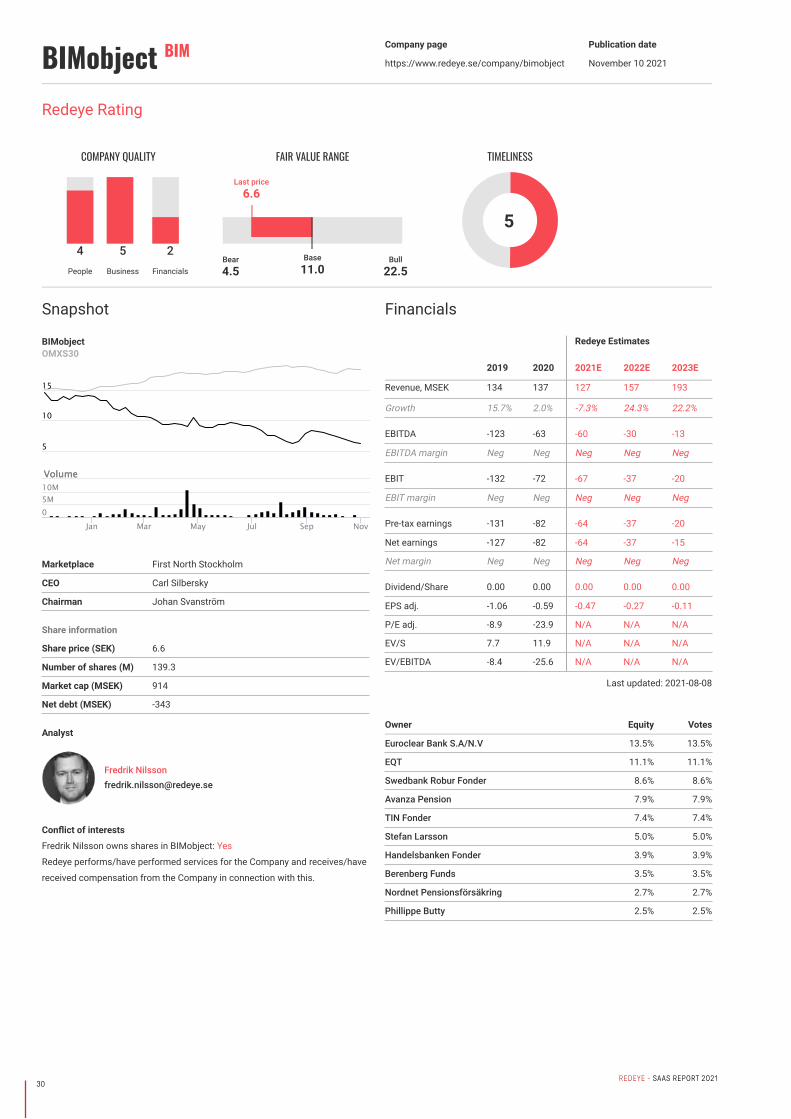
BIMobject BIM Company page
https://www.redeye.se/company/bimobject
Publication date
November 10 2021
Analyst
Fredrik [email protected]
Conflict of interests
Fredrik Nilsson owns shares in BIMobject: Yes
Redeye performs/have performed services for the Company and receives/have
received compensation from the Company in connection with this.
Snapshot
BIMobjectOMXS30
Marketplace First North Stockholm
CEO Carl Silbersky
Chairman Johan Svanström
Share information
Share price (SEK) 6.6
Number of shares (M) 139.3
Market cap (MSEK) 914
Net debt (MSEK) -343
Financials
Redeye Estimates
2019 2020 2021E 2022E 2023E
Revenue, MSEK 134 137 127 157 193
Growth 15.7% 2.0% -7.3% 24.3% 22.2%
EBITDA -123 -63 -60 -30 -13
EBITDA margin Neg Neg Neg Neg Neg
EBIT -132 -72 -67 -37 -20
EBIT margin Neg Neg Neg Neg Neg
Pre-tax earnings -131 -82 -64 -37 -20
Net earnings -127 -82 -64 -37 -15
Net margin Neg Neg Neg Neg Neg
Dividend/Share 0.00 0.00 0.00 0.00 0.00
EPS adj. -1.06 -0.59 -0.47 -0.27 -0.11
P/E adj. -8.9 -23.9 N/A N/A N/A
EV/S 7.7 11.9 N/A N/A N/A
EV/EBITDA -8.4 -25.6 N/A N/A N/A
Last updated: 2021-08-08
Owner Equity Votes
Euroclear Bank S.A/N.V 13.5% 13.5%
EQT 11.1% 11.1%
Swedbank Robur Fonder 8.6% 8.6%
Avanza Pension 7.9% 7.9%
TIN Fonder 7.4% 7.4%
Stefan Larsson 5.0% 5.0%
Handelsbanken Fonder 3.9% 3.9%
Berenberg Funds 3.5% 3.5%
Nordnet Pensionsförsäkring 2.7% 2.7%
Phillippe Butty 2.5% 2.5%
Redeye Rating
COMPANY QUALITY
4People
5Business
2Financials
FAIR VALUE RANGE
Base11.0
Bear4.5
Bull22.5
Last price6.6
TIMELINESS
5
VolumeVolume
Jan Mar May Jul Sep Nov
10
5
15
05M10M

31REDEYE - SAAS REPORT 2021
Company descriptionBIMobject's mission is to digitalize construction for a more sustainable future.
It's a global marketplace for the construction industry that provides architects
and engineers with the information and inspiration they need to design
buildings faster, smarter and greener.
With 2000+ building product brands and 100 of the world’s top 100 architect
firms among its users, it power digital building design worldwide. In 2019, the
company had annual net sales of SEK 134 million.
Investment case• Set to capture market share
• Global potential
• Strategic shift – fueling path to black numbers
• High earnings potential
Set to capture market share
With slim margins, the construction industry is urging for increased efficiency
as it has been lagging significantly in the last decade compared to the rest of
the world. At the same time, we expect Building Information Modelling (BIM) to
be one of the main efficiency drivers in the industry going forward. In a
fragmented market with high underlying growth, we believe that BIMobject, as
the leading global BIM-library provider, is set to capture a significant market
share.
Global potential
Compared to most of the Swedish listed Software as a Service (SaaS)
companies, BIMobject has global potential and is on a good way to becoming
the global leader within its niche. The market, who yet is in the early stage,
offers solid growth prospects of >10% yearly with an estimated TAM larger
than SEK >3.2bn at this point.
Strategic shift – fueling path to black numbers
Historically, BIMobject has had an opportunistic strategic approach, not
utilizing its full potential as a software company. Its new management, which
shows a good understanding of the business and market, has put several new
strategic initiatives into place, adapting its strategy to SaaS-based metrics,
while having its own skin in the game further adds to our positive view.
The most important initiatives include;
• Restructuring of the sales team and processes to accelerate ARR growth,
decrease the CAC payback period, reducing lead times, and improve
onboarding
of new customers from 90 to 30 days
• Improving its product offer and changing its pricing to a value-based
model, which we expect will impact ARPB.
• Establishing a customer success team to reduce churn and increase
customer satisfaction, reducing churn from historically high levels of 12%
to <5%
• Implementing a cost reduction program, reducing yearly OPEX of SEK
50m
High earnings potential
With i) attractive sales growth opportunities, ii) a competitive product offering
for manufacturers and iii) a scalable business model with a high degree of
recurring revenues, we argue that BIMobject is well-positioned for high
profitability in the long-term. As the global leading BIM-library provider, acting
as the market consolidator, growth will be the main focus in the next coming
years.
Catalyst types
Continued growth in recurring revenues
The recurring platform sales remain BIMobject's primary focus going forward.
The growth rate of ARR will be key to its path of market dominance and
profitability. Even if the indicator is lagging, we believe the metric will be critical
for the development of the stock. In the following quarterly reports, keep an eye
on the ARR but also on the net added manufacturers/brands to its client base,
which will be leading.
Profitable growth
Historically, BIMobject has been growing sales significantly but also raised its
OPEX at the same pace. The company is now at a point where increased sales
can emerge into improved profitability, and later on to black numbers. Turning
the trend around in a first step, and secondly reaching above breakeven should
increase the investor sentiment in the stock.
COVERED COMPANIES

32REDEYE - SAAS REPORT 2021
Carasent CARA Company page
https://www.redeye.se/company/carasent
Publication date
November 10 2021
Analyst
Mark Siö[email protected]
Conflict of interests
Mark Siöstedt owns shares in Carasent: Yes
Redeye performs/have performed services for the Company and receives/have
received compensation from the Company in connection with this.
Snapshot
CarasentOMXS30
Marketplace Oslo Børs
CEO Dennis Höjer
Chairman Johan Lindqvist
Share information
Share price (NOK) 44.6
Number of shares (M) 78.6
Market cap (MNOK) 3,502
Net debt (MNOK) -220
Financials
Redeye Estimates
2019 2020 2021E 2022E 2023E
Revenue, MNOK 48 71 141 192 233
Growth 100.0% 47.3% 99.1% 36.3% 21.6%
EBITDA 11 23 51 71 94
EBITDA margin 24.8% 33.0% 36.5% 37.5% 40.6%
EBIT 5 10 30 48 69
EBIT margin 11.5% 15.1% 21.9% 25.2% 30.0%
Pre-tax earnings 5 -35 4 52 74
Net earnings 4 -38 3 44 63
Net margin 8.9% Neg 9.1% 25.5% 28.9%
Dividend/Share 0.00 0.00 0.00 0.00 0.00
EPS adj. 0.10 -0.56 0.16 0.60 0.84
P/E adj. 1,158.2 -202.6 682.4 184.0 133.2
EV/S 102.7 85.5 -6.4 41.9 34.2
EV/EBITDA 414.6 258.8 -17.6 111.8 84.3
Last updated: 2021-11-09
Owner Equity Votes
Vitruvian Partners 15.3% 15.3%
BNP Paribas Securities Services 15.3% 15.3%
Aeternum Capital AS 13.3% 13.3%
Carnegie Investment Bank AB 9.1% 9.1%
Avanza Bank AB 5.4% 5.4%
Danske Bank A/S 5.0% 5.0%
Swedbank AB 4.8% 4.8%
Swedbank Försäkring 4.7% 4.7%
BMO Global Asset Management 4.4% 4.4%
Nordnet Bank AB 4.2% 4.2%
Redeye Rating
COMPANY QUALITY
5People
4Business
3Financials
FAIR VALUE RANGE
Base58.0
Bear25.0
Bull75.0
Last price44.6
TIMELINESS
5
VolumeVolume
Jan Mar May Jul Sep Nov
20253035404550
0
10M

33REDEYE - SAAS REPORT 2021
Company descriptionCarasent is building a house of brands, focusing on e-health solutions such as
EMR/EHR systems, health- and social care ERP, general IT, and add-on
software. It acquired Evimeria in April 2018 (the purchase price was NOK 75m,
or EV/S ~2.7x), Avans Soma in December 2020 (the price was NOK 126.7m, or
EV/S ~5.3x), and Metodika in May 2021 (the price was NOK 108m, or EV/S
~3.9x).
Evimeria is a software as a service (SaaS) company selling an electronic
medical record (EMR) system and integrated services (partly from third-party
developers) to customers in the private Swedish healthcare sector. Avans
Soma is a developer of leading medical record systems and IT solutions in the
Norwegian health care market. And lastly, Metodika is a leading provider of
Enterprise Practice Management (EPM) solutions to independent hospitals and
clinics across 10 European countries.
Investment case• Evimeria has substantial headroom to grow by: i) continuing to win
market share in Sweden and becoming the dominant player, ii) launching
its Webdoc in neighboring countries, iii) moving into adjacent segments
such as dental care and social care, and iv) developing more integrated
services.
• We believe investors underestimate the long growth runaway and
reinvestment opportunities, focusing too narrowly on current multiples
rather than the impact of long-term compounding. The reinvestments are
both organic and inorganic.
• We argue that Carasent is a good “coffee can investment,” where time is
on the business’s side. We believe that every quarterly report, showing
stable profitable growth, will solidify Carasent’s reputation as a
qualitative investment. Compounders have time on their side.
Carasent is an investment management company with a special focus on
businesses that develop entrepreneurial and e-health solutions (EMR systems,
IT solutions, and add-on software). The software as a service (SaaS) company
has excellent unit economics (such as low churn, high net retention numbers,
low customer acquisition cost, high customer lifetime value, etc.) giving it a
solid base to grow from. In Q3’21, it had 811 units (specialists, general
practitioners, rehabilitation, smaller hospitals, etc.) connected to its platforms,
mainly in Sweden and Norway.
At the moment, Carasent has three operating assets: Evimeria, Metodika, and
Avans Soma. However, with a fortress balance sheet and a consolidator
mindset, management is setting out to bring in more software companies
under its umbrella. Carasent can expand in three dimensions: geographically,
segmentally, and through new products/services. The three dimensions
present great reinvestment opportunities to attractive incremental returns on
capital, allowing Carasent (either through Evimeria or another subsidiary) to
accomplish long-term, sustainable growth. It is often an overlooked blessing to
have clear reinvestment opportunities without tampering with profitability.
Carasent is owner-operated and all the senior managers own a significant
number of shares. The entrepreneurial spirit and the fleet-footed organizational
structure allow them to adapt and thrive in an ever-changing market. Carasent
is a visionary firm and the successful (and distinctive) business proposal vouch
for it.
Catalyst typesNorwegian Webdoc launch
We expect Evimeria to launch a Norwegian Webdoc version in late 2021 or
early 2022, thereby expanding its geographical print. Both Avans Soma and
Metodika have operations in Norway and a combined customer base of around
<200 units.
M&A
Carasent has identified M&A targets in all three growth dimensions:
geographical, segmental, and adjacent product/service areas. In December
2020, it used some of the proceeds from the rights issue in September in order
to acquire the Norwegian company, Avans Soma. In May 2021, Carasent
purchased the Swedish peer Metodika, consolidating the Scandinavian market
even further. Carasent has around NOK 900m in cash (after another private
placement), and we expect at least two more acquisitions in 2021.
Stable quarterly reports
We believe that every quarterly report, showing stable profitable growth, will
solidify Carasent’s reputation as a qualitative investment. Compounders have
time on their side.
Stockholm regional council's modular approach
Stockholm regional council has chosen a modular approach, benefiting EMR
developers such as Evimeria. Signs of larger customer intake from Stockholm
will serve as a catalyst for the stock, especially in the primary care segment.
COVERED COMPANIES

34REDEYE - SAAS REPORT 2021
Formpipe Software FPIP Company page
https://www.redeye.se/company/formpipe-software
Publication date
November 10 2021
Analyst
Fredrik [email protected]
Conflict of interests
Fredrik Nilsson owns shares in Formpipe Software: No
Redeye performs/have performed services for the Company and receives/have
received compensation from the Company in connection with this.
Snapshot
Formpipe SoftwareOMXS30
Marketplace NASDAQ Stockholm
CEO Christian Sundin
Chairman Bo Nordlander
Share information
Share price (SEK) 31.8
Number of shares (M) 53.7
Market cap (MSEK) 1,708
Net debt (MSEK) 0
Financials
Redeye Estimates
2019 2020E 2021E 2022E 2023E
Revenue, MSEK 394 403 465 480 494
Growth -3.1% 2.4% 15.3% 3.2% 3.0%
EBITDA 103 104 130 117 133
EBITDA margin 26.2% 25.9% 28.0% 24.4% 26.9%
EBIT 48 53 63 67 83
EBIT margin 12.1% 13.2% 13.6% 14.0% 16.7%
Pre-tax earnings 44 52 62 67 83
Net earnings 35 41 47 52 64
Net margin 8.9% 10.1% 10.2% 10.8% 12.9%
Dividend/Share 0.60 0.60 0.40 0.44 0.54
EPS adj. 0.66 0.76 0.89 0.97 1.20
P/E adj. 34.6 41.9 36.0 32.9 26.7
EV/S 3.2 4.2 3.5 3.3 3.1
EV/EBITDA 12.2 16.3 12.5 13.5 11.6
Last updated: 2021-11-01
Owner Equity Votes
Martin Gren (Grenspecialisten) 10.4% 10.4%
SEB Fonder 9.8% 9.8%
Martin Bjäringer 7.7% 7.7%
Swedbank Robur Fonder 7.6% 7.6%
Alcur Fonder 7.0% 7.0%
Nordea Fonder 6.8% 6.8%
TIN Fonder 6.0% 6.0%
Thomas Wernhoff 5.2% 5.2%
UBS Switzerland AG 3.4% 3.4%
Avanza Pension 3.0% 3.0%
Redeye Rating
COMPANY QUALITY
4People
5Business
4Financials
FAIR VALUE RANGE
Base41.0
Bear27.0
Bull49.0
Last price31.8
TIMELINESS
5
VolumeVolume
Jan Mar May Jul Sep Nov
26283032343638
0
1M

35REDEYE - SAAS REPORT 2021
Company descriptionFormpipe Software provides ECM (Enterprise Content Management) solutions
to public sector clients in Sweden and Denmark as well as the global Life
Science industry.The company is since 2010 listed on the OMX Small Cap
stock exchange. Formpipe has around 220 employees and is headquartered in
Stockholm, but also has a big part of its workforce in Denmark. The company
has a turnover of over 400 MSEK with an EBIT-margin of around 16%.
The ECM market comprises systems that capture, process, store, archive and
deliver information in a systematic way. This allows companies, organizations
and public authorities to manage the continuously increasing flow of
information in a connected, digital world. Through using ECM solutions, they
can therefore increase their productivity, efficiency and even reduce risks in
their business.Formpipe's key market segments, the Swedish and Danish public
sector, are regarded as relatively advanced in their use of ECM solutions. They
are ahead of the private sector, mostly due to regulatory pressure.
Formpipe's key competitors in the Nordics are Software Innovation (NO, part of
Tieto Group), Ida Infront (SE, part of Addnode Group), KMD (DK), and SBYS
(DK). We see Formpipe however in a leading position in their key customer and
product segments.
Investment case• Stable customer base and a high proportion of recurring revenues
• Software-as-a-Service (SaaS) sales are increasing rapidly
• Diversified product portfolio
• High scalability in the business makes us optimistic about the future
Investment Case
Stable customer base and a high proportion of recurring revenues. Formpipe’s
solutions help its clients to manage an ever-increasing flow of information,
which is a strong underlying driver for the business. The firm has a stable
customer base which primarily consists of public sector actors in Sweden and
Denmark, with a strong base of recurring revenues creating stability in the
business. Growth opportunities exist both in existing as well as new markets,
such as the Life Science sector.
Software-as-a-Service sales are increasing rapidly. For example, today the
majority of the Lasernet orders are sold as SaaS, and Formpipe believes that
this trend will continue in the coming years. A SaaS order is accrued over the
contract period, meaning that sales and profitability will be more stable
compared to if the product is sold as a traditional license. However, during the
migration phase from traditional license to SaaS, both profitability and sales are
affected negatively in the short term. On the positive side, this indicates that
Formpipe’s underlying profitability is better than what it may look like at first
glance.
Diversified product portfolio. The company has a history of both developing
own software products, as well as acquiring products, market expertise, and
client relationships. While the biggest focus is on public services clients, the
different products offered to different public, and private sector customer
groups mean that the company has a diversified product and market portfolio,
and is not a "one-trick pony".
High scalability in the business makes us optimistic about the future. In
summary, we consider Formpipe as a stable company due to its steady growth
in recurring revenues. As a result of the high scalability, we believe the
company to increase its margin on a mid-term basis. Also, Formpipe’s solid
market position of many of its products, long contracts and the increasing
trend towards cloud-based software usage, makes us even more optimistic
about Formpipe’s future.
Counter-Thesis - Bear Points
Increased competition: Formpipe may face increased competition from both
local players as well as international firms, and players from consulting and
product backgrounds joining forces, like Tieto.
Lower investment interest: The public sector might face reduced budgets over
time and therefore might have the less economic freedom to invest in systems
such as Formpipe’s.
Lack of profitability improvement: According to the sensitivity analysis, the
market expects a profitability improvement on a mid-term basis. Therefore, it is
important that Formpipe continue to improve its EBIT margin.
Catalyst typesIncrease in SaaS orders
The shift towards more SaaS orders may affect sales and earnings negatively
in the short run. However, we believe that the shift will have a positive impact
on profitability in the long term.
COVERED COMPANIES

36REDEYE - SAAS REPORT 2021
Fortnox FNOX Company page
https://www.redeye.se/company/fortnox
Publication date
November 10 2021
Analyst
Fredrik [email protected]
Conflict of interests
Fredrik Nilsson owns shares in Fortnox: Yes
Redeye performs/have performed services for the Company and receives/have
received compensation from the Company in connection with this.
Snapshot
FortnoxOMXS30
Marketplace Nordic SME
CEO Tommy Eklund
Chairman Olof Hallrup
Share information
Share price (SEK) 630.0
Number of shares (M) 61.0
Market cap (MSEK) 38,414
Net debt (MSEK) -413
Financials
Redeye Estimates
2019 2020 2021E 2022E 2023E
Revenue, MSEK 532 694 935 1,256 1,666
Growth 42.1% 30.4% 34.8% 34.4% 32.6%
EBITDA 204 332 413 597 819
EBITDA margin 38.5% 47.9% 44.3% 47.5% 49.2%
EBIT 172 265 329 504 728
EBIT margin 32.4% 38.3% 35.2% 40.2% 43.7%
Pre-tax earnings 172 262 325 504 728
Net earnings 134 205 255 393 568
Net margin 25.4% 29.6% 27.3% 31.3% 34.1%
Dividend/Share 0.00 0.00 0.00 0.00 0.00
EPS adj. 2.26 3.39 4.19 6.46 9.32
P/E adj. 54.2 N/A N/A N/A N/A
EV/S 13.2 N/A N/A N/A N/A
EV/EBITDA 34.4 N/A N/A N/A N/A
Last updated: 2021-10-27
Owner Equity Votes
Olof Hallrup 20.6% 20.6%
State Street Bank And Trust co 7.9% 7.9%
Swedbank Robur Fonder 6.8% 6.8%
Morgan Stanley & co Intl Plc 4.0% 4.0%
The Northern Trust Company 2.9% 2.9%
BNY Mellon NA (Former Mellon) 2.6% 2.6%
Spiltan Fonder 2.3% 2.3%
AMF Pension & Fonder 2.2% 2.2%
Invesco 2.1% 2.1%
Peder Klas-Åke Bengtsson 2.1% 2.1%
Redeye Rating
COMPANY QUALITY
4People
5Business
5Financials
FAIR VALUE RANGE
Base550.0
Bear260.0
Bull870.0
Last price630.0
TIMELINESS
9
VolumeVolume
Jan Mar May Jul Sep Nov
300
400
500
600
200
0
1M

37REDEYE - SAAS REPORT 2021
Company descriptionFortnox is a Växjö-based provider of software as a service (SaaS) enterprise
resource planning (ERP) systems for micro and small-sized enterprises,
including accounting, invoicing, customer relationship management (CRM) and
quotation & order. The company was founded in 2001 by Jan Älmeby, who also
founded Scandinavia PC Systems or Visma SPCS as it was renamed after
being acquired by Visma. In addition to its software offering, Fortnox also
offers financial services through its subsidiaries Fortnox Finance and
insurances through the newly started Fortnox Insurance. With over 350 000
customers, Fortnox can count ~1/3 of all Swedish micro and small-sized
businesses as its clients, making it the market leader in Sweden.
Investment case• Riding the SaaS-migration a few more years
• Exploit the data
• Significant barriers to enter
Investment case
Riding the SaaS-migration a few more years
The migration towards SaaS acts as a trigger for micro and small-sized
businesses to reevaluate their accounting software. It has been going on for
many years and has served Fortnox well – the number of customers has grown
to over 350 000 since the company was founded in 2001. However, we believe
there are still several years to come before the migration is finished.
Exploiting data
Thanks to its software offering, Fortnox has access to its customers’
accounting data. Thus, with ~1/3 of all Swedish micro- and small-sized
businesses as customers and growing, we believe there is a vast potential
waiting to be utilized going forward. Currently, Fortnox Finance has just scratch
the surface, with a penetration rate of ~2% of Fortnox’ customer base and an
ARPC of SEK ~950. Consequently, the ARPC contribution is merely SEK ~19.
However, just a slight increase in penetration would cause a substantial rise in
ARPC contribution. Looking forward, we believe that Fortnox will strengthen its
competitive edge through the data it can access. Several financial services –
such as loans and factoring – can be price more efficiently by using not only
the customers’ data but also the customers’ customers’ data. Additionally,
marketing can be targeted towards businesses base on their accounting data.
The newly started Fortnox Insurance can similarly benefit from the accounting
data. The data will tell if a business has insurance or not and detect any
actions that could require insurance, such as a purchase of machinery.
Significant barriers to enter
As the market leader regarding SaaS in Sweden, we believe that Fortnox has
significant advantages that are hard to break; business schools are teaching it,
~1/4 of all Swedish micro and small-sized businesses are customers, ~15 000
accountants are using the software regularly, and central deals are in place
with all major accounting offices, whereof some – including Aspia – have
based their solution on Fortnox’ software. Although it is easy to transfer data
from one accounting software to another, many accounting offices,
accountants and business owners have invested significant time in learning
and integrating Fortnox’ software. Thus, a monthly fee of SEK ~100 is likely
insignificant compared to the cost of spending several hours learning a new
system.
Counter-thesis – Bear Points
The death of the accounting offices
Most of the new entrants either want to eliminate the accounting offices or
take over their role, while Fortnox, on the other hand, cooperates with them.
Thus, if the accounting offices would become marginalized, Fortnox will lose
one of its most important competitive edges.
A major accounting office leaving Fortnox
Some major accounting offices – Aspia for example – currently have solutions
based on Fortnox' software. These deals are significant regarding customers,
but the ARPC is low. The main risk, according to us, however, is that other
offices might question Fortnox, as a major player is leaving.
Absence of significant ARPC increases
Our estimates of continuously increasing ARPC might be too optimistic. Fewer
companies than expected may need additional modules, financial services, and
insurance, for several reasons. For example, most businesses are tiny and have
zero employees and may, thus, only need accounting and invoicing software.
Catalyst typesIncreasing ARPC
We forecast the ARPC to continue to increase, mainly due to a higher
penetration for Fortnox Finance. However, small changes in the penetration
rate of lead to significant differences in ARPC and, thus, valuation. We believe
there is a possibility for the ARPC do deviate significantly both on the up- and
downside relative to our forecast.
COVERED COMPANIES

38REDEYE - SAAS REPORT 2021
Penneo PENNEO Company page
https://www.redeye.se/company/penneo
Publication date
November 10 2021
Snapshot
PenneoOMXS30
Marketplace First North Denmark
CEO Christian Stendevad
Chairman Christian Sagild
Share information
Share price (DKK) 31.7
Number of shares (M) 27.1
Market cap (MDKK) 857
Net debt (MDKK) -27
Financials
Redeye Estimates
2019 2020 2021E 2022E 2023E
Revenue, MDKK 28 36 56 82 114
Growth 28.8% 58.5% 46.1% 38.5%
EBITDA 0 -13 -14 -15 -2
EBITDA margin Neg Neg Neg Neg Neg
EBIT -2 -16 -23 -24 -13
EBIT margin Neg Neg Neg Neg Neg
Pre-tax earnings -2 -17 -24 -24 -13
Net earnings -2 -12 -21 -24 -13
Net margin Neg Neg 0.0% 0.0% 0.0%
Dividend/Share 0.00 0.00 0.00 0.00 0.00
EPS adj. -0.47 -0.65 -0.87 -0.96 -0.53
P/E adj. N/A -69.5 N/A N/A N/A
EV/S N/A 24.3 N/A N/A N/A
EV/EBITDA N/A -64.3 N/A N/A N/A
Last updated: 2021-09-15
Owner Equity Votes
Michael Moesgaard Andersen 12.6% 12.6%
Nicolaj Højer Nielsen 11.5% 11.5%
Jan Flora 9.2% 9.2%
Mikkel Clausen 8.1% 8.1%
André Clement 7.4% 7.4%
Jakob Neua Nørgaard 7.0% 7.0%
Anders Eskholm 7.0% 7.0%
Niels Henrik Rasmussen 5.4% 5.4%
Janek Borgmann 4.9% 4.9%
Penneo A/S 2.4% 2.4%
Redeye Rating
COMPANY QUALITY
4People
4Business
2Financials
FAIR VALUE RANGE
Base53.0
Bear17.0
Bull117.0
Last price31.7
TIMELINESS
1
VolumeVolume
Jan Mar May Jul Sep Nov
20304050607080
0
1M

39REDEYE - SAAS REPORT 2021
Company descriptionPenneo is a Danish Software-as-a-Service (SaaS) company founded in 2014
and specializes in managing and automating the digital signing process for
auditors. Penneo offers RegTech solutions, including digital signing,
onboarding of clients (KYC), automation of workflows, compliance, security,
and storage for over 2000 B2B customers. In 2020, when the share was listed
on Nasdaq First North, the company had a total ARR of DKK 37m, and the aim
is to become the software standard for auditors across Europe. The company
is planning to migrate onto the Nasdaq Copenhagen main market in H1 2022.
Penneo has a strong presence within auditor firms and is positioned as the
Nordic market leader, with several Big 10 audit customers across Denmark,
Sweden and Norway. The company has a substantial existence in Denmark,
where ~66% of the annual reports were signed with Penneo's platform. In 2021,
the company expects to continue its internationalization through new market
entries across the Nordic and Europe and improved its ARR guidance to DKK
56-60m, indicating solid growth prospects.
Investment case• Fast Growth Fueled by Digitalization and Regulations
• Cohort Analysis and NRR Suggests Customers are Satisfied
• Solid and Improving SaaS Metrics Indicates Potential for High
Profitability
• Dominating Denmark – Heading for Europe
Fast Growth Fueled by Digitalization and Regulations
Since its listing in mid-2020, Penneo has raised its ARR guidance four times.
Thanks to its low churn of ~2-4%, high uplift of ~25-32%, and ~25-30% growth
from new customers, the ARR CAGR 2019-H1 2021 was >50%. We expect
management to continue its focus on growth by entering new markets and new
verticals, similar to auditors, as well as keeping the net revenue retention high.
We have identified several structural trends, such as increased digitalization,
political ambitions to adopt digital legislation, and the striving for a sustainable
business, driving the underlying market. Furthermore, the low penetration of
eIDs outside the Nordics will result in structural growth for a long time.
Cohort Analysis and NRR Suggests Customers are Satisfied
Penneo focuses on large auditors, typically starting out using Penneo in a
fraction of the firm, and the net revenue retention (NRR) of 120-130% means
the average customer is rapidly increasing its usage – clearly indicating
satisfied customers. For example, the 2017 Cohort generated DKK 4m in ARR
in H1 2018, which in H1 2021 had grown to DKK 7m.
Solid and Improving SaaS Metrics Indicates Potential for HighProfitability
Considering Penneo continues to increase the customer intake, partly driven by
international expansion, combined with its solid NRR, we believe Penneo is set
for many years of high ARR growth. While currently unprofitable, the high NRR
and the improving CAC/Payback suggest Penneo will become highly profitable
as it matures.
Dominating Denmark – Heading for Europe
In Denmark, where 17 of the 20 largest auditors are Penneo customers, 66% of
all annual reports are signed using Penneo. In Sweden and Norway, several of
the top ten auditors are current customers, and considering Penneo's NRR track
record; we believe the likelihood of them increasing their usage is high. Penneo
also has a footprint on the Finnish and Belgian markets.
As Denmark is one of the most digitalized markets in Europe, we believe a
product dominating the Danish market has a high likelihood of being
competitive in all of Europe. As Europe matures and the adoption of eIDs (as
BankID in Sweden) increases, we expect Penneo to enter new markets
gradually.
Niche Focus on Compliance-Heavy Sectors
While having customers in many sectors, Penneo focuses on the auditor
vertical characterized by high regulatory requirements. Penneo is more than
just a signing tool for auditors, as it automates the signing process and
includes KYC functionalities. We believe the more comprehensive solution and
Penneo's integrations to the major auditor ERPs raise the barriers to entry for
competitors and increase its customers' switching costs. Also, as every sizable
business is in contact with an auditor, the use of Penneo spreads through viral
effects as the auditors' customers are encouraged to sign using Penneo.
Going forward, Penneo aims to broaden its solution to other heavily regulated
verticals like the finance sector. While it limits the total addressable market, we
believe the niche focus is a good way to limit competition from global players
and local champions.
Catalyst types
Additional Key Customers Outside of Denmark
We believe new partnerships with major auditors will have a long-term positive
impact. New key customers outside of Denmark are especially positive, as it
validates the competitiveness of the solution outside of its home country. Non-
Nordic major auditors would be even more positive as Penneo has a limited
footprint in those markets currently.
Continued Growth in ARR
Penneo has historically shown strong organic growth in ARR, with an increase
of 48% in 2020, and the recently improved ARR guidance for 2021 indicates
solid growth prospects. If Penneo can continue to grow its ARR – which we find
is likely – the following reliable performance will attract investors' attention.
COVERED COMPANIES

40REDEYE - SAAS REPORT 2021
Safeture SFTR Company page
https://www.redeye.se/company/safeture
Publication date
November 10 2021
Analyst
Mark Siö[email protected]
Conflict of interests
Mark Siöstedt owns shares in Safeture: No
Redeye performs/have performed services for the Company and receives/have
received compensation from the Company in connection with this.
Snapshot
SafetureOMXS30
Marketplace First North Stockholm
CEO Magnus Hultman
Chairman Flemming Breinholt
Share information
Share price (SEK) 9.2
Number of shares (M) 30.1
Market cap (MSEK) 276
Net debt (MSEK) 1
Financials
Redeye Estimates
2019 2020 2021E 2022E 2023E
Revenue, MSEK 23 22 27 40 58
Growth 20.9% -6.0% 23.8% 47.7% 46.1%
EBITDA -14 -21 -17 -9 3
EBITDA margin Neg Neg Neg Neg 5.4%
EBIT -17 -25 -21 -12 0
EBIT margin Neg Neg Neg Neg 0.7%
Pre-tax earnings -15 -25 -21 -12 0
Net earnings -14 -25 -21 -12 0
Net margin Neg Neg Neg Neg 0.5%
Dividend/Share 0.00 0.00 0.00 0.00 0.00
EPS adj. -0.64 -1.00 -0.73 -0.42 0.01
P/E adj. -190.3 -113.9 -153.0 -264.2 10,982.2
EV/S 122.2 134.2 124.7 84.8 58.1
EV/EBITDA -196.1 -131.9 -185.7 -340.4 1,075.2
Last updated: 2021-11-08
Owner Equity Votes
Greg Dingizian 38.2% 38.2%
Ibkr Financial Services AG 19.9% 19.9%
Topline Capital Partners LP 19.9% 19.9%
Nordea Liv & Pension 10.2% 10.2%
Futur Pension 5.0% 5.0%
Semmy Rülf 4.1% 4.1%
Daniel Oredsson 1.7% 1.7%
Flemming Breinholt 1.7% 1.7%
Andreas Rodman 1.6% 1.6%
Joseph Aroyan 1.3% 1.3%
Redeye Rating
COMPANY QUALITY
4People
3Business
2Financials
FAIR VALUE RANGE
Base12.0
Bear5.0
Bull18.0
Last price9.2
TIMELINESS
3
VolumeVolume
Jan Mar May Jul Sep Nov
8
9
10
11
12
0250k500k

41REDEYE - SAAS REPORT 2021
Company descriptionSafeture offers a cloud-based SaaS platform, managing risk, safety, and crises
involving employees. The service unifies employee communication,
information, and location in one tool. Safeture’s open platform architecture
allows customers to seamlessly integrate internal processes and features with
external suppliers, such as assistance providers, travel agencies or other
software, including internal employment databases or intranets.
Safeture’s platform offers a range of functions and components that can be
used off the shelf, such as mobile apps, travel tracking, flight updates, global
real-time alerts, e-learning, bulk messaging, country and medical information.
Companies can pick and choose the number of licenses and modules and
thereby create something that suits their specific need. The customizable
platform can be seamlessly integrated with current human resources/security/
assistance setups.
Investment case
• Safeture is going from being an engineering-focused organization to a
SaaS business, with well-experienced management that has scaled
similar-sized companies before.
• Safeture's strong value proposition makes it a good partner, both for
larger companies seeking to have all employee safety tools under one
roof, and for assistance companies that want to focus on their core
competency, and outsource the technical platform.
• There is an ongoing consolidation in the market, where larger assistance/
security companies acquire smaller software providers, like Safeture. We
believe Safeture could be a possible target.
• Although Safeture is in a ‘land-grabbing phase’ where growth should be
paramount and profitability secondary, signs of scalability would greatly
boost the market’s confidence in the company and ease the possibility to
attract long-term and well-financed investors.
Large installed customer base with low churn
Safeture is a category leader in a fast-growing (>10% a year) niche market. It
has a large installed base of ~4,000 medium to large-sized corporations and
organizations. This has been accomplished despite its engineering-focused
legacy, which points toward a strong value proposition. Our channel checks and
the low churn do as well.
Safeture has an underappreciated market position in an area receiving more
attention after the Covid-19 pandemic. A record amount of proposal requests
indicates a potential ‘ketchup effect’ in the coming years, as more companies
look over their duty of care responsibilities.
Focus on selling
Safeture’s transformation to a SaaS business also coincides with a new focus
on selling. Since the new management joined in 2019, an organizational build-
up has happened, which has greatly expanded the lead generation, onboarding,
and activation of new customers.
Well-experienced management
Safeture’s management and board are full of experienced company-builders
that have scaled businesses before. CEO Magnus Hultman, for example, has a
long history of doing it, including SaaS companies. Safeture needs good
execution, and we believe the company is in the right hands.
Catalyst typesSigns of scalability
Although Safeture is in a 'land-grabbing phase' where growth should be
paramount and profitability secondary, we still would like to see scalability
signs. It would greatly boost the market's confidence in the company and
promote the possibility to attract long-term and well-financed investors.
Safeture does not necessarily have to become profitable but only be able to
show that it could if wanted. This is often a significant catalyst for smaller, less
followed companies. In 2021, we have seen the gross profit exceed the total
investments in sales and marketing, thus indicating the business model's
scalability.
Partnership with a larger assistance/security company (partnership)
Around ~70% of net sales come from partnerships (including white label).
Should Safeture enter a large agreement with a security company such as
Securitas (Pinkerton) or G4S, it would obtain access to a large customer base,
fueling the growth.
New contract with a sizeable customer
Safeture received orders from Siemens and International Paper in 2020, two big
corporations with ~300,000 and ~55,000 employees, respectively. Any
customer (or order value) in the same range would act as a positive catalyst for
the stock, and we expect such news in 2022.
Acquisition target
There is an ongoing consolidation in the market, where larger assistance/
security companies acquire smaller software providers, like Safeture. We
believe Safeture could be a possible target.
COVERED COMPANIES

42REDEYE - SAAS REPORT 2021
Speqta SPEQT Company page
https://www.redeye.se/company/speqta
Publication date
November 10 2021
Analyst
Fredrik [email protected]
Conflict of interests
Fredrik Nilsson owns shares in Speqta: No
Redeye performs/have performed services for the Company and receives/have
received compensation from the Company in connection with this.
Snapshot
SpeqtaOMXS30
Marketplace First North Stockholm
CEO Fredrik Lindros
Chairman Fredrik Burvall
Share information
Share price (SEK) 4.7
Number of shares (M) 65.9
Market cap (MSEK) 307
Net debt (MSEK) 69
Financials
Redeye Estimates
2019 2020 2021E 2022E 2023E
Revenue, MSEK 102 178 203 276 331
Growth 72.4% 74.2% 14.1% 36.1% 20.0%
EBITDA 17 69 29 55 75
EBITDA margin 16.8% 38.8% 14.1% 19.9% 22.7%
EBIT 2 29 -3 28 50
EBIT margin 2.4% 16.4% Neg 10.0% 15.0%
Pre-tax earnings -1 25 -9 20 42
Net earnings -1 19 -7 16 34
Net margin Neg 10.9% Neg 5.7% 10.2%
Dividend/Share 0.00 0.00 0.00 0.00 0.00
EPS adj. -0.02 0.29 -0.11 0.24 0.50
P/E adj. -311.6 14.9 -54.1 25.3 11.8
EV/S 2.7 2.0 2.3 1.6 1.2
EV/EBITDA 16.1 5.2 15.9 8.0 5.3
Last updated: 2021-03-04
Owner Equity Votes
Eone Holding Oy 15.3% 15.3%
Andre Lavold 7.9% 7.9%
Henrik Persson Ekdahl 7.3% 7.3%
Swedbank Robur Fonder 7.3% 7.3%
Swedbank Försäkring 6.8% 6.8%
Jonas Söderqvist 5.3% 5.3%
Länsförsäkringar Fonder 4.9% 4.9%
Andreas Friis 4.8% 4.8%
Avanza Pension 3.6% 3.6%
Nordnet Pensionsförsäkring 2.7% 2.7%
Redeye Rating
COMPANY QUALITY
4People
3Business
2Financials
FAIR VALUE RANGE
Base7.5
Bear3.0
Bull14.0
Last price4.7
TIMELINESS
4
VolumeVolume
Jan Mar May Jul Sep Nov
3
4
5
6
7
0
2.5M

43REDEYE - SAAS REPORT 2021
Company descriptionSpeqta is a digital media house headquartered in Stockholm, Sweden. The
company excels in constructing scalable and auto-generated web products.
The concepts behind the products are language independent, which means
they can be applied on a multinational level. Speqta was founded in 2003, and
the share is traded on Nasdaq Stockholm First North. Speqta has two divisions;
AdTech and Content & Comparison. The Group has a focus on performance-
based marketing and lead generation.
Investment case• Attractive exposure to e-commerce
• Acquired growth
• Innovations
• Scalability
Our investment case in Speqta is based on the vast opportunities within
performance-based marketing and e-commerce. The company has a strong
presence in the e-commerce market and expanding within the finance vertical.
Furthermore, the company is launching new and innovative, in-house developed
products like BidBrain.
Attractive exposure to e-commerce
The European e-commerce market is growing rapidly, and the COVID-19
pandemic has boosted the growth further. Speqta has an attractive exposure to
the European e-commerce industry that will help drive rapid growth for many
years to come.
Acquired growth
The e-commerce sector offers several exciting growth opportunities, and M&A
is one. The company has experience from several acquisitions and is backed
up by several wells capitalized owners. We believe that Speqta is in a strong
position to make value-adding acquisitions.
Innovations
Speqta continues to sow its innovative flair. We find the new product BidBrain
very interesting and things look promising. We believe that the company will
continue to innovate and add new attractive products to its offering.
Scalability
Speqta has a highly digital and scalable business. Therefore, we expect that the
growth efforts will lead to a strong and improving profit margin.
Bear points (Counterarguments to our thesis)
• To not overpay and achieve successful integration and performance of
acquisitions is often challenging. As Speqta scales up, acquisitions are
likely to increase in size. Optimizer Invest and the Chairman of the Board
have good track records and are adding crucial competencies, which
limits the risks.
• Acquisitions in general most often need a healthy financial market, a
downturn could lead to less possibilities to acquire more exciting
companies within the Shopping segment. The Nordea financing and with
Optimizer Invest on board, we believe the company is more likely to
attract capital and convince sellers even in a weaker market.
Catalyst typesAffiliJet expansion
The collaboration with Expressen develops well and has expanded from
performance-based marketing of discount coupons to loans and iGaming.
Speqta has also acquired a similar collaboration with the Norwegian
newspaper Nettavisen as well as Aller Dagbladet. Large publishers are
searching for new income streams and AffiliJet is a flexible and profitable
solution. We believe that new deals are likely within the coming months, both
organically and through acquisitions.
Improved fundamental performance changing the market perception
The acquisitions within Content & Comparison should lead to gradually
enhanced growth and profitability. Speqta shows positive EBITDA results and
can the company demonstrate further profitability, we believe the market
perception and valuation will appreciate.
Value-adding acquisitions
The company is open with its high acquisition ambitions and thus, it should not
come as a surprise for the stock market. We still believe new M&A deals could
be positive catalysts as it would validate the strategy. We also have confidence
in Optimizer Invest's ability to negotiate attractive terms and thereby, create
shareholder value.
In-house product innovations
Speqta has a history of entrepreneurship and business creativity. The founders
are still active in the operations, and the company is adding interesting
competence as it grows. We believe the innovative in-house organization will
generate new exciting products to capitalize on the opportunities within
performance-based marketing.
COVERED COMPANIES

44REDEYE - SAAS REPORT 2021
Vertiseit VERT B Company page
https://www.redeye.se/company/vertiseit
Publication date
November 10 2021
Analyst
Fredrik [email protected]
Conflict of interests
Fredrik Nilsson owns shares in Vertiseit: Yes
Redeye performs/have performed services for the Company and receives/have
received compensation from the Company in connection with this.
Snapshot
VertiseitOMXS30
Marketplace First North Stockholm
CEO Johan Lind
Chairman Vilhelm Schottenius
Share information
Share price (SEK) 37.5
Number of shares (M) 14.4
Market cap (MSEK) 540
Net debt (MSEK) -21
Financials
Redeye Estimates
2019 2020 2021E 2022E 2023E
Revenue, MSEK 83 77 127 184 225
Growth 19.8% -7.9% 65.3% 45.2% 22.2%
EBITDA 12 11 12 22 43
EBITDA margin 14.7% 15.4% 9.7% 12.2% 19.2%
EBIT 7 6 3 13 33
EBIT margin 9.2% 9.0% 2.5% 7.1% 14.8%
Pre-tax earnings 7 6 1 11 31
Net earnings 7 6 1 8 24
Net margin 8.9% 7.9% 1.2% 4.7% 10.9%
Dividend/Share 0.00 0.00 0.00 0.00 0.00
EPS adj. 0.58 0.47 0.10 0.60 1.70
P/E adj. 37.8 31.6 N/A N/A N/A
EV/S 3.1 2.2 N/A N/A N/A
EV/EBITDA 20.9 14.4 N/A N/A N/A
Last updated: 2021-11-03
Owner Equity Votes
Johan Lind 15.1% 21.5%
Adrian Nelje 13.9% 21.1%
(Rbi), Raiffeisen Bank International AG 11.3% 4.2%
Telion Og 11.3% 4.2%
Schottenius Gruppen 10.8% 13.8%
Oskar Edespong 8.4% 11.1%
Jonas Lagerqvist med bolag 7.6% 9.1%
Jan Kjellman med familj 5.5% 8.3%
Nordea Liv & Pension 3.0% 1.1%
Avanza Pension 2.2% 0.8%
Redeye Rating
COMPANY QUALITY
5People
4Business
3Financials
FAIR VALUE RANGE
Base42.0
Bear26.0
Bull56.0
Last price37.5
TIMELINESS
9
VolumeVolume
Jan Mar May Jul Sep Nov
1015
202530
35
0
100k

45REDEYE - SAAS REPORT 2021
Company descriptionVertiseit is a Swedish digital signage group founded in 2008, consisting of
Vertiseit, a full-service integrator, and Dise, a retail-focused CMS (Content
Management System) platform. Its headquarter is in Varberg with offices in
Karlstad, Stockholm, and London. In 2019, when the share was listed on First
North, the group had sales of SEK 83m with an EBIT margin of just below 10%.
The group has several well-known customers, including Skistar, Volvo, Lindex, J
Lindeberg M&S, and Lamborghini. Most of them combine Dise's platform with
Vertiseit's full-service integration. However, there are also examples of "pure"
Dise deals through partners such as M&S and Lamborghini.
Vertiseit generates three different revenue streams, SaaS, Agency, and
Systems. SaaS or Software as a Service consists of recurring revenue from
software subscriptions, surveillance, and support and maintenance paid
monthly per installed system. Agency consists of revenue from strategy and
concept development. Systems consist of revenue from hardware sales and
implementations.
Investment case• Platform First
• From Integrator to SaaS
• Low market penetration
Platform First
Following the acquisition of Grassfish and Vertiseit embracing Grassfish's so-
called ISV+ (Independent software vendor) strategy outside of Sweden, Vertseit
is all in on the platform first strategy. Management believes Digital In-store
software will head the same way as other software verticals like ERP, CRM, and
PIM, where customers generally first choose a platform then the integrator,
resulting in one or a few leading global platforms. Vertiseit is currently the
number one digital signage platform in the DACH region and among the top five
Digital In-store platforms globally. By 2026, Vertiseit aims to become the
leading global Digital In-store platform. While having most of its business in the
Nordics and DACH, Vertiseit has a global footprint today, including a global deal
with BMW of over 8 000 touchpoints.
Interestingly, Vertiseit's main competitors generally stick to the currently
dominating Technical Service Integrator (TSI) strategy, offering in-house
software, consulting, and installations (like Vertiseit in Sweden). Thus,
Vertiseit's platform first strategy is unique in its space. Given that Digital In-
store will imitate other software verticals, which as least, in the long run, seems
reasonable, we believe Vertiseit is in pole position. While Digital In-store
software is a small niche, it is a significant market from Vertiseit's perspective
on a European or even global scale.
From Integrator to SaaS
Before the acquisition of Grassfish, Vertiseit's sales mix was about 50%
hardware, 35% SaaS, and 15% consulting. With Grassfish and the new ISV+
strategy, we expect Vertseit to gain a more attractive sales mix gradually, with
>50% SaaS, ~25% consulting, and <25% hardware. We believe this change in
sales mix will change investors' perception of Vertiseit, as it will resemble a
consulting-heavy SaaS company rather than an integrator with some SaaS
revenues. We believe such a change in perception would trigger a revaluation
of Vertiseit, considering the valuation of the consulting-heavy, generally
successful SaaS businesses listed in Sweden.
Low market penetration
Our field studies and market reports indicate that the penetration of digital
signage in Sweden is low, even as the Nordics is one of the most digitalized
regions. According to management, several Vertiseit customers have digital
signage solutions in 1/3 or less of their total stores. Thus, we see significant
growth potential in the current customer base. We also see the potential for
new customers who have not yet started the digitalization of their stores. The
Corona crisis could very well be a trigger for fewer but more digitalized stores,
which we believe would benefit Vertiseit.
Counter-thesis
Retail digitalization not taking offDigital signage has been in focus for many years, but the penetration is still
low. The retailers implementing a digital signage solution have often only
digitalized a small share of its total stores. However, many retailers are in the
process of gradually digitalizing their stores as they are refurbished. Also, we
believe that the cost/benefit of digital signage solutions is well enough to
support further increases in penetration.
The Big Four Remains in Charge
The Big Four, ZetaDisplay, Trison, Stratacache, and M-Cube, are all generally
favoring a Technical Service Integrator (TSI) strategy, offering in-house
software, consulting, and installations. This model is dominating today and
might continue to do so, which contradicts Vertiseit's vision of one leading
platform. However, Trison focuses on integration, working together with
Grassfish and its platform in the BMW project. Although, we do not expect the
other Big Four to mimic Trison's platform-agnostic approach.
Catalyst typesContinued growth in recurring revenues
The recurring SaaS revenues, with gross margins of 90-95%, is the key to
increase Vertiseit’s profits. If Vertiseit can continue to grow its SaaS revenues
at a steady pace – which we find likely – margins and profits will gradually
increase. While Vertiseit never becomes a pure SaaS business, we believe that
the market will reward the company with higher multiples as the SaaS revenue
grows.
COVERED COMPANIES

46REDEYE - SAAS REPORT 2021
XMReality XMR Company page
https://www.redeye.se/company/xmreality
Publication date
November 10 2021
Analyst
Forbes [email protected]
Conflict of interests
Forbes Goldman owns shares in XMReality: Yes
Redeye performs/have performed services for the Company and receives/have
received compensation from the Company in connection with this.
Snapshot
XMRealityOMXS30
Marketplace First North Stockholm
CEO Jörgen Remmelg
Chairman Björn Persson
Share information
Share price (SEK) 3.4
Number of shares (M) 40.9
Market cap (MSEK) 138
Net debt (MSEK) -18
Financials
Redeye Estimates
2019 2020 2021E 2022E 2023E
Revenue, MSEK 12 21 24 36 58
Growth 17.4% 73.6% 16.4% 49.7% 62.0%
EBITDA -23 -19 -22 -16 0
EBITDA margin Neg Neg Neg Neg Neg
EBIT -27 -24 -27 -22 -8
EBIT margin Neg Neg Neg Neg Neg
Pre-tax earnings -27 -24 -27 -22 -8
Net earnings -27 -24 -27 -22 -8
Net margin 0.0% 0.0% 0.0% 0.0% 0.0%
Dividend/Share 0.00 0.00 0.00 0.00 0.00
EPS adj. -1.60 -0.73 -0.68 -0.55 -0.20
P/E adj. -1.6 -9.7 -5.5 -6.9 -18.7
EV/S 2.9 10.7 4.4 3.5 2.2
EV/EBITDA -1.5 -11.4 -4.8 -7.7 -2,036.7
Last updated: 2021-10-26
Owner Equity Votes
Investment AB Spiltan 23.5% 23.5%
Avanza Pension 6.5% 6.5%
Lars Svensson 4.8% 4.8%
Adrigo Asset Management 4.4% 4.4%
Nordnet Pensionsförsäkring 4.0% 4.0%
Björn Persson 2.9% 2.9%
Nils-Robert Persson 2.8% 2.8%
Christer Svensson 2.0% 2.0%
Göran Gustavsson 1.7% 1.7%
Formue Nord A/S 1.5% 1.5%
Redeye Rating
COMPANY QUALITY
4People
3Business
2Financials
FAIR VALUE RANGE
Base7.0
Bear1.5
Bull12.0
Last price3.4
TIMELINESS
3
VolumeVolume
Jan Mar May Jul Sep Nov
34
567
8
0
2M

47REDEYE - SAAS REPORT 2021
Company descriptionXMReality is the company behind Remote Guidance, a software that enables
advanced video calls, to a large extent, for industrial remote work. The video
calls revolve around hardware issues in industrial environments, such as a
faulty production line on the shop floor that needs servicing. When there is an
issue, a worker on the shop floor seeks support from e.g., a technician or
superior at the home base, which possesses knowledge on how to solve the
issue. Through Remote Guidance, the guiding person is able to overlay
information (e.g., hands or tools) to the guided person through augmented
reality. Press here for a demonstration of Remote Guidance.
Investment case• Scalable and asset-light business model
• Accelerated market growth to be expected
• Strong value proposition
• Focused core business areas
Scalable Business Model
Once XMReality has completed the initial deployment and onboarding of a
customer, the marginal cost of adding more licensed users is negligible. The
potential of achieving significant operating leverage and high profitability is
reflected, in our opinion, in the company's 90%+ gross profit margins. We have
a positive view on the strategy of creating a large installed base, which is able
to scale its usage and licenses with time.
Accelerated Market Growth
Demand for Remote Guidance saw a significant uplift on the back of the
pandemic, and the question is if interest will continue to be as strong going
forward. Less business travel and a greater focus on CO2 control are to be
expected, in our opinion. Research firms expect the Enterprise AR Software
Market to grow at a 56% CAGR from 2019-2025E. We have a positive outlook
on XMReality's prospect to grow in excess of the market due to its 1) user-
friendliness, 2) scalability, and 3) strong IP.
Strong Value Proposition
We have a positive view on Remote Guidance's 1) unique hands overlay
technology, 2) excellent functionality in areas of weak network capacity, and 3)
the feature of inviting users to new sessions through a weblink, i.e., eliminating
the need to run sessions through an installed app on the customer side. Not
having to download software is an important feature mitigating the potential
problem of this new technique being perceived as complicated and complex.
Focused Core Business Areas
XMReality has gained a strong market position in several verticals, especially in
1) the food and beverage industry with customers such as Nestlé, InBev, and
Heineken, and 2) the packaging industry with customers such as Sidel. Two
additional interesting verticals are facility management, and medtech -
especially medical equipment, sharing several similarities with the packaging
industry.
Counter-thesis
Delayed Adoption
So far, the adoption of Remote Guidance has been somewhat slow, and the
company hasn't achieved the critical mass required to become profitable.
Perhaps, some customers and employees prefer legacy models and are
unwilling to receive AR-based assistance.
Increased Competition
There is a risk of superior solutions introduced by competitors emerging on the
market. For the company to keep its competitive edge, it is vital to continue to
invest in R&D.
Price Pressure
XMReality applies a premium price strategy that could be difficult to retain if
new competitors can offer solutions with a similar value proposition as
XMReality. It becomes even more relevant in the long run if the technology
becomes a standardized solution within industrial service operations.
Catalyst types
Significant ARR and Top-Line Growth
Solid quarterly reports, demonstrating significant top-line growth, and thus a
path to profitability should have a significant impact on the share price.
Additional Go-To-Market Partners
Strategic alliances could help XMReality expand its international reach and
increase its installed base at a modest customer acquisition cost. One such
partnership is its existing agreement with Japan-based NTT, establishing a
presence in the APAC region.
Lighthouse Customer Agreements
We see great potential in a high-volume rollout of Remote Guidance throughout
a large customer’s service organization. Apart from yielding a significant ARR
at high margins, it could indicate that its industry is truly ready to adopt the
technology on a larger scale.
COVERED COMPANIES

48REDEYE - SAAS REPORT 2021
COMPANY DESCRIPTIONS – NON-REDEYE CUSTOMERS
CompodiumMore than 100 municipalities, regions and private companies use Compodium’s secure communication platform with the services Vidicue and TDialog. The services make it possi-ble and easy for Compodium’s customers to create online availability, long-term relationships, and successful business, without sharing confidential information with unauthorized individuals or third countries.
EfecteEfecte is a Finnish software company founded in 1998 that helps service organizations digitize and automate their work. The company’s solutions allow their customers to flexibly manage all internal and external services in the organization, such as IT, human resources, financial services, customer ser-vice, and access rights. It is the European Alternative to global players and operates in a range of countries. Efecte is headquartered in Esbo and had net sales of EUR 14.9m in 2020.
GoalplanGoalplan delivers a digital platform solution (SaaS) to sales and service organizations worldwide. In one and the same application, Goalplan offers its customers the opportunity to digitize and streamline their sales efforts and enable improved communication, increased commitment and shared access to goals and results. Through integrations with, among others, Salesforce, Dynamics, SAP, Navision, Sitoo, LeadDesk, Pipedrive, Upsales, Hubspot, Goalplan visualizes data and makes the information accessible to everyone.
HoyluHoylu is a technology company founded in 2016 to build a business focusing on the next-generation enterprise collaboration platform. The company offers a cloud-based digital workspace to do remote work and information change easily accessible, more productive, transparent, and engaging for businesses and organizations. Hoylu is listed on the Nasdaq First North Growth Market, and in 2020, the group had a total ARR of SEK 26.7m.
ImperoImpero is a Danish RegTech company that provides a compli-ance management platform distributed as Software-as-a-Ser-vice (“SaaS”) that enables companies to efficiently manage compliance through automation of risk and control manage-ment, documentation, and reporting. Impero serves about 100 companies, including one-third of all OMXC25 compa-nies in Denmark and three of Germany’s five largest listed companies.
KonsolidatorKonsolidator is an international Software-as-a-Service (SaaS) Group that helps companies digitalize the financial consoli-dation and reporting. Konsolidator is listed on NASDAQ First North Growth Market in Denmark. At the end of September, it had a ARR of DKK 12m.

49REDEYE - SAAS REPORT 2021
COMPANY DESCRIPTIONS – NON-REDEYE CUSTOMERS
LitiumLitium provides a cloud-based digital commerce platform that helps large and medium-sized B2C and B2B businesses accelerate their sales. Lindex, NordicFeel, and Jollyroom are some of its customers, which together have a total turnover of SEK 10+ billion annually on its platform. Litium operates through its partner network in the Nordic market and is, since December 2020, listed on Nasdaq First North.
MestroMestro’s cloud-based energy monitoring service helps prop-erty owners save time, money, and energy. The product suite is currently used by many of Scandinavia’s most influential property companies, retail companies and hotel chains, thereby giving it stable SaaS revenues. Mestro was founded in 2005 and is headquartered in Stockholm, Sweden.
ModelonModelon offers systems modeling and simulation software that accelerates product innovation, development, and operations in various industries. Modelon’s flagship prod-uct, Modelon Impact, is a cloud-native system simulation software platform featuring a collaborative browser-based interface and thousands of proven models and components spanning a broad range of applications. Headquartered in Lund, Sweden, and with a global reach, Modelon is an expert industry leader in model-based systems engineering focusing on leveraging open standard technologies.
SameSystemSameSystem is a Danish software company that provides a cloud-based platform for workforce management. The platform is developed in-house and helps companies reduce operating costs, improve employee retention and spend less time on store administration by providing tools for areas such as flow planning and scheduling. The customer base is primary retailers and foodservice providers and the platform is distributed as Software-as-a-Service (“SaaS”). Samesystem is, since June 2021, listed on Nasdaq First North.
Sleep CycleSleep Cycle is one of the world’s most popular sleep health solutions and the leading sleep tracking app, with global brand recognition and millions of users in more than 150 countries all over the world. The company was founded in 2009 and is headquartered in Gothenburg, Sweden. In 2020, the company had subscription revenues of SEK 160m and an operating margin of more than 35%.

50REDEYE - SAAS REPORT 2021

DISCLAIMER
Important information Redeye AB (“Redeye” or “the Company”) is a specialist financial advisory boutique that focuses on small and mid-cap growth companies in the Nordic region. We focus
on the technology and life science sectors. We provide services within Corporate Broking, Corporate Finance, equity research and investor relations. Our strengths are
our award-winning research department, experienced advisers, a unique investor network, and the powerful distribution channel redeye.se. Redeye was founded in
1999 and since 2007 has been subject to the supervision of the Swedish Financial Supervisory Authority.
Redeye is licensed to; receive and transmit orders in financial instruments, provide investment advice to clients regarding financial instruments, prepare and dissemi-
nate financial analyses/recommendations for trading in financial instruments, execute orders in financial instruments on behalf of clients, place financial instruments
without position taking, provide corporate advice and services within mergers and acquisition, provide services in conjunction with the provision of guarantees regard-
ing financial instruments and to operate as a Certified Advisory business (ancillary authorization).
Limitation of liability This document was prepared for information purposes for general distribution and is not intended to be advisory. The information contained in this analysis is based
on sources deemed reliable by Redeye. However, Redeye cannot guarantee the accuracy of the information. The forward-looking information in the analysis is based
on subjective assessments about the future, which constitutes a factor of uncertainty. Redeye cannot guarantee that forecasts and forward-looking statements will
materialize. Investors shall conduct all investment decisions independently. This analysis is intended to be one of a number of tools that can be used in making an
investment decision. All investors are therefore encouraged to supplement this information with additional relevant data and to consult a financial advisor prior to an
investment decision. Accordingly, Redeye accepts no liability for any loss or damage resulting from the use of this analysis.
Potential conflict of interest Redeye’s research department is regulated by operational and administrative rules established to avoid conflicts of interest and to ensure the objectivity and independ-
ence of its analysts. The following applies:
• For companies that are the subject of Redeye’s research analysis, the applicable rules include those established by the Swedish Financial Supervisory Authority
pertaining to investment recommendations and the handling of conflicts of interest. Furthermore, Redeye employees are not allowed to trade in financial instruments
of the company in question, effective from 30 days before its covered company comes with financial reports, such as quarterly reports, year-end reports, or the like,
to the date Redeye publishes its analysis plus two trading days after this date.
• An analyst may not engage in corporate finance transactions without the express approval of management, and may not receive any remuneration directly linked to
such transactions.
• Redeye may carry out an analysis upon commission or in exchange for payment from the company that is the subject of the analysis, or from an underwriting
institution in conjunction with a merger and acquisition (M&A) deal, new share issue or a public listing. Readers of these reports should assume that Redeye may
have received or will receive remuneration from the company/companies cited in the report for the performance of financial advisory services. Such remuneration is
of a predetermined amount and is not dependent on the content of the analysis.
Redeye’s research coverageRedeye’s research analyses consist of case-based analyses, which imply that the frequency of the analytical reports may vary over time. Unless otherwise expressly
stated in the report, the analysis is updated when considered necessary by the research department, for example in the event of significant changes in market condi-
tions or events related to the issuer/the financial instrument.
Recommendation structureRedeye does not issue any investment recommendations for fundamental analysis. However, Redeye has developed a proprietary analysis and rating model,
Redeye Rating, in which each company is analyzed and evaluated. This analysis aims to provide an independent assessment of the company in question,
its opportunities, risks, etc. The purpose is to provide an objective and professional set of data for owners and investors to use in their decision-making.
Duplication and distributionThis document may not be duplicated, reproduced or copied for purposes other than personal use. The document may not be distributed to physical or
legal entities that are citizens of or domiciled in any country in which such distribution is prohibited according to applicable laws or other regulations.
Copyright Redeye AB.
51REDEYE - SAAS REPORT 2021

redeye.se
Redeye is the next generation investment banking company, specialized in Life Science and Technology. Clients are innovative and fast-growing companies based in the Nordics but with a global reach. Redeye is a leading provider of Equity Research, Corporate Broking, and Corporate Finance in these sectors. The research is built on a value-based investment philosophy and with a unique Rating model. Redeye was founded in Stockholm 1999 and is regulated by the Swedish Financial Authority (Finansinspektionen).
Related Documents