Soft measures to shift modality Söderberg, Alfred 2021 Document Version: Publisher's PDF, also known as Version of record Link to publication Citation for published version (APA): Söderberg, A. (2021). Soft measures to shift modality. Lund University Faculty of Engineering, Technology and Society, Transport and Roads, Lund, Sweden. Total number of authors: 1 General rights Unless other specific re-use rights are stated the following general rights apply: Copyright and moral rights for the publications made accessible in the public portal are retained by the authors and/or other copyright owners and it is a condition of accessing publications that users recognise and abide by the legal requirements associated with these rights. • Users may download and print one copy of any publication from the public portal for the purpose of private study or research. • You may not further distribute the material or use it for any profit-making activity or commercial gain • You may freely distribute the URL identifying the publication in the public portal Read more about Creative commons licenses: https://creativecommons.org/licenses/ Take down policy If you believe that this document breaches copyright please contact us providing details, and we will remove access to the work immediately and investigate your claim.

Welcome message from author
This document is posted to help you gain knowledge. Please leave a comment to let me know what you think about it! Share it to your friends and learn new things together.
Transcript
LUND UNIVERSITY
PO Box 117221 00 Lund+46 46-222 00 00
Soft measures to shift modality
Soumlderberg Alfred
2021
Document VersionPublishers PDF also known as Version of record
Link to publication
Citation for published version (APA)Soumlderberg A (2021) Soft measures to shift modality Lund University Faculty of Engineering Technology andSociety Transport and Roads Lund Sweden
Total number of authors1
General rightsUnless other specific re-use rights are stated the following general rights applyCopyright and moral rights for the publications made accessible in the public portal are retained by the authorsandor other copyright owners and it is a condition of accessing publications that users recognise and abide by thelegal requirements associated with these rights bull Users may download and print one copy of any publication from the public portal for the purpose of private studyor research bull You may not further distribute the material or use it for any profit-making activity or commercial gain bull You may freely distribute the URL identifying the publication in the public portal
Read more about Creative commons licenses httpscreativecommonsorglicensesTake down policyIf you believe that this document breaches copyright please contact us providing details and we will removeaccess to the work immediately and investigate your claim
Soft measures to shift modalityALFRED SOumlDERBERG
FACULTY OF ENGINEERING | LUND UNIVERSITY 2021
Lund UniversityFaculty of Engineering
Department of Technology and SocietyBulletin 321
ISBN 978-91-7895-860-3ISSN 1653-1930
CODEN LUTVDG(TVTT-321)1-101
Reducing the amount of car use in society is difficult Although a necessity due to increased pressure on the environment and urban space the many benefits of driving prevent most people from reducing it Still some people drive a car not because they have to but because they are used to it and may consider changing travel behaviour if they are offered the right condi-tions and encouragement This thesis examines soft transport measures that promote voluntary reductions of car use ndash how they motivate different segments to reduce car use and the potential of innovation for improving their effectiveness and evaluations
9789178
958603
NO
RDIC
SW
AN
EC
OLA
BEL
3041
090
3Pr
inte
d by
Med
ia-T
ryck
Lun
d 20
21
321
Soft measures to shift modality
Alfred Soumlderberg
DOCTORAL DISSERTATION by due permission of the Faculty of Engineering Lund University Sweden
To be defended at the Faculty of Engineering John Ericssons vaumlg 1 in auditorium VA on 28 May at 1000
Faculty opponent Professor Lars E Olsson Karlstad University
Organisation LUND UNIVERSITY
Document name Doctoral dissertation
Faculty of Engineering Department of Technology and Society
Date of issue 28 May 2021
Author Alfred Soumlderberg Sponsoring organisation K2 The Swedish Knowledge Centre for Public Transport
Title and subtitle Soft measures to shift modality Abstract The purpose of this thesis is to contribute knowledge on how to reduce the demand for car use by encouraging a modal shift towards walking cycling and public transport Soft transport measures are the domain for this investigation Two issues regarding soft transport measures are the focus The first regards the lack of methodologically sound evaluations of soft measures and the potential for innovations to alleviate this and influence travel behaviour The second issue is the need for an increased understanding of what factors motivate diverse groups of people to reduce car use and what implications this can have for targeting soft measures The thesis comprises five papers Paper I investigated how information and communication technology (ICT) has been used to influence behaviour change and synthesizes key aspects into a conceptual model for creating a behaviour change support system (BCSS) for smartphone applications based on theory Paper II evaluated a fielded mobility service application (MSA) that was introduced in 13 Swedish organisations Paper III explored marketing messages that promote sustainable transport and motivation to reduce private car use within different segments Paper IV explored the preconditions affecting the motivation of people to reduce private car use In Paper V a randomised controlled trial with GPS data from 98 frequent drivers in Sweden was conducted to investigate the substitution effect of e-bikes The results in Paper I suggest that customisation to the user relevant and contextualised information and feedback commitment and appealing design are important aspects when influencing users to change behaviour through smartphone applications The results in Paper II gave indications that the MSA made it easier to travel by public transport Three factors that influence the success of a new MSA as a means to increase sustainable business trips were identified management control and proactiveness perceived improvement of intervention and functions and technical sufficiency The results in Paper III show that messages relating to the environment personal and societal health collective responsibility and morality performs better than messages relating to personal health financial benefits convenience and status The results in Paper IV show that climate morality is a critical factor affecting motivation to reduce car use Usual commute mode car advocacy health concerns attitudes towards cycling car identity and travel time also influence motivation The results in Paper V show that the treatment group increased cycling on average with one trip and 65 km per day per person which led to a 25 increase in total cycling The whole increase was at the expense of car use which on average decreased by one trip and 14 km per person per day a decrease in car mileage of 37 This thesis makes a novel contribution to the soft transport policy field by investigating innovations as a means for driving behaviour change as well as facilitating better evaluations Another contribution to the field is the combined analyses of segmentation and motivation to reduce car use which give insights into motivational differences and possible strategies for targeting
Key words Soft transport measures Modal shift Innovation ICT E-bikes Segmentation Motivation Evaluation Classification system andor index terms (if any)
Supplementary bibliographical information Language English
ISSN 1653-1930Bulletin ndash Lund University Faculty of Engineering Department of Technology and Society 321
ISBN 978-91-7895-860-3 (print)ISBN 978-91-7895-859-7 (pdf)
Recipientrsquos notes Number of pages 109
Price
Security classification
I the undersigned being the copyright owner of the abstract of the above-mentioned dissertation hereby grant to all reference sources permission to publish and disseminate the abstract of the above-mentioned dissertation
Signature Date 2021-04-19
Soft measures to shift modality
Alfred Soumlderberg
Cover photograph by Alfred Soumlderberg
Copyright 1-109 Alfred Soumlderberg
Paper I copy Elsevier Ltd
Paper II copy The authors
Paper III copy Elsevier Ltd
Paper IV copy Elsevier Ltd
Paper V copy The authors
Faculty of Engineering Department of Technology and Society
ISBN 978-91-7895-860-3 (print) 978-91-7895-859-7 (pdf) ISSN 1653-1930
Printed in Sweden by Media-Tryck Lund University Lund 2021
To my sisters Josefine and Lovisa
Table of contents
Preface 9 Summary 10 Populaumlrvetenskaplig sammanfattning 12 Papers included in the thesis 14 Abstracts 15
1 Introduction 17 11 Car use Two sides of the same coin 17 12 The benefits of soft transport measures 18 13 Key issues addressed 19 14 Aims and objectives 21 15 Main contribution 21 16 Structure of the thesis 22
2 The little brother in transport policy 23 21 Born in the USA 23 22 Managing travel demand through lsquohardrsquo and lsquosoftrsquo measures 24 23 Evaluation and effectiveness of soft measures 25 24 Soft measures in the context of Swedish transport planning 26
3 Framework of the thesis 29 31 Segmentation30 32 Motivation 34 33 Evaluation 36
4 Methods and data 39 41 Progression of the thesis 39 42 Method rationale 40 43 Datasets 41
431 Literature data 41 432 Business travel data 42 433 National survey data 43 434 E-bike trial data 46
44 Representativeness of datasets 48 45 Analyses 49
451 Analytical samples and dependent variables 50 452 Type of analyses 52
5 Results 57 51 Paper I 57 52 Paper II 59 53 Paper III 61 54 Paper IV 63 55 Paper V 67
6 Discussion 71 61 Recapitulation of aims 71 62 First aim Potential of innovations for soft transport measures 71 63 Second aim Motivation to decrease car use and the use of segmentation for improving soft measures 76 64 Concluding remarks 80
641 Limitations 82 642 Further research 83
References 85
Acknowledgement 104
Appendix A Questionnaire items 106
Appendix B Papers 109
9
Preface
One early morning in the spring of 2013 my girlfriend (now wife) and I waited outside the hospital in Lund equipped with goodie bags that were to be distributed to employees who came to work by bicycle We had recently started studying and worked extra hours for the technical administration at Lund municipality Our mission was simple distribute the goodie bags to as many bicycle commuters as possible
The work required some ability to run alongside the cyclists long enough to be able to complete the handover of the bags At the time I did not reflect much on what effects this exercise would have on the cyclistsrsquo attitudes or future commuting behaviour (I thought more about how long we would have to chase cyclists before the bags would run out) In hindsight I realise how complicated such an evaluation would have been What would be measured and in what way Should a control group be used and if so how to avoid contamination from the test group How much effect can be expected and what requirements does this place on sample size And so on
Something that crossed my mind however was the different reactions we had from the cyclists Most seemed genuinely happy with the gesture although a few expressed that it would have been more motivating if they had received something else lsquoI would rather have a sandwichrsquo a man said when inspecting the content of the bag bicycle lights a saddle cover a reflector and a thank you for cycling card In this first encounter with soft transport measures I thus noticed that incentives motivate people in different ways
My later experiences of soft transport measures and attempts of persuading people to change behaviour (a term I never liked1) both in practice and in studying them has made me aware of the high multitude and innovativeness that exist in this field However these strengths may also contribute to weaknesses concerning lack of continuity and stringency I have great respect for the challenges that planners face administrative practical and financial in the implementation of soft transport measures Hence I hope that this research can be of scientific as well as of practical use a dual wish that should not be overly naive in light of Kurt Lewin (1951) who wrote that lsquotherersquos nothing so practical as a good theoryrsquo (p 169)
Alfred Soumlderberg
8 April 2021
1 I was also not very happy about changing behaviour as a child My parents (featured on the cover) can attest to this It required a lot of persuasion on their part to convince me to swap the Bobby Car for the bike
10
Summary
Traffic accumulated by cars is responsible for considerable problems in our cities The problem is partly about the negative effects on human health due to harmful particulate emissions noise traffic accidents and sedentary lifestyles partly about the space it occupies which leads to congestion and the fact that valuable land is taken up by road infrastructure and parking lots In a bigger perspective car traffic also contributes to greenhouse gas emissions that fuel climate change
At the same time the car is ingrained in our way of life and a necessity for many peoples lives to function Politicians are therefore generally reluctant to limit car use and as a result transport planners find it difficult to enforce measures that lead to a significant reduction in car traffic Attempts are being made with soft measures that encourage people to walk cycle and take public transport These measures can for instance be to inform about alternatives to car use marketing new cycle routes and offering free trial periods with public transport So far it has proved difficult to sufficiently evaluate these measures which has led to scepticism about their usefulness At the same time we need to know more about what it is that motivates modal shifts for different groups Thus more knowledge about soft measures is needed
Innovations in the form of smartphones and electric bicycles (e-bikes) have opened new opportunities for soft measures both in terms of evaluation of these and the potential to influence car use Furthermore previous research has shown that it is important to target soft measures and adapt information and marketing to specific target groups also called segmentation Against this background this thesis (including five individual papers) has examined smartphones e-bikes and marketing These three elements have been used in variation to investigate motivation to reduce car use in favour of walking cycling and public transport segmenting and targeting as well as evaluation of soft measures
Regarding the possibility of smartphone applications to influence travel behaviour explored in the first paper a review of previous research showed that there is potential but that too few studies have been conducted to be able to draw any general conclusions The paper found that applications need to be customised to the user provide relevant information and feedback about the userrsquos behaviour create a commitment towards its use and have a user-friendly design The second paper presented a process evaluation of a project where an application was developed to facilitate sustainable business travel However the study showed several weaknesses with the application and the difficulty in evaluating the effect of such a soft measure which gave lessons about both study design and the development of applications and their implementation in organisations
11
In the third paper we found that marketing for sustainable travel is more motivating if it is aimed at the collective rather than the individual and contains altruistic messages linked to the environment and health The respondentsrsquo stated motivation to reduce car use reflected their current car use and attitude towards the environment and various means of transport This underlines the importance of adapting marketing to the target group The fourth paper showed that onersquos morality towards the climate has a significant impact on the motivation to reduce car use but habits travel time and attitudes towards car and bicycle use also play a role Such factors differ between gender age level of education and between urban and rural areas and may be important for the segmentation used for soft measures
The results from the fifth paper showed that e-bikes have exciting potential to replace the car and contribute to more sustainable travel behaviours In a field experiment where the participants consisted of frequent drivers car travel measured in distance decreased by an average of 37 as a result of the participants gaining access to their respective e-bike The share of cycling of total travel increased by just over 20 on average The participants measured their travel behaviour and answered survey questions using their smartphones which contributed to high data quality Both the effect evaluation of the use of e-bikes and the use of smartphones to measure travel behaviour make a novel and important contribution to the research field on soft transport measures and the application of these in practice
The thesis concludes that innovations have great potential to improve soft measures both as a means for contributing to increased sustainable travel behaviours and as a means of making more rigorous evaluations The thesis also contributes to the knowledge about how sustainable transport can be marketed what creates motivation to reduce car use as well as different perspectives on segmentation and which target groups soft measures can be aimed at
12
Populaumlrvetenskaplig sammanfattning
Bilismen orsakar en maumlngd problem i varingra staumlder Det handlar dels om negativa effekter paring maumlnniskors haumllsa paring grund av skadliga partikelutslaumlpp buller trafikolyckor och stillasittande dels om platsen den tar i anspraringk vilket leder till traumlngsel och att vaumlrdefull mark tas i besittning av vaumlginfrastruktur och parkeringsplatser I ett stoumlrre perspektiv bidrar biltrafiken aumlven till utslaumlpp av vaumlxthusgaser som eldar paring klimatfoumlraumlndringen
Samtidigt aumlr bilen ett naturligt inslag i varingrt saumltt att leva och helt noumldvaumlndig foumlr att maringnga personers livspussel ska garing ihop Politiker vill daumlrfoumlr ogaumlrna begraumlnsa bilens framfart och transportplanerare har som foumlljd svaringrt att tvinga fram ett minskat bilresande Daumlrfoumlr goumlrs aumlven foumlrsoumlk med mjuka aringtgaumlrder som syftar till att uppmuntra fler maumlnniskor att garing cykla och aringka kollektivtrafik Det kan handla om att informera om alternativ till bil marknadsfoumlra nya cykelstraringk och att erbjuda gratis provperioder med kollektivtrafik Hittills har det visat sig svaringrt att utvaumlrdera dessa aringtgaumlrder paring ett bra saumltt vilket lett till skepsis gaumlllande dess nytta Samtidigt behoumlver vi veta mer om vad som motiverar aumlndrade resvanor foumlr olika maringlgrupper Det behoumlvs helt enkelt mer kunskap om mjuka aringtgaumlrder
Ny teknik i form av exempelvis smartphones och el-cyklar har oumlppnat upp nya moumljligheter foumlr mjuka aringtgaumlrder baringde vad gaumlller utvaumlrdering av dessa och potentialen att paringverka bilanvaumlndningen Vidare saring har tidigare forskning visat att det aumlr viktigt att rikta mjuka aringtgaumlrder och anpassa information och marknadsfoumlring till specifika maringlgrupper aumlven kallat segmentering Mot denna bakgrund har avhandlingen undersoumlkt smartphones el-cykling och marknadsfoumlring Dessa tre element har paring olika saumltt anvaumlnts foumlr att undersoumlka motivation att minska bilresandet till foumlrmaringn foumlr garingng cykel och kollektivtrafik samt maringlgruppsanpassning och utvaumlrdering av mjuka aringtgaumlrder
Naumlr det gaumlller smartphoneapplikationers moumljlighet att paringverka resandet visade avhandlingens foumlrsta artikel i en genomgaringng av tidigare forskning att det finns potential men att foumlr faring studier har genomfoumlrts foumlr att kunna dra naringgra generella slutsatser om hur mycket I artikeln fastslogs att applikationer behoumlver anpassas till anvaumlndaren ge relevant information och feedback om ens beteende skapa engagemang och ha en anvaumlndarvaumlnlig design I den andra artikeln genomfoumlrdes en processutvaumlrdering av ett projekt daumlr en applikation utvecklades med syfte att underlaumltta det haringllbara tjaumlnsteresandet Studien visade dock paring flera svagheter med applikationen och svaringrigheten i att utvaumlrdera effekten av en saringdan mjuk aringtgaumlrd vilket gav laumlrdomar om saringvaumll studiedesign som utvecklingen av applikationer och dess implementering i organisationer
I den tredje artikeln fann vi att marknadsfoumlring foumlr haringllbart resande aumlr mer motiverande om den riktar sig till kollektivet snarare aumln individen och inneharingller altruistiska budskap
13
kopplat till miljouml och haumllsa Respondenternas angivna motivation att minska bilanvaumlndningen speglade deras nuvarande bilanvaumlndning och attityd gentemot miljoumln och olika faumlrdmedel Detta understryker vikten av att anpassa marknadsfoumlring till de maringlgrupper man vill vaumlnda sig till Den fjaumlrde artikeln visade att individers klimatmoral det vill saumlga det upplevda personliga ansvaret att minska sina vaumlxthusgasutslaumlpp har en betydande paringverkan paring motivationen att minska bilanvaumlndningen Aumlven vanor restid och attityder gentemot bil- och cykelanvaumlndning spelar roll Saringdana faktorer skiljer sig aringt beroende paring koumln aringlder utbildningsnivaring och mellan stad och landsbygd och kan ha betydelse foumlr den segmentering som anvaumlnds foumlr mjuka aringtgaumlrder
Resultatet fraringn den femte artikeln visade att el-cykeln har stor potential att ersaumltta bilen och bidra till ett mer haringllbart resande I en faumlltstudie daumlr deltagarna utgjordes av vanebilister minskade bilresandet maumltt i distans med i genomsnitt 37 till foumlljd av att deltagarna fick tillgaringng till varsin el-cykel Andelen cykling av allt resande oumlkade med drygt 20 i snitt Deltagarna fick maumlta sina resvanor och svara paring fraringgor om sitt resande i sina smartphones vilket bidrog till houmlg datakvaliteacute Baringde effektutvaumlrderingen av el-cykling och anvaumlndningen av smartphones foumlr att maumlta resvanor ger ett nytt och viktigt bidrag till forskningen om mjuka transportaringtgaumlrder samt den praktiska tillaumlmpningen av dessa
Slutsatsen fraringn denna avhandling aumlr att ny teknik har stor potential att foumlrbaumlttra mjuka aringtgaumlrder baringde som medel foumlr att bidra till ett oumlkat haringllbart resande och som medel foumlr att goumlra mer gedigna utvaumlrderingar Avhandlingen bidrar aumlven med kunskap om hur haringllbart resande kan marknadsfoumlras vad som skapar motivation att minska bilresandet samt olika perspektiv paring segmentering och vilka maringlgrupper som mjuka aringtgaumlrder kan riktas till
14
Papers included in the thesis
Paper I Promoting sustainable travel behaviour through the use of smartphone applications A review and development of a conceptual model A Andersson L Winslott Hiselius E Adell Travel Behaviour and Society 11 52-61 (2018) A Andersson Literature review analysis of empirical material development of the conceptual model manuscript writing
Paper II Evaluating a Mobility Service Application for Business Travel Lessons Learnt from a Demonstration Project A Andersson L Winslott Hiselius P Arnfalk J Berg S Forward Sustainability (Switzerland) 12(3) 1-18 (2020) A Andersson Data management statistical analyses conceptual framework the main part of manuscript writing Paper III The effect of marketing messages on the motivation to reduce private car use in different segments A Andersson L Winslott Hiselius E Adell Transport Policy 90 22-30 (2020) A Andersson Developing the survey data management statistical analyses literature review manuscript writing Paper IV Is climate morality the answer Preconditions affecting the motivation to decrease private car use A Andersson Transportation Research Part D Transport and Environment 78 1-14 (2020) Paper V What is the substitution effect of e-bikes A randomised controlled trial A Soumlderberg fka Andersson E Adell L Winslott Hiselius Transportation Research Part D Transport and Environment 90 1-11 (2021) A Soumlderberg fka Andersson Funding acquisition study design literature review developing survey items data management statistical analyses manuscript writing ndash original draft
15
Abstracts
Paper I The negative effects of transport in terms of pollution congestion and climate change have driven the need for increased cleaner and more efficient modes of transport especially in urban settings While new technology can solve some of these issues behaviour changes have also been identified as an important factor to achieve a modal shift from cars to walking cycling or public transport This study investigates how information and communication technology (ICT) has been used to influence behaviour change and synthesizes key aspects into a conceptual model for creating a behaviour change support system (BCSS) for smartphone applications A literature review concerning behaviour change and ICT in the fields of transport health energy and climate was conducted to gather empirical evidence which forms the foundation of the conceptual model The empirical findings were verified against a theoretical framework consisting of the transtheoretical model theory of planned behaviour diffusion of innovations and the concept of gamification The results suggest that customisation to the user relevant and contextualised information and feedback commitment and appealing design are important aspects when influencing users to change behaviour through smartphone applications The conceptual model provides further knowledge of key aspects to consider when developing persuasive tools that aim to encourage more sustainable modes of transport
Paper II Business travel contributes to significant greenhouse gas emissions and there is a need for measures that reduce the demand for trips made with energy-intensive means of transport In this study a mobility service application (MSA) introduced in 13 Swedish organisations was tested and evaluated to facilitate booking and handling of business trips in particular public transport A before and after study consisting of surveys and interviews with employees at the organisations was conducted The results show that the MSA was mostly used for regional and local public transport trips and users stated that the MSA made it easier to travel by public transport although this particular result should be seen as tentative due to the small sample size Three factors that influence the success of a new MSA as a means to increase sustainable business trips were identified management control and proactiveness perceived improvement of intervention and functions and technical sufficiency The results also highlight the need to establish organisational conditions that facilitate sustainable business travel such as a coherent travel policy accessibility to sustainable modes of transport and a culture that encourages environmentally friendly behaviour The study suggests improvements that can be made to similar interventions and strategies which can be introduced to promote sustainable business travel
16
Paper III This study explores marketing messages promoting sustainable transport and reported motivation to reduce private car use within different segments A stated preference survey targeting a sample of 1300 residents in Sweden was conducted and exploratory factor analysis was used to identify underlying dimensions of a set of 19 marketing messages Self-efficacy and collective efficacy were defined as latent factors and the latter was found to be a better motivator for all segments For the most car-advocating segment however the factors (both self and collective efficacy) were unsuccessful in inducing any reported motivation to reduce private car use Assimilation bias seems to influence the respondentsrsquo interpretation of marketing messages
Paper IV Persuasive messages are commonly used in campaigns promoting sustainable transport to motivate people to reduce private car use This paper explores the preconditions affecting the motivation of people to reduce private car use when exposed to such messages A sample of 1300 Swedish residents was analysed for the effect of variables related to accessibility usual commute mode and attitudes Significant variables were used to create a precondition index which was cross-tabulated with demographic variables and stages drawn from the transtheoretical model The results show that there are differences in the preconditions regarding motivation to reduce private car use between segments of the population Results indicate that climate morality is a critical factor affecting motivation specifically the motivation of persistent drivers Usual commute mode car advocacy health concerns attitudes towards cycling car identity and travel time also influence motivation Males the middle-aged people with low educational attainment and rural residents have the least favourable preconditions concerning motivation to reduce private car use
Paper V As sales of e-bikes increase so does the need for reliable evaluations of which means of transport the e-bike replaces the substitution effect A randomised controlled trial with GPS data from 98 frequent drivers in Sweden was conducted to investigate the effect of the e-bike on modal choice the number of trips and distance as well as perceptions of the e-bike as a substitute for the car The results demonstrate that the treatment group increased cycling on average with one trip and 65 km per day per person which led to a 25 increase in total cycling The whole increase was at the expense of car use which on average decreased by one trip and 14 km per person per day a decrease in car mileage of 37
17
1 Introduction
The purpose of this thesis is to contribute knowledge on how to reduce the demand for car use by encouraging a modal shift towards walking cycling and public transport In the big picture car use is a critical issue that affects the balance between all three dimensions of the concept of sustainability socially environmentally and economically (van Wee 2014) as well as the intergenerational definition that lsquothe current generation should not fulfil its needs in such a way that it jeopardizes the needs of future generationsrsquo (WCED 1987) On a smaller scale the issue of car use affects individuals to a high degree as it accounts for a large proportion of all travel (most notably in the western world) and is perceived as a major asset by most households (Lucas and Jones 2009) There is undeniably a duality of car use When designing measures that force a reduction in car travel improvements are generated in certain respects and for some people while also leading to deteriorations in other respects for some people (Levinson 2002) However when people choose to voluntarily alter their car use instead of being forced benefits are mutual (Taylor and Ampt 2003)
11 Car use Two sides of the same coin
Car use makes a significant contribution to general welfare in societies and for individuals In economic terms the speed and flexibility of the car combined with infrastructure and policies that pave its way help people and businesses to connect As a result positive agglomeration and productivity effects can be realised (Boumlrjesson et al 2019 Graham 2007) which in turn can facilitate functioning labour markets and increased employment (Norman et al 2017) Moreover the car provides people with convenience and freedom to travel independently from a to b while constituting a personalised space for socialising with family and friends For many people travel by car is related not only to instrumental benefits but also affective and symbolic benefits (Steg 2005) and may be desired for its own sake (Mokhtarian et al 2001) For those with access to a car it provides accessibility to live and work in areas that are unreachable by public transport or active travel modes such as walking and cycling
In most industrialised countries the car is deeply entrenched in the way of living and despite recent expectations of lsquopeak carrsquo in conjunction with the 2008 economic
18
recession (Bastian et al 2016 Stapleton et al 2017) car use per capita at least in Sweden seems fixed There is no doubt that car use provides enormous benefits to society and individuals (Banister 2011)
Flipping the coin reveals the downside of car use also referred to as negative transport externalities which harm people society and the environment Traffic is responsible for (severe) injuries and fatalities (Elvik et al 2009) congestion (Stopher 2004) local air pollution and noise (Holgate 2017) degradation of urban space and landscapes (Goumlssling 2020 2016) as well as the release of carbon dioxide which exacerbates climate change (Banister 2005) The latter has been at the forefront of car-related issues addressed in the last decades due to the large portion of CO2 emissions stemming from the transport sector In Sweden this portion accounts for a third of domestic emissions of which 93 originates from road transport and 67 of this from passenger transport (Swedish Transport Administration 2020) As such there is no doubt that car use also causes tremendous damage to people and the planet at least in its current shape
12 The benefits of soft transport measures
In both research and practice the way to limit the release of carbon emissions caused by transport is often divided into three mitigation measures (i) switching to low-carbon fuels (ii) improving vehicle efficiency and (iii) reducing vehicle travel (Axsen et al 2020) For fuels the goal is to replace diesel and gasoline with electricity biofuels and hydrogen (each from low-carbon sources) while vehicle efficiency is principally enforced by requiring car manufacturers to comply with vehicle emission standards In terms of reducing vehicle travel this is referred to in transport research as travel demand management (TDM) (Gaumlrling et al 2002) TDM measures are in turn divided into lsquohardrsquo and lsquosoftrsquo measures The former typically includes physical measures such as changes in infrastructure as well as legal and financial policies while the latter includes measures such as information incentives and administrative changes Hard measures are often more coercive than soft measures which aim to empower individuals to voluntarily reduce their car use (Bamberg et al 2011)
The three overarching measures (fuel-switching vehicle efficiency and TDM) will need to be integrated into strong policy mixes to fulfil the climate targets for the transport sector (Banister 2019 Brand et al 2020 Milovanoff et al 2020) Some argue that it is unlikely that TDM measures will contribute significantly in this sense although they can lsquoprovide important complementary co-benefits and mitigation of rebound effects from other efficiency policiesrsquo (Nieuwenhuijsen 2020)
Regardless of the extent to which soft measures lead to reduced carbon dioxide emissions from the transport sector there are many benefits from increasing the share
19
of walking cycling and public transport Successful soft measures lead to improved public health through reduced pollution and higher levels of physical activity (Shaw et al 2014) less congestion as well as less need for road expansions and parking infrastructure while improving equality and road safety (Anable and Goodwin 2019) These benefits cannot be achieved by just focussing on low-carbon fuels or vehicle efficiency Realising a shift from cars to active transport (principally walking and cycling) is associated with large societal benefits (Rabl and de Nazelle 2012) The societal cost of a kilometre driven by car in urban areas has been estimated to be more than six times higher than the cost of a kilometre cycled (Goumlssling and Choi 2015) Due to its relatively low cost and potential societal benefits the value for money of soft measures has been estimated to provide a benefit-cost ratio of more than 101 (Cairns et al 2008)
There is an increasing understanding of the problems associated with high volumes of car traffic in urban areas (Hrelja 2019) As city officials become more interested in reducing car use to create more attractive and liveable urban areas increased attention has been directed towards soft measures to facilitate more walking cycling and use of public transport (Hino et al 2019 Kuang et al 2019) This justifies more research on the current issues affecting the development of soft measures as there are still unanswered questions regarding soft measures in terms of their feasibility and optimal use in practice
13 Key issues addressed
Two issues are the focus of this thesis The first regards the lack of methodologically sound evaluations of soft transport measures and the potential for innovations to alleviate this and influence travel behaviour Research about innovation in soft measures has been scarce and may represent untapped potential The second issue regards the need for an increased understanding of what factors motivate diverse groups of people to reduce car use and what implications this can have for targeting soft measures We will now look at these two issues in brief
As stated by Bamberg and Rees (2017) many are still sceptic about the effectiveness of soft transport measures Even though numerous research studies (including a few meta-analyses) have shown that soft measures bring real tangible effects on car use and benefits to society (Richter et al 2009) there is still a consensus that these findings are threatened by a lack of internal and external validity partly due to a lack of controlled evaluations and insufficient data quality (Chatterjee and Carey 2018) This has led researchers to continuously call for more rigorous evaluations of interventions aimed at reducing car use (Arnott et al 2014 Bonsall 2009 Chatterjee 2009 Graham-Rowe et al 2011 Petrunoff et al 2016 Rosenfield et al 2020 Semenescu et al 2020
20
Shaw et al 2014 Yang et al 2010) At the same time rapid technological development is currently experienced in the transport domain This includes lsquonew mobilityrsquo innovations such as ride-hailing and shared vehicle systems electrification and automation (Sperling 2018) Users of these new services as well as of traditional public transport are becoming increasingly dependent on internet and communication technology (ICT) in particular smartphone applications to access travel information planning tools and to make payments (Goumlssling 2018) Another innovation is the electric bicycle (e-bike) which has gained serious interest in recent years due to its potential to substitute car trips (Cairns et al 2017) making it a promising and potentially critical component of the necessary shift toward more sustainable transportation systems (Plazier et al 2018)
Surprisingly few studies seem to have analysed how these innovations can be used to improve soft measures For e-bikes Moser et al (2018) found that a year after an e-bike trial the participantrsquos habitual association with car use had weakened significantly Similarly a recent study found that a significant modal shift from cars to e-bikes found in a trial setting was replicated for actual e-bike customers (Fyhri and Sundfoslashr 2020) Two examples of studies of ICT and soft measures are Sottile et al (2020) who incorporated soft measures in the form of personal travel plans within a smartphone application (IPET) and Matyas and Kamargianni (2019) who evaluated whether a bundle of transport services (referred to as mobility as a service or MaaS (Karlsson et al 2019)) could be used as a tool for promoting shared transport Still the lack of studies examining potential synergies between these innovations and soft measures can lead to missed opportunities to facilitate modal shifts
Previous research has made considerable contributions to our understanding of the motivational determinants that can influence modal shift (Bamberg 2014 Fujii and Taniguchi 2006 Hoffmann et al 2017 Javaid et al 2020) However motivational determinants may differ between groups which is why segmentation has been increasingly called for to understand how different target groups respond to soft measures such as information and marketing messages (Pangbourne and Masthoff 2016 Richter et al 2011 Semanjski and Gautama 2016 Thoslashgersen 2018) Moreover there is a need for more studies that take a theory-driven approach to soft measures (Arnott et al 2014) According to Chatterjee and Carey (2018) there seems to be some inconsistency in how theory is applied in soft measures and as a basis for evaluation The application of theory in interventions is important for understanding why an intervention did or did not work and can advance our understanding of how to design effective soft measures (Bamberg et al 2011)
This research contributes to filling these gaps by exploring two innovations of relevance for soft measures The first is ICT with a particular emphasis on smartphone applications while the second innovation is the e-bike Additionally marketing messages that promote walking cycling and public transport are explored These three
21
cases form the basis for analysing segmentation of potential populations motivation to decrease car use and evaluation of soft transport measures The thesis attempts to base analyses on theories of behavioural intention behaviour change and technology adoption Two aims have guided this endeavour
14 Aims and objectives
The first aim is to explore two transport innovations smartphone applications and e-bikes in terms of their potential to improve evaluations of soft transport measures and influence travel behaviour
The second aim is to investigate what influences motivation to decrease private car use for different segments and how this can be used to improve soft transport measures
The aims will be realised by achieving the following objectives
1 To conduct a literature review on smartphone applications and behaviour change techniques and contrast the findings against theories of behavioural intention behaviour change and technology adoption
2 To assess the effect of a smartphone application on travel behaviour and perceptions towards using public transport within a field experiment A theory of acceptance and use of technology will be used to analyse the findings
3 To conduct a survey measuring motivation to reduce car use in diverse attitude-based segments and a stage-based theory of change
4 To assess the effect of an e-bike trial on travel behaviour and perceptions towards the e-bike as a substitute for the car in a field experiment utilising smartphone data
15 Main contribution
This thesis makes a novel contribution to the soft transport policy field by investigating innovations as a means for driving behaviour change as well as facilitating better evaluations Another contribution to the field is the combined analyses of segmentation and motivation to reduce car use which give insights into motivational differences and possible strategies for targeting
The empirical contribution consists of field evaluations of a smartphone application as well as an e-bike trial The findings from the analyses of motivation to reduce car use
22
within different demographic groups as well as in behaviour change stages are of use for both research and practice The results regarding the marketing messages could be of use for instance by regional public transport authorities in their marketing efforts
The study design of the e-bike trial offers some methodological elements of interest for both research and practice regarding smartphones for data collection and the option to offer treatment to the control group for mitigating dropouts in behavioural interventions
The theoretical contribution consists of a conceptual model for developing behaviour change support systems which was created in the first paper the evaluation of a smartphone application in light of theory on user acceptance and use of technology as well as the application of attitude-based segmentation and behaviour change stages to explore motivation to reduce car use in different groups
16 Structure of the thesis
This thesis consists of this summary and the five papers which are found in the appendix After this opening chapter an introduction to soft transport measures is given in Chapter 2 Chapter 3 presents the framework containing the central concepts and theories that have guided the interpretation of the empirical material Chapter 4 provides an overview of the methods and datasets while the results from each paper are presented in Chapter 5 In Chapter 6 the results are discussed in relation to previous research and ends with the thesisrsquo conclusions limitations and suggestions for further research
23
2 The little brother in transport policy
This chapter addresses the origins definition and effectiveness of soft measures as reported by previous literature and then delves into the transport planning context of such measures in Sweden
21 Born in the USA
The need for urban transportation policy to manage the travel demand arose in conjunction with the oil supply disruptions in the early 1970s in the United States Attempts were made from the public domain to reduce the use of single-occupant vehicles for instance by promoting carpooling (Ferguson 1997) see Figure 1 The following decade saw a rapid growth in traffic volumes which began to outpace the supply of new road infrastructure A broad welfare-increase occurred in combination with sprawled land-use planning and between 1982 and 1996 car use as measured by vehicle miles travelled increased annually by 32 while the population was growing at an annual rate of 1 (Winters 1998) Traffic congestion increased and in addition other negative externalities from traffic especially environmental impacts were receiving more attention from federal and state legislators (Meyer 1999) One response to these challenges was the introduction of a concept referred to as Transport (or Travel) Demand Management (TDM) which eventually spread to Europe as well
Figure 1 A sign encouraging carpooling during the gas shortage resulting from the 1973 oil crisis Source David Falconer US National Archives and Records Administration
24
22 Managing travel demand through lsquohardrsquo and lsquosoftrsquo measures
TDM includes a variety of strategies that attempt to change travel behaviour in order to increase transportation system efficiency also labelled mobility management by some scholars (Litman 2010) A wide array of measures exists for that purpose ranging from physical alterations of land use legal policies such as prohibiting cars in city centres fiscal policies like congestion charging information such as marketing campaigns for new cycling routes incentives such as temporarily reduced fares on public transport and administrative instruments in the form of travel policies and organisational carpooling schemes (Fujii et al 2009 Gaumlrling et al 2002)
These measures are commonly divided into lsquohardrsquo and lsquosoftrsquo measures (Bamberg et al 2011) Hard measures are designed to push individuals towards the desired behaviour for instance through physical changes like closing roads or increasing taxation of car ownership fuel costs or prohibition of car use under certain conditions Fiscal interventions typically require substantial resources to implement while coercing people through modifications of the physical environment or legal policies may involve political costs as such measures can be met with opposition from the public (Ockwell et al 2009 Semenescu et al 2020)
In contrast soft measures attempt to pull people out of their cars by providing information offering incentives and lowering barriers for reducing car use They attempt to influence car users to voluntarily switch to sustainable travel modes sometimes referred to as lsquovoluntary travel behaviour changersquo (VTBC) (Bamberg et al 2011) and are defined by Steg (2003 p 109) as lsquostrategies aimed at influencing peoplersquos perceptions beliefs attitudes values and normsrsquo One upside of using soft measures is that there is rarely any public opposition to it Another advantage is the flexibility with which it can be implemented thus making it easier to customise according to prevailing contexts compared to hard measures Soft measures have on the other hand been difficult to assess in terms of effectiveness making their usefulness uncertain (Bonsall 2009)
There is an assumption of a synergetic relationship between hard and soft measures in which they could strengthen one another With the implementation of hard measures that change the relative attractiveness of travel options the possibility increases that soft measures would be effective in motivating and empowering car users to decrease car use (Bamberg et al 2011) Likewise if soft measures succeed in reducing car use in conditions of congestion induced traffic effects must be handled with hard measures in order to lsquolock inrsquo the net car use reduction for example by reallocating road capacity and restraining parking (Cairns et al 2004)
25
23 Evaluation and effectiveness of soft measures
For the last two decades much of what has been discussed in the research literature regarding the effectiveness of soft measures has to do with whether mainstream evaluations of soft measures can be trusted and in what ways they need to improve
A few large-scale programs have implemented and evaluated the effectiveness of soft measures for example in Australia (Rose and Ampt 2001) the UK (Cairns et al 2004 Parker et al 2007) Germany (Broumlg et al 2009) and Sweden (Friman et al 2013) Rose and Ampt (2001) reported an approximate 10 reduction in car driver kilometres and a slightly higher percentage reduction in car driver trips Cairns et al (2004) projected a decrease in traffic levels by 4-5 nationally in a low-intensity scenario in which soft measures are applied inconsistently and a 10-15 decrease in a high-intensity scenario in which soft measures are consistently utilised and supplemented by hard measures Broumlg et al (2009) reported reductions in car use of 5-15 however these estimates were for car trips only and not related to car distance Friman et al (2013) analysed 32 programs but concluded that the evaluations were of insufficient quality to be assessed for effectiveness in reducing car use
Indeed compilations of the kind reported above have received much criticism for evaluating studies with weak research designs and for combining the results of these studies narratively Instead Moumlser and Bamberg (2008) introduced a meta-analytic approach to synthesising the results from 141 intervention evaluations a more reliable method and one that can be used to determine causal effects (Bamberg and Moumlser 2007) They found that soft measures generally led to an increase of 7 in the proportion of trips not conducted by car but that the ability to draw strong conclusions was limited by the fact that all the 141 evaluation studies used weak quasi-experimental designs As noted by Bonsall (2009) if there is a systematic bias in the reporting of effects in individual studies this problem will not be alleviated simply by conducting meta-analyses based on published results
Four meta-analyses including randomised controlled trials and strong quasi-experimental studies have been conducted since then Fujii et al (2009) including 15 studies found that the average number of weekly car trips reduced by 11-17 Arnott et al (2014) including four studies found no evidence for behavioural interventions to reduce car use frequency Bamberg and Rees (2017) including 11 studies found an average reduction in car modal share of about 5 The latest meta-analysis by Semenescu et al (2020) including 30 studies found an overall reduction in car modal split of 7
Although these meta-evaluations provide more reliable estimations than previous narrative compilations the studies on which they are based are still limited by internal validity issues due to data collection practices being based on self-reports A related issue
26
is the lack of studies measuring travel distance which is important in order to assess intervention effects for instance on energy emissions and health Further more individual studies need to employ controlled evaluations preferably randomised experimental designs to control for confounding factors that might impede on results (Bamberg and Rees 2017)
24 Soft measures in the context of Swedish transport planning
In Sweden decisions on investment projects that are estimated to cost more than SEK 100 million are to be preceded by an action selection study (AringVS) that reviews potential measures by application of a four-step principle The first step of this principle investigates whether it is possible to address the deficiency need or problem by reducing or changing demand The second step identifies more efficient ways of using existing transport infrastructure As the third and fourth steps reconstruction and new construction measures are considered (Swedish Transport Administration 2018) The idea is that the fourth and most costly step should only be proposed if measures in the first steps are insufficient to meet the needs (Swedish Transport Administration 2014)
Table 1 Different approaches to Travel Demand Management and its relationship to the Swedish four-step principle
The Swedish four-step principle
Travel Demand Management Hard measures Soft measures
Physical changes
Legal policies
Economic policies
Information amp feedback
Incentivised schemes
Administrative change
1 Reducing or changing transport demand
Land use planning Localisation (eg industry shops residential areas)
Decreasing speed limits Parking control
Parking charges Increased fuel prices
Marketing of new services Travel information to households
Temporarily reduced fare for PT Free e-bike trial
Travel policy at schools or workplaces Flexible working hours and teleworking
2 Use existing infrastructure more efficiently
Redistribution of street space Increased PT frequency
Prohibiting cars in city centres
Congestion charging Peak hour road tolls
Digital travel planner
Reward for driving off-peak hours
Organisational carpooling Car cooperatives
3 Make limited renovations
Relative capacity adjustments that disfavour car use
4 New investments or major renovations
New relative capacity investments that disfavour car use
One can easily identify the first two steps in the four-step principle as typical domains for TDM measures in which soft measures are most common in step 1 Fujii et al
27
(2009) divided hard measures into physical legal and economic policies A parallel division of soft measures is made here which includes information and feedback incentivised schemes and administrative changes In Table 1 examples of hard and soft TDM measures divided into these categories are presented in relation to the four-step principle
Even though soft measures are included in the national planning toolbox the utilisation of step 1 measures is low compared to step 2-4 In an evaluation of the application of the four-step principle in practice the Swedish National Audit Office (2018) found that step 1 measures were only considered in half of the 170 action selection studies that were reviewed (compared to 89 for step 2 88 for step 3 and 71 for step 4) and just 35 of the studies proposed an actual implementation of step 1 measures The reasons for the low utilisation of step 1 measures are according to the evaluation that they are not regarded as useful in many cases and because the Swedish Transport Administration lacks the mandate to implement and finance step 1 measures resulting in most of them being conducted on the municipal or regional level There is also a lack of knowledge about the effects of soft measures which contributes to their insignificance in the action selection studies (Swedish National Audit Office 2018) This situation is not unique for Sweden When interviewing officials at the local level in the UK Cairns et al (2004) found that planners often feel that working with soft measures is not recognised as being of central importance in transport strategy which is affecting resources political support career expectations and profile There was also a perception that the relevant professional skills were not widely available or given sufficient importance
Indeed the implementation of soft measures in Sweden is mostly conducted at the local level in municipalities or within regional public transport authorities Coordination on the national level is missing although some are facilitated on a regional scale
Given that soft measures are still in their formative years are smaller in scale compared to conventional measures and are relatively insignificant in the national planning practice makes them something of a little brother within the transport policy family It also highlights the need for more research about the design and effectiveness of soft measures The next chapter presents the framework that has formed the basis for such an examination in this thesis
28
29
3 Framework of the thesis
Soft measures is a particularly dynamic field of transport policy in which many new schemes and initiatives are being developed on an ongoing basis (Cairns et al 2008) Nevertheless from an implementation perspective this thesis has focused on three concepts that are essential parts of conducting soft measures The concepts are segmentation motivation and evaluation the assumption being that implementing soft measures includes the questions of how to segment and target populations how to enhance motivation for participants to change travel behaviour and how to evaluate the effect of interventions These three concepts have been used to structure and analyse the combined material of the papers
Segmentation motivation and evaluation can be positioned within current guidelines for conducting soft measures as proposed by several actors within the field (Steg and Vlek 2009 Sussman et al 2020 The Behavioural Insights Team and Alta Planning + Design 2017 Whillans et al 2020) These guidelines follow a general approach that includes (1) defining the behaviour to be changed and population to target (2) determining what factors affect the target behaviour (3) designing and implementing a suitable intervention and (4) evaluating the effect of that intervention and taking advantage of lessons learned Figure 2 exemplifies this stepwise approach and how the concepts (segmentation motivation and evaluation) are positioned within this process
Figure 2 A stepwise process for conducting soft measures Adapted from Steg and Vlek (2009) and Sussman et al (2020)
Based on a study of soft transport measures implemented in Sweden (Friman et al 2013) it is clear that there is some discrepancy between these general guidelines and how soft measures are conducted in practice A principal concern is the lack of rigorous study designs which makes it difficult to evaluate the effect of the interventions Few
30
soft measures are theoretically grounded or measure changes in behavioural determinants such as motivation to change travel mode Further the majority of such programs usually recruit as many participants as possible in an uncontrolled manner and provide general rather than personalised information (Friman et al 2013) indicating a lack of targeting Consequently the main difficulties with facilitating soft measures seem to be related to segmentation motivational triggers to pursue in order to influence behaviour and how to evaluate the effect of soft measures Thus increasing the understanding of these principles and how they can be applied in practice can help overcome some of the barriers to implementing successful soft measures Table 2 shows which papers have examined which of the concepts How the concepts have been operationalised within this thesis will be explained next
Table 2 The concepts under study in each paper
Paper Segmentation Motivation Evaluation I X II X X III X X IV X X V X X
31 Segmentation
Previous research has established that segmentation is a useful tool for making campaigns more effective In practice however it is still common to implement soft measures to maximise the reach of campaigns (Stopher et al 2009) This carries the risk of the campaign being irrelevant or even disturbing to a large section of the audience Many people are highly reluctant to reduce their car use and will not pay attention to soft measures (Innocenti et al 2013 Lattarulo et al 2018 Tertoolen et al 1998)
Because soft measures are limited to voluntary behaviour change and often smaller in scale than other transport policy measures (not least financially speaking) spreading a campaign across the whole population according to the lsquoshotgun approachrsquo is likely to result in a low return on investment ratio Instead interventions need to be targeted at suitable segments that are susceptible to changing behaviour and thus more likely to respond in the desired way Designing interventions to target appropriate lsquohigh yield segmentsrsquo ensures resources are placed where they are most likely to have a positive effect on travel behaviour (Parker et al 2007)
Market segmentation was first proposed by Smith (1956 p 6) who defined segmentation as lsquoviewing a heterogeneous market (one characterised by divergent
31
demand) as several smaller homogeneous marketsrsquo The idea is to match the genuine needs and desires of consumers with the offers of suppliers particularly suited to satisfy those needs and desires (Dolnicar et al 2018) Segmentation is often part of a larger approach to strategic marketing together with targeting and positioning referred to as the STP approach The process starts with market segmentation (the extraction profiling and description of segments) followed by targeting (the assessment of segments and selection of a target segment) and finally positioning (adjustment of the product so it is perceived as different from competing products and in line with segment needs) (Dolnicar et al 2018)
Segmentation has been used to a varying degree of sophistication within transport research and typically departs from variables related to demographics travel behaviour spatial distribution and attitudes (Haustein and Hunecke 2013) For instance MaxSEM2 uses six lsquostage diagnosticrsquo statements inspired by the transtheoretical model of change (TTM) and Self-regulation theory (Bamberg et al 2011 Prochaska and Diclemente 1986) and segments people according to their readiness to decrease car use (Van Acker et al 2013) Another example is the travel behaviour and attitude-based segmentation by Anable (2002 2005) who used an expansion of the theory of planned behaviour (TPB) to identify segments These were further developed within the EU project lsquoSEGMENTrsquo to a market segmentation technique for promoting more energy-efficient forms of transport (Anable and Wright 2013)
Segmentation has been used in this thesis to increase the understanding of how motivation to decrease car use in favour of alternative modes differs between subgroups in the population and how targeting can be used to increase the efficiency of campaigns The TTM and the SEGMENT model have been utilised for this purpose and are explained next
The transtheoretical model The TTM (Prochaska and Diclemente 1986 Prochaska and DiClemente 1982) is a behaviour change model that integrates key constructs from other theories into a comprehensive model of change It has been applied to a variety of behaviours mostly related to health particularly smoking cessation The TTM assumes behaviour change to be a dynamic process rather than an isolated event and consists of five stages as described in Table 3 The stages of change are just one core construct of the model which also includes 10 main processes of change decisional balance and self-efficacy According to the theory an optimal scenario would be where processes of change within interventions are matched with the most suitable stage of change However the processes of change have received less empirical support than the stages of change
2 MaxSEM was developed as part of the wider MAX project (2006-2009) which was the largest research
project on Mobility Management within the EUrsquos sixth framework program (European Commision 2009)
32
(Prochaska et al 2008) which could be the reason that the stages of change are the part of the model that have been applied the most by researchers (Spencer et al 2002) The TTM has received unprecedented research attention yet it has simultaneously attracted much criticism partly related to the number and classifications of stages and to the fact that stages might differ between contexts (Brug et al 2005) Some point to the stages themselves as being insufficient to the task of explaining behaviour change since behaviour change is a continuous process (West 2005) Even today no definitive conclusions can be made regarding the effectiveness of stage-matched interventions to promote behaviour change (Vela and Ortega 2020)
Table 3 Stages of change within the TTM
Precontemplation No intention to take action within the next six months Contemplation Intends to take action within the next six months Preparation Intends to take action within the next 30 days and has taken some steps in this direction Action Changed overt behaviour for less than six months Maintenance Changed overt behaviour for more than six months
There is an ongoing strand of research that attempts to increase the understanding of the processes underlying the stages of change in travel behaviour (Bamberg 2007 Forward 2019 Friman et al 2019 Olsson et al 2018) In a review of the usage of the TTM in the transport domain Friman et al (2017) conclude that studies generally lack proper designs and outcome measures in relation to the processes and stages of change making it difficult to conclude their effectiveness Still there is some evidence to suggest that it may be useful to conduct segmentation based on stages of change (Armitage 2009 Thigpen et al 2019) For instance in a modified version of the TTM including four stages Bamberg (2013) confirmed distinctive stages of change and showed that a stage-based intervention significantly reduced private car use Thus in this thesis the use of the TTM has been delimited to the stages of change which is a common approach for utilising the model (Gatersleben and Appleton 2007 Thigpen et al 2015 Waygood and Avineri 2016)
The SEGMENT model Attitude-based segmentation has been shown to effectively predict travel mode choice and offer a potential avenue for targeting soft measures more effectively (Hunecke et al 2010) In this thesis the SEGMENT model was chosen to study because its development is well documented (Anable 2005 Anable and Wright 2013) its segments can be detected in crowdsourced mobility data (Semanjski and Gautama 2016) and the model has been applied in practice with promising results (Ladbury 2013)
The SEGMENT model consists of eight segments five with high accessibility to a car and three with low accessibility By answering a set of 18 questions on a five-point
33
Likert scale (the survey items are presented in the appendix) respondents are assigned to one of the segments The developers behind the SEGMENT identified the questions through discriminant analysis (Anable and Wright 2013) The allocation of respondents to segments is made by multiplying their answers on each question by a weighting coefficient which differ depending on the segment Then the products for each question are summed generating a total score for each respondent for each segment After subtracting the constant which is a sum of the weighting coefficient from each segment the respondents are allocated to the segment which they score highest (Anable and Wright 2013) A description of each segment is provided in Table 4
Table 4 Description of segments Source Andersson et al (2020a)
Segment Description
Hig
h-ca
r acc
essi
bilit
y
Devoted drivers
Do not intend to reduce car use and think successful people drive They do not use public transportation nor cycling and think walking is too slow They are not motivated by fitness and have a very low moral obligation to the environment
Image improvers
Like to drive see the car as a way of self-expression and do not want to cut down car use They do not use public transportation but see cycling as a way of expressing themselves and a good way to keep fit They have neutral or moderate environmental attitudes
Malcontent motorists
They do not like to drive and find it stressful They have a moderately strong intention to reduce car use but are not motivated to increase the use of public transport although they prefer it more than cycling They walk but do not see any advantage to walking except for fitness They have a small level of environmental consciousness
Active aspirers Have a high moral obligation to the environment and are highly motivated to use active transport modes predominantly cycling as they believe that it is quick and provides freedom and fitness They are not public transport users and see problems with using it
Practical travellers
They use a car only when necessary as they think that it reduces the quality of life They prefer cycling to the use of public transportation and would walk when it seems more practical They are not motivated by climate change and see local pollution and congestion as issues They are highly educated and above-average part-time working
Low
-car
acc
essi
bilit
y
Car contemplators
They do not use a car are the highest proportion of non-driving licence owners but would like to as they see cars as status symbols They see many problems with public transportation use and find it the same as cycling stressful They believe walking is healthy and have a neutral or moderate attitude towards the environment
Public transport dependents
They think people should be allowed to use cars and would like to see less congestion (they consider more roads as an appropriate solution) They use public transport although they perceive it to be slow They do not cycle but would like to walk more for fitness They are not motivated by the environment and are the least likely to start driving
Car-free choosers
They think that cars lead to unhealthy lifestyles and do not like to drive They prefer cycling as they feel a high moral obligation to the environment Alternatively they will choose public transport which they do not consider stressful nor problematic and walking They are more likely to be women
34
32 Motivation
The ultimate aim of soft measures is to change peoplersquos behaviour This is done either directly through for example incentives and trials or indirectly by influencing peoplersquos beliefs and attitudes
In this context it is often said in everyday speech that people need to be lsquomotivatedrsquo to lsquodorsquo or lsquochangersquo a behaviour Indeed enhanced motivation increases the likelihood of behaviour change which is why it is desirable to strengthen the motivation of individuals in interventions to modify their behaviour (Sarafino 2012) Motivated behaviour is goal-directed and purposeful and it is difficult to think of any behaviour that is not motivated in this sense (Gross 2010) According to the Oxford English Dictionary to motivate means lsquoto provide with a motiversquo and motive means lsquoa reason for doing somethingrsquo The following definition by Miller (1962) captures this essence of motivation
The study of motivation is the study of all those pushes and prods ndash biological social and psychological ndash that defeat our laziness and move us either eagerly or reluctantly to action
Thus motivation can emerge for several reasons connected to biological social and psychological forces These are commonly divided by psychologists into two parts drives which are mainly biologically based such as hunger and thirst and motives which are at least partly learned and psychologically or socially based (Sarafino 2012) such as the desire to drive a car This thesis focuses exclusively on the latter of the two
Motives are in turn influenced by external conditions (eg institutional economic social) such as the accessibility to transport modes generalised costs for travelling and social norms and internal cognitive processes such as attitudes towards driving a car or riding a bike personal norms and perceived behavioural control (Jakobsson 2004) Several internal motivational determinants have been identified that influence car use for instance problem awareness (Steg et al 2001a) personal norm (Abrahamse et al 2009 Bamberg et al 2007 Kloumlckner 2013 Nordlund and Garvill 2003) attitudes social norms and perceived behavioural control (Ajzen 1991 Chen and Chao 2011 Lois et al 2015) habit (Bamberg 2006 Eriksson et al 2008 Gaumlrling and Axhausen 2003) as well as symbolic and affective motives (Steg 2005) Hoffmann et al (2017) found in a systematic review and meta-analysis that the strongest cognitive correlates of using alternatives to the car were intentions perceived behavioural control and attitudes The same factors were the strongest in predicting car use with the addition of habit In a recent review of reviews Javaid et al (2020) investigated both external and internal factors and stated that psychological and sociological factors as well as the built environment influence car use Perceived behavioural control attitudes personal
35
norms social norms habits infrastructure factors and time and price elasticities were the key factors
Although soft transport measures are defined by scholars as lsquostrategies aimed at influencing peoplersquos perceptions beliefs attitudes values and normsrsquo (Steg 2003) which would suggest an exclusive orientation towards internal motives many soft interventions modify external conditions as well for example by providing participants with a free public transport ticket for a limited time (Bamberg 2006 Friman et al 2019 Fujii and Kitamura 2003 Thoslashgersen 2009) Further it is important to stress that even if soft interventions intend to address beliefs norms and attitudes through for example information and feedback they always do so in an environment of external conditions that influence the degree to which internal processes can explain behaviour (Bandura 2000 Guagnano et al 1995) resulting in people not always doing what they say they will do also referred to as the attitude-behaviour gap (Geng et al 2016 Milfont and Duckitt 2010)
Earlier research on behaviour change interventions in transport highlights the need for more theory-based approaches in the implementation and evaluation of soft transport policy measures (Chatterjee and Carey 2018) The following theories and concepts have been employed in this thesis to better understand the motivation to decrease car use in favour of alternative modes
The theory of planned behaviour One exceptionally influential theory is the theory of planned behaviour (TPB) (Ajzen 1991) It is a theory of how intentions to perform behaviours are formed and postulates that a choice is made among alternative behaviours based on the relative strengths of the intentions Intentions are in turn formed by the attitude towards the behaviour the perceived social pressure from significant others (subjective norm) and perceived behavioural control The TPB is an extension of the theory of reasoned action (Ajzen and Fishbein 1980 Fishbein and Ajzen 1975) which is a rational choice model that presumes that people form intentions based on logic and reasoning The difference between TPB and the reasoned action theory is the additional variable perceived behavioural control which is intended to account for behaviours that are not under complete volitional control (Ajzen 1991) Several meta-analyses have found empirical support for the TPB and that the theory is capable of explaining around 20 of the variance in observed behaviour (Armitage and Conner 2001) Likewise many studies have found support for TPB in explaining transport-related behaviours (Forward 2019 Lanzini and Khan 2017)
The transtheoretical model Described in the preceding section
36
Diffusion of innovations Diffusion of innovations (Rogers 1995) is a theory about the spread of innovations in society Innovations could be a behaviour technology service system object or idea that are considered by society to be new Diffusion is the process where innovations are communicated via different channels over time among members of a social system The theory is particularly valuable in gaining insights into what qualities make innovations spread the importance of social networks that spread the word about innovations as well as identifying segments and their needs (innovators early adopters early majority late majority laggards) The theory has been used to categorise consumers according to their attitudes and adoption of innovations such as electric cars (Noppers et al 2015)
Gamification Gamification is the use of game elementsgame mechanisms in activities that are traditionally unrelated to gaming to enhance the user experience of a particular activity (Deterding et al 2011) In recent years the concept has been applied in many areas to influence behaviours and increase the motivational power of the user but without much consensus on how the concept should be formulated and what the actual benefits are (Seaborn and Fels 2015) This is also true in the transport domain where there are a number of examples of scientific studies where attempts have been made to change travel habits using gamification (Castellanos 2016)
The unified theory of acceptance and use of technology UTAUT defined by Venkatesh et al (2003) aims to explain user intentions to use an information system and subsequent usage behaviour The UTAUT states that perceived usefulness (performance expectancy) perceived ease of use (effort expectancy) and norms (social influence) affect technology adoption intention via behavioural intention which in turn leads to behaviour whereas facilitating conditions directly antecede behaviour The UTAUT model has for instance been used to explain the adoption of e-bikes by early adopters (Wolf and Seebauer 2014)
33 Evaluation
An essential but often marginalised element when carrying out soft measures is evaluation (Davies 2012 Friman et al 2013) Successful evaluations of intervention studies are critical because they reveal the effectiveness of an intervention in achieving improvements to society Parker et al (2007) provide three reasons why evaluations should be of substantial interest the first being to inform decision-makers of whether interventions are a good choice for the spending of resources compared to other options Second to understand how and why effects were achieved to support adaptive
37
learning and improve future interventions and third to enable the possibility to inform participants about the outcome of the intervention in which they took part
However conducting good quality evaluations of soft measures is not an easy task a fact for which Stopher et al (2009) list several reasons First it usually requires both before and after surveys spaced sufficiently far apart to detect stable changes in travel behaviour Second it requires data of the average daily numbers of trips distances and times travelled for each mode of transport to enable an assessment of the change taking place The common use of self-report surveys suffers from measurement errors and low resolution making it inappropriate for measuring soft measures which often results in small changes of 5-10 Third small changes in travel behaviours often require large sample sizes to be detected Fourth methods for evaluating the wider benefits of soft measures are often overlooked such as potential spillover effects caused by interactions between the treatment group and their family or friends Fifth the evaluation should not be conducted by the agency undertaking the intervention in order to minimise bias Sixth it requires a control group A control group is a group from the same population while a comparison group is a population group that is similar to the target group but not from the same population (Stopher et al 2009)
The critique from reviews of behavioural transport interventions reflects these difficulties (Graham-Rowe et al 2011) Research from a public health perspective especially expresses concern that intervention studies lack internal validity and objective outcome measures and instead advocate evaluation studies that employ rigorous research designs in the form of randomised controlled trials (RCTs) which are referred to as the lsquogold standardrsquo in evaluation research (Arnott et al 2014 Ogilvie et al 2007 Yang et al 2010) Reviews from the transport domain on the other hand highlight issues related to insufficient sample sizes short data collection periods and responsesocial desirability bias thus advocating longitudinal studies and evaluations with aggregated travel data to supplement survey-based material (Chatterjee 2009 Moumlser and Bamberg 2008)
The discussion of what constitutes good evaluation practice in research about soft measures was nuanced by Bamberg and Rees (2017) They advocate the use of randomised experimental designs for future evaluations seeking to establish whether an effect and the size of such an effect is existent or not while also acknowledging that understanding processes involved in behaviour change could require different study designs This line of reasoning is shared by Chatterjee and Carey (2018) who declare that lsquothe priority for research [on behavioural transport interventions] should not only be to assess whether expected outcomes occur but also to understand how targeted groups respond to interventions and what processes of change take placersquo This thesis has attempted to include both these dimensions of evaluation that is assessing the effect of soft measures as well as analysing the underlying process of change
38
39
4 Methods and data
41 Progression of the thesis
The scope of this thesis has developed over the course of the project At the outset ICT and smartphone technology was the main focus of the thesis Due to uncertainty whether the project assessing the smartphone application in Paper II would be completed in time for it to form part of the thesis the scope was extended to soft measures in a more general sense Two strands of research needs were identified in Paper I for further investigation
The first strand was connected to innovations for soft transport measures A lack of field evaluations of smartphone applications in transport research was identified as well as the potential to utilise smartphones for measuring and collecting travel behaviour data A field evaluation of a mobility service application (MSA) was conducted in Paper II In Paper II it was evident that more rigorous study designs needed to be facilitated to enable adequate evaluations of soft measures This need was found to be echoed in the literature concerning soft measures This knowledge fed into Paper V where a considerable emphasis was placed on study design in an attempt to assess the substitution effect of e-bikes One such effort was to utilise smartphones for collecting data of the participants perceptions and travel behaviour
The second strand was that of motivation to reduce car use and segmentation to enable more effective interventions which led to the research on marketing messages for different segments in Paper III This generated new questions regarding peoplersquos preconditions for motivation to decrease car use in favour of alternative modes of transport which was investigated in Paper IV The results in Paper IV in turn led to the targeting strategy in Paper V where individuals with high car use were invited to participate in the e-bike trial
The iterative emergence of the papers meant that gaps and observations identified in one study could be investigated in the next thus producing a cumulative understanding of the research theme A schematic representation of how the papers relate is presented in Figure 3
40
Figure 3 The linkages between the papers concerning how findings have been incorporated into the research questions or design of upcoming studies
42 Method rationale
The methods employed in this thesis have been mainly quantitative the exception being Paper II in which a mixed-method approach was employed including both surveys and qualitative interviews
Carrying out the objectives has demanded an explorative (inductive) as well as hypothesis-driven (deductive) research approach The inductive approach was suitable in Papers I III and IV because these studies aimed to explore new themes and develop hypotheses Papers II and V were deductive in the sense that we attempted to establish cause and effect from the MSA intervention and the e-bike trial Surveys and experimental research are the methods that have been mainly used in this thesis
The theoretical stance of the thesis is post-positivist in the sense that it maintains the idea of an objective truth while recognising that prevailing knowledge and values of the researcher influence the research process as well as the interpretation of results (Crotty 1998) As such bias is undesired but inevitable and as a researcher one can only try to detect and correct misinterpretations This quality has been refined during the research project however some of the methods employed in this thesis demand a layer of subjectivity for instance in the interpretation of factors in the factor analysis which certainly influence subsequent analyses and conclusions From a post-positivist point of view this is natural and part of the notion that reality can only be known imperfectly Similarly principles and hypotheses are not intended to be proven as true but rather tested for falsification and should therefore be presented as clearly as possible to be open for refutation As Karl Popper put it (1959 p 280) lsquoevery scientific statement must remain tentative foreverrsquo
41
43 Datasets
Four unique datasets were collected within the thesis see Table 5 In the following sections the data collection procedure and details for these datasets will be presented
Table 5 Overview of datasets
Dataset Method Databases and tools Date of collection Literature data Literature review Scopus Web of science
Google scholar Feb and Sep 2017
Business travel data
Surveys interviews and field experiment
Netigate survey tool Before study March 2017 and Feb-June 2018 After study April 2019 Interviews March 2019
National survey data
Survey Kantar Sifo online panel Feb 2018
E-bike trial data Surveys and field experiment
TravelVu smartphone application
March-June 2020
431 Literature data
The empirical data used for the literature review in Paper I was based on peer-reviewed articles between 2008 and 2017 The keywords used to find relevant articles consisted of combinations of the terms lsquotraveltransportationmobility behaviourrsquo lsquobehaviour changersquo lsquosmartphoneapplicationrsquo lsquomobile devicersquo and lsquopersuasive technologyrsquo After fulfilling the search a snowball review was conducted where references from the articles in the literature search were screened for additional eligible papers
Criteria for inclusion The criteria used for assessing articles for inclusion demanded that papers had been peer-reviewed and that they investigated behaviour change related to some form of smartphone applications or other types of ICT The decision about which articles to include in the review followed the four steps of the PRISMA guidelines (Preferred Reporting Items for Systematic Reviews and Meta-Analyses) (Moher et al 2009) identification screening eligibility and inclusion
Empirical content In total 32 articles were included in the empirical material Two were in the field of energy 12 in the fields of health and fitness two were concerned with climate mitigation and pro-environmental behaviours in general and 15 articles were related to transport and mobility
42
432 Business travel data
This dataset was collected over two years in collaboration with Samtrafiken a company that connects all public and private transport operators coordinates public transport data and develops and manages ticketing and payment standards in Sweden The dataset entailed both surveys and interviews The emphasis was on business trips and the evaluation of a support system specifically developed to simplify the handling of business trips
The mobility service application (MSA) Between 2017 and 2019 Samtrafiken provided a service consisting of a mobile web application where among other things employees of recruited companies authorities and organisations could manage their business trips by public transport and car The MSA provided timetable information as well as the purchase of tickets for local and regional buses commuter regional and national train services registration of car trips and reporting of travel expenses Through the MSA trips by public transport were paid by monthly invoice including a financial statement from Samtrafiken to the recruited organisations The research team was not participating in developing the MSA or recruiting the participants
Surveys The survey included questions about the participantsrsquo business trips attitudes toward transport modes and the perceived possibility to use these modes for business trips The after study also contained questions regarding the use of the MSA A record of the questionnaire items is presented in Paper II
Sample The survey was dispatched to a sample of 525 individuals working in one of the 13 organisations that took part in the study via the marketing research company Netigate The online questionnaire was accessed through an e-mail and 250 people completed the first round (48 response rate) 193 of whom were carrying out any business trips In the second round (the after study) 77 participants responded 35 of whom had used the MSA for conducting business trips Thus in the analyses we had 35 users of the MSA constituting a test group and 42 non-users who formed the control group Additionally in the second round 40 individuals agreed to participate in an interview 20 of whom had used the MSA
Interviews Nine focus groups and 10 individual interviews were conducted of which seven were over the phone and the rest at the informantrsquos workplace The purpose of the interviews which were semi-structured to provide the respondents with an opportunity
43
to discuss without restraint while ensuring that several themes were covered (Flick 2002) was to gain an understanding of how the participants perceived their business trips and to get their views of the advantages and disadvantages of the MSA
Study area A total of 13 organisations distributed throughout five of Swedenrsquos 21 counties participated in the project The counties were Halland Kronoberg Oumlstergoumltland Uppsala and Stockholm
433 National survey data
This dataset consisted of answers from a cross-sectional stated preference survey that was distributed across Sweden The survey included questions regarding demographics accessibility travel behaviour attitudes and motivation to decrease car use for commuting trips when exposed to different marketing messages
Pros and cons of stated preferences Stated preference (SP) methods are widely used in travel behaviour research to identify behavioural responses that cannot be observable in the market (Hensher 1994) The main limitation of the SP approach is that it can result in low internal validity due to a discrepancy between self-reported behaviour and actual behaviour (see for example Rosenfield et al 2020) Social desirability bias is a common cause for flawed answers meaning that some respondents tend to underreport socially undesirable activities and overreport socially desirable ones (Krumpal 2013) In the national survey conducted in this thesis the intention was to examine the relationships between attitudes (and subsequent segmentation profile) and motivation imposed by a set of different marketing messages This kind of data material would be hard to ascertain by examining revealed preferences and while stated preferences carry the risk of social desirability bias it has been shown to provide a reasonably accurate description of true preferences and market behaviour (Lambooij et al 2015 Loureiro et al 2003)
Due to the length of the survey we chose not to include a social desirability scale such as the MarlowendashCrowne Social Desirability Scale (Crowne and Marlowe 1960) Still to mitigate biased answers the participants were informed that the survey was anonymised and that there are no lsquorightrsquo or lsquowrongrsquo answers The purpose of the survey was stated to be purely scientific with no reference to sustainable transport to prevent respondents from giving responses they perceive to be more socially acceptable Further statistical techniques were utilised to detect false responses This will be discussed in the next section
44
The use of an online panel to recruit respondents The survey was distributed through an online panel owned by Kantar Sifo one of Swedenrsquos major marketing research companies It consists of approximately 100000 Swedish citizens 16-79 years of age The panel members are randomly recruited through nationally representative telephone surveys and the panel is continuously replaced with new members to prevent them from becoming too accustomed to the survey methodology Those who agree to participate in surveys receive compensation in the form of bonus points that can be redeemed for movie tickets or gift cards
Although the use of online panels for collecting survey responses has been criticised by some scholars for resulting in low data quality essentially related to low external validity and measurement error the examination of these issues has indicated that the validity of responses from online panels generally falls within the credibility intervals of results from conventionally sourced data (Walter et al 2019) In fact the use of online panels can be of significant use because they are more diverse and provide access to underrepresented populations (Landers and Behrend 2015) However it has been suggested that researchers who use online panels for data collection consider the risk of mischievous respondents (MRs) and employ suitable statistical techniques to omit cases if necessary (Hays et al 2015) In Papers III and IV this was performed by applying Hyman and Sierras (2012) MR algorithm The MR algorithm begins with an intra-case assessment of each respondentrsquos answers and assumes that MRs in trying to sabotage studies yet remain undetected will answer in ways that produce high or low means or variances relative to other survey participants Then like outlier analyses the algorithm identifies potential cases for removal based on a threshold criterion The respondents were considered mischievous if the variance of their responses was below 025 This resulted in 16 of the sample being removed for the sample in Paper III (191 cases) and 13 of the sample in Paper IV (127 cases)
Questionnaire content A detailed account of the questionnaire items is presented in Papers III and IV and in the appendix The marketing messages that were assessed in the survey were inspired by real mobility management campaigns in Sweden and carried out by regional public transport authorities municipalities train operators and pro-bicycling organisations However they were adapted to fit the common marketing lsquoframesrsquo used to promote pro-environmental behaviours as identified by previous research (Avineri and Waygood 2013 Bolderdijk et al 2013 Griskevicius et al 2010 Loureiro and Veloso 2017 Nisbet and Gick 2008 Winslott Hiselius and Smidfelt Rosqvist 2015) These were related to either economic environmental health or status-frames The messages are presented in Table 6
45
Table 6 Marketing messages with means and standard deviations Theme abbreviations $=economy E=environment H=health S=status
Marketing message Theme Mean SD 1 We all must help to reduce our climate footprint The result will be a sound
environment that future generations also need E 373 110
2 Those who mostly walk cycle or ride transit are doing something good for the environment
E 364 109
3 Research shows that public transport users are walking on average four times more per day than car drivers therefore reducing the risk of acquiring severe non-communicable diseases
H 360 108
4 Those who cycle and go by public transport not only improve their health but also contribute positively to other peoples health
H 357 108
5 Did you know that cyclists have a 52 lower risk of dying of heart disease and a 40 lower risk of dying from cancer
H 353 113
6 You save about 350 euro per month if you live without a car and instead go by public transport and even more if you cycle or walk
$ 337 124
7 Bicycles run on fat and save you money Cars run on money and make you fat
H $ 337 127
8 If Sweden is to achieve its climate targets then generally every third car trip must be replaced with more environmentally friendly alternatives
E 336 119
9 By cycling instead of taking the car to work you save money and contribute to society at the same time Try it
$ 328 116
10 The car traffic in Sweden induces a socio-economic loss above 10 billion euros in adverse health effects
H 321 117
11 In the government budget support for investments in cycling infrastructure increased by 50 million euros in 2018
$ 317 118
12 If you want to improve your health you should ride a bicycle instead of driving a car If the distance is a problem then an electric bike can be an option
H 314 119
13 Many Swedes use public transport to get to school or work every day Thanks
S 313 118
14 It may seem inconvenient but studies show that over 60 of those who test an electric bike continue to use it
- 308 108
15 The environmental impact per bus passenger is only 65 of the private car user in rural areas and 40 in urban areas
E 304 109
16 Beginning in 2018 you can get 25 of the cost subsidised by the government when purchasing a new electric bicycle
$ 302 128
17 The car used to be a status symbol but today other values are more important such as taking care of oneself and the environment Such values are usually related to cycling or public transport
S 295 118
18 Few things today can be considered more modern and prestigious than commuting by bicycle
S 262 114
19 Swedish Olympic champion Bjoumlrn Ferry has decided to be fossil-free by 2025 If he can do it you can
S 259 118
The level of motivation was measured on a five-point Likert scale from lsquovery unmotivated to decrease my car usersquo to lsquovery motivated to decrease my car usersquo in line with the scale used by Waygood and Avineri (2018) Respondents who already had low or no car use had a slightly adjusted scale lsquovery unmotivated to keep my low level of car usersquo and lsquovery motivated to keep my low level of car usersquo The order of the messages was randomised in the survey to prevent an accumulated message exposure that could affect the relative outcome of the messages
46
One could question whether measuring motivation according to this scale would capture lsquorealrsquo motivation to decrease car use or merely the extent to which respondents liked the messages However marketing research has demonstrated that attitudes toward advertisements influence attitudes toward what is advertised (for a meta-analysis see Brown and Stayman 1992) and some suggest that the liking of an ad may be the best indicator of advertisement effectiveness (Haley and Baldinger 2000) Still it is important to underline that it is the stated motivation to decrease car use as a result of being exposed to the marketing messages that forms the basis for the analyses in Papers III and IV
Sample The survey was distributed in February 2018 and answers were collected from 1500 individuals 1300 of whom stated that they were regularly commuting to school or work Commuting trips were focal because the survey items measuring motivation were contextualised around commuting trips The sample was stratified to match the national conditions regarding gender and age and analytical weights were used to compensate for the overrepresentation of respondents with higher educational attainment (10 difference from the average)
Study area The geographical scope for the survey was limited to seven out of the nine municipality groups in Sweden according to the classification made by the Swedish Association of Local Authorities and Regions (2016) The two excluded municipality groups are classified as rural with a population of fewer than 15000 inhabitants in the largest urban area or with a commuting rate for work outside of the municipality of less than 30 They were excluded since their modal options in general are much more limited than for the rest of the population The included municipality groups include 95 of the Swedish population
434 E-bike trial data
This dataset encompassed three data collection rounds from a randomised controlled e-bike trial conducted in the spring of 2020
Study area The project was a joint venture between the authors of the papers and the mobility management team at the Vaumlstra Goumltaland Region (VGR) VGR is one of Swedenrsquos 21 counties VGR had previously carried out a study of cycling within the county which comprises 49 municipalities Skoumlvde municipality was identified for having particularly low levels of cycling despite decent preconditions Skoumlvde has just over 50000
47
inhabitants and is characterised by large companies within the heavy industry and professional services
VGR established contact with one large employer in Skoumlvde and acquired 50 e-bikes of the lsquopedelecrsquo sort which were lent to participating employees for five weeks
TravelVu logging and surveys The data collection was facilitated through TravelVu a GPS-tracker smartphone application that registers the duration distance route time and travel mode of each trip An advantage of this method is that it provides travel data independent of self-reports from the participant and more details regarding each trip compared to conventional travel surveys The application was also used for distributing the surveys which included questions about age gender education access to travel modes and attitudes towards e-bikes and cycling Since the first data collection period began in March 2020 when the outbreak of COVID-19 occurred additional survey questions were incorporated in the second survey round to capture the effect of the pandemic on the trial
Trial procedure Measurements (travel logging and survey) were conducted for one week at baseline (M1) and four weeks into the trial for both the treatment and control group (M2 and M3) Table 7 provides a timeline for the intervention and the data collection A second e-bike trial period was conducted for the control group only After the first trial was finished the control group got access to the e-bikes and had their trial period The second trial period was conducted to prevent dropouts from the control group by keeping them motivated to participate and to validate the results from the treatment group All participants were informed that they would get access to an e-bike that could be used as much as they liked The VGR team informed the participants about the appropriate use of the TravelVu app and was available for support during the trials
Table 7 Timeline for the e-bike intervention and the data collection Adapted from Soumlderberg fka Andersson et al (2021)
M1 M2 M3 Group Treatment and
control Treatment Treatment and
control Control Control
Activity Baseline measurement and survey
E-bike trial Follow up measurement and survey
E-bike trial Follow up measurement and survey
Date March 9-15 April 2-May 7 April 27-May 3 May 8-June 15
June 1-June 7
Duration 1 week 5 weeks 1 week 5 weeks 1 week
48
Sample Participants who were chosen for taking part in the trials (typical individuals with high car use and a distance of 5-12 km between their home and workplace) were randomly assigned to a treatment or control group
The aim was to recruit 100 participants In total around 3200 employees were contacted 317 of whom stated that they would like to participate At the start of the trials the sample consisted of 98 individuals In the end the analytical sample consisted of 65 participants 40 of whom belonged to the treatment group and 25 to the control group
44 Representativeness of datasets
It is important to emphasise the limits of the datasets in terms of the possibility to generalise the results to other contexts The choice of data to be collected sample size and study design all depend on the purpose of the study
For the literature review in Paper I the search criteria was limited in terms of language (English) and to the fields of energy transportmobility health and fitness and pro-environmentclimate Thus the review is not representative of publications in other languages and cannot generalise beyond these fields However the scope of the study was principally the role of ICT for transport and most studies included in the review were in the transportmobility domain the field in which we were most interested to generalise
The business travel data used in Paper II was collected from participants who were recruited through convenience sampling from the participating organisations a process in which the research team was not part Analysing the travel behaviour of the participants revealed a considerably higher share of public transport for business trips (about 45 of all business trips) than the national average as informed by the national travel survey (10) Further women were overrepresented Consequently the sample is not representative of the general population However the aim was to demonstrate the strengths and weaknesses of the implemented MSA with potential effects on business trips rather than to generalise the effects on travel behaviour to the general population
The national survey data utilised in Papers III and IV were stratified to match the national conditions regarding age and gender The sampling was conducted in seven out of the nine Swedish municipality groups excluding only the most rural parts of the country (inhabited by 5 of the population) As such the sample can be used to get a rough estimation of the national conditions although there is a tendency of online panels to consist of people with higher education than the national average Analytical
49
weights were used to compensate for the overrepresentation of respondents with higher education (the sample had 10 more highly educated participants than the Swedish average) and the underrepresentation of older respondents However differences in attitudes between panellists and non-panellists cannot be controlled and it is wise to interpret the results and generalise in light of these limitations
The target group in the e-bike sample used for Paper V was deliberately chosen due to its high car use which was believed to offer the highest potential for substitution and reduction of car use In the case of external validity it limits the degree of substitution that can be expected to occur for the average individual because the general amount of driving is considerably lower However soft measures are often targeted to this kind of groups that is segments with high car use who are willing to try a new mode of transport This is the primary group to which the e-bike data can be generalised
45 Analyses
This section gives an overview of the analyses that have been employed to evaluate the datasets in relation to the research questions The research questions for each paper are presented in Table 8 It does not cover the work conducted for preparing the data for the analyses Such initial data processing has included (but is not limited to) data screening descriptive analyses the transformation of (and creation of new) variables and reliability analyses for constructing composite variables IBM SPSS statistics 25 was the software used for most processing and analyses of the data
Table 8 Research questions of each paper
Paper Research questions I How can smartphone applications be used to promote pro-environmental travel behaviours
What are the key aspects to consider in developing a behaviour change support system for ICT II How does a mobility service application (MSA) affect travel behaviour and perceptions towards using
public transport for business trips What factors enable an MSA to facilitate more sustainable business trips
III How do marketing messages influence different segmentrsquos motivation to reduce car use What underlying dimensions affect the interpretation of such messages
IV What influence do attitudes accessibility to travel modes travel time and usual commute mode have on the motivation to reduce car use How does the motivation to reduce car use differ between the segments
V To what extent do e-bikes increase cycling for frequent drivers and what modes if any are substituted and to what degree How does an e-bike trial affect perceptions towards e-bikes
Note The research questions have been adapted from the aims as expressed in each paper
The relationship between the papers the datasets the approach the method of analysis and the analysis types are presented in Table 9
50
Table 9 The relationship between the papers datasets method approach and analysis type
451 Analytical samples and dependent variables
For each study an analytical sample was defined to ensure that all analyses were based on the same individuals The size of these samples gender distribution mean age and share of trips undertaken by car pre-intervention is presented in Table 10
In the cases where a certain type of trip has been examined these have been either business trips or commuting trips Commuting trips to work and school combined with business trips constitute about half of all trips in Sweden (Transport Analysis 2020) and are important to study as they are fixed in time and place for most people thereby contributing disproportionally to traffic congestion and environmental pollution (Heinen et al 2010)
Table 10 Analytical samples used in the analyses for each paper
Paper Analytical sample Share of women Mean age Share of car trips I 32 articles - - - II 77 participants 65 46 22 (business trips) III 994 respondents 48 45 46 (commuting trips) IV 850 respondents 49 42 51 (commuting trips) V 65 participants 12 48 90 (commuting trips)
In Paper I the focal interest was key aspects for promoting behaviour change through ICT which was examined through a narrative synthesis of previous research Since no statistical analyses were conducted no dependent variable (DV) was specified
Dependent variables in Paper II In Paper II the DVs were related to reported travel behaviour on the one hand and perceptions about the MSA as a tool for increasing public transport trips on the other
Paper Dataset Approach Method of analysis
Analysis type
I Literature-based data
Inductive Review Content analysis and inductive category development
II Business travel data
Inductive and deductive
Mixed Independentpaired samples t-tests and content analysis
III National survey data
Inductive Quantitative Exploratory factor analysis analysis of variance (ANOVA) and paired samples t-test
IV National survey data
Inductive Quantitative Multiple regression modelling and analysis of variance (ANOVA)
V E-bike data Deductive Quantitative Paired-samples t-tests and content analysis
51
The travel behaviour DVs were based on survey answers about the number of business trips undertaken by car public transport bicycle foot and aeroplane before and after the use of the MSA
Three pairs of DVs (before and after the use of the MSA) were constructed to assess the effect on perceptions towards public transport These determinants were performance expectancy effort expectancy and social influence which are parts of the UTAUT theory The first question was stated as lsquoHow possible is it for you to travel by bustrain for business tripsrsquo (performance expectancy) The second was a statement saying lsquoYou think that using the bustrain is difficultrsquo (effort expectancy) The third question was lsquoYour closest colleagues who also make business trips how often do you think they travel by bustrainrsquo (social influence) Each question was asked once for bus trips and once for train trips and the scale was from 1 to 7 where 1 was impossibletotally agreevery seldom and 7 was very possibletotally disagreevery often The mean score was then computed from the bustrain questions to get an average public transport score for each determinant
Dependent variables in Paper III In Paper III the DVs consisted of the factors identified from the exploratory factor analysis which was based on the stated motivation to decrease private car use from the 19 marketing messages
The first factor (and subsequent DV) consisted of the mean value from 11 messages while the second factor (DV) consisted of the mean value from eight messages A third DV consisted of the mean response from all the messages as a representation of the general motivation to reduce private car use The scale of the three DVs was 1 to 5 (lsquovery unmotivated to decrease my car usersquo to lsquovery motivated to decrease my car usersquo)
Dependent variables in Paper IV In Paper IV the marketing messages were used as the DV in the regression modelling to represent motivation to decrease private car use However since it was believed that the five messages related to status were of lower validity due to stronger reactance towards these kinds of messages they were omitted from the DV The aggregated values from the remaining 14 marketing messages were used to compute a continuous variable that formed the DV The scale of this variable was 14-70 Using the responses to the marketing messages as a proxy for general motivation to decrease car use was chosen because the responses were strongly associated with the behaviours and attitudes of the segments that were investigated in Paper III
A second DV was computed from the significant predictors in the regression to form a lsquoprecondition indexrsquo This was used to explore the trends in how the preconditions for motivation to reduce private car use are distributed demographically and in the
52
behaviour change stages of the TTM The following procedure was undertaken to compute the index
First a new variable was created for each of the significant predictors and each significant category was loaded with the estimated coefficients retrieved from the regression The non-significant categories (and reference categories) were given the value zero Second all the new variables were summed into a continuous variable in which each respondent had a value positioned on the index scale Different methods are available for aggregating indicators to form a composite index and the most common are the lsquoadditive methods that range from summing up unit ranking in each indicator to aggregating weighted transformations of the original indicatorsrsquo (Matteo Mazziotta 2013) The latter method was used to compute the precondition index the significant predictor coefficients were used as weights and aggregated to form an index Third the variable was transformed into a categorical variable for further analyses The range produced by the respondents was equally divided into four categories with the lower range indicating unfavourable preconditions the higher range indicating favourable preconditions and zero representing neither favourable nor unfavourable preconditions
Dependent variables in Paper V The majority of DVs were constructed from travel behaviour data retrieved from the participantsrsquo smartphones Several DVs were created based on the week of measurement mode of travel and treatmentcontrol group for the number of trips distance and modal share
A set of DVs was also constructed of perceived obstacles preventing participants to commute by bike to work comparing between a conventional bicycle and an e-bike The obstacles that constituted a DV were practical (pick-updrop-off transporting goods) time-consuming physically demanding too much of a distance bad cycling infrastructure traffic safety incentives for car commuting lack of secure parking
452 Type of analyses
Content analysis Content analysis was employed to a varying degree for extracting key findings from previous literature (Paper I) interviews (Paper II) and qualitative survey answers (Paper V) There are three approaches to content analysis conventional directed and summative (Hsieh and Shannon 2005) The differences between these approaches have to do with how content is categorised where the conventional content analysis derive categories directly from the text data the directional approach begins with a theory or a priori understanding that guides the development of categories and the summative approach involves counting and comparisons of content followed by
53
interpreting the underlying context Papers I and II used both the conventional and directive approaches because the coding of the literature and the interviews were derived inductively from the data (conventional approach) but interpreted in light of existing theories (directed approach) In Paper V a summative content analysis of the free-text answers was conducted in which the occurrence of stated advantages and disadvantages were counted and ranked for comparison
t-test In experimental work the t-test can be used to establish whether two means differ significantly at a predetermined probability level
Several of the papers set out to examine the difference between means representing either different treatments (for example different marketing messages and their influence on motivation to decrease car use) or different points in time (such as distance cycled before and after the e-bike intervention) Both of these examples drawn from Papers III and V assessed the potential difference between two means that came from the same sample also referred to as repeated measures design As such the paired samples t-test was used for making these comparisons because it assumes that the means come from the same entities
In contrast independent samples t-test assumes that two means are drawn from different samples a test that was used in Paper II to compare means for different characteristics between the treatment and the control group However assessing the effect of the MSA was a repeated measures design conducted within the treatment and the control group respectively and consequently the paired samples t-test was used for this analysis
Analysis of variance (ANOVA) In Papers III and IV there were more than two means from independent samples to be compared Therefore the one-way analysis of variance (ANOVA) was used for investigating whether motivation differed between eight segments (Paper III) and whether preconditions for motivation differed between the five stages of change in the TTM model (Paper IV) The ANOVA test cannot reveal which specific group means are significantly different from each other it only demonstrates if at least two groups are different To determine the relationships between all combinations of group means a post-hoc test needed to be conducted for each ANOVA analysis Different post-hoc tests exist depending on the assumptions that apply to the sample particularly if equal variance of the populations can be assumed For Paper III this assumption was violated and therefore a stricter post-hoc test was applied (Tamhanersquos T2) In Paper IV equal variances were met and so the Tukey post-hoc test was used instead which gives better power to the test than its stricter colleagues (Field 2018)
54
Exploratory factor analysis (EFA) In Paper III a relatively large set of marketing messages (19 to be precise) were shown to the respondents who were asked to state the level of motivation they felt to decrease their personal car use when exposed to each argument Every message had been predeterminably framed around typical themes (economy environment health status) However there was an interest in understanding what if any underlying dimensions unite the messages and if so what do these stand for Factor analysis attempts to achieve parsimony by explaining the maximum amount of common variance in a correlation matrix using the smallest number of explanatory constructs (Field 2018) These lsquolatent variablesrsquo represent several variables in this case marketing messages that correlate highly with each other As such EFA is useful for reducing large sets of information into fewer manageable factors
Two tests are indicative of the suitability for factor analysis The Kaiser-Meyer-Olkin Measure of Sampling Adequacy (KMO) is a statistic that suggests the share of variance in the variables that could be caused by underlying factors High values close to 10 indicate that EFA may be useful for the data Values less than 050 suggest that EFA would not be very useful The other test Bartletts test of sphericity tests the hypothesis that the correlation matrix is an identity matrix which would indicate that the variables are unrelated and therefore unsuitable for structure detection A significance level of p lt 005 indicate that factor analysis may be useful Both these tests indicated that factor analysis would be suitable for the data (KMO = 095 Bartletts test of sphericity (p lt 0001)
Principal axis factoring was chosen for extraction with oblique rotation (Promax) because this carries the assumption that the factors are correlated which is not accounted for in the commonly used orthogonal rotation which assumes factors to be independent (Pituch and Stevens 2016) Deciding on the number of factors to retrieve from the factor solution is often done iteratively and in the next stage interpreting the meaning of the factors is a subjective task However there are a few common thresholds that can guide the factor extraction process In the case of Paper III factors with eigenvalues larger than one in combination with a visual inspection of the scree plot served as guidance for the extraction procedure which resulted in a two-factor solution Messages clustering to the factors were considered meaningful if their loadings were above 035 (Jung and Lee 2011)
Multiple linear regression In Paper IV linear regression models were estimated to establish the feasibility of variables related to attitudes usual mode choice for commuting commuting time accessibility to travel modes and driving license in predicting motivation to decrease car use The rationale for estimating the linear models were threefold (1) to assess the correlational strength between each predictor and the dependent variable (motivation
55
to decrease private car use) (2) to establish the predictive power of the models (by inspection of explained variance via the adjusted R2 value) and (3) to create an index of significant predictor coefficients to be used for exploring how preconditions for motivation to reduce car use are distributed demographically and in the TTM stages
Preliminary analyses were conducted to ensure the non-violation of the assumptions of normality linearity and homoscedasticity by visualising the data in histograms scatterplots and normal P-P plots of standardised residuals Two outliers were excluded based on standardised scores (gt 3) and casewise diagnostics Cookrsquos distances were checked for influential cases and variance inflation factor values (VIF) were inspected for assessing the level of multicollinearity between predictor variables Combined these tests suggested that the variables were suitable for being included in the regression
The attitudinal survey questions were measured on a five-point Likert scale (strongly disagree disagree neithernor agree and strongly agree) Some of these variables were non-linear Therefore dummy variables were created for each category within each attitudinal predictor and neithernor served as the reference category This enabled to account for potential thresholds in the data and presenting a nuanced picture of how the predictors influence the dependent variable (see Paacuteez and Whalen (2010) for a similar approach)
56
57
5 Results
This chapter presents a summary of the aims and results from each paper (for a more detailed account of these see the respective papers in the appendix) The analyses and tools used are presented in the tables along with key findings and model summary when applicable
51 Paper I
The purpose of this study was to investigate how behavioural change techniques can be implemented in smartphone applications to encourage sustainable travel behaviours This was investigated by conducting a literature review from which key aspects of combining behaviour change techniques with ICTsmartphones were compiled Such systems are referred to as behaviour change support systems (BCSS) (Oinas-kukkonen 2010) The empirical findings were evaluated against a theoretical framework consisting of the TPB the TTM diffusion of innovations and gamification
An initial observation from the review was that many empirical studies (about half of the studies included in the review) lack theoretical grounding which suggests that there is a need for more research on this topic that embeds empirical findings in theory Further in the literature review 26 findings were identified which concern different aspects of BCSSs Through an inductive category development four distinctive categories were defined namely (1) customisation to the user (2) information and feedback (3) commitment and (4) appealing design
Based on the empirical findings and in light of the theoretical framework a conceptual model was developed that highlighted these aspects for creating a BCSS (see Figure 4) First of all customisation to the user appeared to be crucial to contextualise information feedback goal setting stimuli motivational mechanisms and other content within the BCSS Segmentation and targeting were identified as enablers for better customisation Due to its importance customisation to the user is the starting point in the model which influences information and feedback and commitment since both of these parts should be grounded in the userrsquos needs as well The rationale is that these three parts in combination will contribute to an appealing design which in itself also needs to be simple and user friendly The arrow design is a reminder that the
58
development of a BCSS is a process that benefits from continuous evaluation and improvement preferably with input from the users themselves
Figure 4 A conceptual model for combining behavioural change techniques with ICT to create a behaviour change support system (BCSS) Source Andersson et al (2018)
A suggestion for further research was to evaluate the effect of BCSSs to change behaviours preferably with larger datasets to allow generalisations and with support in theory Further a potential research strand identified was more studies that explore transport-related segmentation and that evaluate the effect of tailored messages for changing travel behaviour Finally future research was recommended to continue exploring the possibility of measuring actual travel behaviour change with the use of smartphone technology
Table 11 Summary of results from Paper I
Analysis Tool Key findings General observations regarding previous research on ICT and behaviour change support systems
Qualitative content analysis
Lack of studies grounding behaviour change techniques in behaviour theory Segmentation would allow better customisation to the user
Key aspects for influencing behaviour through ICT in the fields of energy health and fitness climate and environment transport and mobility
Inductive category development
26 findings sorted into four categories customisation to the user information and feedback commitment appealing design
59
52 Paper II
The aim was to evaluate the implementation of a new smartphone application developed by Samtrafiken to facilitate more business trips to be carried out by public transport The application was referred to in the study as a mobility service application (MSA) Both surveys and interviews were conducted to evaluate the MSA The quantitative part focused on analysing changes in travel behaviour and changes in determinants based on UTAUT regarding perceptions of public transport The qualitative interviews focused on how the participants believe that their organisations manage business trips and their view of the MSA as a support to facilitate more sustainable business trips
Of the three UTAUT determinants (performance expectancy effort expectancy and social influence) only effort expectancy was significantly different comparing between before and after the implementation of the MSA This indicates that the treatment group (MSA users) thought it was easier to use public transport after they had experienced the application No difference was found for the control group
In Paper II the performance expectancy variable was omitted from the analysis due to violation of normality (although several attempts to overcome this were made by transforming the variable) In retrospect performing the analysis with bootstrapping would have solved the issue because it does not assume normality (Field 2018) Since the sample size was small (n = 77) this would also have added rigour to the analysis by estimating more robust confidence intervals Therefore post-publication the paired samples t-tests were re-estimated for all three determinants for both the treatment and the control group3 Based on 2000 random resamples and 95 confidence intervals it was found that performance expectancy (the skewed variable) and social influence were not statistically different (p = 0597 and 0119 respectively) while effort expectancy was (p = 0026) Thus the conclusions made in Paper II are valid even with robust estimations with the additional result that the perceived possibility to travel by public transport (performance expectancy) did not change as a result of using the MSA
Due to a high dropout rate missing data from the sample and low use of the MSA it was not possible to assess potential differences in travel behaviour as a result of using the application The trips made using the MSA consisted mainly of regional trips by train and bus Only 35 out of 193 individuals used the MSA for the full period and this group already travelled more by public transport than the rest of the sample This is an example of the importance of collecting data from larger samples especially when the intervention is expected to yield a small effect Since the research team was not participating in the recruitment procedure it was difficult to limit attrition and self-
3 Not part of Paper II
60
selection bias which is a general problem in studies attempting to evaluate these kinds of interventions in field experiments (Cellina et al 2019)
From the interviews three factors were identified that could affect the success of a new MSA as a means of increasing sustainable business trips management control and proactiveness perceived improvement due to the intervention and functions and technical sufficiency of the MSA tool
The importance of facilitating organisational conditions that favour sustainable business travel was highlighted expressed as the factor management control and proactiveness For this to happen the interviewees expressed that management needs to take responsibility for implementing and promoting a travel policy making sustainable transport more accessible for employees and creating an organisational culture that encourages pro-environmental behaviour The management also need to lead by example Regarding the perceived improvement due to the intervention the respondents who used the MSA were generally positive about it as a means of managing business travel and many emphasised that the MSA had the potential to make a significant contribution although not in its current form The fact that the MSA automatically handled travel expenses was especially appreciated but there were also shortcomings (technical and functional) that prevented participants from using the MSA Much criticism was related to functions and technical sufficiency The participants wanted a greater range of transport services to be included in the MSA In addition to the purely technical aspects the MSA was expected to offer more ticket options and be easier to use An important reason for not using the MSA was that existing business travel booking systems were either procured and thus employees had to use that service or that existing booking systems were more flexible and offered more personalised service The results also show that the MSA would need to be integrated with existing systems and guidelines to avoid conflicts that might otherwise occur to the user
A methodological lesson from this study was the need to carefully design intervention studies to avoid significant differences in representativeness between the treatment and the control groups as well as consider what type of information and incentives could increase participation in field experiments
Table 12 Summary of results from Paper II
Analysis Tool Key findings The difference in attitudes before and after the MSA trial comparing test- and control group
Paired samples t-test Increase in effort expectancy (easier to use PT) for the test group (p lt 005) while no change was observed for the control group
Aspects that affect the success of a new MSA as a means of increasing sustainable business trips in organisations
Qualitative content analysis
Management control and proactiveness perceived improvement due to intervention functions and technical sufficiency Establishing an organisational culture that favours sustainable business trips
61
Methodological weaknesses Reflections on the method
Challenging to retain interest from participants over time in app-based interventions Future studies should carefully consider what type of information and incentives could increase participation
53 Paper III
The aim was to evaluate how common marketing messages to promote sustainable transport influence different segmentsrsquo motivation to reduce car use and to identify underlying meanings that affect the interpretation of such messages to understand how sustainable transport can be promoted more effectively
The respondents (n = 1300) were asked to assess their level of motivation to decrease their private car use when exposed to each of the 19 marketing messages Information about mode choice for commuting as well as attitudes were used for segmentation according to SEGMENT (for details about the items see appendix)
Descriptive statistics showed that divided into the predetermined frames (environment health economy status) messages induced more motivation if related to environmental or health issues which had mean values of 351 and 344 respectively compared to economic (327) and status (276) messages
Running the messages within a factor analysis suggested a two-factor solution based on eigenvalues over Kaiserrsquos criterion of 1 which explained 50 of the variance in combination The messages clustering to the first factor seemed to represent personal health financial benefits convenience and status Overall these items point toward the individual gaining utility from using sustainable transportation and that one should act pro-environmentally due to self-interest On the contrary the messages related to the second factor seemed to be related to concerns of the environment health (both personal and societal) collective responsibility and morality This suggested that a more altruistic dimension was uniting the messages in the second factor Based on this line of reasoning one could argue that the factors represent egoism on the one hand (first factor) and altruism on the other (second factor) This labelling was used in the first drafts of Paper III
Another interpretation could be to judge the messages within the factors according to whether they communicate individual or collective efficacy since the first factor included more individualistic messages and the second more collective messages4 In the end the choice was made to label the factors accordingly that is the first factor was to represent self-efficacy and the second collective efficacy Self-efficacy focuses explicitly
4 A suggestion put forward by one of the anonymous reviewers
62
on the efficacy expressed by an individual and is defined as lsquothe belief in onersquos capabilities to organise and execute the courses of action required to manage prospective situationsrsquo (Bandura 1995 p 2) while the definition of collective efficacy is lsquoa grouprsquos shared belief in its conjoint capabilities to organise and execute the courses of action required to produce given levels of attainmentsrsquo (Bandura 1997 p 477)
However it is important to emphasise that self-efficacy and collective efficacy are not interchangeable with egoism and altruism Self-efficacy has been demonstrated to be important for individuals in performing all kinds of behaviours including pro-environmental behaviours (Kloumlckner 2013 Skarin et al 2019) In general individuals are more inclined to perform behaviours they believe to be achievable and people with high self-efficacy set higher goals for themselves put more effort into changing behaviour and persevere when facing obstacles (Bandura 1997) Collective efficacy has on the other hand been increasingly associated with pro-environmental behaviours (Barth et al 2016 Doran et al 2015 Reese and Junge 2017) and it seems reasonable to assume that motivation to act in response to collective problems requires a sense of collective efficacy This could for instance turn perceived individual powerlessness in the face of climate change into personal action since a strong sense of collective efficacy has been shown to increase perceived self-efficacy (Jugert et al 2016)
Still it is important to stress that labelling the factors is a subjective task and other labels might be more suitable for capturing their essence that the first factor relates to personal health financial benefits convenience and status while the second factor relates to concerns of the environment personal and societal health collective responsibility and morality
The analysis of the difference in reported motivation for the two factors showed that the second factor was significantly more motivating for all segments although there were also significant differences between the segmentsrsquo general level of motivation The results indicated that the segments were more motivated by messages that confirmed their current attitudes and travel behaviour For instance cycling messages appealed more to regular cyclists However this expectation that attitude-based segments would differ significantly in motivation depending on the kinds of messages was not so clear Rather the difference between segments was expressed in the general motivation to decrease car use based on existing preconditions The difference in general motivation seemed to depend on prevailing attitudes and behaviours demonstrating the effect of assimilation bias which occurs when perceptions of new evidence are interpreted in such a way as to be assimilated into prevailing beliefs (Lord et al 1979) Consequently the way to influence preconditions for motivation to decrease private car use was the subject under study in Paper IV
63
Table 13 Summary of results from Paper III
Analysis Tool Key findings Model summary Mean values for pre-defined message themes
Descriptive analysis
Environmental (351) health (344) economic (327) status (276) Scale 1-5 (very unmotivated to very motivated)
-
Latent dimensions in 19 marketing messages
Exploratory factor analysis
Two-factor solution interpreted as lsquoself-efficacyrsquo (11 items =87) and lsquocollective efficacyrsquo (8 items
=88)
KMO = 095 Bartletts test of sphericity Approx Chi-square = 859068 df = 171 (p lt 0001) of variance = 5049
Difference between latent variables for each segment
Paired samples t-test
Devoted Drivers (p lt 0001) Image Improvers (p lt 0001) Malcontent Motorists (p lt 0001) Active Aspirers (p lt 0001) Practical Travellers (p lt 0001) Car Contemplators (p lt 001) PT Dependents (p lt 0001) Car-free Choosers (p lt 0001)
-
Analysis of variance between segments
One-way between-subjects ANOVA Post Hoc analysis (Tamhanersquos T2)
Segments differed in motivation Segments motivation to reduce car use based on the marketing messages seemed to be influenced by assimilation bias
All messages F(7) = 40027 p lt 0001 Self-efficacy messages F(7) = 33504 p lt 0001 Collective efficacy messages F(7) = 36514 p lt 0001
54 Paper IV
The aim was to explore what motivates people to reduce their car use and how such preconditions for motivation are distributed in the population demographically and the behaviour change stages of the TTM Further the study attempted to analyse motivational preconditions for persistent drivers in isolation
A multiple linear regression model was estimated to understand which variables correlate with the motivation to decrease private car use Driving license accessibility (to a car public transport andor bicycle) the usual modal choice for commuting and commuting time were used to predict motivation to decrease private car use together with attitudinal variables towards the climate car use cycling and public transport The model explained about half of the variance in motivation
It was found that climate morality was the most critical factor associated with motivation to decrease private car use Those strongly disagreeing with feeling a moral obligation to reduce onersquos carbon emissions were significantly less motivated to decrease their car use On the contrary agreeing with this statement was associated with higher motivation compared to being indifferent (neithernor)
Other influential factors were the usual commute mode where those usually travelling with public transport walking or cycling were more motivated to decrease car use
64
than those commuting by car For car advocacy that is the level of lsquoattachmentrsquo one feels towards the car less attachment was associated with higher motivation Health concern that is being less aware of the positive health gains associated with cycling was correlated with a lower level of motivation Having a positive attitude towards cycling increased motivation compared to those being indifferent to cycling Further having a weak car identity (disagreeing with identifying oneself as a car user) had a positive association with motivation Travel time for commuting was not a significant factor on motivation to decrease car use until it reached long commuting times of more than 60 minutes which significantly dampened the motivation compared to those with travel times of 10 minutes or less
In the next analysis the precondition index (constituting the significant predictors from the regression) was cross-tabulated with demographic variables to see how motivational preconditions differ between groups Significant differences were found for gender age educational attainment and residence while relationship status and whether one has children living at home were non-significant Males the middle-aged people with low educational attainment and rural residents had the least favourable preconditions concerning motivation to reduce car use
Figure 5 Cross-tabulation between the precondition index and the TTM stages Source Andersson (2020)
An additional cross-tabulation was made between the precondition index and the TTM stages (see Figure 5) which revealed that preconditions are increasingly more favourable
65
moving from pre-contemplation (the first step in the TTM) to maintenance (last step) A separate correlation analysis5 (Pearsonrsquos r) revealed a moderate but significant correlation of 046 (p lt 001) This means that behaviour change stages could be a useful tool for determining suitable segments to target within an intervention since preconditions for motivation do correlate with the TTM stages Further it was observed that the highest precondition threshold between stages was between pre-contemplation and contemplation suggesting that the transition from pre-contemplation is the hardest step The strategy of targeting the lsquoambivalentrsquo segments for instance the contemplation and preparation stages (Forward 2014) could therefore be much more fruitful than trying to convince pre-contemplators to shift behaviour
As can be seen in Figure 5 pre-contemplators had less favourable preconditions than the other segments (pre-contemplators differed significantly from all the other stages) A separate regression analysis was therefore conducted to see if the associations with motivation differed for this segment The same variables were used as in the first model but this time only the pre-contemplation segment was included
The results were similar to the first regression model with a few exceptions Climate morality was even more influential for pre-contemplators Strongly disagreeing was associated with a near ten-fold lower motivation to decrease car use compared to neithernor while strongly agreeing increased motivation five-fold Being a car advocate and neglecting the positive effects of cycling correlated with motivation negatively while enjoying cycling and disagreeing to identify as a car user had a positive association Unlike the first model usual commute mode and travel time were not significant which may be due to the overall higher commute by car habit in the pre-contemplation segment and the smaller sample size (n = 299)
Table 14 Summary of results from Paper IV
Analysis Tool Key findings Model summary
Motivational associations
Multiple regression DV motivation to reduce private car use
Usual commute mode (ref car) (B 325 CI 181-468 p lt 0001) Travel time gt 60 min (ref 10 min) (B -331 CI -573--89 p lt 001) Attitudes (ref neithernor) Climate morality strongly (st) disagree (B -721 CI -928--514 p lt 0001) Climate morality agree (B 218 CI 065-371 p lt 001) Climate morality st agree (B 469 CI 310-627 p lt 0001) Advocate private car use st disagree (B 224 CI 42-406 p lt 005) Advocate private car use disagree (B 241 CI 80-402 p lt 001)
Adjusted R-square 047
5 Not part of Paper IV
66
Advocate private car use agree (B -281 CI -451--106 p lt 001) Advocate private car use st agree (B -389 CI -557--220 p lt 0001) Like cycling agree (B 337 CI 175-498 p lt 0001) Like cycling st agree (B 369 CI 195-543 p lt 0001) Concerned about health st disagree (B -223 CI -398--47 p lt 005) Perceive cycling as fast st disagree (B -266 CI -449--82 p lt 001) Perceive cycling as fast disagree (B -197 CI -392--002 p lt 005) Identify as a driver st disagree (B 179 CI 07-350 p lt 005)
Pre-conditions for motivation in the sample
Analysis of frequencies
Four categories of pre-conditions ranging from unfavourable to favourable 1st category (6) 2nd category (22) 3rd category (40) 4th category (32)
-
Pre-conditions within demo-graphic factors
Cross-tabulation analysis
Significant differences (more favourable) gender (women) age (younger cohorts) education (higher) occupation (students) residence (urban) No differences relationship status children living at home
-
Distribution of sample based on TTM-stages
Analysis of frequencies
Pre-contemplation (36) contemplation (10) preparation (4) action (31) maintenance (19)
-
Pre-conditions within TTM-stages
Cross-tabulation analysis and one-way between-subjects ANOVA (post hoc test Tukeyrsquos HSD)
Preconditions in category 1 2 3 and 4 for each TTM-stage Items in superscript indicate significant differences a Pre-contemplationb c d f (9 37 45 8) b Contemplationa d e (7 21 45 27) c Preparationa e (6 12 50 31) d Actiona b e (3 14 39 43) e Maintenancea b c d (2 7 28 62)
F(4) = 53211 p lt 0001
Motivational associations in the pre-contemplat-ion segment
Multiple linear regression
Attitudes (ref neithernor) Climate morality st disagree (B -995 CI -1357--632 p lt 0001) Climate morality st agree (B 497 CI 177-817 p lt 001) Advocate private car use agree (B -455 CI -737--173 p lt 001) Advocate private car use st agree (B -574 CI -851--297 p lt 0001) Like cycling agree (B 479 CI 195-764 p lt 001) Like cycling st agree (B 488 CI 168-808 p lt 001) Concerned about health st disagree (B -469 CI -821--116 p lt 001) Perceive cycling as fast disagree (B -342 CI -655--29 p lt 005) Identify as a driver st disagree (B 335 CI 53-617 p lt 005)
Adjusted R-square 051
67
55 Paper V
This paper aimed to assess the substitution effect of e-bikes in a randomised controlled e-bike trial and the influence of the trial on the participantsrsquo perceptions towards e-bike use
Earlier research in this field has employed either a cross-sectional or quasi-experimental study design that suffers potential bias from confounding factors or a lack of internal validity Further most studies rely on self-reported survey answers which could result in over or underestimation of effects due to memory biases and social desirability bias To the best of the knowledge of the author this was the first study to assess the substitution effect of e-bikes using an RCT design with objective travel behaviour data from smartphones
About 100 participants were targeted for the trial Car use in the sample was extremely high nearly all participants usually drove to work and around 70 had two or more cars within the household
Three measurements were undertaken during spring 2020 Due to the COVID-19 outbreak it was fortunate that we included a control group that could help isolate the effect of the trial despite the circumstances
The e-bike use increased by an average of one trip and 65 km per person per day which led to a 25 increase in total cycling The whole increase was at the expense of car use which on average decreased by one trip and 14 km per person per day a decrease in car mileage of 37 The modal share of the car decreased by 21 expressed both as the number of trips and distance The effect size was medium for the decrease in car trips and distance (d = 04-06) and large for the increase in cycling (d = 088-631)
An unexpected effect was that the total distance travelled decreased by approximately 20 during the trial which contributed to half the reduction in car mileage with the increase in cycling accounting for the other half The travel behaviours in the control group remained unchanged during the treatment grouprsquos trial period but the same pattern was observed when the control group had their trial period This could be due to changes in travel patterns resulting from choosing more proximal destinations when having access to the e-bike However the cause remains to be further investigated
Most participants considered work and other single purpose trips to be the errands best suited for e-cycling E-cycling was perceived as less time-consuming and physically demanding compared to conventional cycling and long distances were perceived to be lsquoshorterrsquo due to the ease of use associated with e-cycling On the other hand lacking a secure parking spot was a significantly larger issue when using the e-bike because of the increased risk of theft
68
In the qualitative assessment of the e-bike stated advantages outweighed stated disadvantages Bad weather was the largest disadvantage of e-cycling according to the participants The other disadvantages were practical issues like performing errands that included transporting goods or passengers the heavy battery and the risk of theft Some reported that it was time-consuming to e-cycle compared to driving that it had technical weaknesses such as low speed and bad geometry and that it was heavy and too expensive to purchase
The most positive aspect of the e-bike according to participants was the ease and convenience of use Some of the other benefits were related to altruistic and hedonic aspects e-biking was considered good for the environment and positive in the sense that it made one more alert and provided more opportunities for exercise The participants also appreciated getting fresh air during their morning commute and some wrote that it was fun to use and contributed to increased wellbeing About one in five participants stated that the benefits of the e-bike were also related to time savings avoidance of congestion not having to find a parking space and cost savings
Table 15 Summary of results from Paper V
Analysis Tool Key findings Model summary Effect of the e-bike trial on the number of trips by mode of transport per person per day (modal share in paratheses)
Paired samples t-test with 2000 bootstrap samples
Test group Car -1 (-21) (p lt 005) e-bike +06 (+17) (p lt 001) total bike +09 (+25) (p lt 001) Control group No differences Control group with an e-bike Car -11 (-31) (p lt 005) e-bike +1 (+19) (p lt 005) bike +05 (10) (p lt 005) total bike +15 (+29) (p lt 001)
Cohenrsquos d Car 050-058 E-bike 525 Bike 196 Total bike 192-552
Effect of the e-bike trial on distance travelled by mode of transport per person per day (modal share in paratheses)
Paired samples t-test with 2000 bootstrap samples
Test group Car -137 km (-21) (p lt 005) e-bike +51 km (+16) (p lt 005) total bike +65 km (+21) (p lt 001) Control group No differences Control group with an e-bike Car -125 km (26) (ns) e-bike +71 (+22) (p lt 001) total bike +82 (+23) (p lt 001)
Cohenrsquos d Car 060
E-bike 196 Total bike 196-631
Comparing obstacles for cycling with bicycle and e-bike
Paired samples t-test
Less time-consuming and physically demanding to e-cycle and long distances are a smaller issue (p lt 0001) Lack of secure parking a larger issue for e-bikes (p lt 001)
-
Advantages and disadvantages of the e-bike ( of respondents mentioning the issue in question)
Qualitative content analysis inductive category development and analysis of frequencies
Positive Easy convenient (41-60) exercisehealth environmentally friendly fresh air pleasantfun fastsave time (21-40) no congestion increased wellbeing save money (1-20) Negative Bad weather errands with goods heavy battery (21-40) risk of theft time-
-
69
consuming comp to a car technical issues with e-bike heavy bike expensive to buy (1-20)
70
71
6 Discussion
As laid out in the introduction of this thesis the purpose of this research is to contribute with knowledge on how to reduce the demand for car use by encouraging a modal shift towards walking cycling and public transport Soft measures have been in focus to achieve this It is now time to put the results from this work into context and discuss them in relation to the research aims
61 Recapitulation of aims
The first aim was to explore two transport innovations smartphone applications and e-bikes in terms of their potential to improve evaluations of soft transport measures and influence travel behaviour
The second aim was to investigate what influences motivation to decrease private car use for different segments and how this can be used to improve soft transport measures
62 First aim Potential of innovations for soft transport measures
Soft transport policy is perhaps not the field most commonly related to lsquoinnovationrsquo in the sense that new technological solutions appear that significantly change the preconditions for what can be achieved However one could argue that the emergence of (at least) two innovations within the last decade have done precisely that and could potentially contribute to enhance the conduct of soft measures in two important ways Firstly through the e-bike as a new competitive alternative to the car Secondly by the utilisation of the GPS-tracker smartphone application as a data collection tool for evaluating soft measures
72
A new star in the soft measurersquos toolbox As found in Paper V a large substitution effect was realised from car to e-bike in the e-bike trial Cycling increased and car use decreased significantly (both in terms of the number of trips and distance travelled) The effect sizes for the decrease in car use were medium at Cohenrsquos d 044-060 which is substantially more than the average range of soft measures (011-017) as reported by previous meta-analyses (Bamberg and Rees 2017 Fujii et al 2009 Semenescu et al 2020) Indeed the decrease was so large that the participantsrsquo average car use at the end of the trial expressed as daily kilometres driven was in the range of what has been estimated to be at the sustainable level per capita (218 km) for reaching the climate goals for the Swedish transport sector (Winslott Hiselius and Smidfelt Rosqvist 2018) Thus the potential for e-bikes to contribute to a more sustainable transport system is large
However only about half the decrease in car kilometres could be explained by the e-bike substitution raising the question of what could be causing the rest of the decrease Moreover would the effect hold over time say a year after the intervention Although a follow-up survey was conducted four to five months after the intervention by the partner organisation VGR (Vaumlstra Goumltalandsregionen) in which 44 of participants stated that they cycled more to everyday activities than before the e-bike trial and 16-26 that they bought an e-bike more robust and longitudinal evaluations are needed Results from earlier research are promising participants have been found to have weaker car habits a year after trialling an e-bike (Moser et al 2018) and the substitution effect for consumers of e-bikes are similar to the effects found in trial settings (Fyhri and Sundfoslashr 2020) From the perspective of implementing soft measures e-bike trials seem promising as well Since we carried out the campaign in Skoumlvde the same arrangement has been implemented in another six municipalities with a total of over 200 participants It is now a continuous measure used by the mobility management team in VGR to encourage more sustainable travel behaviours (Ryberg 2021)
The potential with e-bikes has been recognised in the UK as well Philips et al (2020) found that e-bikes if used to replace car travel can cut car carbon dioxide emissions in England by up to 50 The authors emphasise that the greatest potential lies in the rural and sub-urban settings and advocate the implementation of a strategic national cycle network linking villages to towns and towns to cities
Perhaps one of the most intriguing aspects of the e-bike is that it appeals to a wider array of segments than conventional bicycles and public transport do E-bikes provide people who would otherwise not be able to bike due to old age physical limitations or proximity to locations the ability to overcome these challenges (MacArthur et al 2014) Further studies from Western countries have found that more men than women use e-bikes (Haustein and Moslashller 2016) which is positive from the point of view that men generally use cars more compared to women while also being less motivated to reduce that use (Polk 2004 2003 Waygood and Avineri 2016) Indeed 80 of the
73
participants in the e-bike sample were men and judging by the qualitative survey answers they seemed to appreciate using the e-bike primarily for its convenience for giving health benefits and increased wellbeing and for being an environmentally good option
Unclear to what extent smartphones can lsquonudgersquo travel behaviour From the perspective of influencing modal choice a smartphone innovation was evaluated in Paper II in the form of a mobility service application (MSA) Unfortunately the data material was insufficient for an effect-evaluation to be carried out and as a result the potential for smartphones to influence travel behaviours could not be assessed although there was an indication that the MSA had made it easier to travel by public transport
The qualitative process evaluation revealed that several weaknesses with the MSA as well as organisational barriers discouraged participants from using the MSA to a large extent The weaknesses of the MSA can be interpreted in light of the conceptual model developed in Paper I It was stated that the MSA failed to align with the current and often procured business travel agency which made it difficult for some participants to use the MSA even if they wanted to Some stated that the app had too few ticket options and was lacking the personalised service that users were accustomed to from their travel agency According to the model this level of customisation to the user would be insufficient Further there were no real incentives to use the MSA and the users received no feedback regarding their behaviour or use of the app In some organisations the MSA was hardly advertised at all It thus seems that the importance of personalised information and feedback as well as commitment towards using the app as stated in the model were neglected in the design of the MSA A particular limitation of the MSA related to technical weaknesses such as a slow login procedure and non-user-friendly interface which made many of the participants think that the app was not fully developed Clearly the MSA lacked an appealing and user-friendly design which is an essential part of the model Hence when contrasting the MSA against the conceptual model it is unsurprising that the MSA was not more successful
Despite these issues many participants thought that the MSA had the potential to improve how sustainable business trips can be handled (an example was the automatic handling of travel expenses) However the diversity of apps and their increased technical development means that conclusions about smartphone applicationsrsquo general ability to influence travel behaviour can hardly be drawn from this particular case Many factors determine the effectiveness of an intervention not just the design of the app but also the design of the study Lately several research studies have demonstrated a significant behavioural effect by utilising some of the features stated in the conceptual model within smartphone apps to encourage cycling (Weber et al 2018) walking (Nakashima et al 2017) and more sustainable and healthy modes of transport in general (Cellina et al 2019 Ek et al 2020) Thus there seems to be some potential
74
in these apps that could benefit soft measures although more research is needed in this emerging field before any conclusions can be drawn about their general effectiveness
A game-changer for evaluation practice lsquoAre we there yetrsquo This question is posed by Harding and colleagues (2020 p 1) upon assessing a range of smartphone applications as tools for collecting travel-data After assessing 17 different travel apps in 2016 they conclude that while accuracy in terms of trip detection is high in most cases performances are more varied for mode inference
The pursuit for more sophisticated GPS-based solutions for measuring the effect of soft transport measures has been around for some time now The conventional method of using travel diaries is not as reliable as we would like (Bonsall 2009 Rosenfield et al 2020) Already within the TravelSmart program in Australia GPS measurements were piloted as an alternative to travel diaries (Stopher et al 2006) Before the prevalence of smartphones GPS devices were used to measure time and distance travelled and the data was then coupled with the road network public transport routes and survey answers from the participants to establish mode choices (Stopher et al 2009) With smartphones high-quality data can be collected from individuals over several days while minimising the burden on the owner Individuals do not need to remember and manually report details about their trips Instead the app can log travel activities in the background and provide a user interface so that the respondents can validate the information at the end of the day Even now though this technology is as of yet untapped in evaluating soft measures something that is highlighted in the latest meta-analysis by Semenescu et al (2020 p 14)
A significant limitation to current data collection practices based primarily on self-reported information is the possibility of bias both from the intervention evaluator as well as from the intervention recipient These biases could be eliminated by the process of collecting data with the use of smartphones or GPS devices Such changes should be adopted not only by progressive researchers but should become standard practice for intervention providers especially if financing organisations demand higher quality evaluations as an important part of the intervention program
The e-bike intervention carried out within this thesis came with the opportunity to collect data with the TravelVu smartphone application Three measurement periods of one week each were undertaken that resulted in a detailed dataset in which it was also possible to detect smaller changes in travel behaviour as a result of the intervention Moreover the survey responses were collected from the app as well making it easier for the respondents since they did all the reporting in the same tool Some participants had problems with the app although these were few and could most often be alleviated with support from the project team
75
Compared to the data collection procedure in Paper II which was conducted with a web survey the dropout rate was much lower in the e-bike sample (34 drop-out in the e-bike sample and 60 dropout in the business travel sample) Further the data collected from smartphones provided considerably more details about the travel behaviours of the participants
So are we there yet Perhaps it is too early to say that smartphone applications are ready to replace conventional methods used in large-scale national travel surveys one reason being that the response rate could be lower and more skewed thus increasing the risk of attaining a biased sample However as a tool used for assessing behavioural interventions such as soft transport measures it seems to be increasingly indispensable and my own view is that it should be preferred whenever possible as long as an in-depth examination is warranted for the study in question
To control or not control that is not a question The problem of weak study designs in evaluations of soft measures often has to do with the absence of a control group This is a significant issue because it prevents the production of reliable and politically useful evaluation results (Arnott et al 2014) On the other hand including controls in real interventions could be met with reluctance from practitioners who do not want to lsquowastersquo participants who would otherwise have gone into the treatment group (Lieberoth et al 2018) The usual goal of the actor that fund soft measures is to engage as many of the population of an area as possible in the campaign (Stopher et al 2009) Moreover if a control group is incorporated it might result in larger dropouts since the control group is usually less incentivised to participate in the study than the individuals assigned to the treatment group
In a systematic review in the field of medicine on exercise oncology trials Bisschop et al (2015) found that control groups receiving an intervention have lower contamination and dropout rates compared to control groups receiving no intervention To the best of my knowledge similar studies have not been conducted in the transport field despite the obvious advantages of minimising attrition in transportation intervention studies From experiencing high dropout rates in Paper II preventing this from happening again in the e-bike trial became a priority The attempt with an additional trial phase was therefore made in which the control group received the e-bike treatment as well This had likely a positive effect on participation since the trial lasted for a relatively long period (two months excluding the last trial phase) Moreover the participants volunteered to take part in the study with hopes of trialling an e-bike Without treatment those randomly assigned to the control group could have been disappointed and dropped out of the study especially since they would have had to record their travel behaviour and answer questionnaires without getting anything in return
76
Apart from mitigating attrition offering the intervention to the control group after the test group deals with the concern of lsquowasting participantsrsquo since all participants get treatment An additional bonus is more trial data that can be used to validate the effect of the original test group This approach will help to satisfy both the practitioner aiming to maximise the reach of the intervention and the researcher whose main priority is scientific rigour Hence in cases where an effect evaluation is warranted the reasons for not including a control group seem increasingly invalid In fact disseminating this method could lead to increased use of control groups in practice thus realising better evaluations which in turn would facilitate a cumulative understanding of the effects of soft measures
63 Second aim Motivation to decrease car use and the use of segmentation for improving soft measures
Climate morality can only get us so far One of the key questions that confront research and practice regarding soft transport measures is what motivates pro-environmental travel behaviour In this thesis climate morality was particularly important for the motivation to reduce car use and for travelling with more sustainable means of transport Attitudes towards cycling and car use past behaviour and travel time were also significant predictors This is in line with previous research that has found people to be more likely to reduce car use if they like cycling and have experience of it (Fernaacutendez-Heredia et al 2014 Gatersleben and Uzzell 2007 Handy and Xing 2011 Rondinella et al 2012) People with higher affection for cars are less likely to reduce their use of them (Steg 2005 Steg et al 2001b) and long distances tend to discourage commuters from using sustainable transportation (Heinen et al 2013)
Climate morality was the most influential factor This picture was reinforced by the fact that marketing messages for sustainable travel did induce more motivation to reduce private car use if the messages were more altruistic that is emphasised the need to care for the environment personal and societal health benefits of more sustainable travel behaviour collective responsibility and morality This is in line with Franssens et al (2021) who found that public transport operators can increase public transport use by incorporating messages that positively label passengers as sustainable travellers in their communication strategies
Together these findings indicate that motivation to engage in pro-environmental travel behaviours is influenced by moral constructs Indeed some argue that environmental concern and behaviours are most strongly linked to values (Schwartz 1977) particularly altruistic and biospheric orientations (de Groot and Steg 2008) and the
77
activation of pro-environmental personal norms (Stern 2000) A personal norm is activated when individuals realise the consequences of their behaviour (for instance towards the environment) and when they feel personally responsible for the behavioural consequences This increases the likelihood of engaging in altruistic behaviour such as reducing car use in favour of more sustainable but less convenient and comfortable modes of transport However personal norms are only translated into altruistic behaviours when a person feels able to execute them and when there are no perceived barriers or high costs involved (Schwartz 1977)
Previous research supports this stance and suggests that environmental personal norms play a marginal role in predicting actual travel mode choice while emerging as a significant predictor of intention or motivation to choose green modes of transport (see Kloumlckner 2013 and Lanzini and Khan 2017 for meta-analyses) Pro-environmental personal norms were for instance found to only have an indirect effect on e-bike use in a recent Norwegian study (Simsekoglu and Kloumlckner 2018) This indirect-only relationship between environmental personal norms and behaviour is not necessarily bad news as it still offers a potential benefit as expressed by Kloumlckner (2013 p 1036)
[hellip] personal norms are relatively stable compared to attitudes and intentions If a personal norm is created the effect of that norm can last for a long time
When there is an inconsistency between personal norms and behaviour it could be due to a lack of perceived behavioural control to perform the behaviour which is a strong determinant of travel behaviour (Javaid et al 2020) This is often the reason for the attitude-behaviour gap which refers to the difference between what our attitude to something is versus our behaviour in relation to it (Milfont and Duckitt 2010) A similar gap in decision-making theory conceptualised as bounded rationality (Simon 1955) refers to the restraints such as time and cognitive skills that prevent people from making perfectly rational decisions One can argue that the general desire to act in accordance with onersquos moral values is also limited or bounded by rationality To facilitate sustainable travel behaviours it is therefore important to minimise the discrepancy between pro-environmental and rational modal choices For instance the convenience of the e-bike may increase the perceived behavioural control to reduce car use for some people But it is also important to emphasise the need for hard structural conditions that facilitate sustainable means of transport for instance by pricing and taxation physical measures that re-distribute road space and priority measures that restrict access and parking for cars sustainable and integrated transport- and land-use planning and so on (Buehler and Pucher 2011 Marshall and Banister 2000 Pucher and Buehler 2017 Santos et al 2010) The significant effect of climate morality on motivation to decrease private car use as found in this thesis could be a factor that increases the acceptance for such hard structural measures that facilitates sustainable travel behaviours
78
Attitude-based segmentation needs to be assessed in practice In Paper III the use of the SEGMENT model showed that car users with similar demographic characteristics differ profoundly in their modal split and that this difference was better described by attitudes compared to demographics Thus in line with previous research segmentation based on demographics appears to be insufficient in predicting travel behaviour and motivation to change behaviour (Anable 2005 2002) One exception is that between car users and non-car users where demographics do matter non-car users are younger have fewer children and are more often students
How can attitude-based segmentation be used then in practice to find appropriate segments to target Several segmentation procedures including attitudinal survey items have been introduced by researchers (Anable 2005 Damant-Sirois et al 2014 Diana and Pronello 2010 Haustein and Hunecke 2013 Haustein and Moslashller 2016 Li et al 2013 Poortinga and Darnton 2016 Thoslashgersen 2018 Wolf and Schroumlder 2019) However the extent to which these are feasible in practice both in terms of influencing the effectiveness of soft measures and in terms of being reproducible simply and practically is unclear The SEGMENT model proposed by Anable and Wright (2013) is an exception as this has some empirical support and provides an online instrument for the segmentation procedure (Ladbury 2013) However the results from Paper III did not support the notion that the segments were motivated by different kinds of messages A similar conclusion was made recently in a study that assessed the effectiveness of different messages on segments retrieved from the SEGMENT model (Pangbourne et al 2020) The authors suggest that segmentation by travel attitude may not be an effective way to target behaviour change messaging although it may be a useful tool in designing other elements of behaviour change interventions (Pangbourne et al 2020) In Paper III the indication of assimilation bias suggest that messages need to be aligned with the current beliefs and behaviours of the target audience The best way to do that remains to be investigated
Target the low-hanging fruit Paper IV demonstrated that preconditions for motivation to change behaviour (based on attitudes travel time and past behaviour) were significantly correlated with the TTM-stages This is useful knowledge because segmentation based on the TTM is easy to execute while it still provides valuable information about the stage groupsrsquo attitudes towards decreasing car use (Bamberg 2007 Biehl et al 2019 Mundorf et al 2018)
Which segments should then be targeted This question depends primarily on the purpose of the intervention If measures need to be implemented in a specific context for instance to relieve congestion at a school or workplace the target is already defined to some extent
However the purpose of soft measures is often less constrained with the aim to reduce car use as much as possible Although it is tempting to implement soft measures where
79
car use is high caution needs to be taken regarding potential boomerang effects This could happen when the message of a campaign is misaligned with the attitudes and behaviours of the target group (Beale and Bonsall 2007 Petty and Cacioppo 1986) Individuals may dislike being told what to do and may be sceptical towards campaigns in general which could lead them to engage in the opposite behaviour or simply disregard the information (Kavvouris et al 2019) also known as psychological reactance (Brehm 1966) Indeed the results from Paper III indicated that marketing messages promoting sustainable transportation were judged in line with assimilation bias meaning that people interpret information in such a way as to be assimilated into pre-existing beliefs The segment with the highest level of car use (the Devoted Drivers) was also the one that reported the lowest motivation to change behaviour6 This means that it is considerably more difficult to approach a segment that has shown no interest in changing behaviour in comparison to car users with an open mind to change As demonstrated in Paper IV the highest threshold in preconditions for motivation to change travel behaviour was between the first and the second stage in the TTM (pre-contemplation and contemplation) which reinforces this notion
Intervention studies that still have attempted to target pre-contemplation segments such as Devoted Drivers report low or absent compliance levels (Innocenti et al 2013 Lattarulo et al 2018 Tertoolen et al 1998) Thus soft measures targeting car users with no intention to change bear the risk of boomerang effects and are unlikely to induce behaviour change If such segments are to be targeted it would likely require a combination of hard and soft travel demand measures (Steg 2007 Stradling et al 2000) However failing to induce a behaviour change might not be a complete failure if the participants have progressed in their behaviour change ladder (Forward 2019) This could for instance mean that pre-contemplators proceed to contemplation after an intervention (such as an information or marketing campaign) which can be assessed by measuring stage allocation before and after the intervention (Bamberg 2013) However this line of reasoning assumes that peoplersquos stated stage allocation post-intervention remains relatively stable which is not always the case (De Nooijer et al 2005)
From a practitionerrsquos perspective perhaps segmentation need not be more complicated than simply asking people whether they are willing to decrease their car use or not This approach has been used in practice for many years including the behaviour change technique known as IndiMark which segments the population into three main groups regular users of sustainable travel modes non-regular users who are interested in receiving information on alternatives to the car and those who are not interested in
6 When analysing the free-text responses in the national survey data it became clear that a reactance
effect led many respondents to express their strong dissatisfaction with the fact that their car use was implicitly questioned Some even went so far as to (incorrectly) accuse the study of being financed by the Swedish Green Party
80
taking part (Broumlg et al 2009) This would mean identifying car users who are willing to try an alternative to the car In the language of the TTM targeting the contemplation and preparation stages would be a sound strategy since these have lsquoambivalentrsquo attitudes towards car use (Forward 2014) and may therefore be open to change
In Paper V such a targeting strategy was applied in the recruitment of individuals who would get the offer to participate in the e-bike trial These were frequent drivers with an equally high frequency of car use as the Devoted Drivers (80 car trips) but with a different attitude towards driving A large substitution effect from car to e-bike was demonstrated in this sample Targeting such segments offers the largest potential to reduce car use which is often the objective for the actors that finance and implement soft measures (Stopher et al 2009) Moreover individuals who are positive towards taking part in an intervention are more likely to realise a change (Stroumlmberg et al 2016) which could lead to substantial spillover effects through social interactions (Hsieh 2020) resulting in positive effects beyond what is measured directly However researchers might look further into the obstacles preventing pre-contemplators from shifting mode of travel After all this is the segment with the highest car use and there might be possible car use reductions that are within these individualrsquos complete volitional control Naturally these narrower measures that target specific car user segments can be combined with measures aimed at the community in a wider sense with the purpose to influence social norms more generally (Winslott Hiselius and Smidfelt Rosqvist 2015)
64 Concluding remarks
This thesis has shown that innovations can advance the implementation of soft measures both as a means for promoting more sustainable travel choices but also as a means for enhancing evaluations It has also identified limitations with innovations and pitfalls in the application of these in practice Further the thesis contributes knowledge about how pro-environmental travel modes can be marketed what factors influence motivation to reduce private car use as well as different perspectives on segmentation and which target groups soft measures could be aimed at
Based on previous research it is not possible to conclude whether smartphone applications are effective in changing travel behaviours which is also the conclusion from Paper II However there seems to be some potential in using apps for driving behaviour change although their success could depend on several design features as found in Paper I Regarding their effectiveness results from previous research are mixed and more studies are needed in this emerging field before any conclusions can be drawn about their general effectiveness and contribution to soft measures
81
However smartphone applications can contribute significantly to facilitate more rigorous evaluations of soft measures This development is long-awaited and much needed in a field where evaluations are notoriously criticised for low methodological quality which ultimately challenges the use of soft measures in practice Collecting data from usersrsquo smartphones deals with many issues related to self-reports in travel behaviour research It also provides more fine grained data which makes it possible to detect smaller effects This could to some extent compensate for having small sample sizes like the sample used in Paper II
Another methodological improvement for soft measures is to offer interventions to control groups as well which may lead to fewer dropouts from field experiments and in the end a higher acceptance for using control groups in practice
The use of e-bikes is growing at a rapid pace around the world While there are many potential benefits of this mode of transport several of these depend on a substitution effect that has not been properly assessed in previous research This thesis demonstrated in a randomised controlled trial that e-bikes have a considerable car-substitution potential The average increase in the modal share of cycling was 21 with an equal reduction in the share of car use as expressed in distance travelled This extent of substitution shows that the e-bike can seriously compete with the car although mainly for commuting and other single-purpose trips An interesting research strand ahead is evaluating how other types of electric vehicles influence mode choice for instance electric cargo bikes (see for instance the study by Bjoslashrnararing et al (2019)) Due to the higher speed of the e-bike and the potential for regional cycling investments in regional cycle highway networks seems promising for extending its benefits outside of urban areas (Goumltschi et al 2017 Grigoropoulos et al 2021 van Lierop et al 2020)
Regarding the marketing of pro-environmental travel behaviours the results show that messages should promote altruistic feelings connected to health the environment collective responsibility and morality Hence organisations that for instance promote public transport through messages such as lsquotogether for a sustainable futurersquo seems to have chosen an effective communication strategy In contrast to expectations attitude-based segments did not report different preferences with regards to the type of marketing messages but rather assimilated the information according to prevailing beliefs
In line with previous research motivation to reduce car use is heavily influenced by a moral obligation to reduce onersquos carbon emissions although attitudes towards cycling and car use past behaviour and travel time are influential as well An index of these determinants correlated with the TTM stages which indicate that the stage model is suitable for identifying segments to target in interventions The results consistently show that the most car-oriented segments are significantly less motivated to change behaviour At the same time the thesis demonstrates by example that soft measures aimed at car users with an open mind to try a new means of transport have the potential
82
for considerable behaviour change From the perspective of maximising the shift from cars to alternative means of transport soft measures should target such segments However there might be other purposes that require measures to be aimed at other segments and this decision lies ultimately with the organisation that executes the measure Due to the influence of assimilation bias it is important to design measures in a way that limits potential reactance from the target group while encouraging sustainable travel behaviours
641 Limitations
The content analysis in Paper I was conducted independently by the author of this thesis and is therefore more sensitive to researchers bias than if the analysis had been conducted by a group of researchers Another limitation is that the conceptual model developed in Paper I could not be assessed empirically Since the data collection for Paper II was conducted in parallel with the production of Paper I there was no possibility to examine the development and implementation process of the MSA in light of the model by adapting the survey questions accordingly Instead a brief comparison was made within the thesis (see section 62 on page 73)
One limitation of Paper III is that the effect of the marketing messages on actual travel behaviour was not investigated Therefore the analysis is restricted to motivation to decrease private car use In relation to this and Paper IV one could question whether the stated motivation to decrease private car use from being exposed to the marketing messages reflects the lsquotruersquo motivation Indeed one limitation is the use of such a proxy for motivation However based on the principle of assimilation it seems reasonable that these would correlate well enough for conducting the analyses and make the subsequent inferences which were made in Paper IV
A few issues made it difficult to examine the process underlying behaviour change with quantitative methods First the data material in Paper II did not allow for an analysis of the extent to which the UTAUT determinants influenced travel behaviour Second in Paper V the time interval was too short to include an analysis of which determinants influenced the travel behaviour change resulting from the e-bike trial As such the psychological survey items included in the study were not utilised in this thesis Nor were the results from a replication study carried out during autumn 2020 in a similar municipality not possible to include here This would have added to the aim of evaluating the process of change as well as validating the results from Paper V7
Another limitation with Paper V is that the long-term effects of the intervention were not studied which was due to time constraints However a follow-up survey was
7 However this work is ongoing
83
conducted four to five months after the e-bike intervention by the partner organisation VGR Although this is good longitudinal studies must not be only performed by the actor who carries out the intervention in order to minimise the risk of bias
642 Further research
The soft transport policy field is constantly developing which requires a parallel companion in research that critically assess soft measures and identifies ways of improvement Here are some suggestions for further research connected to segmentation motivation and evaluation of soft measures
Regarding segmentation research can continue in the attempt to identify suitable target segments and most critically assess the feasibility of using segmentation and provide practical insights into how it can be applied
Further research can evaluate the effectiveness of attitude-based segmentation in practice and continue to explore motivational determinants for mode shifting in different groups Advanced methods for collecting psychometric data from online communication platforms and the identification of segments through machine learning techniques offer a potential avenue for travel behaviour change However this raises serious privacy and ethical concerns (Wolf and Schroumlder 2019)
Several challenges remain in evaluating soft measures one of the more pressing being the difficulty in conducting longitudinal field experiments Researchers would make a significant contribution by evaluating the long-term effects of soft measures Further more rigorous studies need to replicate field experiments to test the external validity of individual evaluation studies Following this meta-analyses can provide more robust estimations of the effectiveness of various soft measures Another intriguing aspect of evaluation is the potential spillover effects from soft measures A recent study shows that such spillover effects can be equal in size to the effects realised for the intervention group (Hsieh 2020)
84
85
References
Abrahamse W Steg L Gifford R Vlek C 2009 Factors influencing car use for commuting and the intention to reduce it A question of self-interest or morality Transp Res Part F Traffic Psychol Behav 12 317ndash324 httpsdoiorg101016jtrf200904004
Ajzen I 1991 The theory of planned behavior Organ Behav Hum Decis Process 50 179ndash211 httpsdoiorg1010160749-5978(91)90020-T
Ajzen I Fishbein M 1980 Understanding Attitudes and Predicting Social Behavior Prentice-Hall Englewood Cliffs NJ
Anable J 2005 lsquoComplacent Car Addictsrsquo or lsquoAspiring Environmentalistsrsquo Identifying travel behaviour segments using attitude theory Transp Policy 12 65ndash78 httpsdoiorg101016jtranpol200411004
Anable J 2002 Mobility Management In The Leisure Sector The Application Of Psychological Theory And Behavioural Segmentation University of London
Anable J Goodwin P 2019 Chapter 4 transport amp mobility In Eyre N Killip G (Eds) Shifting the Focus Energy Demand in a Net-Zero Carbon UK Centre for Research into Energy Demand Solutions Oxford
Anable J Wright S 2013 Work Package 7 Golden Questions and Social Marketing Guidance Report Intelligent Energy Europe (IEE)
Andersson A 2020 Is climate morality the answer Preconditions affecting the motivation to decrease private car use Transp Res Part D Transp Environ 78 1ndash14 httpsdoiorg101016jtrd201911027
Andersson A Winslott Hiselius L Adell E 2020a The effect of marketing messages on the motivation to reduce private car use in different segments Transp Policy 90 22ndash30 httpsdoiorg101016jtranpol202002006
Andersson A Winslott Hiselius L Adell E 2018 Promoting sustainable travel behaviour through the use of smartphone applications A review and development of a conceptual model Travel Behav Soc 11 52ndash61 httpsdoiorg101016jtbs201712008
Andersson A Winslott Hiselius L Berg J Forward S Arnfalk P 2020b Evaluating a Mobility Service Application for Business Travel Lessons Learnt from a Demonstration Project Sustain 12 1ndash18 httpsdoiorg103390su12030783
Armitage CJ 2009 Is there utility in the transtheoretical model Br J Health Psychol 14 195ndash210 httpsdoiorg101348135910708X368991
86
Armitage CJ Conner M 2001 Efficacy of the theory of planned behaviour Br J Soc Psychol 40 471ndash499 httpsdoiorg101348014466601164939
Arnott B Rehackova L Errington L Sniehotta FF Roberts J Araujo-Soares V 2014 Efficacy of behavioural interventions for transport behaviour change systematic review meta-analysis and intervention coding Int J Behav Nutr Phys Act 11 133 httpsdoiorg101186s12966-014-0133-9
Avineri E Waygood EO 2013 Applying valence framing to enhance the effect of information on transport-related carbon dioxide emissions Transp Res Part A Policy Pract 48 31ndash38 httpsdoiorg101016jtra201210003
Axsen J Ploumltz P Wolinetz M 2020 Crafting strong integrated policy mixes for deep CO2 mitigation in road transport Nat Clim Chang 10 809ndash818 httpsdoiorg101038s41558-020-0877-y
Bamberg S 2014 Psychological Contributions to the Development of Car Use Reduction Interventions in Gaumlrling T Ettema D Friman M (Eds) Handbook of Sustainable Travel Springer Netherlands Dordrecht pp 131ndash149 httpsdoiorg101007978-94-007-7034-8_9
Bamberg S 2013 Applying the stage model of self-regulated behavioral change in a car use reduction intervention J Environ Psychol 33 68ndash75 httpsdoiorg101016jjenvp201210001
Bamberg S 2007 Is a stage model a useful approach to explain car driversrsquo willingness to use public transportation J Appl Soc Psychol 37 1757ndash1783 httpsdoiorg101111j1559-1816200700236x
Bamberg S 2006 Is a residential relocation a good opportunity to change peoplersquos travel behavior Results from a theory-driven intervention study Environ Behav 38 820ndash840 httpsdoiorg1011770013916505285091
Bamberg S Fujii S Friman M Gaumlrling T 2011 Behaviour theory and soft transport policy measures Transp Policy 18 228ndash235 httpsdoiorg101016jtranpol201008006
Bamberg S Hunecke M Bloumlbaum A 2007 Social context personal norms and the use of public transportation Two field studies J Environ Psychol 27 190ndash203 httpsdoiorg101016jjenvp200704001
Bamberg S Moumlser G 2007 Why are work travel plans effective Comparing conclusions from narrative and meta-analytical research synthesis Transportation (Amst) 34 647ndash666 httpsdoiorg101007s11116-007-9121-0
Bamberg S Rees J 2017 The impact of voluntary travel behavior change measures ndash A meta-analytical comparison of quasi-experimental and experimental evidence Transp Res Part A Policy Pract 100 16ndash26 httpsdoiorg101016jtra201704004
Bandura A 2000 Exercise of human agency through collective efficacy Curr Dir Psychol Sci 9 75ndash78 httpsdoiorg1011111467-872100064
87
Bandura A 1997 Self-efficacy The exercise of control W H FreemanTimes Books Henry Holt amp Co New York NY US
Bandura A (Ed) 1995 Self-Efficacy in Changing Societies Cambridge University Press httpsdoiorg101017CBO9780511527692
Banister D 2019 The climate crisis and transport Transp Rev 39 565ndash568 httpsdoiorg1010800144164720191637113
Banister D 2011 Cities mobility and climate change J Transp Geogr 19 1538ndash1546 httpsdoiorg101016jjtrangeo201103009
Banister D 2005 Unsustainable Transport - City transport in the new century Routledge London
Barth M Jugert P Fritsche I 2016 Still underdetected - Social norms and collective efficacy predict the acceptance of electric vehicles in Germany Transp Res Part F Traffic Psychol Behav 37 64ndash77 httpsdoiorg101016jtrf201511011
Bastian A Boumlrjesson M Eliasson J 2016 Explaining lsquopeak carrsquo with economic variables Transp Res Part A Policy Pract 88 236ndash250 httpsdoiorg101016jtra201604005
Beale JR Bonsall PW 2007 Marketing in the bus industry A psychological interpretation of some attitudinal and behavioural outcomes Transp Res Part F Traffic Psychol Behav 10 271ndash287 httpsdoiorg101016jtrf200611001
Biehl A Ermagun A Stathopoulos A 2019 Utilizing multi-stage behavior change theory to model the process of bike share adoption Transp Policy httpsdoiorgS0967070X18301033
Bisschop CNS Courneya KS Velthuis MJ Monninkhof EM Jones LW Friedenreich C Van Der Wall E Peeters PHM May AM 2015 Control group design contamination and drop-out in exercise oncology trials A systematic review PLoS One 10 1ndash13 httpsdoiorg101371journalpone0120996
Bjoslashrnararing HB Berntsen S te Velde SJ Fyhri A Deforche B Andersen LB Bere E 2019 From cars to bikes ndash the effect of an intervention providing access to different bike types A randomized controlled trial PLoS One 14 1ndash17 httpsdoiorg101371journalpone0219304
Bolderdijk JW Steg L Geller ES Lehman PK Postmes T 2013 Comparing the effectiveness of monetary versus moral motives in environmental campaigning Nat Clim Chang 3 413ndash416 httpsdoiorg101038nclimate1767
Bonsall P 2009 Do we know whether personal travel planning really works Transp Policy 16 306ndash314 httpsdoiorg101016jtranpol200910002
Brand C Anable J Ketsopoulou I Watson J 2020 Road to zero or road to nowhere Disrupting transport and energy in a zero carbon world Energy Policy 139 111334 httpsdoiorg101016jenpol2020111334
Brehm JW 1966 A theory of psychological reactance Academic Press Oxford England
88
Brown SP Stayman DM 1992 Antecedents and Consequences of Attitude Toward the Ad A Meta-Analysis J Consum Res 19 34ndash51
Brug J Conner M Harreacute N Kremers S McKellar S Whitelaw S 2005 The Transtheoretical Model and stages of change A critique - Observations by five commentators on the paper by Adams J and White M (2004) Why donrsquot stage-based activity promotion interventions work Health Educ Res 20 244ndash258 httpsdoiorg101093hercyh005
Broumlg W Erl E Ker I Ryle J Wall R 2009 Evaluation of voluntary travel behaviour change Experiences from three continents Transp Policy 16 281ndash292 httpsdoiorg101016jtranpol200910003
Buehler R Pucher J 2011 Sustainable transport in freiburg Lessons from germanyrsquos environmental capital Int J Sustain Transp 5 43ndash70 httpsdoiorg10108015568311003650531
Boumlrjesson M Isacsson G Andersson M Anderstig C 2019 Agglomeration productivity and the role of transport system improvements Econ Transp 18 27ndash39 httpsdoiorg101016jecotra201812002
Cairns S Behrendt F Raffo D Beaumont C Kiefer C 2017 Electrically-assisted bikes Potential impacts on travel behaviour Transp Res Part A Policy Pract 103 327ndash342 httpsdoiorg101016JTRA201703007
Cairns S Sloman L Newson C Anable J 2004 Smarter choices-changing the way we travel Final report of the research project lsquoThe influence of soft factor interventions on travel demandrsquo Final report of the research project lsquoThe influence of soft factor interventions on travel demandrsquo
Cairns S Sloman L Newson C Anable J Kirkbride A Goodwin P 2008 Smarter choices Assessing the potential to achieve traffic reduction using lsquoSoft measuresrsquo Transp Rev 28 593ndash618 httpsdoiorg10108001441640801892504
Castellanos S 2016 Delivering modal-shift incentives by using gamification and smartphones A field study example in Bogota Colombia Case Stud Transp Policy 4 269ndash278 httpsdoiorg101016jcstp201608008
Cellina F Bucher D Mangili F Simatildeo JV Rudel R Raubal M 2019 A large scale app-based behaviour change experiment persuading sustainable mobility patterns Methods results and lessons learnt Sustain 11 httpsdoiorg103390su11092674
Chatterjee K 2009 A comparative evaluation of large-scale personal travel planning projects in England Transp Policy 16 293ndash305 httpsdoiorg101016jtranpol200910004
Chatterjee K Carey RN 2018 Special Issue on the theory design and evaluation of behaviour change interventions in transport J Transp Heal 10 7ndash10 httpsdoiorg101016jjth201808009
Chen CF Chao WH 2011 Habitual or reasoned Using the theory of planned behavior technology acceptance model and habit to examine switching intentions toward public
89
transit Transp Res Part F Traffic Psychol Behav 14 128ndash137 httpsdoiorg101016jtrf201011006
Crotty M 1998 The foundations of social research Meaning and perspective in the research process Allen amp Unwin Crows Nest NSW Australia httpsdoiorg102298theo1301005c
Crowne DP Marlowe D 1960 A new scale of social desirability independent of psychopathology J Consult Psychol 24 349ndash354 httpsdoiorg101037h0047358
Damant-Sirois G Grimsrud M El-Geneidy AM 2014 Whatrsquos your type a multidimensional cyclist typology Transportation (Amst) 41 1153ndash1169 httpsdoiorg101007s11116-014-9523-8
Davies N 2012 What are the ingredients of successful travel behavioural change campaigns Transp Policy 24 19ndash29 httpsdoiorg101016jtranpol201206017
de Groot JIM Steg L 2008 Value orientations to explain beliefs related to environmental significant behavior How to measure egoistic altruistic and biospheric value orientations Environ Behav 40 330ndash354 httpsdoiorg1011770013916506297831
De Nooijer J Van Assema P De Vet E Brug J 2005 How stable are stages of change for nutrition behaviors in the Netherlands Health Promot Int 20 27ndash32 httpsdoiorg101093heaprodah504
Deterding S Sicart M Nacke L OrsquoHara K Dixon D 2011 Gamification Using Game Design Elements in Non-Gaming Contexts Proceedings of the 2011 annual conference extended abstracts on Human factors in computing systems - CHI EA rsquo11 Vancouver BC httpsdoiorg10114519797421979575
Diana M Pronello C 2010 Traveler segmentation strategy with nominal variables through correspondence analysis Transp Policy 17 183ndash190 httpsdoiorg101016jtranpol201001005
Dolnicar S Gruumln B Leisch F 2018 Market segmentation analysis Understanding it doing it and making it useful Market Segmentation Analysis Springer Open Singapore
Doran R Hanss D Larsen S 2015 Attitudes efficacy beliefs and willingness to pay for environmental protection when travelling Tour Hosp Res 15 281ndash292 httpsdoiorg1011771467358415580360
Ek A Alexandrou C Soumlderstroumlm E Bergman P Nystroumlm CD Direito A Eriksson U Henriksson P Maddison R Lagerros YT Bendtsen M Loumlf M 2020 Effectiveness of a 3-month mobile phonendashbased behavior change program on active transportation and physical activity in adults Randomized controlled trial JMIR mHealth uHealth 8 httpsdoiorg10219618531
Elvik R Hoslashye A Vaa T Soslashrensen M 2009 The Handbook of Road Safety Measures Second edi ed Emerald Group Publishing Limited
90
Eriksson L Garvill J Nordlund AM 2008 Interrupting habitual car use The importance of car habit strength and moral motivation for personal car use reduction Transp Res Part F Traffic Psychol Behav 11 10ndash23 httpsdoiorg101016jtrf200705004
European Commision 2009 MAX - Successful Travel Awareness Campaigns and Mobility Management Strategies Transp Res Innov Monit Inf Syst URL httpstrimiseceuropaeuprojectsuccessful-travel-awareness-campaigns-and-mobility-management-strategiestab-partners (accessed 102820)
Ferguson E 1997 The rise and fall of the American carpool 1970-1990 Transportation (Amst) 24 349ndash376 httpsdoiorg101023A1004928012320
Fernaacutendez-Heredia Aacute Monzoacuten A Jara-Diacuteaz S 2014 Understanding cyclistsrsquo perceptions keys for a successful bicycle promotion Transp Res Part A Policy Pract 63 1ndash11 httpsdoiorg101016jtra201402013
Field A 2018 Discovering Statistics using IBM SPSS Statistics 5th editio ed SAGE Publications Ltd Los Angeles London New Delhi Singapore Washington DC Melbourne
Fishbein M Ajzen I 1975 Belief attitude intention and behaviour An introduction to theory and research Reading MA Addison-Wesley
Flick U 2002 Qualitative research - state of the art Soc Sci Inf 41 5ndash24 httpsdoiorg1011770539018402041001001
Forward SE 2019 Views on public transport and how personal experiences can contribute to a more positive attitude and behavioural change Soc Sci 8 httpsdoiorg103390socsci8020047
Forward SE 2014 Exploring peoplersquos willingness to bike using a combination of the theory of planned behavioural and the transtheoretical model Rev Eur Psychol Appl 64 151ndash159 httpsdoiorg101016jerap201404002
Franssens S Botchway E Swart W De Dewitte S 2021 Nudging Commuters to Increase Public Transport Use A Field Experiment in Rotterdam Front Psychol 12 httpsdoiorg103389fpsyg2021633865
Friman M Huck J Olsson LE 2017 Transtheoretical model of change during travel behavior interventions An integrative review Int J Environ Res Public Health 14 1ndash15 httpsdoiorg103390ijerph14060581
Friman M Larhult L Gaumlrling T 2013 An analysis of soft transport policy measures implemented in Sweden to reduce private car use Transportation (Amst) 40 109ndash129 httpsdoiorg101007s11116-012-9412-y
Friman M Maier R Olsson LE 2019 Applying a motivational stage-based approach in order to study a temporary free public transport intervention Transp Policy 81 173ndash183 httpsdoiorg101016jtranpol201906012
91
Fujii S Bamberg S Friman M Gaumlrling T 2009 Are effects of travel feedback programs correctly assessed Transportmetrica 5 43ndash57 httpsdoiorg10108018128600802591277
Fujii S Kitamura R 2003 What does a one-month free bus ticket do to habitual drivers An experimental analysis of habit and attitude change Transportation (Amst) 30 81ndash95 httpsdoiorg101023A1021234607980
Fujii S Taniguchi A 2006 Determinants of the effectiveness of travel feedback programs-a review of communicative mobility management measures for changing travel behaviour in Japan Transp Policy 13 339ndash348 httpsdoiorg101016jtranpol200512007
Fyhri A Sundfoslashr HB 2020 Do people who buy e-bikes cycle more Transp Res Part D Transp Environ 86 102422 httpsdoiorg101016jtrd2020102422
Gatersleben B Appleton KM 2007 Contemplating cycling to work Attitudes and perceptions in different stages of change Transp Res Part A Policy Pract 41 302ndash312 httpsdoiorg101016JTRA200609002
Gatersleben B Uzzell D 2007 Affective Appraisals of the Daily Commute Comparing Perceptions of Drivers Cyclists Walkers and Users of Public Transport Environ Behav 39 416ndash431 httpsdoiorg1011770013916506294032
Geng J Long R Chen H 2016 Impact of information intervention on travel mode choice of urban residents with different goal frames A controlled trial in Xuzhou China Transp Res Part A Policy Pract 91 134ndash147 httpsdoiorg101016jtra201606031
Graham-Rowe E Skippon S Gardner B Abraham C 2011 Can we reduce car use and if so how A review of available evidence Transp Res Part A Policy Pract 45 401ndash418 httpsdoiorg101016jtra201102001
Graham DJ 2007 Agglomeration productivity and transport investment J Transp Econ Policy 41 317ndash343
Grigoropoulos G Hosseini SA Keler A Kaths H Spangler M Busch F Bogenberger K 2021 Traffic simulation analysis of bicycle highways in urban areas Sustain 13 1ndash25 httpsdoiorg103390su13031016
Griskevicius V Tybur JM Van den Bergh B 2010 Going Green to Be Seen Status Reputation and Conspicuous Conservation J Pers Soc Psychol 98 392ndash404 httpsdoiorg101037a0017346
Gross R 2010 Psychology The Science of Mind and Behaviour (4th edition) 6th ed Hodder Education Dubai httpsdoiorg101054nedt20020766
Guagnano GA Stern PC Dietz T 1995 Influences on Attitude-Behavior Relationships A Natural Experiment with Curbside Recycling Environ Behav 27 699ndash718 httpsdoiorg1011770013916595275005
Gaumlrling T Axhausen KW 2003 Introduction Habitual travel choice Transportation (Amst) 30 1ndash11 httpsdoiorg101023A1021230223001
92
Gaumlrling T Eek D Loukopoulos P Fujii S Johansson-Stenman O Kitamura R Pendyala R Vilhelmson B 2002 A conceptual analysis of the impact of travel demand management on private car use Transp Policy 9 59ndash70 httpsdoiorg101016S0967-070X(01)00035-X
Goumlssling S 2020 Why cities need to take road space from cars - and how this could be done J Urban Des 25 443ndash448 httpsdoiorg1010801357480920201727318
Goumlssling S 2018 ICT and transport behavior A conceptual review Int J Sustain Transp 12 153ndash164 httpsdoiorg1010801556831820171338318
Goumlssling S 2016 Urban transport justice J Transp Geogr 54 1ndash9 httpsdoiorg101016jjtrangeo201605002
Goumlssling S Choi AS 2015 Transport transitions in Copenhagen Comparing the cost of cars and bicycles Ecol Econ 113 106ndash113 httpsdoiorg101016jecolecon201503006
Goumltschi T de Nazelle A Brand C Gerike R 2017 Towards a Comprehensive Conceptual Framework of Active Travel Behavior a Review and Synthesis of Published Frameworks Curr Environ Heal reports 4 286ndash295 httpsdoiorg101007s40572-017-0149-9
Haley RI Baldinger AL 2000 The ARF Copy Research Validity Project J Advert Res 40 114 LP ndash 135 httpsdoiorg102501JAR-40-6-114-135
Handy SL Xing Y 2011 Factors correlated with bicycle commuting A study in six small US cities Int J Sustain Transp 5 91ndash110 httpsdoiorg10108015568310903514789
Harding C Faghih Imani A Srikukenthiran S Miller EJ Nurul Habib K 2020 Are we there yet Assessing smartphone apps as full-fledged tools for activity-travel surveys Transportation (Amst) httpsdoiorg101007s11116-020-10135-7
Haustein S Hunecke M 2013 Identifying target groups for environmentally sustainable transport assessment of different segmentation approaches Curr Opin Environ Sustain 5 197ndash204 httpsdoiorg101016jcosust201304009
Haustein S Moslashller M 2016 Age and attitude Changes in cycling patterns of different e-bike user segments Int J Sustain Transp 10 836ndash846 httpsdoiorg1010801556831820161162881
Hays RD Liu H Kapteyn A 2015 Use of Internet panels to conduct surveys Behav Res Methods 47 685ndash690 httpsdoiorg103758s13428-015-0617-9
Heinen E Maat K van Wee B 2013 The effect of work-related factors on the bicycle commute mode choice in the Netherlands Transportation (Amst) 40 23ndash43 httpsdoiorg101007s11116-012-9399-4
Heinen E van Wee B Maat K 2010 Commuting by bicycle An overview of the literature Transp Rev 30 59ndash96 httpsdoiorg10108001441640903187001
93
Hensher DA 1994 Stated Preference analysis of Travel Choices The State Of Practice Transportation (Amst) 21 107ndash133 httpsdoiorg1043249780203985359-12
Hino K Taniguchi A Hanazato M Takagi D 2019 Modal shift from cars and promotion of walking by providing pedometers in Yokohama city Japan Int J Environ Res Public Health 16 httpsdoiorg103390ijerph16122144
Hoffmann C Abraham C White MP Ball S Skippon SM 2017 What cognitive mechanisms predict travel mode choice A systematic review with meta-analysis Transp Rev 37 631ndash652 httpsdoiorg1010800144164720171285819
Holgate S 2017 Every breath we take The lifelong impact of air pollution Report of a working party Clin Med (Northfield Il) 17 8ndash12
Hrelja R 2019 Cars Problematisations measures and blind spots in local transport and land use policy Land use policy 87 104014 httpsdoiorg101016jlandusepol201905033
Hsieh H-F Shannon SE 2005 Three Approaches to Qualitative Content Analysis Qual Health Res 15 1277ndash88 httpsdoiorg1011771049732305276687
Hsieh HS 2020 Transport policy evaluation based on elasticity analysis with social interactions Transp Res Part A Policy Pract 139 273ndash296 httpsdoiorg101016jtra202007011
Hunecke M Haustein S Boumlhler S Grischkat S 2010 Attitude-based target groups to reduce the ecological impact of daily mobility behavior Environ Behav 42 3ndash43 httpsdoiorg1011770013916508319587
Hyman MR Sierra JJ 2012 Adjusting Self-Reported Attitudinal Data for Mischievous Respondents Int J Mark Res 54 129ndash145 httpsdoiorg102501ijmr-54-1-129-145
Innocenti A Lattarulo P Pazienza MG 2013 Car stickiness Heuristics and biases in travel choice Transp Policy 25 158ndash168 httpsdoiorg101016jtranpol201211004
Jakobsson C 2004 Motivational and Volitional Control of Private Automobile Use Goumlteborg University httpsdoiorg101017CBO9781107415324004
Javaid A Creutzig F Bamberg S 2020 Determinants of low-carbon transport mode adoption systematic review of reviews Environ Res Lett 15 103002 httpsdoiorg1010881748-9326aba032
Jugert P Greenaway KH Barth M Buumlchner R Eisentraut S Fritsche I 2016 Collective efficacy increases pro-environmental intentions through increasing self-efficacy J Environ Psychol 48 12ndash23 httpsdoiorg101016jjenvp201608003
Jung S Lee S 2011 Exploratory factor analysis for small samples Behav Res Methods 43 701ndash709 httpsdoiorg103758s13428-011-0077-9
Karlsson ICM Mukhtar-Landgren D Smith G Koglin T Kronsell A Lund E Sarasini S Sochor J 2019 Development and implementation of Mobility-as-a-
94
Service ndash A qualitative study of barriers and enabling factors Transp Res Part A Policy Pract httpsdoiorg101016JTRA201909028
Kavvouris C Chrysochou P Thoslashgersen J 2019 ldquoBe Careful What You Sayrdquo The role of psychological reactance on the impact of pro-environmental normative appeals J Bus Res 0ndash1 httpsdoiorg101016jjbusres201910018
Kloumlckner CA 2013 A comprehensive model of the psychology of environmental behaviour A meta-analysis Glob Environ Chang 23 1028ndash1038 httpsdoiorg101016jgloenvcha201305014
Krumpal I 2013 Determinants of social desirability bias in sensitive surveys A literature review Qual Quant 47 2025ndash2047 httpsdoiorg101007s11135-011-9640-9
Kuang Y Yen BTH Suprun E Sahin O 2019 A soft traffic management approach for achieving environmentally sustainable and economically viable outcomes An Australian case study J Environ Manage 237 379ndash386 httpsdoiorg101016jjenvman201902087
Ladbury P 2013 The SEGMENT Toolkit Lambooij MS Harmsen IA Veldwijk J De Melker H Mollema L Van Weert
YWM De Wit GA 2015 Consistency between stated and revealed preferences A discrete choice experiment and a behavioural experiment on vaccination behaviour compared BMC Med Res Methodol 15 1ndash8 httpsdoiorg101186s12874-015-0010-5
Landers RN Behrend TS 2015 An inconvenient truth Arbitrary distinctions between organizational mechanical turk and other convenience samples Ind Organ Psychol 8 142ndash164 httpsdoiorg101017iop201513
Lanzini P Khan SA 2017 Shedding light on the psychological and behavioral determinants of travel mode choice A meta-analysis Transp Res Part F Traffic Psychol Behav 48 13ndash27 httpsdoiorg101016jtrf201704020
Lattarulo P Masucci V Pazienza MG 2018 Resistance to change car use and routines Transp Policy 74 63ndash72 httpsdoiorg101016jtranpol201811013
Levinson D 2002 Identifying winners and losers in transportation Transp Res Rec 179ndash185 httpsdoiorg1031411812-22
Lewin K 1951 Problems of research in social psychologyy In D Cartwright (Ed) Field theory in social science Selected theoretical papers Harper amp Row New York NY
Li Z Wang W Yang C Ragland DR 2013 Bicycle commuting market analysis using attitudinal market segmentation approach Transp Res Part A Policy Pract 47 56ndash68 httpsdoiorg101016jtra201210017
Lieberoth A Holm Jensen N Bredahl T 2018 Selective psychological effects of nudging gamification and rational information in converting commuters from cars to buses A controlled field experiment Transp Res Part F Traffic Psychol Behav 55 246ndash261 httpsdoiorg101016jtrf201802016
95
Litman T 2010 Quantifying the Benefits of Nonmotorized Transportation For Achieving Mobility Management Objectives by Transp Res Rec 134ndash140
Lois D Moriano JA Rondinella G 2015 Cycle commuting intention A model based on theory of planned behaviour and social identity Transp Res Part F Traffic Psychol Behav 32 101ndash113 httpsdoiorg101016jtrf201505003
Lord CG Ross L Lepper MR 1979 Biased assimilation and attitude polarization The effects of prior theories on subsequently considered evidence J Pers Soc Psychol 37 2098ndash2109 httpsdoiorg1010370022-351437112098
Loureiro A Veloso S 2017 Handbook of Environmental Psychology and Quality of Life Research httpsdoiorg101007978-3-319-31416-7
Loureiro ML McCluskey JJ Mittelhammer RC 2003 Are Stated Preferences Good Predictors of Market Behavior Land Econ 79 44ndash45 httpsdoiorg1023073147104
Lucas K Jones P 2009 The Car in British Society RAC Found London MacArthur J Dill J Person M 2014 Electric bikes in North America Results of an
online survey Transp Res Rec 2468 123ndash130 httpsdoiorg1031412468-14 Marshall S Banister D 2000 Travel reduction strategies Intentions and outcomes
Transp Res Part A Policy Pract 34 321ndash338 httpsdoiorg101016S0965-8564(99)00034-8
Matteo Mazziotta AP 2013 Methods for Constructing Composite Indices One for All or All for One Ital Rev Econ Demogr Stat 67 67ndash80 httpsdoiorg101016jtrac201607002
Matyas M Kamargianni M 2019 The potential of mobility as a service bundles as a mobility management tool Transportation (Amst) 46 1951ndash1968 httpsdoiorg101007s11116-018-9913-4
Meyer MD 1999 Demand management as an element of transportation policy Using carrots and sticks to influence travel behavior Transp Res Part A Policy Pract 33 575ndash599 httpsdoiorg101016S0965-8564(99)00008-7
Milfont TL Duckitt J 2010 The environmental attitudes inventory A valid and reliable measure to assess the structure of environmental attitudes J Environ Psychol 30 80ndash94 httpsdoiorg101016jjenvp200909001
Miller GA 1962 Psychology The Science of Mental Life Penguin Harmondsworth Milovanoff A Posen ID MacLean HL 2020 Electrification of light-duty vehicle fleet
alone will not meet mitigation targets Nat Clim Chang httpsdoiorg101038s41558-020-00921-7
Moher D Liberati A Tetzlaff J Altman DG 2009 Preferred reporting items for systematic reviews and meta-analyses the (PRISMA) statement Res methods Report 1ndash8 httpsdoiorg101136bmjb2535
96
Mokhtarian PL Salomon I Redmond LS 2001 Understanding the demand for travel Itrsquos not purely lsquoderivedrsquo Innovation 14 355ndash380 httpsdoiorg10108013511610120106147
Moser C Blumer Y Hille SL 2018 E-bike trialsrsquo potential to promote sustained changes in car owners mobility habits Environ Res Lett 13 httpsdoiorg1010881748-9326aaad73
Mundorf N Redding CA Paiva AL 2018 Sustainable transportation attitudes and health behavior change Evaluation of a brief stage-targeted video intervention Int J Environ Res Public Health 15 httpsdoiorg103390ijerph15010150
Moumlser G Bamberg S 2008 The effectiveness of soft transport policy measures A critical assessment and meta-analysis of empirical evidence J Environ Psychol 28 10ndash26 httpsdoiorg101016jjenvp200709001
Nakashima R Sato T Maruyama T 2017 Gamification Approach to Smartphone-app-based Mobility Management Transp Res Procedia 25 2344ndash2355 httpsdoiorg101016jtrpro201705234
Nieuwenhuijsen MJ 2020 Urban and transport planning pathways to carbon neutral liveable and healthy cities A review of the current evidence Environ Int 140 105661 httpsdoiorg101016jenvint2020105661
Nisbet EKL Gick ML 2008 Can health psychology help the planet Applying theory and models of health behaviour to environmental actions Can Psychol Can httpsdoiorg101037a0013277
Noppers EH Keizer K Bockarjova M Steg L 2015 The adoption of sustainable innovations The role of instrumental environmental and symbolic attributes for earlier and later adopters J Environ Psychol 44 74ndash84 httpsdoiorg101016jjenvp201509002
Nordlund AM Garvill J 2003 Effects of values problem awareness and personal norm on willingness to reduce personal car use J Environ Psychol 23 339ndash347 httpsdoiorg101016S0272-4944(03)00037-9
Norman T Boumlrjesson M Anderstig C 2017 Labour Market Accessibility and Unemployment J Transp Econ Policy 51 47ndash73
Ockwell D Whitmarsh L OrsquoNeill S 2009 Forcing People to be Green or Fostering Grass-Roots Engagement Sci Commun 30 305ndash327 httpsdoiorg1011771075547008328969
Ogilvie D Foster CE Rothnie H Cavill N Hamilton V Fitzsimons CF Mutrie N 2007 Interventions to promote walking systematic review Bmj 334 1204ndash1204 httpsdoiorg101136bmj39198722720BE
Oinas-kukkonen H 2010 Behavior Change Support Systems A Research Model and Agenda in Persuasive Technology 5th International Conference PERSUASIVE 2010 Copenhagen Denmark June 7-10 2010 Proceedings pp 4ndash14 httpsdoiorg101007978-3-642-13226-1
97
Olsson LE Huck J Friman M 2018 Intention for car use reduction Applying a stage-based model Int J Environ Res Public Health 15 httpsdoiorg103390ijerph15020216
Paacuteez A Whalen K 2010 Enjoyment of commute A comparison of different transportation modes Transp Res Part A Policy Pract 44 537ndash549 httpsdoiorg101016jtra201004003
Pangbourne K Bennett S Baker A 2020 Persuasion profiles to promote pedestrianism Effective targeting of active travel messages Travel Behav Soc 20 300ndash312 httpsdoiorg101016jtbs202004004
Pangbourne K Masthoff J 2016 Personalised messaging for voluntary travel behaviour change interactions between segmentation and modal messaging UTSG Bristol pp 1ndash12
Parker J Harris L Chatterjee K Armitage R Cleary J Goodwin P 2007 Making Personal Travel Planning Work Research Report Department for Transport London
Petrunoff N Wen LM Rissel C 2016 Effects of a workplace travel plan intervention encouraging active travel to work outcomes from a three-year time-series study Public Health 135 38ndash47 httpsdoiorg101016jpuhe201602012
Petty RE Cacioppo JT 1986 The Elaboration Likelihood Model of Persuasion Adv Exp Soc Psychol 19 123ndash205 httpsdoiorg101007978-1-4612-4964-1_1
Philips I Anable J Chatterton T 2020 e-bike carbon savings ndash how much and where Oxford httpsdoiorg1013140RG222043171846
Pituch KA Stevens JP 2016 Applied Multivariate Statistics for the Social Sciences Analyses with SAS and IBMlsquos SPSS 6th ed Routledge New York and London
Plazier PA Weitkamp G Berg AEV Den 2018 Exploring the adoption of e-bikes by different user groups Front Built Environ 4 1ndash8 httpsdoiorg103389fbuil201800047
Polk M 2004 The influence of gender on daily car use and on willingness to reduce car use in Sweden J Transp Geogr 12 185ndash195 httpsdoiorg101016jjtrangeo200404002
Polk M 2003 Are women potentially more accommodating than men to a sustainable transportation system in Sweden Transp Res Part D Transp Environ 8 75ndash95 httpsdoiorg101016S1361-9209(02)00034-2
Poortinga W Darnton A 2016 Segmenting for sustainability The development of a sustainability segmentation model from a Welsh sample J Environ Psychol 45 221ndash232 httpsdoiorg101016jjenvp201601009
Prochaska JO Diclemente CC 1986 Toward a Comprehensive Model of Change in Miller WR Heather N (Eds) Treating Addictive Behaviors Processes of Change Springer US Boston MA pp 3ndash27 httpsdoiorg101007978-1-4613-2191-0_1
98
Prochaska JO DiClemente CC 1982 Transtheoretical therapy Toward a more integrative model of change Psychother Theory Res Pract 19 276ndash288 httpsdoiorg101037h0088437
Prochaska JO Redding C Evers K 2008 The transtheoretical model and stage of change In Health behavior and health education in Glanz K Rimer BK Viswanath K (Eds) Theory Research and Practice Jossey-Bass San Fransisco CA USA pp 97ndash117
Pucher J Buehler R 2017 Cycling towards a more sustainable transport future Transp Rev 37 689ndash694 httpsdoiorg1010800144164720171340234
Rabl A de Nazelle A 2012 Benefits of shift from car to active transport Transp Policy 19 121ndash131 httpsdoiorg101016jtranpol201109008
Reese G Junge EA 2017 Keep on Rockinrsquo in a (plastic-)free world Collective efficacy and pro-environmental intentions as a function of task difficulty Sustain 9 httpsdoiorg103390su9020200
Richter J Friman M Gaumlrling T 2011 Soft transport policy measures Gaps in knowledge Int J Sustain Transp 5 199ndash215 httpsdoiorg101080155683182010490289
Richter J Friman M Gaumlrling T 2009 Soft transport policy measures 1 Results of implementation Karlstad Univ Stud 31 1ndash22
Rogers EM 1995 Diffusion of innovations 3rd editio ed Macmillian Publishing Co Collier Macmillian Publishers London httpsdoiorgciteulike-article-id126680
Rondinella G Fernandez-Heredia A Monzoacuten A 2012 Analysis of perceptions of utilitarian cycling by level of user experience in Proceedings of Transport Research Board Annual Meeting Washington DC
Rose G Ampt E 2001 Travel blending An Australian travel awareness initiative Transp Res Part D Transp Environ 6 95ndash110 httpsdoiorg101016S1361-9209(00)00015-8
Rosenfield A Attanucci JP Zhao J 2020 A randomized controlled trial in travel demand management Transportation (Amst) 47 1907ndash1932 httpsdoiorg101007s11116-019-10023-9
Ryberg K 2021 E-mail correspondence about the continous implementation of e-bike trials 2021-03-29
Santos G Behrendt H Teytelboym A 2010 Part II Policy instruments for sustainable road transport Res Transp Econ 28 46ndash91 httpsdoiorg101016jretrec201003002
Sarafino EP 2012 Applied Behavior Analysis Principles and Procedures in Behavior Modification Wiley
Schwartz SH 1977 Normative influences on altruism Adv Exp Soc Psychol 10 221ndash279 httpsdoiorg101016S0065-2601(08)60358-5
99
Seaborn K Fels DI 2015 Gamification in theory and action A survey Int J Hum Comput Stud 74 14ndash31 httpsdoiorg101016jijhcs201409006
Semanjski I Gautama S 2016 Crowdsourcing mobility insights - Reflection of attitude based segments on high resolution mobility behaviour data Transp Res Part C Emerg Technol 71 434ndash446 httpsdoiorg101016jtrc201608016
Semenescu A Gavreliuc A Sacircrbescu P 2020 30 Years of soft interventions to reduce car use ndash A systematic review and meta-analysis Transp Res Part D Transp Environ 85 102397 httpsdoiorg101016jtrd2020102397
Shaw C Hales S Howden-Chapman P Edwards R 2014 Health co-benefits of climate change mitigation policies in the transport sector Nat Clim Chang 4 427ndash433 httpsdoiorg101038nclimate2247
Simon HA 1955 A Behavioral Model of Rational Choice Q J Econ 69 99ndash118 Simsekoglu Ouml Kloumlckner CA 2018 The role of psychological and socio-demographical
factors for electric bike use in Norway Int J Sustain Transp 13 315ndash323 httpsdoiorg1010801556831820181466221
Skarin F Olsson LE Friman M Waumlstlund E 2019 Importance of motives self-efficacy social support and satisfaction with travel for behavior change during travel intervention programs Transp Res Part F Traffic Psychol Behav 62 451ndash458 httpsdoiorg101016jtrf201902002
Smith WR 1956 Product Differentiation and Market Segmentation as Alternative Marketing Strategies Am Mark Assoc 21 3ndash8
Sottile E Giacchetti T Tuveri G Piras F Calli D Concas V Zamberlan L Meloni I Carrese S 2020 An innovative GPS smartphone based strategy for university mobility management A case study at the University of RomaTre Italy Res Transp Econ 85 100926 httpsdoiorg101016jretrec2020100926
Spencer L Pagell F Hallion ME Adams TB 2002 Applying the transtheoretical model to tobacco prevention education in adolescence A literature review Am J Heal Promot 17 7ndash71
Sperling D 2018 Three Revolutions Steering Automated Shared and Electric Vehicles to a Better Future Island Press Washington Covelo London
Stapleton L Sorrell S Schwanen T 2017 Peak car and increasing rebound A closer look at car travel trends in Great Britain Transp Res Part D Transp Environ 53 217ndash233 httpsdoiorg101016jtrd201703025
Steg L 2007 Sustainable Transportation A Psychological Perspective IATSS Res 31 58ndash66 httpsdoiorg101016s0386-1112(14)60223-5
Steg L 2005 Car use Lust and must Instrumental symbolic and affective motives for car use Transp Res Part A Policy Pract 39 147ndash162 httpsdoiorg101016jtra200407001
100
Steg L 2003 Factors Influencing the Acceptability and Effectiveness of Transport Pricing in Schade J Schlag B (Eds) Acceptability of Transport Pricing Strategies Emerald Group Publishing Limited pp 187ndash202 httpsdoiorg1011089781786359506-012
Steg L Geurs K Ras M 2001a The effects of motivational factors on car use A multidisciplinary modelling approach Transp Res Part A Policy Pract 35 789ndash806 httpsdoiorg101016S0965-8564(00)00017-3
Steg L Vlek C 2009 Encouraging pro-environmental behaviour An integrative review and research agenda J Environ Psychol 29 309ndash317 httpsdoiorg101016jjenvp200810004
Steg L Vlek C Slotegraaf G 2001b Instrumental-reasoned and symbolic-affective motives for using a motor car Transp Res Part F Traffic Psychol Behav 4 151ndash169 httpsdoiorg101016S1369-8478(01)00020-1
Stern PC 2000 Toward a Coherent Theory of Environmentally Significant Behavior J Soc Issues 56 407ndash424
Stopher P Clifford E Swann N Zhang Y 2009 Evaluating voluntary travel behaviour change Suggested guidelines and case studies Transp Policy 16 315ndash324 httpsdoiorg101016jtranpol200910007
Stopher P Greaves S Xu M Fitzgerald C Swann N 2006 A Panel Approach to Evaluating TravelSmart Initiatives in the Short Term ndash South Australia Pilot Survey
Stopher PR 2004 Reducing road congestion A reality check Transp Policy 11 117ndash131 httpsdoiorg101016jtranpol200309002
Stradling SG Meadows ML Beatty S 2000 Helping drivers out of their cars integrating transport policy and social psychology for sustainable change Transp Policy 7 207ndash215 httpsdoiorg101016S0967-070X(00)00026-3
Stroumlmberg H Rexfelt O Karlsson ICMA Sochor J 2016 Trying on change - Trialability as a change moderator for sustainable travel behaviour Travel Behav Soc 4 60ndash68 httpsdoiorg101016jtbs201601002
Sussman R Tan LQ Kormos CE 2020 Behavioral interventions for sustainable transportation an overview of programs and guide for practitioners in Transport and Energy Research Elsevier Inc pp 354ndash422 httpsdoiorg101016B978-0-12-815965-100014-4
Swedish Association of Local Authorities and Regions 2016 Classification of Swedish municipalities 2017 URL httpssklsedownload186b78741215a632d39cbcc851487772640274Classification of Swedish Municipalities 2017pdf (accessed 62618)
Swedish National Audit Office 2018 The four-step principle in transport infrastructure planning URL httpswwwriksrevisionensedownload182fb606e41681a5d0f12cf15f1547423999841RiR_2018_30_ENGLISHpdf (accessed 2321)
101
Swedish Transport Administration 2020 Transport sector emissions URL httpswwwtrafikverketseom-ossvar-verksamhetsa-har-jobbar-vi-medMiljo-och-halsaKlimat (accessed 21720)
Swedish Transport Administration 2018 The four-step principle URL httpswwwtrafikverketsefor-dig-i-branschenPlanera-och-utredaPlanerings--och-analysmetoderfyrstegsprincipen (accessed 2521)
Swedish Transport Administration 2014 Strategic Choice of Measures ndash A new step for planning of transportation solutions
Soumlderberg fka Andersson A Adell E Winslott Hiselius L 2021 What is the substitution effect of e-bikes A randomised controlled trial Transp Res Part D Transp Environ 90 httpsdoiorg101016jtrd2020102648
Taylor MAP Ampt ES 2003 Travelling smarter down under Policies for voluntary travel behaviour change in Australia Transp Policy 10 165ndash177 httpsdoiorg101016S0967-070X(03)00018-0
Tertoolen G Van Kreveld D Verstraten B 1998 Psychological resistance against attempts to reduce private car use Transp Res Part A Policy Pract 32 171ndash181 httpsdoiorg101016S0965-8564(97)00006-2
The Behavioural Insights Team Alta Planning + Design 2017 Applying Behavioural Insights to Transportation Demand Management
Thigpen C Fischer J Nelson T Therrien S Fuller D Gauvin L Winters M 2019 Who is ready to bicycle Categorizing and mapping bicyclists with behavior change concepts Transp Policy 82 11ndash17 httpsdoiorg101016jtranpol201907011
Thigpen CG Driller BK Handy SL 2015 Using a stages of change approach to explore opportunities for increasing bicycle commuting Transp Res Part D Transp Environ 39 44ndash55 httpsdoiorg101016jtrd201505005
Thoslashgersen J 2018 Transport-related lifestyle and environmentally-friendly travel mode choices A multi-level approach Transp Res Part A Policy Pract 107 166ndash186 httpsdoiorg101016jtra201711015
Thoslashgersen J 2009 Promoting public transport as a subscription service Effects of a free month travel card Transp Policy 16 335ndash343 httpsdoiorg101016jtranpol200910008
Transport Analysis 2020 Resvanor i Sverige 2019 [Travel habits in Sweden 2019] Van Acker V Van Cauwenberge B Witlox F 2013 MaxSUMO A New Expert
Approach for Evaluating Mobility Managament Projects Promet-Traffic Transp 25 285ndash294 httpsdoiorg107307pttv25i3290
van Lierop D Soemers J Hoeke L Liu G Chen Z Ettema D Kruijf J 2020 Wayfinding for cycle highways Assessing e-bike usersrsquo experiences with wayfinding along a cycle highway in the Netherlands J Transp Geogr 88 httpsdoiorg101016jjtrangeo2020102827
102
van Wee B 2014 Handbook of sustainable travel in The Unsustainability of Car Use In Gaumlrling T Ettema D Friman M (Eds) Handbook of Sustainable Travel Springer Dordrecht pp 1ndash341 httpsdoiorghttpsdoiorg101007978-94-007-7034-8_5
Vela C Ortega C 2020 Adoption of Change A Systematic Review of the Transtheoretical Model Sport Exerc Med Open J 6 27ndash38 httpsdoiorg1017140SEMOJ-6-179
Venkatesh V Morris MG Davis GB Davis FD 2003 User acceptance of information technology toward a unified view MIS Q 27 425ndash478
Walter SL Seibert SE Goering D OrsquoBoyle EH 2019 A Tale of Two Sample Sources Do Results from Online Panel Data and Conventional Data Converge J Bus Psychol 34 425ndash452 httpsdoiorg101007s10869-018-9552-y
Waygood EOD Avineri E 2018 CO2 valence framing Is it really any different from just giving the amounts Transp Res Part D Transp Environ 63 718ndash732 httpsdoiorg101016jtrd201807011
Waygood EOD Avineri E 2016 Communicating transportation carbon dioxide emissions information Does gender impact behavioral response Transp Res Part D Transp Environ 48 187ndash202 httpsdoiorg101016jtrd201608026
Weber J Azad M Riggs W Cherry CR 2018 The convergence of smartphone apps gamification and competition to increase cycling Transp Res Part F Traffic Psychol Behav 56 333ndash343 httpsdoiorg101016jtrf201804025
West R 2005 Time for a change Putting the Transtheoretical (Stages of Change) Model to rest Addiction 100 1036ndash1039 httpsdoiorg101111j1360-0443200501139x
Whillans A Sherlock J OrsquoFlaherty S Roberts J Daly M 2020 Nudging the Commute Using Behaviorally-Informed Interventions to Promote Sustainable Transportation in US Cities
Winslott Hiselius L Smidfelt Rosqvist L 2018 Segmentation of the current levels of passenger mileage by car in the light of sustainability targets ndash The Swedish case J Clean Prod 182 331ndash337 httpsdoiorg101016jjclepro201802072
Winslott Hiselius L Smidfelt Rosqvist L 2015 Mobility Management campaigns as part of the transition towards changing social norms on sustainable travel behavior J Clean Prod 123 1ndash8 httpsdoiorg101016jjclepro201508055
Winters PL 1998 Transportation demand management APA Plan Advis Serv Reports
Wolf A Seebauer S 2014 Technology adoption of electric bicycles A survey among early adopters Transp Res Part A 69 196ndash211 httpsdoiorg101016jtra201408007
Wolf I Schroumlder T 2019 Connotative meanings of sustainable mobility A segmentation approach using cultural sentiments Transp Res Part A Policy Pract 126 259ndash280 httpsdoiorg101016jtra201906002
World Commission on Environment and Development 1987 Our common future Oxford University Press Oxford UK httpsdoiorg10108007488008808408783
103
Yang L Sahlqvist S McMinn A Griffin SJ Ogilvie D 2010 Interventions to promote cycling systematic review Bmj 341 c5293ndashc5293 httpsdoiorg101136bmjc5293
104
Acknowledgement
A huge thank you to my supervisors Lena and Emeli who have been involved from the beginning to the end of my doctoral studies Your commitment thoughts and support have been invaluable throughout the process especially during the final stretch
Thank you to all my former and current colleagues at Transport and Roads Especially Helena Vilhelmsson for always making sure that major sports events are broadcasted in the fika-room Mia Thomas Astrid and Petra for making things work at the division Maya for the great cakes Andreas for all attempts (successful and unsuccessful) to initiate various workouts and for inviting me to play football in Linero My fellow PhD students for an inspiring companionship Thank you Emma for assisting me at my final seminar (and for being my supervisor at WSP)
Thank you to the folks at K2 for contributing to the welcoming and stimulating research environment Thank you John Ellen and Maria who took me onboard already in my masters in 2016 That internship really spurred my interest in transportation research I am grateful to have been affiliated with K2 during my PhD education and for taking part in the doctoral student programme (thank you Helena Svensson for pulling the strings) To the K2 PhD students I have gotten to know (former and current) thank you all for the fruitful conversations Thank you to Claus for teaching me danish
Thank you to Louise and Sonja for your helpful comments at my final seminar And the team ldquoHaringllbart resande vaumlstrdquo at Vaumlsttrafik for a smooth collaboration in conducting the e-bike trial and for showing real perseverance in acquiring e-bikes Thank you - outstanding fieldwork
Thank you Anders Soumlderberg for introducing me to soft transport measures
To my fellow crusaders at the Swedish Association of Green Motorists thank you for your wholehearted dedication and gumption Being part of this organisation has given me experience for life An extra thank you Per for countless much appreciated discussions (and pints) over the years
Karin Brundell-Freij thank you for mentoring me and for being so generous with advice when I have found myself at a crossroad And for always taking your time (even if it is just on a five-minute train ride) to provide me with the opportunity to step into a new perspective (giving me lsquotankespjaumlrnrsquo)
105
To my dear friends Adam Daniel Lior and Jesper Thank you for your cheerfulness and for always giving me a friendly tough time when we meet Thank you Miroslav Seb and Dominic for our great hiking adventures (and Miro again for commenting on one of my draft papers)
To my parents Monica and Tomas thank you for your unconditional love and support and for making the cover of this thesis awesome To my sisters Josefine and Lovisa for constantly paving the way for their little brother and for being so inspirational thank you Thank you Rolle for being a great pal To my in-laws thank you all for being an important part of my family
To my beautiful wife Elin thank you for bearing with me during the last couple of months when I finalised the thesis Your love happiness and sincerity make my life wonderful and I cannot wait for writing the next chapter of our life together with you as parents
To the people that I have not mentioned here and who supported me in this endeavour ndash thank you
Alfred Soumlderberg
15 April 2021
106
Appendix A Questionnaire items
Paper III
Table 16 The survey questions used in Paper III for segmentation according to the SEGMENT model
Question Scale Q1 Have you driven a car or van in the past 12 months yes no If Q1 = yes Q2 For most journeys I would rather use the car than any other form of transport
strongly disagree disagree neithernor agree strongly agree Q3 I like to drive just for the fun of it
Q4 I am not interested in reducing my car use Q5 Driving gives me a way to express myself If Q1 = no Q6 How likely are you to drive in the next 12 months very unlikely quite unlikely
neithernor fairly likely very likely
All Q7 I am not the kind of person who rides a bicycle strongly disagree disagree
neithernor agree strongly agree
Q8 I feel I should cycle more to keep fit Q9 I find cycling stressful Q10 Cycling can be the quickest way to travel around Q11 I like travelling by bicycle Q12 I am not the kind of person that likes to walk a lot Q13 I feel I should walk more to keep fit Q14 I like travelling by walking Q15 I am not the kind of person to use the bus Q16 In general I would rather cycle than use the bus Q17 I feel a moral obligation to reduce my emissions of greenhouse gases Q18 People should be allowed to use their cars as much as they like
Note The survey also included the marketing messages statements TTM statements and demographic questions concerning age gender education occupation residential location relationship status and children living at home
107
Paper IV
Table 17 The items used in Paper IV for the regression modelling and the TTM statements used for behaviour change stage allocation
Questionstatement Variable name Scale Do you have a driving license Driving license yes no Do you have access to at least one bicycle or e-bike
Access to a bicycle yes no
Do you live within 500 m of a public transport station
Live within 500 m of PT-station
yes no
Do you own or have access to a car for commuting
Access to a car yes no
What mode of transport do you usually use to go to schoolwork
Usual commute mode car public transport bicycle walk other
How long is your travel time from home to schoolwork
Travel time less than 10 min 10-20 min 21-30 min 31-45 min 46-60 min more than 60 min
What statement best describes how you travel in everyday life
TTM lsquoI use the car for the most part and do not intend to change the mode of transport within the next six monthsrsquo lsquoI am using the car for the most part but I am considering replacing some car journeys with other modes within the next six monthsrsquo lsquoI am using the car for the most part but have begun trying other modes instead over the last six monthsrsquo lsquoFor the past six months I have only used the car as a complement to other means of transportrsquo lsquoFor the past six months I have only used modes other than carsrsquo
I am the kind of person who rides a bicycle Identify as cyclist strongly disagree disagree neithernor agree strongly agree
I feel I should cycle more to stay fit Concerned about health Cycling can be the quickest way to get around
Perceive cycling as fast
I like riding a bicycle Like cycling Driving a car is part of my identity Identify as a driver I am the kind of person who uses public transport
Identify with a PT
I feel a moral obligation to reduce my greenhouse gas emissions
Climate morality
People should be allowed to use their cars as much as they like
Advocate private car use
Appendix B Papers
Paper I
Contents lists available at ScienceDirect
Travel Behaviour and Society
journal homepage wwwelseviercomlocatetbs
Promoting sustainable travel behaviour through the use of smartphoneapplications A review and development of a conceptual model
Alfred Anderssona Lena Winslott Hiseliusa Emeli Adellb
a Lund University Department of Technology and Society PO Box 118 SE-221 00 Lund Swedenb Trivector Traffic Åldermansgatan 13 SE-222764 Lund Sweden
A R T I C L E I N F O
KeywordsTravel behaviourICTSmartphone applicationsBehaviour changeSustainable mobility
A B S T R A C T
The negative effects of transport in terms of pollution congestion and climate change has urged the need forhigher shares of cleaner and more efficient modes of transport especially in urban settings While new tech-nology can solve some of these issues behaviour changes has also been identified as an important factor toachieve a modal shift from cars to walking cycling or public transport This study investigates how ICT has beenused to influence behaviour change and synthesizes key aspects into a conceptual model for creating a behaviourchange support system (BCSS) for smartphone applications A literature review concerning behaviour changeand ICT in the fields of transport health energy and climate was conducted to gather empirical evidence whichforms the foundation of the conceptual model The empirical findings were tested and verified against a theo-retical framework consisted of The Transtheoretical Model Theory of Planned Behaviour Diffusion ofInnovations and the concept of Gamification The results suggest that customization to the user relevant andcontextualised information and feedback commitment and appealing design are important aspects when in-fluencing users to behaviour change through smartphone applications The conceptual model provides furtherknowledge of key aspects to consider when developing persuasive tools that aims to encourage more sustainablemodes of transport
1 Introduction
The global transport sector accounts for 23 percent of CO emissionsfrom fossil fuels and is the sector that contributes most to globalwarming after electricity and heat production (IEA 2016) Whilemeasures such as energy efficiency higher incorporation of renewablesin the fuel mix and increased production of renewable energy have ledto a slower rate of growth of electricity and heat generation emissionsmeasures to reduce CO emissions from the transport sector have notbeen as effective Since 1990 global emissions from transport haveincreased by 71 percent (IEA 2016)
For Sweden conversion to a low-carbon energy system has acceleratedfaster in relation to the rest of the world thanks to good resources in waterand nuclear power as well as the introduction of district heating instead ofoil-based heating to housing The industry mainly uses biofuels and elec-tricity however energy use in transport is still dominated by petroleumand aviation fuel products (Sweden Energy Agency 2015) Of Swedenstotal emissions transport constitutes one third of which road traffic ac-counts for 93 per cent (Sweden Energy Agency 2015 EnvironmentalProtection Agency 2016)
At the beginning of 2017 the government presented a proposal for anew climate law aiming to reduce emissions by 85 percent by 2045 inSweden compared with 1990 levels They also proposed to set a targetthat emissions from domestic traffic should have decreased by 70 per-cent by 2030 compared to 2010 levels (Government Offices of Sweden2017)
Research has shown that technology innovation and economicfactors alone will not suffice to achieve the climate and environmentalobjectives set for the transport sector (Nilsson et al 2013) Sustainabledevelopment also requires changes in our behaviour and a developmentin which car travel decreases (Hiselius and Rosqvist 2016) Accordingto Anable et al (2006) there is often a gap between individuals con-cerns of climate change and the actual travel behaviour that is per-formed It does not therefore need to be inadequate knowledge ofclimate change which is the main problem but rather how it is trans-lated into practice when choosing modes of transport
To deal with the inefficient use of transport capacity TransportDemand Management (TDM) emerged as a concept for restricting ac-cess for car traffic and reallocating space in favour for walking cyclingand public transport (Banister 2011) From this a similar approach
httpsdoiorg101016jtbs201712008Received 19 October 2017 Received in revised form 18 December 2017 Accepted 29 December 2017
Corresponding authorE-mail address alfredanderssontftlthse (A Andersson)
referred to as Mobility Management (MM) has become an increasinglycommon tool especially in Europe in the past 20 years to achievedifferent transport goals (Litman 2010) It is a concept for encouragingsustainable transport and managing the demand for car journeys bychanging travellersrsquo attitudes and behaviours (Van Acker VanCauwenberge and Witlox 2013) Mobility Management is often re-ferred to as soft actions as the concept rarely includes however com-plements infrastructure solutions and thus focusing on informationcampaigns price mechanisms and policies (Litman 2010)
As digitization begins to influence more community functions newopportunities emerges for what information and communication tech-nology (ICT) can be used for A relatively new area is the use ofsmartphones as a platform for performing Mobility Management ac-tions and influence travel behaviours (Semanjski et al 2016) Anumber of studies have investigated ICT and collection of travel data(Wells et al 2014 Gerike et al 2016 Semanjski and Gautama 2016)and some have also evaluated its potential for behaviour change and atool for promoting sustainable modes of transport (Parvaneh et al2014 Poslad et al 2015 Castellanos 2016)
Earlier research on Mobility Management often includes beha-vioural and attitudinal theories (see for example Anable et al 2006) toanswer questions related to the attitude-behaviour gap where con-sumers express concerns about environmental issues but fail to translatethis into sustainable actions (Anable et al 2006) A range of differenttechniques to induce voluntary travel behaviour change has also beendeveloped over the years such as personalized travel plans (PTP) in-dividualized marketing schemes and organisational travel plans tomention a few (see Cairns et al (2008) for an ample review) While theintentions for this study is similar to those investigating how to opti-mize Mobility Management campaigns it also aims to expand theknowledge on how to further influence mobility behaviour throughsmartphone applications with support in theory This could be de-scribed as an integrated four-step procedure which includes adoptingshaping changing and keeping sustainable travel behaviours with as-sistance of app-technology This approach offers new possibilities aswell as new challenges By combining behavioural change techniques(BCTs) (Abraham and Michie 2008) and ICT research can start ex-perimenting with the opportunities to gamify data and visualize mes-sages differently to appeal to the user However fundamental butequally important challenges exists such as getting the targeted popu-lation to actually use the application in question This extended ap-proach demands for a wider scope of theories to be used certainlybehavioural change theories but also theories linked to gaming andadoption of new technologies
In a recent review of persuasive technologies to promote sustainablemobility also called behaviour change support systems (BCSS) (Oinas-kukkonen 2010) Sunio and Schmoumlcker (2017) concludes that too littleeffort is given on grounding BCSSs in explicit behavioural changetheory Developing a successful BCSS depends not only on the creativeand appropriate implementation of the behaviour change techniquesbut also on explicitly grounding it on established theoretical constructsfrom behavioural theories (Arnott et al 2014) Support for this sug-gestion can also be found in a significant meta-analysis by (Webb et al2010) who argues that a thoroughly rooted BCSS in theoretical foun-dation is positively correlated with its effectiveness The potential forsmartphone applications as carriers of behaviour change messagesshould we argue not be stalled by ignoring the underlying mechanismsof behaviour change developed from theory
To the best of our knowledge so far the only BCSS grounded inbehavioural theory is one called Quantified Traveller (Jariyasunantet al 2015) which is based on Theory of Planned Behaviour (Ajzen1991) Although highly influential in the field of travel behaviour TPBhas been criticized for disregarding the time dimension of behaviourchange which is the mere foundation of other behaviour change the-ories like The Transtheoretical Model (Prochaska and DiClemente1982) In TTM change is defined as an incremental gradual and
dynamic process involving progress through a series of stages It hasbeen argued that a combination of continuous models and stagemodels such as TPB and TTM can help to explain the process of be-haviour change (Forward 2014) For this purpose we used a theore-tical framework consisting of both Theory of Planned Behaviour andThe Transtheoretical Model but also Diffusion of Innovations (Rogers1995) and the concept of Gamification (Deterding et al 2011) to re-view the content of previous research on behaviour change and ICT anddraw conclusions about best practices for developing a BCSS
There are currently expectations that ICT could be a useful tool forinfluencing travel behaviours (Brazil and Caulfield 2013) and earlierresearch has asserted future platforms for persuasion and behaviourchange to be mobile (Fogg and Eckles 2007) However there is a lackof research exploring these new platforms for behaviour change in thelight of actual behaviour change theory as pointed out by Klein et al(2014) as well as Sunio and Schmoumlcker (2017) It is this knowledge gapin the research that this study seeks to investigate The authors of thisstudy has conducted a review of previous research on behaviour changeand ICT Apart from providing an overview of one particular field therationale for writing a literature review paper is also to add value (Weeand Banister 2016) which in this study is performed through applyingtheories on research findings as well as synthesize the results into aconceptual model
11 Purpose and research questions
The purpose of the study is to investigate how behavioural changetechniques can be implemented in smartphone applications to en-courage sustainable travel behaviours This by (1) examine conclusionsfrom previous research in which the combination of behavioural changetechniques and ICT has been studied in the field of transport as well asin other areas and (2) using a theoretical framework consisting of TheTranstheoretical Model the Theory of Planned Behaviour Diffusion ofInnovations as well as the concept of Gamification to analyse empiricalfindings and thus increase the knowledge of how behaviour changesupport system (BCSS) could be improved
The aim is to provide knowledge of key aspects to consider whencombining behaviour change techniques with ICT and to develop aconceptual model that highlights these aspects grounded in previousresearch and theory
2 Theory
To analyse the results extracted from the literature review we ap-plied the theoretical framework on the stages of adopting shapingchanging and keeping sustainable travel behaviours with the use ofsmartphone applications We made the assumption that these fourstages are vital to consider when developing a BCSS from adopting thetool to recognizing the new behaviour as a habit Although this divisionmakes for better theoretical overview in reality we consider them verymuch integrated both in practice and in theory However as a theo-retical overview our approach can be described as in Fig 1 By takingthis approach we seek to get a holistic theoretical perspective on de-veloping a BCSS as requested in previous research (Klein et al 2014Sunio and Schmoumlcker 2017) With ldquoAdoptingrdquo we refer to the crucialprocess in which the user utilize the smartphone application and engagewith its content Although many people today interact with smart-phones (in Sweden 81 percent have access to a smartphone and 65percent use it daily) there is still a large proportion especially amongelderly who struggle with adopting the new technology (Findahl andDavidsson 2016) We acknowledge this limitation for the generaladoption of a BCSS There is however a strong increase in smartphoneownership worldwide (Pew Research Center 2016) ldquoShapingrdquo is wherethe application should inspire the user to contemplate about herhiscurrent attitudes towards mobility and consider how their personalmobility could be more sustainable ldquoChangingrdquo is the process in which
A Andersson et al
the BCSS ought to guide the user towards accomplishing herhis goalsand thus making the necessary changes to succeed ldquoKeepingrdquo is thefinal step in which the user might need sustained motivation in order toimplement the new behaviour as a habit
Diffusion of Innovations (Rogers 1995) is a theory that seeks toexplain how innovations are spread within group of societies Ac-cording to the theory innovation could be a behaviour technologyservice structure system an object or idea that is considered by societyto be new Diffusion is the process where innovations is communicatedvia different channels over time among members of a social system(Rogers 1995) The theory is particularly valuable in gaining insights inwhat qualities makes innovations spread the importance of socialnetworks that spread the word about innovations as well as the sig-nificance of identifying different user segments and their needs
Theory of Planned Behaviour (TPB) (Ajzen 1991) is a theory whosepurpose is to explain human behaviour The theory assumes that atti-tudes towards a certain behaviour subjective norms and perceivedbehavioural control together form an individuals intentions and be-haviours (ibid) It has been used in a variety of studies to explain andpredict behaviour in fields such as sociology psychology environmentand health (Anable et al 2006) TPB is the most common and influ-ential theory used to explore the attitude-behaviour gap (Armitage andConner 2001) TPB has also established itself in research on travelbehaviours in order to increase the knowledge of how sustainablemodal shares can increase through changing behaviours of travellers(Bamberg et al 2003 Jariyasunant et al 2012 Semanjski andGautama 2016 Semanjski et al 2016) Semanjski and Gautama(2016) has identified TPB as well-established in research related toMobility Management which further motivates for its use as part of aframework to analyse how individuals can be encouraged to moresustainable travel behaviours
The Transtheoretical Model (TTM) (Prochaska and DiClemente1982) is a theory that seeks to explain the process of behaviour changeIt considers behaviour change to be a dynamic process rather than anisolated event and consists of several steps TTM has been used pri-marily to explain health-related behaviour changes but in recent yearsalso to understand travellers modal choice (Forward 2014) Bamberg(2007) for example used TTM to try to describe the decision-makingprocess for motorists who switched to public transport The resultshowed that the expected consequences of the changed travel patternwere perceived as more positive further along the behaviour changeprocess
Gamification is the use of game elementsgame mechanisms in ac-tivities that are traditionally unrelated to gaming to enhance the userexperience of a particular activity (Deterding et al 2011) In recentyears the concept has been applied in a number of areas for the purposeof influencing behaviours and increasing the motivational power of theuser but without much consensus on how the concept should be
formulated and what the actual benefits are (Seaborn and Fels 2015)This is also true in the transport sector where there are a number ofexamples of scientific studies where attempts have been made tochange travel habits using gamification (Castellanos 2016) The con-cept is interesting for this study since it brings new perspectives onmotivational trigger points which indeed could be combined with datacollected via smartphone applications
3 Method
31 Literature review
A literature search was being conducted on electronic sources inmultiple data bases The review followed PRISMA guidelines (Moheret al 2009) for literature reviews by including the four phases of thePRISMA flow diagram Identification screening eligibility and in-cluded papers evaluation To obtain multiple perspectives the searchincluded other fields apart from transport where behaviour changetechniques were combined with ICT Since smartphones today are themost widely used digital tool for travellers to access travel information(Poslad et al 2015 Klecha and Gianni 2018) it made sense to con-struct keywords that would allow research about application-based ICTfor smartphones The keywords consisted of constructs with differentcombinations of the terms ldquotraveltransportationmobility behaviourrdquoldquobehaviour changerdquo ldquosmartphoneapplicationrdquo ldquomobile devicerdquo andldquopersuasive technologyrdquo The timeframe was set for 2008ndash2017
The search were performed in February 2017 and then repeated inSeptember to ensure we covered recent research findings before makingfinal conclusions (see the flow diagram in Fig 2 for details) The ma-jority were scientific articles and a small number consisted of con-ference material and dissertations Three criteria determined whetherthe literature could be considered relevant to the study or not To beincluded in the study it was required that the material fulfilled thefollowing (a) it must be peer-reviewed (b) focused on some form ofbehaviour change and (c) investigated the use of apps smartphones orother types of ICT relevant to the study After fulfilling the search asnowball review was conducted where references from the articles inthe literature search were screened for additional eligible papers Afterreconciliation with the above criteria a total of 32 articles were in-cluded in the review to be analysed
32 Data extraction process using content analysis
The articles were independently examined for information thatprovided knowledge of behaviour change with the help of ICT-appli-ances This was made through a content analysis which means ana-lysing data without preconceived categories to allow new insights toemerge (Hsieh and Shannon 2005) The content was carefully analysed
Fig 1 Theoretical overview of framework application on four integrated stages of behavioural change with the use of a BCSS
A Andersson et al
to identify key concepts and findings that later could be sorted intocategories also described as inductive category development (Potterand Levine-Donnerstein 1999) When performing the inductive cate-gory development three researchers took part in a workshop to discusspossible categories and which to go further with The content analysiswas however performed by one independent researcher and herein liespotential bias The categories were tested against the theoretical fra-mework to evaluate if the findings from earlier research correspondwith relevant theories or not From this outcome a conceptual modelwas constructed based on empirical evidence and the theoretical fra-mework
4 Literature review
Research on ICT and behavioural change has been conducted inseveral fields of which four were investigated in this study The ma-jority (2732) of the articles concerns transport and mobility or healthand fitness while three items are energy-related and two address en-vironmental and climate issues (see Table 1) This means that the fol-lowing analysis will be strongly characterized by the two first men-tioned fields which however is of less concern since it is the synthesisof the result that is interesting and not necessarily what the parts sayseparately Less than half of the reviewed articles used any kind oftheory or concept which suggests a gap between theory and empiricismwhere empirical research lacks reference to theory and where theory isnot sufficiently rooted in empirical research which is also recognised inearlier research (Klein et al 2014 Sunio and Schmoumlcker 2017) Thetheories mentioned however are the Theory of Planned Behaviour(Martiskainen and Coburn 2011 Jariyasunant et al 2015 Semanjskiand Gautama 2016 Semanjski et al 2016 Pronello et al 2017)Random Utility Theory (Brazil and Caulfield 2013) Rational ChoiceTheory (Martiskainen and Coburn 2011) Information-Motivation-Be-havioural Skills model (Aliabadi et al 2016) Gamification (Wellset al 2014 Poslad et al 2015 Castellanos 2016 Coombes and Jones2016) and Nudging as well as Behavioural Economics theory (Gillilandet al 2015)
5 Analysis
51 Findings related to the theoretical framework
From the literature review 26 findings were identified which con-cerns different aspects of BCSSs (see Table 2) Upon review of thesefour distinctive categories were identified namely (1) customization tothe user (2) information and feedback (3) commitment and (4) ap-pealing design The findings were sorted into these four categories andthen analysed based on the theoretical framework of the study
511 Customization to the userA recurring observation from the articles is the importance of
adapting ICT and behavioural change to the user and its needs ratherthan a standard format of one size fits all (ex Anagnostopoulou et al2016 Poslad et al 2015 Tang et al 2015 Coşkun and Erbuğ 2014Gilliland et al 2015 Kraft and Yardley 2009 Dennison et al 2013Anda and Temmen 2014) Several studies also pointed to the need tocontextualize the content and thus make it more relevant to the user(Hargreavesn et al 2010 Coşkun and Erbuğ 2014 Poslad et al 2015Aliabadi et al 2016 Anagnostopoulou et al 2016) TPB assumes thatindividualsrsquo behaviour is influenced by habits but governed by logicalreasoning According to the theory better information should thereforebenefit the individual and strengthen confidence in the innovation atquestion
According to Diffusion of Innovations it is the product that needs tobe adjusted to the individual instead of the opposite Rogers (1995)identified five key criteria that determine between 49 and 87 percentthe acceptance of an innovation namely its relative advantage oversimilar products how well it complies with prevailing norms and va-lues ease of use and simplicity if a trial period is offered and if theresults can be observed by the user Rogers (1995) further stated thatone needs to understand the needs of the user and adjust innovations tomatch the requirements of the segment (innovators early adoptersearly majority late majority laggards)
Both the reviewed articles and the above-mentioned theories sup-port the findings that focus on adjusting content to the user and can
Studies identified through databases
(n=2106)
Studies included after duplicates removed (n=1667)
Studies excluded based on titles and abstracts
(n=1622)
Full-text articles assessed for eligibility (n=45)
Full-text articles excluded with reasons
(n=13)
1 Limited to collection oftravel data
2 No link to attitudes orbehaviourStudies included in the review
(n=32)
Iden
tific
atio
n Sc
reen
ing
Elig
ibilit
y In
clud
ed
Additional studies identified through ldquosnowball reviewrdquo
(n=11)
Titles and abstracts screened (n=1667)
Studies excluded after duplicates removed
(n=450)
Fig 2 Study inclusion flow diagram
A Andersson et al
thus be seen as an important component in the development of a BCSSIndividual alignment is in line with TTM which divides the five-stagetransition process (pre-contemplation contemplation preparation ac-tion maintenance) to determine at which stage of the process in-dividuals are The eight attitude profiles (Semanjski et al 2016) usessimilar approach as they segment the users according to their attitudetowards sustainable travel modes In this manner information feed-back and incentives can be adjusted depending on whether the user is inan early or late stage of the behaviour change process
According to TPB it is possible to influence the intentions of in-dividuals by influencing and drastically changing the prerequisites forone or more of the three components the individuals attitude andvalues towards the behaviour the social norm in relation to the beha-viour and experienced control of performing the action (Bamberg et al2003) By contextualizing and customizing content in for example anapplication for smartphones the perceived control should increase asthe individual will be equipped with more relevant information
Table 1Compilation of empirical material by theme source and purpose
Theme Source Purpose
Energy Anda amp Temmen (2014) Provide examples of how smart energy meters along with community engagement can reduce energy consumptionin households
Hargreavesn et al (2010) Qualitative field study on how individuals interact with smart energy meters and how it can affect the behaviour ofconsuming less energy
Martiskainen amp Coburn (2011) Identifying which factors contribute most to energy-efficient household use using smart energy metersHealth and fitness Aliabadi et al (2016) Identify desirable features for an application that prevents HIV in men Focus groups with 33 participants
Baranowski amp Frankel (2012) Describe different forms of ICT for behavioural change and its strengths and weaknesses to affect children to morehealthy behaviour
Chaplais et al (2015) Systematic literature review on the effects of smartphone usage as a tool for treating obesity among childrenChen et al (2015) Evaluate the quality of the most popular health applications and quantify the techniques used to encourage
behaviour changeCoombes and Jones (2016) Aims to get children more active by encouraging them to walk and cycle in their neighbourhood using tracking
technology with a reward scheme Evaluates the impact of the ldquoBeat the Street-schemerdquo on active travel to school inNorwich UK
Dennison et al (2013) Explore young adults (n= 19) perspective on health and behavioural applications to find out what motivates themto use such applications Focus groups and qualitative interviews
DiFilippo et al (2015) Systematic literature review to study the nutritional applications ability to improve adult knowledge and behaviourabout diet and nutrition
Fanning et al (2012) Perform a meta-analysis of research that examined ICT to encourage physical activity evaluate its effectiveness andprovide suggestions on how future implementation should be designed
Gilliland et al (2015) Investigate the effects of ldquoSmartAPPetiterdquo an application designed to encourage healthy and locally produced foodKraft amp Yardley (2009) Compile knowledge and suggest future studies on ICT as a tool for changing health-related behaviourMcKay et al (2016) Systematic literature review on research that examines the impact of health applications on behaviour to identify
best practiceTang et al (2015) Investigate young peoples experiences and values of using internet and application-based health information as
well as what they value in the contextClimate and environment Coşkun amp Erbuğ (2014) Investigate which app features are important to successfully encourage and long-term sustainable choices based on
17 users recommendations of four different applicationsSullivan et al (2016) Quality assessment of existing travel and dietary apps capable of calculating CO2 emissions and health effects to
influence behaviour changeTransport and mobility Anagnostopoulou et al (2016) A review of existing approaches and prototype systems which describes and classifies the persuasive strategies used
for changing behaviour in the domain of transport Also examines the results and recommendations derived frompilot studies
Berger amp Platzer (2015) Evaluate ldquoSmartMordquo as a tool for collecting travel behaviour data and gain insights on their attitudes towards theapplication 97 participants in the study
Bothos et al (2014) Focus on persuasive strategies supported by a choice architecture approach and incorporated in a smartphoneapplication aiming at providing urban travellers with a solution that will influence them to consider sustainableoptions
Brazil amp Caulfield (2013) Investigate the impact of travel and CO2 calculators on users travel behaviourBresciani et al (2016) Presented the projects ldquoOpti-LOGrdquo and ldquoSharing Citiesrdquo which are joint-venture collaborative projects to initiate
more sustainable mobility and energy-saving society through behavioural change The project includes public andprivate actors as well as community citizens
Castellanos (2016) Study the effects of financial incentives via mobile phones to encourage more sustainable travel 20 participants inthe study for two weeks
Jariyasunant et al (2015) Describe the development application and analysis of a computational travel feedback system called QuantifiedTraveller (QT)
Klecha and Gianni (2018) A review of 14 different applications with focus on utilised technology behaviour change strategies and citizenparticipation in the development process
Parvaneh et al (2014) Study the effects of personal travel information taking into consideration personal preferences Comparativedescriptive and normative travel information
Poslad et al (2015) Study the impact on the behaviour of various travel incentives through the use of Tripzoom in the European cities ofEnschede Gothenburg and Leeds for six months
Pronello et al (2017) Assessing the effects on travel behaviour of a multimodal real-time information navigator for smartphonedeveloped within the project OptimodrsquoLyon
Semanjski et al (2016) Examine the potential of smartphones as tools to deliver incentives to achieve a more sustainable travel behavioursas well as identify different attitude profiles 3400 participants over six months
Semanjski amp Gautama (2016) To bridge psychology marketing and ICT in transport research and evaluate the automatic segmentation of theeight attitude profiles within SEGMENT
Sunio and Schmoumlcker (2017) Review of existing behaviour change support systems (BCSS) designed to promote sustainable travel behaviourExtracts the persuasive features and evaluate their persuasive potential by using the persuasive systems design(PSD) model that has been used to evaluate BCSSs in the health domain
Wells et al (2014) To develop a platform that using gamification encourage users to reflect on their travel behaviours
A Andersson et al
512 Information and feedbackInformation and feedback emerged as an important category for
encouraging individuals to perform the desired behaviour (Kraft andYardley 2009 Hargreavesn et al 2010 Dennison et al 2013 Andaand Temmen 2014 Coşkun and Erbuğ 2014 Gilliland et al 2015Poslad et al 2015 Tang et al 2015 Aliabadi et al 2016) Most im-portantly credible information and data were considered important aswell as the ability to measure their performance and get feedback onones behaviour in relation to individualized goals Incentivesrewards
may be necessary for individuals to switch to more sustainable means oftravel (Poslad et al 2015) but can also be counterproductive if theyare perceived as unnecessary or irrelevant (Coşkun and Erbuğ 2014)
According to TTM individuals who undergo the behavioural changestages continuously assess the balance between the pros and cons of thechanged behaviour (decisional balance) (Prochaska and DiClemente1982) Information and feedback can therefore be used to clarify thebenefits of the change and counter-argue the disadvantages This bal-ance is different through the change process for example the cons of
Table 2Categorization of findings from the literature review
Category Findings Source
Customization to theuser
1 Applications should customize information goals and challenges (Kraft and Yardley 2009 Dennison et al 2013 Anda and Temmen 2014Coşkun and Erbuğ 2014 Gilliland et al 2015 Poslad et al 2015 Tanget al 2015 Anagnostopoulou et al 2016)
2 Use of attitude profiles increases knowledge about which segments aremore willing to change travel behaviour
(Anagnostopoulou et al 2016 Semanjski and Gautama 2016 Semanjskiet al 2016)
3 Contextualization is important to the user (Hargreavesn et al 2010 Coşkun and Erbuğ 2014 Poslad et al 2015Aliabadi et al 2016 Anagnostopoulou et al 2016)
4 The focus should be on the whole household rather than just theindividual
(Hargreavesn et al 2010 Anda and Temmen 2014)
5 Perceived control is an important factor in the choice of performing acertain behaviour
(Coşkun and Erbuğ 2014)
6 Participatory design methods in which end-users actively participate inthe stages of design and development of BCSS is unusual but couldincrease acceptance and usefulness of the application
(Klecha and Gianni 2018)
Information andfeedback
7 It is unclear whether normative information is better than descriptive intrying to influence behaviour change
(Parvaneh et al 2014)
8 Reflective learning could be an alternative approach to persuasion (Bothos et al 2014 Klecha and Gianni 2018)9 Credible information and data is important to the user (Hargreavesn et al 2010 Dennison et al 2013 Anda and Temmen 2014
Coşkun and Erbuğ 2014 Gilliland et al 2015 Tang et al 2015 Aliabadiet al 2016 Anagnostopoulou et al 2016)
10 Measurement and overview of behaviour is important to the user (Martiskainen and Coburn 2011 Dennison et al 2013 Gilliland et al2015 Tang et al 2015)
11 Mobility is very habitual and information can play a role in shiftingmodes only if it becomes meaningful enough to give users significantreasons to break their routine changing the cognitive foundation ofintentions and behaviour
(Bothos et al 2014 Coombes and Jones 2016 Pronello et al 2017)
12 Feedback is important for the user to change behaviour (Kraft and Yardley 2009 Hargreavesn et al 2010 Dennison et al 2013Anda and Temmen 2014 Bothos et al 2014 Gilliland et al 2015 Posladet al 2015 Tang et al 2015)
13 Applications should provide relevant knowledge of environmental andclimate-smart behaviour according to users
(Dennison et al 2013 Coşkun and Erbuğ 2014 Gilliland et al 2015)
14 Incentives in the form of reward can work both positively andnegatively when trying to influence behaviours
(Coşkun and Erbuğ 2014)
15 Carbon dioxide calculators have little effect on travellers if they forexample value short travel times higher than low CO2 emissions but canbe useful for comparing modes and increase awareness of unsustainablebehaviour
(Brazil and Caulfield 2013 Bothos et al 2014)
16 Incentives that are not linked to any product do not seem to inspirebehavioural change to a greater extent in some segments
(Poslad et al 2015)
17 Daily reminders do not necessarily have a positive effect on the qualityof data collection
(Berger and Platzer 2015)
Commitment 18 Higher motivation and involvement leads to a greater extent topositive results
(Kraft and Yardley 2009 Hargreavesn et al 2010 Martiskainen andCoburn 2011 Gilliland et al 2015 Jariyasunant et al 2015 Castellanos2016 Coombes and Jones 2016)
19 Gamification can extend the commitment of the user (Kraft and Yardley 2009 Baranowski and Frankel 2012 Berger andPlatzer 2015 Chaplais et al 2015 DiFilippo et al 2015 Poslad et al2015 Castellanos 2016)
20 Gamification does not necessarily increase sustainable travel in itselfbut on the other hand increases engagement at least in a short perspective
(Wells et al 2014 Coombes and Jones 2016)
21 Long-term commitment is a key issue for ICT to change and maintainthe behaviour of the user
(Kraft and Yardley 2009 Martiskainen and Coburn 2011 Baranowski andFrankel 2012 Chaplais et al 2015 DiFilippo et al 2015 Gilliland et al2015 Castellanos 2016 Coombes and Jones 2016 Pronello et al 2017)
22 Applications need to be fun to engage some users (Dennison et al 2013 Aliabadi et al 2016)23 Gamification that challenges and triggers contest behaviours could beused for motivational purpose
(Coşkun and Erbuğ 2014 Wells et al 2014 Chen et al 2015)
Appealing design 24 Appealing and simple design is important to the user (Hargreavesn et al 2010 Martiskainen and Coburn 2011 Dennison et al2013 Coşkun and Erbuğ 2014 Berger and Platzer 2015 Poslad et al2015 Tang et al 2015 Aliabadi et al 2016 Klecha and Gianni 2018)
25 The integrity aspect is important to the user (Dennison et al 2013 Berger and Platzer 2015 Aliabadi et al 2016Castellanos 2016)
26 Individuals appreciate the ability to personalize the application (Fanning et al 2012 Wells et al 2014 Gilliland et al 2015 Poslad et al2015 Semanjski et al 2016 Sullivan et al 2016)
A Andersson et al
the new behaviour have more weight for individuals during pre-con-templation However in the next stage of contemplation individualsare more likely to understand the benefits of the changed behaviour butstill overestimate the effortcosts of the change and are thus still am-bivalent in their behaviour and not yet quite ready for the change(Bamberg 2007) Thus in the first stages focus should be on raising thepositive aspects of sustainable travel and providing credible informa-tion that reinforces these arguments in combination with short-termrewards (Forward 2014) In the third stage preparation the benefitshave become quite obvious to the individual though one could stillexperience the change difficult which means that they may need gui-dance to move on to the next stage In the action stage the experienceof the new behaviour has probably shown that it was easier than ex-pected and the benefits were reminiscent At this stage however thenew behaviour has not yet become a habit which is why it is importantthat the experience feels good and rewarding to avoid the risk of theindividual returning to old behaviour patterns
According to TPB behaviours can be predicted by individuals at-titude towards the action and their perceived control that is theirexperience of how capable they are to perform the action (Ajzen 1991)With this in mind information and feedback within BCSSs should bedesigned to positively affect the attitude towards sustainable travel andalso aim to strengthen individuals belief that they are capable of ac-tually replacing the car in favour of walking cycling or public trans-port For example information about the consequences of an action caninfluence attitudes in a targeted direction (Abraham and Michie 2008)In spite of this knowledge the question remains on how normativeinformation should be A number of studies express the importance ofnormalizing sustainable travel so that individuals and society sees theunsustainable alternative as different ndash not the contrary (Oinas-kuk-konen 2010 Hiselius and Rosqvist 2016) Also the Theory of PlannedBehaviour sets the social norm as a factor individuals take into accountin their choice of behaviour indicating that it would be a good idea toinfluence these via normative information (Bamberg et al 2003) Atthe same time the risk that individuals may ignore information couldbe greater at normative than descriptive information as it could beperceived as less objective and more deceptive (Parvaneh et al 2014)An alternative approach to normative and persuasive information couldbe that of reflective learning which advocates systems to ldquofoster open-ended reflection meaning for users to reflect on what it actually meansto be sustainable in a way that makes sense in the context of their ownlivesldquo (Klecha and Gianni 2018) The question of which informationthat would be appropriate and adapted by the user may depend onwhich user segment the individual belongs to which again stresses theimportance of appropriate segmentation techniques
513 CommitmentEngaging the user appears as a key issue when it comes to changing
behaviours using ICT (Kraft and Yardley 2009 Martiskainen andCoburn 2011 Baranowski and Frankel 2012 Chaplais et al 2015DiFilippo et al 2015 Gilliland et al 2015 Castellanos 2016Coombes and Jones 2016 Klecha and Gianni 2018) After all it seemsto be of less significance if an application is sophisticated as long asusers neglect it because it is uninteresting A number of studies high-lighted the problem of declining application interest rates over time aslong term involvement on the other hand more often leads to positiveresults (Kraft and Yardley 2009 Hargreavesn et al 2010 Martiskainenand Coburn 2011 Gilliland et al 2015 Jariyasunant et al 2015Castellanos 2016 Pronello et al 2017) For example Pronello et al(2017) found that mobility is a highly habitual activity which is noteasily interrupted except for short periods This analysis is in line withTTM which means that behavioural change is a process that takes timeand thus requires long-term commitment (Prochaska and DiClemente1982) According to TTM the change process is not linear but is oftencharacterized by several relapses to old behaviour patterns (Bamberg2007) Diffusion of innovations also points out the renewal of products
as a central principle for successful dissemination and long-term sur-vival of innovations (Rogers 1995 Robinson 2009) Continuous im-provements are here pointed out as important for maintaining con-sumer interest and commitment over time (Robinson 2009) and shouldideally be carried out during stages of design and development withinput from actual users (Klecha and Gianni 2018)
Several studies are optimistic about Gamification and its potential toextend the commitment of the user (Kraft and Yardley 2009Baranowski and Frankel 2012 Berger and Platzer 2015 Chaplaiset al 2015 DiFilippo et al 2015 Poslad et al 2015 Castellanos2016) That gamification would have a positive impact on participantsinvolvement is also supported by Seaborn amp Fels (2015) The gamingindustry has succeeded in motivating its target groups with mechanismsthat provide constant feedback and motivate individuals to reach adistant goal It is those processes that gamification could use to build adigital platform around something real What is needed is data andsince large quantities can be gathered via for example travel appli-cations the possibility to gamify the experience should be virtuous Atthis point however research have not been able to determine whichspecific game elements work best to prolong commitment (Berger andPlatzer 2015 Poslad et al 2015 Castellanos 2016) It probably alsodepends on context and what kind of attitude profile is the target groupfor behavioural change (Seaborn and Fels 2015)
514 Appealing designThroughout the articles the importance of an appealing and simple
design of BCSSs was emphasized to keep the interests of users(Hargreavesn et al 2010 Martiskainen and Coburn 2011 Dennisonet al 2013 Bothos et al 2014 Coşkun and Erbuğ 2014 Berger andPlatzer 2015 Poslad et al 2015 Tang et al 2015 Aliabadi et al2016) Designing to create user-friendliness is thus important for usersto quickly understand and be able to use the application Some studiesfound that individuals also appreciate the ability to personalize thedesign thus improving the adaptation to the user
Gamification can as mentioned earlier be used to increase userinvolvement This can also be reflected in the design of the applicationAccording to Seaborn amp Fels (2015) game elements should have a user-centred approach where external rewards points pins andor marksshould be based on the usersrsquo motivational trigger points
Simplicity and ease of use are one of the five key criteria that affectthe acceptance of an innovation according to Diffusion of Innovationstheory (Robinson 2009) New ideas and innovations that are easy tounderstand are accepted earlier than those that require the user todevelop new skills
But while focusing on simplicity a number of studies have alsoshown the importance of respecting the integrity of the user (Dennisonet al 2013 Berger and Platzer 2015 Aliabadi et al 2016 Castellanos2016) The processing of collected data must respect user integrity andensure that sensitive information remains accessible only for intendedactors Clarifying this in the design should be central to ensure thatindividuals are comfortable using the application
52 Developing a conceptual model for behaviour change support systems
After analysing the four categories via the theoretical frameworkthey all appear as adequate for creating a conceptual model that helpsus to better understand what considerations are important when con-structing a BCSS (Fig 3) First of all customization to the user appear tobe crucial in order to contextualise information feedback goal settingstimuli motivational mechanisms and other content within the BCSSFor that reason ldquoCustomization to the userrdquo is the starting point of ourconceptual model and also an influencer of ldquoInformation and feedbackrdquoand ldquoCommitmentrdquo since both of these parts should be grounded in theusersrsquo needs as well Our approach is that these three parts in combi-nation will contribute to an ldquoAppealing designrdquo which in itself alsoneeds to be simple and user friendly The arrow design is a reminder
A Andersson et al
that the development of BCSSs is a process rather than a ldquoquick fixrdquowhich benefits from continuous evaluation and improvement pre-ferably with input from the users themselves (Klecha and Gianni2018)
The suggested model can be used to guide the implementationprocess of behaviour change techniques into smartphone applicationsto create a BCSS It has a user-centred focus and advocates that in-formation goals and feedback is adjusted to individuals through seg-mentation techniques In this way chances are greater that the user isprovided with contextual and relevant content that is useful to in-dividuals (Anagnostopoulou et al 2016) The model emphasizes theimportance of engaging the user to maintain motivation through thebehavioural change process Motivating the user is important becausethe performance has proven to be better the higher the interaction withthe application is (Kraft and Yardley 2009 Martiskainen and Coburn2011 Gilliland et al 2015 Castellanos 2016) A simple and user-friendly interface should characterize the design itself
The model uses established theories (TTM TPB DI) andGamification as support functions in the different parts of the modelThe categories are visualized together with the theoriesconcept thathave been used in verifying and developing the findings from the lit-erature review The purpose of including these is to clarify what per-spectives that has characterized the different parts of the conceptualmodel Generally the behaviour change theories TTM and TPB are mostinfluential in the first parts of the model The reverse applies toGamification which is more relevant when it comes to creating pro-cesses that involve the user as well as in designing and visualize con-tent Diffusion of Innovations emphasizes the importance of startingfrom the consumer constantly renewing innovation to create long-termcommitment as well as designing products that are simple and user-friendly (Rogers 1995) This theory is thus well suited to keep in mindthrough the entire development process
6 Discussion
The purpose of this study was to investigate how behaviour changetechniques can be combined with ICT in the creation of a BCSS thatencourage sustainable travel behaviour as well as developing a con-ceptual model that highlights important aspects to take into account insuch an implementation process The results contributed in its entiretyto answering the questions that guided the research process
Previous research points to ICT in general and smartphone-appli-cations in particular as a promising tool for influencing behaviourchange The results indicate however that it requires a user-centredfocus providing individuals with information feedback and goals
relevant for their specific needs to be of value in the process of changingbehaviour This is in line with the persuasive systems design (PSD)model (Oinas-kukkonen and Harjumaa 2009) which represents anextensive conceptualization for technology-based persuasion (for fur-ther application of the model see Sunio and Schmoumlcker 2017) Toallow for relevant and contextualised contents segmentation of targetpopulation would indeed be essential which also goes in line withearlier research on conventional Mobility Management campaigns(Meloni et al 2017)
Some studies indicated that the change was more successful themore individuals used and interacted with the intended BCSS (Kraft andYardley 2009 Hargreavesn et al 2010 Martiskainen and Coburn2011 Gilliland et al 2015 Castellanos 2016 Coombes and Jones2016) Commitment over time thus emerged as one of the most im-portant factors for successfully influence behaviour change Howeverprevious research also stressed the need for more empirical research onhow long-term commitment is achieved Gamification seems promisingand several studies recommend further research in this area (Berger andPlatzer 2015 Poslad et al 2015 Castellanos 2016) The theoreticalframework contributed to verifying and developing the results obtainedin the literature review TTM supports an individualized approach andsegmentation The theory can also explain to some extent how in-formation and feedback should be designed based on the users moti-vational balance that characterizes the transition between the beha-viour change stages (see 512) It also supports the observation thatlong-term commitment is important for individuals to complete thechange process and to reduce the risk of relapse into old habits Ac-cording to Theory of Planned Behaviour attitudes towards behavioursocial norms and perceived control are the main influencers of in-dividualsrsquo behaviours Customized information and feedback that re-inforces the users perceived control as well as content that normalizessustainable mobility choices should therefore be advocated by thetheory However TPB is unable to explain more closely how normativeinformation and feedback should be Diffusion of innovations supportssegmentation customization to the user continuous improvement tocreate commitment as well as simplicity and user-friendliness It alsoadvocates proliferation through social channels which is supported bysome of the reviewed articles and supported by (Ploderer et al 2014)although no conclusive studies are not yet available to shed light of theefficacy of social channels in BCSS (Sunio and Schmoumlcker 2017) Ga-mification emphasizes the importance of creating processes that inducemotivation and commitment based on the usersrsquo motivational triggerpoints The challenge with that approach is to know what the individualmotivational driving force is An alternative is to use different attitudesegments instead and design the application so that users can customize
Customization to the user (TTM TPB DI)
Information and feedback (TTM TPB)
Commitment (TTM DI Gamification)
Appealing design (DI Gamification)
Continuous evaluation and improvement
Fig 3 A conceptual model for combining behavioural change techniques with ICT to create a BCSS
A Andersson et al
certain parts as they like The concept seems promising based on pre-vious empirical studies but is also at an early stage where more re-search is necessary to understand which processes work best
7 Conclusions and further research
Based on previous research and theory a conceptual model thathighlights key aspects to consider when creating a behaviour changesupport system (BCSS) were developed Customization to the usercontextualised information and feedback commitment and appealingdesign emerged as essential aspects when developing persuasivesmartphone applications We strongly suggest segmentation of intendedtarget population to enable better customization to the user This wouldprovide enhanced conditions for user-centred information campaignstailor-made objectives and more contextualised content In previousresearch on ICT to influence behaviour change there are several ex-amples of how parts of our conceptual model have been used frag-mentarily usually with mixed results To the best of our knowledgethere is yet no study on BCSS that takes a holistic approach grounded intheory It would therefore be potential to work on the model empiri-cally to investigate its appropriateness to influence behaviour changeas theory-based research has showed to be more effective than purelyworking with behaviour techniques (Webb et al 2010)
An observation that permeates the reviewed articles is the need formore research with larger and more extensive data collection to enablegeneralisations on the efficacy of BCSSs to change behaviours We ad-vocate more empirical studies to be grounded in behaviour theoryGamification seems to be promising for sustained user engagement butrequire further research to conclude what particular mechanisms thatshould be implemented We also stress the need for studies exploringadequate segmentation techniques related to mobility developing tai-lored messages and content for different segments and also evaluatingthe effects of these
Finally future research should continue to explore the importantpossibility of measuring actual travel behaviour change with the use ofsmartphone technology A successful tool for collecting travel data bysmartphones would be essential in particular for quantitative researchbut also for making informed planning decisions regarding mobilityahead
Disclosure of interest
The authors declares that there has been no conflicts of interestconcerning this article
References
Abraham C Michie S 2008 A taxonomy of behavior change techniques used in in-terventions Health Psychol 27 (3) 379ndash387 httpdxdoiorg1010370278-6133273379
Van Acker V Van Cauwenberge B Witlox F 2013 MaxSUMO a new expert approachfor evaluating mobility managament projects Promet-Traffic Transport 25 (3)285ndash294 httpdxdoiorg107307pttv25i3290
Ajzen I 1991 The theory of planned behavior Organ Behav Human Decis Process 50(2) 179ndash211 httpdxdoiorg1010160749-5978(91)90020-T
Aliabadi N et al 2016 Using the information-motivation-behavioral skills model toguide the development of an HIV prevention smartphone application for high-riskMSM AIDS Educ Prev 27 (6) 522ndash537 httpdxdoiorg101521aeap2015276522
Anable J Lane B Kelay T 2006 lsquoAn evidence base review of public attitudes toclimate change and transport behaviourrsquo London Department for Transport (July)Available at httpwwwpdfwwwchina-upcom8080internationalcasecase1457pdf
Anagnostopoulou E et al 2016 Persuasive Technologies for Sustainable UrbanMobility Persuasive 2016 Workshop Where are we bound for Persuasion inTransport Applications July
Anda M Temmen J 2014 Smart metering for residential energy efficiency the use ofcommunity based social marketing for behavioural change and smart grid in-troduction In Renew Energy 67 pp 119ndash127 httpdxdoiorg101016jrenene201311020
Armitage CJ Conner M 2001 Efficacy of the theory of planned behaviour Br J Soc
Psychol 40 (February 2017) 471ndash499 httpdxdoiorg101348014466601164939
Arnott B et al 2014 Efficacy of behavioural interventions for transport behaviourchange systematic review meta-analysis and intervention coding Int J BehavNutr Phys Activity 11 (1) 133 httpdxdoiorg101186s12966-014-0133-9
Bamberg S 2007 Is a stage model a useful approach to explain car driversrsquo willingnessto use public transportation J Appl Soc Psychol 37 (8) 1757ndash1783 httpdxdoiorg101111j1559-1816200700236x
Bamberg S Ajzen I Schmidt P 2003 Choice of travel mode in the theory of plannedbehavior the roles of past behavior habit and reasoned action Basic Appl SocPsychol 25 (3) 175ndash187 httpdxdoiorg101207S15324834BASP2503_01
Banister D 2011 Cities mobility and climate change J Transp Geogr 19 (6)1538ndash1546 httpdxdoiorg101016jjtrangeo201103009
Baranowski T Frankel L 2012 Letrsquos get technical Gaming and technology for weightcontrol and health promotion in children Childhood Obes (Print) 8 (1) 34ndash37httpdxdoiorg101089chi20110103
Berger M Platzer M 2015 Field evaluation of the smartphone-based travel behaviourdata collection app ldquosmartMordquo In Transp Res Proc 11 pp 263ndash279 httpdxdoiorg101016jtrpro201512023
Bothos E et al 2014 Watch your emissions Persuasive strategies and choice archi-tecture for sustainable decisions in urban mobility PsychNol J 12 (3) 107ndash126
Brazil W Caulfield B 2013 Does green make a difference The potential role ofsmartphone technology in transport behaviour Transport Res Part C EmergTechnol 37 (December) 93ndash101 httpdxdoiorg101016jtrc201309016
Bresciani C et al 2016 lsquoBehavioral change and social innovation through reward anintegrated engagement system for personal mobility Urban Logistics and HousingEfficiency Transport Res Proc 14 353ndash361 httpdxdoiorg101016jtrpro201605087
Cairns S et al 2008 Smarter choices Assessing the potential to achieve traffic re-duction using ldquoSoft measuresrdquo Transp Rev 28 (5) 593ndash618 httpdxdoiorg10108001441640801892504
Castellanos S 2016 lsquoDelivering modal-shift incentives by using gamification andsmartphones A field study example in Bogota Colombia Case Stud Transp Policy 4(4) 269ndash278 httpdxdoiorg101016jcstp201608008
Chaplais E et al 2015 Smartphone interventions for weight treatment and behavioralchange in pediatric obesity a systematic review Telemed J E-health 21 (10)822ndash830 httpdxdoiorg101089tmj20140197
Chen J Cade JE Allman-Farinelli M 2015 The most popular smartphone apps forweight loss a quality assessment JMIR mHealth uHealth 3 (4) e104 httpdxdoiorg102196mhealth4334
Coombes E Jones A 2016 Gamification of active travel to school a pilot evaluation ofthe Beat the Street physical activity intervention Health Place 39 62ndash69 httpdxdoiorg101016jhealthplace201603001
Coşkun A Erbuğ Ccedil 2014 Designing for behaviour change smart phone applications aspersuaders of pro-environmental behaviours Metu J Facul Architect 31 (1)215ndash233 httpdxdoiorg104305METUJFA2014111
Dennison L et al 2013 Opportunities and challenges for smartphone applications insupporting health behavior change qualitative study J Med Internet Res 15 (4)1ndash12 httpdxdoiorg102196jmir2583
Deterding S et al 2011 Gamification Using Game Design Elements in Non-GamingContexts In Proceedings of the 2011 annual conference extended abstracts onHuman factors in computing systems ndash CHI EA rsquo11 Vancouver BC httpdxdoiorg10114519797421979575
DiFilippo KN et al 2015 The use of mobile apps to improve nutrition outcomes asystematic literature review J Telemed Telecare 21 (5) 243ndash253 httpdxdoiorg1011771357633X15572203
Environmental Protection Agency Emissions of greenhouse gases from domestic transportAvailable at httpwwwnaturvardsverketseSa-mar-miljonStatistik-A-OVaxthusgaser-utslapp-fran-inrikes-transporter2016 Accessed 1 February 2017
Fanning J Mullen SP Mcauley E 2012 Increasing physical activity with mobiledevices a meta-analysis J Med Internet Res 14 (6) httpdxdoiorg102196jmir2171
Findahl O Davidsson P 2016 Swedes and internet 2016 study of Swedesrsquo internethabits Found Internet Infrastruct Sweden 978-91-85291-14-4
Forward SE 2014 Exploring peoplersquos willingness to bike using a combination of thetheory of planned behavioural and the transtheoretical model Revue Europeene dePsychologie Appliquee 64 (3) 151ndash159 httpdxdoiorg101016jerap201404002
Gerike R et al 2016 Physical Activity through Sustainable Transport Approaches(PASTA) a study protocol for a multicentre project BMJ Open 6 (1) e009924httpdxdoiorg101136bmjopen-2015-009924
Gilliland J et al 2015 Using a smartphone application to promote healthy dietarybehaviours and local food consumption BioMed Res Int 2015 httpdxdoiorg1011552015841368
Government Offices of Sweden The government proposes historical climate reform forSweden Available at httpwwwregeringensepressmeddelanden201702reger-ingen-foreslar-historisk-klimatreform-for-sverige2017 Accessed 14 February 2017
Hargreavesn T Nye M Burgess J 2010 Making energy visible a qualitative fieldstudy of how householders interact with feedback from smart energy monitorsEnergy Policy 38 (10) 6111ndash6119 httpdxdoiorg101016jenpol201005068
Hiselius LW Rosqvist LS 2016 Mobility Management campaigns as part of thetransition towards changing social norms on sustainable travel behavior J CleanProd 123 34ndash41 httpdxdoiorg101016jjclepro201508055
Hsieh H-F Shannon SE 2005 Three approaches to qualitative content analysis QualHealth Res 15 (9) 1277ndash1288 httpdxdoiorg1011771049732305276687
IEA (2016) CO2 Emissions from Fuel Combustion ndash Highlights Paris Available at
A Andersson et al
httpswwwieaorgpublicationsfreepublicationspublicationCO2EmissionsfromFuelCombustion_Highlights_2016pdf
Fogg J Eckles D 2007 Mobile Persuasion 20 Perspectives on the Future of BehaviorChange Stanford Captology Media Stanford
Jariyasunant J et al 2012 The Quantified Traveler changing transport behavior withpersonalized travel data feedback Transport Res-D 2 (2) 107ndash123 httpdxdoiorg101068a201285
Jariyasunant J et al 2015 Quantified traveler travel feedback meets the cloud tochange behavior J Intell Transp Syst Technol Plann Oper 19 (2) 109ndash124httpdxdoiorg101080154724502013856714
Klecha L Gianni F 2017 Designing for Sustainable Urban Mobility Behaviour ASystematic Review of the Literature In Citizen Territory and Technologies SmartLearning Contexts and Practices Proceedings of the 2nd International Conference onSmart Learning Ecosystems and Regional Development ndash University of AveiroPortugal 22-23 pp 137ndash149 httpdxdoiorg101007978-3-319-61322-2_14
Klein M Mogles N van Wissen A 2014 Intelligent mobile support for therapy ad-herence and behavior change Elsevier Inc J Biomed Inform 51 137ndash151 httpdxdoiorg101016jjbi201405005
Kraft P Yardley L 2009 Current issues and new directions in Psychology and Health What is the future of digital interventions for health behaviour change PsycholHealth 24 (6) 615ndash618 httpdxdoiorg10108008870440903068581
Litman T 2010 Quantifying the benefits of nonmotorized transportation for achievingmobility management objectives by Transp Res Rec 134ndash140
Martiskainen M Coburn J 2011 The role of information and communication tech-nologies (ICTs) in household energy consumption-prospects for the UK Energy Effi 4(2) 209ndash221 httpdxdoiorg101007s12053-010-9094-2
McKay FH et al 2016 Evaluating mobile phone applications for health behaviourchange a systematic review J Telemed Telecare 1ndash9 httpdxdoiorg1011771357633X16673538
Meloni I Sanjust di Teulada B Spissu E 2017 Lessons learned from a personalizedtravel planning (PTP) research program to reduce car dependence Transportation 44(4) 853ndash870 httpdxdoiorg101007s11116-016-9681-y
Moher D et al 2009 Preferred reporting items for systematic reviews and meta-ana-lyses the (PRISMA) statement Res Meth Report 1ndash8 httpdxdoiorg101136bmjb2535
Nilsson LJ et al 2013 I ljuset av framtiden Styrning mot nollutslaumlpp aringr 2050LETS2050 Lunds Universitet
Oinas-kukkonen H 2010 Behavior Change Support Systems A Research Model andAgenda Proceedings In Persuasive Technology 5th International ConferencePERSUASIVE 2010 Copenhagen Denmark June 7-10 pp 4ndash14 httpdxdoiorg101007978-3-642-13226-1
Oinas-kukkonen H Harjumaa M 2009 Persuasive systems design key issues processmodel and system features Commun Assoc Inform Syst 24 (28) 485ndash500
Parvaneh Z Arentze T Timmermans H 2014 A stated adaptation approach to assesschanges in individualsrsquo activity-travel behavior in presence of personalized travelinformation Elsevier BV Transp Res Proc 3 (July) 21ndash30 httpdxdoiorg101016jtrpro201410087
Pew Research Center Smartphone Ownership and Internet Usage Continues to Climb inEmerging Economies ndash But advanced economies still have higher rates of technology
use Available at httpwwwpewglobalorg20160222smartphone-ownership-and-internet-usage-continues-to-climb-in-emerging-economies2016 Accessed 13December 2017
Ploderer B et al 2014 Social interaction and reflection for behaviour change PersUbiquit Comput 18 (7) 1667ndash1676 httpdxdoiorg101007s00779-014-0779-y
Poslad S et al 2015 Using a smart city iot to incentivise and target shifts in mobilitybehaviourndashis it a piece of pie Sensors 15 (6) 13069ndash13096 httpdxdoiorg103390s150613069
Potter WJ Levine-Donnerstein D 1999 Rethinking validity and reliability in contentanalysis J Appl Commun Res 27 258ndash284
Prochaska JO DiClemente CC 1982 Transtheoretical therapy Toward a more in-tegrative model of change Psychother Theor Res Pract 19 (3) 276ndash288 httpdxdoiorg101037h0088437
Pronello C Simatildeo JPRV Rappazzo V 2017 The effects of the multimodal real timeinformation systems on the travel behaviour Transp Res Procedia 25 2681ndash2693httpdxdoiorg101016jtrpro201705172
Robinson L 2009 A summery of Diffusion of Innovations ChangeologyRogers EM 1995 Diffusion of innovations 3rd editio Macmillian Publishing Co 3rd
editio London Collier Macmillian Publishers doi citeulike-article-id126680Seaborn K Fels DI 2015 Gamification in theory and action a survey Int J Human
Comput Stud 74 14ndash31 httpdxdoiorg101016jijhcs201409006Semanjski I et al 2016 Policy 20 platform for mobile sensing and incentivized tar-
geted shifts in mobility behavior Sensors (Switzerland) 16 (7) httpdxdoiorg103390s16071035
Semanjski I Gautama S 2016 Crowdsourcing mobility insights ndash reflection of attitudebased segments on high resolution mobility behaviour data Elsevier Ltd TranspRes Part C Emerg Technol 71 434ndash446 httpdxdoiorg101016jtrc201608016
Sullivan RK et al 2016 Smartphone apps for measuring human health and climatechange co-benefits a comparison and quality rating of available apps JMIR mHealthuHealth 4 (4) e135 httpdxdoiorg102196mhealth5931
Sunio V Schmoumlcker J-D 2017 Can we promote sustainable travel behavior throughmobile apps Evaluation and review of evidence Int J Sustain Transport 11 (8)553ndash566 httpdxdoiorg1010801556831820171300716
Sweden Energy Agency 2015 Energy Situation 2015 Available at httpswwwenergimyndighetensecontentassets50a0c7046ce54aa88e0151796950ba0aenergilaget-2015_webbpdf
Tang J et al 2015 How can weight-loss app designersrsquo best engage and support usersA qualitative investigation Brit J Health Psychol 20 (1) 151ndash171 httpdxdoiorg101111bjhp12114
Webb TL et al 2010 Using the Internet to promote health behavior change a sys-tematic review and meta-analysis of the impact of theoretical basis use of behaviorchange techniques and mode of delivery on efficacy J Med Internet Res 12 (1)httpdxdoiorg102196jmir1376
Wee B Van Banister D 2016 How to write a literature review paper Transp Rev 36(2) 278ndash288 httpdxdoiorg1010800144164720151065456
Wells S et al 2014 Towards an applied gamification model for tracking managing ampencouraging sustainable travel behaviours ICST Trans Ambient Syst 14 (4) 1ndash9
A Andersson et al
Paper II
Paper III
ndash
euro
rsquo
euro
euro
euro rsquo
journal homepage httpwwwelseviercomlocatetranpol
oslash
oslash
euro
rsquo rsquo
rsquo
euro
rsquo
rsquo
rsquo
rsquo
rsquo
rsquo
rsquo
ndash
rsquo
gt
gt
lt
rsquo
rsquo
lt
ndash
frac14
oslash
rsquo
euro
rsquo
rsquo
rsquo
rsquo
rsquo
frac14 frac14frac14 frac14 frac14
rsquo
ndash
euro
rsquo
frac14
frac14
euro
rsquo
8072
4739
30
12
11
10
37
22
21 56 83
50
9
2531
18
33
8 712 12 16
1315 17
0
20
40
60
80
100
Distance working
Walking
Bicyclee-bike
Public transport
ScooterMotorcycle
Car
rsquo
rsquo
rsquo
rsquo
rsquo
rsquo
α
frac14
ndash
euro
rsquo
rsquo α
rsquo rsquo
euro
rsquo
ndash
rsquo
lt
frac14
frac14
ndash
ndash
ndash
rsquo
ndash
ldquo rdquo ldquo rdquo
ndash
ndash
ndash
ndash
ndash
ndash
ndash
ndash
ndash
ndash
rsquo
ndash
ndash
ndash
euro
ndash
ndash
ndash
ndash
ndash
ldquo rdquo
ndash
ndash
euro
ndash
ndash
ndash
ndash
ndash
ndash
ndash
ndash
ndash
ndash
ndash
ndash
ndash
ndash
ndash
ndash
ndash
ndash
rsquo
ndash
ndash
ndash
rsquo
ndash
ndash
ndash
ndash
ndash
ndash
ndash
rsquo
ndash
ndash
ndash
ndash
euro
ndash
oslash
ndash
ndash
ndash
ndash
ndash
ndash
Paper IV
Contents lists available at ScienceDirect
Transportation Research Part D
journal homepage wwwelseviercomlocatetrd
Is climate morality the answer Preconditions affecting themotivation to decrease private car use
Alfred Andersson
Lund University Department of Technology and Society Box 118 SE-221 00 Lund SwedenK2 ndash The Swedish Knowledge Centre for Public Transport Bruksgatan 8 SE-222 36 Lund Sweden
A B S T R A C T
Persuasive messages are commonly used in campaigns promoting sustainable transport to motivate people to reduce private car use This paperexplores the preconditions affecting the motivation of people to reduce private car use when exposed to such messages A sample of 1100 Swedishresidents was analysed for the effect of variables related to accessibility usual commute mode and attitudes Significant variables were used tocreate a precondition index which was cross-tabulated with demographic variables and stages drawn from the transtheoretical model The resultsshow that there are differences in the preconditions regarding motivation to reduce private car use between segments of the population Resultsindicate that climate morality is the most critical factor affecting motivation specifically the motivation of persistent drivers Usual commute modecar advocacy health concern attitudes towards cycling car identity and travel time also influence motivation Males the middle-aged people withlow educational attainment and rural residents have the least favourable preconditions concerning motivation to reduce private car use
1 Introduction
Global transport CO2 emissions continue to rise and constitute a quarter of the total emissions with the highest absolute increasein road transport which accounts for 74 of transport emissions (IEA 2018) In Sweden domestic transport is responsible for aneven higher share (33) mainly because electricity generation and heating in Sweden are less dependent on fossil fuels (SwedishEPA 2018) Among the domestic transport emissions in Sweden 93 comes from road transport and the largest share of it (67)comes from passenger transport (Swedish Transport Administration 2019) Despite a broad agreement among politicians in Swedenthat the transport sector needs to be de-carbonised emissions continue to be more or less unchanged To reach the climate target forthe transport sector in Sweden (ie decrease in emissions from domestic traffic by 70 by 2030 compared with that in 2010)emissions from transport need to decrease annually by 8 (Swedish Transport Administration 2019) Instead CO2 emissions in-creased by 03 in 2018 primarily because of the increased amount of passenger car kilometres which counteracted the otherwiseimproved energy efficiency within the car fleet (Swedish EPA 2018) Therefore to reach the climate targets the demand for privatecar use needs to decrease rapidly Including the expected population growth by 2050 it has been estimated that passenger carkilometres need to be reduced by a third in Sweden (Winslott Hiselius and Smidfelt Rosqvist 2018)
At the time of this study Sweden had almost 49 million passenger cars registered for use in traffic These vehicles do not includelight or heavy trucks which are instead included in the statistics for freight transport In 2008ndash2018 the car fleet expanded byapproximately 12 and according to Transport Analysis a Swedish government agency for transport policy analysis the trend isexpected to continue in the coming years partly because of the projected population and gross domestic product increase (TransportAnalysis 2018) Bicycle sales have remained steady over the past ten years but 38 fewer trips are now made by bicycles than in the1990s (Svensk cykling 2018) Similar to many other European countries Sweden has had a significant increase in the sales of electric
httpsdoiorg101016jtrd201911027
At Department of Technology and Society John Ericssons vaumlg 1 Box 118 SE-221 00 Lund SwedenE-mail address alfredanderssontftlthse
bicycles which accounted for about 20 of the total bicycle sales in 2018Cars remain the dominant mode of transportation in terms of total passenger-kilometres Nationally car trips account for 72 of
all trips Public transport accounts for about 23 and walking and cycling account for 2 respectively (Transport Analysis 2015)The large proportion of car journeys is a trend that is difficult to break An average Swedish resident drives more than 6500 km peryear The passenger car kilometres per capita have hardly changed since 2006 though it has slightly increased since 2013 Howeverdifferences exist at the regional and municipal levels The driving distances by car have decreased in the three Swedish metropolitanareas of Stockholm Gothenburg and Malmouml At the same time passenger car kilometres have increased in the rest of the countryhighlighting the need for car-restricting measures that function in both more rural areas and cities
However implementing car-restricting measures is usually considered a political risk because of the significant barriers related tothe design and acceptance of sustainable transport policies which are referred to as lsquotransport taboosrsquo by Goumlssling and Cohen (2014)Therefore attempts have been made with lsquosoftrsquo measures that encourage people to change their travel behaviour voluntarily Travelprogrammes such as TravelSmart in Australia (Freer et al 2010) and the Travel Feedback Programme in Japan (Taniguchi et al2003) provide users with information about the various aspects of their travel behaviour to encourage pro-environmental behavioursSuch campaigns have been applied in several European cities with positive outcomes (a reduction in private car use of around 10)(Banister 2008)
Persuasive messages are commonly included as part of the campaigns An example from Sweden is the bicycle campaign launchedby the city of Malmouml that used the message lsquoinga loumljliga bilresorrsquo (no ridiculous car trips) to influence social norms related to drivingThe effect of such marketing and communication efforts has been examined to understand its influence on the motivation to decreaseprivate car use (eg Beale and Bonsall 2007 Hess and Bitterman 2016) Mir et al (2016) found that communicating the con-sequences of air pollution could provoke individuals to act more environmentally friendly and change the intention of using moresustainable modes of transportation Some studies have explored the effect of different framing interventions such as CO2 valenceframing (Avineri and Waygood 2013 Waygood and Avineri 2018) and fiscal versus environmental messages (Cohen-Blankshtain2008) These studies contribute to addressing the question of how people respond to different messages However research in-vestigating firstly why people respond the way they do and secondly what characteristics are related to the segments that aremotivated to reduce private car use and those that are not is lacking The first question is critical to understand the latent preconditionsthat guide peoplesrsquo motivation to decrease private car use and the second question is important for policymakers to create efficienttargeted communication strategies In particular research has demonstrated the difficulties in reaching lsquopersistent driversrsquo witharguments emphasising a low-carbon lifestyle (Polk 2003 Jia et al 2018) As this group accounts for the largest share of passengercar kilometres (Ko et al 2011 Smidfelt Rosqvist and Winslott Hiselius 2018) analysing this group more closely is vital to un-derstand their motivations to reduce private car use (Beiratildeo and Sarsfield Cabral 2007) In this study the transtheoretical model(TTM) is used to segment the population and to analyse the conditions for changing travel behaviour in different stage groups
11 TTM
TTM (Prochaska and Diclemente 1986) seeks to explain the process of behaviour change It considers behaviour change as astepwise process rather than an isolated event For campaign designers the advantage of such an approach is that it enables in-terventions to be matched to different stages (Friman et al 2017) TTM has been used mainly to explain health-related behaviourchanges but in recent years it has also been employed to promote modal shifts within the transport domain (Gatersleben andAppleton 2007 Forward 2014) Moreover it has been suggested as a theory for examining campaigns in the transport sector(Waygood et al 2012) The TTM stages include the following
bull Pre-contemplation unconcerned about the problems caused by current behaviour and have no intention to change
bull Contemplation start to become aware of the problem and the cost and benefits of the new behaviour weigh about the same
bull Preparation the benefits of the new behaviour have become apparent and the preparation to change begins
bull Action have started to change but the risk is still high for submitting to the old behaviour
bull Maintenance the behaviour has started to become a habit
12 Aims
This study attempts to shed light on the factors affecting the motivation to reduce private car use and how these factors aredistributed in the population demographically and in the stages of TTM The outcome from a survey exploring peoplesrsquo motivation toreduce private car use when exposed to messages advocating sustainable transport is analysed Ordinary least squares (OLS) re-gression analyses are used to explore the factors affecting such motivation and a precondition index consisting of significant vari-ables is used to differentiate the population Finally a segmentation based on the transtheoretical model is used to analyse persistentdrivers separately
2 Methodology
21 Data collection and sample
The participants in the survey were recruited from a Swedish probability-based internet panel of Kantar Sifo similar to the Dutch
A Andersson
panel used by Hoen and Geurs (2011) The panel consists of approximately 100000 residents 16ndash79 years of age The panel membersare randomly recruited through nationally representative telephone surveys and the panel is continuously filled with new membersto prevent them from becoming lsquoexpertsrsquo The panel members are recruited by e-mail with a link to the questionnaire and if theychoose not to participate another panel member is contacted instead Those who agree to participate receive compensation in theform of bonus points that can be redeemed for movie tickets or gift cards
The sample was stratified to match the national conditions regarding gender and age and analytical weights were used to adjustfor potential skewness These weights were used to compensate for the overrepresentation of respondents with higher education (thesample had 10 more highly educated participants than the Swedish average) and the underrepresentation of older respondents Thegeographical scope was limited to seven out of the nine municipality groups according to the classification made by the SwedishAssociation of Local Authorities and Regions (2016) The two excluded municipality groups consist of rural municipalities where thepopulation is less than 15000 inhabitants in the largest urban area or where the commuting rate for work outside of the municipalityis very low (less than 30) These rural municipalities were excluded because of the types of marketing messages used in the surveywhich mostly relate to sustainable transportation such as walking cycling and public transport that can be inaccessible in many ruralparts of Sweden Nevertheless the municipality groups included in the survey cover nearly 95 of the Swedish population
The questionnaire was fielded in February 2018 A total of 1500 individuals were recruited from the panel as part of a largerresearch project Among these participants 1100 were in the ages of 18ndash65 years and stated that they usually commute to school orwork The study focused on commuting trips to enable the marketing messages to be contextualised around them To ensure that allanalyses were based on the same individuals an analytical sample was defined and included only individuals with valid information(ie no missing responses) for all the variables used in the statistical analyses (n = 977)
Further mischievous respondents (MRs) who knowingly make false responses meant to cheat the researcher were removed byapplying Hyman and Sierras (2012) distribution-free sample-size-unconstrained backwards-stepping MR algorithm This step isespecially important when respondents are compensated for participating (Hyman and Sierra 2012) The lowest variance deletionrule was used to clean the data (Thoslashgersen 2018) The respondents were considered mischievous if the variance of their responses tothe 14 message items that would constitute the dependent variable was below 025 (13 of the sample) This step reduced theanalytical sample to 850 individuals
22 Survey design
The questionnaire involved four parts (1) demographic characteristics of the respondents (2) their accessibility to travel modesdriving license and daily commuting trip length and mode choice (3) attitudinal questions and (4) marketing messages The originalquestionnaire in Swedish was translated into English by the researcher All of the variables used in the study are presented in Table 1Previous literature was searched to determine the factors that could influence the motivation to decrease private car use (Tertoolenet al 1998 Steg and Tertoolen 1999 Beiratildeo and Sarsfield Cabral 2007 Abrahamse et al 2009 Anable and Wright 2013 Damant-Sirois and El-Geneidy 2015) which guided the design of the questions in parts two and three (see Appendix A)
The fourth part of the survey included marketing messages that were used to measure the respondentsrsquo motivation to decreaseprivate car use Messages promoting pro-environmental behaviours have typically been examined in relation to environmentalhealth and economic benefits (Nisbet and Gick 2008 Avineri and Waygood 2013 Bolderdijk et al 2013 Loureiro and Veloso2017 Steinhorst and Kloumlckner 2017) Campaigners have used the same dimensions when framing marketing messages promotingsustainable transport in Sweden (Hiselius and Rosqvist 2015) Therefore these dimensions were used to form the messages con-stituting the dependent variable in this study A screening of messages used by the regional public transport authorities munici-palities working with mobility management train operators and organisations that support bicycling and public transport wasconducted From these actors 14 messages promoting sustainable transport or sustainability in general were chosen (Table 2)
The respondents were asked to state their level of motivation to decrease their car use when exposed to the messages which wererandomised to avoid response bias The messages were rated on a five-point Likert scale from lsquovery motivated to decrease my level ofprivate car usersquo to lsquovery unmotivated to decrease my level of private car usersquo following the scale used by Waygood and Avineri(2018) For the respondents that already had low or no private car use the scale was adjusted to lsquovery motivated to keep my low levelof private car usersquo to lsquovery unmotivated to keep my low level of private car usersquo The 14 items had high construct reliability(Cronbachrsquos alpha = 093) (Meyers et al 2013)
The aggregated responses from the 14 marketing messages were then used to compute a mean value for each respondent forminga continuous variable that was further used as the dependent variable in the OLS regressions The scale of this variable had a range of14ndash70
23 Statistical analyses
Multiple linear regression models were estimated to analyse the effect of attitudes and accessibility on the motivation to decreaseprivate car use Firstly several preliminary analyses were conducted to ensure the non-violation of the assumptions of normalitylinearity homoscedasticity and multicollinearity The histogram scatterplot and normal P-P plots of the regression standardisedresiduals were used to control the data Standardised residuals and casewise diagnostics were further used to investigate if there wereany potential outliers Two outliers were excluded based on standardised scores (gt 3)
Cookrsquos distance statistics which is a measure of the overall influence that a single case has on a model was used to test for casesthat could arbitrarily influence the model Cook and Weisberg (1982) suggested that values greater than one could be cause for bias
A Andersson
Conducting this analysis revealed that the 10 cases with the highest Cookrsquos distance values were 0015ndash0008 and thus no casecaused a significant bias to the model Multicollinearity was further tested by conducting collinearity diagnostics in linear regressionand including all independent variables The general guideline that VIF values above ten or tolerance values below 01 suggestmulticollinearity was used (Field 2013) The maximum variance inflation factor was 202 and the tolerance values varied at050ndash089 indicating no collinearity among the independent variables
The attitudinal survey questions were measured on a five-point Likert scale (strongly disagree disagree neithernor agree andstrongly agree) When running the multiple regressions some of these variables were non-linear that would make treating them ascontinuous variables inappropriate Therefore dummy variables were created for each category within the variables and neithernorserved as the reference category Thus accounting for potential thresholds in the data and presenting a more nuanced picture of howthe independent variables influence the dependent variable became possible (see Paacuteez and Whalen (2010) for a similar approach)This issue is elaborated in conjunction with Table 3
Upon completion of the regression analysis an index consisting of the significant variables was created to explore the trends inhow the preconditions for the motivation to reduce private car use are distributed within the sample and in the TTM stages Thefollowing procedure was undertaken to compute the index First a new variable was created for each of the significant predictorsand each significant category was loaded with the estimated coefficients retrieved from the regression As the index should be a
Table 1Overview of the variables (n = 850)
Mean or distribution () SD
Accessibility amp usual commute modeDriving license 091 028
Access to a bicycle 089 031Live within 500 m to a PT station 084 036Access to a car 078 042
Usual commute modeCar 070 046PT bicycle walk 030
Travel timelt 10 min 017 03610ndash20 min 02821ndash30 min 02031ndash45 min 01746ndash60 min 009gt 60 min 008
AttitudesIdentify as a driver 197 125Advocate private car use 304 136Identify as a cyclist 404 124Perceive cycling as fast 33 14Like cycling 37 122Identify with PT 361 142Concerned about health 314 137Climate morality 346 129
DemographicAge 4197 1271Female 049 05
Relationship statusMarriedlive with partner 07 046Single 03
Children living at homeOne 013 048More than one 024None 063
EducationElementary school 013 110Upper secondary 026University lt3 years 016University gt3 years 045
OccupationWorking 081 049Studying 016Off duty 003
Residential areaThe main city of municipality 068 078Town ge5000 residents 014Town lt5000 residents 018
A Andersson
composite variable showing what significantly influences motivation to reduce private car use weights were only allocated to thecategories that were significant in the regression The non-significant categories (and reference categories) were set to 0 Second allthe new variables were summed into a continuous variable in which each respondent had a value positioned on the index scaleDifferent methods are available for aggregating indicators to form a composite index and the most common are the lsquoadditive methodsthat range from summing up unit ranking in each indicator to aggregating weighted transformations of the original indicatorsrsquo(Matteo Mazziotta 2013) The latter method was used to compute the precondition index the significant predictor coefficients wereused as weights and aggregated to form an index Third the variable was transformed into a categorical variable for further analysesThe range produced by the respondents was used and equally divided into four categories with the lower range indicating un-favourable preconditions the higher range indicating favourable preconditions and 0 being neither favourable nor unfavourablepreconditions
Separate cross-tabulations were then conducted The demographic variables (age gender relationship status children at homeeducation occupation and residence) and the TTM stages interacted with the index similar to the approach used by Polk (2003) Thedistribution of the preconditions within the population was investigated Thus the demographic variables were not included directlyas predictors in the multiple regressions because using them both endogenously (ie within the regression and index) and exogen-ously (ie in the cross-tabulation with the index) would be inappropriate
3 Multiple regression model for the motivation to decrease private car use
A multiple linear regression model was estimated to understand which variables affect the motivation to decrease private car usewhile controlling for the simultaneous effects of other variables The model was estimated using accessibility and attitudinal variablesas the explanatory variables and motivation to decrease private car use as the outcome variable The model had a Nagelkerke score of047 indicating that the included exploratory variables explain about half the variance of the motivation to decrease private car use
Some key insights emerged in the interpretation of the regression results in Table 3 In particular feeling a moral obligation toreduce onersquos carbon emissions (climate morality) is significant and positively affects the motivation to reduce private car use comparedwith the reference category of being indifferent to the issue (neithernor) Those who strongly agree to have climate morale increasetheir motivation to reduce private car use (on a 14ndash70 scale) by 47 points on average Those agreeing to have climate morale is 22points more motivated compared to the reference category neithernor Furthermore those strongly disagreeing with the statementare other things being equal minus72 points less motivated to reduce private car use However disagreeing is not significant climatemorality has an effect only when it is either positive or very negative
The coefficients for agreeing and strongly agreeing to like cycling are significant and increase the motivation to reduce private caruse with 34 and 37 points respectively This result is consistent with those of previous research that found stronger intentions forpeople to use sustainable modes of transportation if they like to bicycle Using stated preferences Gatersleben and Appleton (2007)found that people who like bicycling would bicycle commute under most circumstances The relationship between attitudes towardscycling and car use intentions was further demonstrated by Handy and Xing (2011) who found that people who agree that theywould limit driving as much as possible were also more likely to bicycle commute However the results in Table 3 show thatdisagreeing and strongly disagreeing to like cycling is not significant indicating that attitudes towards cycling primarily influencesmotivation when they are positive One possible explanation for this result is that those who do not like cycling may still be motivatedto decrease their car use by instead switching to public transport a suggestion also put forward by Handy and Xing (2011)
Strongly disagreeing and disagreeing with the statement that cycling can be as fast as a car on certain distances is significant andaffects motivation negatively (minus27 and minus18 respectively) Likewise for the concerned about health variable strongly disagreeing is
Table 2Messages used for measuring motivation to decrease private car use (n = 850)
Item Mean SD
1 We all must help to reduce our climate footprint The result will be a sound environment that future generations also need 383 1052 Those who mostly walk cycle or ride transit are doing something good for the environment 372 1043 Research shows that public transport users are walking on average four times more per day than do car drivers therefore reducing the risk of
acquiring severe non-communicable diseases369 105
4 Those who cycle and go by public transport not only improve their health but also contribute positively to other peoples health 366 1015 Did you know that cyclists have a 52 lower risk of dying of heart disease and a 40 lower risk of dying from cancer 364 1066 You save about 350 euro per month if you live without a car and instead go by public transport and even more so if you cycle or walk 348 1197 Bicycles run on fat and save you money Cars run on money and make you fat 345 1268 If Sweden is to achieve its climate targets then generally every third car trip must be replaced with more environmentally friendly
alternatives341 117
9 By cycling instead of taking the car to work you save money and contribute to society at the same time Try it 336 11110 The car traffic in Sweden induces a socio-economic loss above 10 billion euros in adverse health effects 326 11311 In the government budget support for investments in cycling infrastructure increased by 50 million euros in 2018 321 11512 If you want to improve your health you should ride a bicycle instead of driving a car If the distance is a problem then an electric bike can
be an option317 117
13 Beginning in 2018 you can get 25 of the cost subsidised by the government when purchasing a new electric bicycle 305 12714 The environmental impact per bus passenger is only 65 of the private car user in rural areas and 40 in urban areas 3 106Cronbachrsquos α 093
A Andersson
significant (minus22) Thus those who do not see cycling as a competitive alternative to driving a car or as a way to improve theirhealth are less likely to be motivated to decrease their private car use However the respondents who agree with these statementsseem to either be motivated or not motivated that is there is no association in these cases This outcome is not surprising given thatpeople sometimes hold two or more contradictory beliefs preferences or values referred to as cognitive dissonance by Festinger(1957) A person may be aware of the benefits of bicycle commuting and still be unmotivated to reduce private car use due to otherbarriers
Consequently the results highlight the need to communicate the benefits of cycling on the one hand and to remove the obstacles
Table 3Multiple regression model (n = 848) Dependent variable motivation to decrease private car use
95 CI
B SE Beta t Sig Upper Lower
Constant 43403 2229 1947 0 3903 4778Accessibility amp usual commute modeDriving license (ref no) minus1107 1067 minus003 minus104 03 minus320 099Access to a bicycle (ref no) 0383 0966 001 040 0692 minus151 228Live within 500 m to a PT station (ref no) minus0059 079 000 minus007 0941 minus161 149Access to a car (ref no) 0749 0849 003 088 0378 minus092 242Usual commute mode (ref car) 3248 0731 016 445 0 181 468Travel time (ref lt 10 min)
10ndash20 min 0369 084 002 044 066 minus128 20221ndash30 min 0804 091 003 088 0377 minus098 25931ndash45 min 0013 0957 000 001 0989 minus187 18946ndash61 min minus0201 1144 minus001 minus018 0861 minus245 205gt 60 min minus3314 1233 minus009 minus269 0007 minus573 minus089
AttitudesClimate morality (ref neithernor)
Strongly disagree minus7206 1054 minus022 minus684 0 minus928 minus514Disagree minus1342 0992 minus004 minus135 0177 minus329 061Agree 2179 078 009 279 0005 065 371Strongly agree 4687 0808 020 580 0 31 627
Advocate private car use (ref neithernor)Strongly disagree 2243 0927 008 242 0016 042 406Disagree 2408 0821 009 294 0003 08 402Agree minus2805 0891 minus010 minus315 0002 minus455 minus106Strongly agree minus3885 0858 minus015 minus453 0 minus557 minus22
Like cycling (ref neithernor)Strongly disagree 06 1466 001 041 0682 minus228 348Disagree 0074 1058 0 007 0944 minus200 215Agree 3366 0824 014 408 0 175 498Strongly agree 3692 0888 017 416 0 195 543
Concerned about health (ref neithernor)Strongly disagree minus2225 0894 minus008 minus249 0013 minus398 minus047Disagree minus0025 0933 0 minus003 0978 minus186 181Agree 1196 0794 005 151 0133 minus036 276Strongly agree 1604 0861 006 186 0063 minus009 329
Perceive cycling as fast (ref neithernor)Strongly disagree minus2655 0935 minus010 minus284 0005 minus449 minus082Disagree minus1971 0993 minus006 minus198 0048 minus392 minus002Agree minus0095 0817 0 minus012 0907 minus17 151Strongly agree minus0462 0843 minus002 minus055 0584 minus212 119
Identify as a cyclist (ref neithernor)Strongly disagree minus0858 1522 minus002 minus056 0573 minus385 213Disagree 0641 1202 002 053 0594 minus172 3Agree 047 0998 002 047 0638 minus149 243Strongly agree 0332 0954 002 035 0728 minus154 220
Identify with PT (ref neithernor)Strongly disagree minus1384 1067 minus004 minus13 0195 minus348 071Disagree 0269 1022 001 026 0793 minus174 228Agree minus12 0926 minus005 minus13 0196 minus302 062Strongly agree minus0536 0833 minus003 minus064 0520 minus217 11
Identify as a driver (ref neithernor)Strongly disagree 1783 0873 009 204 0041 007 35Disagree 1884 0987 007 191 0057 minus005 382Agree 1282 1161 004 11 0270 minus1 356Strongly agree minus0072 1364 0 minus005 0958 minus275 261
Note All predictors were entered into the regression model simultaneouslyNagelkerke R2 047
A Andersson
that prevent people from cycling on the other hand Earlier studies demonstrated a clear difference between the attitudes of users thathave cycling experience and those of users that do not (Gatersleben and Uzzell 2007 Rondinella et al 2012 Fernaacutendez-Herediaet al 2014) Suggestions have been made to implement measures that enable people to experience cycling in daily life to increasetheir motivation to cycle (Broach et al 2012)
Regarding the statement lsquoPeople should be allowed to use their cars as much as they likersquo (the advocate private car use variable)the coefficients for lsquostrongly disagreersquo and lsquodisagreersquo are positive and those for lsquoagreersquo and lsquostrongly agreersquo are negative They are allsignificant and in accordance with the expected results For example Steg (2005) and Steg et al (2001) found a relationship betweenaffection for cars and the frequency of private car use People were also found to be unlikely to voluntarily change their behaviourunless they recognise the negative externalities produced by private car use (Tertoolen et al 1998) This finding is further reflectedin the identify as a driver variable in which strongly disagree significantly affects motivation positively Travel time to schoolwork isonly significant if it exceeds 60 min thus affecting the motivation to decrease private car use negatively Research has shown thatlong distances discourage commuters to use sustainable transportation (Heinen et al 2013) and that long trips are reasonablyassumed to be more challenging to influence because of fewer alternatives to promote than short trips
Usual commute mode is significant as using sustainable transport modes positively affect the motivation to decrease private car usecompared with driving This result is expected given the tendency people have in general to assimilate information that is consistentwith their behaviour and attitudes (Beale and Bonsall 2007 Whitmarsh 2011)
4 Demographic differences based on a precondition index of the significant variables
To understand how the significant variables of the motivation to decrease private car use are represented demographically in thesample an index was computed using the estimated coefficients from the multiple regression model Eight variables were includedclimate morality usual commute mode advocate private car use like cycling concerned about health perceive cycling as fastidentify as a driver and travel time The variables are presented in Table 4
The procedure to compute the precondition index has been explained in Section 23 With the results in Table 4 the formula canbe described as follows
= lowast minus lowast minus lowast + lowast
+ lowast + lowast + lowast minus lowast minus lowast
+ lowast + lowast minus lowast minus lowast
minus lowast + lowast
Precondition index (3248 mode_sust) (3314 travel_time) (7206 climate1) (2179 climate4)(4687 climate5) (2243 car_adv1) (2408 car_adv2) (2805 car_adv4) (3885 car_adv5)(3366 like_cycling4) 3692 like_cycling5) (2225 health1) (2655 cycling_fast1)(1971 cycling_fast2) (1783 id_driver1)
Based on the coefficient weights the scores ranged roughly from minus24 to 24 However in practice the scoring for the populationsample ranges from minus16 to 16 The latter range was deemed more useful to form categories for further analyses because it betterdescribed the real preconditions for the sample The range was equally divided into four categories with the lower range indicatingunfavourable preconditions the higher range indicating favourable preconditions and 0 indicating neither favourable nor un-favourable preconditions The scale of the index and the sample distribution are presented in Table 5
Several cross-tabulations were conducted between the precondition index and the demographic variables The results indicatethat men have significantly less favourable preconditions than females and that the respondents differ significantly concerning age(Table 6) The younger cohort has more favourable preconditions than the older cohort The categories within both relationship status
Table 4Variables used and their corresponding weights in the construction of a precondition index of motivation to decrease private car use
Predictor variables Significant categories Abbreviation Sig Weights
Usual commute mode PT bicycle walk mode_sust 0 3248
Travel time gt 60 min travel_time 0007 minus3314
Climate morality Strongly disagree climate1 0 minus7206Agree climate4 0005 2179Strongly agree climate5 0 4687
Advocate private car use Strongly disagree car_adv1 0016 2243Disagree car_adv2 0003 2408Agree car_adv4 0002 minus2805Strongly agree car_adv5 0 minus3885
Like cycling Agree like_cycling4 0 3366Strongly agree like_cycling5 0 3692
Concerned about health Strongly disagree health1 0013 minus2225
Perceive cycling as fast Strongly disagree cycling_fast1 0005 minus2655Disagree cycling_fast2 0048 minus1971
Identify as a driver Strongly disagree id_driver1 0041 1783
Note The reference categories and the non-significant categories were set to 0 in the aggregation of independent variables
A Andersson
and children at home are not significantly different indicating that the precondition index is similar across these demographicvariables The cross-tabulation between education and the precondition index shows a significant difference especially between themost educated (more than three years at a university) and the rest which indicates that higher education provides more favourableconditions compared to having a low education Unsurprisingly this result is also reflected in the occupation variable in whichstudents have significantly more favourable preconditions than employees and those off duty or on parental leave as students areusually young and on the verge of gaining higher education The results in Table 6 further indicate a significant difference inresidence with urban populations having more favourable preconditions than people in suburban towns and small villages
5 Stage of change and the precondition index
To further explore how the preconditions for motivation to decrease private car use are represented in relation to the stage ofbehaviour change a cross-tabulation including the stages from the TTM was performed with the precondition index The differencesbetween the stages were investigated using a one-way between-subjects ANOVA (post hoc test Tukeyrsquos HSD) Previous studies al-located respondents to each stage by asking them to choose one of five statements (Godin et al 2004) One objective is for therespondents to answer based on what they think will happen in the foreseeable future which is usually measured as the next sixmonths The following statements were constructed for this study
bull lsquoI use the car for the most part and do not intend to change the mode of transport within the next six monthsrsquo (pre-contemplation)
bull lsquoI am using the car for the most part but I am considering replacing some car journeys with other modes within the next sixmonthsrsquo (contemplation)
bull lsquoI am using the car for the most part but have begun trying other modes instead in the last six monthsrsquo (preparation)
bull lsquoFor the past six months I have only used the car as a complement to other means of transportrsquo (action)
bull lsquoFor the past six months I have only used other modes than carsrsquo (maintenance)
Contemplation and preparation are the stages in which individuals are ambivalent about their current behaviour thus makingthem more amenable to external influence (Forward 2014) Campaigners usually focus on these two stages because they constitute a
Table 5Scale and distribution of the precondition index (n = 848)
I II III IV
Index scale minus16 to minus8 minus799 to 0 001 to 8 801 to 16n 49 (6) 183 (22) 336 (40) 274 (32)
Table 6Cross-tabulation of the precondition index with the demographics (n = 848)
I () II () III () IV () n
Gender Male 7 23 43 27 435Female 4 20 37 39 415
Age 18ndash29 5 13 40 42 23230ndash50 6 23 37 33 39351ndash65 5 29 44 22 225
Relationship status Marriedin partnership 6 23 40 30 587Single 6 17 40 38 262
Children at home One or more 5 23 41 31 316No 6 21 39 34 534
Education Elementary school 8 36 34 22 110Upper secondary 9 24 39 29 218University lt 3 years 7 19 42 33 139University gt 3 years 3 18 41 38 383
Occupation Working 6 24 41 29 684Off dutyparental leave 7 30 47 17 25Studying 4 7 35 54 137
Residence Main city 4 19 40 37 575Town ge5000 residents 9 25 36 30 120Town lt5000 residents 9 29 43 20 154
Statistically significant differences within the variables examined using the Pearson chi-square test p lt 0001 p lt 001
A Andersson
more feasible target group than those not interested in the new behaviour (pre-contemplators) and those already practising thedesired behaviour to some extent (action and maintenance) Note that the contemplation and preparation groups are usually rela-tively small In this population sample they constitute 14 of the total as shown in Table 7 As the sample sizes are not equallydistributed on the TTM stages a Levenes test was conducted to determine whether the data meet the homogeneity of varianceassumption The test confirmed the null hypothesis (sig = 0559) that all the stages have similar population variances
Fig 1 shows the interaction between the TTM stages and the precondition index The preconditions for the motivation to decreaseprivate car use become more favourable proceeding to the later stages in TTM Particularly pre-contemplators have worse pre-conditions than all the other segments (significance tests are presented in Table 8) Conversely the respondents in the maintenancestage have significantly better preconditions The preconditions are increasingly more favourable moving from contemplation topreparation and from preparation to action
The highest threshold for favourable preconditions seems to be between the pre-contemplation stage and the contemplation stageThis supports the strategy of targeting those in the contemplation and preparation stages as they would likely be more susceptible toincentives and other mechanisms promoting behaviour change Even if the pre-contemplators have a substantial share of the fa-vourable preconditions (55 in category III and IV) they are significantly less likely to respond positively to such mechanisms whichis a paramount challenge for policy-makers because this group carries out the majority of the car passenger kilometres (SmidfeltRosqvist and Winslott Hiselius 2018) Therefore although mobility management campaigns can be successful in promoting in-dividual and incremental behavioural changes this strategy will probably be insufficient to influence lsquopersistent driversrsquo as long asthe conditions for this groups motivation are unfavourable (Barr 2018) Nevertheless previous studies showed a highly unequaldistribution of emissions among the population which is especially evident in transport (Brand and Boardman 2008 Brand andPreston 2010 Ko et al 2011) stressing the need for segmented policies targeting the lsquohigh emittersrsquo (Anable et al 1997 WinslottHiselius and Smidfelt Rosqvist 2018)
To understand which factors are suppressing the motivation to decrease private car use for the pre-contemplation segment anadditional regression analysis was conducted using the same variables as in the earlier model but only including the pre-con-templation segment The results are presented in Table 9 The variables that are strictly non-significant (ie variables without anysignificant category) are excluded from the table
The results provide a deeper understanding of the factors affecting the motivation to decrease private car use for pre-con-templators most of which are similar to those in the first regression model Therefore the focus is to highlight a few differencesbetween the two models
Notably climate morality seems to be the most influential variable in the second model Agreeing strongly with having a moral
Table 7Frequencies distributed on the TTM stages (n = 848)
Pre-contemplation Contemplation Preparation Action Maintenance
n () 355 101 37 315 192
0
10
20
30
40
50
60
70
I II III IV
Shar
e of
TTM
stag
e
Pre-contemplation
Contemplation
Preparation
Action
Maintenace
Unfavourable Favourable Preconditions for motivation to decrease private car use
Fig 1 Cross-tabulation of the precondition index and the TTM stages (n = 848)
A Andersson
obligation to decrease onersquos carbon emissions is significant and increases the probability to be motivated to reduce private car use Bycontrast strongly disagreeing with the statement lowers the likelihood and is also significant Further (strongly) agreeing to thestatement that people should be allowed to drive their car as much as they like is significant and negatively affects the motivation todecrease private car use Unlike the first regression model (strongly) disagreeing is not significant In the second model usualcommute mode and travel time are not significant This result may be due to the overall higher commute habit by car and the smallsample size
Consequently among the independent variables included in the model the most important precondition for motivating lsquopersistentdriversrsquo to reduce their private car use seems to be an enhanced moral concern about climate change and how it relates to driving acar The results suggest that the view that people should be allowed to drive their car as much as they want needs to be problematisedand linked to social norms related to car identity which would have to be replaced by alternative identities consistent with asustainable lifestyle Further increasing the attractiveness of cycling and promoting it as a healthy modal choice seems to be crucialto establishing favourable preconditions that motivate lsquopersistent driversrsquo to reduce their private car use
Table 8Significant differences (p lt 005) in the preconditions between the TTM stages analysed using a one-way between-subjects ANOVA followed by apost hoc test (Tukeyrsquos HSD)
I II III IV
a Pre-contemplationbcde 91 376 45 84b Contemplationade 71 212 447 271c Preparationae 63 125 50 313d Actionabe 34 143 389 434e Maintenaceabcd 31 68 278 623
Table 9Multiple regression model including only the pre-contemplation segment (n = 299) Dependent variable motivation to decrease private car use
95 CI
B SE Beta t Sig Lower Upper
Constant 61692 102 605 0 416 8179AttitudesHave climate morality (ref neithernor)
Strongly disagree minus9947 1841 minus03 minus54 0 minus1357 minus632Disagree minus2283 1584 minus008 minus144 0151 minus54 084Agree 2434 1381 01 176 0079 minus029 515Strongly agree 497 1626 017 306 0002 177 817
Advocate private car use (ref neithernor)Strongly disagree minus0026 2591 0 minus001 0992 minus513 508Disagree 1601 1735 005 092 0357 minus182 502Agree minus4553 1431 minus018 minus318 0002 minus737 minus173Strongly agree minus5736 1406 minus025 minus408 0 minus851 minus297
Like cycling (ref neithernor)Strongly disagree 0936 2414 002 039 0698 minus382 569Disagree 1821 1641 006 111 0268 minus141 505Agree 4793 1446 020 332 0001 195 764Strongly agree 488 1626 019 3 0003 168 808
Concerned about health (ref neithernor)Strongly disagree minus4685 1791 minus015 minus262 0009 minus821 minus116Disagree minus0334 1628 minus001 minus021 0838 minus354 287Agree 0068 1371 0 005 096 minus263 277Strongly agree 1955 1588 007 123 0219 minus117 508
Perceive cycling as fast (ref neithernor)Strongly disagree minus1702 151 minus007 minus113 0261 minus468 127Disagree minus3418 159 minus012 minus215 0032 minus655 minus029Agree 1136 1678 004 068 0499 minus217 444Strongly agree minus2984 1689 minus01 minus177 0078 minus631 034
Identify as a driver (ref neithernor)Strongly disagree 3348 1432 014 234 002 053 617Disagree 1865 1563 007 119 0234 minus121 494Agree minus0066 1708 0 minus004 0969 minus343 33Strongly agree 2556 1807 008 141 0159 minus100 612
Note All predictors were entered into the regression model simultaneouslyNagelkerke R2 0513
A Andersson
6 Discussion and conclusion
This study contributes to the body of transportation research that focuses on soft measures for promoting sustainable transport Byanalysing the outcomes of communication efforts usually found in Swedish mobility management campaigns climate morality isfound to be the most important factor affecting the motivation to decrease private car use Usual commute mode car advocacyhealth concern attitudes towards cycling car identity and travel time are also significant factors affecting the motivation to decreaseprivate car use Indexing these factors according to their respective regression coefficients and having them interact with the de-mographic variables reveal differences between the population segments in terms of preconditions for the motivation to reduceprivate car use In particular males the middle-aged people with low educational attainment and rural residents have the leastfavourable prerequisites concerning the factors mentioned above Additional interaction analysis of the stages drawn from the TTMreveals that individuals who have proceeded from the pre-contemplation-stage adapt preconditions that align with those of the actionand maintenance stages Therefore mobility management campaigns can advantageously target such segments to pick the low-hanging fruit Indeed some progress has been made in the design of campaigns that successfully encourage people to reduce drivingin favour of public transport (Fujii and Taniguchi 2006 Thoslashgersen 2009) However the challenge remains in communicating theneed for reduced car traffic to lsquopersistent driversrsquo (Innocenti et al 2013 Lattarulo et al 2018) In this study a separate modelling ofthe pre-contemplation segment reveals climate morality to be even more influential than that for the general sample Therefore away forward for policymakers could be amongst other interventions to communicate the issue of climate change more strategicallyto lsquopersistent driversrsquo to create favourable preconditions for this segment
Simply communicating the need to reduce private car use to drivers who are not concerned about their current travel behaviour islikely to be unsuccessful as found in many studies (eg Beale and Bonsall 2007 Innocenti et al 2013 Lattarulo et al 2018)Nevertheless the demand for private car use needs to be curved across society if climate targets are to be met Therefore preaching tothe converted is not sufficient without simultaneously targeting consumers who have a higher usage of private cars By focusing onthe preconditions for the motivation to reduce driving campaigners can approach lsquopersistent driversrsquo and those in doubt of theirmobility choice Therefore new communication strategies are needed to facilitate persuasive information that is consistent with thevalues and worldviews of lsquopersistent driversrsquo A point of departure for such communication is to increase public awareness of thelinkage between private car use and climate change (Martin et al 2014) health issues caused by sedentary behaviour pollution andnoise (Nisbet and Gick 2008) and the benefits of cycling (Broach et al 2012 Fernaacutendez-Heredia et al 2014) To align messageswith different value constructs they can be framed around various issues (Whitmarsh 2011) such as energy security technologicalinnovation welfare compassion future generations and justice Research suggests that such communication needs to be constructiveand motivating morally logic or supported by moral reasoning include common societal goals and highlight benefits that aretangible here and now (Hulme 2009) One example is the work of Daziano et al (2017) who showed that CO2 emission informationrelated to social goal contextualisation is far more persuasive than just presenting the grams per mile
Recently Bloomberg reported that domestic and international airline travel from Swedish airports had its weakest overall growthin passenger numbers in a decade (Hoikkala and Magnusson 2019) This result coincides with the high number of hazardouswildfires that fuelled the debate and public concern about climate change among Swedes in 2018 The events have led to a new socialnorm related to flying and generated the new expression lsquoflying shamersquo which refers to the shame people feel when they fly due tothe significant CO2 emissions associated with flying (Hoikkala and Magnusson 2019) According to a survey by the World WildlifeFund 23 of Swedes have abstained from travelling by air in the past year to reduce their climate impact 6 more than a yearearlier (WWF 2019) Some 18 of Swedes have chosen to travel by train rather than air This phenomenon needs to be investigatedbefore any conclusion can be drawn from a possible causal relationship between climate concern and restraints from flying Forexample a meta-analysis by Lanzini and Khan (2017) showed that environmental variables predict behavioural intentions but notactual travel behaviours Nevertheless it raises interesting questions on the potential of a growing pro-environmental social norm aspart of the urgent transition towards a low-carbon transport system If the negative environmental effects of driving can be made astangible to the public as flying is today can lsquodriving shamersquo be the social norm of tomorrow
This study has some limitations Stated preferences were used to collect data on individualsrsquo travel behaviour accessibilitydemographics and motivation to decrease private car use when exposed to marketing messages Revealed preferences or a combi-nation of stated and revealed preferences are preferred to validate the responses However stated preferences are a reasonablyaccurate guide to the real underlying preferences and market behaviour (Wardman 1988 Loureiro et al 2003 Lambooij et al2015) The scope of the study was limited to Sweden and more research is needed to investigate whether the results can be gen-eralised to other geographical contexts Finally a limited set of variables had to be used to explain the outcome of the dependentvariable (R2 score asymp 050 for both models) An increased scope could have shed light on the additional variables affecting themotivation to reduce private car use such as social norms perceived behavioural control and other contextual factors
CRediT authorship contribution statement
Alfred Andersson Conceptualization Methodology Formal analysis Resources Writing - original draft Writing - review ampediting
Acknowledgements
The author would like to thank the Trygg-Hansa Research FoundationN03 for their financial support for conducting the survey
A Andersson
which provided valuable data I would also like to acknowledge the people who participated in the survey Finally I would like tothank the two anonymous reviewers for their constructive comments and suggestions which were a great help in improving themanuscript
Declaration of Competing Interest
The author declares no conflicts of interest in this article
Appendix A
Survey questionnaire (n = 1500)
Questionstatement Variable name Scale
Do you have a driving license Driving license yes noDo you have access to at least one bicycle or
e-bikeAccess to a bicycle yes no
Do you live within 500 m of a public trans-port station
Live within 500 m toPT-station
yes no
Do you own or have access to a car for co-mmuting
Access to a car yes no
What mode of transport do you usually useto go to schoolwork
Usual commute mode car public transport bicycle walk other
How long is your travel time from home toschoolwork
Travel time Less than 10 min 10ndash20 min 21ndash30 min 31ndash45 min 46ndash60 min more than 60 min
What statement best describes how you tra-vel in everyday life
TTM lsquoI use the car for the most part and do not intend to change the mode of transport withinthe next six monthsrsquolsquoI am using the car for the most part but I am considering replacing some car journeys withother modes within the next six monthsrsquolsquoI am using the car for the most part but have begun trying other modes instead the last sixmonthsrsquolsquoFor the past six months I have only used the car as a complement to other means oftransportrsquolsquoFor the past six months I have only used other modes than carsrsquo
I am the kind of person who rides a bicycle Identify as cyclist strongly disagree disagree neithernor agree strongly agreeI feel I should cycle more to stay fit Concerned about
healthCycling can be the quickest way to get aro-
undPerceive cycling asfast
I like riding a bicycle Like cyclingDriving a car is part of my identity Identify as a driverI am the kind of person who uses public tr-
ansportIdentify with a PT
I feel a moral obligation to reduce my gree-nhouse gas emissions
Climate morality
People should be allowed to use their cars asmuch as they like
Advocate private caruse
Excluding demographic questions concerning age gender education occupation residential location relationship status and children which werealso asked in the survey
References
Abrahamse W et al 2009 Factors influencing car use for commuting and the intention to reduce it a question of self-interest or morality Transp Res Part F TrafficPsychol Behav 12 (4) 317ndash324
Anable J Boardman B Root A 1997 Travel Emission Profiles a tool for strategy development and driver adviceAnable J Wright S 2013 Work Package 7 Golden Questions and Social Marketing Guidance ReportAvineri E Waygood EO 2013 Applying valence framing to enhance the effect of information on transport-related carbon dioxide emissions Transp Res Part A
Policy Pract 48 31ndash38Banister D 2008 The sustainable mobility paradigm Transp Policy 15 (2) 73ndash80Barr S 2018 Personal mobility and climate change Wiley Interdiscip Rev Clim Change 9 (5) 1ndash19Beale JR Bonsall PW 2007 Marketing in the bus industry a psychological interpretation of some attitudinal and behavioural outcomes Transp Res Part F
Traffic Psychol Behav 10 (4) 271ndash287Beiratildeo G Sarsfield Cabral JA 2007 Understanding attitudes towards public transport and private car a qualitative study Transp Policy 14 (6) 478ndash489Bolderdijk JW et al 2013 Comparing the effectiveness of monetary versus moral motives in environmental campaigning Nat Clim Change 3 (4) 413ndash416Brand C Boardman B 2008 Taming of the few-The unequal distribution of greenhouse gas emissions from personal travel in the UK Energy Policy 36 (1) 224ndash238Brand C Preston JM 2010 rsquo60-20 emissionrsquo-The unequal distribution of greenhouse gas emissions from personal non-business travel in the UK Transp Policy 17
(1) 9ndash19Broach J Dill J Gliebe J 2012 Where do cyclists ride A route choice model developed with revealed preference GPS data Transp Res Part A Policyand Pract
A Andersson
46 (10) 1730ndash1740Cohen-Blankshtain G 2008 Framing transport-environmental policy The case of company car taxation in Israel Transp Res Part D Transp Environ 13 (2) 65ndash74Cook D Weisberg S 1982 Residuals and Influence in Regression (Monographs on Statistics and Applied Probability)Damant-Sirois G El-Geneidy AM 2015 Who cycles more Determining cycling frequency through a segmentation approach in Montreal Canada Transp Res Part
A Policyand Pract 77 113ndash125Daziano RA et al 2017 Increasing the influence of CO2 emissions information on car purchase J Cleaner Prod 164 861ndash871Fernaacutendez-Heredia Aacute Monzoacuten A Jara-Diacuteaz S 2014 Understanding cyclistsrsquo perceptions keys for a successful bicycle promotion Transp Res Part A Policyand
Pract 63 1ndash11Festinger L 1957 A Theory of Cognitive Dissonance Stanford University PressField A 2013 Discovering Statistics using IBM SPSS Statistics - And sex and drugs and rock lsquonrsquo roll fourth ed SAGE Publications Ltd Los Angeles London New Delhi
Singapore Washington DCForward SE 2014 Exploring peoplersquos willingness to bike using a combination of the theory of planned behavioural and the transtheoretical model Revue Europeene
de Psychologie Appliquee 64 (3) 151ndash159Freer D Henderson P Cubie A 2010 324000 People CanrsquoT Be Wrong Evaluating the WorldrsquoS Largest Individualised Marketing Project In Australasian Transport
Research Forum (ATRF) 33rd 2010 Canberra ACT Australia [Online] Available from httpstridtrborgview1096932Friman M Huck J Olsson LE 2017 Transtheoretical model of change during travel behavior interventions an integrative review Int J Environ Res Public
Health 14 (6) 1ndash15Fujii S Taniguchi A 2006 Determinants of the effectiveness of travel feedback programs-a review of communicative mobility management measures for changing
travel behaviour in Japan Transp Policy 13 (5) 339ndash348Gatersleben B Appleton KM 2007 Contemplating cycling to work attitudes and perceptions in different stages of change Transp Res Part A Policyand Pract 41
(4) 302ndash312Gatersleben B Uzzell D 2007 Affective appraisals of the daily commute comparing perceptions of drivers cyclists walkers and users of public transport Environ
Behav 39 (3) 416ndash431Godin G et al 2004 Stages of motivational readiness for physical activity a comparison of different algorithms of classification Brit J Health Psychol 9 (2)
253ndash267Goumlssling S Cohen S 2014 Why sustainable transport policies will fail EU climate policy in the light of transport taboos J Transp Geogr 39 197ndash207Handy SL Xing Y 2011 Factors correlated with bicycle commuting a study in six small US cities Int J Sustain Transp 5 (2) 91ndash110Heinen E Maat K van Wee B 2013 The effect of work-related factors on the bicycle commute mode choice in the Netherlands Transportation 40 (1) 23ndash43Hess DB Bitterman A 2016 Branding and selling public transit in North America an analysis of recent messages and methods Res Transp Bus Manage 18
49ndash56Hiselius LW Rosqvist LS 2015 Mobility Management campaigns as part of the transition towards changing social norms on sustainable travel behavior J Cleaner
Prod 123 1ndash8Hoen A Geurs KT 2011 The influence of positionality in car-purchasing behaviour on the downsizing of new cars Transp Res Part D Transp Environ 16 (5)
402ndash408Hoikkala H Magnusson N 2019 As lsquoFlying Shamersquo Grips Sweden SAS Ups Stakes in Climate Battle [Online] Bloomberg News Available from httpswww
bloombergcomnewsarticles2019-04-14as-flying-shame-grips-sweden-sas-ups-stakes-in-climate-battle [Accessed 240419]Hulme M 2009 Why We Disagree About Climate Change Understanding Controversy Inaction and Opportunity Cambridge University Press CambridgeHyman MR Sierra JJ 2012 Adjusting self-reported attitudinal data for mischievous respondents Int J Mark Res 54 (1) 129ndash145IEA 2018 CO₂ Emissions From Fuel Combustion 2018Innocenti A Lattarulo P Pazienza MG 2013 Car stickiness heuristics and biases in travel choice Transp Policy 25 158ndash168Jia N et al 2018 Influence of attitudinal and low-carbon factors on behavioral intention of commuting mode choice ndash A cross-city study in China Transp Res Part
A Policyand Pract 111 (March) 108ndash118Ko J et al 2011 Who produces the most CO2 emissions for trips in the Seoul metropolis area Transp Res Part D Transp Environ 16 (5) 358ndash364Lambooij MS et al 2015 Consistency between stated and revealed preferences a discrete choice experiment and a behavioural experiment on vaccination
behaviour compared BMC Med Res Method 15 (19) 1ndash8Lanzini P Khan SA 2017 Shedding light on the psychological and behavioral determinants of travel mode choice a meta-analysis Transp Res Part F Traffic
Psychol Behav 48 13ndash27Lattarulo P Masucci V Pazienza MG 2018 Resistance to change car use and routines Transport Policy 74 (November 2018) 63ndash72Loureiro A Veloso S 2017 Handbook of Environmental Psychology and Quality of Life Research (August 2017) [Online] Available from doiorg101007978-3-
319-31416-7Loureiro ML McCluskey JJ Mittelhammer RC 2003 Are stated preferences good predictors of market behavior Land Econ 79 (1) 44ndash45Martin E et al 2014 Evaluating the public perception of a feebate policy in California through the estimation and cross-validation of an ordinal regression model
Transp Policy 33 144ndash153Matteo Mazziotta AP 2013 Methods for constructing composite indices one for all or all for one Italian Rev Econ Demogr Stat 67 (2) 67ndash80Meyers LS Glenn CG Guarino AJ 2013 Performing Data Analysis Using IBM SPSS John Wiley amp Sons IncorporatedMir HM et al 2016 The impact of outcome framing and psychological distance of air pollution consequences on transportation mode choice Transp Res Part D
Transp Environ 46 328ndash338Nisbet EKL Gick ML 2008 Can health psychology help the planet Applying theory and models of health behaviour to environmental actions Canadian Psychol
49 (4) 296ndash303Paacuteez A Whalen K 2010 Enjoyment of commute a comparison of different transportation modes Transp Res Part A Policyand Pract 44 (7) 537ndash549Polk M 2003 Are women potentially more accommodating than men to a sustainable transportation system in Sweden Transp Res Part D Transp Environ 8 (2)
75ndash95Prochaska JO Diclemente CC 1986 Toward a comprehensive model of change In Miller WR Heather N (Eds) Treating Addictive Behaviors Processes of
Change Springer US Boston MA pp 3ndash27Rondinella G Fernandez-Heredia A Monzoacuten A 2012 Analysis of perceptions of utilitarian cycling by level of user experience In Proceedings of Transport
Research Board Annual Meeting Washington DCSmidfelt Rosqvist L Winslott Hiselius L 2018 Understanding high car use in relation to policy measures based on Swedish data Case Stud Transport Policy
httpsdoiorg101016jcstp201811004Steg L 2005 Car use Lust and must Instrumental symbolic and affective motives for car use Transp Res Part A Policy and Pract 39 (3 SPEC ISS) 147ndash162Steg L Tertoolen G 1999 Sustainable transport policy the contribution from behavioural scientists Public Money Manage 19 (1) 63ndash69Steg L Vlek C Slotegraaf G 2001 Instrumental-reasoned and symbolic-affective motives for using a motor car Transp Res Part F Traffic Psychol Behav 4 (3)
151ndash169Steinhorst J Kloumlckner CA 2017 Effects of monetary versus environmental information framing implications for long-term pro-environmental behavior and
intrinsic motivation Environ Behav 1ndash35Svensk cycling 2018 Cykeltrendrapport (Bicycling trend report) Svensk cykling (Swedish cycling)Swedish Association of Local Authorities and Regions 2016 Classification of Swedish municipalities 2017 Available from httpssklsedownload18
6b78741215a632d39cbcc851487772640274Classification of Swedish Municipalities 2017pdf [Accessed 260618]Swedish EPA 2018 Analysis of Swedish Climate Statistics 2018Swedish Transport Administration 2019 Transport sector emissions Available from httpswwwtrafikverketsefor-dig-i-branschenmiljomdashfor-dig-i-branschen
A Andersson
energi-och-klimatKlimatbarometer [Accessed 170419]Taniguchi A et al 2003 Psychological and behavioral effects of travel feedback program for travel behavior modification Transp Res Rec 1839 (03ndash3711)
182ndash190Tertoolen G Van Kreveld D Verstraten B 1998 Psychological resistance against attempts to reduce private car use Transp Res Part A Policy and Pract 32 (3)
171ndash181Thoslashgersen J 2009 Promoting public transport as a subscription service effects of a free month travel card Transp Policy 16 (6) 335ndash343Thoslashgersen J 2018 Transport-related lifestyle and environmentally-friendly travel mode choices a multi-level approach Transp Res Part A Policy and Pract 107
November 2017 166ndash186Transport Analysis 2018 Fordon 2018 [Cars 2018] by Trafikanalys (Transport Analysis)Transport Analysis 2015 RVU Sverige 2011-2014 [national travel survey 2011-2014] by Trafikanalys (Transport Analysis)Wardman M 1988 A comparison of revealed preference and stated preference models of travel behaviour J Transport Econ PolicyWaygood EO Avineri E Lyons G 2012 The role of information in reducing the impacts of climate change for transport applications In Ryley T Chapman L
(Eds) Transport and Climate Change pp 313ndash340Waygood EOD Avineri E 2018 CO2 valence framing is it really any different from just giving the amounts Transp Res Part D Transp Environ 63 718ndash732Whitmarsh L 2011 Scepticism and uncertainty about climate change dimensions determinants and change over time Global Environ Change 21 690ndash700Winslott Hiselius L Smidfelt Rosqvist L 2018 Segmentation of the current levels of passenger mileage by car in the light of sustainability targets ndash The Swedish
case J Cleaner Prod 182 331ndash337WWF 2019 WWFs Klimatbarometer Allt fler vaumlljer bort flyg och koumltt ndash och kvinnorna garingr foumlre Available from httpswwwwwfsepressmeddelandewwfs-
klimatbarometer-allt-fler-valjer-bort-flyg-och-kott-och-kvinnorna-gar-fore-3241404 [Accessed 250419]
A Andersson
ldquo
rdquo
ndash
rsquo rsquo
ndash
rsquo
rsquo
uml
journal homepage wwwelseviercomlocatetrd
Paper V
uml
uml
uml
uml
uml
journal homepage wwwelseviercomlocatetrd
rsquo
oslash
oslash
uml
rsquo
oslash
oslash
ndash
oslash
ndash ndash
ndash ndash
ndash
ndash
oslash
uml
rsquo
uml
uml
rsquo
ndash
uml
uml
ndash
rsquo
= =
lt
gelt
uml
uml
rsquo uml uml rsquo
rsquo
rsquo
ndash ndash ndash ndash ndash
uml
ndash
= ndash
= ndash rsquo
= ndash
rsquo
lt
lt
lt
uml
ndash
rsquo
rsquo
rsquo
lt
lt
lt
= =
uml
84
33
51
32
18
77
0
20
40
60
80
100
rsquo
= =
lt
lt
0 10 20 30 40 50 60
Expensive to buyHeavy bike
Technical issues with bikeTime consuming comp to a car
Risk of theftCarrying heavy battery
Errands with goodsBad weather
Save moneyWellbeing
No congestioneasier to parkFastsave time
PleasantfunFresh air
Good for the environmentExercisehealth
Easyconvenient
Positive
Negative
uml
uml
rsquo
rsquo
uml
rsquo
oslash
uml
uml
uml uml
uml
uml
ndash
ndash
ndash
ndash
`
ndash
ndash
ndash
ndash
ndash
ndash
uml uml
ndash
uml
ndash
oslash mdash rsquo
ndash
oslash
ndash
oslash ndash
ndash
uml
ndash
ndash
ndash
ldquo rdquo rsquo
ndash
uml
ndash
ndash
ˆ ndash
uml
ndash
oslash oslash mdash
ndash
ndash
ndash
ndash ndash
ndash
uml
- Blank Page
- Blank Page
- Blank Page
- Blank Page
-
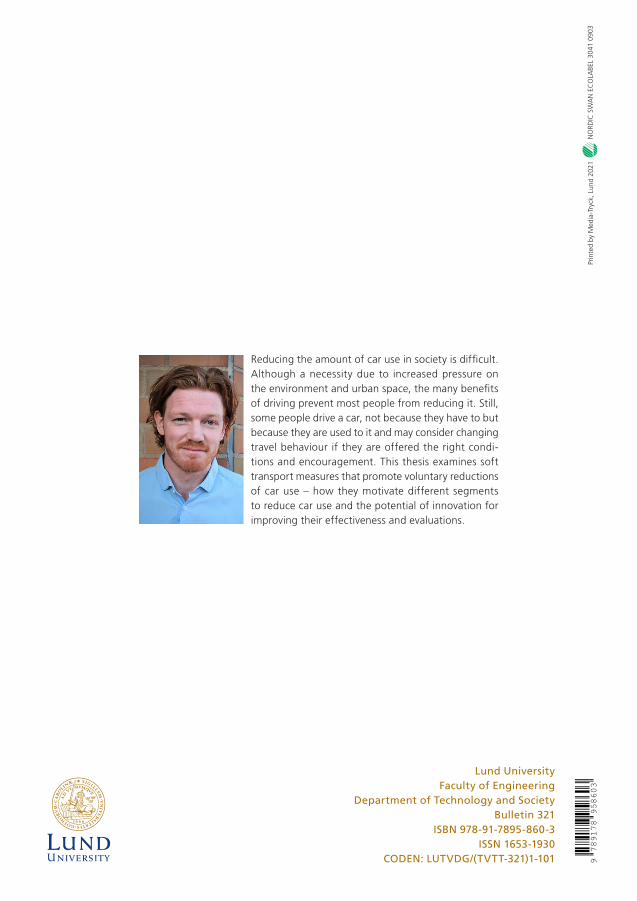
Soft measures to shift modality
Alfred Soumlderberg
DOCTORAL DISSERTATION by due permission of the Faculty of Engineering Lund University Sweden
To be defended at the Faculty of Engineering John Ericssons vaumlg 1 in auditorium VA on 28 May at 1000
Faculty opponent Professor Lars E Olsson Karlstad University
Organisation LUND UNIVERSITY
Document name Doctoral dissertation
Faculty of Engineering Department of Technology and Society
Date of issue 28 May 2021
Author Alfred Soumlderberg Sponsoring organisation K2 The Swedish Knowledge Centre for Public Transport
Title and subtitle Soft measures to shift modality Abstract The purpose of this thesis is to contribute knowledge on how to reduce the demand for car use by encouraging a modal shift towards walking cycling and public transport Soft transport measures are the domain for this investigation Two issues regarding soft transport measures are the focus The first regards the lack of methodologically sound evaluations of soft measures and the potential for innovations to alleviate this and influence travel behaviour The second issue is the need for an increased understanding of what factors motivate diverse groups of people to reduce car use and what implications this can have for targeting soft measures The thesis comprises five papers Paper I investigated how information and communication technology (ICT) has been used to influence behaviour change and synthesizes key aspects into a conceptual model for creating a behaviour change support system (BCSS) for smartphone applications based on theory Paper II evaluated a fielded mobility service application (MSA) that was introduced in 13 Swedish organisations Paper III explored marketing messages that promote sustainable transport and motivation to reduce private car use within different segments Paper IV explored the preconditions affecting the motivation of people to reduce private car use In Paper V a randomised controlled trial with GPS data from 98 frequent drivers in Sweden was conducted to investigate the substitution effect of e-bikes The results in Paper I suggest that customisation to the user relevant and contextualised information and feedback commitment and appealing design are important aspects when influencing users to change behaviour through smartphone applications The results in Paper II gave indications that the MSA made it easier to travel by public transport Three factors that influence the success of a new MSA as a means to increase sustainable business trips were identified management control and proactiveness perceived improvement of intervention and functions and technical sufficiency The results in Paper III show that messages relating to the environment personal and societal health collective responsibility and morality performs better than messages relating to personal health financial benefits convenience and status The results in Paper IV show that climate morality is a critical factor affecting motivation to reduce car use Usual commute mode car advocacy health concerns attitudes towards cycling car identity and travel time also influence motivation The results in Paper V show that the treatment group increased cycling on average with one trip and 65 km per day per person which led to a 25 increase in total cycling The whole increase was at the expense of car use which on average decreased by one trip and 14 km per person per day a decrease in car mileage of 37 This thesis makes a novel contribution to the soft transport policy field by investigating innovations as a means for driving behaviour change as well as facilitating better evaluations Another contribution to the field is the combined analyses of segmentation and motivation to reduce car use which give insights into motivational differences and possible strategies for targeting
Key words Soft transport measures Modal shift Innovation ICT E-bikes Segmentation Motivation Evaluation Classification system andor index terms (if any)
Supplementary bibliographical information Language English
ISSN 1653-1930Bulletin ndash Lund University Faculty of Engineering Department of Technology and Society 321
ISBN 978-91-7895-860-3 (print)ISBN 978-91-7895-859-7 (pdf)
Recipientrsquos notes Number of pages 109
Price
Security classification
I the undersigned being the copyright owner of the abstract of the above-mentioned dissertation hereby grant to all reference sources permission to publish and disseminate the abstract of the above-mentioned dissertation
Signature Date 2021-04-19
Soft measures to shift modality
Alfred Soumlderberg
Cover photograph by Alfred Soumlderberg
Copyright 1-109 Alfred Soumlderberg
Paper I copy Elsevier Ltd
Paper II copy The authors
Paper III copy Elsevier Ltd
Paper IV copy Elsevier Ltd
Paper V copy The authors
Faculty of Engineering Department of Technology and Society
ISBN 978-91-7895-860-3 (print) 978-91-7895-859-7 (pdf) ISSN 1653-1930
Printed in Sweden by Media-Tryck Lund University Lund 2021
To my sisters Josefine and Lovisa
Table of contents
Preface 9 Summary 10 Populaumlrvetenskaplig sammanfattning 12 Papers included in the thesis 14 Abstracts 15
1 Introduction 17 11 Car use Two sides of the same coin 17 12 The benefits of soft transport measures 18 13 Key issues addressed 19 14 Aims and objectives 21 15 Main contribution 21 16 Structure of the thesis 22
2 The little brother in transport policy 23 21 Born in the USA 23 22 Managing travel demand through lsquohardrsquo and lsquosoftrsquo measures 24 23 Evaluation and effectiveness of soft measures 25 24 Soft measures in the context of Swedish transport planning 26
3 Framework of the thesis 29 31 Segmentation30 32 Motivation 34 33 Evaluation 36
4 Methods and data 39 41 Progression of the thesis 39 42 Method rationale 40 43 Datasets 41
431 Literature data 41 432 Business travel data 42 433 National survey data 43 434 E-bike trial data 46
44 Representativeness of datasets 48 45 Analyses 49
451 Analytical samples and dependent variables 50 452 Type of analyses 52
5 Results 57 51 Paper I 57 52 Paper II 59 53 Paper III 61 54 Paper IV 63 55 Paper V 67
6 Discussion 71 61 Recapitulation of aims 71 62 First aim Potential of innovations for soft transport measures 71 63 Second aim Motivation to decrease car use and the use of segmentation for improving soft measures 76 64 Concluding remarks 80
641 Limitations 82 642 Further research 83
References 85
Acknowledgement 104
Appendix A Questionnaire items 106
Appendix B Papers 109
9
Preface
One early morning in the spring of 2013 my girlfriend (now wife) and I waited outside the hospital in Lund equipped with goodie bags that were to be distributed to employees who came to work by bicycle We had recently started studying and worked extra hours for the technical administration at Lund municipality Our mission was simple distribute the goodie bags to as many bicycle commuters as possible
The work required some ability to run alongside the cyclists long enough to be able to complete the handover of the bags At the time I did not reflect much on what effects this exercise would have on the cyclistsrsquo attitudes or future commuting behaviour (I thought more about how long we would have to chase cyclists before the bags would run out) In hindsight I realise how complicated such an evaluation would have been What would be measured and in what way Should a control group be used and if so how to avoid contamination from the test group How much effect can be expected and what requirements does this place on sample size And so on
Something that crossed my mind however was the different reactions we had from the cyclists Most seemed genuinely happy with the gesture although a few expressed that it would have been more motivating if they had received something else lsquoI would rather have a sandwichrsquo a man said when inspecting the content of the bag bicycle lights a saddle cover a reflector and a thank you for cycling card In this first encounter with soft transport measures I thus noticed that incentives motivate people in different ways
My later experiences of soft transport measures and attempts of persuading people to change behaviour (a term I never liked1) both in practice and in studying them has made me aware of the high multitude and innovativeness that exist in this field However these strengths may also contribute to weaknesses concerning lack of continuity and stringency I have great respect for the challenges that planners face administrative practical and financial in the implementation of soft transport measures Hence I hope that this research can be of scientific as well as of practical use a dual wish that should not be overly naive in light of Kurt Lewin (1951) who wrote that lsquotherersquos nothing so practical as a good theoryrsquo (p 169)
Alfred Soumlderberg
8 April 2021
1 I was also not very happy about changing behaviour as a child My parents (featured on the cover) can attest to this It required a lot of persuasion on their part to convince me to swap the Bobby Car for the bike
10
Summary
Traffic accumulated by cars is responsible for considerable problems in our cities The problem is partly about the negative effects on human health due to harmful particulate emissions noise traffic accidents and sedentary lifestyles partly about the space it occupies which leads to congestion and the fact that valuable land is taken up by road infrastructure and parking lots In a bigger perspective car traffic also contributes to greenhouse gas emissions that fuel climate change
At the same time the car is ingrained in our way of life and a necessity for many peoples lives to function Politicians are therefore generally reluctant to limit car use and as a result transport planners find it difficult to enforce measures that lead to a significant reduction in car traffic Attempts are being made with soft measures that encourage people to walk cycle and take public transport These measures can for instance be to inform about alternatives to car use marketing new cycle routes and offering free trial periods with public transport So far it has proved difficult to sufficiently evaluate these measures which has led to scepticism about their usefulness At the same time we need to know more about what it is that motivates modal shifts for different groups Thus more knowledge about soft measures is needed
Innovations in the form of smartphones and electric bicycles (e-bikes) have opened new opportunities for soft measures both in terms of evaluation of these and the potential to influence car use Furthermore previous research has shown that it is important to target soft measures and adapt information and marketing to specific target groups also called segmentation Against this background this thesis (including five individual papers) has examined smartphones e-bikes and marketing These three elements have been used in variation to investigate motivation to reduce car use in favour of walking cycling and public transport segmenting and targeting as well as evaluation of soft measures
Regarding the possibility of smartphone applications to influence travel behaviour explored in the first paper a review of previous research showed that there is potential but that too few studies have been conducted to be able to draw any general conclusions The paper found that applications need to be customised to the user provide relevant information and feedback about the userrsquos behaviour create a commitment towards its use and have a user-friendly design The second paper presented a process evaluation of a project where an application was developed to facilitate sustainable business travel However the study showed several weaknesses with the application and the difficulty in evaluating the effect of such a soft measure which gave lessons about both study design and the development of applications and their implementation in organisations
11
In the third paper we found that marketing for sustainable travel is more motivating if it is aimed at the collective rather than the individual and contains altruistic messages linked to the environment and health The respondentsrsquo stated motivation to reduce car use reflected their current car use and attitude towards the environment and various means of transport This underlines the importance of adapting marketing to the target group The fourth paper showed that onersquos morality towards the climate has a significant impact on the motivation to reduce car use but habits travel time and attitudes towards car and bicycle use also play a role Such factors differ between gender age level of education and between urban and rural areas and may be important for the segmentation used for soft measures
The results from the fifth paper showed that e-bikes have exciting potential to replace the car and contribute to more sustainable travel behaviours In a field experiment where the participants consisted of frequent drivers car travel measured in distance decreased by an average of 37 as a result of the participants gaining access to their respective e-bike The share of cycling of total travel increased by just over 20 on average The participants measured their travel behaviour and answered survey questions using their smartphones which contributed to high data quality Both the effect evaluation of the use of e-bikes and the use of smartphones to measure travel behaviour make a novel and important contribution to the research field on soft transport measures and the application of these in practice
The thesis concludes that innovations have great potential to improve soft measures both as a means for contributing to increased sustainable travel behaviours and as a means of making more rigorous evaluations The thesis also contributes to the knowledge about how sustainable transport can be marketed what creates motivation to reduce car use as well as different perspectives on segmentation and which target groups soft measures can be aimed at
12
Populaumlrvetenskaplig sammanfattning
Bilismen orsakar en maumlngd problem i varingra staumlder Det handlar dels om negativa effekter paring maumlnniskors haumllsa paring grund av skadliga partikelutslaumlpp buller trafikolyckor och stillasittande dels om platsen den tar i anspraringk vilket leder till traumlngsel och att vaumlrdefull mark tas i besittning av vaumlginfrastruktur och parkeringsplatser I ett stoumlrre perspektiv bidrar biltrafiken aumlven till utslaumlpp av vaumlxthusgaser som eldar paring klimatfoumlraumlndringen
Samtidigt aumlr bilen ett naturligt inslag i varingrt saumltt att leva och helt noumldvaumlndig foumlr att maringnga personers livspussel ska garing ihop Politiker vill daumlrfoumlr ogaumlrna begraumlnsa bilens framfart och transportplanerare har som foumlljd svaringrt att tvinga fram ett minskat bilresande Daumlrfoumlr goumlrs aumlven foumlrsoumlk med mjuka aringtgaumlrder som syftar till att uppmuntra fler maumlnniskor att garing cykla och aringka kollektivtrafik Det kan handla om att informera om alternativ till bil marknadsfoumlra nya cykelstraringk och att erbjuda gratis provperioder med kollektivtrafik Hittills har det visat sig svaringrt att utvaumlrdera dessa aringtgaumlrder paring ett bra saumltt vilket lett till skepsis gaumlllande dess nytta Samtidigt behoumlver vi veta mer om vad som motiverar aumlndrade resvanor foumlr olika maringlgrupper Det behoumlvs helt enkelt mer kunskap om mjuka aringtgaumlrder
Ny teknik i form av exempelvis smartphones och el-cyklar har oumlppnat upp nya moumljligheter foumlr mjuka aringtgaumlrder baringde vad gaumlller utvaumlrdering av dessa och potentialen att paringverka bilanvaumlndningen Vidare saring har tidigare forskning visat att det aumlr viktigt att rikta mjuka aringtgaumlrder och anpassa information och marknadsfoumlring till specifika maringlgrupper aumlven kallat segmentering Mot denna bakgrund har avhandlingen undersoumlkt smartphones el-cykling och marknadsfoumlring Dessa tre element har paring olika saumltt anvaumlnts foumlr att undersoumlka motivation att minska bilresandet till foumlrmaringn foumlr garingng cykel och kollektivtrafik samt maringlgruppsanpassning och utvaumlrdering av mjuka aringtgaumlrder
Naumlr det gaumlller smartphoneapplikationers moumljlighet att paringverka resandet visade avhandlingens foumlrsta artikel i en genomgaringng av tidigare forskning att det finns potential men att foumlr faring studier har genomfoumlrts foumlr att kunna dra naringgra generella slutsatser om hur mycket I artikeln fastslogs att applikationer behoumlver anpassas till anvaumlndaren ge relevant information och feedback om ens beteende skapa engagemang och ha en anvaumlndarvaumlnlig design I den andra artikeln genomfoumlrdes en processutvaumlrdering av ett projekt daumlr en applikation utvecklades med syfte att underlaumltta det haringllbara tjaumlnsteresandet Studien visade dock paring flera svagheter med applikationen och svaringrigheten i att utvaumlrdera effekten av en saringdan mjuk aringtgaumlrd vilket gav laumlrdomar om saringvaumll studiedesign som utvecklingen av applikationer och dess implementering i organisationer
I den tredje artikeln fann vi att marknadsfoumlring foumlr haringllbart resande aumlr mer motiverande om den riktar sig till kollektivet snarare aumln individen och inneharingller altruistiska budskap
13
kopplat till miljouml och haumllsa Respondenternas angivna motivation att minska bilanvaumlndningen speglade deras nuvarande bilanvaumlndning och attityd gentemot miljoumln och olika faumlrdmedel Detta understryker vikten av att anpassa marknadsfoumlring till de maringlgrupper man vill vaumlnda sig till Den fjaumlrde artikeln visade att individers klimatmoral det vill saumlga det upplevda personliga ansvaret att minska sina vaumlxthusgasutslaumlpp har en betydande paringverkan paring motivationen att minska bilanvaumlndningen Aumlven vanor restid och attityder gentemot bil- och cykelanvaumlndning spelar roll Saringdana faktorer skiljer sig aringt beroende paring koumln aringlder utbildningsnivaring och mellan stad och landsbygd och kan ha betydelse foumlr den segmentering som anvaumlnds foumlr mjuka aringtgaumlrder
Resultatet fraringn den femte artikeln visade att el-cykeln har stor potential att ersaumltta bilen och bidra till ett mer haringllbart resande I en faumlltstudie daumlr deltagarna utgjordes av vanebilister minskade bilresandet maumltt i distans med i genomsnitt 37 till foumlljd av att deltagarna fick tillgaringng till varsin el-cykel Andelen cykling av allt resande oumlkade med drygt 20 i snitt Deltagarna fick maumlta sina resvanor och svara paring fraringgor om sitt resande i sina smartphones vilket bidrog till houmlg datakvaliteacute Baringde effektutvaumlrderingen av el-cykling och anvaumlndningen av smartphones foumlr att maumlta resvanor ger ett nytt och viktigt bidrag till forskningen om mjuka transportaringtgaumlrder samt den praktiska tillaumlmpningen av dessa
Slutsatsen fraringn denna avhandling aumlr att ny teknik har stor potential att foumlrbaumlttra mjuka aringtgaumlrder baringde som medel foumlr att bidra till ett oumlkat haringllbart resande och som medel foumlr att goumlra mer gedigna utvaumlrderingar Avhandlingen bidrar aumlven med kunskap om hur haringllbart resande kan marknadsfoumlras vad som skapar motivation att minska bilresandet samt olika perspektiv paring segmentering och vilka maringlgrupper som mjuka aringtgaumlrder kan riktas till
14
Papers included in the thesis
Paper I Promoting sustainable travel behaviour through the use of smartphone applications A review and development of a conceptual model A Andersson L Winslott Hiselius E Adell Travel Behaviour and Society 11 52-61 (2018) A Andersson Literature review analysis of empirical material development of the conceptual model manuscript writing
Paper II Evaluating a Mobility Service Application for Business Travel Lessons Learnt from a Demonstration Project A Andersson L Winslott Hiselius P Arnfalk J Berg S Forward Sustainability (Switzerland) 12(3) 1-18 (2020) A Andersson Data management statistical analyses conceptual framework the main part of manuscript writing Paper III The effect of marketing messages on the motivation to reduce private car use in different segments A Andersson L Winslott Hiselius E Adell Transport Policy 90 22-30 (2020) A Andersson Developing the survey data management statistical analyses literature review manuscript writing Paper IV Is climate morality the answer Preconditions affecting the motivation to decrease private car use A Andersson Transportation Research Part D Transport and Environment 78 1-14 (2020) Paper V What is the substitution effect of e-bikes A randomised controlled trial A Soumlderberg fka Andersson E Adell L Winslott Hiselius Transportation Research Part D Transport and Environment 90 1-11 (2021) A Soumlderberg fka Andersson Funding acquisition study design literature review developing survey items data management statistical analyses manuscript writing ndash original draft
15
Abstracts
Paper I The negative effects of transport in terms of pollution congestion and climate change have driven the need for increased cleaner and more efficient modes of transport especially in urban settings While new technology can solve some of these issues behaviour changes have also been identified as an important factor to achieve a modal shift from cars to walking cycling or public transport This study investigates how information and communication technology (ICT) has been used to influence behaviour change and synthesizes key aspects into a conceptual model for creating a behaviour change support system (BCSS) for smartphone applications A literature review concerning behaviour change and ICT in the fields of transport health energy and climate was conducted to gather empirical evidence which forms the foundation of the conceptual model The empirical findings were verified against a theoretical framework consisting of the transtheoretical model theory of planned behaviour diffusion of innovations and the concept of gamification The results suggest that customisation to the user relevant and contextualised information and feedback commitment and appealing design are important aspects when influencing users to change behaviour through smartphone applications The conceptual model provides further knowledge of key aspects to consider when developing persuasive tools that aim to encourage more sustainable modes of transport
Paper II Business travel contributes to significant greenhouse gas emissions and there is a need for measures that reduce the demand for trips made with energy-intensive means of transport In this study a mobility service application (MSA) introduced in 13 Swedish organisations was tested and evaluated to facilitate booking and handling of business trips in particular public transport A before and after study consisting of surveys and interviews with employees at the organisations was conducted The results show that the MSA was mostly used for regional and local public transport trips and users stated that the MSA made it easier to travel by public transport although this particular result should be seen as tentative due to the small sample size Three factors that influence the success of a new MSA as a means to increase sustainable business trips were identified management control and proactiveness perceived improvement of intervention and functions and technical sufficiency The results also highlight the need to establish organisational conditions that facilitate sustainable business travel such as a coherent travel policy accessibility to sustainable modes of transport and a culture that encourages environmentally friendly behaviour The study suggests improvements that can be made to similar interventions and strategies which can be introduced to promote sustainable business travel
16
Paper III This study explores marketing messages promoting sustainable transport and reported motivation to reduce private car use within different segments A stated preference survey targeting a sample of 1300 residents in Sweden was conducted and exploratory factor analysis was used to identify underlying dimensions of a set of 19 marketing messages Self-efficacy and collective efficacy were defined as latent factors and the latter was found to be a better motivator for all segments For the most car-advocating segment however the factors (both self and collective efficacy) were unsuccessful in inducing any reported motivation to reduce private car use Assimilation bias seems to influence the respondentsrsquo interpretation of marketing messages
Paper IV Persuasive messages are commonly used in campaigns promoting sustainable transport to motivate people to reduce private car use This paper explores the preconditions affecting the motivation of people to reduce private car use when exposed to such messages A sample of 1300 Swedish residents was analysed for the effect of variables related to accessibility usual commute mode and attitudes Significant variables were used to create a precondition index which was cross-tabulated with demographic variables and stages drawn from the transtheoretical model The results show that there are differences in the preconditions regarding motivation to reduce private car use between segments of the population Results indicate that climate morality is a critical factor affecting motivation specifically the motivation of persistent drivers Usual commute mode car advocacy health concerns attitudes towards cycling car identity and travel time also influence motivation Males the middle-aged people with low educational attainment and rural residents have the least favourable preconditions concerning motivation to reduce private car use
Paper V As sales of e-bikes increase so does the need for reliable evaluations of which means of transport the e-bike replaces the substitution effect A randomised controlled trial with GPS data from 98 frequent drivers in Sweden was conducted to investigate the effect of the e-bike on modal choice the number of trips and distance as well as perceptions of the e-bike as a substitute for the car The results demonstrate that the treatment group increased cycling on average with one trip and 65 km per day per person which led to a 25 increase in total cycling The whole increase was at the expense of car use which on average decreased by one trip and 14 km per person per day a decrease in car mileage of 37
17
1 Introduction
The purpose of this thesis is to contribute knowledge on how to reduce the demand for car use by encouraging a modal shift towards walking cycling and public transport In the big picture car use is a critical issue that affects the balance between all three dimensions of the concept of sustainability socially environmentally and economically (van Wee 2014) as well as the intergenerational definition that lsquothe current generation should not fulfil its needs in such a way that it jeopardizes the needs of future generationsrsquo (WCED 1987) On a smaller scale the issue of car use affects individuals to a high degree as it accounts for a large proportion of all travel (most notably in the western world) and is perceived as a major asset by most households (Lucas and Jones 2009) There is undeniably a duality of car use When designing measures that force a reduction in car travel improvements are generated in certain respects and for some people while also leading to deteriorations in other respects for some people (Levinson 2002) However when people choose to voluntarily alter their car use instead of being forced benefits are mutual (Taylor and Ampt 2003)
11 Car use Two sides of the same coin
Car use makes a significant contribution to general welfare in societies and for individuals In economic terms the speed and flexibility of the car combined with infrastructure and policies that pave its way help people and businesses to connect As a result positive agglomeration and productivity effects can be realised (Boumlrjesson et al 2019 Graham 2007) which in turn can facilitate functioning labour markets and increased employment (Norman et al 2017) Moreover the car provides people with convenience and freedom to travel independently from a to b while constituting a personalised space for socialising with family and friends For many people travel by car is related not only to instrumental benefits but also affective and symbolic benefits (Steg 2005) and may be desired for its own sake (Mokhtarian et al 2001) For those with access to a car it provides accessibility to live and work in areas that are unreachable by public transport or active travel modes such as walking and cycling
In most industrialised countries the car is deeply entrenched in the way of living and despite recent expectations of lsquopeak carrsquo in conjunction with the 2008 economic
18
recession (Bastian et al 2016 Stapleton et al 2017) car use per capita at least in Sweden seems fixed There is no doubt that car use provides enormous benefits to society and individuals (Banister 2011)
Flipping the coin reveals the downside of car use also referred to as negative transport externalities which harm people society and the environment Traffic is responsible for (severe) injuries and fatalities (Elvik et al 2009) congestion (Stopher 2004) local air pollution and noise (Holgate 2017) degradation of urban space and landscapes (Goumlssling 2020 2016) as well as the release of carbon dioxide which exacerbates climate change (Banister 2005) The latter has been at the forefront of car-related issues addressed in the last decades due to the large portion of CO2 emissions stemming from the transport sector In Sweden this portion accounts for a third of domestic emissions of which 93 originates from road transport and 67 of this from passenger transport (Swedish Transport Administration 2020) As such there is no doubt that car use also causes tremendous damage to people and the planet at least in its current shape
12 The benefits of soft transport measures
In both research and practice the way to limit the release of carbon emissions caused by transport is often divided into three mitigation measures (i) switching to low-carbon fuels (ii) improving vehicle efficiency and (iii) reducing vehicle travel (Axsen et al 2020) For fuels the goal is to replace diesel and gasoline with electricity biofuels and hydrogen (each from low-carbon sources) while vehicle efficiency is principally enforced by requiring car manufacturers to comply with vehicle emission standards In terms of reducing vehicle travel this is referred to in transport research as travel demand management (TDM) (Gaumlrling et al 2002) TDM measures are in turn divided into lsquohardrsquo and lsquosoftrsquo measures The former typically includes physical measures such as changes in infrastructure as well as legal and financial policies while the latter includes measures such as information incentives and administrative changes Hard measures are often more coercive than soft measures which aim to empower individuals to voluntarily reduce their car use (Bamberg et al 2011)
The three overarching measures (fuel-switching vehicle efficiency and TDM) will need to be integrated into strong policy mixes to fulfil the climate targets for the transport sector (Banister 2019 Brand et al 2020 Milovanoff et al 2020) Some argue that it is unlikely that TDM measures will contribute significantly in this sense although they can lsquoprovide important complementary co-benefits and mitigation of rebound effects from other efficiency policiesrsquo (Nieuwenhuijsen 2020)
Regardless of the extent to which soft measures lead to reduced carbon dioxide emissions from the transport sector there are many benefits from increasing the share
19
of walking cycling and public transport Successful soft measures lead to improved public health through reduced pollution and higher levels of physical activity (Shaw et al 2014) less congestion as well as less need for road expansions and parking infrastructure while improving equality and road safety (Anable and Goodwin 2019) These benefits cannot be achieved by just focussing on low-carbon fuels or vehicle efficiency Realising a shift from cars to active transport (principally walking and cycling) is associated with large societal benefits (Rabl and de Nazelle 2012) The societal cost of a kilometre driven by car in urban areas has been estimated to be more than six times higher than the cost of a kilometre cycled (Goumlssling and Choi 2015) Due to its relatively low cost and potential societal benefits the value for money of soft measures has been estimated to provide a benefit-cost ratio of more than 101 (Cairns et al 2008)
There is an increasing understanding of the problems associated with high volumes of car traffic in urban areas (Hrelja 2019) As city officials become more interested in reducing car use to create more attractive and liveable urban areas increased attention has been directed towards soft measures to facilitate more walking cycling and use of public transport (Hino et al 2019 Kuang et al 2019) This justifies more research on the current issues affecting the development of soft measures as there are still unanswered questions regarding soft measures in terms of their feasibility and optimal use in practice
13 Key issues addressed
Two issues are the focus of this thesis The first regards the lack of methodologically sound evaluations of soft transport measures and the potential for innovations to alleviate this and influence travel behaviour Research about innovation in soft measures has been scarce and may represent untapped potential The second issue regards the need for an increased understanding of what factors motivate diverse groups of people to reduce car use and what implications this can have for targeting soft measures We will now look at these two issues in brief
As stated by Bamberg and Rees (2017) many are still sceptic about the effectiveness of soft transport measures Even though numerous research studies (including a few meta-analyses) have shown that soft measures bring real tangible effects on car use and benefits to society (Richter et al 2009) there is still a consensus that these findings are threatened by a lack of internal and external validity partly due to a lack of controlled evaluations and insufficient data quality (Chatterjee and Carey 2018) This has led researchers to continuously call for more rigorous evaluations of interventions aimed at reducing car use (Arnott et al 2014 Bonsall 2009 Chatterjee 2009 Graham-Rowe et al 2011 Petrunoff et al 2016 Rosenfield et al 2020 Semenescu et al 2020
20
Shaw et al 2014 Yang et al 2010) At the same time rapid technological development is currently experienced in the transport domain This includes lsquonew mobilityrsquo innovations such as ride-hailing and shared vehicle systems electrification and automation (Sperling 2018) Users of these new services as well as of traditional public transport are becoming increasingly dependent on internet and communication technology (ICT) in particular smartphone applications to access travel information planning tools and to make payments (Goumlssling 2018) Another innovation is the electric bicycle (e-bike) which has gained serious interest in recent years due to its potential to substitute car trips (Cairns et al 2017) making it a promising and potentially critical component of the necessary shift toward more sustainable transportation systems (Plazier et al 2018)
Surprisingly few studies seem to have analysed how these innovations can be used to improve soft measures For e-bikes Moser et al (2018) found that a year after an e-bike trial the participantrsquos habitual association with car use had weakened significantly Similarly a recent study found that a significant modal shift from cars to e-bikes found in a trial setting was replicated for actual e-bike customers (Fyhri and Sundfoslashr 2020) Two examples of studies of ICT and soft measures are Sottile et al (2020) who incorporated soft measures in the form of personal travel plans within a smartphone application (IPET) and Matyas and Kamargianni (2019) who evaluated whether a bundle of transport services (referred to as mobility as a service or MaaS (Karlsson et al 2019)) could be used as a tool for promoting shared transport Still the lack of studies examining potential synergies between these innovations and soft measures can lead to missed opportunities to facilitate modal shifts
Previous research has made considerable contributions to our understanding of the motivational determinants that can influence modal shift (Bamberg 2014 Fujii and Taniguchi 2006 Hoffmann et al 2017 Javaid et al 2020) However motivational determinants may differ between groups which is why segmentation has been increasingly called for to understand how different target groups respond to soft measures such as information and marketing messages (Pangbourne and Masthoff 2016 Richter et al 2011 Semanjski and Gautama 2016 Thoslashgersen 2018) Moreover there is a need for more studies that take a theory-driven approach to soft measures (Arnott et al 2014) According to Chatterjee and Carey (2018) there seems to be some inconsistency in how theory is applied in soft measures and as a basis for evaluation The application of theory in interventions is important for understanding why an intervention did or did not work and can advance our understanding of how to design effective soft measures (Bamberg et al 2011)
This research contributes to filling these gaps by exploring two innovations of relevance for soft measures The first is ICT with a particular emphasis on smartphone applications while the second innovation is the e-bike Additionally marketing messages that promote walking cycling and public transport are explored These three
21
cases form the basis for analysing segmentation of potential populations motivation to decrease car use and evaluation of soft transport measures The thesis attempts to base analyses on theories of behavioural intention behaviour change and technology adoption Two aims have guided this endeavour
14 Aims and objectives
The first aim is to explore two transport innovations smartphone applications and e-bikes in terms of their potential to improve evaluations of soft transport measures and influence travel behaviour
The second aim is to investigate what influences motivation to decrease private car use for different segments and how this can be used to improve soft transport measures
The aims will be realised by achieving the following objectives
1 To conduct a literature review on smartphone applications and behaviour change techniques and contrast the findings against theories of behavioural intention behaviour change and technology adoption
2 To assess the effect of a smartphone application on travel behaviour and perceptions towards using public transport within a field experiment A theory of acceptance and use of technology will be used to analyse the findings
3 To conduct a survey measuring motivation to reduce car use in diverse attitude-based segments and a stage-based theory of change
4 To assess the effect of an e-bike trial on travel behaviour and perceptions towards the e-bike as a substitute for the car in a field experiment utilising smartphone data
15 Main contribution
This thesis makes a novel contribution to the soft transport policy field by investigating innovations as a means for driving behaviour change as well as facilitating better evaluations Another contribution to the field is the combined analyses of segmentation and motivation to reduce car use which give insights into motivational differences and possible strategies for targeting
The empirical contribution consists of field evaluations of a smartphone application as well as an e-bike trial The findings from the analyses of motivation to reduce car use
22
within different demographic groups as well as in behaviour change stages are of use for both research and practice The results regarding the marketing messages could be of use for instance by regional public transport authorities in their marketing efforts
The study design of the e-bike trial offers some methodological elements of interest for both research and practice regarding smartphones for data collection and the option to offer treatment to the control group for mitigating dropouts in behavioural interventions
The theoretical contribution consists of a conceptual model for developing behaviour change support systems which was created in the first paper the evaluation of a smartphone application in light of theory on user acceptance and use of technology as well as the application of attitude-based segmentation and behaviour change stages to explore motivation to reduce car use in different groups
16 Structure of the thesis
This thesis consists of this summary and the five papers which are found in the appendix After this opening chapter an introduction to soft transport measures is given in Chapter 2 Chapter 3 presents the framework containing the central concepts and theories that have guided the interpretation of the empirical material Chapter 4 provides an overview of the methods and datasets while the results from each paper are presented in Chapter 5 In Chapter 6 the results are discussed in relation to previous research and ends with the thesisrsquo conclusions limitations and suggestions for further research
23
2 The little brother in transport policy
This chapter addresses the origins definition and effectiveness of soft measures as reported by previous literature and then delves into the transport planning context of such measures in Sweden
21 Born in the USA
The need for urban transportation policy to manage the travel demand arose in conjunction with the oil supply disruptions in the early 1970s in the United States Attempts were made from the public domain to reduce the use of single-occupant vehicles for instance by promoting carpooling (Ferguson 1997) see Figure 1 The following decade saw a rapid growth in traffic volumes which began to outpace the supply of new road infrastructure A broad welfare-increase occurred in combination with sprawled land-use planning and between 1982 and 1996 car use as measured by vehicle miles travelled increased annually by 32 while the population was growing at an annual rate of 1 (Winters 1998) Traffic congestion increased and in addition other negative externalities from traffic especially environmental impacts were receiving more attention from federal and state legislators (Meyer 1999) One response to these challenges was the introduction of a concept referred to as Transport (or Travel) Demand Management (TDM) which eventually spread to Europe as well
Figure 1 A sign encouraging carpooling during the gas shortage resulting from the 1973 oil crisis Source David Falconer US National Archives and Records Administration
24
22 Managing travel demand through lsquohardrsquo and lsquosoftrsquo measures
TDM includes a variety of strategies that attempt to change travel behaviour in order to increase transportation system efficiency also labelled mobility management by some scholars (Litman 2010) A wide array of measures exists for that purpose ranging from physical alterations of land use legal policies such as prohibiting cars in city centres fiscal policies like congestion charging information such as marketing campaigns for new cycling routes incentives such as temporarily reduced fares on public transport and administrative instruments in the form of travel policies and organisational carpooling schemes (Fujii et al 2009 Gaumlrling et al 2002)
These measures are commonly divided into lsquohardrsquo and lsquosoftrsquo measures (Bamberg et al 2011) Hard measures are designed to push individuals towards the desired behaviour for instance through physical changes like closing roads or increasing taxation of car ownership fuel costs or prohibition of car use under certain conditions Fiscal interventions typically require substantial resources to implement while coercing people through modifications of the physical environment or legal policies may involve political costs as such measures can be met with opposition from the public (Ockwell et al 2009 Semenescu et al 2020)
In contrast soft measures attempt to pull people out of their cars by providing information offering incentives and lowering barriers for reducing car use They attempt to influence car users to voluntarily switch to sustainable travel modes sometimes referred to as lsquovoluntary travel behaviour changersquo (VTBC) (Bamberg et al 2011) and are defined by Steg (2003 p 109) as lsquostrategies aimed at influencing peoplersquos perceptions beliefs attitudes values and normsrsquo One upside of using soft measures is that there is rarely any public opposition to it Another advantage is the flexibility with which it can be implemented thus making it easier to customise according to prevailing contexts compared to hard measures Soft measures have on the other hand been difficult to assess in terms of effectiveness making their usefulness uncertain (Bonsall 2009)
There is an assumption of a synergetic relationship between hard and soft measures in which they could strengthen one another With the implementation of hard measures that change the relative attractiveness of travel options the possibility increases that soft measures would be effective in motivating and empowering car users to decrease car use (Bamberg et al 2011) Likewise if soft measures succeed in reducing car use in conditions of congestion induced traffic effects must be handled with hard measures in order to lsquolock inrsquo the net car use reduction for example by reallocating road capacity and restraining parking (Cairns et al 2004)
25
23 Evaluation and effectiveness of soft measures
For the last two decades much of what has been discussed in the research literature regarding the effectiveness of soft measures has to do with whether mainstream evaluations of soft measures can be trusted and in what ways they need to improve
A few large-scale programs have implemented and evaluated the effectiveness of soft measures for example in Australia (Rose and Ampt 2001) the UK (Cairns et al 2004 Parker et al 2007) Germany (Broumlg et al 2009) and Sweden (Friman et al 2013) Rose and Ampt (2001) reported an approximate 10 reduction in car driver kilometres and a slightly higher percentage reduction in car driver trips Cairns et al (2004) projected a decrease in traffic levels by 4-5 nationally in a low-intensity scenario in which soft measures are applied inconsistently and a 10-15 decrease in a high-intensity scenario in which soft measures are consistently utilised and supplemented by hard measures Broumlg et al (2009) reported reductions in car use of 5-15 however these estimates were for car trips only and not related to car distance Friman et al (2013) analysed 32 programs but concluded that the evaluations were of insufficient quality to be assessed for effectiveness in reducing car use
Indeed compilations of the kind reported above have received much criticism for evaluating studies with weak research designs and for combining the results of these studies narratively Instead Moumlser and Bamberg (2008) introduced a meta-analytic approach to synthesising the results from 141 intervention evaluations a more reliable method and one that can be used to determine causal effects (Bamberg and Moumlser 2007) They found that soft measures generally led to an increase of 7 in the proportion of trips not conducted by car but that the ability to draw strong conclusions was limited by the fact that all the 141 evaluation studies used weak quasi-experimental designs As noted by Bonsall (2009) if there is a systematic bias in the reporting of effects in individual studies this problem will not be alleviated simply by conducting meta-analyses based on published results
Four meta-analyses including randomised controlled trials and strong quasi-experimental studies have been conducted since then Fujii et al (2009) including 15 studies found that the average number of weekly car trips reduced by 11-17 Arnott et al (2014) including four studies found no evidence for behavioural interventions to reduce car use frequency Bamberg and Rees (2017) including 11 studies found an average reduction in car modal share of about 5 The latest meta-analysis by Semenescu et al (2020) including 30 studies found an overall reduction in car modal split of 7
Although these meta-evaluations provide more reliable estimations than previous narrative compilations the studies on which they are based are still limited by internal validity issues due to data collection practices being based on self-reports A related issue
26
is the lack of studies measuring travel distance which is important in order to assess intervention effects for instance on energy emissions and health Further more individual studies need to employ controlled evaluations preferably randomised experimental designs to control for confounding factors that might impede on results (Bamberg and Rees 2017)
24 Soft measures in the context of Swedish transport planning
In Sweden decisions on investment projects that are estimated to cost more than SEK 100 million are to be preceded by an action selection study (AringVS) that reviews potential measures by application of a four-step principle The first step of this principle investigates whether it is possible to address the deficiency need or problem by reducing or changing demand The second step identifies more efficient ways of using existing transport infrastructure As the third and fourth steps reconstruction and new construction measures are considered (Swedish Transport Administration 2018) The idea is that the fourth and most costly step should only be proposed if measures in the first steps are insufficient to meet the needs (Swedish Transport Administration 2014)
Table 1 Different approaches to Travel Demand Management and its relationship to the Swedish four-step principle
The Swedish four-step principle
Travel Demand Management Hard measures Soft measures
Physical changes
Legal policies
Economic policies
Information amp feedback
Incentivised schemes
Administrative change
1 Reducing or changing transport demand
Land use planning Localisation (eg industry shops residential areas)
Decreasing speed limits Parking control
Parking charges Increased fuel prices
Marketing of new services Travel information to households
Temporarily reduced fare for PT Free e-bike trial
Travel policy at schools or workplaces Flexible working hours and teleworking
2 Use existing infrastructure more efficiently
Redistribution of street space Increased PT frequency
Prohibiting cars in city centres
Congestion charging Peak hour road tolls
Digital travel planner
Reward for driving off-peak hours
Organisational carpooling Car cooperatives
3 Make limited renovations
Relative capacity adjustments that disfavour car use
4 New investments or major renovations
New relative capacity investments that disfavour car use
One can easily identify the first two steps in the four-step principle as typical domains for TDM measures in which soft measures are most common in step 1 Fujii et al
27
(2009) divided hard measures into physical legal and economic policies A parallel division of soft measures is made here which includes information and feedback incentivised schemes and administrative changes In Table 1 examples of hard and soft TDM measures divided into these categories are presented in relation to the four-step principle
Even though soft measures are included in the national planning toolbox the utilisation of step 1 measures is low compared to step 2-4 In an evaluation of the application of the four-step principle in practice the Swedish National Audit Office (2018) found that step 1 measures were only considered in half of the 170 action selection studies that were reviewed (compared to 89 for step 2 88 for step 3 and 71 for step 4) and just 35 of the studies proposed an actual implementation of step 1 measures The reasons for the low utilisation of step 1 measures are according to the evaluation that they are not regarded as useful in many cases and because the Swedish Transport Administration lacks the mandate to implement and finance step 1 measures resulting in most of them being conducted on the municipal or regional level There is also a lack of knowledge about the effects of soft measures which contributes to their insignificance in the action selection studies (Swedish National Audit Office 2018) This situation is not unique for Sweden When interviewing officials at the local level in the UK Cairns et al (2004) found that planners often feel that working with soft measures is not recognised as being of central importance in transport strategy which is affecting resources political support career expectations and profile There was also a perception that the relevant professional skills were not widely available or given sufficient importance
Indeed the implementation of soft measures in Sweden is mostly conducted at the local level in municipalities or within regional public transport authorities Coordination on the national level is missing although some are facilitated on a regional scale
Given that soft measures are still in their formative years are smaller in scale compared to conventional measures and are relatively insignificant in the national planning practice makes them something of a little brother within the transport policy family It also highlights the need for more research about the design and effectiveness of soft measures The next chapter presents the framework that has formed the basis for such an examination in this thesis
28
29
3 Framework of the thesis
Soft measures is a particularly dynamic field of transport policy in which many new schemes and initiatives are being developed on an ongoing basis (Cairns et al 2008) Nevertheless from an implementation perspective this thesis has focused on three concepts that are essential parts of conducting soft measures The concepts are segmentation motivation and evaluation the assumption being that implementing soft measures includes the questions of how to segment and target populations how to enhance motivation for participants to change travel behaviour and how to evaluate the effect of interventions These three concepts have been used to structure and analyse the combined material of the papers
Segmentation motivation and evaluation can be positioned within current guidelines for conducting soft measures as proposed by several actors within the field (Steg and Vlek 2009 Sussman et al 2020 The Behavioural Insights Team and Alta Planning + Design 2017 Whillans et al 2020) These guidelines follow a general approach that includes (1) defining the behaviour to be changed and population to target (2) determining what factors affect the target behaviour (3) designing and implementing a suitable intervention and (4) evaluating the effect of that intervention and taking advantage of lessons learned Figure 2 exemplifies this stepwise approach and how the concepts (segmentation motivation and evaluation) are positioned within this process
Figure 2 A stepwise process for conducting soft measures Adapted from Steg and Vlek (2009) and Sussman et al (2020)
Based on a study of soft transport measures implemented in Sweden (Friman et al 2013) it is clear that there is some discrepancy between these general guidelines and how soft measures are conducted in practice A principal concern is the lack of rigorous study designs which makes it difficult to evaluate the effect of the interventions Few
30
soft measures are theoretically grounded or measure changes in behavioural determinants such as motivation to change travel mode Further the majority of such programs usually recruit as many participants as possible in an uncontrolled manner and provide general rather than personalised information (Friman et al 2013) indicating a lack of targeting Consequently the main difficulties with facilitating soft measures seem to be related to segmentation motivational triggers to pursue in order to influence behaviour and how to evaluate the effect of soft measures Thus increasing the understanding of these principles and how they can be applied in practice can help overcome some of the barriers to implementing successful soft measures Table 2 shows which papers have examined which of the concepts How the concepts have been operationalised within this thesis will be explained next
Table 2 The concepts under study in each paper
Paper Segmentation Motivation Evaluation I X II X X III X X IV X X V X X
31 Segmentation
Previous research has established that segmentation is a useful tool for making campaigns more effective In practice however it is still common to implement soft measures to maximise the reach of campaigns (Stopher et al 2009) This carries the risk of the campaign being irrelevant or even disturbing to a large section of the audience Many people are highly reluctant to reduce their car use and will not pay attention to soft measures (Innocenti et al 2013 Lattarulo et al 2018 Tertoolen et al 1998)
Because soft measures are limited to voluntary behaviour change and often smaller in scale than other transport policy measures (not least financially speaking) spreading a campaign across the whole population according to the lsquoshotgun approachrsquo is likely to result in a low return on investment ratio Instead interventions need to be targeted at suitable segments that are susceptible to changing behaviour and thus more likely to respond in the desired way Designing interventions to target appropriate lsquohigh yield segmentsrsquo ensures resources are placed where they are most likely to have a positive effect on travel behaviour (Parker et al 2007)
Market segmentation was first proposed by Smith (1956 p 6) who defined segmentation as lsquoviewing a heterogeneous market (one characterised by divergent
31
demand) as several smaller homogeneous marketsrsquo The idea is to match the genuine needs and desires of consumers with the offers of suppliers particularly suited to satisfy those needs and desires (Dolnicar et al 2018) Segmentation is often part of a larger approach to strategic marketing together with targeting and positioning referred to as the STP approach The process starts with market segmentation (the extraction profiling and description of segments) followed by targeting (the assessment of segments and selection of a target segment) and finally positioning (adjustment of the product so it is perceived as different from competing products and in line with segment needs) (Dolnicar et al 2018)
Segmentation has been used to a varying degree of sophistication within transport research and typically departs from variables related to demographics travel behaviour spatial distribution and attitudes (Haustein and Hunecke 2013) For instance MaxSEM2 uses six lsquostage diagnosticrsquo statements inspired by the transtheoretical model of change (TTM) and Self-regulation theory (Bamberg et al 2011 Prochaska and Diclemente 1986) and segments people according to their readiness to decrease car use (Van Acker et al 2013) Another example is the travel behaviour and attitude-based segmentation by Anable (2002 2005) who used an expansion of the theory of planned behaviour (TPB) to identify segments These were further developed within the EU project lsquoSEGMENTrsquo to a market segmentation technique for promoting more energy-efficient forms of transport (Anable and Wright 2013)
Segmentation has been used in this thesis to increase the understanding of how motivation to decrease car use in favour of alternative modes differs between subgroups in the population and how targeting can be used to increase the efficiency of campaigns The TTM and the SEGMENT model have been utilised for this purpose and are explained next
The transtheoretical model The TTM (Prochaska and Diclemente 1986 Prochaska and DiClemente 1982) is a behaviour change model that integrates key constructs from other theories into a comprehensive model of change It has been applied to a variety of behaviours mostly related to health particularly smoking cessation The TTM assumes behaviour change to be a dynamic process rather than an isolated event and consists of five stages as described in Table 3 The stages of change are just one core construct of the model which also includes 10 main processes of change decisional balance and self-efficacy According to the theory an optimal scenario would be where processes of change within interventions are matched with the most suitable stage of change However the processes of change have received less empirical support than the stages of change
2 MaxSEM was developed as part of the wider MAX project (2006-2009) which was the largest research
project on Mobility Management within the EUrsquos sixth framework program (European Commision 2009)
32
(Prochaska et al 2008) which could be the reason that the stages of change are the part of the model that have been applied the most by researchers (Spencer et al 2002) The TTM has received unprecedented research attention yet it has simultaneously attracted much criticism partly related to the number and classifications of stages and to the fact that stages might differ between contexts (Brug et al 2005) Some point to the stages themselves as being insufficient to the task of explaining behaviour change since behaviour change is a continuous process (West 2005) Even today no definitive conclusions can be made regarding the effectiveness of stage-matched interventions to promote behaviour change (Vela and Ortega 2020)
Table 3 Stages of change within the TTM
Precontemplation No intention to take action within the next six months Contemplation Intends to take action within the next six months Preparation Intends to take action within the next 30 days and has taken some steps in this direction Action Changed overt behaviour for less than six months Maintenance Changed overt behaviour for more than six months
There is an ongoing strand of research that attempts to increase the understanding of the processes underlying the stages of change in travel behaviour (Bamberg 2007 Forward 2019 Friman et al 2019 Olsson et al 2018) In a review of the usage of the TTM in the transport domain Friman et al (2017) conclude that studies generally lack proper designs and outcome measures in relation to the processes and stages of change making it difficult to conclude their effectiveness Still there is some evidence to suggest that it may be useful to conduct segmentation based on stages of change (Armitage 2009 Thigpen et al 2019) For instance in a modified version of the TTM including four stages Bamberg (2013) confirmed distinctive stages of change and showed that a stage-based intervention significantly reduced private car use Thus in this thesis the use of the TTM has been delimited to the stages of change which is a common approach for utilising the model (Gatersleben and Appleton 2007 Thigpen et al 2015 Waygood and Avineri 2016)
The SEGMENT model Attitude-based segmentation has been shown to effectively predict travel mode choice and offer a potential avenue for targeting soft measures more effectively (Hunecke et al 2010) In this thesis the SEGMENT model was chosen to study because its development is well documented (Anable 2005 Anable and Wright 2013) its segments can be detected in crowdsourced mobility data (Semanjski and Gautama 2016) and the model has been applied in practice with promising results (Ladbury 2013)
The SEGMENT model consists of eight segments five with high accessibility to a car and three with low accessibility By answering a set of 18 questions on a five-point
33
Likert scale (the survey items are presented in the appendix) respondents are assigned to one of the segments The developers behind the SEGMENT identified the questions through discriminant analysis (Anable and Wright 2013) The allocation of respondents to segments is made by multiplying their answers on each question by a weighting coefficient which differ depending on the segment Then the products for each question are summed generating a total score for each respondent for each segment After subtracting the constant which is a sum of the weighting coefficient from each segment the respondents are allocated to the segment which they score highest (Anable and Wright 2013) A description of each segment is provided in Table 4
Table 4 Description of segments Source Andersson et al (2020a)
Segment Description
Hig
h-ca
r acc
essi
bilit
y
Devoted drivers
Do not intend to reduce car use and think successful people drive They do not use public transportation nor cycling and think walking is too slow They are not motivated by fitness and have a very low moral obligation to the environment
Image improvers
Like to drive see the car as a way of self-expression and do not want to cut down car use They do not use public transportation but see cycling as a way of expressing themselves and a good way to keep fit They have neutral or moderate environmental attitudes
Malcontent motorists
They do not like to drive and find it stressful They have a moderately strong intention to reduce car use but are not motivated to increase the use of public transport although they prefer it more than cycling They walk but do not see any advantage to walking except for fitness They have a small level of environmental consciousness
Active aspirers Have a high moral obligation to the environment and are highly motivated to use active transport modes predominantly cycling as they believe that it is quick and provides freedom and fitness They are not public transport users and see problems with using it
Practical travellers
They use a car only when necessary as they think that it reduces the quality of life They prefer cycling to the use of public transportation and would walk when it seems more practical They are not motivated by climate change and see local pollution and congestion as issues They are highly educated and above-average part-time working
Low
-car
acc
essi
bilit
y
Car contemplators
They do not use a car are the highest proportion of non-driving licence owners but would like to as they see cars as status symbols They see many problems with public transportation use and find it the same as cycling stressful They believe walking is healthy and have a neutral or moderate attitude towards the environment
Public transport dependents
They think people should be allowed to use cars and would like to see less congestion (they consider more roads as an appropriate solution) They use public transport although they perceive it to be slow They do not cycle but would like to walk more for fitness They are not motivated by the environment and are the least likely to start driving
Car-free choosers
They think that cars lead to unhealthy lifestyles and do not like to drive They prefer cycling as they feel a high moral obligation to the environment Alternatively they will choose public transport which they do not consider stressful nor problematic and walking They are more likely to be women
34
32 Motivation
The ultimate aim of soft measures is to change peoplersquos behaviour This is done either directly through for example incentives and trials or indirectly by influencing peoplersquos beliefs and attitudes
In this context it is often said in everyday speech that people need to be lsquomotivatedrsquo to lsquodorsquo or lsquochangersquo a behaviour Indeed enhanced motivation increases the likelihood of behaviour change which is why it is desirable to strengthen the motivation of individuals in interventions to modify their behaviour (Sarafino 2012) Motivated behaviour is goal-directed and purposeful and it is difficult to think of any behaviour that is not motivated in this sense (Gross 2010) According to the Oxford English Dictionary to motivate means lsquoto provide with a motiversquo and motive means lsquoa reason for doing somethingrsquo The following definition by Miller (1962) captures this essence of motivation
The study of motivation is the study of all those pushes and prods ndash biological social and psychological ndash that defeat our laziness and move us either eagerly or reluctantly to action
Thus motivation can emerge for several reasons connected to biological social and psychological forces These are commonly divided by psychologists into two parts drives which are mainly biologically based such as hunger and thirst and motives which are at least partly learned and psychologically or socially based (Sarafino 2012) such as the desire to drive a car This thesis focuses exclusively on the latter of the two
Motives are in turn influenced by external conditions (eg institutional economic social) such as the accessibility to transport modes generalised costs for travelling and social norms and internal cognitive processes such as attitudes towards driving a car or riding a bike personal norms and perceived behavioural control (Jakobsson 2004) Several internal motivational determinants have been identified that influence car use for instance problem awareness (Steg et al 2001a) personal norm (Abrahamse et al 2009 Bamberg et al 2007 Kloumlckner 2013 Nordlund and Garvill 2003) attitudes social norms and perceived behavioural control (Ajzen 1991 Chen and Chao 2011 Lois et al 2015) habit (Bamberg 2006 Eriksson et al 2008 Gaumlrling and Axhausen 2003) as well as symbolic and affective motives (Steg 2005) Hoffmann et al (2017) found in a systematic review and meta-analysis that the strongest cognitive correlates of using alternatives to the car were intentions perceived behavioural control and attitudes The same factors were the strongest in predicting car use with the addition of habit In a recent review of reviews Javaid et al (2020) investigated both external and internal factors and stated that psychological and sociological factors as well as the built environment influence car use Perceived behavioural control attitudes personal
35
norms social norms habits infrastructure factors and time and price elasticities were the key factors
Although soft transport measures are defined by scholars as lsquostrategies aimed at influencing peoplersquos perceptions beliefs attitudes values and normsrsquo (Steg 2003) which would suggest an exclusive orientation towards internal motives many soft interventions modify external conditions as well for example by providing participants with a free public transport ticket for a limited time (Bamberg 2006 Friman et al 2019 Fujii and Kitamura 2003 Thoslashgersen 2009) Further it is important to stress that even if soft interventions intend to address beliefs norms and attitudes through for example information and feedback they always do so in an environment of external conditions that influence the degree to which internal processes can explain behaviour (Bandura 2000 Guagnano et al 1995) resulting in people not always doing what they say they will do also referred to as the attitude-behaviour gap (Geng et al 2016 Milfont and Duckitt 2010)
Earlier research on behaviour change interventions in transport highlights the need for more theory-based approaches in the implementation and evaluation of soft transport policy measures (Chatterjee and Carey 2018) The following theories and concepts have been employed in this thesis to better understand the motivation to decrease car use in favour of alternative modes
The theory of planned behaviour One exceptionally influential theory is the theory of planned behaviour (TPB) (Ajzen 1991) It is a theory of how intentions to perform behaviours are formed and postulates that a choice is made among alternative behaviours based on the relative strengths of the intentions Intentions are in turn formed by the attitude towards the behaviour the perceived social pressure from significant others (subjective norm) and perceived behavioural control The TPB is an extension of the theory of reasoned action (Ajzen and Fishbein 1980 Fishbein and Ajzen 1975) which is a rational choice model that presumes that people form intentions based on logic and reasoning The difference between TPB and the reasoned action theory is the additional variable perceived behavioural control which is intended to account for behaviours that are not under complete volitional control (Ajzen 1991) Several meta-analyses have found empirical support for the TPB and that the theory is capable of explaining around 20 of the variance in observed behaviour (Armitage and Conner 2001) Likewise many studies have found support for TPB in explaining transport-related behaviours (Forward 2019 Lanzini and Khan 2017)
The transtheoretical model Described in the preceding section
36
Diffusion of innovations Diffusion of innovations (Rogers 1995) is a theory about the spread of innovations in society Innovations could be a behaviour technology service system object or idea that are considered by society to be new Diffusion is the process where innovations are communicated via different channels over time among members of a social system The theory is particularly valuable in gaining insights into what qualities make innovations spread the importance of social networks that spread the word about innovations as well as identifying segments and their needs (innovators early adopters early majority late majority laggards) The theory has been used to categorise consumers according to their attitudes and adoption of innovations such as electric cars (Noppers et al 2015)
Gamification Gamification is the use of game elementsgame mechanisms in activities that are traditionally unrelated to gaming to enhance the user experience of a particular activity (Deterding et al 2011) In recent years the concept has been applied in many areas to influence behaviours and increase the motivational power of the user but without much consensus on how the concept should be formulated and what the actual benefits are (Seaborn and Fels 2015) This is also true in the transport domain where there are a number of examples of scientific studies where attempts have been made to change travel habits using gamification (Castellanos 2016)
The unified theory of acceptance and use of technology UTAUT defined by Venkatesh et al (2003) aims to explain user intentions to use an information system and subsequent usage behaviour The UTAUT states that perceived usefulness (performance expectancy) perceived ease of use (effort expectancy) and norms (social influence) affect technology adoption intention via behavioural intention which in turn leads to behaviour whereas facilitating conditions directly antecede behaviour The UTAUT model has for instance been used to explain the adoption of e-bikes by early adopters (Wolf and Seebauer 2014)
33 Evaluation
An essential but often marginalised element when carrying out soft measures is evaluation (Davies 2012 Friman et al 2013) Successful evaluations of intervention studies are critical because they reveal the effectiveness of an intervention in achieving improvements to society Parker et al (2007) provide three reasons why evaluations should be of substantial interest the first being to inform decision-makers of whether interventions are a good choice for the spending of resources compared to other options Second to understand how and why effects were achieved to support adaptive
37
learning and improve future interventions and third to enable the possibility to inform participants about the outcome of the intervention in which they took part
However conducting good quality evaluations of soft measures is not an easy task a fact for which Stopher et al (2009) list several reasons First it usually requires both before and after surveys spaced sufficiently far apart to detect stable changes in travel behaviour Second it requires data of the average daily numbers of trips distances and times travelled for each mode of transport to enable an assessment of the change taking place The common use of self-report surveys suffers from measurement errors and low resolution making it inappropriate for measuring soft measures which often results in small changes of 5-10 Third small changes in travel behaviours often require large sample sizes to be detected Fourth methods for evaluating the wider benefits of soft measures are often overlooked such as potential spillover effects caused by interactions between the treatment group and their family or friends Fifth the evaluation should not be conducted by the agency undertaking the intervention in order to minimise bias Sixth it requires a control group A control group is a group from the same population while a comparison group is a population group that is similar to the target group but not from the same population (Stopher et al 2009)
The critique from reviews of behavioural transport interventions reflects these difficulties (Graham-Rowe et al 2011) Research from a public health perspective especially expresses concern that intervention studies lack internal validity and objective outcome measures and instead advocate evaluation studies that employ rigorous research designs in the form of randomised controlled trials (RCTs) which are referred to as the lsquogold standardrsquo in evaluation research (Arnott et al 2014 Ogilvie et al 2007 Yang et al 2010) Reviews from the transport domain on the other hand highlight issues related to insufficient sample sizes short data collection periods and responsesocial desirability bias thus advocating longitudinal studies and evaluations with aggregated travel data to supplement survey-based material (Chatterjee 2009 Moumlser and Bamberg 2008)
The discussion of what constitutes good evaluation practice in research about soft measures was nuanced by Bamberg and Rees (2017) They advocate the use of randomised experimental designs for future evaluations seeking to establish whether an effect and the size of such an effect is existent or not while also acknowledging that understanding processes involved in behaviour change could require different study designs This line of reasoning is shared by Chatterjee and Carey (2018) who declare that lsquothe priority for research [on behavioural transport interventions] should not only be to assess whether expected outcomes occur but also to understand how targeted groups respond to interventions and what processes of change take placersquo This thesis has attempted to include both these dimensions of evaluation that is assessing the effect of soft measures as well as analysing the underlying process of change
38
39
4 Methods and data
41 Progression of the thesis
The scope of this thesis has developed over the course of the project At the outset ICT and smartphone technology was the main focus of the thesis Due to uncertainty whether the project assessing the smartphone application in Paper II would be completed in time for it to form part of the thesis the scope was extended to soft measures in a more general sense Two strands of research needs were identified in Paper I for further investigation
The first strand was connected to innovations for soft transport measures A lack of field evaluations of smartphone applications in transport research was identified as well as the potential to utilise smartphones for measuring and collecting travel behaviour data A field evaluation of a mobility service application (MSA) was conducted in Paper II In Paper II it was evident that more rigorous study designs needed to be facilitated to enable adequate evaluations of soft measures This need was found to be echoed in the literature concerning soft measures This knowledge fed into Paper V where a considerable emphasis was placed on study design in an attempt to assess the substitution effect of e-bikes One such effort was to utilise smartphones for collecting data of the participants perceptions and travel behaviour
The second strand was that of motivation to reduce car use and segmentation to enable more effective interventions which led to the research on marketing messages for different segments in Paper III This generated new questions regarding peoplersquos preconditions for motivation to decrease car use in favour of alternative modes of transport which was investigated in Paper IV The results in Paper IV in turn led to the targeting strategy in Paper V where individuals with high car use were invited to participate in the e-bike trial
The iterative emergence of the papers meant that gaps and observations identified in one study could be investigated in the next thus producing a cumulative understanding of the research theme A schematic representation of how the papers relate is presented in Figure 3
40
Figure 3 The linkages between the papers concerning how findings have been incorporated into the research questions or design of upcoming studies
42 Method rationale
The methods employed in this thesis have been mainly quantitative the exception being Paper II in which a mixed-method approach was employed including both surveys and qualitative interviews
Carrying out the objectives has demanded an explorative (inductive) as well as hypothesis-driven (deductive) research approach The inductive approach was suitable in Papers I III and IV because these studies aimed to explore new themes and develop hypotheses Papers II and V were deductive in the sense that we attempted to establish cause and effect from the MSA intervention and the e-bike trial Surveys and experimental research are the methods that have been mainly used in this thesis
The theoretical stance of the thesis is post-positivist in the sense that it maintains the idea of an objective truth while recognising that prevailing knowledge and values of the researcher influence the research process as well as the interpretation of results (Crotty 1998) As such bias is undesired but inevitable and as a researcher one can only try to detect and correct misinterpretations This quality has been refined during the research project however some of the methods employed in this thesis demand a layer of subjectivity for instance in the interpretation of factors in the factor analysis which certainly influence subsequent analyses and conclusions From a post-positivist point of view this is natural and part of the notion that reality can only be known imperfectly Similarly principles and hypotheses are not intended to be proven as true but rather tested for falsification and should therefore be presented as clearly as possible to be open for refutation As Karl Popper put it (1959 p 280) lsquoevery scientific statement must remain tentative foreverrsquo
41
43 Datasets
Four unique datasets were collected within the thesis see Table 5 In the following sections the data collection procedure and details for these datasets will be presented
Table 5 Overview of datasets
Dataset Method Databases and tools Date of collection Literature data Literature review Scopus Web of science
Google scholar Feb and Sep 2017
Business travel data
Surveys interviews and field experiment
Netigate survey tool Before study March 2017 and Feb-June 2018 After study April 2019 Interviews March 2019
National survey data
Survey Kantar Sifo online panel Feb 2018
E-bike trial data Surveys and field experiment
TravelVu smartphone application
March-June 2020
431 Literature data
The empirical data used for the literature review in Paper I was based on peer-reviewed articles between 2008 and 2017 The keywords used to find relevant articles consisted of combinations of the terms lsquotraveltransportationmobility behaviourrsquo lsquobehaviour changersquo lsquosmartphoneapplicationrsquo lsquomobile devicersquo and lsquopersuasive technologyrsquo After fulfilling the search a snowball review was conducted where references from the articles in the literature search were screened for additional eligible papers
Criteria for inclusion The criteria used for assessing articles for inclusion demanded that papers had been peer-reviewed and that they investigated behaviour change related to some form of smartphone applications or other types of ICT The decision about which articles to include in the review followed the four steps of the PRISMA guidelines (Preferred Reporting Items for Systematic Reviews and Meta-Analyses) (Moher et al 2009) identification screening eligibility and inclusion
Empirical content In total 32 articles were included in the empirical material Two were in the field of energy 12 in the fields of health and fitness two were concerned with climate mitigation and pro-environmental behaviours in general and 15 articles were related to transport and mobility
42
432 Business travel data
This dataset was collected over two years in collaboration with Samtrafiken a company that connects all public and private transport operators coordinates public transport data and develops and manages ticketing and payment standards in Sweden The dataset entailed both surveys and interviews The emphasis was on business trips and the evaluation of a support system specifically developed to simplify the handling of business trips
The mobility service application (MSA) Between 2017 and 2019 Samtrafiken provided a service consisting of a mobile web application where among other things employees of recruited companies authorities and organisations could manage their business trips by public transport and car The MSA provided timetable information as well as the purchase of tickets for local and regional buses commuter regional and national train services registration of car trips and reporting of travel expenses Through the MSA trips by public transport were paid by monthly invoice including a financial statement from Samtrafiken to the recruited organisations The research team was not participating in developing the MSA or recruiting the participants
Surveys The survey included questions about the participantsrsquo business trips attitudes toward transport modes and the perceived possibility to use these modes for business trips The after study also contained questions regarding the use of the MSA A record of the questionnaire items is presented in Paper II
Sample The survey was dispatched to a sample of 525 individuals working in one of the 13 organisations that took part in the study via the marketing research company Netigate The online questionnaire was accessed through an e-mail and 250 people completed the first round (48 response rate) 193 of whom were carrying out any business trips In the second round (the after study) 77 participants responded 35 of whom had used the MSA for conducting business trips Thus in the analyses we had 35 users of the MSA constituting a test group and 42 non-users who formed the control group Additionally in the second round 40 individuals agreed to participate in an interview 20 of whom had used the MSA
Interviews Nine focus groups and 10 individual interviews were conducted of which seven were over the phone and the rest at the informantrsquos workplace The purpose of the interviews which were semi-structured to provide the respondents with an opportunity
43
to discuss without restraint while ensuring that several themes were covered (Flick 2002) was to gain an understanding of how the participants perceived their business trips and to get their views of the advantages and disadvantages of the MSA
Study area A total of 13 organisations distributed throughout five of Swedenrsquos 21 counties participated in the project The counties were Halland Kronoberg Oumlstergoumltland Uppsala and Stockholm
433 National survey data
This dataset consisted of answers from a cross-sectional stated preference survey that was distributed across Sweden The survey included questions regarding demographics accessibility travel behaviour attitudes and motivation to decrease car use for commuting trips when exposed to different marketing messages
Pros and cons of stated preferences Stated preference (SP) methods are widely used in travel behaviour research to identify behavioural responses that cannot be observable in the market (Hensher 1994) The main limitation of the SP approach is that it can result in low internal validity due to a discrepancy between self-reported behaviour and actual behaviour (see for example Rosenfield et al 2020) Social desirability bias is a common cause for flawed answers meaning that some respondents tend to underreport socially undesirable activities and overreport socially desirable ones (Krumpal 2013) In the national survey conducted in this thesis the intention was to examine the relationships between attitudes (and subsequent segmentation profile) and motivation imposed by a set of different marketing messages This kind of data material would be hard to ascertain by examining revealed preferences and while stated preferences carry the risk of social desirability bias it has been shown to provide a reasonably accurate description of true preferences and market behaviour (Lambooij et al 2015 Loureiro et al 2003)
Due to the length of the survey we chose not to include a social desirability scale such as the MarlowendashCrowne Social Desirability Scale (Crowne and Marlowe 1960) Still to mitigate biased answers the participants were informed that the survey was anonymised and that there are no lsquorightrsquo or lsquowrongrsquo answers The purpose of the survey was stated to be purely scientific with no reference to sustainable transport to prevent respondents from giving responses they perceive to be more socially acceptable Further statistical techniques were utilised to detect false responses This will be discussed in the next section
44
The use of an online panel to recruit respondents The survey was distributed through an online panel owned by Kantar Sifo one of Swedenrsquos major marketing research companies It consists of approximately 100000 Swedish citizens 16-79 years of age The panel members are randomly recruited through nationally representative telephone surveys and the panel is continuously replaced with new members to prevent them from becoming too accustomed to the survey methodology Those who agree to participate in surveys receive compensation in the form of bonus points that can be redeemed for movie tickets or gift cards
Although the use of online panels for collecting survey responses has been criticised by some scholars for resulting in low data quality essentially related to low external validity and measurement error the examination of these issues has indicated that the validity of responses from online panels generally falls within the credibility intervals of results from conventionally sourced data (Walter et al 2019) In fact the use of online panels can be of significant use because they are more diverse and provide access to underrepresented populations (Landers and Behrend 2015) However it has been suggested that researchers who use online panels for data collection consider the risk of mischievous respondents (MRs) and employ suitable statistical techniques to omit cases if necessary (Hays et al 2015) In Papers III and IV this was performed by applying Hyman and Sierras (2012) MR algorithm The MR algorithm begins with an intra-case assessment of each respondentrsquos answers and assumes that MRs in trying to sabotage studies yet remain undetected will answer in ways that produce high or low means or variances relative to other survey participants Then like outlier analyses the algorithm identifies potential cases for removal based on a threshold criterion The respondents were considered mischievous if the variance of their responses was below 025 This resulted in 16 of the sample being removed for the sample in Paper III (191 cases) and 13 of the sample in Paper IV (127 cases)
Questionnaire content A detailed account of the questionnaire items is presented in Papers III and IV and in the appendix The marketing messages that were assessed in the survey were inspired by real mobility management campaigns in Sweden and carried out by regional public transport authorities municipalities train operators and pro-bicycling organisations However they were adapted to fit the common marketing lsquoframesrsquo used to promote pro-environmental behaviours as identified by previous research (Avineri and Waygood 2013 Bolderdijk et al 2013 Griskevicius et al 2010 Loureiro and Veloso 2017 Nisbet and Gick 2008 Winslott Hiselius and Smidfelt Rosqvist 2015) These were related to either economic environmental health or status-frames The messages are presented in Table 6
45
Table 6 Marketing messages with means and standard deviations Theme abbreviations $=economy E=environment H=health S=status
Marketing message Theme Mean SD 1 We all must help to reduce our climate footprint The result will be a sound
environment that future generations also need E 373 110
2 Those who mostly walk cycle or ride transit are doing something good for the environment
E 364 109
3 Research shows that public transport users are walking on average four times more per day than car drivers therefore reducing the risk of acquiring severe non-communicable diseases
H 360 108
4 Those who cycle and go by public transport not only improve their health but also contribute positively to other peoples health
H 357 108
5 Did you know that cyclists have a 52 lower risk of dying of heart disease and a 40 lower risk of dying from cancer
H 353 113
6 You save about 350 euro per month if you live without a car and instead go by public transport and even more if you cycle or walk
$ 337 124
7 Bicycles run on fat and save you money Cars run on money and make you fat
H $ 337 127
8 If Sweden is to achieve its climate targets then generally every third car trip must be replaced with more environmentally friendly alternatives
E 336 119
9 By cycling instead of taking the car to work you save money and contribute to society at the same time Try it
$ 328 116
10 The car traffic in Sweden induces a socio-economic loss above 10 billion euros in adverse health effects
H 321 117
11 In the government budget support for investments in cycling infrastructure increased by 50 million euros in 2018
$ 317 118
12 If you want to improve your health you should ride a bicycle instead of driving a car If the distance is a problem then an electric bike can be an option
H 314 119
13 Many Swedes use public transport to get to school or work every day Thanks
S 313 118
14 It may seem inconvenient but studies show that over 60 of those who test an electric bike continue to use it
- 308 108
15 The environmental impact per bus passenger is only 65 of the private car user in rural areas and 40 in urban areas
E 304 109
16 Beginning in 2018 you can get 25 of the cost subsidised by the government when purchasing a new electric bicycle
$ 302 128
17 The car used to be a status symbol but today other values are more important such as taking care of oneself and the environment Such values are usually related to cycling or public transport
S 295 118
18 Few things today can be considered more modern and prestigious than commuting by bicycle
S 262 114
19 Swedish Olympic champion Bjoumlrn Ferry has decided to be fossil-free by 2025 If he can do it you can
S 259 118
The level of motivation was measured on a five-point Likert scale from lsquovery unmotivated to decrease my car usersquo to lsquovery motivated to decrease my car usersquo in line with the scale used by Waygood and Avineri (2018) Respondents who already had low or no car use had a slightly adjusted scale lsquovery unmotivated to keep my low level of car usersquo and lsquovery motivated to keep my low level of car usersquo The order of the messages was randomised in the survey to prevent an accumulated message exposure that could affect the relative outcome of the messages
46
One could question whether measuring motivation according to this scale would capture lsquorealrsquo motivation to decrease car use or merely the extent to which respondents liked the messages However marketing research has demonstrated that attitudes toward advertisements influence attitudes toward what is advertised (for a meta-analysis see Brown and Stayman 1992) and some suggest that the liking of an ad may be the best indicator of advertisement effectiveness (Haley and Baldinger 2000) Still it is important to underline that it is the stated motivation to decrease car use as a result of being exposed to the marketing messages that forms the basis for the analyses in Papers III and IV
Sample The survey was distributed in February 2018 and answers were collected from 1500 individuals 1300 of whom stated that they were regularly commuting to school or work Commuting trips were focal because the survey items measuring motivation were contextualised around commuting trips The sample was stratified to match the national conditions regarding gender and age and analytical weights were used to compensate for the overrepresentation of respondents with higher educational attainment (10 difference from the average)
Study area The geographical scope for the survey was limited to seven out of the nine municipality groups in Sweden according to the classification made by the Swedish Association of Local Authorities and Regions (2016) The two excluded municipality groups are classified as rural with a population of fewer than 15000 inhabitants in the largest urban area or with a commuting rate for work outside of the municipality of less than 30 They were excluded since their modal options in general are much more limited than for the rest of the population The included municipality groups include 95 of the Swedish population
434 E-bike trial data
This dataset encompassed three data collection rounds from a randomised controlled e-bike trial conducted in the spring of 2020
Study area The project was a joint venture between the authors of the papers and the mobility management team at the Vaumlstra Goumltaland Region (VGR) VGR is one of Swedenrsquos 21 counties VGR had previously carried out a study of cycling within the county which comprises 49 municipalities Skoumlvde municipality was identified for having particularly low levels of cycling despite decent preconditions Skoumlvde has just over 50000
47
inhabitants and is characterised by large companies within the heavy industry and professional services
VGR established contact with one large employer in Skoumlvde and acquired 50 e-bikes of the lsquopedelecrsquo sort which were lent to participating employees for five weeks
TravelVu logging and surveys The data collection was facilitated through TravelVu a GPS-tracker smartphone application that registers the duration distance route time and travel mode of each trip An advantage of this method is that it provides travel data independent of self-reports from the participant and more details regarding each trip compared to conventional travel surveys The application was also used for distributing the surveys which included questions about age gender education access to travel modes and attitudes towards e-bikes and cycling Since the first data collection period began in March 2020 when the outbreak of COVID-19 occurred additional survey questions were incorporated in the second survey round to capture the effect of the pandemic on the trial
Trial procedure Measurements (travel logging and survey) were conducted for one week at baseline (M1) and four weeks into the trial for both the treatment and control group (M2 and M3) Table 7 provides a timeline for the intervention and the data collection A second e-bike trial period was conducted for the control group only After the first trial was finished the control group got access to the e-bikes and had their trial period The second trial period was conducted to prevent dropouts from the control group by keeping them motivated to participate and to validate the results from the treatment group All participants were informed that they would get access to an e-bike that could be used as much as they liked The VGR team informed the participants about the appropriate use of the TravelVu app and was available for support during the trials
Table 7 Timeline for the e-bike intervention and the data collection Adapted from Soumlderberg fka Andersson et al (2021)
M1 M2 M3 Group Treatment and
control Treatment Treatment and
control Control Control
Activity Baseline measurement and survey
E-bike trial Follow up measurement and survey
E-bike trial Follow up measurement and survey
Date March 9-15 April 2-May 7 April 27-May 3 May 8-June 15
June 1-June 7
Duration 1 week 5 weeks 1 week 5 weeks 1 week
48
Sample Participants who were chosen for taking part in the trials (typical individuals with high car use and a distance of 5-12 km between their home and workplace) were randomly assigned to a treatment or control group
The aim was to recruit 100 participants In total around 3200 employees were contacted 317 of whom stated that they would like to participate At the start of the trials the sample consisted of 98 individuals In the end the analytical sample consisted of 65 participants 40 of whom belonged to the treatment group and 25 to the control group
44 Representativeness of datasets
It is important to emphasise the limits of the datasets in terms of the possibility to generalise the results to other contexts The choice of data to be collected sample size and study design all depend on the purpose of the study
For the literature review in Paper I the search criteria was limited in terms of language (English) and to the fields of energy transportmobility health and fitness and pro-environmentclimate Thus the review is not representative of publications in other languages and cannot generalise beyond these fields However the scope of the study was principally the role of ICT for transport and most studies included in the review were in the transportmobility domain the field in which we were most interested to generalise
The business travel data used in Paper II was collected from participants who were recruited through convenience sampling from the participating organisations a process in which the research team was not part Analysing the travel behaviour of the participants revealed a considerably higher share of public transport for business trips (about 45 of all business trips) than the national average as informed by the national travel survey (10) Further women were overrepresented Consequently the sample is not representative of the general population However the aim was to demonstrate the strengths and weaknesses of the implemented MSA with potential effects on business trips rather than to generalise the effects on travel behaviour to the general population
The national survey data utilised in Papers III and IV were stratified to match the national conditions regarding age and gender The sampling was conducted in seven out of the nine Swedish municipality groups excluding only the most rural parts of the country (inhabited by 5 of the population) As such the sample can be used to get a rough estimation of the national conditions although there is a tendency of online panels to consist of people with higher education than the national average Analytical
49
weights were used to compensate for the overrepresentation of respondents with higher education (the sample had 10 more highly educated participants than the Swedish average) and the underrepresentation of older respondents However differences in attitudes between panellists and non-panellists cannot be controlled and it is wise to interpret the results and generalise in light of these limitations
The target group in the e-bike sample used for Paper V was deliberately chosen due to its high car use which was believed to offer the highest potential for substitution and reduction of car use In the case of external validity it limits the degree of substitution that can be expected to occur for the average individual because the general amount of driving is considerably lower However soft measures are often targeted to this kind of groups that is segments with high car use who are willing to try a new mode of transport This is the primary group to which the e-bike data can be generalised
45 Analyses
This section gives an overview of the analyses that have been employed to evaluate the datasets in relation to the research questions The research questions for each paper are presented in Table 8 It does not cover the work conducted for preparing the data for the analyses Such initial data processing has included (but is not limited to) data screening descriptive analyses the transformation of (and creation of new) variables and reliability analyses for constructing composite variables IBM SPSS statistics 25 was the software used for most processing and analyses of the data
Table 8 Research questions of each paper
Paper Research questions I How can smartphone applications be used to promote pro-environmental travel behaviours
What are the key aspects to consider in developing a behaviour change support system for ICT II How does a mobility service application (MSA) affect travel behaviour and perceptions towards using
public transport for business trips What factors enable an MSA to facilitate more sustainable business trips
III How do marketing messages influence different segmentrsquos motivation to reduce car use What underlying dimensions affect the interpretation of such messages
IV What influence do attitudes accessibility to travel modes travel time and usual commute mode have on the motivation to reduce car use How does the motivation to reduce car use differ between the segments
V To what extent do e-bikes increase cycling for frequent drivers and what modes if any are substituted and to what degree How does an e-bike trial affect perceptions towards e-bikes
Note The research questions have been adapted from the aims as expressed in each paper
The relationship between the papers the datasets the approach the method of analysis and the analysis types are presented in Table 9
50
Table 9 The relationship between the papers datasets method approach and analysis type
451 Analytical samples and dependent variables
For each study an analytical sample was defined to ensure that all analyses were based on the same individuals The size of these samples gender distribution mean age and share of trips undertaken by car pre-intervention is presented in Table 10
In the cases where a certain type of trip has been examined these have been either business trips or commuting trips Commuting trips to work and school combined with business trips constitute about half of all trips in Sweden (Transport Analysis 2020) and are important to study as they are fixed in time and place for most people thereby contributing disproportionally to traffic congestion and environmental pollution (Heinen et al 2010)
Table 10 Analytical samples used in the analyses for each paper
Paper Analytical sample Share of women Mean age Share of car trips I 32 articles - - - II 77 participants 65 46 22 (business trips) III 994 respondents 48 45 46 (commuting trips) IV 850 respondents 49 42 51 (commuting trips) V 65 participants 12 48 90 (commuting trips)
In Paper I the focal interest was key aspects for promoting behaviour change through ICT which was examined through a narrative synthesis of previous research Since no statistical analyses were conducted no dependent variable (DV) was specified
Dependent variables in Paper II In Paper II the DVs were related to reported travel behaviour on the one hand and perceptions about the MSA as a tool for increasing public transport trips on the other
Paper Dataset Approach Method of analysis
Analysis type
I Literature-based data
Inductive Review Content analysis and inductive category development
II Business travel data
Inductive and deductive
Mixed Independentpaired samples t-tests and content analysis
III National survey data
Inductive Quantitative Exploratory factor analysis analysis of variance (ANOVA) and paired samples t-test
IV National survey data
Inductive Quantitative Multiple regression modelling and analysis of variance (ANOVA)
V E-bike data Deductive Quantitative Paired-samples t-tests and content analysis
51
The travel behaviour DVs were based on survey answers about the number of business trips undertaken by car public transport bicycle foot and aeroplane before and after the use of the MSA
Three pairs of DVs (before and after the use of the MSA) were constructed to assess the effect on perceptions towards public transport These determinants were performance expectancy effort expectancy and social influence which are parts of the UTAUT theory The first question was stated as lsquoHow possible is it for you to travel by bustrain for business tripsrsquo (performance expectancy) The second was a statement saying lsquoYou think that using the bustrain is difficultrsquo (effort expectancy) The third question was lsquoYour closest colleagues who also make business trips how often do you think they travel by bustrainrsquo (social influence) Each question was asked once for bus trips and once for train trips and the scale was from 1 to 7 where 1 was impossibletotally agreevery seldom and 7 was very possibletotally disagreevery often The mean score was then computed from the bustrain questions to get an average public transport score for each determinant
Dependent variables in Paper III In Paper III the DVs consisted of the factors identified from the exploratory factor analysis which was based on the stated motivation to decrease private car use from the 19 marketing messages
The first factor (and subsequent DV) consisted of the mean value from 11 messages while the second factor (DV) consisted of the mean value from eight messages A third DV consisted of the mean response from all the messages as a representation of the general motivation to reduce private car use The scale of the three DVs was 1 to 5 (lsquovery unmotivated to decrease my car usersquo to lsquovery motivated to decrease my car usersquo)
Dependent variables in Paper IV In Paper IV the marketing messages were used as the DV in the regression modelling to represent motivation to decrease private car use However since it was believed that the five messages related to status were of lower validity due to stronger reactance towards these kinds of messages they were omitted from the DV The aggregated values from the remaining 14 marketing messages were used to compute a continuous variable that formed the DV The scale of this variable was 14-70 Using the responses to the marketing messages as a proxy for general motivation to decrease car use was chosen because the responses were strongly associated with the behaviours and attitudes of the segments that were investigated in Paper III
A second DV was computed from the significant predictors in the regression to form a lsquoprecondition indexrsquo This was used to explore the trends in how the preconditions for motivation to reduce private car use are distributed demographically and in the
52
behaviour change stages of the TTM The following procedure was undertaken to compute the index
First a new variable was created for each of the significant predictors and each significant category was loaded with the estimated coefficients retrieved from the regression The non-significant categories (and reference categories) were given the value zero Second all the new variables were summed into a continuous variable in which each respondent had a value positioned on the index scale Different methods are available for aggregating indicators to form a composite index and the most common are the lsquoadditive methods that range from summing up unit ranking in each indicator to aggregating weighted transformations of the original indicatorsrsquo (Matteo Mazziotta 2013) The latter method was used to compute the precondition index the significant predictor coefficients were used as weights and aggregated to form an index Third the variable was transformed into a categorical variable for further analyses The range produced by the respondents was equally divided into four categories with the lower range indicating unfavourable preconditions the higher range indicating favourable preconditions and zero representing neither favourable nor unfavourable preconditions
Dependent variables in Paper V The majority of DVs were constructed from travel behaviour data retrieved from the participantsrsquo smartphones Several DVs were created based on the week of measurement mode of travel and treatmentcontrol group for the number of trips distance and modal share
A set of DVs was also constructed of perceived obstacles preventing participants to commute by bike to work comparing between a conventional bicycle and an e-bike The obstacles that constituted a DV were practical (pick-updrop-off transporting goods) time-consuming physically demanding too much of a distance bad cycling infrastructure traffic safety incentives for car commuting lack of secure parking
452 Type of analyses
Content analysis Content analysis was employed to a varying degree for extracting key findings from previous literature (Paper I) interviews (Paper II) and qualitative survey answers (Paper V) There are three approaches to content analysis conventional directed and summative (Hsieh and Shannon 2005) The differences between these approaches have to do with how content is categorised where the conventional content analysis derive categories directly from the text data the directional approach begins with a theory or a priori understanding that guides the development of categories and the summative approach involves counting and comparisons of content followed by
53
interpreting the underlying context Papers I and II used both the conventional and directive approaches because the coding of the literature and the interviews were derived inductively from the data (conventional approach) but interpreted in light of existing theories (directed approach) In Paper V a summative content analysis of the free-text answers was conducted in which the occurrence of stated advantages and disadvantages were counted and ranked for comparison
t-test In experimental work the t-test can be used to establish whether two means differ significantly at a predetermined probability level
Several of the papers set out to examine the difference between means representing either different treatments (for example different marketing messages and their influence on motivation to decrease car use) or different points in time (such as distance cycled before and after the e-bike intervention) Both of these examples drawn from Papers III and V assessed the potential difference between two means that came from the same sample also referred to as repeated measures design As such the paired samples t-test was used for making these comparisons because it assumes that the means come from the same entities
In contrast independent samples t-test assumes that two means are drawn from different samples a test that was used in Paper II to compare means for different characteristics between the treatment and the control group However assessing the effect of the MSA was a repeated measures design conducted within the treatment and the control group respectively and consequently the paired samples t-test was used for this analysis
Analysis of variance (ANOVA) In Papers III and IV there were more than two means from independent samples to be compared Therefore the one-way analysis of variance (ANOVA) was used for investigating whether motivation differed between eight segments (Paper III) and whether preconditions for motivation differed between the five stages of change in the TTM model (Paper IV) The ANOVA test cannot reveal which specific group means are significantly different from each other it only demonstrates if at least two groups are different To determine the relationships between all combinations of group means a post-hoc test needed to be conducted for each ANOVA analysis Different post-hoc tests exist depending on the assumptions that apply to the sample particularly if equal variance of the populations can be assumed For Paper III this assumption was violated and therefore a stricter post-hoc test was applied (Tamhanersquos T2) In Paper IV equal variances were met and so the Tukey post-hoc test was used instead which gives better power to the test than its stricter colleagues (Field 2018)
54
Exploratory factor analysis (EFA) In Paper III a relatively large set of marketing messages (19 to be precise) were shown to the respondents who were asked to state the level of motivation they felt to decrease their personal car use when exposed to each argument Every message had been predeterminably framed around typical themes (economy environment health status) However there was an interest in understanding what if any underlying dimensions unite the messages and if so what do these stand for Factor analysis attempts to achieve parsimony by explaining the maximum amount of common variance in a correlation matrix using the smallest number of explanatory constructs (Field 2018) These lsquolatent variablesrsquo represent several variables in this case marketing messages that correlate highly with each other As such EFA is useful for reducing large sets of information into fewer manageable factors
Two tests are indicative of the suitability for factor analysis The Kaiser-Meyer-Olkin Measure of Sampling Adequacy (KMO) is a statistic that suggests the share of variance in the variables that could be caused by underlying factors High values close to 10 indicate that EFA may be useful for the data Values less than 050 suggest that EFA would not be very useful The other test Bartletts test of sphericity tests the hypothesis that the correlation matrix is an identity matrix which would indicate that the variables are unrelated and therefore unsuitable for structure detection A significance level of p lt 005 indicate that factor analysis may be useful Both these tests indicated that factor analysis would be suitable for the data (KMO = 095 Bartletts test of sphericity (p lt 0001)
Principal axis factoring was chosen for extraction with oblique rotation (Promax) because this carries the assumption that the factors are correlated which is not accounted for in the commonly used orthogonal rotation which assumes factors to be independent (Pituch and Stevens 2016) Deciding on the number of factors to retrieve from the factor solution is often done iteratively and in the next stage interpreting the meaning of the factors is a subjective task However there are a few common thresholds that can guide the factor extraction process In the case of Paper III factors with eigenvalues larger than one in combination with a visual inspection of the scree plot served as guidance for the extraction procedure which resulted in a two-factor solution Messages clustering to the factors were considered meaningful if their loadings were above 035 (Jung and Lee 2011)
Multiple linear regression In Paper IV linear regression models were estimated to establish the feasibility of variables related to attitudes usual mode choice for commuting commuting time accessibility to travel modes and driving license in predicting motivation to decrease car use The rationale for estimating the linear models were threefold (1) to assess the correlational strength between each predictor and the dependent variable (motivation
55
to decrease private car use) (2) to establish the predictive power of the models (by inspection of explained variance via the adjusted R2 value) and (3) to create an index of significant predictor coefficients to be used for exploring how preconditions for motivation to reduce car use are distributed demographically and in the TTM stages
Preliminary analyses were conducted to ensure the non-violation of the assumptions of normality linearity and homoscedasticity by visualising the data in histograms scatterplots and normal P-P plots of standardised residuals Two outliers were excluded based on standardised scores (gt 3) and casewise diagnostics Cookrsquos distances were checked for influential cases and variance inflation factor values (VIF) were inspected for assessing the level of multicollinearity between predictor variables Combined these tests suggested that the variables were suitable for being included in the regression
The attitudinal survey questions were measured on a five-point Likert scale (strongly disagree disagree neithernor agree and strongly agree) Some of these variables were non-linear Therefore dummy variables were created for each category within each attitudinal predictor and neithernor served as the reference category This enabled to account for potential thresholds in the data and presenting a nuanced picture of how the predictors influence the dependent variable (see Paacuteez and Whalen (2010) for a similar approach)
56
57
5 Results
This chapter presents a summary of the aims and results from each paper (for a more detailed account of these see the respective papers in the appendix) The analyses and tools used are presented in the tables along with key findings and model summary when applicable
51 Paper I
The purpose of this study was to investigate how behavioural change techniques can be implemented in smartphone applications to encourage sustainable travel behaviours This was investigated by conducting a literature review from which key aspects of combining behaviour change techniques with ICTsmartphones were compiled Such systems are referred to as behaviour change support systems (BCSS) (Oinas-kukkonen 2010) The empirical findings were evaluated against a theoretical framework consisting of the TPB the TTM diffusion of innovations and gamification
An initial observation from the review was that many empirical studies (about half of the studies included in the review) lack theoretical grounding which suggests that there is a need for more research on this topic that embeds empirical findings in theory Further in the literature review 26 findings were identified which concern different aspects of BCSSs Through an inductive category development four distinctive categories were defined namely (1) customisation to the user (2) information and feedback (3) commitment and (4) appealing design
Based on the empirical findings and in light of the theoretical framework a conceptual model was developed that highlighted these aspects for creating a BCSS (see Figure 4) First of all customisation to the user appeared to be crucial to contextualise information feedback goal setting stimuli motivational mechanisms and other content within the BCSS Segmentation and targeting were identified as enablers for better customisation Due to its importance customisation to the user is the starting point in the model which influences information and feedback and commitment since both of these parts should be grounded in the userrsquos needs as well The rationale is that these three parts in combination will contribute to an appealing design which in itself also needs to be simple and user friendly The arrow design is a reminder that the
58
development of a BCSS is a process that benefits from continuous evaluation and improvement preferably with input from the users themselves
Figure 4 A conceptual model for combining behavioural change techniques with ICT to create a behaviour change support system (BCSS) Source Andersson et al (2018)
A suggestion for further research was to evaluate the effect of BCSSs to change behaviours preferably with larger datasets to allow generalisations and with support in theory Further a potential research strand identified was more studies that explore transport-related segmentation and that evaluate the effect of tailored messages for changing travel behaviour Finally future research was recommended to continue exploring the possibility of measuring actual travel behaviour change with the use of smartphone technology
Table 11 Summary of results from Paper I
Analysis Tool Key findings General observations regarding previous research on ICT and behaviour change support systems
Qualitative content analysis
Lack of studies grounding behaviour change techniques in behaviour theory Segmentation would allow better customisation to the user
Key aspects for influencing behaviour through ICT in the fields of energy health and fitness climate and environment transport and mobility
Inductive category development
26 findings sorted into four categories customisation to the user information and feedback commitment appealing design
59
52 Paper II
The aim was to evaluate the implementation of a new smartphone application developed by Samtrafiken to facilitate more business trips to be carried out by public transport The application was referred to in the study as a mobility service application (MSA) Both surveys and interviews were conducted to evaluate the MSA The quantitative part focused on analysing changes in travel behaviour and changes in determinants based on UTAUT regarding perceptions of public transport The qualitative interviews focused on how the participants believe that their organisations manage business trips and their view of the MSA as a support to facilitate more sustainable business trips
Of the three UTAUT determinants (performance expectancy effort expectancy and social influence) only effort expectancy was significantly different comparing between before and after the implementation of the MSA This indicates that the treatment group (MSA users) thought it was easier to use public transport after they had experienced the application No difference was found for the control group
In Paper II the performance expectancy variable was omitted from the analysis due to violation of normality (although several attempts to overcome this were made by transforming the variable) In retrospect performing the analysis with bootstrapping would have solved the issue because it does not assume normality (Field 2018) Since the sample size was small (n = 77) this would also have added rigour to the analysis by estimating more robust confidence intervals Therefore post-publication the paired samples t-tests were re-estimated for all three determinants for both the treatment and the control group3 Based on 2000 random resamples and 95 confidence intervals it was found that performance expectancy (the skewed variable) and social influence were not statistically different (p = 0597 and 0119 respectively) while effort expectancy was (p = 0026) Thus the conclusions made in Paper II are valid even with robust estimations with the additional result that the perceived possibility to travel by public transport (performance expectancy) did not change as a result of using the MSA
Due to a high dropout rate missing data from the sample and low use of the MSA it was not possible to assess potential differences in travel behaviour as a result of using the application The trips made using the MSA consisted mainly of regional trips by train and bus Only 35 out of 193 individuals used the MSA for the full period and this group already travelled more by public transport than the rest of the sample This is an example of the importance of collecting data from larger samples especially when the intervention is expected to yield a small effect Since the research team was not participating in the recruitment procedure it was difficult to limit attrition and self-
3 Not part of Paper II
60
selection bias which is a general problem in studies attempting to evaluate these kinds of interventions in field experiments (Cellina et al 2019)
From the interviews three factors were identified that could affect the success of a new MSA as a means of increasing sustainable business trips management control and proactiveness perceived improvement due to the intervention and functions and technical sufficiency of the MSA tool
The importance of facilitating organisational conditions that favour sustainable business travel was highlighted expressed as the factor management control and proactiveness For this to happen the interviewees expressed that management needs to take responsibility for implementing and promoting a travel policy making sustainable transport more accessible for employees and creating an organisational culture that encourages pro-environmental behaviour The management also need to lead by example Regarding the perceived improvement due to the intervention the respondents who used the MSA were generally positive about it as a means of managing business travel and many emphasised that the MSA had the potential to make a significant contribution although not in its current form The fact that the MSA automatically handled travel expenses was especially appreciated but there were also shortcomings (technical and functional) that prevented participants from using the MSA Much criticism was related to functions and technical sufficiency The participants wanted a greater range of transport services to be included in the MSA In addition to the purely technical aspects the MSA was expected to offer more ticket options and be easier to use An important reason for not using the MSA was that existing business travel booking systems were either procured and thus employees had to use that service or that existing booking systems were more flexible and offered more personalised service The results also show that the MSA would need to be integrated with existing systems and guidelines to avoid conflicts that might otherwise occur to the user
A methodological lesson from this study was the need to carefully design intervention studies to avoid significant differences in representativeness between the treatment and the control groups as well as consider what type of information and incentives could increase participation in field experiments
Table 12 Summary of results from Paper II
Analysis Tool Key findings The difference in attitudes before and after the MSA trial comparing test- and control group
Paired samples t-test Increase in effort expectancy (easier to use PT) for the test group (p lt 005) while no change was observed for the control group
Aspects that affect the success of a new MSA as a means of increasing sustainable business trips in organisations
Qualitative content analysis
Management control and proactiveness perceived improvement due to intervention functions and technical sufficiency Establishing an organisational culture that favours sustainable business trips
61
Methodological weaknesses Reflections on the method
Challenging to retain interest from participants over time in app-based interventions Future studies should carefully consider what type of information and incentives could increase participation
53 Paper III
The aim was to evaluate how common marketing messages to promote sustainable transport influence different segmentsrsquo motivation to reduce car use and to identify underlying meanings that affect the interpretation of such messages to understand how sustainable transport can be promoted more effectively
The respondents (n = 1300) were asked to assess their level of motivation to decrease their private car use when exposed to each of the 19 marketing messages Information about mode choice for commuting as well as attitudes were used for segmentation according to SEGMENT (for details about the items see appendix)
Descriptive statistics showed that divided into the predetermined frames (environment health economy status) messages induced more motivation if related to environmental or health issues which had mean values of 351 and 344 respectively compared to economic (327) and status (276) messages
Running the messages within a factor analysis suggested a two-factor solution based on eigenvalues over Kaiserrsquos criterion of 1 which explained 50 of the variance in combination The messages clustering to the first factor seemed to represent personal health financial benefits convenience and status Overall these items point toward the individual gaining utility from using sustainable transportation and that one should act pro-environmentally due to self-interest On the contrary the messages related to the second factor seemed to be related to concerns of the environment health (both personal and societal) collective responsibility and morality This suggested that a more altruistic dimension was uniting the messages in the second factor Based on this line of reasoning one could argue that the factors represent egoism on the one hand (first factor) and altruism on the other (second factor) This labelling was used in the first drafts of Paper III
Another interpretation could be to judge the messages within the factors according to whether they communicate individual or collective efficacy since the first factor included more individualistic messages and the second more collective messages4 In the end the choice was made to label the factors accordingly that is the first factor was to represent self-efficacy and the second collective efficacy Self-efficacy focuses explicitly
4 A suggestion put forward by one of the anonymous reviewers
62
on the efficacy expressed by an individual and is defined as lsquothe belief in onersquos capabilities to organise and execute the courses of action required to manage prospective situationsrsquo (Bandura 1995 p 2) while the definition of collective efficacy is lsquoa grouprsquos shared belief in its conjoint capabilities to organise and execute the courses of action required to produce given levels of attainmentsrsquo (Bandura 1997 p 477)
However it is important to emphasise that self-efficacy and collective efficacy are not interchangeable with egoism and altruism Self-efficacy has been demonstrated to be important for individuals in performing all kinds of behaviours including pro-environmental behaviours (Kloumlckner 2013 Skarin et al 2019) In general individuals are more inclined to perform behaviours they believe to be achievable and people with high self-efficacy set higher goals for themselves put more effort into changing behaviour and persevere when facing obstacles (Bandura 1997) Collective efficacy has on the other hand been increasingly associated with pro-environmental behaviours (Barth et al 2016 Doran et al 2015 Reese and Junge 2017) and it seems reasonable to assume that motivation to act in response to collective problems requires a sense of collective efficacy This could for instance turn perceived individual powerlessness in the face of climate change into personal action since a strong sense of collective efficacy has been shown to increase perceived self-efficacy (Jugert et al 2016)
Still it is important to stress that labelling the factors is a subjective task and other labels might be more suitable for capturing their essence that the first factor relates to personal health financial benefits convenience and status while the second factor relates to concerns of the environment personal and societal health collective responsibility and morality
The analysis of the difference in reported motivation for the two factors showed that the second factor was significantly more motivating for all segments although there were also significant differences between the segmentsrsquo general level of motivation The results indicated that the segments were more motivated by messages that confirmed their current attitudes and travel behaviour For instance cycling messages appealed more to regular cyclists However this expectation that attitude-based segments would differ significantly in motivation depending on the kinds of messages was not so clear Rather the difference between segments was expressed in the general motivation to decrease car use based on existing preconditions The difference in general motivation seemed to depend on prevailing attitudes and behaviours demonstrating the effect of assimilation bias which occurs when perceptions of new evidence are interpreted in such a way as to be assimilated into prevailing beliefs (Lord et al 1979) Consequently the way to influence preconditions for motivation to decrease private car use was the subject under study in Paper IV
63
Table 13 Summary of results from Paper III
Analysis Tool Key findings Model summary Mean values for pre-defined message themes
Descriptive analysis
Environmental (351) health (344) economic (327) status (276) Scale 1-5 (very unmotivated to very motivated)
-
Latent dimensions in 19 marketing messages
Exploratory factor analysis
Two-factor solution interpreted as lsquoself-efficacyrsquo (11 items =87) and lsquocollective efficacyrsquo (8 items
=88)
KMO = 095 Bartletts test of sphericity Approx Chi-square = 859068 df = 171 (p lt 0001) of variance = 5049
Difference between latent variables for each segment
Paired samples t-test
Devoted Drivers (p lt 0001) Image Improvers (p lt 0001) Malcontent Motorists (p lt 0001) Active Aspirers (p lt 0001) Practical Travellers (p lt 0001) Car Contemplators (p lt 001) PT Dependents (p lt 0001) Car-free Choosers (p lt 0001)
-
Analysis of variance between segments
One-way between-subjects ANOVA Post Hoc analysis (Tamhanersquos T2)
Segments differed in motivation Segments motivation to reduce car use based on the marketing messages seemed to be influenced by assimilation bias
All messages F(7) = 40027 p lt 0001 Self-efficacy messages F(7) = 33504 p lt 0001 Collective efficacy messages F(7) = 36514 p lt 0001
54 Paper IV
The aim was to explore what motivates people to reduce their car use and how such preconditions for motivation are distributed in the population demographically and the behaviour change stages of the TTM Further the study attempted to analyse motivational preconditions for persistent drivers in isolation
A multiple linear regression model was estimated to understand which variables correlate with the motivation to decrease private car use Driving license accessibility (to a car public transport andor bicycle) the usual modal choice for commuting and commuting time were used to predict motivation to decrease private car use together with attitudinal variables towards the climate car use cycling and public transport The model explained about half of the variance in motivation
It was found that climate morality was the most critical factor associated with motivation to decrease private car use Those strongly disagreeing with feeling a moral obligation to reduce onersquos carbon emissions were significantly less motivated to decrease their car use On the contrary agreeing with this statement was associated with higher motivation compared to being indifferent (neithernor)
Other influential factors were the usual commute mode where those usually travelling with public transport walking or cycling were more motivated to decrease car use
64
than those commuting by car For car advocacy that is the level of lsquoattachmentrsquo one feels towards the car less attachment was associated with higher motivation Health concern that is being less aware of the positive health gains associated with cycling was correlated with a lower level of motivation Having a positive attitude towards cycling increased motivation compared to those being indifferent to cycling Further having a weak car identity (disagreeing with identifying oneself as a car user) had a positive association with motivation Travel time for commuting was not a significant factor on motivation to decrease car use until it reached long commuting times of more than 60 minutes which significantly dampened the motivation compared to those with travel times of 10 minutes or less
In the next analysis the precondition index (constituting the significant predictors from the regression) was cross-tabulated with demographic variables to see how motivational preconditions differ between groups Significant differences were found for gender age educational attainment and residence while relationship status and whether one has children living at home were non-significant Males the middle-aged people with low educational attainment and rural residents had the least favourable preconditions concerning motivation to reduce car use
Figure 5 Cross-tabulation between the precondition index and the TTM stages Source Andersson (2020)
An additional cross-tabulation was made between the precondition index and the TTM stages (see Figure 5) which revealed that preconditions are increasingly more favourable
65
moving from pre-contemplation (the first step in the TTM) to maintenance (last step) A separate correlation analysis5 (Pearsonrsquos r) revealed a moderate but significant correlation of 046 (p lt 001) This means that behaviour change stages could be a useful tool for determining suitable segments to target within an intervention since preconditions for motivation do correlate with the TTM stages Further it was observed that the highest precondition threshold between stages was between pre-contemplation and contemplation suggesting that the transition from pre-contemplation is the hardest step The strategy of targeting the lsquoambivalentrsquo segments for instance the contemplation and preparation stages (Forward 2014) could therefore be much more fruitful than trying to convince pre-contemplators to shift behaviour
As can be seen in Figure 5 pre-contemplators had less favourable preconditions than the other segments (pre-contemplators differed significantly from all the other stages) A separate regression analysis was therefore conducted to see if the associations with motivation differed for this segment The same variables were used as in the first model but this time only the pre-contemplation segment was included
The results were similar to the first regression model with a few exceptions Climate morality was even more influential for pre-contemplators Strongly disagreeing was associated with a near ten-fold lower motivation to decrease car use compared to neithernor while strongly agreeing increased motivation five-fold Being a car advocate and neglecting the positive effects of cycling correlated with motivation negatively while enjoying cycling and disagreeing to identify as a car user had a positive association Unlike the first model usual commute mode and travel time were not significant which may be due to the overall higher commute by car habit in the pre-contemplation segment and the smaller sample size (n = 299)
Table 14 Summary of results from Paper IV
Analysis Tool Key findings Model summary
Motivational associations
Multiple regression DV motivation to reduce private car use
Usual commute mode (ref car) (B 325 CI 181-468 p lt 0001) Travel time gt 60 min (ref 10 min) (B -331 CI -573--89 p lt 001) Attitudes (ref neithernor) Climate morality strongly (st) disagree (B -721 CI -928--514 p lt 0001) Climate morality agree (B 218 CI 065-371 p lt 001) Climate morality st agree (B 469 CI 310-627 p lt 0001) Advocate private car use st disagree (B 224 CI 42-406 p lt 005) Advocate private car use disagree (B 241 CI 80-402 p lt 001)
Adjusted R-square 047
5 Not part of Paper IV
66
Advocate private car use agree (B -281 CI -451--106 p lt 001) Advocate private car use st agree (B -389 CI -557--220 p lt 0001) Like cycling agree (B 337 CI 175-498 p lt 0001) Like cycling st agree (B 369 CI 195-543 p lt 0001) Concerned about health st disagree (B -223 CI -398--47 p lt 005) Perceive cycling as fast st disagree (B -266 CI -449--82 p lt 001) Perceive cycling as fast disagree (B -197 CI -392--002 p lt 005) Identify as a driver st disagree (B 179 CI 07-350 p lt 005)
Pre-conditions for motivation in the sample
Analysis of frequencies
Four categories of pre-conditions ranging from unfavourable to favourable 1st category (6) 2nd category (22) 3rd category (40) 4th category (32)
-
Pre-conditions within demo-graphic factors
Cross-tabulation analysis
Significant differences (more favourable) gender (women) age (younger cohorts) education (higher) occupation (students) residence (urban) No differences relationship status children living at home
-
Distribution of sample based on TTM-stages
Analysis of frequencies
Pre-contemplation (36) contemplation (10) preparation (4) action (31) maintenance (19)
-
Pre-conditions within TTM-stages
Cross-tabulation analysis and one-way between-subjects ANOVA (post hoc test Tukeyrsquos HSD)
Preconditions in category 1 2 3 and 4 for each TTM-stage Items in superscript indicate significant differences a Pre-contemplationb c d f (9 37 45 8) b Contemplationa d e (7 21 45 27) c Preparationa e (6 12 50 31) d Actiona b e (3 14 39 43) e Maintenancea b c d (2 7 28 62)
F(4) = 53211 p lt 0001
Motivational associations in the pre-contemplat-ion segment
Multiple linear regression
Attitudes (ref neithernor) Climate morality st disagree (B -995 CI -1357--632 p lt 0001) Climate morality st agree (B 497 CI 177-817 p lt 001) Advocate private car use agree (B -455 CI -737--173 p lt 001) Advocate private car use st agree (B -574 CI -851--297 p lt 0001) Like cycling agree (B 479 CI 195-764 p lt 001) Like cycling st agree (B 488 CI 168-808 p lt 001) Concerned about health st disagree (B -469 CI -821--116 p lt 001) Perceive cycling as fast disagree (B -342 CI -655--29 p lt 005) Identify as a driver st disagree (B 335 CI 53-617 p lt 005)
Adjusted R-square 051
67
55 Paper V
This paper aimed to assess the substitution effect of e-bikes in a randomised controlled e-bike trial and the influence of the trial on the participantsrsquo perceptions towards e-bike use
Earlier research in this field has employed either a cross-sectional or quasi-experimental study design that suffers potential bias from confounding factors or a lack of internal validity Further most studies rely on self-reported survey answers which could result in over or underestimation of effects due to memory biases and social desirability bias To the best of the knowledge of the author this was the first study to assess the substitution effect of e-bikes using an RCT design with objective travel behaviour data from smartphones
About 100 participants were targeted for the trial Car use in the sample was extremely high nearly all participants usually drove to work and around 70 had two or more cars within the household
Three measurements were undertaken during spring 2020 Due to the COVID-19 outbreak it was fortunate that we included a control group that could help isolate the effect of the trial despite the circumstances
The e-bike use increased by an average of one trip and 65 km per person per day which led to a 25 increase in total cycling The whole increase was at the expense of car use which on average decreased by one trip and 14 km per person per day a decrease in car mileage of 37 The modal share of the car decreased by 21 expressed both as the number of trips and distance The effect size was medium for the decrease in car trips and distance (d = 04-06) and large for the increase in cycling (d = 088-631)
An unexpected effect was that the total distance travelled decreased by approximately 20 during the trial which contributed to half the reduction in car mileage with the increase in cycling accounting for the other half The travel behaviours in the control group remained unchanged during the treatment grouprsquos trial period but the same pattern was observed when the control group had their trial period This could be due to changes in travel patterns resulting from choosing more proximal destinations when having access to the e-bike However the cause remains to be further investigated
Most participants considered work and other single purpose trips to be the errands best suited for e-cycling E-cycling was perceived as less time-consuming and physically demanding compared to conventional cycling and long distances were perceived to be lsquoshorterrsquo due to the ease of use associated with e-cycling On the other hand lacking a secure parking spot was a significantly larger issue when using the e-bike because of the increased risk of theft
68
In the qualitative assessment of the e-bike stated advantages outweighed stated disadvantages Bad weather was the largest disadvantage of e-cycling according to the participants The other disadvantages were practical issues like performing errands that included transporting goods or passengers the heavy battery and the risk of theft Some reported that it was time-consuming to e-cycle compared to driving that it had technical weaknesses such as low speed and bad geometry and that it was heavy and too expensive to purchase
The most positive aspect of the e-bike according to participants was the ease and convenience of use Some of the other benefits were related to altruistic and hedonic aspects e-biking was considered good for the environment and positive in the sense that it made one more alert and provided more opportunities for exercise The participants also appreciated getting fresh air during their morning commute and some wrote that it was fun to use and contributed to increased wellbeing About one in five participants stated that the benefits of the e-bike were also related to time savings avoidance of congestion not having to find a parking space and cost savings
Table 15 Summary of results from Paper V
Analysis Tool Key findings Model summary Effect of the e-bike trial on the number of trips by mode of transport per person per day (modal share in paratheses)
Paired samples t-test with 2000 bootstrap samples
Test group Car -1 (-21) (p lt 005) e-bike +06 (+17) (p lt 001) total bike +09 (+25) (p lt 001) Control group No differences Control group with an e-bike Car -11 (-31) (p lt 005) e-bike +1 (+19) (p lt 005) bike +05 (10) (p lt 005) total bike +15 (+29) (p lt 001)
Cohenrsquos d Car 050-058 E-bike 525 Bike 196 Total bike 192-552
Effect of the e-bike trial on distance travelled by mode of transport per person per day (modal share in paratheses)
Paired samples t-test with 2000 bootstrap samples
Test group Car -137 km (-21) (p lt 005) e-bike +51 km (+16) (p lt 005) total bike +65 km (+21) (p lt 001) Control group No differences Control group with an e-bike Car -125 km (26) (ns) e-bike +71 (+22) (p lt 001) total bike +82 (+23) (p lt 001)
Cohenrsquos d Car 060
E-bike 196 Total bike 196-631
Comparing obstacles for cycling with bicycle and e-bike
Paired samples t-test
Less time-consuming and physically demanding to e-cycle and long distances are a smaller issue (p lt 0001) Lack of secure parking a larger issue for e-bikes (p lt 001)
-
Advantages and disadvantages of the e-bike ( of respondents mentioning the issue in question)
Qualitative content analysis inductive category development and analysis of frequencies
Positive Easy convenient (41-60) exercisehealth environmentally friendly fresh air pleasantfun fastsave time (21-40) no congestion increased wellbeing save money (1-20) Negative Bad weather errands with goods heavy battery (21-40) risk of theft time-
-
69
consuming comp to a car technical issues with e-bike heavy bike expensive to buy (1-20)
70
71
6 Discussion
As laid out in the introduction of this thesis the purpose of this research is to contribute with knowledge on how to reduce the demand for car use by encouraging a modal shift towards walking cycling and public transport Soft measures have been in focus to achieve this It is now time to put the results from this work into context and discuss them in relation to the research aims
61 Recapitulation of aims
The first aim was to explore two transport innovations smartphone applications and e-bikes in terms of their potential to improve evaluations of soft transport measures and influence travel behaviour
The second aim was to investigate what influences motivation to decrease private car use for different segments and how this can be used to improve soft transport measures
62 First aim Potential of innovations for soft transport measures
Soft transport policy is perhaps not the field most commonly related to lsquoinnovationrsquo in the sense that new technological solutions appear that significantly change the preconditions for what can be achieved However one could argue that the emergence of (at least) two innovations within the last decade have done precisely that and could potentially contribute to enhance the conduct of soft measures in two important ways Firstly through the e-bike as a new competitive alternative to the car Secondly by the utilisation of the GPS-tracker smartphone application as a data collection tool for evaluating soft measures
72
A new star in the soft measurersquos toolbox As found in Paper V a large substitution effect was realised from car to e-bike in the e-bike trial Cycling increased and car use decreased significantly (both in terms of the number of trips and distance travelled) The effect sizes for the decrease in car use were medium at Cohenrsquos d 044-060 which is substantially more than the average range of soft measures (011-017) as reported by previous meta-analyses (Bamberg and Rees 2017 Fujii et al 2009 Semenescu et al 2020) Indeed the decrease was so large that the participantsrsquo average car use at the end of the trial expressed as daily kilometres driven was in the range of what has been estimated to be at the sustainable level per capita (218 km) for reaching the climate goals for the Swedish transport sector (Winslott Hiselius and Smidfelt Rosqvist 2018) Thus the potential for e-bikes to contribute to a more sustainable transport system is large
However only about half the decrease in car kilometres could be explained by the e-bike substitution raising the question of what could be causing the rest of the decrease Moreover would the effect hold over time say a year after the intervention Although a follow-up survey was conducted four to five months after the intervention by the partner organisation VGR (Vaumlstra Goumltalandsregionen) in which 44 of participants stated that they cycled more to everyday activities than before the e-bike trial and 16-26 that they bought an e-bike more robust and longitudinal evaluations are needed Results from earlier research are promising participants have been found to have weaker car habits a year after trialling an e-bike (Moser et al 2018) and the substitution effect for consumers of e-bikes are similar to the effects found in trial settings (Fyhri and Sundfoslashr 2020) From the perspective of implementing soft measures e-bike trials seem promising as well Since we carried out the campaign in Skoumlvde the same arrangement has been implemented in another six municipalities with a total of over 200 participants It is now a continuous measure used by the mobility management team in VGR to encourage more sustainable travel behaviours (Ryberg 2021)
The potential with e-bikes has been recognised in the UK as well Philips et al (2020) found that e-bikes if used to replace car travel can cut car carbon dioxide emissions in England by up to 50 The authors emphasise that the greatest potential lies in the rural and sub-urban settings and advocate the implementation of a strategic national cycle network linking villages to towns and towns to cities
Perhaps one of the most intriguing aspects of the e-bike is that it appeals to a wider array of segments than conventional bicycles and public transport do E-bikes provide people who would otherwise not be able to bike due to old age physical limitations or proximity to locations the ability to overcome these challenges (MacArthur et al 2014) Further studies from Western countries have found that more men than women use e-bikes (Haustein and Moslashller 2016) which is positive from the point of view that men generally use cars more compared to women while also being less motivated to reduce that use (Polk 2004 2003 Waygood and Avineri 2016) Indeed 80 of the
73
participants in the e-bike sample were men and judging by the qualitative survey answers they seemed to appreciate using the e-bike primarily for its convenience for giving health benefits and increased wellbeing and for being an environmentally good option
Unclear to what extent smartphones can lsquonudgersquo travel behaviour From the perspective of influencing modal choice a smartphone innovation was evaluated in Paper II in the form of a mobility service application (MSA) Unfortunately the data material was insufficient for an effect-evaluation to be carried out and as a result the potential for smartphones to influence travel behaviours could not be assessed although there was an indication that the MSA had made it easier to travel by public transport
The qualitative process evaluation revealed that several weaknesses with the MSA as well as organisational barriers discouraged participants from using the MSA to a large extent The weaknesses of the MSA can be interpreted in light of the conceptual model developed in Paper I It was stated that the MSA failed to align with the current and often procured business travel agency which made it difficult for some participants to use the MSA even if they wanted to Some stated that the app had too few ticket options and was lacking the personalised service that users were accustomed to from their travel agency According to the model this level of customisation to the user would be insufficient Further there were no real incentives to use the MSA and the users received no feedback regarding their behaviour or use of the app In some organisations the MSA was hardly advertised at all It thus seems that the importance of personalised information and feedback as well as commitment towards using the app as stated in the model were neglected in the design of the MSA A particular limitation of the MSA related to technical weaknesses such as a slow login procedure and non-user-friendly interface which made many of the participants think that the app was not fully developed Clearly the MSA lacked an appealing and user-friendly design which is an essential part of the model Hence when contrasting the MSA against the conceptual model it is unsurprising that the MSA was not more successful
Despite these issues many participants thought that the MSA had the potential to improve how sustainable business trips can be handled (an example was the automatic handling of travel expenses) However the diversity of apps and their increased technical development means that conclusions about smartphone applicationsrsquo general ability to influence travel behaviour can hardly be drawn from this particular case Many factors determine the effectiveness of an intervention not just the design of the app but also the design of the study Lately several research studies have demonstrated a significant behavioural effect by utilising some of the features stated in the conceptual model within smartphone apps to encourage cycling (Weber et al 2018) walking (Nakashima et al 2017) and more sustainable and healthy modes of transport in general (Cellina et al 2019 Ek et al 2020) Thus there seems to be some potential
74
in these apps that could benefit soft measures although more research is needed in this emerging field before any conclusions can be drawn about their general effectiveness
A game-changer for evaluation practice lsquoAre we there yetrsquo This question is posed by Harding and colleagues (2020 p 1) upon assessing a range of smartphone applications as tools for collecting travel-data After assessing 17 different travel apps in 2016 they conclude that while accuracy in terms of trip detection is high in most cases performances are more varied for mode inference
The pursuit for more sophisticated GPS-based solutions for measuring the effect of soft transport measures has been around for some time now The conventional method of using travel diaries is not as reliable as we would like (Bonsall 2009 Rosenfield et al 2020) Already within the TravelSmart program in Australia GPS measurements were piloted as an alternative to travel diaries (Stopher et al 2006) Before the prevalence of smartphones GPS devices were used to measure time and distance travelled and the data was then coupled with the road network public transport routes and survey answers from the participants to establish mode choices (Stopher et al 2009) With smartphones high-quality data can be collected from individuals over several days while minimising the burden on the owner Individuals do not need to remember and manually report details about their trips Instead the app can log travel activities in the background and provide a user interface so that the respondents can validate the information at the end of the day Even now though this technology is as of yet untapped in evaluating soft measures something that is highlighted in the latest meta-analysis by Semenescu et al (2020 p 14)
A significant limitation to current data collection practices based primarily on self-reported information is the possibility of bias both from the intervention evaluator as well as from the intervention recipient These biases could be eliminated by the process of collecting data with the use of smartphones or GPS devices Such changes should be adopted not only by progressive researchers but should become standard practice for intervention providers especially if financing organisations demand higher quality evaluations as an important part of the intervention program
The e-bike intervention carried out within this thesis came with the opportunity to collect data with the TravelVu smartphone application Three measurement periods of one week each were undertaken that resulted in a detailed dataset in which it was also possible to detect smaller changes in travel behaviour as a result of the intervention Moreover the survey responses were collected from the app as well making it easier for the respondents since they did all the reporting in the same tool Some participants had problems with the app although these were few and could most often be alleviated with support from the project team
75
Compared to the data collection procedure in Paper II which was conducted with a web survey the dropout rate was much lower in the e-bike sample (34 drop-out in the e-bike sample and 60 dropout in the business travel sample) Further the data collected from smartphones provided considerably more details about the travel behaviours of the participants
So are we there yet Perhaps it is too early to say that smartphone applications are ready to replace conventional methods used in large-scale national travel surveys one reason being that the response rate could be lower and more skewed thus increasing the risk of attaining a biased sample However as a tool used for assessing behavioural interventions such as soft transport measures it seems to be increasingly indispensable and my own view is that it should be preferred whenever possible as long as an in-depth examination is warranted for the study in question
To control or not control that is not a question The problem of weak study designs in evaluations of soft measures often has to do with the absence of a control group This is a significant issue because it prevents the production of reliable and politically useful evaluation results (Arnott et al 2014) On the other hand including controls in real interventions could be met with reluctance from practitioners who do not want to lsquowastersquo participants who would otherwise have gone into the treatment group (Lieberoth et al 2018) The usual goal of the actor that fund soft measures is to engage as many of the population of an area as possible in the campaign (Stopher et al 2009) Moreover if a control group is incorporated it might result in larger dropouts since the control group is usually less incentivised to participate in the study than the individuals assigned to the treatment group
In a systematic review in the field of medicine on exercise oncology trials Bisschop et al (2015) found that control groups receiving an intervention have lower contamination and dropout rates compared to control groups receiving no intervention To the best of my knowledge similar studies have not been conducted in the transport field despite the obvious advantages of minimising attrition in transportation intervention studies From experiencing high dropout rates in Paper II preventing this from happening again in the e-bike trial became a priority The attempt with an additional trial phase was therefore made in which the control group received the e-bike treatment as well This had likely a positive effect on participation since the trial lasted for a relatively long period (two months excluding the last trial phase) Moreover the participants volunteered to take part in the study with hopes of trialling an e-bike Without treatment those randomly assigned to the control group could have been disappointed and dropped out of the study especially since they would have had to record their travel behaviour and answer questionnaires without getting anything in return
76
Apart from mitigating attrition offering the intervention to the control group after the test group deals with the concern of lsquowasting participantsrsquo since all participants get treatment An additional bonus is more trial data that can be used to validate the effect of the original test group This approach will help to satisfy both the practitioner aiming to maximise the reach of the intervention and the researcher whose main priority is scientific rigour Hence in cases where an effect evaluation is warranted the reasons for not including a control group seem increasingly invalid In fact disseminating this method could lead to increased use of control groups in practice thus realising better evaluations which in turn would facilitate a cumulative understanding of the effects of soft measures
63 Second aim Motivation to decrease car use and the use of segmentation for improving soft measures
Climate morality can only get us so far One of the key questions that confront research and practice regarding soft transport measures is what motivates pro-environmental travel behaviour In this thesis climate morality was particularly important for the motivation to reduce car use and for travelling with more sustainable means of transport Attitudes towards cycling and car use past behaviour and travel time were also significant predictors This is in line with previous research that has found people to be more likely to reduce car use if they like cycling and have experience of it (Fernaacutendez-Heredia et al 2014 Gatersleben and Uzzell 2007 Handy and Xing 2011 Rondinella et al 2012) People with higher affection for cars are less likely to reduce their use of them (Steg 2005 Steg et al 2001b) and long distances tend to discourage commuters from using sustainable transportation (Heinen et al 2013)
Climate morality was the most influential factor This picture was reinforced by the fact that marketing messages for sustainable travel did induce more motivation to reduce private car use if the messages were more altruistic that is emphasised the need to care for the environment personal and societal health benefits of more sustainable travel behaviour collective responsibility and morality This is in line with Franssens et al (2021) who found that public transport operators can increase public transport use by incorporating messages that positively label passengers as sustainable travellers in their communication strategies
Together these findings indicate that motivation to engage in pro-environmental travel behaviours is influenced by moral constructs Indeed some argue that environmental concern and behaviours are most strongly linked to values (Schwartz 1977) particularly altruistic and biospheric orientations (de Groot and Steg 2008) and the
77
activation of pro-environmental personal norms (Stern 2000) A personal norm is activated when individuals realise the consequences of their behaviour (for instance towards the environment) and when they feel personally responsible for the behavioural consequences This increases the likelihood of engaging in altruistic behaviour such as reducing car use in favour of more sustainable but less convenient and comfortable modes of transport However personal norms are only translated into altruistic behaviours when a person feels able to execute them and when there are no perceived barriers or high costs involved (Schwartz 1977)
Previous research supports this stance and suggests that environmental personal norms play a marginal role in predicting actual travel mode choice while emerging as a significant predictor of intention or motivation to choose green modes of transport (see Kloumlckner 2013 and Lanzini and Khan 2017 for meta-analyses) Pro-environmental personal norms were for instance found to only have an indirect effect on e-bike use in a recent Norwegian study (Simsekoglu and Kloumlckner 2018) This indirect-only relationship between environmental personal norms and behaviour is not necessarily bad news as it still offers a potential benefit as expressed by Kloumlckner (2013 p 1036)
[hellip] personal norms are relatively stable compared to attitudes and intentions If a personal norm is created the effect of that norm can last for a long time
When there is an inconsistency between personal norms and behaviour it could be due to a lack of perceived behavioural control to perform the behaviour which is a strong determinant of travel behaviour (Javaid et al 2020) This is often the reason for the attitude-behaviour gap which refers to the difference between what our attitude to something is versus our behaviour in relation to it (Milfont and Duckitt 2010) A similar gap in decision-making theory conceptualised as bounded rationality (Simon 1955) refers to the restraints such as time and cognitive skills that prevent people from making perfectly rational decisions One can argue that the general desire to act in accordance with onersquos moral values is also limited or bounded by rationality To facilitate sustainable travel behaviours it is therefore important to minimise the discrepancy between pro-environmental and rational modal choices For instance the convenience of the e-bike may increase the perceived behavioural control to reduce car use for some people But it is also important to emphasise the need for hard structural conditions that facilitate sustainable means of transport for instance by pricing and taxation physical measures that re-distribute road space and priority measures that restrict access and parking for cars sustainable and integrated transport- and land-use planning and so on (Buehler and Pucher 2011 Marshall and Banister 2000 Pucher and Buehler 2017 Santos et al 2010) The significant effect of climate morality on motivation to decrease private car use as found in this thesis could be a factor that increases the acceptance for such hard structural measures that facilitates sustainable travel behaviours
78
Attitude-based segmentation needs to be assessed in practice In Paper III the use of the SEGMENT model showed that car users with similar demographic characteristics differ profoundly in their modal split and that this difference was better described by attitudes compared to demographics Thus in line with previous research segmentation based on demographics appears to be insufficient in predicting travel behaviour and motivation to change behaviour (Anable 2005 2002) One exception is that between car users and non-car users where demographics do matter non-car users are younger have fewer children and are more often students
How can attitude-based segmentation be used then in practice to find appropriate segments to target Several segmentation procedures including attitudinal survey items have been introduced by researchers (Anable 2005 Damant-Sirois et al 2014 Diana and Pronello 2010 Haustein and Hunecke 2013 Haustein and Moslashller 2016 Li et al 2013 Poortinga and Darnton 2016 Thoslashgersen 2018 Wolf and Schroumlder 2019) However the extent to which these are feasible in practice both in terms of influencing the effectiveness of soft measures and in terms of being reproducible simply and practically is unclear The SEGMENT model proposed by Anable and Wright (2013) is an exception as this has some empirical support and provides an online instrument for the segmentation procedure (Ladbury 2013) However the results from Paper III did not support the notion that the segments were motivated by different kinds of messages A similar conclusion was made recently in a study that assessed the effectiveness of different messages on segments retrieved from the SEGMENT model (Pangbourne et al 2020) The authors suggest that segmentation by travel attitude may not be an effective way to target behaviour change messaging although it may be a useful tool in designing other elements of behaviour change interventions (Pangbourne et al 2020) In Paper III the indication of assimilation bias suggest that messages need to be aligned with the current beliefs and behaviours of the target audience The best way to do that remains to be investigated
Target the low-hanging fruit Paper IV demonstrated that preconditions for motivation to change behaviour (based on attitudes travel time and past behaviour) were significantly correlated with the TTM-stages This is useful knowledge because segmentation based on the TTM is easy to execute while it still provides valuable information about the stage groupsrsquo attitudes towards decreasing car use (Bamberg 2007 Biehl et al 2019 Mundorf et al 2018)
Which segments should then be targeted This question depends primarily on the purpose of the intervention If measures need to be implemented in a specific context for instance to relieve congestion at a school or workplace the target is already defined to some extent
However the purpose of soft measures is often less constrained with the aim to reduce car use as much as possible Although it is tempting to implement soft measures where
79
car use is high caution needs to be taken regarding potential boomerang effects This could happen when the message of a campaign is misaligned with the attitudes and behaviours of the target group (Beale and Bonsall 2007 Petty and Cacioppo 1986) Individuals may dislike being told what to do and may be sceptical towards campaigns in general which could lead them to engage in the opposite behaviour or simply disregard the information (Kavvouris et al 2019) also known as psychological reactance (Brehm 1966) Indeed the results from Paper III indicated that marketing messages promoting sustainable transportation were judged in line with assimilation bias meaning that people interpret information in such a way as to be assimilated into pre-existing beliefs The segment with the highest level of car use (the Devoted Drivers) was also the one that reported the lowest motivation to change behaviour6 This means that it is considerably more difficult to approach a segment that has shown no interest in changing behaviour in comparison to car users with an open mind to change As demonstrated in Paper IV the highest threshold in preconditions for motivation to change travel behaviour was between the first and the second stage in the TTM (pre-contemplation and contemplation) which reinforces this notion
Intervention studies that still have attempted to target pre-contemplation segments such as Devoted Drivers report low or absent compliance levels (Innocenti et al 2013 Lattarulo et al 2018 Tertoolen et al 1998) Thus soft measures targeting car users with no intention to change bear the risk of boomerang effects and are unlikely to induce behaviour change If such segments are to be targeted it would likely require a combination of hard and soft travel demand measures (Steg 2007 Stradling et al 2000) However failing to induce a behaviour change might not be a complete failure if the participants have progressed in their behaviour change ladder (Forward 2019) This could for instance mean that pre-contemplators proceed to contemplation after an intervention (such as an information or marketing campaign) which can be assessed by measuring stage allocation before and after the intervention (Bamberg 2013) However this line of reasoning assumes that peoplersquos stated stage allocation post-intervention remains relatively stable which is not always the case (De Nooijer et al 2005)
From a practitionerrsquos perspective perhaps segmentation need not be more complicated than simply asking people whether they are willing to decrease their car use or not This approach has been used in practice for many years including the behaviour change technique known as IndiMark which segments the population into three main groups regular users of sustainable travel modes non-regular users who are interested in receiving information on alternatives to the car and those who are not interested in
6 When analysing the free-text responses in the national survey data it became clear that a reactance
effect led many respondents to express their strong dissatisfaction with the fact that their car use was implicitly questioned Some even went so far as to (incorrectly) accuse the study of being financed by the Swedish Green Party
80
taking part (Broumlg et al 2009) This would mean identifying car users who are willing to try an alternative to the car In the language of the TTM targeting the contemplation and preparation stages would be a sound strategy since these have lsquoambivalentrsquo attitudes towards car use (Forward 2014) and may therefore be open to change
In Paper V such a targeting strategy was applied in the recruitment of individuals who would get the offer to participate in the e-bike trial These were frequent drivers with an equally high frequency of car use as the Devoted Drivers (80 car trips) but with a different attitude towards driving A large substitution effect from car to e-bike was demonstrated in this sample Targeting such segments offers the largest potential to reduce car use which is often the objective for the actors that finance and implement soft measures (Stopher et al 2009) Moreover individuals who are positive towards taking part in an intervention are more likely to realise a change (Stroumlmberg et al 2016) which could lead to substantial spillover effects through social interactions (Hsieh 2020) resulting in positive effects beyond what is measured directly However researchers might look further into the obstacles preventing pre-contemplators from shifting mode of travel After all this is the segment with the highest car use and there might be possible car use reductions that are within these individualrsquos complete volitional control Naturally these narrower measures that target specific car user segments can be combined with measures aimed at the community in a wider sense with the purpose to influence social norms more generally (Winslott Hiselius and Smidfelt Rosqvist 2015)
64 Concluding remarks
This thesis has shown that innovations can advance the implementation of soft measures both as a means for promoting more sustainable travel choices but also as a means for enhancing evaluations It has also identified limitations with innovations and pitfalls in the application of these in practice Further the thesis contributes knowledge about how pro-environmental travel modes can be marketed what factors influence motivation to reduce private car use as well as different perspectives on segmentation and which target groups soft measures could be aimed at
Based on previous research it is not possible to conclude whether smartphone applications are effective in changing travel behaviours which is also the conclusion from Paper II However there seems to be some potential in using apps for driving behaviour change although their success could depend on several design features as found in Paper I Regarding their effectiveness results from previous research are mixed and more studies are needed in this emerging field before any conclusions can be drawn about their general effectiveness and contribution to soft measures
81
However smartphone applications can contribute significantly to facilitate more rigorous evaluations of soft measures This development is long-awaited and much needed in a field where evaluations are notoriously criticised for low methodological quality which ultimately challenges the use of soft measures in practice Collecting data from usersrsquo smartphones deals with many issues related to self-reports in travel behaviour research It also provides more fine grained data which makes it possible to detect smaller effects This could to some extent compensate for having small sample sizes like the sample used in Paper II
Another methodological improvement for soft measures is to offer interventions to control groups as well which may lead to fewer dropouts from field experiments and in the end a higher acceptance for using control groups in practice
The use of e-bikes is growing at a rapid pace around the world While there are many potential benefits of this mode of transport several of these depend on a substitution effect that has not been properly assessed in previous research This thesis demonstrated in a randomised controlled trial that e-bikes have a considerable car-substitution potential The average increase in the modal share of cycling was 21 with an equal reduction in the share of car use as expressed in distance travelled This extent of substitution shows that the e-bike can seriously compete with the car although mainly for commuting and other single-purpose trips An interesting research strand ahead is evaluating how other types of electric vehicles influence mode choice for instance electric cargo bikes (see for instance the study by Bjoslashrnararing et al (2019)) Due to the higher speed of the e-bike and the potential for regional cycling investments in regional cycle highway networks seems promising for extending its benefits outside of urban areas (Goumltschi et al 2017 Grigoropoulos et al 2021 van Lierop et al 2020)
Regarding the marketing of pro-environmental travel behaviours the results show that messages should promote altruistic feelings connected to health the environment collective responsibility and morality Hence organisations that for instance promote public transport through messages such as lsquotogether for a sustainable futurersquo seems to have chosen an effective communication strategy In contrast to expectations attitude-based segments did not report different preferences with regards to the type of marketing messages but rather assimilated the information according to prevailing beliefs
In line with previous research motivation to reduce car use is heavily influenced by a moral obligation to reduce onersquos carbon emissions although attitudes towards cycling and car use past behaviour and travel time are influential as well An index of these determinants correlated with the TTM stages which indicate that the stage model is suitable for identifying segments to target in interventions The results consistently show that the most car-oriented segments are significantly less motivated to change behaviour At the same time the thesis demonstrates by example that soft measures aimed at car users with an open mind to try a new means of transport have the potential
82
for considerable behaviour change From the perspective of maximising the shift from cars to alternative means of transport soft measures should target such segments However there might be other purposes that require measures to be aimed at other segments and this decision lies ultimately with the organisation that executes the measure Due to the influence of assimilation bias it is important to design measures in a way that limits potential reactance from the target group while encouraging sustainable travel behaviours
641 Limitations
The content analysis in Paper I was conducted independently by the author of this thesis and is therefore more sensitive to researchers bias than if the analysis had been conducted by a group of researchers Another limitation is that the conceptual model developed in Paper I could not be assessed empirically Since the data collection for Paper II was conducted in parallel with the production of Paper I there was no possibility to examine the development and implementation process of the MSA in light of the model by adapting the survey questions accordingly Instead a brief comparison was made within the thesis (see section 62 on page 73)
One limitation of Paper III is that the effect of the marketing messages on actual travel behaviour was not investigated Therefore the analysis is restricted to motivation to decrease private car use In relation to this and Paper IV one could question whether the stated motivation to decrease private car use from being exposed to the marketing messages reflects the lsquotruersquo motivation Indeed one limitation is the use of such a proxy for motivation However based on the principle of assimilation it seems reasonable that these would correlate well enough for conducting the analyses and make the subsequent inferences which were made in Paper IV
A few issues made it difficult to examine the process underlying behaviour change with quantitative methods First the data material in Paper II did not allow for an analysis of the extent to which the UTAUT determinants influenced travel behaviour Second in Paper V the time interval was too short to include an analysis of which determinants influenced the travel behaviour change resulting from the e-bike trial As such the psychological survey items included in the study were not utilised in this thesis Nor were the results from a replication study carried out during autumn 2020 in a similar municipality not possible to include here This would have added to the aim of evaluating the process of change as well as validating the results from Paper V7
Another limitation with Paper V is that the long-term effects of the intervention were not studied which was due to time constraints However a follow-up survey was
7 However this work is ongoing
83
conducted four to five months after the e-bike intervention by the partner organisation VGR Although this is good longitudinal studies must not be only performed by the actor who carries out the intervention in order to minimise the risk of bias
642 Further research
The soft transport policy field is constantly developing which requires a parallel companion in research that critically assess soft measures and identifies ways of improvement Here are some suggestions for further research connected to segmentation motivation and evaluation of soft measures
Regarding segmentation research can continue in the attempt to identify suitable target segments and most critically assess the feasibility of using segmentation and provide practical insights into how it can be applied
Further research can evaluate the effectiveness of attitude-based segmentation in practice and continue to explore motivational determinants for mode shifting in different groups Advanced methods for collecting psychometric data from online communication platforms and the identification of segments through machine learning techniques offer a potential avenue for travel behaviour change However this raises serious privacy and ethical concerns (Wolf and Schroumlder 2019)
Several challenges remain in evaluating soft measures one of the more pressing being the difficulty in conducting longitudinal field experiments Researchers would make a significant contribution by evaluating the long-term effects of soft measures Further more rigorous studies need to replicate field experiments to test the external validity of individual evaluation studies Following this meta-analyses can provide more robust estimations of the effectiveness of various soft measures Another intriguing aspect of evaluation is the potential spillover effects from soft measures A recent study shows that such spillover effects can be equal in size to the effects realised for the intervention group (Hsieh 2020)
84
85
References
Abrahamse W Steg L Gifford R Vlek C 2009 Factors influencing car use for commuting and the intention to reduce it A question of self-interest or morality Transp Res Part F Traffic Psychol Behav 12 317ndash324 httpsdoiorg101016jtrf200904004
Ajzen I 1991 The theory of planned behavior Organ Behav Hum Decis Process 50 179ndash211 httpsdoiorg1010160749-5978(91)90020-T
Ajzen I Fishbein M 1980 Understanding Attitudes and Predicting Social Behavior Prentice-Hall Englewood Cliffs NJ
Anable J 2005 lsquoComplacent Car Addictsrsquo or lsquoAspiring Environmentalistsrsquo Identifying travel behaviour segments using attitude theory Transp Policy 12 65ndash78 httpsdoiorg101016jtranpol200411004
Anable J 2002 Mobility Management In The Leisure Sector The Application Of Psychological Theory And Behavioural Segmentation University of London
Anable J Goodwin P 2019 Chapter 4 transport amp mobility In Eyre N Killip G (Eds) Shifting the Focus Energy Demand in a Net-Zero Carbon UK Centre for Research into Energy Demand Solutions Oxford
Anable J Wright S 2013 Work Package 7 Golden Questions and Social Marketing Guidance Report Intelligent Energy Europe (IEE)
Andersson A 2020 Is climate morality the answer Preconditions affecting the motivation to decrease private car use Transp Res Part D Transp Environ 78 1ndash14 httpsdoiorg101016jtrd201911027
Andersson A Winslott Hiselius L Adell E 2020a The effect of marketing messages on the motivation to reduce private car use in different segments Transp Policy 90 22ndash30 httpsdoiorg101016jtranpol202002006
Andersson A Winslott Hiselius L Adell E 2018 Promoting sustainable travel behaviour through the use of smartphone applications A review and development of a conceptual model Travel Behav Soc 11 52ndash61 httpsdoiorg101016jtbs201712008
Andersson A Winslott Hiselius L Berg J Forward S Arnfalk P 2020b Evaluating a Mobility Service Application for Business Travel Lessons Learnt from a Demonstration Project Sustain 12 1ndash18 httpsdoiorg103390su12030783
Armitage CJ 2009 Is there utility in the transtheoretical model Br J Health Psychol 14 195ndash210 httpsdoiorg101348135910708X368991
86
Armitage CJ Conner M 2001 Efficacy of the theory of planned behaviour Br J Soc Psychol 40 471ndash499 httpsdoiorg101348014466601164939
Arnott B Rehackova L Errington L Sniehotta FF Roberts J Araujo-Soares V 2014 Efficacy of behavioural interventions for transport behaviour change systematic review meta-analysis and intervention coding Int J Behav Nutr Phys Act 11 133 httpsdoiorg101186s12966-014-0133-9
Avineri E Waygood EO 2013 Applying valence framing to enhance the effect of information on transport-related carbon dioxide emissions Transp Res Part A Policy Pract 48 31ndash38 httpsdoiorg101016jtra201210003
Axsen J Ploumltz P Wolinetz M 2020 Crafting strong integrated policy mixes for deep CO2 mitigation in road transport Nat Clim Chang 10 809ndash818 httpsdoiorg101038s41558-020-0877-y
Bamberg S 2014 Psychological Contributions to the Development of Car Use Reduction Interventions in Gaumlrling T Ettema D Friman M (Eds) Handbook of Sustainable Travel Springer Netherlands Dordrecht pp 131ndash149 httpsdoiorg101007978-94-007-7034-8_9
Bamberg S 2013 Applying the stage model of self-regulated behavioral change in a car use reduction intervention J Environ Psychol 33 68ndash75 httpsdoiorg101016jjenvp201210001
Bamberg S 2007 Is a stage model a useful approach to explain car driversrsquo willingness to use public transportation J Appl Soc Psychol 37 1757ndash1783 httpsdoiorg101111j1559-1816200700236x
Bamberg S 2006 Is a residential relocation a good opportunity to change peoplersquos travel behavior Results from a theory-driven intervention study Environ Behav 38 820ndash840 httpsdoiorg1011770013916505285091
Bamberg S Fujii S Friman M Gaumlrling T 2011 Behaviour theory and soft transport policy measures Transp Policy 18 228ndash235 httpsdoiorg101016jtranpol201008006
Bamberg S Hunecke M Bloumlbaum A 2007 Social context personal norms and the use of public transportation Two field studies J Environ Psychol 27 190ndash203 httpsdoiorg101016jjenvp200704001
Bamberg S Moumlser G 2007 Why are work travel plans effective Comparing conclusions from narrative and meta-analytical research synthesis Transportation (Amst) 34 647ndash666 httpsdoiorg101007s11116-007-9121-0
Bamberg S Rees J 2017 The impact of voluntary travel behavior change measures ndash A meta-analytical comparison of quasi-experimental and experimental evidence Transp Res Part A Policy Pract 100 16ndash26 httpsdoiorg101016jtra201704004
Bandura A 2000 Exercise of human agency through collective efficacy Curr Dir Psychol Sci 9 75ndash78 httpsdoiorg1011111467-872100064
87
Bandura A 1997 Self-efficacy The exercise of control W H FreemanTimes Books Henry Holt amp Co New York NY US
Bandura A (Ed) 1995 Self-Efficacy in Changing Societies Cambridge University Press httpsdoiorg101017CBO9780511527692
Banister D 2019 The climate crisis and transport Transp Rev 39 565ndash568 httpsdoiorg1010800144164720191637113
Banister D 2011 Cities mobility and climate change J Transp Geogr 19 1538ndash1546 httpsdoiorg101016jjtrangeo201103009
Banister D 2005 Unsustainable Transport - City transport in the new century Routledge London
Barth M Jugert P Fritsche I 2016 Still underdetected - Social norms and collective efficacy predict the acceptance of electric vehicles in Germany Transp Res Part F Traffic Psychol Behav 37 64ndash77 httpsdoiorg101016jtrf201511011
Bastian A Boumlrjesson M Eliasson J 2016 Explaining lsquopeak carrsquo with economic variables Transp Res Part A Policy Pract 88 236ndash250 httpsdoiorg101016jtra201604005
Beale JR Bonsall PW 2007 Marketing in the bus industry A psychological interpretation of some attitudinal and behavioural outcomes Transp Res Part F Traffic Psychol Behav 10 271ndash287 httpsdoiorg101016jtrf200611001
Biehl A Ermagun A Stathopoulos A 2019 Utilizing multi-stage behavior change theory to model the process of bike share adoption Transp Policy httpsdoiorgS0967070X18301033
Bisschop CNS Courneya KS Velthuis MJ Monninkhof EM Jones LW Friedenreich C Van Der Wall E Peeters PHM May AM 2015 Control group design contamination and drop-out in exercise oncology trials A systematic review PLoS One 10 1ndash13 httpsdoiorg101371journalpone0120996
Bjoslashrnararing HB Berntsen S te Velde SJ Fyhri A Deforche B Andersen LB Bere E 2019 From cars to bikes ndash the effect of an intervention providing access to different bike types A randomized controlled trial PLoS One 14 1ndash17 httpsdoiorg101371journalpone0219304
Bolderdijk JW Steg L Geller ES Lehman PK Postmes T 2013 Comparing the effectiveness of monetary versus moral motives in environmental campaigning Nat Clim Chang 3 413ndash416 httpsdoiorg101038nclimate1767
Bonsall P 2009 Do we know whether personal travel planning really works Transp Policy 16 306ndash314 httpsdoiorg101016jtranpol200910002
Brand C Anable J Ketsopoulou I Watson J 2020 Road to zero or road to nowhere Disrupting transport and energy in a zero carbon world Energy Policy 139 111334 httpsdoiorg101016jenpol2020111334
Brehm JW 1966 A theory of psychological reactance Academic Press Oxford England
88
Brown SP Stayman DM 1992 Antecedents and Consequences of Attitude Toward the Ad A Meta-Analysis J Consum Res 19 34ndash51
Brug J Conner M Harreacute N Kremers S McKellar S Whitelaw S 2005 The Transtheoretical Model and stages of change A critique - Observations by five commentators on the paper by Adams J and White M (2004) Why donrsquot stage-based activity promotion interventions work Health Educ Res 20 244ndash258 httpsdoiorg101093hercyh005
Broumlg W Erl E Ker I Ryle J Wall R 2009 Evaluation of voluntary travel behaviour change Experiences from three continents Transp Policy 16 281ndash292 httpsdoiorg101016jtranpol200910003
Buehler R Pucher J 2011 Sustainable transport in freiburg Lessons from germanyrsquos environmental capital Int J Sustain Transp 5 43ndash70 httpsdoiorg10108015568311003650531
Boumlrjesson M Isacsson G Andersson M Anderstig C 2019 Agglomeration productivity and the role of transport system improvements Econ Transp 18 27ndash39 httpsdoiorg101016jecotra201812002
Cairns S Behrendt F Raffo D Beaumont C Kiefer C 2017 Electrically-assisted bikes Potential impacts on travel behaviour Transp Res Part A Policy Pract 103 327ndash342 httpsdoiorg101016JTRA201703007
Cairns S Sloman L Newson C Anable J 2004 Smarter choices-changing the way we travel Final report of the research project lsquoThe influence of soft factor interventions on travel demandrsquo Final report of the research project lsquoThe influence of soft factor interventions on travel demandrsquo
Cairns S Sloman L Newson C Anable J Kirkbride A Goodwin P 2008 Smarter choices Assessing the potential to achieve traffic reduction using lsquoSoft measuresrsquo Transp Rev 28 593ndash618 httpsdoiorg10108001441640801892504
Castellanos S 2016 Delivering modal-shift incentives by using gamification and smartphones A field study example in Bogota Colombia Case Stud Transp Policy 4 269ndash278 httpsdoiorg101016jcstp201608008
Cellina F Bucher D Mangili F Simatildeo JV Rudel R Raubal M 2019 A large scale app-based behaviour change experiment persuading sustainable mobility patterns Methods results and lessons learnt Sustain 11 httpsdoiorg103390su11092674
Chatterjee K 2009 A comparative evaluation of large-scale personal travel planning projects in England Transp Policy 16 293ndash305 httpsdoiorg101016jtranpol200910004
Chatterjee K Carey RN 2018 Special Issue on the theory design and evaluation of behaviour change interventions in transport J Transp Heal 10 7ndash10 httpsdoiorg101016jjth201808009
Chen CF Chao WH 2011 Habitual or reasoned Using the theory of planned behavior technology acceptance model and habit to examine switching intentions toward public
89
transit Transp Res Part F Traffic Psychol Behav 14 128ndash137 httpsdoiorg101016jtrf201011006
Crotty M 1998 The foundations of social research Meaning and perspective in the research process Allen amp Unwin Crows Nest NSW Australia httpsdoiorg102298theo1301005c
Crowne DP Marlowe D 1960 A new scale of social desirability independent of psychopathology J Consult Psychol 24 349ndash354 httpsdoiorg101037h0047358
Damant-Sirois G Grimsrud M El-Geneidy AM 2014 Whatrsquos your type a multidimensional cyclist typology Transportation (Amst) 41 1153ndash1169 httpsdoiorg101007s11116-014-9523-8
Davies N 2012 What are the ingredients of successful travel behavioural change campaigns Transp Policy 24 19ndash29 httpsdoiorg101016jtranpol201206017
de Groot JIM Steg L 2008 Value orientations to explain beliefs related to environmental significant behavior How to measure egoistic altruistic and biospheric value orientations Environ Behav 40 330ndash354 httpsdoiorg1011770013916506297831
De Nooijer J Van Assema P De Vet E Brug J 2005 How stable are stages of change for nutrition behaviors in the Netherlands Health Promot Int 20 27ndash32 httpsdoiorg101093heaprodah504
Deterding S Sicart M Nacke L OrsquoHara K Dixon D 2011 Gamification Using Game Design Elements in Non-Gaming Contexts Proceedings of the 2011 annual conference extended abstracts on Human factors in computing systems - CHI EA rsquo11 Vancouver BC httpsdoiorg10114519797421979575
Diana M Pronello C 2010 Traveler segmentation strategy with nominal variables through correspondence analysis Transp Policy 17 183ndash190 httpsdoiorg101016jtranpol201001005
Dolnicar S Gruumln B Leisch F 2018 Market segmentation analysis Understanding it doing it and making it useful Market Segmentation Analysis Springer Open Singapore
Doran R Hanss D Larsen S 2015 Attitudes efficacy beliefs and willingness to pay for environmental protection when travelling Tour Hosp Res 15 281ndash292 httpsdoiorg1011771467358415580360
Ek A Alexandrou C Soumlderstroumlm E Bergman P Nystroumlm CD Direito A Eriksson U Henriksson P Maddison R Lagerros YT Bendtsen M Loumlf M 2020 Effectiveness of a 3-month mobile phonendashbased behavior change program on active transportation and physical activity in adults Randomized controlled trial JMIR mHealth uHealth 8 httpsdoiorg10219618531
Elvik R Hoslashye A Vaa T Soslashrensen M 2009 The Handbook of Road Safety Measures Second edi ed Emerald Group Publishing Limited
90
Eriksson L Garvill J Nordlund AM 2008 Interrupting habitual car use The importance of car habit strength and moral motivation for personal car use reduction Transp Res Part F Traffic Psychol Behav 11 10ndash23 httpsdoiorg101016jtrf200705004
European Commision 2009 MAX - Successful Travel Awareness Campaigns and Mobility Management Strategies Transp Res Innov Monit Inf Syst URL httpstrimiseceuropaeuprojectsuccessful-travel-awareness-campaigns-and-mobility-management-strategiestab-partners (accessed 102820)
Ferguson E 1997 The rise and fall of the American carpool 1970-1990 Transportation (Amst) 24 349ndash376 httpsdoiorg101023A1004928012320
Fernaacutendez-Heredia Aacute Monzoacuten A Jara-Diacuteaz S 2014 Understanding cyclistsrsquo perceptions keys for a successful bicycle promotion Transp Res Part A Policy Pract 63 1ndash11 httpsdoiorg101016jtra201402013
Field A 2018 Discovering Statistics using IBM SPSS Statistics 5th editio ed SAGE Publications Ltd Los Angeles London New Delhi Singapore Washington DC Melbourne
Fishbein M Ajzen I 1975 Belief attitude intention and behaviour An introduction to theory and research Reading MA Addison-Wesley
Flick U 2002 Qualitative research - state of the art Soc Sci Inf 41 5ndash24 httpsdoiorg1011770539018402041001001
Forward SE 2019 Views on public transport and how personal experiences can contribute to a more positive attitude and behavioural change Soc Sci 8 httpsdoiorg103390socsci8020047
Forward SE 2014 Exploring peoplersquos willingness to bike using a combination of the theory of planned behavioural and the transtheoretical model Rev Eur Psychol Appl 64 151ndash159 httpsdoiorg101016jerap201404002
Franssens S Botchway E Swart W De Dewitte S 2021 Nudging Commuters to Increase Public Transport Use A Field Experiment in Rotterdam Front Psychol 12 httpsdoiorg103389fpsyg2021633865
Friman M Huck J Olsson LE 2017 Transtheoretical model of change during travel behavior interventions An integrative review Int J Environ Res Public Health 14 1ndash15 httpsdoiorg103390ijerph14060581
Friman M Larhult L Gaumlrling T 2013 An analysis of soft transport policy measures implemented in Sweden to reduce private car use Transportation (Amst) 40 109ndash129 httpsdoiorg101007s11116-012-9412-y
Friman M Maier R Olsson LE 2019 Applying a motivational stage-based approach in order to study a temporary free public transport intervention Transp Policy 81 173ndash183 httpsdoiorg101016jtranpol201906012
91
Fujii S Bamberg S Friman M Gaumlrling T 2009 Are effects of travel feedback programs correctly assessed Transportmetrica 5 43ndash57 httpsdoiorg10108018128600802591277
Fujii S Kitamura R 2003 What does a one-month free bus ticket do to habitual drivers An experimental analysis of habit and attitude change Transportation (Amst) 30 81ndash95 httpsdoiorg101023A1021234607980
Fujii S Taniguchi A 2006 Determinants of the effectiveness of travel feedback programs-a review of communicative mobility management measures for changing travel behaviour in Japan Transp Policy 13 339ndash348 httpsdoiorg101016jtranpol200512007
Fyhri A Sundfoslashr HB 2020 Do people who buy e-bikes cycle more Transp Res Part D Transp Environ 86 102422 httpsdoiorg101016jtrd2020102422
Gatersleben B Appleton KM 2007 Contemplating cycling to work Attitudes and perceptions in different stages of change Transp Res Part A Policy Pract 41 302ndash312 httpsdoiorg101016JTRA200609002
Gatersleben B Uzzell D 2007 Affective Appraisals of the Daily Commute Comparing Perceptions of Drivers Cyclists Walkers and Users of Public Transport Environ Behav 39 416ndash431 httpsdoiorg1011770013916506294032
Geng J Long R Chen H 2016 Impact of information intervention on travel mode choice of urban residents with different goal frames A controlled trial in Xuzhou China Transp Res Part A Policy Pract 91 134ndash147 httpsdoiorg101016jtra201606031
Graham-Rowe E Skippon S Gardner B Abraham C 2011 Can we reduce car use and if so how A review of available evidence Transp Res Part A Policy Pract 45 401ndash418 httpsdoiorg101016jtra201102001
Graham DJ 2007 Agglomeration productivity and transport investment J Transp Econ Policy 41 317ndash343
Grigoropoulos G Hosseini SA Keler A Kaths H Spangler M Busch F Bogenberger K 2021 Traffic simulation analysis of bicycle highways in urban areas Sustain 13 1ndash25 httpsdoiorg103390su13031016
Griskevicius V Tybur JM Van den Bergh B 2010 Going Green to Be Seen Status Reputation and Conspicuous Conservation J Pers Soc Psychol 98 392ndash404 httpsdoiorg101037a0017346
Gross R 2010 Psychology The Science of Mind and Behaviour (4th edition) 6th ed Hodder Education Dubai httpsdoiorg101054nedt20020766
Guagnano GA Stern PC Dietz T 1995 Influences on Attitude-Behavior Relationships A Natural Experiment with Curbside Recycling Environ Behav 27 699ndash718 httpsdoiorg1011770013916595275005
Gaumlrling T Axhausen KW 2003 Introduction Habitual travel choice Transportation (Amst) 30 1ndash11 httpsdoiorg101023A1021230223001
92
Gaumlrling T Eek D Loukopoulos P Fujii S Johansson-Stenman O Kitamura R Pendyala R Vilhelmson B 2002 A conceptual analysis of the impact of travel demand management on private car use Transp Policy 9 59ndash70 httpsdoiorg101016S0967-070X(01)00035-X
Goumlssling S 2020 Why cities need to take road space from cars - and how this could be done J Urban Des 25 443ndash448 httpsdoiorg1010801357480920201727318
Goumlssling S 2018 ICT and transport behavior A conceptual review Int J Sustain Transp 12 153ndash164 httpsdoiorg1010801556831820171338318
Goumlssling S 2016 Urban transport justice J Transp Geogr 54 1ndash9 httpsdoiorg101016jjtrangeo201605002
Goumlssling S Choi AS 2015 Transport transitions in Copenhagen Comparing the cost of cars and bicycles Ecol Econ 113 106ndash113 httpsdoiorg101016jecolecon201503006
Goumltschi T de Nazelle A Brand C Gerike R 2017 Towards a Comprehensive Conceptual Framework of Active Travel Behavior a Review and Synthesis of Published Frameworks Curr Environ Heal reports 4 286ndash295 httpsdoiorg101007s40572-017-0149-9
Haley RI Baldinger AL 2000 The ARF Copy Research Validity Project J Advert Res 40 114 LP ndash 135 httpsdoiorg102501JAR-40-6-114-135
Handy SL Xing Y 2011 Factors correlated with bicycle commuting A study in six small US cities Int J Sustain Transp 5 91ndash110 httpsdoiorg10108015568310903514789
Harding C Faghih Imani A Srikukenthiran S Miller EJ Nurul Habib K 2020 Are we there yet Assessing smartphone apps as full-fledged tools for activity-travel surveys Transportation (Amst) httpsdoiorg101007s11116-020-10135-7
Haustein S Hunecke M 2013 Identifying target groups for environmentally sustainable transport assessment of different segmentation approaches Curr Opin Environ Sustain 5 197ndash204 httpsdoiorg101016jcosust201304009
Haustein S Moslashller M 2016 Age and attitude Changes in cycling patterns of different e-bike user segments Int J Sustain Transp 10 836ndash846 httpsdoiorg1010801556831820161162881
Hays RD Liu H Kapteyn A 2015 Use of Internet panels to conduct surveys Behav Res Methods 47 685ndash690 httpsdoiorg103758s13428-015-0617-9
Heinen E Maat K van Wee B 2013 The effect of work-related factors on the bicycle commute mode choice in the Netherlands Transportation (Amst) 40 23ndash43 httpsdoiorg101007s11116-012-9399-4
Heinen E van Wee B Maat K 2010 Commuting by bicycle An overview of the literature Transp Rev 30 59ndash96 httpsdoiorg10108001441640903187001
93
Hensher DA 1994 Stated Preference analysis of Travel Choices The State Of Practice Transportation (Amst) 21 107ndash133 httpsdoiorg1043249780203985359-12
Hino K Taniguchi A Hanazato M Takagi D 2019 Modal shift from cars and promotion of walking by providing pedometers in Yokohama city Japan Int J Environ Res Public Health 16 httpsdoiorg103390ijerph16122144
Hoffmann C Abraham C White MP Ball S Skippon SM 2017 What cognitive mechanisms predict travel mode choice A systematic review with meta-analysis Transp Rev 37 631ndash652 httpsdoiorg1010800144164720171285819
Holgate S 2017 Every breath we take The lifelong impact of air pollution Report of a working party Clin Med (Northfield Il) 17 8ndash12
Hrelja R 2019 Cars Problematisations measures and blind spots in local transport and land use policy Land use policy 87 104014 httpsdoiorg101016jlandusepol201905033
Hsieh H-F Shannon SE 2005 Three Approaches to Qualitative Content Analysis Qual Health Res 15 1277ndash88 httpsdoiorg1011771049732305276687
Hsieh HS 2020 Transport policy evaluation based on elasticity analysis with social interactions Transp Res Part A Policy Pract 139 273ndash296 httpsdoiorg101016jtra202007011
Hunecke M Haustein S Boumlhler S Grischkat S 2010 Attitude-based target groups to reduce the ecological impact of daily mobility behavior Environ Behav 42 3ndash43 httpsdoiorg1011770013916508319587
Hyman MR Sierra JJ 2012 Adjusting Self-Reported Attitudinal Data for Mischievous Respondents Int J Mark Res 54 129ndash145 httpsdoiorg102501ijmr-54-1-129-145
Innocenti A Lattarulo P Pazienza MG 2013 Car stickiness Heuristics and biases in travel choice Transp Policy 25 158ndash168 httpsdoiorg101016jtranpol201211004
Jakobsson C 2004 Motivational and Volitional Control of Private Automobile Use Goumlteborg University httpsdoiorg101017CBO9781107415324004
Javaid A Creutzig F Bamberg S 2020 Determinants of low-carbon transport mode adoption systematic review of reviews Environ Res Lett 15 103002 httpsdoiorg1010881748-9326aba032
Jugert P Greenaway KH Barth M Buumlchner R Eisentraut S Fritsche I 2016 Collective efficacy increases pro-environmental intentions through increasing self-efficacy J Environ Psychol 48 12ndash23 httpsdoiorg101016jjenvp201608003
Jung S Lee S 2011 Exploratory factor analysis for small samples Behav Res Methods 43 701ndash709 httpsdoiorg103758s13428-011-0077-9
Karlsson ICM Mukhtar-Landgren D Smith G Koglin T Kronsell A Lund E Sarasini S Sochor J 2019 Development and implementation of Mobility-as-a-
94
Service ndash A qualitative study of barriers and enabling factors Transp Res Part A Policy Pract httpsdoiorg101016JTRA201909028
Kavvouris C Chrysochou P Thoslashgersen J 2019 ldquoBe Careful What You Sayrdquo The role of psychological reactance on the impact of pro-environmental normative appeals J Bus Res 0ndash1 httpsdoiorg101016jjbusres201910018
Kloumlckner CA 2013 A comprehensive model of the psychology of environmental behaviour A meta-analysis Glob Environ Chang 23 1028ndash1038 httpsdoiorg101016jgloenvcha201305014
Krumpal I 2013 Determinants of social desirability bias in sensitive surveys A literature review Qual Quant 47 2025ndash2047 httpsdoiorg101007s11135-011-9640-9
Kuang Y Yen BTH Suprun E Sahin O 2019 A soft traffic management approach for achieving environmentally sustainable and economically viable outcomes An Australian case study J Environ Manage 237 379ndash386 httpsdoiorg101016jjenvman201902087
Ladbury P 2013 The SEGMENT Toolkit Lambooij MS Harmsen IA Veldwijk J De Melker H Mollema L Van Weert
YWM De Wit GA 2015 Consistency between stated and revealed preferences A discrete choice experiment and a behavioural experiment on vaccination behaviour compared BMC Med Res Methodol 15 1ndash8 httpsdoiorg101186s12874-015-0010-5
Landers RN Behrend TS 2015 An inconvenient truth Arbitrary distinctions between organizational mechanical turk and other convenience samples Ind Organ Psychol 8 142ndash164 httpsdoiorg101017iop201513
Lanzini P Khan SA 2017 Shedding light on the psychological and behavioral determinants of travel mode choice A meta-analysis Transp Res Part F Traffic Psychol Behav 48 13ndash27 httpsdoiorg101016jtrf201704020
Lattarulo P Masucci V Pazienza MG 2018 Resistance to change car use and routines Transp Policy 74 63ndash72 httpsdoiorg101016jtranpol201811013
Levinson D 2002 Identifying winners and losers in transportation Transp Res Rec 179ndash185 httpsdoiorg1031411812-22
Lewin K 1951 Problems of research in social psychologyy In D Cartwright (Ed) Field theory in social science Selected theoretical papers Harper amp Row New York NY
Li Z Wang W Yang C Ragland DR 2013 Bicycle commuting market analysis using attitudinal market segmentation approach Transp Res Part A Policy Pract 47 56ndash68 httpsdoiorg101016jtra201210017
Lieberoth A Holm Jensen N Bredahl T 2018 Selective psychological effects of nudging gamification and rational information in converting commuters from cars to buses A controlled field experiment Transp Res Part F Traffic Psychol Behav 55 246ndash261 httpsdoiorg101016jtrf201802016
95
Litman T 2010 Quantifying the Benefits of Nonmotorized Transportation For Achieving Mobility Management Objectives by Transp Res Rec 134ndash140
Lois D Moriano JA Rondinella G 2015 Cycle commuting intention A model based on theory of planned behaviour and social identity Transp Res Part F Traffic Psychol Behav 32 101ndash113 httpsdoiorg101016jtrf201505003
Lord CG Ross L Lepper MR 1979 Biased assimilation and attitude polarization The effects of prior theories on subsequently considered evidence J Pers Soc Psychol 37 2098ndash2109 httpsdoiorg1010370022-351437112098
Loureiro A Veloso S 2017 Handbook of Environmental Psychology and Quality of Life Research httpsdoiorg101007978-3-319-31416-7
Loureiro ML McCluskey JJ Mittelhammer RC 2003 Are Stated Preferences Good Predictors of Market Behavior Land Econ 79 44ndash45 httpsdoiorg1023073147104
Lucas K Jones P 2009 The Car in British Society RAC Found London MacArthur J Dill J Person M 2014 Electric bikes in North America Results of an
online survey Transp Res Rec 2468 123ndash130 httpsdoiorg1031412468-14 Marshall S Banister D 2000 Travel reduction strategies Intentions and outcomes
Transp Res Part A Policy Pract 34 321ndash338 httpsdoiorg101016S0965-8564(99)00034-8
Matteo Mazziotta AP 2013 Methods for Constructing Composite Indices One for All or All for One Ital Rev Econ Demogr Stat 67 67ndash80 httpsdoiorg101016jtrac201607002
Matyas M Kamargianni M 2019 The potential of mobility as a service bundles as a mobility management tool Transportation (Amst) 46 1951ndash1968 httpsdoiorg101007s11116-018-9913-4
Meyer MD 1999 Demand management as an element of transportation policy Using carrots and sticks to influence travel behavior Transp Res Part A Policy Pract 33 575ndash599 httpsdoiorg101016S0965-8564(99)00008-7
Milfont TL Duckitt J 2010 The environmental attitudes inventory A valid and reliable measure to assess the structure of environmental attitudes J Environ Psychol 30 80ndash94 httpsdoiorg101016jjenvp200909001
Miller GA 1962 Psychology The Science of Mental Life Penguin Harmondsworth Milovanoff A Posen ID MacLean HL 2020 Electrification of light-duty vehicle fleet
alone will not meet mitigation targets Nat Clim Chang httpsdoiorg101038s41558-020-00921-7
Moher D Liberati A Tetzlaff J Altman DG 2009 Preferred reporting items for systematic reviews and meta-analyses the (PRISMA) statement Res methods Report 1ndash8 httpsdoiorg101136bmjb2535
96
Mokhtarian PL Salomon I Redmond LS 2001 Understanding the demand for travel Itrsquos not purely lsquoderivedrsquo Innovation 14 355ndash380 httpsdoiorg10108013511610120106147
Moser C Blumer Y Hille SL 2018 E-bike trialsrsquo potential to promote sustained changes in car owners mobility habits Environ Res Lett 13 httpsdoiorg1010881748-9326aaad73
Mundorf N Redding CA Paiva AL 2018 Sustainable transportation attitudes and health behavior change Evaluation of a brief stage-targeted video intervention Int J Environ Res Public Health 15 httpsdoiorg103390ijerph15010150
Moumlser G Bamberg S 2008 The effectiveness of soft transport policy measures A critical assessment and meta-analysis of empirical evidence J Environ Psychol 28 10ndash26 httpsdoiorg101016jjenvp200709001
Nakashima R Sato T Maruyama T 2017 Gamification Approach to Smartphone-app-based Mobility Management Transp Res Procedia 25 2344ndash2355 httpsdoiorg101016jtrpro201705234
Nieuwenhuijsen MJ 2020 Urban and transport planning pathways to carbon neutral liveable and healthy cities A review of the current evidence Environ Int 140 105661 httpsdoiorg101016jenvint2020105661
Nisbet EKL Gick ML 2008 Can health psychology help the planet Applying theory and models of health behaviour to environmental actions Can Psychol Can httpsdoiorg101037a0013277
Noppers EH Keizer K Bockarjova M Steg L 2015 The adoption of sustainable innovations The role of instrumental environmental and symbolic attributes for earlier and later adopters J Environ Psychol 44 74ndash84 httpsdoiorg101016jjenvp201509002
Nordlund AM Garvill J 2003 Effects of values problem awareness and personal norm on willingness to reduce personal car use J Environ Psychol 23 339ndash347 httpsdoiorg101016S0272-4944(03)00037-9
Norman T Boumlrjesson M Anderstig C 2017 Labour Market Accessibility and Unemployment J Transp Econ Policy 51 47ndash73
Ockwell D Whitmarsh L OrsquoNeill S 2009 Forcing People to be Green or Fostering Grass-Roots Engagement Sci Commun 30 305ndash327 httpsdoiorg1011771075547008328969
Ogilvie D Foster CE Rothnie H Cavill N Hamilton V Fitzsimons CF Mutrie N 2007 Interventions to promote walking systematic review Bmj 334 1204ndash1204 httpsdoiorg101136bmj39198722720BE
Oinas-kukkonen H 2010 Behavior Change Support Systems A Research Model and Agenda in Persuasive Technology 5th International Conference PERSUASIVE 2010 Copenhagen Denmark June 7-10 2010 Proceedings pp 4ndash14 httpsdoiorg101007978-3-642-13226-1
97
Olsson LE Huck J Friman M 2018 Intention for car use reduction Applying a stage-based model Int J Environ Res Public Health 15 httpsdoiorg103390ijerph15020216
Paacuteez A Whalen K 2010 Enjoyment of commute A comparison of different transportation modes Transp Res Part A Policy Pract 44 537ndash549 httpsdoiorg101016jtra201004003
Pangbourne K Bennett S Baker A 2020 Persuasion profiles to promote pedestrianism Effective targeting of active travel messages Travel Behav Soc 20 300ndash312 httpsdoiorg101016jtbs202004004
Pangbourne K Masthoff J 2016 Personalised messaging for voluntary travel behaviour change interactions between segmentation and modal messaging UTSG Bristol pp 1ndash12
Parker J Harris L Chatterjee K Armitage R Cleary J Goodwin P 2007 Making Personal Travel Planning Work Research Report Department for Transport London
Petrunoff N Wen LM Rissel C 2016 Effects of a workplace travel plan intervention encouraging active travel to work outcomes from a three-year time-series study Public Health 135 38ndash47 httpsdoiorg101016jpuhe201602012
Petty RE Cacioppo JT 1986 The Elaboration Likelihood Model of Persuasion Adv Exp Soc Psychol 19 123ndash205 httpsdoiorg101007978-1-4612-4964-1_1
Philips I Anable J Chatterton T 2020 e-bike carbon savings ndash how much and where Oxford httpsdoiorg1013140RG222043171846
Pituch KA Stevens JP 2016 Applied Multivariate Statistics for the Social Sciences Analyses with SAS and IBMlsquos SPSS 6th ed Routledge New York and London
Plazier PA Weitkamp G Berg AEV Den 2018 Exploring the adoption of e-bikes by different user groups Front Built Environ 4 1ndash8 httpsdoiorg103389fbuil201800047
Polk M 2004 The influence of gender on daily car use and on willingness to reduce car use in Sweden J Transp Geogr 12 185ndash195 httpsdoiorg101016jjtrangeo200404002
Polk M 2003 Are women potentially more accommodating than men to a sustainable transportation system in Sweden Transp Res Part D Transp Environ 8 75ndash95 httpsdoiorg101016S1361-9209(02)00034-2
Poortinga W Darnton A 2016 Segmenting for sustainability The development of a sustainability segmentation model from a Welsh sample J Environ Psychol 45 221ndash232 httpsdoiorg101016jjenvp201601009
Prochaska JO Diclemente CC 1986 Toward a Comprehensive Model of Change in Miller WR Heather N (Eds) Treating Addictive Behaviors Processes of Change Springer US Boston MA pp 3ndash27 httpsdoiorg101007978-1-4613-2191-0_1
98
Prochaska JO DiClemente CC 1982 Transtheoretical therapy Toward a more integrative model of change Psychother Theory Res Pract 19 276ndash288 httpsdoiorg101037h0088437
Prochaska JO Redding C Evers K 2008 The transtheoretical model and stage of change In Health behavior and health education in Glanz K Rimer BK Viswanath K (Eds) Theory Research and Practice Jossey-Bass San Fransisco CA USA pp 97ndash117
Pucher J Buehler R 2017 Cycling towards a more sustainable transport future Transp Rev 37 689ndash694 httpsdoiorg1010800144164720171340234
Rabl A de Nazelle A 2012 Benefits of shift from car to active transport Transp Policy 19 121ndash131 httpsdoiorg101016jtranpol201109008
Reese G Junge EA 2017 Keep on Rockinrsquo in a (plastic-)free world Collective efficacy and pro-environmental intentions as a function of task difficulty Sustain 9 httpsdoiorg103390su9020200
Richter J Friman M Gaumlrling T 2011 Soft transport policy measures Gaps in knowledge Int J Sustain Transp 5 199ndash215 httpsdoiorg101080155683182010490289
Richter J Friman M Gaumlrling T 2009 Soft transport policy measures 1 Results of implementation Karlstad Univ Stud 31 1ndash22
Rogers EM 1995 Diffusion of innovations 3rd editio ed Macmillian Publishing Co Collier Macmillian Publishers London httpsdoiorgciteulike-article-id126680
Rondinella G Fernandez-Heredia A Monzoacuten A 2012 Analysis of perceptions of utilitarian cycling by level of user experience in Proceedings of Transport Research Board Annual Meeting Washington DC
Rose G Ampt E 2001 Travel blending An Australian travel awareness initiative Transp Res Part D Transp Environ 6 95ndash110 httpsdoiorg101016S1361-9209(00)00015-8
Rosenfield A Attanucci JP Zhao J 2020 A randomized controlled trial in travel demand management Transportation (Amst) 47 1907ndash1932 httpsdoiorg101007s11116-019-10023-9
Ryberg K 2021 E-mail correspondence about the continous implementation of e-bike trials 2021-03-29
Santos G Behrendt H Teytelboym A 2010 Part II Policy instruments for sustainable road transport Res Transp Econ 28 46ndash91 httpsdoiorg101016jretrec201003002
Sarafino EP 2012 Applied Behavior Analysis Principles and Procedures in Behavior Modification Wiley
Schwartz SH 1977 Normative influences on altruism Adv Exp Soc Psychol 10 221ndash279 httpsdoiorg101016S0065-2601(08)60358-5
99
Seaborn K Fels DI 2015 Gamification in theory and action A survey Int J Hum Comput Stud 74 14ndash31 httpsdoiorg101016jijhcs201409006
Semanjski I Gautama S 2016 Crowdsourcing mobility insights - Reflection of attitude based segments on high resolution mobility behaviour data Transp Res Part C Emerg Technol 71 434ndash446 httpsdoiorg101016jtrc201608016
Semenescu A Gavreliuc A Sacircrbescu P 2020 30 Years of soft interventions to reduce car use ndash A systematic review and meta-analysis Transp Res Part D Transp Environ 85 102397 httpsdoiorg101016jtrd2020102397
Shaw C Hales S Howden-Chapman P Edwards R 2014 Health co-benefits of climate change mitigation policies in the transport sector Nat Clim Chang 4 427ndash433 httpsdoiorg101038nclimate2247
Simon HA 1955 A Behavioral Model of Rational Choice Q J Econ 69 99ndash118 Simsekoglu Ouml Kloumlckner CA 2018 The role of psychological and socio-demographical
factors for electric bike use in Norway Int J Sustain Transp 13 315ndash323 httpsdoiorg1010801556831820181466221
Skarin F Olsson LE Friman M Waumlstlund E 2019 Importance of motives self-efficacy social support and satisfaction with travel for behavior change during travel intervention programs Transp Res Part F Traffic Psychol Behav 62 451ndash458 httpsdoiorg101016jtrf201902002
Smith WR 1956 Product Differentiation and Market Segmentation as Alternative Marketing Strategies Am Mark Assoc 21 3ndash8
Sottile E Giacchetti T Tuveri G Piras F Calli D Concas V Zamberlan L Meloni I Carrese S 2020 An innovative GPS smartphone based strategy for university mobility management A case study at the University of RomaTre Italy Res Transp Econ 85 100926 httpsdoiorg101016jretrec2020100926
Spencer L Pagell F Hallion ME Adams TB 2002 Applying the transtheoretical model to tobacco prevention education in adolescence A literature review Am J Heal Promot 17 7ndash71
Sperling D 2018 Three Revolutions Steering Automated Shared and Electric Vehicles to a Better Future Island Press Washington Covelo London
Stapleton L Sorrell S Schwanen T 2017 Peak car and increasing rebound A closer look at car travel trends in Great Britain Transp Res Part D Transp Environ 53 217ndash233 httpsdoiorg101016jtrd201703025
Steg L 2007 Sustainable Transportation A Psychological Perspective IATSS Res 31 58ndash66 httpsdoiorg101016s0386-1112(14)60223-5
Steg L 2005 Car use Lust and must Instrumental symbolic and affective motives for car use Transp Res Part A Policy Pract 39 147ndash162 httpsdoiorg101016jtra200407001
100
Steg L 2003 Factors Influencing the Acceptability and Effectiveness of Transport Pricing in Schade J Schlag B (Eds) Acceptability of Transport Pricing Strategies Emerald Group Publishing Limited pp 187ndash202 httpsdoiorg1011089781786359506-012
Steg L Geurs K Ras M 2001a The effects of motivational factors on car use A multidisciplinary modelling approach Transp Res Part A Policy Pract 35 789ndash806 httpsdoiorg101016S0965-8564(00)00017-3
Steg L Vlek C 2009 Encouraging pro-environmental behaviour An integrative review and research agenda J Environ Psychol 29 309ndash317 httpsdoiorg101016jjenvp200810004
Steg L Vlek C Slotegraaf G 2001b Instrumental-reasoned and symbolic-affective motives for using a motor car Transp Res Part F Traffic Psychol Behav 4 151ndash169 httpsdoiorg101016S1369-8478(01)00020-1
Stern PC 2000 Toward a Coherent Theory of Environmentally Significant Behavior J Soc Issues 56 407ndash424
Stopher P Clifford E Swann N Zhang Y 2009 Evaluating voluntary travel behaviour change Suggested guidelines and case studies Transp Policy 16 315ndash324 httpsdoiorg101016jtranpol200910007
Stopher P Greaves S Xu M Fitzgerald C Swann N 2006 A Panel Approach to Evaluating TravelSmart Initiatives in the Short Term ndash South Australia Pilot Survey
Stopher PR 2004 Reducing road congestion A reality check Transp Policy 11 117ndash131 httpsdoiorg101016jtranpol200309002
Stradling SG Meadows ML Beatty S 2000 Helping drivers out of their cars integrating transport policy and social psychology for sustainable change Transp Policy 7 207ndash215 httpsdoiorg101016S0967-070X(00)00026-3
Stroumlmberg H Rexfelt O Karlsson ICMA Sochor J 2016 Trying on change - Trialability as a change moderator for sustainable travel behaviour Travel Behav Soc 4 60ndash68 httpsdoiorg101016jtbs201601002
Sussman R Tan LQ Kormos CE 2020 Behavioral interventions for sustainable transportation an overview of programs and guide for practitioners in Transport and Energy Research Elsevier Inc pp 354ndash422 httpsdoiorg101016B978-0-12-815965-100014-4
Swedish Association of Local Authorities and Regions 2016 Classification of Swedish municipalities 2017 URL httpssklsedownload186b78741215a632d39cbcc851487772640274Classification of Swedish Municipalities 2017pdf (accessed 62618)
Swedish National Audit Office 2018 The four-step principle in transport infrastructure planning URL httpswwwriksrevisionensedownload182fb606e41681a5d0f12cf15f1547423999841RiR_2018_30_ENGLISHpdf (accessed 2321)
101
Swedish Transport Administration 2020 Transport sector emissions URL httpswwwtrafikverketseom-ossvar-verksamhetsa-har-jobbar-vi-medMiljo-och-halsaKlimat (accessed 21720)
Swedish Transport Administration 2018 The four-step principle URL httpswwwtrafikverketsefor-dig-i-branschenPlanera-och-utredaPlanerings--och-analysmetoderfyrstegsprincipen (accessed 2521)
Swedish Transport Administration 2014 Strategic Choice of Measures ndash A new step for planning of transportation solutions
Soumlderberg fka Andersson A Adell E Winslott Hiselius L 2021 What is the substitution effect of e-bikes A randomised controlled trial Transp Res Part D Transp Environ 90 httpsdoiorg101016jtrd2020102648
Taylor MAP Ampt ES 2003 Travelling smarter down under Policies for voluntary travel behaviour change in Australia Transp Policy 10 165ndash177 httpsdoiorg101016S0967-070X(03)00018-0
Tertoolen G Van Kreveld D Verstraten B 1998 Psychological resistance against attempts to reduce private car use Transp Res Part A Policy Pract 32 171ndash181 httpsdoiorg101016S0965-8564(97)00006-2
The Behavioural Insights Team Alta Planning + Design 2017 Applying Behavioural Insights to Transportation Demand Management
Thigpen C Fischer J Nelson T Therrien S Fuller D Gauvin L Winters M 2019 Who is ready to bicycle Categorizing and mapping bicyclists with behavior change concepts Transp Policy 82 11ndash17 httpsdoiorg101016jtranpol201907011
Thigpen CG Driller BK Handy SL 2015 Using a stages of change approach to explore opportunities for increasing bicycle commuting Transp Res Part D Transp Environ 39 44ndash55 httpsdoiorg101016jtrd201505005
Thoslashgersen J 2018 Transport-related lifestyle and environmentally-friendly travel mode choices A multi-level approach Transp Res Part A Policy Pract 107 166ndash186 httpsdoiorg101016jtra201711015
Thoslashgersen J 2009 Promoting public transport as a subscription service Effects of a free month travel card Transp Policy 16 335ndash343 httpsdoiorg101016jtranpol200910008
Transport Analysis 2020 Resvanor i Sverige 2019 [Travel habits in Sweden 2019] Van Acker V Van Cauwenberge B Witlox F 2013 MaxSUMO A New Expert
Approach for Evaluating Mobility Managament Projects Promet-Traffic Transp 25 285ndash294 httpsdoiorg107307pttv25i3290
van Lierop D Soemers J Hoeke L Liu G Chen Z Ettema D Kruijf J 2020 Wayfinding for cycle highways Assessing e-bike usersrsquo experiences with wayfinding along a cycle highway in the Netherlands J Transp Geogr 88 httpsdoiorg101016jjtrangeo2020102827
102
van Wee B 2014 Handbook of sustainable travel in The Unsustainability of Car Use In Gaumlrling T Ettema D Friman M (Eds) Handbook of Sustainable Travel Springer Dordrecht pp 1ndash341 httpsdoiorghttpsdoiorg101007978-94-007-7034-8_5
Vela C Ortega C 2020 Adoption of Change A Systematic Review of the Transtheoretical Model Sport Exerc Med Open J 6 27ndash38 httpsdoiorg1017140SEMOJ-6-179
Venkatesh V Morris MG Davis GB Davis FD 2003 User acceptance of information technology toward a unified view MIS Q 27 425ndash478
Walter SL Seibert SE Goering D OrsquoBoyle EH 2019 A Tale of Two Sample Sources Do Results from Online Panel Data and Conventional Data Converge J Bus Psychol 34 425ndash452 httpsdoiorg101007s10869-018-9552-y
Waygood EOD Avineri E 2018 CO2 valence framing Is it really any different from just giving the amounts Transp Res Part D Transp Environ 63 718ndash732 httpsdoiorg101016jtrd201807011
Waygood EOD Avineri E 2016 Communicating transportation carbon dioxide emissions information Does gender impact behavioral response Transp Res Part D Transp Environ 48 187ndash202 httpsdoiorg101016jtrd201608026
Weber J Azad M Riggs W Cherry CR 2018 The convergence of smartphone apps gamification and competition to increase cycling Transp Res Part F Traffic Psychol Behav 56 333ndash343 httpsdoiorg101016jtrf201804025
West R 2005 Time for a change Putting the Transtheoretical (Stages of Change) Model to rest Addiction 100 1036ndash1039 httpsdoiorg101111j1360-0443200501139x
Whillans A Sherlock J OrsquoFlaherty S Roberts J Daly M 2020 Nudging the Commute Using Behaviorally-Informed Interventions to Promote Sustainable Transportation in US Cities
Winslott Hiselius L Smidfelt Rosqvist L 2018 Segmentation of the current levels of passenger mileage by car in the light of sustainability targets ndash The Swedish case J Clean Prod 182 331ndash337 httpsdoiorg101016jjclepro201802072
Winslott Hiselius L Smidfelt Rosqvist L 2015 Mobility Management campaigns as part of the transition towards changing social norms on sustainable travel behavior J Clean Prod 123 1ndash8 httpsdoiorg101016jjclepro201508055
Winters PL 1998 Transportation demand management APA Plan Advis Serv Reports
Wolf A Seebauer S 2014 Technology adoption of electric bicycles A survey among early adopters Transp Res Part A 69 196ndash211 httpsdoiorg101016jtra201408007
Wolf I Schroumlder T 2019 Connotative meanings of sustainable mobility A segmentation approach using cultural sentiments Transp Res Part A Policy Pract 126 259ndash280 httpsdoiorg101016jtra201906002
World Commission on Environment and Development 1987 Our common future Oxford University Press Oxford UK httpsdoiorg10108007488008808408783
103
Yang L Sahlqvist S McMinn A Griffin SJ Ogilvie D 2010 Interventions to promote cycling systematic review Bmj 341 c5293ndashc5293 httpsdoiorg101136bmjc5293
104
Acknowledgement
A huge thank you to my supervisors Lena and Emeli who have been involved from the beginning to the end of my doctoral studies Your commitment thoughts and support have been invaluable throughout the process especially during the final stretch
Thank you to all my former and current colleagues at Transport and Roads Especially Helena Vilhelmsson for always making sure that major sports events are broadcasted in the fika-room Mia Thomas Astrid and Petra for making things work at the division Maya for the great cakes Andreas for all attempts (successful and unsuccessful) to initiate various workouts and for inviting me to play football in Linero My fellow PhD students for an inspiring companionship Thank you Emma for assisting me at my final seminar (and for being my supervisor at WSP)
Thank you to the folks at K2 for contributing to the welcoming and stimulating research environment Thank you John Ellen and Maria who took me onboard already in my masters in 2016 That internship really spurred my interest in transportation research I am grateful to have been affiliated with K2 during my PhD education and for taking part in the doctoral student programme (thank you Helena Svensson for pulling the strings) To the K2 PhD students I have gotten to know (former and current) thank you all for the fruitful conversations Thank you to Claus for teaching me danish
Thank you to Louise and Sonja for your helpful comments at my final seminar And the team ldquoHaringllbart resande vaumlstrdquo at Vaumlsttrafik for a smooth collaboration in conducting the e-bike trial and for showing real perseverance in acquiring e-bikes Thank you - outstanding fieldwork
Thank you Anders Soumlderberg for introducing me to soft transport measures
To my fellow crusaders at the Swedish Association of Green Motorists thank you for your wholehearted dedication and gumption Being part of this organisation has given me experience for life An extra thank you Per for countless much appreciated discussions (and pints) over the years
Karin Brundell-Freij thank you for mentoring me and for being so generous with advice when I have found myself at a crossroad And for always taking your time (even if it is just on a five-minute train ride) to provide me with the opportunity to step into a new perspective (giving me lsquotankespjaumlrnrsquo)
105
To my dear friends Adam Daniel Lior and Jesper Thank you for your cheerfulness and for always giving me a friendly tough time when we meet Thank you Miroslav Seb and Dominic for our great hiking adventures (and Miro again for commenting on one of my draft papers)
To my parents Monica and Tomas thank you for your unconditional love and support and for making the cover of this thesis awesome To my sisters Josefine and Lovisa for constantly paving the way for their little brother and for being so inspirational thank you Thank you Rolle for being a great pal To my in-laws thank you all for being an important part of my family
To my beautiful wife Elin thank you for bearing with me during the last couple of months when I finalised the thesis Your love happiness and sincerity make my life wonderful and I cannot wait for writing the next chapter of our life together with you as parents
To the people that I have not mentioned here and who supported me in this endeavour ndash thank you
Alfred Soumlderberg
15 April 2021
106
Appendix A Questionnaire items
Paper III
Table 16 The survey questions used in Paper III for segmentation according to the SEGMENT model
Question Scale Q1 Have you driven a car or van in the past 12 months yes no If Q1 = yes Q2 For most journeys I would rather use the car than any other form of transport
strongly disagree disagree neithernor agree strongly agree Q3 I like to drive just for the fun of it
Q4 I am not interested in reducing my car use Q5 Driving gives me a way to express myself If Q1 = no Q6 How likely are you to drive in the next 12 months very unlikely quite unlikely
neithernor fairly likely very likely
All Q7 I am not the kind of person who rides a bicycle strongly disagree disagree
neithernor agree strongly agree
Q8 I feel I should cycle more to keep fit Q9 I find cycling stressful Q10 Cycling can be the quickest way to travel around Q11 I like travelling by bicycle Q12 I am not the kind of person that likes to walk a lot Q13 I feel I should walk more to keep fit Q14 I like travelling by walking Q15 I am not the kind of person to use the bus Q16 In general I would rather cycle than use the bus Q17 I feel a moral obligation to reduce my emissions of greenhouse gases Q18 People should be allowed to use their cars as much as they like
Note The survey also included the marketing messages statements TTM statements and demographic questions concerning age gender education occupation residential location relationship status and children living at home
107
Paper IV
Table 17 The items used in Paper IV for the regression modelling and the TTM statements used for behaviour change stage allocation
Questionstatement Variable name Scale Do you have a driving license Driving license yes no Do you have access to at least one bicycle or e-bike
Access to a bicycle yes no
Do you live within 500 m of a public transport station
Live within 500 m of PT-station
yes no
Do you own or have access to a car for commuting
Access to a car yes no
What mode of transport do you usually use to go to schoolwork
Usual commute mode car public transport bicycle walk other
How long is your travel time from home to schoolwork
Travel time less than 10 min 10-20 min 21-30 min 31-45 min 46-60 min more than 60 min
What statement best describes how you travel in everyday life
TTM lsquoI use the car for the most part and do not intend to change the mode of transport within the next six monthsrsquo lsquoI am using the car for the most part but I am considering replacing some car journeys with other modes within the next six monthsrsquo lsquoI am using the car for the most part but have begun trying other modes instead over the last six monthsrsquo lsquoFor the past six months I have only used the car as a complement to other means of transportrsquo lsquoFor the past six months I have only used modes other than carsrsquo
I am the kind of person who rides a bicycle Identify as cyclist strongly disagree disagree neithernor agree strongly agree
I feel I should cycle more to stay fit Concerned about health Cycling can be the quickest way to get around
Perceive cycling as fast
I like riding a bicycle Like cycling Driving a car is part of my identity Identify as a driver I am the kind of person who uses public transport
Identify with a PT
I feel a moral obligation to reduce my greenhouse gas emissions
Climate morality
People should be allowed to use their cars as much as they like
Advocate private car use
Appendix B Papers
Paper I
Contents lists available at ScienceDirect
Travel Behaviour and Society
journal homepage wwwelseviercomlocatetbs
Promoting sustainable travel behaviour through the use of smartphoneapplications A review and development of a conceptual model
Alfred Anderssona Lena Winslott Hiseliusa Emeli Adellb
a Lund University Department of Technology and Society PO Box 118 SE-221 00 Lund Swedenb Trivector Traffic Åldermansgatan 13 SE-222764 Lund Sweden
A R T I C L E I N F O
KeywordsTravel behaviourICTSmartphone applicationsBehaviour changeSustainable mobility
A B S T R A C T
The negative effects of transport in terms of pollution congestion and climate change has urged the need forhigher shares of cleaner and more efficient modes of transport especially in urban settings While new tech-nology can solve some of these issues behaviour changes has also been identified as an important factor toachieve a modal shift from cars to walking cycling or public transport This study investigates how ICT has beenused to influence behaviour change and synthesizes key aspects into a conceptual model for creating a behaviourchange support system (BCSS) for smartphone applications A literature review concerning behaviour changeand ICT in the fields of transport health energy and climate was conducted to gather empirical evidence whichforms the foundation of the conceptual model The empirical findings were tested and verified against a theo-retical framework consisted of The Transtheoretical Model Theory of Planned Behaviour Diffusion ofInnovations and the concept of Gamification The results suggest that customization to the user relevant andcontextualised information and feedback commitment and appealing design are important aspects when in-fluencing users to behaviour change through smartphone applications The conceptual model provides furtherknowledge of key aspects to consider when developing persuasive tools that aims to encourage more sustainablemodes of transport
1 Introduction
The global transport sector accounts for 23 percent of CO emissionsfrom fossil fuels and is the sector that contributes most to globalwarming after electricity and heat production (IEA 2016) Whilemeasures such as energy efficiency higher incorporation of renewablesin the fuel mix and increased production of renewable energy have ledto a slower rate of growth of electricity and heat generation emissionsmeasures to reduce CO emissions from the transport sector have notbeen as effective Since 1990 global emissions from transport haveincreased by 71 percent (IEA 2016)
For Sweden conversion to a low-carbon energy system has acceleratedfaster in relation to the rest of the world thanks to good resources in waterand nuclear power as well as the introduction of district heating instead ofoil-based heating to housing The industry mainly uses biofuels and elec-tricity however energy use in transport is still dominated by petroleumand aviation fuel products (Sweden Energy Agency 2015) Of Swedenstotal emissions transport constitutes one third of which road traffic ac-counts for 93 per cent (Sweden Energy Agency 2015 EnvironmentalProtection Agency 2016)
At the beginning of 2017 the government presented a proposal for anew climate law aiming to reduce emissions by 85 percent by 2045 inSweden compared with 1990 levels They also proposed to set a targetthat emissions from domestic traffic should have decreased by 70 per-cent by 2030 compared to 2010 levels (Government Offices of Sweden2017)
Research has shown that technology innovation and economicfactors alone will not suffice to achieve the climate and environmentalobjectives set for the transport sector (Nilsson et al 2013) Sustainabledevelopment also requires changes in our behaviour and a developmentin which car travel decreases (Hiselius and Rosqvist 2016) Accordingto Anable et al (2006) there is often a gap between individuals con-cerns of climate change and the actual travel behaviour that is per-formed It does not therefore need to be inadequate knowledge ofclimate change which is the main problem but rather how it is trans-lated into practice when choosing modes of transport
To deal with the inefficient use of transport capacity TransportDemand Management (TDM) emerged as a concept for restricting ac-cess for car traffic and reallocating space in favour for walking cyclingand public transport (Banister 2011) From this a similar approach
httpsdoiorg101016jtbs201712008Received 19 October 2017 Received in revised form 18 December 2017 Accepted 29 December 2017
Corresponding authorE-mail address alfredanderssontftlthse (A Andersson)
referred to as Mobility Management (MM) has become an increasinglycommon tool especially in Europe in the past 20 years to achievedifferent transport goals (Litman 2010) It is a concept for encouragingsustainable transport and managing the demand for car journeys bychanging travellersrsquo attitudes and behaviours (Van Acker VanCauwenberge and Witlox 2013) Mobility Management is often re-ferred to as soft actions as the concept rarely includes however com-plements infrastructure solutions and thus focusing on informationcampaigns price mechanisms and policies (Litman 2010)
As digitization begins to influence more community functions newopportunities emerges for what information and communication tech-nology (ICT) can be used for A relatively new area is the use ofsmartphones as a platform for performing Mobility Management ac-tions and influence travel behaviours (Semanjski et al 2016) Anumber of studies have investigated ICT and collection of travel data(Wells et al 2014 Gerike et al 2016 Semanjski and Gautama 2016)and some have also evaluated its potential for behaviour change and atool for promoting sustainable modes of transport (Parvaneh et al2014 Poslad et al 2015 Castellanos 2016)
Earlier research on Mobility Management often includes beha-vioural and attitudinal theories (see for example Anable et al 2006) toanswer questions related to the attitude-behaviour gap where con-sumers express concerns about environmental issues but fail to translatethis into sustainable actions (Anable et al 2006) A range of differenttechniques to induce voluntary travel behaviour change has also beendeveloped over the years such as personalized travel plans (PTP) in-dividualized marketing schemes and organisational travel plans tomention a few (see Cairns et al (2008) for an ample review) While theintentions for this study is similar to those investigating how to opti-mize Mobility Management campaigns it also aims to expand theknowledge on how to further influence mobility behaviour throughsmartphone applications with support in theory This could be de-scribed as an integrated four-step procedure which includes adoptingshaping changing and keeping sustainable travel behaviours with as-sistance of app-technology This approach offers new possibilities aswell as new challenges By combining behavioural change techniques(BCTs) (Abraham and Michie 2008) and ICT research can start ex-perimenting with the opportunities to gamify data and visualize mes-sages differently to appeal to the user However fundamental butequally important challenges exists such as getting the targeted popu-lation to actually use the application in question This extended ap-proach demands for a wider scope of theories to be used certainlybehavioural change theories but also theories linked to gaming andadoption of new technologies
In a recent review of persuasive technologies to promote sustainablemobility also called behaviour change support systems (BCSS) (Oinas-kukkonen 2010) Sunio and Schmoumlcker (2017) concludes that too littleeffort is given on grounding BCSSs in explicit behavioural changetheory Developing a successful BCSS depends not only on the creativeand appropriate implementation of the behaviour change techniquesbut also on explicitly grounding it on established theoretical constructsfrom behavioural theories (Arnott et al 2014) Support for this sug-gestion can also be found in a significant meta-analysis by (Webb et al2010) who argues that a thoroughly rooted BCSS in theoretical foun-dation is positively correlated with its effectiveness The potential forsmartphone applications as carriers of behaviour change messagesshould we argue not be stalled by ignoring the underlying mechanismsof behaviour change developed from theory
To the best of our knowledge so far the only BCSS grounded inbehavioural theory is one called Quantified Traveller (Jariyasunantet al 2015) which is based on Theory of Planned Behaviour (Ajzen1991) Although highly influential in the field of travel behaviour TPBhas been criticized for disregarding the time dimension of behaviourchange which is the mere foundation of other behaviour change the-ories like The Transtheoretical Model (Prochaska and DiClemente1982) In TTM change is defined as an incremental gradual and
dynamic process involving progress through a series of stages It hasbeen argued that a combination of continuous models and stagemodels such as TPB and TTM can help to explain the process of be-haviour change (Forward 2014) For this purpose we used a theore-tical framework consisting of both Theory of Planned Behaviour andThe Transtheoretical Model but also Diffusion of Innovations (Rogers1995) and the concept of Gamification (Deterding et al 2011) to re-view the content of previous research on behaviour change and ICT anddraw conclusions about best practices for developing a BCSS
There are currently expectations that ICT could be a useful tool forinfluencing travel behaviours (Brazil and Caulfield 2013) and earlierresearch has asserted future platforms for persuasion and behaviourchange to be mobile (Fogg and Eckles 2007) However there is a lackof research exploring these new platforms for behaviour change in thelight of actual behaviour change theory as pointed out by Klein et al(2014) as well as Sunio and Schmoumlcker (2017) It is this knowledge gapin the research that this study seeks to investigate The authors of thisstudy has conducted a review of previous research on behaviour changeand ICT Apart from providing an overview of one particular field therationale for writing a literature review paper is also to add value (Weeand Banister 2016) which in this study is performed through applyingtheories on research findings as well as synthesize the results into aconceptual model
11 Purpose and research questions
The purpose of the study is to investigate how behavioural changetechniques can be implemented in smartphone applications to en-courage sustainable travel behaviours This by (1) examine conclusionsfrom previous research in which the combination of behavioural changetechniques and ICT has been studied in the field of transport as well asin other areas and (2) using a theoretical framework consisting of TheTranstheoretical Model the Theory of Planned Behaviour Diffusion ofInnovations as well as the concept of Gamification to analyse empiricalfindings and thus increase the knowledge of how behaviour changesupport system (BCSS) could be improved
The aim is to provide knowledge of key aspects to consider whencombining behaviour change techniques with ICT and to develop aconceptual model that highlights these aspects grounded in previousresearch and theory
2 Theory
To analyse the results extracted from the literature review we ap-plied the theoretical framework on the stages of adopting shapingchanging and keeping sustainable travel behaviours with the use ofsmartphone applications We made the assumption that these fourstages are vital to consider when developing a BCSS from adopting thetool to recognizing the new behaviour as a habit Although this divisionmakes for better theoretical overview in reality we consider them verymuch integrated both in practice and in theory However as a theo-retical overview our approach can be described as in Fig 1 By takingthis approach we seek to get a holistic theoretical perspective on de-veloping a BCSS as requested in previous research (Klein et al 2014Sunio and Schmoumlcker 2017) With ldquoAdoptingrdquo we refer to the crucialprocess in which the user utilize the smartphone application and engagewith its content Although many people today interact with smart-phones (in Sweden 81 percent have access to a smartphone and 65percent use it daily) there is still a large proportion especially amongelderly who struggle with adopting the new technology (Findahl andDavidsson 2016) We acknowledge this limitation for the generaladoption of a BCSS There is however a strong increase in smartphoneownership worldwide (Pew Research Center 2016) ldquoShapingrdquo is wherethe application should inspire the user to contemplate about herhiscurrent attitudes towards mobility and consider how their personalmobility could be more sustainable ldquoChangingrdquo is the process in which
A Andersson et al
the BCSS ought to guide the user towards accomplishing herhis goalsand thus making the necessary changes to succeed ldquoKeepingrdquo is thefinal step in which the user might need sustained motivation in order toimplement the new behaviour as a habit
Diffusion of Innovations (Rogers 1995) is a theory that seeks toexplain how innovations are spread within group of societies Ac-cording to the theory innovation could be a behaviour technologyservice structure system an object or idea that is considered by societyto be new Diffusion is the process where innovations is communicatedvia different channels over time among members of a social system(Rogers 1995) The theory is particularly valuable in gaining insights inwhat qualities makes innovations spread the importance of socialnetworks that spread the word about innovations as well as the sig-nificance of identifying different user segments and their needs
Theory of Planned Behaviour (TPB) (Ajzen 1991) is a theory whosepurpose is to explain human behaviour The theory assumes that atti-tudes towards a certain behaviour subjective norms and perceivedbehavioural control together form an individuals intentions and be-haviours (ibid) It has been used in a variety of studies to explain andpredict behaviour in fields such as sociology psychology environmentand health (Anable et al 2006) TPB is the most common and influ-ential theory used to explore the attitude-behaviour gap (Armitage andConner 2001) TPB has also established itself in research on travelbehaviours in order to increase the knowledge of how sustainablemodal shares can increase through changing behaviours of travellers(Bamberg et al 2003 Jariyasunant et al 2012 Semanjski andGautama 2016 Semanjski et al 2016) Semanjski and Gautama(2016) has identified TPB as well-established in research related toMobility Management which further motivates for its use as part of aframework to analyse how individuals can be encouraged to moresustainable travel behaviours
The Transtheoretical Model (TTM) (Prochaska and DiClemente1982) is a theory that seeks to explain the process of behaviour changeIt considers behaviour change to be a dynamic process rather than anisolated event and consists of several steps TTM has been used pri-marily to explain health-related behaviour changes but in recent yearsalso to understand travellers modal choice (Forward 2014) Bamberg(2007) for example used TTM to try to describe the decision-makingprocess for motorists who switched to public transport The resultshowed that the expected consequences of the changed travel patternwere perceived as more positive further along the behaviour changeprocess
Gamification is the use of game elementsgame mechanisms in ac-tivities that are traditionally unrelated to gaming to enhance the userexperience of a particular activity (Deterding et al 2011) In recentyears the concept has been applied in a number of areas for the purposeof influencing behaviours and increasing the motivational power of theuser but without much consensus on how the concept should be
formulated and what the actual benefits are (Seaborn and Fels 2015)This is also true in the transport sector where there are a number ofexamples of scientific studies where attempts have been made tochange travel habits using gamification (Castellanos 2016) The con-cept is interesting for this study since it brings new perspectives onmotivational trigger points which indeed could be combined with datacollected via smartphone applications
3 Method
31 Literature review
A literature search was being conducted on electronic sources inmultiple data bases The review followed PRISMA guidelines (Moheret al 2009) for literature reviews by including the four phases of thePRISMA flow diagram Identification screening eligibility and in-cluded papers evaluation To obtain multiple perspectives the searchincluded other fields apart from transport where behaviour changetechniques were combined with ICT Since smartphones today are themost widely used digital tool for travellers to access travel information(Poslad et al 2015 Klecha and Gianni 2018) it made sense to con-struct keywords that would allow research about application-based ICTfor smartphones The keywords consisted of constructs with differentcombinations of the terms ldquotraveltransportationmobility behaviourrdquoldquobehaviour changerdquo ldquosmartphoneapplicationrdquo ldquomobile devicerdquo andldquopersuasive technologyrdquo The timeframe was set for 2008ndash2017
The search were performed in February 2017 and then repeated inSeptember to ensure we covered recent research findings before makingfinal conclusions (see the flow diagram in Fig 2 for details) The ma-jority were scientific articles and a small number consisted of con-ference material and dissertations Three criteria determined whetherthe literature could be considered relevant to the study or not To beincluded in the study it was required that the material fulfilled thefollowing (a) it must be peer-reviewed (b) focused on some form ofbehaviour change and (c) investigated the use of apps smartphones orother types of ICT relevant to the study After fulfilling the search asnowball review was conducted where references from the articles inthe literature search were screened for additional eligible papers Afterreconciliation with the above criteria a total of 32 articles were in-cluded in the review to be analysed
32 Data extraction process using content analysis
The articles were independently examined for information thatprovided knowledge of behaviour change with the help of ICT-appli-ances This was made through a content analysis which means ana-lysing data without preconceived categories to allow new insights toemerge (Hsieh and Shannon 2005) The content was carefully analysed
Fig 1 Theoretical overview of framework application on four integrated stages of behavioural change with the use of a BCSS
A Andersson et al
to identify key concepts and findings that later could be sorted intocategories also described as inductive category development (Potterand Levine-Donnerstein 1999) When performing the inductive cate-gory development three researchers took part in a workshop to discusspossible categories and which to go further with The content analysiswas however performed by one independent researcher and herein liespotential bias The categories were tested against the theoretical fra-mework to evaluate if the findings from earlier research correspondwith relevant theories or not From this outcome a conceptual modelwas constructed based on empirical evidence and the theoretical fra-mework
4 Literature review
Research on ICT and behavioural change has been conducted inseveral fields of which four were investigated in this study The ma-jority (2732) of the articles concerns transport and mobility or healthand fitness while three items are energy-related and two address en-vironmental and climate issues (see Table 1) This means that the fol-lowing analysis will be strongly characterized by the two first men-tioned fields which however is of less concern since it is the synthesisof the result that is interesting and not necessarily what the parts sayseparately Less than half of the reviewed articles used any kind oftheory or concept which suggests a gap between theory and empiricismwhere empirical research lacks reference to theory and where theory isnot sufficiently rooted in empirical research which is also recognised inearlier research (Klein et al 2014 Sunio and Schmoumlcker 2017) Thetheories mentioned however are the Theory of Planned Behaviour(Martiskainen and Coburn 2011 Jariyasunant et al 2015 Semanjskiand Gautama 2016 Semanjski et al 2016 Pronello et al 2017)Random Utility Theory (Brazil and Caulfield 2013) Rational ChoiceTheory (Martiskainen and Coburn 2011) Information-Motivation-Be-havioural Skills model (Aliabadi et al 2016) Gamification (Wellset al 2014 Poslad et al 2015 Castellanos 2016 Coombes and Jones2016) and Nudging as well as Behavioural Economics theory (Gillilandet al 2015)
5 Analysis
51 Findings related to the theoretical framework
From the literature review 26 findings were identified which con-cerns different aspects of BCSSs (see Table 2) Upon review of thesefour distinctive categories were identified namely (1) customization tothe user (2) information and feedback (3) commitment and (4) ap-pealing design The findings were sorted into these four categories andthen analysed based on the theoretical framework of the study
511 Customization to the userA recurring observation from the articles is the importance of
adapting ICT and behavioural change to the user and its needs ratherthan a standard format of one size fits all (ex Anagnostopoulou et al2016 Poslad et al 2015 Tang et al 2015 Coşkun and Erbuğ 2014Gilliland et al 2015 Kraft and Yardley 2009 Dennison et al 2013Anda and Temmen 2014) Several studies also pointed to the need tocontextualize the content and thus make it more relevant to the user(Hargreavesn et al 2010 Coşkun and Erbuğ 2014 Poslad et al 2015Aliabadi et al 2016 Anagnostopoulou et al 2016) TPB assumes thatindividualsrsquo behaviour is influenced by habits but governed by logicalreasoning According to the theory better information should thereforebenefit the individual and strengthen confidence in the innovation atquestion
According to Diffusion of Innovations it is the product that needs tobe adjusted to the individual instead of the opposite Rogers (1995)identified five key criteria that determine between 49 and 87 percentthe acceptance of an innovation namely its relative advantage oversimilar products how well it complies with prevailing norms and va-lues ease of use and simplicity if a trial period is offered and if theresults can be observed by the user Rogers (1995) further stated thatone needs to understand the needs of the user and adjust innovations tomatch the requirements of the segment (innovators early adoptersearly majority late majority laggards)
Both the reviewed articles and the above-mentioned theories sup-port the findings that focus on adjusting content to the user and can
Studies identified through databases
(n=2106)
Studies included after duplicates removed (n=1667)
Studies excluded based on titles and abstracts
(n=1622)
Full-text articles assessed for eligibility (n=45)
Full-text articles excluded with reasons
(n=13)
1 Limited to collection oftravel data
2 No link to attitudes orbehaviourStudies included in the review
(n=32)
Iden
tific
atio
n Sc
reen
ing
Elig
ibilit
y In
clud
ed
Additional studies identified through ldquosnowball reviewrdquo
(n=11)
Titles and abstracts screened (n=1667)
Studies excluded after duplicates removed
(n=450)
Fig 2 Study inclusion flow diagram
A Andersson et al
thus be seen as an important component in the development of a BCSSIndividual alignment is in line with TTM which divides the five-stagetransition process (pre-contemplation contemplation preparation ac-tion maintenance) to determine at which stage of the process in-dividuals are The eight attitude profiles (Semanjski et al 2016) usessimilar approach as they segment the users according to their attitudetowards sustainable travel modes In this manner information feed-back and incentives can be adjusted depending on whether the user is inan early or late stage of the behaviour change process
According to TPB it is possible to influence the intentions of in-dividuals by influencing and drastically changing the prerequisites forone or more of the three components the individuals attitude andvalues towards the behaviour the social norm in relation to the beha-viour and experienced control of performing the action (Bamberg et al2003) By contextualizing and customizing content in for example anapplication for smartphones the perceived control should increase asthe individual will be equipped with more relevant information
Table 1Compilation of empirical material by theme source and purpose
Theme Source Purpose
Energy Anda amp Temmen (2014) Provide examples of how smart energy meters along with community engagement can reduce energy consumptionin households
Hargreavesn et al (2010) Qualitative field study on how individuals interact with smart energy meters and how it can affect the behaviour ofconsuming less energy
Martiskainen amp Coburn (2011) Identifying which factors contribute most to energy-efficient household use using smart energy metersHealth and fitness Aliabadi et al (2016) Identify desirable features for an application that prevents HIV in men Focus groups with 33 participants
Baranowski amp Frankel (2012) Describe different forms of ICT for behavioural change and its strengths and weaknesses to affect children to morehealthy behaviour
Chaplais et al (2015) Systematic literature review on the effects of smartphone usage as a tool for treating obesity among childrenChen et al (2015) Evaluate the quality of the most popular health applications and quantify the techniques used to encourage
behaviour changeCoombes and Jones (2016) Aims to get children more active by encouraging them to walk and cycle in their neighbourhood using tracking
technology with a reward scheme Evaluates the impact of the ldquoBeat the Street-schemerdquo on active travel to school inNorwich UK
Dennison et al (2013) Explore young adults (n= 19) perspective on health and behavioural applications to find out what motivates themto use such applications Focus groups and qualitative interviews
DiFilippo et al (2015) Systematic literature review to study the nutritional applications ability to improve adult knowledge and behaviourabout diet and nutrition
Fanning et al (2012) Perform a meta-analysis of research that examined ICT to encourage physical activity evaluate its effectiveness andprovide suggestions on how future implementation should be designed
Gilliland et al (2015) Investigate the effects of ldquoSmartAPPetiterdquo an application designed to encourage healthy and locally produced foodKraft amp Yardley (2009) Compile knowledge and suggest future studies on ICT as a tool for changing health-related behaviourMcKay et al (2016) Systematic literature review on research that examines the impact of health applications on behaviour to identify
best practiceTang et al (2015) Investigate young peoples experiences and values of using internet and application-based health information as
well as what they value in the contextClimate and environment Coşkun amp Erbuğ (2014) Investigate which app features are important to successfully encourage and long-term sustainable choices based on
17 users recommendations of four different applicationsSullivan et al (2016) Quality assessment of existing travel and dietary apps capable of calculating CO2 emissions and health effects to
influence behaviour changeTransport and mobility Anagnostopoulou et al (2016) A review of existing approaches and prototype systems which describes and classifies the persuasive strategies used
for changing behaviour in the domain of transport Also examines the results and recommendations derived frompilot studies
Berger amp Platzer (2015) Evaluate ldquoSmartMordquo as a tool for collecting travel behaviour data and gain insights on their attitudes towards theapplication 97 participants in the study
Bothos et al (2014) Focus on persuasive strategies supported by a choice architecture approach and incorporated in a smartphoneapplication aiming at providing urban travellers with a solution that will influence them to consider sustainableoptions
Brazil amp Caulfield (2013) Investigate the impact of travel and CO2 calculators on users travel behaviourBresciani et al (2016) Presented the projects ldquoOpti-LOGrdquo and ldquoSharing Citiesrdquo which are joint-venture collaborative projects to initiate
more sustainable mobility and energy-saving society through behavioural change The project includes public andprivate actors as well as community citizens
Castellanos (2016) Study the effects of financial incentives via mobile phones to encourage more sustainable travel 20 participants inthe study for two weeks
Jariyasunant et al (2015) Describe the development application and analysis of a computational travel feedback system called QuantifiedTraveller (QT)
Klecha and Gianni (2018) A review of 14 different applications with focus on utilised technology behaviour change strategies and citizenparticipation in the development process
Parvaneh et al (2014) Study the effects of personal travel information taking into consideration personal preferences Comparativedescriptive and normative travel information
Poslad et al (2015) Study the impact on the behaviour of various travel incentives through the use of Tripzoom in the European cities ofEnschede Gothenburg and Leeds for six months
Pronello et al (2017) Assessing the effects on travel behaviour of a multimodal real-time information navigator for smartphonedeveloped within the project OptimodrsquoLyon
Semanjski et al (2016) Examine the potential of smartphones as tools to deliver incentives to achieve a more sustainable travel behavioursas well as identify different attitude profiles 3400 participants over six months
Semanjski amp Gautama (2016) To bridge psychology marketing and ICT in transport research and evaluate the automatic segmentation of theeight attitude profiles within SEGMENT
Sunio and Schmoumlcker (2017) Review of existing behaviour change support systems (BCSS) designed to promote sustainable travel behaviourExtracts the persuasive features and evaluate their persuasive potential by using the persuasive systems design(PSD) model that has been used to evaluate BCSSs in the health domain
Wells et al (2014) To develop a platform that using gamification encourage users to reflect on their travel behaviours
A Andersson et al
512 Information and feedbackInformation and feedback emerged as an important category for
encouraging individuals to perform the desired behaviour (Kraft andYardley 2009 Hargreavesn et al 2010 Dennison et al 2013 Andaand Temmen 2014 Coşkun and Erbuğ 2014 Gilliland et al 2015Poslad et al 2015 Tang et al 2015 Aliabadi et al 2016) Most im-portantly credible information and data were considered important aswell as the ability to measure their performance and get feedback onones behaviour in relation to individualized goals Incentivesrewards
may be necessary for individuals to switch to more sustainable means oftravel (Poslad et al 2015) but can also be counterproductive if theyare perceived as unnecessary or irrelevant (Coşkun and Erbuğ 2014)
According to TTM individuals who undergo the behavioural changestages continuously assess the balance between the pros and cons of thechanged behaviour (decisional balance) (Prochaska and DiClemente1982) Information and feedback can therefore be used to clarify thebenefits of the change and counter-argue the disadvantages This bal-ance is different through the change process for example the cons of
Table 2Categorization of findings from the literature review
Category Findings Source
Customization to theuser
1 Applications should customize information goals and challenges (Kraft and Yardley 2009 Dennison et al 2013 Anda and Temmen 2014Coşkun and Erbuğ 2014 Gilliland et al 2015 Poslad et al 2015 Tanget al 2015 Anagnostopoulou et al 2016)
2 Use of attitude profiles increases knowledge about which segments aremore willing to change travel behaviour
(Anagnostopoulou et al 2016 Semanjski and Gautama 2016 Semanjskiet al 2016)
3 Contextualization is important to the user (Hargreavesn et al 2010 Coşkun and Erbuğ 2014 Poslad et al 2015Aliabadi et al 2016 Anagnostopoulou et al 2016)
4 The focus should be on the whole household rather than just theindividual
(Hargreavesn et al 2010 Anda and Temmen 2014)
5 Perceived control is an important factor in the choice of performing acertain behaviour
(Coşkun and Erbuğ 2014)
6 Participatory design methods in which end-users actively participate inthe stages of design and development of BCSS is unusual but couldincrease acceptance and usefulness of the application
(Klecha and Gianni 2018)
Information andfeedback
7 It is unclear whether normative information is better than descriptive intrying to influence behaviour change
(Parvaneh et al 2014)
8 Reflective learning could be an alternative approach to persuasion (Bothos et al 2014 Klecha and Gianni 2018)9 Credible information and data is important to the user (Hargreavesn et al 2010 Dennison et al 2013 Anda and Temmen 2014
Coşkun and Erbuğ 2014 Gilliland et al 2015 Tang et al 2015 Aliabadiet al 2016 Anagnostopoulou et al 2016)
10 Measurement and overview of behaviour is important to the user (Martiskainen and Coburn 2011 Dennison et al 2013 Gilliland et al2015 Tang et al 2015)
11 Mobility is very habitual and information can play a role in shiftingmodes only if it becomes meaningful enough to give users significantreasons to break their routine changing the cognitive foundation ofintentions and behaviour
(Bothos et al 2014 Coombes and Jones 2016 Pronello et al 2017)
12 Feedback is important for the user to change behaviour (Kraft and Yardley 2009 Hargreavesn et al 2010 Dennison et al 2013Anda and Temmen 2014 Bothos et al 2014 Gilliland et al 2015 Posladet al 2015 Tang et al 2015)
13 Applications should provide relevant knowledge of environmental andclimate-smart behaviour according to users
(Dennison et al 2013 Coşkun and Erbuğ 2014 Gilliland et al 2015)
14 Incentives in the form of reward can work both positively andnegatively when trying to influence behaviours
(Coşkun and Erbuğ 2014)
15 Carbon dioxide calculators have little effect on travellers if they forexample value short travel times higher than low CO2 emissions but canbe useful for comparing modes and increase awareness of unsustainablebehaviour
(Brazil and Caulfield 2013 Bothos et al 2014)
16 Incentives that are not linked to any product do not seem to inspirebehavioural change to a greater extent in some segments
(Poslad et al 2015)
17 Daily reminders do not necessarily have a positive effect on the qualityof data collection
(Berger and Platzer 2015)
Commitment 18 Higher motivation and involvement leads to a greater extent topositive results
(Kraft and Yardley 2009 Hargreavesn et al 2010 Martiskainen andCoburn 2011 Gilliland et al 2015 Jariyasunant et al 2015 Castellanos2016 Coombes and Jones 2016)
19 Gamification can extend the commitment of the user (Kraft and Yardley 2009 Baranowski and Frankel 2012 Berger andPlatzer 2015 Chaplais et al 2015 DiFilippo et al 2015 Poslad et al2015 Castellanos 2016)
20 Gamification does not necessarily increase sustainable travel in itselfbut on the other hand increases engagement at least in a short perspective
(Wells et al 2014 Coombes and Jones 2016)
21 Long-term commitment is a key issue for ICT to change and maintainthe behaviour of the user
(Kraft and Yardley 2009 Martiskainen and Coburn 2011 Baranowski andFrankel 2012 Chaplais et al 2015 DiFilippo et al 2015 Gilliland et al2015 Castellanos 2016 Coombes and Jones 2016 Pronello et al 2017)
22 Applications need to be fun to engage some users (Dennison et al 2013 Aliabadi et al 2016)23 Gamification that challenges and triggers contest behaviours could beused for motivational purpose
(Coşkun and Erbuğ 2014 Wells et al 2014 Chen et al 2015)
Appealing design 24 Appealing and simple design is important to the user (Hargreavesn et al 2010 Martiskainen and Coburn 2011 Dennison et al2013 Coşkun and Erbuğ 2014 Berger and Platzer 2015 Poslad et al2015 Tang et al 2015 Aliabadi et al 2016 Klecha and Gianni 2018)
25 The integrity aspect is important to the user (Dennison et al 2013 Berger and Platzer 2015 Aliabadi et al 2016Castellanos 2016)
26 Individuals appreciate the ability to personalize the application (Fanning et al 2012 Wells et al 2014 Gilliland et al 2015 Poslad et al2015 Semanjski et al 2016 Sullivan et al 2016)
A Andersson et al
the new behaviour have more weight for individuals during pre-con-templation However in the next stage of contemplation individualsare more likely to understand the benefits of the changed behaviour butstill overestimate the effortcosts of the change and are thus still am-bivalent in their behaviour and not yet quite ready for the change(Bamberg 2007) Thus in the first stages focus should be on raising thepositive aspects of sustainable travel and providing credible informa-tion that reinforces these arguments in combination with short-termrewards (Forward 2014) In the third stage preparation the benefitshave become quite obvious to the individual though one could stillexperience the change difficult which means that they may need gui-dance to move on to the next stage In the action stage the experienceof the new behaviour has probably shown that it was easier than ex-pected and the benefits were reminiscent At this stage however thenew behaviour has not yet become a habit which is why it is importantthat the experience feels good and rewarding to avoid the risk of theindividual returning to old behaviour patterns
According to TPB behaviours can be predicted by individuals at-titude towards the action and their perceived control that is theirexperience of how capable they are to perform the action (Ajzen 1991)With this in mind information and feedback within BCSSs should bedesigned to positively affect the attitude towards sustainable travel andalso aim to strengthen individuals belief that they are capable of ac-tually replacing the car in favour of walking cycling or public trans-port For example information about the consequences of an action caninfluence attitudes in a targeted direction (Abraham and Michie 2008)In spite of this knowledge the question remains on how normativeinformation should be A number of studies express the importance ofnormalizing sustainable travel so that individuals and society sees theunsustainable alternative as different ndash not the contrary (Oinas-kuk-konen 2010 Hiselius and Rosqvist 2016) Also the Theory of PlannedBehaviour sets the social norm as a factor individuals take into accountin their choice of behaviour indicating that it would be a good idea toinfluence these via normative information (Bamberg et al 2003) Atthe same time the risk that individuals may ignore information couldbe greater at normative than descriptive information as it could beperceived as less objective and more deceptive (Parvaneh et al 2014)An alternative approach to normative and persuasive information couldbe that of reflective learning which advocates systems to ldquofoster open-ended reflection meaning for users to reflect on what it actually meansto be sustainable in a way that makes sense in the context of their ownlivesldquo (Klecha and Gianni 2018) The question of which informationthat would be appropriate and adapted by the user may depend onwhich user segment the individual belongs to which again stresses theimportance of appropriate segmentation techniques
513 CommitmentEngaging the user appears as a key issue when it comes to changing
behaviours using ICT (Kraft and Yardley 2009 Martiskainen andCoburn 2011 Baranowski and Frankel 2012 Chaplais et al 2015DiFilippo et al 2015 Gilliland et al 2015 Castellanos 2016Coombes and Jones 2016 Klecha and Gianni 2018) After all it seemsto be of less significance if an application is sophisticated as long asusers neglect it because it is uninteresting A number of studies high-lighted the problem of declining application interest rates over time aslong term involvement on the other hand more often leads to positiveresults (Kraft and Yardley 2009 Hargreavesn et al 2010 Martiskainenand Coburn 2011 Gilliland et al 2015 Jariyasunant et al 2015Castellanos 2016 Pronello et al 2017) For example Pronello et al(2017) found that mobility is a highly habitual activity which is noteasily interrupted except for short periods This analysis is in line withTTM which means that behavioural change is a process that takes timeand thus requires long-term commitment (Prochaska and DiClemente1982) According to TTM the change process is not linear but is oftencharacterized by several relapses to old behaviour patterns (Bamberg2007) Diffusion of innovations also points out the renewal of products
as a central principle for successful dissemination and long-term sur-vival of innovations (Rogers 1995 Robinson 2009) Continuous im-provements are here pointed out as important for maintaining con-sumer interest and commitment over time (Robinson 2009) and shouldideally be carried out during stages of design and development withinput from actual users (Klecha and Gianni 2018)
Several studies are optimistic about Gamification and its potential toextend the commitment of the user (Kraft and Yardley 2009Baranowski and Frankel 2012 Berger and Platzer 2015 Chaplaiset al 2015 DiFilippo et al 2015 Poslad et al 2015 Castellanos2016) That gamification would have a positive impact on participantsinvolvement is also supported by Seaborn amp Fels (2015) The gamingindustry has succeeded in motivating its target groups with mechanismsthat provide constant feedback and motivate individuals to reach adistant goal It is those processes that gamification could use to build adigital platform around something real What is needed is data andsince large quantities can be gathered via for example travel appli-cations the possibility to gamify the experience should be virtuous Atthis point however research have not been able to determine whichspecific game elements work best to prolong commitment (Berger andPlatzer 2015 Poslad et al 2015 Castellanos 2016) It probably alsodepends on context and what kind of attitude profile is the target groupfor behavioural change (Seaborn and Fels 2015)
514 Appealing designThroughout the articles the importance of an appealing and simple
design of BCSSs was emphasized to keep the interests of users(Hargreavesn et al 2010 Martiskainen and Coburn 2011 Dennisonet al 2013 Bothos et al 2014 Coşkun and Erbuğ 2014 Berger andPlatzer 2015 Poslad et al 2015 Tang et al 2015 Aliabadi et al2016) Designing to create user-friendliness is thus important for usersto quickly understand and be able to use the application Some studiesfound that individuals also appreciate the ability to personalize thedesign thus improving the adaptation to the user
Gamification can as mentioned earlier be used to increase userinvolvement This can also be reflected in the design of the applicationAccording to Seaborn amp Fels (2015) game elements should have a user-centred approach where external rewards points pins andor marksshould be based on the usersrsquo motivational trigger points
Simplicity and ease of use are one of the five key criteria that affectthe acceptance of an innovation according to Diffusion of Innovationstheory (Robinson 2009) New ideas and innovations that are easy tounderstand are accepted earlier than those that require the user todevelop new skills
But while focusing on simplicity a number of studies have alsoshown the importance of respecting the integrity of the user (Dennisonet al 2013 Berger and Platzer 2015 Aliabadi et al 2016 Castellanos2016) The processing of collected data must respect user integrity andensure that sensitive information remains accessible only for intendedactors Clarifying this in the design should be central to ensure thatindividuals are comfortable using the application
52 Developing a conceptual model for behaviour change support systems
After analysing the four categories via the theoretical frameworkthey all appear as adequate for creating a conceptual model that helpsus to better understand what considerations are important when con-structing a BCSS (Fig 3) First of all customization to the user appear tobe crucial in order to contextualise information feedback goal settingstimuli motivational mechanisms and other content within the BCSSFor that reason ldquoCustomization to the userrdquo is the starting point of ourconceptual model and also an influencer of ldquoInformation and feedbackrdquoand ldquoCommitmentrdquo since both of these parts should be grounded in theusersrsquo needs as well Our approach is that these three parts in combi-nation will contribute to an ldquoAppealing designrdquo which in itself alsoneeds to be simple and user friendly The arrow design is a reminder
A Andersson et al
that the development of BCSSs is a process rather than a ldquoquick fixrdquowhich benefits from continuous evaluation and improvement pre-ferably with input from the users themselves (Klecha and Gianni2018)
The suggested model can be used to guide the implementationprocess of behaviour change techniques into smartphone applicationsto create a BCSS It has a user-centred focus and advocates that in-formation goals and feedback is adjusted to individuals through seg-mentation techniques In this way chances are greater that the user isprovided with contextual and relevant content that is useful to in-dividuals (Anagnostopoulou et al 2016) The model emphasizes theimportance of engaging the user to maintain motivation through thebehavioural change process Motivating the user is important becausethe performance has proven to be better the higher the interaction withthe application is (Kraft and Yardley 2009 Martiskainen and Coburn2011 Gilliland et al 2015 Castellanos 2016) A simple and user-friendly interface should characterize the design itself
The model uses established theories (TTM TPB DI) andGamification as support functions in the different parts of the modelThe categories are visualized together with the theoriesconcept thathave been used in verifying and developing the findings from the lit-erature review The purpose of including these is to clarify what per-spectives that has characterized the different parts of the conceptualmodel Generally the behaviour change theories TTM and TPB are mostinfluential in the first parts of the model The reverse applies toGamification which is more relevant when it comes to creating pro-cesses that involve the user as well as in designing and visualize con-tent Diffusion of Innovations emphasizes the importance of startingfrom the consumer constantly renewing innovation to create long-termcommitment as well as designing products that are simple and user-friendly (Rogers 1995) This theory is thus well suited to keep in mindthrough the entire development process
6 Discussion
The purpose of this study was to investigate how behaviour changetechniques can be combined with ICT in the creation of a BCSS thatencourage sustainable travel behaviour as well as developing a con-ceptual model that highlights important aspects to take into account insuch an implementation process The results contributed in its entiretyto answering the questions that guided the research process
Previous research points to ICT in general and smartphone-appli-cations in particular as a promising tool for influencing behaviourchange The results indicate however that it requires a user-centredfocus providing individuals with information feedback and goals
relevant for their specific needs to be of value in the process of changingbehaviour This is in line with the persuasive systems design (PSD)model (Oinas-kukkonen and Harjumaa 2009) which represents anextensive conceptualization for technology-based persuasion (for fur-ther application of the model see Sunio and Schmoumlcker 2017) Toallow for relevant and contextualised contents segmentation of targetpopulation would indeed be essential which also goes in line withearlier research on conventional Mobility Management campaigns(Meloni et al 2017)
Some studies indicated that the change was more successful themore individuals used and interacted with the intended BCSS (Kraft andYardley 2009 Hargreavesn et al 2010 Martiskainen and Coburn2011 Gilliland et al 2015 Castellanos 2016 Coombes and Jones2016) Commitment over time thus emerged as one of the most im-portant factors for successfully influence behaviour change Howeverprevious research also stressed the need for more empirical research onhow long-term commitment is achieved Gamification seems promisingand several studies recommend further research in this area (Berger andPlatzer 2015 Poslad et al 2015 Castellanos 2016) The theoreticalframework contributed to verifying and developing the results obtainedin the literature review TTM supports an individualized approach andsegmentation The theory can also explain to some extent how in-formation and feedback should be designed based on the users moti-vational balance that characterizes the transition between the beha-viour change stages (see 512) It also supports the observation thatlong-term commitment is important for individuals to complete thechange process and to reduce the risk of relapse into old habits Ac-cording to Theory of Planned Behaviour attitudes towards behavioursocial norms and perceived control are the main influencers of in-dividualsrsquo behaviours Customized information and feedback that re-inforces the users perceived control as well as content that normalizessustainable mobility choices should therefore be advocated by thetheory However TPB is unable to explain more closely how normativeinformation and feedback should be Diffusion of innovations supportssegmentation customization to the user continuous improvement tocreate commitment as well as simplicity and user-friendliness It alsoadvocates proliferation through social channels which is supported bysome of the reviewed articles and supported by (Ploderer et al 2014)although no conclusive studies are not yet available to shed light of theefficacy of social channels in BCSS (Sunio and Schmoumlcker 2017) Ga-mification emphasizes the importance of creating processes that inducemotivation and commitment based on the usersrsquo motivational triggerpoints The challenge with that approach is to know what the individualmotivational driving force is An alternative is to use different attitudesegments instead and design the application so that users can customize
Customization to the user (TTM TPB DI)
Information and feedback (TTM TPB)
Commitment (TTM DI Gamification)
Appealing design (DI Gamification)
Continuous evaluation and improvement
Fig 3 A conceptual model for combining behavioural change techniques with ICT to create a BCSS
A Andersson et al
certain parts as they like The concept seems promising based on pre-vious empirical studies but is also at an early stage where more re-search is necessary to understand which processes work best
7 Conclusions and further research
Based on previous research and theory a conceptual model thathighlights key aspects to consider when creating a behaviour changesupport system (BCSS) were developed Customization to the usercontextualised information and feedback commitment and appealingdesign emerged as essential aspects when developing persuasivesmartphone applications We strongly suggest segmentation of intendedtarget population to enable better customization to the user This wouldprovide enhanced conditions for user-centred information campaignstailor-made objectives and more contextualised content In previousresearch on ICT to influence behaviour change there are several ex-amples of how parts of our conceptual model have been used frag-mentarily usually with mixed results To the best of our knowledgethere is yet no study on BCSS that takes a holistic approach grounded intheory It would therefore be potential to work on the model empiri-cally to investigate its appropriateness to influence behaviour changeas theory-based research has showed to be more effective than purelyworking with behaviour techniques (Webb et al 2010)
An observation that permeates the reviewed articles is the need formore research with larger and more extensive data collection to enablegeneralisations on the efficacy of BCSSs to change behaviours We ad-vocate more empirical studies to be grounded in behaviour theoryGamification seems to be promising for sustained user engagement butrequire further research to conclude what particular mechanisms thatshould be implemented We also stress the need for studies exploringadequate segmentation techniques related to mobility developing tai-lored messages and content for different segments and also evaluatingthe effects of these
Finally future research should continue to explore the importantpossibility of measuring actual travel behaviour change with the use ofsmartphone technology A successful tool for collecting travel data bysmartphones would be essential in particular for quantitative researchbut also for making informed planning decisions regarding mobilityahead
Disclosure of interest
The authors declares that there has been no conflicts of interestconcerning this article
References
Abraham C Michie S 2008 A taxonomy of behavior change techniques used in in-terventions Health Psychol 27 (3) 379ndash387 httpdxdoiorg1010370278-6133273379
Van Acker V Van Cauwenberge B Witlox F 2013 MaxSUMO a new expert approachfor evaluating mobility managament projects Promet-Traffic Transport 25 (3)285ndash294 httpdxdoiorg107307pttv25i3290
Ajzen I 1991 The theory of planned behavior Organ Behav Human Decis Process 50(2) 179ndash211 httpdxdoiorg1010160749-5978(91)90020-T
Aliabadi N et al 2016 Using the information-motivation-behavioral skills model toguide the development of an HIV prevention smartphone application for high-riskMSM AIDS Educ Prev 27 (6) 522ndash537 httpdxdoiorg101521aeap2015276522
Anable J Lane B Kelay T 2006 lsquoAn evidence base review of public attitudes toclimate change and transport behaviourrsquo London Department for Transport (July)Available at httpwwwpdfwwwchina-upcom8080internationalcasecase1457pdf
Anagnostopoulou E et al 2016 Persuasive Technologies for Sustainable UrbanMobility Persuasive 2016 Workshop Where are we bound for Persuasion inTransport Applications July
Anda M Temmen J 2014 Smart metering for residential energy efficiency the use ofcommunity based social marketing for behavioural change and smart grid in-troduction In Renew Energy 67 pp 119ndash127 httpdxdoiorg101016jrenene201311020
Armitage CJ Conner M 2001 Efficacy of the theory of planned behaviour Br J Soc
Psychol 40 (February 2017) 471ndash499 httpdxdoiorg101348014466601164939
Arnott B et al 2014 Efficacy of behavioural interventions for transport behaviourchange systematic review meta-analysis and intervention coding Int J BehavNutr Phys Activity 11 (1) 133 httpdxdoiorg101186s12966-014-0133-9
Bamberg S 2007 Is a stage model a useful approach to explain car driversrsquo willingnessto use public transportation J Appl Soc Psychol 37 (8) 1757ndash1783 httpdxdoiorg101111j1559-1816200700236x
Bamberg S Ajzen I Schmidt P 2003 Choice of travel mode in the theory of plannedbehavior the roles of past behavior habit and reasoned action Basic Appl SocPsychol 25 (3) 175ndash187 httpdxdoiorg101207S15324834BASP2503_01
Banister D 2011 Cities mobility and climate change J Transp Geogr 19 (6)1538ndash1546 httpdxdoiorg101016jjtrangeo201103009
Baranowski T Frankel L 2012 Letrsquos get technical Gaming and technology for weightcontrol and health promotion in children Childhood Obes (Print) 8 (1) 34ndash37httpdxdoiorg101089chi20110103
Berger M Platzer M 2015 Field evaluation of the smartphone-based travel behaviourdata collection app ldquosmartMordquo In Transp Res Proc 11 pp 263ndash279 httpdxdoiorg101016jtrpro201512023
Bothos E et al 2014 Watch your emissions Persuasive strategies and choice archi-tecture for sustainable decisions in urban mobility PsychNol J 12 (3) 107ndash126
Brazil W Caulfield B 2013 Does green make a difference The potential role ofsmartphone technology in transport behaviour Transport Res Part C EmergTechnol 37 (December) 93ndash101 httpdxdoiorg101016jtrc201309016
Bresciani C et al 2016 lsquoBehavioral change and social innovation through reward anintegrated engagement system for personal mobility Urban Logistics and HousingEfficiency Transport Res Proc 14 353ndash361 httpdxdoiorg101016jtrpro201605087
Cairns S et al 2008 Smarter choices Assessing the potential to achieve traffic re-duction using ldquoSoft measuresrdquo Transp Rev 28 (5) 593ndash618 httpdxdoiorg10108001441640801892504
Castellanos S 2016 lsquoDelivering modal-shift incentives by using gamification andsmartphones A field study example in Bogota Colombia Case Stud Transp Policy 4(4) 269ndash278 httpdxdoiorg101016jcstp201608008
Chaplais E et al 2015 Smartphone interventions for weight treatment and behavioralchange in pediatric obesity a systematic review Telemed J E-health 21 (10)822ndash830 httpdxdoiorg101089tmj20140197
Chen J Cade JE Allman-Farinelli M 2015 The most popular smartphone apps forweight loss a quality assessment JMIR mHealth uHealth 3 (4) e104 httpdxdoiorg102196mhealth4334
Coombes E Jones A 2016 Gamification of active travel to school a pilot evaluation ofthe Beat the Street physical activity intervention Health Place 39 62ndash69 httpdxdoiorg101016jhealthplace201603001
Coşkun A Erbuğ Ccedil 2014 Designing for behaviour change smart phone applications aspersuaders of pro-environmental behaviours Metu J Facul Architect 31 (1)215ndash233 httpdxdoiorg104305METUJFA2014111
Dennison L et al 2013 Opportunities and challenges for smartphone applications insupporting health behavior change qualitative study J Med Internet Res 15 (4)1ndash12 httpdxdoiorg102196jmir2583
Deterding S et al 2011 Gamification Using Game Design Elements in Non-GamingContexts In Proceedings of the 2011 annual conference extended abstracts onHuman factors in computing systems ndash CHI EA rsquo11 Vancouver BC httpdxdoiorg10114519797421979575
DiFilippo KN et al 2015 The use of mobile apps to improve nutrition outcomes asystematic literature review J Telemed Telecare 21 (5) 243ndash253 httpdxdoiorg1011771357633X15572203
Environmental Protection Agency Emissions of greenhouse gases from domestic transportAvailable at httpwwwnaturvardsverketseSa-mar-miljonStatistik-A-OVaxthusgaser-utslapp-fran-inrikes-transporter2016 Accessed 1 February 2017
Fanning J Mullen SP Mcauley E 2012 Increasing physical activity with mobiledevices a meta-analysis J Med Internet Res 14 (6) httpdxdoiorg102196jmir2171
Findahl O Davidsson P 2016 Swedes and internet 2016 study of Swedesrsquo internethabits Found Internet Infrastruct Sweden 978-91-85291-14-4
Forward SE 2014 Exploring peoplersquos willingness to bike using a combination of thetheory of planned behavioural and the transtheoretical model Revue Europeene dePsychologie Appliquee 64 (3) 151ndash159 httpdxdoiorg101016jerap201404002
Gerike R et al 2016 Physical Activity through Sustainable Transport Approaches(PASTA) a study protocol for a multicentre project BMJ Open 6 (1) e009924httpdxdoiorg101136bmjopen-2015-009924
Gilliland J et al 2015 Using a smartphone application to promote healthy dietarybehaviours and local food consumption BioMed Res Int 2015 httpdxdoiorg1011552015841368
Government Offices of Sweden The government proposes historical climate reform forSweden Available at httpwwwregeringensepressmeddelanden201702reger-ingen-foreslar-historisk-klimatreform-for-sverige2017 Accessed 14 February 2017
Hargreavesn T Nye M Burgess J 2010 Making energy visible a qualitative fieldstudy of how householders interact with feedback from smart energy monitorsEnergy Policy 38 (10) 6111ndash6119 httpdxdoiorg101016jenpol201005068
Hiselius LW Rosqvist LS 2016 Mobility Management campaigns as part of thetransition towards changing social norms on sustainable travel behavior J CleanProd 123 34ndash41 httpdxdoiorg101016jjclepro201508055
Hsieh H-F Shannon SE 2005 Three approaches to qualitative content analysis QualHealth Res 15 (9) 1277ndash1288 httpdxdoiorg1011771049732305276687
IEA (2016) CO2 Emissions from Fuel Combustion ndash Highlights Paris Available at
A Andersson et al
httpswwwieaorgpublicationsfreepublicationspublicationCO2EmissionsfromFuelCombustion_Highlights_2016pdf
Fogg J Eckles D 2007 Mobile Persuasion 20 Perspectives on the Future of BehaviorChange Stanford Captology Media Stanford
Jariyasunant J et al 2012 The Quantified Traveler changing transport behavior withpersonalized travel data feedback Transport Res-D 2 (2) 107ndash123 httpdxdoiorg101068a201285
Jariyasunant J et al 2015 Quantified traveler travel feedback meets the cloud tochange behavior J Intell Transp Syst Technol Plann Oper 19 (2) 109ndash124httpdxdoiorg101080154724502013856714
Klecha L Gianni F 2017 Designing for Sustainable Urban Mobility Behaviour ASystematic Review of the Literature In Citizen Territory and Technologies SmartLearning Contexts and Practices Proceedings of the 2nd International Conference onSmart Learning Ecosystems and Regional Development ndash University of AveiroPortugal 22-23 pp 137ndash149 httpdxdoiorg101007978-3-319-61322-2_14
Klein M Mogles N van Wissen A 2014 Intelligent mobile support for therapy ad-herence and behavior change Elsevier Inc J Biomed Inform 51 137ndash151 httpdxdoiorg101016jjbi201405005
Kraft P Yardley L 2009 Current issues and new directions in Psychology and Health What is the future of digital interventions for health behaviour change PsycholHealth 24 (6) 615ndash618 httpdxdoiorg10108008870440903068581
Litman T 2010 Quantifying the benefits of nonmotorized transportation for achievingmobility management objectives by Transp Res Rec 134ndash140
Martiskainen M Coburn J 2011 The role of information and communication tech-nologies (ICTs) in household energy consumption-prospects for the UK Energy Effi 4(2) 209ndash221 httpdxdoiorg101007s12053-010-9094-2
McKay FH et al 2016 Evaluating mobile phone applications for health behaviourchange a systematic review J Telemed Telecare 1ndash9 httpdxdoiorg1011771357633X16673538
Meloni I Sanjust di Teulada B Spissu E 2017 Lessons learned from a personalizedtravel planning (PTP) research program to reduce car dependence Transportation 44(4) 853ndash870 httpdxdoiorg101007s11116-016-9681-y
Moher D et al 2009 Preferred reporting items for systematic reviews and meta-ana-lyses the (PRISMA) statement Res Meth Report 1ndash8 httpdxdoiorg101136bmjb2535
Nilsson LJ et al 2013 I ljuset av framtiden Styrning mot nollutslaumlpp aringr 2050LETS2050 Lunds Universitet
Oinas-kukkonen H 2010 Behavior Change Support Systems A Research Model andAgenda Proceedings In Persuasive Technology 5th International ConferencePERSUASIVE 2010 Copenhagen Denmark June 7-10 pp 4ndash14 httpdxdoiorg101007978-3-642-13226-1
Oinas-kukkonen H Harjumaa M 2009 Persuasive systems design key issues processmodel and system features Commun Assoc Inform Syst 24 (28) 485ndash500
Parvaneh Z Arentze T Timmermans H 2014 A stated adaptation approach to assesschanges in individualsrsquo activity-travel behavior in presence of personalized travelinformation Elsevier BV Transp Res Proc 3 (July) 21ndash30 httpdxdoiorg101016jtrpro201410087
Pew Research Center Smartphone Ownership and Internet Usage Continues to Climb inEmerging Economies ndash But advanced economies still have higher rates of technology
use Available at httpwwwpewglobalorg20160222smartphone-ownership-and-internet-usage-continues-to-climb-in-emerging-economies2016 Accessed 13December 2017
Ploderer B et al 2014 Social interaction and reflection for behaviour change PersUbiquit Comput 18 (7) 1667ndash1676 httpdxdoiorg101007s00779-014-0779-y
Poslad S et al 2015 Using a smart city iot to incentivise and target shifts in mobilitybehaviourndashis it a piece of pie Sensors 15 (6) 13069ndash13096 httpdxdoiorg103390s150613069
Potter WJ Levine-Donnerstein D 1999 Rethinking validity and reliability in contentanalysis J Appl Commun Res 27 258ndash284
Prochaska JO DiClemente CC 1982 Transtheoretical therapy Toward a more in-tegrative model of change Psychother Theor Res Pract 19 (3) 276ndash288 httpdxdoiorg101037h0088437
Pronello C Simatildeo JPRV Rappazzo V 2017 The effects of the multimodal real timeinformation systems on the travel behaviour Transp Res Procedia 25 2681ndash2693httpdxdoiorg101016jtrpro201705172
Robinson L 2009 A summery of Diffusion of Innovations ChangeologyRogers EM 1995 Diffusion of innovations 3rd editio Macmillian Publishing Co 3rd
editio London Collier Macmillian Publishers doi citeulike-article-id126680Seaborn K Fels DI 2015 Gamification in theory and action a survey Int J Human
Comput Stud 74 14ndash31 httpdxdoiorg101016jijhcs201409006Semanjski I et al 2016 Policy 20 platform for mobile sensing and incentivized tar-
geted shifts in mobility behavior Sensors (Switzerland) 16 (7) httpdxdoiorg103390s16071035
Semanjski I Gautama S 2016 Crowdsourcing mobility insights ndash reflection of attitudebased segments on high resolution mobility behaviour data Elsevier Ltd TranspRes Part C Emerg Technol 71 434ndash446 httpdxdoiorg101016jtrc201608016
Sullivan RK et al 2016 Smartphone apps for measuring human health and climatechange co-benefits a comparison and quality rating of available apps JMIR mHealthuHealth 4 (4) e135 httpdxdoiorg102196mhealth5931
Sunio V Schmoumlcker J-D 2017 Can we promote sustainable travel behavior throughmobile apps Evaluation and review of evidence Int J Sustain Transport 11 (8)553ndash566 httpdxdoiorg1010801556831820171300716
Sweden Energy Agency 2015 Energy Situation 2015 Available at httpswwwenergimyndighetensecontentassets50a0c7046ce54aa88e0151796950ba0aenergilaget-2015_webbpdf
Tang J et al 2015 How can weight-loss app designersrsquo best engage and support usersA qualitative investigation Brit J Health Psychol 20 (1) 151ndash171 httpdxdoiorg101111bjhp12114
Webb TL et al 2010 Using the Internet to promote health behavior change a sys-tematic review and meta-analysis of the impact of theoretical basis use of behaviorchange techniques and mode of delivery on efficacy J Med Internet Res 12 (1)httpdxdoiorg102196jmir1376
Wee B Van Banister D 2016 How to write a literature review paper Transp Rev 36(2) 278ndash288 httpdxdoiorg1010800144164720151065456
Wells S et al 2014 Towards an applied gamification model for tracking managing ampencouraging sustainable travel behaviours ICST Trans Ambient Syst 14 (4) 1ndash9
A Andersson et al
Paper II
Paper III
ndash
euro
rsquo
euro
euro
euro rsquo
journal homepage httpwwwelseviercomlocatetranpol
oslash
oslash
euro
rsquo rsquo
rsquo
euro
rsquo
rsquo
rsquo
rsquo
rsquo
rsquo
rsquo
ndash
rsquo
gt
gt
lt
rsquo
rsquo
lt
ndash
frac14
oslash
rsquo
euro
rsquo
rsquo
rsquo
rsquo
rsquo
frac14 frac14frac14 frac14 frac14
rsquo
ndash
euro
rsquo
frac14
frac14
euro
rsquo
8072
4739
30
12
11
10
37
22
21 56 83
50
9
2531
18
33
8 712 12 16
1315 17
0
20
40
60
80
100
Distance working
Walking
Bicyclee-bike
Public transport
ScooterMotorcycle
Car
rsquo
rsquo
rsquo
rsquo
rsquo
rsquo
α
frac14
ndash
euro
rsquo
rsquo α
rsquo rsquo
euro
rsquo
ndash
rsquo
lt
frac14
frac14
ndash
ndash
ndash
rsquo
ndash
ldquo rdquo ldquo rdquo
ndash
ndash
ndash
ndash
ndash
ndash
ndash
ndash
ndash
ndash
rsquo
ndash
ndash
ndash
euro
ndash
ndash
ndash
ndash
ndash
ldquo rdquo
ndash
ndash
euro
ndash
ndash
ndash
ndash
ndash
ndash
ndash
ndash
ndash
ndash
ndash
ndash
ndash
ndash
ndash
ndash
ndash
ndash
rsquo
ndash
ndash
ndash
rsquo
ndash
ndash
ndash
ndash
ndash
ndash
ndash
rsquo
ndash
ndash
ndash
ndash
euro
ndash
oslash
ndash
ndash
ndash
ndash
ndash
ndash
Paper IV
Contents lists available at ScienceDirect
Transportation Research Part D
journal homepage wwwelseviercomlocatetrd
Is climate morality the answer Preconditions affecting themotivation to decrease private car use
Alfred Andersson
Lund University Department of Technology and Society Box 118 SE-221 00 Lund SwedenK2 ndash The Swedish Knowledge Centre for Public Transport Bruksgatan 8 SE-222 36 Lund Sweden
A B S T R A C T
Persuasive messages are commonly used in campaigns promoting sustainable transport to motivate people to reduce private car use This paperexplores the preconditions affecting the motivation of people to reduce private car use when exposed to such messages A sample of 1100 Swedishresidents was analysed for the effect of variables related to accessibility usual commute mode and attitudes Significant variables were used tocreate a precondition index which was cross-tabulated with demographic variables and stages drawn from the transtheoretical model The resultsshow that there are differences in the preconditions regarding motivation to reduce private car use between segments of the population Resultsindicate that climate morality is the most critical factor affecting motivation specifically the motivation of persistent drivers Usual commute modecar advocacy health concern attitudes towards cycling car identity and travel time also influence motivation Males the middle-aged people withlow educational attainment and rural residents have the least favourable preconditions concerning motivation to reduce private car use
1 Introduction
Global transport CO2 emissions continue to rise and constitute a quarter of the total emissions with the highest absolute increasein road transport which accounts for 74 of transport emissions (IEA 2018) In Sweden domestic transport is responsible for aneven higher share (33) mainly because electricity generation and heating in Sweden are less dependent on fossil fuels (SwedishEPA 2018) Among the domestic transport emissions in Sweden 93 comes from road transport and the largest share of it (67)comes from passenger transport (Swedish Transport Administration 2019) Despite a broad agreement among politicians in Swedenthat the transport sector needs to be de-carbonised emissions continue to be more or less unchanged To reach the climate target forthe transport sector in Sweden (ie decrease in emissions from domestic traffic by 70 by 2030 compared with that in 2010)emissions from transport need to decrease annually by 8 (Swedish Transport Administration 2019) Instead CO2 emissions in-creased by 03 in 2018 primarily because of the increased amount of passenger car kilometres which counteracted the otherwiseimproved energy efficiency within the car fleet (Swedish EPA 2018) Therefore to reach the climate targets the demand for privatecar use needs to decrease rapidly Including the expected population growth by 2050 it has been estimated that passenger carkilometres need to be reduced by a third in Sweden (Winslott Hiselius and Smidfelt Rosqvist 2018)
At the time of this study Sweden had almost 49 million passenger cars registered for use in traffic These vehicles do not includelight or heavy trucks which are instead included in the statistics for freight transport In 2008ndash2018 the car fleet expanded byapproximately 12 and according to Transport Analysis a Swedish government agency for transport policy analysis the trend isexpected to continue in the coming years partly because of the projected population and gross domestic product increase (TransportAnalysis 2018) Bicycle sales have remained steady over the past ten years but 38 fewer trips are now made by bicycles than in the1990s (Svensk cykling 2018) Similar to many other European countries Sweden has had a significant increase in the sales of electric
httpsdoiorg101016jtrd201911027
At Department of Technology and Society John Ericssons vaumlg 1 Box 118 SE-221 00 Lund SwedenE-mail address alfredanderssontftlthse
bicycles which accounted for about 20 of the total bicycle sales in 2018Cars remain the dominant mode of transportation in terms of total passenger-kilometres Nationally car trips account for 72 of
all trips Public transport accounts for about 23 and walking and cycling account for 2 respectively (Transport Analysis 2015)The large proportion of car journeys is a trend that is difficult to break An average Swedish resident drives more than 6500 km peryear The passenger car kilometres per capita have hardly changed since 2006 though it has slightly increased since 2013 Howeverdifferences exist at the regional and municipal levels The driving distances by car have decreased in the three Swedish metropolitanareas of Stockholm Gothenburg and Malmouml At the same time passenger car kilometres have increased in the rest of the countryhighlighting the need for car-restricting measures that function in both more rural areas and cities
However implementing car-restricting measures is usually considered a political risk because of the significant barriers related tothe design and acceptance of sustainable transport policies which are referred to as lsquotransport taboosrsquo by Goumlssling and Cohen (2014)Therefore attempts have been made with lsquosoftrsquo measures that encourage people to change their travel behaviour voluntarily Travelprogrammes such as TravelSmart in Australia (Freer et al 2010) and the Travel Feedback Programme in Japan (Taniguchi et al2003) provide users with information about the various aspects of their travel behaviour to encourage pro-environmental behavioursSuch campaigns have been applied in several European cities with positive outcomes (a reduction in private car use of around 10)(Banister 2008)
Persuasive messages are commonly included as part of the campaigns An example from Sweden is the bicycle campaign launchedby the city of Malmouml that used the message lsquoinga loumljliga bilresorrsquo (no ridiculous car trips) to influence social norms related to drivingThe effect of such marketing and communication efforts has been examined to understand its influence on the motivation to decreaseprivate car use (eg Beale and Bonsall 2007 Hess and Bitterman 2016) Mir et al (2016) found that communicating the con-sequences of air pollution could provoke individuals to act more environmentally friendly and change the intention of using moresustainable modes of transportation Some studies have explored the effect of different framing interventions such as CO2 valenceframing (Avineri and Waygood 2013 Waygood and Avineri 2018) and fiscal versus environmental messages (Cohen-Blankshtain2008) These studies contribute to addressing the question of how people respond to different messages However research in-vestigating firstly why people respond the way they do and secondly what characteristics are related to the segments that aremotivated to reduce private car use and those that are not is lacking The first question is critical to understand the latent preconditionsthat guide peoplesrsquo motivation to decrease private car use and the second question is important for policymakers to create efficienttargeted communication strategies In particular research has demonstrated the difficulties in reaching lsquopersistent driversrsquo witharguments emphasising a low-carbon lifestyle (Polk 2003 Jia et al 2018) As this group accounts for the largest share of passengercar kilometres (Ko et al 2011 Smidfelt Rosqvist and Winslott Hiselius 2018) analysing this group more closely is vital to un-derstand their motivations to reduce private car use (Beiratildeo and Sarsfield Cabral 2007) In this study the transtheoretical model(TTM) is used to segment the population and to analyse the conditions for changing travel behaviour in different stage groups
11 TTM
TTM (Prochaska and Diclemente 1986) seeks to explain the process of behaviour change It considers behaviour change as astepwise process rather than an isolated event For campaign designers the advantage of such an approach is that it enables in-terventions to be matched to different stages (Friman et al 2017) TTM has been used mainly to explain health-related behaviourchanges but in recent years it has also been employed to promote modal shifts within the transport domain (Gatersleben andAppleton 2007 Forward 2014) Moreover it has been suggested as a theory for examining campaigns in the transport sector(Waygood et al 2012) The TTM stages include the following
bull Pre-contemplation unconcerned about the problems caused by current behaviour and have no intention to change
bull Contemplation start to become aware of the problem and the cost and benefits of the new behaviour weigh about the same
bull Preparation the benefits of the new behaviour have become apparent and the preparation to change begins
bull Action have started to change but the risk is still high for submitting to the old behaviour
bull Maintenance the behaviour has started to become a habit
12 Aims
This study attempts to shed light on the factors affecting the motivation to reduce private car use and how these factors aredistributed in the population demographically and in the stages of TTM The outcome from a survey exploring peoplesrsquo motivation toreduce private car use when exposed to messages advocating sustainable transport is analysed Ordinary least squares (OLS) re-gression analyses are used to explore the factors affecting such motivation and a precondition index consisting of significant vari-ables is used to differentiate the population Finally a segmentation based on the transtheoretical model is used to analyse persistentdrivers separately
2 Methodology
21 Data collection and sample
The participants in the survey were recruited from a Swedish probability-based internet panel of Kantar Sifo similar to the Dutch
A Andersson
panel used by Hoen and Geurs (2011) The panel consists of approximately 100000 residents 16ndash79 years of age The panel membersare randomly recruited through nationally representative telephone surveys and the panel is continuously filled with new membersto prevent them from becoming lsquoexpertsrsquo The panel members are recruited by e-mail with a link to the questionnaire and if theychoose not to participate another panel member is contacted instead Those who agree to participate receive compensation in theform of bonus points that can be redeemed for movie tickets or gift cards
The sample was stratified to match the national conditions regarding gender and age and analytical weights were used to adjustfor potential skewness These weights were used to compensate for the overrepresentation of respondents with higher education (thesample had 10 more highly educated participants than the Swedish average) and the underrepresentation of older respondents Thegeographical scope was limited to seven out of the nine municipality groups according to the classification made by the SwedishAssociation of Local Authorities and Regions (2016) The two excluded municipality groups consist of rural municipalities where thepopulation is less than 15000 inhabitants in the largest urban area or where the commuting rate for work outside of the municipalityis very low (less than 30) These rural municipalities were excluded because of the types of marketing messages used in the surveywhich mostly relate to sustainable transportation such as walking cycling and public transport that can be inaccessible in many ruralparts of Sweden Nevertheless the municipality groups included in the survey cover nearly 95 of the Swedish population
The questionnaire was fielded in February 2018 A total of 1500 individuals were recruited from the panel as part of a largerresearch project Among these participants 1100 were in the ages of 18ndash65 years and stated that they usually commute to school orwork The study focused on commuting trips to enable the marketing messages to be contextualised around them To ensure that allanalyses were based on the same individuals an analytical sample was defined and included only individuals with valid information(ie no missing responses) for all the variables used in the statistical analyses (n = 977)
Further mischievous respondents (MRs) who knowingly make false responses meant to cheat the researcher were removed byapplying Hyman and Sierras (2012) distribution-free sample-size-unconstrained backwards-stepping MR algorithm This step isespecially important when respondents are compensated for participating (Hyman and Sierra 2012) The lowest variance deletionrule was used to clean the data (Thoslashgersen 2018) The respondents were considered mischievous if the variance of their responses tothe 14 message items that would constitute the dependent variable was below 025 (13 of the sample) This step reduced theanalytical sample to 850 individuals
22 Survey design
The questionnaire involved four parts (1) demographic characteristics of the respondents (2) their accessibility to travel modesdriving license and daily commuting trip length and mode choice (3) attitudinal questions and (4) marketing messages The originalquestionnaire in Swedish was translated into English by the researcher All of the variables used in the study are presented in Table 1Previous literature was searched to determine the factors that could influence the motivation to decrease private car use (Tertoolenet al 1998 Steg and Tertoolen 1999 Beiratildeo and Sarsfield Cabral 2007 Abrahamse et al 2009 Anable and Wright 2013 Damant-Sirois and El-Geneidy 2015) which guided the design of the questions in parts two and three (see Appendix A)
The fourth part of the survey included marketing messages that were used to measure the respondentsrsquo motivation to decreaseprivate car use Messages promoting pro-environmental behaviours have typically been examined in relation to environmentalhealth and economic benefits (Nisbet and Gick 2008 Avineri and Waygood 2013 Bolderdijk et al 2013 Loureiro and Veloso2017 Steinhorst and Kloumlckner 2017) Campaigners have used the same dimensions when framing marketing messages promotingsustainable transport in Sweden (Hiselius and Rosqvist 2015) Therefore these dimensions were used to form the messages con-stituting the dependent variable in this study A screening of messages used by the regional public transport authorities munici-palities working with mobility management train operators and organisations that support bicycling and public transport wasconducted From these actors 14 messages promoting sustainable transport or sustainability in general were chosen (Table 2)
The respondents were asked to state their level of motivation to decrease their car use when exposed to the messages which wererandomised to avoid response bias The messages were rated on a five-point Likert scale from lsquovery motivated to decrease my level ofprivate car usersquo to lsquovery unmotivated to decrease my level of private car usersquo following the scale used by Waygood and Avineri(2018) For the respondents that already had low or no private car use the scale was adjusted to lsquovery motivated to keep my low levelof private car usersquo to lsquovery unmotivated to keep my low level of private car usersquo The 14 items had high construct reliability(Cronbachrsquos alpha = 093) (Meyers et al 2013)
The aggregated responses from the 14 marketing messages were then used to compute a mean value for each respondent forminga continuous variable that was further used as the dependent variable in the OLS regressions The scale of this variable had a range of14ndash70
23 Statistical analyses
Multiple linear regression models were estimated to analyse the effect of attitudes and accessibility on the motivation to decreaseprivate car use Firstly several preliminary analyses were conducted to ensure the non-violation of the assumptions of normalitylinearity homoscedasticity and multicollinearity The histogram scatterplot and normal P-P plots of the regression standardisedresiduals were used to control the data Standardised residuals and casewise diagnostics were further used to investigate if there wereany potential outliers Two outliers were excluded based on standardised scores (gt 3)
Cookrsquos distance statistics which is a measure of the overall influence that a single case has on a model was used to test for casesthat could arbitrarily influence the model Cook and Weisberg (1982) suggested that values greater than one could be cause for bias
A Andersson
Conducting this analysis revealed that the 10 cases with the highest Cookrsquos distance values were 0015ndash0008 and thus no casecaused a significant bias to the model Multicollinearity was further tested by conducting collinearity diagnostics in linear regressionand including all independent variables The general guideline that VIF values above ten or tolerance values below 01 suggestmulticollinearity was used (Field 2013) The maximum variance inflation factor was 202 and the tolerance values varied at050ndash089 indicating no collinearity among the independent variables
The attitudinal survey questions were measured on a five-point Likert scale (strongly disagree disagree neithernor agree andstrongly agree) When running the multiple regressions some of these variables were non-linear that would make treating them ascontinuous variables inappropriate Therefore dummy variables were created for each category within the variables and neithernorserved as the reference category Thus accounting for potential thresholds in the data and presenting a more nuanced picture of howthe independent variables influence the dependent variable became possible (see Paacuteez and Whalen (2010) for a similar approach)This issue is elaborated in conjunction with Table 3
Upon completion of the regression analysis an index consisting of the significant variables was created to explore the trends inhow the preconditions for the motivation to reduce private car use are distributed within the sample and in the TTM stages Thefollowing procedure was undertaken to compute the index First a new variable was created for each of the significant predictorsand each significant category was loaded with the estimated coefficients retrieved from the regression As the index should be a
Table 1Overview of the variables (n = 850)
Mean or distribution () SD
Accessibility amp usual commute modeDriving license 091 028
Access to a bicycle 089 031Live within 500 m to a PT station 084 036Access to a car 078 042
Usual commute modeCar 070 046PT bicycle walk 030
Travel timelt 10 min 017 03610ndash20 min 02821ndash30 min 02031ndash45 min 01746ndash60 min 009gt 60 min 008
AttitudesIdentify as a driver 197 125Advocate private car use 304 136Identify as a cyclist 404 124Perceive cycling as fast 33 14Like cycling 37 122Identify with PT 361 142Concerned about health 314 137Climate morality 346 129
DemographicAge 4197 1271Female 049 05
Relationship statusMarriedlive with partner 07 046Single 03
Children living at homeOne 013 048More than one 024None 063
EducationElementary school 013 110Upper secondary 026University lt3 years 016University gt3 years 045
OccupationWorking 081 049Studying 016Off duty 003
Residential areaThe main city of municipality 068 078Town ge5000 residents 014Town lt5000 residents 018
A Andersson
composite variable showing what significantly influences motivation to reduce private car use weights were only allocated to thecategories that were significant in the regression The non-significant categories (and reference categories) were set to 0 Second allthe new variables were summed into a continuous variable in which each respondent had a value positioned on the index scaleDifferent methods are available for aggregating indicators to form a composite index and the most common are the lsquoadditive methodsthat range from summing up unit ranking in each indicator to aggregating weighted transformations of the original indicatorsrsquo(Matteo Mazziotta 2013) The latter method was used to compute the precondition index the significant predictor coefficients wereused as weights and aggregated to form an index Third the variable was transformed into a categorical variable for further analysesThe range produced by the respondents was used and equally divided into four categories with the lower range indicating un-favourable preconditions the higher range indicating favourable preconditions and 0 being neither favourable nor unfavourablepreconditions
Separate cross-tabulations were then conducted The demographic variables (age gender relationship status children at homeeducation occupation and residence) and the TTM stages interacted with the index similar to the approach used by Polk (2003) Thedistribution of the preconditions within the population was investigated Thus the demographic variables were not included directlyas predictors in the multiple regressions because using them both endogenously (ie within the regression and index) and exogen-ously (ie in the cross-tabulation with the index) would be inappropriate
3 Multiple regression model for the motivation to decrease private car use
A multiple linear regression model was estimated to understand which variables affect the motivation to decrease private car usewhile controlling for the simultaneous effects of other variables The model was estimated using accessibility and attitudinal variablesas the explanatory variables and motivation to decrease private car use as the outcome variable The model had a Nagelkerke score of047 indicating that the included exploratory variables explain about half the variance of the motivation to decrease private car use
Some key insights emerged in the interpretation of the regression results in Table 3 In particular feeling a moral obligation toreduce onersquos carbon emissions (climate morality) is significant and positively affects the motivation to reduce private car use comparedwith the reference category of being indifferent to the issue (neithernor) Those who strongly agree to have climate morale increasetheir motivation to reduce private car use (on a 14ndash70 scale) by 47 points on average Those agreeing to have climate morale is 22points more motivated compared to the reference category neithernor Furthermore those strongly disagreeing with the statementare other things being equal minus72 points less motivated to reduce private car use However disagreeing is not significant climatemorality has an effect only when it is either positive or very negative
The coefficients for agreeing and strongly agreeing to like cycling are significant and increase the motivation to reduce private caruse with 34 and 37 points respectively This result is consistent with those of previous research that found stronger intentions forpeople to use sustainable modes of transportation if they like to bicycle Using stated preferences Gatersleben and Appleton (2007)found that people who like bicycling would bicycle commute under most circumstances The relationship between attitudes towardscycling and car use intentions was further demonstrated by Handy and Xing (2011) who found that people who agree that theywould limit driving as much as possible were also more likely to bicycle commute However the results in Table 3 show thatdisagreeing and strongly disagreeing to like cycling is not significant indicating that attitudes towards cycling primarily influencesmotivation when they are positive One possible explanation for this result is that those who do not like cycling may still be motivatedto decrease their car use by instead switching to public transport a suggestion also put forward by Handy and Xing (2011)
Strongly disagreeing and disagreeing with the statement that cycling can be as fast as a car on certain distances is significant andaffects motivation negatively (minus27 and minus18 respectively) Likewise for the concerned about health variable strongly disagreeing is
Table 2Messages used for measuring motivation to decrease private car use (n = 850)
Item Mean SD
1 We all must help to reduce our climate footprint The result will be a sound environment that future generations also need 383 1052 Those who mostly walk cycle or ride transit are doing something good for the environment 372 1043 Research shows that public transport users are walking on average four times more per day than do car drivers therefore reducing the risk of
acquiring severe non-communicable diseases369 105
4 Those who cycle and go by public transport not only improve their health but also contribute positively to other peoples health 366 1015 Did you know that cyclists have a 52 lower risk of dying of heart disease and a 40 lower risk of dying from cancer 364 1066 You save about 350 euro per month if you live without a car and instead go by public transport and even more so if you cycle or walk 348 1197 Bicycles run on fat and save you money Cars run on money and make you fat 345 1268 If Sweden is to achieve its climate targets then generally every third car trip must be replaced with more environmentally friendly
alternatives341 117
9 By cycling instead of taking the car to work you save money and contribute to society at the same time Try it 336 11110 The car traffic in Sweden induces a socio-economic loss above 10 billion euros in adverse health effects 326 11311 In the government budget support for investments in cycling infrastructure increased by 50 million euros in 2018 321 11512 If you want to improve your health you should ride a bicycle instead of driving a car If the distance is a problem then an electric bike can
be an option317 117
13 Beginning in 2018 you can get 25 of the cost subsidised by the government when purchasing a new electric bicycle 305 12714 The environmental impact per bus passenger is only 65 of the private car user in rural areas and 40 in urban areas 3 106Cronbachrsquos α 093
A Andersson
significant (minus22) Thus those who do not see cycling as a competitive alternative to driving a car or as a way to improve theirhealth are less likely to be motivated to decrease their private car use However the respondents who agree with these statementsseem to either be motivated or not motivated that is there is no association in these cases This outcome is not surprising given thatpeople sometimes hold two or more contradictory beliefs preferences or values referred to as cognitive dissonance by Festinger(1957) A person may be aware of the benefits of bicycle commuting and still be unmotivated to reduce private car use due to otherbarriers
Consequently the results highlight the need to communicate the benefits of cycling on the one hand and to remove the obstacles
Table 3Multiple regression model (n = 848) Dependent variable motivation to decrease private car use
95 CI
B SE Beta t Sig Upper Lower
Constant 43403 2229 1947 0 3903 4778Accessibility amp usual commute modeDriving license (ref no) minus1107 1067 minus003 minus104 03 minus320 099Access to a bicycle (ref no) 0383 0966 001 040 0692 minus151 228Live within 500 m to a PT station (ref no) minus0059 079 000 minus007 0941 minus161 149Access to a car (ref no) 0749 0849 003 088 0378 minus092 242Usual commute mode (ref car) 3248 0731 016 445 0 181 468Travel time (ref lt 10 min)
10ndash20 min 0369 084 002 044 066 minus128 20221ndash30 min 0804 091 003 088 0377 minus098 25931ndash45 min 0013 0957 000 001 0989 minus187 18946ndash61 min minus0201 1144 minus001 minus018 0861 minus245 205gt 60 min minus3314 1233 minus009 minus269 0007 minus573 minus089
AttitudesClimate morality (ref neithernor)
Strongly disagree minus7206 1054 minus022 minus684 0 minus928 minus514Disagree minus1342 0992 minus004 minus135 0177 minus329 061Agree 2179 078 009 279 0005 065 371Strongly agree 4687 0808 020 580 0 31 627
Advocate private car use (ref neithernor)Strongly disagree 2243 0927 008 242 0016 042 406Disagree 2408 0821 009 294 0003 08 402Agree minus2805 0891 minus010 minus315 0002 minus455 minus106Strongly agree minus3885 0858 minus015 minus453 0 minus557 minus22
Like cycling (ref neithernor)Strongly disagree 06 1466 001 041 0682 minus228 348Disagree 0074 1058 0 007 0944 minus200 215Agree 3366 0824 014 408 0 175 498Strongly agree 3692 0888 017 416 0 195 543
Concerned about health (ref neithernor)Strongly disagree minus2225 0894 minus008 minus249 0013 minus398 minus047Disagree minus0025 0933 0 minus003 0978 minus186 181Agree 1196 0794 005 151 0133 minus036 276Strongly agree 1604 0861 006 186 0063 minus009 329
Perceive cycling as fast (ref neithernor)Strongly disagree minus2655 0935 minus010 minus284 0005 minus449 minus082Disagree minus1971 0993 minus006 minus198 0048 minus392 minus002Agree minus0095 0817 0 minus012 0907 minus17 151Strongly agree minus0462 0843 minus002 minus055 0584 minus212 119
Identify as a cyclist (ref neithernor)Strongly disagree minus0858 1522 minus002 minus056 0573 minus385 213Disagree 0641 1202 002 053 0594 minus172 3Agree 047 0998 002 047 0638 minus149 243Strongly agree 0332 0954 002 035 0728 minus154 220
Identify with PT (ref neithernor)Strongly disagree minus1384 1067 minus004 minus13 0195 minus348 071Disagree 0269 1022 001 026 0793 minus174 228Agree minus12 0926 minus005 minus13 0196 minus302 062Strongly agree minus0536 0833 minus003 minus064 0520 minus217 11
Identify as a driver (ref neithernor)Strongly disagree 1783 0873 009 204 0041 007 35Disagree 1884 0987 007 191 0057 minus005 382Agree 1282 1161 004 11 0270 minus1 356Strongly agree minus0072 1364 0 minus005 0958 minus275 261
Note All predictors were entered into the regression model simultaneouslyNagelkerke R2 047
A Andersson
that prevent people from cycling on the other hand Earlier studies demonstrated a clear difference between the attitudes of users thathave cycling experience and those of users that do not (Gatersleben and Uzzell 2007 Rondinella et al 2012 Fernaacutendez-Herediaet al 2014) Suggestions have been made to implement measures that enable people to experience cycling in daily life to increasetheir motivation to cycle (Broach et al 2012)
Regarding the statement lsquoPeople should be allowed to use their cars as much as they likersquo (the advocate private car use variable)the coefficients for lsquostrongly disagreersquo and lsquodisagreersquo are positive and those for lsquoagreersquo and lsquostrongly agreersquo are negative They are allsignificant and in accordance with the expected results For example Steg (2005) and Steg et al (2001) found a relationship betweenaffection for cars and the frequency of private car use People were also found to be unlikely to voluntarily change their behaviourunless they recognise the negative externalities produced by private car use (Tertoolen et al 1998) This finding is further reflectedin the identify as a driver variable in which strongly disagree significantly affects motivation positively Travel time to schoolwork isonly significant if it exceeds 60 min thus affecting the motivation to decrease private car use negatively Research has shown thatlong distances discourage commuters to use sustainable transportation (Heinen et al 2013) and that long trips are reasonablyassumed to be more challenging to influence because of fewer alternatives to promote than short trips
Usual commute mode is significant as using sustainable transport modes positively affect the motivation to decrease private car usecompared with driving This result is expected given the tendency people have in general to assimilate information that is consistentwith their behaviour and attitudes (Beale and Bonsall 2007 Whitmarsh 2011)
4 Demographic differences based on a precondition index of the significant variables
To understand how the significant variables of the motivation to decrease private car use are represented demographically in thesample an index was computed using the estimated coefficients from the multiple regression model Eight variables were includedclimate morality usual commute mode advocate private car use like cycling concerned about health perceive cycling as fastidentify as a driver and travel time The variables are presented in Table 4
The procedure to compute the precondition index has been explained in Section 23 With the results in Table 4 the formula canbe described as follows
= lowast minus lowast minus lowast + lowast
+ lowast + lowast + lowast minus lowast minus lowast
+ lowast + lowast minus lowast minus lowast
minus lowast + lowast
Precondition index (3248 mode_sust) (3314 travel_time) (7206 climate1) (2179 climate4)(4687 climate5) (2243 car_adv1) (2408 car_adv2) (2805 car_adv4) (3885 car_adv5)(3366 like_cycling4) 3692 like_cycling5) (2225 health1) (2655 cycling_fast1)(1971 cycling_fast2) (1783 id_driver1)
Based on the coefficient weights the scores ranged roughly from minus24 to 24 However in practice the scoring for the populationsample ranges from minus16 to 16 The latter range was deemed more useful to form categories for further analyses because it betterdescribed the real preconditions for the sample The range was equally divided into four categories with the lower range indicatingunfavourable preconditions the higher range indicating favourable preconditions and 0 indicating neither favourable nor un-favourable preconditions The scale of the index and the sample distribution are presented in Table 5
Several cross-tabulations were conducted between the precondition index and the demographic variables The results indicatethat men have significantly less favourable preconditions than females and that the respondents differ significantly concerning age(Table 6) The younger cohort has more favourable preconditions than the older cohort The categories within both relationship status
Table 4Variables used and their corresponding weights in the construction of a precondition index of motivation to decrease private car use
Predictor variables Significant categories Abbreviation Sig Weights
Usual commute mode PT bicycle walk mode_sust 0 3248
Travel time gt 60 min travel_time 0007 minus3314
Climate morality Strongly disagree climate1 0 minus7206Agree climate4 0005 2179Strongly agree climate5 0 4687
Advocate private car use Strongly disagree car_adv1 0016 2243Disagree car_adv2 0003 2408Agree car_adv4 0002 minus2805Strongly agree car_adv5 0 minus3885
Like cycling Agree like_cycling4 0 3366Strongly agree like_cycling5 0 3692
Concerned about health Strongly disagree health1 0013 minus2225
Perceive cycling as fast Strongly disagree cycling_fast1 0005 minus2655Disagree cycling_fast2 0048 minus1971
Identify as a driver Strongly disagree id_driver1 0041 1783
Note The reference categories and the non-significant categories were set to 0 in the aggregation of independent variables
A Andersson
and children at home are not significantly different indicating that the precondition index is similar across these demographicvariables The cross-tabulation between education and the precondition index shows a significant difference especially between themost educated (more than three years at a university) and the rest which indicates that higher education provides more favourableconditions compared to having a low education Unsurprisingly this result is also reflected in the occupation variable in whichstudents have significantly more favourable preconditions than employees and those off duty or on parental leave as students areusually young and on the verge of gaining higher education The results in Table 6 further indicate a significant difference inresidence with urban populations having more favourable preconditions than people in suburban towns and small villages
5 Stage of change and the precondition index
To further explore how the preconditions for motivation to decrease private car use are represented in relation to the stage ofbehaviour change a cross-tabulation including the stages from the TTM was performed with the precondition index The differencesbetween the stages were investigated using a one-way between-subjects ANOVA (post hoc test Tukeyrsquos HSD) Previous studies al-located respondents to each stage by asking them to choose one of five statements (Godin et al 2004) One objective is for therespondents to answer based on what they think will happen in the foreseeable future which is usually measured as the next sixmonths The following statements were constructed for this study
bull lsquoI use the car for the most part and do not intend to change the mode of transport within the next six monthsrsquo (pre-contemplation)
bull lsquoI am using the car for the most part but I am considering replacing some car journeys with other modes within the next sixmonthsrsquo (contemplation)
bull lsquoI am using the car for the most part but have begun trying other modes instead in the last six monthsrsquo (preparation)
bull lsquoFor the past six months I have only used the car as a complement to other means of transportrsquo (action)
bull lsquoFor the past six months I have only used other modes than carsrsquo (maintenance)
Contemplation and preparation are the stages in which individuals are ambivalent about their current behaviour thus makingthem more amenable to external influence (Forward 2014) Campaigners usually focus on these two stages because they constitute a
Table 5Scale and distribution of the precondition index (n = 848)
I II III IV
Index scale minus16 to minus8 minus799 to 0 001 to 8 801 to 16n 49 (6) 183 (22) 336 (40) 274 (32)
Table 6Cross-tabulation of the precondition index with the demographics (n = 848)
I () II () III () IV () n
Gender Male 7 23 43 27 435Female 4 20 37 39 415
Age 18ndash29 5 13 40 42 23230ndash50 6 23 37 33 39351ndash65 5 29 44 22 225
Relationship status Marriedin partnership 6 23 40 30 587Single 6 17 40 38 262
Children at home One or more 5 23 41 31 316No 6 21 39 34 534
Education Elementary school 8 36 34 22 110Upper secondary 9 24 39 29 218University lt 3 years 7 19 42 33 139University gt 3 years 3 18 41 38 383
Occupation Working 6 24 41 29 684Off dutyparental leave 7 30 47 17 25Studying 4 7 35 54 137
Residence Main city 4 19 40 37 575Town ge5000 residents 9 25 36 30 120Town lt5000 residents 9 29 43 20 154
Statistically significant differences within the variables examined using the Pearson chi-square test p lt 0001 p lt 001
A Andersson
more feasible target group than those not interested in the new behaviour (pre-contemplators) and those already practising thedesired behaviour to some extent (action and maintenance) Note that the contemplation and preparation groups are usually rela-tively small In this population sample they constitute 14 of the total as shown in Table 7 As the sample sizes are not equallydistributed on the TTM stages a Levenes test was conducted to determine whether the data meet the homogeneity of varianceassumption The test confirmed the null hypothesis (sig = 0559) that all the stages have similar population variances
Fig 1 shows the interaction between the TTM stages and the precondition index The preconditions for the motivation to decreaseprivate car use become more favourable proceeding to the later stages in TTM Particularly pre-contemplators have worse pre-conditions than all the other segments (significance tests are presented in Table 8) Conversely the respondents in the maintenancestage have significantly better preconditions The preconditions are increasingly more favourable moving from contemplation topreparation and from preparation to action
The highest threshold for favourable preconditions seems to be between the pre-contemplation stage and the contemplation stageThis supports the strategy of targeting those in the contemplation and preparation stages as they would likely be more susceptible toincentives and other mechanisms promoting behaviour change Even if the pre-contemplators have a substantial share of the fa-vourable preconditions (55 in category III and IV) they are significantly less likely to respond positively to such mechanisms whichis a paramount challenge for policy-makers because this group carries out the majority of the car passenger kilometres (SmidfeltRosqvist and Winslott Hiselius 2018) Therefore although mobility management campaigns can be successful in promoting in-dividual and incremental behavioural changes this strategy will probably be insufficient to influence lsquopersistent driversrsquo as long asthe conditions for this groups motivation are unfavourable (Barr 2018) Nevertheless previous studies showed a highly unequaldistribution of emissions among the population which is especially evident in transport (Brand and Boardman 2008 Brand andPreston 2010 Ko et al 2011) stressing the need for segmented policies targeting the lsquohigh emittersrsquo (Anable et al 1997 WinslottHiselius and Smidfelt Rosqvist 2018)
To understand which factors are suppressing the motivation to decrease private car use for the pre-contemplation segment anadditional regression analysis was conducted using the same variables as in the earlier model but only including the pre-con-templation segment The results are presented in Table 9 The variables that are strictly non-significant (ie variables without anysignificant category) are excluded from the table
The results provide a deeper understanding of the factors affecting the motivation to decrease private car use for pre-con-templators most of which are similar to those in the first regression model Therefore the focus is to highlight a few differencesbetween the two models
Notably climate morality seems to be the most influential variable in the second model Agreeing strongly with having a moral
Table 7Frequencies distributed on the TTM stages (n = 848)
Pre-contemplation Contemplation Preparation Action Maintenance
n () 355 101 37 315 192
0
10
20
30
40
50
60
70
I II III IV
Shar
e of
TTM
stag
e
Pre-contemplation
Contemplation
Preparation
Action
Maintenace
Unfavourable Favourable Preconditions for motivation to decrease private car use
Fig 1 Cross-tabulation of the precondition index and the TTM stages (n = 848)
A Andersson
obligation to decrease onersquos carbon emissions is significant and increases the probability to be motivated to reduce private car use Bycontrast strongly disagreeing with the statement lowers the likelihood and is also significant Further (strongly) agreeing to thestatement that people should be allowed to drive their car as much as they like is significant and negatively affects the motivation todecrease private car use Unlike the first regression model (strongly) disagreeing is not significant In the second model usualcommute mode and travel time are not significant This result may be due to the overall higher commute habit by car and the smallsample size
Consequently among the independent variables included in the model the most important precondition for motivating lsquopersistentdriversrsquo to reduce their private car use seems to be an enhanced moral concern about climate change and how it relates to driving acar The results suggest that the view that people should be allowed to drive their car as much as they want needs to be problematisedand linked to social norms related to car identity which would have to be replaced by alternative identities consistent with asustainable lifestyle Further increasing the attractiveness of cycling and promoting it as a healthy modal choice seems to be crucialto establishing favourable preconditions that motivate lsquopersistent driversrsquo to reduce their private car use
Table 8Significant differences (p lt 005) in the preconditions between the TTM stages analysed using a one-way between-subjects ANOVA followed by apost hoc test (Tukeyrsquos HSD)
I II III IV
a Pre-contemplationbcde 91 376 45 84b Contemplationade 71 212 447 271c Preparationae 63 125 50 313d Actionabe 34 143 389 434e Maintenaceabcd 31 68 278 623
Table 9Multiple regression model including only the pre-contemplation segment (n = 299) Dependent variable motivation to decrease private car use
95 CI
B SE Beta t Sig Lower Upper
Constant 61692 102 605 0 416 8179AttitudesHave climate morality (ref neithernor)
Strongly disagree minus9947 1841 minus03 minus54 0 minus1357 minus632Disagree minus2283 1584 minus008 minus144 0151 minus54 084Agree 2434 1381 01 176 0079 minus029 515Strongly agree 497 1626 017 306 0002 177 817
Advocate private car use (ref neithernor)Strongly disagree minus0026 2591 0 minus001 0992 minus513 508Disagree 1601 1735 005 092 0357 minus182 502Agree minus4553 1431 minus018 minus318 0002 minus737 minus173Strongly agree minus5736 1406 minus025 minus408 0 minus851 minus297
Like cycling (ref neithernor)Strongly disagree 0936 2414 002 039 0698 minus382 569Disagree 1821 1641 006 111 0268 minus141 505Agree 4793 1446 020 332 0001 195 764Strongly agree 488 1626 019 3 0003 168 808
Concerned about health (ref neithernor)Strongly disagree minus4685 1791 minus015 minus262 0009 minus821 minus116Disagree minus0334 1628 minus001 minus021 0838 minus354 287Agree 0068 1371 0 005 096 minus263 277Strongly agree 1955 1588 007 123 0219 minus117 508
Perceive cycling as fast (ref neithernor)Strongly disagree minus1702 151 minus007 minus113 0261 minus468 127Disagree minus3418 159 minus012 minus215 0032 minus655 minus029Agree 1136 1678 004 068 0499 minus217 444Strongly agree minus2984 1689 minus01 minus177 0078 minus631 034
Identify as a driver (ref neithernor)Strongly disagree 3348 1432 014 234 002 053 617Disagree 1865 1563 007 119 0234 minus121 494Agree minus0066 1708 0 minus004 0969 minus343 33Strongly agree 2556 1807 008 141 0159 minus100 612
Note All predictors were entered into the regression model simultaneouslyNagelkerke R2 0513
A Andersson
6 Discussion and conclusion
This study contributes to the body of transportation research that focuses on soft measures for promoting sustainable transport Byanalysing the outcomes of communication efforts usually found in Swedish mobility management campaigns climate morality isfound to be the most important factor affecting the motivation to decrease private car use Usual commute mode car advocacyhealth concern attitudes towards cycling car identity and travel time are also significant factors affecting the motivation to decreaseprivate car use Indexing these factors according to their respective regression coefficients and having them interact with the de-mographic variables reveal differences between the population segments in terms of preconditions for the motivation to reduceprivate car use In particular males the middle-aged people with low educational attainment and rural residents have the leastfavourable prerequisites concerning the factors mentioned above Additional interaction analysis of the stages drawn from the TTMreveals that individuals who have proceeded from the pre-contemplation-stage adapt preconditions that align with those of the actionand maintenance stages Therefore mobility management campaigns can advantageously target such segments to pick the low-hanging fruit Indeed some progress has been made in the design of campaigns that successfully encourage people to reduce drivingin favour of public transport (Fujii and Taniguchi 2006 Thoslashgersen 2009) However the challenge remains in communicating theneed for reduced car traffic to lsquopersistent driversrsquo (Innocenti et al 2013 Lattarulo et al 2018) In this study a separate modelling ofthe pre-contemplation segment reveals climate morality to be even more influential than that for the general sample Therefore away forward for policymakers could be amongst other interventions to communicate the issue of climate change more strategicallyto lsquopersistent driversrsquo to create favourable preconditions for this segment
Simply communicating the need to reduce private car use to drivers who are not concerned about their current travel behaviour islikely to be unsuccessful as found in many studies (eg Beale and Bonsall 2007 Innocenti et al 2013 Lattarulo et al 2018)Nevertheless the demand for private car use needs to be curved across society if climate targets are to be met Therefore preaching tothe converted is not sufficient without simultaneously targeting consumers who have a higher usage of private cars By focusing onthe preconditions for the motivation to reduce driving campaigners can approach lsquopersistent driversrsquo and those in doubt of theirmobility choice Therefore new communication strategies are needed to facilitate persuasive information that is consistent with thevalues and worldviews of lsquopersistent driversrsquo A point of departure for such communication is to increase public awareness of thelinkage between private car use and climate change (Martin et al 2014) health issues caused by sedentary behaviour pollution andnoise (Nisbet and Gick 2008) and the benefits of cycling (Broach et al 2012 Fernaacutendez-Heredia et al 2014) To align messageswith different value constructs they can be framed around various issues (Whitmarsh 2011) such as energy security technologicalinnovation welfare compassion future generations and justice Research suggests that such communication needs to be constructiveand motivating morally logic or supported by moral reasoning include common societal goals and highlight benefits that aretangible here and now (Hulme 2009) One example is the work of Daziano et al (2017) who showed that CO2 emission informationrelated to social goal contextualisation is far more persuasive than just presenting the grams per mile
Recently Bloomberg reported that domestic and international airline travel from Swedish airports had its weakest overall growthin passenger numbers in a decade (Hoikkala and Magnusson 2019) This result coincides with the high number of hazardouswildfires that fuelled the debate and public concern about climate change among Swedes in 2018 The events have led to a new socialnorm related to flying and generated the new expression lsquoflying shamersquo which refers to the shame people feel when they fly due tothe significant CO2 emissions associated with flying (Hoikkala and Magnusson 2019) According to a survey by the World WildlifeFund 23 of Swedes have abstained from travelling by air in the past year to reduce their climate impact 6 more than a yearearlier (WWF 2019) Some 18 of Swedes have chosen to travel by train rather than air This phenomenon needs to be investigatedbefore any conclusion can be drawn from a possible causal relationship between climate concern and restraints from flying Forexample a meta-analysis by Lanzini and Khan (2017) showed that environmental variables predict behavioural intentions but notactual travel behaviours Nevertheless it raises interesting questions on the potential of a growing pro-environmental social norm aspart of the urgent transition towards a low-carbon transport system If the negative environmental effects of driving can be made astangible to the public as flying is today can lsquodriving shamersquo be the social norm of tomorrow
This study has some limitations Stated preferences were used to collect data on individualsrsquo travel behaviour accessibilitydemographics and motivation to decrease private car use when exposed to marketing messages Revealed preferences or a combi-nation of stated and revealed preferences are preferred to validate the responses However stated preferences are a reasonablyaccurate guide to the real underlying preferences and market behaviour (Wardman 1988 Loureiro et al 2003 Lambooij et al2015) The scope of the study was limited to Sweden and more research is needed to investigate whether the results can be gen-eralised to other geographical contexts Finally a limited set of variables had to be used to explain the outcome of the dependentvariable (R2 score asymp 050 for both models) An increased scope could have shed light on the additional variables affecting themotivation to reduce private car use such as social norms perceived behavioural control and other contextual factors
CRediT authorship contribution statement
Alfred Andersson Conceptualization Methodology Formal analysis Resources Writing - original draft Writing - review ampediting
Acknowledgements
The author would like to thank the Trygg-Hansa Research FoundationN03 for their financial support for conducting the survey
A Andersson
which provided valuable data I would also like to acknowledge the people who participated in the survey Finally I would like tothank the two anonymous reviewers for their constructive comments and suggestions which were a great help in improving themanuscript
Declaration of Competing Interest
The author declares no conflicts of interest in this article
Appendix A
Survey questionnaire (n = 1500)
Questionstatement Variable name Scale
Do you have a driving license Driving license yes noDo you have access to at least one bicycle or
e-bikeAccess to a bicycle yes no
Do you live within 500 m of a public trans-port station
Live within 500 m toPT-station
yes no
Do you own or have access to a car for co-mmuting
Access to a car yes no
What mode of transport do you usually useto go to schoolwork
Usual commute mode car public transport bicycle walk other
How long is your travel time from home toschoolwork
Travel time Less than 10 min 10ndash20 min 21ndash30 min 31ndash45 min 46ndash60 min more than 60 min
What statement best describes how you tra-vel in everyday life
TTM lsquoI use the car for the most part and do not intend to change the mode of transport withinthe next six monthsrsquolsquoI am using the car for the most part but I am considering replacing some car journeys withother modes within the next six monthsrsquolsquoI am using the car for the most part but have begun trying other modes instead the last sixmonthsrsquolsquoFor the past six months I have only used the car as a complement to other means oftransportrsquolsquoFor the past six months I have only used other modes than carsrsquo
I am the kind of person who rides a bicycle Identify as cyclist strongly disagree disagree neithernor agree strongly agreeI feel I should cycle more to stay fit Concerned about
healthCycling can be the quickest way to get aro-
undPerceive cycling asfast
I like riding a bicycle Like cyclingDriving a car is part of my identity Identify as a driverI am the kind of person who uses public tr-
ansportIdentify with a PT
I feel a moral obligation to reduce my gree-nhouse gas emissions
Climate morality
People should be allowed to use their cars asmuch as they like
Advocate private caruse
Excluding demographic questions concerning age gender education occupation residential location relationship status and children which werealso asked in the survey
References
Abrahamse W et al 2009 Factors influencing car use for commuting and the intention to reduce it a question of self-interest or morality Transp Res Part F TrafficPsychol Behav 12 (4) 317ndash324
Anable J Boardman B Root A 1997 Travel Emission Profiles a tool for strategy development and driver adviceAnable J Wright S 2013 Work Package 7 Golden Questions and Social Marketing Guidance ReportAvineri E Waygood EO 2013 Applying valence framing to enhance the effect of information on transport-related carbon dioxide emissions Transp Res Part A
Policy Pract 48 31ndash38Banister D 2008 The sustainable mobility paradigm Transp Policy 15 (2) 73ndash80Barr S 2018 Personal mobility and climate change Wiley Interdiscip Rev Clim Change 9 (5) 1ndash19Beale JR Bonsall PW 2007 Marketing in the bus industry a psychological interpretation of some attitudinal and behavioural outcomes Transp Res Part F
Traffic Psychol Behav 10 (4) 271ndash287Beiratildeo G Sarsfield Cabral JA 2007 Understanding attitudes towards public transport and private car a qualitative study Transp Policy 14 (6) 478ndash489Bolderdijk JW et al 2013 Comparing the effectiveness of monetary versus moral motives in environmental campaigning Nat Clim Change 3 (4) 413ndash416Brand C Boardman B 2008 Taming of the few-The unequal distribution of greenhouse gas emissions from personal travel in the UK Energy Policy 36 (1) 224ndash238Brand C Preston JM 2010 rsquo60-20 emissionrsquo-The unequal distribution of greenhouse gas emissions from personal non-business travel in the UK Transp Policy 17
(1) 9ndash19Broach J Dill J Gliebe J 2012 Where do cyclists ride A route choice model developed with revealed preference GPS data Transp Res Part A Policyand Pract
A Andersson
46 (10) 1730ndash1740Cohen-Blankshtain G 2008 Framing transport-environmental policy The case of company car taxation in Israel Transp Res Part D Transp Environ 13 (2) 65ndash74Cook D Weisberg S 1982 Residuals and Influence in Regression (Monographs on Statistics and Applied Probability)Damant-Sirois G El-Geneidy AM 2015 Who cycles more Determining cycling frequency through a segmentation approach in Montreal Canada Transp Res Part
A Policyand Pract 77 113ndash125Daziano RA et al 2017 Increasing the influence of CO2 emissions information on car purchase J Cleaner Prod 164 861ndash871Fernaacutendez-Heredia Aacute Monzoacuten A Jara-Diacuteaz S 2014 Understanding cyclistsrsquo perceptions keys for a successful bicycle promotion Transp Res Part A Policyand
Pract 63 1ndash11Festinger L 1957 A Theory of Cognitive Dissonance Stanford University PressField A 2013 Discovering Statistics using IBM SPSS Statistics - And sex and drugs and rock lsquonrsquo roll fourth ed SAGE Publications Ltd Los Angeles London New Delhi
Singapore Washington DCForward SE 2014 Exploring peoplersquos willingness to bike using a combination of the theory of planned behavioural and the transtheoretical model Revue Europeene
de Psychologie Appliquee 64 (3) 151ndash159Freer D Henderson P Cubie A 2010 324000 People CanrsquoT Be Wrong Evaluating the WorldrsquoS Largest Individualised Marketing Project In Australasian Transport
Research Forum (ATRF) 33rd 2010 Canberra ACT Australia [Online] Available from httpstridtrborgview1096932Friman M Huck J Olsson LE 2017 Transtheoretical model of change during travel behavior interventions an integrative review Int J Environ Res Public
Health 14 (6) 1ndash15Fujii S Taniguchi A 2006 Determinants of the effectiveness of travel feedback programs-a review of communicative mobility management measures for changing
travel behaviour in Japan Transp Policy 13 (5) 339ndash348Gatersleben B Appleton KM 2007 Contemplating cycling to work attitudes and perceptions in different stages of change Transp Res Part A Policyand Pract 41
(4) 302ndash312Gatersleben B Uzzell D 2007 Affective appraisals of the daily commute comparing perceptions of drivers cyclists walkers and users of public transport Environ
Behav 39 (3) 416ndash431Godin G et al 2004 Stages of motivational readiness for physical activity a comparison of different algorithms of classification Brit J Health Psychol 9 (2)
253ndash267Goumlssling S Cohen S 2014 Why sustainable transport policies will fail EU climate policy in the light of transport taboos J Transp Geogr 39 197ndash207Handy SL Xing Y 2011 Factors correlated with bicycle commuting a study in six small US cities Int J Sustain Transp 5 (2) 91ndash110Heinen E Maat K van Wee B 2013 The effect of work-related factors on the bicycle commute mode choice in the Netherlands Transportation 40 (1) 23ndash43Hess DB Bitterman A 2016 Branding and selling public transit in North America an analysis of recent messages and methods Res Transp Bus Manage 18
49ndash56Hiselius LW Rosqvist LS 2015 Mobility Management campaigns as part of the transition towards changing social norms on sustainable travel behavior J Cleaner
Prod 123 1ndash8Hoen A Geurs KT 2011 The influence of positionality in car-purchasing behaviour on the downsizing of new cars Transp Res Part D Transp Environ 16 (5)
402ndash408Hoikkala H Magnusson N 2019 As lsquoFlying Shamersquo Grips Sweden SAS Ups Stakes in Climate Battle [Online] Bloomberg News Available from httpswww
bloombergcomnewsarticles2019-04-14as-flying-shame-grips-sweden-sas-ups-stakes-in-climate-battle [Accessed 240419]Hulme M 2009 Why We Disagree About Climate Change Understanding Controversy Inaction and Opportunity Cambridge University Press CambridgeHyman MR Sierra JJ 2012 Adjusting self-reported attitudinal data for mischievous respondents Int J Mark Res 54 (1) 129ndash145IEA 2018 CO₂ Emissions From Fuel Combustion 2018Innocenti A Lattarulo P Pazienza MG 2013 Car stickiness heuristics and biases in travel choice Transp Policy 25 158ndash168Jia N et al 2018 Influence of attitudinal and low-carbon factors on behavioral intention of commuting mode choice ndash A cross-city study in China Transp Res Part
A Policyand Pract 111 (March) 108ndash118Ko J et al 2011 Who produces the most CO2 emissions for trips in the Seoul metropolis area Transp Res Part D Transp Environ 16 (5) 358ndash364Lambooij MS et al 2015 Consistency between stated and revealed preferences a discrete choice experiment and a behavioural experiment on vaccination
behaviour compared BMC Med Res Method 15 (19) 1ndash8Lanzini P Khan SA 2017 Shedding light on the psychological and behavioral determinants of travel mode choice a meta-analysis Transp Res Part F Traffic
Psychol Behav 48 13ndash27Lattarulo P Masucci V Pazienza MG 2018 Resistance to change car use and routines Transport Policy 74 (November 2018) 63ndash72Loureiro A Veloso S 2017 Handbook of Environmental Psychology and Quality of Life Research (August 2017) [Online] Available from doiorg101007978-3-
319-31416-7Loureiro ML McCluskey JJ Mittelhammer RC 2003 Are stated preferences good predictors of market behavior Land Econ 79 (1) 44ndash45Martin E et al 2014 Evaluating the public perception of a feebate policy in California through the estimation and cross-validation of an ordinal regression model
Transp Policy 33 144ndash153Matteo Mazziotta AP 2013 Methods for constructing composite indices one for all or all for one Italian Rev Econ Demogr Stat 67 (2) 67ndash80Meyers LS Glenn CG Guarino AJ 2013 Performing Data Analysis Using IBM SPSS John Wiley amp Sons IncorporatedMir HM et al 2016 The impact of outcome framing and psychological distance of air pollution consequences on transportation mode choice Transp Res Part D
Transp Environ 46 328ndash338Nisbet EKL Gick ML 2008 Can health psychology help the planet Applying theory and models of health behaviour to environmental actions Canadian Psychol
49 (4) 296ndash303Paacuteez A Whalen K 2010 Enjoyment of commute a comparison of different transportation modes Transp Res Part A Policyand Pract 44 (7) 537ndash549Polk M 2003 Are women potentially more accommodating than men to a sustainable transportation system in Sweden Transp Res Part D Transp Environ 8 (2)
75ndash95Prochaska JO Diclemente CC 1986 Toward a comprehensive model of change In Miller WR Heather N (Eds) Treating Addictive Behaviors Processes of
Change Springer US Boston MA pp 3ndash27Rondinella G Fernandez-Heredia A Monzoacuten A 2012 Analysis of perceptions of utilitarian cycling by level of user experience In Proceedings of Transport
Research Board Annual Meeting Washington DCSmidfelt Rosqvist L Winslott Hiselius L 2018 Understanding high car use in relation to policy measures based on Swedish data Case Stud Transport Policy
httpsdoiorg101016jcstp201811004Steg L 2005 Car use Lust and must Instrumental symbolic and affective motives for car use Transp Res Part A Policy and Pract 39 (3 SPEC ISS) 147ndash162Steg L Tertoolen G 1999 Sustainable transport policy the contribution from behavioural scientists Public Money Manage 19 (1) 63ndash69Steg L Vlek C Slotegraaf G 2001 Instrumental-reasoned and symbolic-affective motives for using a motor car Transp Res Part F Traffic Psychol Behav 4 (3)
151ndash169Steinhorst J Kloumlckner CA 2017 Effects of monetary versus environmental information framing implications for long-term pro-environmental behavior and
intrinsic motivation Environ Behav 1ndash35Svensk cycling 2018 Cykeltrendrapport (Bicycling trend report) Svensk cykling (Swedish cycling)Swedish Association of Local Authorities and Regions 2016 Classification of Swedish municipalities 2017 Available from httpssklsedownload18
6b78741215a632d39cbcc851487772640274Classification of Swedish Municipalities 2017pdf [Accessed 260618]Swedish EPA 2018 Analysis of Swedish Climate Statistics 2018Swedish Transport Administration 2019 Transport sector emissions Available from httpswwwtrafikverketsefor-dig-i-branschenmiljomdashfor-dig-i-branschen
A Andersson
energi-och-klimatKlimatbarometer [Accessed 170419]Taniguchi A et al 2003 Psychological and behavioral effects of travel feedback program for travel behavior modification Transp Res Rec 1839 (03ndash3711)
182ndash190Tertoolen G Van Kreveld D Verstraten B 1998 Psychological resistance against attempts to reduce private car use Transp Res Part A Policy and Pract 32 (3)
171ndash181Thoslashgersen J 2009 Promoting public transport as a subscription service effects of a free month travel card Transp Policy 16 (6) 335ndash343Thoslashgersen J 2018 Transport-related lifestyle and environmentally-friendly travel mode choices a multi-level approach Transp Res Part A Policy and Pract 107
November 2017 166ndash186Transport Analysis 2018 Fordon 2018 [Cars 2018] by Trafikanalys (Transport Analysis)Transport Analysis 2015 RVU Sverige 2011-2014 [national travel survey 2011-2014] by Trafikanalys (Transport Analysis)Wardman M 1988 A comparison of revealed preference and stated preference models of travel behaviour J Transport Econ PolicyWaygood EO Avineri E Lyons G 2012 The role of information in reducing the impacts of climate change for transport applications In Ryley T Chapman L
(Eds) Transport and Climate Change pp 313ndash340Waygood EOD Avineri E 2018 CO2 valence framing is it really any different from just giving the amounts Transp Res Part D Transp Environ 63 718ndash732Whitmarsh L 2011 Scepticism and uncertainty about climate change dimensions determinants and change over time Global Environ Change 21 690ndash700Winslott Hiselius L Smidfelt Rosqvist L 2018 Segmentation of the current levels of passenger mileage by car in the light of sustainability targets ndash The Swedish
case J Cleaner Prod 182 331ndash337WWF 2019 WWFs Klimatbarometer Allt fler vaumlljer bort flyg och koumltt ndash och kvinnorna garingr foumlre Available from httpswwwwwfsepressmeddelandewwfs-
klimatbarometer-allt-fler-valjer-bort-flyg-och-kott-och-kvinnorna-gar-fore-3241404 [Accessed 250419]
A Andersson
ldquo
rdquo
ndash
rsquo rsquo
ndash
rsquo
rsquo
uml
journal homepage wwwelseviercomlocatetrd
Paper V
uml
uml
uml
uml
uml
journal homepage wwwelseviercomlocatetrd
rsquo
oslash
oslash
uml
rsquo
oslash
oslash
ndash
oslash
ndash ndash
ndash ndash
ndash
ndash
oslash
uml
rsquo
uml
uml
rsquo
ndash
uml
uml
ndash
rsquo
= =
lt
gelt
uml
uml
rsquo uml uml rsquo
rsquo
rsquo
ndash ndash ndash ndash ndash
uml
ndash
= ndash
= ndash rsquo
= ndash
rsquo
lt
lt
lt
uml
ndash
rsquo
rsquo
rsquo
lt
lt
lt
= =
uml
84
33
51
32
18
77
0
20
40
60
80
100
rsquo
= =
lt
lt
0 10 20 30 40 50 60
Expensive to buyHeavy bike
Technical issues with bikeTime consuming comp to a car
Risk of theftCarrying heavy battery
Errands with goodsBad weather
Save moneyWellbeing
No congestioneasier to parkFastsave time
PleasantfunFresh air
Good for the environmentExercisehealth
Easyconvenient
Positive
Negative
uml
uml
rsquo
rsquo
uml
rsquo
oslash
uml
uml
uml uml
uml
uml
ndash
ndash
ndash
ndash
`
ndash
ndash
ndash
ndash
ndash
ndash
uml uml
ndash
uml
ndash
oslash mdash rsquo
ndash
oslash
ndash
oslash ndash
ndash
uml
ndash
ndash
ndash
ldquo rdquo rsquo
ndash
uml
ndash
ndash
ˆ ndash
uml
ndash
oslash oslash mdash
ndash
ndash
ndash
ndash ndash
ndash
uml
- Blank Page
- Blank Page
- Blank Page
- Blank Page
-


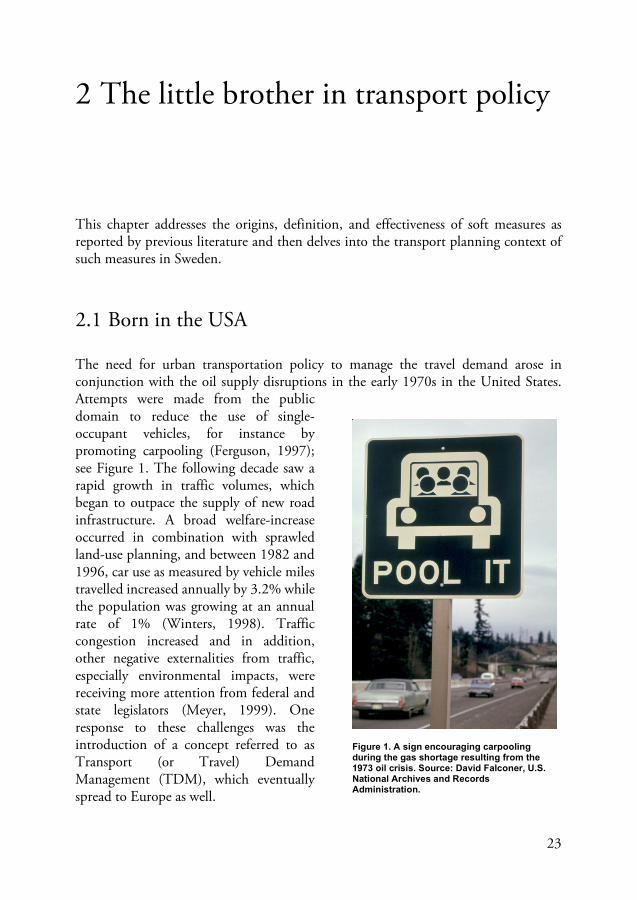

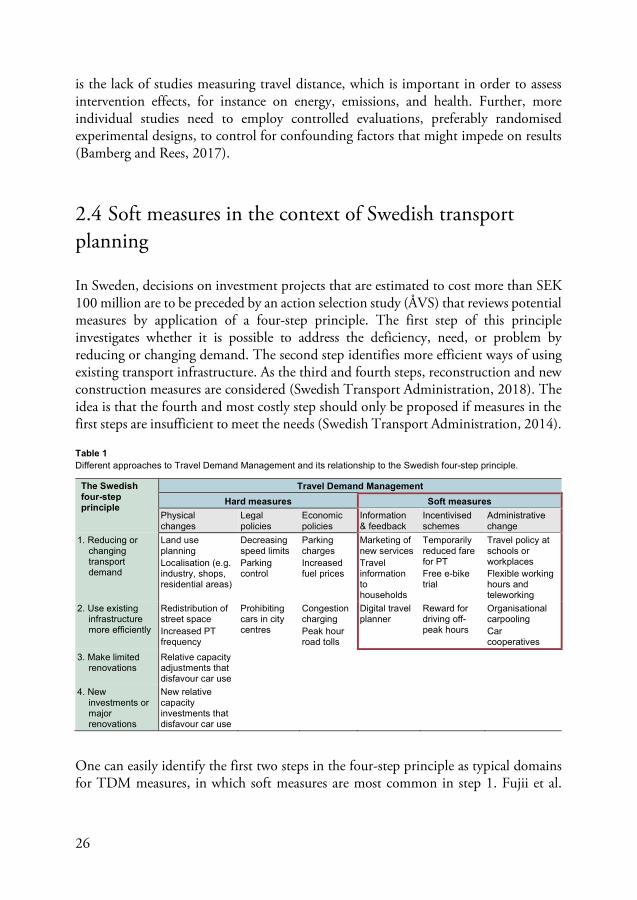

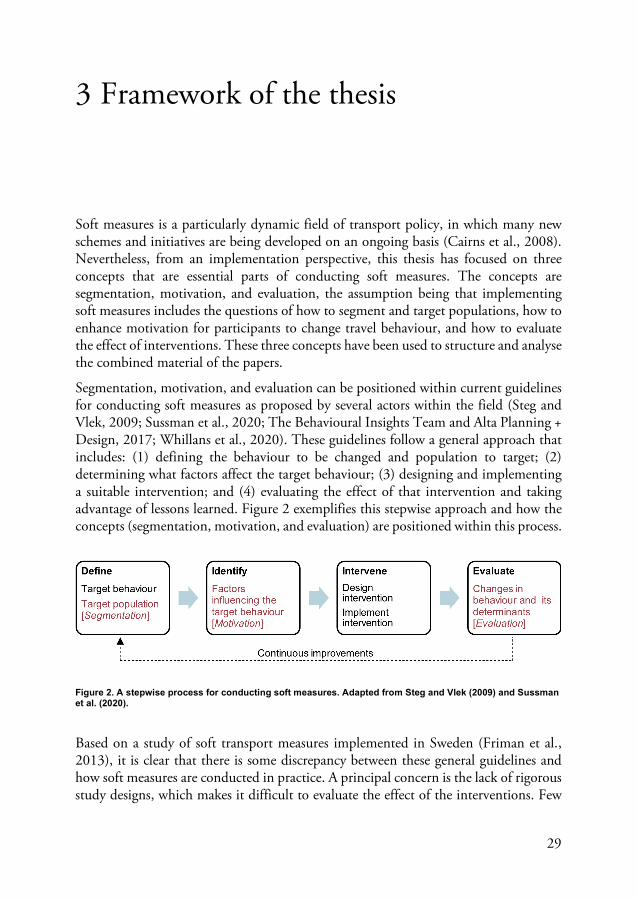
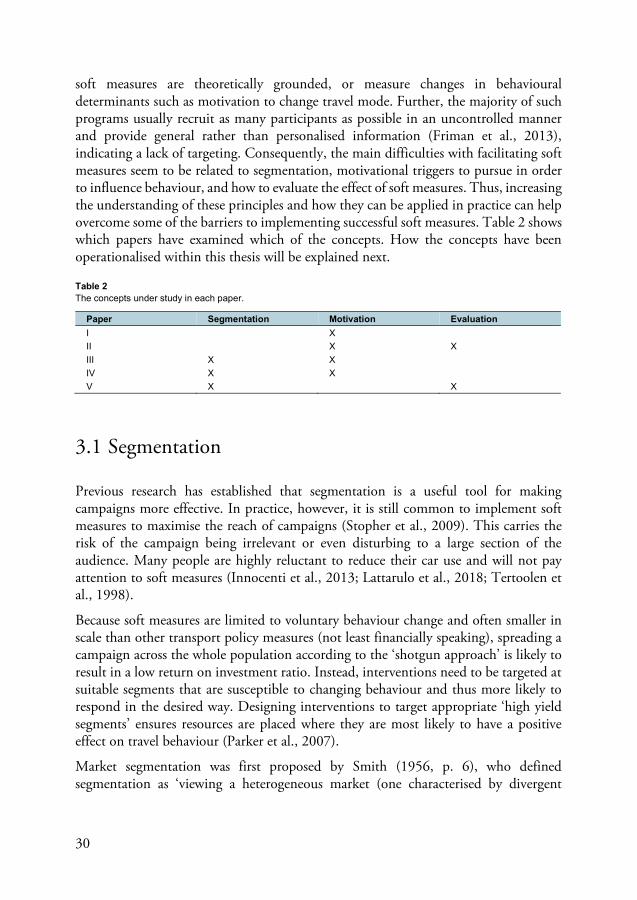
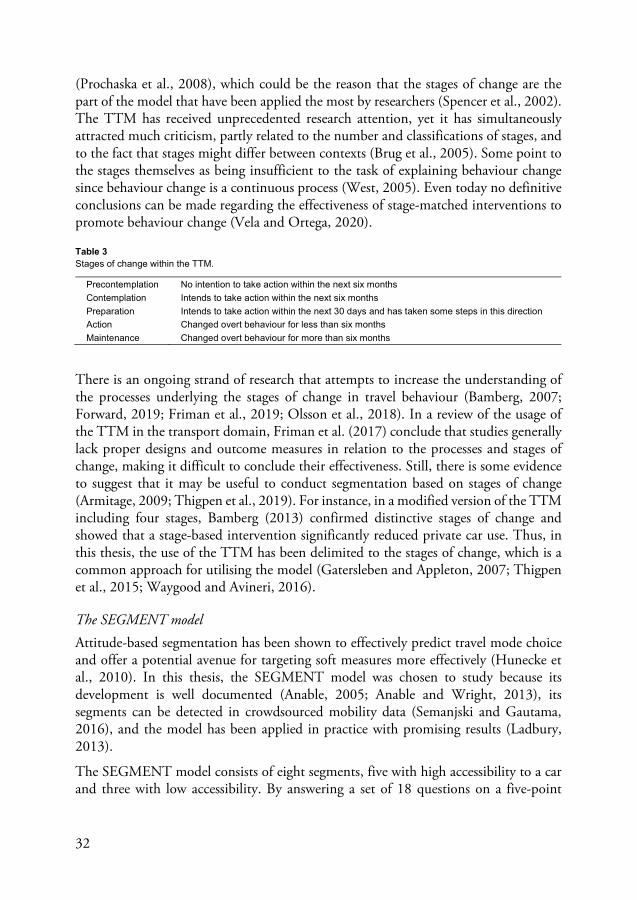
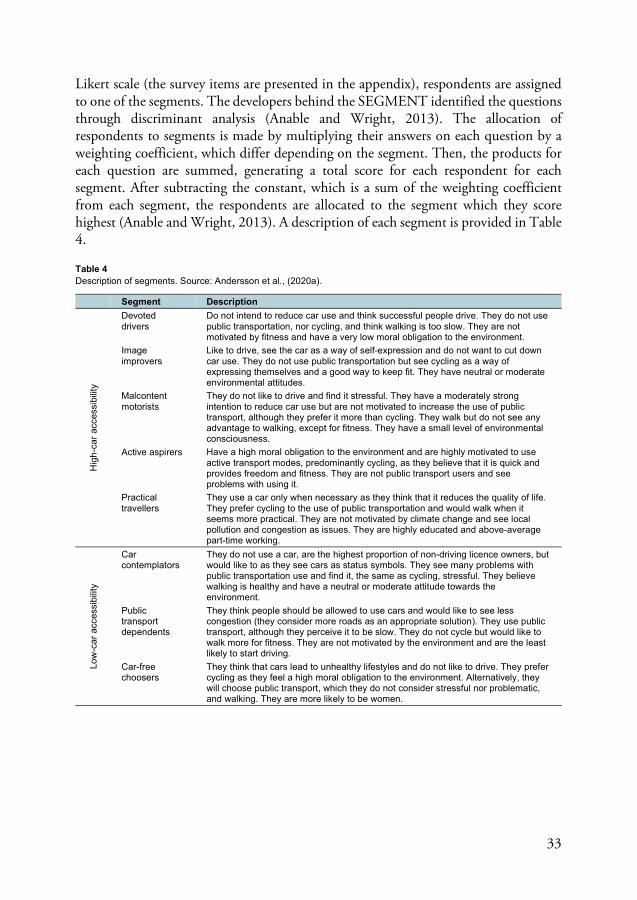

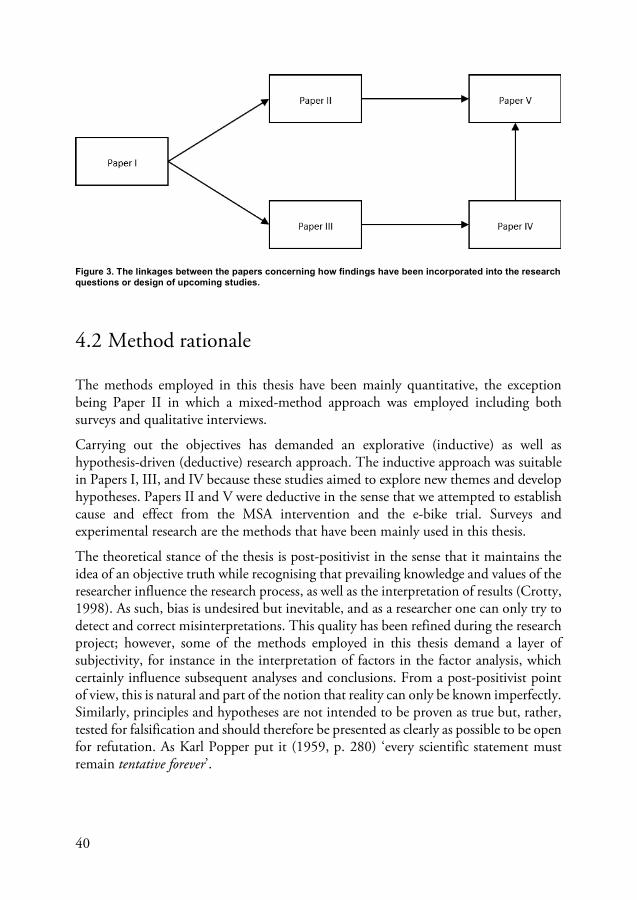
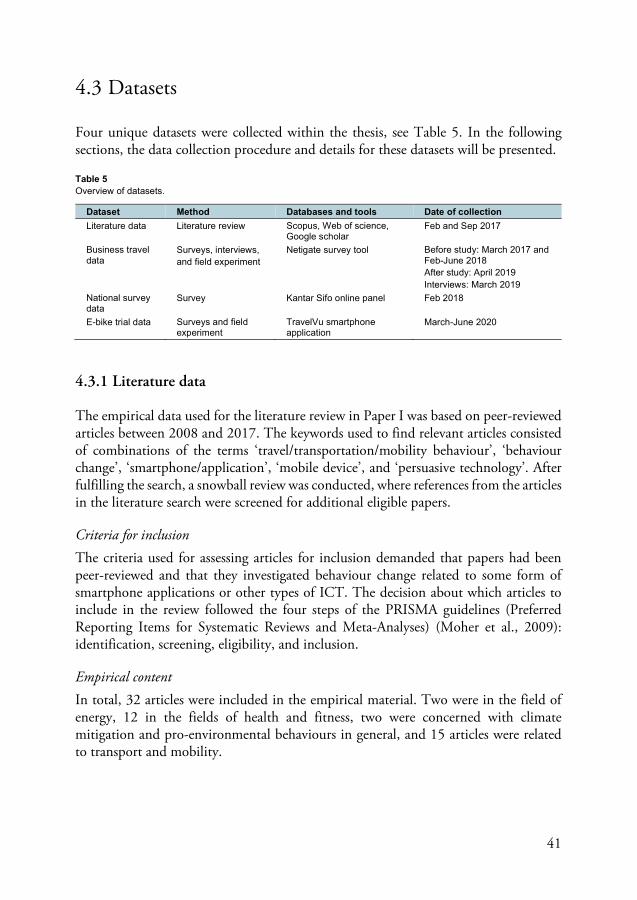
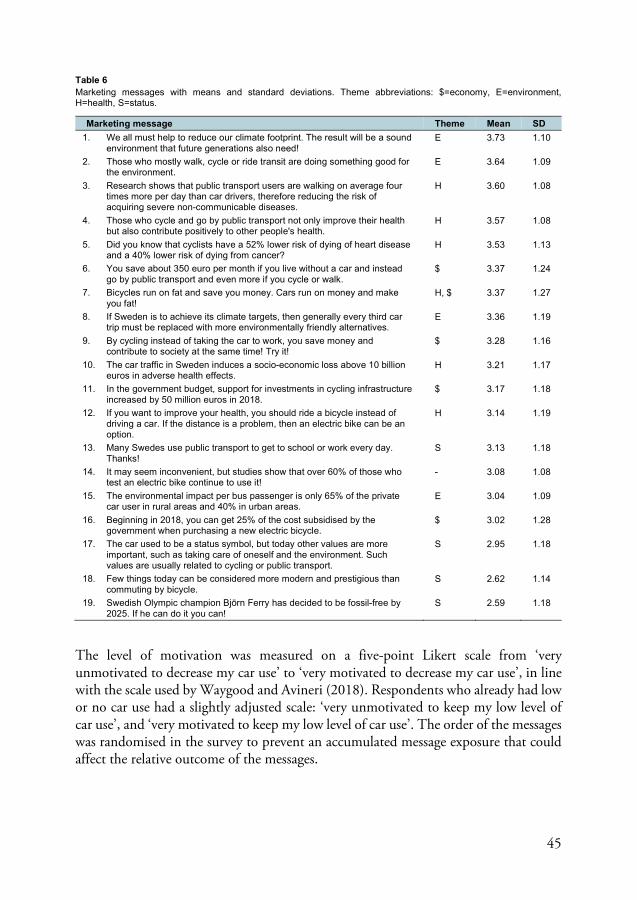
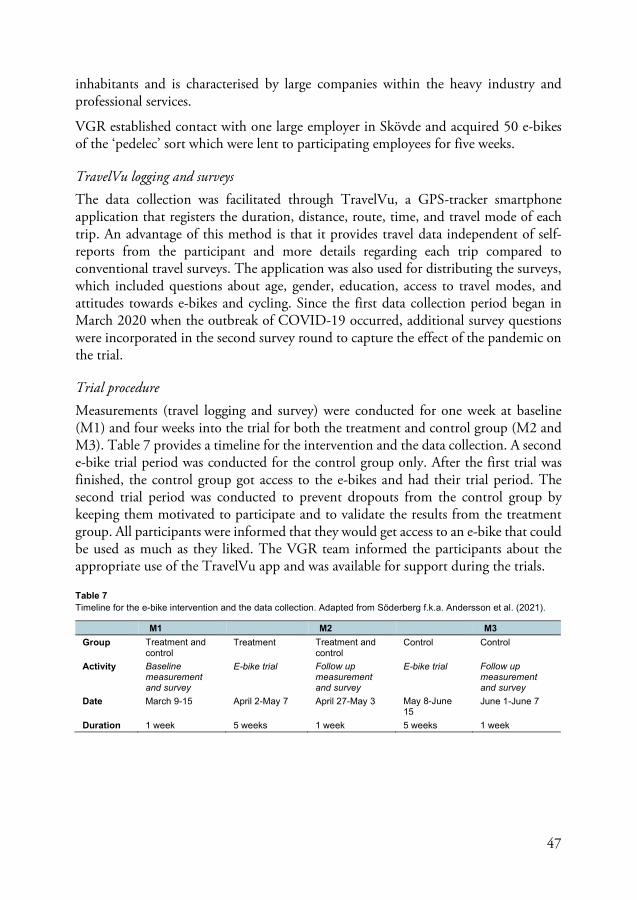

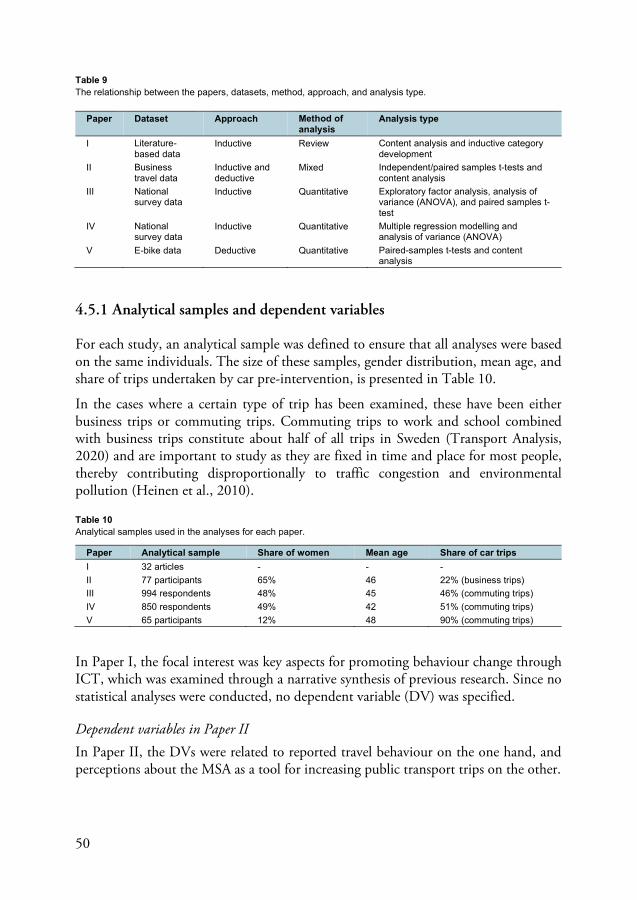

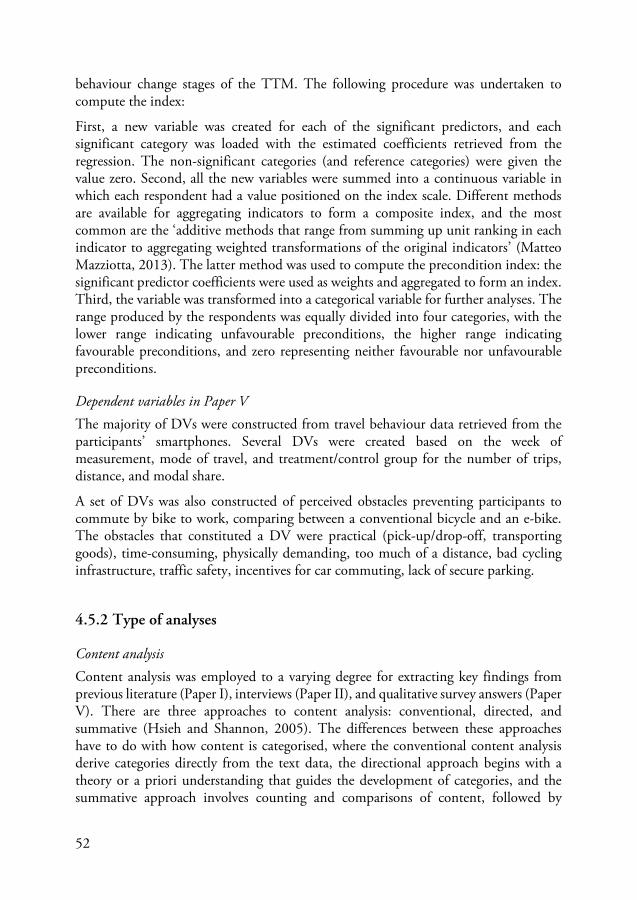

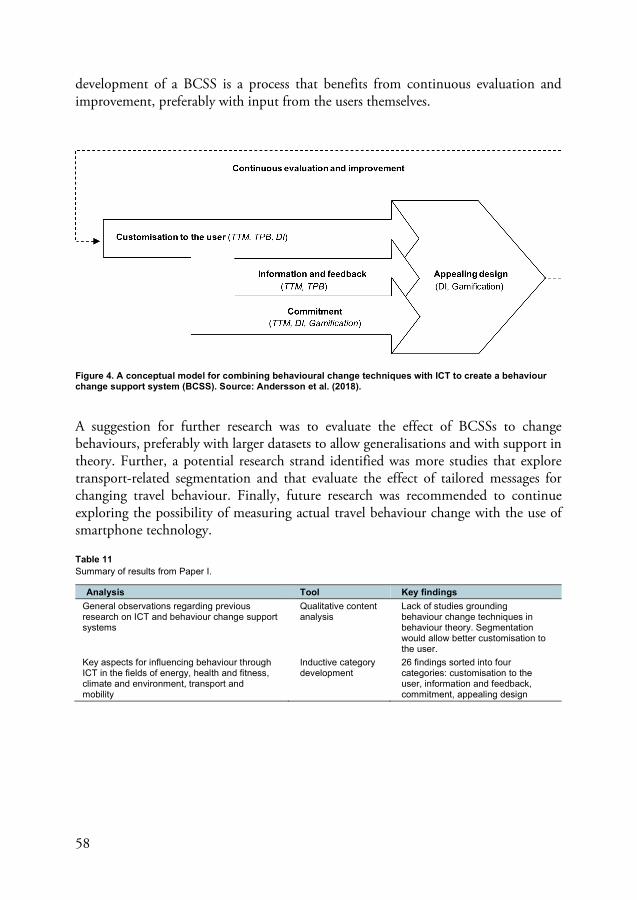
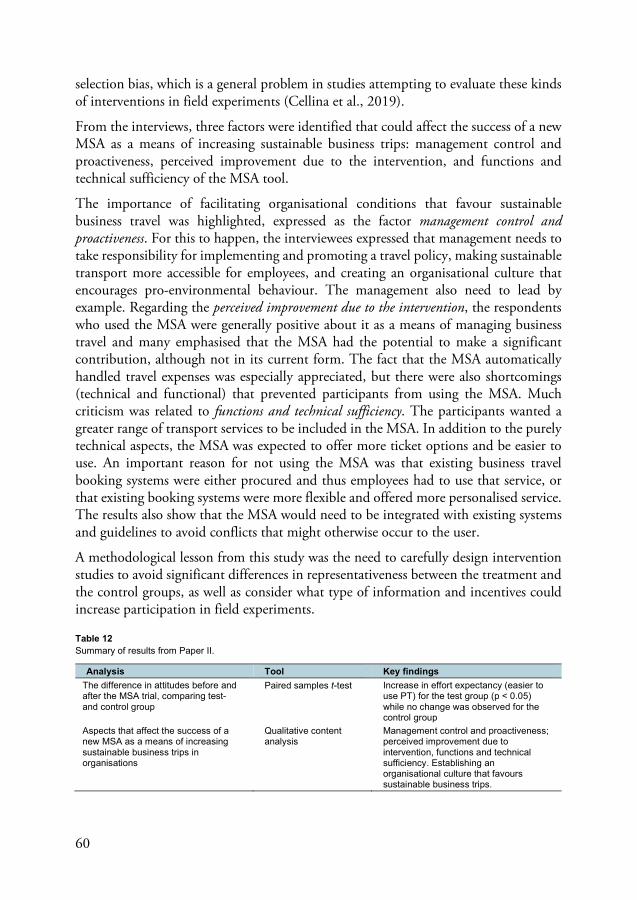

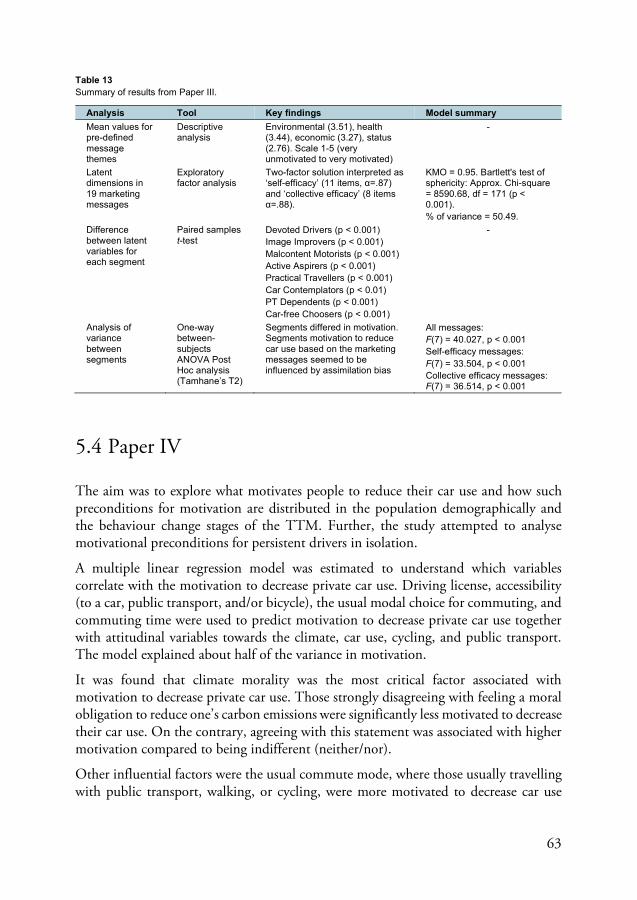
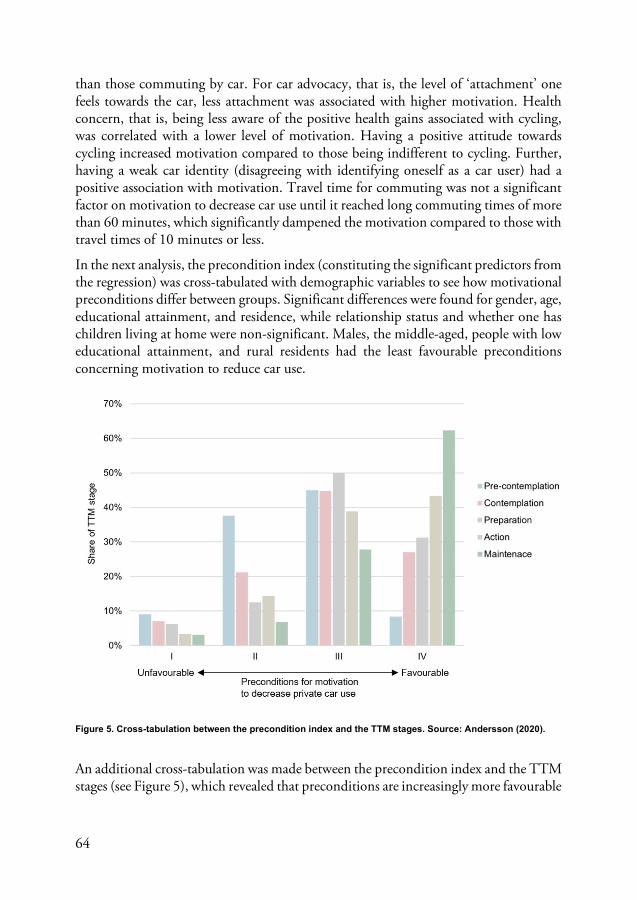
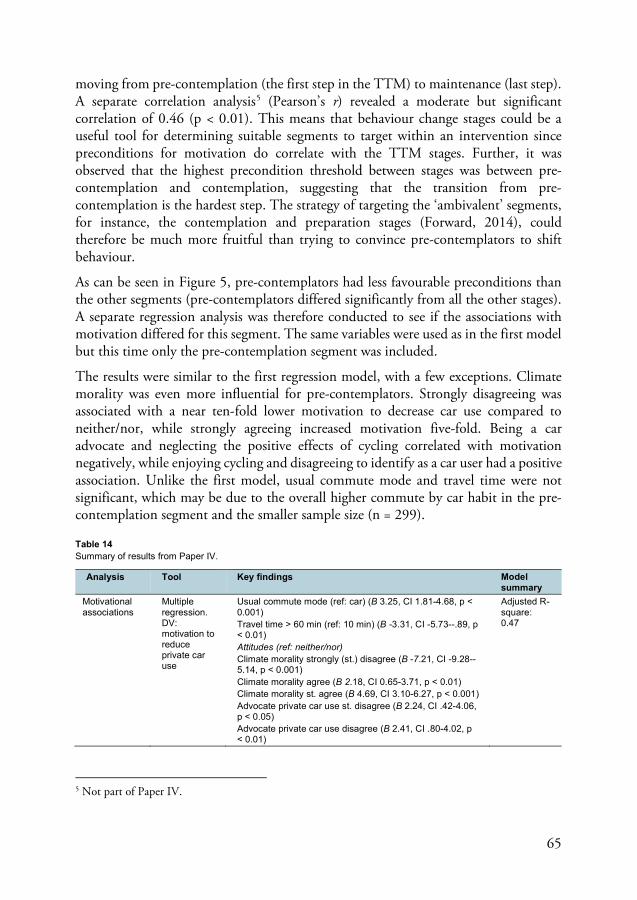
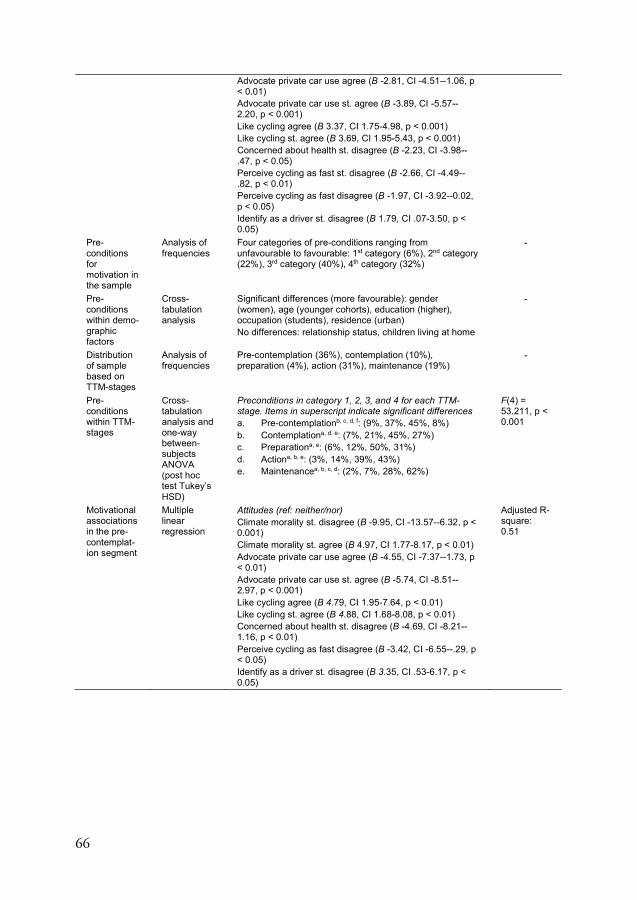
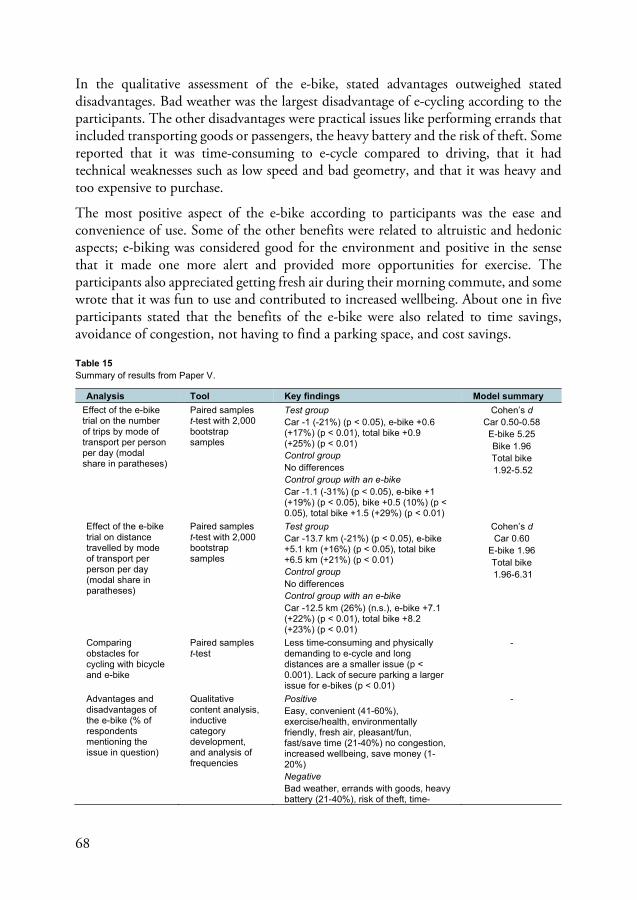


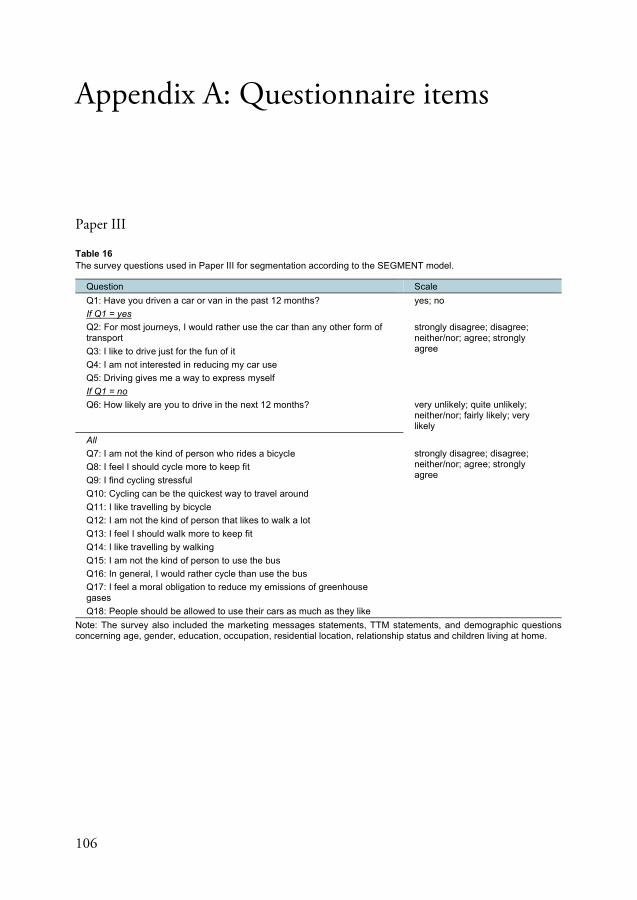
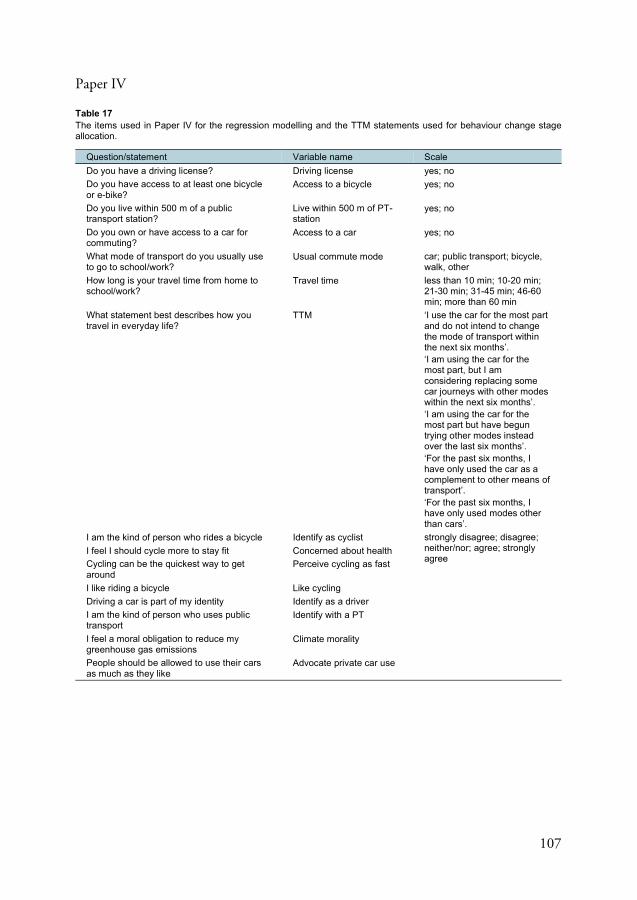


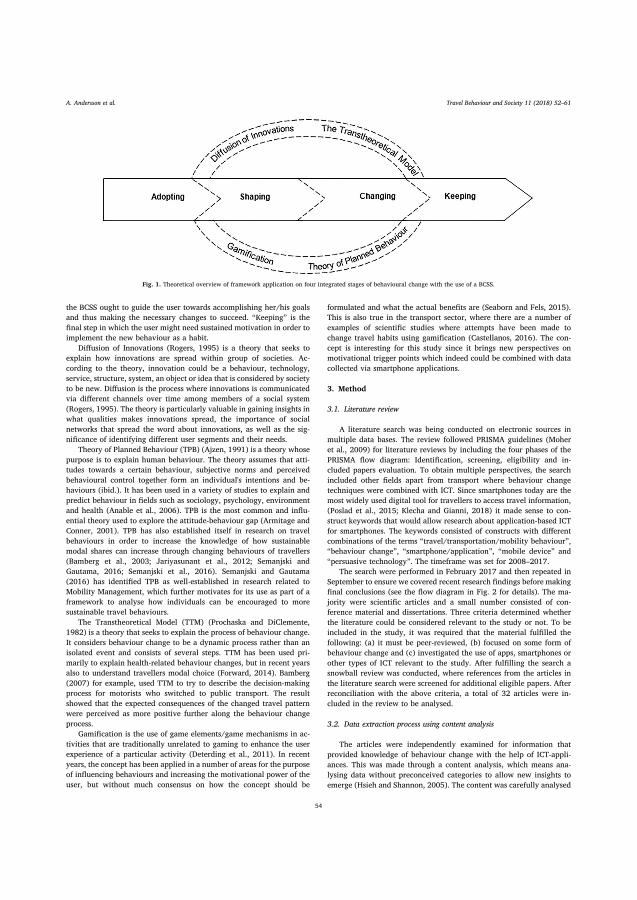
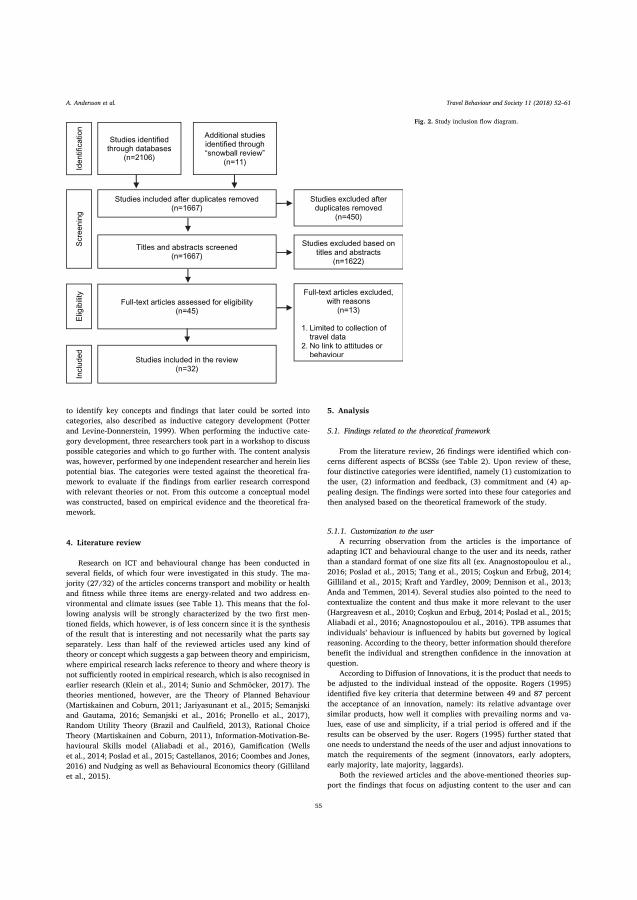
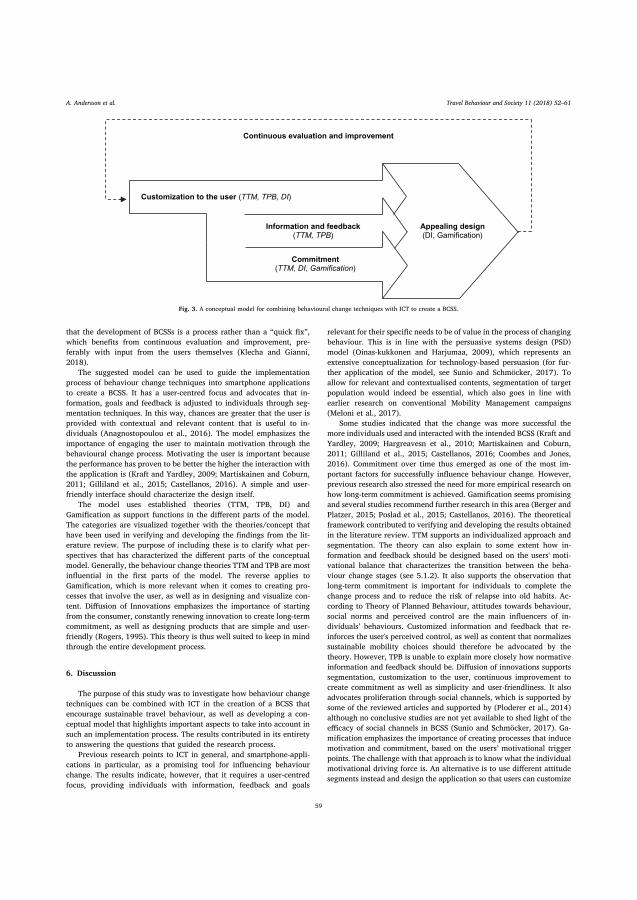


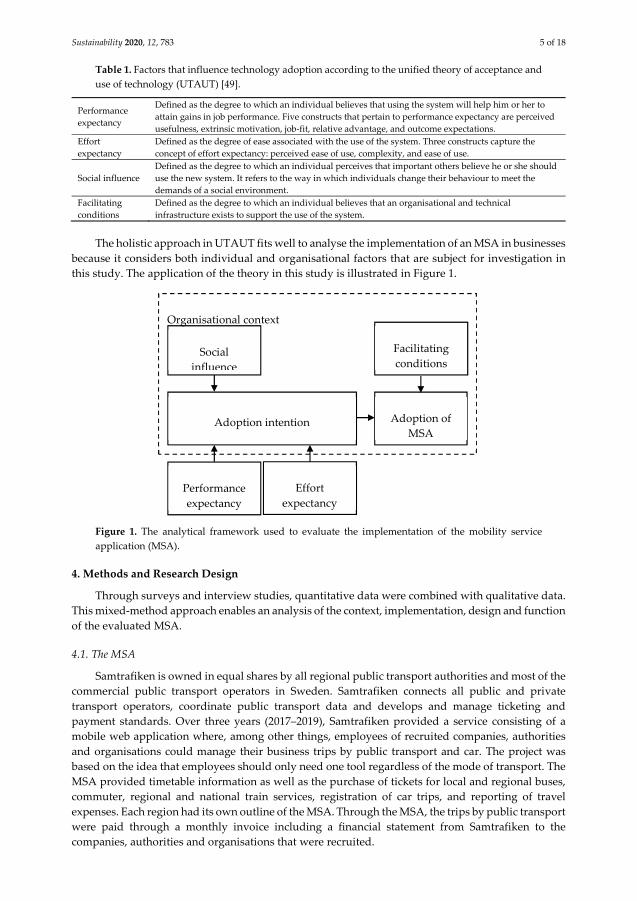
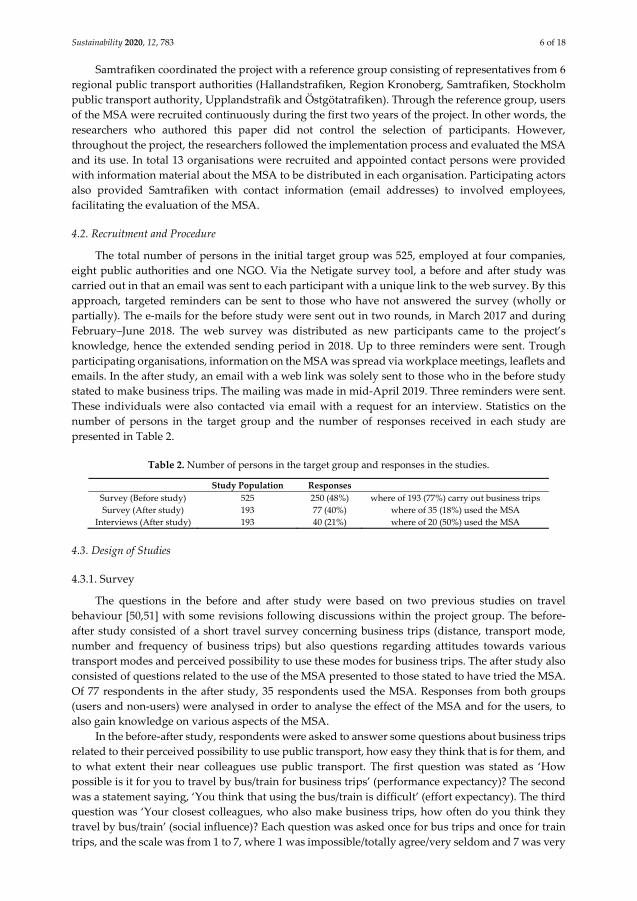


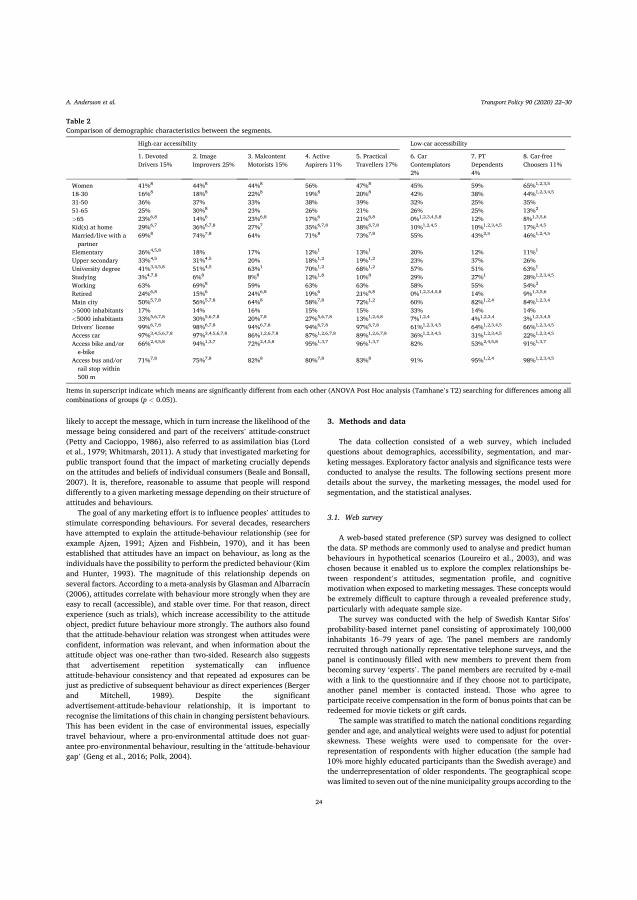
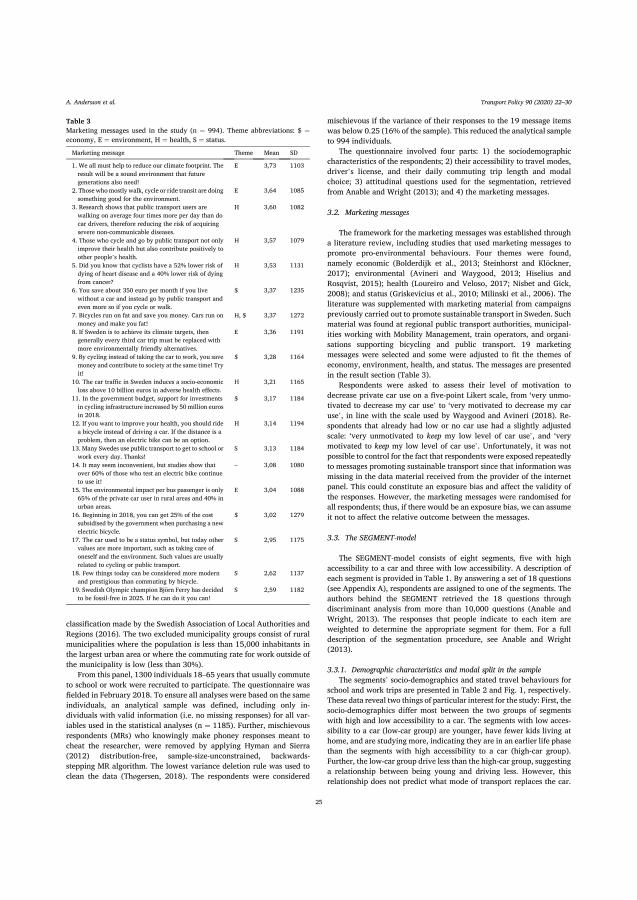
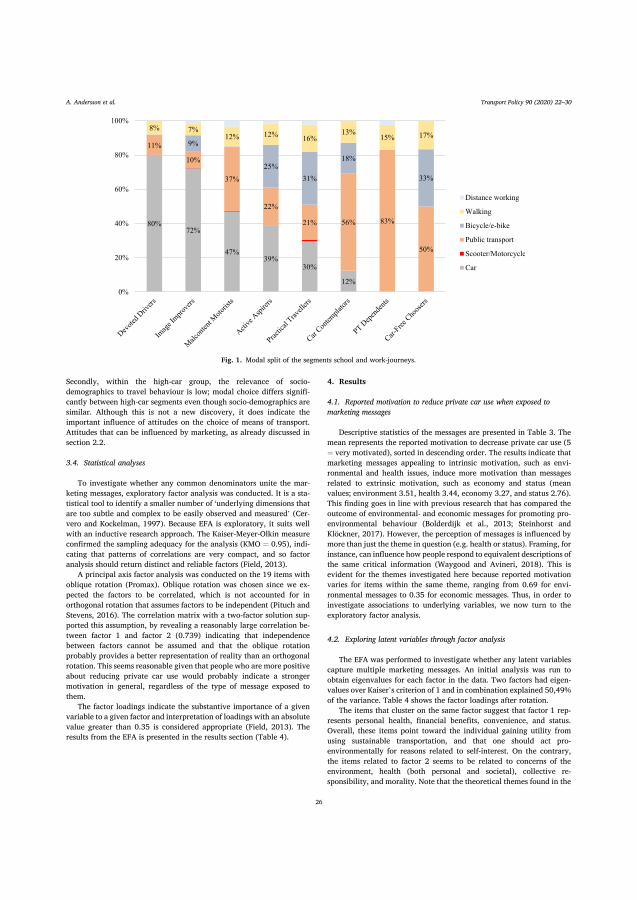
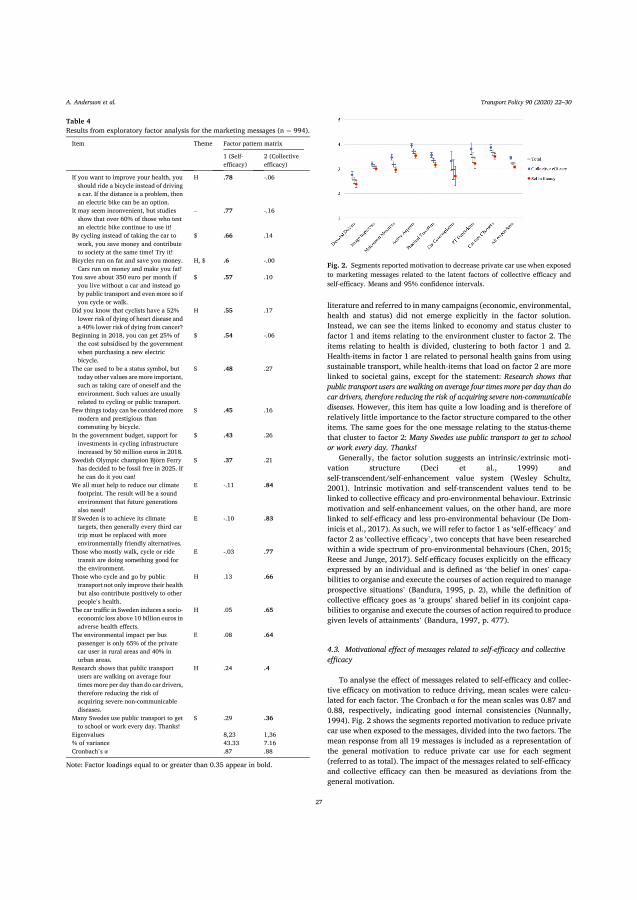
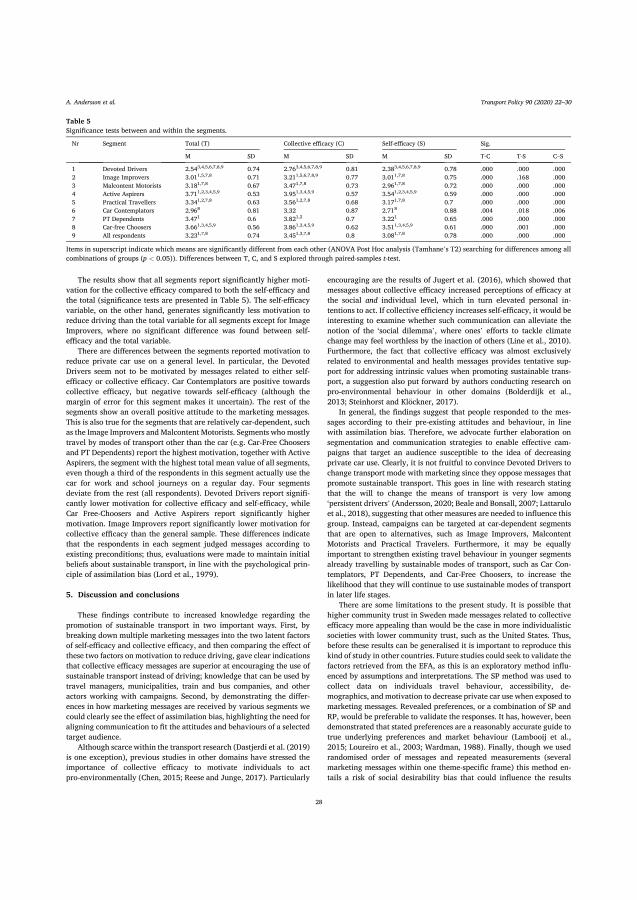


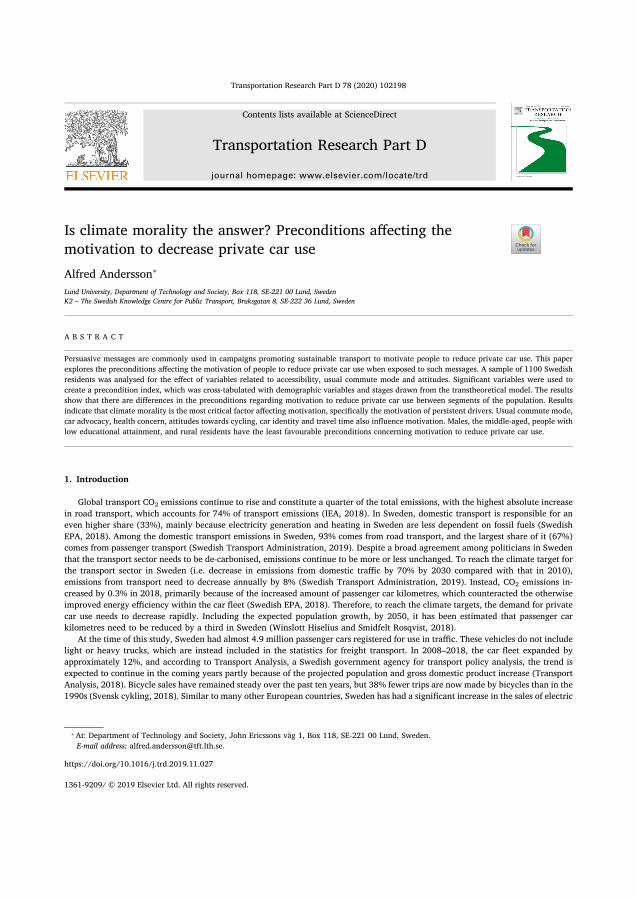
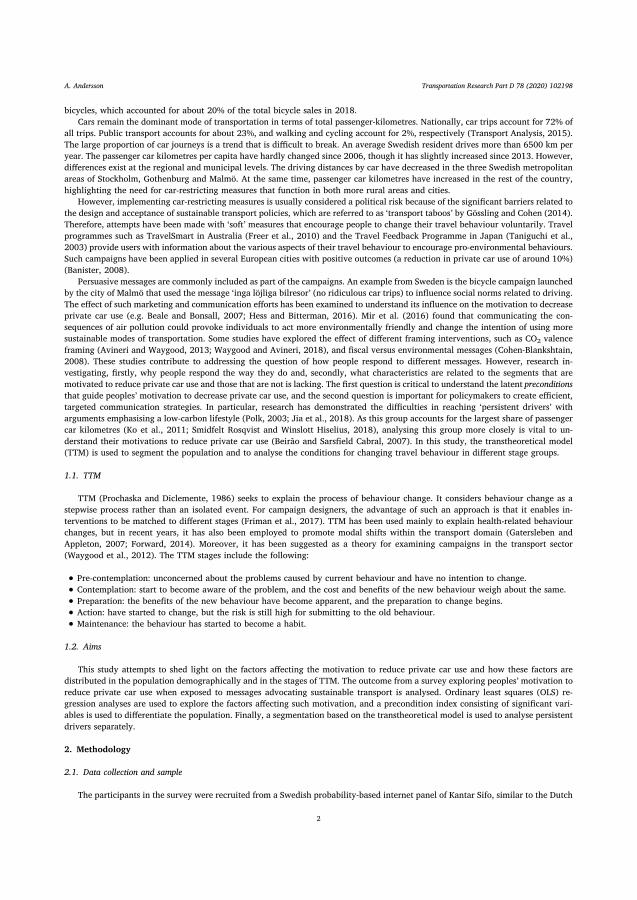
Related Documents