Soft Biometric Analysis: MultiPerson and RealTime Pedestrian Attribute Recognition in Crowded Urbane Environments Ehsan Yaghoubi Thesis for obtaining the doctorate degree in Computer Engineering (3º cycle of study) Supervisor: Prof. Dr. Hugo Pedro Proença August 2021

Welcome message from author
This document is posted to help you gain knowledge. Please leave a comment to let me know what you think about it! Share it to your friends and learn new things together.
Transcript

Soft Biometric Analysis: MultiPerson andRealTime Pedestrian Attribute Recognition
in Crowded Urbane Environments
Ehsan Yaghoubi
Thesis for obtaining the doctorate degree inComputer Engineering
(3º cycle of study)
Supervisor: Prof. Dr. Hugo Pedro Proença
August 2021

Soft Biometrics Analysis in Outdoor Environments
ii

Soft Biometrics Analysis in Outdoor Environments
This thesis was prepared at the University of Beria Interior, IT Instituto deTelecomunicações, Soft Computing and Image Analysis Laboratory (SOCIA Lab), CovilhãDelegation, and was submitted to the University of Beira Interior for defense in a publicexamination session.
This thesis was supported in part by the FCT/MEC through National Fundsand CoFunded by the FEDERPT2020 Partnership Agreement under ProjectUIDB/50008/2019, Project UIDB/50008/2020, Project POCI010247FEDER033395and in part by operation Centro010145FEDER000019 C4 Centro de Competênciasem Cloud Computing, cofunded by the European Regional Development Fund (ERDF)through the Programa Operacional Regional do Centro (Centro 2020), in the scope ofthe Sistema de Apoio à Investigação Científica e Tecnológica Programas Integrados deIC&DT. This work was also supported by “IT: Instituto de Telecomunicações” and “TOMI:City’s Best Friend” under Project UID/EEA/50008/2019.
iii

Soft Biometrics Analysis in Outdoor Environments
iv

Soft Biometrics Analysis in Outdoor Environments
List of PublicationsPublications: Articles included in the main body of the thesis resulting fromthis doctoral research program
1. Yaghoubi, E., Khezeli, F., Borza, D., Kumar, S.V., Neves, J. and Proença, H., 2020.Human Attribute Recognition—A Comprehensive Survey. Applied Sciences, 10(16),p.5608.
2. Yaghoubi, E., Kumar, A. and Proença, H., 2021. SSSPR: A short survey of surveysin person reidentification. Pattern Recognition Letters, 143, pp.5057.
3. Yaghoubi, E., Alirezazadeh, P., Assunção, E., Neves, J.C. and Proença, H., 2019,September. RegionBased CNNs for Pedestrian Gender Recognition in VisualSurveillance Environments. In 2019 International Conference of the BiometricsSpecial Interest Group (BIOSIG) (pp. 15). IEEE.
4. Yaghoubi, E., Borza, D., Neves, J., Kumar, A. and Proença, H., 2020. An attentionbased deep learning model for multiple pedestrian attributes recognition. Imageand Vision Computing, 102, p.103981.
5. Yaghoubi, E., Borza, D., Kumar, S.A. and Proença, H., 2021. Person reidentification: Implicitly defining the receptive fields of deep learning classificationframeworks. Pattern Recognition Letters, 145, pp.2329.
6. Yaghoubi, E., Borza, D., Degarding, B., J. and Proença, H. You Look So Different!Haven’t I Seen You a Long Time Ago?. (submitted to a journal media)
Collaborative Publications: Other publications resulting from this doctoralresearch program not included in the body of the thesis
1. Alirezazadeh, P., Yaghoubi, E., Assunção, E., Neves, J.C. and Proença, H., 2019,September. Pose Switchbased Convolutional Neural Network for Clothing Analysisin Visual Surveillance Environment. In 2019 International Conference of theBiometrics Special Interest Group (BIOSIG) (pp. 15). IEEE.
2. Proença, H., Yaghoubi, E. and Alirezazadeh, P., 2020. A Quadruplet Lossfor Enforcing Semantically Coherent Embeddings in MultiOutput ClassificationProblems. IEEE Transactions on Information Forensics and Security, 16, pp.800811.
3. Borza, D., Yaghoubi, E., Neves, J. and Proença, H., Allinone “HairNet”: A DeepNeural Model for Joint Hair Segmentation and Characterization. In 2020 IEEEInternational Joint Conference on Biometrics (IJCB) (pp. 110). IEEE.
4. Kumar, S.A., Yaghoubi, E., Das, A., Harish, B.S. and Proença, H., 2020. ThePDESTRE: A Fully Annotated Dataset for Pedestrian Detection, Tracking, andShort/LongTerm ReIdentification From Aerial Devices. IEEE Transactions onInformation Forensics and Security, 16, pp.16961708.
v

Soft Biometrics Analysis in Outdoor Environments
vi

Soft Biometrics Analysis in Outdoor Environments
Acknowledgments
First of all, I would like to express my sincere gratitude to my supervisor, Prof. HugoProença for his consistent support and encouragement throughout my PhD, withoutwhich it would be very difficult for me to conclude my PhD course. Also, I would liketo thank Prof. Rúben VeraRodriguez who gave me the opportunity to work with him asmy internship period.I wasn’t easy to go though all challenges of getting a PhD in abroad without the support ofmy wonderful wife, Zeinab. I would like to thank her not only for the unconditional loveshe gives me but also for her patience in many short and long periods we had to live farfrom each other. Life is short, but beautiful and valuable. Throughout these three yearswe couldn’t visit our families and I would like to thank them especially our mothers forenduring the great pain and suffering, caused by our far distance.Last but not least, I would like to thank Dr. Diana Borza, Dr. Aruna Kumar, Dr.João Neves, and Farhad Khezeli who collaborated in my researches and gave me greatcomments. I would also like to thank my helpful friends Vasco Lopes, Miguel Fernandes,Nuno Pereira, and Bruno Carneiro da Silva who helped me during the first months of myPhD to come up with many difficulties. Also, I would like to thank my great friends Dr.Hamzeh Mohammadi, Mostafa Razavi, Bruno Degardin, António Gaspar, Leonice SouzaPereira, Eduardo Assunção, João Brito, and Tiago Roxo with whom I shared preciousmemories and great moments.
vii

Soft Biometrics Analysis in Outdoor Environments
viii

Soft Biometrics Analysis in Outdoor Environments
Abstract
Traditionally, recognition systems were only based on human hard biometrics. However,the ubiquitous CCTV cameras have raised the desire to analyze human biometrics fromfar distances, without people attendance in the acquisition process. Highresolutionface closeshots are rarely available at far distances such that facebased systems cannotprovide reliable results in surveillance applications. Human soft biometrics such as bodyand clothing attributes are believed to bemore effective in analyzing human data collectedby security cameras.This thesis contributes to the human soft biometric analysis in uncontrolled environmentsand mainly focuses on two tasks: Pedestrian Attribute Recognition (PAR) and person reidentification (reid). We first review the literature of both tasks and highlight the historyof advancements, recent developments, and the existing benchmarks. PAR and person reid difficulties are due to significant distances between intraclass samples, which originatefrom variations in several factors such as body pose, illumination, background, occlusion,and data resolution. Recent stateoftheart approaches present endtoend models thatcan extract discriminative and comprehensive feature representations from people. Thecorrelation between different regions of the body and dealing with limited learning datais also the objective of many recent works. Moreover, class imbalance and correlationbetween human attributes are specific challenges associated with the PAR problem.We collect a large surveillance dataset to train a novel gender recognition model suitablefor uncontrolled environments. We propose a deep residual network that extracts severalposewise patches from samples and obtains a comprehensive feature representation. Inthe next step, we develop a model for multiple attribute recognition at once. Consideringthe correlation between human semantic attributes and class imbalance, we respectivelyuse a multitask model and a weighted loss function. We also propose a multiplicationlayer on top of the backbone features extraction layers to exclude the background featuresfrom the final representation of samples and draw the attention of the model to theforeground area.We address the problem of person reid by implicitly defining the receptive fields ofdeep learning classification frameworks. The receptive fields of deep learning modelsdetermine the most significant regions of the input data for providing correct decisions.Therefore, we synthesize a set of learning data in which the destructive regions (e.g.,background) in each pair of instances are interchanged. A segmentation moduledetermines destructive and useful regions in each sample, and the label of synthesizedinstances are inherited from the sample that shared the useful regions in the synthesizedimage. The synthesized learning data are then used in the learning phase and helpthe model rapidly learn that the identity and background regions are not correlated.Meanwhile, the proposed solution could be seen as a data augmentation approach thatfully preserves the label information and is compatible with other data augmentationtechniques.When reid methods are learned in scenarios where the target person appears with
ix

Soft Biometrics Analysis in Outdoor Environments
identical garments in the gallery, the visual appearance of clothes is given the mostimportance in the final feature representation. Clothbased representations are notreliable in the longterm reid settings as people may change their clothes. Therefore,developing solutions that ignore clothing cues and focus on identityrelevant features arein demand. We transform the original data such that the identityrelevant information ofpeople (e.g., face and body shape) are removed, while the identityunrelated cues (i.e.,color and texture of clothes) remain unchanged. A learned model on the synthesizeddataset predicts the identityunrelated cues (shortterm features). Therefore, we train asecondmodel coupled with the first model and learns the embeddings of the original datasuch that the similarity between the embeddings of the original and synthesized data isminimized. This way, the secondmodel predicts based on the identityrelated (longterm)representation of people.To evaluate the performance of the proposed models, we use PAR and person reiddatasets, namely BIODI, PETA, RAP, Market1501, MSMTV2, PRCC, LTCC, and MITand compared our experimental results with stateoftheart methods in the field.In conclusion, the data collected from surveillance cameras have low resolution, suchthat the extraction of hard biometric features is not possible, and facebased approachesproduce poor results. In contrast, soft biometrics are robust to variations in data quality.So, we propose approaches both for PAR and person reid to learn discriminative featuresfrom each instance and evaluate our proposed solutions on several publicly availablebenchmarks.
Keywords
Pedestrian Attribute Recognition, Person ReIdentification, Multitask learning, HumanSoftBiometric Analysis, Attention Mechanism, MultiPerson Soft Biometric Estimation,Face and Body Attribute Recognition, Clothing Attribute Recognition, Visual SurveillanceData Analysis, ClothChanging Person ReIdentification.
x

Soft Biometrics Analysis in Outdoor Environments
Contents
1 Introduction 11.1 Challenges and Motivations . . . . . . . . . . . . . . . . . . . . . . . . . . . 11.2 Objectives . . . . . . . . . . . . . . . . . . . . . . . . . . . . . . . . . . . . . 41.3 Contributions . . . . . . . . . . . . . . . . . . . . . . . . . . . . . . . . . . . 41.4 Research Progress Path . . . . . . . . . . . . . . . . . . . . . . . . . . . . . 61.5 Thesis Structure . . . . . . . . . . . . . . . . . . . . . . . . . . . . . . . . . 8
2 Human Attribute Recognition: A Comprehensive Survey 132.1 Introduction . . . . . . . . . . . . . . . . . . . . . . . . . . . . . . . . . . . 132.2 Human Attribute Recognition Preliminaries . . . . . . . . . . . . . . . . . 17
2.2.1 Data Preparation . . . . . . . . . . . . . . . . . . . . . . . . . . . . . 182.2.2 HAR Model Development . . . . . . . . . . . . . . . . . . . . . . . . 18
2.3 Discussion of Sources . . . . . . . . . . . . . . . . . . . . . . . . . . . . . . 192.3.1 Localization Methods . . . . . . . . . . . . . . . . . . . . . . . . . . 212.3.2 Limited Data . . . . . . . . . . . . . . . . . . . . . . . . . . . . . . . 272.3.3 Attributes Relationship . . . . . . . . . . . . . . . . . . . . . . . . . 282.3.4 Occlusion . . . . . . . . . . . . . . . . . . . . . . . . . . . . . . . . . 332.3.5 Classes Imbalance . . . . . . . . . . . . . . . . . . . . . . . . . . . . 332.3.6 PartBased And Attribute CorrelationBased Methods . . . . . . . . 36
2.4 Datasets . . . . . . . . . . . . . . . . . . . . . . . . . . . . . . . . . . . . . . 362.4.1 PAR datasets . . . . . . . . . . . . . . . . . . . . . . . . . . . . . . . 362.4.2 FAR datasets . . . . . . . . . . . . . . . . . . . . . . . . . . . . . . . 382.4.3 Fashion Datasets . . . . . . . . . . . . . . . . . . . . . . . . . . . . . 402.4.4 Synthetic Datasets . . . . . . . . . . . . . . . . . . . . . . . . . . . . 41
2.5 Evaluation Metrics . . . . . . . . . . . . . . . . . . . . . . . . . . . . . . . . 422.6 Discussion . . . . . . . . . . . . . . . . . . . . . . . . . . . . . . . . . . . . 43
2.6.1 Discussion Over HAR Datasets . . . . . . . . . . . . . . . . . . . . . 432.6.2 Critical Discussion and Performance Comparison . . . . . . . . . . 48
2.7 Conclusions . . . . . . . . . . . . . . . . . . . . . . . . . . . . . . . . . . . 55
3 SSSPR: A Short Survey of Surveys in Person Reidentification 713.1 Introduction . . . . . . . . . . . . . . . . . . . . . . . . . . . . . . . . . . . 71
3.1.1 Contributions . . . . . . . . . . . . . . . . . . . . . . . . . . . . . . 723.2 Person Reidentification Taxonomy . . . . . . . . . . . . . . . . . . . . . . 73
3.2.1 Querytype . . . . . . . . . . . . . . . . . . . . . . . . . . . . . . . . 733.2.2 Strategies . . . . . . . . . . . . . . . . . . . . . . . . . . . . . . . . . 743.2.3 Approaches . . . . . . . . . . . . . . . . . . . . . . . . . . . . . . . . 773.2.4 Identification Settings . . . . . . . . . . . . . . . . . . . . . . . . . . 783.2.5 Context . . . . . . . . . . . . . . . . . . . . . . . . . . . . . . . . . . 783.2.6 Datamodality . . . . . . . . . . . . . . . . . . . . . . . . . . . . . . 78
xi
Soft Biometrics Analysis in Outdoor Environments
3.2.7 Learningtype . . . . . . . . . . . . . . . . . . . . . . . . . . . . . . 79
3.2.8 StateoftheArt Performance Comparison . . . . . . . . . . . . . . 79
3.3 Privacy Concerns . . . . . . . . . . . . . . . . . . . . . . . . . . . . . . . . . 80
3.4 Discussion and Future Directions . . . . . . . . . . . . . . . . . . . . . . . 81
3.4.1 Biases and Problems . . . . . . . . . . . . . . . . . . . . . . . . . . . 81
3.4.2 Open Issues . . . . . . . . . . . . . . . . . . . . . . . . . . . . . . . 82
3.5 Conclusion . . . . . . . . . . . . . . . . . . . . . . . . . . . . . . . . . . . . 83
4 RegionBased CNNs for Pedestrian Gender Recognition in VisualSurveillance Environments 894.1 Introduction . . . . . . . . . . . . . . . . . . . . . . . . . . . . . . . . . . . 89
4.2 Pedestrian Gender Recognition Network (PGRN) . . . . . . . . . . . . . . 90
4.2.1 BaseNet . . . . . . . . . . . . . . . . . . . . . . . . . . . . . . . . . 91
4.2.2 Body KeyPoint Detection and Tracking . . . . . . . . . . . . . . . . 91
4.2.3 Pose Inference . . . . . . . . . . . . . . . . . . . . . . . . . . . . . . 92
4.2.4 RoI: Segmentation and Cropping Strategies . . . . . . . . . . . . . 92
4.2.5 PSN and Score Fusion . . . . . . . . . . . . . . . . . . . . . . . . . . 93
4.3 Experiments and Discussion . . . . . . . . . . . . . . . . . . . . . . . . . . 93
4.3.1 Datasets . . . . . . . . . . . . . . . . . . . . . . . . . . . . . . . . . 93
4.3.2 Experimental Settings . . . . . . . . . . . . . . . . . . . . . . . . . . 94
4.3.3 Results and Discussion . . . . . . . . . . . . . . . . . . . . . . . . . 95
4.4 Conclusions and Future Works . . . . . . . . . . . . . . . . . . . . . . . . . 96
5 An AttentionBased Deep Learning Model for Multiple PedestrianAttributes Recognition 995.1 Introduction . . . . . . . . . . . . . . . . . . . . . . . . . . . . . . . . . . . 99
5.2 Related Work . . . . . . . . . . . . . . . . . . . . . . . . . . . . . . . . . . . 101
5.3 Proposed Method . . . . . . . . . . . . . . . . . . . . . . . . . . . . . . . . 101
5.3.1 Overall Architecture . . . . . . . . . . . . . . . . . . . . . . . . . . . 102
5.3.2 Convolutional Building Blocks . . . . . . . . . . . . . . . . . . . . . 102
5.3.3 Foreground Human Body Segmentation Module . . . . . . . . . . . 104
5.3.4 Hard Attention: Elementwise Multiplication Layer . . . . . . . . . 104
5.3.5 MultiTask CNN Architecture and Weighted Loss Function . . . . . 104
5.4 Experiments and Discussion . . . . . . . . . . . . . . . . . . . . . . . . . . 105
5.4.1 Datasets . . . . . . . . . . . . . . . . . . . . . . . . . . . . . . . . . 106
5.4.2 Evaluation Metrics . . . . . . . . . . . . . . . . . . . . . . . . . . . . 106
5.4.3 Preprocessing . . . . . . . . . . . . . . . . . . . . . . . . . . . . . . 107
5.4.4 Implementation Details . . . . . . . . . . . . . . . . . . . . . . . . . 107
5.4.5 Comparison with the Stateoftheart . . . . . . . . . . . . . . . . . 109
5.4.6 Ablation Studies . . . . . . . . . . . . . . . . . . . . . . . . . . . . . 111
5.5 Conclusions . . . . . . . . . . . . . . . . . . . . . . . . . . . . . . . . . . . . 114
xii

Soft Biometrics Analysis in Outdoor Environments
6 Person Reidentification: Implicitly Defining the Receptive Fields ofDeep Learning Classification Frameworks 1196.1 Introduction . . . . . . . . . . . . . . . . . . . . . . . . . . . . . . . . . . . 1196.2 Related Work . . . . . . . . . . . . . . . . . . . . . . . . . . . . . . . . . . . 1216.3 Proposed Method . . . . . . . . . . . . . . . . . . . . . . . . . . . . . . . . 122
6.3.1 Implicit Definition of Receptive Fields . . . . . . . . . . . . . . . . . 1236.3.2 Synthetic Image Generation . . . . . . . . . . . . . . . . . . . . . . 124
6.4 Implementation Details . . . . . . . . . . . . . . . . . . . . . . . . . . . . . 1256.5 Experiments and Discussion . . . . . . . . . . . . . . . . . . . . . . . . . . 126
6.5.1 Datasets . . . . . . . . . . . . . . . . . . . . . . . . . . . . . . . . . 1276.5.2 Baseline . . . . . . . . . . . . . . . . . . . . . . . . . . . . . . . . . . 1276.5.3 ReID Results . . . . . . . . . . . . . . . . . . . . . . . . . . . . . . 128
6.6 Conclusions . . . . . . . . . . . . . . . . . . . . . . . . . . . . . . . . . . . . 130
7 You Look So Different! Haven’t I Seen You a Long Time Ago? 1377.1 Introduction . . . . . . . . . . . . . . . . . . . . . . . . . . . . . . . . . . . 1377.2 Related work . . . . . . . . . . . . . . . . . . . . . . . . . . . . . . . . . . . 1397.3 Proposed method . . . . . . . . . . . . . . . . . . . . . . . . . . . . . . . . 140
7.3.1 Preprocessing: Image Transformation Pipeline . . . . . . . . . . . 1417.3.2 Proposed Model: Learning Phase . . . . . . . . . . . . . . . . . . . 144
7.4 Experiments and Discussion . . . . . . . . . . . . . . . . . . . . . . . . . . 1457.4.1 Datasets . . . . . . . . . . . . . . . . . . . . . . . . . . . . . . . . . 1457.4.2 Implementation Details . . . . . . . . . . . . . . . . . . . . . . . . . 1467.4.3 Results . . . . . . . . . . . . . . . . . . . . . . . . . . . . . . . . . . 147
7.5 Ablation Studies . . . . . . . . . . . . . . . . . . . . . . . . . . . . . . . . . 1497.6 Conclusions . . . . . . . . . . . . . . . . . . . . . . . . . . . . . . . . . . . . 1507.7 Acknowledgments . . . . . . . . . . . . . . . . . . . . . . . . . . . . . . . . 151
8 Conclusions 1558.1 Summary . . . . . . . . . . . . . . . . . . . . . . . . . . . . . . . . . . . . . 1558.2 Summary of Contributions . . . . . . . . . . . . . . . . . . . . . . . . . . . 1558.3 Future Research Directions . . . . . . . . . . . . . . . . . . . . . . . . . . . 157
8.3.1 Limited Data . . . . . . . . . . . . . . . . . . . . . . . . . . . . . . . 1588.3.2 Explainable Architectures . . . . . . . . . . . . . . . . . . . . . . . . 1588.3.3 PriorKnowledge Based Learning . . . . . . . . . . . . . . . . . . . 159
9 Anexos 161
xiii

Soft Biometrics Analysis in Outdoor Environments
xiv

Soft Biometrics Analysis in Outdoor Environments
List of Figures
1.1 General challenges in person reid and HAR frameworks. . . . . . . . . . . 3
1.2 Gantt chart: the research progress path including passed courses,industrial research projects, publications, internship period and thesispreparation time line. . . . . . . . . . . . . . . . . . . . . . . . . . . . . . . 6
2.1 Typical pipeline to develop a HAR model . . . . . . . . . . . . . . . . . . . 14
2.2 The proposed taxonomy for main challenges in HAR . . . . . . . . . . . . . 21
2.3 Number of citations to HAR datasets . . . . . . . . . . . . . . . . . . . . . 44
2.4 Frequency distribution of the labels . . . . . . . . . . . . . . . . . . . . . . 48
2.5 As human, not only we describe the available attributes . . . . . . . . . . . 50
2.6 Stateoftheart mAP results . . . . . . . . . . . . . . . . . . . . . . . . . . 51
3.1 An endtoend reid model detects and tracks the individuals . . . . . . . . 72
3.2 Multidimensional taxonomy . . . . . . . . . . . . . . . . . . . . . . . . . . 73
3.3 Examples of how varying capturing angles . . . . . . . . . . . . . . . . . . 74
3.4 Some of patching strategies used . . . . . . . . . . . . . . . . . . . . . . . . 77
4.1 Overview of the proposed algorithm called PGRN . . . . . . . . . . . . . . 90
4.2 Foreground segmentation process . . . . . . . . . . . . . . . . . . . . . . . 93
5.1 Challenges in Pedestrian Attribute Recognition (PAR) problems . . . . . . 100
5.2 Comparison between the attentive regions . . . . . . . . . . . . . . . . . . 101
5.3 Overview of the major contributions . . . . . . . . . . . . . . . . . . . . . . 103
5.4 Residual convolutional block . . . . . . . . . . . . . . . . . . . . . . . . . . 103
5.5 The effectiveness of the multiplication layer . . . . . . . . . . . . . . . . . . 109
5.6 Illustration of the effectiveness of the multiplication layer . . . . . . . . . . 113
5.7 Visualization of the heat maps . . . . . . . . . . . . . . . . . . . . . . . . . 114
6.1 The main challenge addressed in this paper . . . . . . . . . . . . . . . . . . 121
6.2 The proposed fullbody attentional data augmentation . . . . . . . . . . . 123
6.3 Examples of synthetic data generated for upperbody . . . . . . . . . . . . 126
7.1 Main motivation of the proposed work. . . . . . . . . . . . . . . . . . . . . 138
7.2 Overview of the image transformation pipeline for removing the IDrelatedcues . . . . . . . . . . . . . . . . . . . . . . . . . . . . . . . . . . . . . . . . 142
7.3 Samples of the synthesized data from several subjects in the LTCC dataset.As we intend, the visual identity cues such as face, height, weight, and bodyshape are distorted successfully. . . . . . . . . . . . . . . . . . . . . . . . . 143
xv

Soft Biometrics Analysis in Outdoor Environments
7.4 Overview of the learning phase of the proposed model. In the offlinelearning phase, the STECNN model receives a transformed image IiIiIi andextracts its shortterm embeddings (IDunrelated) fijfijfij . Then, the longterm representation (IDrelated) of the original image IiIiIi is obtained byminimizing the similarity between the longterm feature vector fififi and thefrozen shortterm embeddings fijfijfij . The magnified box shows the images ofone person with three different clothes and indicates that how LTECNNloss function helps to learn the identity of the person (blue traces) anddisregard clothing features (red traces). IiIiIi refers to the original image ofperson i with clothing style j, and IiIiIi is the IDunrelated version of IiIiIi. Bestviewed in color. . . . . . . . . . . . . . . . . . . . . . . . . . . . . . . . . . . 145
7.5 Visualization of the longterm representations, according to tSNE [38],for six IDs with varying clothes (LTCC test set). The data related to eachperson are presented in a different color, and variety in outfits is denotedby different markers. Best viewed in color. . . . . . . . . . . . . . . . . . . 148
8.1 Comparison between synthesized data of face and fullbody of persons . . 1578.2 A rough example of a visually interpretable PAR model . . . . . . . . . . . 158
xvi

Soft Biometrics Analysis in Outdoor Environments
List of Tables
2.1 Pedestrian attributes datasets . . . . . . . . . . . . . . . . . . . . . . . . . . 412.2 Performance comparison of HAR approaches . . . . . . . . . . . . . . . . . 52
3.1 Performance of the stateoftheart reid methods. . . . . . . . . . . . . . . 80
4.1 Statistics of the BIODI dataset . . . . . . . . . . . . . . . . . . . . . . . . . 944.2 Sample images of the BIODI dataset . . . . . . . . . . . . . . . . . . . . . . 944.3 Accuracy for the experiments on BIODI and PETA datasets . . . . . . . . . 954.4 Results on MIT test set in percentage. . . . . . . . . . . . . . . . . . . . . . 96
5.1 RAP dataset annotations . . . . . . . . . . . . . . . . . . . . . . . . . . . . 1065.2 Parameter Settings for the performed experiments . . . . . . . . . . . . . . 1075.3 Task specification policy . . . . . . . . . . . . . . . . . . . . . . . . . . . . . 1085.4 Mask RCNN parameter settings . . . . . . . . . . . . . . . . . . . . . . . . 1095.5 Comparison between results . . . . . . . . . . . . . . . . . . . . . . . . . . 1105.6 Comparison of results . . . . . . . . . . . . . . . . . . . . . . . . . . . . . . 1125.7 Ablation studies . . . . . . . . . . . . . . . . . . . . . . . . . . . . . . . . . 1135.8 Performance of the network . . . . . . . . . . . . . . . . . . . . . . . . . . . 113
6.1 Results comparison between the baseline and our solutions . . . . . . . . . 1276.2 Results of the proposed receptive field definer . . . . . . . . . . . . . . . . 1286.3 Results comparison on the Market1501 benchmark . . . . . . . . . . . . . 1306.4 Results comparison on the MSMT17 benchmark . . . . . . . . . . . . . . . 130
7.1 Results on the LTCC data set. The method performance on head patches isdenoted by ∗ symbol. . . . . . . . . . . . . . . . . . . . . . . . . . . . . . . 146
7.2 Results for two settings of the PRCC data set: 1) when the query personappears with different clothes in the gallery set (at leftside), 2) when thequery’s outfit is not changed in the gallery set (at leftside). The locallyperformed evaluations were repeated 10 times, and the variances from themean values were shown by ±. . . . . . . . . . . . . . . . . . . . . . . . . . 147
7.3 The performance of the proposed LSD model with different residualbackbones and input resolutions, when trained for 50 epochs on the LTCCdata set. When architecture is changing, the input resolution is fixed to256×128, and when input resolution is changing, the senet154 architectureis used. SS andCCS stand for Standard Setting andClothChanging Setting,respectively. . . . . . . . . . . . . . . . . . . . . . . . . . . . . . . . . . . . 150
xvii

Soft Biometrics Analysis in Outdoor Environments
xviii

Soft Biometrics Analysis in Outdoor Environments
Acronyms
APiS Attributed Pedestrians in Surveillance
ACN Attributes Convolutional Net
BBs Bounding Boxes
BCE Binary CrossEntropy
BIODI Biometria e Deteção de Incidentes
BN Batch Normalization
CAA Clothing Attribute Analysis
CAD Clothing Attributes Dataset
CAMs Class Activation Maps
CBCL Center for Biological and Computational Learning
CCTV ClosedCircuit TeleVision
CNN Convolutional Neural Network
CRF Conditional Random Field
CRP Caltech Roadside Pedestrians
CVPR Computer Vision and Pattern Recognition
CSD Color Structure Descriptor
CTD Clothing Tightness Dataset
DNN Decompositional Neural Network
DukeMTMC Duke MultiTarget, MultiCamera
DPM Deformable Part Model
FAA Facial Attribute Analysis
FAR Fullbody Attribute Recognition
FCN Fully Connected Network
FCL Fully Connected Layer
GAN Generative Adversarial Network
xix

Soft Biometrics Analysis in Outdoor Environments
GCN Graph Convolutional Network
GRID underGround ReIDentification
HAR Human Attribute Recognition
HAT Human ATtributes
HeReid Heterogeneous reid
HD High Definition
HoReid Homogeneous reid
HOG Histogram of Oriented Gradients
ICCV International Conference on Computer Vision
KITTI Karlsruhe Institute of Technology and Toyota Technological Institute
reid reidentification
LSTM Long Short Term Memory
MAP Maximum A Posterioris
MCSH Major Colour Spectrum Histogram
mAP mean Average Precision
MLCNN MultiLabel Convolutional Neural Network
MSCR Maximally Stable Colour Regions
OPC Office of the Privacy Commissioner of Canada
PDESTRE Pedestrian Detection, Tracking, ReIdentification and Search
PARSe27k Pedestrian Attribute Recognition in Sequences
PETA PEdesTrian Attribute
PET PrivacyEnhancing Technologies
PAR Pedestrian Attribute Recognition
PASCALVOC PASCAL Visual Object Classes
PGRN Pedestrian Gender Recognition Network
PSN PoseSensitive Network
RAP Richly Annotated Pedestrian
RCB Residual Convolutional Block
xx

Soft Biometrics Analysis in Outdoor Environments
ResNet Residual Networks
RHSP Recurrent HighlyStructured Patches
RNN Recurrent Neural Networks
RoI Regions of Interest
RPN Region Proposal Network
SENet SqueezeandExcitation Networks
SGD Stochastic Gradient Descent
SIFT ScaleInvariant Feature Transform
SoBiR Soft Biometric Retrieval
SPR Spatial Pyramid Representation
SPPE Single Person Pose Estimator
SSD Single Shot Detector
STN Spatial Transformer Network
SVM Support Vector Machine
UAV Unmanned Aerial Vehicle
UDA Unsupervised Domain Adaptation
VAE Variational AutoEncoders
VGG Visual Geometry Group
YOLO You Only Look Once
xxi

Soft Biometrics Analysis in Outdoor Environments
xxii

Soft Biometrics Analysis in Outdoor Environments
Chapter 1
Introduction
In recent decades, the growing demand for video surveillance systems in public placessuch as metro stations, malls, and streets has been emerging new research tracks formonitoring people and the environments themselves [1].In general, the automatic analysis of video surveillance is a practical approach thatenhances the quality of public services. For example, suppose that parents lost theirchild in an amusement park and they only provide the security officers with some photosand some traits related to their child to find her/him. In such situations, even if someCCTVs have recorded the children’s activity, the manual inspection of the recordedcontent may take too much time; whereas a drone equipped with a camera and a reidentification (reid) framework may fly over the most probable areas and automaticallyfind the locations of the similar children to the query child [2]. Another importantapplication of video surveillance analysis lies in the domain of security and forensicmeasurements, such that upon an accident, the authorities inspect the available recordeddata to investigate the situation [3]. Traditionally, huge amounts of collected datawere reviewed by human operators that were timeconsuming and accompanied byhuman errors caused by tiredness, hurry, and biased opinion. Recently, computerbasedanalysis of visual surveillance data has significantly helped human operators expedite theinspection process –e.g., by highlighting the suspicious parts of the recorded data [4].Analyzing video surveillance data has many different perspectives and components suchas scene understanding [5], human interactions [6] and behavior understanding [7],action and activity recognition [8] and prediction [9], human emotions detection [10],person reid [11], Human Attribute Recognition (HAR) [12], and privacy concerns [13].Among these fields of study, we focus on soft biometric analysis in the wild, narrowedexplicitly to the problems of person reid and Pedestrian Attribute Recognition (PAR)from data collected at for distances. Although the other fields are related to videosurveillance analysis and are active research areas, scholars consider them differenttasks that demand different benchmarks and approaches. For instance, human behaviorunderstanding techniques usually deal with body skeleton data over several consecutiveframes and could be implemented successfully without accessing any RGB videos, butonly skeleton information.
1.1 Challenges and Motivations
As mentioned previously, the field of softbiometric analyses includes a wide range ofproblems, and in this thesis, our focus is on the problems of person reid and PAR. Personreid is the task of recognizing the visual data of a query identity and retrieving most
1

Soft Biometrics Analysis in Outdoor Environments
similar identities that have been captured in different situations, e.g., various physicalplaces or different occasions; and, Human Attribute Recognition (HAR) (also known asPAR) aims to estimate the soft biometric attributes associated to people.
Fig. 1.1 shows some general challenges in the visual analysis of CCTV data: the presenceof more than one person in one shot, high range variation in illumination, significantmisalignment in shots, lowresolution data, the existence of wide background area in oneshot. When the intensity of these challenges goes beyond some extent, even humanscannot provide reliable responses. In general, the face area is the most informativeregion that could revile the persons’ identity. However, usually, the satisfactory dataare not available either because the camera captures the back of the person or there arelarge camera distances from the subject, which causes blurred face shots such that thestateoftheart facebased reid systems cannot provide reliable results. Furthermore,the illumination of the captured data from a subject in a shadowed area has highvariations with images captured from the same person under the sunshine. The variationsin brightness change the observations in clothing and skin colors and consequentlyintroduce some challenges to each stage of the system, from annotation and learning toestimation processes [14].
Usually, the input data of the imagebasedHARandperson reid systems are one fullbodyclose shot (bounding box) of the person such that the shots include as little as possiblebackground region. The bounding box shots are extracted from a full frame containing awide area, including several persons. Person detectors [15] are the primary tools used forextracting fullbody close shots. However, the performance of the person detectors is notperfect [16]; therefore, we should expect a percentage of error (misalignment) in boundingbox extraction, which causes misaligned shots, in which either some body parts of theperson are missed, or extra regions of the background area are included in the extractedbounding box. The challenge ofmisalignment impacts the person reid systemsmore thanHAR systems since we usually perform a crossmatching between the image of the queryperson and the gallery images to reidentify people. Hence, missing body parts or extraareas of background reduces thematching confidence. Whereas whenwewant to performattribute recognition, misalignment may degrade the quality of the final representationonly because of the presence(/absence) of the destructive(/useful) features. Thus, theHAR systems are intrinsically more robust to misalignment. The presence of more thanone person in each shot is another challenge since usually imagebased person reid andHARmodels provide one feature representation for each available shot. Therefore, whenone shot contains more than one person, the features extracted from other persons areentangled with the features of the target person, and consequently, the quality of the finalrepresentation of the target person is degraded and affects the model performance [17].
The number of captured images from each subject is limited such that this number maybe less than few images in some existing person reid and HAR datasets. Therefore, insome fractions of the dataset, each subject may appear in an environment with a uniquebackground. This situation causes some difficulties since the background features willbe entangled with person features in the final representation, mainly because the model
2

Soft Biometrics Analysis in Outdoor Environments
Figure 1.1: General challenges in person reid and HAR frameworks. From left to right, eachimage shows a challenge: presence of more than one person in one shot, illumination variations,missing body parts, low resolution data, wide background area in one shot. Samples are from theRAP, PETA, and Market1501 datasets.
cannot automatically distinguish between the bodyassociated features and backgroundfeatures.
One possibility to perform an accurate person reid is to use people’s hard biometricsfeatures. Hard biometrics, also known as biometrics, are some features that are uniquelyassociated with only one person, e.g., iris. However, acquiring biometric informationdemands an attentive collaboration of people because it cannot be performed from fardistances. Also, variations in noise (e.g., illumination) and data resolution highly degradethe performance of biometric systems. Therefore, person reid cannot be successfulusing hard biometrics information mainly because the data collected by CCTVs have poorresolution such that the required information (e.g., iris) are not available.
Unlike hard biometrics, soft biometrics are human understandable features that help todistinguish one person from another. Traits such as hairstyle, gender, body figure, height,hair color, and clothing style are examples of human characteristics that people use todistinguish one person from another. Soft biometric attributes are prone to be altered andcounterfeit easily and are not appropriate to be used solely in secured verification systems,e.g., accessing bank account; however, they are robust to some extent of noise caused bylowresolution data and illumination variation. More importantly, soft biometrics couldbe captured without people’s collaboration and could speed up the search process for thequery person in the verification systems. For example, if the query person is confirmedto be a male, the search process for this person in the galley data could be done onlyamong males, improving the system overall performance when identifying/verifying theuser [18].
Soft biometric characteristics are also known as semantic features, improving the qualityof the final feature representation of the subjects. Convolutional Neural Networks arebelieved to be successful in obtaining representative feature maps from data; however,person reid is a challenging task such that the final representations obtained by holisticCNNs are insufficient for an accurate reid task. In general, human operators decisionis based on matching characteristics originated from soft biometric attributes, whereas,computerbased person reid systems exploit lowlevel and midlevel features such as
3

Soft Biometrics Analysis in Outdoor Environments
textures, colors, and spatial structures. Therefore, successful estimation of people’ssoft biometrics can mimic human ability and provide a different and valuable sourceof information. Further, this information can be fused with CNNbased features andrepresent richer final representations of input data [19].
1.2 Objectives
Generally, the objective of this research is to study HAR and person reid problems basedon image data collected by video surveillance cameras in uncontrolled environments.Our specific objectives follow the goals of two practical projects that support this thesis:BIODI: Biometria e Deteção de Incidentes 1 and CLOUDSPOLIS: Cloudification ofAutonomous Security Agents for Urban Environments 2.In the scope of theBIODIproject, the industrial partner, TOMIWORLDcompany 3, aimedto set up some urban information panels all over Portugal, in which the soft biometrics ofpeople were required. It is believed that the quantity and quality of learning data candirectly affect the performance of the PAR models. However, the data in the existingPAR datasets have low variability and, more importantly, do not match the data thatour proposed PAR model needs to work with later (the inference phase). Therefore, theexisting domain gap between our data and the existing datasets lead us to collect a newdataset for our industrial needs. Our first objective was to collect and annotate a massivedataset from Portugal and Brazil in different parts of the day, weather, illumination, andenvironments. The annotation was performed for several fullbody soft biometrics suchas gender, height, weight, ethnicity, hair color, hairstyle, upper body clothes, lower bodyclothes, carrying objects, action, wearing glasses, and hats. The next objective was todevelop a PAR model to be learned on the collected data and compared its performancewith the existing cuttingedged PAR frameworks.
In the scope of the CLOUDSPOLIS project, we aimed to study the existing stateoftheart person reid techniques and design a deep learning framework for person reid basedon surveillance data. The proposed solutions are then evaluated and compared with thestateoftheart techniques.
1.3 Contributions
The main contributions of this thesis are as follows.
• We provide a comprehensive review of the HAR datasets and methods. Wecategorize the HAR benchmarks into four groups: fullbody, face, fashion, andsynthetic datasets, and discuss the critical points to provide an insight regardingthe future data collection and annotation tasks. We also propose a challengebased
1https://www.it.pt/Projects/Index/45582http://wordpress.ubi.pt/c4/cloud-applications/3https://tomiworld.com/pt/meet-tomi/
4
Soft Biometrics Analysis in Outdoor Environments
taxonomy for PAR approaches and categorize the existing methods in five clusters:localization, limited data, attribute relation, occlusion, and class imbalance.
• We perform a short survey of surveys to and propose amultidimensional taxonomyto categorize various person reid studies: deep based versus handcraft basedapproaches, types of learning based on the amount of supervision, close and openworld identification settings, strategies of learning, data modality, the data type ofqueries, and contextual versus noncontextual approaches. We also discuss privacyand security concerns caused by processing people’s visual data collected by CCTVs.
• We present a posesensitive regionbased framework for pedestrian genderrecognition from fullbody images of people collected from surveillance camerasfrom far distances in the wild. The proposed framework takes advantage of humandetection and tracking algorithms to capture the bounding boxes of persons. Then,we use an offtheshelf body skeleton detector to infer the rough body pose (front,back, side) of the person and extract several regions of interest (raw, head, convhullof body). Finally, considering each pair of the considered body pose and theextracted regions of interest, we feed the data to nine specialized CNNs and considerthe output of the most confident CNN as the final output, which means that themodel decides based on an optimum perspective.
• We propose an attentionbasedmultitask PARmodel to predict multiple attributesof pedestrians at once. To provide the attention of the body region and filter thedestructive background feasters, we present a multiplication layer situated on topof the convolutional layers and multiplies a binary mask with the feature maps.In addition, to implicitly consider the correlation between persons’ attributes, weintegrate a multibranch classifier into the model. This helps to relativize theimportance of each group of attributes using a weighted loss function.
• We address the shortterm person reid task. We present an imageprocessingtechnique integrated into the learning process of deep learning architectures as adata augmentation process. The proposed technique implicitly defines the receptivefields of CNNs by providing a set of synthesized data for the training phase. Inpractice, we use a segmentation algorithm to obtain the background region and thebody area of subjects and then interchange these segments with other samples inthe learning set. As a result, the model learns from the synthesized data that thebackground region is changeable and identity labels are only correlated to the bodyarea. The proposed solution has some benefits: it is compatible and integrable withthe existing data augmentation techniques, it fully preserves the label informationof the original data, it is a parameterlearningfree technique.
• We study the problem of longterm person reid setting in which the query subjectsmay appear with different clothing styles in the gallery set. The proposed solutiontakes advantage of an image transformation step that facilitates the extraction ofidentityunrelated features of persons, including the background area and cloth
5

Soft Biometrics Analysis in Outdoor Environments
Figure 1.2: Gantt chart: the research progress path including passed courses, industrial researchprojects, publications, internship period and thesis preparation time line.
textures. Next, we employ a simple CNN equipped with a cosine similarity lossfunction to only focus on the identityrelated features by learning some embeddingsthat are dissimilar to the previously obtained identityunrelated features. The mainidea of this strategy is to enhance the quality of the final feature representationsof people learned by the CNNs in the learning phase; so, the image transformationprocess and the step performed for extraction of the identityunrelated features areskipped during the inference phase.
1.4 Research Progress Path
InFig. 1.2, we illustrate the progress path of this research thesis in aGantt Chart, includingthe passed courses, accomplished industrial projects, published papers, timeline of theinternship and thesis preparation..
The industrial research projects, namely BIODI: Biometria e Deteção de Incidentesand CLOUDSPOLIS: Cloudification of Autonomous Security Agents for UrbanEnvironments provided the financial supports for conducting this PhD research for 2 and1 years, respectively. Regarding the BIODI project, first, we collected and annotated acomprehensive fullbody biometric dataset, and in the remaining time, we implementedtwo solutions for pedestrian attribute recognition from lowresolution images in the wild.During the CLOUD project period, we focused on the task of person reid in both short
6

Soft Biometrics Analysis in Outdoor Environments
term and longterm scenarios and proposed competitive frameworks compared to theexisting state of the art methods.
The third cycle of study (PhD) in the University of Beira Interior is a course and researchbased degree, in which the student first passes several courses prior to entering into theresearch activities. To accomplish this PhD thesis, totally 5 courses were passed: C #1)Advanced Topics in Computer Engineering, C#2) Neural Networks, C#3) Thesis andSeminar Project, C#4) Biometric Systems, C#5) Cloud Computing Architecture Topics(see Fig. 1.2).
The objective of the Advanced Topics in Computer Engineering course was to providethe attendee with the scientific skills and knowledge of research methodologies. Anotheraim of this course was to prepare the student for conducting a survey study on the stateof the arts of a selected topic. The Neural Networks course was taken in the samesemester so that the combined knowledge acquired from both previous courses resultedin commencing two survey publications. In the next semester, the course of Thesis andSeminar Project was attended to gain the knowledge of preparing a research proposal forthe remainder of the PhD.
At the beginning of the second year, the courses Biometric Systems and Cloud ComputingArchitecture Topics were participated to improve the general knowledge of recentcomputer vision techniques in biometrics and cloudbased platforms such as googlecolab 4. Specifically, the objective of the Biometric Systems course was to provide theattendee with deep insight about the knowledge behind the cutting edge commercialbiometric products such as Microsoft Azure 5, Face ++ 6 and Aura Vision 7.
The contribution of this thesis in the biometric field of study is 6 firstauthored articlesand 4 collaborative publications. The primary publications include 2 survey articles(published in the Applied Sciences and Pattern Recognition Letters journals) and 4technical papers, from which 2 were published in the Image and Vision Computing andPattern Recognition Letters journals, one was presented in the BIOSIG2019 conferenceinGermany, and one has been recently submitted to a journalmedia. The contributions ofthese publications were described in detail in section 1.3. In addition, the timeline of thecollaborative publications have been illustrated in Fig. 1.2, and the body of these papershave been presented in attachments 9. The collaborative publicationswere in linewith theobjectives of the BIODI and CLOUD projects, in which we first collected and annotatedtwo pedestrian datasets respectively using standstill panels in the urbane environmentsand using a drone with a mobile camera. Then, developed different solutions to competewith the existing state of the art methods in the field.
The internship period was accomplished in collaboration with Prof. Ruben VeraRodriguez, associate professor at the Universidad Autonoma de Madrid. As a result ofthis collaboration, one paper idea is under process, which is about studying the effectof synthesized data (using human 3D models) on enhancing the generalization ability of
4https://colab.research.google.com/5https://azure.microsoft.com/6https://www.faceplusplus.com/7https://auravision.ai/
7

Soft Biometrics Analysis in Outdoor Environments
CNNs for person reid and pedestrian attribute recognition tasks.
1.5 Thesis Structure
As discussed previously, soft biometric analysis with a focus on attribute recognition andperson reid are longlasting research topics, mainly because of the continuing demandfor monitoring the public environments and social behaviors. Over the last decade, deepconvolutional neural networks caused remarkable improvements in the area of pedestrianattribute recognition and person reid and showed that the performance of the modernsurveillance systems even could reach human recognition ability.
In chapter 2, we review the literature of PAR methods and data. We discuss five mainexisting challenges: localization, limited data, attribute relation, occlusion, and classimbalance. Generally, an optimum localizationbased PAR model recognizes attributesbased on their expected location; for instance, people’s hair color and hairstyle aredetected from the head and shoulder area. The challenge of limited data refers tothe fact that the existing learning datasets annotated with human attributes are finite,limiting the generalization ability of the model. Attribute relation is another factorrequired to be considered since the occurrence probability of some attributes is correlatedtogether. For example, the probability of having a beard is very low for a persondetected as female. Occlusion is another challenge that requires attention because, inuncontrolled environments, others or objects may block some body parts of the subjectperson. All the visual attributes may not appear in everybody (e.g., wearing a hat),resulting in the fact that human attribute datasets become very imbalanced in someclasses. The challenges mentioned above are repeatedly addressed to different extentsin PAR literature; therefore, in chapter 2, we propose a challengedbased taxonomy tocategorize them.
We survey several person reid surveys in chapter 3. Based on several recent surveys, wesuggest that the existing reid strategies can be categorized from five points of view such asscalability, preprocessing and augmentation, model architecture design, postprocessingstrategies, and robustness to noise. Works with a focus on scalability try to proposeefficient techniques to improve the speed and accuracy of person reid frameworksand perform onboard processing. For example, hashing and transfer learning aretwo hot topics that lie in the area of scalabilitybased techniques. Preprocessing andaugmentation approaches improve the quality (e.g., generating occluded body parts) orquantity (e.g., synthesizing new samples) of learning data. Some stateoftheart personreid frameworks come up with novel deep architectures or processing blocks to improvethe final representation of the person by extracting the most useful local and globalfeatures. In general, person reidmodels receive an image of the target person and delivera list of images of persons that have the most similarity with the target. Approachesthat attempt to reorder the detection list are known as postprocessing strategies or reranking techniques. Last but not least, person reid frameworks have tomanage the noisesresulted from inaccurate bounding boxes of persons, occluded body parts, and wrong
8

Soft Biometrics Analysis in Outdoor Environments
annotations, which is investigated as the last perspective to the literature of the person reid field. In short, in chapter 3, we address the person reid problem from five perspectivesand elaborate on each of them to highlight the recent advances in the field.
In chapter 4, we propose a posesensitive regionbased gender classification framework.Considering the assumption that regional features and body pose can improve the qualityof the final representation of people, we suggest a framework that provides severalclassification scores based on the subject’s pose and some Regions of Interest (RoI)s.Our experimental results on three datasets such as BIODI, PETA, and MIT show thatthe aggregation of these classification scores contributes to solid improvements in genderrecognition accuracy from fullbody images in the wild.
In chapter 5, we propose a model that estimates multiple attributes of people at thesame time. To this end, we implement a multitask framework to consider the semanticcorrelation between pedestrian attributes and suggest an elementwise multiplicationlayer to remove destructive features, i.e., background area. Additionally, we present aweightedsum loss function to manage the importance of each task (groups of attributes)in the course of model training. Finally, we train and test the proposed framework ontwo wellknown PAR datasets (i.e., PETA and RAP) and compare the performance withseveral stateoftheart methods.
In chapter 6, we propose a data augmentation technique for person reid frameworksthat help to define the receptive fields of the CNN implicitly. Furthermore, consideringthe harmful effects of background features on the performance of person reid models,we present a preprocessing image approach that increases the quantity of learning datasuch that the person reidmodel interprets that the identity and cluttered descriptions arenot correlated. The presented model is evaluated on several person reid datasets: RAP,Market1501, and MSMT17V2.
In chapter 7 we address the problem of person reid with an assumption that the samepeople may appear with different clothing styles. First, we propose to extract theIDunrelated features of each person by synthesizing an image from each instance inthe learning set. Then, we employ a model to learn the longterm representation ofpersons from the original samples, such that the loss function of the model imposesthe embeddings to be dissimilar to the previously extracted IDunrelated embeddings.This way, the person reid model learns the IDrelated features of people and ignoresthe background and clothes information. To evaluate the suggested approach, we usetwo longterm person reid datasets namely PRCC, and LTCC. Finally, we compare ourexperimental results with several current methods to evaluate the effectiveness of theproposed framework.
Finally, in chapter 8, we present the conclusions, including discussions on the proposedsolutions, memorization of our contributions, and highlights of several future researchdirections. We discuss that the performance of stateoftheartmethods has exponentiallyimproved over the recent years. However, some scenarios have not been studiedprofoundly and require more attention to fill the gap between the studies conducted inthe laboratories and the industry demands.
9

Soft Biometrics Analysis in Outdoor Environments
Bibliography
[1] N. Dilshad, J. Hwang, J. Song, and N. Sung, “Applications and challenges invideo surveillance via drone: A brief survey,” in 2020 International Conference onInformation and Communication Technology Convergence (ICTC). IEEE, 2020,pp. 728–732. 1
[2] A. Grigorev, S. Liu, Z. Tian, J. Xiong, S. Rho, and J. Feng, “Delving deeper indronebased person reid by employing deep decision forest and attributes fusion,”ACM Transactions on Multimedia Computing, Communications, and Applications(TOMM), vol. 16, no. 1s, pp. 1–15, 2020. 1
[3] L. Zheng, Y. Yang, and A. G. Hauptmann, “Person reidentification: Past, presentand future,” arXiv preprint arXiv:1610.02984, 2016. 1
[4] A. BedagkarGala and S. K. Shah, “A survey of approaches and trends in person reidentification,” IMAGE VISION COMPUT, vol. 32, no. 4, pp. 270–286, 2014. 1
[5] J. M. Grant and P. J. Flynn, “Crowd scene understanding from video: a survey,”ACM Transactions on Multimedia Computing, Communications, and Applications(TOMM), vol. 13, no. 2, pp. 1–23, 2017. 1
[6] N. Khalid,M. Gochoo, A. Jalal, andK. Kim, “Modeling twoperson segmentation andlocomotion for stereoscopic action identification: A sustainable video surveillancesystem,” Sustainability, vol. 13, no. 2, p. 970, 2021. 1
[7] A. B. Mabrouk and E. Zagrouba, “Abnormal behavior recognition for intelligentvideo surveillance systems: A review,” Expert Systems with Applications, vol. 91,pp. 480–491, 2018. 1
[8] D. R. Beddiar, B. Nini, M. Sabokrou, and A. Hadid, “Visionbased human activityrecognition: a survey,” Multimedia Tools and Applications, vol. 79, no. 41, pp.30 509–30555, 2020. 1
[9] Q. Ke, M. Fritz, and B. Schiele, “Timeconditioned action anticipation in one shot,”in Proceedings of the IEEE/CVF Conference on Computer Vision and PatternRecognition, 2019, pp. 9925–9934. 1
[10] J. Arunnehru and M. K. Geetha, “Automatic human emotion recognition insurveillance video,” in Intelligent Techniques in Signal Processing for MultimediaSecurity. Springer International Publishing, Oct. 2016, vol. 660, pp. 321–342.[Online]. Available: https://doi.org/10.1007/9783319447902_15 1
[11] E. Yaghoubi, A. Kumar, andH. Proença, “Ssspr: A short survey of surveys in personreidentification,” Pattern Recognit. Lett., vol. 143, pp. 50–57, 2021. 1
[12] E. Yaghoubi, D. Borza, J. Neves, A. Kumar, and H. Proença, “An attentionbaseddeep learning model for multiple pedestrian attributes recognition,” IMAGE
10

Soft Biometrics Analysis in Outdoor Environments
VISION COMPUT., pp. 1–25, 2020. [Online]. Available: https://doi.org/10.1016/j.imavis.2020.103981 1
[13] E. Bentafat, M. M. Rathore, and S. Bakiras, “A practical system for privacypreserving video surveillance,” in International Conference on AppliedCryptography and Network Security. Springer, 2020, pp. 21–39. 1
[14] X. Wang, S. Zheng, R. Yang, B. Luo, and J. Tang, “Pedestrian attribute recognition:A survey,” arXiv preprint arXiv:1901.07474, 2019. 2
[15] A. Brunetti, D. Buongiorno, G. F. Trotta, and V. Bevilacqua, “Computer visionand deep learning techniques for pedestrian detection and tracking: A survey,”Neurocomputing, vol. 300, pp. 17–33, 2018. 2
[16] Y. Liu, H. Yang, and Q. Zhao, “Hierarchical feature aggregation from body partsfor misalignment robust person reidentification,” Applied Sciences, vol. 9, no. 11,p. 2255, 2019. 2
[17] E. Yaghoubi, F. Khezeli, D. Borza, S. Kumar, J. Neves, and H. Proença, “Humanattribute recognition—a comprehensive survey,” Applied Sciences, vol. 10, no. 16, p.5608, 2020. 2
[18] F. BecerraRiera, A. MoralesGonzález, and H. MéndezVázquez, “A survey onfacial soft biometrics for video surveillance and forensic applications,” ArtificialIntelligence Review, vol. 52, no. 2, pp. 1155–1187, 2019. 3
[19] B. Hassan, E. Izquierdo, and T. Piatrik, “Soft biometrics: a survey,” MultimediaTools and Applications, Mar. 2021. [Online]. Available: https://doi.org/10.1007/s11042021106228 4
11

Soft Biometrics Analysis in Outdoor Environments
12

Soft Biometrics Analysis in Outdoor Environments
Chapter 2
Human Attribute Recognition: AComprehensive Survey
Abstract. Over the last decade, the field of HAR has dramatically changed, mainly due tothe improvements brought by deep learning solutions. This survey reviews the progressobtained in HAR, considering the transition from the traditional handcrafted to deeplearning approaches. The most relevant works on the field are analyzed concerning theadvances proposed to address the HAR’s typical challenges. Furthermore, we outlinethe applications and typical evaluation metrics used in the HAR context and providea comprehensive review of the publicly available datasets for the development andevaluation of novel HAR approaches.
2.1 Introduction
Over recent years, the increasing amount of multimedia data available in the Internetor supplied by ClosedCircuit TeleVision (CCTV) devices deployed in public/privateenvironments has been raising the requirements for solutions able to automaticallyanalyse human appearance, features and behavior. Hence, HAR has been attractingincreasing attentions in the computer vision/pattern recognition domains, mainly dueto its potential usability for a wide range of applications (e.g., crowd analysis [1], personsearch [2; 3], detection [4], tracking [5], and reidentification [6]). HAR aims atdescribing and understanding the subjects’ traits (such as their hair color, clothingstyle [7], gender [8], etc.) either from fullbody or facial data [9]. Generally, there arefour main subcategories in this area of study:
• Facial Attribute Analysis (FAA). Facial attribute analysis aims at estimating thefacial attributes or manipulating the desired attributes. The former is usuallycarried out by extracting a comprehensive feature representation of the face image,followed by a classifier to predict the face attributes. On the other hand, inmanipulation works, face images are modified (e.g., glasses are removed or added)using generative models.
• Fullbody Attribute Recognition (FAR). Fullbody attribute recognition regards thetask of inferring the softbiometric labels of the subject, including clothing style,headregion attributes, recurring actions (talking to the phone) and role (cleaninglady, policeman), regardless of the location or body position (eating in a restaurant).
• PAR. As an emerging research subfield of HAR, PAR focuses on the fullbodyhuman data that have been exclusively collected from video surveillance camerasor panels, where persons are captured while walking, standing, or running.
13

Soft Biometrics Analysis in Outdoor Environments
Figure 2.1: Typical pipeline to develop a HAR model.
• Clothing Attribute Analysis (CAA). Another subfield of human attribute analysisthat is exclusively focused on clothing style and type. It comprises several subcategories such as inshop retrieval, costumertoshop retrieval, fashion landmarkdetection, fashion analysis, and cloth attribute recognition, each of which requiresspecific solutions to handle the challenges in the field. Among these subcategories, cloth attribute recognition is similar to pedestrian and fullbody attributerecognition and studies the clothing types (e.g., texture, category, shape, style).
The typical pipeline of the HAR systems is given in Figure 2.1, which indicates therequirement of a dataset preparation prior to designing a model. As shown in Figure 2.1,preparing a dataset for this problem typically comprises four steps:
1. Capturing raw data, which can be accomplished using mobile cameras (e.g., drone)or stationary cameras (e.g., CCTV). Also, the raw data might even be collected fromimages/videos publicly available (e.g., Youtube, or similar sources).
2. In most supervised training approaches, HARmodels consider one person at a time(instead of analyzing a fullframe with multiple persons). Therefore, detecting thebounding boxes of each subject is essential and can be done by stateoftheart objectdetection solutions (i.e., Mask RCNN [10], YouOnly LookOnce (YOLO) [11], SingleShot Detector (SSD) [12], etc.)
3. If the raw data is in video format, spatiotemporal information should be kept.in such cases, the accurate tracking of each object (subject) in the scene cansignificantly ease the annotation process.
4. Finally, in order to label the data with semantic attributes, all the bounding boxesof each individual are displaced to human annotators. based on human perception,the desired labels (e.g., ‘gender’ or ‘age’) are then associated to each instance of thedataset.
Regarding the datatype and available annotations, there are many possibilities fordesigning HAR models. Early researches were based on crafted feature extractors.Typically, the linear Support Vector Machine (SVM) was used with different descriptors(such as ensemble of localized features, local binary patterns, color histograms, histogramof oriented gradients) to estimate the human attributes. However, as the correlationbetween human attributes were ignored in traditional methods, one single model was
14

Soft Biometrics Analysis in Outdoor Environments
not suitable for estimating several attributes. For instance, descriptors suitable forgender recognition could not be effective enough to recognize the hairstyle. Therefore,conventional methods mostly focused on obtaining independent feature extractors foreach attribute. After the advent of Convolutional Neural Network (CNN)s and using itas a holistic feature extractor, a growing number of methods focused on models that canestimate multiple attributes at once. Earlier deepbased methods used shallow networks(e.g., 8layer AlexNet [13]), while later models moved towards deeper architectures (e.g.,Residual Networks (ResNet)) [14].The difficulties inHAR originatesmainly due to the highvariability in human appearanceparticularly in intraclass samples. Nevertheless, the following factors have beenidentified as the basis for the development of robust HAR systems:
• learn in an endtoend manner and yield multiple attributes at once;
• extract a discriminative and comprehensive feature representation from the inputdata;
• leverage the intrinsic correlations between attributes;
• consider the location of each attribute in a weakly supervised manner;
• are robust to primary challenges such as lowresolution data, pose variation,occlusion, illumination variation, and cluttered background;
• handle the classes imbalance;
• manage the limiteddata problem effectively.
Despite the relevant advances and many research articles published, HAR can beconsidered still in its early stages. For the community to comeupwith original solutions, itis necessary to be aware of the history of advancements, stateoftheart performance, andthe existing datasets related to this field. Therefore, in this study, we discuss a collectionof HAR related works, starting from the traditional one to the most recent proposals,and explain their possible advantages/drawbacks. We further analyze the performanceof recent studies. Moreover, although we identified more than 15 publicly available HARdatasets, to the best of our knowledge, we donot have a clear discussion on the aspects thatone should observe while collecting a HAR dataset. Thus, after taxonomizing the datasetsand describing theirmain features and data collection setups, we discuss the critical issuesof the data preparation step.Regarding the previously published surveys that addressed similar topics, we particularlymention Zheng et al. [15], where the facial attributemanipulation and estimationmethodshave been reviewed. However, to date, there is no solid survey on the recent advances inother subcategories of human attribute analysis. As the essence of fullbody, pedestrian,and cloth attribute recognition methods are similar to each other; in this paper, wecover all of them with a particular focus on the pedestrian attribute recognition methods.Meanwhile, Reference [16] is the only work similar to our survey that is about pedestrianattribute recognition. Several points distinguish our work from Reference [16]:
15

Soft Biometrics Analysis in Outdoor Environments
• The recent literature on HAR has been mostly focused on addressing someparticular challenges of this problem (such as class imbalance, attribute localization,etc.) rather devising a general HAR system. Therefore, instead of providing amethodological categorization of the literature as in Reference [16], our surveyproposes a challengebased taxonomy, discussing the stateoftheart solutions andthe rationale behind them;
• Contrary to Reference [16], we analyze themotivation of each work and the intuitivereason for its superior performance;
• The datasets main features, statistics and types of annotation are compared anddiscussed in detail;
• Beside the motivations, we discuss HAR applications, divided into three maincategories: security, commercial, and related research directions.
Motivation and Applications
Human attribute recognition methods extract semantic features that describe humanunderstandable characteristics of the individuals in a scene, either from images orvideo sequences, ranging from demographic information (gender, age, race/ethnicity),appearance attributes (body weight, face shape, hairstyle and color etc.), emotional state,to themotivation and attention of people (head pose, gaze direction). As they provide vitalinformation about humans, such systems have already been integrated into numerousrealworld applications, and are entwined with many technologies across the globe.Indisputably, HAR is one of the most important steps in any visual surveillance system.Biometric identifiers are extracted to identify and distinguish between the individuals.Based on the biometric traits, humans are uniquely identified, either based on their facialappearance [17–19], iris patterns [20] or on behavioral traits (gait) [21; 22]. With theincrease of surveillance cameras worldwide, the research focus has shifted from hardbiometric (e.g., iris recognition and palm print) to soft biometric identifiers. The latterdescribe human characteristics, taxonomized into a humanly understandable manner,but are not sufficient to uniquely differentiate between individuals. Instead, they aredescriptors used by humans to categorize their peers into several classes.On a top level, HAR applications can be divided into three main categories: security andsafety, research directions, and commercial applications.Yielding highlevel semantic information, HAR could provide auxiliary information fordifferent computer vision tasks, such as person reidentification ([23; 24]), human actionrecognition [25], scene understanding, advanced driving assistance systems, and eventdetection ([26]).Another fertile field where HAR could be applied is in human drone surveillance. Dronesor Unmanned Aerial Vehicle (UAV), although initially designed for military applications,are rapidly extending to various other application domains, due to their reducedsize, swiftness, and ability to navigate through remote and dangerous environments.
16

Soft Biometrics Analysis in Outdoor Environments
Researchers in multiple fields have started to use UAVs drones in their research work,and, as a result, the Scopus database has shown an increase in the papers related toUAVs, from 11 (4.7 × 10⁶ of total papers) papers published in 2009 to 851 (270.0 ×10⁶ of total articles) published in 2018 [27]. In terms of human surveillance, droneshave been successfully used in various scenarios, ranging from rescue operations andvictim identification, people counting and crowd detection, to police activities. All theseapplications require information about human attributes.
Nowadays, researchers in universities and major car industries work together to designand build the selfdriving cars of the future. HAR methods have important implicationsin such systems as well. Although numerous papers addressed the problem of pedestriandetection, pedestrian attribute recognition is one of the keys to future improvements.Cues about the pedestrians’ body and head orientation provide insights about their intent,and thus avoiding collisions. The pedestrians’ age is another aspect that should beanalyzed by advanced driving assistance systems to decrease vehicle speed when childrenare on the sidewalk. Finally, other works suggest that even pedestrians’ accessories couldbe used to avoid collisions: starting from the statistical evidence that collisions betweenpedestrians and vehicles are more frequent on rainy days, in Reference [28] authorssuggest that detecting whether a pedestrian has on open umbrella could reduce trafficincidences.
As mentioned above, the applications of biometric cues are not limited to surveillancesystems. Such traits have necessary implications also in commercial applications (logins,medical records management) and government applications (ID cards, border, andpassport control) [29]. Also, a recent trend is to have advertisement displays in malls andstores equipped with cameras and HAR systems to extract sociodemographic attributesof the audience and present appropriate and targeted ads based on the audience’s gender,generation or age.
Of course, this application list is not exhaustive, andnumerous other practical uses ofHARcan be envisioned, as this task has implications in all fields interested in and requiring(detailed) human description.
In the remainder of this paper, we first describe the HAR preliminaries—datasetpreparation, and the general difference between the earliest and most recent modelapproaches. In Section 2.3, we survey the HAR techniques from their main challengepointofview, in order to increase the reader’s creativity in introducing novel ideas forsolving the task of HAR. Further, in Sections 2.4 and 2.5, we detail the existing PAR, FAR,and CAA datasets and commonly used evaluation metrics for HAR models. In Section2.6, we discuss the advantages and disadvantages of the abovepresented methods andcompare their performance over the wellknown HAR datasets.
2.2 Human Attribute Recognition Preliminaries
To recognize the human fullbody attributes, it is necessary to follow a twostep pipeline,as depicted in Figure 2.1. In the remainder of this section, each of these steps is described
17

Soft Biometrics Analysis in Outdoor Environments
in detail.
2.2.1 Data Preparation
Developing a HAR model requires relevant annotated data, such that each person ismanually labeled based on its semantic attributes. As discussed in Section 2.4, thereare different types of data sources such as fashion, aerial, and synthetic datasets, whichcould be collected from the Internet resources (e.g., Flickr) or through static or mobilecameras in indoor/outdoor locations. HAR models are often developed to recognizehuman attributes from person bounding boxes (instead of analyzing an entire framecomprising multiple persons). That is why, after the data collection step, it is requiredto preprocess the data and extract the bounding box of each person. Earlier methodsuse human annotators to specify the person locations in each image, and then assignsoft biometric labels to each of person bounding boxed, while recent approaches takeadvantage of the CNNbased person detectors (e.g., Reference [10])—or trackers [30], ifthe data is collected as videos—to provide the human annotators with person boundingboxes for more labeling processes. We refer the interested reader to Reference [31] formore information on person detection and tracking methods.
2.2.2 HARModel Development
In this part, we discuss the main problem in HAR and highlight the differences betweenthe earlier methods and the most recent deep learningbased approaches.
In machine learning, classification is most often seen as a supervised learning task, inwhich a model learns from the labeled input data to predict the appeared classes inthe unseen data. For example, given many person images with gender labels (‘male’ or‘female’), we develop an algorithm to find the relationship between images and labels,based on which we predict the labels of the new images. Fisher’s linear discriminant [32],support vector machine [33], decision trees [34; 35], and neural networks [36; 37] areexamples of classification algorithms. As the input data is large or suspected to haveredundant measures, before analyzing it for classification, the image is transformedinto a reduced set of features. This transformation can be performed using neuralnetworks [38] or different feature descriptors [39]—such as Major Colour SpectrumHistogram (MCSH) [40], Color Structure Descriptor (CSD) [41; 42], ScaleInvariantFeature Transform (SIFT) [43; 44], Maximally Stable Colour Regions (MSCR) [45; 46],Recurrent HighlyStructured Patches (RHSP), and Histogram of Histogram of OrientedGradients (HOG) [47–49]. Image descriptors are not generalized to all the computervision problems and may be suitable only for specific data type—for example, colordescriptors are only suitable for color images. Therefore, models based on featuredescriptors are often called handcrafted methods, in which we should define andapply proper feature descriptors to extract a comprehensive and distinct set of featuresfrom each input image. This process may require more feature engineering, such asdimensionality reduction, feature selection, and fusion. Later, based on the extracted
18

Soft Biometrics Analysis in Outdoor Environments
features, multiple classifiers are learned, such that each one is specialized in predictingspecific attributes of the given input image. As the reader may have noticed, thesesteps are offline (the result of each step should be saved on the disk as the input ofthe next step). On the contrary, deep neural networks are capable of modeling thecomplex nonlinear relationships between the input image and labels, such that thefeature extraction and classifier learning are performed simultaneously. Deep neuralnetworks are implemented as multilevel (large to small featuremap dimensions) layers,in which different processing filters are convoluted with the output of the previous layer.In the first levels of the model, lowlevel features (e.g., edges) are extracted, while midlayers and lastlayers extract the midlevel features (e.g., texture) and highlevel features(e.g., expressiveness of the data), respectively. To learn the classification, several fullyconnected layers are added on top of the convolutional layers (known as a backbone) tomap the last feature map to a feature vector with several neurons equal to the number ofclass labels (attributes).
Several major advantages of deep learning approaches moved the main research trendtowards the deep neural network methods. First, CNNs are endtoend (i.e., both thefeature extraction and classification layers are trained simultaneously). Second, the deepneural networks’ high generalization ability has provided the possibility of transferring theknowledge of other similar fields to scenarios with limited data. As an example, applyingthe weights of a model that has been trained on a large dataset (e.g., ImageNet [50]) notonly has shown positive effects on the accuracy of the model but also has decreased theconvergence time and overfitting problem [51–53]. Thirdly, CNNs could be designed tohandle multiple tasks and labels in a unified model [54; 55].
To fully understand the discussion on the state of the arts in HAR, we encourage thenewcomer readers to read about different architectures of deep neural networks andtheir components in References [56; 57]. Meanwhile, common evaluation metrics areexplained in Section 2.5.
2.3 Discussion of Sources
As depicted in Figure 2.2, we identified five major challenges frequently addressed bythe literature on HAR—localization, limited learning data, attribute relation, bodypartocclusion, and data class imbalance.
HAR datasets only provide the labels for a bounding box of person, but the locationsrelated to each attribute are not annotated. Finding which features are related to whichparts of the body is not a trivial task (mainly because body posture is always changing), andnot fulfilling it may cause an error in prediction. For example, recognizing the ‘wearingsunglasses’ attribute in a fullbody image of a person without considering the eyeglasses’location may lead to omitting the sunglasses feature information due to extensive poolinglayers and a small region of the eyeglasses, compared to the whole image. This challengeis known as localization (Section 2.3.1), as in which we attempt to extract features ofdifferent spatial locations of the image to be certain no information is lost, and we can
19

Soft Biometrics Analysis in Outdoor Environments
extract distant features from the input data.
Earlier methods used to work with limited data as the mathematical calculations werecomputationally expensive, and increasing the amount of data could not justify theexponential computational cost and the amount of improvement in the accuracy. After thedeep learning breakthrough, more data proved to be effective in the generalization abilityof the models. However, collecting and annotating very large datasets is prohibitivelyexpensive. This issue is known as limited data challenge, which has been the subjectof many studies in the deep neural network fields of study, including deepbased HAR,addressed in Section 2.3.2.
In the context of HAR, dozens of attributes are often analyzed together. As humans, weknow that someof these attributes are highly correlated, and knowing one can improve therecognition probability of the other attributes. For example, for a person wearing a ‘tie,’it is less likely to wear a ‘Pyjama’ and more likely to wear a ‘shirt’ and ‘suit’. Studies thataddress the relationship between attributes as their main contribution are categorized inthe ‘attribute relation’ taxonomy and discussed in Section 2.3.3.
Body parts occlusion is another challenge when dealing with HAR data that has not yetbeen addressed by many studies. The challenge in occluded body parts is not only aboutthe missing information of the body parts, but also the presence of some misleadingfeatures of other persons or objects. Further, because in HAR, some attributes are relatedto specific regions, considering the occluded parts before the prediction is important.For example, for a person with an occluded lower body, yielding predictions about theattributes located in the lower body region is questionable. In Section 2.3.4, we discussthe methods and ideas that have particularly addressed the occlusion in HAR data.
Another critical challenge in HAR is the imbalanced number of samples in each class ofdata. Naturally, an observer sees fewer persons wearing long coats, while there are manypersons in the community that appear with a pair of jeans. That is why the HAR datasetsare intrinsically imbalanced and cause the model to be biased/overfitted on some classesof data. Many studies address this challenge in HAR data, which have been discussed inSection 2.3.5.
Among themajor challenges inHAR, considering attribute correlation and extracting finegrained features from local regions of the given data have attracted the most attention,such that recent works [58; 59] attempt to develop some models that could addressboth challenges at the same time. Data class imbalance is another contribution of manyHARmethods which is often handled by applying weighted loss functions to increase theimportance of the minority samples and decrease the effect of the samples from classeswith many samples. To deal with limited data challenges, scholars frequently applythe existing holistic transfer learning and augmentation techniques in computer visionand pattern recognition. In this section, we discuss the significant contributions of theliterature works in alleviating the main challenges in HAR.
20

Soft Biometrics Analysis in Outdoor Environments
Figure 2.2: The proposed taxonomy for main challenges in HAR.
2.3.1 Localization Methods
Analyzing human fullbody images only yields the global features; therefore, to extractdistinct features from each identity, analyzing local regions of the image becomesimportant [60]. To capture the human finegrained features, typical methods divide theperson’s image into several strides or patches and aggregate all the decisions on partsto yield the final decision. The intuition behind these method is that, decomposition ofhumanbody and comparing it with others is intuitively similar to localizing the semanticbodyparts and then describing them. In the following, we survey 5 types of localizationapproaches—(1) attribute locationbased methods that consider the spatial location ofeach attribute in the image (e.g., glasses features are located in the head area, while shoesfeatures are in the lower part of the image); (2) attention mechanismbased techniquesthat attempts to automatically find on the most important locations of the image basedon the ground truth labels; (3) body partbased models, in which the model first locatesthe body parts (i.e., head, torso, hands, and legs) and then extract the related featuresfrom each body parts and aggregate them; (4) poseletbased techniques that extractsthe features from many random locations of the image and aggregate them; (5) pose
21

Soft Biometrics Analysis in Outdoor Environments
estimationbasedmethods that use the coordination of the body skeleton/joints to extractthe local features.
2.3.1.1 Pose EstimationBased Methods
Considering the effect of the bodypose variation of the feature representation, [61]proposes to learnmultiple attribute classifiers so that each of them is suitable for a specificbodypose. Therefore, authors use the Inception architecture [62] as the backbone featureextractor, followed by three branches to capture the specific features of the front, back,and side views of the individuals. Simultaneously, a viewsensitive module analyzes theextracted features from the backbone to refine each branch’s scores. The final results arethe concatenation of all the scores. Ablation studies on the PEdesTrian Attribute (PETA)dataset show that a plain Inception model achieves an 84.4 F1score, while for the modelwith a posesensitive module, this metric increases to 85.5.
Reference [63] is another research that takes advantage of pose estimation for improvingthe performance of pedestrian attribute recognition. In this work, Li et al. suggesteda twostream model whose results are fused, allowing the model to benefit from bothregular global and posesensitive features. Given an input image, the first stream extractsthe regular global features. The posesensitive branch comprises three steps—(1) coarsepose estimator (bodyjoint coordinates predictor) by applying the approach proposedin Reference[64], (2) region localization that uses the bodypose information to spatiallytransform the desired region, originally proposed in References [65], (3) fusion layer thatconcatenates the features of each region. In the first step, pose coordinates are extractedto be shared with the second module, in which body parts are localized by using spatialtransformer networks [65]. A specific classifier is then trained for each region. Finally, theextracted features from both streams are concatenated to return a comprehensive featurerepresentation of the given input data.
2.3.1.2 PoseLetBased Methods
The main idea of poselet based methods is to provide a bagoffeatures from the inputdata using different patching technique. As earlier methods lacked accurate body partdetectors, overlapping patches of the input images were used to extract local features.
Reference [66] is one of the first techniques in this group that uses Spatial PyramidRepresentation (SPR) [67] to divide the images into grids. Unlike a standard bagoffeatures method that extracts the features from a uniform patching distribution, theysuggest a recursive splitting technique, in which each grid has a parameter that is jointlylearned with the weight vector. Intuitively, the spatial grids are varying for each class,which leads to better feature extraction.
In Reference [68], hundreds of poselets are detected from the input data; a classifier istrained for each poselet and semantic attribute. Then, another classifier aggregates thebodypart information, with emphasis on the poselets taken from usual viewpoints thathave discriminative features. A third classifier is then used to consider the relationship
22

Soft Biometrics Analysis in Outdoor Environments
between the attributes. This way, by using the obtained feature representation, the bodypose and viewpoint are implicitly decomposed.
Noticing the importance of accurate bodypart detection when dealing with clothingappearance variations, Reference [69] proposes to learn a comprehensive dictionary thatconsiders various appearance part types (e.g., representing the lowerbody in differentappearances from bare legs to long skirts). To this end, all the input images are dividedinto static overlapping cells, each of which is represented by a feature descriptor. Then, asa result of feature clustering intoK clusters, they represent k types of appearance parts.
In Reference [70], the authors targeted the human attributes and action recognition fromstill images. To this end, supposing that the available human bounding boxes are locatedin the center of the image, the model learns the scale and positions of a series of imagepartitions. Later, themodel predicts the labels based on the reconstructed image from thelearned partitions.
To address the large variation in articulation, angle, and bodypose [71] proposes a CNNbased features extractor, in which each poselet is fed to an independent CNN. Then, alinear SVM classifier learns to distinguish the human attributes based on the aggregationbetween the fullbody and poselet features.
References [72; 73] showed that not only CNNs can yield a highquality featurerepresentation from the input, but also they are better at classification than SVMclassifiers. In this context, Zhu et al. propose to predict multiple attributes atonce, byimplicit regard to the attribute dependencies. Therefore, the authors divide the image into15 static patches and analyze each one with a separate CNN. To consider the relationshipbetween attributes and patches, they connect the output of some specific CNNs to therelevant static patches. For example, the upper splits of the images are connected to thehead and shoulder’s attributes.
Reference [74] claims that in previous poselet works, the location information of theattributes is ignored. For example, to recognize whether a person wears a hat or not,knowing that this feature is related to the upper regions of the image can guide themodel to extract more relevant features. To implement this idea, the authors used anInception [62] structure, in which the features of three different levels (low, middle,and high levels) are fed to three identical modules. These modules extract differentpatches from the whole and part of the input feature maps. The aggregation of the threebranches yields the final feature representation. By following this architectural design,the model implicitly learns the regions related to each attribute in a weakly supervisedmethod. Surprisingly, the baseline (the same implementation without the proposedmodule) achieves better results on the PETA dataset (84.9 vs. 83.4 of F1), while onRichly Annotated Pedestrian (RAP) dataset, the results of the model equipped with theirproposed module (F168.6) is better with a margin of 2.
Reference [75] receives the full frames and uses the scene features (i.e., hierarchicalcontexts) to help the model learn the attributes of the targeted person. For example, in asports scene, it is expected that people have sporty style clothing. Using Fast RCNN [76],the bounding box of each individual is detected, and several poselet are extracted. After
23

Soft Biometrics Analysis in Outdoor Environments
feeding the input frame and its Gaussian pyramids into several convolutional layers, fourfully connected branches are added to the top of the network to yield four scores (fromhuman bounding box, poselets, nearest neighbors of the selected parts, and fullframe)for a final concatenation.
2.3.1.3 PartBased Methods
Extracting discriminative finegrained features often requires first to localize patchesof the relevant regions in the input data. Unlike poseletbased methods that detectthe patches from the entire image, partbased methods aim to learn based on accuratebody parts (i.e., head, torso, arms, and legs). Optimal partbased models are (1) posesensitive (i.e., for similar poses, shows strong activations); (2) extendable to all samples;(3) discriminative on extracting features. CNNs can handle all these factors to someextend, and [77] empirical experiments confirm that for deeper networks, accurate bodyparts are less significant.As one of the first partbased works, inspired by a part detector (i.e., deformable partmodel [78], which captures viewpoint and pose variations), Zhang et al. [79] proposetwo descriptors that learn based on the part annotations. Their main objective is tolocalize the semantic parts and obtain a normalized pose representation. To this end,the first descriptor is fed by correlated body parts, while for the second descriptor, theinput body splits have no semantic correlation. Intuitively, the first descriptor is basedon the inherent semantics of the input image, and the second descriptor learns the crosscomponent correspondences between the body parts.Later, in this context, Reference [77] proposes a model composed of a CNNbased bodypart detector, including an SVM classifier (trained on the fullbody and body parts, that is,head, torso, and legs) to predict the human attributes and action. Given an input image, aGaussian pyramid is obtained, each level is fed to several convolutional layers to producepyramids of feature maps. The convolution of each featurelevel with each bodypartproduces scores correspond to that bodypart. Therefore, the final output is a pyramidof part model scores suitable for learning an SVM classifier. The experiments indicatethat using bodypart analysis and making the network deeper improve the results.As earlier partbased methods used separate feature extractors and classifiers, the partscould not be optimized for recognizing the semantic attributes. Moreover, the detectors,at that time, were inaccurate in detection. Therefore, Reference [80] proposed an endtoend model, in which the body partitions are generated based on the skeleton information.As authors augment a large skeleton estimation dataset (MPII [81]) for human skeletoninformation (which is less prone to error for annotation in comparison with bounding boxannotations for body parts), their body detector is more accurate in detecting the relevantpartitions, leading to better performance.To encode both global and finegrained features and implicitly relate them to the specificattributes, References [82] proposes to add several branches on top of a ResNet50network, such that each branch explores particular regions of the input data and learnsan exclusive classifier. Meanwhile, before the classifier stage, all branches share a layer,
24

Soft Biometrics Analysis in Outdoor Environments
which passes the 6 static regions of features to the attribute classifiers. For example,the head attribute classifier is fed only with the two upper strips of the feature maps.Experimental results on the Market1501 dataset [24] show that applying a layer thatfeeds regional features to the related classifiers can improve the mA from 85.0 to 86.2.Further, repeating the experiments while adding a branch to the architecture of themodelfor predicting the person ID (as an extralabel) improves the mA result from 84.9 to86.1. These experiments show that simultaneous ID predictionwithout any purpose couldslightly diminish the accuracy.
2.3.1.4 Attention Based Methods
By focusing on the most relevant regions of the input data, human beings recognize theobjects and their attributes without the background’s interference. For example, whenrecognizing the headaccessories attributes of an individual, special attention is givento the facial region. Therefore, many HAR methods have attempted to implement anattentionmodule to be inserted atmultiple levels of CNN. Attention heatmaps (also calledlocalization scoremap [83; 84] or class activationmap [85]) are colorful localization scoremaps that make the model interpretable and are usually faded over the original image toshow the model’s ability to focus on the relevant regions.In order to eliminate the need for bodypart detection and prior correspondence amongthe patches, Reference [86] proposed to refine the Class Activation Map network [85],in which the relevant regions of the image to each attribute are highlighted. The modelcomprises a CNN feature extraction backbonewith several branches on its top, which yieldthe scores for all the attributes and their regional heat maps. The fitness of the attentionheatmaps ismeasured using an exponential loss function, while the score of the attributesis derived from a classification loss function. The evaluation of the model is performedusing two different convolutional backbones (i.e., Visual Geometry Group (VGG) [87] andAlexNet [13] models), and the result for the deeper network (VGG16) is better than theother one.To extract more distinctive global and local features, Liu et al. [88] propose an attentionmodule that fuses several feature layers of the relevant regions and yields attention maps.To take full advantage of the attention mechanism, they apply the attention module todifferent model levels. Obtaining the attentive feature maps from various layers of thenetwork means that the model has captured multiple levels of the input sample’s visualpatterns so that the attention maps from higher blocks can cover more extensive regions,and the lower blocks focus on smaller regions of the input data.Considering the problem of cloth classification and landmark detection, Reference [89]proposes an attentive fashion grammar network, in which both the symmetry of the clothsand effect of body motion is captured. To enhance the clothing classification, authorssuggest to (1) develop supervised attention using the ground truth landmarks to learn thefunctional parts of the clothes and (2) use a bottomup, topdown network [90], in whicha successive down and upsampling are performed on the attention maps to learn theglobal attention. The evaluation results of their model for clothing attribute prediction
25

Soft Biometrics Analysis in Outdoor Environments
improved the counterpart methods by a large margin (30% to 60% top5 accuracy on theDeepFashoinC dataset [91]).With a view to select the discriminative regions of the input data, Reference [92] proposesa model considering three aspects: (1) Using the parsing technique [93], they splitfeatures of each bodypart and help the model learns the locationoriented features bypixeltopixel supervision. (2) Multiple attention maps are assigned to each label due toempowering the features from the relevant regions to that label and suppressing the otherfeatures. Different from the previous step, the supervision in this module is performed onthe imagelevel. (3) Another module learns the relevant regions for all the attributes andlearns from a global perspective. The quantitative results on several datasets show thatthe full version of the model improves the plain model’s performance slightly (e.g., for theRAP dataset, the F1 metric improves from 79.15 to 79.98).Reference [94] is another research that has focused on localizing the human attributesengaging multilevel attentionmechanisms in fullframe images. First, supervised coarselearning is performed on the target person, inwhich the extracted features of each residualblock is multiplied by the ground truthmask. Then, inspired by Reference [95], to furtherboost the attributebased localization, an attention module uses the labels to refine theaggregated features of multiple levels of the model.To alleviate the complex background and occlusion challenges in HAR, Reference [96]introduces a coarse attention layer that uses the multiplication between the output of theCNN backbone and ground truth human masks. Further, to guide the model to considerthe semantic relationships among the attributes, authors use a multitask architecturewith a weighted loss function. This way, the CNN learns to find the relevant regions tothe attributes in the foreground regions. Their ablation studies show that consideringthe correlation between attributes (multitask learning) is more effective than coarseattention on the foreground region, although both improve the model performance.
2.3.1.5 Attribute Based Methods
Noticing the effectiveness of the additional information (e.g., pose, bodypart andviewpoint) in the global feature representation, Reference [97] introduces a method thatimproves the localization ability of the model by locating the attributes’ regions in theimages. The model comprises two branches, one of them extracts the global features andprovides the Class ActivationMaps (CAMs) [98] (attention heatmaps), and the other oneuses [99] to produce some RoI for extracting the local features. To localize each attribute,the authors consider regions with high overlap between the CAMs andRoI as the attributelocation. Finally, the local and global features are aggregated using an elementwise sum.Their ablation studies on the RAP dataset show that for the model without localization F1
metric is about 77%, while the fullversion model improves the results to about 80%.As a weakly supervised method, Reference [100] aims to learn the regions in the inputdata related to the specific attributes. Thereby, the input image is fed into a BatchNormalization (BN)Inception model [101], and the features from three levels of themodel (low, mid, and high) are concatenated together to be ready for three separate
26

Soft Biometrics Analysis in Outdoor Environments
localization process. The localization module is built from a SqueezeandExcitationNetworks (SENet) [102] (that considers the channel relationships) proceeded with aSpatial Transformer Network (STN) (that performs conditional transformations on thefeaturemaps) [65]. The training is weakly supervised because instead of using the groundtruth coordinates of the attribute region, the STN is treated as a differentiable RoI poolinglayer that is learned without box annotations. The F1metric on the RAP dataset for BNInception plain model is around 78.2 while this number fro the full version of the modelis 80.2.Considering that both the local and global features are important for making a prediction,most of the literature’s localizationbased methods have introduced modular techniques.Therefore, the proposed module could be used in multiple levels of the model (from thefirst convolutional layers to the final classification layers) to capture both the lowleveland highlevel features. Intuitively, the implicit location of each attribute is learned in aweakly supervised manner.
2.3.2 Limited Data
Although deep neural networks are powerful in the attribute recognition task, aninsufficient amount of data causes an early overfitting problem and hinders them fromextracting a generalized feature representation from the input data. Meanwhile, thedeeper the networks are, the more data are required to learn a wide range of layer weightparameters. Data augmentation and transfer learning are two primary solutions thataddress the challenge of limited data in computer vision tasks. In the context of HAR,there are few researches that have studied the effectiveness of these methods that arediscussed in the following.(A) Data Augmentatio. In this context, Bekele et al. [103] studied the effectivenessof 3 basic data augmentation techniques on their proposed solution and observed thatthe F1 score is improved from 85.7 to 86.4 for an experiment on the PETA dataset.Further, [104] discussed that ResNet could take advantage of the skipped connections toavoid overfitting. Their experimental results on the PETA dataset confirm the superiorityof ResNet without augmentation over the SVMbased and plain CNN models.(B) Transfer Learning. In clothing attribute recognition, some works may deal with twodomains (types of images): (1) in shop images that are highquality in specific poses; (2)inthewild images that vary in the pose, illumination, and resolution. To address theproblem of limited labeled data, we can transfer the knowledge of one domain to theother domain. In this context, inspired by curriculum learning, Dong et al. [105] suggesta twostep framework for curriculum transfer of knowledge from shop clothing images tointhewild similar clothing images. To this end, they train amultitask networkwith easysamples (inshop) and copy its weights to a tripletbranch curriculum transfer network.At first, these branches have identical weights; however, in the second training stage(with harder examples), the feature similarity values between the target and the positivebranches become larger than between the target and negative branches. The ablationstudies confirm the effectiveness of the authors’ idea and show that the mean average
27

Soft Biometrics Analysis in Outdoor Environments
(mA) improved from 51.4 to 58.8 for plainmultitask and proposedmodel, respectively, onthe CrossDomain clothing dataset [106]. Moreover, this work indicates that curriculumlearning versus endtoend learning achieves better results, with 62.3 and 64.4 of mA,respectively.
2.3.3 Attributes Relationship
Both the spatial and semantic relationships among the attributes affect the performanceof the PAR models. For example, hairstyle and footwear are correlated, while related todifferent regions (i.e., spatial distributions) of the input data. Regarding the semanticrelationship, pedestrian attributes may either conflict with each other or are mutuallyconfirming. For instance, wearing jeans and a skirt is an unexpected outfit, whilewearing a Tshirt and sports shoes may coappear with high probability. Therefore,taking these intuitive interpretations into account could be considered as a refinementstep that improves the predictionlist of the attributes [107]. Furthermore, consideringthe contextual relation between various regions improve the performance of the PARmodels. To consider the correlation among the attributes there are several possibilitiessuch as using multitask architecture [96], multilabel classification with weighted lossfunction [108], Recurrent Neural Networks (RNN) [109], Graph Convolutional Network(GCN) [110]. We have classified them into two main groups:
• NetworkOriented methods that take advantage of the various implementation ofconvolutional layers/blocks to discover the relation between attributes,
• mathoriented methods that may or may not extract the features using CNNs, butperform some mathematical operations on the features to modify them regardingthe existing intrinsic correlations among the attributes.
In the following, we discuss the literature of both categories.
2.3.3.1 NetworkOriented Attribute Correlation Consideration
(A) Multitask Learning. In [55], Lu et al. discuss that the intuitionbased design ofmultitask models is not an optimal solution for sharing the relevant information overmultiple tasks, and they propose to gradually widen the structure of the model (add newbranches) using an iterative algorithm. Consequently, in the final architecture, correlatedtasks share most of the convolutional blocks together, while uncorrelated tasks will usedifferent branches. Evaluation of the model on the fashion dataset [91] shows that bywidening the network to 32 branches, the accuracy of the model cannot compete withother counterparts; however, the speed increases (from 34 ms to 10 ms) and the numberof parameters decreases from 134million to 10.5million.In amultitask attribute recognition problem, each taskmay have a different convergencerate. To alleviate this problem and jointly learn multiple tasks, Reference [111] proposesa weighted loss function that updates the weights for each task in the course of learning.
28

Soft Biometrics Analysis in Outdoor Environments
The experimental evaluation on the Market1501 dataset [24] shows an improvement inaccuracy from 86.8% to 88.5%.
In [112; 113], the authors study the multitask nature of PAR and attempt to build anoptimal grouping of the correlated tasks, based on which they share the knowledgebetween tasks. The intuition is that, similar to the human brain, the model should learnmore manageable tasks first and then uses them for solving more complex tasks. Theauthors claim that learning correlated tasks needs less effort, while uncorrelated tasksrequire specific feature representations. Therefore, they apply a curriculum learningschedule to transfer the knowledge of the easier tasks (strongly correlated) to the harderones (weakly correlated). The baseline results show that learning the tasks individuallyyields 71.0% accuracy on the Soft Biometric Retrieval (SoBiR) dataset [114], while thisnumber for learningmultiple tasks at once is 71.3% and for a curriculumbasedmultitaskmodel is 74.2%.
Considering HAR as amultitask problem, Reference [54] proposes to improve themodelarchitecture in terms of feature sharing between tasks. Authors claim that by learning alinear combination of features, the interdependency of the channels is ignored, and themodel cannot exchange spatial information. Therefore, after each convolutional blockin the model, they insert a shared module between tasks to share the information. Thismodule considers three aspects: (1) fusing the features of each two tasks together, (2)generating attention maps regarding the location of the attributes [115], and (3) keepingthe effect of the original features of each task. Ablation studies over this module’spositioning indicate that adding it at the end of the convolutional blocks yields the bestresults. However, the performance is approximately stable when different branches of themodule (one at a time) are ablated.
(B) RNN. In [116], authors discuss that person reid focuses on the global features, whileattribute recognition relies on local aspects of individuals. Therefore, Liu et al. [116]propose a network consisted of three parts that work together to learn the person’sattributes and reidentification (reid). Further, to capture the contextual spatialrelationships and focus to the location of each attribute, they use the RNNCNN backbonefeature extractor followed by an attention model.
To mine the relation of attributes, Reference [117] uses a model based on Long ShortTerm Memory (LSTM). Intuitively, using several successive stages of LSTM preservesthe necessary information along the pipeline and forgets the uncorrelated features. Inthis work, the authors first detect threebody poselets based on the skeleton information.They consider the fullbody as another poselet followed by several fully connected layersto produce several groups of features (for each attribute, one group of features). Eachgroup of features is passed to an LSTM block, followed by a fullyconnected layer. Finally,the concatenation of all features is considered as the final feature representation of theinput image. Considering that LSTMblocks are successively connected to each other, theycarry the useful information of previous groups of features to the next LSTM. The ablationstudy in this work shows that the plain Inceptionv3 on PETA dataset attains 85.7 of F1
metric, and adding LSTM blocks on top of the baseline improves its performance to 86.0,
29

Soft Biometrics Analysis in Outdoor Environments
while the full version of the model that processes the bodyparts achieves to F1 86.5.
Regarding the functionality of RNN in contextual combinations in the sequenced data,Reference [118] introduces two different methods to localize the semantic attributes andcapture their correlations implicitly. In the first method, the input image’s extractedfeatures are divided into several groups; then, each group of features is given to anLSTM layer followed by a regular convolution block and a fully connected layer, whileall the LSTM layers are connected together successively. In the second method, all theextracted features from the backbone are multiplied (spatial pointwise multiplication)by the last convolution block’s output to provide global attention. The experiments showthat dividing the features into groups from global to local features yields better resultsthan random selection.
Inspired by imagecaptioning methods, Reference [119] introduced a Neural PAR thatconverts attributes recognition to the imagecaptioning task. To this end, they generatedsentence vectors to describe each pedestrian image using a random combination ofattributewords. However, there are twomajor disruptions in designing an imagecaptionarchitecture for attribute classification: (1) variable length of sentences (attributewords)for different pedestrians and (2) finding relevance between attributes vectors and spatialspace. To address these challenges, the authors used RNNs units and lookuptable,respectively.
To deal with lowresolution images, Wang et al. [109] formulated the PAR task as asequential prediction problem, in which a twostep model is used to encode and decodethe attributes for discovering both the context of intraindividual attributes and the interattribute relation. To this end, Wang et al. took advantage of LSTMs in both encodeand decode steps for different purposes, such that in the encoding step the context of theintraperson attributes is learned, while in the decoding step, LSTMs is utilized to learn theinterattributes correlation and predict the attributes as a sequence prediction problem.
(C) GCN. In Reference [110], Li et al. introduce a sequentialbased model that relies ontwo graph convolutional networks, in which the semantic attributes are used as the nodesof the first graph, and patches of the input image are used as the nodes of the second graph.To discover the correlation between regions and semantic attributes, they embedded theoutput of the first graph as the extra inputs into the second graph and vise versa (theoutput of the second graph is embedded as the extra inputs into the first graph). Toavoid a closed loop in the architecture, they defined two separate feedforward branches,such that the first branch receives the image patches and presents the spatial contextrepresentation of them. This representation is then mapped into the semantic space toproduce the features that capture the similarity between regions. The second branch inputis semantic attributes that are processed using a graph network and mapped into spatialgraphs to capture the semanticaware features. The output of both branches is fused tolet and endtoend learning. The ablation studies show that in comparison with a plainResNet50 network, the F1 results could improve by margins of 3.5 and 1.3 for the PETAand RAP datasets, respectively.
Inspired by Reference [110], in Reference [107], Li et al. present a GCNbased model
30

Soft Biometrics Analysis in Outdoor Environments
to yield the human parsing alongside the human attributes. Therefore, a graph is builtupon the image features so that each group of features corresponds to one node of thegraph. Afterward, to capture the relationships among the groups of attributes, a graphconvolution is performed. Finally, for each node, a classifier is learned to predict theattributes. To produce the human parsing results, they apply a residual block that usesboth the original features and the output of the graph convolution in the previous branch.Based on the ablation study, a plain ResNet50 on the PETA dataset achieves a F1 scoreof 85.0, while a model based on body parts yields a F1 score of 84.4, and this number forthe model equipped with the abovementioned idea is 87.9.
Tan et al. [120] observed the close relationship between some of the human attributesand claimed that in multitask architectures, the final loss function layer is the criticalpoint of learning, which may not have sufficient influence for obtaining a comprehensiverepresentation for explaining the attribute correlations. Moreover, the limitation inreceptive fields of CNNs [121] hinders themodel’s ability to effectively learn the contextualrelations in the data. Therefore, to capture the structural connections among attributesand contextual information, the authors use two GCN [122]. However, as image datais not originally structured as graphs, they use the extracted attributespecific features(each feature corresponds to one attribute) from a ResNet backbone to obtain the firstgraph. For the second graph, clusters of regions (pixels) in the input image are consideredas the network nodes. The clusters are learned using the share ResNet backbone—withthe previous graph). Finally, the outputs of both graphbased branches are averaged. AsLSTMalso considers the relationship between parts, authors have replaced their proposedGCNs with LSTMs in the model and observed a slight drop in the model’s performance.The ablation strides on three pedestrian datasets show that the F1metric performance ofa vanilla model improves with a margin of 2.
Reference [123] recognized the clothing style by mixing extracted features from the bodyparts. They applied a graphbased model with Conditional Random Field (CRF)s toexplore the correlation between clothes attributes. Specifically, using the weighted sumof bodypart features, they trained an SVM for each of the attributes and used CRFs tolearn the relationships between attributes. By training the CRFs with output probabilityscores from SVM classifiers, the attributes’ relationship is explored. Although usingCRFs was successful in this work, there are yet some disadvantages: (a) due to extensivecomputational cost, CRFs is not an appropriate solution when a broad set of attributes areconsidered, and (b) CRFs cannot capture the spatial relation between attributes [110] (c)models can not simultaneously optimize classifiers and CRFs [110], so it is not useful inan endtoend model.
2.3.3.2 MathOriented Attribute Correlation Consideration
(A) Grammar. In [124], Park et al. addressed the need for an interpretable model that canjointly yield the bodypose information (body joints coordinates) and human semanticattributes. To this end, authors implemented an andor grammar model, in which theyintegrated three types of grammars—(1) simple grammars that break down the fullbody
31

Soft Biometrics Analysis in Outdoor Environments
into smaller nodes; (2) dependency grammar that indicates which nodes (body parts) areconnected to each other and models the geometric articulations; (3) attribute grammarthat assigns the attributes to each node. The ablation studies for attribute predictionshowed that the performance is better if the best pose estimation for each attribute isused for predicting the corresponding attribute score.
(B) Multiplication. In [125], authors discussed that a plain CNN could not handle humanmultiattribute classifications effectively, as for each image, several labels have beenentangled. To address this challenge, Han et al. [125] proposed to use a ResNet50backbone followed by multiple branches to predict the occurrence probability of eachattribute. Further, to improve the results, they provided a matrix from ground truthlabels to obtain the conditional probability of each label (semantic attribute) givenanother attribute. Themultiplication of thismatrix by the previously obtained probabilityprovides the models with a priori knowledge about the correlation of attributes. Theablation study indicated that the baseline (plain ResNet50) on the PETA dataset achieves85.8 of F1 metric, while this number for a simple multibranch model and fullversionmodel is 86.6 and 87.6, respectively.
In order to mitigate the correlation between the visual appearance and the semanticattributes, Reference [126] uses a fusion attention mechanism and provides a balancedweight between the imageguided and attributeguided features. First, attributes areembedded in a latent space with the same dimension of the image features. Next, anonlinear function is applied to the image features to obtain its feature distribution.Then, the imageguided features are obtained via an elementwisemultiplication betweenthe feature distribution of the image and the embedded attribute features. To obtainthe attributeguided features, they embed the attributes to a new latent space; next,the results of the elementwise multiplication between image features and embeddedattribute features are considered as the input of a nonlinear function, for which its outputprovides attributeguided features. Meanwhile, to consider the class imbalance, authorsuse the focal loss function to train themodel. The ablation study shows that the F1metricperformance of the baseline on the PETA dataset is 85.6, which improves to 85.9when themodel is equipped with the abovementioned idea.
In Reference [127], authors propose a multitask architecture, in which each attributecorresponds to one separate task. However, to consider the relationship betweenattributes, both the input image and category information are projected into anotherspace, where the latent factors are disentangled. By applying the elementwisemultiplication between the feature representation of the image and its class information,the authors define a discriminant function. When using it, a logistic regressionmodel canlearn all the attributes simultaneously. To show the efficiency of the methods, authorsevaluate their proposed approach in several attribute datasets of animals, objects, andbirds.
(C) Loss Function. Li et al. [128] discussed the attribute relationships and introducedtwo models to demonstrate the effectiveness of their idea. Considering HAR as a binaryclassification problem, the authors proposed a plain multilabel CNN that predicts all the
32

Soft Biometrics Analysis in Outdoor Environments
attributes atonce. They also equipped the previous model with a weightedloss function(crossentropy), in which each attribute classifier has a specific weight to update thenetworkweights for the next epoch. The experimental results on the PETAdataset with 35attributes indicated that weighted crossentropy loss function could improve the accuracyprediction in 28 attributes and increase themA by 1.3 percent.
2.3.4 Occlusion
In HAR, occlusion is a primary challenge, in which parts of the useful information of theinput data may be covered with other subjects/objects [129]. As this situation is likely tooccur in realworld scenarios, it is necessary to be handled. In the context of person reid, Reference [130] claims that inferring the occluded body parts could improve the results,and in the HAR context, Reference [131] suggests that using sequences of pedestrianimages somehow alleviates the occlusion problem.
Considering the lowresolution images and partial occlusion of the pedestrian’sbody, Reference [132] proposed to manipulate the dataset with occurring frequent partialocclusions and degraded the resolution of the data. Then, the authors trained a modelto rebuild the images with high resolution and do not suffer from occlusion. This way,the reconstruction model will help to manipulate the original dataset before training aclassification model. As rebuild is performed with a GAN, the generated images aredifferent from the original annotated dataset and somehow lost part of the annotations,which degrade the overall performance of the system compared to when one uses theoriginal dataset for training. However, the ablation study in this paper shows that if twoidentical classification networks are separately trained on corrupted and generated data,the performance of themodel that learns from the reconstructed data is better with a highmargin.
To tackle the problem of occlusion, Reference [133] proposes to use a sequence of framesfor recognizing human attributes. First, they extract the framelevel spatial features usinga shared ResNet50 backbone feature extractor [134]. The extracted features are thenprocessed in two separate paths, one of them learns the body pose and motion, and theother branch learns the semantic attributes. Finally, each attribute’s classifier uses anattentionmodule that generates an attention vector showing the importance of each framefor attribute recognition.
To address the challenge of partial occlusion, References [129; 131] adopted video datasetsfor attributes recognition as often occlusions are a temporary situation. Reference [129]divided each video clip to several pieces and extracted a random frame from each piece tocreate a new video clip with a few frame length. The final recognition confidence of eachattribute is obtained by aggregating the recognition probability on the selected frames.
2.3.5 Classes Imbalance
The existence of large differences between the number of samples for each attribute (class)is known as data class imbalance. Generally, in multiclass classification problems, the
33

Soft Biometrics Analysis in Outdoor Environments
ideal scenario would be to use the same amount of data for each class, in order to preservethe learning importance of all the classes at the same level. However, the classes in HARdatasets are naturally imbalanced since the number of samples of some attributes (e.g.,wearing skirts) are lower than others (e.g., wearing jeans). Large class imbalance causesoverfitting in classes with limited data, while classes with large number of samples needmore training epochs to converge. To address this challenge, some methods attempt tobalance the number of samples in each class as a preprocessing step [135–137], which arecalledhard solutions. Hard solutions are classified into three groups—(1) upsampling theminority classes, (2) downsampling the large classes, and (3) generating new samples.On the other hand, soft solutions are interested in handling the data class imbalance byintroducing new training methods [138] or novel loss functions, in which the importanceof each class is weighted based on the frequencies of the data [139–141]. Furthermore, thecombination of both solutions has been the subject of some studies [142].
2.3.5.1 Hard Solutions
The earlier hard solutions are focused either on interpolation between the samples [135;143], or clustering the dataset and oversampling by clusterbased methods [144]. Theprimary way of upsampling in deep learning is to augment the existing samples –asdiscussed in Section 2.3.2. However, excessive upsampling may lead to overfittingwhen the classes are highly imbalanced. Therefore, some works downsample themajority classes [145]. Random downsampling may be an easy choice, but Reference[146] proposes to use the boundaries among the classes to remove redundant samples.However, loss of information is an inevitable part of downsampling, as some samplesare removed, which may carry useful information.
To address these problems, Fukui et al. [28] designed a multitask CNN, in which classes(attributes) with fewer samples are given more importance in the learning phase. Thebatch of samples in conventional learning methods are selected randomly; therefore, therare examples are less likely to be in the minibatch. Meanwhile, data augmentationcannot be sufficient for balancing the dataset as ordinary data augmentation techniquesgenerate new samples regardless of their rarity. Therefore, Fukui et al. [28] definesa rarity rate for each sample in the dataset and perform the augmentation for raresamples. Later, from the createdminibatches, thosewith appropriate sample balance areselected for training themodel. The experimental results on a dataset with four attributesshow a slight improvement in the average recognition rate, though the superiority is notconsistent for all the attributes.
2.3.5.2 Soft Solutions
As previously mentioned, soft solutions focus on boosting the learning methods’performance, rather than merely increasing/decreasing the number of samples.Designing loss functions is a popular approach for guiding themodel to take full advantageof the minority samples. For instance, Reference [126] proposes the combination of focal
34

Soft Biometrics Analysis in Outdoor Environments
loss [147] and crossentropy loss functions to introduce a focal crossentropy loss function(see Section 2.3.3.2 for the analytical review over [126]).
Considering the success of curriculum learning [148] in other fields of studies,in Reference [138], the author addressed the challenge of imbalancedistributed data inHARby batchbased adjustment of data sampling strategy and loss weights. It was arguedthat providing balanced distribution from a highly imbalanced dataset (using samplingstrategies) for the whole learning process may cause the model to disregard the sampleswith most variations (i.e., classes with majority samples) and only emphasizes on theminority class. Moreover, the weighted terms in loss functions play an essential rolein the learning process. Therefore, both the classification loss (often crossentropy) andmetric learning loss (which aims to learn feature embedding for distinguishing betweensamples) should behandled based on their importance. To consider these aspects, authorsdefined two schedules, one for adjusting the sampling strategy by reordering the datafrom imbalanced to balanced and easy to hard; and the other curriculum schedule handlesthe loss importance between classification and distance metric learning. The ablationstudy in this work showed that the sampling scheduler could increase the results of abaseline model form 81.17 to 86.58, and adding loss scheduler to it could improve theresults to 89.05.
To handle the class imbalance problem, Reference [149] modifies the focal lossfunction [147] and apply it for an attentionbased model to focus on the hard samples.The main idea is to add a scaling factor to the binary crossentropy loss function to downweight the effect of easy samples with high confidence. Therefore, the hard misclassifiedsamples of each attribute (class) add larger values to the loss function and become morecritical. Considering the usual weakness of attention mechanism that does not considerthe location of an attribute, the authors modified the attention masks in multiple levelsof the model using attribute confidence weighting. Their ablation studies on the WIDERdataset [75] with ResNet101 backbone feature extractor [134] showed the plain modelachieves mA 83.7 and applying the weighted focal loss function improve the results to 84.4while adding the multiscale attention increased it to 85.9.
2.3.5.3 Hybrid Solutions
Hybrid approaches use the combination of the abovementioned techniques. Performingdata augmentation over the minority classes and applying a weighted loss functionor a curriculum learning strategy are examples of hybrid solutions for handling theclass data imbalance. In Reference [142], the authors discuss that learning from anunbalanced dataset leads to biased classification, with higher classification accuracyover the majority classes and lower performance over the minority classes. To addressthis issue, Chawla et al. [142] proposed an algorithm that focuses on difficult samples(misclassified). To implement this strategy, the authors took advantage of Reference[143], which generates new synthetic instances in each training iteration from theminority classes. Consequently, the weights for the minority samples (false negatives)are increased, which improves the model’s performance.
35

Soft Biometrics Analysis in Outdoor Environments
2.3.6 PartBased And Attribute CorrelationBased Methods
“Whether considering a group of attributes together improve the results of an attributerecognition model or not?” is the question that Reference [150] tries to answer byaddressing the correlation between attributes using a CRF strategy. Concerning thecalculated probability distribution over each attribute, all the Maximum A Posterioris(MAP) are estimated, and then, the model searches for the most probable mixture inthe input image. To also consider the location of each attribute, authors extract the partpatches based on the bounding box around the fullbody, as in fashion datasets posevariations are not significant. A comparison between several simple baselines showsthat the CRFbased method (0.516F1 score) works slightly better than a localizationbased CNN (0.512F1 score) on the Chictopia dataset [151], while a globalbased CNN F1
performance is 0.464.
2.4 Datasets
As opposed to other surveys, instead of merely enumerating the datasets, in thismanuscript, we discuss the advantages and drawbacks of each dataset, with emphasis ondata collectionmethods/software. Finally, we discuss the intrinsically imbalanced natureof HAR datasets and other challenges that arise when gathering data.
2.4.1 PAR datasets
• PETA dataset. PETA [152] dataset combines 19,000 pedestrian images gatheredfrom 10 publicly available datasets; therefore the images present large variationsin terms of scene, lighting conditions and image resolution. The resolution ofthe images varies from 17 × 39 to 169 × 365 pixels. The dataset provides richannotations: the images are manually labeled with 61 binary and 4 multiclassattributes. The binary attributes include information about demographics (gender:Male, age: Age16–30, Age31–45,Age46–60, AgeAbove61), appearance (long hair),clothing (Tshirt, Trousers etc.) and accessories (Sunglasses, Hat, Backpack etc.).The multiclass attributes are related to (eleven basic) color(s) for the upperbodyand lowerbody clothing, shoewear, and hair of the subject. When gathering thedataset, the authors tried to balance the binary attributes; in their convention, abinary class is considered balanced if the maximal and minimal class ratio is lessthan 20:1. In the final version of the dataset, more than half of the binary attributes(31 attributes) have a balanced distribution.
• RAP dataset. Currently, there are two versions of the RAP dataset. The firstversion, RAPv1 v1 [153] was collected from a surveillance camera in shoppingmalls over a period of three months; next, 17 hours of video footage weremanually selected for attribute annotation. In total, the dataset comprises 41,585annotated human silhouettes. The 72 attributes labeled in this dataset includedemographic information (gender and age), accessories (backpack, single shoulder
36

Soft Biometrics Analysis in Outdoor Environments
bag, handbag, plastic bag, paper bag etc.), human appearance (hair style, haircolor, body shape) and clothing information (clothes style, clothes color, footwarestyle, footware color etc.). In addition, the dataset provides annotations aboutocclusions, viewpoints and bodyparts information.
The second version of the RAP dataset [108] is intended as a unifying benchmarkfor both person retrieval and person attribute recognition in realworld surveillancescenarios. The dataset was captured indoor, in a shopping mall and contains84,928 images (2589 person identities) from 25 different scenes. Highresolutioncameras (1280× 720) were used to gather the dataset, and the resolution of humansilhouettes varies from 33 × 81 to 415 × 583 pixels. The attributes annotated arethe same as in RAP v2 (72 attributes, and occlusion, viewpoint, and bodypartsinformation).
• Duke MultiTarget, MultiCamera (DukeMTMC) dataset. The DukeMTMCdataset [154] was collected in Duke’s university campus and contains more than 14h of video sequences gathered from 8 cameras, positioned such that they capturecrowded scenes. The main purpose of this dataset was person reidentification andmulticamera tracking; however, a subset of this dataset was annotated with humanattributes. The annotations were provided at the identity level, and they included 23attributes, regarding the gender (male, female), accessories: wearing hat (yes, no),carrying a backpack (yes, no), carrying a handbag (yes, no), carrying other typesof the bag (yes, no), and clothing style: shoe type (boots, other shoes), the color ofshoes (dark, bright), length of upperbody clothing (long, short), 8 colors of upperbody clothing (black, white, red, purple, gray, blue, green, brown) and 7 colors oflowerbody clothing (black, white, red, gray, blue, green, brown). Due to violationof civil and human rights, as well as privacy issues, since June 2019, DukeUniversityhas terminated the DukeMTMC dataset page.
• PA100K dataset. The PA100k dataset [88] was developed with the intention tosurpass the existing HAR datasets both in quantity and in diversity; the datasetcontainsmore than 100,000 images captured in 598different scenarios. Thedatasetwas captured by outdoor surveillance cameras; therefore, the images provide largevariance in image resolution, lighting conditions, and environment. The datasetis annotated with 26 attributes, including demographic (age, gender), accessories(handbag, phone) and clothing information.
• Market1501 dataset. Market1501 attribute [24; 155] dataset is a version of theMarket1501 dataset augmented with the annotation of 27 attributes. Market1501was initially intended for cross camera person reidentification, and it was collectedoutdoor in front of a supermarket using 6 cameras (5 highresolution cameras andone low resolution). The attributes are provided at the identity level, and in total,there are 1501 annotated identities. In total, the dataset has 32,668 boundingboxes for these 1501 identities. The attributes annotated in Market1501 attributeinclude demographic information (gender and age), information about accessories
37

Soft Biometrics Analysis in Outdoor Environments
(wearing hat, carrying backpack, carrying bag, carrying handbag), appearance(hair length) and clothing type and color (sleeve length, length of lowerbodyclothing, type of lowerbody clothing, 8 color of upperbody clothing, 9 color oflowerbody clothing).
• Pedestrian Detection, Tracking, ReIdentification and Search (PDESTRE) Dataset.Over the recent years, as their cost has diminished considerably, UAVs applicationsextended rapidly in various surveillance scenarios. As a response, several UAVsdatasets have been collected andmade publicly available to the scientific community.Most of them are intended for human detection [156; 157], action recognition [158]or reidentification [159]. To the best of our knowledge, the PDESTRE [160] datasetis the first benchmark that addresses the problem of HAR from aerial images.
PDESTRE dataset [160] was collected in the campuses of two Universities fromIndia and Portugal, using DJIPhantom4 drones controlled by human operators.The dataset provides annotations both for person reidentification, as well as forattribute recognition. The identities are consistent across multiple days. Theannotations for the attributes include demographic information: gender, ethnicityandage, appearance information: height, body volume, hair color, hairstyle, beard,moustache; accessories information: glasses, head accessories, body accessories;clothing information and action information. In total, the dataset contains over 14million person bounding boxes, belonging to 261 known identities.
2.4.2 FAR datasets
• Pedestrian Attribute Recognition in Sequences (PARSe27k) dataset. PARSe27kdataset [161] contains over 27,000 pedestrian images, annotated with 10 attributes.The images were captured by amoving camera across a city environment; every 15thvideo frame was fed to the Deformable Part Model (DPM) pedestrian detector [78]and the resulting bounding boxes were annotated with the 10 attributes based onbinary or multinomial propositions. As opposed to other datasets, the authorsalso included an N/A state (i.e., the labeler cannot decide on that attribute). Theattributes from this dataset include gender information (3 categories—male, female,N/A), accessories (Bag on Left Shoulder, Bag on Right Shoulder Bag in Left Hand,Bag in Right Hand, Backpack; each with three possible states: yes, no, N/A),orientation (with 4 + N/A or 8 +N/A discretizations) and action attributes: posture(standing, walking, sitting and N/A) and isPushing (yes, no, N/A). As the imageswere initially processed by a pedestrian detector, the images of this dataset consistof a fixedsize bounding region of interest, and thus are strongly aligned and containonly a subset of possible human poses.
• Caltech Roadside Pedestrians (CRP) dataset. CRP [162] dataset was captured inreal world conditions, from a moving vehicle. The position (boundingbox) of eachpedestrian, together with 14 body joints are annotated in each video frame. TheCRP dataset comprises 4222 video tracks, with 27,454 pedestrian bounding boxes.
38

Soft Biometrics Analysis in Outdoor Environments
The following attributes are annotated for each pedestrian—age ( 5 categories:child, teen, young adult, middle aged and senior), gender (2 categories—femaleand male), weight (3 categories: Under, Healthy and Over), and clothing style (4categories—casual, light athletic, workout and dressy). The original, uncroppedvideos together with the annotations are publicly available.
• Describing People dataset. Describing People dataset [68] comprises 8035 imagesfrom the H3D [163] and the PASCAL Visual Object Classes (PASCALVOC)2010 [164] datasets. The images from this database are aligned, in the sense that foreach person, the image is cropped (by leaving some margin) and then scaled so thatthe distance between the hips and the shoulders is 200 pixels. The dataset features9 binary (True/False) attributes, as follows: gender (is male), appearance (longhair), accessories (glasses) and several clothing attributes (has hat, has tshirt, hasshorts, has jeans, long sleeves, long pants). The dataset was annotated on AmazonMechanical Turk by five independent labelers; the authors considered a valid labelif at least four of the five annotators agreed on its value.
• Human ATtributes (HAT) dataset. HAT [66; 78] contains 9344 images gatheredfrom Flickr website; for this purpose, the authors used more than 320 manuallyspecified queries to retrieve images related to people and then, employed an offtheshelf person detector to crop the humans in the images. The false positiveswere manually removed. Next, the images were labeled with 27 binary attributes;these attributes incorporate information about the gender (Female), age (Smallbaby, Small kid, Teen aged, Young (college), Middle Aged, Elderly), clothing(Wearing tank top, Wearing tee shirt, Wearing casual jacket, Formal men suit,Female long skirt, Female short skirt, Wearing short shorts, Low cut top, Femalein swim suit, Female wedding dress, Bermuda/beach shorts), pose (Frontal pose,Side pose, Turned Back), Action (Standing Straight, Sitting, Running/Walking,Crouching/bent, Arms bent/crossed) and occlusions (Upper body). The imageshave high variations both in image size and in the subject’s position.
• WIDER dataset. The WIDER Attribute dataset [75] comprises a subset of13,789 images selected from the WIDER database [165], by discarding the imagesfull of nonhuman objects and the images in which the human attributes areindistinguishable; the human bounding boxes from these images are annotatedwith14 attributes. The images contain multiple humans under different and complexvariations. For each image, the authors selected a maximum of 20 bounding boxes(based on their resolution), so in total, there are more than 57,524 annotatedindividuals. The attributes follow a ternary taxonomy: positive, negative andunspecified, and include information about age (Male), clothing (Tshirt, longSleeve,Formal, Shorts, Jeans, Long Pants, Skirt), accessories (Sunglasses, Hat, FaceMask, Logo), appearance (Long Hair). In addition, each image is annotated intoone of 30 event classes (meeting, picnic, parade, etc.), thus allowing to correlate thehuman attributes with the context they were perceived in.
39

Soft Biometrics Analysis in Outdoor Environments
• Clothing Attributes Dataset (CAD) dataset. CAD [123] uses images gathered fromthe website Sartorialist (https://www.thesartorialist.com/) and Flikcr website.The authors downloaded several images, mostly of pedestrians, and applied anupperbody detector to detect humans; they ended up with 1856 images. Next,the ground truth was established by labelers from Amazon Mechanical Turk.Each imagewas annotated by 6 independent individuals, and a label was accepted asground truth if it has at least 5 agreements. The dataset is annotated with the genderof the wearer, information about the accessories (Wearing scarf, Collar presence,Placket presence) and with several attributes regarding the clothing appearance(clothing pattern, major color, clothing category, neckline shape etc.).
• Attributed Pedestrians in Surveillance (APiS) dataset. The APiS dataset [166]gathers images from four different sources: the Karlsruhe Institute of Technologyand Toyota Technological Institute (KITTI) database [167], Center for Biologicaland Computational Learning (CBCL) Street Scenes [168] (http://cbcl.mit.edu/software-datasets/streetscenes/), INRIA database [48] and some videosequences collected by the authors at a train station; in total APiS comprises 3661images. The human bounding boxes are detected using an offtheshelf pedestriandetector, and the results are manually processed by the authors: the false positivesand the lowresolution images (smaller than 90 pixels in height and 35 pixels inwidth) are discarded. Finally, all the images of the dataset are normalized in thesense that the cropped pedestrian images are scaled to 128 × 48 pixels. Thesecropped images are annotated with 11 ternary attributes (positive, negative, andambiguous) and 2 multiclass attributes. These annotations include demographic(gender) and appearance attributes (long hair), as well as information aboutaccessories (back bag, SS (Single Shoulder) bag, hand carrying) and clothing(shirt, Tshirt, long pants, MS (Medium and Short) pants, long jeans, skirt, upperbody clothing color, lowerbody clothing color). The multiclass attributes are thetwo attributes related to the clothing color. The annotation process is performedmanually and divided into two stages: annotation stage (the independent labelingof each attribute) and validation stage (which exploits the relationship between theattributes to check the annotation; also, in this stage, the controversial attributesare marked as ambiguous).
2.4.3 Fashion Datasets
• DeepFashion Dataset. The DeepFashion dataset [91] was gathered from shoppingwebsites, as well as image search engines (blogs, forums, usergenerated content).In the first stage, the authors downloaded 1,320,078 images from shoppingwebsitesand 1,273,150 images from Google images. After a data cleaning process, in whichduplicate, outofscope, and lowquality images were removed, 800,000 clothingimages were finally selected to be included in the DeepFashion dataset. The imagesare annotated solely with clothing information; these annotations are divided intocategories (50 labels: dress, blouse, etc.) and attributes (1000 labels: adjectives
40

Soft Biometrics Analysis in Outdoor Environments
Table 2.1: Pedestrian attributes datasets. Symbol † indicates that the dataset has beenpermanently suspended regarding privacy issues. Titles 1 to 5 stand for demographic, accessories,appearance, clothing and color, respectively andM is the abbreviation for million.
Dataset Type Dataset #images 1 2 3 4 5 Setup
Pedestrian
PETA [152] 19,000 3 3 3 3 3 10 databases
RAP v1 [153] 41,585 3 3 3 3 3 indoor static camera
RAP v2 [108] 84,928 3 3 3 3 3 indoor static camera
DukeMTMC † 34,183 3 3 7 3 3 outdoor static camera
PA100K [88] 100,000 3 3 7 3 7 outdoor surveillance
Market1501 [24] 1501 3 3 3 3 3 outdoor
PDESTRE [160] 14M 3 3 3 3 7 UAV
Full body
PARSe27k [161] 27,000 3 3 7 7 7 outdoor moving camera
CRP [162] 27,454 3 3 7 7 7 moving vehicle
APiS [166] 3661 3 3 3 3 3 3 databases
HAT [66] 9344 3 3 7 3 7 Flickr
CAD [123] 1856 3 3 7 3 3 website crawling
DP [68] 8035 3 3 7 3 7 2 databases
WIDER [75] 13,789 3 3 3 3 7 website crawling
SyntheticCTD [169] 880 7 7 7 3 3 generated data
CLOTH3D [170] 2.1M 7 7 7 3 3 generated data
describing the categories). The categories were annotated by expert labelers, whilefor the attributes, due to their huge number, the authors resorted to metadataannotation (provided by Google search engine or by the shopping website). Inaddition, a set of clothing landmarks, as well as their visibility, are provided for eachimage.
DeepFashion is split into several benchmarks for different purposes: categoryand attribute prediction (classification of the categories and the attributes), inshop clothes retrieval (determine if two images belong to the same clothing item),consumertoshop clothes retrieval (matching consumer images to their shopcounterparts) and fashion landmark detection.
2.4.4 Synthetic Datasets
Virtual reality systems and synthetic image generation have become prevalent in the lastfew years, and their results are more and more realistic and of high resolution. Therefore,we also discuss some data sources comprising computergenerated images. It is a wellknown fact that the performance of deep learning methods is highly dependent on theamount and distribution of data they were trained on, and synthetic datasets couldtheoretically be used as an inexhaustible source of diverse and balanced data. In theory,any combination of attributes in any amount could be synthetically generated.
41

Soft Biometrics Analysis in Outdoor Environments
• DeepFashion—Fashion Image Synthesis. The authors of DeepFashion [91]introduce FashionGAN, an adversarial network for generating clothing images ona wearer [171]. FashionGAN is organized into two stages: on a first level, thenetwork generates a semantic segmentationmapmodeling the wearer’s pose. In thesecond level, a generative model renders an image with precise regions and texturesconditioned on this map. In this context, the DeepFashion dataset was extendedwith 78,979 images (taken for the Inshop Clothes Benchmark), associated withseveral caption sentences and a segmentation map.
• Clothing Tightness Dataset (CTD). CTD [169] comprises 880 3D human models,under various poses, both static and dynamic, “dressed” with 228 different outfits.The garments in the dataset are grouped under various categories, such as “T/longshirt, short/long/down coat, hooded jacket, pants, and skirt/dress, ranging fromultratight to puffy”. CTD was gathered in the context of a deep learning methodthat maps a 3D human scan into a hybrid geometry image. This synthetic datasethas important implications in virtual tryon systems, soft biometrics, and bodypose evaluation. The main drawbacks of this dataset are that it cannot captureexaggerated human postures of low 3D human scans.
• Cloth3D Dataset. Cloth3D [170] comprises thousands of 3D sequences ofanimated human silhouettes, “dressed” with different garments. The datasetfeatures a large variation on the garment shape, fabric, size, and tightness, as wellas human pose. The main applications of this dataset listed by the authors include—“human pose and action recognition indepth images, garment motion analysis,filling missing vertices of scanned bodies with additional metadata (e.g., garmentsegments), support designers and animators tasks, or estimating 3D garment fromRGB images”.
2.5 Evaluation Metrics
This section reviews the most common metrics used in the evaluation of HAR methods.Considering that HAR is a multiclass classification problem, Accuracy (Acc), Precision(Prec), Recall (Rec), and F1 score are the most common metrics for measuring theperformance of thesemethods. In general, thesemetrics can be calculated at two differentlevels: labellevel and samplelevel.The evaluation at labellevel considers each attribute independently. As an example, ifthe gender and height attributes are considered with the labels (male, female) and (short,medium, high), respectively, the labellevel evaluation will measure the performanceof each attributelabel combination. The metric adopted in most papers for labellevelevaluation is the mean accuracy (mA):
mA =1
2N
N∑i=1
(TPi
Pi+
TNi
Ni), (2.1)
42

Soft Biometrics Analysis in Outdoor Environments
where i refers to each of the N attributes. mA determines the average accuracy betweenthe positive and negative examples of each attribute.In the samplelevel evaluation, the performance is measured for each attributedisregarding the number of labels that it comprises. Prec, Rec, Acc, and F1 score forthe ith attribute are thus given by:
Preci =TPi
Pi, Reci =
TPi
Ni, Acci =
TPi + TNi
Pi +Ni, Fi =
2 ∗ Prec ∗Rec
Prec+Rec. (2.2)
The use of these metrics is very common for providing a comparative analysis of thedifferent attributes. The overall system performance can be either measured by the meanAcci over all the attributes or usingmA. However, these metrics can diverge significantly,when attributes are highly unbalanced. mA is preferred when authors deliberately wantto evaluate the effect of data unbalancing.
2.6 Discussion
2.6.1 Discussion Over HAR Datasets
In recent years, HAR has received much interest from the scientific community, with arelatively large number of datasets developed for this purpose; this is also demonstratedby the number of citations. We performed a query for each HAR related database on theGoogle Scholar (scholar.google.com) search engine, and extracted its correspondingnumber of citations; the results are graphically presented in Figure 2.3. In the pastdecade, more than 15 databases related to this research field have been published, andmost of them received hundreds of citations.In Table 2.1, we chose to taxonomize the attributes semantically into demographicattributes (gender, age, ethnicity), appearance attributes (related to the appearance of thesubject, such as hairstyle, hair color, weight, etc.), accessory information (which indicatethe presence of a certain accessory, such as a hat, handbag, backpack etc.) and clothingattributes (which describe the garments worn by the subjects). In total, we have described17 datasets, the majority containing over ten thousand images. These datasets can beseen as a continuous effort made by researchers to provide large amounts of varied datarequired by the latest deep learning neural networks.
1. Attributes definition. The first issues that should be addressed when developinga new dataset for HAR are: (1) which attributes should be annotated? and (2)how many and which classes are required to describe an attribute properly?.Obviously, both these questions depend on the application domain of the HARsystem. Generally, the ultimate goal on aHAR, regardless of the application domain,would be to accurately describe an image in terms of humanunderstandablesemantic labels, for example, “a fiveyearold boy, dressed in blue jeans, witha yellow Tshirt carrying a striped backpack”. As for the second question, theanswer is straightforward for some attributes, such as gender, but it becomes more
43

Soft Biometrics Analysis in Outdoor Environments
Figure 2.3: Number of citations to HAR datasets. The datasets are arranged in an increasingorder by their publication date. The “oldest” dataset being HAT, published in 2009, while thelatest is RAP v2, published in 2018.
complex and subjective for other attributes, such as age or clothing information.Let’s take for example, the age label; different datasets provided different classesfor this information: PETA distinguishes between AgeLess15, Age1630, Age3145,Age4660, AgeAbove61, while the CRP dataset adopted a different age classificationscheme: child, teen, youngadult,middle aged and senior. Now, if aHARanalyzer isintegrated into a surveillance system in a crowded environment, such as Disneyland,and this system should be used to locate a missing child, the age labels fromthe PETA dataset are not detailed enough, as the “lowest” age class is AgeLess15.Secondly, these differences between the different taxonomies make it difficult toassess the performance of a newly developed algorithm across different datasets.
2. Unbalanced data. An important issue in any dataset is related to unbalanced data.Although some datasets were developed by explicitly striking for balanced classes,some classes are not that frequent (especially those related to clothing information),and fully balanced datasets are not a trivial problem. The problem of imbalancealso affects the demographic attributes. In all HAR datasets, the class of youngchildren is poorly represented. To illustrate the problem of unbalanced classes, weselected two of the most prominent HAR related datatsets which are labeled withage information: CRP and PETA. In Figure 2.4, for each of these two datasets, weplot a pie charts to show age distribution of the labeled images.
Furthermore, as datasets are usually gathered in a single region (city, country,continent), the data tends to be unbalanced in terms of ethnicity. This is animportant issue as some studies [172] proved the existence of the other race effect–the tendency tomore easily recognize faces from the same ethnicity– formachine
44

Soft Biometrics Analysis in Outdoor Environments
learning classifier.
3. Data context. Strongly linked to the problem of data unbalance is the contextor environment in which the frames were captured. The environment has agreat influence on the distribution of the clothing and demographic (age, gender)attributes. In [75] the authors noticed “strong correlations between image eventand the frequent human attributes in it”. This is quite logical, as one would expectto encounter more casual outfits in a picnic or sporting event, while at ceremonies(wedding, graduation proms), people tend to be more elegant and dressedup.The same is valid for the demographic attributes: if the frames are captured inthe backyard of a kindergarten, one would that most of the subjects to be children.Ideally, a HAR dataset should provide images captured from multiple and variatescenes. Some datasets explicitly annotated the context in which the data wascaptured [75], while others address this issue by merging images from variousdatasets [152]. From another point of view, this leads our discussion to how theimages from the datasets are presented. Generally speaking, the dataset providesthe images either aligned (all the images have the same size and cropped aroundthe human silhouette with a predefined margin; for example, [68]), or make thefull video frame/image available and specify the bounding box of each human in theimage. We consider that the latter approach is preferable, as it also incorporatescontext information and allows researches to decide how to handle the input data.
4. Binary attributes. Another question in database annotation is what happens whenthe attribute to annotate is indistinguishable due to low resolution and degradedimages, occlusions, or other ambiguities. Themajority of datasets tend to ignore thisproblem and classify the presence of an attribute or provide a multiclass attributescheme. However, in a realworld setup, we cannot afford this luxury, as thecase of indistinguishable attributes might occur quite frequently. Therefore, somedatasets [161; 166] formulate the attribute classification task with N + 1 classes (+1for the N/A label). This approach is preferable, as it allows taking both views overthe data: depending on the application context, one could simply ignore the N/Aattributes or, make the classification problem more interesting, integrate the N/Avalue into the classification framework.
5. Camera configuration. Another aspect that should be taken into account whendiscussing HAR datasets is the camera setup used to capture the images or videosequences. We can distinguish between fixedcamera and movingcamera setups;obviously, this choice again depends on the application domain into which the HARsystem will be integrated. For automotive applications or robotics, one should optfor amoving camera, as the cameramovementmight influence the visual propertiesof the human silhouettes. An example of a movingcamera dataset is PARSe27kdataset [161]. For surveillance applications, a static camera setup will suffice.In another way, we could distinguish between indoor or outdoor camera setups; forexample, RAP dataset [153] uses an indoor camera, while PARSe27k dataset [161]
45

Soft Biometrics Analysis in Outdoor Environments
comprises outdoor video sequences. Indoor captured datasets, such as [153],although captured in realworld scenarios, do not pose that many challenges asoutdoor captured datasets, where the weather and lighting conditions are morevolatile. Finally, the last aspect regarding the camera setup is related to the presenceof a photographer. If the images are captured by a (professional) photographersome bias is introduced, as a human decides how and when to capture the images,such that it will enhance the appearance of the subject. Some databases, suchas CAD [123] or HAT [66; 78] use images downloaded from public websites.However, in these images, the persons are aware of being photographed andperhaps even prepared for this (posing for the image, dressed up nicely for a photosession, etc.). Therefore, even if some datasets contain inthewild images gatheredfor a different system, they might still contain important differences from realworld images in which the subject is unaware of being photographed, the imageis captured automatically, without any human intervention, are the subjects aredressed normally and performing natural dynamic movements.
6. Pose and occlusion labeling. Another nice to have feature for a HAR datasetis the annotation of pose and occlusions. Some databases already provide thisinformation [66; 78; 108; 153]. Amongst other things, these extra labels prove usefulin the evaluation of HAR systems, as they allow researchers to diagnose the errorsof HAR and examine the influence of various factors.
7. Data partitioning strategies. When dealing with HAR, the datasets partitioningscheme (into the train, validation, and test splits) should be carefully engineered.A common pitfall is to split the frames into the train and validation splits randomly,regardless of the person’s identity. This can lead to an unfair assignment of asubject into one of these splits, and inducing bias in the evaluation process. Thisis even more important, as the current stateoftheart methods generally rely ondeep neural network architectures, which have a blackbox behavior in nature, andit is not so straightforward to determine which image features lead to the finalclassification result.
Solutions to this problem include extracting each individual (along with its tracklets) from the video sequence or providing the annotations at the identity level. Then,each person could be randomly assigned to one of the dataset splits.
8. Synthetic data. Recently, significant advances have been made in the field ofcomputer graphics and synthetic data generation. For example, in the field of dronesurveillance, generated data [173] has proven its efficiency in training accuratemachine vision systems. In this section, we have presented some computergenerated datasets which contain human attribute annotations. We consider thatsynthetically generated data is worth taking into consideration, as theoretically,it can be considered an inexhaustible source of data, which could be able togenerate subjects with various attributes, under different poses, in diverse scenarios.However, stateoftheart generative models rely on deep learning, which is known
46

Soft Biometrics Analysis in Outdoor Environments
to be ”hungry” for data, so data is needed to build a realistic generative model.Therefore, this solution might prove to be just a vicious circle.
9. Privacy issues. In the past, as traditional video surveillance systems were simpleand involved only human monitoring, privacy was not a major concern; however,these days, the pervasiveness of systems equipped with cuttingedge technologiesin public places (e.g., shopping malls, private and public buildings, bus and trainstations) have aroused new privacy and security concerns. For instance, the Officeof the Privacy Commissioner of Canada (OPC) is an organization that helps peoplereport their privacy concerns and enforces the enterprises to manage people’spersonal data in their business activities based on restricting standards (https://www.priv.gc.ca/en/report-a-concern/).
When gathering a dataset with realworld images, we deal with privacy and humanrights violations. Ideally, HAR datasets should contained images captured by realworld surveillance cameras, with the subjects are unaware of being filmed, such thattheir behavior is as natural as possible. From an ethical perspective, humans shouldconsent before their images are annotated and publicly distributed. However, thisis not feasible for all scenarios. For example, the Brainwash [174] dataset wasgathered inside a private cafe for the purpose of head detection, and comprised11,917 images. Although this benchmark is not very popular, it is seen in the listsof the popular datasets for commercial and military applications, as it has capturedthe regular customers without their awareness. The DukeMTMC [152] datasettargets the task of multiperson reidentification from fullbody images taken byseveral cameras. This dataset was collected in a university campus in an outdoorenvironment and contains over 2 million frames of 2000 students captured by 8cameras at 1080p. MSCeleb1M [175] is another large dataset of 10 million facescollected from the Internet.
However, despite the success of these datasets (if we evaluate success by thenumber of citations and database downloads), the authors decided to shoutdownthe datasets due to human rights and privacy violation issues.
According to PewResearch Center Privacy Panel Survey conducted from 27 Januaryto 16 February 2015, among 461 adults, more than 90 percent agreed that twofactors are critical for surveillance systems: (1)who can access to their information?(2) what information is collected about them? Moreover, it is notable that theyconsent to share confidential information with someone they trust (93%); however,it is important not to be monitored without permission (88%).
As people’s faces contain sensitive information that could be captured in the wild,authorities have published some standards (https://gdpr-info.eu/) to enforceenterprises respect the privacy of their costumers.
47

Soft Biometrics Analysis in Outdoor Environments
Less then 45 (24.9 %)
Less than 60 (5.7 %)Less than 15 (1.4 %)
More than 60 (0.7 %)
Less than 30 (67.3 %)
Middle Aged (62.0 %)
Senior (11.0 %)
Child (2.4 %)
Young Adult (24.6 %)
CRP datasetPETA dataset
Figure 2.4: Frequency distribution of the labels describing the ‘Age’ class in the PETA [152] (onthe left) and CRP [162] (on the right) databases.
2.6.2 Critical Discussion and Performance Comparison
As mentioned, the main objective of the localization method is to extract distinct finegrained features, by careful analyses of different pieces of the input data and aggregatingthem. Although the extracted localized features create a detailed feature representationof the image, dividing the image to several pieces has several drawbacks:
• the expressiveness of the data is lost (e.g., when processing a jacket only by severalparts, some global features that encode the jacket’s shape and structure are ignored).
• as the person detector cannot always provide aligned and accurate bounding boxes,rigid partitioning methods are prone to error in bodypart captioning, mainly whenthe input data includes awide background. Therefore, methods based on stride/gridpatching of the image are not robust to misalignment errors in the person boundingboxes, leading to degradation in prediction performance.
• different from gender and age, most human attributes (such as glasses, hat, scarf,shoes, etc.) belong to small regions of the image; therefore, analyzing other partsof the image may add irrelevant features to the final feature representation of theimage.
• some attributes are viewdependent andhighly changeable due to humanbodypose,and ignoring them reduces themodel performance; for example, glasses recognitionin the sideview images ismore laborious than frontview, while itmay be impossiblein backview images. Therefore, in some localization methods (e.g., poselet basedtechniques), regardless of this fact, features of different parts may be aggregated toperform a prediction on an unavailable attribute.
• some localization methods rely on the bodyparsing techniques [176] or bodypartdetection methods [177] to extract local features. Not only requires training suchpart detectors rich annotations of data but also errors in bodyparsing and bodypartdetection methods directly affect the performance of the HAR model.
There are several possibilities to address some of these issues, which mostly attempt toguide the learning process using additional information. For instance, as discussed inSection 2.3, some works use novel model structures [72] to capture the relationships
48

Soft Biometrics Analysis in Outdoor Environments
and correlations between the parts of the image, while others try to use prior bodyposecoordinates [63] (or develop a viewdetector in the main structure [61]) to learn theviewspecific attributes. Some methods develop attention modules to find the relevantbody parts, while some approaches extract various poselets [163] of the image by slicingwindowdetectors. Using the semantic attributes as a constraint for extracting the relevantregions is another solution to look for localized attributes [100]. Moreover, developingaccurate bodypart detectors, bodyparsing algorithms and introducing datasets with partannotations are some strategies that can help the localization methods.
Limited data is the other main challenge in HAR. The primary solutions for solving theproblem of limited data are synthesizing artificial samples or augmenting the originaldata. One of the popular approaches for increasing the size of the dataset is to usegenerative models (i.e., Generative Adversarial Network (GAN) [178], Variational AutoEncoders (VAE) [179], or a combination of both [180]). These models are powerfultools for producing new samples, but are not widely used for extending human fullbodydatasets for three reasons:
• in opposition to the breakthrough in face generative models [181], fullbodygenerative models are still in early stages and their performance is stillunsatisfactory,
• the generated data is unlabelled, while HAR is yet far from the stage to beimplemented based on unlabeled data. It worth mentioning that, automaticannotations is an active research area in object detection [182].
• not only takes learning highquality generative models for human fullbody toomuch time, but it also requires a large amount of highresolution learning data,which is yet not available.
Therefore, researchers [71; 82; 103; 129; 183–185]mostly either perform transfer learningto capture the useful knowledge of large datasets or resort to the simple yet useful labelpersevering augmentation techniques from basic data augmentation (flipping, shifting,scaling, cropping, resizing, rotating, shearing, zooming, etc.) to more sophisticatedmethods such as random erasing [186] and foreground augmentation [187].
Due to the lack of sufficient data in some data classes (attributes), augmentationmethodsshould be implemented carefully. Suppose that we have very few data from some classes(e.g., ‘age 0–11’, ‘short winter jacket’) and much more data from other classes (e.g., ‘age25–35’, ‘tshirt’). A blind data augmentation process would exacerbate the data classimbalance and increase the overfitting problem in minority classes. Furthermore, somebasic augmentations are not label persevering. For example, for a dataset annotated forbody weight, scratching the images of a thin personmay be interpreted as amedium or fatperson, while it may be acceptable for colorbased labels. Therefore, visualizing a set ofaugmented data and careful studying of the annotation data are highly suggested beforeperforming augmentation.
49

Soft Biometrics Analysis in Outdoor Environments
Figure 2.5: As human, not only we describe the available attributes in occluded images but alsowe can predict the covered attributes in a negative strategy based on the attribute relations.
Using proper pretrained models (transfer learning) not only reduces the training timebut also increases the system’s performance. To have an effective transfer learning fromtask A to task B we should consider the following conditions [188–190],:
1. There should be some relationships between the data of task A and task B. Forexample, applying pretrained weights of the ImageNet dataset [50] on HAR task isbeneficial as both domains are dealingwithRGB images of objects, including humandata, while transferring the knowledge of medical imagery (e.g., CT/MRI) are notuseful and may only impose some heavy parameters to the model.
2. The data in task A is much more than the data in task B as transferring theknowledge of other small datasets cannot guarantee performance improvements.
Generally, there are two useful strategies for applying transfer learning to HAR problems,in which we suggest to discard the classification layers (i.e., fully connected layers thatare on top of the model), and use the pretrained model as a feature extractor (backbone).Then,
• we can freeze the backbone model and adding several classification layers on top ofthe model for finetuning.
• we can add the proper classification layers on top of the model and train all themodel layers in several steps: (1) freeze the backbone model and finetune the lastlayers, (2) considering a lower learning rate, we unfreeze highlevel feature extractorlayers and finetune the model, (3) we unfreeze midlevel and lowlevel layers inother steps and train themwith a lower learning rate, as these features are normallycommon between most tasks with the same data types.
Considering attribute correlations can boost the performance of HAR models. Someworks (e.g., multitask and RNN based models) attempt to extract the semanticrelationship between the attributes from the visual data. However, lack of enoughdata and also the type of annotations in HAR datasets (the region of attributes are notannotated) lead to the poor performance of these models in capturing the correlationof attributes. Even in GCN and CRF based models that are known to be effective in
50
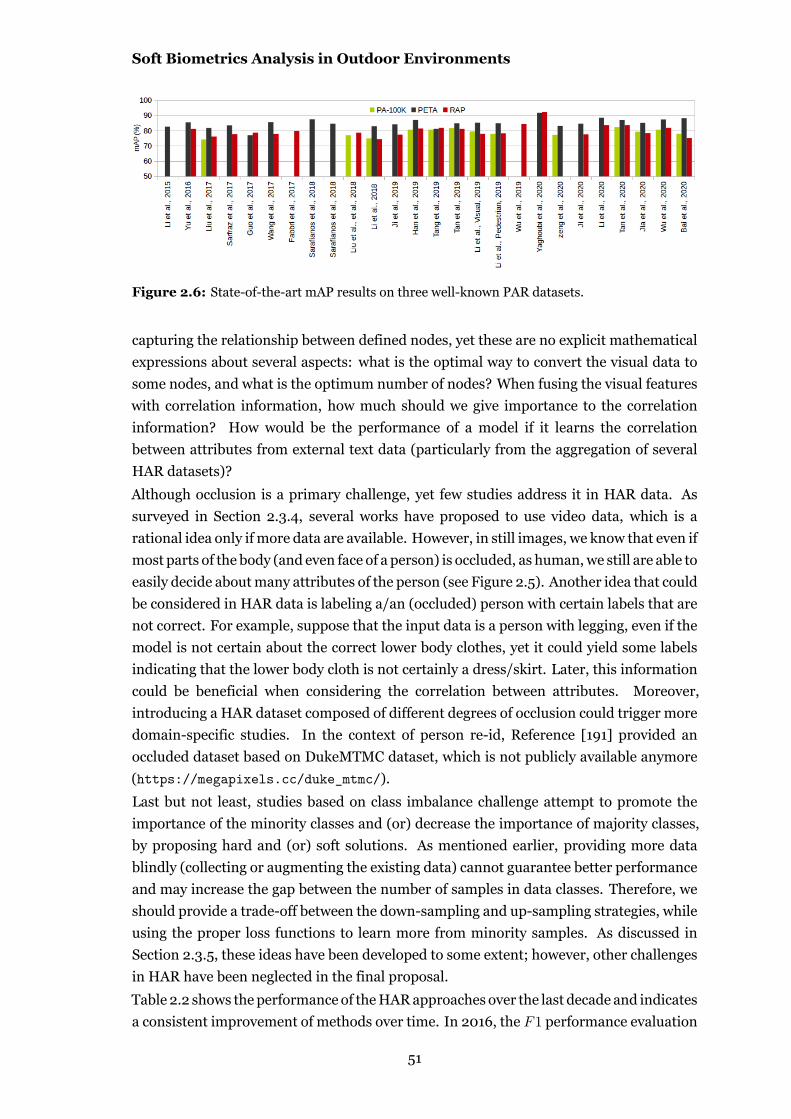
Soft Biometrics Analysis in Outdoor Environments
Figure 2.6: Stateoftheart mAP results on three wellknown PAR datasets.
capturing the relationship between defined nodes, yet these are no explicit mathematicalexpressions about several aspects: what is the optimal way to convert the visual data tosome nodes, and what is the optimum number of nodes? When fusing the visual featureswith correlation information, how much should we give importance to the correlationinformation? How would be the performance of a model if it learns the correlationbetween attributes from external text data (particularly from the aggregation of severalHAR datasets)?
Although occlusion is a primary challenge, yet few studies address it in HAR data. Assurveyed in Section 2.3.4, several works have proposed to use video data, which is arational idea only ifmore data are available. However, in still images, we know that even ifmost parts of the body (and even face of a person) is occluded, as human, we still are able toeasily decide aboutmany attributes of the person (see Figure 2.5). Another idea that couldbe considered in HAR data is labeling a/an (occluded) person with certain labels that arenot correct. For example, suppose that the input data is a person with legging, even if themodel is not certain about the correct lower body clothes, yet it could yield some labelsindicating that the lower body cloth is not certainly a dress/skirt. Later, this informationcould be beneficial when considering the correlation between attributes. Moreover,introducing a HAR dataset composed of different degrees of occlusion could trigger moredomainspecific studies. In the context of person reid, Reference [191] provided anoccluded dataset based on DukeMTMC dataset, which is not publicly available anymore(https://megapixels.cc/duke_mtmc/).Last but not least, studies based on class imbalance challenge attempt to promote theimportance of the minority classes and (or) decrease the importance of majority classes,by proposing hard and (or) soft solutions. As mentioned earlier, providing more datablindly (collecting or augmenting the existing data) cannot guarantee better performanceand may increase the gap between the number of samples in data classes. Therefore, weshould provide a tradeoff between the downsampling and upsampling strategies, whileusing the proper loss functions to learn more from minority samples. As discussed inSection 2.3.5, these ideas have been developed to some extent; however, other challengesin HAR have been neglected in the final proposal.
Table 2.2 shows the performance of theHARapproaches over the last decade and indicatesa consistent improvement of methods over time. In 2016, the F1 performance evaluation
51

Soft Biometrics Analysis in Outdoor Environments
of [74] on the RAP and PETA datasets was 66.12 and 84.90, respectively, while thesenumbers were improved to 79.98 and 86.87 in the year 2019 [92] and to 82.10 and88.30 in year 2020. Furthermore, according to Table 2.2, it is clear that challenges ofattributes localization and attributes correlation have attracted the most attention overthe recent years, which indicates that extracting distinctive finegrained features fromrelevant locations of the given input images is the most important aspect of HAR models.
Despite the early works that analyzed the human fullbody data in different locationsand situations, recent works have focused on attribute recognition from surveillance data,which arouses some privacy issues.
Appearing comprehensive evaluation metrics is another noticeable change over the lastdecade. Due to the intrinsic, large class imbalance in the HAR datasets, mA cannotprovide a comprehensive performance evaluation over different methods. Suppose thatin a binary classification situation, if 99% of the samples belong to persons with glassesand 1% of samples belong to persons without glasses, the model can recognize all the testsamples as persons with glasses and still has 99% of accuracy in recognition. Therefore,for a fair performance comparison with the state of the arts, it is necessary to considermetrics such as Prec, Rec, Acc, and F1 – which are discussed in Section 2.5.
Table 2.2 also shows that the RAP, PETA, and PA100K datasets have attracted themost attention in the context of attribute recognition –which excludes person reid. InFigure 2.6 we illustrate the stateoftheart results obtained on these datasets for mAP
metric. As seen, the PETA dataset sounds easier than other datasets, despite the smallersize and lower quality data compared with the RAP dataset.
Table 2.2: Performance comparison of HAR approaches over the last decade for differentbenchmarks.
Ref., Year,Cat.
Taxonomy Dataset mA Acc. prec. rec. F1
[66], 2011, FAR PoseLet HAT [66] 53.80
[68], 2011, FAR PoseLet [68] 82.90
[123], 2012,FAR and CAA Attribute relation
[123] 84.90
D.Fashion [91]35.37(top5)
[79], 2013, FAR BodyPart HAT [66] 69.88
[69], 2013, FAR PoseLet HAT [66] 59.30
[70], 2013, FAR PoseLet HAT [66] 59.70
[77], 2015, FAR BodyPart DP [68] 83.60
[128], 2015, PAR Loss function PETA [152] 82.6
[77], 2015, FAR BodyPart DP [68] 83.60
[150], 2015, CAAAttribute locationand relation
Dress [150] 84.30 65.20 70.80 67.80
52

Soft Biometrics Analysis in Outdoor Environments
Table 2.2: Cont.
Ref., Year,Cat.
Taxonomy Dataset mA Acc. prec. rec. F1
[75], 2016, FAR PoseLet WIDER [75] 92.20
[74], 2016, PAR PoseLetRAP [108] 81.25 50.30 57.17 78.39 66.12
PETA [152] 85.50 76.98 84.07 85.78 84.90
[91], 2016, CAA Limited data D.Fashion [91]54.61(top5)
[86], 2017, FAR AttentionWIDER [75] 82.90
Berkeley [68] 92.20
[88], 2017, PAR Attention
RAP [108] 76.12 65.39 77.33 78.79 78.05
PETA [152] 81.77 76.13 84.92 83.24 84.07
PA100K [88] 74.21 72.19 82.97 82.09 82.53
[124], 2018, FAR Grammar DP [68] 89.40
[61], 2018,PAR and FAR Pose Estimation
RAP [108] 77.70 67.35 79.51 79.67 79.59
PETA [152] 83.45 77.73 86.18 84.81 85.49
WIDER [75] 82.40
[86], 2017, PAR AttentionRAP [108] 78.68 68.00 80.36 79.82 80.09
PA100K [88] 76.96 75.55 86.99 83.17 85.04
[109], 2017, PAR RNNRAP [108] 77.81 78.11 78.98 78.58
PETA [152] 85.67 86.03 85.34 85.42
[104], 2017, PARLoss Function Augmentation
PETA [152] 75.43 70.83
[132], 2017, PAR Occlusion RAP [108] 79.73 83.97 76.96 78.72 77.83
[105], 2017, CAA Transfer Learning [105] 64.35 64.97 75.66
[111], 2017, PAR MultitaskMarket [24] 88.49
Duke [152] 87.53
[192], 2017, CAA Multiplication D.Fashion [91]30.40(top5)
[89], 2018, CAA Attention D.Fashion [91]60.95(top5)
[113], 2018, PAR SoftMultitask
SoBiR [114] 74.20
VIPeR [193] 84.00
PETA [152] 87.54 [149], 2018,PAR and FAR Soft solution
WIDER [75] 86.40
PETA [152] 84.59 78.56 86.79 86.12 86.46
[63], 2018, PAR Pose EstimationPETA [152] 82.97 78.08 86.86 84.68 85.76
RAP [108] 74.31 64.57 78.86 75.90 77.35
PA100K [88] 74.95 73.08 84.36 82.24 83.29
53

Soft Biometrics Analysis in Outdoor Environments
Table 2.2: Cont.
Ref., Year,Cat.
Taxonomy Dataset mA Acc. prec. rec. F1
[97], 2018, PAR Attribute locationRAP [108] 78.68 68.00 80.36 79.82 80.09
PA100K [88] 76.96 75.55 86.99 83.17 85.04
[117], 2018, PAR RNNRAP [108] 77.81 78.11 78.98 78.58
PETA [152] 85.67 86.03 85.34 85.42
[126], 2019, PAR Soft solutionRAP [108] 77.44 65.75 79.01 77.45 78.03
PETA [152] 84.13 78.62 85.73 86.07 85.88
[125], 2019, PAR Multiplication
PETA [152] 86.97 79.95 87.58 87.73 87.65
RAP [108] 81.42 68.37 81.04 80.27 80.65
PA100K [88] 80.65 78.30 89.49 84.36 86.85
[118], 2019, PAR RNNRAP [108] 77.81 78.11 78.98 78.58
PETA [152] 86.67 86.03 85.34 85.42
[133], 2019, PAR OcclusionDuke [152] 89.31 73.24
MARS [194] 87.01 72.04
[100], 2019, PAR Attribute Location
RAP [108] 81.87 68.17 74.71 86.48 80.16
PETA [152] 86.30 79.52 85.65 88.09 86.85
PA100K [88] 80.68 77.08 84.21 88.84 86.46
[92], 2019, PAR Attention
PA100K [88] 81.61 78.89 86.83 87.73 87.27
RAP [108] 81.25 67.91 78.56 81.45 79.98
PETA [152] 84.88 79.46 87.42 86.33 86.87
Market [24] 87.88
Duke [152] 87.88
[110], 2019, PAR GCN
RAP [108] 77.91 70.04 82.05 80.64 81.34
PETA [152] 85.21 81.82 88.43 88.42 88.42
PA100K [88] 79.52 80.58 89.40 87.15 88.26
[107], 2019, PAR GCN
RAP [108] 78.30 69.79 82.13 80.35 81.23
PETA [152] 84.90 80.95 88.37 87.47 87.91
PA100K [88] 77.87 78.49 88.42 86.08 87.24
[94], 2019,PAR and FAR Attention
RAP [108] 84.28 59.84 66.50 84.13 74.28
WIDER [75] 88.00
[96], 2020, PAR AttentionRAP [108] 92.23
PETA [152] 91.70
[54], 2020, PAR MultitaskPA100K [88] 77.20 78.09 88.46 84.86 86.62
PETA [152] 83.17 78.78 87.49 85.35 86.41
[195], 2020, PAR RNNRAP [108] 77.62 67.17 79.72 78.44 79.07
PETA [152] 84.62 78.80 85.67 86.42 86.04
54

Soft Biometrics Analysis in Outdoor Environments
Table 2.2: Cont.
Ref., Year,Cat.
Taxonomy Dataset mA Acc. prec. rec. F1
[58], 2020, PAR RNN and attentionRAP [108] 83.72 81.85 79.96 80.89
PETA [152] 88.56 88.32 89.62 88.97
[120], 2020, PAR GCN
RAP [108] 83.69 69.15 79.31 82.40 80.82
PETA [152] 86.96 80.38 87.81 87.09 87.45
PA100K [88] 82.31 79.47 87.45 87.77 87.61
[196], 2020, PAR Baseline
RAP [108] 78.48 67.17 82.84 76.25 78.94
PETA [152] 85.11 79.14 86.99 86.33 86.09
PA100K [88] 79.38 78.56 89.41 84.78 86.25
[59], 2020, PAR RNN and attention
PA100K [88] 80.60 88.70 84.90 86.80
RAP [108] 81.90 82.40 81.90 82.10
PETA [152] 87.40 89.20 87.50 88.30
Market [24] 88.50
Duke [152] 88.80
[197], 2020, PAR Hard solution
PA100K [88] 77.89 79.71 90.26 85.37 87.75
RAP [108] 75.09 66.90 84.27 79.16 76.46
PETA [152] 88.24 79.14 88.79 84.70 86.70
[198], 2020, CAA — Fashionista [199] 88.91 47.72 44.92 39.42
[200], 2020, PAR MathorientedMarket [24] 92.90 78.01 87.41 85.65 86.52
Duke [152] 91.77 76.68 86.37 84.40 85.37
We observe that the performance of the state of the arts is yet far from the reliable rangeto be used in forensic affairs and enterprises, and it requires more attention in bothintroducing novel datasets and proposing robust methods.Among PAR, FAR, and CAA fields of study, most of the papers have focused on the PARtask. The reason is not apparent, but at least we know that (1) PAR data are often collectedfrom CCTV and surveillance cameras, and analyzing such data is critical for forensic andsecurity objectives, (2) person reid is a hot topic that mainly works with the same datatype and could be highly influenced by powerful PAR methods.
2.7 Conclusions
This survey reviewed the most relevant works published in the context of HAR problemover the last decade. Contrary to the previous published reviews, which provided amethodological categorization of the literature, in this survey we privileged a challengebased taxonomy, that is, methods were organized based on the challenges of the HARproblem that they were devised to address. According to this type of organization,readers can easily understand the most suitable strategies for addressing each of the
55

Soft Biometrics Analysis in Outdoor Environments
typical challenges of HAR and simultaneously learn which strategies perform better.In addition, we comprehensively reviewed the available HAR datasets, outlining therelative advantages and drawbacks of each one with respect to others, as well as the datacollection strategy used. Also, the intrinsically imbalanced nature of the HAR datasets isdiscussed, as well the most relevant challenges that typically arise when gathering datafor this problem.
Bibliography
[1] G. Tripathi, K. Singh, and D. K. Vishwakarma, “Convolutional neural networks forcrowd behaviour analysis: a survey,” The Visual Computer, vol. 35, no. 5, pp. 753–776, 2019. 13
[2] B. Munjal, S. Amin, F. Tombari, and F. Galasso, “Queryguided endtoend personsearch,” in Proc. CVPR, 2019, pp. 811–820. 13
[3] Y. Yan, Q. Zhang, B. Ni, W. Zhang, M. Xu, and X. Yang, “Learning context graphfor person search,” in Proc. CVPR, June 2019, pp. 2158–2167. 13
[4] C. V. Priscilla and S. A. Sheila, “Pedestrian detectiona survey,” in InternationalConference on Information, Communication and Computing Technology.Springer, 2019, pp. 349–358. 13
[5] N.Narayan, N. Sankaran, S. Setlur, andV.Govindaraju, “Learning deep features foronline person tracking using nonoverlapping cameras: A survey,” IMAGEVISIONCOMPUT, vol. 89, pp. 222–235, 2019. 13
[6] M. Ye, J. Shen, G. Lin, T. Xiang, L. Shao, and S. C. Hoi, “Deep learning for personreidentification: A survey and outlook,” arXiv preprint arXiv:2001.04193, 2020.13
[7] J. Xiang, T. Dong, R. Pan, and W. Gao, “Clothing attribute recognition based onrcnn framework using lsoftmax loss,” IEEE Access, vol. 8, pp. 48 299–48313,2020. 13
[8] B. H. Guo, M. S. Nixon, and J. N. Carter, “A joint density based rankscore fusionfor soft biometric recognition at a distance,” in 2018 24th International Conferenceon Pattern Recognition (ICPR). IEEE, 2018, pp. 3457–3462. 13
[9] N. Thom and E. M. Hand, “Facial attribute recognition: A survey,” ComputerVision: A Reference Guide, pp. 1–13, 2020. 13
[10] K. He, G. Gkioxari, P. Dollár, and R. Girshick, “Mask rcnn,” in Proc. IEEE ICCV,2017, pp. 2961–2969. 14, 18
[11] J. Redmon, S. Divvala, R. Girshick, and A. Farhadi, “You only look once: Unified,realtime object detection,” in Proc. CVPR, 2016, pp. 779–788. 14
56

Soft Biometrics Analysis in Outdoor Environments
[12] W. Liu, D. Anguelov, D. Erhan, C. Szegedy, S. Reed, C.Y. Fu, and A. C. Berg, “Ssd:Single shot multibox detector,” in Proc. ECCV. Springer, 2016, pp. 21–37. 14
[13] A. Krizhevsky, I. Sutskever, and G. E. Hinton, “Imagenet classification with deepconvolutional neural networks,” in Advances in neural information processingsystems, 2012, pp. 1097–1105. 15, 25
[14] E. Bekele and W. Lawson, “The deeper, the better: Analysis of person attributesrecognition,” in 2019 14th IEEE International Conference on Automatic Face &Gesture Recognition (FG 2019). IEEE, 2019, pp. 1–8. 15
[15] X. Zheng, Y. Guo, H. Huang, Y. Li, and R. He, “A survey of deep facial attributeanalysis,” International Journal of Computer Vision, pp. 1–33, 2020. 15
[16] X. Wang, S. Zheng, R. Yang, B. Luo, and J. Tang, “Pedestrian attribute recognition:A survey,” arXiv preprint arXiv:1901.07474, 2019. 15, 16
[17] I. Masi, Y. Wu, T. Hassner, and P. Natarajan, “Deep face recognition: A survey,”in 2018 31st SIBGRAPI conference on graphics, patterns and images (SIBGRAPI).IEEE, 2018, pp. 471–478. 16
[18] G. B.Huang, H. Lee, and E. LearnedMiller, “Learning hierarchical representationsfor face verification with convolutional deep belief networks,” in Proc. CVPR.IEEE, 2012, pp. 2518–2525.
[19] Y. Sun, D. Liang, X.Wang, and X. Tang, “Deepid3: Face recognition with very deepneural networks,” arXiv preprint arXiv:1502.00873, 2015. 16
[20] M. De Marsico, A. Petrosino, and S. Ricciardi, “Iris recognition through machinelearning techniques: A survey,” Pattern Recognit. Lett., vol. 82, pp. 106–115, 2016.16
[21] F. Battistone and A. Petrosino, “Tglstm: A time based graph deep learningapproach to gait recognition,” Pattern Recognit. Lett., vol. 126, pp. 132–138, 2019.16
[22] P. Terrier, “Gait recognition via deep learning of the centerofpressure trajectory,”Applied Sciences, vol. 10, no. 3, p. 774, 2020. 16
[23] R. Layne, T. M. Hospedales, S. Gong, and Q. Mary, “Person reidentification byattributes.” in Bmvc, vol. 2, 2012, p. 8. 16
[24] Y. Lin, L. Zheng, Z. Zheng, Y. Wu, Z. Hu, C. Yan, and Y. Yang, “Improving personreidentification by attribute and identity learning,” Pattern Recognition, vol. 95,pp. 151–161, 2019. 16, 25, 29, 37, 41, 53, 54, 55
[25] J. Liu, B. Kuipers, and S. Savarese, “Recognizing human actions by attributes,” inCVPR 2011. IEEE, 2011, pp. 3337–3344. 16
57

Soft Biometrics Analysis in Outdoor Environments
[26] J. Shao, K. Kang, C. Change Loy, and X. Wang, “Deeply learned attributes forcrowded scene understanding,” in Proc. CVPR, 2015, pp. 4657–4666. 16
[27] N. Tsiamis, L. Efthymiou, and K. P. Tsagarakis, “A comparative analysis of thelegislation evolution for drone use in oecd countries,” Drones, vol. 3, no. 4, p. 75,2019. 17
[28] H. Fukui, T. Yamashita, Y. Yamauchi, H. Fujiyoshi, and H. Murase, “Robustpedestrian attribute recognition for an unbalanced dataset using minibatchtraining with rarity rate,” in Proc. IEEE IV. IEEE, 2016, pp. 322–327. 17, 34
[29] S. Prabhakar, S. Pankanti, and A. K. Jain, “Biometric recognition: Security andprivacy concerns,” IEEE security & privacy, vol. 1, no. 2, pp. 33–42, 2003. 17
[30] Y. Xiu, J. Li, H. Wang, Y. Fang, and C. Lu, “Pose flow: Efficient online posetracking,” arXiv preprint arXiv:1802.00977, 2018. 18
[31] J. Neves, F. Narducci, S. Barra, and H. Proença, “Biometric recognition insurveillance scenarios: a survey,” Artif. Intell. Rev., vol. 46, no. 4, pp. 515–541,2016. 18
[32] R. A. Fisher, “The use of multiple measurements in taxonomic problems,” Annalsof eugenics, vol. 7, no. 2, pp. 179–188, 1936. 18
[33] C. Cortes and V. Vapnik, “Supportvector networks,” Machine learning, vol. 20,no. 3, pp. 273–297, 1995. 18
[34] S. R. Safavian andD. Landgrebe, “A survey of decision tree classifier methodology,”IEEE transactions on systems, man, and cybernetics, vol. 21, no. 3, pp. 660–674,1991. 18
[35] B. Kamiński, M. Jakubczyk, and P. Szufel, “A framework for sensitivity analysis ofdecision trees,” Central European journal of operations research, vol. 26, no. 1, pp.135–159, 2018. 18
[36] W. S. McCulloch andW. Pitts, “A logical calculus of the ideas immanent in nervousactivity,” The bulletin of mathematical biophysics, vol. 5, no. 4, pp. 115–133, 1943.18
[37] G. P. Zhang, “Neural networks for classification: a survey,” IEEE Transactions onSystems, Man, and Cybernetics, Part C (Applications and Reviews), vol. 30, no. 4,pp. 451–462, 2000. 18
[38] T. Georgiou, Y. Liu, W. Chen, and M. Lew, “A survey of traditional and deeplearningbased feature descriptors for high dimensional data in computer vision,”International Journal of Multimedia Information Retrieval, pp. 1–36, 2019. 18
[39] R. Satta, “Appearance descriptors for person reidentification: a comprehensivereview,” arXiv preprint arXiv:1307.5748, 2013. 18
58

Soft Biometrics Analysis in Outdoor Environments
[40] M. Piccardi and E. D. Cheng, “Track matching over disjoint camera views based onan incrementalmajor color spectrumhistogram,” in IEEEConference onAdvancedVideo and Signal Based Surveillance, 2005. IEEE, 2005, pp. 147–152. 18
[41] S.Y. Chien, W.K. Chan, D.C. Cherng, and J.Y. Chang, “Human object trackingalgorithm with human color structure descriptor for video surveillance systems,”in 2006 IEEE International Conference on Multimedia and Expo. IEEE, 2006,pp. 2097–2100. 18
[42] K.M. Wong, L.M. Po, and K.W. Cheung, “Dominant color structure descriptorfor image retrieval,” in 2007 IEEE International Conference on Image Processing,vol. 6. IEEE, 2007, pp. VI–365. 18
[43] D. G. Lowe, “Distinctive image features from scaleinvariant keypoints,”International journal of computer vision, vol. 60, no. 2, pp. 91–110, 2004.18
[44] J. M. Iqbal, J. Lavanya, and S. Arun, “Abnormal human activity recognition usingscale invariant feature transform,” International Journal of Current Engineeringand Technology, vol. 5, no. 6, pp. 3748–3751, 2015. 18
[45] P.E. Forssén, “Maximally stable colour regions for recognition and matching,” in2007 IEEEConference onComputerVision andPatternRecognition. IEEE, 2007,pp. 1–8. 18
[46] S. Basovnik, L. Mach, A. Mikulik, and D. Obdrzalek, “Detecting scene elementsusing maximally stable colour regions,” in Proceedings of the EUROBOTConference, 2009. 18
[47] N. He, J. Cao, and L. Song, “Scale space histogram of oriented gradients forhuman detection,” in 2008 International Symposium on Information Science andEngineering, vol. 2. IEEE, 2008, pp. 167–170. 18
[48] N. Dalal and B. Triggs, “Histograms of oriented gradients for human detection,” inProc. CVPR, vol. 1. IEEE, 2005, pp. 886–893. 40
[49] H. Beiping and Z. Wen, “Fast human detection using motion detection andhistogram of oriented gradients.” JCP, vol. 6, no. 8, pp. 1597–1604, 2011. 18
[50] J. Deng, W. Dong, R. Socher, L.J. Li, K. Li, and L. FeiFei, “ImageNet: A LargeScale Hierarchical Image Database,” in CVPR09, 2009. 19, 50
[51] H.C. Shin, H. R. Roth, M. Gao, L. Lu, Z. Xu, I. Nogues, J. Yao, D. Mollura,and R. M. Summers, “Deep convolutional neural networks for computeraideddetection: Cnn architectures, dataset characteristics and transfer learning,” IEEETrans. Med. Imaging, vol. 35, no. 5, pp. 1285–1298, 2016. 19
59

Soft Biometrics Analysis in Outdoor Environments
[52] P. Alirezazadeh, E. Yaghoubi, E. Assunção, J. C. Neves, and H. Proença,“Pose switchbased convolutional neural network for clothing analysis in visualsurveillance environment,” in Proc. BIOSIG. Darmstadt, Germany: IEEE, 2019,pp. 1–5.
[53] E. Yaghoubi, P. Alirezazadeh, E. Assunção, J. C. Neves, and H. Proençaã, “Regionbased cnns for pedestrian gender recognition in visual surveillance environments,”in Proc. BIOSIG. IEEE, 2019, pp. 1–5. 19
[54] H. Zeng, H. Ai, Z. Zhuang, and L. Chen, “Multitask learning via coattentivesharing for pedestrian attribute recognition,” arXiv preprint arXiv:2004.03164,2020. 19, 29, 54
[55] Y. Lu, A. Kumar, S. Zhai, Y. Cheng, T. Javidi, and R. Feris, “Fullyadaptive featuresharing inmultitask networks with applications in person attribute classification,”in Proc. CVPR, 2017, pp. 5334–5343. 19, 28
[56] Y. Guo, Y. Liu, A. Oerlemans, S. Lao, S. Wu, and M. S. Lew, “Deep learning forvisual understanding: A review,” Neurocomputing, vol. 187, pp. 27–48, 2016. 19
[57] A. Khan, A. Sohail, U. Zahoora, and A. S. Qureshi, “A survey of the recentarchitectures of deep convolutional neural networks,” Artif. Intell. Rev., pp. 1–62,2020. 19
[58] Y. Li, H. Xu, M. Bian, and J. Xiao, “Attention based cnnconvlstm for pedestrianattribute recognition,” Sensors, vol. 20, no. 3, p. 811, 2020. 20, 55
[59] J. Wu, H. Liu, J. Jiang, M. Qi, B. Ren, X. Li, and Y. Wang, “Person attributerecognition by sequence contextual relation learning,” IEEE Transactions onCircuits and Systems for Video Technology, 2020. 20, 55
[60] J. Krause, T. Gebru, J. Deng, L.J. Li, and L. FeiFei, “Learning features and partsfor finegrained recognition,” in 2014 22nd International Conference on PatternRecognition. IEEE, 2014, pp. 26–33. 21
[61] M. S. Sarfraz, A. Schumann, Y. Wang, and R. Stiefelhagen, “Deep viewsensitive pedestrian attribute inference in an endtoend model,” arXiv preprintarXiv:1707.06089, 2017. 22, 49, 53
[62] C. Szegedy, W. Liu, Y. Jia, P. Sermanet, S. Reed, D. Anguelov, D. Erhan,V. Vanhoucke, and A. Rabinovich, “Going deeper with convolutions,” in Proc.CVPR, 2015, pp. 1–9. 22, 23
[63] D. Li, X. Chen, Z. Zhang, and K. Huang, “Pose guided deep model for pedestrianattribute recognition in surveillance scenarios,” in 2018 IEEE InternationalConference on Multimedia and Expo (ICME). IEEE, 2018, pp. 1–6. 22, 49, 53
[64] L. Wei, S. Zhang, W. Gao, and Q. Tian, “Person transfer gan to bridge domain gapfor person reidentification,” in Proc. CVPR, 2018, pp. 79–88. 22
60

Soft Biometrics Analysis in Outdoor Environments
[65] M. Jaderberg, K. Simonyan, A. Zisserman, and K. Kavukcuoglu, “Spatialtransformer networks,” in Proc NIPS Volume 2, ser. NIPS’15. Cambridge, MA,USA: MIT Press, 2015, p. 2017–2025. 22, 27
[66] G. Sharma and F. Jurie, “Learning discriminative spatial representation for imageclassification,” in BMVC 2011 British Machine Vision Conference, J. Hoey, S. J.McKenna, and E. Trucco, Eds. Dundee, United Kingdom: BMVA Press, 2011, pp.1–11. [Online]. Available: https://hal.inria.fr/hal00722820 22, 39, 41, 46, 52
[67] S. Lazebnik, C. Schmid, and J. Ponce, “Beyond bags of features: Spatial pyramidmatching for recognizing natural scene categories,” in 2006 IEEE ComputerSociety Conference on Computer Vision and Pattern Recognition (CVPR’06),vol. 2. IEEE, 2006, pp. 2169–2178. 22
[68] L. Bourdev, S. Maji, and J. Malik, “Describing people: A poseletbased approach toattribute classification,” in Proc. ICCV. IEEE, 2011, pp. 1543–1550. 22, 39, 41, 45,52, 53
[69] J. Joo, S. Wang, and S.C. Zhu, “Human attribute recognition by rich appearancedictionary,” in Proc. ICCV, 2013, pp. 721–728. 23, 52
[70] G. Sharma, F. Jurie, and C. Schmid, “Expanded parts model for human attributeand action recognition in still images,” in Proc. CVPR, June 2013. 23, 52
[71] N. Zhang, M. Paluri, M. Ranzato, T. Darrell, and L. Bourdev, “Panda: Pose alignednetworks for deep attribute modeling,” in Proc. CVPR, 2014, pp. 1637–1644. 23,49
[72] J. Zhu, S. Liao, D. Yi, Z. Lei, and S. Z. Li, “Multilabel cnn based pedestrian attributelearning for soft biometrics,” in 2015 International Conference on Biometrics(ICB). IEEE, 2015, pp. 535–540. 23, 48
[73] J. Zhu, S. Liao, Z. Lei, and S. Z. Li, “Multilabel convolutional neural network basedpedestrian attribute classification,” IMAGE VISION COMPUT, vol. 58, pp. 224–229, 2017. 23
[74] K. Yu, B. Leng, Z. Zhang, D. Li, and K. Huang, “Weaklysupervised learning of midlevel features for pedestrian attribute recognition and localization,” arXiv preprintarXiv:1611.05603, 2016. 23, 52, 53
[75] Y. Li, C. Huang, C. C. Loy, and X. Tang, “Human attribute recognition by deephierarchical contexts,” in Proc. ECCV. Springer, 2016, pp. 684–700. 23, 35, 39,41, 45, 53, 54
[76] R. Girshick, “Fast rcnn,” in Proc. ICCV, 2015, pp. 1440–1448. 23
[77] G. Gkioxari, R. Girshick, and J. Malik, “Actions and attributes from wholes andparts,” in Proc. ICCV, 2015, pp. 2470–2478. 24, 52
61

Soft Biometrics Analysis in Outdoor Environments
[78] P. F. Felzenszwalb, R. B. Girshick, D. McAllester, and D. Ramanan, “Objectdetection with discriminatively trained partbased models,” IEEE TPAMI, vol. 32,no. 9, pp. 1627–1645, 2009. 24, 38, 39, 46
[79] N. Zhang, R. Farrell, F. Iandola, and T. Darrell, “Deformable part descriptors forfinegrained recognition and attribute prediction,” in Proc. ICCV, December 2013.24, 52
[80] L. Yang, L. Zhu, Y. Wei, S. Liang, and P. Tan, “Attribute recognition from adaptiveparts,” arXiv preprint arXiv:1607.01437, 2016. 24
[81] M. Andriluka, L. Pishchulin, P. Gehler, and B. Schiele, “2d human pose estimation:Newbenchmark and state of the art analysis,” inProc. CVPR, 2014, pp. 3686–3693.24
[82] Y. Zhang, X. Gu, J. Tang, K. Cheng, and S. Tan, “Partbased attributeawarenetwork for person reidentification,” IEEE Access, vol. 7, pp. 53 585–53 595, 2019.24, 49
[83] X. Fan, K. Zheng, Y. Lin, and S. Wang, “Combining local appearance and holisticview: Dualsource deep neural networks for human pose estimation,” in Proc.CVPR, 2015, pp. 1347–1355. 25
[84] M. Oquab, L. Bottou, I. Laptev, and J. Sivic, “Is object localization for free?weaklysupervised learning with convolutional neural networks,” in Proc. CVPR, 2015, pp.685–694. 25
[85] B. Zhou, A. Lapedriza, J. Xiao, A. Torralba, and A. Oliva, “Learning deep featuresfor scene recognition using places database,” in Advances in neural informationprocessing systems, 2014, pp. 487–495. 25
[86] H. Guo, X. Fan, and S. Wang, “Human attribute recognition by refining attentionheat map,” Pattern Recognit. Lett., vol. 94, pp. 38–45, 2017. 25, 53
[87] K. Simonyan and A. Zisserman, “Very deep convolutional networks for largescaleimage recognition,” arXiv preprint arXiv:1409.1556, 2014. 25
[88] X. Liu, H. Zhao, M. Tian, L. Sheng, J. Shao, S. Yi, J. Yan, and X.Wang, “Hydraplusnet: Attentive deep features for pedestrian analysis,” in Proc IEEE ICCV, 2017, pp.350–359. 25, 37, 41, 53, 54, 55
[89] W. Wang, Y. Xu, J. Shen, and S.C. Zhu, “Attentive fashion grammar network forfashion landmark detection and clothing category classification,” in Proc. CVPR,June 2018. 25, 53
[90] A. Newell, K. Yang, and J. Deng, “Stacked hourglass networks for human poseestimation,” in ECCV. Springer, 2016, pp. 483–499. 25
62

Soft Biometrics Analysis in Outdoor Environments
[91] Z. Liu, P. Luo, S.Qiu, X.Wang, andX. Tang, “Deepfashion: Powering robust clothesrecognition and retrieval with rich annotations,” in Proc IEEE CVPR, 2016, pp.1096–1104. 26, 28, 40, 42, 52, 53
[92] Z. Tan, Y. Yang, J. Wan, H. Wan, G. Guo, and S. Z. Li, “Attention based pedestrianattribute analysis,” IEEE transactions on image processing, 2019. 26, 52, 54
[93] H. Zhao, J. Shi, X. Qi, X. Wang, and J. Jia, “Pyramid scene parsing network,” inProc. CVPR, 2017, pp. 2881–2890. 26
[94] M. Wu, D. Huang, Y. Guo, and Y. Wang, “Distractionaware feature learningfor human attribute recognition via coarsetofine attention mechanism,” arXivpreprint arXiv:1911.11351, 2019. 26, 54
[95] F. Zhu, H. Li, W. Ouyang, N. Yu, and X. Wang, “Learning spatial regularizationwith imagelevel supervisions for multilabel image classification,” in Proc. CVPR,2017, pp. 5513–5522. 26
[96] E. Yaghoubi, D. Borza, J. Neves, A. Kumar, and H. Proença, “An attentionbaseddeep learning model for multiple pedestrian attributes recognition,” IMAGEVISION COMPUT., pp. 1–25, 2020. [Online]. Available: https://doi.org/10.1016/j.imavis.2020.103981 26, 28, 54
[97] P. Liu, X. Liu, J. Yan, and J. Shao, “Localization guided learning for pedestrianattribute recognition,” arXiv preprint arXiv:1808.09102, 2018. 26, 54
[98] B. Zhou, A. Khosla, A. Lapedriza, A. Oliva, andA. Torralba, “Learning deep featuresfor discriminative localization,” in Proc. CVPR, 2016, pp. 2921–2929. 26
[99] C. L. Zitnick and P. Dollár, “Edge boxes: Locating object proposals from edges,” inProc. ECCV. Springer, 2014, pp. 391–405. 26
[100] C. Tang, L. Sheng, Z. Zhang, and X. Hu, “Improving pedestrian attributerecognition with weaklysupervised multiscale attributespecific localization,” inProc. ICCV, October 2019, pp. 4997–5006. 26, 49, 54
[101] S. Ioffe and C. Szegedy, “Batch normalization: Accelerating deep network trainingby reducing internal covariate shift,” arXiv preprint arXiv:1502.03167, 2015. 26
[102] J. Hu, L. Shen, and G. Sun, “Squeezeandexcitation networks,” in Proc. CVPR,2018, pp. 7132–7141. 27
[103] E. Bekele, W. E. Lawson, Z. Horne, and S. Khemlani, “Implementing a robustexplanatory bias in a person reidentification network,” in Proc. CVPRW, 2018, pp.2165–2172. 27, 49
[104] E. Bekele, C. Narber, andW. Lawson, “Multiattribute residual network (maresnet)for softbiometrics recognition in surveillance scenarios,” in Proc. FG). IEEE,2017, pp. 386–393. 27, 53
63

Soft Biometrics Analysis in Outdoor Environments
[105] Q. Dong, S. Gong, and X. Zhu, “Multitask curriculum transfer deep learning ofclothing attributes,” in 2017 IEEEWinter Conference on Applications of ComputerVision (WACV), 2017, pp. 520–529. 27, 53
[106] Q. Chen, J. Huang, R. Feris, L. M. Brown, J. Dong, and S. Yan, “Deep domainadaptation for describing people based on finegrained clothing attributes,” inProc.CVPR, 2015, pp. 5315–5324. 28
[107] Q. Li, X. Zhao, R. He, and K. Huang, “Pedestrian attribute recognition by jointvisualsemantic reasoning and knowledge distillation,” in Proceedings of the 28thInternational Joint Conference on Artificial Intelligence. AAAI Press, 2019, pp.833–839. 28, 30, 54
[108] D. Li, Z. Zhang, X. Chen, and K. Huang, “A richly annotated pedestrian dataset forperson retrieval in real surveillance scenarios,” IEEE T IMAGE PROCESS, vol. 28,no. 4, pp. 1575–1590, 2018. 28, 37, 41, 46, 53, 54, 55
[109] J. Wang, X. Zhu, S. Gong, and W. Li, “Attribute recognition by joint recurrentlearning of context and correlation,” in Proc. ICCV, 2017, pp. 531–540. 28, 30,53
[110] Q. Li, X. Zhao, R. He, and K. Huang, “Visualsemantic graph reasoning forpedestrian attribute recognition,” in Proceedings of the AAAI Conference onArtificial Intelligence, vol. 33, 2019, pp. 8634–8641. 28, 30, 31, 54
[111] K.He, Z.Wang, Y. Fu, R. Feng, Y.G. Jiang, andX. Xue, “Adaptively weightedmultitask deep network for person attribute classification,” in Proceedings of the 25thACM international conference on Multimedia. ACM, 2017, pp. 1636–1644. 28,53
[112] N. Sarafianos, T. Giannakopoulos, C. Nikou, and I. A. Kakadiaris, “Curriculumlearning for multitask classification of visual attributes,” in Proc. ICCVW, 2017,pp. 2608–2615. 29
[113] ——, “Curriculum learning of visual attribute clusters for multitask classification,”Pattern Recognition, vol. 80, pp. 94–108, 2018. 29, 53
[114] D. MartinhoCorbishley, M. S. Nixon, and J. N. Carter, “Soft biometric retrieval todescribe and identify surveillance images,” in 2016 IEEE International Conferenceon Identity, Security and Behavior Analysis (ISBA). IEEE, 2016, pp. 1–6. 29, 53
[115] S. Woo, J. Park, J.Y. Lee, and I. So Kweon, “Cbam: Convolutional block attentionmodule,” in Proc. ECCV, September 2018. 29
[116] H. Liu, J. Wu, J. Jiang, M. Qi, and B. Ren, “Sequencebased person attributerecognition with joint ctcattention model,” arXiv preprint arXiv:1811.08115,2018. 29
64

Soft Biometrics Analysis in Outdoor Environments
[117] X. Zhao, L. Sang, G. Ding, Y. Guo, and X. Jin, “Grouping attribute recognition forpedestrian with joint recurrent learning.” in IJCAI, 2018, pp. 3177–3183. 29, 54
[118] X. Zhao, L. Sang, G. Ding, J. Han, N. Di, and C. Yan, “Recurrent attention modelfor pedestrian attribute recognition,” in Proceedings of the AAAI Conference onArtificial Intelligence, vol. 33, 2019, pp. 9275–9282. 30, 54
[119] Z. Ji,W. Zheng, and Y. Pang, “Deep pedestrian attribute recognition based on lstm,”in 2017 IEEE International Conference on Image Processing (ICIP). IEEE, 2017,pp. 151–155. 30
[120] Z. Tan, Y. Yang, J. Wan, G. Guo, and S. Z. Li, “Relationaware pedestrian attributerecognition with graph convolutional networks.” in Proc. AAAI, 2020, pp. 12 055–12062. 31, 55
[121] W. Luo, Y. Li, R. Urtasun, and R. Zemel, “Understanding the effective receptivefield in deep convolutional neural networks,” in Advances in neural informationprocessing systems, 2016, pp. 4898–4906. 31
[122] T.N.Kipf andM.Welling, “Semisupervised classificationwith graph convolutionalnetworks,” arXiv preprint arXiv:1609.02907, 2016. 31
[123] H. Chen, A. Gallagher, and B. Girod, “Describing clothing by semantic attributes,”in Proc. ECCV. Springer, 2012, pp. 609–623. 31, 40, 41, 46, 52
[124] S. Park, B.X.Nie, andS. Zhu, “Attribute andor grammar for joint parsing of humanpose, parts and attributes,” IEEE TPAMI, vol. 40, no. 7, pp. 1555–1569, 2018. 31,53
[125] K. Han, Y. Wang, H. Shu, C. Liu, C. Xu, and C. Xu, “Attribute aware pooling forpedestrian attribute recognition,” arXiv preprint arXiv:1907.11837, 2019. 32, 54
[126] Z. Ji, E. He, H. Wang, and A. Yang, “Imageattribute reciprocally guided attentionnetwork for pedestrian attribute recognition,” Pattern Recognit. Lett., vol. 120, pp.89–95, 2019. 32, 34, 35, 54
[127] K. Liang, H. Chang, S. Shan, and X. Chen, “A unified multiplicative framework forattribute learning,” in Proc. ICCV, December 2015. 32
[128] D. Li, X. Chen, and K. Huang, “Multiattribute learning for pedestrian attributerecognition in surveillance scenarios,” in 2015 3rd IAPR Asian Conference onPattern Recognition (ACPR). IEEE, 2015, pp. 111–115. 32, 52
[129] Y. Zhao, X. Shen, Z. Jin, H. Lu, and X.s. Hua, “Attributedriven featuredisentangling and temporal aggregation for video person reidentification,” inProc.CVPR, 2019, pp. 4913–4922. 33, 49
[130] R. Hou, B.Ma, H. Chang, X. Gu, S. Shan, and X. Chen, “Vrstc: Occlusionfree videoperson reidentification,” in Proc. CVPR, June 2019. 33
65

Soft Biometrics Analysis in Outdoor Environments
[131] J. Xu and H. Yang, “Identification of pedestrian attributes based on videosequence,” in 2018 IEEE International Conference on Advanced Manufacturing(ICAM). IEEE, 2018, pp. 467–470. 33
[132] M. Fabbri, S. Calderara, and R. Cucchiara, “Generative adversarial models forpeople attribute recognition in surveillance,” in 2017 14th IEEE internationalconference on advanced video and signal based surveillance (AVSS). IEEE, 2017,pp. 1–6. 33, 53
[133] Z. Chen, A. Li, and Y. Wang, “A temporal attentive approach for videobasedpedestrian attribute recognition,” in Chinese Conference on Pattern Recognitionand Computer Vision (PRCV). Springer, 2019, pp. 209–220. 33, 54
[134] K. He, X. Zhang, S. Ren, and J. Sun, “Deep residual learning for image recognition,”in Proc. CVPR, 2016, pp. 770–778. 33, 35
[135] B.H. M. Hui Han, WenYuan Wang, “Borderlinesmote: a new oversamplingmethod in imbalanced data sets learning,” International Conference on IntelligentComputing, Springer, 2015. 34
[136] E. A. G. Haibo He, “Learning from imbalanced data,” IEEE T. KNOWL. DATA EN.,2009.
[137] H. He, Y. Bai, E. A. Garcia, and S. Li, “Adasyn: Adaptive synthetic samplingapproach for imbalanced learning,” IEEE International Joint Conference onNeural Networks, 2008. 34
[138] Y. Wang, W. Gan, J. Yang, W. Wu, and J. Yan, “Dynamic curriculum learning forimbalanced data classification,” in Proc. ICCV, 2019, pp. 5017–5026. 34, 35
[139] Y. Tang, Y.Q. Zhang, N. V. Chawla, and S. Krasser, “Svms modeling for highlyimbalanced classification,” IEEE Transactions on Systems, Man, and Cybernetics,Part B (Cybernetics), 2008. 34
[140] Z.H. Z. . X.Y. Liu, “Training costsensitive neural networks with methodsaddressing the class imbalance problem,” IEEE T. KNOWL. DATA EN., 2005.
[141] B. Z. . J. L. . N. Abe, “Costsensitive learning by costproportionate exampleweighting,” Third IEEE International Conference on Data Mining, 2003. 34
[142] N. V. Chawla, A. Lazarevic, L. O. Hall, and K. W. Bowyer, “Smoteboost: Improvingprediction of the minority class in boosting,” European Conference on Principlesof Data Mining and Knowledge Discovery(PKDD), 2003. 34, 35
[143] N. V. Chawla, K. W. Bowyer, L. O. Hall, and W. P. Kegelmeyer, “Smote: Syntheticminority oversampling technique,” Journal of artificial intelligence research,,2002. 34, 35
66

Soft Biometrics Analysis in Outdoor Environments
[144] T. Jo and N. Japkowicz., “Class imbalances versus small disjuncts,” ACM SigkddExplorations Newsletter, 2004. 34
[145] G. Haixiang, L. Yijing, J. Shang, G. Mingyun, H. Yuanyue, and G. Bing, “Learningfrom classimbalanced data: Review ofmethods and applications,”Expert Systemswith Applications, vol. 73, pp. 220–239, 2017. 34
[146] e. a. GMiroslav Kubat, Stan Matwin, “Addressing the curse of imbalanced trainingsets: onesided selection,” ICML, 1997. 34
[147] T.Y. Lin, P. Goyal, R. Girshick, K. He, and P. Dollár, “Focal loss for dense objectdetection,” in Proc. ICCV, 2017, pp. 2980–2988. 35
[148] Y. Bengio, J. Louradour, R. Collobert, and J. Weston, “Curriculum learning,” inProceedings of the 26th annual international conference on machine learning,2009, pp. 41–48. 35
[149] N. Sarafianos, X.Xu, and I. A. Kakadiaris, “Deep imbalanced attribute classificationusing visual attention aggregation,” in Proc. ECCV, 2018, pp. 680–697. 35, 53
[150] K. Yamaguchi, T. Okatani, K. Sudo, K.Murasaki, and Y. Taniguchi, “Mix andmatch:Joint model for clothing and attribute recognition.” in BMVC, vol. 1, 2015, p. 4. 36,52
[151] K. Yamaguchi, T. L. Berg, and L. E. Ortiz, “Chic or social: Visual popularity analysisin online fashion networks,” in Proceedings of the 22nd ACM internationalconference on Multimedia, 2014, pp. 773–776. 36
[152] Y. Deng, P. Luo, C. C. Loy, and X. Tang, “Pedestrian attribute recognition atfar distance,” in Proceedings of the 22Nd ACM International Conference onMultimedia, ser. MM ’14. New York, NY, USA: ACM, 2014, pp. 789–792.[Online]. Available: http://doi.acm.org/10.1145/2647868.2654966 36, 41, 45, 47,48, 52, 53, 54, 55
[153] D. Li, Z. Zhang, X. Chen, H. Ling, and K. Huang, “A richly annotated dataset forpedestrian attribute recognition,” arXiv preprint arXiv:1603.07054, 2016. 36, 41,45, 46
[154] E. Ristani, F. Solera, R. Zou, R. Cucchiara, and C. Tomasi, “Performance measuresand a data set for multitarget, multicamera tracking,” in Proc. ECCVW, 2016. 37
[155] L. Zheng, L. Shen, L. Tian, S. Wang, J. Wang, and Q. Tian, “Scalable person reidentification: A benchmark,” in Proc. IEEE ICCV, 2015, pp. 1116–1124. 37
[156] P. Zhu, L. Wen, X. Bian, H. Ling, and Q. Hu, “Vision meets drones: A challenge,”arXiv preprint arXiv:1804.07437, 2018. 38
[157] M. Barekatain, M. Martí, H.F. Shih, S. Murray, K. Nakayama, Y. Matsuo, andH. Prendinger, “Okutamaaction: An aerial view video dataset for concurrenthuman action detection,” in Proc. CVPRW, 2017, pp. 28–35. 38
67

Soft Biometrics Analysis in Outdoor Environments
[158] A. G. Perera, Y. W. Law, and J. Chahl, “Droneaction: An outdoor recorded dronevideo dataset for action recognition,” Drones, vol. 3, no. 4, p. 82, 2019. 38
[159] S. Zhang, Q. Zhang, Y. Yang, X. Wei, P. Wang, B. Jiao, and Y. Zhang, “Personreidentification in aerial imagery,” IEEE Trans. Multimed., p. 1–1, 2020. [Online].Available: http://dx.doi.org/10.1109/TMM.2020.2977528 38
[160] S. Aruna Kumar, E. Yaghoubi, A. Das, B. Harish, and H. Proença, “The pdestre:A fully annotated dataset for pedestrian detection, tracking, reidentification andsearch from aerial devices,” arXiv, pp. arXiv–2004, 2020. 38, 41
[161] P. Sudowe, H. Spitzer, and B. Leibe, “Person attribute recognition with a jointlytrained holistic cnn model,” in Proc. ICCVW, 2015, pp. 87–95. 38, 41, 45
[162] D. Hall and P. Perona, “Finegrained classification of pedestrians in video:Benchmark and state of the art,” in Proc. CVPR, 2015, pp. 5482–5491. 38, 41, 48
[163] L. Bourdev and J. Malik, “Poselets: Body part detectors trained using 3d humanpose annotations,” in Proc. ICCV. IEEE, 2009, pp. 1365–1372. 39, 49
[164] M. Everingham, L. Van Gool, C. K. Williams, J. Winn, and A. Zisserman, “Thepascal visual object classes (voc) challenge,” International journal of computervision, vol. 88, no. 2, pp. 303–338, 2010. 39
[165] Y. Xiong, K. Zhu, D. Lin, and X. Tang, “Recognize complex events from staticimages by fusing deep channels,” in Proc. CVPR, 2015, pp. 1600–1609. 39
[166] J. Zhu, S. Liao, Z. Lei, D. Yi, and S. Li, “Pedestrian attribute classification insurveillance: Database and evaluation,” in Proc. ICCVW, 2013, pp. 331–338. 40,41, 45
[167] A. Geiger, P. Lenz, C. Stiller, and R. Urtasun, “Vision meets robotics: The kittidataset,” International Journal of Robotics Research (IJRR), 2013. 40
[168] S. M. Bileschi and L. Wolf, “Cbcl streetscenes,” Center for Biological andComputational Learning (CBCL) at MIT, Tech. Rep., 2006. [Online]. Available:http://cbcl.mit.edu/softwaredatasets/streetscenes/ 40
[169] X. Chen, A. Pang, Y. Zhu, Y. Li, X. Luo, G. Zhang, P. Wang, Y. Zhang, S. Li,and J. Yu, “Towards 3d human shape recovery under clothing,” CoRR, vol.abs/1904.02601, 2019. [Online]. Available: http://arxiv.org/abs/1904.02601 41,42
[170] H. Bertiche, M. Madadi, and S. Escalera, “Cloth3d: Clothed 3d humans,” arXivpreprint arXiv:1912.02792, 2019. 41, 42
[171] S. Zhu, S. Fidler, R. Urtasun, D. Lin, and C. C. Loy, “Be your own prada: Fashionsynthesis with structural coherence,” in Proc. ICCV, October 2017. 42
68

Soft Biometrics Analysis in Outdoor Environments
[172] P. J. Phillips, F. Jiang, A. Narvekar, J. Ayyad, and A. J. O’Toole, “An otherraceeffect for face recognition algorithms,” ACMTrans. Appl. Percept., vol. 8, no. 2, pp.1–11, 2011. 44
[173] S. Shah, D.Dey, C. Lovett, andA.Kapoor, “Airsim: Highfidelity visual and physicalsimulation for autonomous vehicles,” in Field and service robotics. Springer,2018, pp. 621–635. 46
[174] R. Stewart, M. Andriluka, and A. Y. Ng, “Endtoend people detection in crowdedscenes,” Proc. CVPR, pp. 2325–2333, 2016. 47
[175] Y.Guo, L. Zhang, Y.Hu, X.He, and J.Gao, “Msceleb1m: Adataset andbenchmarkfor largescale face recognition,” in Proc. ECCV. Springer, 2016, pp. 87–102. 47
[176] T. Wang and H. Wang, “Graphboosted attentive network for semantic bodyparsing,” in Proc. ICANN. Springer, 2019, pp. 267–280. 48
[177] S. Li, H. Yu, and R. Hu, “Attributesaided part detection and refinement for personreidentification,” Pattern Recognition, vol. 97, p. 107016, 2020. 48
[178] I. Goodfellow, J. PougetAbadie, M. Mirza, B. Xu, D. WardeFarley, S. Ozair,A. Courville, and Y. Bengio, “Generative adversarial nets,” NIPS, 2014. 49
[179] B. Kim, S. Shin, and H. Jung, “Variational autoencoderbased multiple imagecaptioning using a caption attentionmap,” Applied Sciences, vol. 9, no. 13, p. 2699,2019. 49
[180] W. Xu, S. Keshmiri, and G. Wang, “Adversarially approximated autoencoder forimage generation and manipulation,” IEEE Trans. Multimed., vol. 21, no. 9, pp.2387–2396, 2019. 49
[181] T. Karras, S. Laine, and T. Aila, “A stylebased generator architecture for generativeadversarial networks,” in Proc. CVPR, 2019, pp. 4401–4410. 49
[182] H. Jiang, R. Wang, Y. Li, H. Liu, S. Shan, and X. Chen, “Attribute annotationon largescale image database by active knowledge transfer,” IMAGE VISIONCOMPUT., vol. 78, pp. 1–13, 2018. 49
[183] T. Wang, K.C. Shu, C.H. Chang, and Y.F. Chen, “On the effect of data imbalancefor multilabel pedestrian attribute recognition,” in Proc. TAAI. IEEE, 2018, pp.74–77. 49
[184] K.H. Y. ChiatPin Tay, Sharmili Roy, “Aanet: Attribute attention network forperson reidentifications,” in Proc. CVPR (CVPR), 2019, pp. 7134–7143.
[185] M. Raza, C. Zonghai, S. Rehman, G. Zhenhua, W. Jikai, and B. Peng, “Partwisepedestrian gender recognition via deep convolutional neural networks,” in 2nd IETICBISP. Institution of Engineering and Technology, 2017. [Online]. Available:https://doi.org/10.1049/cp.2017.0102 49
69

Soft Biometrics Analysis in Outdoor Environments
[186] Z. Zhong, L. Zheng, G. Kang, S. Li, and Y. Yang, “Random erasing dataaugmentation,” in Proc AAAI Conf, 2020, pp. 0–0. 49
[187] E. Yaghoubi, D. Borza, P. Alirezazadeh, A. Kumar, and H. Proença, “Person reidentification: Implicitly defining the receptive fields of deep learning classificationframeworks,” arXiv preprint arXiv:2001.11267, 2020. 49
[188] C. Tan, F. Sun, T. Kong, W. Zhang, C. Yang, and C. Liu, “A survey on deep transferlearning,” in Proc. ICANN. Springer, 2018, pp. 270–279. 50
[189] K. Weiss, T. M. Khoshgoftaar, and D. Wang, “A survey of transfer learning,” J. BigData, vol. 3, no. 1, p. 9, 2016.
[190] S. J. Pan andQ. Yang, “A survey on transfer learning,” IEEE T. KNOWL.DATAEN.,vol. 22, no. 10, pp. 1345–1359, 2009. 50
[191] J. Miao, Y. Wu, P. Liu, Y. Ding, and Y. Yang, “Poseguided feature alignment foroccluded person reidentification,” in Proc. ICCV, 2019. 51
[192] C. Corbiere, H. BenYounes, A. Ramé, and C. Ollion, “Leveraging weakly annotateddata for fashion image retrieval and label prediction,” in Proc. ICCVW, 2017, pp.2268–2274. 53
[193] D. Gray, S. Brennan, and H. Tao, “Evaluating appearance models for recognition,reacquisition, and tracking,” in Proc. IEEE international workshop onperformance evaluation for tracking and surveillance (PETS), vol. 3. Citeseer,2007, pp. 1–7. 53
[194] L. Zheng, Z. Bie, Y. Sun, J. Wang, C. Su, S. Wang, and Q. Tian, “Mars: A videobenchmark for largescale person reidentification,” in Proc. ECCV. Springer,2016, pp. 868–884. 54
[195] Z. Ji, Z. Hu, E. He, J. Han, and Y. Pang, “Pedestrian attribute recognition based onmultiple time steps attention,” Pattern Recognit. Lett., 2020. 54
[196] J. Jia, H. Huang, W. Yang, X. Chen, and K. Huang, “Rethinking of pedestrianattribute recognition: Realistic datasets with efficient method,” arXiv preprintarXiv:2005.11909, 2020. 55
[197] X. Bai, Y. Hu, P. Zhou, F. Shang, and S. Shen, “Data augmentation imbalance forimbalanced attribute classification,” arXiv preprint arXiv:2004.13628, 2020. 55
[198] X. Ke, T. Liu, and Z. Li, “Human attribute recognition method based on poseestimation and multiplefeature fusion,” SIGNAL IMAGE VIDEO P., 2020. 55
[199] K. Yamaguchi, M. H. Kiapour, L. E. Ortiz, and T. L. Berg, “Parsing clothing infashion photographs,” in Proc. CVPR. IEEE, 2012, pp. 3570–3577. 55
[200] J. Yang, J. Fan, Y.Wang, Y.Wang,W.Gan, L. Liu, andW.Wu, “Hierarchical featureembedding for attribute recognition,” in Proc. CVPR, 2020, pp. 13 055–13064. 55
70

Soft Biometrics Analysis in Outdoor Environments
Chapter 3
SSSPR: A Short Survey of Surveys in PersonReidentification
Abstract. Person reid addresses the problem of whether “a query image correspondsto an identity in the database” and is believed to play a fundamental role in securityenforcement in the near future, particularly in crowded urban environments. Due tomany possibilities in selecting appropriate model architectures, datasets, and settings,the performance reported by the stateoftheart reid methods oscillates significantlyamong the published surveys. Therefore, it is difficult to understand the mainstreamtrends and emerging research difficulties in person reid. This paper proposes a multidimensional taxonomy to categorize the most relevant researches according to differentperspectives and tries to unify the categorization of reidmethods and fill the gap betweenthe recently published surveys. Furthermore, we discuss the open challenges with a focuson privacy concerns and the issues caused by the exponential increase in the number ofreid publications over the recent years. Finally, we discuss several challenging directionsfor future studies.
3.1 Introduction
Many countries consider video surveillance either as a primary tool to enforce securityand prosecute criminals or simply as a crime deterrent tool. Following an incident, lawenforcement authorities can review the available video footage, and identify a set ofinterest subjects, by matching the captured images/video to the enrolled IDs [1].Given an input query, the person reid systems compare andmatch the input datawith theexisting identities in the database (gallery set), probably captured from nonoverlappingcameras and at different time intervals [2]. The goal is to retrieve an ordered list of theknown identities with the most similarities to the query person. To this end, as outlinedin Fig. 3.1 (a), three modules (detection, tracking, and retrieval) work together, eachone requiring a supervised learning phase on data that represent system settings. In thecomputer vision community, the tasks of person detection and tracking are consideredindependent fields that –at the end– help to obtain the gallery set. Therefore, alignedwiththe previous researches, in this paper we regard the person reid exclusively as a retrievalproblem that includes fourmain tasks: a) data collection; b) annotation; c)model training;and d) inference (see Fig. 3.1 (b)).Fullbody person reidmethods are either based on gait (dynamic) or appearance features.While gait is a unique behavioral biometric trait that is hard to counterfeit, it is highlydependent on the bodyjoints motion and can be affected by the slope of the surfaces,subjects’ shoes and illness [3]. On the other side, appearancebased approaches rely
71

Soft Biometrics Analysis in Outdoor Environments
on visual features such as edges, shape, color, texture, and expressiveness of the data.Therefore, being intrinsically different, the gaitbased and visualbased approaches canbe considered as disjoint tasks, both in terms of the existing databases and identificationtechniques. In this paper, for consistency purposes, we focus exclusively on the visualbased reid approaches and refer the readers interested in gaitbased reid to [4] and [3].
Figure 3.1: An endtoend reid model detects and tracks the individuals in a video, and thenretrieves the query person, while a typical reid model focuses on the retrieval task.
Person reid has attracted considerable interest in the last decade, with more than 53papers published only inConference onComputerVision andPatternRecognition (CVPR)2019 and International Conference on Computer Vision (ICCV) 2019. Over the pastdecade, many review articles have been published to organize the methods available inthe research literature, each one study the problem from different and often contradictoryperspectives. As relevant examples, [5] and [6] discuss the openworld setting versuscloseworld reid and analyze the discrepancies, while [7] and [8] survey themethods fromthe deep learning point of view and emphasis the effectiveness of deep neural networkstructures upon reid models performance. [9] addresses the challenge of heterogeneousreid, in which the query and gallery sets allocate to different domains, and [10] studiesthe importance of efficiency and computational complexity in deep reid architectures.Totally, we identified more than 20 bodybased person reid surveys, 12 were publishedas journal papers, 3 as books, and the remaining are available on ArXiv. From theseresources, 9 papers have been published since 2019. For the complete list of surveys andreading more information about each article, we refer the readers to the Appendix.
3.1.1 Contributions
a) As our first and foremost motivation, we propose a multidimensional taxonomy thatdistinguishes between the person reid models, based on their main approach, type oflearning, identification settings, strategy of learning, data modality, type of queries andcontext (Section 3.2).b) We briefly discuss the privacy and security concerns in surveillance, with a focuson PrivacyEnhancing Technologies (PET)s, to encourage the research community tointroduce privacybydesign and default systems (Section 3.3).c) We identify several emerging deviations caused by an evidently growing number ofpublications over the last few years and discuss the open issues and point out for futuredirections in this topic (Section 3.4).However, the detailed analysis of the existingmethods is out of the scope of our discussion,and this short survey of surveys should be regarded as a complement to the existing
72

Soft Biometrics Analysis in Outdoor Environments
primary surveys.
3.2 Person Reidentification Taxonomy
Figure 3.2: Multidimensional taxonomy (Pointsofview) of the person reidentificationproblem.
Generally, reid models have several independent features that help to categorize themethods from different perspectives, as shown in Fig. 3.2. Here, we not only providea multidimensional taxonomy as an overall insight into the existing research, but weexplore novel ideas from various points of view as well. As an example, the challenges ina deep learning model based on a textquery with openworld setting are totally differentfrom the challenges of amodel designed for a closeworld settingwith anRGBvideoquery.Therefore, in the following subsections, after discussing how dataacquisition and datadomain affect the reid methods, we review the existing strategies for designing a reidmodel, followedby a short description of themost popular approaches for implementationof the strategies. Finally, we briefly explain the categorization in system settings, context,datamodality, and learningtype.
3.2.1 Querytype
Before developing any reid technique, twomain properties of the data should be analyzedwith particular attention:
73

Soft Biometrics Analysis in Outdoor Environments
3.2.1.1 Datadomain
In imagebased datasets, the model is trained on a few samples per individual, whilein videobased benchmarks, for each person, several sequence of images (i.e, videosegments) are available. The existing videobased datasets consist of either RGB orinfrared data [11], and both the query and gallery data are from the same domain(i.e.,infraredinfrared, RGBRGB); whereas the imagebased reid datasets areclassified intoRGBDepth,RGBinfrared,RGBsketch,RGBtext, andRGBRGB.RGBRGB imagebased datasets are classified into shortterm and longterm reid –inwhich identical persons may appear with different clothes. When retrieving a personfrom a gallery, the operator may input a query that comes from different domains, whichresults in large distances between the features extracted from gallery and query data.When dealing with different data modalities, developing methods for learning the gapbetween domains is critical, since typical similarity features (e.g., texture and color) maybe misleading.
3.2.1.2 Datacontent
Data acquisition protocols and conditions (which could be performed either by handhelddevices or stationary cameras) strongly determine the properties of the resulting data andaffect the kind of reid techniques suitable for the problem. For instance, as shown in Fig.3.3, some data variability factors such as pose, motion, and occlusions heavily depend onthe camera view angle and constraint the model’s performance.
Figure 3.3: Examples of how varying capturing angles affect the salient points in the data anddemand specific reid solutions to obtain acceptable performance.
3.2.2 Strategies
Upon our analysis to the problem and to the existing surveys, we suggest that the existingreid strategies can be broadly grouped according to five perspectives: scalability, preprocessing and augmentation, model architecture design, postprocessing strategies, androbustness to noise.
3.2.2.1 Scalability
Speed, accuracy, and onboard processing are critical factors of a realworld person reid system. The process of retrieving from largesize gallery sets is a timedemanding
74

Soft Biometrics Analysis in Outdoor Environments
task, as a solution of which, designing efficient models and using hashing techniqueshave been effective. The unnecessary parts and parameters of the network are removedusing pruning or distillation techniques [12] to increase the efficiency and build lightweighted models. Subsequently, the captured data can be processed onboard instead oftransferring it to the operation center. Hashing [13] is the transformation of the featuresto a compressed form, which not only accelerates the searching process (matching) butoccupies less area for storage as well. To tackle the problem of scalability in trainingphase and learn from huge volume of unlabeled data, a common solution is to applytransfer learning that is sometimes referred to as domain adaptation, in which we usean annotated source domain to learn the discriminative representation of the unlabeledtarget domain.
3.2.2.2 Preprocessing and augmentation
Apart from the basic preprocessing techniques (such as channelwise color alterationor random erasing) that increase the volume of the labeled data, most of the methodsin this category use Generative Adversarial Networks (GANs) to synthesize new data oredit the existing ones. Generate new poses for the existing identities is a techniquethat allows the network to learn a comprehensive presentation of individuals, whilegenerating occluded bodyparts provides the model with new sets of features.Moreover, synthesizing new identities can be seen as a data augmentation techniquethat contributes to the reid models’ performance if the synthetic data follows a similardistribution to the original dataset.The data undergoes substantial changes in colorstyle if we collect them from multiplecameras. However, a crosscamera style transfer can crosstransforms the colorand illumination between cameras, which can strongly improve the model performance.Performing style transfer over multiple datasets (crossdataset style transfer) is alsoused to increase the volume of the training data in the desired domain (e.g., transferringthe style of night images to RGB images).
3.2.2.3 Architecture design
The quality of the extracted features from the query and gallery sets is a factor thatsignificantly determines the system’s performance. Generally, there are two overlappedperspectives to design a novel architecture for extracting discriminative representationfrom the data:1) Design streambased models, which could be investigated from two points ofview: a) in the first perspective, the main objective is to learn suitable metrics learning(using the loss function) to reduce the intraclass variations and increase the interclass variations [14]. Different from typical reid models that use singlestreamarchitectures, some novel models propose to use dualstream architecturesto focus on the inputs’ similarity degree. Moreover, triplet/quadrupletstreamarchitectures use the images of the other identities as negative inputs and the images ofthe target person as positive and anchor inputs [15]. It worth mentioning that usually the
75

Soft Biometrics Analysis in Outdoor Environments
weights and parameters are sheared between streams of the model, leading to a populararchitecture called Siamese networks [16]. b) the second perspective to design streambased models is to extract various features from one identity using multiple streams andfuse them together (e.g., fusing extracted information from motion, semantic attributes,handcrafting techniques, and CNNbased methods).
2) Design customized modules to perform specific processes for extracting robustdiscriminative features from data. When discussing the customizeddesign, there aremany possibilities; therefore, we subcategorize them into three groups: a) Patchwisetechniques. Patchbased analysis helps to extract minutiae information (known asfinegrained features) from the data, which helps to discriminate between interclasssamples that are visually similar to each other. Not only can the patchwise techniquesuse various ways of patching (illustrated in Fig 3.4), but they use different approachesto analyze each patch as well. For example, when using a simple Long ShortTermMemory (LSTM) architecture, the comprehensive feature representation is obtained byprocessing all the patches one after another, while in a multiinput architecture, onecan perform a crossanalysis –e.g., to extract shareable features from headpatches oftwo images. b) Globalbased processing techniques focus on the topology of thecameras and network consistency [13]. Three widelyused datasets (i.e., Market1501,DukeMTMC, and underGround ReIDentification (GRID)) have provided the locations(aerial map), where each camera covers, to allow studying the effects of cameras’ topologyon the model efficiency. As a vivid example, suppose two cameras cover the entranceand exit sides of a narrow street; thus, a person that is firstly captured in frontalviewprobably appears in rearview on the next camera. c)Attentionbased techniques. Bycapturing images from different angles, some parts of the inputdata undergo substantialchanges in appearance, texture, shape, occlusion, and illumination. Fundamentally, thisis amisalignment problem, in which themodel aims to find the target person bymatchingthe corresponding regions of the body (e.g., headwith head) in query and gallery data. Theexisting solutions are typically divided into: i) specialwise attention; and ii) multiframe attention. Generally, specialwise techniques search for salient pixels/regionson the image, which could be accomplished by performing a channelwise operation,learning hardmasks, developing modules for regional selection or by designing multiinput networks. In the multiframe attention architecture, the aim is to provide onefeature representation from a sequence of images.
3.2.2.4 Postprocessing
The output of a reid model is an ordered list of gallery identities, according to thesimilarity between the gallery and query data. This list is called rankinglist, and anyfurther processes for reordering the results are known as reranking. Many intuitivescenarios could help refine this ranking list. For example, in case of being rankedparticularly high for one query, a gallery image should be ranked low for any other queries.Also, if the query person has darkskin, individuals with lightskins should not be rankedhigh. Another frequent postprocessing approach is the rank fusion (fusion of ranking
76

Soft Biometrics Analysis in Outdoor Environments
Figure 3.4: Some of patching strategies used to obtain finegrained local representations of theinput data.
lists) ofmultiple reidmethods, which is particularly suitablewhen accuracy ismuchmoreimportant than speed and computational cost.
3.2.2.5 Robustness to Noise
Whether we use automatic human detection and tracking or perform it manually, errors,misalignment, and inconsistency in boundingbox detection are inevitable. Furthermore,the annotation process is a humanbiased step that is mostly accompanied by somepercentage of errors that may affect the quality of the learning process. There are threegeneral approaches to tackle these challenges [6]. Partial reid techniques constructmodels capable of extracting shareable features from unoccluded body parts, whileoutlaid bounding boxes and inaccurate tracking are studied under the samplenoisereduction. Labelnoise topic addresses the annotation errors by limiting the modelnot to be overfilled on the labels.
3.2.3 Approaches
The discussed strategies (in section 3.2.2) could be taken in to account by threeapproaches: deep learning, handcrafting, and the combination of both (hybrid).In the last decade, reid systems were usually implemented based on knowledgebased feature extractors, which could be classified into four main groups: camerageometry/calibration, color calibration, descriptor learning, and distancemetric learning.As most of the traditional techniques were built upon appearancebased similarities,designing discriminative visual descriptors and learning distance metrics upon personclothes were more popular than other methods [17].Many studies focused on deep structures or a combination of deep neural networks andtraditional methods after the advent of deep learning approaches. In the context ofdeep learning, Convolutional Neural Networks (CNNs) analyze the input data ata single instance, while inRecurrent Neural Networks (RNNs) the data is treated asa sequence of inputs; then, taking advantage of an internal state (memory), the criticalinformation of each sequence is accumulated to construct the final feature representativeof the input. Finally,generativenetworks are classified intoVariational AutoEncoder(VAE) and GAN, each aiming to find the distribution of the original dataset to generate
77

Soft Biometrics Analysis in Outdoor Environments
new data. In reid, GANbased approaches have shown promising results with bothaugmenting the dataset, and editing the samples (e.g., style transferring, completing theoccluded bodyparts, etc.)
3.2.4 Identification Settings
Reid model are either classified into the openworld or closedworld settings. Theclosedworld assumption deals with matching onetomany samples, so that the queryimage is surely corresponding to one of the gallery individuals. On the other hand, thereare different interpretations for the openworld setting: 1) it might regard amulticameraproblem in which the gallery evolves over time, and the everchanging query may not bepresented in the gallery. Moreover, the system could reidentify multisubjects at once[18]; 2) it might regard a groupbased verification task aiming to determine whether thequery appears in the gallery or not, without the necessity of retrieving matched person(s)[19]; and 3) any realworld application that excludes the closeworld setting could beconsidered as an openworld problem. For example, in [6], researches that deal withheterogeneous data, raw images/videos, limited labels, and noisy annotations have beenconsidered as openworld studies [20].
3.2.5 Context
Context is another point of view towards reid problems so that if the system relies on theexternal contextual information (e.g., camera/geometric information) rather than usingthe data itself, it is considered as a contextual system [2]. However, after the adventof deep learning technologies, only a small proportion of works consider person reidfrom the contextual perspective [13]. Meanwhile, contextual based reid datasets shouldprovide extra information such as fullframedata, cameras’ locations and capturing anglese.g., using an aerial map.
3.2.6 Datamodality
Given the various data modalities for the query and gallery sets, the reid task can beregarded either as a Heterogeneous reid (HeReid) or Homogeneous reid (HoReid)problem. In a HoReid perspective, the query and gallery data have similar modalities,while in the HeReid the query is from another domain (for example, if the galleryconsists of RGBimages, the query could be a verbal description of the target person).Therefore, in HeReid, discrepancies between the querydomain and the gallerydomainare huge so that the methods developed for HoReid cannot be directly applied to theseproblems. Dealing with two different data modalities, HeReid techniques aim to bridgethe gap between domains and decrease the intermodality discrepancy, for which thereare several methods [9]: 1) learning a metric to decrease the gap between features of eachdomain; 2) learning shared features; and 3) unifying modalities before feature extractionby transferring both domains to a latent domain. So far, owing to Generative Adversarial
78

Soft Biometrics Analysis in Outdoor Environments
Networks (GAN), unifying the modalities has shown better results that are discussed atthe end of this section.
3.2.7 Learningtype
Supervised, semi supervised, weakly supervised, and unsupervised learning [21] arethe annotationbased learning types. Due to leveraging the manually annotated data,supervised methods achieve superior accuracy than other methods. However, someworks develop weaklysupervised or unsupervised methods to not only ease theprocess of data annotation but also train the model on an excessive amount of unlabeleddata. The main categories in unsupervised learning are domain adaption, dictionarylearning, feature representation extraction, distance measurement, and clustering [13],from which Unsupervised Domain Adaptation (UDA) has attracted the most attention.In UDA, taking advantage of a labeled dataset (source domain), the model learns thediscriminative representation of the unlabeled data (target domain). Therefore, thedistance between the data distribution of domains is minimized, so that targetdomaindata can be treated as the sourcedomain data for training purposes. Different from thetimeconsuming annotation process for supervised methods (all people in the video areannotated onebyone), weaklysupervised annotation is a videolevel process, in whicheach video needs one label, indicating the IDs appeared in that video.
3.2.8 StateoftheArt Performance Comparison
Table 3.1 shows the performance (rank1 andmean Average Precision (mAP)) of the stateoftheart techniques, most published in 2019 and 2020. In these works, the gallery set isalways composed of RGB images/videos, except in [11] (with 14.3 % accuracy for rank1retrieval), where both the gallery and query sets contain infrared images captured at night.
[9] reported that the performance of all the HeReid works is lower than 40%, whereasthe latest papers have claimed 56.7%, 49.0%, 49.%9, and 70.0% rank1 accuracy forRGBtext, RGBsketch, RGBinfrared, and RGBthermal, respectively, pointing for a fastimprovement in performance in this field.
Table 3.1 enables to conclude that HeReid and longterm reid are the least maturedfields of study, respectively with 70% [6] and 65.7% [22] rank1 accuracy, while [23] isan unsupervised person reid work that is close to the hopeful boundary, with 86.2 % and76% rank1 accuracy on the Market1501 and DukeMTMC datasets, respectively.
On the other hand, even though studies based on RGB images and RGB videos haveachieved higher results, their performance is highly dependent on the dataset, such thatrank1 accuracy in RGB videobased studies is in a rage from 63.1 % [24] to 96.2% [25] forthe LSVID and DukeMTMCVideoReID datasets, respectively; similarly, in RGB imagebased researches, [26] has achieved 95.7% rank1 accuracy on the Market1501 dataset,while [6] reports this number around 63.6% for their experiments on the CUHK03dataset.
79

Soft Biometrics Analysis in Outdoor Environments
Field of study Dataset Method R 1 mAP
RGBThermal RegDB [6] 70.0 66.4RGBinfrared SYSUMM01 [27] 49.9 50.7RGBSketch Sketch ReID [28] 49.0 RGBText CUHKPEDES [29] 56.7
Infraredinfrared KnightReid [11] 14.3 10.2
RGBDKinectReID [30] 99.4 RGBDID [30] 76.7
UnsupervisedMarket1501 [23] 86.2 68.7DukeMTMC∗ [23] 76.0 60.3
RGB imagebased
Market1501 [26] 95.7 89.0CUHK03 [6] 63.6 62.0MSMT17 [6] 68.3 49.3DukeMTMC∗ [26] 91.1 81.4
RGB videobased
3DPeS [31] 78.9 PRID2011 [24] 95.5 iLDSVID [25] 88.9 93.0MARS [32] 90.0 82.8DukeMTMCVideoReID∗ [25] 96.2 95.4LSVID [24] 63.1 44.3PRW [33] 73.6 33.4
LongtermMotionReID∗ [22] 65.7 CelebreID [34] 51.2 9.8
∗Not publicly available.
Table 3.1: Performance of the stateoftheart reid methods.
3.3 Privacy Concerns
IAPP, the International Association of Privacy Professionals, defines that privacy is theright to be free from interference or intrusion and to remain anonymous, and informationprivacy regards the control over our own personal information. Among the possible waysof privacy violation [35] (i.e., watching, listening, locating/tracking, detecting/sensing,personal data monitoring, and data analytics), we pay attention to the visual monitoringthat has recently engaged the research community, due to the sensitiveness of monitoringpeople or collecting their personal visual data (from the Internet)without their consent. Inthis scope, several wellknownbenchmarks (e.g.,Brainwash,DukeMTMC, andMSCeleb1M) were permanently suspended by their authors[36], in most cases due to the absenceof explicit authorization from the subjects in the dataset to have their data collected anddisseminated for research purposes.
Overall, there are two solutions to reduce the privacy concern in person reid models:privacybydesign principles and PrivacyEnhancing Technologies (PET).
Privacybydesign principles are some standards to protect data through technologydesign, published by the law enforcement agencies1,2 and enforce companies to respectthe privacy of their customers. In these standards, information tracking is defined as aprinciple that allows people to manage and track whom they have access to their private
1https://gdprinfo.eu/2https://www.priv.gc.ca/en/reportaconcern/
80

Soft Biometrics Analysis in Outdoor Environments
information (and to what extend). In contrast, the data minimization principle statesthat enterprises should only process the minimum necessary data. For example, a visualsurveillance panel that processes the crowd for displaying related advertisements mayneed to recognize the human semantic attributes (e.g., gender, clothing styles, etc.), butshould avoid designing a system that detects faces, analyzes the skin color, and people’srace.PET are methods of protecting data, including anonymization, perturbation, andencryption [37]. In anonymization, the sensitive information is removed to perform acomplete deidentification, generally accomplished by masking, while in perturbation,the sensitive attributes of the data are replaced with noisy or otherwise altered data.On the other hand, security techniques reversibly disguise the identifying information.Examples of PET in person reid could be disguising pedestrian’s faces in the gallery setusing generative networks to reduces the risk of privacy intrusion; however, it indicatesthe need for methods that are able to perform the reid task on anonymized data andpossibly reconstruct the true faces if asked by the authorities [38]. As a method fordeveloping fast reid, hashing could be used to design a reid model that works withencrypted data and reduces the risk of hacking.
3.4 Discussion and Future Directions
3.4.1 Biases and Problems
The number ofmethods in person reid has considerably increased in recent years, leadingto some biases and problems such as unfair comparisons, low originality in techniques,and insufficient attention to some of the important perspectives in the problem.
3.4.1.1 Unfair comparisons
Based on the reimplementation of several stateoftheart reid methods, a recentbaseline [39] explicitly concluded that the improvements reported in some works weremainly due to training tricks rather than to any conceptual advancement of the methoditself, which has led to an exaggeration of the success of such techniques. Therefore,to show the effectiveness of the model, we suggest to perform an ablation study onthe proposed method, such that the basic model is first evaluated, and each proposedcomponent is added one by one over the baseline to show the effectiveness of the idea.Further, to show the superiority of the method over the existing state of the arts, authorsshould remain the architecture and parameters constant as much as possible, so that weare certain that the improvement is caused by the idea [40].
3.4.1.2 Low originality
Although using the power of other fields in person reid is valuable and improves theperformance of state of the art, in recent years, excessive attention to these kinds ofcontributions has decreased the number of original works with significant contributions.
81

Soft Biometrics Analysis in Outdoor Environments
In the literature, we repeatedly face with reimplementation of other fields’ ideas asoriginal reid methods, creating competition for a mere copy of outside ideas into reidproblems. For example, as confirmed by [40], after the success of LSTM, GAN, Siamesenetwork, backbone networks (ResNet, Inception, GoogleNet), various loss functions, etc.,many authors repeated the same ideas on the reid datasets.
3.4.1.3 Insufficient attention to some perspectives
A longterm reid model capable of retrieving multimodality queries is much morerealistic and useful than a closeworld, singlemodality retrieval system. Nevertheless,why does exist more researches in the second scenario?. Understanding the nature ofthe deep neural network is the answer to this question. It is known that deep neuralnetworks are efficient in feature extraction, and they have shown promising resultsspecifically in problems dealing with appearancebased features. Thereby, reid scenariosunder closeworld setting and homogeneousRGBdatamodality have shown considerableperformance improvement. On the other hand, there is little attention to some challengessuch as openworld setting, longtime reid, heterogeneous modality, and noncontextualtasks.
3.4.2 Open Issues
In this section, we discuss the major open issues in the reid problem and point out forsome possible further directions.
Person reid performance has several important covariates, such as variations inbackground, illumination, occlusion, bodypose, and other viewdependent variables [5],[41]. In particular, we emphasize the role of data annotation: when training deep neuralnetworks, the more the annotated data are available, the better the performance wouldbe. However, data preparation for reid is an expensive, tedious, and timeconsumingprocess, opening the space for developing novel semisupervised, weakly supervised oreven unsupervised solutions for training the models [6].
Affected by similar covariates, other pattern recognition tasks (e.g., iris recognition, crossdomain clothing analysis, multiobject tracking) have significantly helped the person reidin several directions such as unsupervised learning, extraction of discriminative featuresets, and application of robust metric learning techniques. Nevertheless, some challengesare related explicitly to the reid task: for example, by increasing the volume of the reiddatasets, the matching process (for retrieving the query person from a largescale galleryset) takes substantially more time, indicating the need for fast reid methods [6].
Furthermore, for a realworld reid system, it is necessary to search the query personindependent of its datatype. However, due to the lack of large datasets consisted ofmultimodal data, current heterogeneous works are limited to single crossmodality searches,and the gallery set often consists of RGB images. Unifying modalities of the query set andgallery set is another open issue in heterogeneous reid that could be fulfilled by mappingthe modality of both sets either to each other interchangeably or to a latent space [9].
82

Soft Biometrics Analysis in Outdoor Environments
Apart from most of researches in the literature that are based on appearance, longterm reid solves the issue of retrieving the same person with different appearance andclothing style [7]. Therefore, studies in this area should consider challenges such as: 1)going beyond appearancebased features and extract discriminative features from hardbiometrics (face and gait) and more robust softbiometrics (height, body volume, bodycontours). Meanwhile, recent facial recognition techniques that typically are trainedon highresolution data (with controlled posevariation) may not increase the overallperformance when dealing with lowquality faces in the wild; 2) longterm reid in realapplications is often tied to openworld setting challenges such as scalability (how to dealwith large databases) and generalization (adding new cameras to the existing system) [5].It worth mentioning that person search is a slightly different research area that aims tolocate the prob person within a whole frame containing one/several persons [42].
Currently, a plethora of human detection and tracking techniques are available fordifferent platforms. By generalizing them for the handheld devices –thanks to highspeedinternet connections–, mobile person reid can quickly become a trivial task, which raisesmany privacy and security concerns. Thus, both secure storage of the gallery set andproposing reid methods that conform privacy concerns by design and default are of theutmost challenges.
3.5 Conclusion
Person reid aims to retrieve an ordered list of the identities from a database, withrespect to query images taken from one or multiple nonoverlapping cameras. Inresult of the extensive research carried out over the last years for solving the primarypattern recognition challenges (e.g., pose variations, partial occlusions and dynamic dataacquisition conditions), reid systems have successfully passed the human accuracylevelin easy scenarios (i.e., when the model is trained based on supervised learning and closeworld setting in RGB heterogeneous modality). In this paper, we proposed a multiviewtaxonomy that considers the different categorizations available in the reid literature toease the discovery of realistic and feasible scenarios for future directions. Furthermore,we discussed the importance of the concept of privacy in this field and briefly reviewedseveral strategies to improve systems’ security and privacy by default. Finally, afterdiscussing some of the issues caused by an evidently growing number of publications inrecent years, we pointed out for some of the open issues in this extremely challengingproblem.
Bibliography
[1] M. Gou, Z. Wu, A. RatesBorras, O. Camps, R. J. Radke et al., “A systematicevaluation and benchmark for person reidentification: Features, metrics, anddatasets,” IEEE TPAMI, vol. 41, no. 3, pp. 523–536, 2018. 71
83

Soft Biometrics Analysis in Outdoor Environments
[2] A. BedagkarGala and S. K. Shah, “A survey of approaches and trends in person reidentification,” IMAGE VISION COMPUT, vol. 32, no. 4, pp. 270–286, 2014. 71,78
[3] A. Nambiar, A. Bernardino, and J. C. Nascimento, “Gaitbased person reidentification: A survey,” ACM Comput. Surv., vol. 52, no. 2, Apr. 2019. [Online].Available: https://doi.org/10.1145/3243043 71, 72
[4] P. Connor and A. Ross, “Biometric recognition by gait: A survey of modalities andfeatures,” Computer Vision and Image Understanding, vol. 167, pp. 1–27, 2018. 72
[5] Q. Leng, M. Ye, and Q. Tian, “A survey of openworld person reidentification,”IEEE Transactions on Circuits and Systems for Video Technology, vol. 30, no. 4,pp. 1092–1108, 2020. 72, 82, 83
[6] M. Ye, J. Shen, G. Lin, T. Xiang, L. Shao, and S. C. Hoi, “Deep learning for personreidentification: A survey and outlook,” arXiv preprint arXiv:2001.04193, 2020.72, 77, 78, 79, 80, 82
[7] M. O. Almasawa, L. A. Elrefaei, and K. Moria, “A survey on deep learningbasedperson reidentification systems,” IEEE Access, vol. 7, pp. 175 228–175 247, 2019.72, 83
[8] D. Wu, S.J. Zheng, X.P. Zhang, C.A. Yuan, F. Cheng, Y. Zhao, Y.J. Lin, Z.Q.Zhao, Y.L. Jiang, and D.S. Huang, “Deep learningbased methods for personreidentification: A comprehensive review,”Neurocomputing, vol. 337, pp. 354–371,Apr. 2019. [Online]. Available: https://doi.org/10.1016/j.neucom.2019.01.079 72
[9] Z. Wang, Z. Wang, Y. Wu, J. Wang, and S. Satoh, “Beyond intramodalitydiscrepancy: A comprehensive survey of heterogeneous person reidentification,”arXiv preprint arXiv:1905.10048, 2019. 72, 78, 79, 82
[10] H. Masson, A. Bhuiyan, L. T. NguyenMeidine, M. Javan, P. Siva, I. B. Ayed, andE.Granger, “A survey of pruningmethods for efficient person reidentification acrossdomains,” arXiv preprint arXiv:1907.02547, 2019. 72
[11] J. Zhang, Y. Yuan, and Q. Wang, “Night person reidentification and a benchmark,”IEEE Access, vol. 7, pp. 95 496–95 504, 2019. 74, 79, 80
[12] I. Ruiz, B. Raducanu, R. Mehta, and J. Amores, “Optimizing speed/accuracytradeoff for person reidentification via knowledge distillation,” EngineeringApplications of Artificial Intelligence, vol. 87, p. 103309, Jan. 2020. [Online].Available: https://doi.org/10.1016/j.engappai.2019.103309 75
[13] H. Wang, H. Du, Y. Zhao, and J. Yan, “A comprehensive overview of person reidentification approaches,” IEEE Access, vol. 8, pp. 45 556–45 583, 2020. 75, 76,78, 79
84

Soft Biometrics Analysis in Outdoor Environments
[14] B. Lavi, I. Ullah, M. Fatan, and A. Rocha, “Survey on reliable deep learningbased person reidentification models: Are we there yet?” arXiv preprintarXiv:2005.00355, 2020. 75
[15] A. Khatun, S. Denman, S. Sridharan, and C. Fookes, “A deep fourstream siameseconvolutional neural network with joint verification and identification loss forperson redetection,” in 2018 IEEEWinter Conference on Applications of ComputerVision (WACV). IEEE, 2018, pp. 1292–1301. 75
[16] S. K. Roy, M. Harandi, R. Nock, and R. Hartley, “Siamese networks: The tale of twomanifolds,” in Proc. ICCV, 2019, pp. 3046–3055. 76
[17] R. Satta, “Appearance descriptors for person reidentification: a comprehensivereview,” arXiv preprint arXiv:1307.5748, 2013. 77
[18] M. A. Saghafi, A. Hussain, H. B. Zaman, and M. H. M. Saad, “Review of person reidentification techniques,” IET Computer Vision, vol. 8, no. 6, pp. 455–474, 2014.78
[19] S. ChanLang, “Closed and open world multishot person reidentification,” Ph.D.dissertation, Paris 6, 2017. 78
[20] H.Wang, X. Zhu, T. Xiang, and S. Gong, “Towards unsupervised openset person reidentification,” in 2016 IEEE International Conference on Image Processing (ICIP).IEEE, 2016, pp. 769–773. 78
[21] Y. Lin, “Deep learning approaches to person reidentification,” Ph.D. dissertation,University of Technology Sydney, 2019. 79
[22] P. Zhang, Q.Wu, J. Xu, and J. Zhang, “Longtermperson reidentification using truemotion from videos,” in Proc. WACV. IEEE, 2018, pp. 494–502. 79, 80
[23] Y. Fu, Y. Wei, G. Wang, Y. Zhou, H. Shi, and T. S. Huang, “Selfsimilaritygrouping: A simple unsupervised cross domain adaptation approach for person reidentification,” in Proc. ICCV, October 2019, pp. 6112–6121. 79, 80
[24] J. Li, J.Wang, Q. Tian,W.Gao, andS. Zhang, “Globallocal temporal representationsfor video person reidentification,” in Proc. ICCV, October 2019, pp. 3958–3967. 79,80
[25] M. Li, H. Xu, J. Wang, W. Li, and Y. Sun, “Temporal aggregation with cliplevelattention for videobased person reidentification,” in The IEEEWinter Conferenceon Applications of Computer Vision, March 2020, pp. 3376–3384. 79, 80
[26] H. Chen, B. Lagadec, and F. Bremond, “Learning discriminative and generalizablerepresentations by spatialchannel partition for person reidentification,” in 2020IEEE Winter Conference on Applications of Computer Vision (WACV), 2020, pp.2472–2481. 79, 80
85

Soft Biometrics Analysis in Outdoor Environments
[27] D. Li, X. Wei, X. Hong, and Y. Gong, “Infraredvisible crossmodal person reidentification with an xmodality,” in Proc. AAAI Conf. Artif. Intell., 2020, pp. 4610–4617. 80
[28] S. Gui, Y. Zhu, X. Qin, and X. Ling, “Learning multilevel domain invariant featuresfor sketch reidentification,” Neurocomputing, vol. 403, pp. 294–303, Aug. 2020.[Online]. Available: https://doi.org/10.1016/j.neucom.2020.04.060 80
[29] S. Aggarwal, V. B. RADHAKRISHNAN, and A. Chakraborty, “Textbased personsearch via attributeaided matching,” in The IEEE Winter Conference onApplications of Computer Vision, March 2020, pp. 2617–2625. 80
[30] L. Ren, J. Lu, J. Feng, and J. Zhou, “Uniform and variational deep learning forrgbd object recognition and person reidentification,” IEEE Transactions on ImageProcessing, vol. 28, no. 10, pp. 4970–4983, 2019. 80
[31] S. Zhou, J. Wang, D.Meng, Y. Liang, Y. Gong, and N. Zheng, “Discriminative featurelearning with foreground attention for person reidentification,” IEEE Transactionson Image Processing, vol. 28, no. 9, pp. 4671–4684, 2019. 80
[32] C.T. Liu, C.W. Wu, Y.C. F. Wang, and S.Y. Chien, “Spatially and temporallyefficient nonlocal attention network for videobased person reidentification,”arXiv preprint arXiv:1908.01683, 2019. 80
[33] Y. Yan, Q. Zhang, B. Ni, W. Zhang, M. Xu, and X. Yang, “Learning context graph forperson search,” in Proc. CVPR, June 2019, pp. 2158–2167. 80
[34] Y. Huang, J. Xu, Q. Wu, Y. Zhong, P. Zhang, and Z. Zhang, “Beyond scalar neuron:Adopting vectorneuron capsules for longterm person reidentification,” IEEE TCIRC SYST VID, vol. 30, no. 10, pp. 3459–3471, 2020. 80
[35] C. D. Raab, “Privacy, security, surveillance and regulation,” 2017.[Online]. Available: http://www.inf.ed.ac.uk/teaching/courses/pi/2017_2018/slides/RaabProfIssuesInformaticsCourse2017FINALppt.pdf 80
[36] J. Harvey, Adam. LaPlace. (2019) Megapixels.cc: Origins, ethics, and privacyimplications of publicly available face recognition image datasets. [Online].Available: https://megapixels.cc/ 80
[37] J. Curzon, A. Almehmadi, and K. ElKhatib, “A survey of privacy enhancingtechnologies for smart cities,” Pervasive and Mobile Computing, vol. 55, pp. 76–95,Apr. 2019. [Online]. Available: https://doi.org/10.1016/j.pmcj.2019.03.001 81
[38] H. Proença, “The uunet: Reversible face deidentification for visual surveillancevideo footage,” arXiv preprint arXiv:2007.04316, 2020. 81
[39] H. Luo,W. Jiang, Y.Gu, F. Liu, X. Liao, S. Lai, and J.Gu, “A strongbaseline andbatchnormalization neck for deep person reidentification,” IEEE Trans Multimedia,vol. 22, no. 10, pp. 2597–2609, 2020. 81
86

Soft Biometrics Analysis in Outdoor Environments
[40] K. Musgrave, S. Belongie, and S.N. Lim, “A metric learning reality check,” arXivpreprint arXiv:2003.08505, 2020. 81, 82
[41] H. Shi, Y. Yang, X. Zhu, S. Liao, Z. Lei, W. Zheng, and S. Z. Li, “Embedding deepmetric for person reidentification: A study against large variations,” in ComputerVision – ECCV 2016, B. Leibe, J. Matas, N. Sebe, and M. Welling, Eds. Cham:Springer International Publishing, 2016, pp. 732–748. 82
[42] K. Islam, “Person search: New paradigm of person reidentification: A survey andoutlook of recent works,” IMAGE VISION COMPUT, vol. 101, p. 103970, Sep. 2020.[Online]. Available: https://doi.org/10.1016/j.imavis.2020.103970 83
87

Soft Biometrics Analysis in Outdoor Environments
88

Soft Biometrics Analysis in Outdoor Environments
Chapter 4
RegionBased CNNs for Pedestrian GenderRecognition in Visual SurveillanceEnvironments
Abstract. Inferring soft biometric labels in totally uncontrolled outdoor environments,such as surveillance scenarios, remains a challenge due to the low resolution of dataand its covariates that might seriously compromise performance (e.g., occlusions andsubjects pose). In this kind of data, even stateoftheart deeplearning frameworks (suchas ResNet) working in a holistic way, attain relatively poor performance, which was themain motivation for the work described in this paper. In particular, having noticed themain effect of the subjects’ “pose” factor, in this paper we describe a method that uses thebody keypoints to estimate the subjects pose and define a set of regions of interest (e.g.,head, torso, and legs). This information is used to learn appropriate classificationmodels,specialized in different poses/body parts, which contributes to solid improvements inperformance. This conclusion is supported by the experiments we conducted in multiplerealworld outdoor scenarios, using the data acquired from advertising panels placed incrowded urban environments.
4.1 Introduction
Being often the first mentioned attribute to describe a person, gender estimation is usefulin many areas of computer vision, such as surveillance, forensic affairs, marketing, andhumanrobot interaction. In the first decade of this century, datasets were small andmostapproaches were based on handcrafted features such as Histogram of Oriented Gradients(HOG). However, after the advent of deep learning frameworks, scholars focused oncollecting extensive labeled data and developing deeper networks.In the literature, gender estimation from facial images has received more attention thanwholebody. However, in this paper, we use fullbody images since in Pedestrian AttributeRecognition (PAR) scenarios not only the quality of facial regions decreases, but also thebody features are more robust to far distances.[1] proposes a finetuned CNN model to predict the gender from the “front”, “back” and“both” views. They employ a parsingmechanism via the Decompositional Neural Network(DNN) to remove the background. The foreground is then parsed in the upper and lowerbodies so that the two CNNs are finetuned. As a conclusion, feeding upperbody imagesto the network slightly improves the results. However, they have gray scaled and forcedsquared the images which cause the loss of colorbased features and data deformation.In [2], authors apply HOG alongside a CNN and concatenate the extracted features thatare used as the input of a Softmax classifier. Although the expressiveness of the data is
89

Soft Biometrics Analysis in Outdoor Environments
Figure 4.1: Overview of the proposed algorithm called Pedestrian Gender Recognition Network(PGRN). Taking advantage of the human detector, skeleton detector, and human tracker, weextract the bounding boxes alongside 16 body keypoints for each person. Afterward, the trainingset is split into three subsets corresponding to the desired poses (i.e. frontal, rear, and lateral).The RoIs are then extracted and fed to a PoseSensitive Network (PSN) which is constructed fromthree specialized ResNet50 networks. The weights of a pretrained network (i.e. BaseNet) areshared with each of these PSNs to reduce the time of training. Finally, the most confident scorefrom the RoIs is considered as the final score for recognition.
protected in this method, feature redundancy in the last layer can lead to a biased modelthat degrade the performance in realworld applications. [3] presents another work thatadopts an extra thermal camera for data acquisition. Using CNNmethods, they extract thefeatures from visible images and thermal maps and fuse them in score level by exploitingSupport VectorMachine (SVM) learner. As they apply thermal images for recognition, thealgorithm can fail in crowded places with occlusion, which is a real and critical scenario.In addition to the mentioned weaknesses, the datasets in previous works are mainlycollected from one location which can cause some easiness such as: monotonousillumination, stable camera settings, controlled occlusion, similar background, andcontrolled distance acquisition. While in this paper, we collect a dataset from outdoorand indoor advertisement panels in more than 100 cities of Portugal and Brazil1.Further, we propose a Pedestrian Gender Recognition Network (PGRN) which providesseveral decisions based on the subject pose and some Regions of Interest (RoI) so thatthe decision with maximum certainty is reported as the final recognition (Fig. 4.1). Theperformed experiments on three datasets show the superiority of the proposed algorithmin comparison with the stateoftheart methods, as detailed in section 3.
4.2 Pedestrian Gender Recognition Network (PGRN)
Regarding the impact of pose variation on the biometric system performance, we developour proposed algorithm on a human body keypoint detection and tracker platform. Ingeneral, the suggested PGRN is divided into the following steps: training the baselinenetwork calledBaseNet, key point detection and tracking, pose extraction, RoI extraction,finetuning PSN, and score fusion.
1https://tomiworld.com/locations/
90

Soft Biometrics Analysis in Outdoor Environments
4.2.1 BaseNet
Although the pretrained CNNs on the ImageNet dataset have shown promising results onvarious recognition tasks, it is interesting to note that training from scratch or updatingtheweights of all layers necessarily leads to better results upon the availability of sufficientdata. As we have collected a large proprietary dataset (i.e. Biometria e Deteção deIncidentes (BIODI)), the weights of the network trained on the ImageNet dataset areconsidered as the initial weights for ourmodel. Afterward, the whole layers of the networkare trained on raw images of the BIODI. This network is named as BaseNet that later willbe used for transferring the knowledge to the PSNs.
4.2.2 Body KeyPoint Detection and Tracking
BIODI is composed of 216 video clips of wild visual surveillance environments taken fromdifferent countries. We started by analyzing each video using a stateoftheart approachcalled Alphapose [4] that is an accurate realtime and multiperson skeleton detectorbased on an object detection method named FasterRCNN [5]. This object detectorprovides the Bounding Boxes (BBs) of multiple humans in each frame. Then, the humanBBs are fed to the Spatial Transformer Network (STN) [6], which yields high qualitydominant human proposals. In other words, the out put of the STN are some transformedhuman proposals, therefore, after estimating the skeleton of each person using the SinglePerson Pose Estimator (SPPE) [7], each set of the body keypoints needs to be mapped tothe original image coordinate using a detransformer network.So far, the detection of BBs and skeleton of each person in each frame is done. To performthe tracking, the straight forward approach is to connect the current skeletons to theclosest skeletons in the next frame. However, this method produces errors when thereare several poses close to each other. Therefore, we apply Poseflow [8] that works basedon a small interframe skeleton distance (dc) and a large intraframe skeleton distance(df ) of the form Eq. 4.1. Finally, we storage all the BBs and body keypoints related to eachhuman subject to the disk for the next step.
dc(S(1), S(2)) =
N∑n=1
fn2
fn1
,
df (S1, S2| σ1, σ2, λ =1
Ksim(S1, S2|σ1)+
λ
Hsim(S1, S2|σ2),
s.t. Ksim(S1, S2|σ1) =
N∑
n=1
tanhcn1σ1
. tanhcn2σ1
; if Sn2 in B(Sn
1 )
0 ; Otherwise ,
s.t. Hsim(S1, S2|σ2) =N∑
n=1
e− (Sn
1 −Sn2 )
σ2 ,
(4.1)
where S1 and S2 are two skeletons related to two different individuals in a frame inB(Sn1 )
and B(Sn2 ) bounding boxes, respectively. f
n1 and fn
2 are extracted features of these boxes
91

Soft Biometrics Analysis in Outdoor Environments
and n ∈ 1, ..., N in which N represents the number of body keypoints, and σ1, σ2, andλ can be determined in a datadriven manner.
4.2.3 Pose Inference
For a biometric system specialized in specific human bodypose, various body gesturesprovide different features, therefore, unseen poses in the test set highly impact itsperformance. On the other hand, posespecialized networks are not able to learn theimportant features if we split the train set to many subsets of different poses. Regardingthis matter and number of images of our dataset, we considered only the three mostcommon poses of pedestrians, including ”frontal”, ”rear”, and ”lateral” views.As the BBs are extracted using an object detector, the aspect ratio (width/height) of eachBB is 1.75. We visualized quite a few numbers of body keypoints (see Fig. 4.2(a)) on theresized images (175×100) and discovered that individuals with shoulderwidth lower thannine pixels (out of 100 pixels) in the invariantscale RoIs can be a nominate for lateral viewimages. It worthmentioning that, we considered the other body keypoints to perform thisexperiment, however, the best results are obtained using the shoulderwidth points. Ifpi = (xi, yi) represents the coordinates of body points, the desired poses are:
Pose ≡
Frontal view; if xv − xz < −9
Rear view; if xv − xz > 9
Lateral view; if |xv − xz| =< 9 pixels,
(4.2)
where (xv, yv) and (xz, yz) respectively are 13th and 14th bodypoint coordinates illustratedin Fig. 4.2(a).
4.2.4 RoI: Segmentation and Cropping Strategies
By joining the exterior body points pwe obtain a polygon, we find it useful to create amaskby applying ConvexHull on this set. ForN points p1, ..., pN , the ConvexHull is the set ofall convex combinations of its points such that in a convex combination each point has apositive weight wi. These weights are used to compute a weighted average of the points.For each choice of weights, the obtained convex combination is a point in the ConvexHull.Therefore, choosing weights in all possible ways, we can form a black polygonshape asFig. 4.2(b). In a single equation, the ConvexHull is the set:
CH(N) =
N∑i=1
wipi : wi ≥ 0 for all i, and
N∑i=1
wi = 1
. (4.3)
Figure 4.2 illustrates this process for a sample image. To avoid information lost whenperforming the ConvexHull algorithm, we consider two extra points (xl, yl) and (xr, yr)
near the ears. Therefore, yl = yr = yn+yh2 and xl = xn − yl , xr = xn − yr, where (xn, yn)
and (xh, yh) are 9th and 10th bodypoint coordinates illustrated in Fig. 4.2 (a), respectively.
92

Soft Biometrics Analysis in Outdoor Environments
Figure 4.2: Foreground segmentation process. After determining the exterior border using theConvexHull, a mask is created and the foreground is cropped. (a) Body keypoints (b) Red pointsare considered as a reference for adding two green points near the head so that the polygoncropcontains the head and hair (c) Samples of segmented images which will have a black backgroundin training phase.
The polygonmask is then produced by painting inside of the obtained ConvexHull withblack, and this mask is employed to segment the raw images.Considering that the facial region carries information about most human traits, includinggender, we used different sets of body points such as the elbow, chestbone, head, neck,and shoulders to crop the head. Under visual inspection, the best results are obtainedusing the head, chestbone, and shoulders’ points that have been shifted out ten pixels.
4.2.5 PSN and Score Fusion
The PSN is composed of three subnetworks, specialized in three poses (i.e. frontal, rear,and lateral poses). Using weightsharing, the knowledge of the BaseNet is transferred tothese subnets. For each image, there are three patches (i.e. head, polygon, whole image)corresponding to three PSNs (see Fig. 4.1). The obtained scores for each patch are thenconcatenated, and the highest one is selected as the final score of the image, which meansthat the model decides based on a optimistic perspective. For example, in case of partialbodyocclusion and low score recognition for the fullbody image, the model presumablydecides based on the headcrop region.
4.3 Experiments and Discussion
First, we describe the strategy of the data collection and discuss the unique features of thecollected dataset. We then briefly explain the two public datasets for which we evaluatedour model. Finally, after describing the experimental settings, we provide the results.
4.3.1 Datasets
In general, deeplearningbased biometric systems are sensitive to data variability. Dueto the environment and subject dynamics, a biometric system trained in a specific placecannot produce the best results in unseen places. This even becomes more critical inuniversal systems dealing with humans as the subject of interest, because not only the
93

Soft Biometrics Analysis in Outdoor Environments
Factors Statistics
No. of videos, subjects, and BBs 216; 13,876; 503,433Length of videos 7 minutesFrame rate extraction 7 frames/sec.Aspect ratio of BBs (Height/Width) 1.75No. of BBs with frontal, rear, and lateral view 256,485; 235,564; 11,384
Table 4.1: Statistics of the BIODI dataset
environment alters, but the styles of clothing and body pose differ in various situations.For instance, the recognition rate will be highly affected in a cold and rainy night as peopleusually cover their bodies, heads, and faceswhile carrying an umbrellawhich has occludedthe upper body. Therefore, regarding the lack of datasets that cover a wide range ofvariations in the environment and pedestrian, we collected the BIODI dataset from 36advertisement panels in Portugal and Brazil at indoor and outdoor locations; differentmoments of the day including morning, noon, evening and night; and various weathers.Table 4.1 summarizes the statistics of this dataset. Each panel has one embedded camerawith 1.5meter vertical distance from the ground. Table 4.2 shows several samples of theBIODI dataset. It worthmentioning that this private dataset has been annotatedmanuallyfor 16 soft biometric labels including gender, age, weight, race, height, hair color, hairstyle, beard, mustache, glasses, head attachments, upperbody cloths, lowerbody clothes,shoes, accessories, and action.To make our results reproducible, we report the performance of our method on publicdatasets such as PETA (excluding MIT) and MIT. Briefly, the MIT pedestrian datasetconsists of 888 outdoor images with 64x128 pixels annotated for frontal and rear views.Approximately, half of the images are in frontal view, and female’s share is onethird of thedataset. PETA is a collection of 19000 images consisting of 10 different datasets, includingthe MIT dataset. However, MIT is excluded from PETA since the proposed model will beevaluated on it, separately. It is worth mentioning that, in PETA benchmark, the numberof males and females are almost the same and there is no viewwise annotation.
4.3.2 Experimental Settings
In our experiments, we use Python 3.5 and Keras 2.1.2 API on top of the Tensorflow1.13. In order to avoid over fitting, we add the batch normalization, max pooling, and
Table 4.2: Sample images of the BIODI dataset that guarantees a wide spectrum of subject andenvironment changes.
94

Soft Biometrics Analysis in Outdoor Environments
Images Network BIODI Frontal Rear Lateral PETA Frontal Rear Lateral
Raw
BaseNet 85.68 85.96 84.49 79.70 86.77 89.18 89.94 75.99FrontalNet 87.53 90.56 RearNet 85.18 93.06 LateralNet 79.87 77.20
Head FrontalNet 88.42 88.73
RearNet 85.13 90.15 LateralNet 78.09 77.37
Polygon FrontalNet 90.44 91.29
RearNet 87.44 91.44 LateralNet 80.99 76.06
Fusion FrontalNet 92.19 92.15
RearNet 88.86 93.58 LateralNet 84.16 80.16
Table 4.3: Accuracy for the experiments on BIODI and PETA in percentage. The experimentson raw, headcrop, and polygoncrop images suggest that headcrop images provide the weakestresults and confirm the fact that in surveillance scenarios, fullbody recognition is more robust.Secondly, we perceived that as BIODI contains various environments, polygon segmentationprovides better results while this is not true for PETA dataset. Finally, the last row of the tableindicates that the adopted strategy for score fusion produces the highest score and accuracy amongother approaches.
drop out layers to the ResNet50. The learning rate is set to 0.005 for the StochasticGradient Descent (SGD) optimizer. It is worth mentioning that we resized the imagesto 175 x 100 pixels, applied standardization per image, and performed horizontal mirroraugmentation.We evaluate the proposed model on three datasets BIODI, MIT, and PETA such that 70%of the BIODI (i.e. 352400 images) and PETA (i.e. 12680 images) datasets are allocated tothe training phase. AsMIT is a small dataset with 888 images, we used 50% of the data fortest phase to have stable results because in each testrun the recognition rate have somevariations.
4.3.3 Results and Discussion
Considering the explanations in the previous section, the experiments were conducted inthree forms: raw images, headcropped regions, and polygonshape regions. Afterward,each trained model is tested. Table 4.3 shows the results of the proposed model onthe RoIs which indicates that lateralview state is the most difficult recognizable posewith around 84% and 80% accuracy for the BIODI and PETA datasets, respectively.Furthermore, FrontalNet outperformed the BaseNet by 1.6% while RearNet improvedthe results from 84.49% to 85.18%, and LateralNet estimated the gender slightly better.Moreover, the increase of the 2% accuracy in polygoncrop images shows that thebackground negatively affects the performance of the networks. Hence, developing thepowerful segmentation algorithms for human fullbody is suitable for further studies.Table 4.4 shows the evaluation of the proposed approach on MIT dataset. Notably, weachieve an average accuracy of 90.0%, 87.9%, and 89.0% for the frontal, rear, and mixed
95

Soft Biometrics Analysis in Outdoor Environments
View [9] [10] [11] [12] [1] ProposedMethod
Front 76.0 79.5 81.0 82.1 82.9 90.0Back 74.6 84.0 82.7 81.3 81.8 87.9Mixed 78.2 80.1 82.0 82.4 89.0
Table 4.4: Results on MIT test set in percentage.
view images, respectively, that are outperforming the results obtained by other methods.
4.4 Conclusions and Future Works
Regarding the ubiquitous surveillance cameras and the lowquality facial acquisitions, it isnecessary to develop methods that deal with fullbody images, occlusions, pose variation,and various illuminates. To this end, we proposed an algorithm for pedestrian genderrecognition in crowded urban environments so that the output of a bodyjoints detectoris applied for splitting the images into three common poses. Further, taking advantage oftransfer learning, the specialized networks were finetuned for extracted RoIs. Extensiveexperiments onmultiple challenging datasets showed that proposed PGRN can effectivelyestimate the gender and consistently outperform the stateoftheartmethods. As the nextstep, we have focused on developing an endtoend network capable of estimating bodyrelated soft biometric traits such as weight, age, height, and race.
Bibliography
[1] M. Raza, M. Sharif, M. Yasmin, M. A. Khan, T. Saba, and S. L. Fernandes,“Appearance based pedestrians’ gender recognition by employing stacked autoencoders in deep learning,” FUTURE GENER COMP SY, vol. 88, pp. 28–39, 2018.89, 96
[2] L. Cai, J. Zhu, H. Zeng, J. Chen, C. Cai, and K.K. Ma, “Hogassisted deep featurelearning for pedestrian gender recognition,” Journal of the Franklin Institute, vol.355, no. 4, pp. 1991–2008, 2018. 89
[3] D. Nguyen, K. Kim, H. Hong, J. Koo, M. Kim, and K. Park, “Gender recognitionfrom humanbody images using visiblelight and thermal camera videos based on acnn for image feature extraction,” Sensors, vol. 17, no. 3, p. 637, mar 2017. [Online].Available: https://doi.org/10.3390/s17030637 90
[4] H.S. Fang, S. Xie, Y.W. Tai, and C. Lu, “Rmpe: Regional multiperson poseestimation,” in Proc. ICCV, 2017, pp. 2334–2343. 91
[5] S. Ren, K. He, R. Girshick, and J. Sun, “Faster rcnn: Towards realtime objectdetection with region proposal networks,” in Advances in neural informationprocessing systems, 2015, pp. 91–99. 91
96

Soft Biometrics Analysis in Outdoor Environments
[6] M. Jaderberg, K. Simonyan, A. Zisserman, andK. Kavukcuoglu, “Spatial transformernetworks,” inProcNIPS Volume 2, ser. NIPS’15. Cambridge,MA,USA:MIT Press,2015, p. 2017–2025. 91
[7] A. Newell, K. Yang, and J. Deng, “Stacked hourglass networks for human poseestimation,” in ECCV. Springer, 2016, pp. 483–499. 91
[8] Y. Xiu, J. Li, H.Wang, Y. Fang, and C. Lu, “Pose flow: Efficient online pose tracking,”arXiv preprint arXiv:1802.00977, 2018. 91
[9] L. Cao, M. Dikmen, Y. Fu, and T. S. Huang, “Gender recognition from body,” inProceedings of the 16th ACM international conference onMultimedia. ACM, 2008,pp. 725–728. 96
[10] G. Guo, G.Mu, and Y. Fu, “Gender from body: A biologicallyinspired approach withmanifold learning,” in ACCV. Springer, 2009, pp. 236–245. 96
[11] C. D. Geelen, R. G. Wijnhoven, G. Dubbelman et al., “Gender classification in lowresolution surveillance video: indepth comparison of random forests and svms,”in VSTIA2015, vol. 9407. International Society for Optics and Photonics, 2015, p.94070M. 96
[12] M. Raza, C. Zonghai, S. Rehman, G. Zhenhua, W. Jikai, and B. Peng, “Partwisepedestrian gender recognition via deep convolutional neural networks,” in 2nd IETICBISP. Institution of Engineering and Technology, 2017. [Online]. Available:https://doi.org/10.1049/cp.2017.0102 96
97

Soft Biometrics Analysis in Outdoor Environments
98

Soft Biometrics Analysis in Outdoor Environments
Chapter 5
An AttentionBased Deep Learning Model forMultiple Pedestrian Attributes Recognition
Abstract. The automatic characterization of pedestrians in surveillance footage is atough challenge, particularly with data acquisition conditions that are extremely diverse,cluttered backgrounds and subjects imaged from varying distances, under multipleposes, and partially occluded. Having observed that the stateoftheart performanceis still unsatisfactory, this paper provides a novel solution to the problem, with twofold contributions: 1) considering the strong semantic correlation between the differentfullbody attributes, we propose a multitask deep model that uses an elementwisemultiplication layer to extract more comprehensive feature representations. In practice,this layer serves as a filter to remove irrelevant background features, and is particularlyimportant to handle complex, cluttered data; and 2) we introduce a weightedsum term tothe loss function that not only relativizes the contribution of each task but also is crucialfor performance improvement in multipleattribute inference settings. Our experimentswere performed in twowellknown datasets (RAP and PETA) and point for the superiorityof the proposed method with respect to the stateoftheart. The code is available athttps://github.com/Ehsan-Yaghoubi/MAN-PAR-.
5.1 Introduction
The automated inference of pedestrian attributes is a longlasting goal in videosurveillance and has been the scope of various research works [1] [2]. Commonly knownas pedestrian attribute recognition (PAR), this topic is still regarded as an open problem,due to extremely challenging variability factors such as occlusions, viewpoint variations,lowillumination and lowresolution data (Fig. 5.1).Deep learning frameworks have been repeatedly improving the stateoftheart in manycomputer vision tasks, such as object detection and classification, action recognition andsoft biometrics inference. In the PAR context, severalmodels have been also proposed [3],[4], withmost of these techniques facing particular difficulties to handle the heterogeneityof visual surveillance environments.Researchers have been approaching the PAR problem from different perspectives [5]: [6],[7], [8] proposed deep learning models based on fullbody images to address the datavariation issues, while [9], [10], [11], [12] described bodypart deep learning networksto consider the finegrained features of the human body parts. Other works focusedparticularly the attention mechanism [13], [14], [11], and typically performed additionaloperations in the output of the midlevel and highlevel convolutional layers. However,learning a comprehensive feature representation of pedestrian data, as the backbone for
99

Soft Biometrics Analysis in Outdoor Environments
Figure 5.1: (a) Examples of some of the challenges in the PAR problem: crowded scenes, poorillumination conditions, and partial occlusions. (b) Typical structure of PAR networks, whichreceive a single image and perform labels inference.
all those approaches, still poses remarkable challenges, mostly resulting from the multilabel and multitask intrinsic properties of PAR networks.In opposition to previous works that attempted to jointly extract local, global and finegrained features from the input image, in this paper, we propose amultitask network thatprocesses the feature maps and not only considers the correlation among the attributesbut also captures the foreground features using a hard attention mechanism. Theattention mechanism yields from the elementwise multiplication between the featuremaps and a foreground mask that is included as a layer on top of the backbone featureextractor. Furthermore, we describe a weighted binary crossentropy loss, where theweights are determined based on the number of categories (e.g., gender, ethnicity, age, …)in each task. Intuitively, these weights control the contribution of each category duringtraining, and are the key to avoid that some of the labels predominate over others, whichwas one of the major problems we identified in our evaluation on the previous works. Inthe empirical validation of the proposed method, we used two wellknown PAR datasets(PETA and RAP) and three baseline methods considered to represent the stateoftheart.The contributions of this work can be summarized as follows:
1. We propose amultitask classificationmodel for PAR that itsmain feature is to focuson the foreground (human body) features, attenuating the effect of backgroundregions in the feature representations (Fig. 5.2);
2. We describe a weighted sum loss function that effectively handles the contributionof each category (e.g., gender, body figure, age, etc.) in the optimizationmechanism,avoiding that some of the categories predominate over others during the inferencestep;
3. Inspired by the attentionmechanism, we implement an elementwisemultiplicationlayer that simulates a hard attention in the output of the convolutional layers,which particularly improves the robustness of feature representations in highlyheterogeneous data acquisition environments.
The remainder of this paper is organized as follows: Section 5.2 summarises the PARrelated literature, and section 5.3 describes our method. In section 5.4, we provide theempirical validation details and discuss the obtained results. Finally, conclusions areprovided in section 5.5.
100

Soft Biometrics Analysis in Outdoor Environments
Figure 5.2: Comparison between the attentive regions obtained typically by previous methods[15], [16] and ours solution, while inferring the Gender attribute. Note the less importance givento background regions by our solution with respect to previous techniques.
5.2 RelatedWork
The ubiquity of CCTV cameras has been rising the ambition of obtaining reliable solutionsfor the automated inference of pedestrian attributes, which can be particularly hard incase of crowded urban environments. Given that face closeshots are rarely available atfar distances, PAR upon fullbody data is of practical interest. In this context, the earlierPARmethods focused individually on a single attribute and used handcrafted feature setsto feed classifiers such as SVM or AdaBoost[17], [18] [19]. More recently, most of theproposed methods were based on deep learning frameworks, and have been repeatedlyadvancing the stateoftheart performance [20], [21], [22], [23].In the context of deep learning, [24] proposed a multilabel model composed of severalCNNs working in parallel, and specialized in segments of the input data. [6] comparedthe performance of singlelabel versus multilabel models, concluding that the semanticcorrelation between the attributes contributes to improve the results. [7] proposed aparameter sharing scheme over independently trained models. Subsequently, inspiredby the success of Recurrent Neural Networks, [25] proposed a Long ShortTermMemory(LSTM) based model to learn the correlation between the attributes in lowqualitypedestrian images. Other works also considered information about the subjects pose [26],bodyparts [27] and viewpoint [9], [14], claiming to improve performance by obtainingbetter feature representations. In this context, by aggregating multiple feature mapsfrom low, mid and highlevel layers of the CNN, [28] enriched the obtained featurerepresentation. For a comprehensive overviewof the existing humanattribute recognitionapproaches, we refer the readers to [5].
5.3 Proposed Method
As illustrated in Fig. 5.2, our main motivation is to provide a PAR pipeline that is robustto backgroundbased irrelevant features, which should contribute for improvements
101

Soft Biometrics Analysis in Outdoor Environments
in performance, particularly in crowded scenes that partial occlusions of human bodysilhouettes occur (Fig. 5.1 (a) and Fig. 5.2).
5.3.1 Overall Architecture
Fig. 5.3 provides an overview of the proposed model, inferring the complete setof attributes of a pedestrian at once, in a singleshot paradigm. Our pipelineis composed of four main stages: 1) the convolutional layers, as general featureextractors; 2) the body segmentation module, that is responsible to discriminatebetween the foreground/background regions; 3) themultiplication layer, that in practiceimplements the attention mechanism; and 4) the taskoriented branches, that avoid thepredominance of some of the labels over others in the inference step.At first, the input image feeds a set of convolutional layers, where the local and globalfeatures are extracted. Next, we use the body segmentation module to obtain the binarymask of the pedestrian body. This mask is used to remove the background features, byan elementwise multiplication with the feature maps. The resulting features (that arefree of background noise) are then compressed using an average pooling strategy. Finally,for each task, we add different fully connected layers on top of the network, not only toleverage the useful information from other tasks but also to improve the generalizationperformance of the network. We have adopted a multitask network, because the sharedconvolutional layers extract the common local and global features that are necessary for allthe tasks (i.e., behavioral attributes, regional attributes, and global attributes) and then,there are separate branches that allow the network to focus on themost important featuresfor each task.
5.3.2 Convolutional Building Blocks
The implemented convolution layers are based on the concept of residual block.Considering x as the input of a conventional neural network, we want to learn the truedistribution of the output H(x). Therefore, the difference (residual) between the inputand output is R(x) = H(x) − x, and can be rearranged to H(x) = R(x) + x. In otherwords, traditional network layers learn the true output H(x), whereas residual networklayers learn the residualR(x). It is worth mentioning that it is easier to learn the residualof the output and input, rather than only the true output [29]. In fact, residualbasednetworks have the degree of freedom to train the layers in residual blocks or skip them.As the optimal number of layers depends on the complexity of the problem under study,adding skip connections makes the neural network active in training the useful layers.There are various types of residual blocks made of different arrangements of the BatchNormalization (BN) layer, activation function, and convolutional layers. Based on theanalysis provided in [30], the forward and backward signals can directly propagatebetween two blocks, and optimal results will be obtained when the input x is used as skipconnection (Fig. 5.4).
102

Soft Biometrics Analysis in Outdoor Environments
Figure 5.3: Overview of the major contributions (Ci) in this paper. C1) the elementwisemultiplication layer receives a set of feature maps FH×W×D and a binary mask MH×W×D, andoutputs a set of attention glimpses. C2) The multitaskoriented architecture provides to thenetwork the ability to focus on the local (e.g., head accessories, types of shoes), behavioral (e.g.,talking, pushing), and global (e.g., age, gender) features (visual results are given in Fig. 5.7).C3) a weighted crossentropy loss function not only considers the interconnection between thedifferent attributes, but also handles the contribution of each label in the inference step. ResidualConvolutional Block (RCB) is the abbreviation for Residual Convolutional Block, illustrated inFig. 5.4. Region Proposal Network (RPN), Fully Connected Network (FCN), and Fully ConnectedLayer (FCL) stand for Region Proposal Network, Fully Connected Network, and Fully ConnectedLayer, respectively.
Figure 5.4: Residual convolutional block in which the input x is considered a skip connection.
103

Soft Biometrics Analysis in Outdoor Environments
5.3.3 Foreground Human Body Segmentation Module
We used the Mask RCNN [31] model to obtain the full body human masks. This methodadopts a twostage procedure after the convolutional layers: i) a RPN [32] that providesseveral possibilities for the object bounding boxes, followed by an alignment layer; andii) a FCN [33] that infers the bounding boxes, class probabilities, and the segmentationmasks.
5.3.4 Hard Attention: Elementwise Multiplication Layer
The idea of an attention mechanism is to provide the neural network with the ability tofocus on a feature subset. Let I be an input image, F the corresponding feature maps,M an attention mask, fϕ(I) an attention network with parameters ϕ, andG an attentionglimpse (i.e., the result of applying an attention mechanism to the image I). Typically,the attention mechanism is implemented as F = fϕ(I), and G = M ⊙ F , where ⊙ isan elementwise multiplication. In soft attention, features are multiplied with a mask ofvalues between zero and one, while in the hard attention variant, values are binarized and hence they should be fully considered or completely disregarded.In this work, as we produce the foreground binary masks, we applied a hard attentionmechanism on the output of the convolutional layers. To this end, we used an elementwise multiplication layer that receives a set of feature maps FH×W×D and a binary maskMH×W×D, and returns a set of attention glimpses GH×W×D, in which H ,W , and D arethe height, weight, and the number of the feature maps, respectively.
5.3.5 MultiTask CNN Architecture andWeighted Loss Function
We consider multiple soft label categories (e.g., gender, age, lowerbody clothing,ethnicity andhairstyle), with each of these including twoormore classes. For example, thecategory of lowerbody clothing is composed of 6 classes: ’pants’, ’jeans’, ’shorts’, ’skirt’,’dress’, ’leggings’. As stated above, there are evident semantic dependencies betweenmost of the labels (e.g., it is not likely that someone uses a ’dress’ and ’sandals’ at thesame time). Hence, to model these relations between the different categories, we use ahard parameter sharing strategy[34] in our multitask residual architecture. Let T , Ct,Kc,Nk be the number of tasks, the number of categories (labels) in each task, the numberof classes in each category, and the number of samples in each class, respectively.During the learning phase, themodelH receives one input image I, its binarymaskS, theground truth labels Y , and returns Y as the predicted attributes (labels):
Y =
yt,ct,kt |t ∈1, ..., T
, c ∈
1, ..., Ct
, k ∈
1, ...,Kc
,
T, Ct,Kc ∈ N, yi ∈1, 0 , (5.1)
in which yt,c,k denotes the predicted attributes.The key concept of the learning process is the loss function. In the single attribute
104

Soft Biometrics Analysis in Outdoor Environments
recognition[35] setting, if the nth image In, (n = 1, ..., N) is characterized by themth attribute, (m = 1, ...,M), then ynm = 1; otherwise, ynm = 0. In case ofhaving multiple attributes (multitask), the predicting functions are in the form of Φ =Φ1,Φ2, ...,Φm, ...,ΦM
, and Φm(I′) ∈
1, 0. We define the minimization of the loss
function over the training samples for themth attribute as:
Ψm = argminΨm
N∑n=1
L(Φm(In,Ψm), ynm
), (5.2)
where Ψm contains a set of optimized parameters related to the mth attribute, whileΦm(In,Ψm) returns the predicted label (ynm) for the mth attribute of the image In.Besides, L(.) is the loss function that measures the difference between the predictionsand groundtruth labels.Considering the interconnection between attributes, one can define a unified multiattribute learning model for all the attributes. In this case, the loss function jointlyconsiders all the attributes:
Ψ = argminΨ
M∑m=1
N∑n=1
L(Φm(In,Ψm), ynm
), (5.3)
in which Ψ contains the set of optimized parameters related to all attributes.In opposition to the above mentioned functions, in order to consider the contribution ofeach category in the loss value, we define a weighted sum loss function:
Ψ = argminΨ
T∑t=1
Ct∑c=1
Kc∑k=1
Nk∑n=1
1
RcL(Φtck(In,Ψtck), ytckn
),
(5.4)
where Rc ∈ R1, ..., RCt are scalar values corresponding to the number of classes inthe categories 1, ..., Ct.Using the sigmoid activation function for all classes in each category, we can formulatethe crossentropy loss function as:
Loss = −T∑t=1
Ct∑c=1
Kc∑k=1
Nk∑n=1
1
nRc
(ytcknlog(ptckn) + (1− ytckn)log(1− ptckn)
), (5.5)
where ytckn is the binary value that relates the class label k in category c. The groundtruthlabel for observation n and ptckn is the predicted probability of the observation n.
5.4 Experiments and Discussion
The proposed PARnetworkwas evaluated on twowellknown datasets: the PETA [17] andthe Richly Annotated Pedestrian (RAP) [15], with both being among the most frequently
105

Soft Biometrics Analysis in Outdoor Environments
Table 5.1: RAP dataset annotations
Branch Annotations
Soft Biometrics Gender, Age, Body figure, Hairstyle, Hair color
Clothing AttributesHat, Upper body clothes style and color, Lower body clothes style and color,Shoe style
Accessories Glasses, Backpack, Bags, BoxAction Telephoning, Talking, Pushing, Carrying, Holding, Gathering
used benchmarks in PAR experiments.
5.4.1 Datasets
RAP [15] is the largest and the most recent dataset in the area of surveillance, pedestrianrecognition, and human reidentification. It was collected at an indoor shopping mallwith 25 High Definition (HD) cameras (spatial resolution 1, 280× 720) during one month.Benefiting from a motion detection and tracking algorithm, authors have processedthe collected videos, which resulted in 84,928 human fullbody images. The resultingbounding boxes vary in size from 33×81 to 415×583. The annotations provide informationabout the viewpoint (’front’, ’back’, ’leftside’, and ’rightside’), body occlusions and bodypart pose, alongwith a detailed specification of the trainvalidationtest partitions, personID, and 111 binary human attributes. Due to the unbalanced distribution of the attributesand insufficient data for some of the classes, only 55 of these binary attributes wereselected [15]. Table 5.1 shows the categories of these attributes. It is worth mentioningthat, as the annotation process is performed per subject instance, the same identity mayhave different attribute annotations in distinct samples.PETA [17] contains ten different pedestrian image collections gathered in outdoorenvironments. It is composed of 19,000 images corresponding to 8,705 individuals,each one annotated with 61 binary attributes, from which 35 were considered withenough samples and selected for the training phase. Camera angle, illumination, and theresolution of images are the particular variation factors in this set.
5.4.2 Evaluation Metrics
PAR algorithms are typically evaluated based on the standard classification accuracy perattribute, and on the mean accuracy (mA) of the attribute. Further, the mean accuracyover all attributes was also used [36], [37]:
mA =1
2M
M∑m=1
(Pm
Pm+
Nm
Nm
), (5.6)
wherem denotes one attribute andM is the total number of attributes. For each attributem, Pm, Nm, Pm, and Nm stand for the number of positive samples, negative samples,correctly recognized as positive samples, correctly recognized as negative samples.
106

Soft Biometrics Analysis in Outdoor Environments
Table 5.2: Parameter Settings for the performed experiments on the RAP dataset.
Parameter Value
Image input shape 256× 256× 3
Mask input shape 16× 16× 3
Learning rate 1× e−4
Learning decay 1× e−6
Number of epochs 200Dropout probability 0.7Batch size 8
5.4.3 Preprocessing
RAP and PETA samples vary in size, with each image containing exclusively one subjectannotated. Therefore, to have constant ratio images, we first performed a zero paddingand then, resized them into 256×256. It worth mentioning that, after each residual block,the input size is divided by 2. Therefore, as we have implemented the backbone with 4
residual stages, to multiply the binary mask and feature maps with a size of 16 × 16, theinput size should be 256×256. Note that the sharp edges caused by these zero pads do notaffect the network due to the presence of themultiplication layer before the classificationlayers.To assure a fair comparison between the tested methods, we used the same trainvalidationtest splits as in [15]: 50, 957 imageswere used for learning, 16, 986 for validationpurposes, and the remaining 16,985 images used for testing. The same strategy was usedfor the PETA dataset. Table 5.2 shows the parameter settings of our multitask network.
5.4.4 Implementation Details
Ourmethodwas implemented using Keras 2.2.5with Tensorflow 1.12.0 backend [38], andall the experiments were performed on a machine with an Intel Core i5 − 8600K CPU @3.60 GHz (Hexa Core | 6 Threads) processor, NVIDIA GeForce RTX 2080 Ti GPU, and 32
GB RAM.The proposed CNN architecture was fulfilled as a dualstep network. At first, we appliedthe body segmentation network (i.e., Mask RCNN, explained in the next subsection) toextract the human fullbody masks, and then trained a twoinput multitask network thatreceives the preprocessed masks and the input data. It is worth mentioning that, onaccount of the spreading or gathering nature of the attributes features in the fullbodyhuman images, we intuitively clustered all the binary attributes into 7 and 6 groups forthe experiments on RAP and PETA, respectively, as given in Table 5.3.As stated above, we used the pretrained Mask RCNN [39] to obtain all the foregroundmasks in our experiments. The used segmentation model was trained in the MSCOCOdataset [40]. Table 5.4 provides the details of our implementation settings.By feeding the input images to the convolutional building blocks, we obtain a set offeature maps that will be multiplied by the corresponding mask, using the elementwisemultiplication layer. This layer receives two inputs with the same shapes. Transferringthe input data with shape of 256 × 256 × 3 into a 4residual block backbone, we obtain
107

Soft Biometrics Analysis in Outdoor Environments
Table5.3:
Taskspecification
policyfor
thePETA
andRAPdatasets.
Dataset
Task1(Full
Body)
Task2(Head
)Task
3(Upper
Body)
Task4(Low
erBody)
Task5(Foot
wears)
Task6
(Accessories)
Task7(Action)
PETA
Female,M
ale,AgeLess30,AgeLess45,
AgeLess60,
AgeLarger60
Hat,LongH
air,Scarf,Sunglasses,
Nothing
Casual,Form
al,Jacket,Logo,
Plaid,ShortSleeves,Strip,Tshirt,Vneck,O
ther
Casual,Form
al,Jeans,Shorts,ShortSkirt,Trousers
LeatherShoes,Sandals,
FootwearShoes,
Sneaker
Backpack
,MessengerB
ag,PlasticB
ags,CarryingN
othing,CarryingO
ther
RAP
Female,M
ale,AgeLess16,Age1730,
Age3145,
Age4660,BodyFat,
BodyN
ormal,
BodyThin,Custom
er,Employee
BaldH
ead,LongH
air,BlackH
air,Hat,
Glasses
Shirt,Sweater,
Vest,TShirt,
Cotton,Jacket,SuitU
p,Tight,ShortSleeves,
Others
LongTrousers,Skirt,ShortSkirt,Dress,Jeans,
TightTrousers
Leather,Sports,Boots,C
loth,Casual,O
ther
Backpack,
ShoulderBag,
HandB
ag,Box,
PlasticBag,
PaperBag,
HandTrunk,Other
Calling,Talking,Gathering,
Holding,Pushing,
Pulling,CarryingB
yArm
,CarryingB
yHand
108

Soft Biometrics Analysis in Outdoor Environments
Table 5.4: Mask RCNN parameter settings
Parameter Value
Image input dimension 1024× 1024× 3
RPN anchor scales 32, 64, 128, 256, 512RPN anchor ratio 0.5, 1, 2Number of proposals per image 256
Figure 5.5: The effectiveness of the multiplication layer on filtering the background featuresfrom the feature maps. The far left column shows the input images to the network, the Maskcolumn presents the ground truth binary mask (the first input of the multiplication layer), thecolumns with Before label (the second input of the multiplication layer) display the feature mapsbefore applying the multiplication operation, and the columns with After label show the output ofthe multiplication layer.
a 16 × 16 × 1, 024shaped output. Also, masks are resized to have the same size as thecorresponding feature maps. Therefore, as a result of multiplying the binary mask andfeature maps, we obtain a set of attention glimpses with the 16× 16× 1, 024 shape. Theseglimpses are downsampled to 1, 024 features using a global average pooling layer todecrease the sensitivity of the locations of the features in the input image [41]. Afterward,in the interest of training one classifier for each task, a Dense[ReLU ] → DropOut →Dense[ReLU ] → DropOut → Dense[ReLU ] → Dense[Sigmoid] architecture is stackedon top of the shared layers for each task.
5.4.5 Comparison with the Stateoftheart
We compared the performance attained by our method to three baselines, that wereconsidered to represent the stateoftheart: Attributes Convolutional Net (ACN) [7],DeepMar [15], and MultiLabel Convolutional Neural Network (MLCNN) [16] on theRAP and the PETA datasets. These methods have been selected for two reasons: 1 ina way similar to our method, ACN and DeepMar are globalbased methods (i.e., theyextract features from the fullbody images) 2 Authors of these methods have reportedthe results for all the attributes in a separate way, assuring a fair comparison between theperformance of all methods.As the solution proposed in this paper, the ACN [7] method analyzes the fullbody imagesand jointly learns all the attributes without relying on additional information. DeepMar[15] is a globalbased endtoend CNN model that provides all the binary labels for theinput image, simultaneously. In [16], authors propose a MLCNN that divides the input
109

Soft Biometrics Analysis in Outdoor Environments
Table 5.5: Comparison between the results observed in the PETA dataset (mean accuracypercentage). The highest accuracy values per attribute among all methods appear in bold.
Attributes DeepMar [15] MLCNN [16] Proposed
Male 89.9 84.3 91.2AgeLess30 85.8 81.1 85.3AgeLess45 81.8 79.9 82.7AgeLess60 86.3 92.8 93.9AgeLarger60 94.8 97.6 98.6HeadHat 91.8 96.1 97.4HeadLongHair 88.9 88.1 92.3HeadScarf 96.1 97.2 98.2HeadNothing 85.8 86.1 90.7UBCasual 84.4 89.3 93.4UBFormal 85.1 91.1 94.6UBJacket 79.2 92.3 95.0UBShortSleeves 87.5 88.1 93.4UBTshirt 83.0 90.6 93.8UBOther 86.1 82.0 84.8LBCasual 84.9 90.5 93.7LBFormal 85.2 90.9 94.0LBJeans 85.7 83.1 86.7LBTrousers 84.3 76.2 78.9ShoesLeather 87.3 85.2 89.8ShoesFootwear 80.0 75.8 79.8ShoesSneaker 78.7 81.8 86.6Backpack 82.6 84.3 89.2MessengerBag 82.0 79.6 86.3PlasticBags 87.0 93.5 94.5CarryingNothing 83.1 80.1 85.9CarryingOther 77.3 80.9 78.8
Average of 27 Attributes 85.4 86.6 90.0Average of 35 Attributes 82.6 91.7
image into overlapped parts and fuses the features of each CNN to provide the binarylabels for the pedestrians. Tables 5.5 and 5.6 provide the obtained results observed forthe three methods considered in the PETA and RAP datasets.Table 5.5 shows the evaluation results of the DeepMar and MLCNN methods, includingour model on the PETA dataset. According to this table, our model shows superiorrecognition rates for 22 (out of 27) attributes, concluded to more than 3% improvementin total accuracy. If we consider 35 attributes, the proposed network achieves a 91.7%recognition rate while this value for the DeepMar approach is 82.6%.The experiment carried out without considering image augmentation (i.e., 5degreerotation, horizontal flip, 0.02 width and height shift range, 0.05 shear range, 0.08 zoomrange and changing the brightness in the interval [0.9,1.1]), showed 85.5% and 88.2%average accuracy for 27 and 35 attributes, respectively. We augmented the imagesrandomly, and after the visualization of some images, we determined the values inaugmentations.As shown in Table 5.6, the average recognition rates for the ACN and DeepMar methodsrespectively were 68.92% and 75.54%, while our approach achieved more than 92%. Inparticular, excluding five attributes (i.e., Female, Shirt, Jacket, Long Trousers, andOther
110

Soft Biometrics Analysis in Outdoor Environments
class in attachments category), our PARmodel provides notoriously better results than theDeepMar method, and better than the ACN model in all cases.The proposed method shows superior results in both datasets; however, in 22 attributesof the RAP benchmark, the recognition percentage is yet less than 95%, and in 7 cases,this rate is even less than 80%. The same interpretation is valid for the PETA dataset aswell, which indicates the demands of more research works in the PAR field of study.
5.4.6 Ablation Studies
In this section, we study the effectiveness of the mentioned contributions in Fig. 5.3.To this end, we trained and tested a light version of the network (with three residualblocks and input image size 128 × 128) on the PETA dataset with similar initialization,but different settings (Table 5.7). The first row of Table 5.7 shows the performance of anetwork, constructed from three residual blocks with four shared fully connected layerson top, plus one fully connected layer for each attribute. In this architecture, as thesystem cannot decide on each task independently, the performance is poor (81.11%), andthe network cannot predict the uncorrelated attributes (e.g., behavioral attributes versusappearance attributes) effectively. However, the results in the second row of Table 5.7show that repeating the fully connected layers for each task independently (while keepingthe rest of the architecture unchanged), improves the results by around 8%. Further,equipping the network with the proposed weighted loss function (Table 5.7, row 3) andadding the Multiplication layer (Table 5.7, row 4) showed further improvements in theperformance to 89.35% and 89.73%, respectively.Feature map visualization. Neural networks are known as poorly interpretablemodels. However, as the internal structures of theCNNs are designed to operate upon twodimensional images, they preserve the spatial relationships for what it is being learned[42]. Hence, by visualizing the operations on each layer, we can understand the behaviorof the network. As a result of slicing the small linear filters over the input data, weobtain the activation maps (feature maps). To analyze the behavior of the proposedmultiplication layer (Fig. 5.3), we visualized the input and output feature maps in Fig.5.5, such that the columns labeled asMask and Before refer to the inputs of the layer, andthe columns labeled as After show the multiplication results of the two inputs. As it isevident, unwanted features resulting from the partial occlusions were filtered from thefeature map, which improved the overall performance of the system.Where is the network looking at? As a general behavior, CNNs infer what couldbe the optimal local/global features of a training set and generalize them to decide onunseen data. Here, partial occlusions can easily affect this behavior and decrease theperformance, being helpful to understand where the model are actually looking at in theprediction phase. To this end, we plot some heat maps to investigate the effectiveness ofthe proposed multiplication layer and taskoriented architecture. Heat maps are easilyunderstandable and highlight the regions on which the network focuses while making aprediction.Fig. 5.6 shows the behavior of the system under examples with partial occlusions. As
111

Soft Biometrics Analysis in Outdoor Environments
Table 5.6: Comparison of the results observed in the RAP dataset (mean accuracy percentage).
Attributes ACN [7] DeepMar [15] Proposed
Female 94.06 96.53 96.28AgeLess16 77.29 77.24 99.25Age1730 69.18 69.66 69.98Age3145 66.80 66.64 67.19Age4660 52.16 59.90 96.88BodyFat 58.42 61.95 87.24BodyNormal 55.36 58.47 78.20BodyThin 52.31 55.75 92.82Customer 80.85 82.30 96.98Employee 85.60 85.73 97.67BaldHead 65.28 80.93 99.56LongHair 89.49 92.47 94.67BlackHair 66.19 79.33 94.94Hat 60.73 84.00 99.02Glasses 56.30 84.19 96.76UBShirt 81.81 85.86 83.93UBSweater 56.85 64.21 92.66UBVest 83.65 89.91 96.91UBTShirt 71.61 75.94 77.17UBCotton 74.67 79.02 89.48UBJacket 78.29 80.69 71.93UBSuitUp 73.92 77.29 97.18UBTight 61.71 68.89 96.10UBShortSleeves 88.27 90.09 90.79UBOthers 50.35 54.82 97.91LBLongTrousers 86.60 86.64 84.88LBSkirt 70.51 74.83 97.37LBShortSkirt 73.16 72.86 98.10LBDress 72.89 76.30 97.34LBJeans 90.17 89.46 91.56LBTightTrousers 86.95 87.91 94.71Backpack 68.87 80.61 98.03ShoulderBag 69.30 82.52 93.29HandBag 63.95 76.45 97.64Box 66.72 76.18 96.30PlasticBag 61.53 75.20 97.78PaperBag 52.25 63.34 99.07HandTrunk 79.01 84.57 97.74Other 66.14 76.14 71.54Calling 74.66 86.97 97.13Talking 50.54 54.65 97.54Gathering 52.69 58.81 95.47Holding 56.43 64.22 97.71Pushing 80.97 82.58 99.15Pulling 69.00 78.35 98.24CarryingByArm 53.55 65.40 97.77CarryingByHand 74.58 82.72 87.57Other 54.83 58.79 99.13
Average 68.92 75.54 92.23
112

Soft Biometrics Analysis in Outdoor Environments
Table 5.7: Ablation studies. The first row shows our baseline system with a multilabelarchitecture and binarycrossentropy loss function, while the other rows indicate the proposedsystem with various settings.
Multitask architecture Multiplication LayerWeighted Loss
(Binarycrossentropy)mAP (%)
81.113 89.183 3 89.353 3 89.73
Figure 5.6: Illustration of the effectiveness of the multiplication layer upon the focus abilityof the proposed model in case of partial occlusions. Samples regard the PETA dataset, with thenetwork predicting the age and gender attributes.
it is seen, the proposed network is able to filter the harmful features of the distractorseffectively, while focusing on the target subject. Moreover, Fig. 5.7 shows the modelbehavior during the attribute recognition in each task.Loss Function. Table 5.8 provides the performance of the proposed network, whenusing different loss functions suitable for binary classification. Focal loss [43] forces thenetwork to concentrate on hard samples, while the weighted Binary CrossEntropy (BCE)loss [6] allocates a specific binary weight to each class. Training the network using binaryfocal loss function showed 79.30% accuracy in the test phase, while this number was90.19% for the weighted BCE loss (see Table 5.8).The proposed weighted loss function uses the BCE loss function, while recommendsdifferent weights for each class. We further trained the proposed model with the binaryfocal loss function using the proposed weights. The results in Table 5.8 indicate a slightimprovement in the performance whenwe train the network using the proposed weightedloss function with BCE (90.34%).
Table 5.8: Performance of the network trained with different loss functions on the PETA dataset.
Loss Function mAP (%)
Binary focal loss function [43] 79.30Weighted BCE loss function [6] 90.19Proposed weighted loss function (with BCE) 90.34Proposed weighted loss function (with binary focal loss) 89.27
113

Soft Biometrics Analysis in Outdoor Environments
Figure 5.7: Visualization of the heat maps resulting of the proposed multitask network. Sampleregard the PETA dataset. The leftmost column shows the original samples, the column Task 1(i.e., recognizing age and gender) presents the effectiveness of the network focus on the humanfullbody, and the remaining columns display the ability of the system on regionbased attributerecognition. The task policies are given in Table 5.3.
5.5 Conclusions
Complex background clutter, viewpoint variations and occlusions are known to havea noticeable negative effect on the performance of person attribute recognition (PAR)methods. According to this observation, in this paper, we proposed a deeplearningframework that improves the robustness of the obtained feature representation by directlydiscarding the background regions in the fully connected layers of the network. To thisend, we described an elementwisemultiplication layer between the output of the residualconvolutional layers and a binary mask representing the human fullbody foreground.Further, the refined featuremaps were downsampled and fed to different fully connectedlayers, that each one is specialized in learning a particular task (i.e., a subset of attributes).Finally, we described a loss function that weights each category of attributes to ensure thateach attribute receives enough attention, and there are not some attributes that bias theresults of others. Our experimental analysis in the PETA and RAP datasets pointed forsolid improvements in performance of the proposed model with respect to the stateoftheart.
114

Soft Biometrics Analysis in Outdoor Environments
Bibliography
[1] A. B. Mabrouk and E. Zagrouba, “Abnormal behavior recognition for intelligentvideo surveillance systems: A review,” Expert Systems with Applications, vol. 91,pp. 480–491, 2018. 99
[2] J. Kumari, R. Rajesh, and K. Pooja, “Facial expression recognition: A survey,”Procedia Computer Science, vol. 58, pp. 486–491, 2015. 99
[3] J. Schmidhuber, “Deep learning in neural networks: An overview,”Neural networks,vol. 61, pp. 85–117, 2015. 99
[4] W. Liu, Z. Wang, X. Liu, N. Zeng, Y. Liu, and F. E. Alsaadi, “A survey of deep neuralnetwork architectures and their applications,”Neurocomputing, vol. 234, pp. 11–26,2017. 99
[5] X. Wang, S. Zheng, R. Yang, B. Luo, and J. Tang, “Pedestrian attribute recognition:A survey,” arXiv preprint arXiv:1901.07474, 2019. 99, 101
[6] D. Li, X. Chen, and K. Huang, “Multiattribute learning for pedestrian attributerecognition in surveillance scenarios,” in 2015 3rd IAPR Asian Conference onPattern Recognition (ACPR). IEEE, 2015, pp. 111–115. 99, 101, 113
[7] P. Sudowe, H. Spitzer, and B. Leibe, “Person attribute recognition with a jointlytrained holistic cnn model,” in Proc. ICCVW, 2015, pp. 87–95. 99, 101, 109, 112
[8] A. H. Abdulnabi, G. Wang, J. Lu, and K. Jia, “Multitask cnn model for attributeprediction,” IEEE Trans. Multimed., vol. 17, no. 11, pp. 1949–1959, 2015. 99
[9] P. Liu, X. Liu, J. Yan, and J. Shao, “Localization guided learning for pedestrianattribute recognition,” arXiv preprint arXiv:1808.09102, 2018. 99, 101
[10] G. Gkioxari, R. Girshick, and J. Malik, “Actions and attributes from wholes andparts,” in Proc. ICCV, 2015, pp. 2470–2478. 99
[11] Y. Li, C. Huang, C. C. Loy, and X. Tang, “Human attribute recognition by deephierarchical contexts,” in Proc. ECCV. Springer, 2016, pp. 684–700. 99
[12] Y. Chen, S. Duffner, A. STOIAN, J.Y. Dufour, and A. Baskurt, “Pedestrianattribute recognition with partbased CNN and combined feature representations,”in VISAPP2018, Funchal, Portugal, Jan. 2018. [Online]. Available: https://hal.archivesouvertes.fr/hal01625470 99
[13] N. Sarafianos, X. Xu, and I. A. Kakadiaris, “Deep imbalanced attribute classificationusing visual attention aggregation,” in Proc. ECCV, 2018, pp. 680–697. 99
[14] M. S. Sarfraz, A. Schumann, Y. Wang, and R. Stiefelhagen, “Deep viewsensitive pedestrian attribute inference in an endtoend model,” arXiv preprintarXiv:1707.06089, 2017. 99, 101
115

Soft Biometrics Analysis in Outdoor Environments
[15] D. Li, Z. Zhang, X. Chen, and K. Huang, “A richly annotated pedestrian dataset forperson retrieval in real surveillance scenarios,” IEEE T IMAGE PROCESS, vol. 28,no. 4, pp. 1575–1590, 2018. 101, 105, 106, 107, 109, 110, 112
[16] J. Zhu, S. Liao, Z. Lei, and S. Z. Li, “Multilabel convolutional neural network basedpedestrian attribute classification,” IMAGEVISIONCOMPUT, vol. 58, pp. 224–229,2017. 101, 109, 110
[17] Y. Deng, P. Luo, C. C. Loy, and X. Tang, “Pedestrian attribute recognition atfar distance,” in Proceedings of the 22Nd ACM International Conference onMultimedia, ser. MM ’14. New York, NY, USA: ACM, 2014, pp. 789–792. [Online].Available: http://doi.acm.org/10.1145/2647868.2654966 101, 105, 106
[18] J. Zhu, S. Liao, Z. Lei, D. Yi, and S. Li, “Pedestrian attribute classification insurveillance: Database and evaluation,” in Proc. ICCVW, 2013, pp. 331–338. 101
[19] R. Layne, T. M. Hospedales, and S. Gong, “Attributesbased reidentification,” inPerson ReIdentification. Springer, 2014, pp. 93–117. 101
[20] Z. Tan, Y. Yang, J. Wan, H. Wan, G. Guo, and S. Z. Li, “Attention based pedestrianattribute analysis,” IEEE transactions on image processing, 2019. 101
[21] Q. Li, X. Zhao, R. He, and K. Huang, “Visualsemantic graph reasoning forpedestrian attribute recognition,” in Proceedings of the AAAI Conference onArtificial Intelligence, vol. 33, 2019, pp. 8634–8641. 101
[22] X. Zhao, L. Sang, G. Ding, J. Han, N. Di, and C. Yan, “Recurrent attention modelfor pedestrian attribute recognition,” in Proceedings of the AAAI Conference onArtificial Intelligence, vol. 33, 2019, pp. 9275–9282. 101
[23] M. Lou, Z. Yu, F. Guo, and X. Zheng, “Msenet: Pedestrian attribute recognitionusingmlsc and seblocks,” in International Conference onArtificial Intelligence andSecurity. Springer, 2019, pp. 217–226. 101
[24] J. Zhu, S. Liao, D. Yi, Z. Lei, and S. Z. Li, “Multilabel cnn based pedestrian attributelearning for soft biometrics,” in 2015 International Conference on Biometrics (ICB).IEEE, 2015, pp. 535–540. 101
[25] J. Wang, X. Zhu, S. Gong, and W. Li, “Attribute recognition by joint recurrentlearning of context and correlation,” in Proc. ICCV, 2017, pp. 531–540. 101
[26] D. Li, X. Chen, Z. Zhang, and K. Huang, “Pose guided deep model for pedestrianattribute recognition in surveillance scenarios,” in 2018 IEEE InternationalConference on Multimedia and Expo (ICME). IEEE, 2018, pp. 1–6. 101
[27] L. Yang, L. Zhu, Y. Wei, S. Liang, and P. Tan, “Attribute recognition from adaptiveparts,” arXiv preprint arXiv:1607.01437, 2016. 101
116
Soft Biometrics Analysis in Outdoor Environments
[28] X. Liu, H. Zhao, M. Tian, L. Sheng, J. Shao, S. Yi, J. Yan, and X. Wang, “Hydraplusnet: Attentive deep features for pedestrian analysis,” in Proc. ICCV, 2017, pp. 350–359. 101
[29] K. He, X. Zhang, S. Ren, and J. Sun, “Deep residual learning for image recognition,”in Proc. CVPR, 2016, pp. 770–778. 102
[30] ——, “Identitymappings in deep residual networks,” inProc. ECCV. Springer, 2016,pp. 630–645. 102
[31] K. He, G. Gkioxari, P. Dollár, and R. Girshick, “Mask rcnn,” in Proc. IEEE ICCV,2017, pp. 2961–2969. 104
[32] S. Ren, K. He, R. Girshick, and J. Sun, “Faster rcnn: Towards realtime objectdetection with region proposal networks,” in Advances in neural informationprocessing systems, 2015, pp. 91–99. 104
[33] J. Long, E. Shelhamer, and T. Darrell, “Fully convolutional networks for semanticsegmentation,” in Proc. CVPR, 2015, pp. 3431–3440. 104
[34] S. Ruder, “An overview of multitask learning in deep neural networks,” CoRR, vol.abs/1706.05098, 2017. [Online]. Available: http://arxiv.org/abs/1706.05098 104
[35] Z. Liu, P. Luo, X. Wang, and X. Tang, “Deep learning face attributes in the wild,” inProc. ICCV, 2015, pp. 3730–3738. 105
[36] K. He, Z. Wang, Y. Fu, R. Feng, Y.G. Jiang, and X. Xue, “Adaptively weighted multitask deep network for person attribute classification,” in Proceedings of the 25thACM international conference on Multimedia. ACM, 2017, pp. 1636–1644. 106
[37] Y. Lin, L. Zheng, Z. Zheng, Y. Wu, Z. Hu, C. Yan, and Y. Yang, “Improving personreidentification by attribute and identity learning,” Pattern Recognition, vol. 95, pp.151–161, 2019. 106
[38] M. Abadi, P. Barham, J. Chen, Z. Chen, A. Davis, J. Dean, M. Devin, S. Ghemawat,G. Irving, M. Isard et al., “Tensorflow: A system for largescale machine learning,”in 12th USENIX Symposium on Operating Systems Design and Implementation(OSDI 16), 2016, pp. 265–283. 107
[39] W. Abdulla, “Mask rcnn for object detection and instance segmentation on kerasand tensorflow,” https://github.com/matterport/Mask_RCNN, 2017. 107
[40] T.Y. Lin, M.Maire, S. Belongie, J. Hays, P. Perona, D. Ramanan, P. Dollár, and C. L.Zitnick, “Microsoft coco: Common objects in context,” in Proc. ECCV. Springer,2014, pp. 740–755. 107
[41] M. Lin, Q. Chen, and S. Yan, “Network in network,” arXiv preprint arXiv:1312.4400,2013. 109
117

Soft Biometrics Analysis in Outdoor Environments
[42] I. Goodfellow, Y. Bengio, and A. Courville, Deep learning. MIT press, 2016. 111
[43] T.Y. Lin, P. Goyal, R. Girshick, K. He, and P. Dollár, “Focal loss for dense objectdetection,” in Proc. ICCV, 2017, pp. 2980–2988. 113
118

Soft Biometrics Analysis in Outdoor Environments
Chapter 6
Person Reidentification: Implicitly Definingthe Receptive Fields of Deep LearningClassification Frameworks
Abstract. The receptive fields of deep learning models determine the most significantregions of the input data for providing correct decisions. Up to now, the primary wayto learn such receptive fields is to train the models upon masked data, which helps thenetworks to ignore any unwanted regions, but also has two major drawbacks: 1) it yieldsedgesensitive decision processes; and 2) it augments considerably the computational costof the inference phase. Having theses weaknesses inmind, this paper describes a solutionfor implicitly enhancing the inference of the networks’ receptive fields, by creatingsynthetic learning data composed of interchanged segments considered apriori importantor irrelevant for the network decision. In practice, we use a segmentation module todistinguish between the foreground (important) versus background (irrelevant) parts ofeach learning instance, and randomly swap segments between image pairs, while keepingthe class label exclusively consistent with the label of the segments deemed important.This strategy typically drives the networks to interpret that the identity and clutterdescriptions are not correlated. Moreover, the proposed solution has other interestingproperties: 1) it is parameterlearningfree; 2) it fully preserves the label information; and3) it is compatible with the data augmentation techniques typically used. In our empiricalevaluation, we considered the person reidentification problem, and the well known RAP,Market1501 andMSMTV2 datasets for two different settings (upperbody and fullbody),having observed highly competitive results over the stateoftheart. Under a reproducibleresearch paradigm, both the code and the empirical evaluation protocol are available athttps://github.com/Ehsan-Yaghoubi/reid-strong-baseline.
6.1 Introduction
Person reidentification (reid) refers to the crosscamera retrieval task, in which a queryfrom a target subject is used to retrieve identities from a gallery set. This process is tiedto many difficulties, such as variations in human pose, illumination, partial occlusion,and cluttered background. The primary way to address these challenges is to providelargescale labeled learning data (which are not only hard to collect, but particularly costlyto annotate) and expect that the deep model learns the critical parts of the input dataautonomously. This strategy is supposed to work for any problem, upon the existence ofenough learning data, which might correspond to millions of learning instances in hardproblems.
119

Soft Biometrics Analysis in Outdoor Environments
To skim the costly annotation step, various works propose to augment the learning datausing different techniques [1]. They either use the available data to synthesize new imagesor generate new images by sampling from the learned distribution. In both cases, themainobjective is to increase the quantity of data, without assisting the model in finding theinput regions, so that often the networks find spurious patterns in the background regionsthat –yet– are matched with the ground truth labels. This kind of techniques showspositive effects in several applications; for example, [2] proposes an object detectionmodel, in which the objects are cut out from their original background and pasted toother scenes (e.g., a plane is pasted between different sky images). On the contrary, in thepedestrian attribute recognition and reidentification problems, the background clutter isknown as a primary obstacle to the reliability of the inferred models.Holistic CNNbased reid models extract global features, regardless of any critical regionsin the input data, and typically fail when the background covers most of the input. Inparticular, when dealing with limited amounts of learning data, three problems emerge:1) holistic methods may not find the foreground regions automatically; 2) partbasedmethods [3], [4] typically fail to detect the appropriate critical regions; and 3) attentionbased models (e.g., [5] and [6]) face difficulties in case that multiple persons appear in asingle bounding box. As an attempt to reduce the classification bias due to the backgroundclutter (caused by inaccurate person detection or crowded scenes), [7] proposes analignment method to refine the bounding boxes, while [8] uses a local feature matchingtechnique. As illustrated in Fig. 6.1, although the alignmentbased reid approachesreduce the amounts of clutter in the learning data, the networks still typically suffer fromthe remaining background features, particularly if some of the IDs always appear in thesame scene (background).To address the abovedescribed problems, this paper introduces a receptive field implicitdefinition method based on data augmentation that could be applied to the existing reid methods as a complementary step. The proposed solution is 1) maskfree for the testphase, i.e., it does not require any additional explicit segmentation in test time; and 2)contributes to foregroundfocused decisions in the inference phase. The main idea is togenerate synthetic data composed of interleaved segments from the original learning set,while using class information only from specific segments. During the learning phase, thenewly generated samples feed the network, keeping their label exclusively consistent withthe identity from where the regionofinterest was cropped. Hence, as the model receivesimages of each identity with inconsistent unwanted areas (e.g., background), it naturallypays the most attention to the regions consistent with ground truth labels. We observedthat this preprocessing method is equivalent to only learn from the effective receptivefields and ignore the destructive regions. During the test phase, samples are providedwithout any mask, and the network naturally disregards the detrimental information,which is the insight for the observed improvements in performance.In particular, when compared to [9] and [10], this paper can be seen as a dataaugmentation technique with several singularities: 1) we not only enlarge the learningdata but also implicitly provide the inference model with an attentional decisionmaking
120

Soft Biometrics Analysis in Outdoor Environments
Figure 6.1: The main challenge addressed in this paper: during the learning phase, if the modelsees all samples of one ID in a single scene, the final feature representation of that subject mightbe entangled with spurious (background) features. By creating synthetic samples with multiplebackgrounds, we implicitly guide the network to focus on the deemed important (foreground)features.
skill, contributing to ignore irrelevant image features during the test phase; 2)we generatehighly representative samples, making it possible to use our solution alongwith other dataaugmentation methods; and 3) our solution allows the onthefly data generation, whichmakes it efficient and easy to be implemented beside the common data augmentationtechniques. Our evaluation results point for consistent improvements in performancewhen using our solution over the stateoftheart person reid method.
6.2 RelatedWork
Data Augmentation. Data augmentation targets the root cause of the overfittingproblem by generating new data samples and preserving their ground truth labels.Geometrical transformation (scaling, rotations, flipping, etc.), color alteration (contrast,brightness, hue), image manipulation (random erasing [10], kernel filters, imagemixing [9]), and deep learning approaches (neural style transfer, generative adversarialnetworks) [1] are the common augmentation techniques.Recently, various methods have been proposed for image synthesizing and dataaugmentation [1]. For example, [9] generates n2 samples from an nsized dataset by
121
Soft Biometrics Analysis in Outdoor Environments
using a sample pairing method, in which a random couple of images are overlaid basedon the average intensity values of their pixels. [10] presents a random erasing dataaugmentation strategy that inflates the learning data by randomly selecting rectangularregions and changing their pixels values. As an attempt to robustify the model againstocclusions, increasing the volume of the learning data turned the concept of randomerasing into a popular data augmentation technique. [2] addressed the problem ofobject detection, in which the background has helpful features for detecting the objects;therefore, authors developed a contextestimator network that places the instances (i.e.,cut out objects) with meaningful sizes on the relevant backgrounds.Person ReID. In general, early person reid works studied either the descriptorsto extract more robust feature representations or metricbased methods to handle thedistance between the interclass and intraclass samples [11]. However, recent reidstudies aremostly based on deep learning neural networks that can be classified into threebranches [12]: Convolutional Neural Network (CNN), CNNRecurrent neural network,and Generative Adversarial Network (GAN).Among the CNN and CNNRNNmethods, those based on attention mechanisms follow asimilar objective to what we pursue in this paper; i.e., they ignore background features bydeveloping attention modules in the backbone feature extractor. Attention mechanismmay be developed for either singleshot or multishot (video) [13], [14], [15] scenarios,both of them aim to learn a distinctive feature representation that focuses on the criticalregions of the data. To this end, [16] use the bodyjoint coordinates to remove theextra background and divide the image into several horizontal pieces to be processed byseparate CNN branches. [5] and [6] propose a bodypart detector to reidentify the probeperson with matching the bounding boxes of each bodypart, while [17] uses the maskedout bodyparts to ignore the background features in the matching process. In contrastto these works that explicitly implement the attentional process in the structure of theneural network [18], we provide an attentional control ability based on receptive fieldaugmentation detailed in section 6.3. Therefore, in some terms, our work is similar tothe GANbased reid techniques, which usually aim to either increase the quantity of thedata [19] or present novel poses of the existing identities [20], [21] or transfer the camerastyle [22], [23]. Although GANbased works present novel features for each individual,they generate some destructive features that are originated from the new backgrounds.Furthermore, these works ignore to handle the problem of coappearance of multipleidentities in one shot.
6.3 Proposed Method
Figure 6.2 provides an overview of the proposed image synthesis method, in this case,considering the fullbody as the region of interest (ROI). We show the first synthesizesubset, in which the new samples comprise of the ROI of the 1st sample and thebackground of the other samples.
122

Soft Biometrics Analysis in Outdoor Environments
Figure 6.2: The proposed fullbody attentional data augmentation (best viewed in color). Blue,orange, purple, and red denote the samples 1, 2, 3, and N , respectively. The paleyellow, green,pink, and purple colors represent their cluttered (background) regions, which should be irrelevantfor the inference process. Therefore, all the synthetic images labeled as 1 share the blue bodyregion but have different backgrounds, which provides a strong cue for the network to disregardsuch segments from the decision process.
6.3.1 Implicit Definition of Receptive Fields
As an intrinsic behavior of CNNs, in the learning phase, the network extracts a set ofessential features in accordancewith the image annotations. However, extracting relevantand compressed features is an ongoing challenge, especially when the background1
changes with person ID. Intuitively, when a person’s identity appears with an identicalbackground, some background features are entangled with the useful foreground featuresand reduce the inference performance. However, if the network sees one person withdifferent backgrounds, it can automatically discriminate between the relevant regions ofthe image and the ground truth labels. Therefore, to help the inference modelautomatically distinguish between the unwanted features and foregroundfeatures, in the learning phase, we repeatedly feed synthetically generated,fake images to the network that has been composed of two components:
1. critical parts of the current input image that describe the ground truth labels (i.e.,person’s identity), and we would like to have an attention on them, and
2. parts of the other real samples that intuitively are uncorrelated with the currentidentity –i.e., background and possible body parts (if any) that we would like thenetwork to ignore them.
Thus, the model looks through each region of interest, juxtaposed withdifferent unwanted regions –of all the images– enabling the network to
1The terms (unwanted region/regionofinterest), (undesired/desired) boundaries,(background/foreground) areas, and (unwanted/wanted) areas refer to the data segments that aredeemed to be irrelevant/relevant to the ground truth label. For example, in a hair color recognition problem,the regionofinterest is the hair area, which can be defined by a binary mask
123

Soft Biometrics Analysis in Outdoor Environments
learn where to look at in the image and ignores the parts that are changingarbitrarily and are not correlated with ground truth labels. Consequently,during the test phase, the model explores the region of interest and discards the featuresof unwanted regions that have been trained for.Formally, let Ii represent the ith image in the learning set, li its ground truth label (ID)and Mj the corresponding groundtruth binary mask that discriminates between theforeground/background regions. As the available reid datasets do not provide groundtruth human bodymasks, we use theMask RCNN [24] to obtain suchmasks (see Section6.4). Considering thatROI. refers the region of interest and UR. the unwanted regions,the goal is to synthesis the artificial sample Si¬j , using label li: Si¬j(x, y) = ROIi ∪URj ,whereROI. = I.(x, y) such thatM.(x, y) = 1,UR. = I.(x, y) such thatM.(x, y) = 0, and(x, y) are the coordinates of the pixels.Therefore, for an nsized dataset, the maximum number of generated images is equalto n2 − n. However, to avoid losing the expressiveness of the generated samples, weconsider several constraints. Hence, a combination of the common data transformations(e.g., flipping, cropping, blurring) can be used along with our method. Obviously, sincewe utilize the ground truth masks, our technique should be used in the first place, beforeany other augmentation transformation, to avoid extra processing on the binary masks.
6.3.2 Synthetic Image Generation
To ensure that the synthetically generated images have a natural aspect, we impose thefollowing constraints:
6.3.2.1 Size and shape constraint
Considering that human bodies are deformable objects of varying size and alignmentwithin the bounding boxes, any blind image generation process will yield unrealisticresults. Therefore, we added a constraint that avoids combining images withsignificant differences in their aspect ratios of the ROIs to circumvent the unrealisticstretching/shrinking of the replaced content in the generated images. To this end, theratio between the foreground areas defined by masks Mj and Mi should be more thanthe threshold Ts (we considered Ts = 0.8 in our experiments). Let A. be the area of theforeground region (i.e., maskM.):Aj =
∑wx=0
∑hy=0Mj(x, y), wherew andh are thewidth
and height of the image, respectively.This constraint translates to min(Ai,Aj)/max(Ai,Aj) > Ts. Moreover, to ensure theshape similarity, we calculate the Intersection over Union metric (IoU) for masksMi andMj: IoU(Mi,Mj) = (Mi ∩Mj)/(Mi ∪Mj).For the IoU calculation, we ought to consider only the rectangular area around themasks (instead of the whole image area); moreover, when calculating the IoU, the sizeof the masks must match, and in case of resizing the masks, the aspect ratios should bepreserved. To fulfill these conditions, we find the contours in the binary masks using[25] and calculate the minimal upright bounding rectangle of the masks. The width of
124

Soft Biometrics Analysis in Outdoor Environments
the rectangular masks in all images is set to a fixed size and, afterwards, we apply zeropadding to the height of the smaller mask to match the sizes. Finally, if the IoU(Mi,Mj)
is higher than a threshold Ti, we consider those images for the merging process (Ti = 0.5
was used in our experiments).
6.3.2.2 Smoothness constraint
The transition between the source image and the replaced content should be as smooth aspossible to prevent from strong edges. One challenge is thatMi and the body silhouetteof the jth person do not match perfectly. To overcome this issue, we enlarge the maskMj by using the morphological dilation operator with a 5 × 5 kernel: Md = Mj ⊕K5×5.Next, to guarantee the continuity between the background and the newly added content,we use the image inpainting technique in [26] to remove the undesired area from thesource image, as it has been dictated by the enlarged maskMd.
6.3.2.3 Viewpoint constraint
The proposed method can be used for focusing on a specific region of the body. Forexample, supposing that the upperbody should be considered the RoI, the generatedimages will be composed of the 1st sample’s upperbody and the remaining segments(background and lowerbody regions) of the other images, while keeping the label of the1st sample. When defining the receptive fields of specific regions (e.g., upper body in Fig.6.3), it is important to generate high representative samples. Hence, we consider the bodyposes of samples and only combine images with the same viewpoint annotations causingto prevent from generating images composed of the anterior upperbody of the ith personand posterior lowerbody (and background) of the jth person. One can apply Alphapose[27] to any pedestrian dataset to estimate the body poses and then, uses a clusteringmethod such as [28], [29], [30], or [31] to create clusters of poses as the viewpoint label.The detailed information for the two experiments carried out is given in subsection6.5.3. Figure 6.3 shows some examples generated by our technique, providing attentionto the upperbody or fullbody region. When defining the CNN’s receptive fields onthe upperbody region, fake samples are different in the human lower body and theenvironment, while they resemble each other in the person’s upper body and identity label.By selecting the fullbody as the ROI, the generated images will be composed of similarbody silhouettes with different surroundings.
6.4 Implementation Details
As the settings and configurations on all the datasets are identical, in the followingwe onlymention the details for the RAP dataset. We based our method on the baseline [32] andselected similar model architecture, parameter settings, and optimizer. In this baseline, authors resized images onthefly into 128 × 128 pixels. As the RAP images vary inresolution (from 33×81 to 415×583), to avoid any data deformation, we first mapped the
125

Soft Biometrics Analysis in Outdoor Environments
Figure 6.3: Examples of synthetic data generated for upperbody (center columns) and fullbody(rightmost columns) receptive fields. The leftmost column shows the original images. Additionalexamples are provided at https://github.com/EhsanYaghoubi/reidstrongbaseline.
images to a squared shape, using a replication technique, in which the row or column atthe very edge of the original image is replicated to the extra border of the image.The RAP dataset does not provide human body segmentation annotations. To generatethe segmentation masks, we first fed the images to MaskRCNN model [24] (using itsdefault parameter settings described in https://github.com/matterport/Mask_RCNN).Next, as described in subsection 6.3.2, we generated the synthetic images.To provide the train and test splits for our model, we followed the instructions of thedataset publishers in [23; 33; 34]. Furthermore, following the configurations suggestedin [32], we used the stateoftheart tricks such as warmup learning rate [35], randomerasing data augmentation [10], label smoothing [36], last stride [37], and BNNeck [32],alongside the conventional data augmentation transformations (i.e., random horizontalflip, random crop, and 10pixelpadding and originalsizecrop).
6.5 Experiments and Discussion
We evaluate the proposed method under two settings: (1) by defining the upperbodyreceptive fields, assuming that most of the identity information lies in upper body. In thissetting, we generate the synthetic data by modifying the lowerbody parts of the subjectimages. This setting requires both segmentationmasks and viewpoint annotations, as theperspective/viewpoint of the upperbody region should be consistent with the perspectiveof the lower body. In practice, this strategy assures that we do not combine a frontview upper body with a rearview lower body. (2) by defining the fullbody receptivefields, in which the attention of the network is “oriented” towards the entire body. Thenotion of viewpoint does not apply here, since the method can be seen as a simplebackground swapping process, where the person is placed in a different environment.In our experiments, we evaluate our model on the earlier setting and RAP dataset fortwo modes: (a) when humanbased annotations are available for four viewpoints, and(b) when the subjects’ viewpoint is inferred using a clustering method. Furthermore, wetested ourmethod with the later setting over the RAP,Market1501, andMSMT17 datasets.
126

Soft Biometrics Analysis in Outdoor Environments
Table 6.1: Results comparison between the baseline (top row) and our solutions for definingreceptive fields, particularly tuned for the upper body and full body, on the RAP benchmark. mAPand Ranks 1, 5, and 10 are given, for the softmax and tripletsoftmax samplers. Ours1 shows theresults for setting 1, mode 1: upper body with viewpoint annotations. Ours2 shows the resultsfor setting 1, mode 2: upper body without viewpoint annotations. Ours3 shows the results forsetting 2: full body. The best possible results for Luo et al. [32] occurred using tripletsoftmaxsampler in epoch 1120, whereas our models were trained for 280 epochs which lasted around 20hours. The best results appear in bold.
softmax sampler tripletsoftmax samplerModel rank=1 rank=5 rank=10 mAP rank=1 rank=5 rank=10 mAP
Luo et al. [32] 64.1 81.5 86.8 45.8 66.1 81.9 86.3 45.9Ours1 64.4 80.5 85.6 42.5 66.5 81.5 86.0 43.0Ours2 65.1 81.4 86.2 43.3 66.8 82.0 86.5 43.8Ours3 65.7 82.2 87.2 45.0 69.0 83.6 88.1 46.3
6.5.1 Datasets
The Richly Annotated Pedestrian (RAP) benchmark [33] is one of the largest wellknownpedestrian dataset composing of around 85,000 samples, from which 41,585 imageshave been selected manually for identity annotation. The RAP reid set includes 26,638images of 2,589 identities and 14,947 samples as distractors that have been collected from23 cameras in a shopping mall. The provided human bounding boxes have differentresolutions ranging from 33 × 81 to 415 × 583. In addition to human attributes, theRAP dataset is annotated for camera angle, bodypart position, and occlusions. TheMSMT17V2 reid dataset [23] consists of 4101 identities captured with 15 cameras inoutdoor and indoor environment. The total number of person bounding boxes are 126, 441which have been detected using Faster RCNN [38]. TheMarket1501 dataset [34] used theDeformable Part Model (DPM) detector [39] to extract 32,668 person bounding boxesfrom 1105 identities using 6 cameras in outdoor scenes. The Market1501 dataset imageswere normalized to 128× 64 pixel resolution.
6.5.2 Baseline
A recent work by Facebook AI [40] mentions that upgrading factors such as the learningmethod (e.g., [41], [42]), network architecture (e.g., ResNet, GoogleNet, BNInception),loss function (e.g., embedding losses [43], [44] and classification losses [45], [46]), andparameter settings may improve the performance of an algorithm, leading to unfaircomparison. This way, to be certain that the proposed solution actually contributes toperformance improvement, our empirical framework was carefully designed in order tokeep constant as many factors as possible with a recent reid baseline [32] This baselinehas advanced the stateoftheart performance with respect to several techniques such as[47],[48], and [49]. In summary, it is a holistic deep learningbased framework that usesa bag of tricks that are known to be particularly effective for the person reid problem.Authors employ the ResNet50 model as the backbone feature extractor
127

Soft Biometrics Analysis in Outdoor Environments
Table 6.2: Results of the proposed receptive field definer solution for upperbody and fullbodymodels. Bold and underline styles denote the best and runnerup results. ”Aug. Prob.” stands foraugmentation probability.
Model Aug. Prob. Rank 1 Rank 5 Rank 10 Rank 50 mAP
Upperbody
0.1 53.4 72.3 78.9 90.6 34.80.3 63.1 79.8 84.8 93.2 41.10.5 64.4 80.5 85.6 92.7 42.50.7 62.1 78.3 83.0 91.6 37.70.9 59.0 75.3 80.6 90.2 34.8
Fullbody0.3 69.0 83.6 88.1 94.8 46.30.5 68.0 82.6 87.0 94.3 44.6
6.5.3 ReID Results
6.5.3.1 Experiments on the RAP dataset
As stated before, the proposed method with the upperbody setting requires viewpointlabels; however, not all pedestrian datasets provide this ground truth information. Asannotating a large dataset with this information would be extremely time consuming, wesuggested that state of the art pose detectors are used to automatically infer the subjectsviewpoint. To test this hypothesis, we have chosen the RAP dataset since it includesmanual annotations for the samples viewpoint. Hence, we evaluated our upperbodybased model for two different modes: (1) by considering the humanbased viewpointannotations; and (2) by using Alphapose followed by a clustering method (BalancedIterative Reducing and Clustering using Hierarchies [28]) to automatically estimatehuman poses. In the latter case, we used Alphapose with its default settings to extract thebody keypoints of all the persons in the dataset; next, we applied the BIRCH clusteringmethod and created 8 clusters of body poses. Finally, to swap the unwanted regions inthe original image with another sample, the candidate image is selected from the samecluster where the original image is located. In bothmodes, the network configuration andthe hyperparameters were exactly the same.Table 6.1 provides the overall performances based on the mean Average Precision (mAP)metric and Cumulative Match Characteristic (CMC) for ranks 1, 5, and 10, denotingthe possibility of retrieving at least one true positive in the top1, 5, and 10 ranks.We evaluated the proposed method using two sampling methods and observed a slightimprovement in the performance of both methods when using the tripletsoftmaxover softmax sampler. As previously mentioned, our method could be treated as anaugmentationmethod that requires a pairedprocess (i.e., exchanging the foreground andbackground of each pair of images), imposing a computational cost only to the learningphase. Moreover, due to increasing the learning samples from n to less than n2, thenetwork needs more time and the number of epochs to converge. Therefore, learning ourmethod (using tripletsoftmax sampler) for 280 epochs lasted around 20 hours with lossvalue 1.3, while the baseline method completed 2000 epochs after 37 hours of learningwith loss value 1.0.The experimental results of upperbody setting are given in rows 2 and 3 of Table 6.1,
128

Soft Biometrics Analysis in Outdoor Environments
pointing for an optimal performance, when we use 8 cluster of poses instead of the groundtruth viewpoint labels; therefore, ourmethod could be used in conjunctionwith viewpointestimation models to boost the performance, without requiring viewpoint annotations.Comparison of the first and second rows of Table 6.1 shows that our technique withan attention on the human upperbody achieves competitive results, such that retrievalaccuracy in rank 1 is 0.3% better than the baseline. However, in higher ranks and mAPmetrics, the baseline has better performance.The fourth row of Table 6.1 provides the performance of the proposed method with anattention on the human fullbody and –not surprisingly– indicates that concentration onthe fullbody (rather than upperbody) yields more useful features for shorttime personreid. However, comparing four rows of the result table together, we could perceivehow much is the lowerbody important –as a bodypart with most background region?For example, when using fullbody region (over the upperbody) with tripletsoftmaxsampler, the rank 1 accuracy improves from 66.8 to 69.0 (i.e., 2.2% improvement), whilethe accuracy difference of rank 1 between the holistic baseline and fullbody method is2.9%, indicating that 2.2 of our improvement (in rank 1) over the baseline is because ofattention on the lowerbody and the rest (0.7%) is due to focusing on the upperbody.During the learning phase, each synthesized sample is generated with a probabilitybetween [0, 1], with 0meaning that no changes will be done in the dataset (i.e., we use theoriginal samples) and 1 indicates that all samples will be transformed (augmented). Westudied the effectiveness of our method for different probabilities (from 0.1 to 0.9) andgave the obtained results in Table 6.2. Overall, the optimal performance of the proposedtechnique is attained when the augmentation probability lies in the [0.3, 0.5] interval.This leads us to conclude that such intermediate probabilities of augmentation keep thediscriminating information of the original data while also guarantee the transformationof enough data for yielding an effective attention mechanism.
6.5.3.2 Experiments on the Market1501 dataset
Table 6.3 compares the performance of our method with respect to several stateoftheart techniques on the Market1501 set [34], and supports the superiority of our method,with 0.4 of rank 1 accuracy over [50] and 1.1 of mAP over [51]. Additionally, we postprocessed our results on the Market1501 using the reranking method proposed by [52].[52] postprocesses the global features of the gallery set and the probe person. Thismethod indicates that the kreciprocal nearest neighbors to the probe image should havemore priorities in the ranking list. Using this technique with settings k1 = 20, k2 = 6, andλ = 0.3, the rank 1 and mAP results were improved from 95.1 and 86.5 to 95.8 and 94.3,respectively.
6.5.3.3 Experiments on the MSMT17V2 dataset
The empirical results over theMSMT17v2 benchmark [23] are given in Table 6.4. Resultsshow that the proposed method advances the stateoftheart methods in ranks 1, 5, and
129

Soft Biometrics Analysis in Outdoor Environments
Table 6.3: Results comparison on the Market1501 benchmark. The top two results are given inbold.
Model Rank 1 Rank 5 Rank 10 mAP
[53] 88.5 – – 71.5[54] 84.7 94.2 96.6 64.7[55] 90.5 – – 77.7[56] 91.3 – – 76.0[57] 91.4 96.6 97.7 76.7[51] 91.5 96.8 97.3 85.4[58] 92.1 96.5 98.6 81.9[59] 92.3 – – 78.2[60] 93.3 – – 76.8[61] 93.3 97.5 98.4 81.3[62] 93.4 97.6 98.5 82.2[63] 93.9 – – 84.5[50] 94.7 95.7 98.5 –Ours 95.1 98.2 99.0 86.5
Ours + reranking 95.8 98.0 98.5 94.3
10 by more than 2 percent, while based on the mAP metric our method (45.9%) rankssecond best, after [64].
6.6 Conclusions
CNNs are known to be able to autonomously find the critical regions of the input dataand discriminate between foregroundbackground regions. However, to accomplish sucha challenging goal, they demand large volumes of learning data, which can be hard tocollect and particularly costly to annotate, in case of supervised learning problems. Inthis paper, we described a solution based on data segmentation and swapping, thatinterchanges segments apriori deemed to be important or irrelevant for the networkresponses. The proposed method can be seen as a data augmentation solution thatimplicitly empowers the network to improve its receptive fields inference skill. In practice,during the learning phase, we provide the networkwith an attentionalmechanismderivedfrom prior information (i.e., annotations and body masks), that determines not only thecritical regions of the input data but also provides important cues about any uselessinput segments that should be disregarded from the decision process. Finally, it isimportant to stress that, in test time, samples are provided without any segmentationmask, which lowers the computational burdenwith respect to previously proposed explicitattention mechanisms. As a proofofconcept, our experiments were carried out in
Table 6.4: Results comparison on the MSMT17 benchmark. The best results are given in bold.
Model Rank 1 Rank 5 Rank 10 mAP
[64] 68.3 – – 49.3[59] 68.8 – – 41.0[57] 69.4 81.5 85.6 39.2Ours 71.7 83.6 87.4 45.9
130

Soft Biometrics Analysis in Outdoor Environments
the highly challenging pedestrian reidentification problem, and the results show thatour approach –as a complementary data augmentation technique– could contribute tosignificant improvements in the performance of the stateoftheart.
Bibliography
[1] C. Shorten and T. M. Khoshgoftaar, “A survey on image data augmentation for deeplearning,” J. Big Data, vol. 6, no. 1, p. 60, 2019. 120, 121
[2] N. Dvornik, J. Mairal, and C. Schmid, “On the importance of visual context for dataaugmentation in scene understanding,” IEEE TPAMI, 2019. 120, 122
[3] R. R. Varior, B. Shuai, J. Lu, D. Xu, and G. Wang, “A siamese long shorttermmemory architecture for human reidentification,” in Proc. ECCV. Springer, 2016,pp. 135–153. 120
[4] D. Li, X. Chen, Z. Zhang, and K. Huang, “Learning deep contextaware features overbody and latent parts for person reidentification,” in Proc. CVPR, 2017, pp. 384–393. 120
[5] J. Xu, R. Zhao, F. Zhu, H. Wang, and W. Ouyang, “Attentionaware compositionalnetwork for person reidentification,” in Proc. CVPR, 2018, pp. 2119–2128. 120, 122
[6] L. Zhao, X. Li, Y. Zhuang, and J. Wang, “Deeplylearned partalignedrepresentations for person reidentification,” in Proc. ICCV, 2017, pp. 3219–3228.120, 122
[7] Z. Zheng, L. Zheng, and Y. Yang, “Pedestrian alignment network for largescaleperson reidentification,” IEEE Transactions on Circuits and Systems for VideoTechnology, vol. 29, no. 10, pp. 3037–3045, 2018. 120
[8] X. Zhang, H. Luo, X. Fan, W. Xiang, Y. Sun, Q. Xiao, W. Jiang, C. Zhang, and J. Sun,“Alignedreid: Surpassing humanlevel performance in person reidentification,”arXiv preprint arXiv:1711.08184, 2017. 120
[9] H. Inoue, “Data augmentation by pairing samples for images classification,” arXivpreprint arXiv:1801.02929, 2018. 120, 121
[10] Z. Zhong, L. Zheng, G. Kang, S. Li, and Y. Yang, “Random erasing dataaugmentation,” in Proc AAAI Conf, 2020, pp. 0–0. 120, 121, 122, 126
[11] A. BedagkarGala and S. K. Shah, “A survey of approaches and trends in person reidentification,” IMAGE VISION COMPUT, vol. 32, no. 4, pp. 270–286, 2014. 122
[12] D. Wu, S.J. Zheng, X.P. Zhang, C.A. Yuan, F. Cheng, Y. Zhao, Y.J. Lin, Z.Q.Zhao, Y.L. Jiang, and D.S. Huang, “Deep learningbased methods for personreidentification: A comprehensive review,”Neurocomputing, vol. 337, pp. 354–371,Apr. 2019. [Online]. Available: https://doi.org/10.1016/j.neucom.2019.01.079 122
131

Soft Biometrics Analysis in Outdoor Environments
[13] G. Chen, J. Lu, M. Yang, and J. Zhou, “Spatialtemporal attentionaware learningfor videobased person reidentification,” IEEE Transactions on Image Processing,vol. 28, no. 9, pp. 4192–4205, 2019. 122
[14] L. Zhang, Z. Shi, J. T. Zhou, M.M. Cheng, Y. Liu, J.W. Bian, Z. Zeng, and C. Shen,“Ordered or orderless: A revisit for video based person reidentification,” IEEETPAMI, 2020. 122
[15] L. Cheng, X.Y. Jing, X. Zhu, F. Ma, C.H. Hu, Z. Cai, and F. Qi, “Scalefusion framework for improving videobased person reidentification performance,”Neural Computing and Applications, pp. 1–18, 2020. 122
[16] F. Yang, K. Yan, S. Lu, H. Jia, X. Xie, and W. Gao, “Attention driven person reidentification,” Pattern Recognition, vol. 86, pp. 143–155, 2019. 122
[17] C. Zhou and H. Yu, “Maskguided region attention network for person reidentification,” in PacificAsia Conference on Knowledge Discovery and DataMining. Springer, 2020, pp. 286–298. 122
[18] M. Denil, L. Bazzani, H. Larochelle, and N. de Freitas, “Learning where to attendwith deep architectures for image tracking,”Neural Comput., vol. 24, no. 8, pp. 2151–2184, 2012. 122
[19] Z. Zheng, L. Zheng, and Y. Yang, “Unlabeled samples generated by gan improve theperson reidentification baseline in vitro,” in Proc. ICCV, 2017, pp. 3754–3762. 122
[20] J. Liu, B. Ni, Y. Yan, P. Zhou, S. Cheng, and J. Hu, “Pose transferrable person reidentification,” in Proc. CVPR, 2018, pp. 4099–4108. 122
[21] A. Borgia, Y. Hua, E. Kodirov, and N. Robertson, “Ganbased poseaware regulationfor videobased person reidentification,” in 2019 IEEE Winter Conference onApplications of Computer Vision (WACV). IEEE, 2019, pp. 1175–1184. 122
[22] Y. Lin, Y. Wu, C. Yan, M. Xu, and Y. Yang, “Unsupervised person reidentificationvia crosscamera similarity exploration,” IEEE Transactions on Image Processing,vol. 29, pp. 5481–5490, 2020. 122
[23] L. Wei, S. Zhang, W. Gao, and Q. Tian, “Person transfer gan to bridge domain gapfor person reidentification,” in Proc. CVPR, 2018, pp. 79–88. 122, 126, 127, 129
[24] K. He, G. Gkioxari, P. Dollár, and R. Girshick, “Mask rcnn,” in Proc. IEEE ICCV,2017, pp. 2961–2969. 124, 126
[25] S. Suzuki et al., “Topological structural analysis of digitized binary images by borderfollowing,” Computer vision, graphics, and image processing, vol. 30, no. 1, pp. 32–46, 1985. 124
[26] A. Telea, “An image inpainting technique based on the fast marching method,” J.Graph. Tools, vol. 9, no. 1, pp. 23–34, 2004. 125
132

Soft Biometrics Analysis in Outdoor Environments
[27] H.S. Fang, S. Xie, Y.W. Tai, and C. Lu, “Rmpe: Regional multiperson poseestimation,” in Proc. ICCV, 2017, pp. 2334–2343. 125
[28] T. Zhang, R. Ramakrishnan, and M. Livny, “Birch: an efficient data clusteringmethod for very large databases,” ACM sigmod record, vol. 25, no. 2, pp. 103–114,1996. 125, 128
[29] J. MacQueen et al., “Some methods for classification and analysis of multivariateobservations,” in Proceedings of the fifth Berkeley symposium on mathematicalstatistics and probability, vol. 1, no. 14. Oakland, CA, USA, 1967, pp. 281–297.125
[30] D. Sculley, “Webscale kmeans clustering,” in Proceedings of the 19th internationalconference on World wide web, 2010, pp. 1177–1178. 125
[31] A. Y. Ng, M. I. Jordan, and Y. Weiss, “On spectral clustering: Analysis and analgorithm,” in Advances in neural information processing systems, 2002, pp. 849–856. 125
[32] H. Luo, Y. Gu, X. Liao, S. Lai, and W. Jiang, “Bag of tricks and a strong baseline fordeep person reidentification,” in Proc. CVPRW, 2019, pp. 0–0. 125, 126, 127
[33] D. Li, Z. Zhang, X. Chen, and K. Huang, “A richly annotated pedestrian dataset forperson retrieval in real surveillance scenarios,” IEEE T IMAGE PROCESS, vol. 28,no. 4, pp. 1575–1590, 2018. 126, 127
[34] L. Zheng, L. Shen, L. Tian, S. Wang, J. Wang, and Q. Tian, “Scalable person reidentification: A benchmark,” in Proc. IEEE ICCV, 2015, pp. 1116–1124. 126, 127,129
[35] X. Fan, W. Jiang, H. Luo, and M. Fei, “Spherereid: Deep hypersphere manifoldembedding for person reidentification,” J VIS COMMUN IMAGE R., vol. 60, pp.51–58, 2019. 126
[36] Z. Zheng, L. Zheng, and Y. Yang, “A discriminatively learned cnn embedding forperson reidentification,” ACM TOMM, vol. 14, no. 1, p. 13, 2018. 126
[37] Y. Sun, L. Zheng, Y. Yang, Q. Tian, and S. Wang, “Beyond part models: Personretrieval with refined part pooling (and a strong convolutional baseline),” in Proc.ECCV, 2018, pp. 480–496. 126
[38] S. Ren, K. He, R. Girshick, and J. Sun, “Faster rcnn: Towards realtime objectdetection with region proposal networks,” in Advances in neural informationprocessing systems, 2015, pp. 91–99. 127
[39] P. F. Felzenszwalb, R. B. Girshick, D.McAllester, andD. Ramanan, “Object detectionwith discriminatively trained partbased models,” IEEE TPAMI, vol. 32, no. 9, pp.1627–1645, 2009. 127
133

Soft Biometrics Analysis in Outdoor Environments
[40] K. Musgrave, S. Belongie, and S.N. Lim, “A metric learning reality check,” arXivpreprint arXiv:2003.08505, 2020. 127
[41] K. Roth, B. Brattoli, and B. Ommer, “Mic: Mining interclass characteristics forimproved metric learning,” in Proc. ICCV, 2019, pp. 8000–8009. 127
[42] W. Kim, B. Goyal, K. Chawla, J. Lee, and K. Kwon, “Attentionbased ensemble fordeep metric learning,” in Proc. ECCV, 2018, pp. 736–751. 127
[43] F. Cakir, K. He, X. Xia, B. Kulis, and S. Sclaroff, “Deep metric learning to rank,” inProc. CVPR, 2019, pp. 1861–1870. 127
[44] X. Wang, X. Han, W. Huang, D. Dong, and M. R. Scott, “Multisimilarity loss withgeneral pair weighting for deep metric learning,” in Proc. CVPR, 2019, pp. 5022–5030. 127
[45] H.Wang, Y.Wang, Z. Zhou, X. Ji, D.Gong, J. Zhou, Z. Li, andW.Liu, “Cosface: Largemargin cosine loss for deep face recognition,” in Proc. CVPR, 2018, pp. 5265–5274.127
[46] Q. Qian, L. Shang, B. Sun, J. Hu, H. Li, and R. Jin, “Softtriple loss: Deep metriclearning without triplet sampling,” in Proc. ICCV, 2019, pp. 6450–6458. 127
[47] M. M. Kalayeh, E. Basaran, M. Gökmen, M. E. Kamasak, and M. Shah, “Humansemantic parsing for person reidentification,” in Proc IEEE CVPR, 2018, pp. 1062–1071. 127
[48] Z. Zhong, L. Zheng, Z. Zheng, S. Li, and Y. Yang, “Camstyle: A novel dataaugmentation method for person reidentification,” IEEE T IMAGE PROCESS,vol. 28, no. 3, pp. 1176–1190, 2018. 127
[49] W. Li, X. Zhu, and S. Gong, “Harmonious attention network for person reidentification,” in Proc. CVPR, 2018, pp. 2285–2294. 127
[50] A. Khatun, S. Denman, S. Sridharan, and C. Fookes, “Semantic consistency andidentity mapping multicomponent generative adversarial network for person reidentification,” in The IEEEWinter Conference on Applications of Computer Vision,2020, pp. 2267–2276. 129, 130
[51] Q. Zhou, B. Zhong, X. Lan, G. Sun, Y. Zhang, B. Zhang, and R. Ji, “Finegrainedspatial alignment model for person reidentification with focal triplet loss,” IEEETransactions on Image Processing, vol. 29, pp. 7578–7589, 2020. 129, 130
[52] Z. Zhong, L. Zheng, D. Cao, and S. Li, “Reranking person reidentification with kreciprocal encoding,” in Proc. CVPR, 2017, pp. 1318–1327. 129
[53] Z. Zeng, Z. Wang, Z. Wang, Y. Zheng, Y.Y. Chuang, and S. Satoh, “Illuminationadaptive person reidentification,” IEEE Trans. Multimed., 2020. 130
134

Soft Biometrics Analysis in Outdoor Environments
[54] Y.S. Chang, M.Y. Wang, L. He, W. Lu, H. Su, N. Gao, and X.A. Yang, “Jointdeep semantic embedding andmetric learning for person reidentification,” PatternRecognit. Lett., vol. 130, pp. 306–311, 2020. 130
[55] Y. Ge, Z. Li, H. Zhao, G. Yin, S. Yi, X. Wang et al., “Fdgan: Poseguided featuredistilling gan for robust person reidentification,” inAdvances in neural informationprocessing systems, 2018, pp. 1222–1233. 130
[56] Z. Wang, J. Jiang, Y. Wu, M. Ye, X. Bai, and S. Satoh, “Learning sparse and identitypreserved hidden attributes for person reidentification,” IEEE Transactions onImage Processing, vol. 29, no. 1, pp. 2013–2025, 2019. 130
[57] Y. Yuan, W. Chen, Y. Yang, and Z. Wang, “In defense of the triplet loss again:Learning robust person reidentificationwith fast approximated triplet loss and labeldistillation,” in Proc. CVPRW, 2020, pp. 354–355. 130
[58] Z. Chang, Z. Qin, H. Fan, H. Su, H. Yang, S. Zheng, and H. Ling, “Weighted bilinearcoding over salient body parts for person reidentification,” Neurocomputing, vol.407, pp. 454–464, 2020. 130
[59] M. Jiang, C. Li, J. Kong, Z. Teng, and D. Zhuang, “Crosslevel reinforced attentionnetwork for person reidentification,” Journal of Visual Communication and ImageRepresentation, p. 102775, 2020. 130
[60] S. Liu, T. Si, X. Hao, and Z. Zhang, “Semantic constraint gan for person reidentification in camera sensor networks,” IEEE Access, vol. 7, pp. 176 257–176 265,2019. 130
[61] W. Zhang, L. Huang, Z. Wei, and J. Nie, “Appearance feature enhancement forperson reidentification,” Expert Systems with Applications, p. 113771, 2020. 130
[62] Y. Tang, X. Yang, N. Wang, B. Song, and X. Gao, “Person reidentificationwith feature pyramid optimization and gradual background suppression,” NeuralNetworks, vol. 124, pp. 223–232, 2020. 130
[63] F. Chen, N. Wang, J. Tang, D. Liang, and H. Feng, “Selfsupervised dataaugmentation for person reidentification,” Neurocomputing, 2020. 130
[64] M. Ye, J. Shen, G. Lin, T. Xiang, L. Shao, and S. C. Hoi, “Deep learning for personreidentification: A survey and outlook,” arXiv preprint arXiv:2001.04193, 2020.130
135

Soft Biometrics Analysis in Outdoor Environments
136

Soft Biometrics Analysis in Outdoor Environments
Chapter 7
You Look So Different! Haven’t I Seen You aLong Time Ago?
Abstract. Person reidentification (reid) aims to match a query identity (ID) to anelement in a gallery, collected from multiple cameras. Most of the existing reid methodsare trained and evaluated under shortterm settings, where the query subjects appearwith the same clothes in the gallery. In this setting, the learned feature representationsare dominated by the visual appearance of clothes, which considerably drops theidentification accuracy for longterm settings. To alleviate this problem, we proposea model that learns the longterm representations of persons by ignoring the featurespreviously learned by a shortterm reid method and naturally makes it invariant toclothing styles. We first synthesize a set in which we distort the most relevant biometricinformation of people (face, body shape, height, andweight) and keep the shortterm cues(color and texture of clothes) unchanged. This way, while the original data expresses boththe IDrelated and all varying features, the synthesized representations are composedmostly of shortterm attributes – e.g., color and texture of clothes. Following this idea, thekey to obtaining stable longterm representations is to learn embeddings of the originaldata that maximize the dissimilarity with the shortterm embeddings. In practice, wefirst use the synthetic data to learn a model that embeds the IDunrelated features andthen learn a second model from the original data, where the longterm embeddingsare extracted in such a way to be independent of the previously obtained IDunrelatedfeatures. Our experiments were performed on two challenging clothchanging sets (LTCCand PRCC) and our results support the effectiveness of the proposed method, whichadvances the stateoftheart for both short and longterm reid.
7.1 Introduction
Retrieving a query identity from a gallery of people with consistent clothingstyle,across a distributed camera network is known as shortterm person reidentification(reid) [1]. Being inherently a challenging task, shortterm reid has been the topic ofsubstantial research for more than a decade, with several datasets announced [2; 3],methods proposed [4; 5], and multiple surveys published [5–8]. In this problem,the major challenges are the variations in body pose, varying illumination, occlusions,camera resolution, and viewing angle. Therefore, in clothconsistent setting, theassumption is to obtain representations that are mostly based on the clothing texturesand colors. However, reidentifying people formbiological traits rather than any transientappearance characteristics is more challenging [9]. Shortterm reid methods are knownto substantially degrade their performance under clothchanging scenarios [10], which
137

Soft Biometrics Analysis in Outdoor Environments
Figure 7.1: Main motivation of the proposed work. Shortterm person reid methods rely onappearance features that are likely to converge towards ”Manifold 1”, inwhich sampleswith similarclothes appear nearby. Instead, our goal is to obtain an embedding such as ”Manifold 2”, wheresamples of different persons appear together, regardless of their clothing styles. Best viewed incolor.
provides the main motivation for this work: it is crucial to develop reid models that arenaturally invariant to clothing features such as colors, textures, shapes, and styles.As illustrated in Fig. 7.1, in longterm person reid settings, the model should recognizeinstances of the same person after long periods (several weeks or months), with theassumption that the query subject might be wearing different clothes than any instanceof the gallery. Recently, some models proposed to learn clothindependent features, byeither generating peoplewith different clothing patterns [10; 11] or extracting shapebasedbody features [12; 13]. Other authors assumed specific constraints (e.g., constant walkingpatterns [14], moderate clothing changes [13], and visible facial images [15]), attemptingto learn IDsensitive embeddings by changing the clothes colors/patterns. In opposition,other works exclusively focused in the bodyshape or facial attributes [13; 15], most ofwhich reported to have poor generalization capabilities.Learning robust features is a key factor in longterm person reid. Robustness refers to 1)the extraction of discriminative features from interperson samples and 2) being invariantto intraperson attribute variations. Although the crossentropy loss function optimizesthe reid model for these criteria, high variations in the intraperson samples hinder themodel from learning useful longterm representations and lead to learning a manifoldsimilar to ”manifold 1” illustrated in Fig. 7.1.Based on our analysis, we concluded that the key to mitigating the above problemsis to keep the visual appearance information that are useful (face, body shape, bodyfigure, height, gender) while disregarding any other IDunrelated features (clothing stylesand background features). This paper proposes a framework that firstly transforms theoriginal learning data in a way to help the model to infer IDunrelated features (i.e.,shortterm). At a second step, a longterm embedding is learned by minimizing thecorrelation between the inferred features and the previously obtained shortterm featurerepresentations, according to a cosine similarity loss.The main contributions of this paper are as follows:
138

Soft Biometrics Analysis in Outdoor Environments
• We discuss the person reid problem under the longterm scenario, which is up tothe moment rarely seen in the literature.
• We propose an image transformation pipeline that helps the imagebased reidmodels to disregards background and clothingbased features.
• We propose a framework that reidentifies people based on their face and softbiometrics (e.g., body shape), while automatically disregarding any changeablevisual appearance features (e.g., clothes). Moreover, at the inference time, oursolution does not depend on any kind of additional labeling information, such asbody masks or keypoints.
• The proposed framework implicitly disentangles the shortterm and longtermrepresentations using the cosine similarity measure. Hence, the proposed strategycould be applied to other object recognition tasks.
7.2 Related work
Most of the prior person reid studies assume that the query persons wear the same outfitsin the gallery set [8]. However, this assumption is not always valid and leads to poorperformance when applied to longterm reid settings. In this paper, we focus on a realworld scenario, when people may appear with different clothes, and refer the readers to[5; 8] for discussions on the representative works of the shortterm person reid.As an early study in the context of longterm reid, Zhang et al. [14] proposes a videobased reid technique based on the body motion to address the challenge of personappearance variations. In this work, the authors applied local descriptors (i.e., Histogramof Optical Flow and Motion Boundary Histogram) to capture the latent motion cuesof a person’s walking style and relative motion between feature points, based on thehypothesis that persons’ movement follows a consistent pattern. Although this methodcaptures some finegrained gait features, it disregards the useful appearance featuresrelated to the bodyshape and head area.In [15], the authors focused solely on scenarios where the face is clearly visible. Theproposedmodel processes two persons’ pictures and uses the face area to yield the personID and detects whether the subject has different clothes based on the body area or not.However, the high resolution face shots are rarely available in the surveillance data,which leads to an undesirable performance of the stateoftheart face recognitionmodels.So, coupling a shortterm reid model equipped to a face reid branch cannot obtainsatisfactory results [1; 13]. Later, [13] performed a casestudy, in which the individualschange their clothes, such that the overall body shape is preserved. In other words, theauthors proposed a reidmodel based on the person’s contour sketches to ignore the colorbased features and demonstrate the importance of the bodyshape in longterm personreid. In order to enhance the performance of the deepbased longterm person reid, onestrategy would be to increase the learning data, such that each subject wears numerousdifferent clothes. As collecting such a dataset on a large scale demands expensive
139

Soft Biometrics Analysis in Outdoor Environments
gathering and annotation processes, some studies proposed applying generative models.In this context, inspired by a poseinvariant generative reid model [16], Yu et al. [10]proposed a clothing simulator model to synthesize more samples for each ID with severaldifferent clothing styles. The authors applied a bodyparsing technique on the image tomask out the clothes area and trained a generative model to reconstruct the clothes areadifferently. Afterward, another model used both the original image and the reconstructedimage to learn the differences (clothes area). Although this method has tried to decreasethe clothing change effects, it has some drawbacks: 1) segmentation clothing area is itselfa challenging task in computer vision and yet cannot yield reliable results on the realworld human surveillance data, 2) this method neglects the feature similarities in thebackground area, 3) the shape of the clothing styles (e.g., short dress and longdress) highlyaffects the final feature representation of the persons, which has been neglected.In another generativebased study [12], the authors proposed an adversarial learningbased model to ignore the color features and focused solely on the bodyshape features.To derive the bodyshape representation, the authors extracted image features in RGBand greyscale modes and fed them into a feature discriminator to distinguish betweenthe RGB and greyscale feature sets. Supposing that another image of the same personcontains similar bodyshape features, the authors concatenated the greyscale featuresof a first bodypose with the RGB features of a second bodypose. Then, they trained agenerator to reconstruct an RGB image with the first bodypose.With an assumption that the bodyshape is a reliable softbiometric for longterm reidscenarios, Qian et al. [1] used the human joint coordinates to model the relations amongthem by two scalar numbers in xaxis and yaxis directions. Next, these scalars were usedto generate the shapebased features that their difference with the imagebased featurescould result in a shapesensitive feature representation of the input sample. [1] relieson capturing the information of the bodyjoints coordinates; however, [13] shows that thecontour sketch of the body has useful information which cannot be inferred from the bodykeypoints.Based on the abovementioned review on the recent studies, a longterm person reidmodelmay extract useful information from headneck area, fullbody soft biometrics, andbodyshape characteristics. In the next section, we explain how our model captures thesedata and disregards the shortterm features.
7.3 Proposed method
The proposed Longterm, Shortterm features Decoupler (LSD) framework is an imagebased person reid network that extracts longterm discriminative representations ofpeople that are invariant to clothes and background changes. The LSD framework isdeveloped in four phases: preprocessing, learning shortterm embeddings (IDunrelatedfeatures), learning the longterm embeddings (IDrelated features), and inferring thelongterm feature representations of people. In the preprocessing phase, we generate asynthesized dataset, in which we apply several image transformations on each sample of
140

Soft Biometrics Analysis in Outdoor Environments
the original learning set to distort the visual identity cues such as facial area, body figure,height, weight, and gender (see Fig. 7.2 and Fig. 7.3). Then, in the first learning phase,we train an auxiliary model, named as ShortTerm Embedding Convolutional NeuralNetwork (STECNN), on the synthesized data to extract the IDunrelated embeddingsof each instance. In the next learning phase, we use a cosine similarity loss function inthe learning phase of a second model, called LongTerm Embedding CNN (LTECNN),to learn from the original images such that the learned embeddings are dissimilar tothe IDunrelated embeddings. This way, the LTECNN model captures the embeddingsof the identity cues that are unchangeable during long time intervals and disregards theattributes that are more prone to change e.g., clothing style, accessories and background.In the evaluation phase, we only use the LTECNN model to infer the longtermrepresentations of people. This denotes that training the STECNNmodel andgeneratingsynthesized data are auxiliary steps that enhances the learning quality of the LTECNNmodel and are skipped in the inference phase. Meanwhile, the evaluation process of theLTECNN model is similar to the typical reid models: the gallery samples are rankedbased on the similarity between the longterm representations of the gallery and queryinstances.It is worth noting that the STECNN and LTECNN are regular deep architectures (e.g.,resnet50) that extract the global features of the input data, and the given names are toprovide the reader with a feeling about their functionality; therefore, both the STECNNand LTECNN may have an identical architecture, but are different in terms of the inputdata and loss function.
7.3.1 Preprocessing: Image Transformation Pipeline
In the proposed LSD model, the STECNN must learn the embeddings unrelated to thesubject’s ID, such as clothes and background features. This section describes the variousimage processing steps applied to the original learning set to remove the ID cues andgenerate the learning data for the STECNN model. Fig. 7.2 gives an overview of theimage transformation pipeline and Fig. 7.3 shows some examples of several synthesizedsamples. The results show that as we intended, the robust soft biometrics (such as weight,height, and body shape) have been visually distorted in the transformed images, while thebackground area and accessories have been unchanged approximately.The proposed pipeline requires the input image, the segmentation mask, and the bodykeypoints of the subject. The latter data are extracted using the stateoftheart methods,for instance, segmentation [17] and human body keypoint localization [18]. It is worthnoting that our approach does not require a perfect segmentation and localization ofthe body parts, as these data are used to roughly establish an irregular shaped region ofinterest (body contour) to be removed from the input image.We hypothesize that the head area and the overall body contour (shape) contain the mostIDrelated cues, while background, accessories, clothes texture, and clothes color result intemporary features. Therefore, we apply several transformations on each input image to(1) remove the subject ID from the scene and create a plain background, (2) generate the
141

Soft Biometrics Analysis in Outdoor Environments
Figure 7.2: Overview of the image transformation pipeline for removing the IDrelated cues.kkk, MMM , III, y, UUU , and BBB are respectively the body keypoints, binary mask, RGB image, ID label,transformed image, and reconstructed background of the person. (1) shows the reconstructionof plain backgroundBBB, (2) illustrates the steps to generate distorted foreground area UUUf , and (3)shows that IDunrelated image III is generated by overlappingUUUf overBBB. Best viewed in color.
IDunrelated foreground, for which we distort the IDrelated cues of the person body andface, (3) overlap the IDunrelated foreground on the plain background. Fig. 7.2 presentsan overview of our strategy for generating IDunrelated images. In the remainder of thissection, we explain each of these steps in detail. For simplicity, we skip the index i anduse III to denote the ith original input image,MMM to refer its corresponding, original bodymask, andKKK = (kkkx1, kkky1), (kkkx2, kkky2), ..., (kkkx17, kkky17) to show the body keypoints for thisimage.
1. To generate a plain background imageBBB, we consider the foreground area (subjectbody) using themaskMMM as themissing pixels and apply the inpaintingmethod [19]to restore the background area (see the green box in Fig. 7.2).
2. Next, we generate an IDunrelated foreground areaUUUf that contains the shorttermattributes (illustrated in a blue box in Fig. 7.2). To this end, (a) We use the bodykeypoints KKK and the fullbody maskMMM to select a headneck maskMMMh from theoriginal mask MMM . (b) In parallel, we should obtain a body contour mask MMM b, forwhich we use a method similar to the tophat morphological transformation. Theoriginal body mask MMM is first expanded using a morphological dilation operatorto obtain the maskMMMd: MMM ⊕ B =
∪d∈BMMMd; (the size of the dilation kernel B is
proportional to the size of the original mask. We used 3% of the width and heightof the mask in our experiments). Then, we use an erosion morphological operatorto shrink the body mask area: MMM ⊖ B =
∩e∈BMMM e. Next, the body contour MMM b
142

Soft Biometrics Analysis in Outdoor Environments
Figure 7.3: Samples of the synthesized data from several subjects in the LTCC dataset. Aswe intend, the visual identity cues such as face, height, weight, and body shape are distortedsuccessfully.
is obtained by taking the intersection (bitwise AND operation) between the dilatedmaskMMMd and the inversion (bitwise NOT operation) eroded body maskMMM e. (c) Afinal maskMMMf is obtained by adding (bitwise OR operation) the headneck pixelswith the body contour pixels: MMMf = MMM b +MMM e. (d) IDrelated pixels are then inpainted in the input image III using [19] to generate an image (UUU) without any identityinformation. (e) It is important to deform the overall body shape of the person (bysimulating random changes in weight, height, and clothes pattern). We apply thisdeformation to remove the remained IDrelated features. However, to preserve thebackground area from deformation, we perform the same random transformationson the maskMMM and the inpainted imageUUU ; so, in the next step, we could mask outthe body area. We use [20] followed by a random stretching in height and widthof the body area to apply some image deformations randomly. Precisely speaking,we impose a perturbation mesh on the maskMMM and image UUU to alter the subject’ssilhouette. Then, some points are selected on the mesh to distort the body shape bysome random directions and strengths; this mesh deformation is applied by linearinterpolation at a pixellevel on bothMMM andUUU . (f) Finally, the deformed foregroundareaUUUf is obtained by masking out the imageUUU t withMMM t.
3. The last transformation step in the proposed pipeline overlaps the deformedforeground regionUUUf on the backgroundBBB, yielding IDunrelated image III (see thered box in Fig. 7.2).
143

Soft Biometrics Analysis in Outdoor Environments
Fig. 7.3 shows some examples of the longterm clothchanging (LTCC) data set [1] thathave been transformed by our preprocessing pipeline due to the removal of their IDrelated cues.
7.3.2 Proposed Model: Learning Phase
Learning robust features is a key factor in longterm person reid. In the context ofthis task, robustness refers to 1) the extraction of discriminative features from interperson samples and 2) being invariant to intraperson attribute variations. Althoughthe crossentropy loss function optimizes these criteria, high variations in the intraperson samples and limited data hinder the model from learning useful longtermrepresentations. The key to enhance the quality and speed of the learning process of longterm representations of people is to focus on both distilling the identityrelated featuresand disregarding the identityunrelated features.Suppose that the learning set G = (IiIiIi, yi, cj) consists of n persons with m differentclothing styles for each person, where y. denotes the personID label, c. refers tothe clothing label, i = 1, . . . , n and j = 1, . . . ,m. By performing several imagetransformations on the learning set G, we synthesize another learning data set G =
IiIiIi, yi, cj that excludes the IDrelated visual features. This phase was described in theprevious subsection.As shown in the first learning phase in Fig. 7.4 (b), we feed the synthesized data (IiIiIi, yi, cj)to the STECNN model ϕ(G; θ) and learn labels yi, cj with a crossentropy loss function.The label yi, cj refers to the person i with the ID label yi with the clothing label cj;in other words, this network learns to distinguish between the outfits worn by personi. The extracted features of this person are denoted as shortterm features fijfijfij and arefrozen during the next learning phase, where we feed the original image of person i to asecond model. Precisely, given the original data (IiIiIi, yi, cj) and frozen shortterm featuresfijfijfij , the LTECNN model ϕ(G, θ) learns the longterm representations fff i, such that it ismathematically dissimilar to the IDunrelated feature vector fijfijfij , while simultaneouslylearns the IDrelated features, using an aggregation loss function:
LLTE =
n∑i=1
fff i.fff ij
∥fff i∥∥fff ij∥+
n∑i=1
ti log(si), (7.1)
where n is the number of person IDs in the learning set, ti is the groundtruth personID (label), and si denotes the predicted probability score of person i. In equation 1, thecosinesimilarity term minimizes the similarity between the shortterm and longtermfeatures, while the crossentropy term helps the LTECNN learn the person ID.Finally, in the inference phase, we only use LTECNN model ϕ(G, θ) to extract the longterm representations of the query and gallery data. Next, similar to the shortterm personreid methods, the gallery set is ordered based on the euclidean distances between thequery and gallery samples. Then, the Cumulative Matching Characteristics (CMC) andMean Average Precision (mAP) metrics are reported as the evaluation criteria.
144

Soft Biometrics Analysis in Outdoor Environments
Figure 7.4: Overview of the learning phase of the proposed model. In the offline learning phase,the STECNNmodel receives a transformed image IiIiIi and extracts its shortterm embeddings (IDunrelated) fijfijfij . Then, the longterm representation (IDrelated) of the original image IiIiIi is obtainedby minimizing the similarity between the longterm feature vector fififi and the frozen shorttermembeddings fijfijfij . The magnified box shows the images of one person with three different clothesand indicates that howLTECNN loss function helps to learn the identity of the person (blue traces)and disregard clothing features (red traces). IiIiIi refers to the original image of person iwith clothingstyle j, and IiIiIi is the IDunrelated version of IiIiIi. Best viewed in color.
7.4 Experiments and Discussion
7.4.1 Datasets
The LongTerm clothchanging (LTCC) Person Reidentification dataset [1] was collectedusing a CCTV system with 12 cameras installed on different floors in an office building. Itcomprises 24 hours of video recording that were collected over two months. As a result,persons were appeared with substantial changes in lighting, viewing angle, and body pose.The authors used the MaskRCNN framework [17] to extract the person bounding boxesfrom video frames and then annotated each bounding box with a person ID and clothinglabel. The LTCC dataset comprises 17,138 images from 152 identities with 478 outfits, andon average, each person appears with five different clothing outfits. The LTCC dataset ispublicly available in two subsets: 1) training subset with 77 individuals, where 46 subjectsare wearing different clothes and 31 elements appear with identical garments. 2) testingsubset with 76 persons, where 46 people appear with different outfits and 30 individualsare wearing the same clothes.The PersonReidentification byContour Sketch (PRCC) dataset [13]was captured indoorsusing three cameras positioned in separate rooms. The PRCC dataset consists of 221identities and a total of 33,698 images. In two camera views, the subjects wear the sameclothes, while on the other camera, the garments change. Therefore, there are precisely
145

Soft Biometrics Analysis in Outdoor Environments
two different clotheschanges per subject.We trained and evaluated our model on the LTCC [1] and PRCC [13] longterm reiddatasets, as both comprise realworld data recorded with cameras and are large enough tobe suitable for deep architectures. These datasets are publicly available in train and testsplits, and there is no overlap between the subjects in the test and train sets. We followedthe same evaluation settings in the original papers [1; 13] to have a fair comparison.
MethodsStandard Setting ClothChanging Setting
R1 R5 R10 R50 mAP R1 R5 R10 R50 mAPLOMO [21] + KISSME [22] 26.6 9.1 10.8 5.3LOMO [21] + NullSpace [23] 34.8 11.9 16.5 6.3resnet50 [24]∗ 9.4 23.2 31.3 59.8 5.9 22.9 43.0 53.9 77.7 9.8Luo et al. [25]∗ 25.8 47.5 57.2 80.6 10.2 11.7 23.8 33.4 62.9 5.9resnet50 [24] 49.7 64.9 70.4 86.6 19.7 18.1 32.4 38.8 59.2 8.1seresnext [26] 48.3 64.1 71.4 85.4 19.0 20.4 34.2 44.1 63.8 9.3senet [26] 54.6 70.0 77.9 87.2 21.2 24.2 36.6 45.2 62.0 9.4resnet50ibna [27] 55.4 69.2 74.4 86.2 23.3 23.7 35.7 42.1 64.0 10.4HACNN [28] 60.2 26.8 21.9 9.3MuDeep [29] 61.9 27.5 23.5 10.2Luo et al. [25] 60.2 74.0 80.1 88.8 25.6 24.2 40.6 51.5 71.2 11.3Qian et al. [1] 71.4 34.3 26.2 12.4Ours (LSD) 72.2 80.3 84.6 91.9 31.0 31.4 46.7 54.3 73.5 13.6LSD + reranking [30] 76.7 83.6 85.2 91.9 44.9 41.1 53.6 57.7 74.0 19.5
Table 7.1: Results on the LTCC data set. The method performance on head patches is denoted by∗ symbol.
7.4.2 Implementation Details
We processed the original image III using the offtheshelf Mask RCNN [17] and AlphaPose [18] models with default configurations1 and prepared the inputs of the preprocessing pipeline i.e., KKK and MMM . The dilation and erosion transformations wereperformed using a kernel (filter), with a size that is proportional to 3% of the image width.The inpainting technique [19] was also used in its default configurations2 using the pretrained weights on the Places2 dataset [31].The proposed framework, including the STECNN and LTECNN, can be implementedusing any CNN architecture as feature extractors. In this paper, we implementedthe proposed model based on residual CNNs using the Pytorch library to evaluate theeffectiveness of our method. We started the training phases by finetuning the ImageNetpretrained weights, using the Adam optimizer [32], for 250 epochs. The input imageswere 256×128 for both networks, i.e., STECNN and LTECNN. Formore implementationdetails, we refer the readers to the project page at https://github.com/canarybird33/YouLookDifferent.
1https://github.com/matterport/Mask_RCNN, https://github.com/MVIG-SJTU/AlphaPose2https://github.com/Atlas200dk/sample-imageinpainting-HiFill
146

Soft Biometrics Analysis in Outdoor Environments
MethodsCameras A and C (different clothes) Cameras A and B (same clothes)R1 R10 R20 mAP R1 R10 R20 mAP
[21] + [22] 18.6 49.8 67.3 47.4 81.4 90.4 [33] + [34] + [21] 23.7 62.0 74.5 54.2 84.1 91.2 resnet50 [24] 24.1±10.8 56.9±2.4 68.5±3.3 35.3±6.6 76.3±5.0 94.0±1.6 97.4±0.6 82.6±3.8
seresnext101 [26] 27.7±1.7 57.6±6.6 70.3±3.5 37.8±2.1 69.1±8.9 94.4±4.0 97.6±2.2 78.4±5.1
senet [26] 27.2±4.7 54.5±4.9 66.9±1.7 36.6±3.2 76.7±4.6 96.0±1.7 97.9±0.6 83.9±2.6
resnetibna [27] 32.9±6.7 67.2±4.7 81.6±3.7 44.1±5.0 84.8±3.6 98.3±1.5 99.5±0.4 89.8±2.0
HACNN [28] 21.8 59.5 67.5 82.5 98.1 99.0 PCB [35] 22.9 61.2 78.3 86.9 98.8 99.6 DCN [36] 26.0 71.7 85.3 61.9 92.1 97.7 STN [37] 27.5 69.5 83.2 59.2 91.4 96.1 Yang et al. [13] 34.4 77.3 88.1 64.2 92.6 96.7 Ours (LSD) 37.2±6.7 68.7±2.0 80.5±4.1 47.6±3.4 93.6±1.7 99.5±0.6 99.8±0.1 95.8±1.1
Ours + reranking 42.7±4.2 71.2±3.5 81.5±2.4 52.2±2.2 97.9±0.4 99.8±0.0 99.9±0.0 98.7±0.1
Table 7.2: Results for two settings of the PRCC data set: 1) when the query person appearswith different clothes in the gallery set (at leftside), 2) when the query’s outfit is not changedin the gallery set (at leftside). The locally performed evaluations were repeated 10 times, and thevariances from the mean values were shown by ±.
7.4.3 Results
7.4.3.1 LTCC Dataset
To evaluate ourmodel on theLTCCdataset [1], we considered the two settings suggested inthe original paper [1]: 1) standard setting, in which we ignore those images of the gallerythat have captured from the same person and same camera. 2) clothchanging setting,where the images of the same personwith identical clothes capturedwith the same cameraare discarded from the gallery before ranking the gallery elements based on the queryperson.We provide a comparison between our model performance to several baselines in Table7.1. In general, our model shows superior performance for both the evaluation metrics:mAP and CMC for ranks 1 to 50.As shown in the middle column of Table 7.1, in standard evaluation setting, the handcrafted based methods can extract better feature representations (from fullbody imagesof persons) in comparison with simple baselines [24; 25], when simple baselines arelearned based on the face/head patches. In the next performance level, resnet50ibna [27] achieves 55.4% and 23.3% of rank1 and mAP, respectively; these numbersimprove by the shortterm reid baselines, specifically to 61.9% and 27.5% by [29]. Asa longterm reid framework, Qian et al. [1] presents competitive results (71.4%/34.3%of rank1/mAP) compared to our method without reranking (72.2%/31.0% of rank1/mAP). However, by applying the reranking technique [30] on our results, our methodconsistently outperforms the other competitors and achieves 76.7%/44.9% of rank1/mAP.InTable 7.1 section clothchanging evaluation setting, it is noticeable that the performanceof the shortterm reid methods [25; 28; 29] roughly degrades to their onethird, whichdenote that these methods heavily rely on the color and texture of the clothes to reidpeople. It is also interesting that a resnet50 model could extract more useful longterm
147

Soft Biometrics Analysis in Outdoor Environments
Figure 7.5: Visualization of the longterm representations, according to tSNE [38], for six IDswith varying clothes (LTCC test set). The data related to each person are presented in a differentcolor, and variety in outfits is denoted by different markers. Best viewed in color.
information from headshots (22.9%/9.8% of rank1/mAP) rather than fullbody images18.1%/8.1% of rank1/mAP, whereas the shorttermmodel [25] fails in the headshot longterm reid setting, by achieving 24.2%/11.3% of rank1/mAP from the fullbody imagesand obtaining 11.7%/5.9% of rank1/mAP from the head patches. In the clothchangingcontext, our method obtains better reid results with 31.4%/13.6% of rank1/mAP beforethe reranking process and 41.1%/19.5%of rank1/mAP after reranking the reid retrievallist, which indicates the superiority of our approach in comparison with all the othermethods, specifically [1] that achieves 26.2%/12.4% of rank1/mAP.Fig. 7.5 shows tSNE [38] visualization of longterm representations provided with ourproposed method for several persons from the LTCC test set that are wearing variousclothing outfits. The representations related to consecutive frames of the same personwith the same clothes are not close to each other, indicating that our method does not relyon the appearance similarity to reidentify people.
7.4.3.2 PRCC Dataset
As previously mentioned, the PRCC dataset was collected using three cameras, namely A,B, and C, such that the individuals’ clothes in cameras A and B are the same, while inthe camera C, subjects wear different outfits. Following the evaluation protocol in [13],we select one image of each person from camera A and build a oneshot gallery, whilesamples captured by the other two cameras are considered to be as the queries for twodifferent settings: evaluation on the clothchanging and clothconsistent settings.Table 7.2 shows the performance of several baselines versus our method on the PRCCdataset. The baseline could be roughly divided to four groups: 1) methods based on thehandcrafted features [21; 22; 33; 34], 2) plain deep residual networks [24; 26; 27], 3)shortterm person reid techniques [28; 35–37], and 4) longterm reid method [13].In general, methods based on the handcrafted features obtain the lowest recognition
148

Soft Biometrics Analysis in Outdoor Environments
results, with the rank1 accuracy less than 24% and 55% in the clothchanging andstandard settings, respectively, whereas the second groupofmethods could achieve a rank1/mAP approximately between 24%/35% to 33%/44% in the clothchanging scenario andbetween 70%/78% to 85%/90% in the standardsetting. Interestingly, the shorttermreid techniques could improve the rank1 results up to 86.9%, only when the inquiryperson wears consistent clothing outfits in the gallery. When the query person appearswith different clothing styles, our method achieves 37.2%/47.6% for rank1/mAP (and42.7%/52.2% after the reranking process), while the approach presented by Yang et al.[13] obtains a rank1 accuracy of around 34.4%. Moreover, when people wear identicalclothes in the query and gallery sets, our method still outperforms all the baselines with93.6% rank1 and 95.8% mAP; these numbers could even be improved to 97.9% and98.7%, respectively, whenwe apply the reranking technique [30] on the obtained rankinglist.
7.4.3.3 Discussion
As indicated in Tables 7.1 and 7.2, the proposedmethod has improved the longterm reidaccuracy, while it can provide reliable results for shortterm reid task. Our interpretationof the superior performance of ourmethod in both tasks is that, holistic CNNs can providediscriminative representation based on the identity (rather than clothes and background)when we use an aggregation loss function, in which we learn the ID labels using a crossentropy loss termandpenalize the learning of the IDunrelated features by a similarity lossterm. In fact, learning the identity cues by an aggregation loss function implicitly preventsthe model from predicting the identity of people based on their clothes and background.Whereas, architectural based design may explicitly limit the model, which results intobetter longterm reid but worse shortterm reid accuracy.
7.5 Ablation Studies
We performed several experiments with different backbones and input image sizes toevaluate the performance of the proposed LSD model in various conditions and find thelimits of our method. The experiments in this section were carried out on the LTCCdataset, and the LSDmodel was trained for 50 epochs, and results were reported after thereranking process. The other settings remained as same as the previous experiments.Left section of Table 7.3 shows the experiment results of the LSD for five differentimage resolutions from 32 × 16 to 512 × 256 and indicates that the improvement ofthe rank1 accuracy saturates when the size of the images is increased from 256 × 128
to 512 × 256. In contrast, the mAP increases sharply in clothchanging settings, from13.7% to 17.4%. The reason behind the variation of accuracy is that, when we reducethe size of the images, some critical information (details probably) are lost permanently,whereas when we resize the images to 512 × 256, no extra detail are induced from data,probably because of the limits imposed by the imagequality of the captured data fromfar distances by the surveillance cameras . Furthermore, we trained and evaluated our
149

Soft Biometrics Analysis in Outdoor Environments
Architecture SS CCS Input Resolution SS CCSR1 mAP R1 mAP R1 mAP R1 mAP
resnet50 52.3 26.0 20.4 10.0 32× 16 21.5 9.8 8.4 4.6resnet101 47.9 24.9 17.1 10.0 64× 32 43.2 23.1 15.3 8.8resnet152 51.7 26.2 18.9 10.1 128× 64 62.5 35.6 24.7 12.7seresnet101 56.2 29.6 22.4 11.6 256× 128 70.0 39.5 35.2 13.7seresnet152 55.0 28.7 21.4 10.2 512× 256 69.8 41.4 35.7 17.4seresnext101 55.8 27.9 23.0 11.4resnet50ibna 57.8 30.0 23.7 11.5senet154 58.6 29.1 27.8 11.7
Table 7.3: The performance of the proposed LSD model with different residual backbonesand input resolutions, when trained for 50 epochs on the LTCC data set. When architecture ischanging, the input resolution is fixed to 256 × 128, and when input resolution is changing, thesenet154 architecture is used. SS and CCS stand for Standard Setting and ClothChanging Setting,respectively.
model with several different feature extraction backbones. As shown in the right sectionof Table 7.3, the seresnet models achieve better results than plain resnet methods. Theproposed framework achieves better results when implemented based on the resnet50ibna, with 57.8%/30.0% and 23.7%/11.5% of rank1/mAP for the standard and clothchanging settings, respectively. Moreover, these numbers improve to 58.6%/29.1% and27.8%/11.7%, when the senet154 model is used as the backbone feature extractor.
7.6 Conclusions
Longterm person reid aims to retrieve a query ID from a gallery, where elements areexpected to appear with different clothing, hairstyles, or additional accessories. Thisis an extremely ambitious identification setting, where the majority of the existing reid methods still have poor performance. Hence, it is critical to find alternate featurerepresentations that are naturally insensitive to shortterm reid features. Moreover,manually annotating large amounts of longterm instances for feeding supervisedclassification frameworks might be an insurmountable task, not only due to the lack ofavailable data but also to the number of human resources required for the task. Based onthese observations, this paper describes an LSD model, which its most innovative pointis to naturally learn longterm representations of persons while ignoring the typicallyvarying shortterm attributes (clothing style, body shape, and background). To thisend, we propose an image transformation pipeline over the IDrelated regions (the headand the body shape) and create a model (STECNN) that identifies the most relevantshortterm features. These representations are then separated from the longtermrepresentation via the cosine similarity loss function. The experimental results on thestateoftheart clothchanging benchmarks confirmed the effectiveness of the proposedmethod by consistently advancing the performance of the best performing techniques.
150

Soft Biometrics Analysis in Outdoor Environments
7.7 Acknowledgments
This work was supported in part by the FCT/MEC through National Funds and CoFunded bythe FEDERPT2020 Partnership Agreement under Project UIDB/50008/2020, Project POCI010247FEDER033395 and in part by operation Centro010145FEDER000019 C4 Centro deCompetências em Cloud Computing, cofunded by the European Regional Development Fund(ERDF) through the Programa Operacional Regional do Centro (Centro 2020), in the scope ofthe Sistema de Apoio à Investigação Científica e Tecnológica Programas Integrados de IC&DT.This research was also supported by ’FCT Fundação para a Ciência e Tecnologia’ through theresearch grant ’UI/BD/150765/2020’.
Bibliography
[1] X. Qian, W. Wang, L. Zhang, F. Zhu, Y. Fu, T. Xiang, Y.G. Jiang, and X. Xue, “Longtermclothchanging person reidentification,” arXiv preprint arXiv:2005.12633, 2020. 137, 139,140, 144, 145, 146, 147, 148
[2] E. Ristani, F. Solera, R. Zou, R. Cucchiara, and C. Tomasi, “Performancemeasures and a dataset for multitarget, multicamera tracking,” in Proc. IEEE ICCV. Springer, 2016, pp. 17–35.137
[3] L. Zheng, L. Shen, L. Tian, S. Wang, J. Wang, and Q. Tian, “Scalable person reidentification:A benchmark,” in Proc. IEEE ICCV, 2015, pp. 1116–1124. 137
[4] H. Luo, W. Jiang, Y. Gu, F. Liu, X. Liao, S. Lai, and J. Gu, “A strong baseline and batchnormalization neck for deep person reidentification,” IEEE Trans Multimedia, vol. 22,no. 10, pp. 2597–2609, 2020. 137
[5] M. Ye, J. Shen, G. Lin, T. Xiang, L. Shao, and S. C. Hoi, “Deep learning for person reidentification: A survey and outlook,” arXiv preprint arXiv:2001.04193, 2020. 137, 139
[6] B. Lavi, I. Ullah, M. Fatan, and A. Rocha, “Survey on reliable deep learningbased personreidentification models: Are we there yet?” arXiv preprint arXiv:2005.00355, 2020.
[7] M. O. Almasawa, L. A. Elrefaei, and K. Moria, “A survey on deep learningbased person reidentification systems,” IEEE Access, vol. 7, pp. 175 228–175 247, 2019.
[8] E. Yaghoubi, A. Kumar, and H. Proença, “Ssspr: A short survey of surveys in person reidentification,” Pattern Recognit. Lett., vol. 143, pp. 50–57, 2021. 137, 139
[9] J. Dietlmeier, J. Antony, K. McGuinness, and N. E. O’Connor, “How important are faces forperson reidentification?” arXiv preprint arXiv:2010.06307, 2020. 137
[10] Z. Yu, Y. Zhao, B. Hong, Z. Jin, J. Huang, D. Cai, X. He, and X.S. Hua, “Apparelinvariant feature learning for apparelchanged person reidentification,” arXiv preprintarXiv:2008.06181, 2020. 137, 138, 140
[11] F. Wan, Y. Wu, X. Qian, Y. Chen, and Y. Fu, “When person reidentification meets changingclothes,” in Proc. CVPRW, 2020, pp. 830–831. 138
[12] Y.J. Li, Z. Luo, X. Weng, and K. M. Kitani, “Learning shape representations for clothingvariations in person reidentification,” arXiv preprint arXiv:2003.07340, 2020. 138, 140
151

Soft Biometrics Analysis in Outdoor Environments
[13] Q. Yang, A. Wu, and W.S. Zheng, “Person reidentification by contour sketch undermoderate clothing change,” IEEE TPAMI, pp. 1–1, 2019. 138, 139, 140, 145, 146, 147, 148,149
[14] P. Zhang, Q.Wu, J. Xu, and J. Zhang, “Longterm person reidentification using true motionfrom videos,” in Proc. WACV. IEEE, 2018, pp. 494–502. 138, 139
[15] J. Xue, Z. Meng, K. Katipally, H. Wang, and K. van Zon, “Clothing change aware personidentification,” in Proc. CVPRW, 2018, pp. 2112–2120. 138, 139
[16] X. Qian, Y. Fu, T. Xiang, W. Wang, J. Qiu, Y. Wu, Y.G. Jiang, and X. Xue, “Posenormalizedimage generation for person reidentification,” in Proc. IEEE ICCV, 2018, pp. 650–667. 140
[17] K. He, G. Gkioxari, P. Dollár, and R. Girshick, “Mask rcnn,” in Proc. IEEE ICCV, 2017, pp.2961–2969. 141, 145, 146
[18] Y. Xiu, J. Li, H. Wang, Y. Fang, and C. Lu, “Pose flow: Efficient online pose tracking,” arXivpreprint arXiv:1802.00977, 2018. 141, 146
[19] Z. Yi, Q. Tang, S. Azizi, D. Jang, and Z. Xu, “Contextual residual aggregation for ultra highresolution image inpainting,” in Proc. CVPR, 2020, pp. 7508–7517. 142, 143, 146
[20] K. Ma, Z. Shu, X. Bai, J. Wang, and D. Samaras, “Docunet: Document image unwarping viaa stacked unet,” in Proc. CVPR, 2018, pp. 4700–4709. 143
[21] S. Liao, Y. Hu, X. Zhu, and S. Z. Li, “Person reidentification by local maximal occurrencerepresentation and metric learning,” in Proc. CVPR, 2015, pp. 2197–2206. 146, 147, 148
[22] A. Kittur, E. H. Chi, and B. Suh, “Crowdsourcing user studies with mechanical turk,” in ProcSIGCHI Conf Hum Factor Comput Syst, 2008, pp. 453–456. 146, 147, 148
[23] L. Zhang, T. Xiang, and S. Gong, “Learning a discriminative null space for person reidentification,” in Proc. CVPR, 2016, pp. 1239–1248. 146
[24] K. He, X. Zhang, S. Ren, and J. Sun, “Deep residual learning for image recognition,” in Proc.CVPR, 2016, pp. 770–778. 146, 147, 148
[25] H. Luo, Y. Gu, X. Liao, S. Lai, and W. Jiang, “Bag of tricks and a strong baseline for deepperson reidentification,” in Proc. CVPRW, 2019, pp. 1487–1495. 146, 147, 148
[26] J. Hu, L. Shen, and G. Sun, “Squeezeandexcitation networks,” in Proc. CVPR, 2018, pp.7132–7141. 146, 147, 148
[27] X. Pan, P. Luo, J. Shi, and X. Tang, “Two at once: Enhancing learning and generalizationcapacities via ibnnet,” in Proc. ECCV, September 2018. 146, 147, 148
[28] W. Li, X. Zhu, and S. Gong, “Harmonious attention network for person reidentification,” inProc. CVPR, 2018, pp. 2285–2294. 146, 147, 148
[29] X. Qian, Y. Fu, T. Xiang, Y.G. Jiang, and X. Xue, “Leaderbased multiscale attention deeparchitecture for person reidentification,” IEEE TPAMI, vol. 42, no. 2, pp. 371–385, 2019.146, 147
[30] Z. Zhong, L. Zheng, D. Cao, and S. Li, “Reranking person reidentification with kreciprocalencoding,” in Proc. CVPR, 2017, pp. 1318–1327. 146, 147, 149
152

Soft Biometrics Analysis in Outdoor Environments
[31] B. Zhou, A. Lapedriza, A. Khosla, A. Oliva, and A. Torralba, “Places: A 10 million imagedatabase for scene recognition,” IEEE TPAMI, vol. 40, no. 6, pp. 1452–1464, 2017. 146
[32] K. Da, “A method for stochastic optimization,” arXiv preprint arXiv:1412.6980, 2014. 146
[33] T. Ojala, M. Pietikäinen, and D. Harwood, “A comparative study of texture measures withclassification based on featured distributions,” Pattern Recognit., vol. 29, no. 1, pp. 51–59,1996. 147, 148
[34] N. Dalal and B. Triggs, “Histograms of oriented gradients for human detection,” in Proc.CVPR, vol. 1. IEEE, 2005, pp. 886–893. 147, 148
[35] Y. Sun, L. Zheng, Y. Yang, Q. Tian, and S. Wang, “Beyond part models: Person retrievalwith refined part pooling (and a strong convolutional baseline),” in Proc. ECCV, 2018, pp.480–496. 147, 148
[36] J. Dai, H. Qi, Y. Xiong, Y. Li, G. Zhang, H. Hu, and Y. Wei, “Deformable convolutionalnetworks,” in Proc. ICCV, 2017, pp. 764–773. 147
[37] M. Jaderberg, K. Simonyan, A. Zisserman, and K. Kavukcuoglu, “Spatial transformernetworks,” in Proc NIPS Volume 2, ser. NIPS’15. Cambridge, MA, USA: MIT Press, 2015,p. 2017–2025. 147, 148
[38] L. Van der Maaten and G. Hinton, “Visualizing data using tsne.” Journal of machinelearning research, vol. 9, no. 11, 2008. xvi, 148
153

Soft Biometrics Analysis in Outdoor Environments
154

Soft Biometrics Analysis in Outdoor Environments
Chapter 8
Conclusions
8.1 Summary
Ubiquitous CCTV cameras have raised the desire for human attribute estimation and person reidentification in crowded urban environments. Given that face closeshots are rarely availableat far distances, feature extraction from the body is of practical interest nowadays. However,fullbody data is accompanied by a wide background area and has more complexity in termsof viewpoint variations and occlusions. The primary solution to tackle these general challengesis to provide large learning data because deep neural networks can automatically provide adiscriminative and comprehensive feature representation from critical regions of the input data.As huge data collection and annotation is expensive, developing approaches to address datadependent challenges such as imbalanced class data in PAR tasks and clothchanging person reidis important.To study the abovementioned difficulties, in the scopes of this research, we first reviewed existingPAR and person reid approaches, including the stateoftheart architectures, recent datasets,and future directions with a focus on deep learning methods. Then, we proposed several novelframeworks for both PAR and person reid and evaluated the performance of our approaches onseveral wellknown publicly available datasets and compared our experimental results with therecent existing methods.
8.2 Summary of Contributions
The main contributions of this thesis are as follows.
• We provide a comprehensive survey on the PAR approaches and benchmarks with anemphasis on deep learning methods. We study the typical pipeline of the HAR systems,which is started by data preparation and continues with designing a model to be trainedand evaluated. We then highlight several factors that are required to be considered fordeveloping an optimal HAR framework, pointing that 1) we should design an endtoendmodel that predicts multiple attributes at once; 2) the model should extract a discriminateand comprehensive features representation from each instance of the dataset; 3) we shouldconsider the location of each attribute on the body of the person; 4) model should deal withgeneral challenges such as lowquality data, pose variation, illumination variation, clutteredbackground, and occlusion; 5) model should handle the class imbalanced data and avoidto overfit or and underfit on some classes; 6) model should manage the limiteddataproblem effectively, for example, by using data augmentation techniques or learning fromsynthesized data. Next, we propose a challengedbased taxonomy for HAR approaches andcategorize the existing methods in five general groups, based on which, we conclude thatthe most recent HAR methods study the effects of the attribute localization and attributecorrelations in the performance of themodel. Finally, we provide a comprehensive study ontheHAR benchmarks based on the data content: face, fullbody, fashion style, and syntheticdata.
155

Soft Biometrics Analysis in Outdoor Environments
• We conduct a short survey of surveys on person reid methods and propose a multidimensional taxonomy that distinguishes between person reid models, based on theirmain approach, type of learning, identification settings, the strategy of learning, datamodality, type of queries and context. Most of the existing stateoftheartmethods could bestudied under the strategy pointofview that explains architecture based methods and dataaugmentation techniques. We then discuss some privacy and security concerns caused byprocessing people’s personal data via surveillance systems. Finally, we explain some biasesand problems in the literature of person reid, such as unfair comparison of methods, loworiginality in techniques, and insufficient attention to some of the important perspectivesin the problem.
• As gender attribute is often one of the primary properties of people, we present a multibranch framework that provides a comprehensive and discriminative representation ofpersons. The proposed solution uses several posespecialized CNNs to extract the features ofdifferent regions of interest and aggregates the output scores of CNN branches. To evaluatethe performance of the model, we trained and tested the algorithm on the BIODI and PETAdatasets. Our experimental results confirm that CNNs specialized in predicting the genderattribute from images cropped by the convhull of fullbody keypoints can achieve betterresults thanCNNs thatwork on the head crops or raw fullbody images. Overall, surveillancedata have low resolutions and predicting the gender on head crops yields poor accuracy,whereas predicting from raw images suffers from interference of background features in thefinal feature representation of person.
• Inspired by our previous observations about the adverse effects of background featuresin the model performance, we propose a multiplication layer that explicitly filters thebackground features. The proposed model works with fullbody images of pedestrians thatare captured in uncontrolled environments and has a multitask architecture that yieldsmultiple soft biometrics of persons at once. The taskoriented architecture is integratedwith a weighted loss function that relativizes the importance of each class of attributes andhandles the imbalanced PAR data. The evaluation of our method on the PETA and RAPdatasets shows the superiority of the proposed framework with respect to the state of thearts.
• We propose an image transformation technique that helps to implicitly define the receptivefields of CNNs in the shorttermperson reid task. The receptive fields determine the criticalregions of the input data that are correlated with the label information. Therefore, to assistthe inference model to find the important regions efficiently, we generate a synthesizedlearning dataset in which the irrelevant (e.g., background) and important (e.g., body area)regions of the original data are swapped, and the label of the synthesized data is inheritedfrom the image that has shared its important region. This solution can be implemented asa data augmentation technique, which means that we can skip the computation expensesof the image transformation process during the inference phase. Further, our solutionpreserves the label information and is parameterlearningfree. The experimental results onseveral datasets such as RAP,Market1501, andMSMTV2 datasets confirm the effectivenessof the proposed solution for the person reid task from fullbody images in the wild.
• CNNs are dominated by the texturebased feasters, resulting in a challenge to learn longterm person reid, in which people appear with different clothes that have been seenbefore. To address this problem, we present a longterm, shortterm decoupler modelthat, regardless of the cloth and background texture, captures the identitybased featuresresulting from height, weight, body shape, and head area. To this end, we propose an image
156

Soft Biometrics Analysis in Outdoor Environments
Figure 8.1: Comparison between synthesized data of face and fullbody of persons. The two firstrows show the face examples generated using StyleGan when trained on the celebaHQ dataset.The second row illustrates the instances that StyleGan has failed to produce flawless images. Theother two rows illustrate the fullbody examples generated by StyleGan with the same settingswhen trained on the RAP dataset.
transformation chain to synthesize some data from original images such that the identitycharacteristics of a person are distorted. We then train a CNN model on the synthesizeddata to obtain the IDunrelated feature of each instance of the learning set. Latter, wetrain another CNNmodel on the original data and use the IDunrelated features in a cosinesimilarity loss function to focus on learning the IDrelated features. This way, in the trainingphase, the model learns that the background and clothing texture is not correlated to theidentity of the person. Therefore, in the inference phase, we only use the second model(and skip the image transformation processes) to predict the identity of the query person.The experimental results on the clothchanging benchmarks (PRCC and LTCC) confirm thesuperiority of the proposed solution compared to the state of the arts.
8.3 Future Research Directions
PAR and person reid fields of study are at early stages, and there are many possibilities for futureworks. In the following, we enumerate some future directions that are rarely discussed in theliterature.
157

Soft Biometrics Analysis in Outdoor Environments
Figure 8.2: A rough example of a visually interpretable PAR model with an extra head to showthe active receptive fields when making a prediction.
8.3.1 Limited Data
Deep neural networks require massive learning data to improve their performance. However, theprocess of data collection and annotation is costly and timeconsuming. Recently, generativemodels have shown impressive evolution in synthesizing highquality human face data (seeFig. 8.1). However, existing fullbody generative models produce unsatisfactory results, mainlybecause of the wide variations in the fullbody data and small learning sets. As shown in Fig.8.1, details in the generated fullbody images (e.g., facial attributes) are mainly missed, and thereare samples without hands or do not follow the logical structure of the humans such that thefrontal upper body has been attached to a backward lower body. There are also some examples themodel has failed to build the general structure of the body. To overcome these challenges, futureworks may study either novel generative architectures to create visually pleasant fullbody data orpropose rich datasets to enhance the quality of the learning phase of existingmodels. For instance,adding a constrain term to the loss function of the generator model –that could be based on thebody pose information of the real data– can help the model converge sooner and prevent fromgenerating illogical body structures.
8.3.2 Explainable Architectures
The performance of the stateoftheart deepmodels is impressive, yetmost of them cannot vividlymention the reasons behind the decisions made. The reliability of PAR and person reid systemsenhances when we highlight the essential information that results in the final predictions. Forexample, PAR frameworks that estimate, e.g., hair color and style attributes, could have an extraoutput to highlight that the estimation is based on the information extracted from the people’shead region. A rough example of an explainable PAR model is illustrated in Fig. 8.2, where themodel has one extra head that yields a heatmap to show the pixels that have led to the classificationresult.
158

Soft Biometrics Analysis in Outdoor Environments
8.3.3 PriorKnowledge Based Learning
Providing prior human knowledge to the person reid and PAR models can help mimic humanrecognition ability in some aspects. For example, in an outdoor environment in the winter season,it is hardly expected that people appearwith summer clothing style. Similarly, while it is natural forsomeone with sport suits to work out, it is unexpected that someone with formal clothes has quickmotions. Therefore, the accumulation of useful information such as scene understanding, humanenvironment interaction estimation, and activity recognition may improve the performance ofperson reid and PAR systems.
159

Soft Biometrics Analysis in Outdoor Environments
160

Soft Biometrics Analysis in Outdoor Environments
Chapter 9
Anexos
Some other publications that extend the objectives of this thesis and are resulted from this doctoralresearch program are as follows. These research articles have not been included in the main bodyof the manuscript.
161

1696 IEEE TRANSACTIONS ON INFORMATION FORENSICS AND SECURITY, VOL. 16, 2021
The P-DESTRE: A Fully Annotated Datasetfor Pedestrian Detection, Tracking, and
Short/Long-Term Re-IdentificationFrom Aerial Devices
S. V. Aruna Kumar, Ehsan Yaghoubi, Member, IEEE, Abhijit Das , Member, IEEE,
B. S. Harish, and Hugo Proença , Senior Member, IEEE
Abstract— Over the years, unmanned aerial vehicles (UAVs)have been regarded as a potential solution to surveil publicspaces, providing a cheap way for data collection, while coveringlarge and difficult-to-reach areas. This kind of solutions canbe particularly useful to detect, track and identify subjects ofinterest in crowds, for security/safety purposes. In this con-text, various datasets are publicly available, yet most of themare only suitable for evaluating detection, tracking and short-term re-identification techniques. This paper announces the freeavailability of the P-DESTRE dataset, the first of its kindto provide video/UAV-based data for pedestrian long-term re-identification research, with ID annotations consistent acrossdata collected in different days. As a secondary contribution,we provide the results attained by the state-of-the-art pedestriandetection, tracking, short/long term re-identification techniquesin well-known surveillance datasets, used as baselines for thecorresponding effectiveness observed in the P-DESTRE data.This comparison highlights the discriminating characteristics ofP-DESTRE with respect to similar sets. Finally, we identify themost problematic data degradation factors and co-variates forUAV-based automated data analysis, which should be consideredin subsequent technologic/conceptual advances in this field. Thedataset and the full specification of the empirical evaluationcarried out are freely available at http://p-destre.di.ubi.pt/.
Index Terms— Visual surveillance, aerial data, pedestriandetection, object tracking, pedestrian re-identification, pedestriansearch.
I. INTRODUCTION
V IDEO-BASED surveillance refers the act of watch-ing a person or a place, esp. a person believed
Manuscript received April 7, 2020; revised September 21, 2020 andOctober 30, 2020; accepted November 12, 2020. Date of publicationNovember 26, 2020; date of current version December 21, 2020. Thiswork was supported in part by the FCT/MEC through National Funds andCo-Funded by the FEDER-PT2020 Partnership Agreement under ProjectUIDB/EEA/50008/2020, Project POCI-01-0247-FEDER-033395 and in partby the C4: Cloud Computing Competence Centre. The associate editorcoordinating the review of this manuscript and approving it for publicationwas Dr. Siwei Lyu. (Corresponding author: Hugo Proença.)
S. V. Aruna Kumar is with the Department of Computer Science andEngineering, Ramaiah University of Applied Sciences, Bengaluru 560054,India (e-mail: [email protected]).
Ehsan Yaghoubi and Hugo Proença are with the IT: Instituto de Teleco-municações, Department of Computer Science, University of Beira Interior,6201-001 Covilhã, Portugal (e-mail: [email protected]; [email protected]).
Abhijit Das is with the Indian Statistical Institute, Kolkata 700108, India(e-mail: [email protected]).
B. S. Harish is with the Department of Information Science and Engineering,JSS Science and Technology University, Mysuru 570006, India (e-mail:[email protected]).
Digital Object Identifier 10.1109/TIFS.2020.3040881
to be involved with criminal activity or a place wherecriminals gather.1 Over the years, this technology has beenused in far more applications than its roots in crime detection,such as traffic control and management of physical infrastruc-tures. The first generation of video surveillance systems wasbased in closed-circuit television (CCTV) networks, beinglimited by the stationary nature of cameras. More recently,unmanned aerial vehicles (UAVs) have been regarded as asolution to overcome such limitations: UAVs provide a fastand cheap way for data collection, and can easily assessconfined spaces, producing minimal noise while reducing thestaff demands and cost. UAV-based surveillance of crowdscan host crime prevention measures throughout the world,but it also raises a sensitive debate about faithful balancesbetween security/privacy issues. In this context, it is importantthat legal authorities strictly define the cases where this kindof solutions can be used (e.g., missing child or disorientedelderly? Criminal seek?).
Being at the core of video surveillance, many efforts havebeen concentrated in the development of video-based pedes-trian analysis methods that work in real-world conditions,which is seen as a grand challenge.2 In particular, the problemof identifying pedestrians in crowds is especially difficult whenthe time elapsed between consecutive observations denies theuse of clothing-based features (bottom row of Fig. 1).
To date, the research on pedestrian analysis has been mostlyconducted on databases (e.g., [11], [17], and [30]) that providedata with short lapses of time between consecutive observa-tions of each ID (typically within a single day), which allowsto use clothing-based appearance features for identification(top row of Fig. 1). Also, datasets related to other problems areused (e.g., gait recognition [38]), where the data acquisitionconditions are evidently different of the seen in surveillanceenvironments.
As a tool to support further advances in video/UAV-basedpedestrian analysis, the P-DESTRE is a joint effort fromresearch groups in two universities of Portugal and India.It is a multi-session set of videos, taken in outdoor crowdedenvironments. “DJI Phantom 4”3 drones controlled by human
1https://dictionary.cambridge.org/dictionary/english/surveillance2https://en.wikipedia.org/wiki/Grand_Challenges3https://www.dji.com/pt/phantom-4
1556-6021 © 2020 IEEE. Personal use is permitted, but republication/redistribution requires IEEE permission.See https://www.ieee.org/publications/rights/index.html for more information.
Authorized licensed use limited to: b-on: UNIVERSIDADE DA BEIRA INTERIOR. Downloaded on May 11,2021 at 14:02:52 UTC from IEEE Xplore. Restrictions apply.
Soft Biometrics Analysis in Outdoor Environments
162

KUMAR et al.: P-DESTRE: A FULLY ANNOTATED DATASET FOR PEDESTRIAN DETECTION, TRACKING 1697
Fig. 1. Key difference between the pedestrian short-term re-identification(upper row) and long-term re-identification problems (bottom row). In theformer case, it is assumed that subjects keep the same clothes betweenconsecutive observations, which does not happen in the long-term problem.Matching IDs across long-term observations is highly challenging, as thestate-of-the-art re-identification techniques rely in clothing appearance-basedfeatures. The P-DESTRE set is the first to supply video/UAV-based datafor pedestrian long-term re-identification.
operators flew over various scenes of both universities campi,with the data acquired simulating the everyday conditions insurveillance environments. All subjects offered explicitly asvolunteers and they were asked to act normally and ignorethe UAVs. Moreover, the P-DESTRE set is fully annotated atthe frame level by human experts, providing four families ofmeta-data:
• Bounding boxes. The position of each pedestrian at everyframe is given as a bounding box, to support object detec-tion, tracking and semantic segmentation experiments;
• IDs. Each pedestrian has a unique identifier that is keptconsistent over all the data acquisition days/sessions.This is a singular characteristic that turns the P-DESTREsuitable for various kinds of identification problems. Theunknown identities are also annotated, and can be usedas distractors to increase the identification challenges;
• Soft biometrics labels. Each pedestrian is fully char-acterised by 16 labels: ‘gender’, ‘age’, ‘height’, ‘bodyvolume’, ‘ethnicity’, ‘hair colour’, ‘hairstyle’, ‘beard’,‘moustache’, ‘glasses’, ‘head accessories’, ‘body acces-sories’, ‘action’ and ‘clothing information’ (x3), whichallows to perform soft biometrics and action recognitionexperiments.
• Head pose. 3D head pose angles are given in terms ofyaw, pitch and roll values for all the bounding boxes,except backside views. This information was automat-ically obtained according to the Deep Head Pose [29]method.
As a consequence of its annotation, the P-DESTRE is thefirst suitable for evaluating video/UAV-based long-term re-identification methods. Using data collected over large periodsof time (days/weeks), the re-identification techniques cannotrely in clothing-based features, which is the key characteristicthat distinguishes between the long-term and the short-termre-identification problems (Fig. 1).
In summary, this paper offers the following contributions:1) we announce the free availability of the P-DESTRE
dataset, the first of its kind that is fully annotated at theframe level and was designed to support the research on
video/UAV-based long-term re-identification. Moreover,the P-DESTRE set can be used in pedestrian detection,tracking, short-term re-identification and soft biometricsexperiments;
2) we provide a systematic review of the related work inthe scope of the P-DESTRE set, comparing its maindiscriminating features with respect to the related sets;
3) based in our own empirical evaluation, we reportthe results that state-of-the-art methods attain inthe pedestrian detection, tracking and short-term re-identification tasks, when considering well-known sur-veillance datasets. The comparison between such resultsand those attained in P-DESTRE supports the originalityof the novel dataset.
The remainder of this paper is organized as follows:Section II summarizes the most relevant research in the scopeof the novel dataset. Section III provides a detailed descriptionof the P-DESTRE data. Section IV discusses the resultsobserved in our empirical evaluation, and the conclusions aregiven in Section V.
II. RELATED WORK
This section describes the most relevant UAV-based datasetsand also pays special attention to datasets that focus theproblems of pedestrian detection, tracking, re-identificationand search.
A. UAV-Based Datasets
Various datasets of UAV-based data are available to theresearch community, most of them serving for object detec-tion and tracking purposes. The ‘Object deTection in Aerialimages’ [35] set supports research on multi-class object detec-tion, and has 2,806 images, with 188K instances of 15 cat-egories. The ‘Stanford drone dataset’ [28] provides videodata for object tracking, containing 60 videos from 8 scenes,annotated for 6 classes. Similarly, the ‘UAV123’ [24] set pro-vides 123 video sequences from aerial viewpoints, containingover 110K frames, annotated for object detection/tracking.The ‘VisDrone’ [40] consists of 288 videos/261,908 frames,with over 2.6M bounding boxes covering pedestrians, cars,bicycles, and tricycles. Finally, the largest freely availablesource is the ‘Multidrone’ [23], providing data for multiplecategory object detection and tracking. It contains videos ofvarious actions, collected under various weather conditions andin different places, yet not all the data are annotated. The‘UAVDT’ [9] is an image-based dataset that supports researchon vehicle detection and tracking. It has 80K frames/ 841.5Kbounding boxes, selected from 10 hours raw videos, that weremanually annotated for 14 attributes (e.g., weather condition,flying altitude, camera view, vehicle category and levels ofocclusion). Recently, to facilitate research on face recognitionfrom video/UAV-based data, the ‘DroneSURF’ dataset [15]was released. This dataset is composed of 200 videos from58 subjects, captured across 411K frames, and includes over786K face annotations.
B. Pedestrian Analysis Datasets
As summarized in Table I, there are various datasetsfor supporting pedestrian analysis research. The pioneer set
Authorized licensed use limited to: b-on: UNIVERSIDADE DA BEIRA INTERIOR. Downloaded on May 11,2021 at 14:02:52 UTC from IEEE Xplore. Restrictions apply.
Soft Biometrics Analysis in Outdoor Environments
163

1698 IEEE TRANSACTIONS ON INFORMATION FORENSICS AND SECURITY, VOL. 16, 2021
TABLE I
COMPARISON BETWEEN THE P-DESTRE AND THE EXISTING DATASETS THAT SUPPORT THE RESEARCH IN PEDESTRIAN DETECTION, TRACKING ANDSHORT/LONG-TERM RE-IDENTIFICATION (APPEARING IN CHRONOLOGICAL ORDER)
was the ‘PRID-2011’ [14], containing 400 image sequencesof 200 pedestrians. Next, the ‘CUHK03’ [17] set aimedat providing enough data for deep learning-based solu-tions, and contains images collected from 5 cameras, com-prising 1,467 identities and 13,164 bounding boxes. The‘iLIDS-VID’ [32] set was the first to release video data,comprising 600 sequences of 300 individuals, with sequencelengths ranging from 23 to 192 frames. The ‘MRP’ [16]was the first UAV-based dataset specifically designed forthe re-identification problem, containing a 28 identities and4,000 bounding boxes. Roughly at the same time, the ‘PRAI-1581’ [32] data reproduces undoubtedly real surveillanceconditions, but UAVs flew at too high altitude to enablere-identification experiments (up to 60 meters). This set has39,461 images of 1,581 identities, and is mainly used fordetection and tracking purposes. The ‘Market-1501’ [37] setwas collected using 6 cameras in front of a supermarket, andcontains 32,668 bounding boxes of 1,501 identities. Its exten-sion (‘MARS’ [39]) was the first video-based set specificallydevoted to pedestrian re-identification. Singularly, the ‘Mini-drone’ [6] set was created mostly to support abnormal eventdetection analysis, and has been also used for pedestriandetection, tracking and short-term re-identification purposes.
The ‘DukeMTMC-VideoReID’ [34] is a subset of theDukeMTMC [27] tracking dataset, used for pedestrianre-identification purposes. Authors also defined a performanceevaluation protocol, enumerating the 702 identities used fortraining, the 702 testing identities, and the 408 distrac-tor identities. Overall, this set comprises 369,656 framesof 2,196 sequences for training and 445,764 framesof 2,636 sequences for testing. The ‘AVI’ [30] set enablespose estimation/abnormal event detection experiments, withsubjects in each frame annotated with 14 body keypoints.More recently, the ‘DRoneHIT’ [11] set supports image-basedpedestrian re-identification experiments from aerial data,containing 101 identities, each one with about 459 images.
The ‘CSM’ [1] and ‘iQIQI-VID’ [20] sets were includedin this summary because they previously released datafor the long-term re-identification problem. However, theirvideo sequences have notoriously different features from theacquired in surveillance environments: predominantly regardTV shows/movies. Similarly, the ‘Long-Term Cloth-Changing(LTCC)’ [26] set also supports long-term re-identificationresearch and has 17,119 images from 152 identities, collectedusing CCTV footage and annotated across clothing-changesand different views.
Among the datasets analyzed, note that the Market1501,MARS, CUHK03, iLIDS-VID and DukeMTMC-VideoReIDwere collected using stationary cameras, and their data havenotoriously different features of the resulting from UAV-basedacquisition. Also, even though the PRAI-1581 and DRone HITsets were collected using UAVs, they do not provide consistentidentity information between acquisition sessions, and cannotbe used in pedestrian search problem.
III. THE P-DESTRE DATASETA. Data Acquisition Devices and Protocols
The P-DESTRE dataset is the result of a joint effort fromresearchers in two universities: the University of Beira Inte-rior4 (Portugal) and the JSS Science and Technology Univer-sity5 (India). In order to enable the research on pedestrianidentification from UAV-based data, a set of DJI® Phantom46 drones controlled by human operators flew over variousscenes of both university campi, acquiring data that simulatethe everyday conditions in outdoor urban environments.
All subjects in the dataset offered explicitly as volunteersand they were asked to completely ignore the UAVs (Fig. 2),that were flying at altitudes between 5.5 and 6.7 meters,with the camera pitch angles varying between 45 to 90.
4http://www.ubi.pt5https://jssstuniv.in6https://www.dji.com/pt/phantom-4-pro-v2
Authorized licensed use limited to: b-on: UNIVERSIDADE DA BEIRA INTERIOR. Downloaded on May 11,2021 at 14:02:52 UTC from IEEE Xplore. Restrictions apply.
Soft Biometrics Analysis in Outdoor Environments
164

KUMAR et al.: P-DESTRE: A FULLY ANNOTATED DATASET FOR PEDESTRIAN DETECTION, TRACKING 1699
Fig. 2. At top: schema of the data acquisition protocol used. Human operatorscontrolled DJI Phantom 4 aircrafts in various scenes of two university campi,flying at altitude between 5.5 and 6.7 meters, with gimbal pitch angles between45 to 90. The image at the bottom provides one example of a full scene ofthe P-DESTRE set.
TABLE II
THE P-DESTRE DATA ACQUISITION MAIN FEATURES
Volunteers were students of both universities (mostly in the18-24 age interval, > 90%), ≈ 65/35% males/females, and ofpredominantly two ethnicities (‘white’ and ‘indian’). About28% of the volunteers were using glasses, 10% of them wereusing sunglasses. Data were recorded at 30fps, with 4K spatialresolution (3, 840 × 2, 160), and stored in "mp4" format, withH.264 compression. The key features of the data acquisitionsettings are summarized in Table II, and additional details canbe found at the corresponding webpage.7
B. Annotation Data
The P-DESTRE set is fully annotated at the frame level,by human experts. For each video, we provide one text filewith the same filename (plus the ".txt" extension), containingall the corresponding meta-information in comma-separatedfile format. In these files, each row provides the informa-tion for one bounding box in a frame (total of 25 numericvalues). The annotation process was divided into fourphases: 1) pedestrian detection; 2) tracking; 3) identification
7http://p-destre.di.ubi.pt/download.html
TABLE III
THE P-DESTRE DATASET ANNOTATION PROTOCOL. FOR EACH VIDEO,A TEXT FILE PROVIDES THE ANNOTATION AT FRAME LEVEL, WITH
THE ROI OF EACH PEDESTRIAN IN THE SCENE, TOGETHER
WITH THE ID INFORMATION AND 16 OTHER SOFT BIOMETRIC
LABELS
and soft biometrics characterisation; and 4) 3D head poseestimation.
At first, the well-known Mask R-CNN [13] method wasused to provide an initial estimate of the position of everypedestrian in the scene, with the resulting data subjectedto human verification and correction. Next, the deep sortmethod [33] provided the preliminary tracking information,which again was corrected manually. As result of these twoinitial steps, we obtained the rectangular bounding boxesproviding the regions-of-interest (ROI) of every pedestrian ineach frame/video. The next phase of the annotation processwas carried out manually, with human annotators that knewpersonally the volunteers of each university setting the IDinformation and characterising the samples according to thesoft labels. Finally, we used the Deep Head Pose [29] methodto obtain the 3D head pose angles for all elements (exceptbackside views), expressed in terms of yaw, pitch and rollvalues.
Table III provides the details of the labels annotated forevery instance (pedestrian/frame) in the dataset, along withthe ID information, the bounding box that defines the ROI
Authorized licensed use limited to: b-on: UNIVERSIDADE DA BEIRA INTERIOR. Downloaded on May 11,2021 at 14:02:52 UTC from IEEE Xplore. Restrictions apply.
Soft Biometrics Analysis in Outdoor Environments
165

1700 IEEE TRANSACTIONS ON INFORMATION FORENSICS AND SECURITY, VOL. 16, 2021
Fig. 3. Examples of the six factors that - under visual inspection and ina qualitative analysis - constitute the major challenges to automated imageanalysis in video/UAV-based data. These are the predominant data degradationfactors in the P-DESTRE set and the most important co-variates for theresponses of automated systems.
and the frame information. For every label, we also provide alist of its possible values.
C. Typical Data Degradation Factors
As expected, the acquisition of video/UAV-based data incrowded outdoor environments, from at-a-distance and simu-lating covert protocols, has led to extremely heterogeneoussamples, degraded in multiple perspectives. Under visualinspection, we identified the six major factors that the most fre-quently reduced the quality data, and augment the challengesof automated image analysis:
1) Poor resolution/blur. As illustrated in the top row ofFig. 3, some subjects were acquired from large distances(over 40 m.), with the corresponding ROIs having verypoor resolution. Also, some parts of the scenes laidoutside the cameras depth-of-field, in result of a largerange in objects depth. This led to blurred samples.In both cases, the amount of information available perbounding box is reduced;
2) Motion blur. This factor yielded from thenon-stationary nature of the cameras and the subjects’movements. In practice, for some bounding boxes,
an apparent streaking of the body silhouettes isobserved;
3) Partial occlusions. As a result of the scene dynamicsand due to the multiple objects in the scenes, par-tial occlusions of subjects were particularly frequent.According to our perception, this might be the mostconcerning factor of UAV-based data, as illustrated inthe third row of Fig. 3;
4) Pose. Under covert data acquisition protocols and with-out accounting for subjects cooperation, many samplesregard profile and backside views, in which identifica-tion and soft biometric characterisation are particularlydifficult;
5) Lighting/shadows. As a consequence of the outdoorconditions, many samples are over/under-illuminated,with shadowed regions due to the remaining objects inthe scene (e.g., buildings, cars, trees, traffic signs…);
6) UAV elevation angle. When using gimbal pitch anglesclose to 90, the longest axis of the subjects bodyis almost parallel to the camera axis. In such cases,images contain exclusively a top-view perspective ofthe subjects, with reduced amount of discriminatinginformation (bottom row of Fig. 3).
When comparing the major features of CCTV andUAV-based data, the pitch factor of images is particularly evi-dent. Due to the UAVs altitude, subjects appear almost invari-ably with negative pitch angles (over 95% of the P-DESTREimages have pitch angles between -10 and 50), which -according to the results reported in Section IV - appears tobe a relevant data degradation factor. Also, the non-stationaryfeature of UAVs increases the heterogeneity of the resultingdata, which again augments the challenges in performingreliable automated image analysis.
D. P-DESTRE Statistical Significance
Let α be a confidence interval. Let p be the error rate of aclassifier and p be the estimated error rate over a finite numberof test patterns. At an α-confidence level, we want that the trueerror rate does not exceed p by an amount larger than ε(n, α).Guyon et al. [12] defined ε(n, α) = βp as a fraction of p.Assuming that recognition errors are Bernoulli trials, authorsconcluded that the number of required trials n to achieve (1-α)confidence in the error rate estimate is given by:
n = −ln(α)/(β2 p). (1)
Using typical values α = 0.05 and β = 0.2, authorsrecommend a simpler form, given by: n ≈ 100
p .Considering the statistics of the P-DESTRE set (Fig. 4),
in terms of the number of data acquisition sessions/daysper volunteer and the number of bounding boxes per vol-unteer/session, it is possible to obtain the lower bounds forthe statistical confidence in experiments related with identityverification at the frame level, assuming the 1) short-term re-identification; and 2) long-term re-identification problems.
In the short-term re-identification setting, consideringthat each frame (bounding box) with a valid ID (≥ 1)generates a valid template, that all frames of the same IDacquired in different sessions of the same day can be used
Authorized licensed use limited to: b-on: UNIVERSIDADE DA BEIRA INTERIOR. Downloaded on May 11,2021 at 14:02:52 UTC from IEEE Xplore. Restrictions apply.
Soft Biometrics Analysis in Outdoor Environments
166

KUMAR et al.: P-DESTRE: A FULLY ANNOTATED DATASET FOR PEDESTRIAN DETECTION, TRACKING 1701
Fig. 4. P-DESTRE statistics. Top row: number of days with data per volunteer(at left), number of data acquisition sessions per volunteer (at center), andnumber of bounding boxes per volunteer (at right). The histogram at themiddle row provides the summary statistics for the length of the trackletsequences. Finally, the bottom row provides the total of bounding boxes (BBs)per 3D head pose angle, expressed in terms of yaw, pitch and roll values.
to generate genuine pairs and that frames with differentIDs (including ‘unknown’) compose the impostors set, theP-DESTRE dataset enables to perform 1,246,587,154 (gen-uine) + 605,599,676,264 (impostor) comparisons, leading to ap value with a lower bound of approximately 1.647 × 10⁻¹⁰.Regarding the pedestrian long-term re-identification problem,where the genuine pairs must have been acquired in differentdays, the dataset enables to perform 2,160,586,581 (genuine) +605,599,676,264 (impostor) comparisons, leading to a p valuewith a lower bound of approximately 1.645 × 10⁻¹⁰. Notethat these are lower bounds, that do not take into account theportions of data used for learning purposes. Also, these valueswill increase if we do not assume the independence betweenimages and error correlations are taken into account.
IV. EXPERIMENTS AND RESULTS
In this section we report the results obtained by methodsthat represent the state-of-the-art in four tasks: pedestrian1) detection; 2) tracking; 3) short-term re-identification; and4) long-term re-identification. For contextualisation, we reportnot only the performance obtained in the P-DESTRE set, butalso provide baseline results attained by the same techniquesin well-known datasets. Also, for each problem, we illustratethe typical failure cases that we have subjectively perceivedduring our experiments.
A. Pedestrian Detection
The RetinaNet [19], R-FCN [7] methods were initially con-sidered to represent the state-of-the-art in pedestrian detection,as both outperformed in the PASCAL VOC 2007/2012 [10]challenge (‘Person Detection’ category). Then, the well-knownSSD [21] method was also chosen as baseline, as it is themost widely detector reported in the literature, and its resultscan be easily contextualised. Accordingly, this section reportsa comparison between the performance of the three objectdetectors in the P-DESTRE/PASCAL sets.
TABLE IV
COMPARISON BETWEEN THE AVERAGE PRECISION (AP) OBTAINED BYTHREE METHODS CONSIDERED TO REPRESENT THE STATE-OF-THE-
ART IN PEDESTRIAN DETECTION, IN THE P-DESTRE AND PAS-CAL VOC 2007/2012 SETS
In summary, RetinaNet is composed of a backbone networkand two task specific subnetworks. It uses a feature pyramidnetwork as backbone model, to obtain a convolutional featuremap over the entire input image. Two sub-networks use thisfeature representation: the first one classifies the anchor boxesand the second model performs the bounding box regression,to refine the localization of the detected objects. R-FCNuses a fully convolutional architecture, where the translationinvariance is obtained by position-sensitive score maps that usespecialized convolutional layers to encode the deviations withrespect to default positions. A position-sensitive ROI poolinglayer is appended on top of the fully connected layers. TheSSD model eliminates the proposal generation and featureresampling steps by encapsulating all the processing into asingle network. It discretizes the output space of boundingboxes into a set of default boxes over different aspect ratiosand scales per feature map location. In our experiments, in adata augmentation setting, the sizes of the learning patcheswere randomly sampled by [0.1, 1] factor, and horizontallyflipped with probability 0.5.
For the PASCAL VOC 2007/2012 set, the official devel-opment kit8 was used to evaluate the methods on the ‘Per-son’ category, using 10-fold cross validation. Regarding theP-DESTRE set, a 10-fold cross validation scheme was used,with the data in each split randomly divided into 60% forlearning, 20% for validation and 20% for test, i.e., 45 videoswere used for learning, 15 for validation and 15 videos for testpurposes. The full specification of the samples used in eachsplit and the scores returned by each method is provided in.9
The results are summarized in Table IV for alldatasets/methods, in terms of the average precision obtained atintersection-of-union values equal to 0.5 (i.e., AP@IoU=0.5).Also, Fig. 5 provides the precision/recall curves for bothdata sets and all detection methods, with the P-DESTREvalues being represented by red lines and the PASCALVOC 2007/2012 results represented by green lines. The shad-owed regions denote the standard deviation performance inthe 10 splits, at each operating point. Overall, all methodsdecreased notoriously their effectiveness from the PASCALVOC set to the P-DESTRE set, in some cases with error ratesincreasing over 160%. In the case of the R-FCN method,in a small region of the performance space (recall ≈ 0.2),the levels of performance for P-DESTRE and PASCAL VOCwere approximately equal, yet the precision values thenremain stable for much higher recall values in the PASCALVOC set.
8http://host.robots.ox.ac.uk/pascal/VOC/voc2012/#devkit9http://p-destre.di.ubi.pt/pedestrian_detection_splits.zip
Authorized licensed use limited to: b-on: UNIVERSIDADE DA BEIRA INTERIOR. Downloaded on May 11,2021 at 14:02:52 UTC from IEEE Xplore. Restrictions apply.
Soft Biometrics Analysis in Outdoor Environments
167

1702 IEEE TRANSACTIONS ON INFORMATION FORENSICS AND SECURITY, VOL. 16, 2021
Fig. 5. Comparison between the precision/recall curves observed in thePASCAL VOC 2007/2012 (green lines) and P-DESTRE (red lines) sets.Results are given for the RetinaNet (top plot), R-FCN (middle plot) and SSD(bottom plot) object detection methods.
When comparing the performance of the three techniquestested, we observed that RetinaNet slightly outperformed thecompetitors in both datasets, in all cases with the R-FCNbeing the runner-up. The SSD algorithm not only got evidentlythe lowest average performance among all methods, but alsoits variance was the largest, which points for the lowerrobustness of this technique to most of the data co-variates inboth the PASCAL VOC and P-DESTRE sets. The observedranks among the three methods not only accord previousobject evaluation initiatives [10], but also the substancial lowerperformance observed in P-DESTRE than in PASCAL VOCsupports the hypothesis claimed in this paper: the P-DESTREset has evidently different features with respect to previoussimilar sets.
In a qualitative perspective, we observed that all meth-ods faced particular difficulties in crowded scenes, whenonly a small part of the subjects silhouette is unoccluded,as illustrated in Fig. 6. Considering that RetinaNet is anchor-based, and that the predefined anchor boxes have a set ofhandcrafted aspect ratios and scales that are data depen-dent, performance might have been seriously affected. Eventhough RetinaNet has clearly outperformed its competitors,the challenging conditions in the P-DESTRE set have stillnotoriously degraded its effectiveness, when compared to thePASCAL VOC baseline. By analysing the instances in bothsets, we observed that the P-DESTRE set has notoriously morehard cases than PASCAL VOC, with a significant portionof severely degraded samples (i.e., with severe occlusions,
Fig. 6. Typical cases where the object detectors returned the worst scores,i.e., failed to appropriately detect the pedestrians. The green boxes representthe ground-truth, while the red colour denotes the detected boxes.
extreme poor resolution and strong local lighting variations/shadows).
In summary, our experiments point for the require-ment of novel strategies to handle the specific problemsthat yield from UAV-based data acquisition. Not only thestate-of-the-art solutions provide levels of performance that arestill far from the demanded to deploy this kind of solutionsin real-environments, but most methods are also sensitiveto particularly frequent co-variates in UAV-based imaging(e.g., motion-blur and shadows). Another concerning point isthe density of subjects in the scenes, with crowded environ-ments easily providing severe occlusions that constraint theeffectiveness of the object detection phase.
B. Pedestrian TrackingFor the tracking task, the TracktorCV [2] and V-IOU [5]
methods were initially selected to represent the state-of-the-art,according to: 1) their performance in the MOT challenge10;and 2) the fact that both provide freely available implemen-tations, which is important to guarantee that we obtain afair evaluation between datasets. Moreover, we consideredadditionally one method (IOU [4]) that is among the mostwidely reported in the literature. We compared the effective-ness attained by the three techniques in the P-DESTRE andMOT challenge sets, in order to perceive the relative hardnessof tracking pedestrians in UAV-based data in comparison toa stationary camera setting. In terms of evaluation protocols,the rules provided for the MOT challenges were rigorouslymet for the MOT evaluation. For the P-DESTRE set, a 10-foldcross validation scheme was used, with the data in each splitrandomly divided into 60% for learning, 20% for validationand 20% for test, i.e., 45 videos were used for learning, 15 forvalidation and 15 videos for test purposes. The full details ofeach split are available at.11
The TracktorCV method comprises two steps: 1) a regres-sion module, that uses the input of the object detection step toupdate the position of the bounding box at a subsequent frame;and 2) an object detector that provides the set of bounding
10https://motchallenge.net11http://p-destre.di.ubi.pt/pedestrian_tracking_splits.zip
Authorized licensed use limited to: b-on: UNIVERSIDADE DA BEIRA INTERIOR. Downloaded on May 11,2021 at 14:02:52 UTC from IEEE Xplore. Restrictions apply.
Soft Biometrics Analysis in Outdoor Environments
168
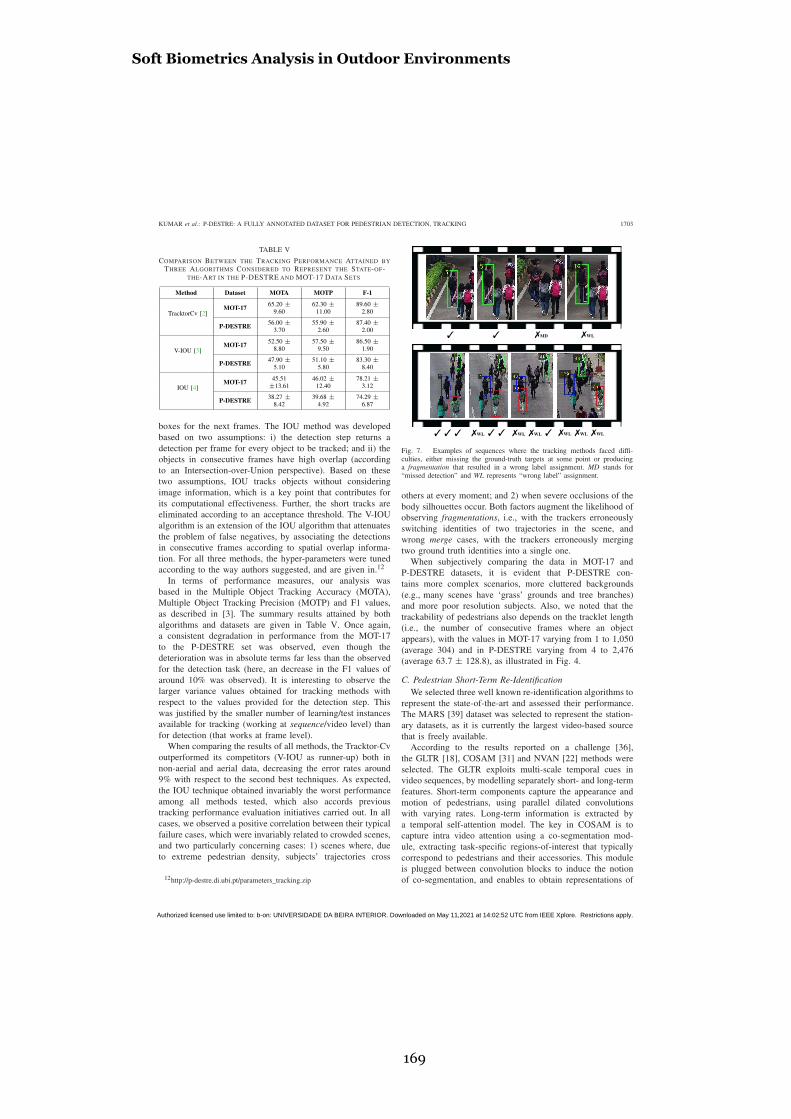
KUMAR et al.: P-DESTRE: A FULLY ANNOTATED DATASET FOR PEDESTRIAN DETECTION, TRACKING 1703
TABLE V
COMPARISON BETWEEN THE TRACKING PERFORMANCE ATTAINED BYTHREE ALGORITHMS CONSIDERED TO REPRESENT THE STATE-OF-
THE-ART IN THE P-DESTRE AND MOT-17 DATA SETS
boxes for the next frames. The IOU method was developedbased on two assumptions: i) the detection step returns adetection per frame for every object to be tracked; and ii) theobjects in consecutive frames have high overlap (accordingto an Intersection-over-Union perspective). Based on thesetwo assumptions, IOU tracks objects without consideringimage information, which is a key point that contributes forits computational effectiveness. Further, the short tracks areeliminated according to an acceptance threshold. The V-IOUalgorithm is an extension of the IOU algorithm that attenuatesthe problem of false negatives, by associating the detectionsin consecutive frames according to spatial overlap informa-tion. For all three methods, the hyper-parameters were tunedaccording to the way authors suggested, and are given in.12
In terms of performance measures, our analysis wasbased in the Multiple Object Tracking Accuracy (MOTA),Multiple Object Tracking Precision (MOTP) and F1 values,as described in [3]. The summary results attained by bothalgorithms and datasets are given in Table V. Once again,a consistent degradation in performance from the MOT-17to the P-DESTRE set was observed, even though thedeterioration was in absolute terms far less than the observedfor the detection task (here, an decrease in the F1 values ofaround 10% was observed). It is interesting to observe thelarger variance values obtained for tracking methods withrespect to the values provided for the detection step. Thiswas justified by the smaller number of learning/test instancesavailable for tracking (working at sequence/video level) thanfor detection (that works at frame level).
When comparing the results of all methods, the Tracktor-Cvoutperformed its competitors (V-IOU as runner-up) both innon-aerial and aerial data, decreasing the error rates around9% with respect to the second best techniques. As expected,the IOU technique obtained invariably the worst performanceamong all methods tested, which also accords previoustracking performance evaluation initiatives carried out. In allcases, we observed a positive correlation between their typicalfailure cases, which were invariably related to crowded scenes,and two particularly concerning cases: 1) scenes where, dueto extreme pedestrian density, subjects’ trajectories cross
12http://p-destre.di.ubi.pt/parameters_tracking.zip
Fig. 7. Examples of sequences where the tracking methods faced diffi-culties, either missing the ground-truth targets at some point or producinga fragmentation that resulted in a wrong label assignment. MD stands for“missed detection” and WL represents “wrong label” assignment.
others at every moment; and 2) when severe occlusions of thebody silhouettes occur. Both factors augment the likelihood ofobserving fragmentations, i.e., with the trackers erroneouslyswitching identities of two trajectories in the scene, andwrong merge cases, with the trackers erroneously mergingtwo ground truth identities into a single one.
When subjectively comparing the data in MOT-17 andP-DESTRE datasets, it is evident that P-DESTRE con-tains more complex scenarios, more cluttered backgrounds(e.g., many scenes have ‘grass’ grounds and tree branches)and more poor resolution subjects. Also, we noted that thetrackability of pedestrians also depends on the tracklet length(i.e., the number of consecutive frames where an objectappears), with the values in MOT-17 varying from 1 to 1,050(average 304) and in P-DESTRE varying from 4 to 2,476(average 63.7 ± 128.8), as illustrated in Fig. 4.
C. Pedestrian Short-Term Re-IdentificationWe selected three well known re-identification algorithms to
represent the state-of-the-art and assessed their performance.The MARS [39] dataset was selected to represent the station-ary datasets, as it is currently the largest video-based sourcethat is freely available.
According to the results reported on a challenge [36],the GLTR [18], COSAM [31] and NVAN [22] methods wereselected. The GLTR exploits multi-scale temporal cues invideo sequences, by modelling separately short- and long-termfeatures. Short-term components capture the appearance andmotion of pedestrians, using parallel dilated convolutionswith varying rates. Long-term information is extracted bya temporal self-attention model. The key in COSAM is tocapture intra video attention using a co-segmentation mod-ule, extracting task-specific regions-of-interest that typicallycorrespond to pedestrians and their accessories. This moduleis plugged between convolution blocks to induce the notionof co-segmentation, and enables to obtain representations of
Authorized licensed use limited to: b-on: UNIVERSIDADE DA BEIRA INTERIOR. Downloaded on May 11,2021 at 14:02:52 UTC from IEEE Xplore. Restrictions apply.
Soft Biometrics Analysis in Outdoor Environments
169

1704 IEEE TRANSACTIONS ON INFORMATION FORENSICS AND SECURITY, VOL. 16, 2021
TABLE VI
COMPARISON BETWEEN THE RE-IDENTIFICATION PERFORMANCEATTAINED BY THREE STATE-OF-THE-ART METHODS IN THE
P-DESTRE AND MARS DATA SETS
both the spatial and temporal domains. Finally, the Non-localVideo Attention Network (NVAN) exploits both spatial andtemporal cues by introducing a non-local attention operationinto the backbone CNN at multiple feature levels. Further,it reduces the computational complexity of the inference stepby exploring the spatial and temporal redundancy that isobserved in the learning data.
In a 5-fold setting, both datasets were divided into randomsplits, each one containing the learning, query and gallery sets,in proportions 50:10:40. For the MARS dataset, the evaluationprotocol described in13 was used. For the P-DESTRE dataset,we considered 1,894 tracklets of 608 IDs, with an averagenumber of frames per tracklet of 67,4. The full specificationof the samples used for learning/validation/test purposes ineach split is given in.14
Regarding the GLTR method, the ResNet50 was used asbackbone model, with the learning rate set to 0.01. In theCOSAM method, the Se-ResNet50 architecture was used asbackbone model. The COSAM layer was plugged betweenthe forth and fifth convolution layers, with the learning rateset to 0.0001 and the reduction dimension size set to 256.For the NVAN method, we also used ResNet50 architectureas backbone network and plugged two non-local attentionlayers (after Conv3_3 and Conv3_4) and three non-local layers(after Conv4_4, Conv4_5, and Conv4_6). The input frameswere resized into 256 × 128. The model was trained usingthe Adam algorithm, with 300 epochs and learning rate setto 0.0001.
The summary results are provided in Table VI. In oppositionto the detection and tracking problems, it is interesting to notethat no significant decreases in performance were observedfrom the MARS to the P-DESTRE data, which points for thesuitability of the existing short-term re-identification solutionsfor UAV-based data. Fig. 8 provides the cumulative rank-ncurves for all algorithms/datasets. The red lines represent theP-DESTRE results and the green series denote the MARSvalues. Results are given in terms of the identification ratewith respect to the proportion of gallery identities retrieved(i.e., hit/penetration plot). Apart the outperforming results of
13http://www.liangzheng.com.cn/Project/project_mars.html14http://p-destre.di.ubi.pt/pedestrian_reid_splits.zip
Fig. 8. Comparison between the closed-set identification (CMC) curvesobserved in the MARS (green lines) and P-DESTRE (red lines) sets for theGLTR, COSAM and NVAN re-identification techniques. Zoomed-in regionswith the top-1 to 20 results are shown in the inner plots.
NVAN, it is particularly interesting to note the apparentlycontradictory results of the GLTR and COSAM algorithmsin the MARS and P-DESTRE sets. In all cases, in termsof the top-20 performance, the P-DESTRE results were farworse than the corresponding MARS values. However, forlarger ranks (starting at 5% of the enrolled identities), theP-DESTRE values were solidly better than the ranks observedfor MARS. Also, in case of heavily degraded MARS instances,algorithms returned almost random results, which was notobserved for the P-DESTRE. This might be justified by thefact that P-DESTRE contains more poor quality data thanMARS, yet it does not provide extremely degraded (i.e.,almost impossible) instances that turn the identification intoa quasi-random process.
Based in these experiments, Fig. 9 highlights some notori-ous cases for re-identification purposes. The upper row repre-sents the particularly hazardous cases in terms of convenience,where different IDs were erroneously perceived as the same.This was mostly due to similarities in clothing, together withshared soft biometric labels between different IDs. The bottomrow provides the particularly dangerous cases for security pur-poses, where methods had difficulties in identifying a knownID. Here, errors often yielded from notorious differences inpose and scale between the query/gallery data. Along with thebackground clutter, these factors were observed to decrease theeffectiveness of the feature representations, and were amongthe most concerning for re-identification performance.
Authorized licensed use limited to: b-on: UNIVERSIDADE DA BEIRA INTERIOR. Downloaded on May 11,2021 at 14:02:52 UTC from IEEE Xplore. Restrictions apply.
Soft Biometrics Analysis in Outdoor Environments
170

KUMAR et al.: P-DESTRE: A FULLY ANNOTATED DATASET FOR PEDESTRIAN DETECTION, TRACKING 1705
Fig. 9. Examples of the instances that got the worst re-identificationperformance. The upper row illustrates typical false matches, almost invariablyrelated with clothing styles and colours. The bottom row provides someexamples of cases where (due to differences in pose and scale), the trueidentities could not be retrieved among the top positions. “Q” represents thequery image and “Rank-i” provides the rank of the corresponding galleryimage.
D. Long-Term Pedestrian Re-Identification
As stated above, the pedestrian video-based long-termre-identification problem was the main motivation for thedevelopment of the P-DESTRE dataset. Here, there is notany guarantee about the clothing appearance of subjects, norabout the time elapsed between consecutive observations ofone ID. In such circumstances, the analysis of alternative fea-tures should be considered (e.g., face, gait or soft-biometricsbased).
Considering that there are not yet methods in the liter-ature specifically designed for this kind of task, we havechosen a combination of two well-known re-identificationtechniques that combine face and body features. Similarly tothe previous tasks, the goal was to obtain an approximationfor the effectiveness attained by the existing solutions inUAV-based data. Such levels of performance constitute abaseline for this problem and can be used as basis for furtherdevelopments.
The facial regions-of-interest were detected by the SSHmethod [25] (acceptance threshold=0.7), from where a featurerepresentation was obtained using the ArcFace [8] model. Forthe body-based analysis, the COSAM [31] model provided thefeature representation. Both models were trained from scratch.The data were sampled into 5 trials, each one containing learn-ing/gallery/query instances in proportions 50:10:40. As for theprevious tasks, the full specification of the samples used ineach split is given in.15
For the ArcFace method, the MobileNetV2 was used asbackbone model, and the learning rate set to 0.01. RegardingCOSAM, the Se-ResNet50 was used as backbone model, andthe COSAM layer was plugged into the forth and fifth convo-lutional layers, with learning rate equal to 1e−4 and dimensionsize equal to 256. Each model was trained reparately, and
15http://p-destre.di.ubi.pt/pedestrian_search_splits.zip
TABLE VII
BASELINE LONG-TERM PEDESTRIAN RE-IDENTIFICATION PERFORMANCEOBTAINED BY AN ENSEMBLE OF ARCFACE [8] + COSAM [31] IN THE
P-DESTRE DATA SET
Fig. 10. Closed-set identification (CMC) curves obtained for the long-termre-identification problem in the P-DESTRE dataset. The inner plot providesthe top-20 results as a zoomed-in region.
during the test phase, the mean value of the ArcFace facialfeatures in the tracklet were appended to the body-basedrepresentation yielding from COSAM. The Euclidean normwas used as distance function between such concatenatedrepresentations.
Fig. 10 provides the cumulative rank-n curves obtained,in terms of the successfull identification rates with respectto the proportion of gallery identities (i.e., hit/penetrationplot). As expected, when compared to the short-term re-identification setting, performance was substantially lower(rank-1 ≈ 79.14% for re-identification → ≈ 49.88% forsearch), which accords the human perception for the additionaldifficulty of search with respect to re-identify.
Based in our qualitative analysis of the results, Fig. 11provides three types of examples: the upper row shows somesuccessful identification cases, in which the model retrievedthe true identity in the first position. In most cases, we notedthat subjects kept some piece of clothing/accessories betweenobservations (e.g., glasses or backpack) and the same hairstyle.The remaining rows illustrate the failure cases: the secondrow provides examples of the hazardous cases for conveniencepurposes, in which due to similarities in pose, accessories andsoft biometric labels between the query and gallery images,false matches have occurred. Finally, the bottom row providesexamples of security sensitive cases, where the IDs of thequeries were retrieved in high positions (ranks 56, 73 and98), i.e., the system failed to detect a subject of interest ina crowd.
The challenges of long-term re-identification are illustratedin Fig. 12, providing the differences between the probabilitiesof obtaining a top-i correct identification (hit), ∀i ∈ 1, . . . , n,i.e., retrieve the identity corresponding to a query up to the ith
position, for the search and re-identification problems. Here,Ps(i) and Pr (i) denote the probabilities of observing a hitin the search Ps and re-identification Pr tasks, i.e., negative(Ps(i) - Pr (i)
)denote higher probabilities for re-identification
success than for search success. The zoomed-in region givenat the right part of the Figure shows the additional diffi-culty (of almost 40 percentual points) in retrieving the true
Authorized licensed use limited to: b-on: UNIVERSIDADE DA BEIRA INTERIOR. Downloaded on May 11,2021 at 14:02:52 UTC from IEEE Xplore. Restrictions apply.
Soft Biometrics Analysis in Outdoor Environments
171

1706 IEEE TRANSACTIONS ON INFORMATION FORENSICS AND SECURITY, VOL. 16, 2021
Fig. 11. Examples of the instances where good/poor pedestrian searchperformance was observed. The upper row illustrates particularly successfulcases, while the bottom rows show pairs of images where the used algorithmhad notorious difficulties to retrieve the correct identity. “Q” representsthe query image and “Rank-i” provides the rank of the retrieved galleryimage.
Fig. 12. Differences between the probability of retrieving the true identityof a query among the top-i positions, ∀i ∈ 1, . . . , 100, for the pedes-trian long-term re-identification (Ps ) and short-term re-identification (Pr )problems.
identity in a single shot (difference between top-1 values).Then, the gap between the accumulated values of Ps and Pr
decreases in a monotonous way, and only approaches 0 nearthe full penetration rate, i.e., when all the known identities areretrieved for a query. In summary, it is much more difficult toidentify pedestrians when no clothing information can be used,which paves the way for further developments in this kind oftechnology. According to our goals in developing this datasource, the P-DESTRE set is a tool to support such advancesin the state-of-the-art.
V. CONCLUSION
This paper announced the availability of the P-DESTREdataset, which provides video sequences of pedestrians takenfrom UAVs in outdoor environments. The key point of the
P-DESTRE set is to provide full annotations that enable theresearch on long-term pedestrian re-identification, where thetime elapsed between consecutive observations of IDs forbidsthe use of clothing-based features. Apart this, the P-DESTREset is also suitable for research on UAV/video-based pedes-trian detection, tracking, short-term re-identification and softbiometrics analysis.
Additionally, as a secondary contribution, we offered theresults of our own evaluation of the state-of-the-art in thepedestrian detection, tracking and short-term re-identificationproblems, comparing the performance attained in data acquiredfrom stationary (CCTV) and from moving/UAV devices. Suchresults point for a particular hardness of the existing solutionsto detect and track subjects UAV-based data. In opposition,the existing short-term re-identification techniques appear tobe relatively robust to the features typical of UAV-baseddata.
Overall, the decreases in performance observed from CCTVto UAV-based data support the originality and usefulness ofP-DESTRE. hence, potential directions for further develop-ments of long-term UAV-based re-identification include the useof attention-based networks that disregard portions of the inputdata known to be ineffective for long-term re-identification(e.g., clothes or hairstyles). Another important field will bethe development of domain adaptation techniques robust tochanges in the UAV-acquisition settings and environmentsheterogeneity.
REFERENCES
[1] M. Ahmed, M. Jahangir, H. Afzal, A. Majeed, and I. Siddiqi,“Using crowd-source based features from social media and con-ventional features to predict the movies popularity,” in Proc. IEEEInt. Conf. Smart City/SocialCom/SustainCom (SmartCity), Dec. 2015,pp. 273–278.
[2] P. Bergmann, T. Meinhardt, and L. Leal-Taixe, “Tracking withoutbells and whistles,” 2019, arXiv:1903.05625. [Online]. Available:http://arxiv.org/abs/1903.05625
[3] K. Bernardin and R. Stiefelhagen, “Evaluating multiple object track-ing performance: The CLEAR MOT metrics,” EURASIP J. ImageVideo Process., vol. 2008, pp. 1–10, Dec. 2008, doi: 10.1155/2008/246309.
[4] E. Bochinski, V. Eiselein, and T. Sikora, “High-speed tracking-by-detection without using image information,” in Proc. 14th IEEE Int.Conf. Adv. Video Signal Based Surveill. (AVSS), Aug. 2017, pp. 1–6,doi: 10.1109/avss.2017.8078516.
[5] E. Bochinski, T. Senst, and T. Sikora, “Extending IOU based multi-object tracking by visual information,” in Proc. 15th IEEE Int. Conf. Adv.Video Signal Based Surveill. (AVSS), Nov. 2018, pp. 1–6, doi: 10.1109/avss.2018.8639144.
[6] M. Bonetto, P. Korshunov, G. Ramponi, and T. Ebrahimi, “Pri-vacy in mini-drone based video surveillance,” in Proc. Work-shop De-Identificat. Privacy Protection Multimedia, 2015, pp. 1–3,doi: 10.13140/RG.2.1.4078.5445.
[7] J. Dai, Y. Li, K. He, and J. Sun, “R-FCN: Object detection via region-based fully convolutional networks,” in Proc. Int. Conf. Neural Inf.Process. Syst., 2016, pp. 379–387.
[8] J. Deng, J. Guo, N. Xue, and S. Zafeiriou, “ArcFace: Additive angularmargin loss for deep face recognition,” in Proc. IEEE/CVF Conf.Comput. Vis. Pattern Recognit. (CVPR), Jun. 2019, pp. 4690–4699,doi: 10.1109/cvpr.2019.00482.
[9] D. Du et al., “The unmanned aerial vehicle benchmark: Objectdetection and tracking,” in Proc. Eur. Conf. Comput. Vis., 2018,pp. 370–386.
[10] M. Everingham, S. Eslami, L. Van Gool, C. Williams, J. Winn,and A. Zisserman, “The PASCAL visual object classes challenge: Aretrospective,” Int. J. Comput. Vis., vol. 111, no,. 1, pp. 318–327,2015.
Authorized licensed use limited to: b-on: UNIVERSIDADE DA BEIRA INTERIOR. Downloaded on May 11,2021 at 14:02:52 UTC from IEEE Xplore. Restrictions apply.
Soft Biometrics Analysis in Outdoor Environments
172

KUMAR et al.: P-DESTRE: A FULLY ANNOTATED DATASET FOR PEDESTRIAN DETECTION, TRACKING 1707
[11] A. Grigorev, Z. Tian, S. Rho, J. Xiong, S. Liu, and F. Jiang, “Deep personre-identification in UAV images,” EURASIP J. Adv. Signal Process.,vol. 2019, no. 1, p. 54, Dec. 2019, doi: 10.1186/s13634-019-0647-z.
[12] I. Guyon, J. Makhoul, R. Schwartz, and V. Vapnik, “What size testset gives good error rate estimates?” IEEE Trans. Pattern Anal. Mach.Intell., vol. 20, no. 1, pp. 52–64, Feb. 1998.
[13] K. He, G. Gkioxari, P. Dollar, and R. Girshick, “Person re-identification by descriptive and discriminative classification,” 2018,arXiv:1703.06870v3. [Online]. Available: https://arxiv.org/abs/1703.06870v3
[14] M. Hirzer, C. Beleznai, P. Roth, and H. Bischof, “Person re-identificationby descriptive and discriminative classification,” in Proc. Scandin. Conf.Image Anal., 2011, pp. 91–102.
[15] I. Kalra, M. Singh, S. Nagpal, R. Singh, M. Vatsa, and P. B. Sujit,“DroneSURF: Benchmark dataset for drone-based face recognition,”in Proc. 14th IEEE Int. Conf. Autom. Face Gesture Recognit. (FG),May 2019, pp. 1–7.
[16] R. Layne, T. Hospedales, and S. Gong, “Investigating open-world personre-identification using a drone,” in Proc. Eur. Conf. Comput. Vis., 2014,pp. 225–240.
[17] W. Li, R. Zhao, T. Xiao, and X. Wang, “DeepReID: Deep filterpairing neural network for person re-identification,” in Proc. IEEE Conf.Comput. Vis. Pattern Recognit., Jun. 2014, pp. 152–159, doi: 10.1109/cvpr.2014.27.
[18] J. Li, J. Wang, Q. Tian, W. Gao, and S. Zhang, “Global-local temporal representations for video person re-identification,”2019, arXiv:1908.10049. [Online]. Available: http://arxiv.org/abs/1908.10049
[19] T.-Y. Lin, P. Goyal, R. Girshick, K. He, and P. Dollar, “Focal loss fordense object detection,” IEEE Trans. Pattern Anal. Mach. Intell., vol. 42,no. 2, pp. 318–327, Feb. 2020.
[20] Y. Liu et al., “IQIYI-VID: A large dataset for multi-modal personidentification,” 2018, arXiv:1811.07548. [Online]. Available: http://arxiv.org/abs/1811.07548
[21] W. Liu et al., “SSD: Single shot multibox detector,” in Proc. Eur. Conf.Comput. Vis., 2016, pp. 21–37, doi: 10.1007/978-3-319-46448-0_2.
[22] C. T. Liu, C. W. Wu, Y. C. F. Wang, and S. Y. Chien, “Spatiallyand temporally efficient non-local attention network for video-basedperson re-identification,” in Proc. Brit. Mach. Vis. Conf., 2019, pp. 1–13.[Online]. Available: https://arxiv.org/abs/1908.01683
[23] I. Mademlis et al., “High-level multiple-UAV cinematography toolsfor covering outdoor events,” IEEE Trans. Broadcast., vol. 65, no. 3,pp. 627–635, Sep. 2019.
[24] M. Mueller, N. Smith, and B. Ghanem, “A benchmark and simulator forUAV tracking,” in Proc. Eur. Conf. Comput. Vis., 2016, pp. 445–461,doi: 10.1007/978-3-319-46448-0_27.
[25] M. Najibi, P. Samangouei, R. Chellappa, and L. S. Davis, “SSH:Single stage headless face detector,” in Proc. IEEE Int. Conf.Comput. Vis. (ICCV), Oct. 2017, pp. 4875–4884, doi: 10.1109/iccv.2017.522.
[26] X. Qian et al., “Long-term cloth-changing person re-identification,”2020, arXiv:2005.12633. [Online]. Available: http://arxiv.org/abs/2005.12633
[27] E. Ristani, F. Solera, R. Zou, R. Cucchiara, and C. Tomasi, “Performancemeasures and a data set for multi-target, multi-camera tracking,” inProc. Eur. Conf. Comput. Vis. Workshops, 2016, pp. 17–35. [Online].Available: http://arXiv:1609.01775v2, 2016.
[28] A. Robicquet, A. Sadeghian, A. Alahi, and S. Savarese, “Learning socialetiquette: Human trajectory prediction in crowded scenes,” in Proc. Eur.Conf. Comput. Vis., 2016, pp. 549–565, doi: 10.1007/978-3-319-46484-8_33.
[29] N. Ruiz, E. Chong, and J. M. Rehg, “Fine-grained head pose esti-mation without keypoints,” in Proc. IEEE/CVF Conf. Comput. Vis.Pattern Recognit. Workshops (CVPRW), Jun. 2018, pp. 2074–2083,doi: 10.1109/cvprw.2018.00281.
[30] A. Singh, D. Patil, and S. N. Omkar, “Eye in the sky: Real-timedrone surveillance system (DSS) for violent individuals identificationusing ScatterNet hybrid deep learning network,” in Proc. IEEE/CVFConf. Comput. Vis. Pattern Recognit. Workshops (CVPRW), Jun. 2018,pp. 1629–1637, doi: 10.1109/cvprw.2018.00214.
[31] A. Subramaniam, A. Nambiar, and A. Mittal, “Co-segmentationinspired attention networks for video-based person re-identification,”in Proc. IEEE/CVF Int. Conf. Comput. Vis. (ICCV), Oct. 2019,pp. 562–572.
[32] X. Wang and R. Zhao, “Person re-identification: System design and eval-uation overview,” in Person Re-Identification. London, U.K.: Springer,2014, doi: 10.1007/978-1-4471-6296-4_17.
[33] N. Wojke, A. Bewley, and D. Paulus, “Simple online and realtimetracking with a deep association metric,” in Proc. IEEE Int. Conf. ImageProcess. (ICIP), Sep. 2017, pp. 3645–3649.
[34] Y. Wu, Y. Lin, X. Dong, Y. Yan, W. Ouyang, and Y. Yang,“Exploit the unknown gradually: One-shot video-based person re-identification by stepwise learning,” in Proc. IEEE/CVF Conf. Com-put. Vis. Pattern Recognit., Jun. 2018, pp. 5177–5186, doi: 10.1109/cvpr.2018.00543.
[35] G.-S. Xia et al., “DOTA: A large-scale dataset for object detection inaerial images,” in Proc. IEEE/CVF Conf. Comput. Vis. Pattern Recognit.,Jun. 2018, pp. 3974–3983, doi: 10.1109/cvpr.2018.00418.
[36] M. Ye, J. Shen, G. Lin, T. Xiang, L. Shao, and S. C. H.Hoi, “Deep learning for person re-identification: A survey and out-look,” 2020, arXiv:2001.04193. [Online]. Available: http://arxiv.org/abs/2001.04193
[37] L. Zheng, L. Shen, L. Tian, S. Wang, J. Wang, and Q. Tian,“Scalable person re-identification: A benchmark,” in Proc. IEEE Int.Conf. Comput. Vis. (ICCV), Dec. 2015, pp. 1116–1124, doi: 10.1109/iccv.2015.133.
[38] S. Zheng, J. Zhang, K. Huang, R. He, and T. Tan, “Robust viewtransformation model for gait recognition,” in Proc. 18th IEEEInt. Conf. Image Process., Sep. 2011, pp. 2073–2076, doi: 10.1109/icip.2011.6115889.
[39] L. Zheng et al., “MARS: A video benchmark for large-scale per-son re-identification,” in Proc. Eur. Conf. Comput. Vis., in LectureNotes in Computer Science, vol. 9910. London, U.K.: Springer, 2016,pp. 868–884.
[40] P. Zhu, L. Wen, X. Bian, H. Ling, and Q. Hu, “Vision meetsdrones: A challenge,” 2018, arXiv:1804.07437. [Online]. Available:http://arxiv.org/abs/1804.07437
S. V. Aruna Kumar received the Ph.D. degreein computer science and engineering from Visves-varaya Technological University, India. He was aPost-Doctoral Researcher with the University ofBeira Interior, Portugal. He is currently workingas an Assistant Professor with the Department ofComputer Science and Engineering, Ramaiah Uni-versity of Applied Sciences, Bengaluru, India. Hisresearch interests include biometrics and medicalimage processing.
Ehsan Yaghoubi (Member, IEEE) received theB.Sc. degree from the Sadjad University of Tech-nology in 2011 and the M.Sc. degree from the Uni-versity of Birjand in 2016. He is currently pursuingthe Ph.D. degree in biometrics with the Universityof Beira Interior, Portugal. His research interestsbroadly include computer vision and pattern recogni-tion problems, with a particular focus on biometricsand surveillance.
Abhijit Das (Member, IEEE) received the Ph.D.degree from the School of Information and Commu-nication Technology, Griffith University, Australia.He has worked as a Researcher with the Universityof Southern California, as a Post-Doctoral
Researcher with the Inria Sophia Antipolis-Méditerranée, France, and as a Research Adminis-trator with the University of Technology Sydney,Ultimo, NSW, Australia. He is currently a Visit-ing Scientist with the Indian Statistical Institute,Kolkata. During his research career, he has published
several scientific articles in conferences, journals and a book chapter, havingalso received several awards. He is also involved in organizing scientificevents.
Authorized licensed use limited to: b-on: UNIVERSIDADE DA BEIRA INTERIOR. Downloaded on May 11,2021 at 14:02:52 UTC from IEEE Xplore. Restrictions apply.
Soft Biometrics Analysis in Outdoor Environments
173

1708 IEEE TRANSACTIONS ON INFORMATION FORENSICS AND SECURITY, VOL. 16, 2021
B. S. Harish received the B.Eng. degree in elec-tronics and communication and the master’s degreein technology (networking and internet engineering)from Visvesvaraya Technological University, India,and the Ph.D. degree in computer science from theUniversity of Mysore.
He was a Visiting Researcher with DIBRIS,Department of Informatics, Bio Engineering, Robot-ics and System Engineering, University of Genova,Italy. He is currently working as a Professor with theDepartment of Information Science and Engineering,
JSS Science and Technology University, India. His research interests includemachine learning, text mining, and computational intelligence. He is servingas a reviewer for many international journals and served as the TechnicalProgram Chair for International Conferences. He successfully executed gov-ernment funded projects sanctioned from the Government of India. He is aMember Life Member CSI (09872), a Life Member INSTICC (12844), a LifeMember Institute of Engineers, and a Life Member ISTE.
Hugo Proença (Senior Member, IEEE) received theB.Sc., M.Sc., and Ph.D. degrees from the Universityof Beira Interior in 2001, 2004, and 2007, respec-tively. He is currently an Associate Professor withthe Department of Computer Science, Universityof Beira Interior. He has been researching mainlyabout biometrics and visual-surveillance. He was theCoordinating Editor of the IEEE Biometrics CouncilNewsletter and the Area Editor (ocular biometrics)of the IEEE BIOMETRICS COMPENDIUM JOUR-NAL. He is a member of the Editorial Boards of
the Image and Vision Computing, IEEE ACCESS, and International Journalof Biometrics. Also, he served as a Guest Editor of Special Issues of thePattern Recognition Letters, Image and Vision Computing, and Signal, Image,and Video Processing Journals.
Authorized licensed use limited to: b-on: UNIVERSIDADE DA BEIRA INTERIOR. Downloaded on May 11,2021 at 14:02:52 UTC from IEEE Xplore. Restrictions apply.
Soft Biometrics Analysis in Outdoor Environments
174

800 IEEE TRANSACTIONS ON INFORMATION FORENSICS AND SECURITY, VOL. 16, 2021
A Quadruplet Loss for Enforcing SemanticallyCoherent Embeddings in Multi-Output
Classification ProblemsHugo Proença , Senior Member, IEEE, Ehsan Yaghoubi, and Pendar Alirezazadeh
Abstract— This article describes one objective functionfor learning semantically coherent feature embeddings inmulti-output classification problems, i.e., when the responsevariables have dimension higher than one. Such coherent embed-dings can be used simultaneously for different tasks, such asidentity retrieval and soft biometrics labelling. We proposea generalization of the triplet loss that: 1) defines a metricthat considers the number of agreeing labels between pairs ofelements; 2) introduces the concept of similar classes, accordingto the values provided by the metric; and 3) disregards the notionof anchor, sampling four arbitrary elements at each time, fromwhere two pairs are defined. The distances between elementsin each pair are imposed according to their semantic similarity(i.e., the number of agreeing labels). Likewise the triplet loss,our proposal also privileges small distances between positivepairs. However, the key novelty is to additionally enforce thatthe distance between elements of any other pair correspondsinversely to their semantic similarity. The proposed loss yieldsembeddings with a strong correspondence between the classescentroids and their semantic descriptions. In practice, it is anatural choice to jointly infer coarse (soft biometrics) + fine (ID)labels, using simple rules such as k-neighbours. Also, in oppositionto its triplet counterpart, the proposed loss appears to be agnosticwith regard to demanding criteria for mining learning instances(such as the semi-hard pairs). Our experiments were carried outin five different datasets (BIODI, LFW, IJB-A, Megaface andPETA) and validate our assumptions, showing results that arecomparable to the state-of-the-art in both the identity retrievaland soft biometrics labelling tasks.
Index Terms— Feature embedding, soft biometrics, identityretrieval, convolutional neural networks, triplet loss.
I. INTRODUCTION
CHARACTERIZING pedestrians in crowds has beenattracting growing attention, with soft biometrics
(e.g., gender, ethnicity or age) being particularly importantto determine the identities in a scene. This kind of labelsis closely related to human perception and describes thevisual appearance of subjects, with applications in identityretrieval [36], [40] and person re-identification [15], [27].
Manuscript received April 2, 2020; revised July 24, 2020 and August 26,2020; accepted August 29, 2020. Date of publication September 10, 2020;date of current version September 30, 2020. This work was supported bythe FCT/MCTES through National funds and co-funded by EU funds underthe Project UIDB/50008/2020, and by the Fundo de Coesão and FundoSocial Europeu, (FEDER), PT2020 Program, under the Grant POCI-01-0247-FEDER-033395. The associate editor coordinating the review of thismanuscript and approving it for publication was Dr. Andrew Beng Jin Teoh.(Corresponding author: Hugo Proença.)
The authors are with the Department of Computer Science, IT-Instituto deTelecomunicações, University of Beira Interior, 6200-001, Covilhã, Portugal(e-mail: [email protected]; [email protected]; [email protected]).
Digital Object Identifier 10.1109/TIFS.2020.3023304
Deep learning frameworks have been repeatedly improvingthe state-of-the-art in many computer vision tasks, such asobject detection and classification [25], [41], action recog-nition [6], [19], semantic segmentation [24], [44] and softbiometrics inference [32]. In this context, the triplet loss [34]is a popular concept, where three learning elements areconsidered at a time, two of them of the same class and athird one of a different class. By imposing larger distancesbetween the elements of the negative than of the positivepair, the intra-class compactness and inter-class discrepancy inthe destiny space are enforced. This strategy was successfullyapplied to various problems, upon the mining of the semi-hardnegative input pairs, i.e., cases where the negative element isfarther to the anchor than the positive, but still provides apositive loss due to an imposed margin.
This article describes one objective function that is ageneralization of the triplet loss. Instead of dividing thelearning pairs into positive/negative, we define a metric toperceive the semantic similarity between two classes (IDs).In learning time, four elements are considered at a time andthe margins between the pairwise distances yield from thenumber of agreeing labels in each pair (Fig. 1). Under thisformulation, elements of similar classes (e.g., two “young,black, bald, male” subjects) are projected into adjacent regionsof the destiny space. Also, as we impose different marginsbetween (almost) all negative pairs, we leverage the difficultiesin mining appropriate learning instances, which is one of themain difficulties in the triplet loss formulation.
The proposed loss function is particularly suitable forcoarse-to-fine classification problems, where some labels areeasier to infer than others and the global problem can bedecomposed into more tractable sub-components. This hierar-chical paradigm is known to be an efficient way of organizingobject recognition, not only to accommodate a large numberof hypotheses, but also to systematically exploit the sharedattributes. Under this paradigm, the identity retrieval problemis of particular interest, where the finest labels (IDs) are seenas the leaves of hierarchical structures with roots such as thegender or ethnicity features. However, note that the proposedformulation does not appropriately handle soft labels that varyamong different images of a subject (e.g., hairstyle). Also,it does not take into account the varying difficulty of estimatingthe different labels, allowing further improvements based inmetric learning concepts.
The remainder of this article is organized as follows:Section II summarizes the most relevant research in the scope
1556-6013 © 2020 IEEE. Personal use is permitted, but republication/redistribution requires IEEE permission.See https://www.ieee.org/publications/rights/index.html for more information.
Authorized licensed use limited to: b-on: UNIVERSIDADE DA BEIRA INTERIOR. Downloaded on May 11,2021 at 14:02:23 UTC from IEEE Xplore. Restrictions apply.
Soft Biometrics Analysis in Outdoor Environments
175

PROENÇA et al.: QUADRUPLET LOSS FOR ENFORCING SEMANTICALLY COHERENT EMBEDDINGS 801
Fig. 1. Likewise the triplet loss [34], the proposed quadruplet formula-tion minimizes the distances between elements of positive pairs A1, A2.However, the key novelty is to additionally consider the semantic similaritybetween classes (A, B and C). In this example, assuming that A and B aresemantically similar, our proposal privileges embeddings where the distancesbetween (A., B) elements are smaller than the distances between (A., C) andbetween (B, C) elements.
of our work. Section III describes the proposed objectivefunction. In Section IV we discuss the obtained results andthe conclusions are given in Section V.
II. RELATED WORK
Deep learning methods for biometrics can be roughlydivided into two major groups: 1) methods that directly learnmulti-class classifiers used in identity retrieval and soft bio-metrics inference; and 2) methods that learn low-dimensionalfeature embeddings, where inference yields from nearestneighbour search.
A. Soft Biometrics and Identity Retrieval
Bekele et al. [2] proposed a residual network for multi-output inference that handles classes-imbalance directly inthe cost function, without depending of data augmenta-tion techniques. Almudhahka et al. [1] explored the con-cept of comparative soft biometrics and assessed the impactof automatic estimations on face retrieval performance.Guo et al. [12] studied the influence of distance in theeffectiveness of body and facial soft biometrics, introducinga joint density distribution based rank-score fusion strat-egy [13]. Vera-Rodriguez et al. [31] used hand-crafted fea-tures extracted from the distances between key points inbody silhouettes. Martinho-Corbishley et al. [29] introducedthe idea of super-fine soft attributes, describing multiple con-cepts of one trait as multi-dimensional perceptual coordinates.Also, using joint attribute regression and deep residual CNNs,they observed substantially better retrieval performance incomparison to conventional labels. Schumann and Speckerused an ensemble of classifiers for robust attributes infer-ence [35], extended to full body search by combining it with ahuman silhouette detector. He et al. [17] proposed a weightedmulti-task CNN with a loss term that dynamically updates theweight for each task during the learning phase.
Several works regarded the semantic segmentation as a toolto support labels inference: Galiyawala et al. [10] describeda deep learning framework for person retrieval using theheight, clothes’ color, and gender labels, with a segmenta-tion module used to remove clutter. Similarly, Cipcigan andNixon [3] obtained semantically segmented regions of thebody that fed two CNN-based feature extraction and inferencemodules.
Finally, specifically designed for handheld devices,Samangouei and Chellappa [32] extracted various facialsoft biometric features, while Neal and Woodard [26]developed a human retrieval scheme based on thirteendemographic and behavioural attributes from mobile phonesdata, such as calling, SMS and application data, havingauthors positively concluded about the feasibility of this kindof recognition.
A comprehensive summary of the most relevant research insoft biometrics is given in [38].
B. Feature Embeddings and Loss Functions
Triplet loss functions were motivated by the concept of con-trastive loss [14], where the rationale is to penalize distancesbetween positive pairs, while favouring distances betweennegative pairs. Kang et al. [21] used a deep ensemble ofmulti-scale CNNs, each one based on triplet loss functions.Song et al. [37] learned semantic feature embeddings thatlift the vector of pairwise distances within the batch to thematrix of pairwise distances, and described a structured losson the lifted problem. Liu and Huan [28] proposed a tripletloss learning architecture composed of four CNNs, each onelearning features from different body parts that are fused atthe score level.
A posterior concept was the center loss [42], whichfinds a center for each class and penalizes the distancesbetween the projections and their corresponding class center.Jian et al. [20] combined additive margin softmax with centerloss to increase the inter-classes distances and avoid over-confidence on classifications. Ranjan et al.’s crystal loss [30]restricts the features to lie on a hypersphere of a fixed radius,adding a constraint on the features projections such that their2-norm is constant. Chen et al. [4] used deep representationsto feed a Bayesian metrics learning module that maximizes thelog-likelihood ratio between intra- and inter-classes distances.Deng et al.’s Sphereface [8] proposes an additive angularmargin loss, with a clear geometric interpretation due to thecorrespondence to the geodesic distance on the hypersphere.
Observing that CNN-based methods tend to overfit in personre-identification tasks, Shi et al. [36] used siamese architec-tures to provide a joint description to a metric learning module,regularizing the learning process and improving the general-ization ability. Also, to cope with large intra-class variations,they suggested the idea of moderate positive mining, again toprevent overfitting. Motivated by the difficulties in generatelearning instances for triplet loss frameworks, Su et al. [39]performed adaptive CNN fine-tuning, along with an adaptiveloss function that relates the maximum distance among thepositive pairs to the margin demanded for separate positive
Authorized licensed use limited to: b-on: UNIVERSIDADE DA BEIRA INTERIOR. Downloaded on May 11,2021 at 14:02:23 UTC from IEEE Xplore. Restrictions apply.
Soft Biometrics Analysis in Outdoor Environments
176

802 IEEE TRANSACTIONS ON INFORMATION FORENSICS AND SECURITY, VOL. 16, 2021
from negative pairs. Hu et al. [18] proposed an objective func-tion that generalizes the Maximum Mean Discrepancy [33]metric, with a weighting scheme that favours good qualitydata. Duan et al. [9] proposed the uniform loss to learn deepequi-distributed representations for face recognition. Finally,observing the typical unbalance between positive and negativepairs, Wang et al. [41] described an adaptive margin list-wiseloss, in which learning data are provided with a set of negativepairs divided into three classes (easy, moderate, and hard),depending of the distance rank with respect to the query.
Finally, we note the differences between our loss functionand the (also quadruplet) loss described by Chen et al. [5].These authors attempt to augment the inter-classes marginsand the intra-class compactness without explicitly using anysemantical constraint. As in the original triplet loss formula-tion, the concept of similar class doesn’t exist in [5], and thereis no rule to explicitly enforce the projection of identities thatshare most of the labels into neighbour regions of the latentspace. In opposition, our method concerns essentially aboutsuch kind of semantical coherence, i.e., assures that similarclasses are projected into adjacent regions of the embedding.Also, even the idea behind the loss formulation is radicallydifferent in both methods, in the sense that [5] still considersthe concept of anchor (as the triplet-loss), which is also inopposition to our proposal.
III. PROPOSED METHOD
A. Quadruplet Loss: Definition
Consider a supervised classification problem, where t is thedimensionality of the response variable yi associated to theinput element xi ∈ [0, 255]n. Let f (.) be one embeddingfunction that maps xi into a d-dimensional space , withf i = f (xi ) ∈ being the projected vector. Let x1, . . . , xbbe a batch of b images from the learning set. We defineφ(yi , y j ) ∈ N, ∀i, j ∈ 1, . . . , b as the function thatmeasures the semantic similarity between xi and x j :
φ(yi , y j ) = || yi − y j ||0, (1)
with ||.||0 being the 0-norm operator.In practice, φ(., .) counts the number of disagreeing labels
between the xi , x j pair, i.e., φ(yi , y j ) = t when theith and jth elements have fully disjoint classes membership(e.g., one “black, adult, male” and another “white, young,female” subjects), while φ(y1, y2) = 0 when they have theexact same label (class) across all dimensions, i.e., when theyconstitute a positive pair.
Let i, j, p, q be the indices of four images in thebatch. The corresponding quadruplet loss value i, j,p,q isgiven by:i, j,p,q = sgn
(φ(yi , y j )− φ(y p, yq )
)×
[( f p − f q)22 − f i − f j22)+ α
], (2)
where sgn() is the sign function, ||x||22 denotes the square
of the 2-norm of x(||x||2 = (x2
1 + . . . x2n )
12 , i.e., ||x||22 =
x21 + . . . x2
n
)and α is the desired margin (α = 0.1 was used
in our experiments). Evidently, the loss value will be zero
when both image pairs have the same number of agreeinglabels (as sgn(0) = 0 in these cases). In any other case,the sign function will determine the pair which distance inthe embedding should be minimized. As an example, if the(p, q) elements are semantically closer to each other than the(i, j) elements
(φ(yp, yq ) < φ(yi , y j )
), we want to ensure
that f p − f q)22 < f i − f j22.The accumulated loss in the batch is given by the truncated
mean of a sample (of size s) randomly taken from the subsetof the
(b4
)individual loss values where φ(yi , y j ) = φ(y p, yq):
L = 1
s
s∑z=1
[z
]+, (3)
where z ∈ 1, . . . , s4 denotes the zth composition of fourelements in the batch and [.]+ is the max(., 0) function. Evenconsidering that a large fraction of the combinations in thebatch will be invalid (i.e., with φ(., .) = 0), large values of bwill result in an intractable number of combinations at eachiteration. In practical terms, after filtering out those invalidcombinations, we randomly sample a subset of the remaininginstances, which is designated as the mini-batch.
B. Quadruplet Loss: Training
Consider four indices i, j, p, q of elements in the mini-batch, with φ(yi , y j ) > φ(y p, yq). Let φ denote thedifference between the number of disagreeing labels of thei, j and p, q pairs:
φ = φ(yi , y j )− φ(y p, yq ). (4)
Also, let f be the distance between the elements of themost alike pair minus the distance between the elements ofthe least alike pair in the destiny space (plus the margin):
f = f p − f q)22 − f i − f j22 + α. (5)
Upon basic algebraic manipulation, the gradients of L withrespect to the quadruplet terms are given by:
∂L∂ f i=
∑z
2( f j − f i ), if φ > 0 ∧ f ≥ 0
0, otherwise(6)
∂L∂ f j
=∑
z
2( f i − f j ), if φ > 0 ∧ f ≥ 0
0, otherwise(7)
∂L∂ f p
=∑
z
2( f p − f q), if φ > 0 ∧ f ≥ 0
0, otherwise(8)
∂L∂ f q
=∑
z
2( f q − f p), if φ > 0 ∧ f ≥ 0
0, otherwise(9)
In practice terms, the model weights are adjusted only whenpairs have different number of agreeing labels (i.e., φ > 0)and when the distance in the destiny space between theelements of the most similar pair is higher than the distancebetween the elements of the least similar pair (plus the margin, f ≥ 0). According to this idea, using (6)-(9), the deeplearning frameworks supervised by the proposed quadrupletloss are trainable in a way similar to its counterpart triplet
Authorized licensed use limited to: b-on: UNIVERSIDADE DA BEIRA INTERIOR. Downloaded on May 11,2021 at 14:02:23 UTC from IEEE Xplore. Restrictions apply.
Soft Biometrics Analysis in Outdoor Environments
177

PROENÇA et al.: QUADRUPLET LOSS FOR ENFORCING SEMANTICALLY COHERENT EMBEDDINGS 803
Fig. 2. Key difference between the triplet loss [34] formulation and the solution proposed in this article. Using a loss function that analyzes the semanticsimilarity (in terms of soft biometrics) between the different identities, we enforce embeddings (3) that are semantically coherent, i.e., where: 1) elementsof the same class appear near each other; but additionally 2) elements of similar classes appear closer to each other than elements with no labels in common.This is in opposition to the original formulation of the triplet loss, that relies mostly in image appearance to define the geometry of the destiny space, obtaining- in case of noisy image features - semantically incoherent embeddings (e.g., in 1 and 2, classes are compact and discriminative, but the x/z centroidsare too close to each other).
loss and can be optimized according to the standard StochasticGradient Descend (SGD) algorithm, which was done in all ourexperiments.
For clarity purposes, Algorithm 1 gives a pseudocodedescription of the learning phase and of the batch/mini-batchdefinition processes.
Algorithm 1 Pseudocode Description of the Learning Phaseand of the Batch/Mini-Batch Definition ProcessesPrecondition: M: CNN, te: Tot. epochs, s: mini-batch size,
b: batch size, I : Learning set, n imagesfor 1 to te do
for 1 to ns do
b← randomly sample b out of n images from Ic← create
(b4
)quadruplet combinations from b
c∗ ← filter out invalid elements from cs← randomly sample s elements from c∗
M ← update weights(M, s) (eqs. (6-9))end for
end forreturn M
C. Quadruplet Loss: Insight and Example
Fig. 2 illustrates our rationale in the proposed loss. By defin-ing a metric that analyses the similarity between two classes,we create the concept of semantically similar class. Thisenables to explicitly enforce that elements of the least similarclasses (with no common labels) are at the farthest distancesin the embedding. During the learning phase, we samplethe image pairs in a stochastic way and enforce projectionsin a way that resembles the human perception of semanticsimilarity.
As an example, Fig. 3 compares the bidimensional embed-dings resulting from the triplet and the quadruplet losses, forthe LFW identities with more than 15 images in the dataset
(using t = 2 : ‘ID’, ‘Gender’ labels). This plot yieldedfrom the projection of a 128-dimensional embedding down totwo dimensions, according to the Neighbourhood ComponentAnalysis (NCA) [11] algorithm.
It can be seen that the triplet loss provided an embeddingwhere the positions of elements are exclusively determined bytheir appearance, where ‘females’ appear nearby ‘male tennisplayers’ (upper left corner). In opposition, the quadrupletloss established a large margin between both genders, whilekeeping the compactness per ID. This kind of embeddingis interesting: 1) for identity retrieval, to guarantee that allretrieved elements have soft labels equal to the query; 2) upona semantic description of the query (e.g., “find adult whitemales similar to this image”), to guarantee that all retrievedelements meet the semantic criteria; and 3) to use the sameembedding to directly infer fine (ID) + coarse (soft) labels,in a simple k-neighbours fashion.
IV. RESULTS AND DISCUSSION
A. Experimental Setting and Preprocessing
Our empirical validation was conducted in one propri-etary (BIODI) and four freely available datasets (LFW, PETA,IJB-A and Megaface) well known in the biometrics andre-identification literature.
The BIODI1 dataset is proprietary of Tomiworld®,2 beingcomposed of 849,932 images from 13,876 subjects, takenfrom 216 indoor/outdoor video surveillance sequences. Allimages were manually annotated for 14 labels: gender, age,height, body volume, ethnicity, hair color and style, beard,moustache, glasses and clothing (x4). The Labeled Faces inthe Wild (LFW) [16] dataset contains 13,233 images from5,749 identities, collected from the web, with large variationsin pose, expression and lighting conditions. PETA [7] is a com-bination of 10 pedestrian re-identification datasets, composed
1http://di.ubi.pt/~hugomcp/BIODI/2https://tomiworld.com/
Authorized licensed use limited to: b-on: UNIVERSIDADE DA BEIRA INTERIOR. Downloaded on May 11,2021 at 14:02:23 UTC from IEEE Xplore. Restrictions apply.
Soft Biometrics Analysis in Outdoor Environments
178

804 IEEE TRANSACTIONS ON INFORMATION FORENSICS AND SECURITY, VOL. 16, 2021
Fig. 3. Comparison between the 2D embeddings resulting from the tripletloss [34] (top plot), and from the proposed quadruplet loss (bottom plot).Results are given for t = 2 features ‘ID’, ‘Gender’ for the LFW identitieswith at least 15 images (89 elements).
of 19,000 images from 8,705 subjects, each one annotatedwith 61 binary and 4 multi-output atributes. The IIJB-A [23]dataset contains 5,397 images plus 20,412 video frames from500 individuals, with large variations in pose and illumination.Finally, the Megaface [22] set was released to evaluate facerecognition performance at the million scale, and consists ofa gallery set and a probe set. The gallery set is a subsetof Flickr photos from Yahoo (more than 1,000,000 imagesfrom 690,000 subjects). The probe dataset includes FaceScruband FGNet sets. FaceScrub has 100,000 images from 530individuals and FGNet contains 1,002 images of 82 identities.Some examples of the images in each dataset are givenin Fig. 4.
B. Convolutional Neural Networks
Two CNN architectures were considered: the VGG andResNet models (Fig. 5). Here, the idea was not only tocompare the performance of the quadruplet loss with respect tothe baselines, but also to perceive the variations in performancewith respect to different CNN architectures. A TensorFlowimplementation of both architectures is available at.3
3https://github.com/hugomcp/quadruplets
Fig. 4. Datasets used in the empirical validation of the method proposedin this article. From top to bottom rows, images of the BIODI, PETA, LFW,Megaface and IJB-A sets are shown.
All the models were initialized with random weights,from zero-mean Gaussian distributions with standard devia-tion 0.01 and bias 0.5. Images were resized to 256 × 256,adding lateral white bands when needed to keep constantratios. A batch size of 64 was defined, which results in toomany combinations of pairs for the triplet/quadruplet losses.At each iteration, we filtered out the invalid triplets/quadrupletsinstances and randomly selected the mini-batch elements, com-posed of 64 instances in all cases. For every baseline, 64 pairswere also used as a batch. The learning rate started from 0.01,with momentum 0.9 and weight decay 5e−4. In the learning-from-scratch paradigm, we stopped the learning processwhen the validation loss didn’t decrease for 10 iterations(i.e., patience=10).
We initially varied the dimensionality of the embedding (d)to perceive the sensitivity of the proposed method with respectto this parameter. Considering the LFW set, the average AUCvalues with respect to d are provided in Fig. 6 (the shadowedregions denote the ± standard deviation performance, after10 trials). As expected, higher values for d were directlycorrelated to performance, even though results stabilised fordimensions higher than 128. In this regard, we assumed thatusing higher dimensions would require much more trainingdata, having resorted from this moment to d = 128 in allsubsequent experiments.
Interestingly, the absolute performance observed for verylow d values was not too far of the obtained for much higherdimensions, which raises the possibility of using the positionof the elements in the destiny space directly for classificationand visualization, without the need of any dimensionality
Authorized licensed use limited to: b-on: UNIVERSIDADE DA BEIRA INTERIOR. Downloaded on May 11,2021 at 14:02:23 UTC from IEEE Xplore. Restrictions apply.
Soft Biometrics Analysis in Outdoor Environments
179

PROENÇA et al.: QUADRUPLET LOSS FOR ENFORCING SEMANTICALLY COHERENT EMBEDDINGS 805
Fig. 5. Architectures of the CNNs used in the experiments. The yellow boxesrepresent convolutional layers, and the blue and green boxes represent poolingand dropout (keeping probability 0.75) layers. Finally, the red boxes denotefully connected layers. In the ResNet architecture, the dashed skip connectionsrepresent convolutions with stride 2 × 2, yielding outputs with half of thespatial input size. The ‘/2’ symbol denotes stride 2 × 2 (the remaining layersuse stride 1 × 1).
reduction algorithm (MDS, LLE or PCA algorithms are fre-quently seen in the literature for this purpose).
C. Single- vs. Multi-Output Embeddings Learning:Semantical Coherence
To compare the semantical coherence of the embed-dings resulting from single-output (triplet and Chen et al.’slosses) and multi-output (ours) learning formulations, we mea-sured the distances (2-norm) between each element in an
Fig. 6. Variations in the mean AUC values (± the standard deviations after10 trials, given as shadowed regions) with respect to the dimensionality ofthe embedding. Results are shown for the LFW validation set, when usingthe VGG-like (solid line) and ResNet-like (dashed line) CNN architectures.
embedding and all the others, grouping values into two sets:1) intra-label observations, when two elements share a specificlabel (e.g., ‘male’/‘male’ or ‘asian’/‘asian’); and 2) inter-labels observations, in case of different labels in the pair(e.g., ‘male’/‘female’ or ‘asian’/‘black’). In practice, we mea-sured the distances between elements of the same/differentID, gender, ethnicity and joint gender+ethnicity labels. Notethat, in all cases, a unique embedding was obtained foreach method, using the ID as feature for the tripletand Chen et al. methods, and the ID, Gender, Ethnicity(t = 3) for the proposed method, with the annotations for theIJB-A set provided by the Face++ algorithm and subjected tohuman validation. The VGG-like architecture was considered,as described in Section IV-B.
The results are given in Fig. 7 (LFW, Megaface and IJB-Asets). The green color represents the statistics of the intra-labelvalues, while the red color represents the inter-labels values.Box plots show the median of the distance values (horizontalsolid lines) and the first and third quartiles (top and bottom ofthe box marks). The upper and lower whiskers are denoted bythe horizontal lines outside each box. All outliers are omitted,for visualisation purposes.
The leftmost group in each dataset is the root for theID retrieval performance, and compares the distances in theembeddings between elements that have the same/differentIDs. The remaining cases are the most important for ourpurposes, and provide the distances between elements thatshare (or not) some label: the second group compares the‘male’/‘male and ‘female’/‘female’ distances (green boxes) to‘male’/‘female’ values (red boxes). The third group providesthe corresponding results for the ethnicity label, while therightmost group provides the distances when jointly consider-ing the gender and ethnicity features, i.e., when two elementsconstitute an intra-label pair iff they have the same genderand ethnicity labels.
These results turn evident the different properties of theembeddings yielding from the proposed loss with respect tothe baselines. If we consider exclusively the ID to measurethe distances between elements, the results almost do notvary among all methods. However, a different conclusioncan be drawn when measuring the distances between thesame/different gender, ethnicity and gender/ethnicity labels.Here, the proposed quadruplet loss was the unique methodwhere the intra-label/inter-labels whiskers provided disjoint
Authorized licensed use limited to: b-on: UNIVERSIDADE DA BEIRA INTERIOR. Downloaded on May 11,2021 at 14:02:23 UTC from IEEE Xplore. Restrictions apply.
Soft Biometrics Analysis in Outdoor Environments
180

806 IEEE TRANSACTIONS ON INFORMATION FORENSICS AND SECURITY, VOL. 16, 2021
Fig. 7. Box plots of the distances between each element in the embedding with respect to others that share the same (green color) or different (red color)labels. We compare the multi-output learning solution proposed in this article (Quadruplet), with respect to the single-output learning methods (Triplet [34]and Chen et al. [5]). Values regard the LFW (top plot), Megaface (center plot) and IJB-A (bottom plot) sets, measuring the ID, Gender, Ethnicity andGender, Ethnicity same/different label distances.
intersections, by a solid margin in all cases, i.e., the differencebetween the intra-label/inter-labels distances was far largerthan in the remaining losses. Of course, such differences aredue to the fact that the triplet and Chen et al. methods havenot considered additional soft labels to define the topology ofthe embeddings, having exclusively resorted to the ID labelsand images appearance for such purpose.
In practice, these experiments turn evident that single-labellearning formulation yield embeddings that are semanticallyincoherent from other labels’ perspectives, in the sense that‘males’ are often nearby ‘females’, or ‘white’ nearby ‘asian’elements. In this setting, using such embeddings for simulta-neously ID retrieval and soft biometrics labelling is risky, anderrors will often occur. In opposition, the proposed loss guar-antees large margins between groups of intra-label/inter-labelsobservations, typically corresponding to clusters in the embed-dings with respect to the set of learning labels considered.
D. Identity Retrieval
Even considering that the goals of our proposal are beyondthe ID retrieval performance, it is important to comparethe performance of the quadruplet loss with respect to thebaselines in this task. As in the previous experiment, notethat all the baselines (triplet loss, center loss, softmax andChen et al. [5]) considered exclusively the ID to infer theembeddings, while the proposed loss used all the availablelabels for that purpose.
Fig. 8 provides the Cumulative Match curves (CMC, outerplots) and the Detection and Identification rates at rank-1(DIR, inner plots). The results are also summarized in Table I,
reporting the rank-1, top-10% values and the mean averageprecision (mAP) scores, given by:
mAP =∑n
q=1 P(q)
n, (10)
where n is the number of queries, P(q) =∑nk=1 P(k)r(k),
P(k) is the precision at cut-off k and r(k) is the change inrecall from k − 1 to k.
For the LFW set experiment, the BLUFR4 evaluation pro-tocol was chosen. In the verification (1:1) setting, the testset contained 9,708 face images of 4,249 subjects, whichyielded over 47 million matching scores. For the open-setidentification problem, the genuine probe set contained4,350 face images of 1,000 subjects, the impostor probe sethad 4,357 images of 3,249 subjects, and the gallery set had1,000 images. This evaluation protocol was the basis to design,for the other sets, as close as possible experiments, in termsof the number of matching scores, gallery and probe sets.
Generally, we observed that the proposed quadruplet lossoutperforms the other loss functions, which might be theresult of having used additional information for learning.These improvements in performance were observed in mostcases by a consistent margin for both the verification andidentification tasks, not only for the VGG but also for theResNet architecture.
In terms of the errors per CNN architecture, the ResNet-likeerror rates were roughly 0.9 × (90%) of the observedfor the VGG-like networks (higher margins were observedfor the softmax loss). Not surprisingly, the Chen et al. [5]’
4http://www.cbsr.ia.ac.cn/users/scliao/projects/blufr/
Authorized licensed use limited to: b-on: UNIVERSIDADE DA BEIRA INTERIOR. Downloaded on May 11,2021 at 14:02:23 UTC from IEEE Xplore. Restrictions apply.
Soft Biometrics Analysis in Outdoor Environments
181

PROENÇA et al.: QUADRUPLET LOSS FOR ENFORCING SEMANTICALLY COHERENT EMBEDDINGS 807
Fig. 8. Identity retrieval results. The outer plots provide the closed-set identification (CMC) curves for the LFW, Megaface and IJB-A sets, using the VGGand ResNet architectures. Inside each plot, the inner regions show the corresponding detection and identification rate (DIR) values at rank-1. Results areshown for the quadruplet loss function (purple color), and four baselines: the softmax (red color), center loss (green color), triplet loss (blue color) andChen et al. [5]’s (black color) method.
method outperformed the remaining competitors, followed bythe triplet loss function, which is consistent with most ofthe results reported in the literature. The softmax loss gotrepeatedly the worst performance among the five functionsconsidered.
Regarding the performance per dataset, the values observedfor Megaface were far worse for all objective functionsthan the values for LFW and IJB-A. In the Megaface set,we followed the protocol of the small training set, using490,000 images from 17,189 subjects (images overlappingwith Facescrub dataset were discarded). Also, note that therelative performance between the loss functions was roughlythe same in all sets. Degradations in performance were slightfrom the LFW to the IJB-A set and much more visible in caseof the Megaface set. In this context, the softmax loss producedthe most evident degradations, followed by the center loss.
E. Soft Biometrics Inference
As stated above, the proposed loss can also be used forlearning a soft biometrics estimator. In test time, the position towhere one element is projected is used to infer the soft labels,in a simple nearest neighbour fashion. In these experiments,we considered only 1-NN, i.e., the label inferred for each querywas given by the closest gallery element. Better results wouldbe possibly attained if more neighbours had been considered,even though the computational cost of classification will alsoincrease. All experiments were conducted according to a
bootstrapping-like strategy: having n test images available,the bootstrap randomly selected (with replacement) 0.9 × nimages, obtaining samples composed of 90% of the wholedata. Ten test samples were created and the experiments wereconducted independently on each trail, which enabled to obtainthe mean and the standard deviation at each performancevalue.
As baselines we used two commercial off-the-shelf (COTS)techniques, considered to represent the state-of-the-art [38]:the Matlab SDK for Face++5 and the Microsoft CognitiveToolkit Commercial.6 Face++ is a commercial face recogni-tion system, with good performance reported for the LFWface recognition competition (second best rate). MicrosoftCognitive Toolkit is a deep learning framework that providesuseful information based on vision, speech and language. Also,in order to highlight the distinct properties of the embeddingsgenerated by our proposal with respect to the state-of-the-art, we also measured the soft labelling effectiveness thatcan be attained by the Triplet loss [34] and Chenet al. [43]embeddings if a simple 1-NN rule is used to infer softbiometrics labels.
We considered exclusively the ‘Gender’, ‘Ethnicity’ and‘Age’ labels (t = 3), quantised respectively into two classes forGender (‘male’, ‘female’), three classes for Age (‘young’,‘adult’, ‘senior’), and three classes for Ethnicity (‘white’,
5http://www.faceplusplus.com/6https://www.microsoft.com/cognitive-services/
Authorized licensed use limited to: b-on: UNIVERSIDADE DA BEIRA INTERIOR. Downloaded on May 11,2021 at 14:02:23 UTC from IEEE Xplore. Restrictions apply.
Soft Biometrics Analysis in Outdoor Environments
182

808 IEEE TRANSACTIONS ON INFORMATION FORENSICS AND SECURITY, VOL. 16, 2021
TABLE I
IDENTITY RETRIEVAL PERFORMANCE OF THE PROPOSED LOSS WITHRESPECT TO THE BASELINES: softmax, CENTER AND TRIPLET LOSSES,
AND CHEN et al. [5]’S METHOD. THE AVERAGE PERFORMANCE±STANDARD DEVIATION VALUES ARE GIVEN, AFTER
10 TRIALS. INSIDE EACH CELL, VALUES REGARD(FROM TOP TO BOTTOM) THE LFW, MEGAFACE
AND IJB-A DATASETS. THE BOLD FONT
HIGHLIGHTS THE BEST RESULT PERDATASET AMONG ALL METHODS
‘black’, ‘asian’). The average and standard deviation perfor-mance values are reported in Table II for the BIODI, PETAand LFW sets.
Overall, the results achieved by the quadruplet loss canbe favourably compared to the baseline techniques for mostlabels, particularly for the BIODI and LFW datasets. Regard-ing the PETA set, Face++ invariably outperformed the othertechniques, even if at a reduced margin in most cases. Thiswas justified by the extreme heterogeneity of image featuresin this set, in result of being the concatenation of differ-ent databases. This should had reduced the representativityof the learning data with respect the test set, being theFace++ model apparently the least sensitive to this covariate.
TABLE II
SOFT BIOMETRICS LABELLING PERFORMANCE (MAP) ATTAINEDBY THE PROPOSED METHOD, WITH RESPECT TO TWO
COMMERCIAL-OFF-THE-SHELF SYSTEMS (FACE++AND MICROSOFT COGNITIVE) AND TWO OTHER
BASELINES. THE AVERAGE PERFORMANCE±STANDARD DEVIATION VALUES ARE GIVEN,AFTER 10 TRIALS. INSIDE EACH CELL, THE
TOP VALUE REGARDS THE VGG-LIKEPERFORMANCE, AND THE BOTTOM
VALUE CORRESPONDS TO THE
RESNET-LIKE VALUES
Note that the ‘Ethnicity’ label is only provided by the Face++framework. Regarding the Triplet [34] and Chen et al. [43]baselines, it is important to note that the reported values wereobtained in embeddings that were inferred exclusively based inID information. Under such circumstances, we confirmed thatboth solutions produce semantically inconsistent embeddings,in which elements with similar appearance but different softlabels are frequently projected to adjacent regions.
Globally, these experiments supported the possibility ofusing such the proposed method to estimate soft labels ina single-shot paradigm, which is interesting to reduce thecomputational cost of using specialized third-party solutionsfor soft labelling.
Finally, we analysed the variations in performance withrespect to the number of labels considered, i.e., the value ofthe t parameter. At first, to perceive how the identity retrievalperformance depends of the number of soft labels, we used the
Authorized licensed use limited to: b-on: UNIVERSIDADE DA BEIRA INTERIOR. Downloaded on May 11,2021 at 14:02:23 UTC from IEEE Xplore. Restrictions apply.
Soft Biometrics Analysis in Outdoor Environments
183

PROENÇA et al.: QUADRUPLET LOSS FOR ENFORCING SEMANTICALLY COHERENT EMBEDDINGS 809
Fig. 9. At left: rank-1 identification accuracy in the LFW dataset, for 1 ≤t ≤ 4. At right: soft biometrics performance in the BIODI test set, for 2 ≤t ≤ 14, for the VGG (solid line) and ResNet (dashed line) architectures.
annotations provided by the ATVS group [38] for the LFW set,and measured the rank-1 variations for 1 ≤ t ≤ 4, starting bythe ‘ID’ label alone and then adding iteratively the ‘Gender’→ ‘Ethnicity’ → ‘Age’ labels. The results are shown in theleft plot of Fig. 9. In a complementary way, to perceive theoverall labelling effectiveness for large values of t , the BIODIdataset was used (the one with the largest number of annotatedlabels), and the values obtained for t ∈ 2, . . . , 14. In allcases, d = 128 was kept, with the average labelling error inthe test set X given by:
e(X) = 1
n.t
n∑i=1
|| pi − gi ||0, (11)
with pi denoting the t labels predicted for the i th image andgi being the ground-truth. || ||0 denotes the 0-norm.
It is interesting to observe the apparently contradictoryresults in both plots: at first, a positive correlation betweenthe labelling errors and the values of t is evident, which wasjustified by the difficulty of inferring some of the hardestlabels in the BIODI set (e.g., the type of shoes). However,the average rank-1 identification accuracy also increased whenmore soft labels were used, even if the results were obtainedonly for small values of t (i.e., not considering the partic-ularly hard labels, in result of no available ground truth).Overall, we concluded that the proposed loss obtain acceptableperformance (i.e., close to the state-of-the-art) when a smallnumber of soft labels is available (≥ 2), but also when a fewmore labels should be inferred (up to t ≈ 8). In this regard,we presume that even higher values for t (t 8) wouldrequire substantially more amounts of learning data and alsohigher values for d (dimension of the embedding).
F. Semantic Identity Retrieval
Finally, we considered the semantic identity retrieval prob-lem, where - along with the query image - semantic criteria areused to filter the retrieved elements (i.e., “Find this person”→ “Find this female”, Fig. 10). In this setting, it is assumedthat the ground-truth soft labels of the gallery IDs are known,even though the same does not apply for the queries.
We considered the hardest identity retrieval dataset(Megaface) and compared our results to Chen et al.’s (themost frequent runner-up in previous experiments). The softlabel ‘Gender’ (provided by the Microsoft Cognitive Toolkitfor the queries) was used as additional semantic data, to filterthe retrieved identities. The bottom plot in Fig. 10 provides the
Fig. 10. Comparison between the hit/penetration rates of the proposed lossand Chen et al. [5]’s method, when disregarding (baseline) or consideringsemantic additional information to filter the retrieved results. Values are givenfor the ResNet architecture and Megaface dataset. The ‘Gender’ was thesemantic criterium in each query and “n” is the number of enrolled identities.
results in terms of the hit/penetration rates, being notorious thesimilar levels of performance of both methods in this setting(‘semantic’ data series), with Chen et al.’s method slightlyoutperforming up to the top-20 identities, and getting worseresults than our solution for the remaining penetration values.
It can be concluded that - when coarse labels are available -our method and Chen et al.’s attain similar quality embed-dings in terms of compactness and discriminability. However,the key point is that the baseline version of the proposedloss is a way to approximate the results attained by state-of-the-art methods when using semantic information to filterthe retrieved identities.
V. CONCLUSION AND FURTHER WORK
In this article we proposed a loss function for multi-outputclassification problems, where the response variables havedimension greater than one. Our function is a generalizationof the well known triplet loss, replacing the positive/negativebinary division of pairs and the notion of anchor, by:i) a metric that considers the semantic similarity betweenany two classes; and ii) a quadruplet term that imposesdifferent distances between pairs of elements according to thatsimilarity.
In particular, we considered the identity retrieval and softbiometrics problems, using the ID and three soft labels (‘Gen-der’, ‘Age’ and ‘Ethnicity’) to obtain semantically coherentembeddings. In such spaces, not only the intra-class com-pactness is guaranteed, but also the broad families of classes(e.g., “white young males” or “black senior females”) appearin adjacent regions. This enables a direct correspondencebetween the ID centroids and their semantic descriptions,allowing that simple rules such as k-neighbours are used tojointly infer the identity/soft label information. The insightof the proposed loss is in opposition to single-label lossformulations, where elements are projected into the destiny
Authorized licensed use limited to: b-on: UNIVERSIDADE DA BEIRA INTERIOR. Downloaded on May 11,2021 at 14:02:23 UTC from IEEE Xplore. Restrictions apply.
Soft Biometrics Analysis in Outdoor Environments
184

810 IEEE TRANSACTIONS ON INFORMATION FORENSICS AND SECURITY, VOL. 16, 2021
space based uniquely in ID information and image appearance,being assumed that semantical coherence yields naturally uponthe similarity of image features.
As future directions for this work, we are exploring thepossibility of fusing the concept described in this article tothe original triplet and Chen et al. formulations. In this lineof research, the concept of anchor will still be disregarded andall images in a triplet will regard different classes (IDs), withthe margins imposed according to the soft biometrics similaritybetween pairs of elements. Also, two other possibilities are:1) to differently weight the contribution of each soft labelin defining the embedding topology; and 2) to consider theconceptual distance inside each label (e.g., ‘young’ is closer to‘adult’ than to ‘senior’). Both possibilities should also improvethe overall ID+soft biometrics labelling performance.
ACKNOWLEDGEMENT
The authors would like to thank support of NVIDIACorporation®, with the donation of one Titan X GPU board.
REFERENCES
[1] N. Y. Almudhahka, M. S. Nixon, and J. S. Hare, “Automatic semanticface recognition,” in Proc. 12th IEEE Int. Conf. Autom. Face GestureRecognit. (FG), May 2017, pp. 180–185, doi: 10.1109/fg.2017.31.
[2] E. Bekele, C. Narber, and W. Lawson, “Multi-attribute residual network(MAResNet) for soft-biometrics recognition in surveillance scenarios,”in Proc. 12th IEEE Int. Conf. Autom. Face Gesture Recognit. (FG),May 2017, pp. 386–393, doi: 10.1109/fg.2017.55.
[3] E. B. Cipcigan and M. S. Nixon, “Feature selection for subject rankingusing soft biometric queries,” in Proc. 15th IEEE Int. Conf. Adv.Video Signal Based Surveill. (AVSS), Nov. 2018, pp. 1–6, doi: 10.1109/avss.2018.8639319.
[4] J.-C. Chen, R. Ranjan, A. Kumar, C.-H. Chen, V. M. Patel, andR. Chellappa, “An end-to-end system for unconstrained face verifi-cation with deep convolutional neural networks,” in Proc. IEEE Int.Conf. Comput. Vis. Workshop (ICCVW), Dec. 2015, pp. 118–126,doi: 10.1109/iccvw.2015.55.
[5] W. Chen, X. Chen, J. Zhang, and K. Huang, “Beyond triplet loss: Adeep quadruplet network for person re-identification,” in Proc. IEEEConf. Comput. Vis. Pattern Recognit. (CVPR), Jul. 2017, pp. 403–412,doi: 10.1109/cvpr.2017.145.
[6] V. Choutas, P. Weinzaepfel, J. Revaud, and C. Schmid, “PoTion: PoseMoTion representation for action recognition,” in Proc. IEEE/CVFConf. Comput. Vis. Pattern Recognit., Jun. 2018, pp. 7024–7033, doi:10.1109/cvpr.2018.00734.
[7] Y. Deng, P. Luo, C. C. Loy, and X. Tang, “Pedestrian attribute recog-nition at far distance,” in Proc. ACM Int. Conf. Multimedia MM, 2014,pp. 789–792, doi: 10.1145/2647868.2654966.
[8] J. Deng, J. Guo, N. Xue, and S. Zafeiriou, “ArcFace: Additive angu-lar margin loss for deep face recognition,” 2018, arXiv:1801.07698.[Online]. Available: http://arxiv.org/abs/1801.07698
[9] Y. Duan, J. Lu and J. Zhou, “UniformFace: Learning deep equidis-tributed representation for face recognition,” 2019, arXiv:1801.07698.[Online]. Available: https://arxiv.org/abs/1801.07698
[10] H. Galiyawala, K. Shah, V. Gajjar, and M. S. Raval, “Personretrieval in surveillance video using height, color and gender,” 2018,arXiv:1810.05080. [Online]. Available: http://arxiv.org/abs/1810.05080
[11] G. Jacob, R. Sam, H. Geoff, and S. Ruslan, “Neighbourhood Compo-nents Analysis,” in Proc. Adv. Neural Inf. Process. Syst. (NIPS), vol. 17,2004, pp. 513–520, doi: 10.5555/2976040.2976105
[12] B. H. Guo, M. S. Nixon, and J. N. Carter, “Fusion analysis of softbiometrics for recognition at a distance,” in Proc. IEEE 4th Int. Conf.Identity, Secur., Behav. Anal. (ISBA), Jan. 2018, pp. 1–8, doi: 10.1109/isba.2018.8311457.
[13] B. H. Guo, M. S. Nixon, and J. N. Carter, “A joint density based rank-score fusion for soft biometric recognition at a distance,” in Proc. 24thInt. Conf. Pattern Recognit. (ICPR), Aug. 2018, p. 3457, doi: 10.1109/icpr.2018.8546071.
[14] R. Hadsell, S. Chopra, and Y. LeCun, “Dimensionality reduction bylearning an invariant mapping,” in Proc. IEEE Comput. Soc. Conf. Com-put. Vis. Pattern Recognit. (CVPR), vol. 2, Jun. 2006, pp. 1735–1742.,doi: 10.1109/cvpr.2006.100.
[15] M. Halstead, S. Denman, C. Fookes, Y. Tian, and M. S. Nixon, “Seman-tic person retrieval in surveillance using soft biometrics: AVSS 2018challenge II,” in Proc. 15th IEEE Int. Conf. Adv. Video Signal BasedSurveill. (AVSS), Nov. 2018, pp. 1–6, doi: 10.1109/avss.2018.8639379.
[16] E. Learned-Miller, G. Huang, A. RoyChowdhury, H. Li, and G. Hua,“Labeled faces in the wild: A survey,” in Proc. Adv. Face DetectionFacial Image Anal., M. Kawulok, M. E. Celebi, and B. Smolka, Eds.New York, NY, USA: Springer, 2016, pp. 189–248, doi: 10.1007/978-3-319-25958-1_8.
[17] K. He, Z. Wang, Y. Fu, R. Feng, Y.-G. Jiang, and X. Xue, “Adaptivelyweighted multi-task deep network for person attribute classification,” inProc. ACM Multimedia Conf. MM, 2017, pp. 1636–1644, doi: 10.1145/3123266.3123424.
[18] Y. Hu, X. Wu, and R. He, “Attention-set based metric learning forvideo face recognition,” IEEE Trans. Pattern Anal. Mach. Intell., vol. 40,no. 12, pp. 2827–2840, Nov. 2018.
[19] S. Ji, W. Xu, M. Yang, and K. Yu, “3D convolutional neural networksfor human action recognition,” IEEE Trans. Pattern Anal. Mach. Intell.,vol. 35, no. 1, pp. 221–231, Jan. 2013.
[20] M. Jiang, Z. Yang, W. Liu, and X. Liu, “Additive margin softmax withcenter loss for face recognition,” in Proc. the 2nd Int. Conf. Video ImageProcess. ICVIP, 2018, pp. 1–8, doi: 10.1145/3301506.3301511.
[21] B.-N. Kang, Y. Kim, and D. Kim, “Deep convolution neural networkwith stacks of multi-scale convolutional layer block using triplet offaces for face recognition in the wild,” in Proc. IEEE Int. Conf.Syst., Man, Cybern. (SMC), Oct. 2016, Art. no. 004460, doi: 10.1109/smc.2016.7844934.
[22] I. Kemelmacher-Shlizerman, S. M. Seitz, D. Miller, and E. Brossard,“The MegaFace benchmark: 1 million faces for recognition at scale,” inProc. IEEE Conf. Comput. Vis. Pattern Recognit. (CVPR), Jun. 2016,pp. 4873–4882, doi: 10.1109/cvpr.2016.527.
[23] B. F. Klare et al., “Pushing the frontiers of unconstrained face detectionand recognition: IARPA janus benchmark a,” in Proc. IEEE Conf. Com-put. Vis. Pattern Recognit. (CVPR), Jun. 2015, pp. 1931–1939, doi: 10.1109/cvpr.2015.7298803.
[24] F. Lateef and Y. Ruichek, “Survey on semantic segmentation usingdeep learning techniques,” Neurocomputing, vol. 338, pp. 321–348,Apr. 2019.
[25] W. Liu et al., “SSD: Single shot MultiBox detector,” in Proc. Eur. Conf.Comput. Vis., 2016, pp. 21–37, doi: 10.1007/978-3-319-46448-0_2
[26] T. J. Neal and D. L. Woodard, “You are not acting like yourself: Astudy on soft biometric classification, person identification, and mobiledevice use,” IEEE Trans. Biometrics, Behav., Identity Sci., vol. 1, no. 2,pp. 109–122, Apr. 2019.
[27] D. Li, Z. Zhang, X. Chen, and K. Huang, “A richly annotated pedestriandataset for person retrieval in real surveillance scenarios,” IEEE Trans.Image Process., vol. 28, no. 4, pp. 1575–1590, Apr. 2019.
[28] H. Liu and W. Huang, “Body structure based triplet convolutionalneural network for person re-identification,” in Proc. IEEE Int. Conf.Acoust., Speech Signal Process. (ICASSP), Mar. 2017, pp. 1772–1776,doi: 10.1109/icassp.2017.7952461.
[29] D. Martinho-Corbishley, M. S. Nixon, and J. N. Carter, “Super-fineattributes with crowd prototyping,” IEEE Trans. Pattern Anal. Mach.Intell., vol. 41, no. 6, pp. 1486–1500, Jun. 2019.
[30] R. Ranjan et al., “Crystal loss and quality pooling for unconstrainedface verification and recognition,” 2018, arXiv:1804.01159. [Online].Available: http://arxiv.org/abs/1804.01159
[31] R. Vera-Rodriguez, P. Marin-Belinchon, E. Gonzalez-Sosa, P. Tome,and J. Ortega-Garcia, “Exploring automatic extraction of body-basedsoft biometrics,” in Proc. Int. Carnahan Conf. Secur. Technol. (ICCST),Oct. 2017, pp. 1–6, doi: 10.1109/ccst.2017.8167841.
[32] P. Samangouei and R. Chellappa, “Convolutional neural networks forattribute-based active authentication on mobile devices,” in Proc. IEEE8th Int. Conf. Biometrics Theory, Appl. Syst. (BTAS), Sep. 2016, pp. 1–8,doi: 10.1109/btas.2016.7791163.
[33] A. Gretton, K. Borgwardt, M. Rasch, B. Schlkopf, and J. Smola, “Akernel method for the two-sample-problem,” in Proc. Adv. Neural Inf.Process. Syst. Conf., Vancouver, BC, Canada, 2006, pp. 513–520.
[34] F. Schroff, D. Kalenichenko, and J. Philbin, “FaceNet: A unified embed-ding for face recognition and clustering,” in Proc. IEEE Conf. Comput.Vis. Pattern Recognit. (CVPR), Jun. 2015, pp. 815–823, doi: 10.1109/cvpr.2015.7298682.
Authorized licensed use limited to: b-on: UNIVERSIDADE DA BEIRA INTERIOR. Downloaded on May 11,2021 at 14:02:23 UTC from IEEE Xplore. Restrictions apply.
Soft Biometrics Analysis in Outdoor Environments
185

PROENÇA et al.: QUADRUPLET LOSS FOR ENFORCING SEMANTICALLY COHERENT EMBEDDINGS 811
[35] A. Schumann, A. Specker, and J. Beyerer, “Attribute-based personretrieval and search in video sequences,” in Proc. 15th IEEE Int.Conf. Adv. Video Signal Based Surveill. (AVSS), Nov. 2018, pp. 1–6,doi: 10.1109/avss.2018.8639114.
[36] H. Shi, X. Zhu, S. Liao, Z. Lei, Y. Yang, and S. Z. Li, “Constrained deepmetric learning for person re-identification,” 2015, arXiv:1511.07545.[Online]. Available: http://arxiv.org/abs/1511.07545
[37] H. O. Song, Y. Xiang, S. Jegelka, and S. Savarese, “Deep metriclearning via lifted structured feature embedding,” in Proc. IEEE Conf.Comput. Vis. Pattern Recognit. (CVPR), Jun. 2016, pp. 4004–4012,doi: 10.1109/cvpr.2016.434.
[38] E. Gonzalez-Sosa, J. Fierrez, R. Vera-Rodriguez, andF. Alonso-Fernandez, “Facial soft biometrics for recognition in thewild: Recent works, annotation, and COTS evaluation,” IEEE Trans.Inf. Forensics Security, vol. 13, no. 8, pp. 2001–2014, Aug. 2018.
[39] C. Su, Y. Yan, S. Chen, and H. Wang, “An efficient deep neural networkstraining framework for robust face recognition,” in Proc. IEEE Int. Conf.Image Process. (ICIP), Sep. 2017, pp. 3800–3804, doi: 10.1109/icip.2017.8296993.
[40] F. Wang, W. Zuo, L. Lin, D. Zhang, and L. Zhang, “Joint learn-ing of single-image and cross-image representations for person re-identification,” in Proc. IEEE Conf. Comput. Vis. Pattern Recognit.(CVPR), Jun. 2016, pp. 1288–1296, doi: 10.1109/cvpr.2016.144.
[41] J. Wang, Z. Wang, C. Gao, N. Sang, and R. Huang, “DeepList:Learning deep features with adaptive listwise constraint for personreidentification,” IEEE Trans. Circuits Syst. Video Technol., vol. 27,no. 3, pp. 513–524, Mar. 2017.
[42] Y. Wen, K. Zhang, Z. Li, and Y. Qiao, “A discriminative feature learningapproach for deep face recognition,” in Proc. 14th Eur. Conf. Comput.Vis., 2016, pp. 499–515, doi: 10.1007/978-3-319-46478-7_31.
[43] Y. Wen, K. Zhang, Z. Li, and Y. Qiao, “A comprehensive study on centerloss for deep face recognition,” Int. J. Comput. Vis., vol. 127, nos. 6–7,pp. 668–683, Jun. 2019.
[44] B. Zhou, A. Lapedriza, J. Xiao, A. Torralba, and A. Oliva, “Learningdeep features for scene recognition using places database,” in Proc. Adv.Neural Inf. Process. Syst. Conf., Montreal, QC, Canada, 2014, pp. 487–495.
Hugo Proença (Senior Member, IEEE). received theB.Sc., M.Sc., and Ph.D. degrees from the Depart-ment of Computer Science, University of BeiraInterior, in 2001, 2004, and 2007, respectively.He is currently an Associate Professor with theDepartment of Computer Science, University ofBeira Interior. He has been researching mainly aboutbiometrics and visual-surveillance. He was the Coor-dinating Editor of the IEEE BIOMETRICS COUNCIL
NEWSLETTER and the Area Editor (ocular bio-metrics) of the IEEE BIOMETRICS COMPENDIUM
JOURNAL. He is a member of the Editorial Boards of the Image and VisionComputing, IEEE ACCESS, and the International Journal of Biometrics.He served as the Guest Editor of special issues of the Pattern RecognitionLetters, Image and Vision Computing and Signal, and Image and VideoProcessing Journals.
Ehsan Yaghoubi, photograph and biography not available at the time ofpublication.
Pendar Alirezazadeh, photograph and biography not available at the time ofpublication.
Authorized licensed use limited to: b-on: UNIVERSIDADE DA BEIRA INTERIOR. Downloaded on May 11,2021 at 14:02:23 UTC from IEEE Xplore. Restrictions apply.
Soft Biometrics Analysis in Outdoor Environments
186

All-in-one ”HairNet”: A Deep Neural Model for Joint Hair Segmentation andCharacterization
Diana BorzaBabes Boylai University,
Cluj-Napoca, Romania, [email protected]
Ehsan YaghoubiInstituto de Telecomunicacoes
University of Beira Interior, 6201-001 Covilha, [email protected]
Joao NevesTomiWorld
3500-106 Viseu, [email protected]
Hugo ProencaInstituto de Telecomunicacoes
University of Beira Interior, 6201-001 Covilha, [email protected]
Abstract
The hair appearance is among the most valuable softbiometric traits when performing human recognition at-a-distance. Even in degraded data, the hair’s appearance isinstinctively used by humans to distinguish between indi-viduals. In this paper we propose a multi-task deep neu-ral model capable of segmenting the hair region, while alsoinferring the hair color, shape and style, all from in-the-wild images. Our main contributions are two-fold: 1) thedesign of an all-in-one neural network, based on depth-wise separable convolutions to extract the features; and 2)the use convolutional feature masking layer as an atten-tion mechanism that enforces the analysis only within the’hair’ regions. In a conceptual perspective, the strengthof our model is that the segmentation mask is used by theother tasks to perceive - at feature-map level - only the re-gions relevant to the attribute characterization task. Thisparadigm allows the network to analyze features from non-rectangular areas of the input data, which is particularlyimportant, considering the irregularity of hair regions. Ourexperiments showed that the proposed approach reaches ahair segmentation performance comparable to the state-of-the-art, having as main advantage the fact of performingmultiple levels of analysis in a single-shot paradigm.
1. Introduction
Visual surveillance has grown astonishingly in the lastdecade at a worldwide level: more than 350 billion surveil-lance cameras were reported in 2016 [6]. Despite popular
978-1-7281-9186-7/20/$31.00 @2020 European Union
belief, a reliable, fully-automated visual surveillance sys-tem has not been yet developed, and state of the art artifi-cial intelligence based models still struggle with high false-positive rates. Standard face biometric measures cannot beproperly analyzed in surveillance systems, due to the poorimage quality (low resolution, blurred, off-angle and oc-cluded subjects), and soft biometric cues are often used toassist classical recognition systems. Despite this, researchon external face features (hair, head and face shape) hasbeen neglected in favor of other features, such as irises,eyes, mouth, etc.). [33] has shown that hair cues (namely,the hair length and color) are amongst the most discrimina-tive soft biometric labels when dealing with person recog-nition at a distance. Moreover, neuroscience research stud-ies confirm this hypothesis: the human visual system seemsto perceive the face holistically [30], with emphasis on thehead structure and hair feature, rather than internal cues[29, 31].
Automated hair analysis is undoubtedly a difficult task,as the hair structure, shape and visual appearance largelyvary between individuals, as depicted in Fig. 1. Unlike in-ternal face features (e.g., the eyes or mouth), it is hard toestablish the appropriate region of interest for hair pixels.It is difficult to define a hair shape as a variety of hairstylesexist; defining hair texture and color is difficult too. Individ-uals naturally tend to have different hair colors and styles,but some tend to change their hair color and styles that af-fects the hair properties.
In this paper, we propose an all-in-one convolutionalneural network (CNN) designed for complete hair anal-ysis (segmentation, color, shape and hairstyle classifica-tion), which uses only depth wise separable convolutions[9], making it suitable for running on devices with limited
Authorized licensed use limited to: b-on: UNIVERSIDADE DA BEIRA INTERIOR. Downloaded on May 11,2021 at 14:03:19 UTC from IEEE Xplore. Restrictions apply.
Soft Biometrics Analysis in Outdoor Environments
187

Figure 1. Samples that illustrate the complexity of the in-the-wildhair analysis. Subjects have varying poses, with hair of varyingshapes, densities and colors, often partially occluded and hard todistinguish from the background.
computational resources. The original architectural featuresof the network are: (1) the use of convolutional featuremasking layers in order to keep the convolutions ”focused”only on the hair pixels and (2) convolutional feature selec-tion by using skip layers and feature-map masking. Thenetwork operates on images captured in uncontrolled, in-the-wild environments; the only constraint imposed on theinput is that the head area is detectable by a state of the artface detector [22]. A cohesive perspective on the proposedsolution is depicted in Fig. 2.
The remainder of this paper is organized as follows: inSection 2, we discuss the related work, and in Section 3 wedetail the network architecture and the learning phase of theproposed method. Section 4 describes our experiments and,finally, the conclusions are given in Section 5.
2. Related WorkEarly works on hair segmentation operated mainly on
frontal images with relatively simple backgrounds. In [36],the positions of the face and eyes are used to establish theregion of interest (ROI) for the hair analysis; next, basedon spatial (anthropomorphic proportions) and color infor-mation a list of seeds is obtained, and region growing isperformed to obtain the hair mask. Therefore, hair segmen-tation is problematic if the background has a similar textureto the hair area. The method also extracts several propertiesof the hair (volume, length, dominant color) using classi-cal image processing techniques. The method described in[21] defines the hair ROI starting from the positions of theeyes and mouth. Next, the authors devised a region grow-ing algorithm to distinguish the hair pixels from the skinand background pixels. The region growing algorithm op-erates on a set of 45 features, which includes color, gradient(Canny magnitude), and frequency descriptors. In [27] araw localization of the hair area is obtained by fusing fre-
quency and color information (YCrCb color space). [14]segments the hair based on the appearance of the upper hairregion. First, this region is extracted using active shape andcontour models. Based on the appearance parameters ofthis region, the entire hair region is extracted at pixel levelusing texture analysis. [17] operates on video sequences;the head area is computed using face detection and back-ground subtraction. Within this region, a skin segmentationmask is obtained using flood-fill algorithm. Finally, the hairregion is estimated as the difference between the head andskin pixels. Similarly, [35] extracts the head from videosequences, and the hair region is segmented through his-togram analysis and k-means clustering. The hair length isdetermined through line scanning. [18] uses learned mix-ture models of color and location information to infer thehypothesis of the hair, face, and background regions. [34]relies on a coarse hair probability map, in which each pixelencodes the probability of belonging to the hair class. Thehair segmentation map is inferred through regression tech-niques by finding pairs of isomorphic manifolds. In [28],the authors apply a shape detector to establish a ROI for thehair area; then, to extract the hair-pixels, they use graph-cuts based on solely color cues in the YCbCr color-space.Finally, k-means is applied as a post-processing step to en-sure homogeneity between neighboring hair patches.
In [24], a two-layered hierarchical Markov RandomField (MRF) architecture is proposed for the segmentationand labeling of hair and facial hairstyles. The first layeroperates at pixel level, modeling local interactions, whilethe latter extracts higher level, object information, provid-ing coherent solutions for the segmentation problem. Themethod was tested on degraded images captured by an out-door visual surveillance system.
Recently, the problem of hair segmentation was ap-proached from a deep learning perspective ([19, 1, 13]);these methods achieve state of the art performance. Thesegmentation neural networks begin with ”contracting”path, in which a sequence of convolutional layers extractmeaningful features, but also reduce the spatial information.Next, a set of deconvolutional layers expands these con-densed features into segmentation maps. To preserve high-resolution details, skip-connections are inserted to concate-nate feature maps from the beginning of the network (higherlevel of details) with those from the expanding part of thenetwork (higher semantic level). In [19], the loss function istuned to preserve the high-frequency information of the hairby adding a term that penalizes the discrepancy between thegradients of the input image and those of the predicted hairmask.
2.1. Multi-task Convolutional Neural Networks
Multi-task learning (MTL) has been successfully usedin machine learning as a strategy to improve generalization
Authorized licensed use limited to: b-on: UNIVERSIDADE DA BEIRA INTERIOR. Downloaded on May 11,2021 at 14:03:19 UTC from IEEE Xplore. Restrictions apply.
Soft Biometrics Analysis in Outdoor Environments
188

Hai
rSe
gmen
tatio
nH
air
Ana
lysi
s
Depthwise conv + ReLUFully connected layers
Upsampling
Batch normalization
Pooling
’black’, ’blond’, ’brown’, ’gray’Hair Color ⊕
’straight’, ’wavy’Hairstyle
’bangs’, ’bald’Hair Shape
Figure 2. Solution outline: the network comprises several classification branches for the following hair attributes: hair-skin segmentationmask, hair color, shape and style. The segmentation output is used by the other classification branches to select, at feature map level, onlythe hair pixels via convolutional feature masking.
by learning several classification tasks at once while main-taining a shared representation of the data. A detailed de-scription, including theoretical analysis and applications ofmulti-task learning, can be found in [2]. One of the pioneer-ing works to performed multi-task facial attribute analysisusing a single CNN in an end-to-end manner is [26]. Thenetwork simultaneously performs face detection and align-ment, pose estimation, gender recognition, smile detection,age estimation, and face recognition. In this framework,the filters in the first convolutional layers of the networkare shared between all the classification tasks, constraininga shared representation among the tasks, and reducing therisk of overfitting in these layers. Deep multi-task learninghas also been applied for emotion analysis. In [3], the au-thors propose a deep learning framework for the tasks of fa-cial attribute recognition, action unit detection, and valence-arousal estimation.
2.2. Feature Selection in Convolutional Neural Net-works
Deep neural networks achieved state of the art perfor-mance on (almost) every field of computer vision and areoften used as generic feature extractors. This adaptability ofCNNs is also proved by transfer learning: features learnedby the network on a (large) database can be successfully ap-plied to other classification tasks. However, classical CNNarchitectures operate holistically, in the sense that the fea-tures are extracted globally, from the entire image, and thuscapturing (potentially) irrelevant information. Therefore:How could the network be guided to see and extract fea-
tures within some predefined ROI? This question arose forthe problem of object detection, in which a bounding boxand a class must be inferred for every object in an image.Clearly, the classification part should only analyze the re-gion of interest of the localized object.
The R-CNN (Regions with CNN features) architecturesolves this problem in a straightforward manner: a regionproposal extraction step is first applied to extract potentialobjects, and each of these regions is fed to the CNN. Its suc-cessor, Fast R-CNN object detector [7], analyzes the entireimage to extract a convolutional feature map. Next, eachROI is mapped to this feature map, warped into square re-gions of predefined size (ROI pooling), and fed to the objectclassification layer.
Similarly, the SPP-Net architecture [8] introduced theSpatial Pyramid Pooling layer (SPP layer), which masksconvolutional feature maps by a rectangular region (i.e.,zeros-out the features outside the ROI) and extracts a fixed-length feature vector out of each ROI. In [4], boundingboxes, which can be seen as coarse segmentation masks,are used to ”supervise” the training of CNNs for semanticimage segmentation. A step forward is taken by [5]; here,input masks of irregular shapes are used to eliminate irrele-vant regions of the feature map. The input binary masks areprojected into the domain of the convolutional feature maps:each activation is mapped to the input image domain as thecenter of its receptive field (similar to [8]), and each pixel ofthe input mask is assigned to the nearest projected receptivefield. However, this approach requires an additional stepto generate the input masks with the region proposals. In
Authorized licensed use limited to: b-on: UNIVERSIDADE DA BEIRA INTERIOR. Downloaded on May 11,2021 at 14:03:19 UTC from IEEE Xplore. Restrictions apply.
Soft Biometrics Analysis in Outdoor Environments
189

[5], the proposal regions are extracted by grouping severalsuper-pixels of the input image. In our approach, the masksare segmented directly by the neural network, therefore nopre-processing steps are required.
3. Proposed Method3.1. Network Architecture
Formally, let Xi denote the feature vector (RGB-pixels)of the ith sample, Yi the corresponding annotations, andYi the network’s prediction. The data associated toeach image (Yi or Yi) comprises the following attributes:Mi, cli, sti, wvi, bgi, bdi, where Mi is the face/hair seg-mentation mask, cli ∈CL = ’black’, ’blond’, ’brown’,’gray’ denotes the hair color label, sti and wvi are binaryvalues which indicate if the hairstyle is ’straight’ or ’wavy’respectively. Finally, the values bgi, bdi compose the hairshape classification branch, indicating whether the personhas bangs, or is bald respectively. The output of the net-work was chosen in accordance with the hair attribute in-formation provided by CelebA database [23], which is, tothe best of our knowledge, the largest image dataset provid-ing multiple hair attributes annotations. We chose separate,binary attributes to describe the hairstyle (sti and wvi) andthe hair shape (bgi, bdi), instead of a single multi-label clas-sification layer, for two main reasons. First of all, not allthe samples from the dataset are annotated with this infor-mation, or, on the other hand, some samples are annotatedwith multiple labels from the same logical group. The lat-ter case results in a contradiction with the multi-label clas-sification, which assumes that each example is appointedto one and only one label. Secondly, the annotations pro-vided for these attributes are not exhaustive: for example,the hair shape analysis could also include one of the fol-lowing: ”long hair”, ”medium hair”, ”short hair”, etc.
The backbone of the network is inspired by thelightweight MobileNet [9], on top of which we added sev-eral classification branches.
3.2. Hair Segmentation
The output of the hair segmentation branch Mi ∈R224×224×2 is a bi-dimensional, two-channel, mask of thesame size as the input. The two channels (M0
i , M1i ) con-
tain, for each pixel, the probability for belonging to the skinor hair class, respectively. The facial skin area is also seg-mented, as it provides essential information regarding thehair shape and length: one cannot make any inference aboutthe shape of the hair without correlating its area to the face.
To obtain the segmentation mask, the feature map of thelast convolutional layer in the network backbone is fed toa decoder. As suggested in [19], rather than using trans-posed convolutional layers, the upsampling is accomplishedby a 2× upsampling operation, followed by depth-wise and
Figure 3. Hair color perception is a contextual phenomenon andcannot be decoupled from the surrounding scene colors and lightsources. Also, demographic attributes can influence the hair colorestimation process.
point-wise convolutions. Three such blocks are concate-nated to obtain a mask of the same size as the input im-age. Similar to [19], skip connections to the corresponding,equal-sized layers in the network backbone are added suchthat the output includes information about the high resolu-tion, but yet weak, features extracted by these layers.
Finally, the segmentation output is obtained by adding a1×1 convolution with two filters (i.e., two output channels:one for the hair and one for the skin pixels) with softmaxactivation.
During training, we aim at minimizing the binary crossentropy loss (1) between the ground truth mask Mi and thepredicted segmentation mask Mi:
Lseg(Mi, Mi) = −(Mi ·log(Mi)+(1−Mi)·log(1−Mi)).(1)
At test time, the single channel, output mask is obtainedby assigning each pixel to the class (hair or skin) with thehighest probability, given that it is larger than a threshold t,or to background otherwise:
Mout =
arg max(M0,M1) + 1, if max(M0,M1) > t
0 (background), otherwise,
(2)where t = 0.5 was used in all our experiments.
3.3. Hair Color Inference
Color perception is a complex process, as the appearanceof an object is highly dependent on the environmental con-text (both spatially and temporally) [12]. It is practically im-possible to distinguish the apparent color of a patch, with-out having additional information regarding the surroundingcolors and light sources. In the context of hair color estima-tion, demographic cues (such as gender and age) are alsocrucial in deciding the hair tone. An illustrative example isdepicted in Figure 3.
Therefore, when deciding on the color tone, the networkshould use, not only information about the hair tone but also
Authorized licensed use limited to: b-on: UNIVERSIDADE DA BEIRA INTERIOR. Downloaded on May 11,2021 at 14:03:19 UTC from IEEE Xplore. Restrictions apply.
Soft Biometrics Analysis in Outdoor Environments
190

Depthwise conv + ReLUPoolingFully connected layers
⊕
Labels
Figure 4. Hair color analysis module. Two separate convolutionalbranches analyze the image’s feature map: the first captures in-formation about the global scene lighting, while the second onefocuses only on the hair region using convolutional feature mask-ing.
some cues regarding the surrounding lighting conditionsand light sources. With this in mind, the hair color classi-fication task combines two convolutional branches (Fig. 4),which operate on the feature map extracted by the networkbackbone. The first analyzes the entire feature map, thusextracting information about the overall scene lighting con-ditions, while the latter masks this feature map using theoutput of the hair segmentation, to put emphasis solely onthe hair features.
Finally, they are merged into a single feature vectorFV C, which is flattened and passed to a fully-connectedlayer with softmax activation:
sm(FV Ci) =eFV Ci∑Kj=1 e
FV Cj
, (3)
where FCVi is the feature vector of the i-th sample.As mentioned above, the hair color analysis module dis-
tinguishes the hair tone into one of the following classes CL= ’black’, ’blond’, ’brown’, ’gray’.
The loss function to be optimized in this case is the cat-egorical cross-entropy loss:
Lcolor =∑i
|CL|∑j=1
−clij · log(clij), (4)
where CL is the number of hair labels, cli is the one-hotencoding of the ground truth hair color, and cli are the pre-dicted class probabilities.
3.4. Hairstyle Inference
The hairstyle analysis module comprises two separatebinary classification layers, specialized for the ’wavy’ or’straight’ structures respectively.
To decide on these tasks, the network should only ana-lyze the hair pixels. Therefore, the input of each classifica-tion branch consists of a feature map extracted from the net-work backbone, masked with the hair segmentation mask,
such that only the deemed hair regions are considered. LetFM be the feature map extracted from the network back-bone and HS the binarized hair segmentation map. Theinput I of each of these branches is given by:
I = FM Θ HS, (5)
where Θ is the feature map masking operator as defined inSection 2.2. This input is passed to 2 convolutional layers,flattened and then fed to a fully convolutional classificationlayers. As we are dealing with binary attributes, the ac-tivation function for the output neurons Ob is the sigmoidfunction:
P (Ob) =1
1 + e−Ob. (6)
The loss function of these layers is the binary cross-entropy loss function:
La(a, a) = − 1
N
∑(a · log(a)+(1− a) · log(1− a)), (7)
where a = 1 if the hair has the attribute and a = 0 other-wise; a is the predicted probability for the hair attribute.
3.5. Hair Shape Inference
The hair shape analysis task consists of two classificationbranches, each having a binary outcome: Bangs and Bald.
Intuitively, a piece of essential information in inferringthese shape characteristics is the relationship between theface area and the hair area. Therefore, when applying theconvolutional feature masking operation, we keep the hairpixels, as well as the facial skin pixels to better capture thisrelationship.
As the predictions are binary values, the activation andloss functions for the hair shape classification layers areidentical to the ones used for hairstyle classification (Sec-tion 3.4).
4. Experiments and Discussion4.1. Datasets and Experimental Setup
The main dataset used to train and validate the pro-posed model was CelebAMask-HQ [15], a subset of CelebAdatabase [23]. CelebA [23] is suitable for training ourmodel as it contains more than 200k images captured inreal-world scenarios (blurred, occluded subjects and withlarge pose variations); in addition, each image is labeledwith 40 binary attributes, including information about thehair color attributes ’black’, ’blond’, ’brown’, ’gray’,hairstyle attributes ’straight’, ’wavy’ and shape attributes’bangs’, ’bald’.
For the segmentation task, we used CelebAMask-HQ[15] which contains 30k images, selected from CelebA, to-gether with manually annotated masks of face components
Authorized licensed use limited to: b-on: UNIVERSIDADE DA BEIRA INTERIOR. Downloaded on May 11,2021 at 14:03:19 UTC from IEEE Xplore. Restrictions apply.
Soft Biometrics Analysis in Outdoor Environments
191

(skin, nose, eyes, eyebrows, ears, mouth, lip, hair, hat) andother accessories (eyeglass, earring, necklace, neck, andcloth).
In addition, to demonstrate the generalization ability ofthe proposed method, we also tested the segmentation mod-ule on three additional databases: (a) Labeled Parts in theWild [11], (b) Figaro-1k [32] and (c) another subset ofCelebA, independently annotated by [1]. Images from thesedatasets were not used at all in the training part. LabeledParts in the Wild [10] (the funnelled version) is a subset ofLabel Faces in the Wild (LFW) [11] database; it contains2927 face images segmented into hair/skin/background la-bels. The segmentation is performed at a coarse level:first the images are divided into super-pixels, and then eachsuper-pixel is manually assigned to a label. Figaro-1k [32]contains 1050 images annotated with hair masks, gatheredfrom the Internet, for the purpose of hair analysis in thewild.
4.2. Learning and Parameter Tuning
As annotated data (with hair masks and hair attributes)is limited, we used transfer learning to make sure that thenetwork won’t overfit the training data. So, instead of ran-domly initializing the weights of the neural network, thetraining starts from some weight values computed on a dif-ferent task, for which larger datasets are available; this as-sumes that the low-level features extracted (edges, textures,gradients, etc.) are relevant across tasks. Therefore, thebackbone of the network and the segmentation branch isfirst trained to segment objects from the COCO dataset [20].COCO is a large scale image database, which comprisesapproximately 330K images, designed for object detectionand segmentation. The dataset comprises more than 1.5million object instances, captured in real-world scenarios,grouped into 80 object categories, thus providing enoughgeneralization and data variance.
Next, we conduct the following training scheme:
1. Train the hair segmentation branch on CelebAMask-HQ dataset using the loss function described inLseg (1). The segmentation branch is first trained, asthe attribute classification problems use the segmen-tation mask to establish the ROIs (in the convolutionalfeature masking layers). Having a good estimate of thehair and face region would greatly speed-up the train-ing process.
2. Freeze the shared layers of the network backbone andindividually train all the hair analysis branches usingtheir corresponding loss functions.
3. Finally, the neural network is trained on all the tasks,in an end-to-end manner, such that the common knowl-edge (filter values) is shared across all the classification
problems. At this stage, the individual loss functionsare combined into a weighted average as described inequation (8):
L =T∑
i=0
λi · Li, (8)
where T is the total number of tasks, Li ∈Lcolor, Lseg, Lstraight, Lwavy and λi are the lossvalue and weight for task i.
In all cases, the weights are optimized using Adam [16]optimizer. The initial learning rate α is set to α = 0.0001when training individually the classification branches, anddecreased to α = 0.00001 for the final, end-to-end training;in all cases, the exponential decay rate for the first momentestimates β1 is set to 0.9, and the exponential decay rate forthe second-moment estimates β2 is fixed at 0.99.
4.3. Results
4.3.1 Hair Segmentation
Let ncl be the number of segmentation classes (ncl = 2 inour case ), nij be the number of pixels belonging to classi but predicted to class j, and ti the number of pixels inthe ground truth annotation belonging to class i. For thenumerical evaluation of the proposed method, we report themean Intersection over Union (mIOU ) and the mean pixelaccuracy (mAcc), as defined in equations (9) and (10).
mIoU =1
ncl
∑i
niiti +
∑j nij − nii
. (9)
The mAcc metric defines the percentage of correctlyclassified pixels of a class, averaged over all the segmen-tation classes.
mAcc =1
ncl
∑i nii∑i ti
. (10)
A fraction of 3000 images (10%) of the CelebAHQ-Mask dataset, which were not used in the training process,are used to validate the proposed approach. The resultsof the proposed method compared to other state of the artworks are reported in Table 1. The results are discussed inSection 4.3.1, with some of the predictions of the proposedmethod depicted in Fig. 5.
Baseline methods Table 1 displays the hair segmenta-tion performance on CelebAHQ-Mask, Labeled Parts andFigaro-1k databases, compared to other state-of-the-artmethods based on deep learning frameworks. In Table 1,CelebA* refers to the subset of CelebA dataset annotatedby [1].
Authorized licensed use limited to: b-on: UNIVERSIDADE DA BEIRA INTERIOR. Downloaded on May 11,2021 at 14:03:19 UTC from IEEE Xplore. Restrictions apply.
Soft Biometrics Analysis in Outdoor Environments
192

Figure 5. Segmentation masks obtained by the proposed solution on different datasets. The predicted hair pixels are depicted in blue, skinpixels appear in red and background pixels in black. Last row: some failure cases.
Table 1. Comparison of hair segmentation performance with re-spect to the state-of-the-art.
Method Database Pixel accuracy IoU[19] LFW 97.69 NA[1] LFW 97.01 0.871
[25] LFW 97.32 NAProposed LFW 95.30 0.864
[1] CelebA* 97.06 0.920Proposed CelebA* 97.55 0.881Proposed CelebA-MaskHQ 98.79 0.939
[1] Figaro-1k 90.28 0.778Proposed Figaro-1k 97.61 0.903
Overall, the proposed method achieves high performancefor the task of hair segmentation, even if it is surpassed bythe other methods on the LFW dataset. In our view, thiswas due to the fact that most of these methods are intendedfor various fashion, visagisme or hair coloring applications,in which the hair shape needs to be accurately captured bythe segmentation mask. [19] uses a secondary loss functionbesides binary cross-entropy to obtain accurate segmenta-tion masks from coarse annotation data. This loss functionenforces the consistency between the input image and thepredicted mask edges. In [1] a more complex (VGG-16)fully convolutional neural networks, while [25] combinesfully convolutional neural networks with conditional ran-dom fields to obtain an accurate hair matting result. Also,the lower performance in LFW might be due to the proposedmethod hasn’t been trained on the LFW parts dataset and thesegmentation masks provided by this database are quite dif-ferent from the ones of CelebA-MaskHQ. First of all, theyare provided at super-pixel level, so are not accurate enough
Figure 6. Examples of predicted segmentation masks (LFWdataset): a) predicted; b) ground truth; c) input image.
for high-accuracy evaluation. In addition, as opposed toCelebA-MaskHQ, the hair class also includes facial hair(moustache and beard), while the skin class comprises theneck area. Fig. 6 displays some ground truth segmentationmasks versus predicted masks on the LFW dataset.
The proposed method is not intended for virtual try-on applications, where highly accurate hair segmentationmasks are required, but for soft biometrics analysis in vi-sual surveillance systems. Therefore, we are not interestedin perfectly segmenting all the hair strands or contour de-tails. Moreover, as discussed in the introductory section,
Authorized licensed use limited to: b-on: UNIVERSIDADE DA BEIRA INTERIOR. Downloaded on May 11,2021 at 14:03:19 UTC from IEEE Xplore. Restrictions apply.
Soft Biometrics Analysis in Outdoor Environments
193

Table 2. Hair attributes classification performance of the proposed methodMetric Feature masking Hair color Hairstyle Hair shape
’wavy’ ’straight’ ’bangs’ ’bald’Accuracy 7 88.16 93.20 92.10 92.71 98.40Precision 7 88.13 94.26 92.87 96.32 97.45
Recall 7 88.16 92.00 91.2 88.82 99.40F1 Score 7 88.01 93.11 92.02 92.41 98.41Accuracy 3 93.45 94.30 94.60 94.41 98.10Precision 3 93.50 95.48 95.88 97.23 97.23
Recall 3 93.45 93.00 93.20 91.41 99.00F1 Score 3 93.43 94.22 94.52 94.23 98.12
images captured by security cameras are often low resolu-tion and blurred, and these hair details would be impossibleto distinguish. Even so, from Figure 5 it can be observedthat the proposed network is capable of capturing the over-all hair shape by accurately segmenting larger strands ofhair covering the face or bangs.
4.3.2 Hair Attributes Inference
To evaluate the classification branches, we randomly se-lected test images from the CelebA dataset (which are not apart of CelebA-MaskHQ) such that the number of samplesin each class is the same. The standard metrics: acc - accu-racy, pr - precision, rec -recall and F1 - F1 score are used tonumerically express the performance of the proposed solu-tion. Table 2 summarizes the performance of our network inhair attribute characterization, with and without using con-volutional feature masking (to prove the efficiency of theproposed convolutional feature masking layer). In the lattercase, the network was trained as described in Section 4.2,but the input masks of the hair segmentation module are setto 1, such that the entire image is analyzed for classifyingthe hair shape.
For each hairstyle and shape classes we randomly se-lected 1,000 images from the CelebA dataset that are notpart of CelebA-HQ. Our experiments showed that, exceptfor the bald detection task, the convolutional feature mask-ing resulted in an increase of the classification performance.For the bald attribute, the accuracy values between themasked and unmasked implementations are comparable (adifference of only 0.3%).
The hair color analysis branch was evaluated on 6,000images (1,500 samples for each color class) randomly se-lected from the CelebA dataset. The proposed methoduses softmax as a final classification layer for predictingthe hair color, and considers the class with the highestprobability as the hair color prediction. However, someimages from the CelebA dataset are not labeled with anyof the hair color attributes, or, on the other hand, are la-beled with multiple colors (e.g., ’blond’ and ’gray’). To
be fair in the comparison, both for training and for testing,we randomly selected solely images that contain one andonly one annotation of the hair color classes. Overall, themajority of confusions are between the ’brown’/’blonde’,’brown’/’gray’ and ’blonde’/’gray’ labels. In our view, thiswas mostly due to the subjective perception of hair color,with light brown/dark-blonde colors being easily mistakenwith blond/light blonde color when performing the manualannotation of ground truth data.
The inference step (hair segmentation and hair attributeclassification), takes, on average 350 milliseconds on anthird generation iPad Pro device.
5. Conclusions
This paper described an all-in-one model for hair seg-mentation and attribute analysis, able to jointly extract thehair-facial skin segmentation mask while also inferring in-formation about the hair color, shape and style. Also, as theproposed architecture uses only depth-wise separable con-volutions, it is straightforward to running it in real time,even on devices with limited computational power (e.g.,smartphones). To limit the influence of background and ir-relevant features on the prediction of the network, an at-tention mechanism based on convolutional feature mask-ing layers is proposed. Therefore, in our architecture, theinferred segmentation masks are used by the classificationbranches to determine, at the feature map level, any irregu-lar shaped patches that might correspond to the hair pixels,which enables it to ignore the remaining regions that aredeemed as irrelevant to the analysis problem. This featuremasking strategy is preferred over traditional ROI-Poolinglayers, as if we try to enclose the hair area into a rectan-gle, a large portion of that patch will be ”filled” by the facearea, which introduces irrelevant (but salient) features to theanalysis problem.
Our experiments were performed in challenging in thewild datasets (CelebA, LFW and Fiagro-1k), obtaining highperformance (similar or higher than the state of the art), ata lower computational cost.
Authorized licensed use limited to: b-on: UNIVERSIDADE DA BEIRA INTERIOR. Downloaded on May 11,2021 at 14:03:19 UTC from IEEE Xplore. Restrictions apply.
Soft Biometrics Analysis in Outdoor Environments
194

References[1] D. Borza, T. Ileni, and A. Darabant. A deep learning ap-
proach to hair segmentation and color extraction from facialimages. In International Conference on Advanced Conceptsfor Intelligent Vision Systems, pages 438–449. Springer,2018.
[2] R. Caruana. Multitask learning. Machine Learning,28(1):41–75, Jul 1997.
[3] W.-Y. Chang, S.-H. Hsu, and J.-H. Chien. Fatauva-net: Anintegrated deep learning framework for facial attribute recog-nition, action unit detection, and valence-arousal estimation.In Proceedings of the IEEE Conference on Computer Visionand Pattern Recognition Workshops, pages 17–25, 2017.
[4] J. Dai, K. He, and J. Sun. Boxsup: Exploiting boundingboxes to supervise convolutional networks for semantic seg-mentation. In Proceedings of the IEEE International Con-ference on Computer Vision, pages 1635–1643, 2015.
[5] J. Dai, K. He, and J. Sun. Convolutional feature masking forjoint object and stuff segmentation. In Proceedings of theIEEE Conference on Computer Vision and Pattern Recogni-tion, pages 3992–4000, 2015.
[6] S. Feldstein. The global expansion of ai surveillance.Carnegie Endowment. https://carnegieendowment.org/2019/09/17/global-expansion-of-ai-surveillance-pub-79847, 2019.
[7] R. Girshick. Fast r-cnn. In Proceedings of the IEEE inter-national conference on computer vision, pages 1440–1448,2015.
[8] K. He, X. Zhang, S. Ren, and J. Sun. Spatial pyramid poolingin deep convolutional networks for visual recognition. IEEEtransactions on pattern analysis and machine intelligence,37(9):1904–1916, 2015.
[9] A. G. Howard, M. Zhu, B. Chen, D. Kalenichenko, W. Wang,T. Weyand, M. Andreetto, and H. Adam. Mobilenets: Effi-cient convolutional neural networks for mobile vision appli-cations. arXiv preprint arXiv:1704.04861, 2017.
[10] G. B. Huang, V. Jain, and E. Learned-Miller. Unsupervisedjoint alignment of complex images. In ICCV, 2007.
[11] G. B. Huang, M. Ramesh, T. Berg, and E. Learned-Miller.Labeled faces in the wild: A database for studying facerecognition in unconstrained environments. Technical Re-port 07-49, University of Massachusetts, Amherst, October2007.
[12] A. Hurlbert and Y. Ling. Understanding colour perceptionand preference. In Colour Design, pages 169–192. Elsevier,2017.
[13] T. Ileni, D. Borza, and A. Darabant. Fast in-the-wild hairsegmentation and color classification. In 14th InternationalConference on Computer Vision Theory and Applications,pages 59–66, 2019.
[14] P. Julian, C. Dehais, F. Lauze, V. Charvillat, A. Bartoli, andA. Choukroun. Automatic hair detection in the wild. In 201020th International Conference on Pattern Recognition, pages4617–4620. IEEE, 2010.
[15] T. Karras, T. Aila, S. Laine, and J. Lehtinen. Progressivegrowing of gans for improved quality, stability, and variation.arXiv preprint arXiv:1710.10196, 2017.
[16] D. P. Kingma and J. Ba. Adam: A method for stochasticoptimization. arXiv preprint arXiv:1412.6980, 2014.
[17] A. Krupka, J. Prinosil, K. Riha, J. Minar, and M. Dutta. Hairsegmentation for color estimation in surveillance systems. InProc. 6th Int. Conf. Adv. Multimedia, pages 102–107, 2014.
[18] K.-c. Lee, D. Anguelov, B. Sumengen, and S. B. Gokturk.Markov random field models for hair and face segmentation.In 2008 8th IEEE International Conference on AutomaticFace & Gesture Recognition, pages 1–6. IEEE, 2008.
[19] A. Levinshtein, C. Chang, E. Phung, I. Kezele, W. Guo, andP. Aarabi. Real-time deep hair matting on mobile devices. In2018 15th Conference on Computer and Robot Vision (CRV),pages 1–7. IEEE, 2018.
[20] T.-Y. Lin, M. Maire, S. Belongie, J. Hays, P. Perona, D. Ra-manan, P. Dollar, and C. L. Zitnick. Microsoft coco: Com-mon objects in context. In European conference on computervision, pages 740–755. Springer, 2014.
[21] U. Lipowezky, O. Mamo, and A. Cohen. Using integratedcolor and texture features for automatic hair detection. In2008 IEEE 25th Convention of Electrical and ElectronicsEngineers in Israel, pages 051–055. IEEE, 2008.
[22] W. Liu, D. Anguelov, D. Erhan, C. Szegedy, S. Reed, C.-Y. Fu, and A. C. Berg. Ssd: Single shot multibox detector.In European conference on computer vision, pages 21–37.Springer, 2016.
[23] Z. Liu, P. Luo, X. Wang, and X. Tang. Deep learning faceattributes in the wild. In Proceedings of International Con-ference on Computer Vision (ICCV), December 2015.
[24] H. Proenca and J. C. Neves. Soft biometrics: Globally co-herent solutions for hair segmentation and style recognitionbased on hierarchical mrfs. IEEE Transactions on Informa-tion Forensics and Security, 12(7):1637–1645, 2017.
[25] S. Qin, S. Kim, and R. Manduchi. Automatic skin and hairmasking using fully convolutional networks. In 2017 IEEEInternational Conference on Multimedia and Expo (ICME),pages 103–108. IEEE, 2017.
[26] R. Ranjan, S. Sankaranarayanan, C. D. Castillo, and R. Chel-lappa. An all-in-one convolutional neural network for faceanalysis. In 2017 12th IEEE International Conference onAutomatic Face & Gesture Recognition (FG 2017), pages17–24. IEEE, 2017.
[27] C. Rousset and P.-Y. Coulon. Frequential and color analysisfor hair mask segmentation. In 2008 15th IEEE InternationalConference on Image Processing, pages 2276–2279. IEEE,2008.
[28] Y. Shen, Z. Peng, and Y. Zhang. Image based hair segmenta-tion algorithm for the application of automatic facial carica-ture synthesis. The Scientific World Journal, 2014, 2014.
[29] P. Sinha. Last but not least. Perception, 29(8):1005–1008,2000.
[30] P. Sinha, B. Balas, Y. Ostrovsky, and R. Russell. Face recog-nition by humans: Nineteen results all computer vision re-searchers should know about. Proceedings of the IEEE,94(11):1948–1962, 2006.
[31] P. Sinha and T. Poggio. ’united’we stand. Perception,31(1):133, 2002.
Authorized licensed use limited to: b-on: UNIVERSIDADE DA BEIRA INTERIOR. Downloaded on May 11,2021 at 14:03:19 UTC from IEEE Xplore. Restrictions apply.
Soft Biometrics Analysis in Outdoor Environments
195

[32] M. Svanera, U. R. Muhammad, R. Leonardi, and S. Benini.Figaro, hair detection and segmentation in the wild. In 2016IEEE International Conference on Image Processing (ICIP),pages 933–937. IEEE, 2016.
[33] P. Tome, J. Fierrez, R. Vera-Rodriguez, and M. S. Nixon.Soft biometrics and their application in person recognition ata distance. IEEE Transactions on information forensics andsecurity, 9(3):464–475, 2014.
[34] D. Wang, S. Shan, H. Zhang, W. Zeng, and X. Chen. Isomor-phic manifold inference for hair segmentation. In 2013 10thIEEE International Conference and Workshops on AutomaticFace and Gesture Recognition (FG), pages 1–6. IEEE, 2013.
[35] Y. Wang, Z. Zhou, E. K. Teoh, and B. Su. Human hair seg-mentation and length detection for human appearance model.In 2014 22nd International Conference on Pattern Recogni-tion, pages 450–454. IEEE, 2014.
[36] Y. Yacoob and L. S. Davis. Detection and analysis of hair.IEEE transactions on pattern analysis and machine intelli-gence, 28(7):1164–1169, 2006.
Authorized licensed use limited to: b-on: UNIVERSIDADE DA BEIRA INTERIOR. Downloaded on May 11,2021 at 14:03:19 UTC from IEEE Xplore. Restrictions apply.
Soft Biometrics Analysis in Outdoor Environments
196

Pose Switch-based Convolutional Neural Networkfor Clothing Analysis in Visual Surveillance
Environment
Pendar Alirezazadeh1, Ehsan Yaghoubi2, Eduardo Assuncao3,Joao C. Neves4, Hugo Proenca5IT-Instituto de Telecomunicacoes1,2,3,5, Tomi World4, Portugal
(Pendar.Alirezazadeh1, Ehsan.Yaghoubi2, Eduardo.Assuncao3)@ubi.pt, [email protected], [email protected]
Abstract—Recognizing pedestrian clothing types and styles inoutdoor scenes and totally uncontrolled conditions is appealingto emerging applications such as security, intelligent customerprofile analysis and computer-aided fashion design. Recognitionof clothing categories from videos remains a challenge, mainlydue to the poor data resolution and the data covariates that com-promise the effectiveness of automated image analysis techniques(e.g., poses, shadows and partial occlusions). While state-of-the-art methods typically analyze clothing attributes without payingattention to variation of human poses, here we claim for theimportance of a feature representation derived from human posesto improve classification rate. Estimating the pose of pedestriansis important to fed guided features into recognizing system. Inthis paper, we introduce pose switch-based convolutional neuralnetwork for recognizing the types of clothes of pedestrians, usingdata acquired in crowded urban environments. In particular, wecompare the effectiveness attained when using CNNs withoutrespect to human poses variant, and assess the improvements inperformance attained by pose feature extraction. The observedresults enable us to conclude that pose information can improvethe performance of clothing recognition system. We focus onthe key role of pose information in pedestrian clothing analysis,which can be employed as an interesting topic for further works.
Index Terms—Soft biometrics, pedestrian clothing analysis,surveillance environment, human pose classification.
I. INTRODUCTION
The analysis of the pedestrian appearance, and more specifi-cally clothing analysis, has gained interest in machine learningtechnologies in order to increase accuracy of surveillancebased recognition systems. Clothing is one of the most im-portant soft biometrics to pedestrian analysis and has manydifferent applications, such as clothing retrieval [1], [2], cloth-ing recognition [3], [4], outfit recommendation [5] and visualsearch for matching fashion items [6]. Despite several worksproposed in clothing analysis, clothing recognition can’t beconsidered a solved task, especially for surveillance-based
This research is funded by the “FEDER, Fundo de Coesao e FundoSocial Europeu” under the “PT2020 - Portugal 2020” program, “IT: In-stituto de Telecomunicacoes” and “TOMI: City’s Best Friend”. Also, thework is funded by FCT/MEC through national funds and when applica-ble co-funded by FEDER PT2020 partnership agreement under the projectUID/EEA/50008/2019.
environment, that typically produce poor quality data. A goodclothing recognition system is highly dependent on the trainingphase. If these systems are trained with images in controlledconditions, they will not achieve high performance in the realworld with various clothing appearance, styles and poses.
One of the major problems in the analysis of clothingis the lack of comprehensive dataset with enough images.Recently two datasets have been published. The MVC Dataset[7] for view-invariant clothing retrieval with 161,638 imagesand the DeepFashion Dataset [4] with 800,000 annotated real-life images. Both datasets are image-based dataset. Nowadayswith cities getting bigger and increasing the use of city-level scenes, researchers have shown an increased interest inclothing analysis of pedestrians which are captured by camerasin streets [8], [9].
To perform clothing analysis in surveillance environmentwith uncontrolled conditions, we collected a dataset composedof video-based images from outdoor and indoor advertisementpanels in Portugal and Brazil. On the other hand, clothingattribute analysis is highly dependent on deformation andposes variation of the human body. By moving some parts ofthe body such as the knee, hip, neck, shoulder etc. in variousgestures, different types of clothing may look like each other,which causes the similarity of the extracted feature vectors anddecreases the classification rate. In order to have the ability toclothing recognition in the real application, in this paper, weconsider switching CNN architecture that passes frames froma video within a surveillance environment on related Pose-CNN based on a pose-switch classifier. The related Pose-CNNis chosen based on pose information extracted from the videoframes as in multi-column Pose-CNN networks to augment theability to confront pose variations. A particular Pose-CNN istrained on a video frame if the performance of the network onthe frame’s pose is the best. Fig. 1 illustrates the architectureof our proposed approach.
II. POSE IDENTIFICATION
The pose identification aims to explore the human posegroup, to assist convolutional neural network for better pedes-trian clothing recognition. The output of pose identification
©2019 Gesellschaft für Informatik e.V., Bonn, Germany
Authorized licensed use limited to: b-on: UNIVERSIDADE DA BEIRA INTERIOR. Downloaded on May 11,2021 at 14:03:42 UTC from IEEE Xplore. Restrictions apply.
Soft Biometrics Analysis in Outdoor Environments
197

Pose
Identification
Pose
1 C
NN
Pose
2 C
NN
Pose
8 C
NN
Pose
Identification
Clothing
Label
Pose 8
Human
Detection
Key-point
Detection
Tracking
Pose Extraction
Clothing
Label
Clothing
Label
Pose Switch
Pose
Classification
Fig. 1. Architecture of the proposed method, Pose Switch-CNN is shown. Video frames from the surveillance environment are relayed to one of the eightCNN networks based on the pose label inferred from pose identification.
is a pose number based on feature vector including a set ofcoordinates to describe the pose of the person. It consists oftwo main steps, including estimates human poses and classifiesposes to select the appropriate network.
A. Human pose estimation
Human pose estimation also known as key-point detection,aims to detect the locations of K key-points or part of the bodye.g. R-hip, L-hip, R-shoulder, L-shoulder etc. from boundingbox images. So we have estimated K heatmaps where eachheatmap indicates the location confidence of the defined key-point. In order to obtain pedestrian bounding boxes (BBs), weuse the effective object detection technique VGG-based SSD512 as pedestrian detector. Pedestrian BBs are fed into poseestimator and key points are generated automatically. In thispaper we use CNN based Single Person Pose Estimator (SPPE)method to estimates poses. SPPE network is designed to trainon single person images and it is very sensitive to localizationerrors [10]. On the other hand, pose information consists of aset of key points that each key point belongs to specific region.To select region of interests which have high quality for SPPEnetwork, we use Spatial Transformer Networks (STN) [11].The STN has shown excellent performance in modeling thevariance of scale and pose for adaptively region localization[12]. The STN performs a 2D pointwise transformation withthe affine parameters θ which can be expressed as:(
xsiysi
)=
[θ11 θ12 θ13θ21 θ22 θ23
] xtiyti1
(1)
where (xti, yti) are the target coordinates of the regular grid
in the output feature map and the (xsi , ysi ) are the source
coordinates in the input feature map that define the samplepoints. The output of the SPPE network is a set of 16 keypoints which are used to pose estimation. After human poses
estimation for each BBs, we use pose similarity to track multi-person poses in videos to indicate the same person acrossdifferent frames. Pose metric similarity is used to eliminate theposes which are too close and too similar to each others. Weused intra-frame df and inter-frame dc pose distance metricsto measure the pose similarity between two poses P1 and P2
in a frame and two sequential frames [13]:
(2)df (P1, P2|σ1, σ2, λ) =KSim (P1, P2|σ1)−1 + λHSim (P1, P2|σ2)−1,dc (P1, P2) =
∑Nn=1
fn2
fn1
where
(3)KSim (P1, P2|σ1) = ∑Nn=1 tanh
cn1σ1· tanh cn2
σ1if pn2 is within B (pn1 )
0; otherwise
HSim (P1, P2|σ2) =N∑n=1
exp
[− (pn1 − pn2 )
2
σ2
](4)
where pn1 and pn2 are the nth key points of pose P1 and P2
in B (pn1 ) and B (pn2 ) boxes respectively, N=16 is number ofbody keypoints, fn1 and fn2 are feature point extracted fromboxes, and σ1, σ2 and λ can be determined in a data-drivenmanner. We have extracted coordinates(x,y) for 16 key-pointsof the full body for all the images. Then, these 16 coordinatespoints are concatenated to generate a 32 dimensional bodycoordinate-features vector for each human BBs.
B. Pose classification
Posed-based features may not necessarily be numericallysimilar for similar motions [14] and it is an important chal-lenge in pose-based feature applications. One of the practicalsolutions is finding a suitable pattern that aims to grouping aset of pose-based feature in such a way that features in the
Authorized licensed use limited to: b-on: UNIVERSIDADE DA BEIRA INTERIOR. Downloaded on May 11,2021 at 14:03:42 UTC from IEEE Xplore. Restrictions apply.
Soft Biometrics Analysis in Outdoor Environments
198

same group are more similar to each other than to those inother groups. For this purpose in this study we have used K-means classification algorithm. In order to raise the accuracyof the K-means, we use T-distributed Stochastic NeighborEmbedding (t-SNE) [15] method before classification. Thismethod is known as a nonlinear dimensionality reductiontechnique for visualization high-dimensional data in a low-dimensional space of two or three dimensions that similarfeature vectors are modeled by nearby points and dissimilarfeature vectors are modeled by distant points with high prob-ability. The t-SNE method aims to best capture neighborhoodidentity by considering the probability that one point is theneighbor of all other points. Conditional neighborhood prob-ability of object xi with object xj is defined as:
pj|i =exp
(−‖xi − xj‖2 /2τ2i
)∑k 6=i exp
(−‖xi − xk‖2 /2τ2i
) , (5)
where τ2i is the variance for the Gaussian distributioncentered around xi. Since pij is not necessarily equal to pji,because τij is not necessarily equal to τji, so joint probabilitiespij is defined by symmetrizing two conditional probabilitiesas:
pij =pj|i + pi|j
2N. (6)
We have trained K-means with low dimension featurevectors resulted from t-SNE method and classified the bodycoordinate-features to K classes.
III. RESULTS AND DISCUSSION
In this section, we briefly introduce the datasets, imple-mentation details and results of the proposed method andcomparison methods. The experimental results empiricallyvalidate the effectiveness of the proposed method.
A. Dataset
Due to the lack of comprehensive dataset for pedestrianclothing analysis in surveillance environment, we collectedBiometria e Detecao de Incidentes (BIODI) dataset. TheBIODI dataset collected from 216 videos recorded by 36advertisement panels in Portugal and Brazil. These videoscaptured in various indoor and outdoor environments such asroads, beaches, airports, streets and metro stations at differenthours of the day, lighting, pose, style and various weathers. Ineach panel, a camera is placed at a distance of 1.5 meters fromthe ground. All cameras have the same brand with differentadjustments, which lead to videos with different qualities.There was no precondition and all of the videos were recordedin unconstraint environments. The statistics of BIODI datasetare summarized in the Table I. To recognize the enormousupper-body and lower-body clothing items, we have labeledthe BBs manually. We generated category list bikini, blouse,coat, hoodie, shirt and t-shirt for the upper-body part and jean,legging, pant and short for the lower-body part. Each imagereceived at most one category label for each part.
TABLE ISTATISTICS OF BIODI DATASET
Factors StatisticsNo. of Videos 216
Length of Videos 7 minutesFrame rate extraction 7 frames/sec.
No. of Subjects 13876No. of Bounding Boxes (BBs) 503433
Aspect ratio of BBs (Height/Width) 1.75
To further show the efficacy of our proposed methods, weconducted clothing recognition experiments on the RAP-2.0[16] dataset and compared our results with the performance oftheir best method. RAP-2.0 comes from a realistic HighDefini-tion (1280 × 720) surveillance network at an indoor shoppingmall and all images are captured by 25 cameras scenes. Thisdataset contains 84928 images (2589 subjects) with resolutionranging from 33 × 81 to 415 × 583.
B. Implementation Details
We have adopted K=8 typical poses, empirically. We con-sider a subset of 300,000 images of BIODI as training dataand a subset of 100,000 images as validation data. Basedon pose identification method, the training and validationdata are divided to 8 typical pose groups. Clothes boundingboxes for upper-body and lower-body are detected by use ofextracted key points. Time performance of pose identificationalgorithm for a frame including 20 people is about 0.3 second.To evaluate the performance of our proposed system afterpose identification, we adopt end-to-end CNN approaches asclothing recognition. End-to-end deep learning methods havemade jointly learn features and classifiers. We use CNNs withsame architectures for each pose group. We fine-tune VGG-16 [17] and ResNet50 [18] on training and validation datawith weights of ImageNet [19] dataset for each pose group.In testing, we employ the remain part of BIODI to test thefine-tuned models. We ensure that no subject BBs overlapsbetween fine-tuning and testing sets. The stochastic gradientdescent (SGD) is adopted to optimize the networks. For bothmodels, we use the initial learning rate 1× 10⁻⁴ and weightdecay with 1×10⁻⁶. The models have implemented in Python3.6.7 using the Keras 2.1.6 deep learning library on top of theTensorflow 1.10 backend and trained for 100 epochs with oneNVIDIA GeForce RTX 2080 Ti GPU.
C. Results
We present an extensive evaluation of our proposed methodon upper-body and lower-body clothing recognition. We firstlycompare our framework with two baseline models (i.e. VGG-16 and ResNet50 without pose information) on BIODI datasetto validate the effectiveness of Pose Switch-based CNN. TableII, III show the classification accuracy of baseline models onupper-body and lower-body BIODI clothing categories recog-nition, respectively. From the obtained results, the proposedtechnique increased the performance of clothing recognitionrate on all pose groups of upper-body and lower-body parts.
Authorized licensed use limited to: b-on: UNIVERSIDADE DA BEIRA INTERIOR. Downloaded on May 11,2021 at 14:03:42 UTC from IEEE Xplore. Restrictions apply.
Soft Biometrics Analysis in Outdoor Environments
199

TABLE IITHE PERFORMANCE OF THE PROPOSED METHOD (%) FOR BIODI UPPER-BODY
Network Pose 1 Pose 2 Pose 3 Pose 4 Pose 5 Pose 6 Pose 7 Pose 8 Mean Accuracy without PoseVGG-16 88.94 88.98 89.52 88.79 88.93 89.59 88.54 88.20 88.93 87.41ResNet50 88.02 87.43 87.54 87.44 88.13 88.14 87.37 87.14 87.65 86.23
TABLE IIITHE PERFORMANCE OF THE PROPOSED METHOD (%) FOR BIODI LOWER-BODY
Network Pose 1 Pose 2 Pose 3 Pose 4 Pose 5 Pose 6 Pose 7 Pose 8 Mean Accuracy without PoseVGG-16 87.5 85.21 87.34 88.13 87.97 86.62 85.42 87.62 86.98 86.15ResNet50 86.89 85.66 87.03 88.44 88.04 85.68 85.43 87.54 86.83 85.17
In order to visualize performance of the proposed frameworkwhich has had better performance compared to the situationwithout pose information, we have drawn the receiver operat-ing characteristic (ROC) curve per category for the VGG-16network (Fig.2). We have drawn the ROC curve for coat andblouse classes from upper-body and pants and short classes forlower-body. As it derives from the ROC curves, performanceof VGG-16 network is improved using pose information.Secondly, to further show the efficacy of our approach, we con-ducted clothing recognition experiments on RAP-2.0 datasetand compared our results with the performance of the baselinemethod which is achieved best recognition rate. Based onthe full body’s direction, RAP-2.0 images are annotated tofour types of viewpoints, including facing front (F), facingback (B), facing left (L) and facing right (R). Due to thisbackground, we have classified images to four typical posegroups. The results of employing VGG-16 network in each of4 typical pose groups on RAP-2.0 upper-body and lower-bodyparts are shown in Table IV, V, respectively. It is clear thatfor all typical pose groups, the recognition rates are improvedcompared to without pose information, significantly.
TABLE IVTHE PERFORMANCE OF THE PROPOSED METHOD AND DEEPMAR-R (%)
FOR RAP-2.0 UPPER-BODY
Network Pose 1 Pose 2 Pose 3 Pose 4 MeanVGG-16 82.66 82.89 83.44 83.84 83.20
DeepMAR-R [16] - - - - 76.68
TABLE VTHE PERFORMANCE OF THE PROPOSED METHOD AND DEEPMAR-R (%)
FOR RAP-2.0 LOWER-BODY
Network Pose 1 Pose 2 Pose 3 Pose 4 MeanVGG-16 87.13 86.93 87.49 87.06 87.15
DeepMAR-R [16] - - - - 81.33
IV. CONCLUSION AND FUTURE WORKS
Since surveillance-based images are collected in uncon-strained environment with various pose and styles, differenttypes of clothing may look like each other which causes the
similarity of the extracted feature vectors and decreases theclassification rate. In this paper, we propose pose switch-basedconvolutional neural network that leverages pose variationto improve the accuracy of the pedestrian clothing recogni-tion in crowded urban environments. The proposed methodemploys pose estimation techniques to key point detectionfor coordinate-features representation. We have classified allBBs to eight typical pose groups using these features. Theconvolutional neural networks are trained for each pose groupand recognized upper-body and lower-body clothing images.Extensive experiments on RAP-2 datasets show that ourmethod exhibits state-of-the art performance on major datasetin real surveillance scenarios. In the future, we plan to extendthe proposed method to explore more efficient human semanticstructure knowledge to assist pedestrian attribute recognition.
REFERENCES
[1] Z. Li, Y. Li, W. Tian, Y. Pang, and Y. Liu, “Cross-scenario clothingretrieval and fine-grained style recognition,” in 2016 23rd InternationalConference on Pattern Recognition (ICPR), pp. 2912–2917, IEEE, 2016.
[2] X. Liang, L. Lin, W. Yang, P. Luo, J. Huang, and S. Yan, “Clothesco-parsing via joint image segmentation and labeling with applicationto clothing retrieval,” IEEE Transactions on Multimedia, vol. 18, no. 6,pp. 1175–1186, 2016.
[3] A. Y. Ivanov, G. I. Borzunov, and K. Kogos, “Recognition and identi-fication of the clothes in the photo or video using neural networks,” in2018 IEEE Conference of Russian Young Researchers in Electrical andElectronic Engineering (EIConRus), pp. 1513–1516, IEEE, 2018.
[4] Z. Liu, P. Luo, S. Qiu, X. Wang, and X. Tang, “Deepfashion: Power-ing robust clothes recognition and retrieval with rich annotations,” inProceedings of the IEEE conference on computer vision and patternrecognition, pp. 1096–1104, 2016.
[5] P. Tangseng, K. Yamaguchi, and T. Okatani, “Recommending outfitsfrom personal closet,” in Proceedings of the IEEE International Con-ference on Computer Vision, pp. 2275–2279, 2017.
[6] J. Lasserre, C. Bracher, and R. Vollgraf, “Street2fashion2shop: Enablingvisual search in fashion e-commerce using studio images,” in Interna-tional Conference on Pattern Recognition Applications and Methods,pp. 3–26, Springer, 2018.
[7] K.-H. Liu, T.-Y. Chen, and C.-S. Chen, “Mvc: A dataset for view-invariant clothing retrieval and attribute prediction,” in Proceedings ofthe 2016 ACM on International Conference on Multimedia Retrieval,pp. 313–316, ACM, 2016.
[8] J. Huang, X. Wu, J. Zhu, and R. He, “Real-time clothing detection withconvolutional neural network,” in Recent Developments in IntelligentComputing, Communication and Devices, pp. 233–239, Springer, 2019.
[9] M. Yang and K. Yu, “Real-time clothing recognition in surveillancevideos,” in 2011 18th IEEE International Conference on Image Pro-cessing, pp. 2937–2940, IEEE, 2011.
Authorized licensed use limited to: b-on: UNIVERSIDADE DA BEIRA INTERIOR. Downloaded on May 11,2021 at 14:03:42 UTC from IEEE Xplore. Restrictions apply.
Soft Biometrics Analysis in Outdoor Environments
200

Fig. 2. ROC curves of the VGG-16 for different categories on BIODI upper-body and lower-body.
[10] H.-S. Fang, S. Xie, Y.-W. Tai, and C. Lu, “Rmpe: Regional multi-personpose estimation,” in Proceedings of the IEEE International Conferenceon Computer Vision, pp. 2334–2343, 2017.
[11] M. Jaderberg, K. Simonyan, A. Zisserman, et al., “Spatial transformernetworks,” in Advances in neural information processing systems,pp. 2017–2025, 2015.
[12] D. Li, X. Chen, Z. Zhang, and K. Huang, “Pose guided deep model forpedestrian attribute recognition in surveillance scenarios,” in 2018 IEEEInternational Conference on Multimedia and Expo (ICME), pp. 1–6,IEEE, 2018.
[13] Y. Xiu, J. Li, H. Wang, Y. Fang, and C. Lu, “Pose flow: Efficient onlinepose tracking,” arXiv preprint arXiv:1802.00977, 2018.
[14] A. Yao, J. Gall, G. Fanelli, and L. Van Gool, “Does human actionrecognition benefit from pose estimation?,” in BMVC 2011-Proceedingsof the British Machine Vision Conference 2011, 2011.
[15] H. Zhou, F. Wang, and P. Tao, “t-distributed stochastic neighbor em-bedding method with the least information loss for macromolecularsimulations,” Journal of chemical theory and computation, vol. 14,no. 11, pp. 5499–5510, 2018.
[16] D. Li, Z. Zhang, X. Chen, and K. Huang, “A richly annotated pedes-trian dataset for person retrieval in real surveillance scenarios,” IEEEtransactions on image processing, vol. 28, no. 4, pp. 1575–1590, 2019.
[17] K. Simonyan and A. Zisserman, “Very deep convolutional networks forlarge-scale image recognition,” arXiv preprint arXiv:1409.1556, 2014.
[18] K. He, X. Zhang, S. Ren, and J. Sun, “Deep residual learning for imagerecognition,” in Proceedings of the IEEE conference on computer visionand pattern recognition, pp. 770–778, 2016.
[19] O. Russakovsky, J. Deng, H. Su, J. Krause, S. Satheesh, S. Ma,Z. Huang, A. Karpathy, A. Khosla, M. Bernstein, et al., “Imagenet largescale visual recognition challenge,” International journal of computervision, vol. 115, no. 3, pp. 211–252, 2015.
Authorized licensed use limited to: b-on: UNIVERSIDADE DA BEIRA INTERIOR. Downloaded on May 11,2021 at 14:03:42 UTC from IEEE Xplore. Restrictions apply.
Soft Biometrics Analysis in Outdoor Environments
201
Related Documents


![Biometric Standards documents/Standards... · Biometric Profiles Biometric [Application] Profile – a conforming subset or combination of base standards used to effect specific biometric](https://static.cupdf.com/doc/110x72/5f711372ce578d4ee02aea91/biometric-standards-documentsstandards-biometric-profiles-biometric-application.jpg)