Neighborhood Violence, Peer Effects, and Academic Achievement in Chicago Julia Burdick-Will 1 Abstract Research shows that exposure to local neighborhood violence is associated with students’ behavior and engagement in the classroom. Given the social nature of schooling, these symptoms not only affect indi- vidual students but have the potential to spill over and influence their classmates’ learning, as well. In this study, I use detailed administrative data from five complete cohorts of students in the Chicago Public Schools (2002 to 2010), crime data from the Chicago Police Department, and school-level surveys con- ducted by the University of Chicago Consortium on Chicago School Research to assess the strength of this peer effect. The estimated negative relationship between peer exposure to neighborhood violent crime and individual achievement is substantial and remains after adjusting for other peer characteristics and student fixed effects. Surveys suggest these results are related to trust, discipline, and safety concerns in cohorts with larger proportions of students from violent neighborhoods. Keywords neighborhood effects, urban schooling, peer effects, achievement, violence Schools function best when all students arrive ready to learn and are able to concentrate on instruction (Sørenson and Hallinan 1977); however, many stu- dents, especially in urban areas, are exposed to envi- ronments outside of schools that make it difficult to be fully engaged. Exposure to local neighborhood violence is associated with reductions in test scores and increases in stress, depression, and aggression, all of which can lead to disruptive and distracting behavior in the classroom (Aizer 2007; Bell and Jen- kins 1993; Bingenheimer, Brennan, and Earls 2005; Bowen and Van Dorn 2002; Guerra, Huesmann, and Spidler 2003; Sharkey 2010). Given the social nature of schooling, these symptoms not only affect individual students but have the potential to spill over and influence their classmates’ learning, as well. Even a few disrup- tive or disengaged students have the potential to derail instruction for the entire class (Cohen, Lotan, and Leechor 1989; McFarland 2001). In this study, I use detailed administrative data from five complete cohorts of students in the Chicago Public Schools (CPS; 2002 to 2010), crime data from the Chicago Police Department (CPD), and school-level surveys conducted by the University of Chicago Consortium on Chicago School Research (CCSR) to assess the strength of this peer effect. The estimated negative relation- ship between peer exposure to neighborhood vio- lence and individual achievement is substantial. These estimates are larger than those of peer neighborhood socioeconomic disadvantage and larger for students from safer neighborhoods. Sur- vey data suggest these results are related to increased reports of disciplinary problems and reductions in perceived safety and teacher trust 1 Johns Hopkins University, Baltimore, MD, USA Corresponding Author: Julia Burdick-Will, Johns Hopkins University, 533 Mergenthaler Hall, 3400 N. Charles St., Baltimore, MD 21218, USA. E-mail: [email protected] Sociology of Education 2018, Vol. 91(3) 205–223 Ó American Sociological Association 2018 DOI: 10.1177/0038040718779063 journals.sagepub.com/home/soe

Welcome message from author
This document is posted to help you gain knowledge. Please leave a comment to let me know what you think about it! Share it to your friends and learn new things together.
Transcript
Neighborhood Violence, PeerEffects, and AcademicAchievement in Chicago
Julia Burdick-Will1
Abstract
Research shows that exposure to local neighborhood violence is associated with students’ behavior andengagement in the classroom. Given the social nature of schooling, these symptoms not only affect indi-vidual students but have the potential to spill over and influence their classmates’ learning, as well. In thisstudy, I use detailed administrative data from five complete cohorts of students in the Chicago PublicSchools (2002 to 2010), crime data from the Chicago Police Department, and school-level surveys con-ducted by the University of Chicago Consortium on Chicago School Research to assess the strength ofthis peer effect. The estimated negative relationship between peer exposure to neighborhood violentcrime and individual achievement is substantial and remains after adjusting for other peer characteristicsand student fixed effects. Surveys suggest these results are related to trust, discipline, and safety concernsin cohorts with larger proportions of students from violent neighborhoods.
Keywords
neighborhood effects, urban schooling, peer effects, achievement, violence
Schools function best when all students arrive ready
to learn and are able to concentrate on instruction
(Sørenson and Hallinan 1977); however, many stu-
dents, especially in urban areas, are exposed to envi-
ronments outside of schools that make it difficult to
be fully engaged. Exposure to local neighborhood
violence is associated with reductions in test scores
and increases in stress, depression, and aggression,
all of which can lead to disruptive and distracting
behavior in the classroom (Aizer 2007; Bell and Jen-
kins 1993; Bingenheimer, Brennan, and Earls 2005;
Bowen and Van Dorn 2002; Guerra, Huesmann, and
Spidler 2003; Sharkey 2010).
Given the social nature of schooling, these
symptoms not only affect individual students but
have the potential to spill over and influence their
classmates’ learning, as well. Even a few disrup-
tive or disengaged students have the potential to
derail instruction for the entire class (Cohen,
Lotan, and Leechor 1989; McFarland 2001). In
this study, I use detailed administrative data
from five complete cohorts of students in the
Chicago Public Schools (CPS; 2002 to 2010),
crime data from the Chicago Police Department
(CPD), and school-level surveys conducted by
the University of Chicago Consortium on Chicago
School Research (CCSR) to assess the strength of
this peer effect. The estimated negative relation-
ship between peer exposure to neighborhood vio-
lence and individual achievement is substantial.
These estimates are larger than those of peer
neighborhood socioeconomic disadvantage and
larger for students from safer neighborhoods. Sur-
vey data suggest these results are related to
increased reports of disciplinary problems and
reductions in perceived safety and teacher trust
1Johns Hopkins University, Baltimore, MD, USA
Corresponding Author:
Julia Burdick-Will, Johns Hopkins University, 533
Mergenthaler Hall, 3400 N. Charles St., Baltimore,
MD 21218, USA.
E-mail: [email protected]
Sociology of Education2018, Vol. 91(3) 205–223
� American Sociological Association 2018DOI: 10.1177/0038040718779063
journals.sagepub.com/home/soe

in cohorts with larger proportions of students from
violent neighborhoods.
Estimating the true effect of these spillovers
presents methodological difficulties due to the
possibility of selection and omitted-variable bias.
Students living in violent neighborhoods are likely
to be distinct from those in safer neighborhoods,
and schools that educate different proportions of
these students are likely to differ in ways that
are associated with achievement. To adjust for
the consequences of this selection bias, I compare
students to themselves in different calendar years
using individual fixed effects. These models com-
pare the subject-specific composition of students’
classrooms to their achievement in different years.
They show that when classmates are exposed to
higher levels of neighborhood violence, students’
performance on standardized test scores suffers.
Documenting the relationship between peer
exposure to neighborhood violence and individual
learning is important for two reasons. First, if the
composition of students has a causal effect on
achievement, then the sorting of students into and
within schools becomes a potential source of educa-
tional inequality. Grouping students with behavior
problems in the same classroom puts those students
at a disadvantage by making some classrooms more
conducive to learning than others. While formal
tracking is on the decline, recent changes in school
assignment policies have led to substantial sorting
of students across schools according to their middle
school achievement, making it more likely that stu-
dents with behavior problems and other forms of
disadvantage are found in the same classrooms
(Lutton 2014). Second, if the effects of violence
can be felt in schools across the city (see
Burdick-Will 2017), then reducing that violence
should be important to residents and policy makers
in every neighborhood, not just those with the high-
est crime rates. In fact, reducing violence in the city
may benefit a much larger number of students than
one might first assume.
NEIGHBORHOOD VIOLENCE,PEER BEHAVIOR, ANDACHIEVEMENT
Neighborhood-effects research tends to focus on
demographic differences between neighborhoods,
such as poverty rates, and points toward geo-
graphic and cultural isolation, which socializes
youth to subcultural, antiacademic norms and
deprives them of the material and institutional
resources needed for academic achievement (for
reviews, see Johnson 2012; Sampson, Morenoff,
and Gannon-Rowley 2002). Recently, neighbor-
hood research has moved beyond poverty meas-
ures to examine the relationship between local
exposure to violent crime and educational out-
comes. For example, Sharkey (2010) shows that
local homicides are associated with short-term
reductions in performance on standardized tests.
Harding (2009) shows that violent-crime rates
explain much of the association between neighbor-
hood socioeconomic disadvantage and high school
graduation. Burdick-Will (2016) shows that early
exposure to neighborhood violence is associated
with slower test score growth through high school.
Finally, Schwartz and colleagues (2016) show that
repeated exposure to local violence leads to
increasingly large reductions in test scores.
The primary mechanisms linking local violence
and educational outcomes in existing studies are
driven by psychological stress and behavioral adap-
tations intended to provide protection in dangerous
streets. Research shows that growing up in a violent
neighborhood leads to higher rates of aggression and
depression (Aizer 2007; Bell and Jenkins 1993; Bin-
genheimer et al. 2005; Bowen and Van Dorn 2002;
Guerra et al. 2003). This behavior may be the result
of a feeling of hypervigilance when it comes to
threats and a tendency to interpret others’ actions
with a bias toward hostile intent (Margolin and
Gordis 2000) or due to neurological responses to
stress and fear (LeDoux 2000). Sharkey and col-
leagues (2012), for example, show that the stress
experienced after a local homicide limits attention
spans and decreases impulse control.
Adolescents may also use aggressive behavior
as a form of protection, to keep others in their
neighborhood from bothering them (Anderson
1999; Jones 2004; Harding 2010). However, even
if students are just acting tough and are not inclined
to engage in disruptive or violent behavior, their
fellow students and teachers can misinterpret their
demeanor and attitude. This form of cultural misun-
derstanding has the potential to make everyone in
the classroom feel less safe and to undermine the
relationships between students and teachers that
are necessary to create a productive learning envi-
ronment (Dance 2002; Devine 1996).
Some students who experience stress and
trauma through neighborhood violence may not
206 Sociology of Education 91(3)

react in an aggressive manner. Instead, they may
withdraw and exhibit internalizing behavioral prob-
lems, such as depression, anxiety, and distraction
(Phillips and Shonkoff 2000). These behaviors
also have the potential to slow the pace of instruc-
tion for the entire classroom. Moreover, students
dealing with emotional trauma require extra atten-
tion from teachers and school counselors, which
can detract from the time and resources available
for other students (Walkley and Cox 2013).
Neighborhood violence may also influence stu-
dents’ academic engagement and emotional connec-
tions to their school community. A long history of
urban ethnographic research suggests that living in
a high-crime neighborhood can have a negative
impact on interpersonal and institutional trust
(Anderson 1999; Bourgois 1995; Goffman 2009;
Harding 2010; Sanchez-Jankowski 2008; Venkatesh
2000; Wacquant 2008; see also Kirk and Papachris-
tos 2011; Sampson and Bartusch 1998). In general,
these studies describe how residents in high-crime
and violent neighborhoods do not trust the police
to prevent crime, nor do they trust that individual
police officers have their best interests in mind
when on patrol (Carr, Napolitano, and Keating
2007). This mistrust appears to extend to teachers
and school administrators, as well (Harding 2010).
Successful teaching and instruction requires trust
and social bonding between students and teachers.
When students come to the classroom wary and sus-
picious, they are more likely to rebel and disrupt
the functioning of the classroom (Bidwell 1965;
Sørenson and Hallinan 1977; Waller 1932).
The literature on the effects of school composi-
tion and peer effects bears much in common with
that on neighborhood effects. Both deal with
whether and how the characteristics of those
around a given area (either as neighbors or class-
mates) influence an individual’s outcomes. More-
over, traditional discussions of school composition
effects tend to focus on relatively similar theoret-
ical mechanisms as those of neighborhood pov-
erty: collective socialization, relative deprivation,
and lack of institutional resources. The classic
review of neighborhood effects research by Jencks
and Mayer (1990:138) is quite explicit about this
connection: ‘‘Even if neighborhood and school
mix were not strongly correlated, we would expect
them to have somewhat similar effects because
most of the same social processes should be at
work in both contexts.’’ The measures used to
assess these effects have equally focused on demo-
graphic markers, using the racial composition of
the school and the percentage of students receiving
free or reduced lunch or living in poverty (Johnson
2012); however, the empirical evidence for the
effects of high-poverty schools is as mixed and
inconclusive as that of neighborhood poverty.
Despite strong cross-sectional correlations
between high-poverty schools and achievement
(Chaplin 2002; Coleman et al. 1966; Gamoran
1996; Hauser, Sewell, and Alwin 1976; Lee and
Smith, 1997), individual-level studies that track
student growth show no real effect on learning
(Lauen and Gaddis 2013).
Nevertheless, there is growing evidence that
stressed, distracted, disengaged, and poorly
behaved students, regardless of their socioeco-
nomic background, disrupt instruction and drain
resources in ways that make schools less func-
tional. Behavior problems can range from simple
lack of attention that slows instruction to violent
disruptions that bring all instruction to a halt
(Cohen et al. 1989; McFarland 2001).
Because it is difficult to measure classroom
environments on a large scale, many quantitative
studies of behavioral peer effects rely on clever
proxies. For example, Figlio (2007) uses the num-
ber of boys with typically female first names as
an instrument for disruptive behavior, based on
the logic that these boys are more likely to be
picked on. Aizer (2009) exploits the plausibly
exogenous timing of Attention Deficit Disorder
diagnoses and treatment to show that not-yet-
diagnosed students are disruptive in the classroom.
Carrell and Hoekstra (2010) and Bryk and col-
leagues (2010) use the concentration of students
living in homes with reported domestic violence
cases and students in the foster care system, respec-
tively, as proxies for students likely experiencing
stressful home situations. Finally, Nomi and Allens-
worth (2013) exploit policy changes that altered the
composition of freshmen math classes and sorted
larger numbers of students with disciplinary prob-
lems into particular classrooms. These studies all
show that students with stressful family lives and
discipline problems put a strain on school and class-
room resources. Despite the indirect measures of
behavior, the range of proxies and methods and the
consistency of these relationships suggest that dis-
tracted, disruptive, and disengaged students do
have a negative effect on their peers’ achievement.
Given the documented relationship between neigh-
borhood violence, stress, and behavior, the same
added strain on school resources is likely to occur
when students live in dangerous neighborhoods.
Burdick-Will 207

DATA AND MEASURES
The research on neighborhood violence and peer
behavior suggests one should expect the influence
of neighborhood violence to spread from individ-
ual students to peers in the classroom. Stressed,
disruptive, antsy, and disengaged students from
dangerous neighborhoods can undermine the
learning process for the entire classroom. There-
fore, this study will attempt to answer the follow-
ing question: Are there negative spillover effects
of neighborhood violence on achievement within
a classroom? In other words, to what extent is
the average level of neighborhood violence of
one’s classroom peers related to reductions in stu-
dent achievement? To test this spillover hypothe-
sis, it is necessary to bring together data from mul-
tiple sources. Specifically, this study uses detailed
crime data from CPD, complete administrative
files from CPS, and biannual school-level surveys
from CCSR. The analytic data set includes the five
cohorts of students who were first-time freshmen
between the fall of 2002 and 2006. Every student
is followed for the four years it should take to
complete high school, regardless of actual prog-
ress toward graduation.
Student Data
Basic student information, such as gender, race,
age, grade, special education designation, census
block group ID, and school ID, comes from the
CPS administrative files. Everything except race
and gender can change over time, including where
a student lives and attends school. Changes in
school and neighborhood IDs are used to generate
indicators for school and residential mobility.
Scale scores from annual standardized tests are
also recorded in these administrative files. Scale
scores on the eighth-grade Illinois Test of Basic
Skills are used to measure achievement prior to
entering high school. These scale scores are
designed to be equivalent for different calendar
years, and unlike percentile scores they have no
floor or ceiling. During high school, CPS students
take three tests: EXPLORE, PLAN, and Prairie
State Achievement Examination (PSAE). These
tests are designed to be taken in sequence and
are scored on a common scale (1 to 36); one year’s
gain is supposed to be approximately four points.
EXPLORE and PLAN are given to 9th and 10th
graders, respectively, a few weeks after the start
of the school year each fall. Eleventh graders
may take PLAN in the fall, but they are also
required to take the PSAE near the end of the
school year. A subset of the PSAE contains the
ACT used for college admission. These tests
have a variety of sections, but this study focuses
only on the main sections: reading and math.1
Crime Data
The crime data come from eight years of location-
specific CPD incident reports (September 2001
through August 2009). Counts of violent crime
include all homicides, sexual assaults, aggregated
and simple batteries, aggravated and simple
assaults, and robberies. Census block-group-level
crime counts include all violent crimes during
one year prior to the start of school in the fall. I
use counts rather than rates for two reasons. First,
the literature on neighborhood violence focuses on
geographic exposure rather than direct victimiza-
tion or witnessing, and a homicide in front of
one’s home will be stressful regardless of how
many other people live in the neighborhood. Sec-
ond, determining the exact population of census
block groups on an annual basis is difficult. Linear
extrapolation of population counts between the
2000 Census and the 2010 Census will likely be
inaccurate, given the dramatic and often sudden
population changes in tracts where public housing
was closed during this period.
The exact location of a crime may also contain
errors, especially when determining on which side
of the street a crime took place. Given the small
size of Chicago’s block groups (.09 square miles,
seven city blocks on average), students likely
have some knowledge of and exposure to crimes
that take place in adjacent block groups. There-
fore, I created a spatially smoothed average of
the crime count in each block group and its contig-
uous block groups. This allows crimes located on
either side of the street to count toward the focal
block group’s crime count. I then logged this con-
tiguous block group measure. Together, the spatial
smoothing and logging reduce the microvariation
and skewness of the distributions while leaving
quite a bit of variability in crime rates across the
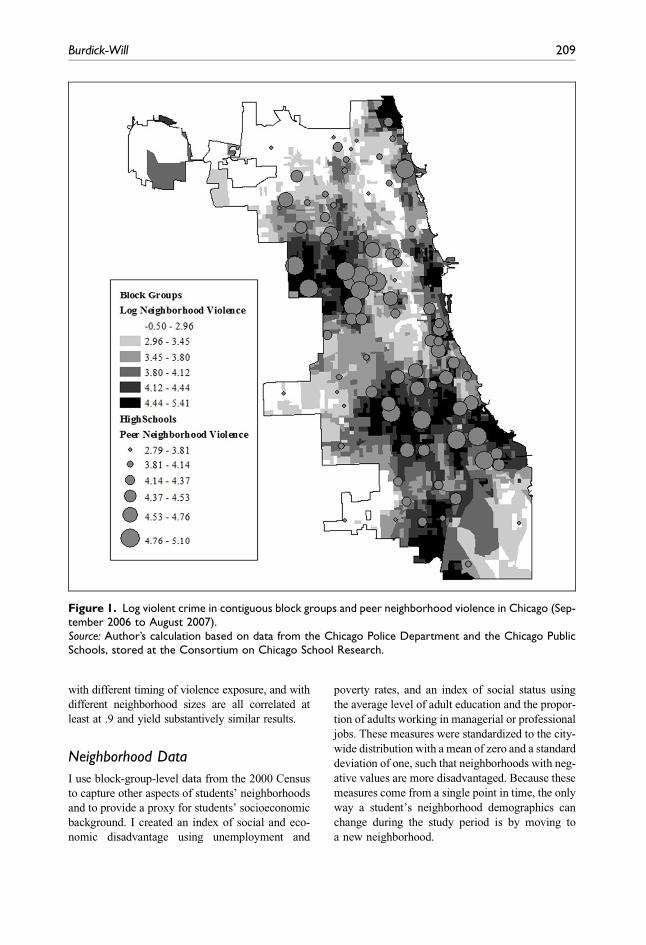
city (Figure 1). It also means that a relatively small
number of the most extreme values of block-group
violent crime are given less weight in the calculation
of peer exposure. Measures of peer exposure to
neighborhood violence without the transformations,
208 Sociology of Education 91(3)
with different timing of violence exposure, and with
different neighborhood sizes are all correlated at
least at .9 and yield substantively similar results.
Neighborhood Data
I use block-group-level data from the 2000 Census
to capture other aspects of students’ neighborhoods
and to provide a proxy for students’ socioeconomic
background. I created an index of social and eco-
nomic disadvantage using unemployment and
poverty rates, and an index of social status using
the average level of adult education and the propor-
tion of adults working in managerial or professional
jobs. These measures were standardized to the city-
wide distribution with a mean of zero and a standard
deviation of one, such that neighborhoods with neg-
ative values are more disadvantaged. Because these
measures come from a single point in time, the only
way a student’s neighborhood demographics can
change during the study period is by moving to
a new neighborhood.
Figure 1. Log violent crime in contiguous block groups and peer neighborhood violence in Chicago (Sep-tember 2006 to August 2007).Source: Author’s calculation based on data from the Chicago Police Department and the Chicago PublicSchools, stored at the Consortium on Chicago School Research.
Burdick-Will 209

Peer Composition
The analysis defines peers as all other students in
each student’s English and math classes. Specifi-
cally, peer neighborhood violence is defined by
the average neighborhood violence level that all
students in the focal student’s classroom experi-
enced that year, excluding themselves:
Ptgisk5Sj 6¼ilog Vtgjsk
� �= ntgs � 1� �
; ð1Þ
where i is the focal student, Vtgsk is the average
violent crime count in neighborhood k and its sur-
rounding block groups in the 12 months leading up
to academic year t for students in classroom g and
school s, and n is the number of students in that
classroom.
As described in more detail in the Methods sec-
tion, the estimation requires that this peer compo-
sition measure vary for students over time. This
variation comes from three sources. First, the
block-group violent crime count changes from
year to year. Even if peers come from the same
neighborhoods every year, changes in the local
crime rate would lead to annual differences in vio-
lence exposure. Violent crime declined substan-
tially throughout Chicago during this period. In
2002 to 2003, the average count of violent crimes
in a block group was 83; in 2009 to 2010, it was
59. However, specific neighborhoods rarely expe-
rienced steady, monotonic declines. Crime counts
bounced up and down quite a bit from year to year
within specific block groups and even increased in
some parts of the city. Second, students move dur-
ing high school at different rates every calendar
year. Students change schools and homes during
the four-year period in ways that change not
only an individual student’s exposure to peers
but the neighborhood exposure and composition
of the peers themselves. Around 4 percent of stu-
dents change schools each year, and 5 percent
change census block groups; 82 percent of stu-
dents never change schools. Restricting the sample
to students who never change schools yields some-
what larger coefficients for peer neighborhood
violent crime exposure. Finally, students are
sorted into different sections of math and English
every year, resulting in somewhat different peer
exposure each year. It is possible that students
already on a downward trajectory are sorted into
classrooms with progressively higher peer neigh-
borhood violence exposure; however, classroom-
level peer measures are strongly correlated with
neighborhood violence exposure for the whole
grade in a school (reading, r = .94; math, r =
.89), suggesting that sorting into classrooms by
neighborhood violence exposure is not particularly
strong. Using a grade-level measure yields almost
identical results to those presented here.
In addition to exposure to peer neighborhood
violence, I calculated other measures of peer char-
acteristics using the same formulas. These include
peer average eighth-grade test scores, neighborhood
socioeconomic disadvantage, neighborhood social
status, school mobility, and residential mobility. I
also included school size to ensure that the compo-
sition measures are not just a reflection of larger
schools that attract a more diverse student body.
School Climate
School-level measures of school climate are avail-
able from surveys that CCSR conducts every other
year. Perceived safety at school comes from four
survey questions: How safe do you feel (1) outside
around the school, (2) traveling to and from school,
(3) in the hallways or bathrooms of the school, and
(4) in your classroom? A measure that captures peer
support asks if students’ classmates treat each other
with respect, work together well, and help each
other learn; and if other students disrupt class,
like to put others down, and do not care about
each other. Finally, students report how often dur-
ing the school year they have gotten into trouble,
been sent to the office for getting into trouble,
been suspended, or had their parents contacted
because they got into trouble. In addition to con-
ducting the in-school surveys, CCSR also uses mul-
tilevel Rasch models to convert the measures to
a 10-point scale and generate reliable school-level
measures that are adjusted for school composition
and student-level missing data. CCSR uses the Big-
steps program created by MESA Press at the Uni-
versity of Chicago to develop these measures.2
Because these surveys are conducted only
every other year, including these measures in the
main model would severely limit the number of
observations per student; however, cross-sectional
correlations and school-level analysis over time
with these measures provide a rough picture of
the relationship between school climate and stu-
dents’ exposure to neighborhood violence. More
detail on these survey measures and how they
change over time can be found in Steinberg,
Allensworth, and Johnson (2011) and Burdick-
Will (2013).
210 Sociology of Education 91(3)

Missing Data
Because this analysis is based on administrative
records, only students who remain enrolled in
any school in the district, including charter
schools, will show up in the annual files. This
means the number of students in the data decreases
as each cohort advances in grade and students drop
out or leave the public school system. By 11th
grade, each cohort of students is around 78 percent
of its original size. Estimating the models with
only students who remain in CPS for all four years
yields similar results, and exposure to individual-
or grade-level neighborhood violence in a given
year does not appear related to the probability
that a student leaves the district (Appendix Table
A1 in the online version of the article). This may
come as a surprise, given prior research on neigh-
borhood violence and high school graduation
(Harding 2010). However, it is important to note
that leaving, in the administrative data, is not the
same as dropping out of school: many students
who transfer to another public or private school
go on to graduate from high school.
The only individual variables with any nontriv-
ial amount of missingness for years when students
are enrolled in the district are the test scores, both
as outcomes and as middle school covariates.
Approximately 8.4 percent of first-time freshmen
in these cohorts are missing eighth-grade test
scores. These are largely students who were not
enrolled in CPS in that grade, and they are excluded
from the analysis. I also excluded observations if
the outcome variable was missing. On average,
there are approximately 2.5 tests per student. The
final analytic data set includes 117,678 students,
291,398 reading scores, and 291,619 math scores.
Students who are missing an outcome were some-
what lower achieving in middle school and more
likely to be in special education or have repeated
a grade, but there is no evidence that the probability
of missing a test score or grade is significantly
related to the level of peer neighborhood violence.
METHODS
Testing for the causal effect of any type of envi-
ronmental influence is difficult using observa-
tional data. Any correlation between school com-
position and individual achievement may be due
to the selection of otherwise similar students into
the same school. To account for as much of that
selection as possible, I take advantage of the data’s
longitudinal nature to adjust for unobserved time-
invariant differences between students with an
individual fixed-effects model. The model com-
pares the peer exposure and test scores of students
in one year to their exposure and achievement in
a different year, thereby adjusting for bias from
student characteristics that do not change over
time, including race, gender, prior achievement,
and innate ability:
Yti5b01b1Pti1b2Nti1b3Wti
1b4Ets1Tt1Si1eti; ð2Þ
where Yti is the achievement outcome (either
reading or math test scores) for student i in aca-
demic year t; Pti is the average level of log violent
crime experienced by the focal student’s peers
during the 12 months prior to that academic year
(see Equation 1); Nti is the spatially smoothed
and logged violent crime count for the prior year
in the neighborhood where the student lives; Wti
are time-varying student covariates, including
age, grade repetition, special education status,
school and residential mobility, and neighborhood
demographics; Ets is a time-varying measure of the
number of students in each school, because school
size may be correlated with school attendance pat-
terns, classroom sorting, and achievement; Tt is
the fixed effects for the calendar year; and Si is
student fixed effects. Standard errors are robust
and clustered at the student level.3
SCHOOL ATTENDANCE INCHICAGO
These fixed-effects models rely on variation over
time in the neighborhood composition of Chica-
go’s high school classrooms. In addition, the theo-
retical argument that the effects of neighborhood
violence spill over among classmates requires
that school and neighborhood composition are
not interchangeable or entirely overlapping.
Across the country, and especially in Chicago,
within-district choice policies are breaking down
the geographic link between neighborhood and
school. Nationally, in 2007, half of all students
had some level of choice in their public school
(Grady, Bielick, and Aud 2010). In Chicago, an
examination of the attendance patterns of a single
cohort of eighth graders reveals that only 32
Burdick-Will 211

percent of students attended the high school pre-
dicted by their residential location, and students
from violent neighborhoods were most likely to
abandon their neighborhood school in search of
alternative educational options. These students
attend not only open-enrollment schools, such as
charters, magnets, and vocational schools, but also
underenrolled traditional neighborhood schools in
other parts of the city (Burdick-Will 2017).
In one high-minority, high-poverty, and low-
achieving school in the heart of the violent South
Side with no magnet programs, nearly one third of
the first-time freshman cohort in 2008 came from
outside the attendance boundary area. Students
traveled up to 15 miles across the city to attend
the school, and they came from neighborhoods at
all levels of the violent crime distribution. Schools
with more formal open enrollment or special pro-
gramming attract a much higher proportion of stu-
dents from outside their attendance boundaries.
On average, in Chicago, schools educate students
from 80 different census tracts in a single cohort.
Even traditional neighborhood high schools bring
in students from 70 different tracts, on average.
Therefore, when considering the joint effects of
neighborhood violence and school composition,
it is important to understand that these models
are not based on small variations in crime rates
in the relatively small geographic area of schools’
attendance boundaries. Instead, students are mix-
ing in schools with peers from across the city;
many of their peers are from neighborhoods very
different from their own in terms of geography
and social organization. Figure 1 shows the
school-level average peer neighborhood violence
measure for one year. Many schools in violent
areas draw students from more violent neighbor-
hoods, but there is quite a bit of spatial variability.
Crime rates of students’ neighborhoods do not
always correspond to the crime rate surrounding
a school, and some high-peer-neighborhood-
violence schools are right next to low-peer-
neighborhood-violence schools.
Furthermore, the mix of students changes from
year to year. In Chicago, students may apply to
any school in the district, even ‘‘neighborhood’’
schools with stated attendance boundaries. Empty
seats in attendance-boundary schools are filled by
lottery (CPS 2016). Students frequently apply to
multiple schools and do not know where they
will enroll until the last minute (Pattillo, Delale-
O’Connor, and Butts 2014). This leads to mean-
ingful variation over time in the average
neighborhood violence levels across years in the
same school. Figure 2 shows the change in stu-
dents’ exposure to violent crime over time in 15
randomly selected high schools. School composi-
tion varies over time, with some schools fluctuat-
ing quite a bit from year to year. Even schools
without dramatic changes exhibit a decline over
time that reflects overall decreasing violent crime
rates in Chicago.
RESULTS
Descriptive Summary
Table 1 shows a descriptive summary of the ana-
lytic data. Each column shows the means and stan-
dard deviations for each year in which a student has
a test score. Column 1 describes the characteristics
of all students included in the analysis, and columns
2 through 4 describe the characteristics of students
in schools with high, medium, and low levels of
average peer neighborhood violent crime. Cutoffs
are determined by the thirds of the school-level
neighborhood violence measure. Peer measures of
eighth-grade achievement, neighborhood disadvan-
tage, and neighborhood violence are not included
because, on average, they mirror the averages of
the individual measures.
Overall, approximately half the students are
African American and about one third are
Figure 2. School average log neighborhood vio-lent crime over time.Source: Author’s calculation based on data fromthe Chicago Police Department and the ChicagoPublic Schools, stored at the Consortium on Chi-cago School Research.Note: Each line represents one of 15 randomlyselected schools.
212 Sociology of Education 91(3)

Hispanic; however, these proportions mask dra-
matically different ethnic compositions of schools
with different levels of average neighborhood vio-
lence. Low-neighborhood-violence schools are
only around 30 percent African American and 48
percent Hispanic, whereas schools with high lev-
els of average neighborhood violence are, on aver-
age, over 94 percent African American and only 5
percent Hispanic. Given the high correlation
between violent crime rates and neighborhood dis-
advantage, it is not surprising that schools with
high levels of average neighborhood violent crime
serve students from some of the most socially and
economically disadvantaged neighborhoods. All
achievement measures are higher in low-peer-
neighborhood-violence schools.
This relationship between school composition
and achievement is confirmed by examining the
correlations between the average level of neigh-
borhood violence of students’ peers and their aca-
demic outcomes (Appendix Table A2 in the online
version of the article). Exposure through peers and
where one lives are correlated at about .64, but the
measure of peer exposure to neighborhood vio-
lence has a stronger relationship with achievement
than does the neighborhood where an individual
student lives (–.32 vs. –.23 for reading test scores;
–.35 vs. –.26 for math test scores). This shows that
students’ test scores drop in classrooms with large
numbers of students from violent neighborhoods.
However, the relationship with tests taken in
eighth grade, before students enter high school,
is approximately the same size (–.36), which indi-
cates selection of already low-achieving students
into schools with high average neighborhood vio-
lent crime rates.
Table 1. Student Characteristics by Thirds of Grade, Average Neighborhood Violence.
Variable All students Low Medium High
Reading 14.83 16.13 13.91 13.10(4.43) (4.94) (3.56) (3.15)
Math 15.05 16.44 14.15 13.10(4.22) (4.51) (3.40) (3.29)
Grade 10.21 10.31 10.20 10.11(1.10) (1.11) (1.10) (1.07)
Cumulative grade repetition 0.11 0.09 0.16 0.11(0.36) (0.33) (0.47) (0.36)
Male 0.48 0.48 0.48 0.47(0.50) (0.50) (0.50) (0.50)
African American 0.54 0.30 0.63 0.94(0.50) (0.46) (0.48) (0.23)
Hispanic 0.34 0.48 0.34 0.05(0.48) (0.50) (0.47) (0.22)
Eighth-grade test scores 248.75 258.81 242.07 234.70(30.83) (30.53) (27.35) (26.58)
Age 15.51 15.53 15.49 15.41(1.17) (1.17) (1.17) (1.14)
Special education 0.17 0.15 0.18 0.21(0.38) (0.36) (0.39) (0.41)
Neighborhood disadvantage 0.26 -0.11 0.45 0.87(0.78) (0.70) (0.64) (0.63)
Neighborhood violence 72.24 47.83 91.43 135.52(60.0) (44.5) (53.5) (54.0)
Observations 291,631 145,597 77,635 68,399Students 117,636 55,579 32,910 29,147Neighborhoods 2,363 898 836 629Schools 152 50 50 52
Source: Author’s calculation based on data from the Chicago Police Department and the Chicago Public Schools, storedat the Consortium on Chicago School Research.Note: Standard errors in parenthesis.
Burdick-Will 213

Fixed-effects Models
Tables 2 and 3 show the results of the fixed-effects
models for each outcome. All coefficients for con-
tinuous variables represent standardized effect
sizes. The first column for each outcome shows
the relationship between having classmates with
high levels of neighborhood violence and the
achievement outcome, adjusting for time-varying
student characteristics and school size. The mod-
els show a negative relationship between peer
exposure to neighborhood violence and achieve-
ment for both subjects, although it is somewhat
stronger for math than for reading. One standard-
deviation increase in classroom average neighbor-
hood violence predicts a decline of –.024 standard
deviations in reading and a –.035 decline in math.
The coefficient for living in a violent neighbor-
hood is substantially smaller than that of peer
exposure, although it is comparable in size to other
research using in-school standardized test scores
(e.g., Sharkey et al. 2014). Note, however, that
the timing and crime exposure in this study are
designed to measure stress and behavior problems
associated with a generally violent area, not the
acute trauma of local homicides, which is large
but fades relatively quickly (Sharkey 2010). The
annual measure of crime with individual fixed
effects also fails to capture any lagged effects of
earlier exposure (Burdick-Will 2016). Therefore,
these estimates may not capture the full effect on
achievement of living in a violent neighborhood.
School Climate
School surveys conducted by CCSR every other
year provide some insight into the social organiza-
tion of Chicago’s high schools. Unfortunately,
results of these surveys are available only at the
school level, and because these surveys are col-
lected only in odd-numbered years, it is impossi-
ble to include them in the main models without
cutting the sample size in half and severely limit-
ing the number of observations per student. How-
ever, this section will examine the relationship
between these school-level measures and student
composition across schools and within the same
school over time. The results provide insight into
the ways student exposure to neighborhood vio-
lence is related to classroom management and stu-
dent learning.
Across schools, the average level of student
exposure to neighborhood violence is associated
with decreases in perceived safety in and around
school (r = –.30), increased numbers of students
with disciplinary problems (r = .53), and
decreased peer support for academic behavior
(r = –.45), but it is not strongly related to trust
in teachers (r = .02) (Appendix Table A3 in the
online version of the article). Table A3 also
includes a count of violent crimes reported on
school grounds during that academic year. In all
cases except reported safety, students’ exposure
to neighborhood violence has a stronger relation-
ship with the climate measures than does the
reported number of crimes at school. Surprisingly,
the number of crimes committed on school
grounds and the violence rate in students’ neigh-
borhoods are not strongly correlated (r = .05).
This is likely due to a combination of the high var-
iability in crime rates on school grounds from year
to year and the scattering of students from violent
neighborhoods to a wide range of high schools,
including schools with very low campus crime
rates.
The longitudinal survey data also allow for
comparison of schools to themselves over time.
Table 4 reports results of fixed-effects regressions
that compare the survey results at a given school in
one year to results in the same school in different
years. Given the odd-year-only survey collection
and the opening and closing of schools during
this period, each school has an average of three
observations. Despite a strong cross-sectional
association, students’ exposure to neighborhood
violence is not consistently related to changes in
peer support in classroom behavior within the
same school over time (b = .11, SE = .24).
Changes in students’ exposure to violent neighbor-
hoods is also not related to changes in the violent
crime rate on school grounds (b = –.16, SE = .22).
In contrast, when exposure to violent neighbor-
hoods is higher, students are substantially more
likely to report being involved in disciplinary
action (b = .28, SE = .12) and are less likely to
report feeling safe (b = –.36, SE = .14). Despite
no cross-sectional relationship, increases in stu-
dent exposure to neighborhood violence are
related to lower levels of trust that their teachers
have their best interests at heart (b = –.40, SE =
.23), although this coefficient is only marginally
significant. The bottom rows in Table 4 reverse
the timing of the survey and student composition.
In other words, the survey results in a given year
are used to predict the composition of students
in the following year. All of these coefficients
214 Sociology of Education 91(3)

Table 2. Individual Fixed-effects Results for Reading Standardized Test Scores.
Variable Model 1 Model 2 Model 3 Model 4
Peer neighborhood violence (PNV) –.024*** –.033*** –.020*** –.107***(.004) (.005) (.005) (.005)
Log neighborhood violence (NV) –.013** –.012** –.007 –.009*(.004) (.004) (.004) (.004)
Age –.021 –.021 –.022 –.024(.020) (.020) (.021) (.020)
Grade repetition –.252*** –.247*** –.244*** –.190***(.004) (.004) (.004) (.004)
Special education status .041* .041* .041* .044*(.018) (.019) (.019) (.018)
Neighborhood socioeconomic disadvantage –.010 –.009 .005 .004(.005) (.005) (.005) (.005)
Neighborhood social status .0004 .0003 –.002 –.001(.005) (.005) (.005) (.005)
School move –.025*** –.012 –.013 –.006(.007) (.007) (.007) (.007)
Residential move –.003 –.003 –.002 .000(.006) (.006) (.006) (.006)
School size –.032*** –.031*** –.030*** –.021***(.004) (.004) (.004) (.004)
Peer achievement .002 .001 .0004(.003) (.003) (.003)
Peer neighborhood disadvantage –.018*** –.010* –.003(.005) (.005) (.005)
Peer neighborhood social status .009** .007* .006(.003) (.003) (.003)
Peer school mobility –.005*** –.004** –.003(.002) (.002) (.002)
Peer residential mobility –.009*** –.008*** –.012***(.002) (.002) (.002)
School violent crime –.012*** –.013*** –.068***(.002) (.002) (.003)
PNV 3 NV .034***(.003)
Fall –.250***(.005)
PNV 3 Fall .115***(.003)
Constant –.959*** –.956*** –.984*** –.696***(.057) (.057) (.057) (.055)
R2
Within .21 .21 .21 .23Between .01 .01 .01 .02Overall .02 .02 .02 .04
Observations 291,398 291,398 291,398 291,398Number of students 117,636 117,636 117,636 117,636
Source: Author’s calculation based on data from the Chicago Police Department and the Chicago Public Schools, storedat the Consortium on Chicago School Research.Note: All models include individual fixed-effects, calendar-year dummies. All continuous variables are standardized,including the outcome. Standard errors in parentheses are robust and clustered within student.*p \ .05. **p \ .01. ***p \ .001.
Burdick-Will 215

Table 3. Individual Fixed-effects Results for Math Standardized Test Scores.
Variable Model 1 Model 2 Model 3 Model 4
Peer neighborhood violence (PNV) –.035*** –.030*** –.025*** –.034***(.003) (.004) (.004) (.004)
Log neighborhood violence (NV) –.008* –.006 –.004 –.0001(.004) (.004) (.004) (.004)
Age –.007 –.005 –.005 –.006(.017) (.018) (.018) (.019)
Grade repetition –.228*** –.191*** –.190*** –.140***(.005) (.005) (.005) (.005)
Special education status –.010 .005 .005 .009(.017) (.017) (.017) (.016)
Neighborhood socioeconomic disadvantage –.005 –.005 .003 .002(.005) (.005) (.005) (.005)
Neighborhood social status .004 .004 –.005 –.004(.005) (.005) (.005) (.005)
School move –.052*** –.019** –.019** –.011(.006) (.007) (.007) (.007)
Residential move .027*** .005 .005 .004(.005) (.005) (.005) (.005)
School size –.011** –.017*** –.016*** –.007(.004) (.004) (.004) (.004)
Peer achievement .048*** .048*** .049***(.002) (.002) (.002)
Peer neighborhood disadvantage –.012** –.010* –.005(.004) (.004) (.004)
Peer neighborhood social status .001 .00003 .00003(.003) (.003) (.003)
Peer school mobility –.003* –.003 –.006***(.001) (.001) (.001)
Peer residential mobility –.001 –.001 –.005**(.001) (.001) (.001)
School violent crime –.021*** –.078*** –.021***(.001) (.001) (.002)
PNV 3 NV .014***(.002)
Fall –.274***(.004)
PNV 3 Fall .019***(.002)
Constant –.701*** –.597*** –.609*** –.322***(.047) (.049) (.049) (.052)
R2
Within .19 .20 .20 .22Between .02 .04 .04 .08Overall .03 .06 .06 .09
Observations 291,619 291,619 291,619 291,619Number of students 117,678 117,678 117,678 117,678
Source: Author’s calculation based on data from the Chicago Police Department and the Chicago Public Schools, storedat the Consortium on Chicago School Research.Note: All models include individual fixed-effects, calendar-year dummies. All continuous variables are standardized,including the outcome. Standard errors in parentheses are robust and clustered within student.*p \ .05. **p \ .01. ***p \ .001.
216 Sociology of Education 91(3)
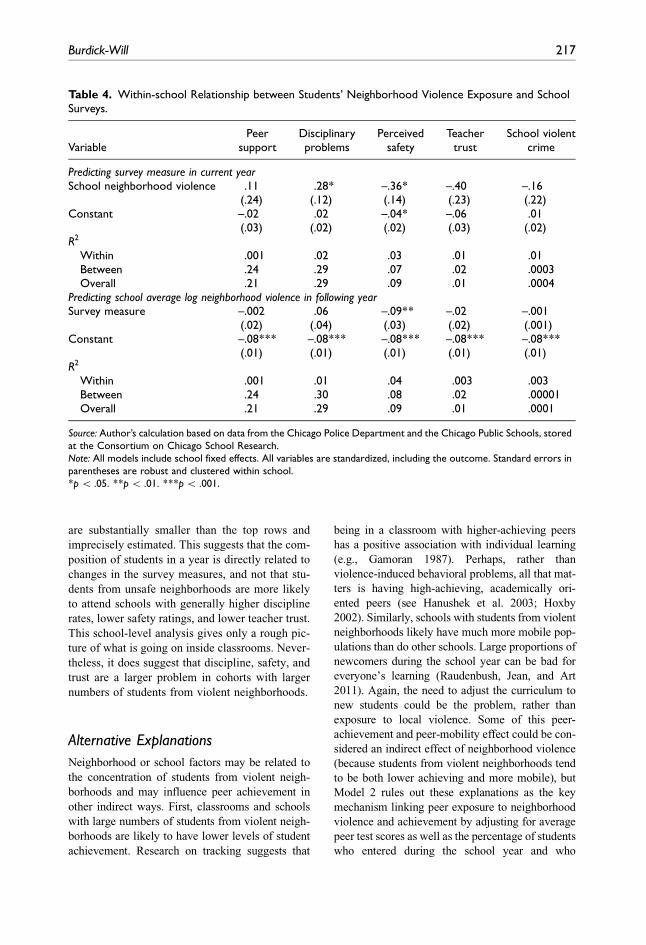
are substantially smaller than the top rows and
imprecisely estimated. This suggests that the com-
position of students in a year is directly related to
changes in the survey measures, and not that stu-
dents from unsafe neighborhoods are more likely
to attend schools with generally higher discipline
rates, lower safety ratings, and lower teacher trust.
This school-level analysis gives only a rough pic-
ture of what is going on inside classrooms. Never-
theless, it does suggest that discipline, safety, and
trust are a larger problem in cohorts with larger
numbers of students from violent neighborhoods.
Alternative Explanations
Neighborhood or school factors may be related to
the concentration of students from violent neigh-
borhoods and may influence peer achievement in
other indirect ways. First, classrooms and schools
with large numbers of students from violent neigh-
borhoods are likely to have lower levels of student
achievement. Research on tracking suggests that
being in a classroom with higher-achieving peers
has a positive association with individual learning
(e.g., Gamoran 1987). Perhaps, rather than
violence-induced behavioral problems, all that mat-
ters is having high-achieving, academically ori-
ented peers (see Hanushek et al. 2003; Hoxby
2002). Similarly, schools with students from violent
neighborhoods likely have much more mobile pop-
ulations than do other schools. Large proportions of
newcomers during the school year can be bad for
everyone’s learning (Raudenbush, Jean, and Art
2011). Again, the need to adjust the curriculum to
new students could be the problem, rather than
exposure to local violence. Some of this peer-
achievement and peer-mobility effect could be con-
sidered an indirect effect of neighborhood violence
(because students from violent neighborhoods tend
to be both lower achieving and more mobile), but
Model 2 rules out these explanations as the key
mechanism linking peer exposure to neighborhood
violence and achievement by adjusting for average
peer test scores as well as the percentage of students
who entered during the school year and who
Table 4. Within-school Relationship between Students’ Neighborhood Violence Exposure and SchoolSurveys.
VariablePeer
supportDisciplinaryproblems
Perceivedsafety
Teachertrust
School violentcrime
Predicting survey measure in current yearSchool neighborhood violence .11 .28* –.36* –.40 –.16
(.24) (.12) (.14) (.23) (.22)Constant –.02 .02 –.04* –.06 .01
(.03) (.02) (.02) (.03) (.02)R2
Within .001 .02 .03 .01 .01Between .24 .29 .07 .02 .0003Overall .21 .29 .09 .01 .0004
Predicting school average log neighborhood violence in following yearSurvey measure –.002 .06 –.09** –.02 –.001
(.02) (.04) (.03) (.02) (.001)Constant –.08*** –.08*** –.08*** –.08*** –.08***
(.01) (.01) (.01) (.01) (.01)R2
Within .001 .01 .04 .003 .003Between .24 .30 .08 .02 .00001Overall .21 .29 .09 .01 .0001
Source: Author’s calculation based on data from the Chicago Police Department and the Chicago Public Schools, storedat the Consortium on Chicago School Research.Note: All models include school fixed effects. All variables are standardized, including the outcome. Standard errors inparentheses are robust and clustered within school.*p \ .05. **p \ .01. ***p \ .001.
Burdick-Will 217

changed neighborhoods during the prior calendar
year. Mobile peers are independently associated
with small reductions in achievement. Attending
a school with high-achieving peers does predict
higher math scores but not reading scores.
Much of the research on neighborhood effects
argues that isolation in poor neighborhoods collec-
tively socializes youth to subcultural, anti-
academic norms and deprives them of the material
and institutional resources needed for academic
achievement (Jencks and Mayer 1990). Therefore,
Model 2 includes adjustments for peer exposure to
neighborhood socioeconomic disadvantage and
social status. The coefficient for the peer average
socioeconomic index is around half the size of
the neighborhood violence coefficients: –.018 for
reading and –.012 for math.
Another possibility is that the effect on
achievement is driven by students bringing their
neighborhood fights onto school grounds
(Mateu-Gelabert and Lune 2003). Model 2 thus
adjusts for the number of violent incidents on
school grounds in the year. The coefficients are
somewhat smaller than those of peer neighbor-
hood violence and comparable to those reported
in previous research (Burdick-Will 2013).
Despite all these adjustments, the coefficient
for peer neighborhood violence exposure remains
relatively similar. In fact, the coefficient for read-
ing is somewhat larger after introducing the cova-
riates (–.033). This suggests that the behavioral
problems related to exposure to neighborhood vio-
lence are directly related to classroom learning,
and they are not driven by the association with
achievement, mobility, material disadvantage, or
reported crimes on campus.
Interactions
Model 3 for each outcome adds the interaction term
between living in a violent neighborhood and expo-
sure through peers. This interaction can shed light
on whether the effect of neighborhood violence
spills over within schools and disrupts actual learn-
ing, or if it is a form of cumulative disadvantage in
which students who are themselves exposed are
concentrated in the same schools. The results indi-
cate that the effect of attending a school with many
students from violent neighborhoods is larger for
students from safer neighborhoods. As the level
of neighborhood violence increases, the effect of
peer violence decreases. Figure 3 shows the
marginal effect of peer neighborhood violence at
various levels of individual exposure to neighbor-
hood violence. For students from very safe neigh-
borhoods, one standard-deviation increase in peer
neighborhood violence predicts a reduction in test
scores of approximately .05 standard deviations
for math and .09 standard deviations for reading.
The strength of the interaction means that peers
from violent neighborhoods have no significant
effect on students from high violence neighbor-
hoods. Although there is substantially less variation
within schools in eighth-grade achievement (i.e.,
high-achieving students do not go to low-achieving
schools), similar interactions exist with prior
achievement (not shown in tables). Higher-achiev-
ing students show the largest decreases in test
scores when exposed to peers from violent neigh-
borhoods. This is what one would expect if concen-
trations of students from violent neighborhoods
were derailing instruction for everyone. In a coun-
terfactual sense, students who already have trouble
concentrating, completing their assignments, and
behaving in the classroom are not as likely to be
affected by the lack of opportunity to learn.
Higher-achieving students and students from safe
neighborhoods, on the other hand, have more to
lose from exposure to disruptive peers.
Figure 3. Marginal effect of peer neighborhoodviolence by individual neighborhood violence.Source: Author’s calculation based on data fromthe Chicago Police Department and the ChicagoPublic Schools, stored at the Consortium on Chi-cago School Research.Note: Neighborhood violent crime values coverapproximately the 10th to 90th percentiles of stu-dent exposure to neighborhood violent crime.Error bars represent 95 percent confidenceintervals.
218 Sociology of Education 91(3)
The final model exploits the variation in test
timing in different grades to show that longer
exposure leads to larger effects. In other words,
the longer students are in a classroom with
lower-achieving peers, the larger the effect on
their learning. This can be evaluated using an
interaction between classroom-level neighborhood
violence and an indicator for a fall test. Remem-
ber, 9th- and 10th-grade tests are taken in the
fall, but 11th-grade tests are taken in the spring.
Model 4 shows that, indeed, the relationship
between peer neighborhood violence and test
scores is much stronger for 11th-grade tests taken
in the spring than for 9th- and 10th-grade tests
taken in the fall. This timing effect seems stron-
gest with respect to reading scores. The coefficient
for spring tests is –.11 standard deviations for
reading and –.03 standard deviations for math
scores. The effects on fall tests are substantially
smaller, only around –.01 standard deviations for
math and reading.4 There is no evidence that the
influence of peer exposure to neighborhood vio-
lence varies by other characteristics, such as
race, gender, or neighborhood demographics.
DISCUSSION ANDCONCLUSIONS
Violent crime rates in major U.S. cities have
declined substantially over the past two decades
(Sharkey 2018), but this decline has spread
unevenly across and within cities. Some cities,
neighborhoods, and demographic groups continue
to face extremely high rates of violence (Friedson
and Sharkey 2015). In fact, the national downward
trend in violent crime seems to be reversing in
some places in recent years. In 2017, for example,
Baltimore set a record for its homicide rate (Rec-
tor 2017). At the same time, students in urban dis-
tricts across the country are increasingly offered
options to attend schools outside their neighbor-
hoods. These choice programs range from city-
wide enrollments in charter and magnet schools
to out-of-zone admissions to neighborhood
schools and boundary-free ranking systems
(Grady et al. 2010; Whitehurst 2017).
The findings reported here contribute to the
understanding of how these trends in urban
violence and school choice interact to produce
widespread collateral damage on a scale much
larger than a few schools with high crime
rates or a few students from the most violent
neighborhoods. Specifically, this study documents
the extent to which students from a range of neigh-
borhoods come together in schools, and it shows
that when students experience higher levels of
neighborhood violence, the whole school reports
feeling less safe, having more disciplinary prob-
lems, and feeling less trust in their teachers. These
survey measures help explain the robust relation-
ship between classmates’ exposure to neighbor-
hood violence and the achievement of individual
students. One standard deviation increase in class-
mates’ exposure to neighborhood violence is
related to an approximately .03-standard-deviation
decline in standardized test scores. This may seem
like a small change, but students tend to grow only
around .3 standard deviations in reading and .2
standard deviations in math per year. Therefore,
these relatively small standardized coefficients
represent a reduction of at least one 10th of a year’s
growth. The relationship is even stronger for tests
taken later in the year (.1 standard deviations),
suggesting that longer exposure to peers from vio-
lent neighborhoods could lead to even larger
cumulative effects. These effects are largest for
students who come from the safest neighborhoods.
This study is not without its limitations.
Administrative records and official crime statistics
provide insight into population-level patterns, but
they lack detailed information on students’ back-
grounds or direct experiences with violent crime.
The school-level surveys provide only a rough pic-
ture of what might be going on inside classrooms.
More detailed survey or interview data are needed
to understand the precise mechanisms linking
classmates’ exposure to neighborhood violence,
instruction, and achievement. In addition, despite
the rigorous adjustments for other measures of
peer characteristics and constant differences
between students, the methods used here cannot
completely rule out dynamic selection processes
at work. Unobserved changes in students’ circum-
stances might be related to both their achievement
and their sorting across and within schools in ways
that bias the results.
This study also takes place in just one city:
Chicago. The levels of violence in Chicago during
this period are high, but they are far from unique.
According to the 2013 Federal Bureau of Investi-
gation (FBI) Uniform Crime Reports, Chicago’s
violent crime rate per capita was comparable
to Philadelphia, Miami, and Houston (FBI
2015). Moreover, Chicago’s open-enrollment
policies and sorting of students from different
Burdick-Will 219

neighborhoods into the same schools are not
unique: Denver, Boston, and New York all receive
higher rankings than Chicago in school choice and
competition from the Brookings Institution
(Whitehurst 2017). Although it is impossible to
know for sure whether the relationships docu-
mented here would apply to other cities, the
effects of neighborhood violence or disruptive
behavior and disengagement might be similar in
other locations. In fact, Sharkey (2018) describes
how academic performance improved substan-
tially over two decades in a wide range of states
that had large declines in crime. The scale of these
changes is unlikely to be explained by individual
reductions in stress alone.
Despite these limitations, the results presented
here show that peer exposure to neighborhood vio-
lence is an important predictor of student learning.
This study adds to the growing body of evidence
that disruptive behavior and peer engagement are
more important predictors of school effects than
is peer socioeconomic background. Recent studies
show that the proportion of students receiving free
or reduced lunch in a school is not related to stu-
dent achievement. Other scholars have interpreted
these findings to mean that school composition
does not matter (Lauen and Gaddis 2012; Wodtke
and Parbst 2017); however, free-lunch status is
a poor proxy for the kinds of social and emotional
development that are important for classroom
learning. When a poor student and a nonpoor stu-
dent are in a class together, the nonpoor student
does not necessarily learn less, but when a disrup-
tive or disengaged student is in the classroom,
instruction is likely to be derailed in a way that
influences both students’ learning. Developing
better indicators for peer background and behav-
ior, and understanding their influence on learning,
is especially important in an era of accountability,
where students, teachers, and schools face poten-
tially severe consequences for low standardized
test scores.
Finally, these results show that reducing vio-
lent crime in the city of Chicago has the potential
to improve the achievement of all students, not
just those who are directly exposed to violence.
The spillover effects of neighborhood violence
make increased spending to improve safety in
the most dangerous neighborhoods a cost-effective
proposal with regard to academic achievement.
Not only would it help the students who live in
these neighborhoods, but it would also help their
classmates who live elsewhere. This study shows
that violent crime in a city may be spatially con-
centrated, but the effects of that violence are not.
Social problems in one area cannot be easily con-
tained; they influence the educational opportuni-
ties of students across the city. Addressing these
problems should thus be everyone’s concern.
Urban violence is not just a policing problem
that exists in a vacuum; its consequences spread
to many other social spheres, including education.
ACKNOWLEDGMENTS
I thank Stephen Raudenbush, Mario Small, Jens Ludwig,
Stephen Morgan, Ann Golladay, the participants in the
New York University Institute of Education Sciences–
funded Predoctoral Interdisciplinary Research Training
Seminar, and the University of Chicago Consortium on
Chicago School Research for invaluable feedback on
this project.
FUNDING
The author disclosed receipt of the following financial
support for the research, authorship, and/or publication
of this article: This research was funded indirectly by
a predoctoral fellowship from the Institute for Educa-
tional Sciences, the Population Studies and Training
Center at Brown University, and the Hopkins Population
Center. The contents of this manuscript do not reflect the
views or policies of the Consortium on Chicago School
Research, Chicago Public Schools, or the Chicago Police
Department. All errors and opinions are my own.
ORCID iD
J. Burdick-Will https://orcid.org/0000-0002-3670-4179
NOTES
1. For more on the Illinois standardized tests and their
changes over time, see Luppescu and colleagues 2011.
For technical details on the scoring and scaling of the
tests, see ACT 2013a, ACT 2013b, and ACT 2013c.
2. For more details, see http://ccsr.uchicago.edu/down
loads/9585ccsr_rasch_analysis_primer.pdf.
3. The structure of the data is complicated and does not
allow for a simple approach to clustering the standard
errors. Observations are simultaneously cross-classi-
fied within schools, block groups, and students—
none of which is cleanly nested within any of the
others over time. Within years, observations are clus-
tered within classrooms, but these groups dissolve
and reform every year. To my knowledge, there is
no way to take into account all of the possible cluster-
ing of the standard errors in a single model with cur-
rently available software. The models presented here
220 Sociology of Education 91(3)

represent robust standard errors clustered at the stu-
dent level. I do this because test scores are most
strongly correlated with the same student’s perfor-
mance in different years. This is also the default set-
ting in Stata’s robust fixed-effects estimation.
Because the peer measure is applied at the classroom
level, ideally one would want to cluster the errors at
the classroom or school level. However, students are
not neatly nested within schools over time, and thus it
is impossible to cluster the standard errors at the
school level while also including student fixed
effects. If I limit the sample to students who never
changed schools, I can adjust the clustering to assess
its impact on inference. Clustering the standard errors
at the school level rather than the student level with
this subsample makes almost no difference in the
size of the standard errors and does not change the
substantive interpretation of the findings. Given that
the coefficients are around seven times the size of
the standard error with student-level clustering, the
impact of alternative clustering would have to more
than triple the standard errors to change the substan-
tive interpretation of the findings.
4. Models that estimate an interaction with grade level
yield the same results. Coefficients for 9th and 10th
grade are similar to those for the fall in Model 4,
and estimates for 11th grade replicate those for the
spring. The larger effect in 11th grade could also be
due to more time in high school, not just tests taken
later in the year. It is possible that lagged effects of
peer exposure build over time, making 11th graders
more vulnerable. In fact, peer composition in 9th
grade is a significant predictor of 11th-grade test
scores. Unfortunately, the lagged and current-year
peer measures are highly correlated, and it is not pos-
sible to put both in the same model. On the other
hand, the effects of peer composition in 9th and
10th grades are statistically indistinguishable from
one another and are the same as the combined coef-
ficient for fall tests shown in the tables. This suggests
that seasonality matters more than the length of time
in high school.
SUPPLEMENTAL MATERIAL
The appendices are available in the online version of the
article.
REFERENCES
ACT. 2013a. ‘‘ACT EXPLORE Technical Manual
2013-14.’’ Iowa City: Author. https://www.act.org/
content/dam/act/unsecured/documents/Explore-Tech
Manual.pdf
ACT. 2013b. ‘‘ACT PLAN Technical Manual 2013-14.’’
Iowa City: Author. https://www.act.org/content/dam/
act/unsecured/documents/PlanTechnicalManual.pdf
ACT. 2013c. ‘‘ACT PSAE Technical Manual 2013-14.’’
Iowa City: Author. https://www.isbe.net/Documents/
tech_manual13.pdf
Aizer, Anna. 2007. ‘‘Neighborhood Violence and Urban
Youth.’’ Pp. 275–307 in The Problems of Disadvan-
taged Youth: An Economic Perspective, edited by J.
Gruber. Chicago: University of Chicago Press.
Aizer, Anna. 2009. ‘‘Peer Effects and Human Capital
Accumulation: The Externalities of ADD.’’ Working
Paper No. 14354, National Bureau of Economic
Research, Cambridge, MA.
Anderson, Elijah. 1999. Code of the Street. New York:
Norton.
Bell, Carl, and Esther Jenkins. 1993. ‘‘Community Vio-
lence and Children on Chicago’s South Side.’’ Psy-
chiatry 56(1):46–54.
Bidwell, Charles. 1965. ‘‘The School as a Formal Orga-
nization.’’ Pp. 972–1022 in Handbook of Organiza-
tions, edited by J. G. March. Chicago: Rand
McNally.
Bingenheimer, Jeffery, Robert Brennan, and Felton Earls.
2005. ‘‘Firearm Violence Exposure and Serious Vio-
lent Behavior.’’ Science 308(5726):1323–26.
Bourgois, Philippe. 1995. In Search of Respect: Selling
Crack in el Barrio. Cambridge: Cambridge Univer-
sity Press.
Bowen, Gary, and Richard Van Dorn. 2002. ‘‘Commu-
nity Violent Crime Rates and School Danger.’’ Chil-
dren and Schools 24(2):90–104.
Bryk, Anthony, Penny Bender Sebring, Elaine Allens-
worth, Stuart Luppescu, and John Easton. 2010.
Organizing Schools for Improvement: Lessons from
Chicago. Chicago: University of Chicago Press.
Burdick-Will, Julia. 2013. ‘‘School Violent Crime and
Academic Achievement in Chicago.’’ Sociology of
Education 86(4):343–61.
Burdick-Will, Julia. 2016. ‘‘Neighborhood Violent
Crime and Academic Growth in Chicago: Lasting
Effects of Early Exposure.’’ Social Forces 95(1):
133–57.
Burdick-Will, Julia. 2017. ‘‘Neighbors, but Not Class-
mates: Neighborhood Disadvantage, Local Violent
Crime, and the Heterogeneity of Educational Experi-
ences in Chicago.’’ American Journal of Education
124(1):27–65.
Carr, Patrick, Laura Napolitano, and Jessica Keating.
2007. ‘‘We Never Call the Cops and Here Is Why:
A Qualitative Examination of Legal Cynicism in
Three Philadelphia Neighborhoods.’’ Criminology
45(2):445–80.
Carrell, Scott E., and Mark L. Hoekstra. 2010. ‘‘Exter-
nalities in the Classroom: How Children Exposed
to Domestic Violence Affect Everyone’s Kids.’’
American Economic Journal: Applied Economics
2(1):211–28.
Chaplin, D. 2002. ‘‘Estimating the Impact of Economic
Integration.’’ Pp. 87–113 in Divided We Fail: Com-
ing Together through Public School Choice, edited
Burdick-Will 221
by Century Foundation. New York: Century Founda-
tion Press.
Chicago Public Schools. 2016. ‘‘Program Application
Requirements.’’ Retrieved November 23, 2016
(http://cps.edu/Schools/High_schools/Pages/Highsch
ools.aspx).
Cohen, Elizabeth, Rachel Lotan, and Chaub Leechor.
1989. ‘‘Can Classrooms Learn?’’ Sociology of Educa-
tion 62(2):75–94.
Coleman, J. S., E. Campbell, C. Hobson, J. McPartland,
A. Mood, F. D. Weinfield, and R. York. 1966. Equal-
ity of Educational Opportunity. Washington, DC:
Government Printing Office.
Dance, Lory Janelle. 2002. Tough Fronts: The Impact of
Street Culture on Schooling. New York: Routledge.
Devine, John. 1996. Maximum Security: The Culture of
Violence in Inner-city Schools. Chicago: University
of Chicago Press.
Federal Bureau of Investigation. 2015. ‘‘Crime in the
United States by Metropolitan Statistical Area,
2015.’’ Washington, DC: Author.
Figlio, David N. 2007. ‘‘Boys Named Sue: Disruptive
Children and Their Peers.’’ Education 2(4):376–94.
Friedson, Michael, and Patrick Sharkey. 2015. ‘‘Violence
and Neighborhood Disadvantage after the Crime
Decline.’’ Annals of the American Academy of Polit-
ical and Social Science 660(1):341–58.
Gamoran, Adam. 1987. ‘‘The Stratification of High
School Learning Opportunities.’’ Sociology of Edu-
cation 60(3):135–55.
Gamoran, A. 1996. Effects of Schooling on Children and
Families. Pp. 107–14 in Family–School Links: How
Do They Affect Educational Outcomes? edited by
A. Booth and J. F. Dunn. Hillsdale, NJ: Lawrence
Erlbaum.
Goffman, Alice. 2009. ‘‘On the Run: Wanted Men in
a Philadelphia Ghetto.’’ American Sociological
Review 74(3):339–57.
Grady, Sarah, Stacey Bielick, and Susan Aud. 2010.
Trends in the Use of School Choice: 1993–2007.
Washington, DC: National Center for Education
Statistics.
Guerra, Nancy, L. Rowell Huesmann, and Anja Spindler.
2003. ‘‘Community Violence Exposure, Social Cogni-
tion, and Aggression among Urban Elementary
School Children.’’ Child Development 74(5):1561–76.
Hanushek, Erik, John Kain, Jacob Markman, and Steven
Rivkin. 2003. ‘‘Does Peer Ability Effect Student
Achievement?’’ Journal of Applied Economics
18(5):527–44.
Harding, David. 2009. ‘‘Collateral Consequences of Vio-
lence in Disadvantaged Neighborhoods.’’ Social
Forces 88(2):757–84.
Harding, David. 2010. Living the Drama: Community,
Conflict, and Culture among Inner-city Boys. Chi-
cago: University of Chicago Press.
Hauser, R., W. Sewell, and D. Alwin. 1976. ‘‘High
School Effects on Achievement.’’ Pp. 309–42 in
Schooling and Achievement in American Society,
edited by W. Sewell, R. Hauser, and D. Featherman.
London: Academic Press.
Hoxby, Caroline. 2002. ‘‘The Power of Peers: How Does
the Makeup of a Classroom Influence Achievement.’’
Education Next 2(2):57–63.
Jencks, Christopher, and Susan Mayer. 1990. ‘‘The
Social Consequences of Growing Up in a Poor
Neighborhood.’’ Pp. 111–86 in Inner-city Poverty
in the United States, edited by L. Lynn Jr., and M.
McGeary. Washington, DC: National Academy.
Johnson, Odis, Jr. 2012. ‘‘A Systematic Review of
Neighborhood and Institutional Relationships
Related to Education.’’ Education and Urban Society
44(4):477–511.
Jones, Nikki. 2004. ‘‘It’s Not Where You Live, It’s How
You Live’’: How Young Women Negotiate Conflict
and Violence in the Inner City.’’ Annals of the Amer-
ican Academy of Political and Social Sciences 595:
49–62.
Kirk, David S., and Andrew V. Papachristos. 2011.
‘‘Cultural Mechanisms and the Persistence of Neigh-
borhood Violence.’’ American Journal of Sociology
116(4):1190–233.
Lauen, Douglas L., and S. Michael Gaddis. 2013. ‘‘Expo-
sure to Classroom Poverty and Test Score Achieve-
ment: Contextual Effects or Selection?’’ American
Journal of Sociology 118(4):943–79.
LeDoux, Joseph E. 2000. ‘‘Emotion Circuits in the Brain.’’
Annual Review of Neuroscience 23:155–84.
Lee, Valarie E., and Smith, Julia B. 1997. ‘‘High School
Size: Which Works Best and for Whom?’’ Educa-
tional Evaluation and Policy Analysis 19(3):205–27.
Luppescu, Stuart, Elaine Allensworth, Paul Moore, Mar-
isa de la Torre, James Murphy, and Sanja Jagesic.
2011. Trends in Chicago’s Schools across Three
Eras of Reform. Chicago: University of Chicago
Consortium on Chicago School Research.
Lutton, Linda. 2014. ‘‘The Big Sort: How Chicago’s
School Choice System Is Tracking Kids into Sepa-
rate High Schools Based on Achievement.’’ WBEZ
91.5 Chicago. Retrieved August 14, 2014 (http://
www.wbez.org/news/big-sort-110502).
Mateu-Gelabert, Pedro, and Howard Lune. 2003.
‘‘School Violence: The Bidirectional Conflict Flow
between Neighborhood and School.’’ City & Com-
munity 2(4):353–68.
Margolin, Gayla, and Elana Gordis. 2000. ‘‘The Effects
of Family and Community Violence on Children.’’
Annual Review of Psychology 51(1):445–79.
McFarland, Daniel. 2001. ‘‘Student Resistance: How the
Formal and Informal Organization of Classrooms
Facilitate Everyday Forms of Student Defiance.’’
American Journal of Sociology 107(3):612–78.
Nomi, Takako, and Elaine Allensworth. 2013. ‘‘Sorting
and Supporting: Why Double-dose Algebra Led to
Better Test Scores but More Course Failures.’’ Amer-
ican Educational Research Journal 50(4):756–88.
222 Sociology of Education 91(3)

Pattillo, Mary, Lori Delale-O’Connor, and Felicia Butts.
2014. ‘‘High Stakes Choosing: How Parents Navigate
Chicago Public Schools.’’ Pp. 237–67 in Choosing
Homes, Choosing Schools, edited by K. Goyette
and A. Lareau. New York: Russell Sage.
Phillips, Deborah, and Jack Shonkoff. 2000. From Neu-
rons to Neighborhoods: The Science of Early Child-
hood Development. Washington, DC: National Acad-
emy Press.
Raudenbush, Stephen, Marshall Jean, and Emily Art.
2011. ‘‘Year-by-year Cumulative Impacts of Attend-
ing a High-mobility Elementary School on Child-
ren’s Mathematics Achievement in Chicago,
1995-2005.’’ Pp. 359–76 in Whither Opportunity?
Rising Inequality, Schools, and Children’s Life
Chances, edited by G. Duncan and R. Murnane.
New York: Russell Sage Foundation.
Rector, Kevin. 2017. ‘‘2017 Sets Record for Killings Per
Capita.’’ Baltimore Sun, December 27. Retrieved
January 12, 2018 (http://www.baltimoresun.com/
news/maryland/crime/bs-md-ci-per-capita-homicid
es-201712 27-story.html).
Sampson, Robert J., and Dawn Jeglum Bartusch. 1998.
‘‘Legal Cynicism and (Subcultural?) Tolerance of
Deviance: The Neighborhood Context of Racial Dif-
ferences.’’ Law and Society Review 32(4):777–804.
Sampson, Robert J., Jeffrey D. Morenoff, and Thomas
Gannon-Rowley. 2002. ‘‘Assessing ‘Neighborhood
Effects’: Social Processes and New Directions in
Research.’’ Annual Review of Sociology 28(1):443–78.
Sanchez-Jankowski, M. 2008. Cracks in the Pavement:
Social Change and Resilience in Poor Neighbor-
hoods. Berkeley: University of California Press.
Schwartz, Amy Ellen, Agustina Laurito, Johanna Lacoe,
Patrick Sharkey, and Ingrid Gould Ellen. 2016. ‘‘The
Academic Effects of Chronic Exposure to Neighbor-
hood Violence.’’ Working Paper No. 195, Center for
Policy Research, Maxwell School, Syracuse Univer-
sity, Syracuse, NY.
Sharkey, Patrick. 2010. ‘‘The Acute Effect of Local
Homicides on Children’s Cognitive Performance.’’
Proceedings of the National Academy of Sciences
107(26):11733–38.
Sharkey, Patrick. 2018. Uneasy Peace: The Great Crime
Decline, the Renewal of City Life, and the Next War
on Violence. New York: Norton.
Sharkey, Patrick, Amy Ellen Schwartz, Ingrid Gould
Ellen, and Johanna Lacoe. 2014. ‘‘High Stakes in
the Classroom, High Stakes on the Street: The
Effects of Community Violence on Students’ Stan-
dardized Test Performance.’’ Sociological Science
1(3):199–220.
Sharkey, Patrick, Nicole Strayer, Andrew Papachristos,
and Cybele Raver. 2012. ‘‘The Effect of Local Vio-
lence on Children’s Attention and Impulse Control.’’
American Journal of Public Health 102:2287–93.
Sørenson, Aage, and Maureen Hallinan. 1977. ‘‘A
Reconceptualization of School Effects.’’ Sociology
of Education 50(4):273–89.
Steinberg, Matthew, Elaine Allensworth, and David
Johnson. 2011. Student and Teacher Safety in Chi-
cago Public Schools: The Roles of Community Con-
text and School Social Organization. Chicago: Uni-
versity of Chicago Consortium on Chicago School
Research.
Venkatesh, Sudhir Alladi. 2000. American Project: The
Rise and Fall of a Modern Ghetto. Cambridge,
MA: Harvard University Press.
Walkley, Meg, and Tory L. Cox. 2013. ‘‘Building Trau-
ma-informed Schools and Communities.’’ Children
& Schools 35(2):123–26.
Waller, Willard. 1932. The Sociology of Teaching. New
York: Wiley.
Wacquant, L. J. D. 2008. Urban Outcasts: A Compara-
tive Sociology of Advanced Marginality. Cambridge:
Polity.
Whitehurst, Grover. 2017. 2016 Education Choice and
Competition Index. Washington, DC: Brookings
Institution.
Wodtke, Geoffrey T., and Matthew Parbst. 2017.
‘‘Neighborhoods, Schools, and Academic Achieve-
ment: A Formal Mediation Analysis of Contextual
Effects on Reading and Mathematics Abilities.’’
Demography 54(5):1653–76.
Author Biography
Julia Burdick-Will is an assistant professor in the
Department of Sociology and the School of Education
at Johns Hopkins University. Her research combines
the sociology of education and urban sociology to study
the roots of educational inequality and examine the
dynamic connections between communities and schools
that shape opportunities to learn.
Burdick-Will 223
Related Documents