Munich Personal RePEc Archive Socio-religious Disparity in Educational Achievements: A District Level study in West Bengal Hati, Koushik Kumar Department of Economics, The University of Burdwan March 2010 Online at https://mpra.ub.uni-muenchen.de/45810/ MPRA Paper No. 45810, posted 05 Apr 2013 12:12 UTC

Welcome message from author
This document is posted to help you gain knowledge. Please leave a comment to let me know what you think about it! Share it to your friends and learn new things together.
Transcript
Munich Personal RePEc Archive
Socio-religious Disparity in Educational
Achievements: A District Level study in
West Bengal
Hati, Koushik Kumar
Department of Economics, The University of Burdwan
March 2010
Online at https://mpra.ub.uni-muenchen.de/45810/
MPRA Paper No. 45810, posted 05 Apr 2013 12:12 UTC
Socio-religious Disparity in Educational Achievements:
A District Level Study in West Bengal
_____________________________________________
Koushik Kumar Hati*
UGC Project Fellow
Department of Economics
University of Burdwan
* Corresponding Author, UGC Project Fellow, Department of Economics, University of Burdwan, Golapbag,
Burdwan, West Bengal – 713104; email: [email protected]
2
Socio-religious Disparity in Educational Achievements:
A District Level Study in West Bengal
Abstract
Education is a powerful catalyst for the change of a society and plays a crucial role in the
development of a nation. In recent years, education has been included as a key component of
Human Development Index. As a result, social and regional disparities in educational
achievement drag back development of the country. The present paper focuses on
Educational Achievement in Elementary Education across the districts of West Bengal to
explore regional disparities in educational achievements and differences across social
groups – Religious Minorities and Scheduled Castes and Tribes. Since data on children with
socio-religious classification is not available, we have tried to provide an overview of the
situation by analyzing educational achievements separately for Religious Minority dominated
districts, SC/ST dominated districts, and Other districts. Based on the data from District
Information System for Education, the paper uses educational indicators like Literacy,
Enrolment, Drop Out, Repetition Rate, Completion Rate, and Examination Performance of
the Students at primary stages and middle stages the paper also tries to construct a
composite Educational Development Index, separately for the different types of districts. The
paper brings to light regional and social disparities in educational achievement in our state
and proposes certain policies for improvement.
__________________________
I. INTRODUCTION
Access to education is a basic human right and essential to human well-being. Formal
education is one of the instruments for accelerating the process of social mobility. School and
college education generally give students the confidence that they can improve their lives. It
also has the potential to make them aware of the difficulties and obstacles that may hinder
their paths. Such awareness induces deprived groups to venture for various alternative
avenues for improving their living status and climbing up the social hierarchy. While, India’s
progress in providing access to education to its children and youth is remarkable, especially
for the last decade, after the starting of Sarva Shiksha Abhiyan in 2001, all socio-religious
groups have not benefited equally. During the six decades between 1951 and 2001, India’s
3
Per Capita GDP increased three times, while literacy rate increased 3.5 times and Gross
Enrolment Ratio increased 2.5 times. More recently, the number of Out Of School Children
(OOSC) in the age group of 6 – 14 years has declined from around 45 million in 2001 to
around 8 million by the end of 2009. However, it is argued that this improvement has been
unequal for different segments of the society, mostly along social and religious lines. This
paper tries to explore differential access and achievement of socio-religious groups to
education in the districts of West Bengal. It tries to address the questions like what is the
pattern of disparity in educational attainment in West Bengal and to what extent membership
of excluded social groups cause deprivation in educational achievement?
The paper consists of six sections. The next section provides a brief overview of the current
literature and the third section describes the Data Sources and Methodology. The fourth
section tries to explore the disparity in educational achievements between socio-religious
groups in West Bengal using district level data. Lastly, a case study has been done at a
backward and an advanced district. Those two districts are Purulia and Hoogli respectively,
chosen on the basis of the ranking in the Human Development Report of West Bengal 2004.
The last section sums up the findings and provides some possible suggestions.
II. BRIEF REVIEW OF CURRENT LITERATURE
Education is perceived to be the primary means to overcome social discrimination (Omvedt,
1993). Yet, researchers have found substantial disparities among socio-religious classes in
terms of education in India. Some of the recent studies on Education and Social Class in
Indian context include those by Chalam (2000), Reddy (2000), Rahul and Subhadra. (2001),
Jeffrey et al (2002), Kanbargi (2002), Nambissan and Sedwal (2002), Sujatha (2002),
Balagopalan and Subrahmanian (2003), Visaria and Ramachandran (2003), Subrahmanian
(2005), Velaskar (2005), Jha and Jhingran (2005), and Lewin (2007). On the other hand,
Ansari (1988), Salamatullah (1994), Ruhela (1998), and Desai and Kulkarni (2005) deal with
educational status among religious minorities, especially among Muslims in India. Two
recent reports of the Government of India, the Sachar Committee Report (GOI, 2006) and the
Ranganath Misra Committee Report (GOI, 2007) also discuss these issues in detail, among
many others.
Surprisingly the present author have not come across any studies related to educational
disparity among socio-religious groups in West Bengal, though the demographic situation of
the state is quite conducive to such studies. The present paper aims to fill this gap in existing
literature.
4
III. DATA SOURCE AND METHODOLOGY
The present study uses data mainly from District Information System of Education of the
Government of India (DISE). Some data has also been taken from Planning Department of
Government of West Bengal and Data related to population of SC, ST & Minority has been
taken from Census of India (2001) and Ministry of Human Resource Development,
Government of India. The paper also uses primary data obtained through Field Survey in
Purulia and Hoogli districts of West Bengal to explore social exclusion in educational
attainment in West Bengal. Though these are case studies, they provide important insights
into the situation.
IV. METHODOLOGY
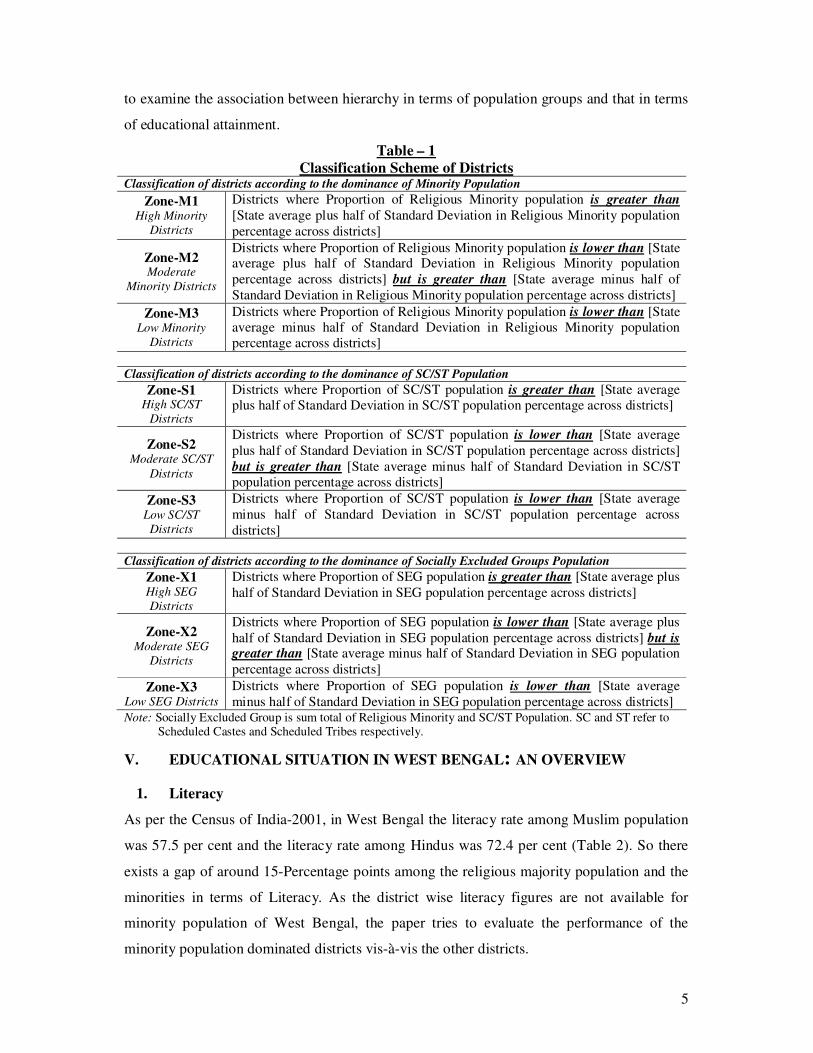
In order to explore the religion wise disparity in educational attainment, the nineteen districts
of West Bengal have been divided into different Zones depending on the population
composition. We have High Minority districts (Zone-M1), Moderate Minority Districts
(Zone-M2) and Low Minority districts (Zone-M3) depending on the share of minority
population in the districts. The grouping into three Zones has been done so as to have fairly
equal sized groups. The exact method is described in Table-1. Similar grouping were done for
SC/ST population. We have also explored the situation after adding the Religious Minorities
and SC/STs to get proportion of Socially Excluded Population. It may be noted that in our
study Religious Minority is taken to constitute the Muslim population since other religious
minorities are marginal in the context of West Bengal.
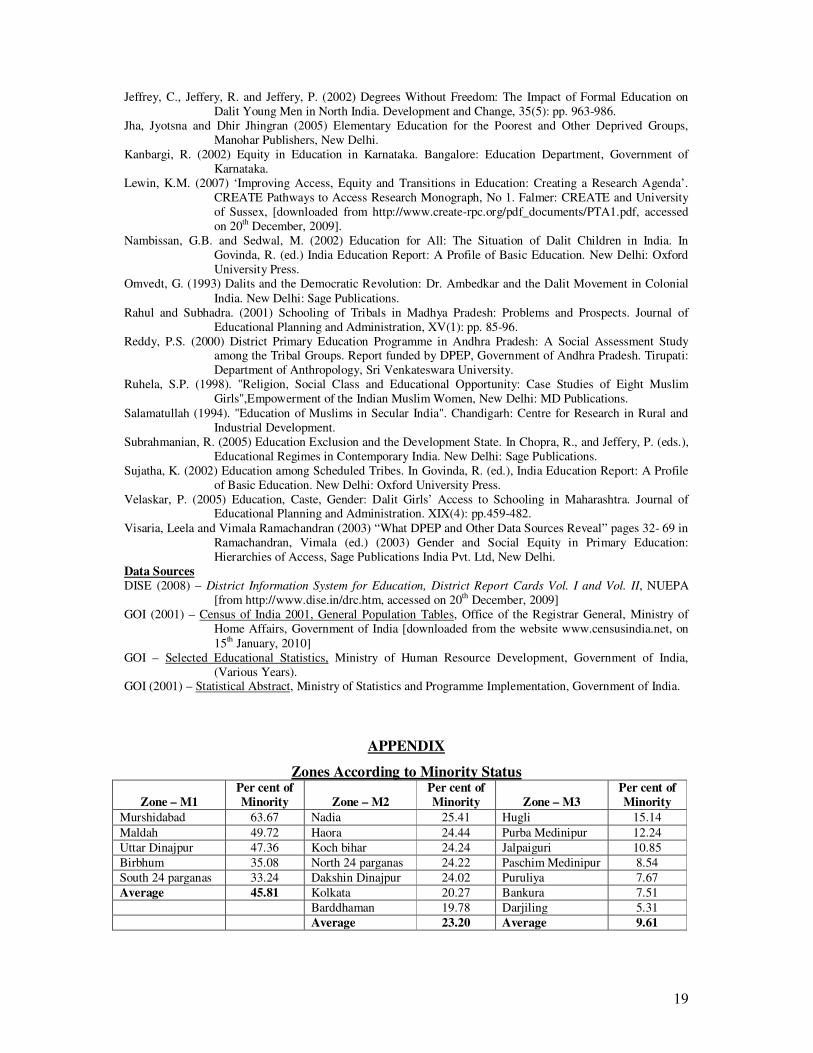
The zonal distribution of the districts according to the above three criteria is given in the
Appendix.
Now these three Zones for each type of classification can be compared to test the hypothesis
that people belonging to Socially Excluded Groups (Religious Minorities or Scheduled
Castes and Tribes) are having lower educational attainment compared to the Socially
Included communities (Upper Caste Hindus in case of West Bengal) being reflected as lower
average educational attainment in the districts dominated by the excluded groups compared to
the districts where their presence is relatively lower. In addition to this descriptive
exploration, Analysis of Variance (ANOVA) has been used to check if the variation between
the districts in terms of educational indices can be explained through the membership of the
districts in the Zones formed by us with the help of F test. We have also ranked the districts
in terms of the educational indices as well as the concentration of Minorities, SC/ST
population, and Socially Excluded Groups. Thereafter, Rank Correlation has also been used
5
to examine the association between hierarchy in terms of population groups and that in terms
of educational attainment.
Table – 1
Classification Scheme of Districts Classification of districts according to the dominance of Minority Population
Zone-M1 High Minority
Districts
Districts where Proportion of Religious Minority population is greater than
[State average plus half of Standard Deviation in Religious Minority population
percentage across districts]
Zone-M2 Moderate
Minority Districts
Districts where Proportion of Religious Minority population is lower than [State average plus half of Standard Deviation in Religious Minority population
percentage across districts] but is greater than [State average minus half of
Standard Deviation in Religious Minority population percentage across districts]
Zone-M3 Low Minority
Districts
Districts where Proportion of Religious Minority population is lower than [State
average minus half of Standard Deviation in Religious Minority population
percentage across districts]
Classification of districts according to the dominance of SC/ST Population
Zone-S1 High SC/ST
Districts
Districts where Proportion of SC/ST population is greater than [State average
plus half of Standard Deviation in SC/ST population percentage across districts]
Zone-S2 Moderate SC/ST
Districts
Districts where Proportion of SC/ST population is lower than [State average
plus half of Standard Deviation in SC/ST population percentage across districts]
but is greater than [State average minus half of Standard Deviation in SC/ST
population percentage across districts]
Zone-S3 Low SC/ST
Districts
Districts where Proportion of SC/ST population is lower than [State average
minus half of Standard Deviation in SC/ST population percentage across
districts]
Classification of districts according to the dominance of Socially Excluded Groups Population
Zone-X1 High SEG
Districts
Districts where Proportion of SEG population is greater than [State average plus
half of Standard Deviation in SEG population percentage across districts]
Zone-X2 Moderate SEG
Districts
Districts where Proportion of SEG population is lower than [State average plus
half of Standard Deviation in SEG population percentage across districts] but is greater than [State average minus half of Standard Deviation in SEG population
percentage across districts]
Zone-X3 Low SEG Districts
Districts where Proportion of SEG population is lower than [State average
minus half of Standard Deviation in SEG population percentage across districts] Note: Socially Excluded Group is sum total of Religious Minority and SC/ST Population. SC and ST refer to
Scheduled Castes and Scheduled Tribes respectively.
V. EDUCATIONAL SITUATION IN WEST BENGAL: AN OVERVIEW
1. Literacy
As per the Census of India-2001, in West Bengal the literacy rate among Muslim population
was 57.5 per cent and the literacy rate among Hindus was 72.4 per cent (Table 2). So there
exists a gap of around 15-Percentage points among the religious majority population and the
minorities in terms of Literacy. As the district wise literacy figures are not available for
minority population of West Bengal, the paper tries to evaluate the performance of the
minority population dominated districts vis-à-vis the other districts.
6
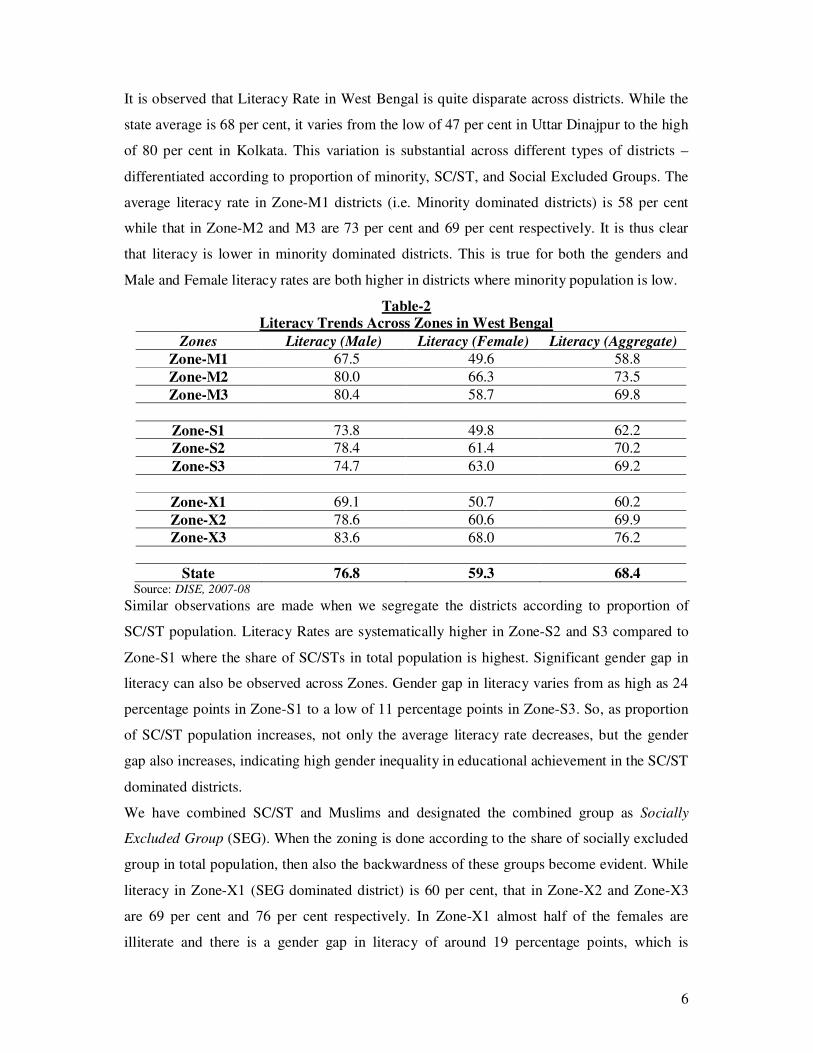
It is observed that Literacy Rate in West Bengal is quite disparate across districts. While the
state average is 68 per cent, it varies from the low of 47 per cent in Uttar Dinajpur to the high
of 80 per cent in Kolkata. This variation is substantial across different types of districts –
differentiated according to proportion of minority, SC/ST, and Social Excluded Groups. The
average literacy rate in Zone-M1 districts (i.e. Minority dominated districts) is 58 per cent
while that in Zone-M2 and M3 are 73 per cent and 69 per cent respectively. It is thus clear
that literacy is lower in minority dominated districts. This is true for both the genders and
Male and Female literacy rates are both higher in districts where minority population is low.
Table-2
Literacy Trends Across Zones in West Bengal
Zones Literacy (Male) Literacy (Female) Literacy (Aggregate)
Zone-M1 67.5 49.6 58.8
Zone-M2 80.0 66.3 73.5
Zone-M3 80.4 58.7 69.8
Zone-S1 73.8 49.8 62.2
Zone-S2 78.4 61.4 70.2
Zone-S3 74.7 63.0 69.2
Zone-X1 69.1 50.7 60.2
Zone-X2 78.6 60.6 69.9
Zone-X3 83.6 68.0 76.2
State 76.8 59.3 68.4 Source: DISE, 2007-08
Similar observations are made when we segregate the districts according to proportion of
SC/ST population. Literacy Rates are systematically higher in Zone-S2 and S3 compared to
Zone-S1 where the share of SC/STs in total population is highest. Significant gender gap in
literacy can also be observed across Zones. Gender gap in literacy varies from as high as 24
percentage points in Zone-S1 to a low of 11 percentage points in Zone-S3. So, as proportion
of SC/ST population increases, not only the average literacy rate decreases, but the gender
gap also increases, indicating high gender inequality in educational achievement in the SC/ST
dominated districts.
We have combined SC/ST and Muslims and designated the combined group as Socially
Excluded Group (SEG). When the zoning is done according to the share of socially excluded
group in total population, then also the backwardness of these groups become evident. While
literacy in Zone-X1 (SEG dominated district) is 60 per cent, that in Zone-X2 and Zone-X3
are 69 per cent and 76 per cent respectively. In Zone-X1 almost half of the females are
illiterate and there is a gender gap in literacy of around 19 percentage points, which is
7
considerably high. On the other hand, female literacy rate in Zone-X2 and X3 are 60 and 68
per cent respectively. So, it emerges that dominance of Socially Excluded Group is inversely
proportional to literacy rate in general and female literacy in particular.
While discussing the literacy indicator another important observation can be made.
Irrespective of composition of population, there exists an average gender gap in literacy of
around 15 percentage points in West Bengal, indicating that negligence of the educational
needs of the girl child is quite common among the socially included groups in West Bengal as
well, and Women can be considered as an Excluded Group by themselves, but that is beyond
the scope of this paper.
2. Net Enrolment Rate (NER)
To continue with formal educational training, after being literate, children need to be
admitted to schools. So, emphasis should be given to on the Net Enrollment Ratio. NER, it
may be recalled, measures what proportion of relevant age-group children are enrolled in
school stages. A high NER is the objective and indicator of educational achievement. To
fulfill this objective, Government of India has started the Sarva Shiksha Abhiyan (SSA) in
2001, and the mission to some extent has been successful. During last ten years significant
increase in NER can be noticed, especially in backward areas. According to India’s
Education For All Mid-Decade Assessment, in just five years between the year 2000 and
2005, primary school enrollment increased by 14 per cent in aggregate and by 20 per cent for
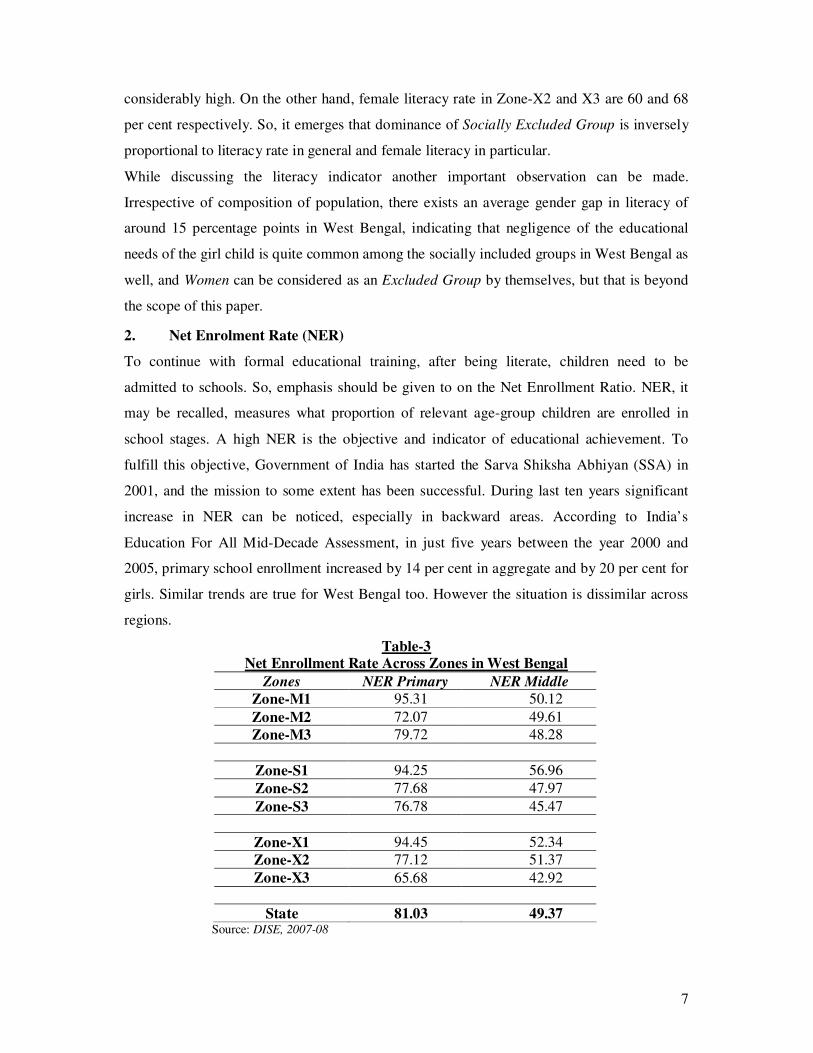
girls. Similar trends are true for West Bengal too. However the situation is dissimilar across
regions.
Table-3 Net Enrollment Rate Across Zones in West Bengal
Zones NER Primary NER Middle
Zone-M1 95.31 50.12
Zone-M2 72.07 49.61
Zone-M3 79.72 48.28
Zone-S1 94.25 56.96
Zone-S2 77.68 47.97
Zone-S3 76.78 45.47
Zone-X1 94.45 52.34
Zone-X2 77.12 51.37
Zone-X3 65.68 42.92
State 81.03 49.37 Source: DISE, 2007-08
8
The Net Enrollment Rate for Primary Stage in Zone M1 is 95 per cent while that in Zone M2
and M3 is 72 and 79 per cent respectively (Table 3). That is quite unexpected result as per as
the hypothesis of backward group dominated districts having lower educational achievements
is concerned. In Zone M1 except for Birbhum and South Twenty Four Pargana the other three
districts namely, Malda, Murshidabad and Uttar Dinajpur exhibit a NER of 100 per cent. This
rise in enrollment may have been because of the SSA drive by the government since 2001.
Even so, this is really encouraging trends in so far as bringing children to schools is
concerned.
However, when we move to Net Enrollment Rate for Middle Stages, we find a completely
opposite picture. The NER for middle stages on an average are almost half of the NER at
Primary – indicating high drop outs during movement from primary to middle stages. As we
can see that the NER at middle stage for Zone-M1 is 50 per cent and for Zone-M2 and M3
the figures are 49 and 48 per cent respectively.
Low NER of Zone-M2 may have been caused by incompleteness of enrolment data from the
advanced district of Kolkata where available DISE data provides enrollment figures mostly
for the Government Schools whereas most of the children go to private schools.
Similar is the situation if the districts are classified according to the population of SC/ST
community. Here also, both NER at primary stage and middle stage is high for Zone-S1 as
compared to Zone-S2 and S3. Again it may be due to the recent efforts of Sarva Shiksha
Abhiyan. Districts like Purulia, Bankura, and Birbhum having around 40 per cent if its
population as SC/ST shows about 100 per cent NER at primary level. But again there is a
problem in retaining those children in school, is reflected by the lower NER for middle
stages.
Lastly, when we divide the districts as per the dominance of Socially Excluded Group then it
is observed that in Zone-X1, out of every 100 children, 94 gets enrolled in the primary
school, 6 remains out of school and 52 out of those 94 enrolled child goes to middle stage
while 42 gets dropped out in between the primary and middle stages. So, out of each 100
child of Zone-X1, 48 remain out of school. It appears that Sarva Shiksha Abhiyan is
successful in bringing the children to school, but is not successful in retaining them in school
or reduce dropout. This is the main reason why our hypothesis is refuted for the NER for
primary stage but not quite so for the NER for middle stage.
9
3. Dropout Rates (DOR)
After ensuring all children in the age group of 6 – 14 years are enrolled in school, the next
task is to reduce the dropout in order to ensure that the enrolled children completes formal
education up to at least the secondary stages. After the completion of mid-decade evaluation
of Education For All in 2005, it has been found that one in four children left school before
reaching grade V and almost half left before reaching grade VIII. Thus dropout is still a
major problem area in our education system. Are the Socially Excluded Groups suffering
from higher dropout? Let us explore the issue.
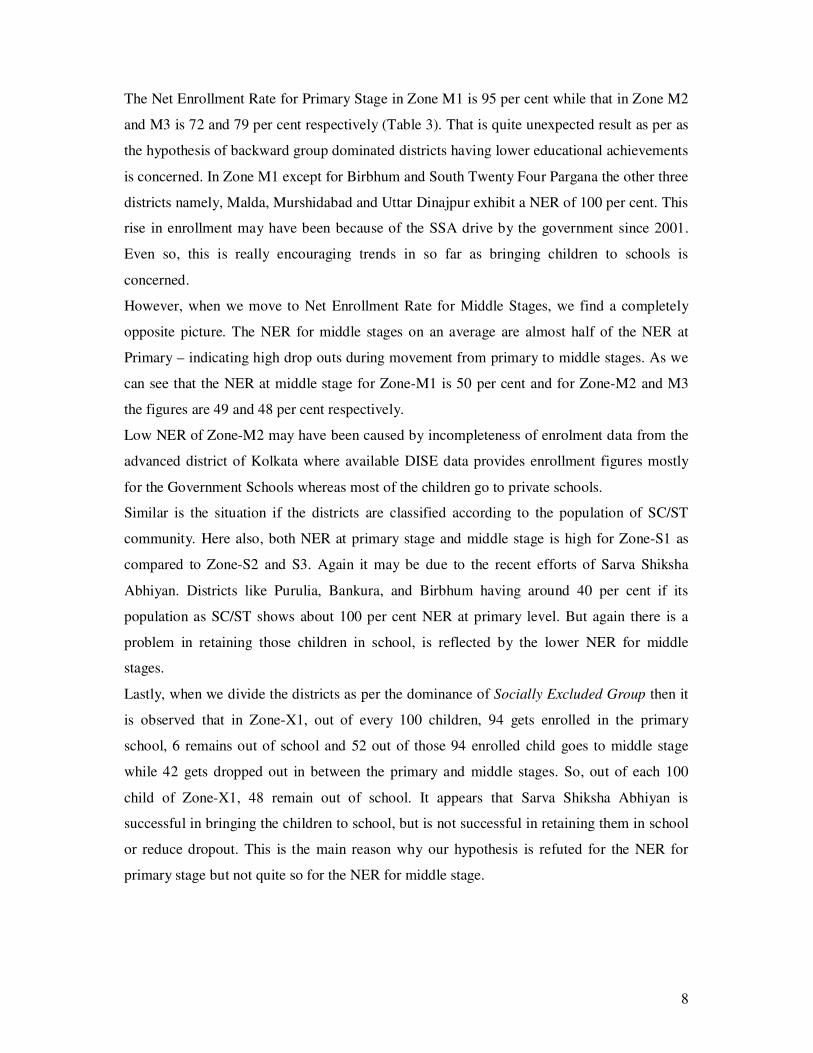
When we look at the different Zones classified according to the presence of minority
population, it is noticed that as share of minority population increases in the districts, the
dropout rate also increases (Table 4).
It is seen that the drop out rate for primary stage in Zone-M1 is 32 per cent while that in
middle stage is 44 per cent. And the dropout rate for the Zone-M2 is 18 and 34 per cent for
primary and middle stages respectively.
Similar trends in dropout rates are noted when the districts are classified according to SC/ST
population and also in case of zoning according to the presence of Socially Excluded Group.
It appears that our hypothesis is proved if we use the dropout rate as an (inverse) indicator of
educational attainment. Though in these days Government of India has started midday meal
scheme and various programmes to retain the children in the school, much needs to be done
yet.
Table-4
Dropout rate Across Zones in West Bengal
Zones Dropout Rate
Primary
Dropout Rate
Middle
Zone-M1 32.7 44.3
Zone-M2 18.4 34.2
Zone-M3 27.2 35.8
Zone-S1 28.5 40.4
Zone-S2 26.9 37.1
Zone-S3 18.0 35.3
Zone-X1 33.0 43.8
Zone-X2 20.8 36.3
Zone-X3 17.5 29.0
State 25.8 37.6 Source: DISE, 2007-08
10
4. Retention Rate
Retention Rate is actually complementary to the dropout rate. So as dropout rate declines, the
retention rate rises. Since the results for dropout rates have already been discussed, there is
nothing much to say about the retention rate. But presently retention rate should be the matter
of concern for the school authorities. During a field survey on education and human
development, results of which we discuss later, an opinion was taken from different persons
about the reasons for dropout. Most of them said that high school is far away and they need to
provide cycles to their children to send them to school and they are not capable enough to
spend so much. For girl children, parents simply don’t want their daughters to cover such a
long distance to go to school, may be due to security reasons. In fact the poor people take
their children out of school because they cannot afford to educate them; even if they could
afford to educate their children, the returns on primary school education are meagre; and
sometimes they need their children’s earning to supplement family income.
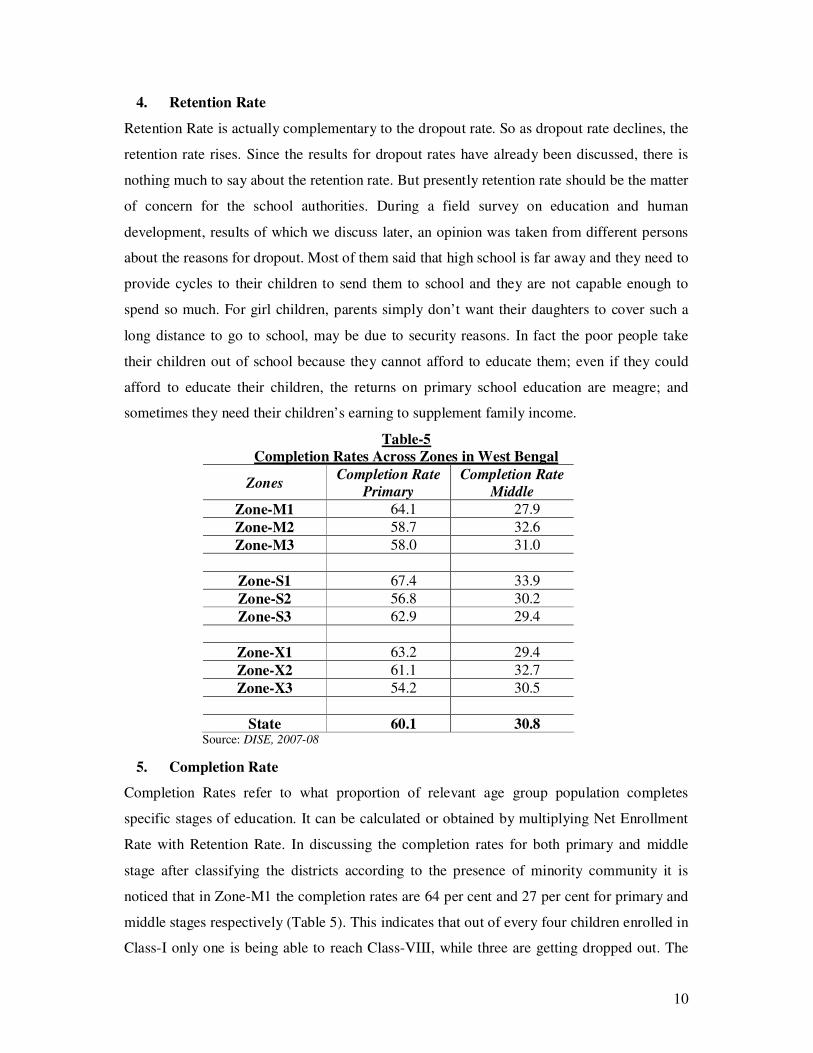
Table-5
Completion Rates Across Zones in West Bengal
Zones Completion Rate
Primary
Completion Rate
Middle
Zone-M1 64.1 27.9
Zone-M2 58.7 32.6
Zone-M3 58.0 31.0
Zone-S1 67.4 33.9
Zone-S2 56.8 30.2
Zone-S3 62.9 29.4
Zone-X1 63.2 29.4
Zone-X2 61.1 32.7
Zone-X3 54.2 30.5
State 60.1 30.8 Source: DISE, 2007-08
5. Completion Rate
Completion Rates refer to what proportion of relevant age group population completes
specific stages of education. It can be calculated or obtained by multiplying Net Enrollment
Rate with Retention Rate. In discussing the completion rates for both primary and middle
stage after classifying the districts according to the presence of minority community it is
noticed that in Zone-M1 the completion rates are 64 per cent and 27 per cent for primary and
middle stages respectively (Table 5). This indicates that out of every four children enrolled in
Class-I only one is being able to reach Class-VIII, while three are getting dropped out. The
11
completion rates are expected to be higher in Zone-M2 and Zone-M3 compared to Zone-M1.
However we find that our hypothesis is refuted for the primary stages, may be because of the
higher enrollment figures. The hypothesis is observed to be satisfied for the completion rates
of middle stages.
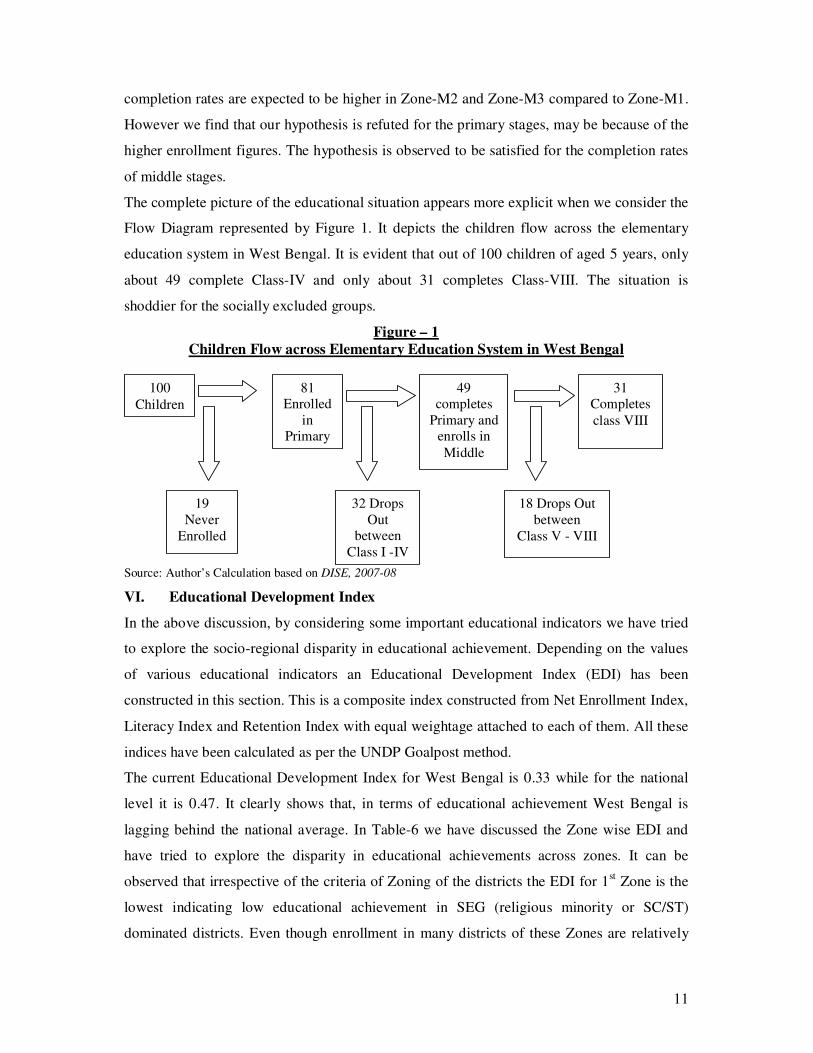
The complete picture of the educational situation appears more explicit when we consider the
Flow Diagram represented by Figure 1. It depicts the children flow across the elementary
education system in West Bengal. It is evident that out of 100 children of aged 5 years, only
about 49 complete Class-IV and only about 31 completes Class-VIII. The situation is
shoddier for the socially excluded groups.
Figure – 1
Children Flow across Elementary Education System in West Bengal
100
Children
81
Enrolled
in
Primary
49
completes
Primary and
enrolls in
Middle
31
Completes
class VIII
19
Never
Enrolled
32 Drops
Out
between
Class I -IV
18 Drops Out
between
Class V - VIII
Source: Author’s Calculation based on DISE, 2007-08
VI. Educational Development Index
In the above discussion, by considering some important educational indicators we have tried
to explore the socio-regional disparity in educational achievement. Depending on the values
of various educational indicators an Educational Development Index (EDI) has been
constructed in this section. This is a composite index constructed from Net Enrollment Index,
Literacy Index and Retention Index with equal weightage attached to each of them. All these
indices have been calculated as per the UNDP Goalpost method.
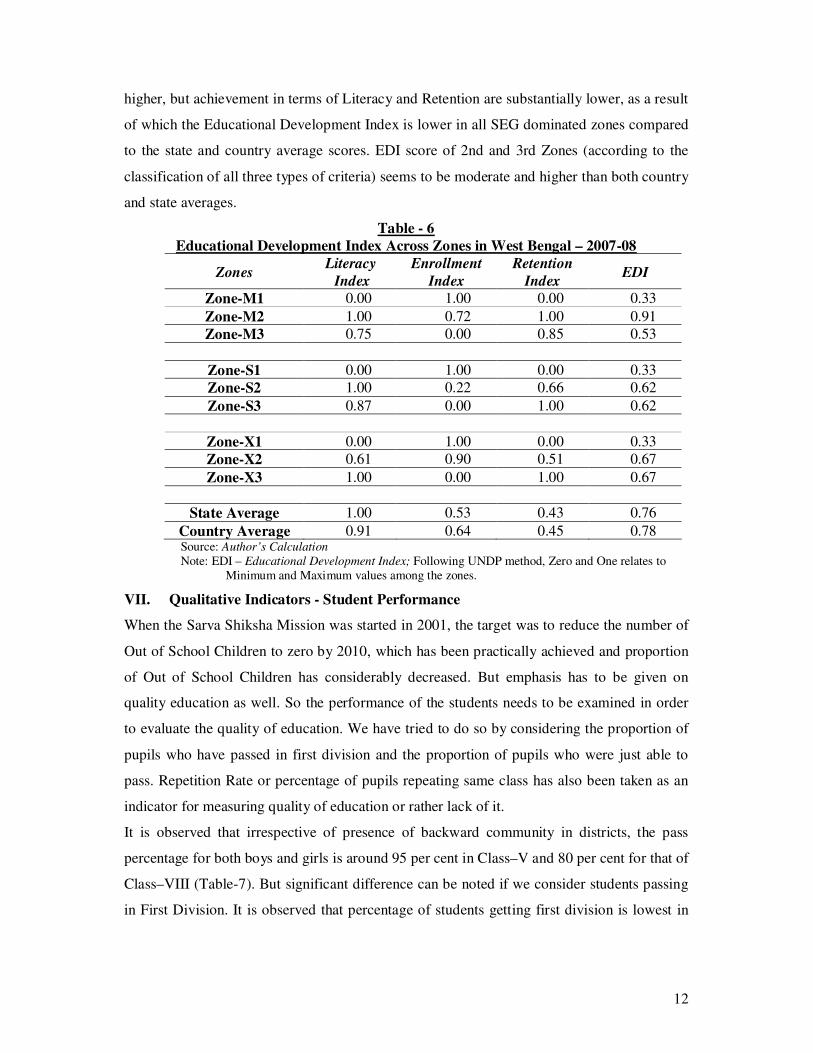
The current Educational Development Index for West Bengal is 0.33 while for the national
level it is 0.47. It clearly shows that, in terms of educational achievement West Bengal is
lagging behind the national average. In Table-6 we have discussed the Zone wise EDI and
have tried to explore the disparity in educational achievements across zones. It can be
observed that irrespective of the criteria of Zoning of the districts the EDI for 1st Zone is the
lowest indicating low educational achievement in SEG (religious minority or SC/ST)
dominated districts. Even though enrollment in many districts of these Zones are relatively
12
higher, but achievement in terms of Literacy and Retention are substantially lower, as a result
of which the Educational Development Index is lower in all SEG dominated zones compared
to the state and country average scores. EDI score of 2nd and 3rd Zones (according to the
classification of all three types of criteria) seems to be moderate and higher than both country
and state averages.
Table - 6
Educational Development Index Across Zones in West Bengal – 2007-08
Zones Literacy
Index
Enrollment
Index
Retention
Index EDI
Zone-M1 0.00 1.00 0.00 0.33
Zone-M2 1.00 0.72 1.00 0.91
Zone-M3 0.75 0.00 0.85 0.53
Zone-S1 0.00 1.00 0.00 0.33
Zone-S2 1.00 0.22 0.66 0.62
Zone-S3 0.87 0.00 1.00 0.62
Zone-X1 0.00 1.00 0.00 0.33
Zone-X2 0.61 0.90 0.51 0.67
Zone-X3 1.00 0.00 1.00 0.67
State Average 1.00 0.53 0.43 0.76
Country Average 0.91 0.64 0.45 0.78 Source: Author’s Calculation
Note: EDI – Educational Development Index; Following UNDP method, Zero and One relates to
Minimum and Maximum values among the zones.
VII. Qualitative Indicators - Student Performance
When the Sarva Shiksha Mission was started in 2001, the target was to reduce the number of
Out of School Children to zero by 2010, which has been practically achieved and proportion
of Out of School Children has considerably decreased. But emphasis has to be given on
quality education as well. So the performance of the students needs to be examined in order
to evaluate the quality of education. We have tried to do so by considering the proportion of
pupils who have passed in first division and the proportion of pupils who were just able to
pass. Repetition Rate or percentage of pupils repeating same class has also been taken as an
indicator for measuring quality of education or rather lack of it.
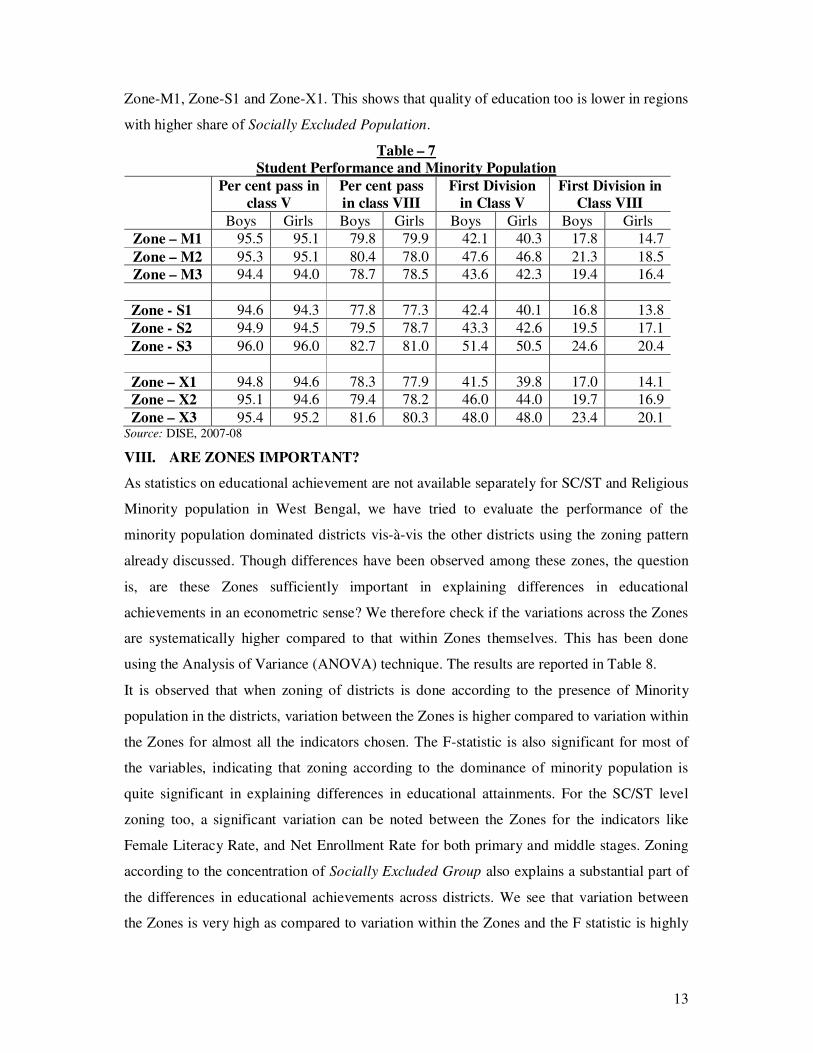
It is observed that irrespective of presence of backward community in districts, the pass
percentage for both boys and girls is around 95 per cent in Class–V and 80 per cent for that of
Class–VIII (Table-7). But significant difference can be noted if we consider students passing
in First Division. It is observed that percentage of students getting first division is lowest in
13
Zone-M1, Zone-S1 and Zone-X1. This shows that quality of education too is lower in regions
with higher share of Socially Excluded Population.
Table – 7
Student Performance and Minority Population
Per cent pass in
class V
Per cent pass
in class VIII
First Division
in Class V
First Division in
Class VIII
Boys Girls Boys Girls Boys Girls Boys Girls
Zone – M1 95.5 95.1 79.8 79.9 42.1 40.3 17.8 14.7
Zone – M2 95.3 95.1 80.4 78.0 47.6 46.8 21.3 18.5
Zone – M3 94.4 94.0 78.7 78.5 43.6 42.3 19.4 16.4
Zone - S1 94.6 94.3 77.8 77.3 42.4 40.1 16.8 13.8
Zone - S2 94.9 94.5 79.5 78.7 43.3 42.6 19.5 17.1
Zone - S3 96.0 96.0 82.7 81.0 51.4 50.5 24.6 20.4
Zone – X1 94.8 94.6 78.3 77.9 41.5 39.8 17.0 14.1
Zone – X2 95.1 94.6 79.4 78.2 46.0 44.0 19.7 16.9
Zone – X3 95.4 95.2 81.6 80.3 48.0 48.0 23.4 20.1 Source: DISE, 2007-08
VIII. ARE ZONES IMPORTANT?
As statistics on educational achievement are not available separately for SC/ST and Religious
Minority population in West Bengal, we have tried to evaluate the performance of the
minority population dominated districts vis-à-vis the other districts using the zoning pattern
already discussed. Though differences have been observed among these zones, the question
is, are these Zones sufficiently important in explaining differences in educational
achievements in an econometric sense? We therefore check if the variations across the Zones
are systematically higher compared to that within Zones themselves. This has been done
using the Analysis of Variance (ANOVA) technique. The results are reported in Table 8.
It is observed that when zoning of districts is done according to the presence of Minority
population in the districts, variation between the Zones is higher compared to variation within
the Zones for almost all the indicators chosen. The F-statistic is also significant for most of
the variables, indicating that zoning according to the dominance of minority population is
quite significant in explaining differences in educational attainments. For the SC/ST level
zoning too, a significant variation can be noted between the Zones for the indicators like
Female Literacy Rate, and Net Enrollment Rate for both primary and middle stages. Zoning
according to the concentration of Socially Excluded Group also explains a substantial part of
the differences in educational achievements across districts. We see that variation between
the Zones is very high as compared to variation within the Zones and the F statistic is highly

14
significant for all the indicators. It implies that share of Socially Excluded Group in the
district affects the educational achievement of it.
Table – 8
Variation within and between groups of Districts Zoning according to
Variables
Proportion of
Variation
Explained by Minority
Population
SC/ST
Population
SEG
Population Within Groups 28.7 53.5 10.7
Between Groups 71.3 46.5 89.3 Total Literacy F Stat 2.48 (0.11) 0.086 (0.43) 3.38** (0.00)
Within Groups 11.9 92.3 10.2
Between Groups 88.1 7.7 89.8 Male Literacy F Stat 4.49** (0.02) 0.08 (0.92) 8.77** (0.00)
Within Groups 22.0 32.8 13.5
Between Groups 78.0 67.2 86.6 Female Literacy F Stat 3.55** (0.05) 2.04 (0.16) 6.43** (0.01)
Within Groups 26.6 35.9 11.2
Between Groups 73.4 64.8 88.8 NER Primary F Stat 2.75* (0.09) 1.84 (0.19) 7.94** (0.00)
Within Groups 28.6 21.3 18.2
Between Groups 71.4 78.8 81.8 NER Middle F Stat 2.49 (0.11) 3.70** (0.04) 4.49** (0.03)
Within Groups 39.1 50.3 16.5
Between Groups 60.9 49.7 83.5 DOR Middle F Stat 1.55 (0.24) 0.98 (0.39) 5.07** (0.02)
Within Groups 39.1 50.3 16.5
Between Groups 60.9 49.7 83.5 RET Middle F Stat 1.55 (0.24) 0.98 (0.39) 5.07** (0.02)
Source: Author’s Calculation
Note: NER – Net Enrolment Rate, DOR – Dropout Rate, RET – Retention Rate; Variations are in terms
of percentage of TSS explained by Within and Between Groups; ** and * denotes significance at 5 and 10 per cent levels respectively; Figures in parenthesis are Significance levels.
IX. Hierarchy of Districts
In order to validate the earlier results another statistical technique has been used. Since our
contention is that districts having more excluded class population will be performing
relatively poorly in terms of educational achievements, we rank the districts according to the
proportion of Minority, SC/ST and Socially Excluded Group population on the one hand and
according to the educational achievement indicators like Literacy, Net Enrollment Rate,
Dropout Rate, Retention Rate and completion Rate on the other. Thereafter rank correlation
coefficients are calculated between rank according to population characteristics and rank
according to educational indicators. It is observed that districts ranking higher in terms of
Socially Excluded Groups are ranked lower in terms of literacy and completion and higher in
terms of Dropout, supporting our hypothesis (Table 9). Only for Net Enrollment Rate and
Primary Completion Rates are the results contrary to our hypothesis, possible reasons of
which have already been noted. It thus appears that analysis based on secondary data quite
clearly brings out the fact that districts having more number of SC/ST and Minority
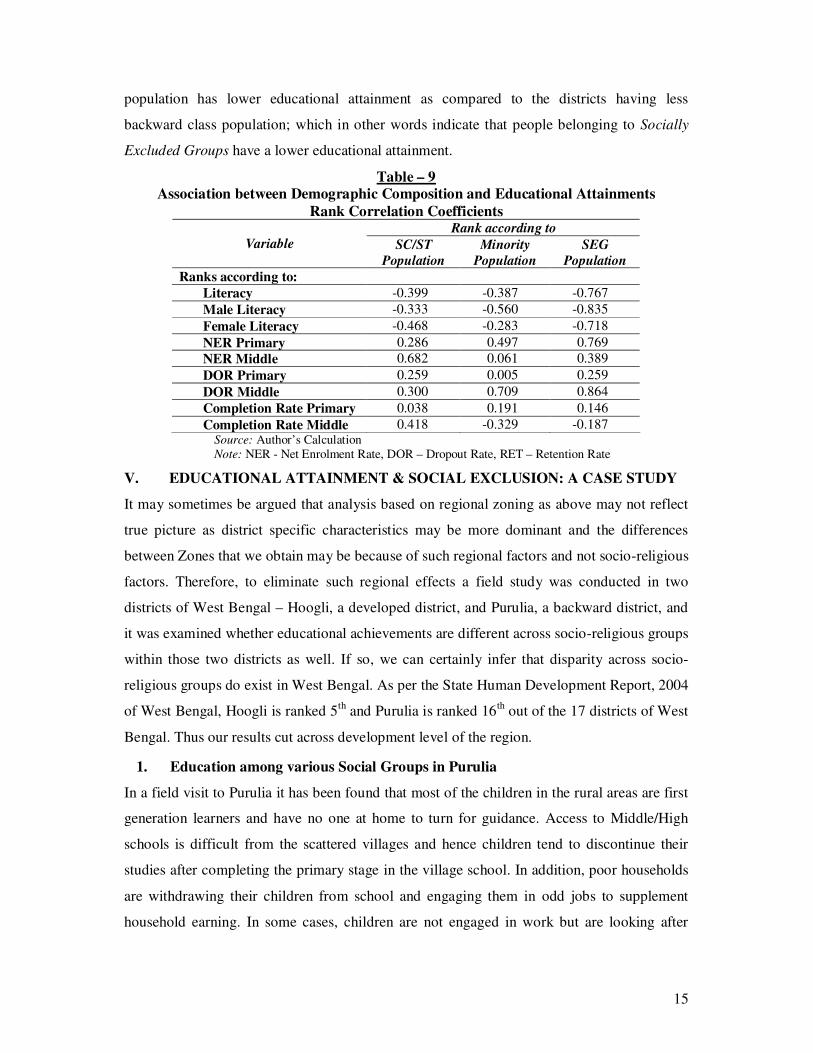
15
population has lower educational attainment as compared to the districts having less
backward class population; which in other words indicate that people belonging to Socially
Excluded Groups have a lower educational attainment.
Table – 9
Association between Demographic Composition and Educational Attainments
Rank Correlation Coefficients Rank according to
Variable SC/ST
Population
Minority
Population
SEG
Population
Ranks according to:
Literacy -0.399 -0.387 -0.767
Male Literacy -0.333 -0.560 -0.835
Female Literacy -0.468 -0.283 -0.718
NER Primary 0.286 0.497 0.769
NER Middle 0.682 0.061 0.389
DOR Primary 0.259 0.005 0.259
DOR Middle 0.300 0.709 0.864
Completion Rate Primary 0.038 0.191 0.146
Completion Rate Middle 0.418 -0.329 -0.187 Source: Author’s Calculation
Note: NER - Net Enrolment Rate, DOR – Dropout Rate, RET – Retention Rate
V. EDUCATIONAL ATTAINMENT & SOCIAL EXCLUSION: A CASE STUDY
It may sometimes be argued that analysis based on regional zoning as above may not reflect
true picture as district specific characteristics may be more dominant and the differences
between Zones that we obtain may be because of such regional factors and not socio-religious
factors. Therefore, to eliminate such regional effects a field study was conducted in two
districts of West Bengal – Hoogli, a developed district, and Purulia, a backward district, and
it was examined whether educational achievements are different across socio-religious groups
within those two districts as well. If so, we can certainly infer that disparity across socio-
religious groups do exist in West Bengal. As per the State Human Development Report, 2004
of West Bengal, Hoogli is ranked 5th
and Purulia is ranked 16th
out of the 17 districts of West
Bengal. Thus our results cut across development level of the region.
1. Education among various Social Groups in Purulia
In a field visit to Purulia it has been found that most of the children in the rural areas are first
generation learners and have no one at home to turn for guidance. Access to Middle/High
schools is difficult from the scattered villages and hence children tend to discontinue their
studies after completing the primary stage in the village school. In addition, poor households
are withdrawing their children from school and engaging them in odd jobs to supplement
household earning. In some cases, children are not engaged in work but are looking after
16
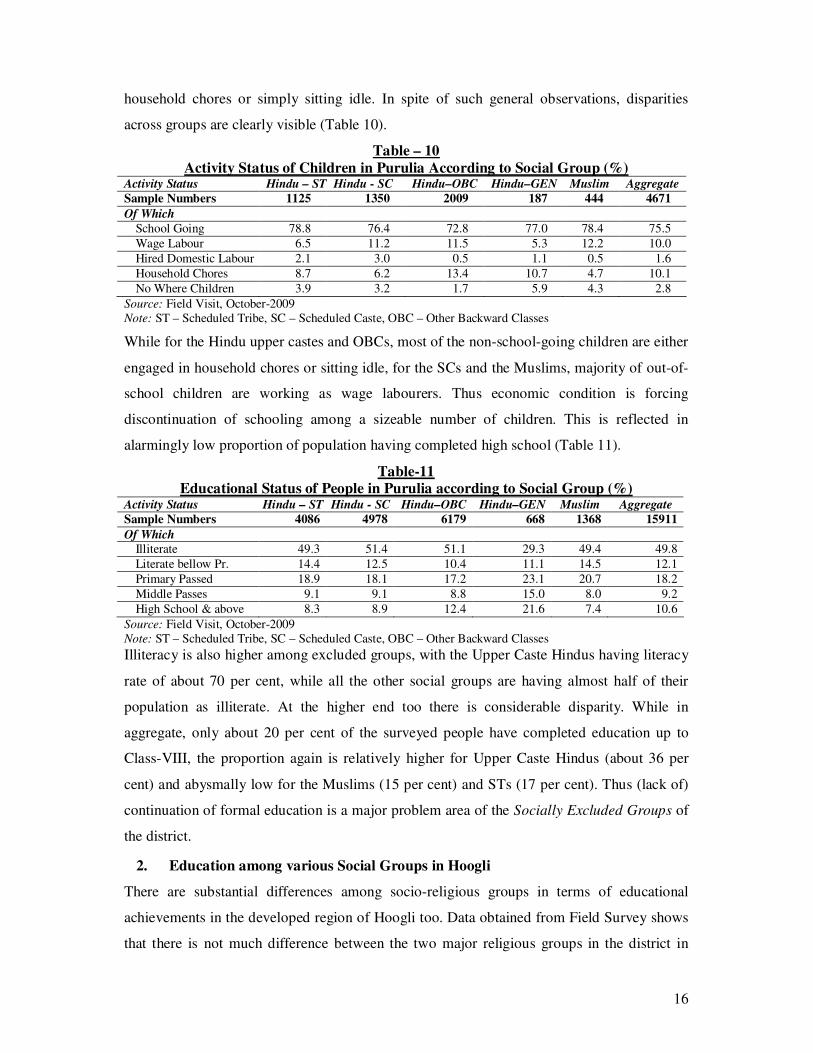
household chores or simply sitting idle. In spite of such general observations, disparities
across groups are clearly visible (Table 10).
Table – 10
Activity Status of Children in Purulia According to Social Group (%) Activity Status Hindu – ST Hindu - SC Hindu–OBC Hindu–GEN Muslim Aggregate
Sample Numbers 1125 1350 2009 187 444 4671
Of Which
School Going 78.8 76.4 72.8 77.0 78.4 75.5
Wage Labour 6.5 11.2 11.5 5.3 12.2 10.0
Hired Domestic Labour 2.1 3.0 0.5 1.1 0.5 1.6
Household Chores 8.7 6.2 13.4 10.7 4.7 10.1
No Where Children 3.9 3.2 1.7 5.9 4.3 2.8
Source: Field Visit, October-2009
Note: ST – Scheduled Tribe, SC – Scheduled Caste, OBC – Other Backward Classes
While for the Hindu upper castes and OBCs, most of the non-school-going children are either
engaged in household chores or sitting idle, for the SCs and the Muslims, majority of out-of-
school children are working as wage labourers. Thus economic condition is forcing
discontinuation of schooling among a sizeable number of children. This is reflected in
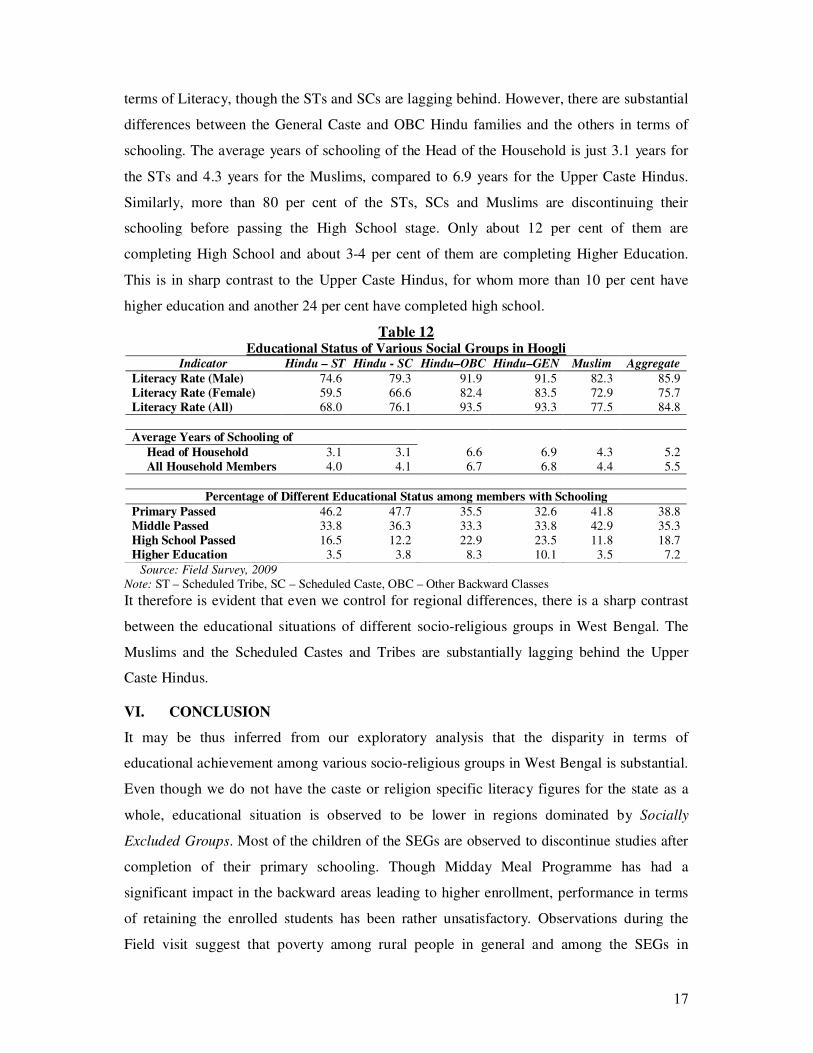
alarmingly low proportion of population having completed high school (Table 11).
Table-11 Educational Status of People in Purulia according to Social Group (%)
Activity Status Hindu – ST Hindu - SC Hindu–OBC Hindu–GEN Muslim Aggregate
Sample Numbers 4086 4978 6179 668 1368 15911
Of Which
Illiterate 49.3 51.4 51.1 29.3 49.4 49.8
Literate bellow Pr. 14.4 12.5 10.4 11.1 14.5 12.1
Primary Passed 18.9 18.1 17.2 23.1 20.7 18.2
Middle Passes 9.1 9.1 8.8 15.0 8.0 9.2
High School & above 8.3 8.9 12.4 21.6 7.4 10.6
Source: Field Visit, October-2009
Note: ST – Scheduled Tribe, SC – Scheduled Caste, OBC – Other Backward Classes
Illiteracy is also higher among excluded groups, with the Upper Caste Hindus having literacy
rate of about 70 per cent, while all the other social groups are having almost half of their
population as illiterate. At the higher end too there is considerable disparity. While in
aggregate, only about 20 per cent of the surveyed people have completed education up to
Class-VIII, the proportion again is relatively higher for Upper Caste Hindus (about 36 per
cent) and abysmally low for the Muslims (15 per cent) and STs (17 per cent). Thus (lack of)
continuation of formal education is a major problem area of the Socially Excluded Groups of
the district.
2. Education among various Social Groups in Hoogli
There are substantial differences among socio-religious groups in terms of educational
achievements in the developed region of Hoogli too. Data obtained from Field Survey shows
that there is not much difference between the two major religious groups in the district in
17
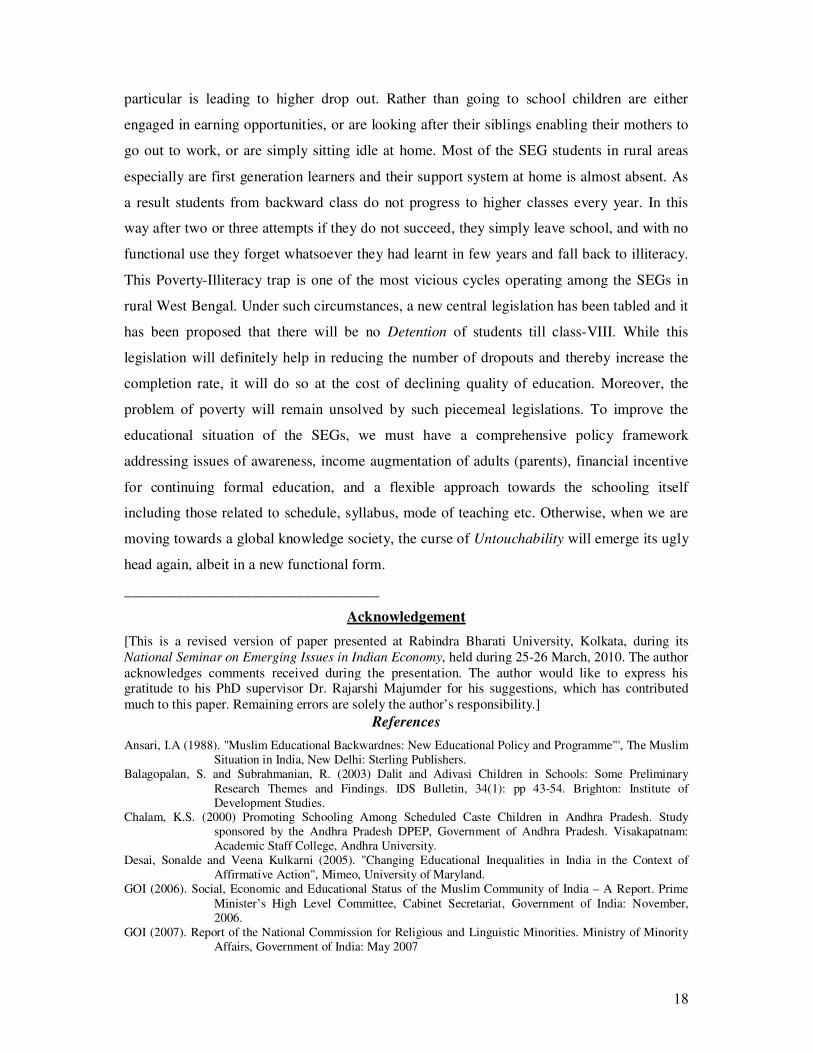
terms of Literacy, though the STs and SCs are lagging behind. However, there are substantial
differences between the General Caste and OBC Hindu families and the others in terms of
schooling. The average years of schooling of the Head of the Household is just 3.1 years for
the STs and 4.3 years for the Muslims, compared to 6.9 years for the Upper Caste Hindus.
Similarly, more than 80 per cent of the STs, SCs and Muslims are discontinuing their
schooling before passing the High School stage. Only about 12 per cent of them are
completing High School and about 3-4 per cent of them are completing Higher Education.
This is in sharp contrast to the Upper Caste Hindus, for whom more than 10 per cent have
higher education and another 24 per cent have completed high school.
Table 12 Educational Status of Various Social Groups in Hoogli
Indicator Hindu – ST Hindu - SC Hindu–OBC Hindu–GEN Muslim Aggregate
Literacy Rate (Male) 74.6 79.3 91.9 91.5 82.3 85.9
Literacy Rate (Female) 59.5 66.6 82.4 83.5 72.9 75.7
Literacy Rate (All) 68.0 76.1 93.5 93.3 77.5 84.8
Average Years of Schooling of
Head of Household 3.1 3.1 6.6 6.9 4.3 5.2
All Household Members 4.0 4.1 6.7 6.8 4.4 5.5
Percentage of Different Educational Status among members with Schooling
Primary Passed 46.2 47.7 35.5 32.6 41.8 38.8
Middle Passed 33.8 36.3 33.3 33.8 42.9 35.3
High School Passed 16.5 12.2 22.9 23.5 11.8 18.7
Higher Education 3.5 3.8 8.3 10.1 3.5 7.2
Source: Field Survey, 2009
Note: ST – Scheduled Tribe, SC – Scheduled Caste, OBC – Other Backward Classes
It therefore is evident that even we control for regional differences, there is a sharp contrast
between the educational situations of different socio-religious groups in West Bengal. The
Muslims and the Scheduled Castes and Tribes are substantially lagging behind the Upper
Caste Hindus.
VI. CONCLUSION
It may be thus inferred from our exploratory analysis that the disparity in terms of
educational achievement among various socio-religious groups in West Bengal is substantial.
Even though we do not have the caste or religion specific literacy figures for the state as a
whole, educational situation is observed to be lower in regions dominated by Socially
Excluded Groups. Most of the children of the SEGs are observed to discontinue studies after
completion of their primary schooling. Though Midday Meal Programme has had a
significant impact in the backward areas leading to higher enrollment, performance in terms
of retaining the enrolled students has been rather unsatisfactory. Observations during the
Field visit suggest that poverty among rural people in general and among the SEGs in
18
particular is leading to higher drop out. Rather than going to school children are either
engaged in earning opportunities, or are looking after their siblings enabling their mothers to
go out to work, or are simply sitting idle at home. Most of the SEG students in rural areas
especially are first generation learners and their support system at home is almost absent. As
a result students from backward class do not progress to higher classes every year. In this
way after two or three attempts if they do not succeed, they simply leave school, and with no
functional use they forget whatsoever they had learnt in few years and fall back to illiteracy.
This Poverty-Illiteracy trap is one of the most vicious cycles operating among the SEGs in
rural West Bengal. Under such circumstances, a new central legislation has been tabled and it
has been proposed that there will be no Detention of students till class-VIII. While this
legislation will definitely help in reducing the number of dropouts and thereby increase the
completion rate, it will do so at the cost of declining quality of education. Moreover, the
problem of poverty will remain unsolved by such piecemeal legislations. To improve the
educational situation of the SEGs, we must have a comprehensive policy framework
addressing issues of awareness, income augmentation of adults (parents), financial incentive
for continuing formal education, and a flexible approach towards the schooling itself
including those related to schedule, syllabus, mode of teaching etc. Otherwise, when we are
moving towards a global knowledge society, the curse of Untouchability will emerge its ugly
head again, albeit in a new functional form.
__________________________________
Acknowledgement
[This is a revised version of paper presented at Rabindra Bharati University, Kolkata, during its
National Seminar on Emerging Issues in Indian Economy, held during 25-26 March, 2010. The author
acknowledges comments received during the presentation. The author would like to express his gratitude to his PhD supervisor Dr. Rajarshi Majumder for his suggestions, which has contributed
much to this paper. Remaining errors are solely the author’s responsibility.]
References
Ansari, I.A (1988). "Muslim Educational Backwardnes: New Educational Policy and Programme"', The Muslim
Situation in India, New Delhi: Sterling Publishers.
Balagopalan, S. and Subrahmanian, R. (2003) Dalit and Adivasi Children in Schools: Some Preliminary
Research Themes and Findings. IDS Bulletin, 34(1): pp 43-54. Brighton: Institute of
Development Studies. Chalam, K.S. (2000) Promoting Schooling Among Scheduled Caste Children in Andhra Pradesh. Study
sponsored by the Andhra Pradesh DPEP, Government of Andhra Pradesh. Visakapatnam:
Academic Staff College, Andhra University.
Desai, Sonalde and Veena Kulkarni (2005). "Changing Educational Inequalities in India in the Context of
Affirmative Action", Mimeo, University of Maryland.
GOI (2006). Social, Economic and Educational Status of the Muslim Community of India – A Report. Prime
Minister’s High Level Committee, Cabinet Secretariat, Government of India: November,
2006.
GOI (2007). Report of the National Commission for Religious and Linguistic Minorities. Ministry of Minority
Affairs, Government of India: May 2007
19
Jeffrey, C., Jeffery, R. and Jeffery, P. (2002) Degrees Without Freedom: The Impact of Formal Education on
Dalit Young Men in North India. Development and Change, 35(5): pp. 963-986.
Jha, Jyotsna and Dhir Jhingran (2005) Elementary Education for the Poorest and Other Deprived Groups,
Manohar Publishers, New Delhi.
Kanbargi, R. (2002) Equity in Education in Karnataka. Bangalore: Education Department, Government of
Karnataka.
Lewin, K.M. (2007) ‘Improving Access, Equity and Transitions in Education: Creating a Research Agenda’.
CREATE Pathways to Access Research Monograph, No 1. Falmer: CREATE and University
of Sussex, [downloaded from http://www.create-rpc.org/pdf_documents/PTA1.pdf, accessed
on 20th
December, 2009].
Nambissan, G.B. and Sedwal, M. (2002) Education for All: The Situation of Dalit Children in India. In
Govinda, R. (ed.) India Education Report: A Profile of Basic Education. New Delhi: Oxford
University Press.
Omvedt, G. (1993) Dalits and the Democratic Revolution: Dr. Ambedkar and the Dalit Movement in Colonial
India. New Delhi: Sage Publications.
Rahul and Subhadra. (2001) Schooling of Tribals in Madhya Pradesh: Problems and Prospects. Journal of
Educational Planning and Administration, XV(1): pp. 85-96.
Reddy, P.S. (2000) District Primary Education Programme in Andhra Pradesh: A Social Assessment Study among the Tribal Groups. Report funded by DPEP, Government of Andhra Pradesh. Tirupati:
Department of Anthropology, Sri Venkateswara University.
Ruhela, S.P. (1998). "Religion, Social Class and Educational Opportunity: Case Studies of Eight Muslim
Girls",Empowerment of the Indian Muslim Women, New Delhi: MD Publications.
Salamatullah (1994). "Education of Muslims in Secular India". Chandigarh: Centre for Research in Rural and
Industrial Development.
Subrahmanian, R. (2005) Education Exclusion and the Development State. In Chopra, R., and Jeffery, P. (eds.),
Educational Regimes in Contemporary India. New Delhi: Sage Publications.
Sujatha, K. (2002) Education among Scheduled Tribes. In Govinda, R. (ed.), India Education Report: A Profile
of Basic Education. New Delhi: Oxford University Press.
Velaskar, P. (2005) Education, Caste, Gender: Dalit Girls’ Access to Schooling in Maharashtra. Journal of Educational Planning and Administration. XIX(4): pp.459-482.
Visaria, Leela and Vimala Ramachandran (2003) “What DPEP and Other Data Sources Reveal” pages 32- 69 in
Ramachandran, Vimala (ed.) (2003) Gender and Social Equity in Primary Education:
Hierarchies of Access, Sage Publications India Pvt. Ltd, New Delhi.
Data Sources
DISE (2008) – District Information System for Education, District Report Cards Vol. I and Vol. II, NUEPA
[from http://www.dise.in/drc.htm, accessed on 20th
December, 2009]
GOI (2001) – Census of India 2001, General Population Tables, Office of the Registrar General, Ministry of
Home Affairs, Government of India [downloaded from the website www.censusindia.net, on
15th January, 2010]
GOI – Selected Educational Statistics, Ministry of Human Resource Development, Government of India,
(Various Years). GOI (2001) – Statistical Abstract, Ministry of Statistics and Programme Implementation, Government of India.
APPENDIX
Zones According to Minority Status
Zone – M1
Per cent of
Minority Zone – M2
Per cent of
Minority Zone – M3
Per cent of
Minority
Murshidabad 63.67 Nadia 25.41 Hugli 15.14
Maldah 49.72 Haora 24.44 Purba Medinipur 12.24
Uttar Dinajpur 47.36 Koch bihar 24.24 Jalpaiguri 10.85
Birbhum 35.08 North 24 parganas 24.22 Paschim Medinipur 8.54
South 24 parganas 33.24 Dakshin Dinajpur 24.02 Puruliya 7.67
Average 45.81 Kolkata 20.27 Bankura 7.51
Barddhaman 19.78 Darjiling 5.31
Average 23.20 Average 9.61
20
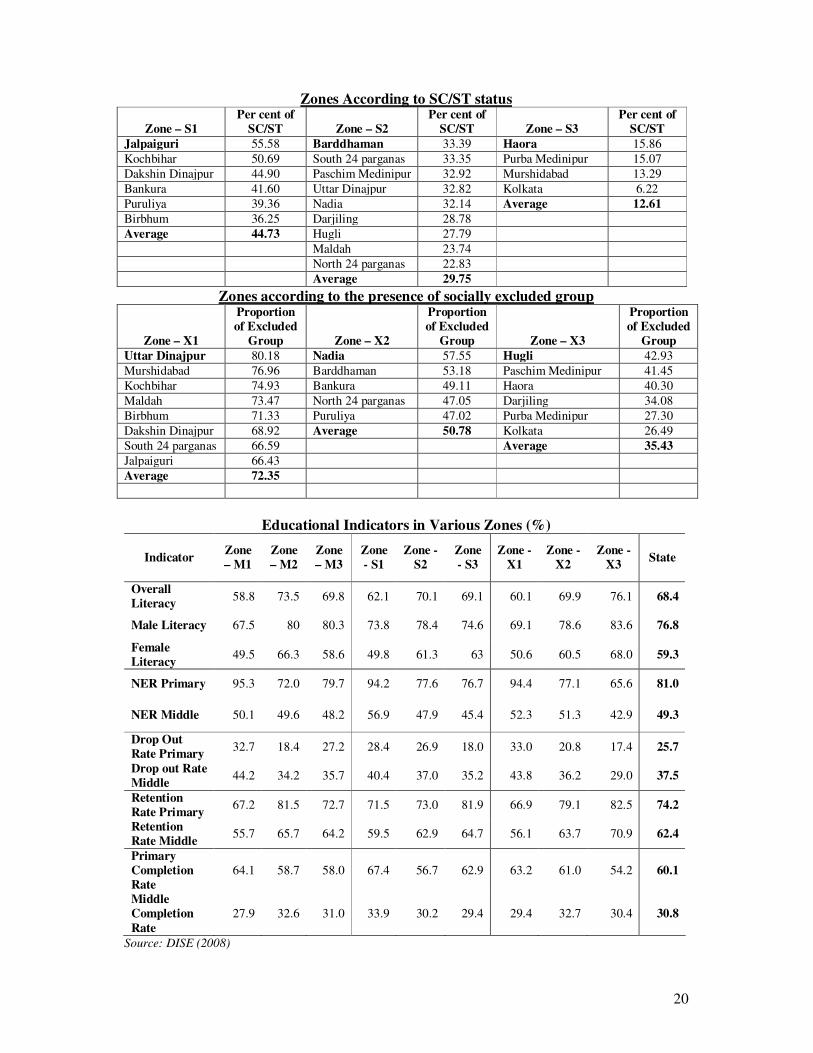
Zones According to SC/ST status
Zone – S1
Per cent of
SC/ST Zone – S2
Per cent of
SC/ST Zone – S3
Per cent of
SC/ST
Jalpaiguri 55.58 Barddhaman 33.39 Haora 15.86
Kochbihar 50.69 South 24 parganas 33.35 Purba Medinipur 15.07
Dakshin Dinajpur 44.90 Paschim Medinipur 32.92 Murshidabad 13.29
Bankura 41.60 Uttar Dinajpur 32.82 Kolkata 6.22
Puruliya 39.36 Nadia 32.14 Average 12.61
Birbhum 36.25 Darjiling 28.78
Average 44.73 Hugli 27.79
Maldah 23.74
North 24 parganas 22.83
Average 29.75
Zones according to the presence of socially excluded group
Zone – X1
Proportion
of Excluded
Group Zone – X2
Proportion
of Excluded
Group Zone – X3
Proportion
of Excluded
Group
Uttar Dinajpur 80.18 Nadia 57.55 Hugli 42.93
Murshidabad 76.96 Barddhaman 53.18 Paschim Medinipur 41.45
Kochbihar 74.93 Bankura 49.11 Haora 40.30
Maldah 73.47 North 24 parganas 47.05 Darjiling 34.08
Birbhum 71.33 Puruliya 47.02 Purba Medinipur 27.30
Dakshin Dinajpur 68.92 Average 50.78 Kolkata 26.49
South 24 parganas 66.59 Average 35.43
Jalpaiguri 66.43
Average 72.35
Educational Indicators in Various Zones (%)
Indicator Zone
– M1
Zone
– M2
Zone
– M3
Zone
- S1
Zone -
S2
Zone
- S3
Zone -
X1
Zone -
X2
Zone -
X3 State
Overall
Literacy 58.8 73.5 69.8 62.1 70.1 69.1 60.1 69.9 76.1 68.4
Male Literacy 67.5 80 80.3 73.8 78.4 74.6 69.1 78.6 83.6 76.8
Female
Literacy 49.5 66.3 58.6 49.8 61.3 63 50.6 60.5 68.0 59.3
NER Primary 95.3 72.0 79.7 94.2 77.6 76.7 94.4 77.1 65.6 81.0
NER Middle 50.1 49.6 48.2 56.9 47.9 45.4 52.3 51.3 42.9 49.3
Drop Out
Rate Primary 32.7 18.4 27.2 28.4 26.9 18.0 33.0 20.8 17.4 25.7
Drop out Rate
Middle 44.2 34.2 35.7 40.4 37.0 35.2 43.8 36.2 29.0 37.5
Retention
Rate Primary 67.2 81.5 72.7 71.5 73.0 81.9 66.9 79.1 82.5 74.2
Retention
Rate Middle 55.7 65.7 64.2 59.5 62.9 64.7 56.1 63.7 70.9 62.4
Primary
Completion
Rate
64.1 58.7 58.0 67.4 56.7 62.9 63.2 61.0 54.2 60.1
Middle
Completion
Rate
27.9 32.6 31.0 33.9 30.2 29.4 29.4 32.7 30.4 30.8
Source: DISE (2008)
Related Documents