This article was downloaded by: [University of the Sunshine Coast] On: 24 February 2015, At: 19:38 Publisher: Taylor & Francis Informa Ltd Registered in England and Wales Registered Number: 1072954 Registered office: Mortimer House, 37-41 Mortimer Street, London W1T 3JH, UK Australasian Journal of Environmental Management Publication details, including instructions for authors and subscription information: http://www.tandfonline.com/loi/tjem20 Socio-economic trends and climate change adaptation: the case of South East Queensland A. Roiko a , R.B. Mangoyana a , S. McFallan b , R.W. (Bill) Carter a , J. Oliver a & T.F. Smith a a Sustainability Research Centre , University of the Sunshine Coast , Maroochydore , DC, Queensland , 4558 b Commonwealth and Industrial Research Organisation (CSIRO), Queensland Bioscience Precinct , University of Queensland , St Lucia , 4067 Published online: 08 Mar 2012. To cite this article: A. Roiko , R.B. Mangoyana , S. McFallan , R.W. (Bill) Carter , J. Oliver & T.F. Smith (2012) Socio-economic trends and climate change adaptation: the case of South East Queensland, Australasian Journal of Environmental Management, 19:1, 35-50, DOI: 10.1080/14486563.2011.646754 To link to this article: http://dx.doi.org/10.1080/14486563.2011.646754 PLEASE SCROLL DOWN FOR ARTICLE Taylor & Francis makes every effort to ensure the accuracy of all the information (the “Content”) contained in the publications on our platform. However, Taylor & Francis, our agents, and our licensors make no representations or warranties whatsoever as to the accuracy, completeness, or suitability for any purpose of the Content. Any opinions and views expressed in this publication are the opinions and views of the authors, and are not the views of or endorsed by Taylor & Francis. The accuracy of the Content should not be relied upon and should be independently verified with primary sources of information. Taylor and Francis shall not be liable for any losses, actions, claims, proceedings, demands, costs, expenses, damages, and other liabilities whatsoever or howsoever caused arising directly or indirectly in connection with, in relation to or arising out of the use of the Content. This article may be used for research, teaching, and private study purposes. Any substantial or systematic reproduction, redistribution, reselling, loan, sub-licensing, systematic supply, or distribution in any form to anyone is expressly forbidden. Terms &

Welcome message from author
This document is posted to help you gain knowledge. Please leave a comment to let me know what you think about it! Share it to your friends and learn new things together.
Transcript

This article was downloaded by: [University of the Sunshine Coast]On: 24 February 2015, At: 19:38Publisher: Taylor & FrancisInforma Ltd Registered in England and Wales Registered Number: 1072954 Registeredoffice: Mortimer House, 37-41 Mortimer Street, London W1T 3JH, UK
Australasian Journal of EnvironmentalManagementPublication details, including instructions for authors andsubscription information:http://www.tandfonline.com/loi/tjem20
Socio-economic trends and climatechange adaptation: the case of SouthEast QueenslandA. Roiko a , R.B. Mangoyana a , S. McFallan b , R.W. (Bill) Carter a ,J. Oliver a & T.F. Smith aa Sustainability Research Centre , University of the SunshineCoast , Maroochydore , DC, Queensland , 4558b Commonwealth and Industrial Research Organisation (CSIRO),Queensland Bioscience Precinct , University of Queensland , StLucia , 4067Published online: 08 Mar 2012.
To cite this article: A. Roiko , R.B. Mangoyana , S. McFallan , R.W. (Bill) Carter , J. Oliver &T.F. Smith (2012) Socio-economic trends and climate change adaptation: the case of SouthEast Queensland, Australasian Journal of Environmental Management, 19:1, 35-50, DOI:10.1080/14486563.2011.646754
To link to this article: http://dx.doi.org/10.1080/14486563.2011.646754
PLEASE SCROLL DOWN FOR ARTICLE
Taylor & Francis makes every effort to ensure the accuracy of all the information (the“Content”) contained in the publications on our platform. However, Taylor & Francis,our agents, and our licensors make no representations or warranties whatsoever as tothe accuracy, completeness, or suitability for any purpose of the Content. Any opinionsand views expressed in this publication are the opinions and views of the authors,and are not the views of or endorsed by Taylor & Francis. The accuracy of the Contentshould not be relied upon and should be independently verified with primary sourcesof information. Taylor and Francis shall not be liable for any losses, actions, claims,proceedings, demands, costs, expenses, damages, and other liabilities whatsoeveror howsoever caused arising directly or indirectly in connection with, in relation to orarising out of the use of the Content.
This article may be used for research, teaching, and private study purposes. Anysubstantial or systematic reproduction, redistribution, reselling, loan, sub-licensing,systematic supply, or distribution in any form to anyone is expressly forbidden. Terms &

Conditions of access and use can be found at http://www.tandfonline.com/page/terms-and-conditions
Dow
nloa
ded
by [
Uni
vers
ity o
f th
e Su
nshi
ne C
oast
] at
19:
38 2
4 Fe
brua
ry 2
015

Socio-economic trends and climate change adaptation: the case ofSouth East Queensland
A. Roikoa, R.B. Mangoyanaa*, S. McFallanb, R.W. (Bill) Cartera, J. Olivera and
T.F. Smitha
aSustainability Research Centre, University of the Sunshine Coast, Maroochydore DC,Queensland, 4558; bCommonwealth and Industrial Research Organisation (CSIRO),Queensland Bioscience Precinct, University of Queensland, St Lucia, 4067
The effectiveness of climate change responses is influenced by the adaptivecapacity of communities within regions over spatial and temporal scales. Whileclimate change projections are commonly used to set policy and managementresponses, they are not always coupled with socio-economic projections over thesame time periods. This article explores the interplay between socio-economiccharacteristics and their potential implications for regional vulnerability andadaptive capacity. Population growth presents one of the biggest challenges forthe South East Queensland region (SEQ) of Australia. Indigenous people, theaged, lone person households and single parent families show marked increasesrelative to other population segments. The literature suggests that these groupsare more vulnerable to the risks associated with climate change. Populationgrowth will not only increase the number of vulnerable groups, but also thedemand for land, goods and services, including energy, infrastructure andecosystem services. However, such data need to be integrated with context-specific data to account for spatial and temporal variations (or differences) in theadaptive capacity of communities.
Keywords: demography; adaptive capacity; community; context-specific data;population projections
The global climate system is changing faster than previously thought (IPCC 2007;
Poruschi et al. 2010). This is reflected in the accelerated increase in the concentration
of CO2 in the atmosphere, increasing global ocean temperatures and sea-level rises,
and loss of Arctic sea ice (Steffen 2009). South East Queensland (SEQ) will not be
spared from these changes. In northern Australia, tropical cyclones, thunderstorms
and hail events are projected to increase in intensity (CSIRO & BOM 2007). Average
annual temperatures in SEQ are predicted to increase by 0.7 to 1.48C by 2030, and
sea-levels to rise up to 79 cm by 2100 (CSIRO & BOM 2007). Negative impacts are
likely to include increased risks of heat related illnesses and death, coastal erosion
and inundation damage, damage to buildings and infrastructure, and constrained
water supplies. However, uncertainties still surround the rates and magnitudes of
major processes that drive change and impacts on human systems, hence the
predictability of impacts is constrained.
*Corresponding author. Email: [email protected]
Australasian Journal of Environmental Management
Vol. 19, No. 1, March 2012, 35�50
ISSN 1448-6563 print/ISSN 2159-5356 online
# 2012 Environment Institute of Australia and New Zealand Inc.
http://dx.doi.org/10.1080/14486563.2011.646754
http://www.tandfonline.com
Dow
nloa
ded
by [
Uni
vers
ity o
f th
e Su
nshi
ne C
oast
] at
19:
38 2
4 Fe
brua
ry 2
015

The success of climate change adaptation strategies depends largely on social
processes. For example, the concept of adaptive capacity has emerged as a key
consideration in the determination of vulnerability to climate change (Adger et al.
2007). As the world becomes more threatened by climate change related impacts, the
influence of socio-economic factors on a community’s adaptive capacity is receiving
greater attention (Daffara et al. 2009; Smith et al. 2010). It is widely held that community
sensitivity, vulnerability and the ability to adapt to change are influenced by theinteraction of cultural, social, institutional and economic factors, in addition to climate-
related risks (Smith et al. 2000). This interaction accounts for the temporal and spatial
variation of adaptive capacity between communities. For example, Adger (2003, p. 400)
argued that, ‘the nature of adaptive capacity is such that it has culture and place-specific
characteristics that can be identified only through culture and place-specific research’.
At an individual level, awareness of consequences and risks perceived to be
associated with climate change influence the attitudes and motivations of individuals
to take adaptive actions (Grothmann & Patt 2005; Hansla et al. 2006). However, risk
perception is influenced by a multitude of factors including the nature of the risk,
whether a choice has been made to accept the risk, access to and validity of
information, and how risks are communicated. In some cases, a manifestation of the
risk is needed before it is perceived as real. People appraise risk against the value
placed on personal assets exposed to climate change threats. Therefore, high-risk
perception is believed to provide motivation to adapt (Grothmann & Patt 2005).
However, response efficacy (beliefs about whether the coping response will beeffective), self-efficacy (beliefs about one’s ability to respond) and response costs may
limit actual adaptation (Milne et al. 2000). These factors are closely linked to the role
social capital plays in building adaptive capacity. Understanding the influence of
these factors within a particular region requires in-depth evaluation involving
community surveys to identify climate information sources, their accessibility and
relevance, and behavioural changes planned or taken in response to perceived risks.
Social cohesion and collective action have been identified as important determi-
nants of community adaptive capacity (Armitage 2005). A socially cohesive society is
more likely to have social networks that enhance communication of risks (and benefits)
of climate change, more volunteers who can support more vulnerable groups (such as
the aged) and a more consensus-oriented society in which collective interests are more
valued than individual interests (Yohe & Tol 2002; Adger 2003). However, while social
cohesion can provide a platform for improved adaptive capacity, it may limit it where
norms and values do not support more permanent adjustments to climate change
threats (Grothmann & Patt 2005). Again, these factors require context-specific data
and analysis to understand their influence in a particular region.The capacity of institutions (structures, policies, rules and regulations that shape
individual and collective behaviour) affects the degree to which a community engages
in practices that will reduce its exposure and improve its adaptive capacity.
Institutions are often judged by their ability to provide space for planned and
innovative autonomous actions, learning capacity, resources for action and fair
systems of governance (Adger 2003). Fair systems of governance encompass equity,
legitimacy and economic efficiency based on context-specific norms and values that
affect decision-making processes (Adger et al. 2005). Decisions to adapt to climate
change are made within a nested hierarchical context involving individuals, families,
neighbourhoods, firms and government at all levels (Adger et al. 2005). Adaptation
36 A. Roiko et al.
Dow
nloa
ded
by [
Uni
vers
ity o
f th
e Su
nshi
ne C
oast
] at
19:
38 2
4 Fe
brua
ry 2
015

decisions include creating policies and regulations to build adaptive capacity and
actions to affect improved adaptive capacity. These decisions need to be integrated
across sectors. Broad stakeholder and community consultation in reviewing and
recommending such policies is required to enhance adaptive capacity.Earlier approaches for evaluating the role of socio-economic characteristics in
community vulnerabilities and exposure to climate change impacts have projected
impacts on a static society (Berkhout et al. 2002; van Drunen & Berkhout 2009). The
inherent assumptions in these studies is that the future vulnerability of a community
to climate change related impacts can be explained by understanding current
vulnerabilities and that current trends will continue. These assumptions limit the
usefulness of such studies because they ignore the different contexts in which human
development and climate hazards occur, and that trends may change. Socio-economic characteristics are dynamic and future climates cannot be predicted with
certainty (Berkhout & Hertin 2000; van Drunen & Berkhout 2009). Scenarios about
possible futures through participatory approaches have been recommended to
account for the dynamic nature of adaptive capacity (e.g. Berkhout & Hertin
2000; Malone et al. 2004). This would provide a platform for reflexivity in
understanding the future.
Literature on adaptive capacity acknowledges the importance of both generic
and context-specific determinants (Daffara et al. 2009). While generic determinantsprovide only part of the knowledge needed to inform adaptation strategies, they do
provide an essential foundation for a more comprehensive analysis of adaptive
capacity. These reflections form the context for this paper, which draws on an
evaluation of both historical and projected socio-economic trends for SEQ and their
likely implications for the adaptive capacity of communities in the region. The study
was a first step to stimulate and guide further research and debate on the interplay of
drivers of socio-economic change and its implications for regional adaptive capacity
in SEQ.
Methods
This article reports a desk-top assessment of socio-economic and demographic
variables using both historical data and projected trends for SEQ. An initial set of
variables was selected based on literature that identifies factors that might influence
the sensitivity and capacity of communities to adapt to climate change impacts
(Figure 1). In addition to journal articles, government policy and planningdocuments were included in the review to produce a preliminary list of determinants.
These were then considered by climate change specialists associated with the SEQ-
CARI project (see Acknowledgements) at several stages of the research process (e.g.
variable selection, data sourcing, model selection, modelling and data interpreta-
tion). A sub-set of variables was then selected for further analysis based on data
availability.
The data were sourced primarily from the 1996, 2001 and 2006 censuses
conducted by the Australian Bureau of Statistics (ABS). Additional data, importantfor determining adaptive capacity, were sourced from government reports and
research agencies (e.g. statistical summaries). For the purpose of this article, ABS
data representing a wide range of socio-economic and demographic variables were
summarised to show trends between 1996 and 2006. All ABS census data were based
Australasian Journal of Environmental Management 37
Dow
nloa
ded
by [
Uni
vers
ity o
f th
e Su
nshi
ne C
oast
] at
19:
38 2
4 Fe
brua
ry 2
015

on place of enumeration, based on where people slept on census night rather than
where they normally reside. This introduced an unavoidable, systemic source of error.
Other sources of error include partial responses (when some people do not answer all
the questions on the census form), family representatives responding on behalf of
other family members and ABS processing errors (ABS 2007). However, these are
unlikely to alter the trends and, therefore, their relevance.
Population projections align, where possible, to climate scenario timelines widely
used by government agencies (e.g. 2030, 2050 and 2070). These are consistent with
the planning horizon of 2031 in the SEQ regional plan. Queensland’s Planning
Information and Forecasting Unit (PIFU) generated these projections using the
models developed through the Office of Economic and Statistical Research (OESR).
The base year for the projections was 2006, the most recent census date, and the
models project in annual steps. Projections are updated twice every five years to
account for background data updates. Commonly, three series are generated (low,
medium and high), with the medium series usually presented. Projections are
produced for a 50-year period at the state level and for a 25-year period at the local
government area (LGA) level. The population models have four main components:
growth; fertility; mortality; and net interstate and overseas migration. The models
incorporate three separate methodologies to generate projections. The first is a ratio
share method, used to project total persons for each LGA. Then a multi-region
Demographic factors
Population change (historical and projected)
Population distribution
Age profiles
Ethnic groups (size and distribution)
Education (enrolment in primary,secondary and tertiary,qualifications by industry)
Household structure/ composition (one parent, two parent, lone households)
Housing (affordability, ownership,types)
Economic factors
Income/financial status
Employment
Infrastructure development
Vulnerable groups
Aged
Children
Indigenous groups
Single parents
Lone persons
Coastal zones inhabitants
Illiterate
Unemployed
Low income earners
Socio-cultural factors
Values, beliefs, norms
Risk perception
Self efficacy
Social capital
Consequences
Increased demand for resources(energy, land for agriculture and
buildings, infrastructure).
Pressure on ecosystems
Constrained access to services
Climate change symptoms(including frequency and magnitude of
climate change related disasters)
Figure 1. Socio-economic determinants and implications of climate change impacts.
38 A. Roiko et al.
Dow
nloa
ded
by [
Uni
vers
ity o
f th
e Su
nshi
ne C
oast
] at
19:
38 2
4 Fe
brua
ry 2
015

cohort component model is applied to produce projections by age and gender, while
modifying the ratio share method projections to improve consistency. Finally, a
housing unit model is used to incorporate land supply constraints within the
projections. The models used include POPSTAR and SEQHUM models developedby the Queensland Centre for Population Research (University of Queensland 2011).
The ratio share method involved estimating each LGA’s future population based on
its past share of the statistical district (SD) population and its past share of the
growth. The multi-region cohort component model used updated parameters on
fertility, including age-specific fertility trends, mortality, and both internal and
overseas migration.
Findings
SEQ is the region with the fastest growing population in Australia (Department of
Infrastructure and Planning 2008a). Queensland’s population represents approxi-
mately 20 per cent of Australia’s population and its average growth, at 10.7 per cent
over the period 2001 to 2006, was higher than the national average. More than three-
quarters of this growth occurred in SEQ. In 2006, the region’s population was
2,742,037, a 12.4 per cent increase from 2001, and was approximately two-thirds
(67.8 per cent) of the total Queensland population. In 2006, 20 per cent of the SEQpopulation was composed of children (B15 years old), 14.2 per cent young people
(15�24), 28.3 per cent young workers (25�44) and 24.7 per cent represented older
workers (45�64). Those aged 65 and over made up the balance of 12.9 per cent. This
group also showed the fastest growth between 2001 and 2006 (18 per cent) compared
with those in the age groups of 0�14 and 15�64 (8.2 per cent, and14.2 per cent
respectively). Life expectancy is projected to increase by ten and seven years for
males and females respectively by 2050.
While people of Aboriginal or Torres Strait Islander origin accounted for only 1.6per cent (45,494) of the total SEQ population at the time of 2006 census, this
represents an 18 per cent increase since 2001. The majority (62 per cent) resided in
the four SEQ LGAs of Brisbane, Gold Coast, Ipswich and Logan. Indigenous
populations are often over-represented in low socio-economic groups due to high
unemployment (e.g. unemployment rate of over 15 per cent for indigenous persons
compared to less than 5 per cent for non-indigenous in 2006, and lower education
groups (Queensland Government 2006a, 2006b; Queensland Health 2005)). Low
socio-economic status is associated with low adaptive capacity (Adger 2003).From the 2006 census, the population of SEQ was located predominantly in
urban areas and concentrated along the coast. The two largest population centres of
Brisbane (35 per cent) and Gold Coast (18 per cent) accounted for just over one-half
of the region’s population. All the LGAs experienced population growth between
2001 and 2006, ranging from the lowest of 3.9 per cent in Gatton to the highest of
35.5 per cent in Caloundra. Kilcoy and Crows Nest were among the least populated
areas, with a population density of only two and three persons per square kilometre
respectively. The highest population density was recorded in Redcliffe at 1,234persons/sq km. The largest population centres of Brisbane and Gold Coast had
population densities of 724 and 350 persons/sq km, respectively.
Projected population changes are expected to continue (Office of Economic and
Statistical Research 2009a). The population for Queensland in 2056 is projected to
Australasian Journal of Environmental Management 39
Dow
nloa
ded
by [
Uni
vers
ity o
f th
e Su
nshi
ne C
oast
] at
19:
38 2
4 Fe
brua
ry 2
015

increase in the order of 50 per cent, with the low series projection being 6.7 million and
the high series, 10 million people (Figure 2). Births are expected to remain the greatest
contributor, with interstate migration declining and overseas migration becoming a
greater contributor after 2026. Migration is currently, and will remain, the major
contributor to growth for some LGAs, including the Gold Coast (overseas) and
Sunshine Coast (internal). This projected total for SEQ represents 70.6 per cent of the
total projected population for Queensland of 6,273,885; and an increase of 1.5 per cent.
The SEQ region will see a significant ageing of the population with upwards of 20 per
cent of the population expected to be over 65 by 2031, compared with the current
average of 13 per cent. The current and projected population structure reflects an
ageing population, which is likely to add to the number of people potentially vulnerable
to climate change. The expected population ranges for Queensland to 2056 indicate a
difference in the projected populations in 2056 in the order of 50 per cent, with the low
series projected to be 6.7 million and the high series projected to be 10 million people
(Figure 2) (also see Office of Economic and Statistical Research Queensland Treasury
2009, 2011 for further details).
Household structure
At the time of the 2006 census, there were 113,358 one-parent households (10.8 per
cent) in SEQ, an increase of 35 per cent from 1996. Lone person households had also
increased by 29 per cent since 1996, to 221,202. By comparison, couples with children
and couples with no children households increased by 15 per cent and 33 per cent
respectively over the ten years. Despite these trends, the average household size has
varied little throughout this period and is similar for SEQ and Queensland as a
whole. Queensland Health (2005) estimated that 29 per cent of people aged 65 years
Figure 2. Population projections Queensland to 2056 (high-low series). Source: Queensland
Government 2008.
40 A. Roiko et al.
Dow
nloa
ded
by [
Uni
vers
ity o
f th
e Su
nshi
ne C
oast
] at
19:
38 2
4 Fe
brua
ry 2
015

and over in SEQ were in lone person households with 6 per cent in care
accommodation. With regard to spatial distribution of lone person households,
areas such as the Sunshine Coast, Gold Coast, Redcliffe, Brisbane, Caboolture and
Toowoomba are reported as highly represented.These trends are expected to continue as the population ages and families
continue to restructure (Queensland Health 2005). Projections show a doubling of
lone person households and an increase of at least 60 per cent in one-parent family
households across the region. By 2031, all the areas in SEQ are likely to experience a
significant increase in their relative proportion of persons over 65 and over. This
particularly applies to the coastal communities of Redland, Moreton Bay and
Sunshine Coast. Correspondingly, the relative proportion in all other age groups is
likely to fall below 2006 levels.The average household size is likely to reduce from 2.58 persons to 2.42 persons
for Queensland, and from 2.63 persons to 2.46 persons in Brisbane SD (Cooper
2008). The Gold Coast is expected to see a fall from 2.43 persons to 2.36 persons,
while the Sunshine Coast SD is expected to see a fall from 2.45 persons to 2.38
persons. Due to the ageing population and societal change, the Queensland
household structure is expected to see three out of every five households having
only one or two persons living in them in 20 years time (Taylor & Robinson 2007).
Housing type, tenure and projected demand
The majority of couple families (couples with or without children) are living in
separate (detached) houses, while most lone persons are living in lower priced types
of housing, which include units, flats, apartments, row or terrace houses, caravans,cabins and houseboats. SEQ is showing an increasing number of people working
towards fully owning their houses (Figure 3). While the proportion of dwellings fully
owned dropped by 8.7 per cent in 2006 compared to 2001, the number of people
Figure 3. Trends in housing type by family structure in SEQ (1996, 2001 and 2006). Source:
ABS (no date).
Australasian Journal of Environmental Management 41
Dow
nloa
ded
by [
Uni
vers
ity o
f th
e Su
nshi
ne C
oast
] at
19:
38 2
4 Fe
brua
ry 2
015
working towards owning their own dwellings increased by 25.9 per cent in the same
period. The higher the proportion of dwellings that are fully paid off, the better the
tenure security. There was a slight decline in the number of fully owned dwellings
between 2001 and 2006 (Figure 3).
Population growth generates demand for housing. Ipswich stands out with an
expected 225 per cent increase followed by the neighbouring Scenic Rim LGA, with
an expected increase of 110 per cent. Brisbane and Redlands have the lowest
projected growth in dwellings, reflecting urban footprint constraints. Increased
housing demand means more energy required for construction and use during the life
of these new dwellings, which increases greenhouse gas emissions, exacerbating the
problem of climate change. However, the need for new dwellings will provide an
opportunity for the development of energy-efficient infrastructure.
Education, employment and income
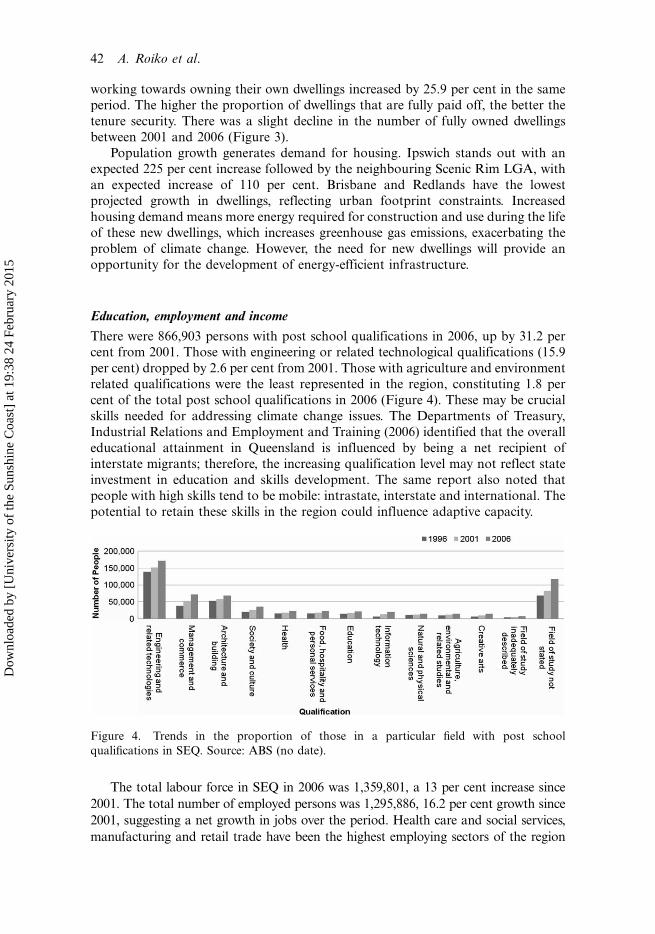
There were 866,903 persons with post school qualifications in 2006, up by 31.2 per
cent from 2001. Those with engineering or related technological qualifications (15.9
per cent) dropped by 2.6 per cent from 2001. Those with agriculture and environment
related qualifications were the least represented in the region, constituting 1.8 per
cent of the total post school qualifications in 2006 (Figure 4). These may be crucial
skills needed for addressing climate change issues. The Departments of Treasury,
Industrial Relations and Employment and Training (2006) identified that the overall
educational attainment in Queensland is influenced by being a net recipient of
interstate migrants; therefore, the increasing qualification level may not reflect state
investment in education and skills development. The same report also noted that
people with high skills tend to be mobile: intrastate, interstate and international. The
potential to retain these skills in the region could influence adaptive capacity.
The total labour force in SEQ in 2006 was 1,359,801, a 13 per cent increase since
2001. The total number of employed persons was 1,295,886, 16.2 per cent growth since
2001, suggesting a net growth in jobs over the period. Health care and social services,
manufacturing and retail trade have been the highest employing sectors of the region
Figure 4. Trends in the proportion of those in a particular field with post school
qualifications in SEQ. Source: ABS (no date).
42 A. Roiko et al.
Dow
nloa
ded
by [
Uni
vers
ity o
f th
e Su
nshi
ne C
oast
] at
19:
38 2
4 Fe
brua
ry 2
015

since 1996 (Figure 5). The number of people employed has been growing across all
household structure types: a positive development for the region. Volatility in these
statistics warrants further investigation; however, since 2001, SEQ has enjoyed a 24 per
cent drop in unemployed couple families with children and 22 per cent of one-parent
families. However, Queensland Health (2005) reported loss of occupation, limited
employment and loss of access to services for people living in rural areas. Loss of
employment and related income increases vulnerability to climate change as commu-
nities lack financial capacity to meet response cost (Adger et al. 2004). However, the
ultimate effect of this limitation will depend on the institutional response capacity and
social support systems. This highlights the need to explore further SEQ regional
response capacity and its current and future social support burden.
Technicians, trade workers and professionals have been growing at an increasing
rate, but with declining enrolment in tertiary training areas of technology and
engineering, environment, agriculture and social studies. The effects of these changesrequire further exploration to understand the potential extent to which loss of these
skills impacts adaptive capacity of the region.
Income
Median individual and family incomes in SEQ grew steadily between 2001 and 2006,
by 30.4 per cent and 26.3 per cent respectively (Table 1). This growth has been slower
than the growth in median rent (43.8 per cent) and housing loan repayment (53 percent) for the same period, introducing housing stress to some households. SEQ has
experienced higher growth in median rents than Queensland as a whole, and this may
be attributable to the contraction of the population towards SEQ. Queensland Health
(2005) reported that concentrations of wealth exist in the inner city areas of Brisbane,
Retail trade
0 2 4 6 8 10 12
ManufacturingHealth care & social assistance
Education & trainingAccommodation & food services
ConstructionProfessional, scientific & technical…
Public administration & safetyWholesale trade
Transport, postal & warehousingOther services
Administrative & support servicesFinancial & insurance services
Rental, hiring & real estate servicesInformation media & …
Agriculture, forestry & fishingArts & recreation services
Electricity, gas, water & waste …Mining
Inadequately described/Not stated
Per cent of employment by Industry
1996
2001
2006
Ind
ust
ry
Figure 5. Trends in employment by post school qualifications in SEQ (1996�2006). Source:
ABS (no date).
Australasian Journal of Environmental Management 43
Dow
nloa
ded
by [
Uni
vers
ity o
f th
e Su
nshi
ne C
oast
] at
19:
38 2
4 Fe
brua
ry 2
015

the Gold Coast and along the Noosa coastline, while low income earners are dispersed
in the outer metropolitan, northern coastal and rural areas. The same report also
indicated that inner city areas contain higher income single-person and couple
households with no children, while middle, outer and newly developing suburbs are
composed of low-income individuals and families with children (including 12�20 year
olds). Another trend noted by Queensland Health (2005) is a dominance of low-
income households on the Sunshine Coast, in contrast with the Gold Coast, where
low-income households only occur in concentrated pockets. These pockets of low
income are likely to be more vulnerable to the impacts of climate change.
In 2006, seven of SEQ’s 21 LGAs featured in the top ten ranking of the leastdisadvantaged areas of Queensland and four are in the top five based on the ABS
socio-economic indexes for areas (SEIFA) (ABS 2006). Brisbane is the least
disadvantaged LGA in the state. None of the SEQ LGAs was in the bottom ten
of the disadvantaged LGAs of Queensland. In relation to the distribution of
disadvantage, Queensland Health (2005) noted that there are particular ‘hot spots’ of
disadvantage with high levels of need. These include Central Logan (Woodridge),
Western/Eastern Gateway, Esk, Laidley, Caloundra (urban rural fringe areas and
southern suburbs), Caboolture (urban rural fringe areas), Northern area ofToowoomba and the north-eastern suburbs of Brisbane.
No specific projections on the degrees of disadvantage were sourced for the
region. However, an indicator of disadvantage was available for the Gold Coast
LGA. The projected Centrelink payments for the Gold Coast reflect the projection of
higher populations in the older age groups. While these figures cannot be generalised
across the region, they illustrate one type of flow-on that can be expected under
projected population structures.
Discussion
Social implications of climate change in SEQ
The increasing concentration of the SEQ population in coastal areas is likely to
increase per capita adaptation costs due to the increased frequency of, and exposure
Table 1. Trends in median income, rent and loan repayments in SEQ (1996�2009)
SEQ Region Queensland
Income and living
costs 1996 2001 2006
Change
2001�2006 (%) 1996 2001 2006
Change
2001�2006 (%)
Median individual
income ($/weekly)
264 332 433 30.4% 286 359 474 32.0%
Median family
income ($/weekly)
722 906 1,229 35.7% 702 871 1,154 32.5%
Median housing
loan repayment
843 903 1,382 53.0% 800 867 1,300 37.7%
Median rent
($/weekly)
142 160 230 43.8% 125 145 200 49.9%
Source: ABS (no date)
44 A. Roiko et al.
Dow
nloa
ded
by [
Uni
vers
ity o
f th
e Su
nshi
ne C
oast
] at
19:
38 2
4 Fe
brua
ry 2
015

to, hazards associated with climate change (e.g. storm surges and coastal flooding).
For example, in Queensland during 2008, heavy rainfall events flooded an area of
about one million square kilometres resulting in infrastructure damages amounting
to $234 million (Queensland Government 2009). In Mackay alone, schools and the
Mackay airport were shut, about 4000 homes were damaged, and more than 6000
homes lost services such as power and telephone communications (Apan et al. 2010).
As a result, assistance worth over $4 million was provided to almost 7000 familiesthrough the Natural Disaster Relief and Recovery Arrangements (NDRRA) grants,
and a further 410 million was paid out in insurance claims (Apan et al. 2010; Melanie
et al. 2011). More recently, in the 2011 SEQ floods, it is estimated that the total cost
of infrastructure repair will be $440 million for Brisbane alone, with road repair
accounting for about 31 per cent of the total costs (ABC 2011).
In the absence of strong policy to restrict development in vulnerable coastal areas,
costs associated with adaptation (e.g. reversing development approval decisions,
evacuations, insurance claims) are likely to be high. This may reduce adaptive
capacity, subject to the interplay of costs of adaptation and factors such as
availability and access to financial resources, age of residents, types of housing,
level of access to infrastructure and services, levels of social cohesion and the
anticipatory response capacity of institutions.
An increase in life expectancy, the general increase in the number of older people
(65 and over) in the population and their increasing concentration in coastal areas islikely to increase the proportion of people vulnerable to the impacts of climate
change. Older people are disproportionately vulnerable to natural disasters due to
factors including their natural physiological susceptibility, high likelihood of limited
social networks and low economic status. For example, Knowlton et al. (2009)
showed that during the 2006 California heat wave older people and young children
were more likely to be affected, and Hyer et al. (2006) reported that 74 per cent of
hurricane Katrina related deaths were in the 60 and over age group, while people
aged 75 and over constituted 50 per cent of deaths.
The vulnerability of the aged in the SEQ region is affected by income. The elderly
in low-income groups would have limited capacity to cover response costs. However,
previous experiences, knowledge and availability of volunteers could be mitigating
factors. These issues require further exploration in primary evaluations and may be
an area for attention to support other endeavours to minimise the vulnerability of
this group. The increasing number of lone and one-parent households raises
important issues with regard to vulnerability. Lone person households, pensioners,
one-parent families and minority groups are often considered to have low adaptivecapacity due to their lower economic status and the stress of providing for, and
ensuring the upkeep of, their family.
Compared with couple households, one-parent families have low equivalised
household incomes (income normalised to number of persons per household), low
rates of home ownership, low labour force participation and employment, and higher
incidences of financial stress (ABS 2007). Availability and access to financial
resources enhances adaptive capacity by enabling individuals to meet the costs of
adaptation (Adger 2003; Adger et al. 2004; Adger et al. 2005). There is therefore need
for an SEQ case-specific exploration of these issues through primary social surveys.
These would provide an indication of both individual and community-level
adaptation capacity.
Australasian Journal of Environmental Management 45
Dow
nloa
ded
by [
Uni
vers
ity o
f th
e Su
nshi
ne C
oast
] at
19:
38 2
4 Fe
brua
ry 2
015

Having an adequate and appropriate place to live is fundamental to socio-
economic well-being and, consequently, a capacity to adapt to climate change
(Australian Human Rights Commission 2008). Different housing types are
susceptible to different climate change related impacts. Most people in the regionlive in flats, units, apartments and separate houses which are more secure than, for
example, caravans and cabins. Of concern is the increasing number of people living in
insecure accommodation. Housing plans need to prioritise vulnerable groups,
including low-income indigenous people.
Many housing characteristics, which include those that affect dwelling size and
the number of people accommodated, cost, and security of tenure, are key influences
on human well-being and on ability and willingness to undertake measures to adapt
to climate change. Those renting properties may not have the freedom to modifyrented accommodation to adapt to climate change.
Education level alone does not determine adaptive capacity of individuals.
However, its interplay with other factors, such as employment, income, response
costs and psychological determinants (e.g. understanding and interpretation of
climate change risks, response effectiveness beliefs about whether the recommended
coping response will be effectual in coping with the threat, and self-efficacy) can
determine adaptive capacity.
Population growth presents one of the biggest challenges for the SEQ region.Indigenous people, lone households, single parent families and people over the age 65
are projected to increase. These groups are often at risk of socio-cultural, financial
and location disadvantage, and low health status. Population growth will not only
increase the number of vulnerable groups but also increase demand for land, goods
and services including transport, energy, infrastructure and ecosystem services.
Environmental implications of climate and demographic change
Historically, SEQ has already experienced intertidal and coastal habitat losses and
modifications to accommodate human activities. For example, by 1989, in less than
20 years, half of the melaleuca wetlands had been cleared to make way for
urbanisation, and an estimated 2400 hectares of mangrove wetland habitat suffered
the same fate between 1974 and 1998 (Queensland Government 2006a). Without
increased consideration of the sustainability of remnant vegetation in urban
planning, population increase is likely to result in habitat loss directly and indirectly.
It has been predicted that by 2026, urbanisation alone will demand an additional13 per cent of the current undeveloped land, which is likely to place increased
pressure on remnant vegetation (only 26 per cent remains now) and biodiversity
habitat (Department of Infrastructure and Planning 2008b, 2009). Increased
population will not only demand additional land for housing and other infra-
structure development, but also exacerbate pressure on natural resources through
waste discharges, especially on fresh and saltwater systems.
These changes, with associated human activities, are likely to reduce the resilience
of natural ecosystems and, therefore, their ability to adapt to climate change relatedhazards, and their capacity to support humans and the region’s economy in the
longer term. This highlights the need to consider the resilience of ecosystems at
broader scales, in particular coastal systems, where populations are increasingly
concentrating, and to map strategies to manage and nurture their adaptive capacity.
46 A. Roiko et al.
Dow
nloa
ded
by [
Uni
vers
ity o
f th
e Su
nshi
ne C
oast
] at
19:
38 2
4 Fe
brua
ry 2
015

The degree of disadvantage of the residents can be associated with consumer
behaviours which, in turn, can influence the demand for ecosystem services. The
average ecological footprint for the SEQ population for the year 2003�04 was
7.27 global hectares (gha) per person, implying considerably more extraction ofresources than the average global citizen (which is 2.2gha per person) and far more
than what can be sustained (1gha per person) (Department of Infrastructure and
Planning 2008a). This highlights the need for further exploration of the impacts of
increased demand for goods and services and how this might enhance or harm the
adaptive capacity of ecosystems and, ultimately, of humans who depend on them.
Energy implications of climate and demographic change
The global trend of increased use of energy will, with current technologies, increase
greenhouse gas emissions intensifying climate change and the occurrences and
severity of climate change related hazards. This will increase per capita greenhouse
gas emissions and will exacerbate a range of climate change related problems. The
resultant increased exposure of the region may weaken human and ecosystem
capacity to adapt. The growing SEQ population, age structure and urbanisation are
likely to increase energy demand, particularly through development of infrastructure,
cooling and domestic appliance use. The increasing numbers of individuals in the 65and over category, with the expected increases in temperatures, is likely to drive
health-based summer cooling energy consumption, as well as cooling being required
for longer periods of the year. In addition, the increasing lone and single parent
household is likely to increase per capita energy consumption due to the reduction in
shared household appliances. Individuals from such households may not have the
financial capacity to increase their cooling energy consumption, which may place
them at greater risk of heat-related health conditions.
Land use implications on climate and demographic change
The urban sprawl, resulting from population growth, is likely, if not managed, to
increase conflict with agricultural production and increase the alienation of good
agricultural land required to meet the demand for agricultural and forestry products.
The loss of agricultural land close to urban areas could have negative consequences
for climate change, such as increased emissions, because of greater transportation
distances to markets. Land use changes result in complex interactions involvingsurface albedo, carbon cycles and other factors that may increase regional warming
of the environment, and hence increase exposure of environmental and human
systems to climate change hazards (Virginia 1997).
Conclusions
Historical and projected socio-economic trends provide an important platform for
understanding socio-economic change and its implications for climate changeadaptation. This article has illustrated the use and limitations of routinely collected,
aggregate data, such as population and income statistics and trends, to characterise
adaptive capacity. While these data are useful in identifying issues of concern and
‘geographic hot-spots’, they need to be integrated with more context-specific data at
Australasian Journal of Environmental Management 47
Dow
nloa
ded
by [
Uni
vers
ity o
f th
e Su
nshi
ne C
oast
] at
19:
38 2
4 Fe
brua
ry 2
015

a community level to account for spatial and temporal variations (or differences) in
the adaptive capacity of communities.Understanding the historical and socio-economic changes and the interaction
between the various determinants of adaptive capacity alone will not account for the
dynamic nature of adaptive capacity. Adaptive capacity is in a constantly shifting
equilibrium and is best understood by developing scenarios of possible futures to
which communities of place, practice and influence might respond. This will need to
involve key sector-based stakeholders and the wider community, including (those
advocating for) the most vulnerable. The desired outcome of such scenario modelling
would be the formulation and implementation of policies, strategies, measures and
monitoring systems that provide feedback on the emerging trends and the
opportunity to direct this equilibrium into a desired state.
Acknowledgments
This research is part of the South East Queensland Climate Adaptation Research Initiative(SEQ-CARI), a partnership between the Queensland and Australian Governments, theCSIRO Climate Adaptation National Research Flagship, Griffith University, University of theSunshine Coast and University of Queensland. The Initiative aims to provide researchknowledge to enable the region to adapt and prepare for the impacts of climate change.
References
Adger, WN 2003, ‘Social capital, collective action, and adaptation to climate change’,Economic Geography, vol. 79, no. 4, pp. 387�404.
Adger, WN, Arnell, NW & Tompkins, EL 2005, ‘Successful adaptation to climate changeacross scales’, Global Environmental Change � Human and Policy Dimensions, vol. 15,no. 2, pp. 77�86.
Adger, WN, Agrawala, S, Mirza, MMQ, Conde, C, O’Brien, K, Pulhin, J, Pulwarty, R, Smit, B& Takahashi, K (eds.) 2007, ‘Assessment of adaptation practices, options, constraints andcapacity’, in: Climate change 2007: impacts, adaptation and vulnerability. Contribution ofWorking Group II to the Fourth Assessment Report of the Intergovernmental Panel onClimate Change, Cambridge University Press, Cambridge, UK.
Adger, WN, Brooks, N, Bentham, G, Agnew, M & Eriksen, S 2004, New indicators ofvulnerability and adaptive capacity: Technical Report 7, Tyndall Centre for Climate ChangeResearch, Norwich.
Apan, A, Keogh, DU, King, D, Thomas, M, Mushtaq, S & Baddiley, P 2010, The 2008 floodsin Queensland: a case study of vulnerability, resilience and adaptive capacity, report for theNational Climate Change Adaptation Research Facility, Gold Coast.
Armitage, D 2005, ‘Adaptive capacity and community-based natural resource management’,Environmental Management, vol. 35, no. 6, pp. 703�715.
ABC (Australian Broadcasting Corporation) 2011, Brisbane floods to cost city $440 million,viewed 23 May 2011, Bhttp://www.abc.net.au/pm/content/2011/s3133417.htm�.
ABS (Australian Bureau of Statistics) 2006, Information paper: an introduction to socio-economic indexes for areas (SEIFA), Australian Bureau of Statistics, Canberra.
ABS (Australian Bureau of Statistics) 2007, Australian social trends, Australian Bureau ofStatistics, Canberra.
ABS (Australian Bureau of Statistics) no date, Community profiles series: 1996, 2001 and 2006,ABS census cat. no. 2003.0-2006, viewed 12 September 2010, Bhttp://www.abs.gov.au/ausstats/[email protected]/web�pages/statistics�.
Australian Human Rights Commission 2008, Background paper: human rights and climatechange, Human Rights and Equal Opportunity Commission, viewed 23 May 2011,Bhttp://www.humanrights.gov.au/about/media/papers/hrandclimate_change.html�.
48 A. Roiko et al.
Dow
nloa
ded
by [
Uni
vers
ity o
f th
e Su
nshi
ne C
oast
] at
19:
38 2
4 Fe
brua
ry 2
015
Berkhout, F & Hertin, J 2000, ‘Viewpoint: socio-economic scenarios for climate changeimpact assessment’, Global Environmental Change, vol. 10, no. 3, pp. 165�168.
Berkhout, F, Hertin, J & Jordan, A 2002, ‘Socio-economic features in climate change impactassessment: using scenarios as ‘‘learning machines’’’, Global Environmental Change, vol.12, no. 2, pp. 83�85.
Cooper, J 2008, Queensland state and regional household and dwelling projections 2006 �31 December 2008, Queensland Centre for Population Research, School of Geography,Planning and Architecture, University of Queensland, Brisbane.
CSIRO (Commonwealth Scientific and Industrial Research Organisation) & BOM (Bureau ofMeteorology) 2007, Climate change in Australia: technical report 2007, CSIRO Marine andAtmospheric Research and the Bureau of Meteorology, Aspendale and Melbourne.
Daffara, P, Keys, N & Smith, TF 2009, Critical review on adaptive capacity literature,Sustainability Research Centre, University of the Sunshine Coast, Queensland.
Department of Infrastructure and Planning 2008a, South East Queensland state of the regiontechnical report 2008, Queensland Government, Brisbane.
Department of Infrastructure and Planning 2008b, Delivering Queensland housing affordabilitystrategy South East Queensland greenfield land review, Queensland Government, Brisbane.
Department of Infrastructure and Planning 2009, South East Queensland climate changemanagement plan: draft for public consultation, Queensland Government, Brisbane.
Departments of Treasury, Industrial Relations and Employment and Training 2006, Theimplications of demographic ageing for Queensland’s labour force, Queensland Government,Brisbane.
Grothmann, T & Patt, A 2005, ‘Adaptive capacity and human cognition: the process ofindividual adaptation to climate change’, Global Environmental Change, vol. 15, no. 3,pp. 199�213.
Hansla, A, Gable, A, Juliusson, A & Polivka-West, L 2006, ‘Psychological determinantsof attitude towards and willingness to pay for green electricity’, Energy Policy, vol. 36,pp. 768�774.
Hyer, K, Brown, LM & Polivka-West, L 2006, Establishing and refining hurricane responsesystems for long term care facilities, Health Affairs, Millwood.
IPCC (Intergovernmental Panel on Climate Change) 2007, Climate change 2007: the physicalscience basis. Contribution of Working Group I to the Fourth Assessment Report of theIntergovernmental Panel on Climate Change, Cambridge University Press, Cambridge, UKand New York.
Knowlton, K, Rotkin-Ellman, M, Kling, G, Margolis, H, Smith, D, Solomon, G, Trent, R &English, P 2009, ‘The 2006 California heat wave: impacts on hospitalisations andemergency department visits’, Environmental Heath Perspectives, vol. 117, no. 1,pp. 61�67.
Malone, EL, Smith, JB, Brenkert, AL, Hurd, B, Moss, RH & Bouille, D 2004, Developingsocio-economic scenarios for use in vulnerability and adaptation assessments, UN Develop-ment Program, New York.
Milne, S, Sheeran, P & Orbell, S 2000, ‘Prediction and intervention in health-relatedbehaviour: a meta-analytic review of protection motivation theory’, Journal of AppliedSocial Psychology, vol. 30, pp. 106�143.
Office of Economic and Statistical Research 2009a, Regional profile, SEQ regional plan,Queensland Treasury, Brisbane.
Office of Economic and Statistical Research 2009b, Queensland Government and AustralianBureau of Statistics population projection (2008 edition): a comparison, viewed 23November 2010, Bhttp://www.oesr.qld.gov.au/products/presentations-papers/qld-gov-abs-pop-proj-2008-comparison/qld-gov-abs-pop-proj-2008-comparison.pdf�.
Office of Economic and Statistical Research Queensland Treasury 2011, QueenslandGovernment population projections to 2056: Queensland and statistical divisions (2011edition), Queensland Government, Brisbane.
Poruschi, L, Dhakal, S & Canadell, J 2010, Ten years of advancing knowledge on the globalcarbon cycle and its management, Global Carbon Project, Tsukaba, Japan and Canberra.
Queensland Government 2006a, Population projections to 2051, Queensland and StatisticalDivisions, Brisbane.
Australasian Journal of Environmental Management 49
Dow
nloa
ded
by [
Uni
vers
ity o
f th
e Su
nshi
ne C
oast
] at
19:
38 2
4 Fe
brua
ry 2
015
Queensland Government 2006b, Indigenous equity, Queensland Government, Brisbane.Queensland Government 2008, Queensland Government population projections to 2056,
Queensland and Statistical Divisions, Author, Brisbane.Queensland Government 2009, ‘State government to plan for flood resistant communities’,
media release, 2 November 2009, viewed 23 January 2012, Bhttp://www.cabinet.qld.gov.au/mms/StatementDisplaySingle.aspx?id=67220�.
Queensland Health 2005, Health and social impact assessment of the South East QueenslandRegional Plan (2005�2026), Queensland Health, Brisbane.
Smith, B, Burton, I, Klein, RJT & Wandel, J 2000, ‘An anatomy of adaptation to climatechange and variability’, Climate Change, vol. 45, no. 1, pp. 223�251.
Smith, TF, Lynam, T, Preston, BL, Mathews, J, Carter, RW, Thompsen, DC, Carter, J, Roiko,AH, Simpson, RW, Waterman, P, Bussey, MP, Keys, N & Stephenson, C 2010, ‘Towardsenhancing adaptive capacity for climate change response in South East Queensland’,Australian Journal of Disaster and Trauma Studies, vol. 2010�1.
Steffen, W 2009, Climate change 2009: faster change and more serious risk, Department ofClimate Change, Canberra.
Taylor, A & Robinson, C 2007, Sustainable Queensland, Committee for Economic Develop-ment of Australia (CEDA), Brisbane.
University of Queensland 2011, QCPR software, School of Geography, Planning andEnvironmental Management, viewed 29 November 2011, Bhttp://www.gpem.uq.edu.au/qcpr-software�.
van Drunen, M & Berkhout, F 2009, Socio-economic scenarios in the climate changes spatialplanning and the knowledge for climate programmes, Institute for Environmental Studies,Vrije Universiteit, Amsterdam.
Virginia, HD 1997, ‘The relationship between land-use change and climate change’, EcologicalApplications, vol. 7, no. 3, pp. 753�769.
Yohe, G & Tol, RSJ 2002, ‘Indicators for social and economic coping capacity: movingtoward a working definition of adaptive capacity’, Global Environmental Change, vol. 12,pp. 25�40.
50 A. Roiko et al.
Dow
nloa
ded
by [
Uni
vers
ity o
f th
e Su
nshi
ne C
oast
] at
19:
38 2
4 Fe
brua
ry 2
015
Related Documents